UNITED STATES
SECURITIES AND EXCHANGE COMMISSION
Washington, D.C. 20549
FORM 20-F
| ¨ | REGISTRATION STATEMENT PURSUANT TO SECTION 12(b) OR 12(g) OF THE SECURITIES EXCHANGE ACT OF 1934 |
OR
| x | ANNUAL REPORT PURSUANT TO SECTION 13 OR 15 (d) OF THE SECURITIES EXCHANGE ACT OF 1934 FOR THE FISCAL YEAR ENDED 30 JUNE 2015 |
FOR THE FISCAL YEAR ENDED 30 JUNE 2013
OR
| ¨ | TRANSITION REPORT PURSUANT TO SECTION 13 OR 15 (d) OF THE SECURITIES AND EXCHANGE ACT OF 1934 |
| ¨ | SHELL COMPANY REPORT PURSUANT TO SECTION 13 OR 15(d) OF THE SECURITIES EXCHANGE ACT OF 1934 |
Date of event requiring this shell company report
For the transition period fromto
| | |
| Commission file number: 001-09526 | | Commission file number: 001-31714 |
| BHP BILLITON LIMITED | | BHP BILLITON PLC |
| (ABN 49 004 028 077) | | (REG. NO. 3196209) |
| (Exact name of Registrant as specified in its charter) | | (Exact name of Registrant as specified in its charter) |
| VICTORIA, AUSTRALIA | | ENGLAND AND WALES |
| (Jurisdiction of incorporation or organisation) | | (Jurisdiction of incorporation or organisation) |
171 COLLINS STREET, MELBOURNE, VICTORIA 3000 AUSTRALIA | | NEATHOUSE PLACE, LONDON UNITED KINGDOM |
| (Address of principal executive offices) | | (Address of principal executive offices) |
Securities registered or to be registered pursuant to section 12(b) of the Act.
| | | | | | |
Title of each class | | Name of each exchange on
which registered | | Title of each class | | Name of each exchange on
which registered |
American Depositary Shares* | | New York Stock Exchange | | American Depositary Shares* | | New York Stock Exchange |
Ordinary Shares** | | New York Stock Exchange | | Ordinary Shares, nominal
value US$0.50 each** | | New York Stock Exchange |
| * | Evidenced by American Depositary Receipts. Each American Depositary Receipt represents two ordinary shares of BHP Billiton Limited or BHP Billiton Plc, as the case may be. |
| ** | Not for trading, but only in connection with the listing of the applicable American Depositary Shares. |
Securities registered or to be registered pursuant to Section 12(g) of the Act.
None
Securities for which there is a reporting obligation pursuant to Section 15(d) of the Act.
None
Indicate the number of outstanding shares of each of the issuer’s classes of capital or common stock as of the close of the period covered by the annual report.
| | | | |
| | | BHP Billiton Limited | | BHP Billiton Plc |
Fully Paid Ordinary Shares | | 3,211,691,105 | | 2,136,185.454 |
| | | | |
| | | BHP Billiton Limited | | BHP Billiton Plc |
Fully Paid Ordinary Shares | | 3,211,691,105 | | 2,112,071,796 |
Indicate by check mark if the registrant is a well-known seasoned issuer, as defined in Rule 405 of the Securities Act. Yes x No ¨
If this report is an annual or transition report, indicate by check mark if the registrant is not required to file reports pursuant to Section 13 or 15(d) of the Securities Exchange Act of 1934. Yes ¨ No x
Note – Checking the box above will not relieve any registrant required to file reports pursuant to Section 13 or 15(d) of the Securities Exchange Act of 1934 from their obligations under those Sections.
Indicate by check mark whether the registrant (1) has filed all reports required to be filed by Section 13 or 15(d) of the Securities Exchange Act of 1934 during the preceding 12 months (or for such shorter period that the registrant was required to file such reports), and (2) has been subject to such filing requirements for the past 90 days. Yes x No ¨
Indicate by check mark whether the registrant has submitted electronically and posted on its corporate Web site, if any, every Interactive Data File required to be submitted and posted pursuant to Rule 405 of Regulation S-T (§ 232.405 of this chapter) during the preceding 12 months (or for such shorter period that the registrant was required to submit and post such files). Yes ¨ No ¨
Indicate by check mark whether the registrant is a large accelerated filer, an accelerated filer, or a non-accelerated filer. See definition of “accelerated filer and large accelerated filer” in Rule 12b-2 of the Exchange Act. (Check one):
| | | | |
Large accelerated filer x | | Accelerated filer ¨ | | Non-accelerated filer ¨ |
Indicate by check mark which basis of accounting the registrant has used to prepare the financial statements included in this filing:
| | | | |
U.S. GAAP ¨ | | International Financial Reporting Standards as issued by the International Accounting
Standards Board x | | Other ¨ |
If “Other” has been checked in response to the previous question, indicate by check mark which financial statement item the registrant has elected to follow. Item 17 ¨ Item 18 ¨
If this is an annual report, indicate by checkmark whether the registrant is a shell company (as defined in Rule 12b-2 of the Exchange Act). Yes ¨ No x
| | |
Our Charter |
We are BHP Billiton,
a leading global resources company. | | Our purpose is to create long-term shareholder value through the discovery, acquisition, development and marketing of natural resources. |
| Our strategy is to own and operate large, long-life, low-cost, expandable, upstream assets diversified by commodity, geography and market. |
| |
| | Our Values |
| |
| | Sustainability Putting health and safety first, being environmentally responsible and supporting our communities. |
| |
| | Integrity Doing what is right and doing what we say we will do. |
| |
| | Respect Embracing openness, trust, teamwork, diversity and relationships that are mutually beneficial. |
| |
| | Performance Achieving superior business results by stretching our capabilities. |
| |
| | Simplicity Focusing our efforts on the things that matter most. |
| |
| | Accountability Defining and accepting responsibility and delivering on our commitments. |
| |
| | We are successful when: |
| |
| | Our people start each day with a sense of purpose and end the day with a sense of accomplishment. |
| |
| | Our communities, customers and suppliers value their relationships with us. |
| |
| | Our asset portfolio is world-class and sustainably developed. |
| |
| | Our operational discipline and financial strength enables our future growth. |
| |
| | Our shareholders receive a superior return on their investment. |
| |
| |  |
| | Andrew Mackenzie Chief Executive Officer |
TableBHP Billiton is a Dual Listed Company comprising BHP Billiton Limited and BHP Billiton Plc. The two entities continue to exist as separate companies but operate as a combined Group known as BHP Billiton.
The headquarters of ContentsBHP Billiton Limited and the global headquarters of the combined BHP Billiton Group are located in Melbourne, Australia. BHP Billiton Plc is located in London, United Kingdom. Both companies have identical Boards of Directors and are run by a unified management team. Throughout this publication, the Boards are referred to collectively as the Board. Shareholders in each company have equivalent economic and voting rights in the BHP Billiton Group as a whole.
Throughout this Annual Report, the terms BHP Billiton, the Company and the Group refer to the combined group, including both BHP Billiton Limited and subsidiary companies and BHP Billiton Plc and subsidiary companies.
i
Contents
ii
iii
iv
v
Form 20-F Cross Reference Table
| | | | |
Item Number | | Description | | Report section reference |
1. | | Identity of directors, senior management and advisors | | Not applicable |
2. | | Offer statistics and expected timetable | | Not applicable |
3. | | Key Information | | |
A | | Selected financial information | | 1.6.31.11 |
B | | Capitalisation and indebtedness | | Not applicable |
C | | Reasons for the offer and use of proceeds | | Not applicable |
D | | Risk factors | | 1.7 |
4. | | Information on the company | | |
A | | History and development of the company | | 1.1.3, 1.2, 2.2.1, 2.2.21.6, 1.12, 2.1, 2.2, 5.1, 9.1 to 2.2.6, 2.3, 2.109.3 and 39.12 |
B | | Business overview | | 1, 2.21.5 to 2.81.15, 2.1 to 2.5 and 3.19.11 |
C | | Organisational structure | | 2.109.3 and Note 2630 to the Financial Statements |
D | | Property, plant and equipment | | 1.2, 2.2.21.12 and 2.1 to 2.2.6, 2.3, 2.8, 2.13 and 3.7.22.4 |
4A. | | Unresolved staff comments | | None |
5. | | Operating and financial review and prospects | | |
A | | Operating results | | 1.6, 3.3, 3.4, 3.61.10 to 1.12, 1.15 and 2.5 |
B | | Liquidity and capital resources | | 3.71.15.4 and 1.15.5 |
C | | Research and development, patents and licences etc | | 2.5, 2.61.6.3, 1.12, 1.15.1, 2.1, 2.3 and 7.155.14 |
D | | Trend information | | 3.41.5.3, 1.12 and 1.15.1 |
E | | Off-balance sheet arrangements | | 3.81.15.6 and Notes 2134 and 2235 to the Financial Statements |
F | | Tabular disclosure of contractual obligations | | 3.81.15.6 and Notes 2134 and 2235 to the Financial Statements |
6. | | Directors, senior management and employees | | |
A | | Directors and senior management | | 4.1 and 4.23.2 |
B | | Compensation | | 64 |
C | | Board practices | | 4.1,3.2, 3.14 and 4.2 5, 6.2 to 6.4 |
D | | Employees | | 2.91.13 and 7.85.8 |
E | | Share ownership | | 6, 7.8, 7.194, 5.17 and 7.205.18 |
7. | | Major shareholders and related party transactions | | |
A | | Major shareholders | | 11.29.6 |
B | | Related party transactions | | 3.91.15.6 and Note 3233 to the Financial Statements |
C | | Interests of experts and counsel | | Not applicable |
8. | | Financial information | | |
A | | Consolidated statements and other financial information | | 8, 9, 11.37, 9.7 and the pages beginning on page F-1 in this Annual Report |
B | | Significant changes | | 3.101.15.6 and Note 36 to the Financial Statements |
9. | | The offer and listing | | |
A | | Offer and listing details | | 11.49.8 |
B | | Plan of distribution | | Not applicable |
C | | Markets | | 11.19.2 |
D | | Selling shareholders | | Not applicable |
E | | Dilution | | Not applicable |
F | | Expenses of the issue | | Not applicable |
10.
| | Additional Information | | |
A
| | Share capital | | Not applicable |
viiv
| Item Number | | Description | | Report section reference | | Description | | Report section reference |
10. | | | Additional Information | | |
A | | | Share capital | | Not applicable |
B | | Memorandum and articles of association | | 2.7.2 and 2.12 | | Memorandum and articles of association | | 9.5 and 9.11 |
C | | Material contracts | | 2.11 | | Material contracts | | 9.4 |
D | | Exchange controls | | 2.7.2 | | Exchange controls | | 9.11.2 |
E | | Taxation | | 11.6 | | Taxation | | 9.10 |
F | | Dividends and paying agents | | Not applicable | | Dividends and paying agents | | Not applicable |
G | | Statement by experts | | Not applicable | | Statement by experts | | Not applicable |
H | | Documents on display | | 2.12.14 | | Documents on display | | 9.5.14 |
I | | Subsidiary information | | 3.9 and Note 26 to the Financial Statements | | Subsidiary information | | 1.15.6 and Note 30 to the Financial Statements |
11. | | Quantitative and qualitative disclosures about market risk | | 3.7.4 and Note 29 to the Financial Statements | | Quantitative and qualitative disclosures about market risk | | 1.15.6 and Note 23 to the Financial Statements |
12. | | Description of securities other than equity securities | | | | Description of securities other than equity securities | | |
A | | Debt Securities | | Not applicable | | Debt Securities | | Not applicable |
B | | Warrants and Rights | | Not applicable | | Warrants and Rights | | Not applicable |
C | | Other Securities | | Not applicable | | Other Securities | | Not applicable |
D | | American Depositary Shares | | 11.5 | | American Depositary Shares | | 9.9 |
13. | | Defaults, dividend arrearages and delinquencies | | There have been no defaults, dividend arrearages or delinquencies | | Defaults, dividend arrearages and delinquencies | | There have been no defaults, dividend arrearages or delinquencies |
14. | | Material modifications to the rights of security holders and use of proceeds | | There have been no material modifications to the rights of security holders and use of proceeds since our last Annual Report | | Material modifications to the rights of security holders and use of proceeds | | There have been no material modifications to the rights of security holders and use of proceeds since our last Annual Report |
15. | | Controls and procedures | | 5.13.1 | | Controls and procedures | | 3.14.1 |
16. | | | | | | | | |
A | | Audit committee financial expert | | 4.1 and 5.13.1 | | Audit committee financial expert | | 3.2.1 and 3.14.1 |
B | | Code of ethics | | 5.16 | | Code of ethics | | 3.17 |
C | | Principal accountant fees and services | | 5.13.1 and Note 35 to the Financial Statements | | Principal accountant fees and services | | 3.14.1 and Note 38 to the Financial Statements |
D | | Exemptions from the listing standards for audit committees | | Not applicable | | Exemptions from the listing standards for audit committees | | Not applicable |
E | | Purchases of equity securities by the issuer and affiliated purchasers | | 7.2 | | Purchases of equity securities by the issuer and affiliated purchasers | | 5.2 |
F | | Change in Registrant’s Certifying Accountant | | There has been no change of the Registrant’s Certifying Accountant since our last Annual Report | | Change in Registrant’s Certifying Accountant | | Not applicable |
G | | Corporate Governance | | 5.22 | | Corporate Governance | | 3.21 |
H | | Mine Safety and Health Administration (MSHA) Disclosure | | The information concerning mine safety violations or other regulatory matters required by section 1503(a) of the Dodd-Frank Wall Street Reform and Consumer Protection Act. This item is included in Exhibit 95.1 | | Mine Safety and Health Administration (MSHA) Disclosure | | Exhibit 95.1 |
17. | | Financial statements | | Not applicable as Item 18 complied with | | Financial statements | | Not applicable as Item 18 complied with |
18. | | Financial statements | | The pages beginning on page F-1 in this Annual Report, Exhibit 15.1 | | Financial statements | | The pages beginning on page F-1 in this Annual Report and Exhibit 15.1 |
19. | | Exhibits | | 12 | | Exhibits | | 10 |
viiv
1 Key informationStrategic Report
1.1 Our Company
We are BHP Billiton, a leading global resources company.
We are among the world’s top producers of major commodities, including iron ore, metallurgical and energy coal, conventional and unconventional oil and gas, copper, aluminium, manganese, uranium, nickel and silver.
As at 30 June 2013, we had a market capitalisation of approximately US$147.1 billion. For FY2013, we reported net operating cash flow of US$18.3 billion, revenue of US$66.0 billion and profit attributable to shareholders of US$10.9 billion. Throughout FY2013, our workforce comprised of approximately 128,800 employees and contractors working at 141 locations in 26 countries.
1.1.1 Our Charter
Our BHP Billiton Charter is the single most important means by which we communicate who we are, what we do and what we stand for. It is throughOur Charter we articulate our purpose, our strategy, the values we uphold and how we measure success.Our Charter is the foundation for our decision-making, actions and behaviours.
Our Charter makes it clear that as we strive for success we must remain forthright in the things we value: Sustainability, Integrity, Respect, Performance, Simplicity and Accountability. By working in a way that is consistent withOur Charter, we will continue to build on our success both today and for the long term.
1.1.2 Our Operating Model
In FY2013, following the appointment of Andrew Mackenzie as Chief Executive Officer, organisational changes were made to consolidate our previous Customer Sector Groups into five Businesses.
Our Operating Model sets out the relationship between the Businesses, Group Functions and Marketing and defines how we work, how we are organised and how we measure performance.
Our Businesses
Our assets, operations and interests are separated into five business units. These Businesses are: Petroleum and Potash; Copper; Iron Ore; Coal; and Aluminium, Manganese and Nickel. The Operating Model has been designed to ensure that decision-making remains as close to the Businesses as possible.
Group Functions
Our Group Functions support the Businesses and operate under a defined set of accountabilities authorised by the Group Management Committee (GMC). Our Group Functions are primarily located in Melbourne, London and Singapore.
Marketing
Marketing is responsible for selling our products and for the purchase of all major raw materials; owning the supply chain from assets to markets and raw materials from suppliers to assets; achieving market clearing prices for the Group’s products and managing price risk; and developing a single Company view of the markets.
The core principles of the Operating Model include mandatory performance requirements; common organisational design; common systems and processes; and common planning and reporting.
The Operating Model is designed to deliver a simple and scalable organisation to achieve a sustainable improvement in productivity by providing performance transparency, eliminating duplication of effort and enabling the more rapid identification and deployment of best practice.
1.1.3 Our Businesses
Petroleum and Potash
Our Petroleum and Potash Business, headquartered in Houston, United States, comprises conventional and unconventional oil and gas operations located in six countries throughout the world and a potash development project with a regional Potash Head Office in Saskatoon, Canada. Our portfolio of operations includes:Onshore US – four shale fields operated onshore in the United States (Eagle Ford, Permian, Haynesville and Fayetteville);Gulf of Mexico – two operated fields (Neptune and Shenzi) and three non-operated fields (Atlantis, Mad Dog and Genesis);Bass Strait – interests in offshore projects and processing in Bass Strait, off the southeastern coast of Australia; andNorth WestShelf – interest in an offshore project and processing in Western Australia. Our portfolio also includes interests in other projects in Australia and in the United Kingdom, Algeria, Trinidad and Tobago, and Pakistan.
Copper
Our Copper Business, headquartered in Santiago, Chile, is one of the world’s premier producers of copper, silver, lead and uranium, and a leading producer of zinc. We market five primary products: copper concentrate, copper cathodes, uranium oxide, lead and zinc concentrates. Our portfolio of mining operations includes:Escondida – the world’s largest producer of copper, located in Chile;Cannington – one of the world’s largest producers of silver located in Queensland, Australia;Olympic Dam – a major producer of copper and uranium located in South Australia;Pampa Norte – two copper mines, located in Chile; andAntamina – a joint venture interest in a copper and zinc mine, located in Peru.
Iron Ore
Our Iron Ore Business, headquartered in Perth, Australia, is one of the world’s leading iron ore producers. We sell lump and fines product from Australia and pellets from our operations in Brazil. Our portfolio of mining operations includes:Western Australia Iron Ore – an integrated system of mines and more than 1,000 kilometres of rail infrastructure and port facilities in the Pilbara region of northern Western Australia; andSamarco – a joint venture interest in the Samarco operation, which comprises a mine, two 396-kilometre pipelines and two concentrators, located in Brazil.
Coal
Our Coal Business, headquartered in Brisbane, Australia, is the world’s largest supplier of seaborne metallurgical coal and one of the world’s largest producers and marketers of export energy coal. Our portfolio of mining operations includes: three Metallurgical Coal Assets, includingBHP Billiton Mitsubishi Alliance (BMA) Joint Venture,BHP Billiton Mitsui Joint Venture, both located in the Bowen Basin in central Queensland, Australia, andIllawarra Coal in New South Wales, Australia; and four Energy Coal Assets:Energy Coal South Africa,New Mexico Coal,New South Wales Energy Coal andCerrejón in Colombia.
Aluminium, Manganese and Nickel
Our Aluminium, Manganese and Nickel Business, headquartered in Perth, Australia, is one of the world’s largest integrated producers of aluminium, nickel and manganese ore and alloy. Our portfolio of operations includes: Aluminium operations in southern Africa (Hillside, Bayside andMozal smelters), Australia (Boddington/Worsley) and South America (Alumar); Manganese Assets located in Australia (GEMCO andTEMCO) and South Africa (HMM andMetalloys); and Nickel Assets, includingNickel West in Australia andCerro Matoso in Colombia.
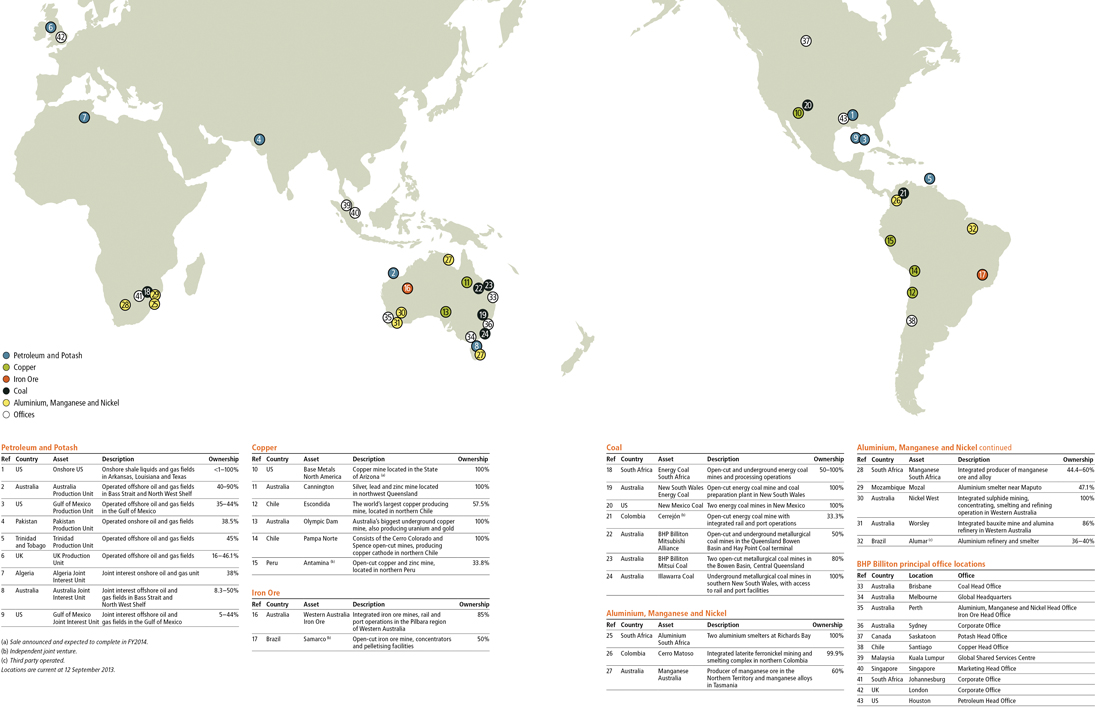
1.2 BHP Billiton locations
Petroleum and Potash
| | | | | | | | |
Ref | | Country | | Asset | | Description | | Ownership |
1 | | US | | Onshore US | | Onshore shale liquids and gas fields in Arkansas, Louisiana and Texas | | <1 – 100% |
2 | | Australia | | Australia Production Unit | | Operated offshore oil and gas fields in Bass Strait and North West Shelf | | 40 – 90% |
3 | | US | | Gulf of Mexico Production Unit | | Operated offshore oil and gas fields in the Gulf of Mexico | | 35 – 44% |
4 | | Pakistan | | Pakistan Production Unit | | Operated onshore oil and gas fields | | 38.5% |
5 | | Trinidad and Tobago | | Trinidad Production Unit | | Operated offshore oil and gas fields | | 45% |
6 | | UK | | UK Production Unit | | Operated offshore oil and gas fields | | 16 – 46.1% |
7 | | Algeria | | Algeria Joint Interest Unit | | Joint interest onshore oil and gas fields | | 38% |
8 | | Australia | | Australia Joint Interest Unit | | Joint interest offshore oil and gas fields in Bass Strait and North West Shelf | | 8.3 – 50% |
9 | | US | | Gulf of Mexico Joint Interest Unit | | Joint interest offshore oil and gas fields in the Gulf of Mexico | | 5 – 44% |
Copper
| | | | | | | | |
Ref | | Country | | Asset | | Description | | Ownership |
10 | | US | | Base Metals North America | | Copper mine located in the State of Arizona (a) | | 100% |
11 | | Australia | | Cannington | | Silver, lead and zinc mine located in northwest Queensland | | 100% |
12 | | Chile | | Escondida | | The world’s largest copper producing mine, located in northern Chile | | 57.5% |
13 | | Australia | | Olympic Dam | | Australia’s biggest underground copper mine, also producing uranium and gold | | 100% |
14 | | Chile | | Pampa Norte | | Consists of the Cerro Colorado and Spence open-cut mines, producing copper cathode in northern Chile | | 100% |
15 | | Peru | | Antamina (b) | | Open-cut copper and zinc mine, located in northern Peru | | 33.8% |
Iron Ore
| | | | | | | | |
Ref | | Country | | Asset | | Description | | Ownership |
16 | | Australia | | Western
Australia
Iron Ore | | Integrated iron ore mines, rail and port operations in the Pilbara region of Western Australia | | 85% |
17 | | Brazil | | Samarco (b) | | Open-cut iron ore mine, concentrators and pelletising facilities | | 50% |
Coal
| | | | | | | | |
Ref | | Country | | Asset | | Description | | Ownership |
18 | | South Africa | | Energy Coal South Africa | | Open-cut and underground energy coal mines and processing operations | | 50 – 100% |
19 | | Australia | | New South Wales Energy Coal | | Open-cut energy coal mine and coal preparation plant in New South Wales | | 100% |
20 | | US | | New Mexico Coal | | Two energy coal mines in New Mexico | | 100% |
21 | | Columbia | | Cerrejón (b) | | Open-cut energy coal mine with integrated rail and port operations | | 33.3% |
22 | | Australia | | BHP Billiton Mitsubishi Alliance | | Open-cut and underground metallurgical coal mines in the Queensland Bowen Basin and Hay Point Coal terminal | | 50% |
23 | | Australia | | BHP Billiton Mitsui Coal | | Two open-cut metallurgical coal mines in the Bowen Basin, Central Queensland | | 80% |
24 | | Australia | | Illawarra Coal | | Underground metallurgical coal mines in southern New South Wales, with access to rail and port facilities | | 100% |
Aluminium, Manganese and Nickel
| | | | | | | | |
Ref | | Country | | Asset | | Description | | Ownership |
25 | | South Africa | | Aluminium South Africa | | Two aluminium smelters at Richards Bay | | 100% |
26 | | Colombia | | Cerro Matoso | | Integrated laterite ferronickel mining and smelting complex in northern Colombia | | 99.9% |
27 | | Australia | | Manganese Australia | | Producer of manganese ore in the Northern Territory and manganese alloys in Tasmania | | 60% |
28 | | South Africa | | Manganese South Africa | | Integrated producer of manganese ore and alloy | | 44.4 – 60% |
29 | | Mozambique | | Mozal | | Aluminium smelter near Maputo | | 47.1% |
30 | | Australia | | Nickel West | | Integrated sulphide mining, concentrating, smelting and refining operation in Western Australia | | 100% |
31 | | Australia | | Worsley | | Integrated bauxite mine and alumina refinery in Western Australia | | 86% |
32 | | Brazil | | Alumar (c) | | Aluminium refinery and smelter | | 36 – 40% |
BHP Billiton principal office locations
| | | | | | |
Ref
| | Country
| | Location
| | Office
|
33
| | Australia | | Brisbane | | Coal Head Office |
34
| | Australia | | Melbourne | | Global Headquarters |
35
| | Australia | | Perth | | Aluminium, Manganese and Nickel Head Office
Iron Ore Head Office
|
36
| | Australia | | Sydney | | Corporate Office |
37
| | Canada | | Saskatoon | | Potash Head Office |
38
| | Chile | | Santiago | | Copper Head Office |
39
| | Malaysia | | Kuala Lumpur | | Global Shared Services Centre |
40
| | Singapore | | Singapore | | Marketing Head Office |
41
| | South Africa | | Johannesburg | | Corporate Office |
42
| | UK | | London | | Corporate Office |
43
| | US | | Houston | | Petroleum Head Office |
(a) | Sale announced and expected to complete in FY2014. |
(b) | Independent joint venture. |
Locations are current at 12 September 2013
1.3 Chairman’s Review
Dear Shareholder
In the past year, we have seen continued growth in the global economy despite significant drops in commodity prices and volatility in currency and financial markets.
At last year’s Annual General Meetings I said, ‘Events this year (FY2014) have been a reminder of how uncertain and volatile politics and uncertaineconomics can be’. This year, those trends have accelerated. While this level of uncertainty in the global economy can be unsettling, for global economies, I am pleased to report thatover 130 years your Company has demonstrated the ability to successfully overcome difficult challenges.
Against this backdrop, in FY2015 we set production records across many of our operations. This, combined with a focus on productivity, offset some of the downturn in commodity prices. While our financial performance was impacted by market conditions, continued to perform well. BHP Billiton reportedimprovements in operational performance, productivity and higher production produced an Attributable profit excluding exceptional items, of US$11.81.9 billion and theNet operating cash flows of US$19.3 billion. We increased our full-year dividend was increased by fourtwo per cent to 116124 US cents per share. TheseThis is in addition to the pro rata, in-specie distribution of South32 shares to eligible shareholders during the year.
Your Company is in a strong financial position. We have lower debt, a strong balance sheet and solid financial results were underpinned by strong operating performance and a keycash flows. While we are taking an even more focused approach to capital allocation, we continue to invest in those projects that we expect to provide superior long-term returns. The focus on productivity.
Oversimplification and productivity saw the last decade, industrialisation and urbanisationdemerger of South32 in emerging economies underpinned strong commodities consumption. We maintain a positive outlook over the long term as the fundamentals of wealth creation, demographics and urbanisation continue to create demand for commodities across Asia and other markets.
Increased supply has, however, exerted downward pressure on many commodity markets more recently and we expect this trend to continue over the short term. While lower rates of investment across the industry will ultimately lead to more balanced markets, all resources companies will need to improve productivity and be flexible enough to adapt to change in this more challenging environment.
Against that backdrop, we will continueMay 2015. This transaction significantly simplified our portfolio, enabling us to focus on two constants that have guided us throughgenerating more value from our 150-year history. The first is the significancelarge-scale, high-quality assets while allowing shareholders continued ownership of what we do. Rising living standards depend on economic growth, and we aim to safely, reliably and profitably supply the resources required to support economic growth. This helps improve the living standardsSouth32’s operations.
Tragically five of millions of people around the world every day. The second is how we operate. This is outlinedour colleagues died at work inOur BHP Billiton Charter, which defines our values. Health and safety always come first. While our overall safety performance continued to improve, sadly, three colleagues lost their lives at work. FY2015. On behalf of the Board, I offer our sincere condolencesextend my deepest sympathy to their families and friends. These tragic incidents highlightYour Directors and your management team are committed to a safe workplace.
BHP Billiton is a global company that values our host communities. Our tax payments are just one part of the contribution we make to the communities in which we operate. We paid more than US$7.3 billion to governments worldwide in 2015. BHP Billiton is one of Australia’s largest taxpayers. In addition, we invested more than US$225 million in local communities across the world on projects that include improving access to education and healthcare.
Climate change remains a strategic consideration for your Board. We understand the importance of remaining focused on providing a workplace where allreducing the Company’s greenhouse gas emissions and ensuring the resilience of our people return home fitbusiness. Policy measures are also needed to effect reductions in emissions. We are contributing to practical and well ateffective policy development and supporting the endefforts of each day.nations to reach a global agreement in Paris in December 2015.
As partIt is with profound sadness that the Board pays tribute to Sir John Buchanan after his passing in July 2015. Sir John served as a Non-executive Director ofOur Charter value BHP Billiton from 2003 up until the time of Sustainability,his death and was the Senior Independent Director of BHP Billiton Plc. Sir John provided wise counsel to his fellow Directors and to management and we strivewill miss him greatly – both personally and for his invaluable contribution as a Director.
I would also like to be an integral part ofthank Keith Rumble and Carlos Cordeiro for their valuable contribution over the years. Keith Rumble retired from the Board in May this year, while Carlos Cordeiro will retire after the Annual General Meetings later this year. In line with our communities, making a positive difference at the local, regional and national level. We allocate one per cent of our pre-tax profitsplanned approach to community programs, which in 2013 was US$245.8 million. These funds support community initiatives, such as the Colombia Resilience Project to alleviate poverty and hardship for vulnerable populations; the Royal Flying Doctor Service’s On the Road initiative for people living, working and travelling in remote areas of Western Australia; the socio-economic component of our Black Economic Empowerment programs in South Africa.
Our community programs are in additionBoard succession, we appointed Anita Frew to the US$11.6 billionBoard as a Non-executive Director with effect from 15 September 2015. Anita’s depth of experience in taxesstrategic and royalties we paidrisk management, marketing and governance across a broad range of sectors will enable her to governments and our broader economicmake a significant contribution in terms of jobs, capital investment and support of local businesses.
Looking ahead, we expect further volume growth at a lower unit cost as we continue to invest in our key commodities and major basins that provide the foundations for shareholder value creation.Board. We also announced a further US$2.6 billion investment in our Jansen Potash Project. A growing population and improving incomes in emerging economies meansthat Shriti Vadera will assume the longer-term outlook for potash, a fertiliser that improves the yield and qualityrole of agricultural production, is strong. Over many years, the Group’s strategy has delivered significant value for shareholders, and we can expect a more productive and capital efficient organisation to build on that track record.
This year, we also announced the retirement of Marius Kloppers and the appointment of Andrew Mackenzie as Chief Executive OfficerSenior Independent Director of BHP Billiton. Marius made BHP Billiton a safer and financially stronger company, and we thank him for his leadership. Andrew brings a unique combination of deep industry knowledge and global management skillsPlc.
The results you will read about in this Report are due to the role, with more than 30 years’ experience in the oil and gas, petrochemicals and minerals industries.
Andrew and his new senior management team are off to a great start. Together with our 128,800 employees and contractors in more than 140 operations across the globe, they have delivered the record production and substantial productivity gains that underpinned our robust financial results. As the global economy continues to strengthen, the talents and efforts of all our peopleemployees and our low-cost, upstream strategycontractors, led by Andrew Mackenzie. Through their efforts, your Company contributes to stronger economies and diversification ensure we are well positioned.improved living standards around the world. Your Board is confident in the outlook for BHP Billiton and we thank you for your continued support of ourthe Company.
Jac Nasser AO
Chairman
1.41.2 Chief Executive Officer’s Report
BHP Billiton delivered a solid set of results in FY2015, based on strong operating performance and improved productivity against a backdrop of a volatile global economy and lower commodity prices.
Our FY2015 safety performance was disappointing. While we improved total recordable injury frequency performance by two per cent to 4.1 injuries per million hours worked, five colleagues died at work. It is with deep sadness that I extend my condolences to their families, friends and workmates. Safety is unquestionably my first priority, as it is for everyone at BHP Billiton. I am honoured to deliver my first annual results as Chief Executive Officerworking with all the leaders of BHP Billiton and report thatwe have implemented a Company-wide program of engagement to make our Company’s enduring strategy and high-quality, diversified portfolioworkplaces safer than ever before.
In FY2015, the focus on best-in-class performance across our operations delivered robust financial results in FY2013.
Our results reflect record production and substantial productivity gains offset by lower commodity prices. In FY2013, we achieved a thirteenth consecutive annual production record at Western Australiaof US$4.1 billion, two years ahead of target. Iron Ore and a 28 per cent increase in copperMetallurgical Coal achieved annual production at Escondida, Chile. In addition, liquids production at our Onshore US operations increased by 76records, with increases of 14 per cent and 13 per cent respectively, Petroleum production increased by four per cent and Copper production was flat following the unplanned mill outage at Olympic Dam. This resulted in an overall Group production increase of nine per cent on a copper equivalent basis.
Improved operational productivity has generated strong cash flow to fund the progressive dividend, maintain a solid ‘A’ credit rating and allow us to continue to invest in growth. Further operational productivity will stretch the capacity of existing operations to safely increase volumes at very low cost, and increased capital productivity will reduce the cost of investments. In FY2015, we reduced capital and exploration expenditure to US$11 billion and expect this to decline to US$8.5 billion in FY2016. We have unique, high-return growth opportunities within the portfolio, and our Queensland Coal operations in Australia returnedcash flows and disciplined capital management structure will allow us to full supply chain capacity duringprogress these when the period.time is right.
I took overIn May 2015, we completed the leadershipdemerger of South32 to create a more focused portfolio for BHP Billiton. This simpler portfolio of assets, with more similar characteristics, allows a sharper focus on the Company in May from Marius KloppersBusinesses that generate the majority of our earnings, and increases the potential for further productivity gains and shareholder value. Post-demerger, BHP Billiton’s strategy remains unchanged and Our Charter values of Sustainability, Integrity, Respect, Performance, Simplicity and Accountability will continue to whom I am very grateful for his comprehensive handoverdefine and leadership. Soon after my appointment, changes were madeguide us.
Local partnerships continue to our Group Management Committee structure that effectively removed a layer of management and consolidated our Businesses into five. This isbe an integral part of our continuing effortsbusiness. In FY2015, we contributed US$225 million to simplify the organisation and bring our strategic and operational leadership closer to attain our goal of becoming more productive and efficient than we are today.
Guided byOur BHP Billiton Charter and consistent strategy, our priorities in the near term are to protect our people and improve the health and safety of our operations, create a more productive organisation, actively manage our portfolio, maintain a disciplined approach to capital management and support sustainable development of our host communities.
Sadly, during FY2013, three of our colleagues lost their lives at work. This is clearly unacceptable. Eliminating risk is a critical, continual focus of everyone at BHP Billiton. We continue to improve the process for effective management of the critical controls of our material health and safety risks. The health, safety and wellbeing of our people is our primary responsibility. In FY2013, our total recordable injury frequency was 4.6 per million hours worked, a two per cent improvement on FY2012.
In the absence of higher commodity prices, we have sharpened our focus on the Company’s productivity. We continue to find ways of working smarter to obtain the most from our assets, orebodies, plant and machinery. We aim to create the right culture and supporting processes for our people so they are engaged with our Company’s efforts to become more competitive.
We continue to actively manage our portfolio and have increased our focus on our major Businesses: Iron Ore, Petroleum, Copper and Coal, which, together with Potash, provide optimum diversification. Divestments totalling US$6.5 billion were either announced or completed during FY2013, representing a premium over average market valuations.
We believeprograms that to maintain our position as one of the world’s leading companies, we must commit to high ethical business practices and governance standards. We are committed toOur Charter value of Integrity, doing what is right and doing what we say we will do. This is evident in our anti-corruption standards and the BHP BillitonCode of Business Conduct, which prohibits bribery and corruption in all our business dealings. All our leaders have the responsibility for ensuring the requirements of theCode of Business Conduct are embedded across BHP Billiton.
Sustainability and supporting our host communities is central toOur Charter values. In FY2013, our community contributions amounted to US$245.8 million, and we continue to strive to have a long-lasting positive impact on the quality of life for people in our host communities. This year, we developed a new BHP Billiton Social Investment Framework to build a stronger linkage between our business and the communities that support and host us. The framework has identified three areas of sustainable development that will form the basis of future investments: governance, environment, and human capability and social inclusion.
ThisClimate change considerations remain central to planning and execution. We are taking action to reduce emissions, build the resilience of our operations and supply chains, and work with others to support effective policy development. We are exploring opportunities to invest in low-emission technologies such as carbon capture and storage and battery storage.
We are proud to have publicly committed our support for the recognition of Australia’s Aboriginal and Torres Strait Islander Peoples in the nation’s constitution. We have strong relationships with Indigenous peoples in
Australia and around the world. Our support for recognition in Australia’s foundation governance document is consistent with the values underpinning the relationships we seek to have with Indigenous Australians.
Last month marked the 130th anniversary of the establishment of the Broken Hill Proprietary Company. The longevity of BHP Billiton is a challenging yettribute to the enduring innovation, passion and commitment that has supported our rise from a single operation on a remote sheep station in western New South Wales, Australia to a Company operating across the globe.
We will build upon this inheritance by making sure we continue to have the very rewarding timebest people working with the best assets in the best commodities. We remain confident that focus on best-in-class performance, unrivalled asset quality, diversification and investment in high-return projects, will create long-term value through the cycle and deliver superior returns to be atour shareholders.
In everything we do, we are motivated by the helmknowledge that the commodities we produce are central to global economic growth and development. Every employee of BHP Billiton is proud of the world’s leading diversifiedrole the Company plays in supporting the supply of the resources company. We believe our proven strategy, when combined with our great orebodiesnecessary to improve living standards and operational focus on productivity, will deliver stronger margins throughout the economic cycle, a simpler and more capital efficient structure, a substantial increase in free cash flow and growth in shareholder value.social progress.
I would like to thank allextend my sincere thanks to our people, suppliers, customers, host communities and shareholders for their continued support overshareholders. I would especially like to thank the past year. We could not achieve our success without all of your support. The hard-working, disciplinedemployees and talented people atcontractors whose contributions help BHP Billiton are,reach its potential, and will alwayswhose commitment to step up and deliver their best makes me very proud to be central to our ongoing success. I look forward to leading you as we resource the future.part of this great Company.
Andrew Mackenzie
Chief Executive Officer
1.51.3 Our strategyCompany
1.3.1 Group overview
We are BHP Billiton, a leading global resources company. We are among the world’s top producers of major commodities, including iron ore, metallurgical coal, copper and business model
1.5.1 Our consistent strategy
Our purpose
Our purpose is to create long-term shareholder value through the discovery, acquisition, developmenturanium, and marketing of natural resources.
Our strategyhave substantial interests in conventional and unconventional oil and gas and energy coal.
Our strategy is to own and operate large, long-life, low-cost, expandable, upstream assets diversified by commodity, geography and market. Our diversified portfolio of high-quality assets gives us resilience and flexibility to enhance value throughout the commodity cycle.
We sell into globally integrated marketsextract and aim to produce at full capacity throughoutprocess minerals, oil and gas from our production operations located primarily in Australia and the economic cycle. Our leading position in the resources industry is due to our unique, proven and consistent strategy. In line with our strategy, we pursue growth opportunities consistent with our core skills of:
evaluating, developing and extracting our resources in our Businesses;
distributing and sellingAmericas. We sell our products globally with sales and managing financial risk associated with the revenue linemarketing taking place principally through Marketing;
throughSingapore and Houston, United States. As at 30 June 2015, our Group Functions, defining and governing world-class functional standards, which are implemented Group-wide.
This strategy means more predictable company performance over time which, in turn, underpins the creationworkforce consisted of long-term sustainable value for our shareholders, customers,approximately 80,000 employees and contractors.
During FY2015, we demerged a selection of BHP Billiton’s alumina, aluminium, coal, manganese, nickel, silver, lead and zinc assets into a new company, South32.
The safety and health of our people and of the broader communities in which we operate. We aim to deliver long-term sustainable value rather than being focused on short-term returns.
Our values
In pursuing our strategy through all stages of the economic and commodity cycle, we are guided byOur Charter values of Sustainability; Integrity; Respect; Performance; Simplicity; and Accountability.
Our overriding commitment is ensuring the safety of our people, and respecting our environment and the communities in which we work. This commitment informs everything we do and influences every aspect of our work.
Operational capability is fundamental to our strategy and is reflected inOur Charter. In particular, our values of Performance – achieving superior business results by stretching our capabilities, and Simplicity – focusing our efforts on the things that matter most.
Our success factors
We are successful when our people start each day with a sense of purpose and end the day with a sense of accomplishment; our communities, customers and suppliers value their relationships with us; our asset portfolio
is world-class and sustainably developed; our operational discipline and financial strength enables our future growth; and our shareholders receive a superior return on their investment.
1.5.2 Our business model
Exploration and evaluation
discovery through brownfield and greenfield exploring
acquiring and divesting
evaluating our portfolio
Over the past five years, brownfield exploration has increased our resource base around our portfolio of existing assets in large resource basins, which now provides us with significant growth opportunities. This has allowed us to reduce brownfield exploration expenditure and rationalise our greenfield exploration program to focus on copper in Chile and Peru and conventional oil and gas predominantly in the Gulf of Mexico and Western Australia.
We evaluate the results of our brownfield and greenfield exploration to identify future growth projects consistent with our strategy to own and operate large, long-life, low-cost, expandable, upstream assets. We also continually evaluate our portfolio and consider acquisition and divestment opportunities.
Development
evaluating and developing projects
The evaluation and development of large-scale resource projects generates significant value for BHP Billiton. We have a number of high-quality growth projects currently under development. We also have a large number of growth opportunities in our project pipeline in varying stages of evaluation. In our development process, these projects progress through feasibility to execution only after external approvals and rigorous internal review.
Potential expansion projects must compete for capital in BHP Billiton and are only approved if they meet our strict criteria for investment.
Extraction, processing and transportation
open-pit and underground mining
extracting conventional and unconventional oil and gas
processing and refining
Across our global operations, the diversification of our portfolio of assets by commodity, geography and market continues to be one of our differentiating features. Our goal is to safely operate all of our assets at capacity through mining, extracting, processing and transporting commodities.
We continue to set production records at a number of assets. Through the development and use of standard operating practices and technology, we are driving efficiencies through improved capital intensity, labour productivity and increased utilisation of plant and machinery.
Our extraction and processing activities apply our ongoing sustainability obligations, including rehabilitation at the end of the asset life.
Marketing and logistics
selling our products
purchasing major raw materials
managing the supply chain
managing credit and price risk
In order to develop customer and market-focused solutions, we have divided our marketing organisation between mineral marketing, centralised in Singapore and petroleum product marketing, based in Houston, United States. Marketing manages the Group’s product sales and the purchase of all major raw materials. It achieves market clearing prices for our products and is responsible for managing our credit and price risks.
Marketing also manages the supply chain of our products from assets to markets and the raw materials from suppliers to assets. This includes managing our in-house freight requirements so as to procure high-quality,cost-effective shipping.
1.5.3 External factors and trends
Global economy
Economic conditions during the second half of FY2013 were affected by lower than expected growth in emerging economies. Weaker trade and soft manufacturing activity pulled growth rates slightly below expectations in China. However, with employment conditions and income growth remaining resilient, the Chinese Government has room to pursue reforms that support its agenda of stable, long-term growth.
Significant cuts in government spending affected growth in the United States, however this was offset by improved private sector demand, leading to modest rates of economic growth overall. Housing and stock market prices have also strengthened household balance sheets over the past year. As a result, we are confident the recovery will continue, although risks remain regarding the unwinding of monetary policy stimulus.
The renewed policy push in Japan is also positive for medium-term growth expectations, if the government can achieve its stated objectives. Europe remained relatively stable during FY2013; however, we do not anticipate a strong or rapid recovery while fundamental structural problems remain.
Overall, we expect more balanced global growth over the long term as China continues to develop its economy and large developed economies, such as the United States, grow despite fiscal challenges. We expect the rebalancing of the Chinese economy to be significant in terms of the nature of domestic demand, as well as the types of goods and services the economy will produce. We expect these changes to take place gradually, particularly in relation to savings behaviour and levels of fixed asset investment. We also see India and South East Asia as significant sources of economic growth in the long term.
Commodity prices
During FY2013, commodity markets were impacted by a slower pace of growth in China that was balanced in part by increased stability in European sovereign debt markets and an improved private sector performance in the United States. In the case of most steelmaking raw materials, demand growth rates outside China decreased, and combined with robust supply growth from seaborne sources, resulted in lower raw material prices than the previous year. The metals commodities attracted lower prices than the previous year as a result of supply growing faster than demand. Conversely for energy commodities, geopolitical tensions and United States economic improvements provided price support for crude oil, while the US gas prices increased due to increased seasonal demand in the residential and commercial sector and decreased storage inventories from the previous year.
Exchange rates
We are exposed to movements in exchange rates in relation to foreign currency sales and purchases as well as in relation to foreign currency denominated monetary assets and liabilities, including debt. We believe that active
currency hedging does not provide long-term benefits to our shareholders. Because a majority of our sales are denominated in US dollars, and the US dollar plays an important role in our organisation, we borrow and hold surplus cash predominantly in US dollars to provide a natural hedge. Operating costs and costs of locally sourced equipment are influenced by fluctuations in local currencies, primarily the Australian dollar, Brazilian real, Chilean peso and South African rand. Foreign exchange gains and losses reflected in operating costs owing to fluctuations in the local currencies relative to the US dollar may potentially offset one another. In addition, exchange rate markets often provide a theoretical natural hedge against movements in commodity prices. Volatility increased during the year, with a strengthening of the US dollar in the last quarter of FY2013. Overall, the Australian dollar, Brazilian real and South African rand ended FY2013 weaker against the US dollar, while the Chilean peso strengthened.
1.5.4 Our strategic priorities
Our senior management team has sharpened its focus on the following strategic priorities in order to execute the Company’s strategy and deliver sustainable improvement in productivity.
Protect our people and improve the health and safety of our operations
The health, safety and wellbeing of our people are central to the success of our organisation. Regardless of where our people are located, the area of the organisation in which they work or the type of work they undertake, we strive to create a workingan environment that is free from fatality, injury or occupational illness or injury. Identifying and managing material risk is a critical component of our management approach. By understanding and managing our risks, we provide greater protection for our people, communities and assets.
Create a more productive organisation
We continue to simplify our business in order to become more productive and a more capital efficient organisation. We recently implemented a new organisational structure and we removed a layer of management to create a direct line of communication between our Chief Executive Officer and our Businesses.
We are pursuing productivity improvements to sustain our competitiveness and capitalise on growth opportunities. We view productivity as a way of operating that maximises the value for our shareholders, of our people, capital and assets. The inputs to productivity are capital intensity, labour productivity and the utilisation of our plant and machinery. The outputs of productivity are unit revenues and costs that give us a superior margin.
Productivity will be enabled by our people being engaged in our drive to become more competitive by having our plant and machinery assets work harder and our people work smarter. We seek to have a culture that fosters productivity and to make sure our people have the right skills and approach to do their jobs better each day.
Active management of our portfolio
We have concentrated our efforts on those world-class basins where we enjoy economies of scale and a competitive advantage. Our focus on four major Businesses of Iron Ore, Petroleum, Copper and Coal, together with Potash, provides optimum diversification.
Of the 18 major projects in execution at 30 June 2013, approximately 70 per cent are expected to deliver first production by the end of CY2014. The majority of our development projects are brownfield in nature, which are inherently lower risk.
We executed a targeted divestment program, with major transactions totalling US$6.5 billion announced or completed during the period. In these transactions:
we sold our diamonds business, comprising our interests in the EKATI Diamond Mine and Diamonds Marketing operations, to Dominion Diamond Corporation (formerly Harry Winston Diamond Corporation);
we sold our non-operating interest in South African-based Richards Bay Minerals to Rio Tinto;
we sold our Yeelirrie uranium deposit in Western Australia to Cameco Corporation;
we announced the sale of Pinto Valley mining operation and the associated San Manuel Arizona Railroad Company to Capstone Mining Corp;
we sold our interest in the East and West Browse Petroleum joint ventures located offshore Western Australia to PetroChina International Investment (Australia) Pty Ltd;
we extended our Western Australia Iron Ore (WAIO) long-term joint venture relationship with ITOCHU and Mitsui to include Jimblebar. This was completed in July 2013 and aligns our interests across the WAIO supply chain, as well as driving simplicity and flexibility.
An operational review and temporary cessation of production at our BMA open-cut Gregory metallurgical coal mine in Queensland, Australia, also took place in FY2013. We continue to evaluate the performance of all of our operations.
For further information on these events, refer to section 5.3 of this Annual Report.
Disciplined approach to capital management
The Group’s priorities for capital management remain unchanged: firstly, to invest in high-return growth opportunities throughout the economic cycle; secondly, to maintain a solid ‘A’ credit rating and to grow our progressive dividend; and finally, to return excess capital to shareholders.
We have announced a reduction in capital and exploration expenditure from US$21.7 billion in FY2013 to US$16.2 billion in FY2014 (excluding deferred stripping). By reducing annual capital expenditure and increasing competition for capital within the Group, we expect to achieve more sustainable, high margin growth at a higher average rate of return on incremental investment.
The combination of a disciplined approach to capital expenditure and the continued success of the divestment program has strengthened the financial position of the Company. This financial strength has allowed for a reduction in gearing in the second half of FY2013 and continued commitment to maintain a solid ‘A’ credit rating. In addition, this approach underpins our progressive dividend policy, which has been demonstrated by an increase of the dividend for FY2013 to 116 US cents per share, a four per cent increase year on year.
Support sustainable development of our host communitiesillness.
The long-term nature of our operations allows us to establish long-term relationships with our host communities.build collaborative community relationships. Our size and scope mean we can make a meaningful contribution to communities in which we operate. We aim to makemaximise the economic and social benefits of our operations to contribute to global economic development, while minimising our environmental footprint, for example through innovation, productivity and technology.
We have strong governance processes in place, high standards of ethical and responsible behaviour, and we are an active contributor to societal development. We care as much about how results are achieved as we do about the results themselves.
1.3.2 Our structure
BHP Billiton operates under a positive contributionDual Listed Company (DLC) structure, with two parent companies BHP Billiton Limited and BHP Billiton Plc operated as a single economic entity, run by a unified Board and management team. Our headquarters are located in Melbourne, Australia.
BHP Billiton Limited has a primary listing on the Australian Securities Exchange (ASX) in Australia. BHP Billiton Plc has a premium listing on the UK Listing Authority’s Official List and its ordinary shares are admitted to trading on the London Stock Exchange (LSE) in the United Kingdom and a secondary listing on the Johannesburg Stock Exchange (JSE) in South Africa. In addition, BHP Billiton Limited American Depositary Receipts (ADRs) and BHP Billiton Plc ADRs trade on the New York Stock Exchange (NYSE) in the United States.
Our Operating Model describes the way the Company is organised and sets out the relationship between the Businesses, Group Functions and Marketing. The Operating Model defines how we work, how we are organised and how we measure performance.
Businesses: Our assets, operations and interests are separated into four business units. These Businesses are: Petroleum and Potash; Copper; Iron Ore; and Coal. The Operating Model has been designed to ensure that decision-making remains as close to the livesBusinesses as possible.
Group Functions: Group Functions support the Businesses and operate under a defined set of accountabilities authorised by the Group Management Committee (GMC). Our Group Functions are primarily located in Melbourne, London and Singapore.
Marketing: Marketing is responsible for securing sales of our product; realising the full value of our products; managing the supply chain from resources to markets; supporting strategic decision-making through market insights; minimising operating costs and optimising working capital.
The core principles of the Operating Model include mandatory performance requirements, common organisational design, common systems and processes, and common planning and reporting.
The Operating Model is designed to deliver a simple and scalable organisation to achieve a sustainable improvement in productivity by providing performance transparency, eliminating duplication of effort and enabling the more rapid identification and deployment of best practice.
1.3.3 Strategic context
Across the globe, communities are experiencing transformational change – economically, socially, technologically and environmentally. As these accelerate and interconnect, they create opportunities for innovation and improvement. We aim to be at the forefront of these shifts and provide the resources needed to turn change into positive development.
We supply the mineral and energy commodities that are crucial for all stages of economic growth. Emerging economies require construction materials like steel as their populations expand and new cities and heavy industry develop. As economies grow and people who live nearbecome wealthier, a consumer economy emerges and steel intensity slows while demand increases for materials that are used in consumer goods, such as copper. Increased income leads to a demand for agricultural commodities, including potash. The products in our operationsportfolio are the raw materials that fuel change and support an improvement in living standards for people in many parts of the world.
While short-term demand for commodities has moderated, our global energy needs are expected to society more generally.increase by around 30 per cent in the next 20 years. Around two thirds of new demand will originate from Asia, with the majority from China and India. Sub-Saharan Africa is expected to see the fastest growth, albeit from a lower base.
As part of this commitment, we voluntarily invest oneBy 2030, around 50 per cent of newly installed electricity capacity in China and India is expected to be renewable energy. However, even with the strong growth in renewables, the energy supply mix in these two Asian giants is expected to continue to be dominated by oil, coal and gas.
Independent bodies such as the International Energy Agency believe that over the next few decades, fossil fuels will remain central to the energy mix as their affordability and the scale of existing infrastructure often make them hard to practically replace, although their exact percentage varies across a range of scenarios.
We think and plan in decades and generations, and we have long recognised that sustainable growth requires an effective response to climate change. Responding to climate change is a priority Board governance and strategic issue for our pre-tax profit, calculated onCompany. BHP Billiton accepts the averageIPCC’s assessment of climate change science, which has found that warming of the previous three years’ pre-tax profit,climate is unequivocal, the human influence is clear and physical impacts are unavoidable. We believe that the world must pursue the twin objectives of limiting climate change to the lower end of the IPCC emission scenarios in community programsline with current international agreements, while providing access to reliable and affordable energy to support economic development and improved living standards.
Our strategic approach to climate change is underpinned by engagement with policy makers and other stakeholders, including investors, companies and non-government organisations. Industry has a key role to play in climate change policy development by working with governments and other stakeholders to inform the development of an effective, long-term policy framework that aimdelivers a measured transition to have a long-lasting, positive impactlow carbon economy. BHP Billiton believes that any such policy framework should include a complementary set of measures, including a price on the quality of lifecarbon, support for people in our host communities. This includes implementing newlow-emissions technologies and supporting existing community projects.measures to build resilience.
1.6 Selected key measures
1.6.1 Our results at a glance1.3.4 FY2015 performance summary
Not required for US reporting. Refer to sections 1.6.21.11 and 1.6.3.
1.15.1.6.2 Operational information1.3.5 About this Strategic Report
Our BoardThis Strategic Report meets the requirements of the Strategic Reporting required by the UK Companies Act 2006 and Group Management Committee (GMC) monitor a rangethe Operating and Financial Review required by the Australian Corporations Act 2001.
This Strategic Report provides insight into BHP Billiton’s strategy, operating and business model and objectives. It describes the principal risks the Company faces and how these risks might affect our future prospects. It also gives our perspective on our recent operational and financial performance.
We intend this disclosure to assist shareholders and other stakeholders to understand and interpret the Consolidated Financial Statements prepared in accordance with International Financial Reporting Standards (IFRS) included in this Annual Report. The basis of preparation of the Consolidated Financial Statements is set out in note 41 ‘Basis of preparation and measurement’ to the Financial Statements. To obtain full details of the financial and operational performance indicators, reported on a monthly basis, to measure performance over time. We also monitor a comprehensive set of health, safety, environment and community (HSEC) contribution indicators.
| | | | | | | | | | | | |
| | | 2013 | | | 2012 | | | 2011 | |
Health, safety, environment and community | | | | | | | | | | | | |
Total recordable injury frequency (TRIF) | | | 4.6 | | | | 4.7 | | | | 5.0 | |
Community investment (US$M) | | | 245.8 | | | | 214.1 | | | | 195.5 | |
Production (1) | | | | | | | | | | | | |
Total Petroleum production (million barrels of oil equivalent) | | | 235.8 | | | | 222.3 | | | | 159.4 | |
Copper cathode and concentrate (’000 tonnes) | | | 1,209.4 | | | | 1,094.5 | | | | 1,139.4 | |
Iron ore (’000 tonnes) | | | 169,856 | | | | 159,478 | | | | 134,406 | |
Metallurgical coal (’000 tonnes) | | | 37,650 | | | | 33,230 | | | | 32,678 | |
Energy coal (’000 tonnes) | | | 72,892 | | | | 71,111 | | | | 69,500 | |
Alumina (’000 tonnes) | | | 4,880 | | | | 4,152 | | | | 4,010 | |
Aluminium (’000 tonnes) | | | 1,179 | | | | 1,153 | | | | 1,246 | |
Manganese ores (’000 tonnes) | | | 8,517 | | | | 7,931 | | | | 7,093 | |
Manganese alloys (’000 tonnes) | | | 608 | | | | 602 | | | | 753 | |
Nickel (’000 tonnes) | | | 154.1 | | | | 157.9 | | | | 152.7 | |
(1) | Further details on production appear in section 2.3 of this Annual Report. |
1.6.3 Financial information
Our selected financial information reflects the operations of the BHP Billiton Group, andthis Strategic Report should be read in conjunction with the FY2013 financial statements, together with theConsolidated Financial Statements and accompanying notes.
We prepareSection 1 of this Annual Report 2015 constitutes our consolidated financial statements in accordance with International Financial Reporting Standards (IFRS), as issued by the International Accounting Standards Board, and as outlined in noteStrategic Report 2015. References to sections beyond section 1 ‘Accounting policies’are references to the financial statementssections in this Annual Report. We publish our consolidated financial statements in US dollars.
| | | | | | | | | | | | | | | | | | | | |
| | | 2013 | | | 2012 | | | 2011 | | | 2010 | | | 2009 | |
Consolidated Income Statement (US$M except per share data) | | | | | | | | | | | | | | | | | | | | |
Revenue | | | 65,968 | | | | 72,226 | | | | 71,739 | | | | 52,798 | | | | 50,211 | |
Profit from operations | | | 19,225 | | | | 23,752 | | | | 31,816 | | | | 20,031 | | | | 12,160 | |
Profit attributable to members of BHP Billiton Group | | | 10,876 | | | | 15,417 | | | | 23,648 | | | | 12,722 | | | | 5,877 | |
Dividends per ordinary share – paid during the period
(US cents) | | | 114.0 | | | | 110.0 | | | | 91.0 | | | | 83.0 | | | | 82.0 | |
Dividends per ordinary share – declared in respect of the period (US cents) | | | 116.0 | | | | 112.0 | | | | 101.0 | | | | 87.0 | | | | 82.0 | |
Earnings per ordinary share (basic) (US cents)(1) | | | 204.4 | | | | 289.6 | | | | 429.1 | | | | 228.6 | | | | 105.6 | |
Earnings per ordinary share (diluted) (US cents)(1) | | | 203.7 | | | | 288.4 | | | | 426.9 | | | | 227.8 | | | | 105.4 | |
Number of ordinary shares (millions) | | | | | | | | | | | | | | | | | | | | |
– At period end | | | 5,348 | | | | 5,348 | | | | 5,350 | | | | 5,589 | | | | 5,589 | |
– Weighted average | | | 5,322 | | | | 5,323 | | | | 5,511 | | | | 5,565 | | | | 5,565 | |
– Diluted | | | 5,340 | | | | 5,346 | | | | 5,540 | | | | 5,595 | | | | 5,598 | |
| | | | | | | | | | | | | | | | | | | | |
Consolidated Balance Sheet (US$M) | | | | | | | | | | | | | | | | | | | | |
Total assets | | | 138,109 | | | | 129,273 | | | | 102,920 | | | | 88,852 | | | | 78,770 | |
Share capital (including share premium) | | | 2,773 | | | | 2,773 | | | | 2,771 | | | | 2,861 | | | | 2,861 | |
Total equity attributable to members of BHP Billiton Group | | | 70,664 | | | | 65,870 | | | | 56,762 | | | | 48,525 | | | | 39,954 | |
| | | | | | | | | | | | | | | | | | | | |
Other financial information | | | | | | | | | | | | | | | | | | | | |
Underlying EBIT (US$M)(2) | | | 21,127 | | | | 27,238 | | | | 31,980 | | | | 19,719 | | | | 18,214 | |
Underlying EBIT margin(3)(4) | | | 33.2 | % | | | 39.4 | % | | | 47.0 | % | | | 40.7 | % | | | 40.1 | % |
Return on capital employed(4) | | | 13.5 | % | | | 23.0 | % | | | 38.5 | % | | | 26.4 | % | | | 24.6 | % |
Net operating cash flow (US$M)(5) | | | 18,252 | | | | 24,384 | | | | 30,080 | | | | 16,890 | | | | 17,854 | |
Project investment (US$M) | | | 21,183 | | | | 22,791 | | | | 24,517 | | | | 10,770 | | | | 13,965 | |
Gearing | | | 28.8 | % | | | 26.0 | % | | | 9.2 | % | | | 6.3 | % | | | 12.1 | % |
(1) | The calculation of the number of ordinary shares used in the computation of basic earnings per share is the aggregate of the weighted average number of ordinary shares outstanding during the period of BHP Billiton Limited and BHP Billiton Plc after deduction of the weighted average number of shares held by the Billiton share repurchase scheme and the Billiton Employee Share Ownership Plan Trust and the BHP Bonus Equity Plan Trust and adjusting for the BHP Billiton Limited bonus share issue. Included in the calculation of fully diluted earnings per share are shares contingently issuable under Employee Share Ownership Plans. |
(2) | Underlying EBIT is earnings before net finance costs, taxation and any exceptional items. Underlying EBIT is not an IFRS measure of profitability, financial performance, or liquidity and may be defined and used in differing ways by different entities. Underlying EBIT is included in the FY2013 Consolidated Financial Statements as required by IFRS 8 ‘Operating Segments’. We believe that Underlying EBIT provides useful information, but should not be considered as an indication of, or alternative to, Attributable profit as an indicator of operating performance. See section 3.6.2 for more information about this measure, including a reconciliation to profit from operations. |
(3) | Underlying EBIT margin excludes third party product. |
(4) | Underlying EBIT margin and Return on capital employed are non-IFRS measures. We believe that Underlying EBIT margin and Return on capital employed provide useful information, but should not be
|
| considered as an indication of, or alternative to, Attributable profit as an indicator of operating performance. See section 3.3 for more information about this measure. |
(5) | On 1 July 2010, the Group adopted the policy of classifying exploration cash flows which are not recognised as assets as Net operating cash flows. Previously such cash flows were classified as net investing cash flows. The change in policy arose from amendments to IAS7/AASB7 ‘Cash Flows’. Comparative figures have been restated. |
1.7 Our management of risk
1.7.1 Risk factors
We believe that becauseReport 2015. Shareholders may obtain a hard copy of the international scopeAnnual Report free of charge by contacting our operations and the industriesShare Registrars, whose details are set out in which we are engaged, there are numerous factors that may have an effect on our results and operations. The following describes the material risks that could affect the BHP Billiton Group.
External risks
Fluctuations in commodity prices and impacts of ongoing global economic volatility may negatively affect our results, including cash flows and asset values
The prices we obtain for our oil, gas and minerals are determined by, or linked to, prices in world markets, which have historically been subject to substantial volatility. Our usual policy is to sell our productsCorporate Directory at the prevailing market prices. The diversity provided by our relatively broad portfolio of commodities does not insulate the effects of price changes. Fluctuations in commodity prices can occur due to sustained price shifts reflecting underlying global economic and geopolitical factors, industry demand and supply balances, product substitution and national tariffs. See section 3.4.1 for summaries of pricing trends for our most significant commodities. The ongoing global economic volatility has negatively affected commodity market prices and demand. The ongoing uncertainty and impact on global economic growth, particularly in the developed economies, may continue to adversely affect future demand and prices for commodities. The impact of potential longer-term sustained price shifts and shorter-term price volatility, including the effects of unwinding the sustained monetary stimulus in the United States, creates the risk that our financial and operating results including cash flows and asset values, will be materially and adversely affected by unforeseen declines in the prevailing prices of our products.
Our financial results may be negatively affected by currency exchange rate fluctuations
Our assets, earnings and cash flows are influenced by a wide variety of currencies due to the geographic diversity of the countries in which we operate. Fluctuations in the exchange rates of those currencies may have a significant impact on our financial results. The US dollar is the currency in which the majority of our sales are denominated. Operating costs are influenced by the currencies of those countries where our mines and processing plants are located and also by those currencies in which the costs of imported equipment and services are determined. The Australian dollar, South African rand, Chilean peso, Brazilian real and US dollar are the most important currencies influencing our operating costs. Over recent years, the level of exchange of currencies in which the majority of our operating costs are incurred (in particular the Australian dollar, if sustained relative to US dollar denominated commodity prices) has and may continue to adversely impact our profit margins. Given the dominant role of the US currency in our affairs, the US dollar is the currency in which we present financial performance. We do not generally believe that active currency hedging provides long-term benefits to our shareholders. From time to time, we consider currency protection measures appropriate in specific commercial circumstances, subject to strict limits established by our Board. Therefore, in any particular year, our financial results may be negatively affected by currency exchange rate fluctuations.
Reduction in Chinese demand may negatively impact our results
The Chinese market has been driving global materials demand and pricing over the past decade. Sales into China generated US$19.4 billion (FY2012: US$21.6 billion), or 29.4 per cent (FY2012: 29.9 per cent), of our revenue
in the year ended 30 June 2013. The FY2013 sales into China by Business included 58.8 per cent Iron Ore, 19.4 per cent Copper, 8.4 per cent Coal and 4.5 per cent Petroleum. A slowing in China’s economic growth could result in lower prices and demand for our products and negatively impact our results including cash flows.
In response to its increased demand for commodities, China is increasingly seeking strategic self-sufficiency in key commodities, including investments in existing businesses or new developments in other countries. These investments may adversely impact future commodity demand and supply balances and prices.
Actions by governments or political events in the countries in which we operate could have a negative impact on our business
We have operations in many countries around the globe, which have varying degrees of political and commercial stability. We operate in emerging markets, which may involve additional risks that could have an adverse impact upon the profitability of an operation. These risks could include terrorism, civil unrest, nationalisation, renegotiation or nullification of existing contracts, leases, permits or other agreements, restrictions on repatriation of earnings or capital and changes in laws and policy, as well as other unforeseeable risks. Risks relating to bribery and corruption, including possible delays or disruption resulting from a refusal to make so-called facilitation payments, may be prevalent in some of the countries in which we operate. If any of our major operations are affected by one or more of these risks, it could have a negative effect on the operations in those countries, as well as the Group’s overall operating results and financial condition.
Our operations are based on material long-term investments that are dependent on long-term fiscal stability and could be adversely impacted by changes in fiscal legislation. The mining industry has been identified as a source of tax revenue and can also be impacted by broader fiscal measures applying to business generally.
Our business could be adversely affected by new government regulations, such as controls on imports, exports and prices. Increasing requirements relating to regulatory, environmental and social approvals can potentially result in significant delays in construction and may adversely affect the economics of new mining and oil and gas projects, the expansion of existing operations and results of our operations. We have oil and gas operations located in the Gulf of Mexico region of the United States. A six-month moratorium on drilling was issued in June 2010 following the Deepwater Horizon oil spill. Even though the moratorium has been lifted, the industry now faces more stringent permitting requirements. Delays or additional costs may occur in receiving future permits for deepwater drilling activities in the Gulf of Mexico.
Infrastructure, such as rail, ports, power and water, is critical to our business operations. We have operations or potential development projects in countries where government provided infrastructure or regulatory regimes for access to infrastructure, including our own privately operated infrastructure, may be inadequate or uncertain or subject to legislative change. These may adversely impact the efficient operations and expansion of our Businesses.
We operate in several countries where ownership of land is uncertain and where disputes may arise in relation to ownership. In Australia, the Native Title Act 1993 provides for the establishment and recognition of native title under certain circumstances. In South Africa, the Extension of Security of Tenure Act (1997) and the Restitution of Land Rights Act (1994) provide for various landholding rights. Such legislation could negatively affect new or existing projects.
These regulations are complex, difficult to predict and outside of our control and could negatively affect our Company and results.
Business risks
Failure to discover new reserves, maintain or enhance existing reserves or develop new operations could negatively affect our future results and financial condition
The demand for our products and production from our operations results in existing reserves being depleted over time. As our revenues and profits are derived from our oil and gas and minerals operations, our results and financial condition are directly related to the success of our exploration and acquisition efforts, and our ability to replace existing reserves. Exploration activity occurs adjacent to established operations and in new regions, in developed and less developed countries. These activities may increase land tenure, infrastructure and related political risks. A failure in our ability to discover new reserves, enhance existing reserves or develop new operations in sufficient quantities to maintain or grow the current level of our reserves could negatively affect our results, financial condition and prospects.
Future deterioration in commodities pricing may make drilling some acreage and existing reserves uneconomic. Our actual drilling activities and future drilling budget will depend on drilling results, commodity prices, drilling and production costs, availability of drilling services and equipment, lease expirations, gathering systems, transportation pipelines and other infrastructure constraints, regulatory approvals and other factors.
There are numerous uncertainties inherent in estimating ore and oil and gas reserves, and geological, technical and economic assumptions that are valid at the time of estimation may change significantly when new information becomes available. The uncertain global financial outlook may affect economic assumptions related to reserve recovery and require reserve restatements. Reserve restatements could negatively affect our results and prospects.
Potential changes to our portfolio of assets through acquisitions and divestments may have a material adverse effect on our future results and financial condition
We regularly review the composition of our asset portfolio and from time to time may add assets to the portfolio or divest assets from the portfolio. There are a number of risks associated with such divestments or acquisitions. These include adverse market reaction to such changes or the timing or terms on which such changes are made, the imposition of adverse regulatory conditions and obligations, commercial objectives not being achieved as expected, unforeseen liabilities arising from such changes to the portfolio, sales revenues and operational performance not meeting our expectations, anticipated synergies or cost savings being delayed or not being achieved, inability to retain key staff and transaction-related costs being more than anticipated. These factors could negatively affect our reputation, future results and financial condition.
Increased costs and schedule delays may adversely affect our development projects
Although we devote significant time and resources to our project planning, approval and review process, many of our development projects are highly complex and rely on factors that are outside our control, which may cause us to underestimate the cost or time required to complete a project. In addition, we may fail to manage projects as effectively as we anticipate and unforeseen challenges may emerge.
Any of these may result in increased capital costs and schedule delays at our development projects, adversely affecting our development projects and impacting anticipated financial returns.
Financial risks
If our liquidity and cash flow deteriorate significantly it could adversely affect our ability to fund our major capital programs
We seek to maintain a solid ‘A’ credit rating as part of our strategy; however, fluctuations in commodity prices and the ongoing global economic volatility may continue to adversely impact our future cash flows and ability to
access capital from financial markets at acceptable pricing. If our key financial ratios and solid ‘A’ credit rating are not maintained, our liquidity and cash reserves, interest rate costs on borrowed debt, future access to financial capital markets and the ability to fund current and future major capital programs could be adversely affected.
We may not recover our investments in mining, oil and gas assets, which may require financial write-downs
One or more of our assets may be impacted by changed market or industry structures, commodity prices, technical operating difficulties, inability to recover our mineral, oil or gas reserves and increased operating cost levels. These may cause us to fail to recover all or a portion of our investment in mining and oil and gas assets and may require financial write-downs adversely impacting our financial results.
The commercial counterparties we transact with may not meet their obligations which may negatively impact our results
We contract with a large number of commercial and financial counterparties, including customers, suppliers and financial institutions. The ongoing global economic volatility has placed strains on global financial markets, reduced liquidity and adversely affected business conditions generally. We maintain a ‘one book’ approach with commercial counterparties to ensure that all credit exposures are quantified. Our existing counterparty credit controls may not prevent a material loss due to credit exposure to a major customer or financial counterparty. In addition, customers, suppliers, contractors or joint venture partners may fail to perform against existing contracts and obligations. Non-supply of key inputs, such as tyres, mining and mobile equipment and other key consumables, may unfavourably impact costs and production at our operations. These factors could negatively affect our financial condition and results of operations.
Operational risks
Cost pressures and reduced productivity could negatively impact our operating margins and expansion plans
Cost pressures may continue to occur across the resources industry. As the prices for our products are determined by the global commodity markets in which we operate, we do not generally have the ability to offset these cost pressures through corresponding price increases, which can adversely affect our operating margins. Notwithstanding our efforts to reduce costs and a number of key cost inputs being commodity price-linked, the inability to reduce costs and a timing lag may adversely impact our operating margins for an extended period.
Our Australian-based operations may continue to be affected by the Australian Fair Work Act 2009 as labour agreements expire and businesses are required to collectively bargain with unions. In some instances labour unions are pursuing wage claims in the bargaining process, and/or claims about union access and involvement in operational decision-making. These claims may adversely affect workplace flexibility, productivity and costs. Industrial action in pursuit of claims associated with the bargaining process has occurred in some Businesses, and is likely to continue to occur as unions press for new claims as part of the bargaining process.
A number of our operations, such as aluminium and copper, are energy or water intensive and, as a result, the Group’s costs and earnings could be adversely affected by rising costs or by supply interruptions. These could include the unavailability of energy, fuel or water due to a variety of reasons, including fluctuations in climate, significant increases in costs, inadequate infrastructure capacity, interruptions in supply due to equipment failure or other causes and the inability to extend supply contracts on economical terms.
These factors could lead to increased operating costs at existing operations and could negatively impact our operating margins and expansion plans.
Unexpected natural and operational catastrophes may adversely impact our operations
We operate extractive, processing and logistical operations in many geographic locations both onshore and offshore. Our key port facilities are located at Port Hedland and Hay Point in Australia. We have 12 underground mines, including seven underground coal mines. Our operational processes may be subject to operational accidents such as port and shipping incidents, underground mine and processing plant fire and explosion,open-cut pit wall failures, loss of power supply, railroad incidents, loss of well control, environmental pollution and mechanical critical equipment failures. Our operations may also be subject to unexpected natural catastrophes such as earthquakes, flood, hurricanes and tsunamis. Our northwest Western Australia iron ore, Queensland coal and Gulf of Mexico oil and gas operations are located in areas subject to cyclones or hurricanes. Our Chilean copper operations are located in a known earthquake and tsunami zone. Based on our claims, insurance premiums and loss experience, our risk management approach is not to purchase insurance for property damage, business interruption and construction-related risk and primary liability exposures. Existing business continuity plans may not provide protection for all of the costs that arise from such events. The impact of these events could lead to disruptions in production, increased costs and loss of facilities more than offsetting premiums saved, which would adversely affect our financial results and prospects. Third party claims arising from these events may exceed the limit of liability insurance policies we have in place.
Our non-controlled assets may not comply with our standards
Some of our assets are controlled and managed by joint venture partners or by other companies. Management of our non-controlled assets may not comply with our management and operating standards, controls and procedures, including our health, safety, environment and community (HSEC) standards. Failure to adopt equivalent standards, controls and procedures at these assets could lead to higher costs and reduced production and adversely impact our results and reputation.
Breaches in our information technology security processes may adversely impact the conduct of our business activities
We maintain global information technology (IT) infrastructure, applications and communications networks to support our business activities. These systems could be subject to security breaches resulting in theft, disclosure or corruption of information, including information relating to acquisitions and divestments, strategicdecision-making, investment market communications or commercially sensitive information relating to major contracts. Security breaches could also result in misappropriation of funds or disruptions to our business operations.
Sustainability risks
HSEC impacts, incidents or accidents and related regulations may adversely affect our people, operations and reputation or licence to operate
Due to the nature of our operations, HSEC incidents or accidents and related regulations may adversely affect our reputation or licence to operate.
Safety
Potential safety events that may have a material adverse impact on our operations include fire, explosion or rock fall incidents in underground mining operations, personnel conveyance equipment failures in underground operations, aircraft incidents, incidents involving light vehicles and mining mobile equipment, ground control failures, well blowouts, explosions or gas leaks, isolation working from heights or lifting operations.
Environment
Environmental incidents that have the potential to create a material impact include uncontrolled tailings containment breaches, subsidence from mining activities, escape of polluting substances and uncontrolled releases of hydrocarbons.
Our operations by their nature have the potential to impact biodiversity, water resources and related ecosystem services. Changes in scientific understanding of these impacts, regulatory requirements or stakeholder expectations may prevent or delay project approvals and result in increased costs for mitigation, offsets or compensatory actions.
We provide for operational closure and site rehabilitation. Our operating and closed facilities are required to have closure plans. Changes in regulatory or community expectations may result in the relevant plans not being adequate. This may impact financial provisioning and costs at the affected operations.
Community
We contribute to the communities in which we operate by providing skilled employment opportunities, salaries and wages, taxes and royalties and community development programs, including a commitment to one per cent of pre-tax profits invested in community programs. Notwithstanding these actions, local communities may become dissatisfied with the impact of our operations or oppose our new development projects, including through litigation, potentially affecting costs and production, and in extreme cases viability. Community related risks may include community protests or civil unrest, delays to proposed developments and inadvertent breaches of human rights or other international laws or conventions.
Health
Health risks faced include fatigue and occupational exposure to noise, silica, manganese, diesel exhaust particulate, fluorides, coal tar pitch, nickel and sulphuric acid mist. Longer-term health impacts may arise due to unanticipated workplace exposures or historical exposures of our workforce to hazardous substances. These effects may create future financial compensation obligations.
We invest in workplace and community health programs, where indicated by risk assessment. However, infectious diseases such as HIV and malaria may have a material adverse impact upon our workers or on our communities, primarily in Africa. Because we operate globally, we may be affected by potential pandemic influenza outbreaks, such as A(H1N1) and avian flu, in any of the regions in which we operate.
HSEC legislation
The nature of the industries in which we operate means that many of our activities are highly regulated by health, safety and environmental laws. As regulatory standards and expectations are constantly developing, we may be exposed to increased litigation, compliance costs and unforeseen environmental rehabilitation expenses.
Legislation requiring manufacturers, importers and downstream users of chemical substances, including metals and minerals, to establish that the substances can be used without negatively affecting health or the environment may impact our operations and markets. These potential compliance costs, litigation expenses, regulatory delays, rehabilitation expenses and operational costs could negatively affect our financial results.
Hydraulic fracturing
Our Onshore US operations involve hydraulic fracturing, an essential and common practice in the oil and gas industry to stimulate production of natural gas and oil from dense subsurface rock formations. Hydraulic fracturing involves using water, sand and a small amount of chemicals to fracture the hydrocarbon-bearing rock formation, to allow flow of hydrocarbons into the wellbore. We routinely apply hydraulic fracturing techniques in our drilling and completion programs.
Attention given to the hydraulic fracturing process could lead to greater opposition to oil and gas production activities using hydraulic fracturing techniques. Increased regulation could impose more stringent permitting, public disclosure and well construction requirements on hydraulic fracturing operations. The hydraulic fracturing process is typically regulated by relevant state regulatory bodies. Some states in the United States are considering changes to regulations in relation to permitting, public disclosure, and/or well construction requirements on hydraulic fracturing and related operations. Arkansas, Louisiana and Texas have adopted various laws, regulations or issued regulatory guidance concerning hydraulic fracturing.
Several US federal agencies are reviewing or advancing regulatory proposals concerning hydraulic fracturing and related operations. The US Environmental Protection Agency (EPA) commenced a study of the potential impacts of hydraulic fracturing activities on drinking water resources and issued a non-determinative Progress Report in December 2012. The EPA is expected to issue a final report for peer review in CY2014. The US Bureau of Land Management (BLM) issued a revised proposed rule that would impose new requirements on hydraulic fracturing operations conducted on federal lands, including the disclosure of chemical additives used. Activity at the federal level, including the ongoing EPA study, BLM rules and other analysis by federal and state agencies to assess the impacts of hydraulic fracturing could spur additional legislative or regulatory actions.
While we have not yet realised a material delay or substantially higher operating costs as a result of current regulatory requirements in our Onshore US operations, we cannot predict whether additional federal, state or local laws or regulations will be enacted and what such actions would require or prohibit. Additional legislation or regulation could subject our operations to delays and increased costs, or prohibit certain activities, which could adversely affect the financial performance of our Onshore US operations.
Climate change and greenhouse effects may adversely impact our operations and markets
Carbon-based energy is a significant input in a number of the Group’s mining and processing operations and we have significant sales of carbon-based energy products.
A number of governments or governmental bodies have introduced or are contemplating regulatory change in response to the impacts of climate change. Under the December 2009 Copenhagen Accord, developed countries established individual greenhouse gas targets and developing countries established national mitigation actions. The European Union Emissions Trading System (EU ETS), which came into effect on 1 January 2005, has had an impact on greenhouse gas and energy-intensive businesses based in the EU. Our Petroleum Assets in the United Kingdom are currently subject to the EU ETS, as are our EU-based customers. Elsewhere, there is current and emerging climate change regulation that will affect energy prices, demand and margins for carbon-intensive products. The Australian Government’s response has included the introduction in 2001 of a renewable energy target of 20 per cent by the year 2020, and a carbon pricing scheme which commenced with a fixed price on 1 July 2012. From a medium to long-term perspective, we are likely to see some changes in the cost position of our greenhouse gas-intensive assets and energy-intensive assets as a result of regulatory impacts in the countries where we operate. These proposed regulatory mechanisms may impact our operations directly or indirectly through our suppliers and customers. Inconsistency of regulations, particularly between developed and developing countries, may also change the competitive position of some of our assets. Assessments of the potential impact of future climate change regulation are uncertain given the wide scope of potential regulatory change in the many countries where we operate. The South African Government plans to introduce a carbon tax beginning in 2015; however the details are not yet finalised. Carbon pricing has also been discussed as part of a broader tax reform package in Chile.
The physical impacts of climate change on our operations are highly uncertain and will be particular to the geographic circumstances. These may include changes in rainfall patterns, water shortages, rising sea levels, increased storm intensities and higher temperatures. These effects may adversely impact the productivity and financial performance of our operations.
A breach of our governance processes may lead to regulatory penalties and loss of reputation
We operate in a global environment straddling multiple jurisdictions and complex regulatory frameworks. Our governance and compliance processes, which include the review of internal control over financial reporting and specific internal controls in relation to offers of things of value to government officials and representatives of state-owned enterprises, may not prevent future potential breaches of law, accounting or governance practice. The BHP BillitonCode of Business Conduct, together with our mandatory policies, such as the anti-corruption and the competition policies, may not prevent instances of fraudulent behaviour and dishonesty nor guarantee compliance with legal or regulatory requirements. This may lead to regulatory fines, disgorgement of profits, litigation, loss of operating licences or reputational damage.
1.7.2 Approach to risk management
We believe that the identification and management of risk is central to achieving our corporate purpose of creating long-term shareholder value.
Risk will manifest itself in many forms and has the potential to impact our health and safety, environment, community, reputation, regulatory, market and financial performance and, thereby, the achievement of our corporate purpose.
By understanding and managing risk, we provide greater certainty and confidence for our shareholders, employees, customers, suppliers, and for the communities in which we operate. Successful risk management can be a source of competitive advantage.
Our risks are managed on an enterprise-wide basis. The natural diversification in our portfolio of commodities, geographies, currencies, assets and liabilities is a key element in our risk management approach.
Risk management is embedded in our critical business activities, functions and processes. Materiality and our tolerance for risk are key considerations in our decision-making.
Risk issues are identified, analysed and assessed in a consistent manner. Performance requirements exist for the identification, assessment, control and monitoring of material risk issues that could threaten our corporate purpose and business plans. These include:
The potential for impacts on the achievement of our corporate purpose and business plans is identified through risk assessments using approved materiality and tolerability criteria. The severity of any risk event is assessed according to a matrix that describes the degree of harm, injury or loss from the most severe impact associated with that risk event, assuming reasonable effectiveness of controls.
A risk assessment (risk identification, risk analysis and risk evaluation) is conducted for material risk issues.
Risk controls are designed, implemented, operated and assessed to produce a residual risk that is tolerable. Performance standards are established for critical controls over material risks with supporting monitoring and verification processes.
We have established processes that apply when entering or commencing new activities in higher governance risk countries. Risk assessments and a supporting risk management plan are required to ensure that potential reputation, legal, business conduct and corruption-related exposures are tolerable and legislative compliance is maintained, including relevant anti-corruption legislation and the application of any sanctions or trade embargos.
Our risk management governance approach is described in sections 5.13.1 and 5.14.
1.7.3 Management of principal risks
The scope of our operations and the number of industries in which we operate and engage mean that a range of factors may impact our results. Material risks that could negatively affect our results and performance are described in section 1.7.1end of this Annual Report. Our approach
All references to managing these risks is outlined below.websites in this Annual Report are, unless expressly stated otherwise, intended to be inactive textual references for information only and any information contained in or accessible through any such website does not form a part of this Annual Report.
| | |
Principal risk area
| | Risk management approach
|
External risks
| | |
Risks arise from fluctuations in commodity prices and currency exchange rates, demand changes in major markets (such as China or Europe) or actions by governments and political events that impact long-term fiscal stability. | | The diversification of our portfolio of commodities, geographies and currencies is a key strategy for reducing volatility. Section 3.4 describes external factors and trends affecting our results and note 29 ‘Financial risk management’ to the financial statements outlines the Group’s financial risk management strategy, including market, commodity, and currency risk. The Financial Risk Management Committee oversees these, as described in section 5.15. We engage with governments and other key stakeholders to ensure the potential impacts of proposed fiscal, tax, resource investment, infrastructure access and regulatory changes are understood and where possible mitigated. |
| |
Business risks
| | |
Executing our business strategy creates risks related to identifying and proving reserves, adding and divesting assets and managing our capital development projects. | | We support our business strategy through minerals and petroleum exploration programs. The Group Resource and Business Optimisation function provides governance and technical leadership for Mineral Resource development and Ore Reserves reporting as described in section 2.13.2 and section 2.6. Our governance over reporting of Petroleum reserves is described in section 2.13.1.
We have established investment approval processes that apply to all major capital projects and asset divestment and acquisitions. The Investment Committee oversees these as described in section 5.15. The Group Project Management function additionally ensures that the optimum framework and capabilities are in place to deliver safe, predictable and competitive projects. Additionally we have established project hubs as operating centres for the study and execution of a pipeline of major capital projects using a program management approach.
|
| | |
Principal risk area
| | Risk management approach
|
Financial risks
| | |
Continued volatility in global financial markets may adversely impact future cash flows, the ability to adequately access and source capital from financial markets and our credit rating. This may impact planned expenditures, as well as the ability to recover investments in mining and oil and gas projects. In addition, the commercial counterparties (customers, suppliers and financial institutions) we transact with may, due to adverse market conditions, not meet their obligations. | | We seek to maintain a solid ‘A’ credit rating, supported by our portfolio risk management strategy. As part of this strategy, commodity prices and currency exchange rates are not hedged, and wherever possible we take the prevailing market price, which serves to mitigate counterparty performance risk. We use Cash Flow at Risk analysis to monitor volatilities and key financial ratios. Credit limits and review processes are established for all customers and financial counterparties. The Financial Risk Management Committee oversees these as described in section 5.15. Note 29 ‘Financial risk management’ to the financial statements outlines our financial risk management strategy. |
| |
Operational risks
| | |
Operating cost pressures and reduced productivity could negatively impact operating margins and expansion plans. Non-controlled assets may not comply with our standards. Unexpected natural and operational catastrophes may adversely impact our operations. Breaches in IT security processes may adversely impact the conduct of our business activities. | | We seek to ensure that adequate operating margins are maintained through our strategy to own and operate large, long-life, low-cost and expandable upstream assets.
The Group’s concentrated effort to reduce operating costs and drive productivity improvements has realised tangible results, with a reduction in controllable costs.
The capability to sustain productivity improvements is being further enhanced through continued refinements to our Operating Model. The Operating Model is designed to deliver a simple and scalable organisation, providing a competitive advantage through defining work, organisation and performance measurement. Defined global business processes, including 1SAP, provide a standardised way of working across the organisation. Common processes generate reliable data and improve operating discipline. Global sourcing arrangements have been established to ensure continuity of supply and competitive costs for key supply inputs. We seek to influence the application of our standards tonon-controlled assets.
Through the application of our risk management processes, we identify material catastrophic operational risks and implement the critical controls and performance requirements to maintain control effectiveness. Business continuity plans are required to be established to mitigate consequences. Consistent with our portfolio risk management approach, we continue to be largely self-insured for losses arising from property damage, business interruption and construction.
|
| | |
Principal risk area
| | Risk management approach
|
| | IT security controls to protect IT infrastructure, applications and communication networks and respond to security incidents are in place and subject to regular monitoring and assessment. To maintain adequate levels of protection, we also continue to monitor the development of threats in the external environment and assess potential responses to those threats. |
| |
Sustainability risks
| | |
HSEC incidents or accidents and related regulations may adversely affect our people, operations and reputation or licence to operate. The potential physical impacts and related government regulatory responses to climate change and greenhouse effects may adversely impact our operations and markets. Given that we operate in a challenging global environment straddling multiple jurisdictions, a breach of our governance processes may lead to regulatory penalties and loss of reputation. | | Our approach to sustainability risks is reflected inOur Charter and described in section 2.8. A comprehensive set of Group Level Documents (GLD) set out Group-wide HSEC-related performance requirements to ensure effective management control of these risks.
OurCode of Business Conduct sets out requirements related to working with integrity, including dealings with government officials and third parties. Processes and controls are in place for the financial control over financial reporting, including under Sarbanes-Oxley. We have established anti-corruption and antitrust related performance requirements overseen by the Legal and Compliance function. The Disclosure Committee oversees our compliance with securities dealing obligations and continuous and periodic disclosure obligations.
|
1.81.3.6 Forward looking statements
This Annual Report contains statements relating to past performance (which cannot be relied on as a guide to future performance) and also contains forward looking statements, including statements regarding:
regarding trends in commodity prices and currency exchange rates;
demand for commodities;
production forecasts; plans, strategies and objectives of management;
divestment of assets closure or closuredivestment of certain operations or facilities (including associated costs);
anticipated production or construction commencement dates;
capital costs and scheduling;
operating costs;
anticipated productive lives of projects, mines and facilities;
provisions and contingent liabilities;
and tax and regulatory developments.
Forward looking statements can be identified by the use of terminology such as ‘intend’, ‘aim’, ‘project’, ‘anticipate’, ‘estimate’, ‘plan’, ‘believe’, ‘expect’, ‘may’, ‘should’, ‘will’, ‘continue’ or similar words. These statements discuss future expectations concerning the results of operations or financial condition,conditions, or provide other forward looking statements.information.
These forward looking statements are not guarantees or predictions of future performance, and involve known and unknown risks, uncertainties and other factors, many of which are beyond our control, and which may cause actual results to differ materially from those expressed in the statements contained in this Annual Report. Readers are cautioned not to put undue reliance on forward looking statements.
For example, our future revenues from our operations, projects or mines described in this Annual Report will be based, in part, upon the market price of the minerals, metals or petroleum products produced, which may vary significantly from current levels. These variations, if materially adverse, may affect the timing or the feasibility of the development of a particular project, the expansion of certain facilities or mines, or the continuation of existing operations.
Other factors that may affect the actual construction or production commencement dates, costs or production output and anticipated lives of operations, mines or facilities include our ability to profitably produce and transport the minerals, petroleum and/or metals extracted to applicable markets; the impact of foreign currency exchange rates on the market prices of the minerals, petroleum or metals we produce; activities of government authorities in some of the countries where we are exploring or developing these projects, facilities or mines, including increases in taxes, changes in environmental and other regulations and political uncertainty; labour unrest; and other factors identified in the risk factors describedset out in section 1.7.1.
We cannot assure you that our estimated economically recoverable reserve figures, closure or divestment1.7.2 of operations or facilities, including associated costs, actual production or commencement dates, cost or production output or anticipated lives of the projects, mines and facilities discussed in this Annual Report, will not differ materially from the statements contained in this Annual Report.
Except as required by applicable regulations or by law, the Group does not undertake any obligation to publicly update or review any forward looking statements, whether as a result of new information or future events.
Past performance cannot be relied on as a guide to future performance.
1.3.7 Completed demerger of assets
2 InformationIn August 2014, we announced our intention to create a new company through the demerger of a selection of assets that included BHP Billiton’s interest in its integrated Aluminium business, Energy Coal South Africa, Illawarra metallurgical coal, the Manganese business, the Cerro Matoso nickel operation and the Cannington silver-lead-zinc mine. After receiving shareholder approval for the demerger on 6 May 2015 (with approximately 98 per cent of votes cast being in favour), the new company, South32, was listed on the Company
2.1 HistoryASX as an independent company on 18 May 2015 and development
the formal separation of South32 from BHP Billiton Limited (formerly BHP Limited and before that The Broken Hill Proprietary Company Limited) was incorporated in 1885 and is registered in Australia with ABN 49 004 028 077. BHP Billiton Plc (formerly Billiton Plc) was incorporated in 1996 and is registered in England and Wales with registration number 3196209. Successive predecessor entities to BHP Billiton Plc have operated since 1860.
Since 29 June 2001, we have operated under a Dual Listed Company (DLC) structure. Under the DLC structure, the two parent companies,completed on 25 May 2015. Eligible BHP Billiton Limited and Plc shareholders received shares in South32 in the demerger through a pro rata, in-specie distribution, as well as retaining their existing shares in the Group.
For IFRS accounting purposes, the demerger was deemed completed as of 8 May 2015 (the date of loss of control) and the demerged assets are treated as Discontinued operations in BHP Billiton’s Financial Statements. Unless otherwise stated, throughout this Annual Report financial information for FY2015 relating to the demerged assets is reported for the period from 1 July 2014 to 8 May 2015 as Discontinued operations, while FY2015 production information relating to the demerged assets is reported for the period from 1 July 2014 to 30 April 2015 to more closely align with BHP Billiton’s month-end reporting systems. Continuing operations refers to the assets that formed part of the BHP Billiton PlcGroup as at 30 June 2015.
Comparative information for the years ended 30 June 2014 and 30 June 2013 has been restated for the effects of the application of IFRS 5/AASB 5 ‘Non-current Assets Held for Sale and Discontinued Operations’ following the demerger of South32. The Consolidated Statement of Comprehensive Income, the Consolidated Balance Sheet and the Consolidated Statement of Changes in Equity for these periods are not required to be restated.
For more information on the South32 demerger and reporting of Continuing and Discontinued operations, refer to sections 1.6.4 and 2.1.7 of this Annual Report and note 29 ‘Discontinued operations’ to the Financial Statements.
1.4 BHP Billiton locations
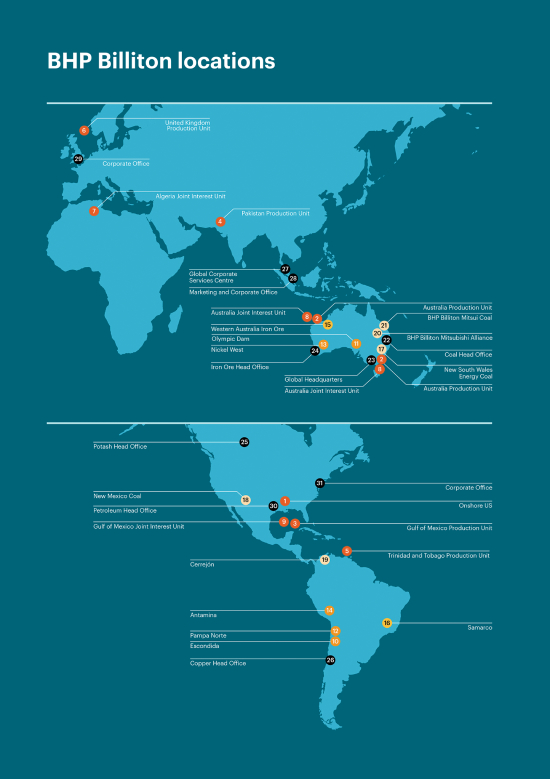
1.4 BHP Billiton locations
We are among the world’s top producers of major commodities, including iron ore, metallurgical coal, copper and uranium, and have substantial interests in conventional and unconventional oil and gas and energy coal.
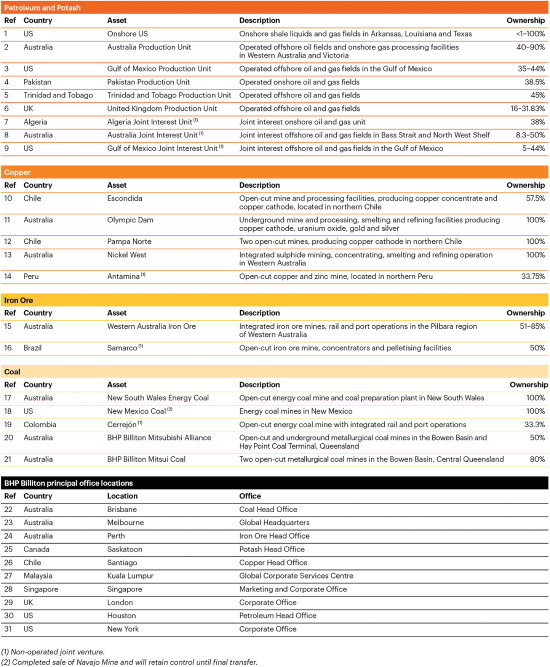
1.5 Strategy and business model
1.5.1 Our consistent strategy
Our purpose
Our corporate purpose is to create long-term shareholder value through the discovery, acquisition, development and marketing of natural resources.
Our strategy
Our strategy is to own and operate large, long-life, low-cost, expandable, upstream assets diversified by commodity, geography and market.
Our unique position in the resources industry is due to our proven and consistent strategy. In line with our strategy, we pursue growth opportunities consistent with our core skills of:
evaluating, developing and extracting resources in our Businesses;
distributing and selling our products, and managing financial risk associated with our revenue through Marketing;
defining and governing world-class functional standards, which are implemented Group-wide through our Group Functions.
We operate in a dynamic, globally competitive environment. Our strategy has delivered strong Company performance over time which, in turn, underpins the creation of long-term sustainable value for our shareholders, customers, employees and the communities in which we operate. We aim to deliver long-term sustainable value rather than focusing on short-term returns.
Our values
In pursuing our strategy through all stages of the economic and commodity cycles, we are guided byOur BHP Billiton Charter values of Sustainability, Integrity, Respect, Performance, Simplicity and Accountability.
Our overriding commitment is to ensuring the safety of our people, and respecting our environment and the communities in which we work. This commitment informs everything we do and influences every aspect of our work.
Operational capability is fundamental to our strategy. It is reflected inOur Charter, in particular our values of Performance – achieving superior business results by stretching our capabilities, and Simplicity – focusing our efforts on the things that matter most.
Our success factors
We are successful when:
our people start each day with a sense of purpose and end the day with a sense of accomplishment;
our communities, customers and suppliers value their relationships with us;
our asset portfolio is world-class and sustainably developed;
our operational discipline and financial strength enables our future growth; and
our shareholders receive a superior return on their investment.
1.5.2 Our business model
Exploration and evaluation
Discovery through brownfield and greenfield exploration.
Evaluating our portfolio.
Divestment and acquisition.
Our portfolio of existing assets in large resource basins provides us with potential growth opportunities. This has allowed us to reduce our greenfield exploration expenditure and rationalise our brownfield exploration program. We continue to focus our greenfield exploration on copper in Chile, Peru and the southwestern United States, and conventional oil and gas, predominantly offshore in the Gulf of Mexico, Western Australia and Trinidad and Tobago. We evaluate the results of our brownfield and greenfield exploration to identify future growth projects consistent with our strategy to own and operate large, long-life, low-cost, expandable, upstream assets. We also continually evaluate our portfolio and consider divestment and acquisition opportunities.
Development
Evaluating and developing projects.
The evaluation and development of large-scale resource projects generates significant value for BHP Billiton. We have a number of high-quality growth projects currently under development. We also have a large number of growth opportunities in our project pipeline in varying stages of evaluation.
In our development process, these projects progress through feasibility to execution only after internal and external approvals. Our rigorous internal review process requires projects to pass through various tollgates for internal approvals at each stage, including Board approval for major projects.
Potential expansion projects must compete for capital within BHP Billiton and approved only if they meet our strict criteria for investment.
Extraction, processing and transportation
Open-pit and underground mining.
Extracting conventional and unconventional oil and gas.
Processing and refining.
Across our global operations, the diversification of our portfolio of assets by commodity, geography and market continues to be one of our differentiating features. Our goal is to safely operate all our assets at capacity through mining, extracting, processing and transporting commodities.
We continue to set production records at a number of assets. Through the development and use of standard operating practices and technology, we are driving efficiencies through improved capital intensity, labour productivity and increased utilisation of plant and machinery.
Our extraction and processing activities are mindful of our ongoing sustainability obligations, including rehabilitation at the end of the asset life.
Marketing and logistics
BHP Billiton’s Marketing organisation is responsible for:
Developing the Group-wide view of the markets and future pricing.
Supporting the Businesses to maximise the value of upstream resources.
Managing the supply chain to customers.
Achieving market clearing prices for the Group’s products.
Selling the Group’s products and purchasing all major raw materials.
Managing price risk.
Due to its proximity to our customers in Asia, the primary hub for our marketing activities is Singapore, while our marketing of oil and gas is headquartered in Houston, United States. In addition, we have marketers located close to our customers in nine cities around the world.
Marketing’s responsibilities require an active presence in the various commodities markets, the global freight market and the crude and gas pipeline transportation market, through which we manage the supply chain for our products and develop strong integrated relationships between our Businesses and our customers.
Our market insight is strengthened by the multi-commodity nature of our organisation, our proximity to our customers and the flow of information in our centralised marketing structure.
A description of our risk factors, including those that impact our business model, and our approach to risk management are presented in section 1.7 of this Annual Report.
1.5.3 External factors and trends
Economic outlook
The global economy grew at a modest rate in FY2015 with a mild improvement in developed economies offsetting a moderation in emerging markets.
In China, a slowdown in the property sector and fixed asset investment led to lower economic growth following policy tightening in CY2014. Consumer spending remained resilient reflecting the continued rebalancing of the economy. A number of interest rate reductions, cuts in bank reserve requirements, boosts to infrastructure spending and administrative measures supporting the property market are likely to buttress growth over the remainder of CY2015. In line with our expectations, the economy is growing more slowly as it matures over the medium term and the government’s reform program promotes domestic consumption over investment. We expect the authorities will continue to press ahead with reform in a singlecautious but sustained manner as they seek to improve the efficiency of capital allocation in the economy, while maintaining support for employment.
The US economy continued to improve despite weakness in the March 2015 quarter caused by severe weather in the northeast and a stronger US dollar. Ongoing strength in the labour market, rising disposable incomes, higher equity markets and improved housing prices supported consumer demand. After a period in which businesses failed to respond to improved economic entity, runconditions and higher levels of profitability, corporate investment has begun to show signs of recovery. The Federal Reserve is expected to begin increasing interest rates in the first half of CY2016.
The European Central Bank began a program of quantitative easing in March 2015, which appears to be driving a modest pick-up in economic growth. Activity has improved across the Eurozone, with the exception of Greece, reflecting a broad-based lift in domestic demand. We expect this improvement in growth to continue in FY2016.
Japan’s economy saw growth improve in annualised terms as the year progressed, supported by the Bank of Japan’s quantitative easing and a unified weaker yen. Growth should be supported by stronger business investment into FY2016. A longer-term, sustainable recovery is contingent on the scale and speed of structural reform.
Climate change
The physical impacts of climate change and various regulations that seek to address climate change may affect our operations, productivity and the markets in which we sell our products. Physical effects may include changes in rainfall patterns, water shortages, rising sea levels, increased storm intensities and higher temperatures. In
addition national governments have already introduced or are contemplating the introduction of, regulatory responses to greenhouse gas emissions from the combustion of fossil fuels to address the impacts of climate change. There has also been a number of divestment campaigns that have focused on fossil fuels ‘stranded assets’. We continue to welcome the opportunity to engage with our shareholders on our business strategy to ensure the benefits and resilience of our portfolio, including in a carbon constrained world, are understood.
Other external factors and trends
A number of external factors and trends may continue to have a material impact on our financial and operational results, as described in section 1.15.1 of this Annual Report. These factors include commodity prices, exchange rates and operating costs.
The chart below presents the price movements in our core Business commodities over the past 10 years. Over this period we have benefited from generally strong commodity prices, which have trended downwards in FY2015 and this trend has continued post 30 June 2015.
Commodity prices 2006–2015
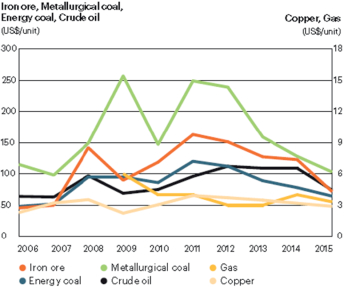
A summary of the pricing trends for our most significant commodities for FY2015 is presented in section 1.15.1 of this Annual Report.
1.5.4 Corporate planning
At BHP Billiton we have a long-standing and robust corporate planning process that underpins the development and delivery of our strategy.
Our planning process involves a review of our strategy against a constantly changing external environment and the risks and opportunities this presents, to optimise our returns to our shareholders.
Core principles
The corporate planning cycle embodies the following core principles:
Board and management team. More detailsGMC ownership and regular review of strategy and strategic priorities.
Regular engagement between the GMC, Businesses, Group Functions and Marketing.
Application of a consistent and integrated planning process where Business, Group Functions and Marketing plans are aggregated to form the overall corporate plan.
Cycle begins with long-term strategic plans followed by short-term plans to deliver strategic imperatives.
Ensure our portfolio and plans are resilient under both long-term scenarios and short-term shock events.
Corporate planning framework
A Board Strategy Forum is held regularly where the Board and the GMC actively discuss and debate the Company’s strategy. Businesses prepare long-term plans and discuss these plans at strategic reviews with the GMC.
A BHP Billiton 20-year Plan is prepared based on input from the Businesses’ long-term plans and is optimised for an annual capital allocation limit that maximises total shareholder returns, while ensuring financial risks are appropriately mitigated. Within this capital ceiling, major growth options are optimally sequenced over the20-year Plan through our capital allocation process.
The capital allocation process includes analysis of net present value (NPV), internal rates of return (IRR), return on capital (ROC) and margin analysis to inform decision-making. This process is further described in section 1.6.3 of this Annual Report. All available growth options are assessed and prioritised to generate a high-value and capital-efficient portfolio, which provides flexibility to return excess cash to shareholders. The increased competition for capital has improved our capital productivity.
The flowchart below illustrates our corporate planning framework.

We believe that the rigour of our corporate planning process, combined with the flexibility it provides the Company to quickly respond to an inherently dynamic external environment, is essential to maximise total shareholder returns.
The starting point of our planning process is the construction of a central case, built through an in-depth, bottom up analysis using rigorous processes, benchmarked with external views, and thoroughly reviewed and endorsed periodically by the GMC and the Board. Our current central case assumes the US economy continues to recover and strengthen, progressive development of China and India, integration of emerging economies into a multi-polar economic environment, and action on climate change centred on national policies with short-term prioritisation to adaptation and a long-term shift toward mitigation.
Scenarios
Our corporate planning process uses scenario analysis to encompass a wide spectrum of potential outcomes for key global uncertainties. Designed to interpret external factors including technical, economic, political and governance trends facing the global resources industry, the scenarios offer a means by which to explore potential portfolio discontinuities and opportunities, as well as to test the robustness of decisions.
Our scenarios do not constitute preferred outcomes for BHP Billiton. The Company’s approach to critical global challenges, such as the importance of addressing climate change, continues to be based onOur Charter values, including our value of Sustainability. Our position on climate change is discussed further in sections 1.6.1 and 1.14 of this Annual Report.
The scenarios are designed to be divergent, but also plausible and internally consistent, spanning unique potential future business environments. An outline of the DLC structurekey characteristics of each of our scenarios is set out below:
Robust global economic growth sustains strong impetus to develop and implement cleaner, more energy efficient solutions that support growth. Unified societal action to address climate change leads to high cooperation and commitment to limit emissions. Technology plays a pivotal role with breakthroughs in new, next generation clean energy technologies. Higher-cost options are often deployed to meet lower CO2 stabilisation targets. There is an orderly transition to a two degrees Celsius world.
Strong global growth led by China and the United States underpinned by liberalised trade. Coordination in environment, technology and trade policy reduces water and food constraints. Technology dynamism with significant investment in research and development underpinned by high economic growth, and a coordinated response to addressing climate change.
High, sustainable economic growth is unlocked by productivity gains in advanced economies. Reform success in India achieves high transformative growth. Parts of the global resource base are not as accessible as once thought. Rapidly growing production rates of some commodities deplete basins and reserve replacement is costly. More difficult to access capital in resource rich economies given greater uncertainty in regulatory regime and higher capital costs. Technology development is focused on highly differentiated products including uptake and transfer of information and communications technology (ICT), robotics and bio-technology. There is less technology transfer from the major economies to emerging economies.
A future state enmeshed in economic stagnation and protectionism. Nationalism drives economic policy rather than reform. Security of supply rather than lowest cost sourcing drives resources investment policy. Global cooperation is limited and research and development dwindles with low private sector capacity and government support. Food and water supply does not meet global requirements provoking instability in some economies. Climate change commitments are abandoned in favour of adaptation.
Tracking of signposts (trends) and triggers (events) across scenarios is integral to our planning process. These signposts and triggers provide an indication of which scenarios are becoming more or less dominant through time. They allow early awareness for the move towards a scenario, offering us a powerful decision-making tool that would enable us to act early. For example, the nature and pace of growth in global foreign direct investment, including patent, trademark and design application trends by industry are indicator variables that measure the pace of uptake of global and inter-regional technology transfer, a signpost that reflects the nature and extent of liberalised trade. An example of a potential trigger event is a ratified accord on climate change during the 2015 United Nations Framework Convention on Climate Change Conference of the Parties, and binding agreements on longer-term carbon emissions targets were enacted across key economies.
Our analysis highlights that our uniquely diversified, high-quality portfolio of assets is robust across each of our scenarios. For example, in a carbon constrained world, we believe there is a likelihood of upside for uranium and our high-quality hard coking coal (with lower smelting emissions) and iron ore lump product (for direct blast furnace feed). In addition, we expect that copper would be resilient and offer continued opportunity for growth,
while our gas exposure may yet provide opportunities during a transition to a lower-carbon economy. In general, we anticipate that these commodities are robust and could help mitigate potential negative impacts in other commodities.
1.6 Strategic priorities
Our GMC maintains a strong focus on the following strategic priorities in order to execute the Company’s strategy. A number of these priorities are monitored by the GMC using the key performance indicators as presented in section 1.10 of this Annual Report.
1.6.1 Continue to operate sustainably
We will continue to operate sustainably with our focus on the following areas:
Protect our people and improve the health and safety of our operations
The health, safety and wellbeing of our people are central to the success of our organisation. Regardless of where our people are located or the type of work they undertake, we strive to create a working environment that is free from occupational illness or injury. Identifying and managing fatal and material risk is a critical component of our management approach. By understanding and managing our risks, we provide greater protection for our people, communities and assets.
Despite our goal to achieve zero work-related fatalities, tragically we lost five of our colleagues in FY2015. Four fatalities occurred during on-site work activities and one fatality occurred in an off-site transportation accident. Independent investigations were undertaken for each incident, with remedial action taken and findings from the investigations shared across the Group. In FY2014, we had no work-related fatalities at our operated assets, a goal that we will continue to work towards.
As part of our constant focus to eliminate fatal and other serious incidents, a Company-level safety intervention was initiated in FY2015. The safety intervention was launched across our business through a variety of methods, including workshops, team talks and surveys. Feedback was presented at our senior leaders’ meeting in July 2015, identifying the key controls, programs, systems, processes and tools currently in place that require improvement and Company-wide adoption through focused leadership.
Support sustainable development of our host communities
We strive to be a valued partner in the communities in which we operate and, through all our interactions, seek to foster meaningful, long-term relationships that respect local cultures and create lasting benefits. We are also proud of our broader contribution to society. Our commodities support economic development and ultimately lead to urbanisation and improved standards of living. Through employment, taxes and royalties, we support local, regional and national economies. Where possible, we purchase local goods and services and develop infrastructure that benefits entire communities.
We voluntarily invest one per cent of our pre-tax profit, calculated on the average of the previous three years’ pre-tax profit, in community programs. Since 2001, BHP Billiton has committed more than US$2 billion in programs that aim to have a long-lasting, positive impact on quality of life around the world. During FY2015, our voluntary community investment totalled US$225 million, comprising US$142 million in cash, in-kind support and administrative costs and a US$83 million contribution to the BHP Billiton Foundation.
Strategic approach to climate change
Our strategic approach to climate change is underpinned by engagement with policy makers and other stakeholders, including investors, companies and non-government organisations. We believe industry has a key role to play in climate change policy development by working with governments and other stakeholders to inform the development of effective, long-term policy frameworks that deliver a measured transition to a lower emissions economy.
We have an integrated approach to addressing climate change that has three key areas: mitigation, adaptation and low-emissions technology (LET). As well as taking action to reduce emissions, adapt to the physical impacts of climate change, develop and deploy LETs and engage in the policy debate, we continue to identify and assess the impacts of climate change on our portfolio. We have a robust corporate planning process that includes testing the resilience of our portfolio and investment decisions against a range of future scenarios.
Our position on climate change
We accept the Intergovernmental Panel on Climate Change’s (IPCC) assessment of climate change science which has found that warming of the climate is unequivocal, the human influence is clear and physical impacts are unavoidable.
We believe that:
The world must pursue the twin objectives of:
| – | | limiting climate change to the lower end of the IPCC emission scenarios in line with current international agreements; while |
| – | | providing access to reliable and affordable energy to support economic development and improved living standards. |
Under all current plausible scenarios, fossil fuels will continue to be a significant part of the energy mix for decades.
Therefore, there needs to be an acceleration of effort to drive energy efficiency, develop and deploy low-emissions technology and adapt to the impacts of climate change.
There should be a price on carbon, implemented in a way that addresses competitiveness concerns and achieves lowest cost emissions reductions.
We will:
continue to take action to reduce our emissions;
build resilience of our operations, investments, communities and ecosystems to climate change impacts;
seek to enhance the global response by engaging with governments, recognising their role as policy makers;
work in partnership with resource sector peers to improve sectoral performance and increase the industry’s influence in policy development to deliver effective long-term regulatory responses;
contribute to reducing emissions from the use of fossil fuels through material investments in low-emission technology.
Further information on our sustainability commitments, standards and performance can be found in section 2.101.14 of this Annual Report.
Additional information is also available in the Sustainability Report 2015, which can be found online atwww.bhpbilliton.com.
1.6.2 A more productive organisation
During the past year, we have continued to focus on sustainable improvement in productivity across the Company. Our people have worked smarter to identify and implement more productive ways of working. Our portfolio, common systems, structures and culture have also resulted in greater volume growth from our existing plant and equipment at lower unit costs.
Our Operating Model remains the foundation for our sustainable productivity gains. It guides how our people work together, defines how we are organised and allows us to measure operational and financial performance across our business. It also helps remove duplication, build capability and more rapidly identify and deploy best practices.
To achieve functional excellence across the Company, we are developing our people and encouraging our teams to learn from each other. Our focus is on creating an inclusive environment where every employee feels they can contribute to improving our performance.
Increasing transparency and access to robust data across the organisation has improved our ability to deliver sustained improvements. By using 1SAP as our single Company-wide resource planning system, our teams have access to best-in-class business processes, standard metrics and reports.
Our focus on productivity has improved operating performance at each of our Businesses. Our long-term commitment to improve productivity across our Company continues to create significant value for shareholders and other stakeholders.
Case study: Increased truck performance at Copper’s Escondida Mine
Objective: To increase ultra-class haul truck production time.
Approach: Escondida benchmarked its truck performance and maintenance activities, both internally and externally, and reviewed how it conducted truck maintenance and shift activities to identify improvement opportunities.
A range of initiatives were implemented to improve haul truck production time. Less frequent and larger blasts were used to reduce interruptions to production. Trucks were only taken out of production for preventative maintenance determined by equipment condition, rather than by time in service. The mine also implemented new crib huts and shift relief, called hot seating, to keep the trucks moving.
Outcomes: Escondida has set a new internal BHP Billiton benchmark for sustainable ultra-class haul truck performance. In FY2015, truck utilisation of available time increased to 83 per cent from 75 per cent in the previous year. This allowed the operation to move 438 million tonnes of material, an increase of six per cent compared to FY2014.
Productivity results: During FY2015, Escondida decreased its mine production unit cost by 10 per cent through its productivity initiatives.
1.6.3 Disciplined approach to capital management
Our priorities for capital management remain unchanged. The quality of our assets and adherence to our strategy has differentiated our performance and maximised shareholder returns by allocating capital in a disciplined manner.
Our diversified and high-margin portfolio delivers a higher return on capital with lower volatility, when compared with many peers. Over the last 10 years, we have returned US$67 billion to shareholders in the form of dividends and buy-backs.
Many of the areas to which we direct our cash flow are interconnected. In order to make capital allocation decisions, we test each decision against a range of short-term and long-term criteria across several scenarios. We aim to optimise for net present value (NPV), return on capital (ROC), internal rate of return (IRR) and margin, while remaining mindful of portfolio construction and cash flow at risk. No single metric can dominate the process given the potential to create imbalances and all alternatives actively compete.
Our portfolio remains a key point of difference. However, because it is opportunity-rich, capital discipline is more important. By reducing annual expenditure, we have created even more competition for capital and we have sharpened our focus on our core commodities and our high-margin major basins.
Given our portfolio of long-life orebodies, we also consider the value of future options as we must preserve their value at low cost.
The following factors are considered when making capital allocation decisions:
Progressive dividend
BHP Billiton remains committed to a progressive dividend policy. The aim of this policy is to steadily increase or at least maintain the dividend per share in US dollars at each half-yearly payment.
On 25 August 2015, the Board determined a final dividend for the year of 62 US cents per share. Together with the interim dividend of 62 US cents per share paid to shareholders on 31 March 2015, this brought the total dividend determined for the year to 124 US cents per share, a two per cent increase over the previous year’s full-year dividend of 121 US cents per share.
| | | | | | | | | | | | |
Year ended 30 June | | 2015 | | | 2014 | | | 2013 | |
Dividends determined in respect of the period (US cents per share) | | | | | | | | | | | | |
Interim dividend | | | 62.0 | | | | 59.0 | | | | 57.0 | |
Final dividend | | | 62.0 | | | | 62.0 | | | | 59.0 | |
| | | | | | | | | | | | |
| | | 124.0 | | | | 121.0 | | | | 116.0 | |
| | | | | | | | | | | | |
A strong balance sheet
Our solid ‘A’ credit rating provides flexibility and access to debt capital markets. Despite the reduction in commodity prices broadly over FY2015, the Group maintained a strong balance sheet and reduced net debt by five per cent to US$24.4 billion. Improved operating and capital productivity supported by our flexible investment program generated free cash flow of US$6.3 billion.
During FY2015, the Group issued a three tranche Euro denominated bond under its Euro Medium Term Note Programme, comprising EUR600 million Floating Rate Notes due 2020 paying interest at three-month Euribor plus 35 basis points, EUR650 million 0.75 per cent bonds due 2022 and EUR750 million 1.50 per cent bonds due 2030. The Group also priced a five-year A$1.0 billion note issue under its Australian Medium Term Note Program, paying interest at 3.00 per cent due 2020.
In August 2014, the Group redeemed all outstanding Petrohawk Energy Corporation 7.25 per cent Senior Notes due August 2018 and 6.25 per cent Senior Notes due June 2019 at the applicable call prices. The aggregate principal value of the notes redeemed was approximately US$1.8 billion.
The Group has a US$6.0 billion commercial paper program backed by a US$6.0 billion revolving credit facility. The facility expires in May 2020 and has a one-year extension option. As at 30 June 2015, the Group had US$nil outstanding in the US commercial paper market and the Group’s cash and cash equivalents on hand were US$6.8 billion.
Internal competition for capital investment
By reducing annual capital and exploration expenditure and increasing competition for capital within the Group, we have prioritised higher quality growth at a higher average rate of return on incremental investment. We continue to invest selectively in those projects that are capital efficient and have high return growth.
During the year, three major projects achieved first production, namely:
The Escondida Oxide Leach Area Project (OLAP) was completed in November 2014. The Project involved the creation of a new dynamic leaching pad and mineral handling system that included several overland conveyors. The new pad is expected to maintain oxide leaching capacity at current levels. OLAP was approved in February 2012 with budgeted expenditure of US$721 million (US$414 million BHP Billiton share) and a US$212 million increase in the budget of OLAP to US$933 million (US$536 million BHP Billiton share) was approved in March 2014. Expected final cost is US$899 million (US$517 million BHP Billiton share).
In March 2011, we approved the third expansion of the Hay Point Coal Terminal. The expansion of the terminal will deliver an additional 11 Mt of annual port capacity (100 per cent basis). The project investment has a budget of US$1.5 billion (BHP Billiton share). In January 2015, first coal was loaded through the expanded terminal and the project was 97.6 per cent complete as at 30 June 2015.
The Escondida Organic Growth Project 1 (OGP1) is a new concentrator with a 152 kilotonnes per day (ktpd) plant. We expect this project to provide additional processing capacity and allow access to high-grade ore. OGP1 was approved in February 2012 with budgeted expenditure of US$3.8 billion (US$2.2 billion BHP Billiton share). A US$361 million increase in the budget of OGP1 to US$4.2 billion (US$ 2.4 billion BHP Billiton share) was approved in October 2014 following challenges associated with contractor’s progress. The Project was completed in May 2015 and is currently in the commissioning and ramp-up phase.
At the end of FY2015, BHP Billiton had four major projects under development with a combined budget of US$7.0 billion.
Information in this section has been presented on a Continuing operations basis to exclude the contribution from assets that were demerged with South32, unless otherwise noted. Details of the contribution of the South32 assets to the Group’s results are disclosed in note 29 ‘Discontinued operations’ to the Financial Statements.
Capital expenditure
Capital and exploration expenditure is disclosed for each Business in the table below.
| | | | | | | | | | | | |
Year ended 30 June | | 2015
US$M | | | 2014
US$M
Restated | | | 2013
US$M
Restated | |
Capital and exploration expenditure (1) | | | | | | | | | | | | |
Petroleum and Potash | | | 5,929 | | | | 7,070 | | | | 8,439 | |
Copper | | | 3,912 | | | | 3,808 | | | | 4,157 | |
Iron Ore | | | 2,048 | | | | 3,118 | | | | 6,196 | |
Coal | | | 749 | | | | 2,000 | | | | 3,168 | |
Group and unallocated items | | | 125 | | | | 214 | | | | 465 | |
| | | | | | | | | | | | |
BHP Billiton Group | | | 12,763 | | | | 16,210 | | | | 22,425 | |
| | | | | | | | | | | | |
| (1) | Capital expenditure is presented on a cash basis and excludes capitalised interest, but includes capitalised exploration. Exploration expenditure is capitalised in accordance with our accounting policies, as set out in note 43 ‘Significant accounting policies’ to the Financial Statements. |
Capital expenditure encompasses expenditure on major projects, as set out in section 2.4 of this Annual Report, and capital expenditure on sustaining and other items.
| | | | | | | | | | | | |
Year ended 30 June | | 2015
US$M | | | 2014
US$M
Restated | | | 2013
US$M
Restated | |
Capital expenditure | | | 11,947 | | | | 15,224 | | | | 21,104 | |
| | | | | | | | | | | | |
Exploration expenditure | | | | | | | | | | | | |
Petroleum | | | 567 | | | | 600 | | | | 675 | |
Minerals | | | 249 | | | | 386 | | | | 646 | |
| | | | | | | | | | | | |
Total | | | 816 | | | | 986 | | | | 1,321 | |
| | | | | | | | | | | | |
Total capital and exploration expenditure (cash basis) | | | 12,763 | | | | 16,210 | | | | 22,425 | |
| | | | | | | | | | | | |
Add: equity accounted investments | | | 434 | | | | 871 | | | | 1,493 | |
Less: capitalised deferred stripping (1) | | | (815 | ) | | | (1,275 | ) | | | (1,501 | ) |
Less: non-controlling interests | | | (1,342 | ) | | | (1,198 | ) | | | (995 | ) |
| | | | | | | | | | | | |
Total capital and exploration expenditure (BHP Billiton share) | | | 11,040 | | | | 14,608 | | | | 21,422 | |
| | | | | | | | | | | | |
| (1) | Capitalised deferred stripping includes US$142 million attributable to non-controlling interests in FY2015 (2014: US$243 million; 2013: US$292 million). |
BHP Billiton’s share of capital and exploration expenditure declined by 24 per cent during FY2015 to US$11.0 billion. Our rate of investment is expected to decline to US$8.5 billion in FY2016 and US$7.0 billion in FY2017.
1.6.4 Active management of our portfolio
We continue to concentrate our efforts on the assets and operations where we enjoy economies of scale and a competitive advantage. Our focus remains on our four major Businesses of Iron Ore, Petroleum, Copper, and Coal, with Potash as a potential fifth. This diversified portfolio of low-cost assets, unrivalled in scale and quality, provides resilience and flexibility to enhance value for shareholders.
Since FY2013, we have executed a targeted divestment program, which has included a collection of individual transactions totalling US$7 billion and the successful demerger of a selection of BHP Billiton assets with South32.
We will continue to simplify our portfolio towards achieving BHP Billiton’s identified core portfolio of 19 assets across eight countries and three continents.
Completed demerger of assets
Demerger milestones
On 19 August 2014, we announced our intention to create a new company through the demerger of a selection of BHP Billiton assets that included:
BHP Billiton’s integrated Aluminium business;
Energy Coal South Africa;
Illawarra metallurgical coal;
BHP Billiton’s Manganese business;
Cerro Matoso nickel operation;
Cannington silver-lead-zinc mine.
A shareholder circular dated 16 March 2015 contained a unanimous recommendation from the BHP Billiton Board that shareholders vote in favour of the demerger resolution.
Simultaneous General Meetings took place in Perth and London on 6 May 2015 to approve the demerger of South32 from BHP Billiton. The resolution was successful with approximately 98 per cent of votes cast being in favour.
On 8 May 2015, BHP Billiton transferred operational management control of the assets to the South32 delegated management team. On 25 May 2015, the implementation of the demerger was completed, marking the formal separation of the two companies.
Eligible BHP Billiton Limited and Plc shareholders received shares in South32 through a pro rata, in-specie distribution, as well as retaining their existing shares in the Group.
Demerger rationale and impacts
The demerger simplifies BHP Billiton and enables us to further focus on generating value from our core portfolio. This portfolio comprises our exceptionally large long-life petroleum, copper, iron ore, coal and potash assets. With a smaller set of similar assets, our common systems and processes enable us to identify and deploy best practice more quickly.
Having assessed a number of alternatives, the Board considered the demerger to be the preferred approach to achieving simplification of our portfolio, maximising shareholder value and providing the potential for South32 assets to maximise their value due to the focus of their own dedicated Board and management.
Post-demerger, BHP Billiton remains one of the largest diversified global resources companies and in particular:
the largest exporter of metallurgical coal;
a global top three producer of iron ore;
a global top four exporter of copper concentrate;
the largest overseas investor in onshore US shale;
the holder of what we believe to be one of the world’s best undeveloped potash resources.
Our strategic priorities remain unchanged. Consistent with our established strategy, our portfolio provides broad exposure to steelmaking raw materials, copper, energy and, potentially, agricultural markets and will remain diversified by commodity, geography and market.
Disclosure of the demerged assets in this Annual Report
For IFRS accounting purposes, the demerger was deemed completed as of 8 May 2015 (the date of loss of control) and the demerged assets are treated as Discontinued operations in BHP Billiton’s Financial Statements. Unless otherwise stated, throughout this Annual Report, financial information for FY2015 relating to the demerged assets is reported for the period from 1 July 2014 to 8 May 2015 as Discontinued operations, while FY2015 production information relating to the demerged assets is reported for the period from 1 July 2014 to 30 April 2015 to more closely align with BHP Billiton’s month-end reporting systems. Where noted, Continuing operations refers to the assets that formed part of the BHP Billiton Group as at 30 June 2015.
Comparative information for the years ended 30 June 2014 and 30 June 2013 has been restated for the effects of the application of IFRS 5/AASB 5 ‘Non-current Assets Held for Sale and Discontinued Operations’ following the demerger of South32. The Consolidated Statement of Comprehensive Income, the Consolidated Balance Sheet and the Consolidated Statement of Changes in Equity for these periods are not required to be restated.
For information relating to a description of the demerged assets and production associated with these assets, refer to sections 2.1.7 and 2.2.2 of this Annual Report and note 29 ‘Discontinued operations’ to the Financial Statements.
1.7 Management of risk
1.7.1 Approach to risk management
We believe the identification and management of risk are central to achieving our corporate purpose of creating long-term shareholder value.
Risk has the potential to impact our health and safety, environment, community, reputation, regulatory, market and financial performance and thereby the achievement of our corporate purpose.
By understanding and managing risk, we provide greater certainty and confidence for our shareholders, employees, customers, suppliers, and for the communities in which we operate. Successful risk management can be a source of competitive advantage.
Our risks are viewed and managed on a Group-wide basis. The natural diversification in our portfolio of commodities, geographies, currencies, assets and liabilities is a key element in our risk management approach.
Risk management is embedded in our critical business activities, functions and processes. Materiality and our tolerance for risk are key considerations in our decision-making.
Risk issues are identified, analysed and assessed in a consistent manner. Performance requirements exist for the identification, assessment, control and monitoring of material risk issues that could threaten our corporate purpose and business plans. These include that:
The potential for impacts on the achievement of our corporate purpose and business plans is identified through risk assessments using approved materiality and tolerability criteria. The severity of any risk event is assessed according to a matrix that describes the degree of harm, injury or loss from the most severe impact associated with that risk event, assuming reasonable effectiveness of controls.
A risk assessment (risk identification, risk analysis, including likelihood and impact assessment and risk evaluation) is conducted for material risk issues.
Risk controls are designed, implemented, operated and assessed to produce a residual risk that is tolerable. Performance standards are established for critical controls over material risks with supporting verification processes.
We have established processes that apply when entering or commencing new activities in high-risk countries. Risk assessments and a supporting risk management plan are required to ensure that potential reputation, legal, business conduct and corruption-related exposures are managed and legislative compliance is maintained, including relevant anti-corruption legislation and the application of any relevant sanctions or trade embargos.
Our risk management governance approach is described in sections 3.14.1 and 3.15 of this Annual Report.
1.7.2 Risk factors
We believe that because of the international scope of our operations and the industries in which we are engaged, there are numerous factors that may have an adverse effect on our results and operations. The following describes the material risks that could affect BHP Billiton LimitedBilliton.
External risks
Fluctuations in commodity prices and BHP Billiton Plcimpacts of ongoing global economic volatility may negatively affect our results, including cash flows and asset values
The prices we obtain for our oil, gas and minerals are determined by, or linked to, prices in world markets, which have each retainedhistorically been subject to substantial volatility. Our usual policy is to sell our products at the prevailing market prices. The diversity provided by our relatively broad portfolio of commodities does not fully insulate the effects of price changes. Fluctuations in commodity prices can occur due to price shifts reflecting underlying global economic and geopolitical factors, industry demand, increased supply due to the development of new productive resources, technological change, product substitution and national tariffs. We are particularly exposed to price movements in iron ore, coal, copper, and oil and gas. For example, a US$1 per tonne decline in the average iron ore price and US$1 per barrel decline in the average oil price would have an estimated impact on FY2015 profit after taxation of US$144 million and US$54 million, respectively.
For further information relating to commodity price impacts, refer to section 1.15.1 of this Annual Report.
Volatility in global economic growth, particularly in the developing economies, has the potential to adversely impact future demand and prices for commodities. The impact of potential long-term sustained price shifts and short-term price volatility, including the effects of unwinding the sustained monetary stimulus in the United States, creates the risk that our financial and operating results, including cash flows and asset values, will be materially and adversely affected by unforeseen declines in the prevailing prices of our products.
Our financial results may be negatively affected by currency exchange rate fluctuations
Our assets, earnings and cash flows are influenced by a wide variety of currencies due to the geographic diversity of the countries in which we operate. Fluctuations in the exchange rates of those currencies may have a significant impact on our financial results. The US dollar is the currency in which the majority of our sales are denominated and the currency in which we present our financial performance. Operating costs are influenced by the currencies of those countries where our mines and mine processing plants are located and also by those currencies in which the costs of imported equipment and services are determined. The Australian dollar, Chilean peso, and US dollar are some of the currencies influencing our operating costs. We do not generally believe that active currency hedging provides long-term benefits to our shareholders. From time to time, we consider currency protection measures appropriate in specific commercial circumstances, subject to strict limits established by our Board.
Reduction in Chinese demand may negatively impact our results
The Chinese market has been driving global materials demand and pricing over the past decade. Sales into China generated US$16.3 billion (FY2014: US$21.8 billion) or 36.6 per cent (FY2014: 38.5 per cent) of our revenue in FY2015. The FY2015 sales into China by Business included 66 per cent Iron Ore, 23 per cent Copper, nine per cent Coal, one per cent Nickel West (reported in Group and Unallocated) and one per cent Petroleum. A continued slowing in China’s economic growth and demand could result in lower prices for our products and negatively impact our results, including cash flows.
Actions by governments or political events in the countries in which we operate could have a negative impact on our business
We have operations or interests (e.g. through our non-operated assets) in various countries around the globe, which have varying degrees of political, judicial and commercial stability. We operate or have interests in certain emerging markets, which may involve additional risks that could have an adverse impact on the profitability of an operation. These risks could include terrorism, civil unrest, judicial activism, regulatory investigation, nationalisation, protectionism, renegotiation or nullification of existing contracts, leases, permits or other agreements, imposts, controls or prohibitions on the production or use of certain products, restrictions on repatriation of earnings or capital and changes in laws and policy, as well as other unforeseeable risks. Risks relating to bribery and corruption, including possible delays or disruption resulting from a refusal to makeso-called facilitation payments, may be prevalent in some of the countries in which we operate. If any of our major operations are affected by one or more of these risks, it could have a negative effect on our operations in those countries, as well as the Group’s overall operating results and financial condition.
Our operations are based on material long-term investments that are dependent on long-term fiscal stability and could be adversely impacted by changes in fiscal legislation. The natural resources industry continues to be regarded as a source of tax revenue and can also be impacted by broader fiscal measures applying to businesses generally.
Our business could be adversely affected by new government regulations and international standards, such as controls on imports, exports, prices and greenhouse gas emissions. Increasing requirements relating to regulatory, environmental and social or community approvals can potentially result in significant delays in construction and may adversely affect the economics of new mining and oil and gas projects, the expansion of existing operations and results of our operations. Infrastructure, such as rail, ports, power and water, is critical to our business operations. We have operations or potential development projects in countries where government-provided infrastructure or regulatory regimes for access to infrastructure, including our own privately operated infrastructure, may be inadequate or uncertain or subject to legislative change. The impact of climate change may increase competition for, and the regulation of, limited resources, such as power and water. These factors may adversely impact the efficient operations and expansion of our business.
We operate in countries where ownership of land is uncertain and where disputes may arise in relation to ownership. For example, in Australia, the Native Title Act 1993 provides for the establishment and recognition of native title under certain circumstances.
These regulations are complex, difficult to predict and outside our control and could negatively affect our Company, future results and our financial condition.
Business risks
Failure to discover or acquire new resources, maintain reserves or develop new operations could negatively affect our future results and financial condition
The demand for our products and production from our operations results in existing reserves being depleted over time. As our revenues and profits are derived from our oil and gas and minerals operations, our future results and financial condition are directly related to the success of our exploration and acquisition efforts, and our ability to generate reserves to meet our future production requirements at a competitive cost. Exploration activity occurs adjacent to established operations and in new regions, in developed and less-developed countries. These activities may increase land tenure, infrastructure and related political risks. A failure in our ability to discover or acquire new resources, maintain reserves or develop new operations in sufficient quantities to maintain or grow the current level of our reserves could negatively affect our results, financial condition and prospects.
Future deterioration in commodities pricing may make some existing reserves uneconomic. Our actual drilling activities and future drilling budget will depend on our mineral inventory size and quality, drilling results, commodity prices, drilling and production costs, availability of drilling services and equipment, lease expirations, transportation pipelines, railroads and other infrastructure constraints, regulatory approvals and other factors.
There are numerous uncertainties inherent in estimating mineral and oil and gas reserves. Geological assumptions about our mineralisation that are valid at the time of estimation may change significantly when new information becomes available. Estimates of reserves that will be recovered or the cost at which we anticipate such reserves will be recovered are based on uncertain assumptions. The uncertain global financial outlook may affect economic assumptions related to reserve recovery and may require reserve restatements. Reserve restatements could negatively affect our results and prospects.
Potential changes to our portfolio of assets through acquisitions and divestments may have a material adverse effect on our future results and financial condition
We regularly review the composition of our asset portfolio and from time to time may add assets to the portfolio or divest assets from the portfolio. There are a number of risks associated with such acquisitions or divestments. These include adverse market reaction to such changes or the timing or terms on which such changes are made, the imposition of adverse regulatory conditions and obligations, commercial objectives not being achieved as expected, unforeseen liabilities arising from such changes to the portfolio, sales revenues and operational performance not meeting our expectations, anticipated synergies or cost savings being delayed or not being achieved, inability to retain key staff and transaction-related costs being more than anticipated. These factors could negatively affect our reputation, future results and financial condition.
Increased costs and schedule delays may adversely affect our development projects
Although we devote significant time and resources to our project planning, approval and review process, many of our development projects are highly complex and rely on factors that are outside our control, which may cause us to underestimate the cost or time required to complete a project. For instance, incidents during development projects may cause setbacks or cost overruns, required licences, permits or authorisations to build a project may
be unobtainable at anticipated costs, or may be obtained only after significant delay and market conditions may change, thereby making a project less profitable than initially projected.
In addition, we may fail to manage projects as effectively as we anticipate and unforeseen challenges may emerge.
Any of these may result in increased capital costs and schedule delays at our development projects and impact anticipated financial returns.
Financial risks
If our liquidity and cash flow deteriorate significantly it could adversely affect our ability to fund our major capital programs
We seek to maintain a solid ‘A’ credit rating as part of our strategy. However, fluctuations in commodity prices and the ongoing global economic volatility may adversely impact our future cash flows and ability to access capital from financial markets at acceptable pricing. If our key financial ratios and credit rating are not maintained, our liquidity and cash reserves, interest rate costs on borrowed debt, future access to financial capital markets and the ability to fund current and future major capital programs could be adversely affected.
We may not fully recover our investments in mining, oil and gas assets, which may require financial write-downs
One or more of our assets may be impacted by changed market or industry structures, commodity prices, technical operating difficulties, inability to recover our mineral, oil or gas reserves and increased operating cost levels. These may cause us to fail to recover all or a portion of our investment in mining and oil and gas assets and may require financial write-downs, including goodwill adversely impacting our financial results.
The commercial counterparties we transact with may not meet their separate corporate identitiesobligations, which may negatively impact our results
We contract with a large number of commercial and maintained their separate stock exchange listings, but theyfinancial counterparties, including end-customers, suppliers and financial institutions. Global economic volatility continues to strain global financial markets, with tighter liquidity in China and uncertain business conditions generally. We maintain a ‘one book’ approach with commercial counterparties to ensure all credit exposures are quantified. Our existing counterparty credit controls may not prevent a material loss due to credit exposure to a major customer segment or financial counterparty. In addition, customers, suppliers, contractors or joint venture partners may fail to perform against existing contracts and obligations. Non-supply of key inputs, such as tyres, mining and mobile equipment, diesel and other key consumables, may unfavourably impact costs and production at our operations. These factors could negatively affect our financial condition and results of operations.
Operational risks
Cost pressures and reduced productivity could negatively impact our operating margins and expansion plans
Cost pressures may continue to occur across the resources industry. As the prices for our products are determined by the global commodity markets in which we operate, we do not generally have the ability to offset these cost pressures through corresponding price increases, which can adversely affect our operating margins. Notwithstanding our efforts to reduce costs and a number of key cost inputs being commodity price-linked, the inability to reduce costs and a timing lag may adversely impact our operating margins for an extended period.
A number of our operations, such as copper, are energy or water intensive and, as a result, the Group’s costs and earnings could be adversely affected by rising costs or by supply interruptions. These could include the
unavailability of energy, fuel or water due to a variety of reasons, including fluctuations in climate, inadequate infrastructure capacity, interruptions in supply due to equipment failure or other causes and the inability to extend supply contracts on economic terms.
Many of our Australian employees have conditions of employment, including wages, governed by the operation of the Australian Fair Work Act 2009. Conditions of employment are often contained within collective agreements that are required to be renegotiated on expiry (typically every three to four years). In some instances, under the operation of the Fair Work Act it can be expected that unions will pursue increases to conditions of employment, including wages, and/or claims for greater union involvement in business decision-making.
In circumstances where a collective agreement is being renegotiated, industrial action is permitted under the Fair Work Act. Industrial action and any subsequent settlement to mitigate associated commercial damage can adversely affect productivity, customer perceptions as a reliable supplier and contribute to increases in costs.
The industrial relations environment in Chile remains challenging and it is possible that we will see further disruptions. Changes to labour legislation are being considered by the Chilean Congress, and if passed would result in the right to have a single negotiating body across different operations owned by a single company, which may also result in higher risk of operational stoppages.
These factors could lead to increased operating costs at existing operations and could negatively impact our operating margins and expansion plans.
Unexpected natural and operational catastrophes may adversely impact our operations
We operate extractive, processing and logistical operations in many geographic locations, both onshore and offshore. Our key port facilities are located at Coloso and Antofagasta in Chile, and Port Hedland and Hay Point in Australia. We have five underground mines, including three underground coal mines. Our operational processes may be subject to operational accidents, such as port and shipping incidents, underground mine and processing plant fire and explosion, open-cut pit wall failures, loss of power supply, railroad incidents, loss of well control, environmental pollution and mechanical critical equipment failures. Our operations may also be subject to unexpected natural catastrophes such as earthquakes, flood, hurricanes and tsunamis. Our northwest Western Australia iron ore, Queensland coal and Gulf of Mexico oil and gas operations are located in areas subject to cyclones or hurricanes. Our Chilean copper operations are located in a known earthquake and tsunami zone. Based on our risk management and concerns about the value of external insurance in the natural resource sector, our risk financing (insurance) approach is to minimise or not to purchase external insurance for certain risks, including property damage, business interruption, construction-related risk, marine cargo and primary liability risks. Existing business continuity plans may not provide protection for all of the costs that arise from such events. The impact of these events could lead to disruptions in production, increased costs and loss of facilities. Where external insurance is purchased, third party claims arising from these events may exceed the limit of liability of the insurance policies we have in place.
Our non-operated assets may not comply with our standards
Some of our assets are operated and managed by joint venture partners or by other companies. Management of our non-operated assets may not comply with our management and operating standards, controls and procedures, including our health, safety, environment and community (HSEC) standards. Failure to adopt equivalent standards, controls and procedures at these assets could lead to higher costs and reduced production and adversely impact our results and reputation.
Breaches in our information technology security processes may adversely impact our business activities
We maintain information technology (IT) systems, consisting of infrastructure, business applications and communications networks to support our business activities. These systems may be subject to security breaches
(e.g. cyber-crime) that can result in misappropriation of funds, increased health and safety risks to staff, disruption to our operations, environmental damage, poor product quality, loss of intellectual property, disclosure of commercially sensitive information and reputational damage.
Sustainability risks
Safety, health, environmental and community impacts, incidents or accidents and related regulations may adversely affect our people, operations and reputation or licence to operate
Safety
Potential safety events that may have a material adverse impact on our operations include fire, explosion or rock fall incidents in underground mining operations, personnel conveyance equipment failures in underground operations, aircraft incidents, incidents involving light vehicles and mining mobile equipment, ground control failures, well blowouts, explosions or gas leaks, and accidents involving inadequate isolation and working from heights or lifting operations.
Health
Health risks faced include fatigue, musculoskeletal illnesses and occupational exposure to noise, silica, diesel exhaust particulate, nickel and sulphuric acid mist. Longer-term health impacts may arise due to unanticipated workplace exposures or historical exposures of our workforce to hazardous substances. These effects may create future financial compensation obligations.
Given we operate globally, we may be affected by potential pandemic influenza outbreaks, such as A(H1N1) and avian flu, in any of the regions in which we operate.
Environment
Environmental incidents have the potential to lead to material adverse impacts on our operations. These include uncontrolled tailings containment breaches, subsidence from mining activities, escape of polluting substances and uncontrolled releases of hydrocarbons.
Our operations by their nature have the potential to adversely impact biodiversity, water resources and related ecosystem services. Changes in scientific understanding of these impacts, regulatory requirements or stakeholder expectations may prevent or delay project approvals and result in increased costs for mitigation, offsets or compensatory actions.
We provide for operational closure and site rehabilitation. Our operating and closed facilities are required to have closure plans. Changes in regulatory or community expectations may result in the relevant plans not being adequate. This may increase financial provisioning and costs at the affected operations.
Community
Local communities may become dissatisfied with the impact of our operations or oppose our new development projects, including through litigation, potentially affecting costs and production, and in extreme cases viability. Community related risks may include community protests or civil unrest, and may cause delays to proposed developments. Our operations or activities also risk inadvertent breaches of human rights or other international laws or conventions.
HSE legislation
The nature of the industries in which we operate means many of our activities are highly regulated by health, safety and environmental (HSE) laws. As regulatory standards and expectations are constantly developing, we may be exposed to increased litigation, compliance costs and unforeseen environmental rehabilitation expenses.
Legislation requiring manufacturers, importers and downstream users of chemical substances, including metals and minerals, to establish that the substances can be used without negatively affecting health or the environment may impact our operations and markets. Potential compliance costs, litigation expenses, regulatory delays, rehabilitation expenses and operational costs arising from such legislation could negatively affect our financial results.
Hydraulic fracturing
Our Onshore US operations involve hydraulic fracturing, an essential and common practice in the oil and gas industry to stimulate production of natural gas and oil from dense subsurface rock formations. Hydraulic fracturing involves using water, sand and a small amount of chemicals to fracture the hydrocarbon-bearing rock formation, to allow flow of hydrocarbons into the wellbore. We routinely apply hydraulic fracturing techniques in our drilling and completion programs.
Attention given to the hydraulic fracturing process could lead to greater opposition to oil and gas production activities using hydraulic fracturing techniques. Increased regulation could impose more stringent permitting, public disclosure and well construction requirements on hydraulic fracturing operations. In the United States, the hydraulic fracturing process is typically regulated by relevant US state regulatory bodies. Some states are considering changes to regulations in relation to permitting, public disclosure, and/or well construction requirements on hydraulic fracturing and related operations, including the possibility of outright bans on the process. Arkansas, Louisiana and Texas (the states in which we currently operate) have adopted various laws and regulations, or issued regulatory guidance, concerning hydraulic fracturing.
Several US federal agencies are also reviewing or advancing regulatory proposals concerning hydraulic fracturing and related operations. The US Environmental Protection Agency (EPA) commenced a study of the potential impacts of hydraulic fracturing activities on drinking water resources. The agency issued a non-determinative Progress Report in December 2012 and is expected to issue a final draft assessment report for peer review and comment in CY2015. As part of the studies’ efforts, the EPA released a preliminary analysis on 30 March 2015. The EPA is expected to issue a final report for peer review in CY2016. The EPA’s Office of Inspector General continues to research the EPA’s and states’ ability to manage potential threats to water resources from hydraulic fracturing, with a possible longer-term study to follow. The US Bureau of Land Management (BLM) issued a final rule on 20 March 2015 that would impose new requirements on hydraulic fracturing operations conducted on federal lands, including the disclosure of chemicals used, wellbore integrity, water use and disposal of flow back water. The BLM regulation took effect on 24 June 2015. Activity at the federal level, including the ongoing EPA study, BLM rules and other analysis by federal and state agencies to assess the impacts of hydraulic fracturing, could spur additional legislative or regulatory actions.
While we have not experienced a material delay or substantially higher operating costs in our Onshore US operations as a single unified economic entity,result of current regulatory requirements, we cannot predict whether additional federal, state or local laws or regulations will be enacted and what such actions would require or prohibit. Additional legislation or regulation could subject our operations to delays and increased costs, or prohibit certain activities, which could adversely affect the financial performance of our Onshore US operations.
Due to the nature of our operations, HSEC incidents or accidents and related regulations may adversely affect our reputation or licence to operate.
Climate change may impact the value of our Company, and our operations and markets
The physical impacts of climate change and various regulations that seek to address climate change may negatively affect our operations, productivity and the markets in which we sell our products. Fossil fuel-related emissions are a significant source of greenhouse gases contributing to climate change. We produce fossil fuels such as coal, oil and gas for sale to customers, and we use fossil fuels in our mining and processing operations either directly or through the purchase of fossil fuel-based electricity.
A number of national governments have already introduced, or are contemplating the introduction of, regulatory responses to greenhouse gas emissions from the combustion of fossil fuels to address the impacts of climate change. This includes countries where we have operations such as Australia, the United States and Chile, as well as customer markets such as China, India and Europe. In addition, the international community aims to complete a new global climate agreement at the 21st Conference of the Parties (COP21) in Paris in December 2015. The absence of regulatory certainty, global policy inconsistencies and the challenges presented by managing our portfolio across a variety of regulatory frameworks has the potential to adversely impact our operations and supply chain. From a medium to long-term perspective, we are likely to see some adverse changes in the cost position of our greenhouse gas-intensive assets and energy-intensive assets as a result of regulatory impacts in the countries where we operate. These proposed regulatory mechanisms may impact our operations directly or indirectly through our suppliers and customers. Assessments of the potential impact of future climate change regulation are uncertain given the wide scope of potential regulatory change in the many countries in which we operate. For example, the Australian Government repealed a carbon tax in 2014 and carbon pricing is being discussed as part of a broader tax reform package in Chile.
There is a potential gap between the current valuation of fossil fuel reserves on the balance sheets of companies and in global equities markets and the reduced value that could result if a significant proportion of reserves were rendered incapable of extraction in an economically viable fashion due to technology, regulatory or market responses to climate change. In such a scenario, stranded reserve assets held on our balance sheet may need to be impaired or written off and our inability to make productive use of such assets may also negatively impact our financial condition and results.
The growth of alternative energy supply options, such as renewables and nuclear, could also present a change to the energy mix that may impact on fossil fuel markets.
The physical effects of climate change on our operations may include changes in rainfall patterns, water shortages, rising sea levels, increased storm intensities and higher temperatures. These effects may adversely impact the financial performance of our operations.
A breach of our governance processes may lead to regulatory penalties and loss of reputation
We operate in a global environment that encompasses multiple jurisdictions and complex regulatory frameworks. Our governance and compliance processes, which include the review of internal controls over financial reporting and specific internal controls in relation to trade and financial sanctions, and offers of things of value to government officials and representatives of state-owned enterprises, may not prevent future potential breaches of law, accounting or governance practice. OurCode of Business Conduct, together with their boardsour mandatory policies, such as the anti-corruption, trade and senior executive management comprisingfinancial sanctions and competition policies, may not prevent instances of fraudulent behaviour and dishonesty nor guarantee compliance with legal or regulatory requirements. This may lead to regulatory fines, disgorgement of profits, litigation, loss of operating licences and/or reputational damage.
1.7.3 Management of principal risks
The scope of our operations and the same people.number of industries in which we operate and engage mean that a range of factors may impact our results. Material risks that could negatively affect our results and performance are described in section 1.7.2 of this Annual Report. Our approach to managing these risks is outlined below.
| | |
Principal risk area | | Risk management approach |
External risks | | |
| Risks arise from falls in commodity prices and demand in major markets (such as China or Europe) or changes in currency exchange rates and actions by governments | | The diversification of our portfolio of commodities, geographies and currencies is a key strategy for reducing the effects of volatility. Section 1.15.1 |
| | |
Principal risk area | | Risk management approach |
| and political events that impact long-term fiscal stability. | | describes external factors and trends affecting our results and note 23 ‘Financial risk management’ to the Financial Statements outlines the Group’s financial risk management strategy, including market, commodity, and currency risk. The Financial Risk Management Committee oversees these risks as described in sections 3.15 and 3.16. We also engage with governments and other key stakeholders to ensure the potential adverse impacts of proposed fiscal, tax, resource investment, infrastructure access and regulatory changes are understood and where possible mitigated. |
| |
Business risks | | |
| Risks include the inherent uncertainty of identifying and proving reserves, adding and divesting assets and managing our capital development projects. | | Our Technology Geoscience and Engineering function provides governance and technical leadership for Ore Reserves reporting as described in section 2.3.2. Our governance over reporting of Petroleum reserves is described in section 2.3.1. |
| |
| | We have established investment approval processes that apply to all major capital projects and asset divestment and acquisitions. The Investment Committee oversees these as described in sections 3.15 and 3.16. Our Project Management function additionally seeks to ensure that projects are safe, predictable and competitive, and it has established a continuous improvement practice. |
| |
Financial risks | | |
| Continued volatility in global financial markets may adversely impact future cash flows, our ability to adequately access and source capital from financial markets and our credit rating. Volatility may impact planned expenditures, as well as the ability to recover investments in mining and oil and gas projects. In addition, the commercial counterparties (customers, suppliers and financial institutions) we transact with may, due to adverse market conditions, fail to meet their contractual obligations. | | We seek to maintain a solid ‘A’ credit rating, supported by our portfolio risk management strategy. As part of this strategy, the diversification of our portfolio reduces overall cash flow volatility. Commodity prices and currency exchange rates are not hedged, and wherever possible we take the prevailing market price. We use Cash Flow at Risk analysis to monitor volatilities and key financial ratios. Credit limits and review processes are required to be established for all customers and financial counterparties. The Financial Risk Management Committee oversees these as described in sections 3.15 and 3.16. Note 23 ‘Financial risk management’ to the Financial Statements outlines our financial risk management strategy. |
| |
Operational risks | | |
| Operating cost pressures and reduced productivity could negatively impact operating margins and expansion plans. Non-operated assets may not comply with our standards. Unexpected natural and operational catastrophes may adversely impact our operations. Breaches in IT security processes may adversely impact the conduct of our business activities. | | We seek to ensure that adequate operating margins are maintained through our strategy to own and operate large, long-life, low-cost and expandable upstream assets. |
| | |
Principal risk area | | Risk management approach |
| | The Group’s concentrated effort to reduce operating costs and drive productivity improvements has realised tangible results, with a reduction in controllable costs. The capability to sustain productivity improvements is being further enhanced through continued refinements to our Operating Model. The Operating Model is designed to deliver a simple and scalable organisation, providing a competitive advantage through defining work, organisation and performance measurements. Defined global business processes, including 1SAP, provide a standardised way of working across the organisation. Common processes generate useful data and improve operating discipline. Global sourcing arrangements have been established to ensure continuity of supply and competitive costs for key supply inputs. We seek to influence the application of our standards to non-operated assets. Through the application of our risk management processes, we identify catastrophic operational risks and implement the critical controls and performance requirements to maintain control effectiveness. Business continuity plans are required to be established to mitigate consequences. Consistent with our portfolio risk management approach, we continue to be largely self-insured for losses arising from property damage, business interruption and construction. From an industrial relations perspective, detailed planning is undertaken to support the renegotiation of employment agreements and is supported by training and access to expertise in negotiation and agreement making. IT security controls to protect IT infrastructure, business applications and communication networks and respond to security incidents are in place and subject to regular monitoring and assessment. To maintain adequate levels of protection, we also continue to monitor the development of threats in the external environment and assess potential responses to those threats. |
| |
Sustainability risks | | |
| HSEC incidents or accidents may adversely affect our people or neighbouring communities, operations and reputation or licence to operate. The potential physical impacts and related responses to climate change may impact the value of our Company, and operations and | | Our approach to sustainability risks is reflected inOur Charter and described in section 1.14, including a Company-level safety intervention that was initiated in FY2015. A comprehensive set of Group Level Documents (GLDs) set out Group-wide HSEC- |
| | |
Principal risk area | | Risk management approach |
| markets. Given we operate in a challenging global environment straddling multiple jurisdictions, a breach of our governance processes may lead to regulatory penalties and loss of reputation. | | related performance requirements designed to ensure effective management control of these risks. Our approach to corporate planning, investment decision-making and portfolio management provides a focus on the identification, assessment and management of climate change risks. We have been applying an internal price on carbon in our investment decisions for more than a decade. Through a comprehensive and strategic approach to corporate planning, we work with a broad range of scenarios to assess our portfolio, including consideration of a broad range of potential policy responses to and impacts from climate change. Our models suggest that BHP Billiton’s portfolio diversification results in the resilience of our overall asset valuation through all these scenarios. Our approach to engagement with community stakeholders is outlined in ourCommunity GLD. Businesses are also required to undertake social impact opportunity assessments to identify, mitigate or manage key potential social and human rights risks. As with our other risks, for climate change risk ourRisk Management GLD provides the framework for risk management. Internal audits are conducted to test compliance with GLD requirements and action plans are developed to address any gaps. Key findings are reported to senior management and reports are considered by relevant Board committees. OurCode of Business Conduct sets out requirements related to working with integrity, including dealings with government officials and third parties. Processes and controls are in place for the internal control over financial reporting, including under Sarbanes-Oxley. We have established anti-corruption and antitrust related performance requirements, which are overseen by the Legal and Compliance function as described in section 3.17. Additionally, the Disclosure Committee oversees our compliance with securities dealing obligations and continuous and periodic disclosure obligations as described in sections 3.15 and 3.18. |
1.8 Corporate governance
At BHP Billiton, Limited haswe have a primary listing ongovernance framework that goes beyond an interest in governance for its own sake or the Australian Securities Exchange (ASX)need to comply with regulatory requirements. We believe that high-quality governance supports long-term value creation. Simply put, we think good governance is good business, and our approach is to adopt what we consider to be the best of the prevailing governance standards in Australia. BHP Billiton Plc has a premium listing on the UK Listing Authority’s Official List and its ordinary shares are admitted to trading on the London Stock Exchange (LSE) inAustralia, the United Kingdom and the United States.
In the same spirit, we do not see governance as just a secondary listingmatter for the Board. Good governance is also the responsibility of executive management and is embedded throughout the organisation.
The diagram below describes the governance framework at BHP Billiton. It shows the interaction between the shareholders and the Board, demonstrates how the Board Committee structure facilitates the relationship between the Board and the Chief Executive Officer (CEO) and illustrates the flow of delegation from shareholders. We have robust processes in place to ensure that the delegation flows through the Board and its committees to the CEO and the GMC and into the organisation. At the same time, accountability flows upwards from the Company to shareholders. This process helps to ensure alignment with shareholders.
As part of our corporate planning cycle, we include a range of scenarios that are reviewed annually and updated by the Group with executive management’s involvement. The scenarios, and the governance process supporting them, also form part of the Board agenda.
These scenarios provide a lens to assess the performance of our business portfolio. They include assumptions around commodity prices, currencies, costs, tax rates and the price of carbon and ranges for a number of risks the Group faces. These include global growth, levels of trade, geopolitical situations, climate change and technology. All of the scenarios are used to inform BHP Billiton’s strategy and the resilience of our diversified asset portfolio over the short and long term.
Regardless of which direction the world may take, we will always be guided byOur Charter values, including our value of Sustainability, in how we operate our business, interact with our stakeholders and plan for the future.
Our Charter is core to the governance framework of BHP Billiton. It embodies our corporate purpose, strategy and values, and defines when we are successful. We foster a culture that values and rewards high ethical standards, personal and corporate integrity and respect for others.
BHP Billiton governance structure
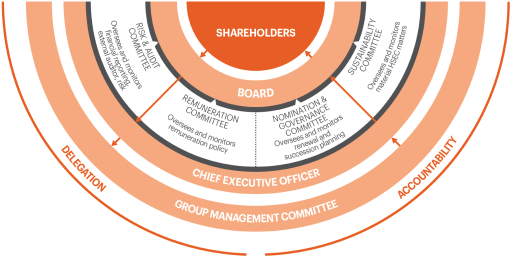
Part of the Board’s commitment to high-quality governance is expressed through the approach BHP Billiton takes to engaging and communicating with shareholders. We encourage shareholders to make their views known to us.
Our shareholders are based across the globe. Outside of the two Annual General Meetings (AGMs), which are an important step in the governance and investor engagement process, the Board uses a range of formal and
informal communication channels to understand shareholder views to ensure it can represent shareholders in governing BHP Billiton. Regular proactive engagement with institutional shareholders and investor representative organisations takes place in Australia, South Africa, the United Kingdom and the United States. The purpose of these meetings is to discuss the full range of governance issues, as well as the broad strategy of the Group. They offer an important opportunity to build relationships and to engage directly with governance managers, fund managers and governance advisers.
For more information on our corporate governance processes, refer to section 3 of this Annual Report.
1.9 Remuneration
Our Remuneration Committee recognises that remuneration has an important role to play in supporting the implementation and achievement of the Group’s strategy and our ongoing performance, aligning the activities of management to the interests of shareholders, and in supportingOur Charter.
Remuneration at BHP Billiton
The key principles of our remuneration policy, which remain unchanged from FY2014, are to:
support the execution of the Group’s business strategy in accordance with a risk framework that is appropriate for the organisation;
provide competitive rewards to attract, motivate and retain highly skilled executives willing to work around the world;
apply demanding performance measures, including key financial and non-financial measures of performance;
link a significant component of pay to our performance and the creation of value for our shareholders from relative outperformance;
ensure remuneration arrangements are equitable and facilitate the deployment of people around the Group;
limit severance payments on termination to pre-established contractual arrangements (which do not commit us to making any unjustified payments).
Link to strategy
Our Charter sets out our values, placing health and safety first, upon which the Remuneration Committee places great weight in the determination of performance-based remuneration outcomes for BHP Billiton’s executives.Our Charter also sets out our purpose, our strategy and how we measure success. The Committee is guided by those measures in supporting our executives in taking a long-term approach to decision-making in order to build a sustainable and value-adding business. Our remuneration policy and strategy is focused on long-term success and minimising short-term behaviours or results that would jeopardise longer-term outcomes.
We want executive remuneration to reflect the Group’s performance and share price over an extended period and this is primarily achieved with the equity component of the Short-Term Incentive award being deferred for a two-year period, and with Total Shareholder Return under the Long-Term Incentive Plan being measured over a five-year performance period.
Our approach
We have made no changes to the underlying approach to remuneration in the last year. It is an approach that BHP Billiton has practised for over 10 years and we believe it continues to serve our executives and shareholders well. The remuneration outcomes continue to appropriately reflect the performance of the Group, of the Businesses and of individuals.
While our approach has been given strong support by shareholders, with a vote ‘for’ the Remuneration Report in excess of 97 per cent at last year’s AGMs, and indeed over 96 per cent in each of the prior five years, the Remuneration Committee and the Board will continue to listen and give attention to feedback and views from shareholders on the Johannesburg Stock Exchange (JSE)Group’s approach to pay.
Summary
The Committee remains confident that our philosophy and policies on remuneration are appropriate to support long-term value creation, and the outcomes for FY2015 continue to demonstrate the alignment between remuneration and performance at BHP Billiton.
For more information on our remuneration policies and the remuneration outcomes for members of the GMC and Non-executive Directors, refer to section 4 of this Annual Report.
1.10 Key performance indicators
Our key performance indicators (KPIs) enable us to measure our sustainable development and financial performance. Their relevance to our strategy and our performance against these measures in FY2015 are explained below.
These KPIs are used as measures, directly and indirectly, in the short-term and/or long-term incentive arrangements for remuneration of senior executives. Certain KPIs (denoted with this symbol ) are used directly to calculate incentive outcomes and others (denoted with this symbol
 ) are considered more broadly in determining final overall results. Our Remuneration Report is contained in section 4 of this Annual Report and provides information on our overall approach to remuneration of executives, including remuneration policies and the remuneration outcomes for members of the GMC and Non-executive Directors.
1.10.1 Sustainability KPIs
TRIF
| | |
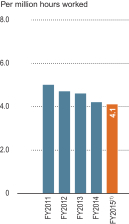
__________ (1) Includes data for Continuing and Discontinued operations for the financial years being reported. | | Definition Total recordable injury frequency (TRIF) is an indicator in highlighting broad personal injury trends and is calculated based on the number of recordable injuries per million hours worked. This data covers the assets that have been wholly owned and operated by BHP Billiton or that have been operated by BHP Billiton in a joint venture operation (including assets that now form part of South32 until 8 May 2015), and includes work-related events occurring outside of our operation locations for the period from 1 July 2014 to 30 June 2015. In FY2015, we expanded our definition of work-related activities to align with the reporting boundaries of the International Council on Mining and Metals, which includes the recording of events that occur outside of our operated locations where we have established the work to be performed and can set and verify the health and safety standards. Link to strategy Our overriding commitment is to ensuring the safety and health of our people and this is supported byOur Charter value of Sustainability. FY2015 performance There were five work-related fatalities in FY2015. Our TRIF has improved by 18 per cent over the last five years. During FY2015, we improved our TRIF by two per cent. For information on our approach to health and safety and our performance, refer to section 1.14 of this Annual Report. |
GHG emissions(1)
| | |
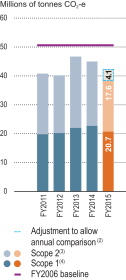
| | Definition Greenhouse gas (GHG) emissions are measured according to the World Resources Institute/World Business Council for Sustainable Development Greenhouse Gas Protocol. This data only includes wholly owned and operated assets or assets operated in a joint venture operation from 1 July 2012 to 30 June 2015 (including assets that now form part of South32 until 8 May 2015). Link to strategy The global challenge of climate change remains a priority for our organisation and is core to our strategic decision-making. Our GHG emissions are monitored and our performance is tracked against our target. FY2015 performance In FY2015, the Group’s GHG emissions was 38.3 million tonnes (Mt) of carbon dioxide equivalent (CO2-e). Taking into account the impact of the demerger(2), this represents a six per cent reduction compared to FY2014 GHG emissions. For more information on our GHG emissions, refer to section 1.14 of this Annual Report. |
| (1) | Measured according to the World Resources Institute/World Business Council for Sustainable Development Greenhouse Gas Protocol. |
| (2) | In order to compare the total GHG emissions to prior financial years, GHG emissions (estimated) from South32 assets between the date of demerger and 30 June 2015 have been added to FY2015 GHG emissions as shown above. |
| (3) | Scope 2 refers to indirect GHG emissions from the generation of purchased electricity and steam that is consumed by operated assets. |
| (4) | Scope 1 refers to direct GHG emissions from operated assets. |
Community investment
| | |
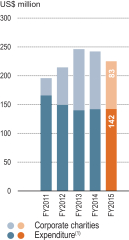
| | Definition Our voluntary community investment comprises cash, in-kind support, administrative costs and contributions to the BHP Billiton Foundation and BHP Billiton Sustainable Communities (our corporate charities). It includes BHP Billiton’s equity share for both operated and non-operated joint venture operations. Link to strategy We believe that in addition to operating a responsible and ethical company, we can make a broader contribution to the communities in which we operate and supportOur Charter value of Sustainability. FY2015 performance Our voluntary community investment totalled US$225.0 million, comprising US$142.0 million in cash, in-kind support and administrative costs, and a US$83.0 million contribution to the BHP Billiton Foundation. For more information on our community investment, refer to section 1.14 of this Annual Report. |
| (1) | Includes BHP Billiton’s equity share for both operated and non-operated joint venture operations. Includes payments made by operations demerged with South32. |
1.10.2 Financial KPIs
Attributable profit(1)
| | |
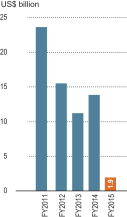
| | Definition Attributable profit represents Profit after taxation attributable to members of BHP Billiton Group and includes attributable (loss)/profit after taxation from Discontinued operations. Link to strategy This is a key financial measure that provides insight on the amount of profit available to distribute to shareholders, which aligns to our purpose as presented inOur Charter. FY2015 performance Attributable profit decreased by 86 per cent to US$1.9 billion, mainly driven by a significant decline in commodity prices and included an attributable loss related to Discontinued operations of US$1.6 billion. For our Financial Statements, refer to section 7 of this Annual Report. |
| (1) | Includes data for Continuing and Discontinued operations for the financial years being reported. |
Underlying EBIT(1)
| | |
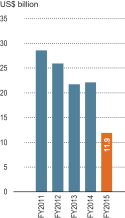
| | Definition Underlying EBIT is earnings before net finance costs, taxation, Discontinued operations and any exceptional items. Link to strategy This is a key financial measure used across the Group. It gives insight to cost management, production growth and performance efficiency. FY2015 performance Underlying EBIT declined by 46 per cent to US$11.9 billion, as the reduction in controllable cash costs, productivity-led volume efficiencies and an increase in growth volumes, were more than offset by lower realised prices net of price-linked costs. For a reconciliation of Underlying EBIT to Profit from operations, refer to sections 1.11 and 2.5.1 of this Annual Report. For our Financial Statements, refer to section 7 of this Annual Report. |
| (1) | Excludes data from Discontinued operations for the financial years being reported. |
Net operating cash flows(1)
| | |
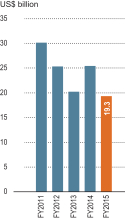
| | Definition Net operating cash flows represents the cash generated by the Group’s consolidated operations, after dividends received, interest, taxation and royalty-related taxation. This figure excludes cash flows relating to investing and financing activities and includes net operating cash flows from Discontinued operations. Link to strategy Net operating cash flows provides insight into how we are managing costs and increasing efficiency and productivity across the Company. FY2015 performance Net operating cash flows decreased by 24 per cent to US$19.3 billion during FY2015. The major contributor was the US$7.7 billion decrease in cash generated from operations (after changes in working capital balances), which was partially offset by a decrease of US$2.1 billion in net taxes paid. For our Financial Statements, refer to section 7 of this Annual Report. |
| (1) | Includes data for Continuing and Discontinued operations for the financial years being reported. |
1.10.3 Capital management KPIs
Total shareholder return (TSR)
| | |
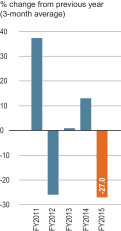
| | Definition TSR shows the total return to the shareholder during the year. It combines both movements in share prices and dividends paid (which are assumed to be reinvested). Link to strategy TSR measures performance of the organisation in terms of shareholder wealth generation, which aligns to our purpose as presented inOur Charter, and enables the comparison of our performance with that of our peer companies. FY2015 performance TSR was negative 27.0 per cent during FY2015 as a result of a decrease in the BHP Billiton share price, partly offset by an increase in the dividends paid. BHP Billiton underperformed its peer companies by 10.7 per cent from 1 July 2010 to 30 June 2015. |
Long-term credit rating
| | |
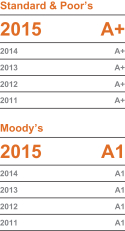
| | Definition Credit ratings are forward looking opinions about credit risk. Standard & Poor’s and Moody’s credit ratings express the opinion of each agency about the ability and willingness of BHP Billiton to meet its financial obligations in full and on time. Link to strategy One of BHP Billiton’s priorities for capital management is to maintain a solid ‘A’ credit rating, which indicates the strength of our balance sheet. FY2015 performance BHP Billiton has maintained a long-term credit rating of A+ from Standard & Poor’s and A1 from Moody’s. On 4 May 2015, Standard & Poor’s revised the Group’s ratings outlook to negative from stable. For more information on our liquidity and capital resources, refer to section 1.15.5 of this Annual Report. |
1.11 Summary of consolidated performance
1.11.1 Selected financial information
Our selected financial information reflects the operations of the BHP Billiton Group, and should be read in conjunction with the FY2015 Financial Statements, together with the accompanying notes.
We prepare our Consolidated Financial Statements in accordance with International Financial Reporting Standards (IFRS), as issued by the International Accounting Standards Board, and as outlined in note 41 ‘Basis of preparation and measurement’ to the Financial Statements in this Annual Report. We publish our Consolidated Financial Statements in US dollars.
Comparative financial information for FY2014, FY2013, FY2012 and FY2011 has been restated for the effects of the application of IFRS 5/AASB 5 ‘Non-current Assets Held for Sale and Discontinued Operations’ following
the demerger of South32, unless otherwise noted. The Consolidated Balance Sheet for these periods is not required to be and has not been restated, for further information refer to note 41 ‘Basis of preparation and measurement’ to the Financial Statements.
We use several financial measures to monitor the financial performance of our overall strategy. The two key measures are Profit after taxation attributable to members of the BHP Billiton Group (Attributable profit) and Underlying EBIT.
| | | | | | | | | | | | | | | | | | | | |
Year ended 30 June US$M | | 2015 | | | 2014 | | | 2013 | | | 2012(7) | | | 2011 (7) (8) | |
Consolidated Income Statement (Section 7.1.1) | | | | | | | | | | | | | | | | | | | | |
Revenue | | | 44,636 | | | | 56,762 | | | | 53,860 | | | | 56,642 | | | | 57,088 | |
Profit from operations | | | 8,670 | | | | 22,649 | | | | 21,977 | | | | 22,602 | | | | 28,462 | |
Profit after taxation from Continuing operations | | | 4,390 | | | | 14,955 | | | | 14,132 | | | | 15,233 | | | | 21,062 | |
(Loss)/profit after taxation from Discontinued operations | | | (1,512 | ) | | | 269 | | | | (1,312 | ) | | | 1,384 | | | | 2,884 | |
| Profit after taxation from Continuing and Discontinued operations attributable to members of BHP Billiton Group(1) | | | 1,910 | | | | 13,832 | | | | 11,223 | | | | 15,473 | | | | 23,648 | |
| Dividends per ordinary share – paid during the period (US cents) | | | 124.0 | | | | 118.0 | | | | 114.0 | | | | 110.0 | | | | 91.0 | |
| Dividends per ordinary share – determined in respect of the period (US cents) | | | 124.0 | | | | 121.0 | | | | 116.0 | | | | 112.0 | | | | 101.0 | |
| Basic earnings from Continuing and Discontinued operations per ordinary share (US cents)(1) (2) | | | 35.9 | | | | 260.0 | | | | 210.9 | | | | 290.7 | | | | 429.1 | |
| Diluted earnings from Continuing and Discontinued operations per ordinary share (US cents)(1) (2) | | | 35.8 | | | | 259.1 | | | | 210.2 | | | | 289.4 | | | | 426.9 | |
| Basic earnings from Continuing operations per ordinary share (US cents) (2) | | | 65.5 | | | | 256.5 | | | | 238.6 | | | | 265.3 | | | | 380.8 | |
| Diluted earnings from Continuing operations per ordinary share (US cents)(2) | | | 65.3 | | | | 255.7 | | | | 237.8 | | | | 264.1 | | | | 378.8 | |
Number of ordinary shares (millions) | | | | | | | | | | | | | | | | | | | | |
– At period end | | | 5,324 | | | | 5,348 | | | | 5,348 | | | | 5,348 | | | | 5,350 | |
– Weighted average | | | 5,318 | | | | 5,321 | | | | 5,322 | | | | 5,323 | | | | 5,511 | |
– Diluted | | | 5,333 | | | | 5,338 | | | | 5,340 | | | | 5,346 | | | | 5,540 | |
Consolidated Balance Sheet (Section 7.1.3) (3) | | | | | | | | | | | | | | | | | | | | |
Total assets | | | 124,580 | | | | 151,413 | | | | 139,178 | | | | 129,201 | | | | 102,920 | |
Net assets | | | 70,545 | | | | 85,382 | | | | 75,291 | | | | 69,315 | | | | 57,755 | |
Share capital (including share premium) | | | 2,761 | | | | 2,773 | | | | 2,773 | | | | 2,773 | | | | 2,771 | |
| Total equity attributable to members of BHP Billiton Group | | | 64,768 | | | | 79,143 | | | | 70,667 | | | | 65,526 | | | | 56,762 | |
Other financial information | | | | | | | | | | | | | | | | | | | | |
Underlying EBITDA(4) | | | 21,852 | | | | 30,292 | | | | 28,109 | | | | 31,554 | | | | 32,904 | |
Underlying EBIT(4) | | | 11,866 | | | | 22,098 | | | | 21,680 | | | | 25,948 | | | | 28,626 | |
Underlying attributable profit(4) | | | 6,417 | | | | 13,263 | | | | 12,017 | | | | 15,928 | | | | 19,194 | |
Underlying basic earnings per share (US cents)(4) | | | 120.7 | | | | 249.3 | | | | 225.8 | | | | 299.2 | | | | 348.3 | |
| Capital and exploration expenditure (BHP Billiton share) (5) | | | 11,581 | | | | 15,181 | | | | 22,291 | | | | 19,793 | | | | 12,387 | |
Net operating cash flows(6) | | | 19,296 | | | | 25,364 | | | | 20,154 | | | | 25,259 | | | | 30,080 | |
| (1) | Includes (loss)/profit after taxation from Discontinued operations attributable to members of BHP Billiton Group. |
| (2) | For more information on earnings per share refer to note 6 ‘Earnings per share’ to the Financial Statements. |
| (3) | The Consolidated Balance Sheet for FY2015 does not include the assets and liabilities of the Businesses demerged with South32. IFRS 5/AASB 5 ‘Non-current Assets Held for Sale and Discontinued Operations’ does not require the Consolidated Balance Sheet to be restated for comparative periods. |
| (4) | Underlying attributable profit, Underlying EBIT and Underlying EBITDA are non-IFRS financial measures that we use to reflect the underlying performance of BHP Billiton. Underlying attributable profit is Attributable profit excluding Discontinued operations and any exceptional items. Underlying EBIT is earnings before net finance costs, taxation, Discontinued operations and any exceptional items. Underlying EBITDA is Underlying EBIT before depreciation, impairments and amortisation. We believe that Underlying attributable profit, Underlying EBIT and Underlying EBITDA provide useful information, but should not be considered as an indication of, or as an alternative to, Attributable profit as an indicator of actual operating performance or as an alternative to cash flow as a measure of liquidity. Underlying EBIT and Underlying EBITDA are included in the FY2015 Consolidated Financial Statements as required by IFRS 8 ‘Operating Segments’ and are disclosed in sections 1.15.3 Operating results and 2.5 Business performance. |
| (5) | Represents the share of capital and exploration expenditure attributable to BHP Billiton shareholders on a cash basis. Includes BHP Billiton proportionate share of equity accounted investments, capital and exploration expenditure from Discontinued operations; excludes capitalised deferred stripping and non-controlling interests. |
| (6) | Net operating cash flows are after dividends received, net interest and taxation and include net operating cash flows from Discontinued operations. |
| (7) | FY2012 and FY2011 restated data is not required to be and has not been subject to audit. |
| (8) | FY2011 data has not been restated for the effects of new accounting standards and interpretations and other voluntary changes in accounting policy, which were effective in the financial year commencing from 1 July 2013. This information has however been restated where required by IFRS 5/AASB 5 ‘Non-current Assets Held for Sale and Discontinued Operations’, unless otherwise noted. |
Non-IFRS measures
We use a number of non-IFRS measures to assess our performance. Non-IFRS measures include the following:
Adjusted effective tax rate – comprises Total taxation expense excluding remeasurement of deferred tax assets associated with the Minerals Resource Rent Tax (MRRT), exceptional items, Discontinued operations and exchange rate movements included in taxation expense divided by Profit before taxation and exceptional items.
Controllable cash costs – comprises operating cash costs and exploration and business development costs and excludes Discontinued operations.
Free cash flow – comprises Net operating cash flows less net investing cash flows and excludes Discontinued operations.
Gearing – represents the ratio of net debt to net debt plus net assets.
Net debt – comprises Interest bearing liabilities less Cash and cash equivalents for the total operations within the Group at the reporting date.
Net operating assets – represents operating assets net of operating liabilities, including the carrying value of equity accounted investments and predominantly excludes cash balances, interest bearing liabilities and deferred tax balances. The carrying value of investments accounted for using the equity accounted method represents the balance of the Group’s investment in equity accounted investments, with no adjustment for any cash balances, interest bearing liabilities and deferred tax balances of the equity accounted investment.
Underlying attributable profit – comprises Profit after taxation attributable to members of BHP Billiton Group less exceptional items as described in note 2 ‘Exceptional items’ to the Financial Statements and excludes Discontinued operations.
Underlying basic earnings per share – represents basic earnings per share excluding any exceptional items and Discontinued operations.
Underlying EBIT – is earnings before net finance costs, taxation, Discontinued operations and any exceptional items.
Underlying EBITDA – is Underlying EBIT before depreciation, impairments and amortisation.
Underlying EBIT margin – comprises Underlying EBIT, excluding third party product profit from operations, divided by revenue excluding third party product revenue.
Underlying EBITDA margin – comprises Underlying EBITDA, excluding third party product EBITDA, divided by revenue excluding third party product revenue.
Underlying EBITDA interest coverage – for the purpose of deriving interest coverage, net interest comprises Interest on bank loans and overdrafts, Interest on all other borrowings, Finance lease and hire purchase interest less Interest income.
Underlying return on capital – represents net profit after tax, excluding exceptional items, Discontinued operations and net finance costs (after tax), divided by average capital employed. Capital employed is net assets before net debt.
Financial results for year ended 30 June 2015 compared with year ended 30 June 2014
Information in this section has been presented on a Continuing operations basis to exclude the contribution from assets that were demerged with South32, unless otherwise noted. Details of the contribution of the South32 assets to the Group’s results are disclosed under ‘Discontinued operations’ below and in note 29 ‘Discontinued operations’ to the Financial Statements.
Revenue in FY2015 was US$44.6 billion, a decrease of US$12.2 billion or 21 per cent from US$56.8 billion in the corresponding period. Revenue decreased across all Businesses, but mainly in the Iron Ore and Petroleum and Potash Businesses, where revenue decreased by US$6.6 billion and US$3.4 billion, respectively. Our Copper Business and our Coal Business contributed additional revenue decreases of US$1.3 billion and US$678 million, respectively.
The decrease in revenue in Iron Ore was primarily due to a 41 per cent decline in the average realised price of iron ore to US$61 per wet metric tonne (FOB), which more than offset a 13 per cent volume increase at WAIO to a record 254 Mt (100 per cent basis) as a result of continued improvement in the performance of our integrated supply chain and the successful ramp-up of the Jimblebar mining hub. The decrease in revenue in Petroleum was primarily driven by lower realised prices.
Overall, the US$12.2 billion decrease in revenue in FY2015 was primarily attributable to weaker realised prices for our commodities, which reduced total revenue by US$17.0 billion, which more than offset additional revenue of US$6.2 billion attributable to increased volumes during the year.
| | | | | | | | | | | | |
Year ended 30 June | | 2015
US$M | | | 2014
US$M
Restated | | | 2013
US$M
Restated | |
| | | |
Raw materials and consumables used | | | 4,667 | | | | 5,540 | | | | 5,407 | |
Employee benefits expense | | | 4,971 | | | | 5,413 | | | | 5,578 | |
External services (including transportation) (1) | | | 8,928 | | | | 9,899 | | | | 10,202 | |
Third party commodity purchases | | | 1,165 | | | | 1,702 | | | | 1,158 | |
Net foreign exchange (gains)/losses | | | (469 | ) | | | 168 | | | | (187 | ) |
Fair value change on derivatives | | | 124 | | | | (122 | ) | | | 63 | |
Government royalties paid and payable | | | 1,708 | | | | 2,412 | | | | 2,179 | |
Depreciation and amortisation expense | | | 9,158 | | | | 7,716 | | | | 6,067 | |
Exploration and evaluation expenditure | | | 670 | | | | 698 | | | | 1,026 | |
Impairment of assets (2) | | | 4,024 | | | | 478 | | | | 3,286 | |
Operating lease rentals | | | 636 | | | | 665 | | | | 679 | |
Other operating expenses(3) | | | 1,428 | | | | 1,954 | | | | 1,371 | |
Total expenses | | | 37,010 | | | | 36,523 | | | | 36,829 | |
Less exceptional items | | | (3,196 | ) | | | – | | | | (2,862 | ) |
Total expenses excluding exceptional items | | | 33,814 | | | | 36,523 | | | | 33,967 | |
| | | | | | | | | | | | |
| (1) | Includes exceptional items of US$ nil (2014: US$ nil; 2013: US$96 million). |
| (2) | Includes exceptional items of US$3,196 million (2014: US$ nil; 2013: US$2,924 million). |
| (3) | Includes exceptional items of US$ nil (2014: US$ nil; 2013: credit of US$158 million). |
Total expenses increased from US$36.5 billion in FY2014 to US$37.0 billion in FY2015. Total expenses excluding exceptional items of US$3.2 billion, the majority of which related to impairments in FY2015, decreased by US$2.7 billion or seven per cent during FY2015 from US$36.5 billion to US$33.8 billion.
The increase of non-cash expenses for depreciation and amortisation of US$1.4 billion and impairments not classified as exceptional items of US$350 million, was more than offset by our ability to reduce operating costs across all of our Businesses, demonstrated by the delivery of a US$2.7 billion reduction in cash cost efficiencies and a favourable foreign exchange impact of US$1.7 billion.
Reductions in expenses (excluding exceptional items) were evident in Raw materials and consumables used of US$873 million, External services (including transportation) of US$971 million, Employee benefit expense of US$442 million, Third party commodity purchases of US$537 million, and Government royalties paid and payable of US$704 million. Total operating costs were aided by favourable exchange rates, including a favourable restatement of monetary items in the balance sheet of US$637 million compared to FY2014. For further information, refer to note 42 ‘Functional and presentation currency’ to the Financial Statements.
Other income decreased from US$1.2 billion in FY2014 to US$496 million in FY2015, mainly due to the gain on sale for the Pinto Valley mining operation of US$551 million recognised in FY2014. For further information, refer to note 5 ‘Other income’ to the Financial Statements.
Profit from operations decreased by US$13.9 billion or 62 per cent, from US$22.6 billion to US$8.7 billion. Gross exceptional items during FY2015 comprised an impairment of Onshore US assets of US$2.8 billion and an impairment of Nickel West assets of US$409 million, compared with gross exceptional income of US$551 million in FY2014.
Underlying EBIT
Underlying EBIT is a key measure that management uses internally to assess the performance of our Businesses, make decisions on the allocation of resources and assess operational management. Management uses this measure because financing structures and tax regimes differ across our assets and substantial components of our tax and interest charges are levied at a Group level rather than an operational level.
We exclude exceptional items from Underlying EBIT in order to enhance the comparability of the measure from period to period and provide clarity into the underlying performance of our operations. Our management monitors exceptional items separately.
For FY2015, Underlying EBIT declined by 46 per cent to US$11.9 billion. Further analysis of Underlying EBIT for the Businesses is included in section 1.12 and for the Group in section 1.15.3 of this Annual Report.
The following table reconciles Underlying EBIT to Profit from operations.
| | | | | | | | | | | | |
Year ended 30 June | | 2015
US$M | | | 2014
US$M
Restated | | | 2013
US$M
Restated | |
| | | |
Underlying EBIT | | | 11,866 | | | | 22,098 | | | | 21,680 | |
Exceptional items (before taxation) – refer section 1.15.3 | | | (3,196 | ) | | | 551 | | | | 297 | |
| | | | | | | | | | | | | |
Profit from operations (EBIT) | | | 8,670 | | | | 22,649 | | | | 21,977 | |
| | | | | | | | | | | | |
Net finance costs
Net finance costs decreased by US$300 million to US$614 million in FY2015. The decrease reflected foreign exchange gains on finance leases and the early redemption of the Petrohawk Energy Corporation Senior Notes in August 2014, which resulted in a gain on redemption and lower interest expense.
Taxation expense
Total taxation expense decreased by US$3.1 billion to US$3.7 billion in FY2015. This decrease was mainly driven by the decrease of Profit before taxation. The adjusted effective tax rate, which excludes the influence of exchange rate movements, remeasurement of deferred tax assets associated with the MRRT and exceptional items, decreased from 32.2 per cent to 31.8 per cent.
Discontinued operations
South32’s contribution to BHP Billiton’s FY2015 results comprised US$753 million Profit after taxation, excluding exceptional items. Exceptional items comprised a tax expense of US$111 million related to the repeal of the MRRT and a net loss on the demerger of US$2.2 billion (after tax benefit). This contribution has been included in Loss attributable to members of BHP Billiton Group from Discontinued operations of US$1.6 billion.
Underlying attributable profit
The following table reconciles Underlying attributable profit to Attributable profit.
| | | | | | | | | | | | |
Year ended 30 June | | 2015
US$M | | | 2014
US$M | | | 2013
US$M | |
| | | |
Underlying attributable profit | | | 6,417 | | | | 13,263 | | | | 12,017 | |
Attributable loss – Discontinued operations | | | (1,573 | ) | | | 184 | | | | (1,475 | ) |
Exceptional items (after taxation) | | | (2,946 | ) | | | 385 | | | | 681 | |
Minority interest in exceptional items | | | 12 | | | | – | | | | – | |
| | | | | | | | | | | | | |
Attributable profit | | | 1,910 | | | | 13,832 | | | | 11,223 | |
| | | | | | | | | | | | |
Attributable profit decreased by 86 per cent to US$1.9 billion mainly driven by a significant decline in commodity prices and included an Attributable loss related to Discontinued operations of US$1.6 billion.
Underlying basic earnings per share of 120.7 US cents is calculated using Underlying attributable profit divided by the weighted average number of ordinary shares.
Other financial information
Net operating cash flows from Continuing operations decreased by 25 per cent to US$17.8 billion during FY2015. The major contributor was the US$7.7 billion decrease in cash generated from operations (after changes in working capital balances), which was partially offset by a decrease of US$2.1 billion in net taxes paid. Despite the significant decline in commodity prices, we generated US$6.3 billion of free cash flow during the period as we further improved both operating and capital productivity and exercised the flexibility in our investment program. In this regard, we invested US$11.0 billion in capital projects and exploration (BHP Billiton share) for Continuing operations during the year.
We finished the period with net debt of US$24.4 billion (2014: US$25.8 billion) for a gearing ratio of 25.7 per cent (2014: 23.2 per cent). IFRS 5/AASB 5 ‘Non-current Assets Held for Sale and Discontinued Operations’ does not require the Consolidated Balance Sheet to be restated for comparative periods. The FY2014 figures therefore includes assets and liabilities of the Businesses demerged with South32. For information relating to Discontinued operations refer to note 29 ‘Discontinued operations’ to the Financial Statements.
1.11.2 Production performance
A summary of our production volumes for FY2015 and the previous two financial years is shown below. Further details appear in section 2.2 of this Annual Report.
| | | | | | | | | | | | |
Year ended 30 June (1) | | 2015 | | | 2014 | | | 2013 | |
Production – Continuing operations | | | | | | | | | | | | |
Total Petroleum production (MMboe) | | | 256 | | | | 246 | | | | 236 | |
Copper (kt) | | | 1,708 | | | | 1,727 | | | | 1,689 | |
Iron ore (kt) | | | 232,508 | | | | 203,564 | | | | 169,856 | |
Metallurgical coal (kt) | | | 42,621 | | | | 37,565 | | | | 29,708 | |
Energy coal (kt) | | | 41,012 | | | | 43,108 | | | | 40,818 | |
Nickel (kt) | | | 90 | | | | 99 | | | | 103 | |
Production – Discontinued operations | | | | | | | | | | | | |
Metallurgical coal (kt) | | | 7,216 | | | | 7,513 | | | | 7,942 | |
Energy coal (kt) | | | 28,677 | | | | 30,384 | | | | 31,627 | |
Alumina (kt) | | | 4,284 | | | | 5,178 | | | | 4,880 | |
Aluminium (kt) | | | 843 | | | | 1,174 | | | | 1,179 | |
Manganese ores (kt) | | | 7,224 | | | | 8,302 | | | | 8,517 | |
Manganese alloys (kt) | | | 612 | | | | 646 | | | | 608 | |
Nickel (kt) | | | 34 | | | | 44 | | | | 51 | |
| (1) | BHP Billiton Group share of production includes our proportional share of production for which profit is derived from our equity accounted investments, unless otherwise stated. |
1.11.3 Projects and pipeline
Our project pipeline focuses on commodities that are expected to be high-margin and create significant future value. During FY2015, three major projects achieved first production for a total capital expenditure (subject to finalisation) of US$6.7 billion. At the end of FY2015, we had four major projects under development with a combined budget of US$7.0 billion. This budget does not include an additional US$1.5 billion of capital expenditure that we expect to spend in FY2016 on development of our Onshore US asset.
For more information on our major projects and pipeline refer to sections 1.12, 2.1 and 2.4 of this Annual Report.
1.12 Our Businesses
The description of our Businesses and a discussion of their performance are set out below.
For further information on our assets, production, results and reserves refer to section 2 of this Annual Report. For further information on the financial results of our Businesses, refer to note 1 ‘Segment reporting’ to the Financial Statements.
1.12.1 Revenue and Underlying EBIT performance by Business
The following tables provide a summary of Revenue and Underlying EBIT for FY2015 and the two prior corresponding periods of our Businesses and the Group. Our use of Underlying EBIT is explained in section 1.11.1 of this Annual Report. Underlying EBIT is one of the financial measures used to monitor the financial performance of our overall strategy and is disclosed by segment in note 1 ‘Segment reporting’ to the Financial Statements.
Information in this section has been presented on a Continuing operations basis to exclude the contribution from assets that were demerged with South32, unless otherwise noted. Details of the contribution of the South32 assets to the Group’s results are disclosed in note 29 ‘Discontinued operations’ to the Financial Statements.
Group and business level information is reported on a statutory basis in accordance with IFRS 8 ‘Operating Segments’. Revenue excludes revenue from investments accounted for using the equity method. Underlying EBIT includes net finance costs and taxation expense of investments accounted for using the equity method.
| | | | | | | | | | | | |
Year ended 30 June | | 2015
US$M | | | 2014
US$M
Restated | | | 2013
US$M
Restated | |
| | | |
Revenue (1) | | | | | | | | | | | | |
Petroleum and Potash | | | 11,447 | | | | 14,833 | | | | 13,224 | |
Copper | | | 11,453 | | | | 12,789 | | | | 13,172 | |
Iron Ore | | | 14,753 | | | | 21,356 | | | | 18,593 | |
Coal | | | 5,885 | | | | 6,563 | | | | 6,574 | |
Group and unallocated items(2) | | | 1,098 | | | | 1,221 | | | | 2,297 | |
| | | | | | | | | | | | |
BHP Billiton Group | | | 44,636 | | | | 56,762 | | | | 53,860 | |
| | | | | | | | | | | | |
| | | | | | | | | | | | |
Year ended 30 June | | 2015
US$M | | | 2014
US$M
Restated | | | 2013
US$M
Restated | |
| | | |
Underlying EBIT | | | | | | | | | | | | |
Petroleum and Potash | | | 1,802 | | | | 5,287 | | | | 5,636 | |
Copper | | | 3,353 | | | | 4,668 | | | | 5,033 | |
Iron Ore | | | 6,932 | | | | 12,102 | | | | 11,109 | |
Coal | | | 348 | | | | 575 | | | | 424 | |
Group and unallocated items(2) | | | (569 | ) | | | (534 | ) | | | (522 | ) |
| | | | | | | | | | | | |
BHP Billiton Group | | | 11,866 | | | | 22,098 | | | | 21,680 | |
| | | | | | | | | | | | |
| (1) | Includes the sale of third party products. |
| (2) | Comprises Group Functions, other unallocated operations including Nickel West (previously disclosed in the former Aluminium, Manganese and Nickel Business), consolidation adjustments and external sales of freight and fuel to third parties. |
Year ended 30 June 2015 compared with year ended 30 June 2014
Underlying EBIT for FY2015 was US$11.9 billion, a decrease of 46 per cent compared to the prior year.
A significant decline in commodity prices reduced Underlying EBIT by US$16.4 billion. This was offset in part by a reduction in operating cash costs of US$2.7 billion and the generation of productivity-led volume efficiencies of US$1.2 billion. A US$142 million reduction in capitalised exploration expenditure contributed to the delivery of US$4.1 billion of productivity gains during the period, two years ahead of our FY2017 target.
Non-cash charges and one-off items decreased Underlying EBIT by US$1.3 billion and US$456 million respectively, but were offset by the favourable impact of a stronger US dollar of US$1.6 billion, a reduction of price-linked costs of US$1.2 billion and the impact of additional growth volumes of US$1.8 billion.
The use of the term operating cash costs is described in section 1.15.3 of this Annual Report.
1.12.2 Petroleum and Potash Business
Our Petroleum and Potash Business headquartered in Houston, United States, comprises conventional and non-conventional oil and gas operations and a potash project based in Saskatchewan, Canada.
Results
| | | | | | | | | | | | |
Year ended 30 June | | 2015
US$M | | | 2014
US$M | | | 2013
US$M | |
| | | |
Revenue | | | 11,447 | | | | 14,833 | | | | 13,224 | |
Underlying EBIT | | | 1,802 | | | | 5,287 | | | | 5,636 | |
Capital expenditure | | | 5,359 | | | | 6,423 | | | | 7,675 | |
Net operating assets | | | 36,287 | | | | 39,514 | | | | 37,525 | |
Total petroleum production (MMboe) | | | 256 | | | | 246 | | | | 236 | |
Our Petroleum Business includes exploration, development, production and marketing activities. We have a high-quality resource base concentrated in the United States and Australia. Our core production operations are located in the US Gulf of Mexico, Australia, Trinidad and Tobago (conventional) and Onshore US (unconventional). We produce crude oil and condensate, gas and natural gas liquids (NGLs). A summary of the assets, capital projects and FY2015 performance of our Petroleum and Potash Business is presented as follows.
Description of the Petroleum Business
Our production operations include the following:
Gulf of Mexico (United States)
We operate two fields in the Gulf of Mexico (Shenzi with a 44 per cent interest and Neptune with a 35 per cent interest) and hold non-operating interests in three other fields (Atlantis with a 44 per cent interest, Mad Dog with a 23.9 per cent interest, and Genesis with a 4.95 per cent interest). We have ongoing infill drilling in most of our Gulf of Mexico fields and also planned ongoing water injection wells at the Shenzi and Atlantis fields. All the fields are located between 155 and 210 kilometres offshore from the US state of Louisiana. We also own 25 per cent and 22 per cent, respectively, of the companies that own and operate the Caesar oil pipeline and the Cleopatra gas pipeline. These pipelines transport oil and gas from the Green Canyon area, where our Gulf of Mexico fields are located, to connecting pipelines that transport product onshore. Our US oil production is delivered to refineries along the Gulf Coast of the United States. Production in FY2015 was 36.6 million barrels of oil equivalent (MMboe), up from 36.1 MMboe in FY2014.
Onshore US (United States)
We produce oil, condensate, gas and NGLs in four shale areas: Eagle Ford, Permian, Haynesville and Fayetteville. The Eagle Ford area has two fields, Black Hawk and Hawkville. Much of the Eagle Ford and Permian areas are focused on hydrocarbon liquids. The Haynesville and Fayetteville areas are focused on gas. Our combined leasehold acreage onshore in the United States is approximately 1.1 million net acres. Our ownership interests in those leases range from less than one per cent to 100 per cent. At 30 June 2015, we held an interest in approximately 7,300 gross wells and approximately 2,300 net wells. We acted as joint venture operator for approximately 27 per cent of our gross wells. Production in FY2015 was 125.7 MMboe, up from 108.1 MMboe in FY2014.
Oil and gas production from our onshore shale areas is sold domestically in the United States, via connections to intrastate and interstate pipelines, and internationally through the export of processed condensate from Black Hawk. Prices for oil, NGLs and gas are based on US regional price indices, including West Texas Intermediate prices for oil, relevant published US regional gas indices for natural gas and Mont Belvieu prices for NGLs.
Map of Onshore US and Gulf of Mexico
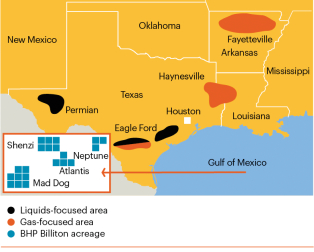
Bass Strait (Australia)
Together with our 50-50 joint venture partner, Esso Australia (a subsidiary of ExxonMobil), through the Gippsland Basin Joint Venture, we participated in the original discovery of hydrocarbons in 1965 and we have been producing oil and gas from Bass Strait for more than 40 years. The Bass Strait operations are located between 25 and 80 kilometres off the southeastern coast of Australia.
We sell the majority of our Bass Strait crude oil and condensate production to refineries along the east coast of Australia under 12-month contracts. The contract price is based on the average Dated Brent price. Gas is piped onshore to the joint venture’s Longford processing facility, from where we sell our share of production to domestic distributors under contracts with periodic price reviews. Liquefied petroleum gas (LPG) is dispatched via pipeline, road tanker or sea tanker. Ethane is dispatched via pipeline to petrochemical plants in western Melbourne.
Production in FY2015 was 31.2 MMboe, down from 34.0 MMboe in FY2014.
Minerva (Australia)
We are the operator of Minerva (90 per cent interest), a gas field located 11 kilometres south-southwest of Port Campbell in western Victoria. The operation consists of two subsea wells, with gas piped onshore to a processing plant. After processing, the gas is delivered into a pipeline and sold domestically under long-term contracts.
Production in FY2015 was 3.1 MMboe, up from 3.0 MMboe in FY2014.
North West Shelf (Australia)
We are a joint venture participant in the North West Shelf Project, located approximately 125 kilometres northwest of Dampier in Western Australia. The North West Shelf Project supplies gas to the Western Australian domestic market, mainly under long-term contracts, and liquefied natural gas (LNG) to buyers in Japan, South Korea and China under a series of long-term contracts.
North West Shelf gas is piped from the fields to the Karratha Gas Plant for processing. LPG, condensate and LNG are transported to market by ship, while domestic gas is transported by the Natural Gas and Pilbara Energy pipelines. We are also a joint venture partner in four nearby oil fields – Cossack, Wanaea, Lambert and Hermes.
All North West Shelf gas and oil joint ventures are operated by Woodside. Production in FY2015 was 28.7 MMboe, down from 28.8 MMboe in FY2014.
Pyrenees (Australia)
We operate six oil fields in Pyrenees, which are located offshore approximately 23 kilometres northwest of Northwest Cape, Western Australia. We had an effective 62 per cent interest in the fields as at 30 June 2015, based on inception-to-date production from two permits in which we have interests of 71.43 per cent and 40 per cent, respectively. The project uses a floating, production, storage and off-take (FPSO) facility. The crude oil produced is sold internationally on the spot market. Production in FY2015 was 7.2 MMboe, down from 7.5 MMboe in FY2014.
Macedon (Australia)
We are the operator of Macedon (71.43 per cent interest), an offshore gas field located approximately 75 kilometres west of Onslow, Western Australia, and an onshore gas processing facility, located approximately 17 kilometres southwest of Onslow. The operation achieved first gas in August 2013 and consists of four subsea wells, with gas piped onshore to the processing plant. After processing, the gas is delivered into a pipeline and sold into the Western Australian domestic market, mainly under long-term contracts. Production in FY2015 was 6.8 MMboe, up from 5.5 MMboe in FY2014.
Stybarrow (Australia)
We are the operator of Stybarrow (50 per cent interest), an oil field located 55 kilometres west-northwest of Exmouth, Western Australia. The project uses a FPSO facility. The crude oil produced is sold internationally on the spot market. Stybarrow reached the end of its field life and ceased production on 30 June 2015.
Map of North West Shelf and Bass Strait
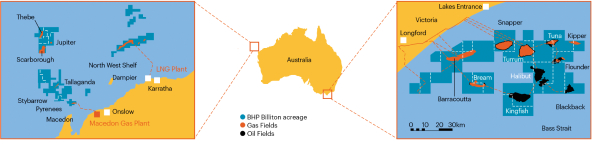
Trinidad and Tobago
We operate the Greater Angostura field (45 per cent interest in the production sharing contract), an integrated oil and gas development, located offshore, 40 kilometres east of Trinidad. The crude oil is sold on a spot basis to international markets, while the gas is sold domestically under term contracts. Production in FY2015 was 6.7 MMboe, down from 7.5 MMboe in FY2014.
Other
We are the operator of the Zamzama gas project (38.5 per cent interest) in the Sindh province of Pakistan and the Keith oil and gas field (31.83 per cent interest) in the North Sea. We have non-operating interests in ROD Integrated Development (38 per cent interest), which consists of six satellite oil fields in Algeria, and in the Bruce oil and gas field (16 per cent interest) in the North Sea. Production in FY2015 was 9.0 MMboe, down from 14.2 MMboe in FY2014.
More information on our assets and operations is presented in section 2.1.1 of this Annual Report.
Development projects in execution at year-end
North West Shelf Greater Western Flank–A
The North West Shelf Greater Western Flank–A (GWF-A) gas project was approved by the Board in November 2011 to recover gas from the near field Goodwyn H and Tidepole fields. The project consists of a five well subsea tie-back of the Goodwyn H and Tidepole fields to the Goodwyn A platform. The Goodwyn A platform is located in 130 metres of water, approximately 130 kilometres offshore from Karratha on the northwest coast of Australia. First gas production is expected in CY2016. Woodside is the operator and we own a 16.67 per cent interest.
Bass Strait Longford Gas Conditioning
The Longford Gas Conditioning Plant (LGCP) Project was approved by the Board in December 2012 to enable the production of Turrum reserves plus the production of Kipper and other undeveloped high carbon dioxide content hydrocarbons. The Project scope includes a carbon dioxide extraction facility, brownfield tie-ins, an electrical upgrade and multiple supporting utilities. First gas production is expected in CY2016.
Bass Strait Kipper gas field development
Initial development of the Kipper gas field in the Gippsland Basin, located offshore from Victoria, was approved by the Board in December 2007. A supplemental approval of the development was granted in January 2011. The first phase of the project included two new subsea wells, three new pipelines and platform modifications to supply 10 thousand barrels per day (Mbbl/d) of condensate and 80 million cubic feet per day (MMcf/d) of gas.
Gas and liquids will be processed via the existing Gippsland Basin Joint Venture facilities. The Kipper gas field development comprises the Kipper Unit Joint Venture and the Gippsland Basin Joint Venture. We own a 32.5 per cent interest in the Kipper Unit Joint Venture, with Esso Australia owning 32.5 per cent and Santos owning 35 per cent. We own a 50 per cent interest in the Gippsland Basin Joint Venture, with Esso Australia owning the remaining 50 per cent.
The main Kipper gas field facilities were completed in September 2012; however, first production has not yet commenced due to the need to provide for mercury removal. Funding for the installation of the mercury treatment facilities of US$120 million was approved in March 2014, with completion expected to occur in CY2016. Our share of costs incurred to 30 June 2015 was US$59 million.
Bass Strait Turrum field development
Further expansion of the Gippsland Basin facilities is underway following approval by the Board in July 2008 of the full field development of the Turrum oil and gas field. A supplemental approval of the development was obtained in January 2011. The project consists of five wells and a new platform, Marlin B, linked by a bridge to the existing Marlin A platform. The Turrum field, which has a capacity of 11 Mbbl/d of oil and 200 MMcf/d of gas, is located 42 kilometres offshore in approximately 60 metres of water. Our share of development costs is approximately US$1.4 billion, of which US$1.3 billion was incurred as of 30 June 2015.
The Turrum field development operates under the Gippsland Basin Joint Venture, in which we own a 50 per cent interest, with Esso Australia owning the remaining 50 per cent. Initial production of low carbon dioxide gas through the Turrum facilities occurred in June 2013. High carbon dioxide gas production from the Turrum reservoir will come online with completion of the Longford Gas Conditioning Plant in CY2016.
Onshore US development
BHP Billiton’s Onshore US drilling and development expenditure in FY2015, presented on an accruals basis within this section, was US$3.3 billion (FY2014: US$4.2 billion). The expenditure was primarily related to drilling and completion activities in our liquids-rich Black Hawk and Permian fields, while deferring development in areas that are predominantly gas.
Eagle Ford capital expenditure for FY2015 was US$2.1 billion (FY2014: US$3.1 billion). The expenditure was primarily related to drilling and completion activities, resulting in 188 net development wells completed during the year. Of the US$2.1 billion, approximately US$95 million was spent on the installation of more than 52 kilometres of pipeline infrastructure and additional gas processing facilities. The operated rig count was seven for the year (FY2014: 17).
Permian capital expenditure for FY2015 was US$0.7 billion (FY2014: US$0.5 billion). The expenditure was primarily related to drilling and completion activities, resulting in 45 net development wells completed during the year. Of the US$0.7 billion, approximately US$54 million was spent on the installation of more than 101 kilometres of pipeline infrastructure and additional gas processing facilities. The operated rig count was three for the year (FY2014: four).
Haynesville capital expenditure for FY2015 was US$0.3 billion (FY2014: US$0.4 billion). The expenditure was primarily related to drilling and completion activities, resulting in 25 net development wells completed during the year. There were no operated rigs in Haynesville at the end of this year (FY2014: three).
Fayetteville capital expenditure for FY2015 was US$0.2 billion (FY2014: US$0.2 billion). The expenditure was primarily related to participation in drilling and completion activities for wells operated by third parties, resulting in 45 net development wells completed during the year.
More information on our development and capital projects is presented in section 2.4 of this Annual Report.
Exploration and evaluation
Our exploration strategy is to focus on material opportunities, at high working interest, with a bias for liquids and operatorship. While the majority of the expenditure incurred was in our Gulf of Mexico, Western Australia and Trinidad and Tobago focus areas, we also incurred expenditure in South Africa. In addition,Africa, Brazil, South-East Asia, India and Onshore US.
After exploration and appraisal we then perform development evaluation activities to determine the technical feasibility and commercial viability of prospective projects.
More information on our development evaluation activities and exploration is presented in section 2.1.1 of this Annual Report.
Description of Potash
Jansen Potash Project
Our Potash strategy is to build a material industry position over the long term.
We hold exploration permits and mining leases, issued by the Government of Saskatchewan, covering more than 16,000 square kilometres of mineral rights in the province of Saskatchewan in Canada. The Government of Saskatchewan has issued a Potash Lease Special Agreement (KLSA) for the Jansen Potash Project, which provides long-term security of tenure to allow the ongoing development and subsequent operation of Jansen for the life of the operation.
We have progressively explored our permit areas over the past eight years and continue to evaluate their economic development potential. We are converting our exploration permits to long-term mining leases as these permits mature in order to enable further evaluation. To date, we have secured 8,000 square kilometres under long-term mining leases.
We continue to progress Jansen, a greenfield potash project, located approximately 140 kilometres east of Saskatoon in south-central Saskatchewan. We believe Jansen is one of the world’s best undeveloped potash resources and is likely to be a low-cost source of supply once fully developed. Investment in Jansen could underpin a potential fifth Business within BHP Billiton, given the opportunity to develop a multi-decade, multi-mine basin in Saskatchewan.
On 20 August 2013, we announced an additional US$2.6 billion investment in Jansen, bringing total approved spending to US$3.8 billion. This investment is funding the excavation and lining of the Project’s production and service shafts, and the installation of essential surface infrastructure and utilities and was 46 per cent complete as of 30 June 2015.
The level of expenditure on the Project in FY2015 was US$423 million. Shaft excavation is progressing, while the construction workforce camp and service shaft permanent headframe have been completed. Necessary infrastructure work continues to be progressed.
With our investment premised on the attractive longer-term market fundamentals for potash, we will continue to modulate the pace of development. The introduction of one or more minority partners, consistent with our approach for some of our other resource operations, will be considered at the appropriate time.
On the basis of our current projections and subject to Board approval, Jansen is likely to ramp-up production in the decade beginning 2020.
We are continuing to evaluate other areas for which we have exploration permits in the Saskatchewan potash basin, including Young, Boulder, Burr and Melville, through analysis of the extensive data collected from successive exploration programs.
In October 2014, the management of the closed mine sites associated with Base Metals North America was transitioned from the Potash to the Petroleum Business. All locations are in care and maintenance or in various stages of closure.
As at 1 August 2015, management of the Jansen Potash Project transferred from the Petroleum Business to BHP Billiton’s Chief Commercial Officer.
Performance
Total petroleum production increased by four per cent in FY2015 to a record 256 MMboe. A 17 per cent increase in liquids production to 125 MMboe was supported by a 67 per cent increase in Onshore US liquids volumes and strong uptime performance in the Gulf of Mexico. Natural gas production declined by six per cent to 787 billion cubic feet due to weaker seasonal demand at Bass Strait, along with lower Onshore US gas volumes as a result of the decision to defer development activity for longer-term value.
Petroleum revenue decreased by US$3.4 billion to US$11.5 billion. Revenue in Australia for the Australia Production Unit (which includes Macedon, Pyrenees, Stybarrow and Minerva), Bass Strait and North West Shelf collectively decreased by US$1.5 billion (27 per cent) to US$4.2 billion and revenue in the Gulf of Mexico for Atlantis, Shenzi and Mad Dog decreased by US$963 million (30 per cent) to US$2.2 billion.
Underlying EBIT for Petroleum decreased by US$3.9 billion to US$1.9 billion in FY2015. Price related impacts, net of price-linked costs decreased Underlying EBIT by US$4.1 billion due to the decrease in average realised
prices of crude and condensate oil from US$102/bbl to US$68/bbl, US natural gas from US$4.10/Mscf to US$3.27/Mscf and LNG from US$14.67/Mscf to US$11.65/Mscf.
Higher volumes contributed an increase of US$799 million to Underlying EBIT. This was partially offset bynon-cash costs which reduced Underlying EBIT by US$639 million. The increase in non-cash costs includes: US$316 million of higher depreciation and amortisation charges in Onshore US following the ramp-up of liquids production at Black Hawk and the progressive development of our Permian acreage; and US$328 million of impairment charges associated with the divestment of conventional assets in North Louisiana (Haynesville) and unconventional gas assets in the Pecos field (Permian). The rate of depreciation in Onshore US assets is expected to continue to rise as the proportion of currently higher-margin liquids volumes increase relative to gas. During the period, a US$79 million impairment of Neptune was also recognised as the fall in near-term oil prices has affected its value due to its short field life.
Petroleum capital expenditure declined by 15 per cent to US$5.0 billion in FY2015, which included US$3.7 billion of Onshore US drilling and development expenditure. We continued to realise significant improvements in shale drilling efficiency during the period as spud to sales timing in the Black Hawk improved by 17 per cent and drilling costs declined by 19 per cent to US$3.4 million per well.
| | | | | | | | | | | | | | | | | | | | | | |
| 2015 financial year | | Liquids focused areas | | | Gas focused areas | | | | |
(2014 financial year) | | Eagle Ford | | | Permian | | | Haynesville | | | Fayetteville | | | Total | |
Capital expenditure (i) | | US$ billion | | | 2.3 (3.1) | | | | 0.8 (0.5) | | | | 0.4 (0.4) | | | | 0.2 (0.2) | | | | 3.7 (4.2) | |
Rig allocation | | At period-end | | | 7 (17) | | | | 3 (4) | | | | 0 (3) | | | | 0 (0) | | | | 10 (24) | |
| Net wells drilled and completed (ii) | | Period total | | | 188 (262) | | | | 45 (43) | | | | 25 (38) | | | | 45 (71) | | | | 303 (414) | |
Net productive wells (iii) | | At period-end | | | 836 (647) | | | | 75 (57) | | | | 395 (899) | | | | 1,070 (1,023) | | | | 2,376 (2,626) | |
| (i) | Includes land acquisition, site preparation, drilling, completions, well site facilities, mid-stream infrastructure and pipelines. |
| (ii) | Can vary between periods based on changes in rig activity and the inventory of wells drilled but not yet completed at period-end. |
| (iii) | Change in productive well count includes reduction associated with the divestment of assets in North Louisiana (Haynesville) and Pecos (Permian). |
Petroleum exploration expenditure for FY2015 was US$567 million, of which US$481 million was expensed. Activity for the period was largely focused on the Gulf of Mexico, Western Australia and Trinidad and Tobago.
Potash recorded an Underlying EBIT loss of US$184 million in FY2015 compared to a loss of US$285 million in FY2014. The reduction in loss was driven by a decrease in non-cash costs and exploration expenditure.
Outlook
Petroleum production is forecast to decrease by seven per cent in FY2016 to 237 MMboe (Conventional: 125 MMboe; Onshore US: 112 MMboe). In Onshore US, further improvements in drilling and completions efficiency will support stable volumes in the liquids-rich Black Hawk and Permian despite lower capital spend in FY2016. However, we anticipate a 19 per cent decline in the combined production of the predominantly gas-rich, and currently lower-margin Haynesville, Fayetteville and Hawkville fields as we continue to defer development of these assets for longer-term value. Conventional volumes are expected to decrease as a result of planned maintenance programs and natural field decline.
In FY2016, we expect to reduce drilling costs further to US$2.5 million per well in the Black Hawk. In our Conventional business, investment remained focused on high-return infill drilling opportunities in the Gulf of Mexico and life extension projects at Bass Strait and North West Shelf.
Petroleum capital expenditure of approximately US$3.1 billion is planned in FY2016. Onshore US capital expenditure is expected to account for US$1.5 billion of this and support a development program of nine operated rigs. Completions activity will continue to be tailored to market conditions and we will exercise further flexibility should there be greater value in deferral. Drilling activity will be focused on our liquids-rich Black Hawk and Permian acreage with our dry-gas development program in Haynesville and Fayetteville deferred for longer-term value.
A US$600 million exploration program, largely focused on acreage access and seismic data acquisition is planned for FY2016.
During February 2015, BHP Billiton signed an agreement with Tri-Resources, a subsidiary of the Hashoo Group, for the sale of our gas business in Pakistan. The transaction is subject to regulatory approval.
The excavation and lining of the Jansen Potash project shafts is steadily progressing and the pre-development project was 46 per cent complete at the end of the period. We expect to spend approximately US$350 million in FY2016. With our investment premised on the attractive longer-term market fundamentals for potash, we will continue to review the appropriate pace and level of development activity and capital expenditure for the project.
1.12.3 Copper Business
Our Copper Business, headquartered in Santiago, Chile, is one of the world’s leading producers of copper concentrate and cathode, uranium oxide, and a producer of zinc concentrate. Our portfolio of mining operations includes the Escondida mine in Chile, a leading producer of copper, and Olympic Dam in South Australia, a major producer of copper and uranium oxide.
Results
| | | | | | | | | | | | |
Year ended 30 June (1) | | 2015
US$M | | | 2014
US$M
Restated | | | 2013
US$M
Restated | |
| | | |
Revenue | | | 11,453 | | | | 12,789 | | | | 13,172 | |
Underlying EBIT | | | 3,353 | | | | 4,668 | | | | 5,033 | |
Capital expenditure | | | 3,822 | | | | 3,697 | | | | 3,891 | |
Net operating assets | | | 23,701 | | | | 21,997 | | | | 19,868 | |
Production – copper (kt) | | | 1,708 | | | | 1,727 | | | | 1,689 | |
| (1) | Information included in this table excludes Cannington given it formed part of the South32 demerger. The financial results for FY2013 and FY2014 have been restated to exclude Cannington. |
A summary of the assets and operations, development projects and FY2015 performance of our Copper Business is presented as follows.
Description of the Copper Business
Our assets consist of the following:
Escondida (Chile)
Our 57.5 per cent owned and operated Escondida mine is a leading producer of copper. Located in the Atacama Desert in northern Chile, Escondida employs approximately 12,000 operational employees and contractors and has the capacity to move in excess of 1.3 million tonnes (Mt) of material per day. Its two open-cut pits currently feed three concentrator plants, which use grinding and flotation technologies to produce copper concentrate, as well as two leaching operations (oxide and sulphide). In FY2015, total Escondida production was 916.1 kilotonnes (kt) of payable copper in concentrate and 310.4 kt of copper cathode.
Pampa Norte (Chile)
Pampa Norte consists of two wholly owned operations in the Atacama Desert in northern Chile – Spence and Cerro Colorado. During FY2015, Spence produced 171.4 kt of high-quality copper cathode, using oxide and sulphide ore treatment through leaching, solvent extraction and electrowinning processes. Although production levels at Cerro Colorado have fallen in recent years as grades have declined, production in FY2015 reached 78.2 kt of copper cathode. A project currently being studied, referred to as the Spence Growth Option (SGO), is being conducted to consider exploiting the large and expandable hypogene resource with associated molybdenum sulphide by building a 95 kilotonnes per day (ktpd) concentrator at the Spence operation. SGO would extend the mine life by approximately 50 years beyond the current CY2025 closure date.
Antamina (Peru)
We own 33.75 per cent of Antamina, a large, low-cost copper and zinc mine in north central Peru. Antamina’s total production for FY2015 was 107.7 kt of copper in concentrate and 66.4 kt of zinc in concentrate. Antamina also produces molybdenum and lead/bismuth concentrate, as well as small amounts of silver in the form of by-products.
In FY2015, following the identification of a number of debottlenecking opportunities, Antamina successfully increased nominal milling capacity to 53 million tonnes per annum (Mtpa).
Olympic Dam (Australia)
Our wholly owned Olympic Dam mine is a producer of copper cathode and uranium oxide and a refiner of gold and silver bullion. The site includes an underground mine, where the primary method of ore extraction islong-hole open stoping with cemented aggregate fill, and an integrated metallurgical processing plant.
The underground mine extracts copper uranium ore and hauls the ore by an automated train and trucking network feeding underground crushing, storage and ore hoisting facilities. The processing plant consists of two grinding circuits in which high-quality copper concentrate is extracted from sulphide ore through a flotation extraction process. The operation includes a fully integrated metallurgical complex with a grinding and concentrating circuit, a hydrometallurgical plant incorporating solvent extraction circuits for copper and uranium, a copper smelter, a copper refinery and a recovery circuit for precious metals.
The Svedala mill, which accounts for approximately 60 per cent of Olympic Dam’s production, experienced an electrical failure in January 2015. Repairs were completed by June 2015 and the mill is now operating at full capacity.
In FY2015, Olympic Dam produced 124.5 kt of copper cathode, 3.1 kt of uranium oxide, 104.8 kilo-ounces (koz) of refined gold and 724 koz of refined silver.
More information on our assets and operations is presented in section 2.1.2 of this Annual Report.
Development projects in execution at year-end
Escondida
The Organic Growth Project 1 (OGP1) is a new concentrator with a 152 ktpd plant. We expect this project to provide additional processing capacity and allow access to higher-grade ore. OGP1 was approved in February 2012 with budgeted expenditure of US$3.8 billion (US$2.2 billion BHP Billiton share). A US$361 million increase in the budget of OGP1 to US$4.2 billion (US$ 2.4 billion BHP Billiton share) was approved in October 2014 following challenges associated with contractor’s progress. The Project was completed in May 2015 and is currently in the commissioning and ramp-up phase.
The Escondida Water Supply (EWS) project was approved in July 2013 and consists of a new 2,500 litres per second sea water desalination facility. This project will provide an alternative water supply to Escondida, as water usage increases upon completion of the 152 ktpd OGP1 copper concentrator. Construction of the new desalination facility commenced in July 2013 and includes the development of two pipelines, four high-pressure pump stations, a reservoir at the mine site and high-voltage infrastructure to support the system. The new facility is expected to be commissioned in CY2017 at a cost of US$3.4 billion (US$2.0 billion BHP Billiton share).
The Oxide Leach Area Project (OLAP) was completed in November 2014. The Project involved the creation of a new dynamic leaching pad and mineral handling system that included several overland conveyors. The new pad is expected to maintain oxide leaching capacity at current levels. OLAP was approved in February 2012 with budgeted expenditure of US$721 million (US$414 million BHP Billiton share) and a US$212 million increase in the budget of OLAP to US$933 million (US$536 million BHP Billiton share) was approved in March 2014. Expected final cost is US$899 million (US$517 million BHP Billiton share).
More information on our development projects is presented in section 2.4 of this Annual Report.
Exploration activities
Our greenfield copper exploration activities during FY2015 were focused on advancing targets within Chile, Peru and southwestern United States. Greenfield activities include opportunity identification, application for and acquisition of mineral title, early reconnaissance operations and drilling programs.
Performance
Total copper production, including our proportional share of production for which profit is derived from our equity accounted investments for FY2015 was unchanged at 1.7 Mt. Escondida copper production increased by six per cent to 1.23 Mt as an 11 per cent improvement in truck utilisation and higher grades more than offset the impact of severe wet weather, water restrictions, industrial action and a power outage throughout northern Chile. Pampa Norte copper production increased by seven per cent to 250 kt as Spence benefited from higher recoveries. Olympic Dam copper production decreased by 32 per cent to 125 kt following an electrical failure which caused a mill outage in January 2015. Antamina copper production decreased by 25 per cent to 108 kt as lower grades more than offset record mill throughput.
Copper revenue decreased by US$1.3 billion to US$11.5 billion. The decrease was across all operations with revenue for Escondida decreasing by three per cent to US$7.8 billion, revenue at Olympic Dam decreased 30 per cent to US$1.2 billion and revenue at Pampa Norte decreased 20 per cent to US$1.4 billion.
Underlying EBIT for FY2015 decreased by US$1.3 billion to US$3.4 billion. Price impact net of price-linked costs for Copper reduced Underlying EBIT by US$1.6 billion due to lower average realised prices for copper
from US$3.22/lb to US$2.78/lb. The increase in non-cash costs of US$839 million largely reflects increased ore mined resulting in higher depletion of stripping capitalised in previous periods in line with mine plans at Escondida; increased depreciation following the completion of OLAP; and a US$199 million impairment driven by a lower copper price and permitting uncertainty for the proposed mine life extension at Cerro Colorado. In contrast, a stronger US dollar against the Chilean peso and Australian dollar increased Underlying EBIT by US$359 million. Productivity cost efficiencies increased Underlying EBIT additionally by US$1.0 billion driven by improved productivity at Escondida and improved ore grades.
Unit cash costs is one of the financial measures used to monitor the performance of our individual assets.
Unit cash costs (excluding one-off items, freight and treatment and refining charges) at our operated copper assets declined by 14 per cent during FY2015. At Escondida, the improvement in truck utilisation and significant costs savings resulted in an eight per cent decrease to US$1.07 per pound. The excluded one-off costs primarily reflect the implementation of the Escondida voluntary redundancy program which is expected to reduce employee head count by more than 20 per cent.
Outlook
Total copper production is forecast to decrease by 12 per cent in FY2016 to 1.5 Mt. Escondida copper production of approximately 940 kt is forecast as increased throughput, enabled by the completion of OGP1 and further productivity improvements, partly offset an anticipated 27 per cent decline in grade. Pampa Norte production is forecast to remain at a similar level for FY2016. At Olympic Dam, an increase in full-year production is anticipated following the full ramp-up of the mill at the end of July 2015. Higher average copper grades at Antamina are expected to support an increase in copper volumes in FY2016.
During FY2015, OLAP delivered first production while OGP1 achieved mechanical completion and is now in the commissioning phase. The commissioning of the EWS project remains on schedule to commence in CY2017. In the medium term, completion of the EWS project and the life extension of Los Colorados will allow the use of three concentrators at Escondida to offset grade decline and support a strong recovery in production. At Olympic Dam, we will continue with our low-cost underground transition into the higher-grade Southern Mining Area. This high-grade ore will release latent capacity within our existing operations and lay the foundation for the longer-term underground expansion.
In FY2016, despite an anticipated increase in material moved to mitigate grade decline, a further step change in unit cost performance is expected as additional benefits from our productivity agenda are realised. In this context, Escondida unit costs are expected to decline by 15 per cent to US$0.91 per pound on a grade-adjusted basis.
1.12.4 Iron Ore Business
Our Iron Ore Business, headquartered in Perth, Australia, is one of the leading iron ore producers in the world. We sell lump and fines products produced in Australia and produce pellets from our operations in Brazil.
Results
| | | | | | | | | | | | |
Year ended 30 June | | 2015
US$M | | | 2014
US$M | | | 2013
US$M | |
| | | |
Revenue | | | 14,753 | | | | 21,356 | | | | 18,593 | |
Underlying EBIT | | | 6,932 | | | | 12,102 | | | | 11,109 | |
Capital expenditure | | | 1,930 | | | | 2,949 | | | | 5,979 | |
Net operating assets | | | 23,954 | | | | 23,390 | | | | 22,126 | |
Production – iron ore (Mt) | | | 233 | | | | 204 | | | | 170 | |
A summary of the assets, development projects and FY2015 performance of our Iron Ore Business is presented as follows.
Description of the Iron Ore Business
Our assets consist of the following:
Western Australia Iron Ore (Australia)
Operations at Western Australia Iron Ore (WAIO) involve an integrated system of mines and more than 1,000 kilometres of rail infrastructure and port facilities in the Pilbara region of northern Western Australia, with our headquarters located in Perth. Our focus is to safely maximise output through operating our mines and utilising available infrastructure at our disposal.
Since 2001, we have expanded our WAIO operations in response to increasing demand for iron ore, particularly from China. We have completed eight expansion projects during this period to increase our mine, rail and port capacity. This includes our plan to continue to grow production following the recent completion of a number of expansion projects and ongoing debottlenecking of the supply chain to underpin potential further growth in capacity to 290 Mtpa (100 per cent basis). Our share of FY2015 production was 218.0 Mt of ore, which is expected to increase in FY2016 to 233 Mtpa.
Our Pilbara reserve base is relatively concentrated, allowing us to plan our development around a series of integrated mining hubs joined to the orebodies by conveyors or spur lines. This approach enables us to maximise the value of installed infrastructure by using the same processing plant and rail infrastructure for a number of orebodies.
Lump and fines products are sold to steel mills in China, South Korea, Japan, Singapore, Hong Kong, Taiwan, Switzerland and Australia under long-term and short-term contracts. Contract prices are generally linked to market indices.
In order to establish a consistent, long-term, high-quality lump ore product with a stable grade, we produce a blended lump product. The product is a blend of lump ores produced from the Newman, Area C and Jimblebar mining areas, known as Newman Blend lump. During FY2015, 23 per cent of our sales were lump and 77 per cent were fines.
Our WAIO operations consist of four main joint ventures: Mt Newman, Yandi, Mt Goldsworthy and Jimblebar. Our interest in the joint ventures is 85 per cent, with Mitsui and ITOCHU owning the remaining 15 per cent. The joint ventures are unincorporated, except Jimblebar.
The Mt Newman Joint Venture (JV) consists of a number of orebodies joined by conveyors and spur lines to a mining hub at Mt Whaleback. Ore is crushed, beneficiated (where necessary) and blended to create lump and fines products. The ore is then transported to port using Mt Newman JV-owned rail facilities. The Yandi JV comprises the Yandi mine where ore is crushed and screened and then transported by rail on the Newman main line. The Mt Goldsworthy JV consists of the Area C mine in the central Pilbara and the Yarrie mine in northern Pilbara. Ore is crushed and screened at Area C and transported by rail to Port Hedland. Production at the Yarrie mine in the northern Pilbara has been suspended since 25 February 2014, following improved productivity at our other mining operations. The Jimblebar operation comprises the Jimblebar mine, located 40 kilometres east of Newman. Jimblebar delivered first production in the September 2013 quarter and produced 16.8 Mt during FY2015. The Jimblebar mining hub ramped-up to a production rate exceeding 45 Mtpa during FY2015.
Our rail operations are controlled from Perth via our integrated remote operations centre, which co-locates rail control, port production control, mine dispatch control and mine fixed plant control.
Our port facilities are located on both sides of the harbour at Port Hedland. These facilities consist of Nelson Point, owned by the Mt Newman JV, and Finucane Island, owned by the Mt Goldsworthy JV. The port facilities include five ore car dumpers, three lump rescreening plants, eight stackers, five reclaimers, stock and blending yards, and eight ship loaders.
Map of Western Australia Iron Ore
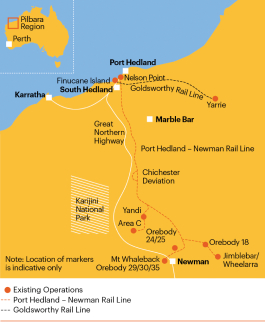
Samarco (Brazil)
We are a 50–50 joint venture partner with Vale at the Samarco operation in Brazil. Samarco currently comprises a mine and three concentrators located in the state of Minas Gerais, and four pellet plants and a port, located in Anchieta in the state of Espirito Santo. Three 400-kilometre pipelines connect the mine site to the pelletising facilities.
Samarco’s main product is iron ore pellets. Extraction and beneficiation of iron ore are conducted at the Germano facilities in the municipalities of Mariana and Ouro Preto. Conveyor systems are used to extract the ore and convey it from the mines. Ore beneficiation then occurs in concentrators, where crushing, milling, desliming and flotation processes produce iron concentrate. The concentrate leaves the concentrators as slurry and is pumped through the slurry pipelines from the Germano facilities to the pellet plants in Ubu, Anchieta, where the slurry is processed into pellets. The iron ore pellets are then heat treated. The pellet output is stored in a stockpile yard before being shipped out of the Samarco-owned Port of Ubu in Anchieta.
Pellets are independently marketed by Samarco and sold to steelmakers in 19 countries, with prices generally linked to market indices.
In FY2015, our share of production was 14.5 Mt of pellets.
More information on our assets and operations is presented in section 2.1.3 of this Annual Report.
Development projects in execution at year-end
Western Australia Iron Ore
WAIO has been executing a number of expansion projects in recent years. These projects, approved in March 2011 for a total of US$7.4 billion (US$6.6 billion BHP Billiton share) plus pre-commitment funding of US$2.3 billion (US$2.1 billion BHP Billiton share), were designed to deliver an integrated operation with a minimum capacity of 220 Mtpa (100 per cent basis).
These projects, each of which is substantially complete, included:
the Jimblebar Mine Expansion project to develop the Jimblebar mine and rail links, and procure mining equipment and rolling stock in order to deliver a capacity of 35 Mtpa. The project costs as at 30 June 2015 amounted to US$3.5 billion (BHP Billiton share). Final costs are expected to be delivered below the revised budget of US$3.6 billion;
further development of Port Hedland, including two additional berths and ship loaders, a car dumper, connecting conveyor route, and associated rail works and rolling stock. The project costs as at 30 June 2015 amounted to US$1.8 billion (BHP Billiton share). Final costs are expected to be delivered below the revised budget of US$1.9 billion;
port blending facilities and rail yards to enable ore blending. The project costs as at 30 June 2015 amounted to US$0.9 billion (BHP Billiton share). Final costs are expected to be delivered below the revised budget of US$1.0 billion.
Our plan to continue to grow production following the recent completion of a number of expansion projects includes ongoing debottlenecking of the supply chain to underpin potential further growth in capacity to 290 Mtpa (100 per cent basis).
Western Australia Iron Ore – Orebody 24 mine
In FY2014, WAIO completed execution of its development of the Orebody 24 mine, located approximately 10 kilometres northeast of Newman. Orebody 24 is a sustaining mine to maintain iron ore production output from the Mt Newman JV operations. The project costs as at 30 June 2015 amounted to US$0.6 billion (BHP Billiton share). Final costs are expected to be delivered below the revised budget of US$0.7 billion.
More information on our development projects is presented in section 2.4 of this Annual Report.
Exploration activities
Western Australia
WAIO has a substantial existing reserve base supported by considerable additional mineralisation, all within a 250-kilometre radius of our existing infrastructure. This concentration of orebodies also gives WAIO the flexibility to add growth tonnes to existing hub infrastructure and link brownfield developments to our existing mainline rail and port facilities. The total area covered by exploration and mining tenure amounts to 6,500 square kilometres, excluding crown leases and general purpose and miscellaneous licences, which are used for infrastructure space and access.
Total exploration expenditure in FY2015 amounted to US$118 million.
Guinea Iron Ore
BHP Billiton has a 41.3 per cent interest in a joint venture that holds the Nimba Mining Concession and four iron ore prospecting permits in southeast Guinea.
On 29 July 2014, BHP Billiton and ArcelorMittal signed an agreement for the acquisition by ArcelorMittal of BHP Billiton’s 43.5 per cent stake in Euronimba Limited, American Depositary Receipts (ADRs)which holds an effective 95 per cent interest in the Mount Nimba iron ore project in Guinea. In May 2015, ArcelorMittal terminated the transaction following failure to meet the conditions to closing by the agreed deadline. We will continue to assess our options for the Mount Nimba iron ore project.
Liberia Iron Ore
BHP Billiton has a 100 per cent interest in a Mineral Development Agreement with the Government of Liberia. This enables the further exploration and development of our Liberian iron ore mineral leases.
On 25 August 2014, BHP Billiton and Cavalla Resources signed a sale and purchase agreement for the acquisition by Cavalla Resources of BHP Billiton’s 100 per cent interest in its Liberia iron ore project. Completion of the transaction remains subject to the receipt of regulatory approval and other customary closing conditions.
Performance
Total iron ore production, including our proportional share of production for which profit is derived from our equity accounted investments, increased by 14 per cent in FY2015 to a record 233 Mt. WAIO production increased by 13 per cent to a record 254 Mt (100 per cent basis) as a result of continued improvement in the performance of our integrated supply chain and the successful ramp-up of the Jimblebar mining hub. Continued optimisation of the port facilities and an increase in direct to ship ore resulted in record sales volumes at WAIO of 256 Mt (100 per cent basis). Samarco production increased by 33 per cent to 29 Mt (100 per cent basis) as the fourth pellet plant ramped up to full capacity.
Iron Ore revenue decreased by US$6.6 billion to US$14.8 billion, which included a 31 per cent decrease in revenue for WAIO of US$6.4 billion to US$14.4 billion. The major contributor to this decline was a 41 per cent decline in average realised price of iron ore to US$61 per wet metric tonne (FOB), which was partially offset by an increase in WAIO sales volumes.
Underlying EBIT for FY2015 decreased by US$5.2 billion to US$6.9 billion. The fall in the average realised price of iron ore reduced Underlying EBIT by US$8.7 billion, net of price-linked costs, although this was partially offset by a weaker Australian dollar, which increased Underlying EBIT by US$499 million. The improved performance of our integrated supply chain at WAIO and the successful ramp-up of the Jimblebar mining hub supported an increase of US$1.9 billion volume impact to Underlying EBIT. Cost efficiencies from productivity initiatives increased Underlying EBIT by US$1.2 billion.
Unit cash costs is one of the financial measures used to monitor the performance of our individual assets.
WAIO unit cash costs (excluding freight and royalties) declined by 31 per cent to US$19 per tonne, underpinned by reductions in labour, contractor and maintenance costs, lower diesel prices and a stronger US dollar against the Australian dollar.
Outlook
Total iron ore production is forecast to increase by six per cent in FY2016 to 247 Mt. WAIO production is forecast to increase to approximately 270 Mt (100 per cent basis) as a result of improved efficiency at Mining Area C, Newman and our rail and port operations.
Further productivity improvements and the low-cost expansion of the Jimblebar mining hub, which comprises the installation of a new primary crusher and additional conveying capacity, are expected to deliver an increase in system capacity to 290 Mtpa (100 per cent basis) over time.
Costs associated with the Jimblebar expansion, as well as the investment to purchase additional tugs and construct a new tug harbour at Port Hedland, are expected to be included within WAIO’s average sustaining capital expenditure budget of approximately US$5 per tonne. WAIO unit costs are expected to fall to US$15 per tonne in FY2016.
1.12.5 Coal Business
Our Coal Business, headquartered in Brisbane, Australia, is the world’s largest supplier of seaborne metallurgical coal, a key input in steel production. Our Coal Business is also a large supplier of seaborne energy coal (also known as thermal or steaming coal) and a domestic energy coal supplier in the countries where our mines are located.
Results
| | | | | | | | | | | | |
Year ended 30 June (1) | | 2015
US$M | | | 2014
US$M
Restated | | | 2013
US$M
Restated | |
| | | |
Revenue | | | 5,885 | | | | 6,563 | | | | 6,574 | |
Underlying EBIT | | | 348 | | | | 575 | | | | 424 | |
Capital expenditure | | | 729 | | | | 1,971 | | | | 3,136 | |
Net operating assets | | | 11,769 | | | | 11,909 | | | | 10,632 | |
Production – metallurgical coal (Mt) | | | 43 | | | | 38 | | | | 30 | |
Production – energy coal (Mt) | | | 41 | | | | 43 | | | | 41 | |
| (1) | Information included in this table excludes Energy Coal South Africa and Illawarra Coal given they formed part of the South32 demerger. The numbers for FY2013 and FY2014 have been restated to exclude Energy Coal South Africa and Illawarra Coal. |
A summary of the assets, development projects and FY2015 performance of our Coal Business is presented as follows.
Description of the Coal Business
Our assets comprise the following:
Queensland Coal (Australia)
Queensland Coal comprises the BHP Billiton Mitsubishi Alliance (BMA) and BHP Billiton Plc ADRs tradeMitsui Coal (BMC) Assets in the Bowen Basin in Central Queensland, Australia.
The Bowen Basin is well positioned to supply the seaborne market because of its high-quality metallurgical coals, which are ideally suited to efficient blast furnace operations, and its geographical proximity to Asian customers. We have access to key infrastructure in the Bowen Basin, including a modern, multi-user rail network, and our own coal loading terminal at Hay Point, located near the city of Mackay. We also have contracted capacity at three other multi-user port facilities, including the Port of Gladstone (RG Tanna Coal Terminal), Dalrymple Bay Coal Terminal and Abbot Point Coal Terminal.
Map of Queensland Coal
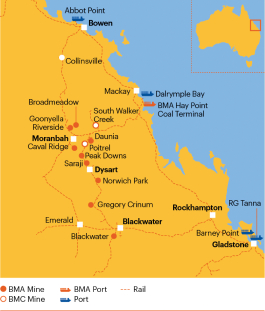
BHP Billiton Mitsubishi Alliance – BMA owns and operates open-cut and underground metallurgical coal mines in the Bowen Basin, and also owns and operates the Hay Point Coal Terminal. We share 50–50 ownership with Mitsubishi Development. BMA operates the Goonyella Riverside, Broadmeadow, Daunia, Caval Ridge, Peak Downs, Saraji, Gregory Crinum and Blackwater mines. Our share of total production in FY2015 was 33.9 Mt. During FY2015, BMA announced the ramping down of the Crinum underground mine as it approaches the end of its economic reserve life, with longwall production expected to cease in the March 2016 quarter.
BHP Billiton Mitsui Coal – BMC is a subsidiary company owned by BHP Billiton (80 per cent) and Mitsui and Co (20 per cent). BMC owns and operates South Walker Creek and Poitrel, both open-cut metallurgical coal mines in the Bowen Basin. Total production in FY2015 was 8.7 Mt.
New Mexico Coal (United States)
We own and operate the San Juan energy coal mine located in the US state of New Mexico. The mine transports its production directly to the nearby San Juan Generating Station (SJGS). Production for FY2015 was 5.1 Mt.
To ensure the ongoing supply of coal to the SJGS beyond 2017, in May 2015, the SJGS owners reached an in principle agreement for a new Coal Supply Agreement with Westmoreland Coal Company. In conjunction with this, in July 2015, New Mexico Coal executed a sales agreement with Westmoreland for the purchase of the San Juan Mine. Subject to regulatory approval, the transaction is expected to be completed at the end of CY2015 with Westmoreland assuming full operation of the mine from 1 January 2016.
We also operate the nearby Navajo mine, located on Navajo Nation land in New Mexico. Full ownership of the Navajo Coal Company transferred to the Navajo Transitional Energy Company (NTEC), an entity of the Navajo Nation, effective 30 December 2013. New Mexico Coal and NTEC have entered into a Mine Management Agreement where New Mexico Coal will continue as mine operator until 31 December 2016, at which time
control will pass to a new mine manager. Navajo mine transports its production directly to the nearby Four Corners Power Plant. Production for FY2015 was 4.9 Mt. As we retain control of the mine until full consideration is paid, production continues to be reported by the Group.
New South Wales Energy Coal (Australia)
Our wholly owned New South Wales Energy Coal Asset owns and operates the Mt Arthur Coal open-cut energy coal mine in the Hunter Valley region of New South Wales, Australia.
New South Wales Energy Coal produced 19.7 Mt in FY2015.
Cerrejón (Colombia)
We have a one-third interest in Cerrejón, which owns, operates and markets one of the world’s largest open-cut export energy coal mines, located in the La Guajira province of Colombia.
In FY2015, our share of Cerrejón production was approximately 11.3 Mt.
More information on our assets and operations is presented in section 2.1.4 of this Annual Report.
Completed development projects
Cerrejón P40 Project
In August 2011, we announced a US$437 million (BHP Billiton share) investment in the expansion of Cerrejón, known as the P40 Project, which is expected to increase Cerrejón’s thermal coal production by 8 Mtpa to approximately 40 Mtpa (100 per cent basis). The project scope includes a second berth and dual quadrant ship loader at Cerrejón’s 100 per cent owned and operated Puerto Bolivar, along with necessary mine, rail and associated supply chain infrastructure. Construction commenced in CY2011 and the project handled its first coal in the December 2013 quarter. However, operational issues are expected to constrain capacity to approximately 35 Mtpa (100 per cent basis) in the medium term. The final cost was US$376 million (BHP Billiton share) and the project was completed during the December 2014 quarter.
Development projects in execution at year-end
Hay Point Coal Terminal Expansion Stage 3
In March 2011, we approved the third expansion of the Hay Point Coal Terminal. The expansion of the terminal will deliver an additional 11 Mt of annual port capacity (100 per cent basis). The project investment has a budget of US$1.5 billion (BHP Billiton share). In January 2015, first coal was loaded through the expanded terminal and the project was 97.6 per cent complete at 30 June 2015.
Newcastle Port Third Phase Expansion
In August 2011, we announced a US$367 million (BHP Billiton share) investment in the third stage development of the Newcastle Coal Infrastructure Group’s coal handling facility in Newcastle. The port expansion project is expected to increase total capacity at the coal terminal from 53 Mtpa to 66 Mtpa. This is expected to increase New South Wales Energy Coal’s allocation by 4.6 Mtpa to 19.2 Mtpa. First coal on ship, being the first ship loaded through the new facility, was achieved in June 2013, ahead of schedule. At 30 June 2015, the project was 99.5 per cent complete.
IndoMet Coal Project
IndoMet Coal comprises seven coal contracts of work covering a large metallurgical coal resource in Central and East Kalimantan, Indonesia, which was discovered by BHP Billiton in the 1990s. Following an assessment of the importance of local participation in developing the project, in 2010 we sold a 25 per cent interest in the project to a subsidiary of PT Adaro Energy TBK. We retain 75 per cent of the project and hold management responsibility.
During FY2015, IndoMet completed infrastructure development and received an operating permit to commence mining at Haju mine. Production is expected to commence from the 1 Mtpa Haju mine in Indonesia during FY2016.
More information on our development projects is presented in section 2.4 of this Annual Report.
Performance
Metallurgical coal production increased by 13 per cent in FY2015 to a record 43 Mt. Record production and sales volumes at Queensland Coal were supported by the successful ramp-up of the Caval Ridge mine and continued productivity improvements. An increase in equipment and wash-plant utilisation rates underpinned record volumes at six other operations.
Energy coal production, including our proportional share of production for which profit is derived from our equity accounted investments, for FY2015 decreased by five per cent to 41 Mt as anticipated. Lower production reflected drought conditions and the need to manage dust emissions at Cerrejón, as well as reduced demand for our Navajo Coal product.
Coal revenue for FY2015 decreased by US$678 million to US$5.9 billion. The decrease in revenues was driven by a 20 per cent reduction in the average realised price for hard coking coal to US$105/t, a 21 per cent reduction in the average price received for weak coking coal to US$88/t and a 22 per cent reduction in the average realised price for thermal coal to US$58/t.
Underlying EBIT for FY2015 decreased by US$227 million to US$348 million. The price impact, net of price-linked costs, on Underlying EBIT for FY2015 was a decrease of US$1.0 billion. This was partially offset by a stronger US dollar against the Australian dollar, which increased Underlying EBIT by US$406 million, and productivity cost efficiencies which increased Underlying EBIT by US$418 million.
Unit cash costs is one of the financial measures used to monitor the performance of our individual assets.
Queensland Coal unit cash costs (excluding freight and royalties) declined by 23 per cent to US$65 per tonne, supported by increased equipment and wash-plant utilisation rates, a continued reduction in labour, contractor and maintenance costs and a favourable currency movement.
Outlook
Metallurgical coal production is forecast to decrease in FY2016 to 40 Mt as operations at Crinum are expected to cease in the first quarter of CY2016 as the mine approaches the end of its economic reserve life. Energy coal production is forecast to remain broadly unchanged in FY2016 at 40 Mt.
In FY2016, unit costs are expected to decline to US$61 per tonne as the benefits from embedded productivity initiatives and a stronger US dollar, more than offset the removal of low-cost Crinum volumes and the expenses associated with its closure.
1.12.6 Other assets
Our Other assets include the following:
Nickel West (Australia)
Our wholly owned Nickel West Asset in Western Australia consists of an integrated system of mines, concentrators, a smelter and a refinery. Nickel West production in FY2015 was 89.9 kt of contained nickel. On 31 October 2013, production at the Nickel West Leinster Perseverance underground mine was suspended following a significant seismic event. A subsequent review of the incident determined it was unsafe to resume operations.
Performance
Revenue for Nickel West decreased by 13 per cent to US$1.4 billion predominantly due to lower sales volumes.
Underlying EBIT for Nickel West increased by US$134 million due to cost efficiencies and a favourable exchange rate movement, which was partially offset by a movement in ceased and sold operations from the closure of the Nickel West Leinster Perseverance underground mine during FY2014.
More information on our assets and operations is presented in section 2.1.5 of this Annual Report.
1.13 Our people
Enabling our organisation to realise its potential through our people is fundamental to our success. We are focused on facilitating a culture where our employees are provided with opportunities to develop, are valued and are encouraged to contribute toward making work safer, simpler and more productive. Achieving this in a focused and collaborative way will mean we can deliver greater value to our shareholders.
1.13.1 Employees and contractors
Our Charter enables us to align our people around a common purpose and values, as well as provide clear guidance for how we do business and the way in which we work, wherever we are based in the world.
The table below provides the average number of employees and contractors over the last three financial years.
| | | | | | | | | | | | | | | | |
Year ended 30 June | | 2015 | | | 2015 | | | 2014 (b) | | | 2013 (b) | |
| | | Continuing
operations (a) | | | Discontinued
operations (a) | | | | | | | |
Employees | | | 29,670 | | | | 13,159 | | | | 47,044 | | | | 46,892 | |
Contractors | | | 50,698 | | | | 13,352 | | | | 76,759 | | | | 79,330 | |
| | | | | | | | | | | | | | | | |
Total | | | 80,368 | | | | 26,511 | | | | 123,803 | | | | 126,222 | |
| | | | | | | | | | | | | | | | |
The table below shows the gender composition of our workforce, senior leaders and the Board over the last three financial years.
| | | | | | | | | | | | | | | | |
Year ended 30 June | | 2015 | | | 2015 | | | 2014 (b) | | | 2013 (b) | |
| | | Continuing
operations (a) | | | Discontinued
operations (a) | | | | | | | |
Male employees | | | 24,487 | | | | 11,331 | | | | 39,517 | | | | 38,920 | |
Female employees | | | 5,183 | | | | 1,828 | | | | 7,527 | | | | 7,972 | |
Female employees (%) | | | 17 | | | | 14 | | | | 16 | | | | 17 | |
Male senior leaders (c) | | | 293 | | | | 85 | | | | 317 | | | | 326 | |
Female senior leaders (c) | | | 62 | | | | 19 | | | | 55 | | | | 40 | |
Female senior leaders (%) | | | 17 | | | | 18 | | | | 15 | | | | 11 | |
Male Board members | | | 10 | | | | | | | | 12 | | | | 11 | |
Female Board members (d) | | | 2 | | | | | | | | 2 | | | | 2 | |
Female Board members (%) | | | 17 | | | | | | | | 14 | | | | 15 | |
| (a) | For a description of the South32 demerger and reporting of Continuing and Discontinued operations, see sections 1.3.7, 1.6.4, and 2.1.7 of this Annual Report and note 29 ‘Discontinued operations’ to the Financial Statements. |
| (b) | These figures have not been restated for the purposes of the South32 demerger or reporting of Continuing and Discontinued operations. |
| (c) | For UK law purposes, we are required to show information for ‘senior managers’, which is defined to include both senior leaders and any persons who are directors of any subsidiary company even if they are not senior leaders. In FY2015, 355 senior leaders comprise the top people in the organisation. There are 50 directors of subsidiary companies who are not senior leaders, comprising 36 males and 14 females. Therefore, for UK law purposes, the total number of senior managers is 329 males and 76 females (19 per cent female). |
| (d) | For information relating to changes to the Board following year-end please refer to section 3.1 of this Annual Report. |
The tables below provide a breakdown of the average number of employees across the Group, in accordance with our reporting requirements under the UK Companies Act 2006. The calculation includes the Executive Director, 100 per cent of employees of subsidiary companies, and our share of joint operations, for each of the past three financial years. Employees of equity accounted entities are not included. Part-time employees are included on a full-time equivalent basis. Employees of businesses acquired or disposed of during a particular year are included for the period of ownership. Contractors are not included.
| | | | | | | | | | | | |
Year ended 30 June | | 2015 | | | 2014 (a) | | | 2013 (a) | |
Average number of employees for Continuing operations | | | | | | | | | | | | |
Petroleum and Potash | | | 4,224 | | | | 4,207 | | | | 4,449 | |
Copper | | | 9,138 | | | | 9,414 | | | | 9,765 | |
Iron Ore | | | 7,483 | | | | 8,035 | | | | 6,883 | |
Coal | | | 5,579 | | | | 6,160 | | | | 6,006 | |
Group and unallocated | | | 3,246 | | | | 3,687 | | | | 4,054 | |
| | | | | | | | | | | | |
Total average number of employees for Continuing operations | | | 29,670 | | | | 31,503 | | | | 31,157 | |
| | | | | | | | | | | | |
Total average number of employees from Discontinued operations | | | 13,159 | | | | 15,541 | | | | 15,735 | |
| | | | | | | | | | | | |
Total average number of employees | | | 42,829 | | | | 47,044 | | | | 46,892 | |
| | | | | | | | | | | | |
| (a) | These figures have not been restated for the purposes of the South32 demerger or reporting of Continuing and Discontinued operations. |
The table below provides a breakdown of our average number of employees by geographic region for each of the last three financial years.
| | | | | | | | | | | | | | | | |
Year ended 30 June | | 2015 | | | 2015 | | | 2014 (b) | | | 2013 (b) | |
| | | Continuing
operations (a) | | | Discontinued
operations (a) | | | | | | | |
Africa | | | 117 | | | | 6,875 | | | | 9,035 | | | | 9,121 | |
Asia | | | 1,022 | | | | 121 | | | | 1,105 | | | | 1,183 | |
Australasia | | | 16,839 | | | | 4,589 | | | | 23,048 | | | | 21,977 | |
Europe | | | 83 | | | | 19 | | | | 146 | | | | 231 | |
North America | | | 4,188 | | | | – | | | | 4,373 | | | | 5,116 | |
South America | | | 7,421 | | | | 1,555 | | | | 9,337 | | | | 9,264 | |
| | | | | | | | | | | | | | | | |
Total | | | 29,670 | | | | 13,159 | | | | 47,044 | | | | 46,892 | |
| | | | | | | | | | | | | | | | |
| (a) | For a description of the South32 demerger and reporting of Continuing and Discontinued operations, see sections 1.3.7, 1.6.4, and 2.1.7 of this Annual Report and note 29 ‘Discontinued operations’ to the Financial Statements. |
| (b) | These figures have not been restated for the purposes of the South32 demerger or reporting of Continuing and Discontinued operations. |
Changes in market conditions, and our business transformation programs focused on improving efficiencies and driving greater productivity have resulted in a decrease in our workforce requirements. Additionally, the deferral of some projects has had a consequential reduction in the workforce required for such projects. The FY2015 reductions were predominately in our contractor workforce, primarily in our Petroleum and Potash, Iron Ore and Coal Businesses.
1.13.2 Employee policies and engagement
At BHP Billiton, our people are fundamental to our success. Our people strategy focuses on developing our future leaders, engaging and supporting our high-performance workforce, and continuing to build a diverse team and inclusive workplace culture.
Our people strategy reflects our desire to have a highly motivated team and the importance of building effective leadership and deep functional expertise across our workforce to enable productivity. We strongly believe that having employees who are engaged and connected to our organisation reinforces our shared purpose, aligned toOur Charter, and will result in a more harmonious workplace.
An important component of our people strategy is how we enable our leaders to step up and drive greater productivity. In FY2015, a new leadership development framework, Leading the Future, was developed and implemented to address the findings of our FY2013 employee survey. Based on the premise that leadership drives culture and culture drives performance, the framework is globally consistent, sustainable and designed to build a distinctive BHP Billiton leadership capability. The first program introduced was Leading Step Up, a global approach to shifting our culture in the areas of employee engagement, the way we lead change, and how we develop our people. Targeted at all frontline people leaders in our operations, Group Functions and Marketing, Leading Step Up is delivered locally by BHP Billiton leaders, taught through practical everyday routines, and reinforced with regular feedback and coaching. To ensure continuous improvement, the program will be measured through local observation and feedback discussions, and through our annual employee surveys. Leading the Future will continue to be implemented across the business in FY2016.
Integral to achieving effective employee engagement is our approach to communication. We believe communication is a two-way process that we undertake through a variety of channels, including face-to-face, the
internet, intranet, email, newsletters, online collaboration forums and other means designed to cater for the local environment. Annually we seek feedback from our employees via an Employee Perception Survey. The findings from these surveys inform our HR practices and are used to measure and track people-related performance.
Our Charter, the BHP BillitonCode of Business Conduct and Human Resources GLDs prescribe what we will do and the behaviours that we expect of those who work for, or on behalf of, BHP Billiton. All of these documents are accessible to employees. Also, our employees can access our Annual Reports either via the internet or hard copy and receive regular communications on BHP Billiton goals and performance, as well as on other important issues such as health and safety, the environment and theCode of Business Conduct. Dispute and grievance handling processes exist to address issues across the Company. A business conduct advisory service, EthicsPoint, operates worldwide to allow concerns to be raised about conduct that is out of step withOur Charter values, our policies and procedures or legislation.
To help our people focus on clear goals, deliver our strategic and operational priorities and align behaviour toOur Charter, in FY2015, 86 per cent of our total number of employees participated in a formal performance management process, including 86 per cent of our operators and support staff. This process also provides the opportunity for employees to receive feedback and coaching, and identify skills and capabilities requiring further development. Due to industrial agreements, not all our employees are able to participate in individual performance or reward programs.
BHP Billiton is committed to creating a diverse workforce and inclusive work environment in which every employee is respected, treated fairly and embraced for their unique skills, experiences and perspectives. Discrimination on any basis, including disability, is not acceptable. In instances where employees require support for a disability, we work with them to identify roles that meet their skill, experience and capability, and offer retraining where required. Where practical to do so, flexible work practices are offered, taking into account the needs of the employee and those of the particular workplace. The employment packages under our remuneration policy, which must comply with local regulations, are aligned to our business requirements and are designed to be sufficiently attractive to recruit and retain highly capable and experienced candidates.
Our employee share purchase plan, Shareplus, is available to all permanent full-time and part-time employees, and those on fixed-term contracts, except where local regulations limit operation of the scheme. In these instances, alternate arrangements are in place. As at 30 June 2015, 14,077 employees were participants in Shareplus. Short-term and long-term incentive schemes also operate across the Group. Rewards for eligible individuals are predicated on the need to meet targets relating to the Group’s performance in areas such as health, safety and achievement of financial measures and on the personal performance of each employee.
1.13.3 Inclusion and diversity at BHP Billiton
Our Charter and Human Resources GLDs provide guidance on all aspects of our human resource management, including our approach to inclusion and diversity.
We believe that an inclusive work environment and a diverse workforce, where the unique skills, experiences and perspectives of our people are embraced, is pivotal to sustaining performance and further increasing our productivity. At BHP Billiton, we celebrate diversity in a broad sense, including differences in thought, perspectives, nationality, gender, sexual orientation, age and experience. In relation to gender, the Board had a goal of increasing the number of women on the Board to three by the end of CY2015. This has now been achieved with the announcement on 14 August 2015 that Anita Frew has been appointed to the Board (effective 15 September 2015) and will stand for election at the 2015 AGMs.
Each financial year, the Board considers, approves and monitors progress on the Group’s performance objectives. More details are set out below.
Our approach to inclusion and diversity is underpinned by the following principles:
a diverse workforce and an inclusive environment are necessary to the delivery of our strategy that is predicated on diversification by commodity, geography and market;
our aspiration is to have a workforce that best represents the communities in which our assets are located and our employees live;
actions that support our inclusion and diversity objectives should be consistent with our established approach to talent, performance and reward;
achieving an appropriate level of diversity is facilitated by line leadership and structured programs that support employees from an early career stage in developing the necessary skills and experiences for leadership roles;
| • | | creating an inclusive work environment will require every employee and leader to embrace diversity and act in a way that is consistent withOur Charter; |
measurable objectives in support of inclusion and diversity will be transparent, fit for purpose and focus on (i) engaging, enabling and developing our workforce and (ii) establishing appropriate representation goals.
Progress against measurable objectives
A summary of the three objectives committed to in FY2015 and progress to date are set out below.
| 1. | Each Business, Group Function and Marketing will be evaluated on progress in executing the measurable objectives that form part of its multi-year diversity plan. |
As in previous years, monitoring and tracking performance against inclusion and diversity plans was undertaken as part of the Group’s internal compliance requirements. Performance for each Business, Group Function and Marketing was evaluated against FY2015 measurable objectives and the results of these evaluations were taken into account in determining bonus remuneration.
| 2. | Execute the inclusion and diversity strategy and actions approved by the GMC. |
Our Businesses, Group Functions and Marketing executed the GMC approved inclusion and diversity plan. During the reporting period:
| – | | Our CEO and senior management across the organisation reinforced the Company’s commitment to inclusion and diversity through internal and external communication channels, including leadership messages, town hall meetings and participation in external industry events. |
| – | | Our CEO and the executive team participated in an Inclusive Leadership and Unconscious Bias development experience. Key content was also included in the BHP Billiton Group-wide Leadership Development Program, Leading Step Up, seeking to strengthen the ability of all people leaders to engage, lead change and develop our people. |
| – | | A Senior Executive Sponsorship program for female talent was launched. In addition, Businesses continued executing their female mentoring programs. These initiatives have contributed to increasing female representation in pipelines to manager and above level roles. |
| – | | After successful pilot programs during FY2014, flexible work arrangements were implemented in some Businesses, Group Functions and Marketing. Implementation was supported by information and engagement sessions led by line managers. |
| – | | Initiatives to keep employees engaged while on parental leave were successfully implemented. These included keep in touch meetings with employees during their parental leave and parental coaching sessions for managers. |
| – | | Initiatives to develop and promote diverse talent continued to be deployed across different regions. Key initiatives included career panel discussions, talent discussions sessions for diverse employees and implementing inclusion of diverse candidates for vacant roles. |
| – | | Actions to increase representation of Indigenous peoples (including Aboriginal and Torres Strait Islander peoples) in our workforce continued to be executed. Actions included targeted resourcing strategies, training programs and integration initiatives to broaden their employment opportunities. |
| – | | From our baseline in 2010, female representation increased by (i) 13 per cent in manager and senior leadership roles to 21 per cent and (ii) two per cent in our overall workforce representation to 17 per cent(a). We remain committed to increasing overall female representation, with a specific focus on operational areas. |
| – | | In FY2015, female representation in our graduate intake increased by 7.6 per cent at a global level to 42 per cent and by 10 per cent to 46 per cent in Australia(b). Representation of Aboriginal and Torres Strait Islander peoples in the graduate intake in Australia increased by six per cent to 11 per cent. |
| 3. | Demonstrate year-on-year improvement in creating a work environment of inclusion, as measured by our employee survey index. |
As part of our employee survey, we gauge employees’ perceptions of feeling valued and heard. Results, together with tools and materials to assist action planning and improvement, were cascaded to business leaders and line managers. Results demonstrate a three per cent increase from last year.
| (a) | These figures represent outcomes for Continuing operations. For Discontinued operations, female representation in manager and senior leadership roles was 17 per cent (totalling 19 per cent for the Group for FY2015) and female representation for the overall Discontinued operations workforce was 14 per cent (totalling 16 per cent for the Group for FY2015). We remain committed to increasing overall female representation, with a specific focus on operational areas. |
| (b) | These figures represent outcomes for the total Group (including Discontinued operations). In relation to Discontinued operations, three per cent of these graduates from the total Group were transferred to South32 as part of the demerger. |
Continuous improvement
In FY2016, we will continue to focus on creating a more inclusive work environment and on enhancing our gender and diversity profile. We will take the following steps to achieve this commitment:
demonstrate progress against key objectives to improve the diversity of our workforce profile with particular emphasis on increasing female representation year-on-year, both overall and in leadership roles;
demonstrate year-on-year improvement in creating a work environment of inclusion, as measured by our employee survey index.
As in previous years, each Business, Group Function and Marketing will be evaluated on progress in executing the measurable objectives that form part of their scorecards and appraisal commitments. Successful completion of these objectives will be taken into account in determining bonus remuneration. Progress against each year’s measurable objectives will continue to be tracked as part of the Group’s internal compliance requirements and disclosed in the Annual Report.
1.14 Sustainability
Sustainability is core to our business strategy and integrated into our decision-making. It helps us liveOur Charter values of putting health and safety first, being environmentally responsible and supporting our host communities.
In reporting our sustainability performance, we include our impact on the environment and approach to climate change, water stewardship, resource conservation and biodiversity; and our efforts to ensure the broader economic contributions of our operations benefit the regions in which we operate.
The information (including performance data) contained in this section, unless otherwise stated, covers assets that have been wholly owned and operated by BHP Billiton or that have been operated by BHP Billiton in a joint venture operation (operated assets) for FY2015. It also includes information (including performance data) relating to, and including, the demerged assets for the period from 1 July 2014 to 8 May 2015. Unless otherwise stated, data included in this section is presented on a Continuing operations basis.
We acknowledge the importance of measuring our broader impact. As such, in FY2015 we expanded our definition of work-related activities to align with the recording boundaries of the International Council on Mining and Metals (ICMM). This includes the recording of events that occur outside of our operated locations where we have established the work to be performed and can set and verify the health and safety standards.
1.14.1 Identifying our material sustainability issues
To deliver successfully on our business strategy, we identify and respond to the sustainability issues that have a direct or indirect impact on our business and our stakeholders. Using a materiality assessment process, we identify and prioritise material sustainability issues. The following issues are discussed in this Annual Report:
| | | | | | |
Governance | | Health and safety | | Environment | | Society |
• Governance and sustainability • Identifying and managing our material risks • Operating with integrity • Climate change | | • Keeping our people and operations safe • Focusing on the health of our people | | • Biodiversity management • Water • Responsibly managing hydraulic fracturing | | • Engaging with our host communities • Respecting human rights • Making a positive contribution to society |
Additional information relating to our materiality assessment process and our sustainability performance for FY2015 is available in our Sustainability Report 2015 and can be found online atwww.bhpbilliton.com.
1.14.2 Governance
Governance and sustainability
Our Board governs the Group in a manner consistent withOur Charter, our strategy and our commitment to a transparent and high-quality governance system. The Board has established a number of committees to assist in exercising its authority, including monitoring the performance of the Group.
The Sustainability Committee assists the Board in oversight of health, safety, environment and community (HSEC) matters, including climate change. This includes overseeing areas relating to HSEC risk control, compliance with applicable legal and regulatory requirements, and overall HSEC performance of the Group.
During FY2015, the Sustainability Committee continued to assist the Board in its oversight of HSEC issues and performance. This included consideration of strategic environmental and community matters, HSEC audits and trends, and the detailed reports from management of the relevant operation on the event, actions taken and investigations in the event of a fatality or significant incident.
Below the level of the Board, key management decisions are made by the CEO, the GMC, other management committees and individual members of management to whom authority has been delegated.
At the Group level, health, safety, environment and community teams provide guidance and thought leadership by developing and implementing HSEC management frameworks, focusing on catastrophic and fatal hazards management; identifying relevant HSEC trends; tracking performance and alignment with other Company requirements; and reporting progress against targets.
To link HSEC matters to remuneration, 20 per cent of the FY2015 short-term incentive opportunity for GMC members was based on HSEC performance. Given the importance the Group places on safety, the short-term incentive opportunity attached to HSEC has been increased for FY2016 to 25 per cent. The Sustainability Committee assists the Remuneration Committee in determining appropriate HSEC metrics to be included in GMC scorecards and in assessing performance against those measures.
The Remuneration Committee and the Board also have discretion over both the short-term and long-term incentive opportunities for GMC members and take into consideration HSEC performance. As a consequence of the five tragic fatalities in FY2015, the Board and the Remuneration Committee concluded, after taking advice from the Sustainability Committee, that a zero outcome was appropriate for the CEO’s FY2015 short-term incentive HSEC component, with the decision supported by the CEO.
Further information on the metrics and their assessment is available in the Remuneration Report contained in section 4 of this Annual Report.
Identifying and managing our material risks
In addition to the legal requirements of the countries in which we operate, our approach to sustainability risks is defined by our GLDs. These clearly describe our mandatory minimum performance requirements and accountabilities across the Group and are the foundation for developing and implementing management systems at our operations.
GLDs relating to HSEC matters set our Group-wide HSEC-related performance requirements to ensure effective management control of our sustainability risks. Our GLDs are consistent with the principles and mandatory requirements of the position statements of the ICMM Sustainable Development Framework, the United Nations (UN) Global Compact, the UN Declaration of Human Rights and the Voluntary Principles on Security and Human Rights.
At our operated assets, we have the ability to set workplace HSEC standards and enforce their application. Contractors working at our operated assets must comply with the minimum performance requirements in our relevant GLDs. In addition we seek to ensure our customers, suppliers, agents and service providers maintain business practices and workplaces that are aligned with our GLDs. We also seek to apply GLD performance requirements to our non-operated assets.
We use the framework in ourRisk Management GLD to identify and manage the risk involved in our business activities, functions and processes. This provides a strong foundation for our active and consistent risk-based approach to sustainability. A broader discussion of our risk factors and management approach is provided in section 1.7 of this Annual Report.
Operating with integrity
Integrity and accountability are core values at BHP Billiton and central to our reputation as one of the world’s leading companies. We are committed to ethical business practices and high-quality governance in all that we do. Regardless of the country or culture within which our people work, ourAnti-corruption GLD andCode of Business Conduct prohibit bribery and corruption in all our business dealings. Particulars in relation to theCode of Business Conduct and anti-corruption are referred to the Sustainability Report 2015 and in section 3.17 of this Annual Report. Specific discussion on legal proceedings is available in section 6 of this Annual Report.
Transparency of payments to governments
BHP Billiton considers the licences we have to operate in jurisdictions around the world as a privilege that bestows upon us a responsibility to contribute to the economic and social development of our host countries. A critical component of this responsibility is our taxation obligations to our host governments.
Our payments to governments in FY2015 on a country-by-country basis of US$7.3 billion are presented in our Sustainability Report 2015. Approximately US$1.4 billion in taxes collected on behalf of employees was also remitted to governments in FY2015. More than 99 per cent (excludes demerged assets) of our payments were made to nine countries. Of these, our largest payments were made in Australia, where we have the majority of our assets.
BHP Billiton has long been deeply committed to the role transparency plays in contributing to the good governance of natural resources for the benefit of the governments and citizens of countries that host our operations. This is why BHP Billiton has voluntarily publicly reported our payments of taxes and royalties in our Annual Sustainability Report in increasing detail over the last 15 years and has been a member of the Extractive Industries Transparency Initiative (EITI) since its inception in 2002. We continue our strong support through our active participation on the EITI Board.
We believe that transparency by governments and companies around revenue flows from the extraction of natural resources is an important element in the fight against corruption. A level and globally consistent playing field will ensure all companies disclose on the same basis and reduce the reporting burden for those operating in multiple jurisdictions. To this end, and consistent with our Transparency Principles, we support appropriate national and extra-territorial mandatory corporate reporting to complement the EITI and provide a globally consistent regulatory framework for all extractive industry companies.
We have disclosed our payments of taxes and royalties on a project-by-project basis, and payments to state and provincial governments at a subnational level, in a stand-alone BHP Billiton Economic contribution and payments to governments Report. This Report is available online atwww.bhpbilliton.com.
Closure planning
Closure planning is an important consideration in the planning and development of our mining and petroleum operations. We recognise the significant risks associated with ineffective closure and seek to minimise these through our closure governance framework. The closure framework integrates resource planning and development, health, safety and environment, stakeholder engagement, finance and assurance into business operational design.
Specifically, the framework requires each asset to develop closure plans. These plans describe closure objectives and the management process in place to reduce closure liabilities over the life of the asset.
An ongoing internal audit program continues to test the effectiveness of these closure plans and the business alignment to the closure planning framework, including the financial provisions. Information on these provisions can be found in note 14 ‘Closure and rehabilitation provisions’ to the Financial Statements. Audit findings are reviewed annually and reported to the relevant Business Presidents, while summary reports are considered by the Sustainability Committee of the Board. During FY2015, 11 audits were conducted against performance criteria and recommendations from such audits have been initiated.
Climate change
Our perspective on climate change
We accept the Intergovernmental Panel on Climate Change (IPCC) assessment of climate change science, which has found that warming of the climate is unequivocal, the human influence is clear and physical impacts are unavoidable.
Sustainable economic growth requires an effective response to climate change. The world needs reliable, affordable energy to support higher living standards and lower GHG emissions to keep the global average temperature rise below two degrees Celsius. We do not prioritise one of these requirements over the other. Both are essential.
Even allowing for significant improvements in energy efficiency, energy demand is expected to increase as the global population grows and living standards improve. Today, fossil fuels are often the most affordable, reliable and accessible way of meeting this demand and provide more than 80 per cent of the world’s primary energy. However, their growing use would substantially increase GHG emissions and exacerbate climate change unless new technology reduces their impact. To meet its development and climate goals, the world must find ways to progressively decarbonise the use of fossil fuels, improve energy efficiency and increase the use of alternative energy sources such as renewables and nuclear power.
Climate change governance
BHP Billiton’s strategy is tied to economic growth in both emerging and developed economies, and sustainable growth requires an effective response to climate change. Responding to climate change is a priority Board governance and strategic issue for our Company.
Our GMC has primary responsibility for the design and implementation of an effective position and response to climate, and accountability for performance against GHG emissions, our climate change metric. We also seek input and insight from external experts, such as the Forum on Corporate Responsibility.
To reflect updates in scientific knowledge and global regulatory and political responses, we regularly review our position on climate change. We incorporate climate change considerations into our Group scenario planning to understand potential impacts on our portfolio. We also conduct annual reviews of performance against Business GHG targets to ensure we are on track to achieve our Company target. The Sustainability Committee has considered a range of climate change scenarios and continues to monitor the actions being taken to manage a range of climate change impacts and policy responses.
Our approach
Our strategic approach to climate change is underpinned by engagement with policy makers and other stakeholders, including investors, companies and non-government organisations. We believe industry has a key role to play in climate change policy development by working with governments and other stakeholders to inform the development of effective long-term policy framework that delivers a measured transition to a lower emissions economy. BHP Billiton believes an effective policy framework should include a complementary set of measures, including a price on carbon, support for low-emissions technologies and measures to build resilience.
We continue to share lessons learnt with our stakeholders and identify solutions that we believe can drive emissions reductions at the lowest cost. In September 2014, BHP Billiton signed the World Bank’s Putting a Price on Carbon statement, which was presented at the 2014 UN Climate Summit in New York Stock Exchange (NYSE)and we are a member of their Carbon Pricing Leadership Coalition. In 2015, we made two climate change policy submissions in response to the Australian Government’s discussion papers Setting Australia’s Post-2020 Target for GHG Emissions and Emission Reduction Fund: Safeguard Mechanism, sharing our perspective on the importance of this issue.
We have also hosted several policy roundtables, bringing cross-sectoral business groups together to discuss different ways that business and government can address climate change. Internationally, we look forward to the 21st Conference of the Parties (COP21) in Paris in December 2015 delivering a positive outcome that puts the world on a path to limit global temperatures to less than 2 degrees Celsius above pre-industrial levels, in line with current international commitments.
We are committed to transparent and open communications and have an ongoing and extensive engagement program with investors, government and the broader society, including our voluntary submission to the CDP (formerly known as the Carbon Disclosure Project). The CDP score is a measure of the actions that a company has demonstrated in carbon management. Our commitment to continuing transparency and disclosure has resulted in an improvement in our CDP score since 2013.
We have been taking action for many years to understand and manage the impacts of climate change on our business. We have been applying an internal price on carbon in our investment decisions and portfolio evaluation for more than a decade and were early adopters of this approach. We maintain a view on carbon pricing using a carbon price protocol, which we update regularly. Our carbon price protocol tracks the progress of national emissions reduction ambitions to tackle climate change throughout the world, including in our major operating regions and customer demand centres. In parallel, we look at the potential for reductions in emissions and the cost associated with those reductions to determine an appropriate long-term price level. We carry out this assessment for various scenarios which reflect the effectiveness and ambition of policies, the timing to implement reductions, the interaction between policy mechanisms and the role of low carbon technologies. We have an integrated approach to addressing climate change that has three key areas: mitigation, adaptation andlow-emissions technology.
Mitigation
As a major producer and consumer of energy, we prioritise GHG reductions and energy efficiency.
BHP Billiton is among the sector leaders in setting an absolute target to limit our GHG emissions. As we grow our business, this target encourages us to look for ways to improve our energy efficiency, increase productivity and implement additional GHG reduction projects across our operations. All our Businesses are required to identify, evaluate and implement suitable GHG reduction opportunities, including during project design and equipment selection.
In FY2015, the Group’s total GHG emissions were 38.3 million tonnes (Mt) of carbon dioxide equivalent (CO2-e). Taking into account the impact of the demerger, this represents a six per cent reduction on FY2014 GHG emissions. For the purposes of the FY2014 comparison, emissions from assets demerged with South32 for the period 1 July 2014 to 30 April 2015 were annualised. This reduction has been driven in part by GHG reduction projects across our Businesses and improved productivity.
GHG Scope 1 and 2 (millions of tonnes CO2-e)(a)
| | | | | | | | | | | | |
Year ended 30 June (b) | | 2015 | | | 2014 | | | 2013 | |
Scope 1 (c) | | | 20.7 | | | | 22.7 | | | | 22.0 | |
Scope 2 (d) | | | 17.6 | | | | 22.3 | | | | 24.7 | |
| | | | | | | | | | | | |
Total GHG millions of tonnes CO2-e | | | 38.3 | | | | 45.0 | | | | 46.7 | |
| | | | | | | | | | | | |
| (a) | Measured according to the World Resources Institute/World Business Council for Sustainable Development Greenhouse Gas Protocol. |
| (b) | Includes data for Continuing and Discontinued operations. |
| (c) | Scope 1 refers to direct GHG emissions from our operated assets. |
| (d) | Scope 2 refers to indirect GHG emissions from the generation of purchased electricity and steam that is consumed by our operated assets. |
In line with the requirements of the UK Companies Act 2006, our reported FY2015 GHG intensity was 3.8 tonnes of CO2-e per tonne of copper equivalent production (FY2014: 4.9 tonnes of CO2-e). Our reported FY2015 energy intensity was 30 petajoules per million tonnes of copper equivalent production. Copper
equivalent production has been based on FY2013 average realised product prices. Rather than use an intensity metric, we have set ourselves a challenging goal to limit our overall emissions by keeping our absolute FY2017 GHG emissions below our FY2006 baseline while we continue to grow our business.
A key example of our ongoing activity to reduce GHG emissions is our Fuel Quality Network that brings people together from across our Company to understand and test the benefits of improving fuel quality. Our investigations have shown that improving fuel chemistry can deliver significant reductions in diesel exhaust particulates and GHG emissions. We estimate that improving the quality of fuel delivered to our mobile plants has the potential to reduce energy consumption across the Company by around 4,600 terajoules (TJ) per annum and reduce GHG emissions by approximately 320,000 tonnes of CO2-e per annum. In addition, the Fuel Quality Network will help us to achieve cost savings in maintenance operations and deliver improved productivity.
Projects and initiatives such as these keep us on track to achieve our GHG emissions reduction target. We are committed to continued focus on the delivery of GHG reduction opportunities within our Businesses.
In addition to identifying opportunities within our Company, we also seek to contribute to global GHG emissions reductions. We are currently implementing a strategy to support REDD+ (Reducing Emissions from Deforestation and Forest Degradation), an international mechanism that provides economic, social and environmental incentives for developing countries to reduce GHG emissions from deforestation and related activities through the creation of carbon credits. Through project support, improved governance and climate finance market stimulation, BHP Billiton is playing a role in reducing deforestation, enhancing community livelihoods and improving biodiversity and watershed conservation. BHP Billiton and the International Finance Corporation are exploring ways of stimulating demand for REDD+ credits to support forest protection and conservation.
Adaptation
BHP Billiton’s corporate strategy is based on owning and operating long-life assets diversified by commodity, geography and market. Our success over many years can be attributed to the way we have successfully adapted to the changing business landscape. Building resilience to the physical impacts of climate change is just as essential to long-term business success.
We take a multifaceted approach to climate change adaptation, building resilience across activities both within our operations and investments, and outside of our operational control in our communities and ecosystems. We seek to leverage many of our established core business processes such as risk and planning. Climate risks may occur as a result of acute (extreme) weather events (e.g. floods and cyclones); chronic (incremental) changes in climate conditions, which may progressively increase risk over time (e.g. changes to temperature); and cumulative impacts from the interaction of direct and indirect climate impacts (e.g. changes to water availability). Our analysis has found that climate change will exacerbate existing risks while also exposing our Businesses to new risks. For example, cyclone management is critical for our Western Australia Iron Ore (WAIO) Asset and maintaining adaptive management practices will allow WAIO to respond to the expected increase in cyclone intensity in the Pilbara. We also require new investments to assess risks associated with the forecast impacts of climate change. For example, during the project design, identification and assessment of increasing storm intensity and storm surge levels resulted in raising the height of the trestle at our Hay Point coal port facility in Queensland, Australia, as part of our expansion plans.
Effective analysis of climate science is critical to our resilience planning and we take care to understand what variables and analysis make the most sense to our business. We are currently working with the CSIRO (Australia’s national science agency) to obtain analyses of the climate science. This will inform climate resilience planning at an asset level, improving our understanding of the material climate vulnerabilities that face our Businesses.
Technology
Technology and innovation have the potential to significantly reduce global emissions and meet long-term climate goals. Given that fossil fuels are likely to continue to be a significant part of the energy mix for decades, it is vital that low-emissions technologies (LET) are available at scale, lower cost and much faster than the usual commercial time frames to meet the challenge of climate change. Industry has a significant collaborative role to play with government, academia and the community to facilitate this necessary step change.
Since 2007, we have spent over US$400 million on LET research, development and deployment across a number of projects ranging in scale and complexity. For example, the West Cliff Ventilation Air Methane Project (WestVAMP) first piloted at Illawarra Coal’s Appin Colliery in 2001, utilises 20 per cent of available mine ventilation air to produce electricity. This reduces the site’s overall GHG emissions footprint by removing the methane from mine ventilation air.
BHP Billiton is also part of ONE Future, a coalition of companies from across the natural gas industry in the United States.States focused on identifying solutions for fugitive methane emissions management. ONE Future has developed an approach, that if widely adopted, could lower the total methane emissions of participating coalition companies to less than one per cent of gross production.
To build upon this contribution to the development of LET, we have recently established an integrated strategy that considers investment across a range of technologies that can lead to material emissions reductions in our operations and across our supply chains. When evaluating opportunity areas for potential investment, we look at several different factors, including the potential to impact upon global emissions and the opportunity to use our own skills and expertise to accelerate the change required, including our expertise in geology, engineering and markets.
We also seek to leverage our investments with the contribution of suitable partners, including governments, peers and research organisations. The focus for us is to consider the catalytic role that BHP Billiton can play in working with others to accelerate the deployment of technology to address material sources of emissions.
Our roadmap for investment includes the development and demonstration of carbon capture and storage (CCS) technologies, the reduction of fugitive methane emissions from coal and petroleum operations, high-efficiency/low-emissions power generation, low-emissions transportation and improvement and application of battery storage to enhance the wider deployment of renewable energy.
CCS can play a pivotal role in reducing emissions from oil and gas production, and from the use of fossil fuels in power generation and industrial processes. The key components of CCS (capture, transport and storage of CO2) have all been demonstrated successfully for many years. The challenge for large-scale deployment of CCS technology in the power and industrial sectors is the integration of the key components of CCS and appropriate commercial and regulatory support to foster further development.
Addressing the key barriers to deployment (regulatory uncertainty, cost and stakeholder concern) is essential if CCS is to become a global mitigation tool at the scale required to make a meaningful contribution to long-term climate goals. We have previously contributed to the development of CCS in both Australia and the United States and we are a founding member of CO2CRC, one of the world’s leading collaborative research organisations focused on long-term geological storage of carbon dioxide.
Portfolio evaluation
As well as taking action to reduce emissions, build resilience to the physical impacts of climate change, develop and deploy LETs and support an effective global response, we continue to identify and assess the impacts of climate change on our portfolio.
The starting point of our corporate planning process is the construction of a central case based on extensive analysis and research. Our current central case assumes the US economy continues to recover and strengthen, progressive development of China and India, integration of emerging economies into a multi-polar economic environment, and action on climate change centred on national policies.
Our corporate planning process uses scenario analysis to encompass a wide spectrum of potential outcomes for key global uncertainties. Designed to interpret external factors including technical, economic, political and governance trends facing the global resources industry, the scenarios offer a means by which to explore potential portfolio discontinuities and opportunities, as well as to test the robustness of decisions. Our scenarios do not constitute preferred outcomes for BHP Billiton. The scenarios are designed to be divergent, but also plausible and internally consistent, spanning unique potential future business environments.
According to independent bodies such as the International Energy Agency (IEA), fossil fuels will continue to supply a significant amount of the world’s energy for decades. This is the case even in the IEA’s ‘450 Scenario’, under which the world achieves a 2ºC outcome. Oil, coal and gas are likely to continue to constitute a significant part of the energy supply mix in countries like China and India, notwithstanding strong growth in renewables.
Given the ongoing role of fossil fuels, and the many uncertainties facing not only the resources sector but the world in general, accurately predicting how the world will respond to the challenge posed by climate change is difficult. Our scenario planning approach endeavours to consider a range of potential outcomes in order to understand the impacts on our portfolio and the critical signposts we must monitor in order to respond in a timely and effective way.
Our analysis highlights that our uniquely diversified portfolio of high-quality assets is robust across our scenarios and is highly unlikely to result in BHP Billiton assets being ‘stranded’. In a scenario where there is strong impetus to develop and implement cleaner, more energy efficient solutions and unified societal action to address climate change, our analysis indicates that there is a potential of upside for uranium, our high-quality hard coking coal and iron ore lump product. Copper is resilient and would offer continued opportunity for growth and our gas exposure may yet provide opportunities during a transition to a lower carbon economy. In aggregate, we anticipate these commodities are robust and provide options that could mitigate potential negative impacts on other commodities.
Regardless of the path the world chooses, we are committed to reducing our own emissions and to supporting global efforts to reduce general emissions.
1.14.3 Health and safety
Keeping our people and operations safe
The health and safety of our people and of the broader communities in which we operate is central to every aspect of our business. Regardless of where our people are located, the area of the organisation in which they work, or the type of work they undertake, we strive to create an environment that is free from occupational harm. However, we do recognise that environments we operate in can be hazardous.
Despite our goal to achieve zero work-related fatalities, tragically we lost five of our colleagues in FY2015. Four fatalities occurred during on-site work activities and one fatality occurred in an off-site transportation accident. Independent investigations were undertaken for each incident, with remedial action taken and findings from the investigations shared across the Group. In FY2014, we had no work-related fatalities at our operated assets, a goal that we will continue to work towards.
As part of our ongoing focus to eliminate fatal and other serious incidents, a Company-level safety intervention was initiated in FY2015. The safety intervention was launched with engagement across our business through a variety of methods, including workshops, team talks and surveys. Feedback was presented at our senior leaders’
meeting in July 2015, identifying the key controls, programs, systems, processes and tools currently in place that require improvement and Company-wide adoption through focused leadership.
Safety risk controls for Company-wide risks are included in ourSafety GLD and serve as the minimum mandatory controls. Each Business is required to assess whether additional controls are required to manage risks and to meet the objective of no fatalities.
During FY2015, our overall total recordable injury frequency (TRIF) performance of 4.1 injuries per million hours worked improved by two per cent compared with FY2014. Over the past five years, our TRIF has reduced by 18 per cent.
Total recordable injury frequency (per million hours worked)
| | | | | | | | | | | | |
Year ended 30 June (a) | | 2015 | | | 2014 | | | 2013 | |
Total recordable injury frequency (TRIF) | | | 4.1 | | | | 4.2 | | | | 4.6 | |
| | | | | | | | | | | | |
| (a) | Includes data for Continuing and Discontinued operations for the financial years being reported. |
Focusing on the health of our people
We want our people to be fit for work and make sure their work does not negatively impact their health or wellbeing now or in the future.
During FY2015, we continued to establish, maintain and review our exposure profiles and manage significant health risks. The minimum mandatory controls contained within ourHealth GLD are structured around three principal aims: the prevention of illness from exposure; ensuring people are fit for work; and returning people to work after illness or injury. These principal aims form the cornerstone of our health risk management framework.
In FY2012, we established a health target baseline and committed to reduce potential occupational exposure to carcinogens and airborne contaminants by 10 per cent by FY2017. In FY2015, the number of potential exposures to carcinogens and airborne contaminants requiring the use of personal protective equipment reduced by 40 per cent compared with our FY2012 baseline. We have therefore exceeded our target to date. While good progress has been made in relation to occupational exposures to carcinogens and airborne contaminants, we remain vigilant in adopting and maintaining effective exposure controls. Our FY2015 results are due to a number of initiatives across our operations, details of which can be found in our Sustainability Report 2015.
In FY2015, the incidence of employee occupational illness was 4.93 per million hours worked, an increase of 74 per cent compared with FY2014. Noise induced hearing loss cases increased significantly due to a more accurate assessment triggered by incorrectly applying our hearing loss criteria in previous years at some assets. Our reduction in musculoskeletal illnesses was primarily due to the introduction of a multifaceted control program at one of our assets.
| | | | | | | | | | | | |
Year ended 30 June (a) | | 2015 | | | 2014 | | | 2013 | |
Noise induced hearing loss | | | 3.05 | | | | 0.68 | | | | 0.51 | |
Musculoskeletal | | | 1.52 | | | | 1.61 | | | | 1.24 | |
Other illnesses | | | 0.36 | | | | 0.55 | | | | 0.64 | |
| | | | | | | | | | | | |
Total | | | 4.93 | | | | 2.84 | | | | 2.39 | |
| | | | | | | | | | | | |
| (a) | Includes data for Continuing and Discontinued operations for the financial years being reported. |
1.14.4 Environment
We seek to demonstrate our environmental responsibility by minimising our environmental impacts and leaving lasting benefits. We approach our environmental management in ways that address our responsibilities to firstly understand and minimise impacts, and, secondly to contribute more broadly as environmental stewards.
We complement our core business processes of risk management, and corporate planning, community development and stakeholder engagement with the minimum mandatory requirements for environmental management of ourEnvironment GLD. In this GLD, we take a risk-based approach and emphasise implementation of the mitigation hierarchy to avoid, minimise and rehabilitate direct, indirect and cumulative impacts within our area of influence across both short-term and long-term business horizons. We require our Businesses to set target environmental outcomes for land, biodiversity, water resources and air, and prevent or minimise GHG emissions, including in project design. Where unacceptable impacts remain to important biodiversity and ecosystems, we apply compensatory actions to address the residual impacts.
Biodiversity management
A sustainable society depends on biodiversity and its associated ecosystem services, such as food, air and water. Similarly, our operations depend on and have the potential to impact biodiversity and its related ecosystem services.
We have two targets focused on biodiversity that acknowledge the importance of maintaining the unique ecosystems and biodiversity of the areas in which we operate and the importance of conserving these more broadly. The first target requires the development and maintenance of land and biodiversity management plans that include controls demonstrating application of the mitigation hierarchy to manage the biodiversity and ecosystem impacts of our operations. This target is supported by the requirements of ourEnvironment GLD. In FY2015, consistent with our target, all operations developed land and biodiversity management plans.
The second target is at a wider Group level and is a voluntary commitment to financing the conservation and ongoing management of areas of high biodiversity and ecosystem value that are of national or international conservation significance. In FY2012, we established an alliance with Conservation International to support the delivery of this target and improve our approach to biodiversity management more broadly. As a result, we will improve our environmental performance and broaden our contributions to lasting environmental benefits beyond what could be achieved by our operations alone. As of FY2015, we have committed more than US$35 million to conservation, in addition to the environmental management activities at our operations.
A central part of our approach to managing our impacts on land and biodiversity is the rehabilitation of land no longer required for our activities. Our Businesses are required to maintain rehabilitation plans that support life-of-asset and closure plans. This includes rehabilitating disturbed areas that are no longer required for our operational purposes, consistent with the pre-disturbance land use or alternate land use, while taking into account regulatory requirements and stakeholder expectations. As at the end of FY2015, our total land rehabilitated was 40,800 hectares, a five per cent increase since FY2014, on the total area rehabilitated.
Water
The sustainability of our operations relies on our ability to obtain an appropriate quality and quantity of water, use it responsibly and manage it appropriately, including taking account of natural supply variations. As economies and populations continue to expand and pressure for water becomes more intense, we recognise the role we have as responsible stewards of the water we share with our host communities. We anticipate climate change is likely to make the patterns and cycles of water flow less predictable and require our operations to implement adaptive responses. Managing our shared water resources is therefore a complex task for our business.
To manage our shared water resources, our operations are required to assess the direct, indirect and cumulative impacts and risks to water resources. We do this by understanding the social, cultural, ecological and economic values of these resources at a catchment level within our area of influence. Based on the risks and impacts, our operations apply a mitigation hierarchy; implement controls and monitor their effectiveness. At the operational level, we maintain quantitative water balance models to predict and support the management of water inputs, use and outputs and to enable timely management responses to water-related risks. Where possible, we seek to use lower-quality or recycled water to minimise extraction requirements from higher-quality water resources.
Recognising the regional nature of our water risks, we introduced a target in FY2013 requiring our operations with water-related material risks to implement projects to reduce their impact on associated water resources. The target allows our Businesses to annually review and focus on the water challenges specific to the regions in which they operate. Further discussion on projects implemented as part of our water target can be found in our Sustainability Report 2015.
We report on our water use publicly, consistent with the Input Output model of the Minerals Council of Australia’s Water Accounting Framework (WAF). We are working with the ICMM to support broader adoption across the industry. The WAF aims to improve data integrity and comparability across the sector to allow a more meaningful analysis on which to base policy making and deliver improved outcomes.
Under the WAF, water is categorised as Type 1 (close to drinking water standards), Type 2 (suitable for some purposes), and Type 3 (unsuitable for most purposes). In FY2015, our total water input (water intended for use) was 340,200 megalitres across the Group, with 85 per cent defined as Type 2 or Type 3. Our use of Type 2 and Type 3 water demonstrates our approach to utilising lower-quality water wherever feasible.
Responsibly managing hydraulic fracturing
Since 2011, we have conducted onshore shale operations in the Eagle Ford, Permian, Haynesville and Fayetteville shale operations according to our North America Shale Operating Principles. These principles state our commitment to safety, and to protect the land where we operate, safeguard and manage water resources, minimise air emissions from our operations, and be a good neighbour to our host communities. We construct and operate our facilities in an environmentally sensitive manner. We conduct environmental assessments, and prepare plans with controls to minimise impacts to air, water, land and biodiversity.
We publicly report the ingredients of the fracturing fluids from each well completion into FracFocus, the hydraulic fracturing chemical disclosure registry. We don’t use benzene, toluene, ethylbenzene or xylene (BTEX) or diesel in our fracturing fluids, and we work with our service companies to reduce toxicity of fracturing fluids where possible.
We check every well we drill against our list of critical elements to ensure well integrity and the safety of our operations. Our Groundwater Risk Management Plan incorporates controls to prevent the loss of containment of pressurised fluids, including: casing annulus monitoring procedures to verify well integrity; proper wellhead and casing design and construction; and specialised training to assure competency. During FY2015, we voluntarily implemented a pre-drilling groundwater monitoring program in the active drilling areas of the Eagle Ford, Permian and Haynesville shale operations to establish a baseline of groundwater quality.
To improve management of water resources and reduce fresh water demand at our Eagle Ford operations, we implemented a mobile reverse osmosis system to produce potable water and treat waste water for reuse in drilling and completions at our drilling camps, while reducing trucking of water and waste. In our Permian shale operation, we use predominately a blend of brackish water and recycled produced water for our drilling and completions operations.
The majority of our air emissions relate to GHG emissions from fuel combustion, flaring and venting during well construction and production. We reduce methane emissions across our shale operations by capturing and selling the produced natural gas that would otherwise be vented or flared.
At our Permian shale operation, we increased the percentage of produced water sent through pipeline to disposal, eliminating a portion of trucking to disposal wells, which also contributed to GHG reductions. We utilise temporary pipelines instead of trucks throughout our shale operations to supply water to our construction operations. This reduces air emissions and relieves traffic stress on local roads and communities.
We accept the scientific basis for linking seismic activity to waste water injection wells associated with unconventional oil and gas production. As such, we conduct enhanced seismicity monitoring and other types of data acquisition to better understand and mitigate the risk of the potential for induced seismic activity associated with waste water disposal operations. We actively participate in cooperative efforts with stakeholders (industry, government, science community and the public) to better understand and promote best practice risk management in our operations.
1.14.5 Society
We strive to be a valued partner in the communities in which we operate and, through all our interactions, seek to foster meaningful, long-term relationships that respect local cultures and create lasting benefits. We believe this is fundamental to being a responsible corporate citizen and is a clear demonstration ofOur Charter values.
Engaging effectively in communities
OurCommunity GLD prescribes an inclusive and proactive approach to stakeholder engagement. We seek to build connections with stakeholders early in the life cycle of our operations, maintain open and ongoing communications with them, and operate transparently in relation to our plans and performance. In order to be effective and reach as many people as possible, we ensure these engagement activities are culturally and socially inclusive.
Our stakeholder engagement process requires our assets and operations to identify and analyse stakeholder groups to determine the level of impact the Company has on them and their level of interest in engaging with us. Each asset and operation then designs community engagement activities suitable for each of the stakeholder groups and individuals, where appropriate. Through engagement, with our host communities we also develop an understanding of the social and economic environment, including potential impacts and opportunities.
To measure the effectiveness of our engagement and community development activities, our operations are required to complete a community perception survey every three years. These surveys provide a valuable external perspective on the quality of our engagement and whether our stakeholders believe we are addressing their key concerns.
Respecting human rights
BHP Billiton’s corporate responsibility to respect human rights is embedded within the Company’s systems and processes and aligns with the UN Declaration of Human Rights and the UN Global Compact principles. The UN Guiding Principles on Business and Human Rights require companies to address three aspects to fulfil their responsibility to respect human rights: express a commitment to human rights through a policy statement; perform human rights due diligence to identify, prevent, mitigate and account for potential human rights impacts; and provide remediation where business enterprises have been identified as having caused or contributed to adverse human rights impacts. We meet these requirements by embedding them into our Company systems and processes.
BHP Billiton’s commitment to human rights is publicly stated in ourCode of Business Conduct (the Code), which clearly outlines our responsibilities and expectations. All employees and certain contractors are provided with the Code on commencement of employment with BHP Billiton, and it is a condition of that employment that they behave in accordance with the Code. Annual risk-basedCode of Business Conduct training and communication plans must be completed and executed by each area of the Group. In addition, we measure effectiveness and obtain assurance of our human rights processes through the internal audits of our GLDs.
As part of our human rights due diligence process, our operations are required to identify and document key potential human rights risks by completing a Human Rights Impact Assessment (HRIA). This includes assessing performance against the articles of the UN Universal Declaration of Human Rights, the UN Global Compact principles, and host country legislation governing human rights issues. We require each HRIA to be reviewed internally on an annual basis.
Every three years, each HRIA is required to be verified through an engagement process with stakeholders and, in medium- and high-risk jurisdictions, validated by a qualified human rights specialist. Where a HRIA identifies a material risk, a Human Rights Management Plan is required to be implemented and reviewed annually. Selected employees and contractors receive training on compliance with BHP Billiton’s human rights commitments.
Managing our security-related material risks
The nature and global reach of our organisation can result in our people working in countries where there is potential exposure to personal and business risks. We require an assessment of each country for the degree of risk associated with visiting, exploring and operating within it, and appropriate controls are developed to mitigate identified risks.
Through our commitment to the Voluntary Principles on Security and Human Rights (VPs), we seek to protect people and property from material security-related risks. Performance requirements related to the VPs are implemented through ourSecurity and Emergency Management GLD. Our operations are required to identify security-related material risks to people and property, and engage relevant stakeholders to develop and manage security programs that respect human rights and fundamental freedoms.
In addition, we require our operations to conduct an annual review for alignment with the VPs and implement an improvement plan to close identified gaps. The process also provides an opportunity to further build awareness and understanding of the VPs across the Company.
Respecting and including Indigenous communities
As many of our operations are located on or near Indigenous peoples’ lands, it is important we recognise the traditional rights and values of Indigenous peoples, respect their cultural heritage and the significance of their lands and provide opportunities for inclusion and advancement.
BHP Billiton’s approach to engaging with and supporting Indigenous peoples is articulated in our Indigenous Peoples Policy Statement, which was developed and approved by our GMC in FY2015. Implementation of the Policy Statement will help us strengthen relationships with Indigenous peoples and be a valued partner in their economic, social and cultural empowerment. We are currently in the process of developing a Group-wide Indigenous Peoples Strategy to guide implementation of the Policy Statement.
As a member of the ICMM, our Indigenous Peoples Policy Statement is consistent with the 2013 ICMM Indigenous Peoples and Mining Position Statement and is implemented in accordance with ourCommunity GLD.
Commitments through our Policy Statement include understanding Indigenous peoples’ rights and interests; building cross-cultural understanding; agreeing on appropriate engagement processes; and ensuring effective
participation in decision-making. A number of related commitments address how we engage where government is responsible for managing Indigenous peoples’ interests and how to move forward when differences of opinion arise.
Our Policy Statement specifically addresses the issue of free, prior and informed consent through committing to seek the consent of Indigenous peoples for new operations or major capital projects that are located on lands traditionally owned by, or under customary use of, Indigenous peoples and which are likely to have significant adverse impacts on Indigenous peoples.
In making this commitment, we recognise the right of governments to ultimately make decisions on the development of resources and that, in most countries, neither Indigenous peoples nor other groups have a right to veto projects. Where consent cannot be reached, a host government may decide to proceed with a project after balancing the rights and interests of Indigenous peoples with the wider population. In these circumstances, BHP Billiton will determine whether we remain involved with the project. The BHP Billiton Indigenous Peoples Policy Statement can be found in our Sustainability Report 2015.
Respecting customary rights
At a very early stage of a project, we seek to identify customary owners, occupiers and users of the land on which we intend to operate, as well as conduct land usage surveys. Knowing who is connected to the land and how it is used is critical to establishing effective community consultation and engagement. This helps to ensure people potentially affected by our operations are fully aware of our activities and have an opportunity to express their concerns and aspirations.
In instances where land may be used for customary purposes and no formal land title has been issued, information is requested from relevant organisations, including government authorities with responsibilities for customary land uses, and Indigenous peoples’ representative organisations, such as land and tribal councils. Further enquiries are also made directly with the people in the area to help identify those with connections to the land. Arising from this engagement, the operational work plan may be amended to reduce potential impacts on landowners and users.
Our projects are designed in a way that avoids or minimises resettlement of individuals or communities. If resettlement is required (voluntary or involuntary), programs must be implemented consistent with the requirements set out in the International Finance Corporation’s Performance Standard 5, Land Acquisition and Involuntary Resettlement. This includes being planned and implemented in a participatory manner that leads to a demonstrable improvement in livelihoods of the displaced persons or communities.
Ok Tedi
BHP Billiton exited from Ok Tedi Mining Limited (OTML) in February 2002. The exit arrangements included the transfer of BHP Billiton’s shares in OTML to Papua New Guinea Sustainable Development Program Limited (PNGSDP) and a statutory undertaking protecting BHP Billiton from environmental claims by the PNG Government. In September 2013, the PNG Parliament passed laws which compulsorily acquired PNGSDP’s shares in OTML and changed other aspects of the exit arrangements, including the repeal of the protection from environmental claims by the PNG Government. PNGSDP is challenging the validity of actions taken by the PNG Government to restructure and obtain control of PNGSDP. BHP Billiton retains an indemnity from PNGSDP in respect of environmental claims by the PNG Government and certain environmental claims by third parties. This indemnity is secured against certain key assets of PNGSDP. BHP Billiton remains committed to ensuring that the substantial long-term fund held by PNGSDP remains well governed for the benefit of the people of Papua New Guinea and the Western Province in particular.
Making a positive contribution to society
We know we are successful when our host communities value their relationship with us. Our aim is to work alongside host communities to help them achieve sustainable economic and social benefits, as well as diversified
and resilient local economies, so that these benefits continue beyond the life of our operations. Our broader contribution to local economies can be realised through indirect employment and our support of local businesses that provide a range of services and products, which enable our operations to function effectively.
Our operations around the world support local and national economies through creating jobs, providing infrastructure, purchasing goods and services and contributing significant payments of taxes and royalties to governments. By supplying many of our commodities to markets in developing countries, we also support economic development to help improve living standards and quality of life.
Improving the quality of life in our host communities
We aim to be partners with our host communities and are committed to understanding their needs and priorities. We seek to invest in projects that will continue to promote a benefit to the community beyond the life of the project. Using data from a social baseline study and social impact and opportunity assessment, we prepare a community development management plan. Community development projects and donations are required to be aligned to the overall community development management plan, implemented in consultation with local stakeholders, and meet our due diligence and anti-corruption requirements.
We voluntarily invest one per cent of our pre-tax profit, calculated on the average of the previous three years’ pre-tax profit, in community programs that aim to have a long-lasting, positive impact on people’s quality of life, including implementing new and supporting existing community projects. With a focus on improving quality of life, our community development programs are developed by working openly with governments and the communities in which we operate, and focusing on the needs and resources of our key stakeholders. This is how we are contributing to economic and social development.
During FY2015, our voluntary community investment totalled US$225 million, comprising US$142 million cash, in-kind support and administrative costs, and a US$83 million contribution to the BHP Billiton Foundation. The BHP Billiton Foundation was established in FY2013 to identify and support large sustainable development projects in countries and regions of interest to BHP Billiton, in order to complement the local programs managed by our assets. This builds on contributions that have previously been paid to the BHP Billiton Sustainable Communities charitable organisation. At the end of FY2015, BHP Billiton Sustainable Communities had a total of US$62.5 million and the BHP Billiton Foundation had a total of US$219.2 million in funds available for future sustainable development projects.
Community investment (US$M)
| | | | | | | | | | | | |
Year ended 30 June | | 2015 | | | 2014 | | | 2013 | |
Expenditure (1) (including in-kind support and administrative costs) | | | 142.0 | | | | 141.7 | | | | 139.8 | |
Contribution into BHP Billiton Sustainable Communities and BHP Billiton Foundation | | | 83.0 | | | | 100.0 | | | | 106.0 | |
| | | | | | | | | | | | |
Total Community investment | | | 225.0 | | | | 241.7 | | | | 245.8 | |
| | | | | | | | | | | | |
| (1) | Includes BHP Billiton’s equity share for both operated and non-operated joint venture operations. Includes payments made by operations demerged with South32. |
BHP Billiton Social Investment Framework
During FY2015, we developed a new BHP Billiton Social Investment Framework to guide our approach to voluntary social investment (social and environmental programs with net social benefit) between FY2016 and FY2020, providing a unified and integrated framework across our Company. The Framework is the outcome of an extensive review of BHP Billiton’s existing approach to social investment and has been informed by a thorough analysis of information about our internal and external operating context. Specific inputs to the review
included our material sustainability risks, emerging global trends and the stakeholder needs and expectations of our host communities. Using this information to inform our Social Investment Framework has ensured a strong linkage between our business and social investment objectives.
BHP Billiton is committed to ensuring our significant social investment adds value to the communities in which we operate and leaves behind a lasting change. Details of our new Social Investment Framework can be found in our Sustainability Report 2015.
1.15 Additional information
1.15.1 External factors and trends
The following section describes some of the external factors and trends that have had a material impact on our financial condition and results of operations. We operate our business in a dynamic and changing environment and with information that is rarely complete and exact. We primarily manage the risks discussed in this section under our portfolio risk management approach, which relies on the effects of diversification, rather than individual risk management programs. Details of our risk factors can be found in section 1.7.2 of this Annual Report. Details of our financial risk management strategies and financial instruments outstanding at 30 June 2015 can be found in section 1.7.3 of this Annual Report and in note 23 ‘Financial risk management’ to the Financial Statements.
Management monitors particular trends arising from external factors with a view to managing the potential impact on our future financial condition and results of operations. The following external factors could have a material adverse effect on our business and areas where we make decisions on the basis of information that is incomplete or uncertain.
Information in this section has been presented on a Continuing operations basis to exclude the contribution from assets that were demerged with South32, unless otherwise noted. Details of the contribution of the South32 assets to the Group’s results are disclosed in note 29 ‘Discontinued operations’ to the Financial Statements.
Commodity prices
The prices we obtain for our products represent a key driver of our business, and fluctuations in these commodity prices affect our results, including cash flows and asset values. The estimated impact on FY2015 profit after taxation of changes of commodity prices is set out below.
| | | | |
| | US$M | |
US$1/bbl on oil price | | | 54 | |
US¢10/MMBtu on US gas price | | | 27 | |
US¢1/lb on copper price | | | 24 | |
US$1/t on iron ore price | | | 144 | |
US$1/t on metallurgical coal price | | | 23 | |
US$1/t on energy coal price | | | 11 | |
US¢1/lb on nickel price | | | 2 | |
Commodity markets were influenced by modest growth in global economic activity in FY2015. Solid momentum in the US economy, supported by improved growth in the Eurozone and Japan, saw developed economies contribute an improved share of activity relative to emerging markets. A number of emerging economies, including China, saw growth slow while Russia and Brazil experienced recessions. In the case of most steelmaking raw materials and energy commodities, supply growth was greater than demand growth resulting in lower prices. The price for crude oil dropped significantly, while the Henry Hub gas price declined on higher supply and increased inventory levels relative to the previous year. The Asian LNG price dropped on greater
supply and lower oil prices. The copper price was also lower as supply disruptions were offset by weaker than expected consumption. Although aluminium demand grew, supply exceeded consumption due to increasing production from China. In the manganese market, the supply side response to weak demand growth was slower than expected resulting in a decrease in prices.
The following tables show the prices for our most significant commodities for the years ended 30 June 2015, 2014 and 2013, on both a Continuing and Discontinued operations basis. These prices represent selected quoted prices from the relevant sources as indicated, and will differ from the realised prices on the sale of the Group’s production due to differences in quotation periods, quality of products, delivery terms and the range of quoted prices that are used for contracting sales in different markets.
Continuing operations
| | | | | | | | | | | | | | | | | | | | | | | | |
Year ended 30 June | | 2015
Closing | | | 2014
Closing | | | 2013
Closing | | | 2015
Average | | | 2014
Average | | | 2013
Average | |
Natural gas Henry Hub (1) (US$/MMBtu) | | | 2.81 | | | | 4.39 | | | | 3.73 | | | | 3.32 | | | | 4.25 | | | | 3.44 | |
Natural gas Asian Spot LNG (2) (US$/MMBtu) | | | 7.30 | | | | 11.28 | | | | 15.40 | | | | 9.74 | | | | 16.38 | | | | 15.14 | |
Crude oil (Brent) (3) (US$/bbl) | | | 61.05 | | | | 111.02 | | | | 102.46 | | | | 73.91 | | | | 109.36 | | | | 108.64 | |
Ethane (4) (US$/bbl) | | | 8.40 | | | | 12.02 | | | | 9.92 | | | | 8.56 | | | | 11.92 | | | | 12.15 | |
Propane (5) (US$/bbl) | | | 16.25 | | | | 44.47 | | | | 35.52 | | | | 29.34 | | | | 48.05 | | | | 37.31 | |
Butane (6) (US$/bbl) | | | 23.89 | | | | 54.39 | | | | 49.51 | | | | 36.89 | | | | 56.70 | | | | 61.74 | |
Copper (LME cash) (US$/lb) | | | 2.60 | | | | 3.15 | | | | 3.06 | | | | 2.89 | | | | 3.18 | | | | 3.48 | |
Iron ore (7) (US$/dmt) | | | 59.50 | | | | 93.25 | | | | 116.25 | | | | 71.61 | | | | 122.70 | | | | 127.23 | |
Metallurgical coal (8) (US$/t) | | | 88.00 | | | | 110.50 | | | | 130.00 | | | | 102.91 | | | | 128.40 | | | | 159.13 | |
Energy coal (9) (US$/t) | | | 61.66 | | | | 70.89 | | | | 78.89 | | | | 64.37 | | | | 78.38 | | | | 89.10 | |
Nickel (LME cash) (US$/lb) | | | 5.30 | | | | 8.49 | | | | 6.21 | | | | 7.02 | | | | 6.88 | | | | 7.43 | |
| (1) | Platts Gas based on Henry Hub – typically applies to gas sales in the US gas market. |
| (2) | Platts Liquefied Natural Gas Delivery Ex-Ship (DES) Japan/Korea Marker – typically applies to Asian LNG spot sales. |
| (3) | Platts Dated Brent is a benchmark price assessment of the spot market value of physical cargoes of North Sea light sweet crude oil. |
| (4) | OPIS Mont Belvieu non-Tet Ethane – typically applies to ethane sales in the US Gulf Coast market. |
| (5) | OPIS Mont Belvieu non-Tet Propane – typically applies to propane sales in the US Gulf Coast market. |
| (6) | OPIS Mont Belvieu non-Tet Normal Butane – typically applies to butane sales in the US Gulf Coast market. |
| (7) | Platts 62 per cent Fe Cost and Freight (CFR) China – used for fines. |
| (8) | Platts Low-Vol hard coking coal Index FOB Australia – representative of high-quality hard coking coals. |
| (9) | GlobalCOAL FOB Newcastle 6,000kcal/kg NCV – typically applies to coal sales in the Asia Pacific market. |
The following summarises the average and closing pricing trends of our most significant commodities for FY2015.
Natural gas Henry Hub: The Platts US Henry Hub natural gas price decreased by 22 per cent during FY2015. The decrease was a result of increased production growth, partially offset by consumption growth in the power sector. Natural gas inventories ended the year at 2,577 Billion cubic feet (Bcf), one per cent above the five-year average and 35 per cent higher year-on-year. The year-end price was 15 per cent below the average for the year. Since 30 June 2015, the US Henry Hub natural gas price decreased five per cent on 31 August 2015.
Natural gas Asian Spot LNG: The Asian liquefied natural gas spot price decreased by 41 per cent during FY2015. The decrease was driven by weaker north Asian end-user demand and ample global supply availability. In turn, this allowed for more spot purchases on lower prices and provided some support for Asian buyers to maintain higher inventory levels. Meanwhile, the drop in crude oil prices has had a lagged negative impact on oil-linked LNG contracts in the second half of FY2015. The year-end price was 25 per cent below the average for the year.
Crude oil: The Platts Dated Brent crude price decreased by 32 per cent during FY2015 following increases in global crude supply, particularly from US production, growing faster than demand. Libyan supply outages returned to market in the latter half of CY2014, and OPEC decided to maintain its production levels. The year-end price was 17 per cent below the average for the year. Since 30 June 2015, the Dated Brent crude price decreased 21 per cent on 28 August 2015.
NGL: A barrel of natural gas liquids consists mainly of ethane and liquefied petroleum gas (propane and butane). The Mont Belvieu ethane and propane price decreased by 28 per cent and 39 per cent, respectively, during FY2015 following increases in ethane and propane supply. Mont Belvieu butane prices decreased by 35 per cent during FY2015 following a decrease in the West Texas Intermediate oil price. The year-end propane and butane prices were 45 per cent and 35 per cent below the average for the year, respectively. Since 30 June 2015, the Mont Belvieu ethane price decreased seven per cent and the Mont Belvieu propane price increased nine per cent on 31 August 2015.
Copper: The London Metal Exchange (LME) copper cash settlement price decreased by nine per cent in FY2015. The copper price trended downwards during the first seven months amid improved supply, weaker than anticipated consumption and the strengthening of the US dollar. The price decreased to a five-year low in mid-January on short-selling by Chinese-backed hedge funds. The price increased in February, impacted by Chilean supply disruption due to flooding, while softening of Chinese demand dampened prices since May. Since 30 June 2015, the copper price decreased 11 per cent on 28 August 2015.
Iron ore: The Platts 62 per cent iron ore CFR China decreased 42 per cent over FY2015 as low-cost seaborne iron ore supply outpaced demand growth. Productivity and cost compression on the supply side also impacted price as mining companies lowered their cost structures in response to the changed environment. The year-end price was 17 per cent below the average price for the year. Since 30 June 2015, the iron ore CFR price decreased six per cent on 31 August 2015.
Metallurgical coal: The Platts Low-Vol Hard Coking Coal Index decreased by 20 per cent during FY2015. While demand from traditional markets recovered steadily, the price decrease was mainly driven by continuing supply growth and weak Chinese demand. The year-end price was 15 per cent below the average price for the year. Since 30 June 2015, the Hard Coking Coal Index decreased eight per cent on 31 August 2015.
Energy coal: The globalCOAL Newcastle FOB price decreased by 18 per cent during FY2015. The decrease was driven by weak Chinese seaborne demand, despite healthy growth from India, and sustained supply from Australia and Indonesia supported by depreciating currencies. Since 30 June 2015, the Newcastle energy coal price decreased seven per cent on 31 August 2015.
Nickel: The LME cash settlement nickel price increased two per cent during FY2015 though the price decreased over the course of the financial year driven by weak demand and adequate supply, as evidenced by rising LME stocks. The year-end price was 25 per cent below the average price for the year. Since 30 June 2015, the nickel price decreased 14 per cent on 28 August 2015.
Discontinued operations
| | | | | | | | | | | | | | | | | | | | | | | | |
Year ended 30 June (1) | | 2015
Closing | | | 2014
Closing | | | 2013
Closing | | | 2015
Average | | | 2014
Average | | | 2013
Average | |
Aluminium (LME cash) (US$/t) | | | 1,647 | | | | 1,851 | | | | 1,731 | | | | 1,880 | | | | 1,764 | | | | 1,938 | |
Alumina (2) (US$/t) | | | 323 | | | | 312 | | | | 318 | | | | 339 | | | | 321 | | | | 327 | |
Manganese Alloys (3) (US$/t) | | | 821 | | | | 999 | | | | 1,038 | | | | 879 | | | | 1,020 | | | | 1,106 | |
Manganese Ores (4) (US$/dmtu) | | | 2.98 | | | | 4.20 | | | | 5.54 | | | | 3.89 | | | | 4.95 | | | | 5.29 | |
| (1) | Post-demerger BHP Billiton’s results will not be impacted by fluctuations in the prices of commodities (aluminium, alumina, manganese alloys and ores) that no longer form part of post-demerger operations. Refer to section 1.6.4 for more details. |
| (2) | Platts PAX Free on Board (FOB) Australia – market price assessment of calcined metallurgical/smelter grade alumina. |
| (3) | Bulk FerroAlloy high carbon ferromanganese (HCFeMn) Western Europe DDP. |
| (4) | Metal Bulletin manganese ore 44 per cent Mn Cost Insurance Freight (CIF). |
The FY2015 pricing trends for the commodities that comprise our Discontinued operations were as follows:
Aluminium: The LME cash settlement price increased by seven per cent during FY2015. However, price premiums in Japan, Europe and the United States ended lower, reflecting the market surplus on increasing production from China. The year-end price was 12 per cent below the average for the year.
Alumina: The FOB Australia price increased six per cent during FY2015, supported by a lack of bauxite availability as a result of the Indonesian ore ban, and growing demand from China.
Manganese: The Metal Bulletin manganese ore China CIF price decreased 21 per cent during FY2015. Demand growth slowed and the market was well supplied amid high Chinese inventories. The year-end price was 23 per cent below the average price for the year. The Western Europe spot high carbon ferromanganese price decreased 14 per cent during FY2015, driven by persistent oversupply and the currency depreciation of major producers in India, Australia, South Africa and Europe.
Exchange rates
We remain exposed to exchange rate transaction risk on foreign currency sales and purchases, as we believe active currency hedging does not provide long-term benefits to our shareholders. Operating costs and costs of locally sourced equipment are influenced by fluctuations in local currencies, primarily the Australian dollar and Chilean peso. Foreign exchange gains and losses reflected in operating costs owing to fluctuations in the local currencies relative to the US dollar may potentially offset one another. The majority of our sales are denominated in US dollars and we borrow and hold surplus cash predominately in US dollars; those transactions and balances provide no foreign exchange exposure relative to the US dollar functional currency of the Group.
The US dollar strengthened against our main local currencies during FY2015, resulting in stronger average US dollar rates versus the Australian dollar and Chilean peso. Average and closing exchange rates for current and prior periods are contained within note 42 ‘Functional and presentation currency’ to the Financial Statements.
We are also exposed to exchange rate translation risk in relation to net monetary liabilities, being our foreign currency denominated monetary assets and liabilities, including certain debt and other long-term liabilities. Details of our exposure to foreign currency fluctuations are contained within note 23 ‘Financial risk management’ to the Financial Statements.
Changes in product demand and supply
The global economy grew at a modest rate in FY2015 with a mild improvement in developed economies offsetting a moderation in emerging markets.
In China, a slowdown in the property sector and fixed asset investment led to lower economic growth following policy tightening in CY2014. Consumer spending remained resilient reflecting the continued rebalancing of the economy. A number of interest rate reductions, cuts in bank reserve requirements, boosts to infrastructure spending and administrative measures supporting the property market are likely to buttress growth over the remainder of CY2015. In line with our expectations, the economy is growing more slowly, though off a higher base, as it matures over the medium term and the government’s reform program promotes domestic consumption over investment. We expect near-term volatility to continue as the authorities press ahead with reform in a cautious but sustained manner as they seek to improve the efficiency of capital allocation in the economy while maintaining support for employment. However, our robust longer-term outlook for China remains intact as the economy transitions.
The US economy continued to improve despite weakness in the March 2015 quarter caused by severe weather in the northeast and a stronger US dollar. Ongoing strength in the labour market, rising disposable incomes, higher equity markets and improved housing prices supported consumer demand. After a period in which businesses failed to respond to improved economic conditions and higher levels of profitability, corporate investment has begun to show signs of recovery. The Federal Reserve is expected to begin increasing interest rates in the first half of FY2016.
The European Central Bank began a program of quantitative easing in March 2015, which appears to be driving a modest pick-up in economic growth. Activity has improved across the Eurozone, with the exception of Greece, reflecting a broad-based lift in domestic demand and we expect the improvement in growth to continue in FY2016.
Japan’s economy saw growth improve in annualised terms as the year progressed, supported by the Bank of Japan’s quantitative easing and a weaker yen. Growth should be supported by stronger business investment into FY2016. A longer-term, sustainable recovery is contingent on the scale and speed of structural reform.
Commodity prices generally trended downwards in FY2015, with prices for most of our commodities notably lower going into the new financial year.
Chinese steel production declined by 1.3 per cent in the second half of FY2015 versus the corresponding period in FY2014, triggered largely by a slowing construction sector. New construction starts were lower this year due to considerable levels of existing stock. Although China’s steel exports are at an all-time high, we expect subdued crude steel production growth over the remainder of CY2015 with some upside potential should the construction sector recover. However, with steel stock per capita still well below that of developed nations, we expect moderate but sustainable growth in Chinese steel production over the next decade. An extended view on the life cycle of steel usage has resulted in a lower but longer plateau for crude steel production, peaking between 935 Mt and 985 Mt in the middle of the next decade. The implications for pig iron demand, and therefore iron ore and metallurgical coal, are mitigated in the medium term by lower scrap availability as the scrap cycle in China will take longer to develop. Outside China, steel production growth is improving steadily driven by India, the Middle East and South-East Asia.
The supply of most steelmaking raw materials has grown faster than demand. In iron ore, we estimate that approximately 100 Mt of incremental lower cost seaborne supply will enter the market in CY2015, outweighing demand growth. In this context, higher cost Chinese domestic production, along with high-cost seaborne exports, continues to exit the market. Private mines in China have seen their operating rates fall from approximately 90 per cent in CY2011 to approximately 35 per cent today. Many producers have also cut their costs. As a result, the iron ore cost curve has both flattened and fallen from previous levels.
In metallurgical coal, while uneconomic high-cost supply has slowly withdrawn from the seaborne market, prices remain subdued as industry-wide cost reductions and weaker producer currencies against the US dollar support continued production from marginal suppliers. Recent quality restrictions have also weakened China’s import demand but this was partially offset by growth in traditional markets. The long-term outlook remains robust as the supply of premium hard coking coals becomes scarce.
Depreciating currencies have sustained Indonesian and Australian thermal coal exports, prolonging the weak pricing environment. Despite healthy seaborne demand growth from India, China’s import demand has weakened, limiting prospects for price recovery in the near term.
In copper, prices were affected by weaker than expected consumption and the strengthening US dollar. In the near term, new supply under development is expected to keep the market well supplied. However, a deficit is expected to emerge at the end of this decade as grade decline, rising costs and a scarcity of high-quality future development opportunities are likely to constrain the industry’s ability to meet attractive demand growth.
Global crude oil demand growth was outpaced by supply growth putting pressure on prices throughout the year. Despite strong demand growth, liquids supply exceeded demand by 2.6 MMboe/d in the second half of FY2015. We expect prices to remain range bound in the short term due to available supply capacity from the United States and OPEC. The long-term demand outlook remains healthy, underpinned by the transport sector, notably in the Asian region.
US natural gas prices declined during the year as production growth was only partially offset by increased consumption in the power sector. In the longer term, demand is expected to benefit from increasing industrial use, growth in gas-fired power generation and the start of LNG exports. As core acreage is depleted, less productive and higher cost shale areas will be required to meet growing demand. In the LNG market, weaker North Asian end-user demand and ample supply have kept prices subdued.
We expect modest growth of the global economy. In the longer term, urbanisation and industrialisation will remain the primary drivers of commodity demand. The transition to consumption-led growth in emerging economies should provide particular support for industrial metals, energy and fertilisers.
Capital expenditure
Capital expenditure is important in pursuing our strategy through the development of large-scale resource projects and in sustaining our existing operations. Capital expenditure is disclosed for each Business in section 1.6.3 of this Annual Report.
Operating costs
Information in this section has been presented on a Continuing operations basis to exclude the contribution from assets that were demerged with South32, unless otherwise noted. Details of the contribution of the South32 assets to the Group’s results are disclosed in note 29 ‘Discontinued operations’ to the Financial Statements.
As the prices for our products are determined by the global commodity markets in which we operate, we do not generally have the ability to offset cost pressures through corresponding price increases; therefore, controlling our operating costs is a key driver of our results. Operating costs for the last three years are set out in section 1.11.1 as well as an analysis of the change in Total expenses. Further analysis of the factors that impacted expenses during FY2015 is set out below and in section 1.15.3.
In discussing the factors that affected Total expenses, we refer to the change in operating cash costs and change in exploration and business development. Collectively we refer to these as change in controllable cash costs. Operating cash costs by definition do not include non-cash costs being depreciation, amortisation, impairments,
movements in deferred stripping balances and movements in provisions. The change in operating cash costs also excludes the impact of exchange rates and inflation on the actual costs incurred in the corresponding period, changes in fuel and energy costs, changes in exploration and business development costs and one-off items. These items are excluded so as to provide a consistent measurement of changes in costs across all the Businesses based on the factors that are within their control and responsibility.
Change in operating cash costs and change in controllable cash costs are not measures that are recognised under International Financial Reporting Standards (IFRS) and they may differ from similarly titled measures reported by other companies. A reconciliation of the movements in Underlying EBIT to the financial statement line items in the Consolidated Income Statement is included in section 2.5 of this Annual Report.
Our focus on reducing operating costs through productivity initiatives saw a decrease in operating cash costs of US$2.7 billion and a reduction in exploration and business development of US$29 million for a combined reduction in controllable cash costs of US$2.7 billion. In addition, the improvement in operating costs was complemented by favourable exchange rate impacts of US$1.7 billion. These improvements were partially offset by inflation of US$433 million and an increase in the production costs associated with higher volumes of US$3.2 billion. With higher depreciation and amortisation charges of US$1.4 billion and higher impairment charges of US$350 million. Total expenses excluding exceptional items of US$3.2 billion decreased from US$36.5 billion to US$33.8 billion.
Exploration and development of resources
Minerals exploration
Over the past six years, brownfield exploration has increased our reserve base around our portfolio of existing assets in large resource basins, which now provide us with growth opportunities. This has allowed us to reduce brownfield exploration expenditure and rationalise our greenfield exploration program.
Greenfield minerals (new sites) exploration is focused on advancing targets within Chile, Peru, southwestern United States and is organised through our Copper Business. Greenfield activities include opportunity identification, application for and acquisition of mineral title, early reconnaissance operations and multi-million dollar delineation drilling programs.
In addition to our activities focused on finding new world-class deposits, several of our Businesses undertake brownfield exploration, principally aimed at delineating and categorising mineral deposits near existing operations, and advancing projects through the development pipeline.
Our expenditure on minerals exploration over the last three financial years is set out below.
| | | | | | | | | | | | |
Year ended 30 June | | 2015 | | | 2014 | | | 2013 | |
| | US$M | | | US$M
Restated | | | US$M
Restated | |
Greenfield exploration | | | 55 | | | | 46 | | | | 179 | |
Brownfield exploration | | | 194 | | | | 340 | | | | 467 | |
| | | | | | | | | | | | |
Total minerals exploration (1) | | | 249 | | | | 386 | | | | 646 | |
| | | | | | | | | | | | |
| (1) | Excludes minerals exploration from Discontinued operations. |
The Group’s minerals exploration expenditure declined by 36 per cent in FY2015 to US$249 million as we sharpened our focus on advancing copper targets within Chile, Peru and southwestern United States.
Petroleum exploration
We have reduced exploration expenditure in Petroleum over recent years with a focus on high-impact liquids opportunities in the Gulf of Mexico, Western Australia and Trinidad and Tobago.
| | | | | | | | | | | | |
Year ended 30 June | | 2015
US$M | | | 2014
US$M | | | 2013
US$M | |
| | | |
Petroleum exploration | | | 567 | | | | 600 | | | | 675 | |
Exploration expense
Exploration expense represents that portion of exploration expenditure that is not capitalised in accordance with our accounting policies, as set out in note 43 ‘Significant accounting policies’ to the Financial Statements.
Exploration expense for each Business over the three-year period is set out below.
| | | | | | | | | | | | |
Year ended 30 June | | 2015
US$M | | | 2014
US$M
Restated | | | 2013
US$M
Restated | |
| | | |
Exploration expense (1) (2) | | | | | | | | | | | | |
Petroleum and Potash | | | 532 | | | | 544 | | | | 709 | |
Copper | | | 90 | | | | 111 | | | | 266 | |
Iron Ore | | | 38 | | | | 56 | | | | 74 | |
Coal | | | 20 | | | | 29 | | | | 32 | |
Group and unallocated items | | | 18 | | | | 30 | | | | 47 | |
| | | | | | | | | | | | |
BHP Billiton Group | | | 698 | | | | 770 | | | | 1,128 | |
| | | | | | | | | | | | |
| (1) | Excludes exploration expenses from Discontinued operations. |
| (2) | Includes US$28 million (2014: US$72 million; 2013: US$102 million) exploration expense previously capitalised, written off as impaired. |
Following our focus on productivity and reducing costs, the reduction in the Group’s exploration expense, excluding impairment of exploration expenditure previously capitalised, increased Underlying EBIT in FY2015 by US$28 million.
Interest rates
We are exposed to interest rate risk on our outstanding borrowings and investments. Our policy on interest rate exposure is to pay or receive on a US dollar floating interest rate basis. To achieve this policy, we often use derivative financial instruments, including cross currency and interest rate swaps, to convert an underlying exposure to a US dollar floating rate exposure. Deviation from our policy requires approval from our Financial Risk Management Committee and is managed within our portfolio risk management approach.
Our earnings are sensitive to changes in interest rates on the floating component of the Group’s net borrowings. Our main exposure is to the 3 month US LIBOR benchmark, which increased by 0.010 per cent in FY2015 to an average of 0.252 per cent. Further information, including the Group’s sensitivity to movements in interest rates, can be found in note 23 ‘Financial risk management’ to the Financial Statements.
Health, safety, environment and community
We operate in an industry where many of our activities are highly regulated by laws governing health, safety and the environment. We are committed to compliance with the laws and regulations of the countries in which we
operate and, where applicable, to exceeding legal and other requirements which are less stringent than our own. However, regulatory standards and community expectations are constantly evolving. As a result, we may be exposed to increased litigation, compliance costs and unforeseen environmental rehabilitation expenses, despite our best efforts to work with governments, community groups and scientists to keep pace with regulations, law and public expectations.
Further information about our compliance with HSEC regulations can be found in section 1.14 of this Annual Report.
Insurance
During FY2015, we maintained an insurance program encompassing property damage, business interruption, sabotage and terrorism, marine cargo, construction, directors’ and officers’ liability and public and certain other liabilities. The program includes a combination of self-insurance via subsidiary captive insurance companies, industry mutuals and external market insurance and reinsurance. Mandates are established as to risk retention levels, policy cover and, where applicable, insurance and reinsurance counterparty security. As part of our portfolio risk management approach, we regularly conduct an assessment of maximum foreseeable loss potential, cash flow at risk, loss experience, claims received and insurance premiums paid, and will make adjustments to the balance of self-insurance and external insurance and reinsurance as required.
The Group is largely self-insured for losses arising from property damage and business interruption, sabotage and terrorism, marine cargo, construction, primary public liability and employee benefits. For these risks, we internally insure our Businesses (for wholly owned assets and, where permissible, by local insurance regulation and/or commercial market terms our share of joint venture assets) via our captive insurance companies. Any losses incurred will consequently impact the Financial Statements as they arise.
1.15.2 Application of critical accounting policies
The preparation of the Consolidated Financial Statements requires management to make judgements and estimates and form assumptions that affect the amounts of assets, liabilities, contingent liabilities, revenues and expenses reported in the Financial Statements. On an ongoing basis, management evaluates its judgements and estimates in relation to assets, liabilities, contingent liabilities, revenue and expenses. Management bases its judgements and estimates on historical experience and on other factors it believes to be reasonable under the circumstances, the results of which form the basis of the reported amounts that are not readily apparent from other sources. Actual results may differ from these estimates under different assumptions and conditions.
The Group has identified the following critical accounting policies under which significant judgements, estimates and assumptions are made and where actual results may differ from these estimates under different assumptions and conditions and may materially affect financial results or the financial position reported in future periods:
reserve estimates;
exploration and evaluation expenditure;
development expenditure;
taxation;
property, plant and equipment and intangible assets – recoverable amount; and
provision for closure and rehabilitation.
In accordance with IFRS, we are required to include information regarding the nature of the estimates and judgements and potential impacts on our financial results or financial position in the Financial Statements. This information can be found in note 44 ‘Application of accounting estimates, assumptions and judgements’ to the Financial Statements.
1.15.3 Operating results
The following table describes the approximate impact of the principal factors that affected Underlying EBIT for FY2015 and FY2014. Underlying EBIT is earnings before net finance costs, taxation, Discontinued operations and any exceptional items.
| | | | | | | | |
Year ended 30 June | | 2015
US$M | | | 2014
US$M
Restated | |
| | |
Underlying EBIT | | | 22,098 | | | | 21,680 | |
Net price impact: | | | | | | | | |
Change in sales prices | | | (16,433 | ) | | | (2,639 | ) |
Price-linked costs | | | 1,209 | | | | (111 | ) |
| | | | | | | | |
| | | (15,224 | ) | | | (2,750 | ) |
| | | | | | | | |
Change in volumes: | | | | | | | | |
Productivity | | | 1,220 | | | | 1,029 | |
Growth | | | 1,822 | | | | 1,929 | |
| | | | | | | | |
| | | 3,042 | | | | 2,958 | |
| | | | | | | | |
Change in controllable cash costs: | | | | | | | | |
Operating cash costs | | | 2,678 | | | | 1,131 | |
Exploration and business development | | | 29 | | | | 398 | |
| | | | | | | | |
| | | 2,707 | | | | 1,529 | |
| | | | | | | | |
Change in other costs: | | | | | | | | |
Exchange rates | | | 1,567 | | | | 1,188 | |
Inflation on costs | | | (433 | ) | | | (575 | ) |
Fuel and energy | | | 518 | | | | (3 | ) |
Non-cash | | | (1,304 | ) | | | (1,737 | ) |
One-off items | | | (456 | ) | | | – | |
| | | | | | | | |
| | | (108 | ) | | | (1,127 | ) |
| | | | | | | | |
Asset sales | | | (72 | ) | | | 61 | |
Ceased and sold operations | | | 22 | | | | (349 | ) |
Share of operating profit from equity accounted investments | | | (637 | ) | | | 43 | |
Other | | | 38 | | | | 53 | |
| | | | | | | | |
Underlying EBIT | | | 11,866 | | | | 22,098 | |
| | | | | | | | |
The method of calculation of the factors that affected Underlying EBIT and the Financial Statement line items of Revenue, Other income and Expenses (excluding net finance costs) that are affected by the factors are as follows.
| | | | |
Factor affecting
Underlying EBIT | | Method of calculation | | Financial statement line item affected |
Change in sales prices | | Change in average realised price for each operation from the corresponding period to the current period, multiplied by current period volumes. | | Revenue |
| | |
Price-linked costs | | Change in price-linked costs for each operation from the corresponding period to the current period, multiplied by current period volumes. | | Expenses |
| | |
Volumes – Productivity | | Change in volumes for each operation not included in the Growth category from the corresponding period to the current period, multiplied by the prior year Underlying EBIT margin. | | Revenue and Expenses |
| | |
Volumes – Growth | | Volume – Growth comprises Underlying EBIT for operations that are new or acquired in the current period minus Underlying EBIT for operations that are new or acquired in the corresponding period, change in volumes for operations identified as a Growth project from the corresponding period to the current period multiplied by the prior year Underlying EBIT margin, and change in volume for Petroleum Business from the corresponding period to the current period multiplied by the prior year Underlying EBIT margin. | | Revenue and Expenses |
| | |
Operating cash costs | | Change in total costs, other than price-linked costs, exchange rates, inflation on costs, fuel and energy costs, non-cash costs and one-off items as defined below for each operation from the corresponding period to the current period. | | Expenses |
| | |
| Exploration and business development | | Exploration and business development expense in the current period minus exploration and business development expense in the corresponding period. | | Expenses |
| | |
Exchange rates | | Change in exchange rate multiplied by current period local currency revenue and expenses. The majority of the Group’s selling prices are denominated in US dollars and so there is little impact of exchange rate changes on Revenue. | | Revenue and Expenses |
| | |
Inflation on costs | | Change in inflation rate applied to expenses, other than depreciation and amortisation, price-linked costs, exploration and business development expenses, expenses in ceased and sold operations and expenses in new and acquired operations. | | Expenses |
| | |
Fuel and energy | | Fuel and energy expense in the current period minus fuel and energy expense in the corresponding period. | | Expenses |
| | |
Non-cash | | Includes non-cash items, mainly depreciation, amortisation and impairments. | | Expenses |
| | |
One-off items | | Change in costs exceeding a pre-determined threshold associated with an unexpected event that had not occurred in the last two years and is not reasonably likely to occur within the next two years. | | Expenses |
| | | | |
Factor affecting
Underlying EBIT | | Method of calculation | | Financial statement line item affected |
Asset sales | | Profit/loss on the sale of assets or operations in the current period minus profit/loss on sale in the corresponding period. | | Other income |
| | |
| Ceased and sold operations | | Underlying EBIT for operations that are ceased or sold operations in the current period minus Underlying EBIT for operations that are ceased or sold in the corresponding period. | | Revenue, Other income and Expenses |
| | |
| Share of operating profit from equity accounted investments | | Share of operating profit from equity accounted investments for the period minus Share of operating profit from equity accounted investments in the corresponding period. | | Share of operating profit from equity accounted investments |
| | |
Other | | Variances not explained by the above factors. | | Revenue, Other income and Expenses |
A reconciliation of the movements in Underlying EBIT for FY2015 to the Financial Statement line items in the Consolidated Income Statement is included in section 2.5 of this Annual Report.
The following commentary describes the principal factors outlined in the table above for FY2015 and FY2014.
Prices
Lower realised prices reduced Underlying EBIT by US$16.4 billion in FY2015. A 41 per cent decline in the average realised price of iron ore was the major contributor and reduced Underlying EBIT by US$9.5 billion. Weaker average realised prices for our Petroleum, Copper and Coal Businesses decreased Underlying EBIT by US$4.2 billion, US$1.6 billion and US$1.1 billion, respectively. A reduction in price-linked costs increased Underlying EBIT by US$1.2 billion and primarily reflected lower royalty charges in our Iron Ore Business.
Volumes
Productivity-led volume efficiencies and the ramp up of major projects underpinned a US$3.0 billion increase in Underlying EBIT. Western Australia Iron Ore (WAIO) was the major contributor as the improved performance of our integrated supply chain and the ramp-up of the Jimblebar mining hub supported a US$1.9 billion increase in Underlying EBIT. A doubling of liquids production from both Black Hawk and Permian supported a further US$799 million volume-related increase in Petroleum’s Underlying EBIT.
Controllable cash costs
Operating cash costs
Our focus on best-in-class performance underpinned a US$2.7 billion reduction in operating cash costs during FY2015.
A reduction in labour, contractor and maintenance costs increased Underlying EBIT by US$1.5 billion during the period. This was most evident in WAIO where the standardisation of our equipment and maintenance systems, and the insourcing of third party services facilitated a step change in the performance of our mining operations. Mining-related efficiencies contributed to a further US$580 million reduction in cash costs and largely reflected improved productivity at Escondida.
Exploration and business development
The Group’s exploration and business development expenditure was broadly in line with FY2014. Our exploration program remains focused on greenfield copper targets within Chile, Peru and the southwestern United States, and petroleum liquids opportunities in the Gulf of Mexico, Western Australia and Trinidad and Tobago.
Other costs
Exchange rates
A stronger US dollar increased Underlying EBIT by US$1.6 billion during the period. This included the restatement of monetary items in the balance sheet, which increased Underlying EBIT by US$637 million relative to FY2014. Further information can be found in note 42 ‘Functional and presentation currency’ to the Financial Statements.
Inflation on costs
The impact of inflation reduced Underlying EBIT by US$433 million during the period. This was most notable in Australia and Chile, which accounted for over 85 per cent of the total variance.
Fuel and energy
A reduction in diesel prices across our minerals businesses supported a US$518 million increase in Underlying EBIT.
Non-cash
An increase in non-cash charges reduced Underlying EBIT by US$1.3 billion during the period.
A US$839 million increase in non-cash charges in our Copper Business reflects: higher ore mined which resulted in increased depletion of stripping capitalised at Escondida; increased depreciation following the completion of the Escondida Oxide Leach Area Project; and a US$199 million impairment driven by a lower copper price and permitting uncertainty for the proposed mine life extension at Cerro Colorado.
A US$639 million increase in non-cash charges in our Petroleum Business reflects: US$316 million of higher depreciation and amortisation charges in Onshore US following the ramp-up of liquids production at Black Hawk and the progressive development of our Permian acreage; and US$328 million of impairment charges associated with the divestment of assets in north Louisiana and the Pecos field in the Permian. During the period, a US$79 million impairment of Neptune was also recognised as the fall in near-term oil prices has affected its value due to its short field life.
The decrease in non-cash charges relates to mine site rehabilitation provision charges recognised in FY2014 for the Group’s North American closed mines.
One-off items
One-off items recognised during the period comprise a US$268 million expense related to the mill outage at Olympic Dam and US$188 million costs associated with the implementation of the Escondida Voluntary Redundancy Program.
Asset sales
The contribution of asset sales to Underlying EBIT decreased by US$72 million from FY2014, which included the sale of Liverpool Bay.
Ceased and sold operations
Underlying EBIT from ceased and sold operations increased by US$22 million in FY2015. This largely reflected an unfavourable US$143 million adjustment to the Browse divestment proceeds, due to unitisation changes subsequent to the completion of the sale, offset by the closure of the Nickel West Leinster Perseverance underground mine, both during FY2014.
Share of operating profit from equity accounted investments
Lower average realised prices received by our equity accounted investments decreased Underlying EBIT US$637 million.
Net finance costs
Net finance costs decreased by US$300 million to US$614 million. The decrease reflected foreign exchange gains on finance leases and the early redemption of the Petrohawk Energy Corporation Senior Notes in August 2014, which resulted in a gain on redemption and lower interest expense.
Taxation expense
The Group’s adjusted effective tax rate, which excludes the influence of exchange rate movements, remeasurement of deferred tax assets associated with the Minerals Resource Rent Tax (MRRT) and exceptional items, was 31.8 per cent (30 June 2014: 32.2 per cent).
Total taxation expense, including royalty-related taxation, exceptional items and exchange rate movements, was US$3.7 billion, representing a statutory effective tax rate of 45.5 per cent (30 June 2014: 31.2 per cent).
Government imposed royalty arrangements calculated by reference to profits are reported as royalty-related taxation. An exceptional item of US$698 million tax expense (2014: US$ nil) was recognised on a Continuing operations basis for the derecognition of deferred tax assets upon the repeal of the MRRT legislation in Australia.
Adjusted effective tax rate is not an IFRS measure and is reconciled to the Statutory effective tax rate below:
| | | | | | | | | | | | | | | | |
| | | 2015 | | | 2014 | |
| | | | | | Restated | |
Year ended 30 June | | Profit
before tax | | Income tax
expense | | % | | | Profit
before tax | | Income tax
expense | | % | |
| | | US$M | | US$M | | | | | US$M | | US$M | | | |
Statutory effective tax rate | | 8,056 | | (3,666) | | | 45.5 | % | | 21,735 | | (6,780) | | | 31.2 | % |
Less: | | | | | | | | | | | | | | | | |
Exchange rate movements | | – | | 339 | | | | | | – | | (34) | | | | |
Remeasurement of deferred tax assets associated with the MRRT | | – | | – | | | | | | – | | (170) | | | | |
Exceptional items | | 3,196 | | (250) | | | | | | (551) | | 166 | | | | |
| | | | | | | | | | | | | | | | |
Adjusted effective tax rate | | 11,252 | | (3,577) | | | 31.8 | % | | 21,184 | | (6,818) | | | 32.2 | % |
| | | | | | | | | | | | | | | | |
Other royalty and excise arrangements that are not profit based are recognised as operating costs within Profit before taxation. These amounted to US$1.7 billion during the period (30 June 2014: US$2.4 billion).
Exceptional items
| | | | | | | | | | | | |
Year ended 30 June 2015 | | Gross | | | Tax | | | Net | |
| | | US$M | | | US$M | | | US$M | |
Exceptional items by category | | | | | | | | | | | | |
Impairment of Onshore US assets | | | (2,787 | ) | | | 829 | | | | (1,958 | ) |
Impairment of Nickel West assets | | | (409 | ) | | | 119 | | | | (290 | ) |
Repeal of Minerals Resource Rent Tax legislation(1) | | | – | | | | (698 | ) | | | (698 | ) |
| | | | | | | | | | | | |
| | | (3,196 | ) | | | 250 | | | | (2,946 | ) |
| | | | | | | | | | | | |
| (1) | Includes amounts attributable to non-controlling interests of US$(12) million. |
The Group recognised an impairment charge of US$2.0 billion (after tax benefit) in relation to its Onshore US assets. The gas-focused Hawkville field accounts for the substantial majority of this charge reflecting its geological complexity, product mix, acreage relinquishments and amended development plans. The remainder relates to the impairment of goodwill associated with the Petrohawk acquisition.
On 12 November 2014, the Group announced that the review of its Nickel West business was complete and the preferred option, the sale of the business, was not achieved on an acceptable basis. As a result of operational decisions made subsequent to the conclusion of this process, an impairment charge of US$290 million (after tax benefit) was recognised in FY2015.
The legislation to repeal the MRRT in Australia took effect on 30 September 2014. As a result, the Group derecognised a MRRT deferred tax asset of US$809 million, and corresponding taxation charges of US$698 million related to Continuing operations and US$111 million related to Discontinued operations were recognised in FY2015.
Refer to note 2 ‘Exceptional items’ to the Financial Statements for more information.
| | | | | | | | | | | | |
Year ended 30 June 2014 | | Gross | | | Tax | | | Net | |
| | | US$M | | | US$M | | | US$M | |
Exceptional items by category | | | | | | | | | | | | |
Sale of Pinto Valley | | | 551 | | | | (166 | ) | | | 385 | |
| | | | | | | | | | | | |
| | | 551 | | | | (166 | ) | | | 385 | |
| | | | | | | | | | | | |
On 11 October 2013, the Group announced it had completed the sale of its Pinto Valley mining operation for cash consideration of US$653 million, after working capital adjustments. A gain on sale of US$385 million (after tax expense) was recognised in FY2014.
Refer to note 2 ‘Exceptional items’ to the Financial Statements for more information. An analysis of exceptional items for FY2013 are included in section 2.5.5 of this Annual Report.
Discontinued operations
On 25 May 2015, the Group announced that it completed the demerger of a selection of its aluminium, coal, manganese, nickel and silver-lead-zinc assets to create an independent metals and mining company, South32.
South32’s contribution to BHP Billiton’s FY2015 results comprised a US$753 million profit after taxation excluding exceptional items. Exceptional items comprised a tax expense of US$111 million related to the repeal of the MRRT and a net loss on demerger of US$2.2 billion (after tax benefit). This contribution has been included in Attributable loss after taxation from Discontinued operations of US$1.6 billion.
Third party sales
We differentiate sales of our production from sales of third party products due to the significant difference in profit margin earned on these sales. The table below shows the breakdown between our production and third party products.
| | | | | | | | | | | | |
Year ended 30 June (1) | | 2015
US$M | | | 2014
US$M
Restated | | | 2013
US$M
Restated | |
| | | |
Group production | | | | | | | | | | | | |
Revenue | | | 43,457 | | | | 55,045 | | | | 52,637 | |
Related operating costs | | | (31,605 | ) | | | (32,962 | ) | | | (31,021 | ) |
| | | | | | | | | | | | |
Underlying EBIT | | | 11,852 | | | | 22,083 | | | | 21,616 | |
Underlying EBIT Margin | | | 27.3 | % | | | 40.1 | % | | | 41.1 | % |
| | | | | | | | | | | | |
Third party products | | | | | | | | | | | | |
Revenue | | | 1,179 | | | | 1,717 | | | | 1,223 | |
Related operating costs | | | (1,165 | ) | | | (1,702 | ) | | | (1,159 | ) |
| | | | | | | | | | | | |
Operating profit | | | 14 | | | | 15 | | | | 64 | |
Margin on third party products (2) | | | 1.2 | % | | | 0.9 | % | | | 5.2 | % |
| | | | | | | | | | | | |
| (1) | Excluding exceptional items and Discontinued operations. |
| (2) | Operating profit divided by revenue. |
We engage in third party trading for the following reasons:
Production variability and occasional shortfalls from our own assets means that we sometimes source third party materials to ensure a steady supply of product to our customers.
To optimise our supply chain outcomes, we may buy physical product from third parties.
In order to support the development of liquid markets, we will sometimes source third party physical product and manage risk through both the physical and financial markets.
1.15.4 Cash flow analysis
A Consolidated Cash Flow Statement is contained in the Financial Statements. The explanatory notes appear in note 37 ‘Notes to the consolidated cash flow statement’ to the Financial Statements. A summary table has been presented below to show the key sources and uses of cash.
| | | | | | | | | | | | |
Year ended 30 June | | 2015
US$M | | | 2014
US$M
Restated | | | 2013
US$M
Restated | |
| | | |
Cash generated from operations | | | 21,620 | | | | 29,318 | | | | 27,026 | |
Dividends received | | | 740 | | | | 1,264 | | | | 716 | |
Net interest paid | | | (541 | ) | | | (795 | ) | | | (848 | ) |
Taxation paid | | | (4,025 | ) | | | (6,147 | ) | | | (7,877 | ) |
| | | | | | | | | | | | |
Net operating cash flows from Continuing operations | | | 17,794 | | | | 23,640 | | | | 19,017 | |
| | | | | | | | | | | | |
Net operating cash flows from Discontinued operations | | | 1,502 | | | | 1,724 | | | | 1,137 | |
| | | | | | | | | | | | |
Net operating cash flows | | | 19,296 | | | | 25,364 | | | | 20,154 | |
| | | | | | | | | | | | |
Purchases of property plant and equipment | | | (11,947 | ) | | | (15,224 | ) | | | (21,104 | ) |
Exploration expenditure | | | (816 | ) | | | (986 | ) | | | (1,321 | ) |
Exploration expenditure expensed and included in operating cash flows | | | 670 | | | | 698 | | | | 1,026 | |
Purchases of intangibles | | | (98 | ) | | | (192 | ) | | | (380 | ) |
Investment in financial assets | | | (15 | ) | | | (1,168 | ) | | | (455 | ) |
Investment in equity accounted investments | | | (71 | ) | | | (44 | ) | | | (84 | ) |
Net proceeds from investing activities | | | 775 | | | | 1,782 | | | | 4,697 | |
| | | | | | | | | | | | |
Net investing cash flows from Continuing operations | | | (11,502 | ) | | | (15,134 | ) | | | (17,621 | ) |
| | | | | | | | | | | | |
Net investing cash flows from Discontinued operations | | | (1,066 | ) | | | (700 | ) | | | (1,105 | ) |
| | | | | | | | | | | | |
Cash disposed on demerger of South32 | | | (586 | ) | | | – | | | | – | |
| | | | | | | | | | | | |
Net investing cash flows | | | (13,154 | ) | | | (15,834 | ) | | | (18,726 | ) |
| | | | | | | | | | | | |
Net (repayment of)/proceeds from interest bearing liabilities | | | (728 | ) | | | (1,011 | ) | | | 7,255 | |
Dividends paid | | | (7,052 | ) | | | (6,506 | ) | | | (6,945 | ) |
Contributions from non-controlling interests | | | 53 | | | | 1,435 | | | | 73 | |
Other financing activities | | | (346 | ) | | | (354 | ) | | | (433 | ) |
| | | | | | | | | | | | |
Net financing cash flows from Continuing operations | | | (8,073 | ) | | | (6,436 | ) | | | (50 | ) |
| | | | | | | | | | | | |
Net financing cash flows from Discontinued operations | | | (203 | ) | | | (32 | ) | | | (148 | ) |
| | | | | | | | | | | | |
Net financing cash flows | | | (8,276 | ) | | | (6,468 | ) | | | (198 | ) |
| | | | | | | | | | | | |
Net (decrease)/increase in cash and cash equivalents from Continuing operations | | | (1,781 | ) | | | 2,070 | | | | 1,346 | |
| | | | | | | | | | | | |
Net increase/(decrease) in cash and cash equivalents from Discontinued operations | | | 233 | | | | 992 | | | | (116 | ) |
| | | | | | | | | | | | |
Cash disposed on demerger of South32 | | | (586 | ) | | | – | | | | – | |
| | | | | | | | | | | | |
Net operating cash flows from Continuing operations after interest and tax decreased by 25 per cent to US$17.8 billion during FY2015. The major contributor was the US$7.7 billion decrease in cash generated from operations (after changes in working capital balances), which was partially offset by a decrease of US$2.1 billion in net taxes paid.
Net investing cash outflows from Continuing operations decreased by US$3.6 billion to US$11.5 billion during FY2015 and reflected a US$3.4 billion reduction in capital and exploration expenditure. Expenditure on growth projects totalled US$9.3 billion, including US$4.5 billion on Petroleum projects and US$4.8 billion on Minerals projects. Sustaining capital expenditure and other items totalled US$2.6 billion. Exploration expenditure was US$816 million, including US$670 million classified within net operating cash flows.
Net financing cash outflows from Continuing operations increased by US$1.6 billion to US$8.1 billion. A decrease in proceeds from interest bearing liabilities of US$2.6 billion, a decrease in contributions fromnon-controlling interests of US$1.4 billion and higher dividends paid to non-controlling interests of US$435 million were partially offset by a decrease in repayments of interest bearing liabilities of US$2.9 billion during FY2015.
1.15.5 Net debt and sources of liquidity
Our policies on debt and liquidity management pursue the following objectives:
a solid ‘A’ credit rating;
gearing to be a maximum of 40 per cent;
diversification of funding sources;
maintain borrowings and excess cash predominantly in US dollars.
Gearing and net debt
Net debt, comprising Interest bearing liabilities less Cash and cash equivalents, was US$24.4 billion, which represented a decrease of US$1.4 billion compared with the net debt position at 30 June 2014. Gearing, which is the ratio of net debt to net debt plus net assets, was 25.7 per cent at 30 June 2015, compared with 23.2 per cent at 30 June 2014. IFRS 5/AASB 5 ‘Non-current Assets Held for Sale and Discontinued Operations’ does not require the Consolidated Balance Sheet to be restated for comparative periods. The FY2014 figures therefore includes assets and liabilities of the Businesses demerged with South32. For information relating to Discontinued operations refer to note 29 ‘Discontinued operations’ to the Financial Statements.
Cash and cash equivalents less overdrafts at 30 June 2015 was US$6.6 billion compared with US$8.8 billion at 30 June 2014. Included within Cash and cash equivalents were short-term deposits of US$5.8 billion compared with US$7.1 billion at 30 June 2014.
Funding sources
During FY2015, we issued the following long-term debt:
In March 2015, we issued an A$1.0 billion 3.000 per cent Australian bond due 2020.
In April 2015, we issued a three tranche Euro bond comprising €600 million Floating Rate Notes due 2020 paying three-month Euribor plus 0.350 per cent, €650 million 0.750 per cent bonds due 2022 and €750 million 1.500 per cent bonds due 2030.
None of our Group-level borrowing facilities are subject to financial covenants. Certain specific financing facilities in relation to specific Businesses are the subject of financial covenants that vary from facility to facility, but which would be considered normal for such facilities.
In addition to the Group’s uncommitted debt issuance programs, we hold the following committed standby facilities.
| | | | | | | | | | | | | | | | | | | | | | | | |
| | | Facility
available
2015 | | | Drawn
2015 | | | Undrawn
2015 | �� | | Facility
available
2014 | | | Drawn
2014 | | | Undrawn
2014 | |
| | | US$M | | | US$M | | | US$M | | | US$M | | | US$M | | | US$M | |
Revolving credit facility (1) | | | 6,000 | | | | – | | | | 6,000 | | | | 6,000 | | | | – | | | | 6,000 | |
| | | | | | | | | | | | | | | | | | | | | | | | |
Total financing facilities | | | 6,000 | | | | – | | | | 6,000 | | | | 6,000 | | | | – | | | | 6,000 | |
| | | | | | | | | | | | | | | | | | | | | | | | |
| (1) | The Group’s committed US$6.0 billion revolving credit facility operates as a back-stop to the Group’s uncommitted commercial paper program. The combined amount drawn under the facility or as commercial paper will not exceed US$6.0 billion. As at 30 June 2015, US$ nil commercial paper was drawn (2014: US$ nil), therefore US$6.0 billion of committed facility was available to use (2014: US$6.0 billion). The revolving credit facility has a five-year maturity with one remaining one-year extension option. A commitment fee is payable on the undrawn balance and an interest rate comprising an interbank rate plus a margin applies to any drawn balance. The agreed margins are typical for a credit facility extended to a company with the Group’s credit rating. |
Additional information regarding the maturity profile of our debt obligations and details of our standby and support agreements is included in note 23 ‘Financial risk management’ to the Financial Statements.
The Group’s credit ratings are currently A1/P-1 (Moody’s – long-term/short-term) and A+/A-1 (Standard & Poor’s – long-term/short-term). The credit ratings from both agencies remained unchanged in FY2015, however on 4 May 2015 Standard & Poor’s revised the Group’s ratings outlook to negative from stable.
1.15.6 Other information
Quantitative and qualitative disclosures about market risk
We identified our primary market risks in section 1.15.1 of this Annual Report. A description of how we manage our market risks, including both quantitative and qualitative information about our market risk sensitive instruments outstanding at 30 June 2015, is contained in note 23 ‘Financial risk management’ to the Financial Statements.
Off-balance sheet arrangements and contractual commitments
Information in relation to our material off-balance sheet arrangements, principally contingent liabilities, commitments for capital expenditure and commitments under leases at 30 June 2015 is provided in note 34 ‘Commitments’ and note 35 ‘Contingent liabilities’ to the Financial Statements.
Subsidiary information
Information about our significant subsidiaries is included in note 30 ‘Subsidiaries’ to the Financial Statements.
Related party transactions
Related party transactions are outlined in note 33 ‘Related party transactions’ to the Financial Statements.
Significant changes since the end of the year
Significant changes since the end of the year are outlined in note 36 ‘Subsequent events’ to the Financial Statements.
The Strategic Report is made in accordance with a resolution of the Board.
Jac Nasser AO
Chairman
Dated: 10 September 2015
2 Business overview
2.2.12.1 Business Groups
2.1.1 Petroleum and Potash Business
Our Petroleum and Potash Business headquartered in Houston, United States, comprises conventional and non-conventional oil and gas operations and a potash project based in Saskatchewan, Canada.
Petroleum
Our Petroleum Business includes exploration, development, production and marketing activities in more than 12 countries around the globe.activities. We have a high-quality resource base concentrated in the United States and Australia. Our core production operations are located in the deepwaterUS Gulf of Mexico, Onshore USAustralia and Australia, as well as in the United Kingdom, Algeria, Trinidad and Tobago (conventional) and Pakistan.Onshore US (unconventional). We produce crude oil and condensate, natural gas and natural gas liquids (NGLs). Our headquarters are located in Houston, Texas, United States.
The Petroleum portfolio was expanded in 2011, when we made a significant investment in the unconventional shale business with the acquisition of the Fayetteville shale area in the US state of Arkansas, from Chesapeake Energy Corporation. Later that same year, we purchased Petrohawk Energy Corporation, which held acreages in the US states of Texas and Louisiana. Together these acquisitions now form our Onshore US operations.
Our overall production for FY2013FY2015 was 235.8255.7 million barrels of oil equivalent (MMboe). This was mainly attributable to our US and Australian operations, which produced 129.8162.3 MMboe and 79.977.7 MMboe, respectively, with the majority of US production coming from Onshore US, which produced 99.2125.7 MMboe. Operations outside Australia and the United States delivered the remaining production volumes. Information relating to our oil and gas reserves is set out in section 2.13.1.2.3.1.
During FY2013,In line with our aim of simplification and a sharper strategic focus, we completed the sale ofcontinue to evaluate our 8.33 per cent interestexisting portfolio in the East Browse Joint Venture and 20 per cent interest in the West Browse Joint Venture, located offshore Western Australia,order to PetroChina International Investment (Australia) Pty Ltd for US$1.7 billion, inclusive of customary purchase price adjustments.optimise our position around our core business.
United States
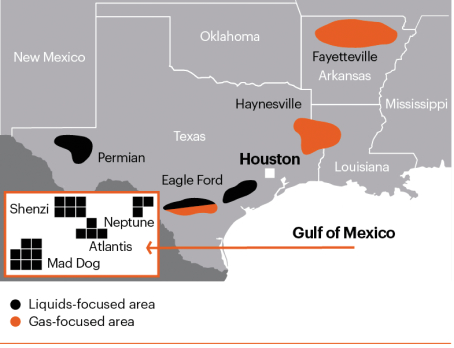
Our production operations include:
United Statesinclude the following:
Gulf of Mexico
We operate two fields in the Gulf of Mexico (Shenzi with a 44 per cent interest and Neptune with a 35 per cent interest) and hold non-operating interests in three other fields (Atlantis with a 44 per cent interest, Mad Dog with a 23.9 per cent interest, and Genesis with a 4.95 per cent interest). We have ongoing infill drilling in most of our Gulf of Mexico fields and also planned ongoing water injection wells at the Shenzi and Atlantis fields. All the fields are located 155–between 155 and 210 kilometres offshore from the US state of Louisiana, United States.Louisiana. We also own 25 per cent and 22 per cent, respectively, of the companies that own and operate the Caesar oil pipeline and the Cleopatra gas pipeline. These pipelines transport oil and gas from the Green Canyon area, where allour Gulf of ourMexico fields are located, to connecting pipelines that transport product onshore. Our US oil production is delivered to refineries along the Gulf Coast of the United States.
Onshore US
We produce oil, NGLscondensate, gas and natural gasNGLs in four shale areas: Eagle Ford, Permian, Haynesville and Fayetteville. The Eagle Ford area has two fields, Black Hawk and Hawkville. The Permian area consists of the Delaware and South Midland basins.
Our combined leasehold acreage onshore in the United States is approximately 1.5 million net acres. Our ownership interests in those leases range from less than one per cent to 100 per cent. At 30 June 2013, we held an interest in approximately 7,200 gross wells and approximately 2,300 net wells. We acted as joint venture operator for approximately 33 per cent of our gross wells. Production in FY2013 was 99.2 MMboe up from 85.6 MMboe in FY2012.
Onshore US shale areas

Shale reservoirs are characterised by low permeability, so it is necessary to stimulate the reservoir to create additional permeability and, therefore, the flow of liquids and gas to the wellbore. Extracting oil and gas from shale involves hydraulic fracturing. Hydraulic fracturing, which is a process developed to efficiently access supplies of oil and natural gas locked inside dense subsurface rock formations, such as shale. Hydraulic fracturing involves usingthe use of water, sand and a small amount of chemicals to fracture the hydrocarbon-bearing rock formation to allow the well to produce commercial volumes.
The development phase of an onshore shale operation requires an extensive drilling and completion program, which may include associated gas compression and treatment facilities and connecting pipelines. Much of our
development of the shale reservoirs utilises horizontal drilling with average lateral lengths between 1,200 and 1,500 metres. We enter into service contracts with third parties to provide drilling and completion services at our operated sites. At the end of FY2013, we had 40 drilling rigs in operation.
The Eagle Ford and Permian areas are focused on hydrocarbon liquids. The Eagle Ford area is located in south Texas, where our leasehold acreage comprises 0.3 million net acres. The Permian area is located in west Texas, where our leasehold acreage comprises 0.5 million net acres. During FY2013, we continued to drill and evaluate the Permian area. Production volume from the Permian area was 1 MMboe. The combined production in FY2013 from our liquids-focused Eagle Ford and Permian areas was 33.4 MMboe, with a production mix of 42 per cent natural gas, 23 per cent NGLs and 35 per cent crude oil and condensate.
The Haynesville and Fayetteville areas are focused on natural gas. The Haynesville area is located in northwest Louisiana and east Texas, where our leasehold acreage comprises 0.2 million net acres. The Fayetteville field is located in north central Arkansas, where our leasehold acreage comprises 0.4 million net acres. The Haynesville and Fayetteville areas had combined production in FY2013 of 65.8 MMboe of natural gas.
Oil and gas production is sold domestically in the United States, with connections to intrastate and interstate pipelines. Prices for oil, NGLs and natural gas are based on US regional price indices;indices, including West Texas Intermediate prices for oil, Henry Hub pricesrelevant published US regional gas indices for natural gas and Mont Belvieu prices for NGLs.
Eagle Ford
The Eagle Ford production operation is located primarily in the southern Texas counties of DeWitt, Karnes, McMullen and LaSalle. We produce oil, condensate, gas and NGLs from two fields, Black Hawk and Hawkville. The oil and gas produced is sold domestically in the United States, via connections to intrastate and interstate pipelines, and internationally through the export of processed condensate from Black Hawk. The Eagle Ford gathering system consists of 1,602 kilometres of gathering lines that deliver gathered volumes to five central delivery points (CDPs), from where processed volumes are transported to market.
Our Black Hawk acreage comprises 0.1 million net acres and is located primarily in the DeWitt and Karnes Counties in southern Texas. Our ownership interests range from five per cent to 100 per cent. A majority of our interest (50 per cent share) in the Black Hawk is held with Devon Energy. At 30 June 2015, we held an interest in approximately 772 gross wells and approximately 427 net wells. We acted as joint venture operator for approximately 15 per cent of our gross wells.
Our Hawkville acreage comprises 0.2 million net acres and is located primarily in the McMullen and La Salle Counties in southern Texas. Our ownership interests range from nine per cent to 100 per cent. At 30 June 2015, we held an interest in approximately 494 gross wells and approximately 409 net wells. We acted as joint venture operator for approximately 84 per cent of our gross wells.
Permian
The Permian production operation consists of 0.2 million net acres and is primarily located in the western Texas county of Reeves. We produce oil, gas and NGLs. The oil and gas produced is sold domestically in the United States, via connections to intrastate and interstate pipelines. Our ownership interests range from 14 per cent to 100 per cent. At 30 June 2015, we held an interest in approximately 81 gross wells and approximately 75 net
wells. We acted as joint venture operator for approximately 93 per cent of our gross wells. The Permian gathering system consists of 145 kilometres of gathering lines that deliver gathered volumes to third party CDPs, from where processed volumes are transported to market. During FY2015, as part of our continued focus on investing and operating core assets, we sold our interest in our upstream Onshore US Pecos shale operation, located in the Permian Basin, to Silverback Exploration, LLC for a cash consideration of US$75 million. We also sold our Pecos midstream operations to EagleClaw Midstream, LLC for a cash consideration of US$52 million.
Haynesville
The Haynesville production operation is located primarily in northern Louisiana and consists of 0.2 million net acres. We produce gas that is sold domestically in the United States, via connections to intrastate and interstate pipelines. Our ownership interests range from less than one per cent to 100 per cent. At 30 June 2015, we held an interest in approximately 1,045 gross wells and approximately 395 net wells. We acted as joint venture operator for approximately 37 per cent of our gross wells. During FY2015, as part of our continued focus on investing and operating core assets, we sold our interest in our Onshore North Louisiana conventional operations to JW Operating Company for a cash consideration of US$135 million.
Fayetteville
The Fayetteville production operation is located in north central Arkansas and consists of 0.4 million net acres. We produce gas that is sold domestically in the United States, via connections to intrastate and interstate pipelines. Our ownership interests range from less than one per cent to 100 per cent. At 30 June 2015, we held an interest in approximately 4,950 gross wells and approximately 1,070 net wells. We acted as joint venture operator for approximately 20 per cent of our gross wells. The Fayetteville gathering system consists of 763 kilometres of gathering lines that deliver gathered volumes to 14 CDPs, from where processed volumes are transported to market.
Australia
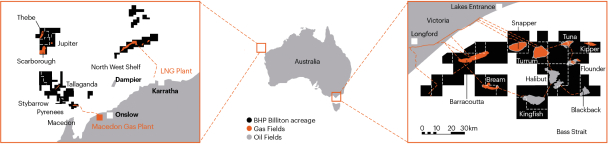
Bass Strait
Together with our 50-50 joint venture partner, Esso Australia (a subsidiary of ExxonMobil), through the Gippsland Basin Joint Venture, we participated in the original discovery of hydrocarbons in 1965 and we have been producing oil and gas from Bass Strait for overmore than 40 years, having participated in the original discovery of hydrocarbons in 1965.years. The Bass Strait operations are located between 25 and 80 kilometres off the southeastern coast of Australia.
We sell the majority of our Bass Strait crude oil and condensate production to refineries along the east coast of Australia under 12-month term contracts. The contract price is based on the average Dated Brent price. Gas is piped onshore to the joint venture’s Longford processing facility, from whichwhere we sell our share of production to domestic distributors under contracts with periodic price reviews. Liquefied petroleum gas (LPG) is dispatched via pipeline, road tanker or sea tanker. Ethane is dispatched via pipeline to petrochemical plants in western Melbourne.
Minerva
We are the operator of Minerva (90 per cent interest), a gas field located 11 kilometres south-southwest of Port Campbell in western Victoria. The operation consists of two subsea wells, with gas piped onshore to a processing plant. After processing, the gas is delivered into a pipeline and sold domestically onunder long-term contracts.
North West Shelf
We are a joint venture participant in the North West Shelf Project, located approximately 125 kilometres northwest of Dampier in Western Australia. The North West Shelf Project was developed in phases: the domestic gas phase supplies gas to the Western Australian domestic market, mainly under long-term contracts, and a series of liquefied natural gas (LNG) expansion phases supplying LNG to buyers in Japan, South Korea and China under a series of long-term contracts. Gas
North West Shelf gas is piped from the fields to the Karratha Gas Plant for processing. Liquefied petroleum gas (LPG),LPG, condensate and LNG are transported to market by ship, while domestic gas is transported by the Natural Gas and Pilbara Energy pipelines. We are also a joint venture participantpartner in four nearby oil fields.fields – Cossack, Wanaea, Lambert and Hermes. All the North West Shelf gas and oil joint ventures are operated by Woodside.
Pyrenees
We operate threesix oil fields in Pyrenees, which are located offshore approximately 23 kilometres northwest of Northwest Cape, Western Australia. We had an effective 62 per cent interest in the fields as at 30 June 2013,
2015, based on inception to dateinception-to-date production from two permits in which we have interests of 71.43 per cent and 40 per cent, respectively. This percentage fluctuates depending on the proportion of production from the various fields. The project uses a Floating, Production, Storagefloating, production, storage and Off-takeoff-take (FPSO) facility. The crude oil produced is sold internationally on the spot market.
Macedon
We are the operator of Macedon (71.43 per cent interest), an offshore gas field located approximately 75 kilometres west of Onslow, Western Australia, and an onshore gas processing facility, located approximately 17 kilometres southwest of Onslow. The operation achieved first gas in August 2013 and consists of four subsea wells, with gas piped onshore to the processing plant. After processing, the gas is delivered into a pipeline and sold into the Western Australian domestic market, mainly under long-term contracts.
Stybarrow
We operate an oil fieldare the operator of Stybarrow (50 per cent interest) in Stybarrow, which is, an oil field located 55 kilometres west-northwest of Exmouth, Western Australia. The project uses a FPSO facility. The crude oil produced is sold internationally on the spot market. Stybarrow reached the end of its field life and ceased production on 30 June 2015.
Other production operations
Algeria
Our Algerian operations comprise an effective 38 per cent interest in the ROD Integrated Development, which consists of six satellite oil fields that pump oil back to a dedicated processing train and is sold on a spot basis to international markets. Our interest in ROD is subject to a contractual determination to ensure interest from participating association leases is accurately reflected. Future redetermination of our interest may be possible under certain conditions.
United Kingdom
We hold a 16 per cent non-operating interest in the Bruce oil and gas field in the North Sea and operate the Keith oil and gas field (31.83 per cent share), a subsea tie-back, which is processed via the Bruce platform facilities.
We are also the operator of Liverpool Bay, United Kingdom (46.1 per cent interest). The integrated development consists of five producing offshore oil and gas fields in the Irish Sea, located approximately 10 kilometres off the northwest coast of England, the Point of Ayr onshore processing plant in North Wales and associated infrastructure. We deliver the Liverpool Bay gas by pipeline to E.ON’s Connah’s Quay power station. The crude oil produced is sold internationally on the spot market.
Trinidad and Tobago
We operate the Greater Angostura field (45 per cent interest in the production sharing contract), an integrated oil and gas development, located offshore, 40 kilometres east of Trinidad. The crude oil is sold on a spot basis to international markets, while the gas is sold domestically onunder term contracts.
Algeria
Our Algerian operations comprise an effective 38 per cent interest in the ROD Integrated Development, which consists of six satellite oil fields that pump oil back to a dedicated processing train. The oil is sold on a spot basis to international markets. Our interest in ROD is subject to a contractual determination with our joint venture partner ENI, which could result in a future change in our interest under certain conditions.
United Kingdom
We hold a 16 per cent non-operating interest in the Bruce oil and gas field in the North Sea and operate the Keith oil and gas field (31.83 per cent interest), a subsea tie-back. Oil and gas from both fields is processed via the Bruce platform facilities.
Pakistan
We operate the Zamzama gas project (38.5 per cent interest) in the Sindh province of Pakistan. Both gas and condensate are sold domestically onunder term contracts in accordance with the Pakistan GovernmentGovernment’s pricing policies.
During February 2015, BHP Billiton and Tri-Resources Investments Inc. (a subsidiary of the Hashoo Group) signed a share purchase agreement for the acquisition by Tri-Resources of BHP Billiton’s entire interest in BHP Petroleum (Pakistan), which holds a 38.5 per cent interest in the Zamzama Joint Venture. Completion of the transaction is subject to receipt of regulatory approvals and other customary closing conditions.
Information on Petroleum operations
The following table contains additional details of our production operations. This table should be read in conjunction with the production (see(refer to section 2.3.1)2.2.1) and reserve tables (see(refer to section 2.13.1)2.3.1).
| | | | | | | | | | | | |
Operation &
location | | Product | | Ownership | | Operator | | Title, leases or options | | Nominal production
capacity | | Facilities, use & condition |
United States | | | | | | | | | | |
Neptune (Green (Green Canyon 613)
| | | | | | | | | | | | |
Offshore Deepwater
deepwater Gulf of Mexico (1,300 m) (1,300m)
| | Oil and gas | | BHP Billiton 35% Marathon Oil 30% Woodside EnergyW&T Offshore 20% Maxus US Exploration 15% | | BHP Billiton | | Lease from US Government as long as oil and gas produced in paying quantities | | 50 Mbbl/d oil 50 MMcf/d gas | | Permanently moored tension leg platform (TLP) |
| | | | | | |
Shenzi (Green (Green Canyon 653)
| | | | | | | | | | | | |
Offshore Deepwater
deepwater Gulf of Mexico (1,310 m)(1,310m)
| | Oil and gas | | BHP Billiton 44% Hess Corporation 28% Repsol 28% | | BHP Billiton | | Lease from US Government as long as oil and gas produced in paying quantities | | 100 Mbbl/d oil 50 MMcf/d gas | | Stand-alone TLP Genghis Khan field (part of same geological structure) tied back to Marco Polo TLP |
| | | | | | |
Atlantis (Green (Green Canyon 743)
| | | | | | | | | | | | |
Offshore Deepwaterdeepwater
Gulf of Mexico (2,155 m)(2,155m)
| | Oil and gas | | BHP Billiton 44% BP 56% | | BP | | Lease from US Government as long as oil and gas produced in paying quantities | | 200 Mbbl/d oil 180 MMcf/d gas | | Permanently moored semi-submersible platform |
| | | | | | |
Mad Dog (Green (Green Canyon 782)
| | | | | | | | | | | | |
Offshore Deepwaterdeepwater
Gulf of Mexico (1,310 m)(1,310m)
| | Oil and gas | | BHP Billiton 23.9% BP 60.5% Chevron 15.6% | | BP | | Lease from US Government as long as oil and gas produced in paying quantities | | 80 Mbbl/d oil 60 MMcf/d gas | | Permanently moored integrated truss spar, facilities for simultaneous production and drilling operations |
| | | | | | | | | | | | |
Operation &
location | | Product | | Ownership | | Operator | | Title, leases or options | | Nominal production
capacity | | Facilities, use & condition |
Genesis (Green (Green Canyon 205)
| | | | | | | | | | | | |
Offshore Deepwaterdeepwater
Gulf of Mexico (approximately 790 m)790m) | | Oil and gas | | BHP Billiton 4.95% Chevron 56.67% ExxonMobil 38.38% | | Chevron | | Lease from US Government as long as oil and gas produced in paying quantities | | 55 Mbbl/d oil 72 MMcf/d gas | | Floating cylindrical hull (spar) moored to seabed with integrated drilling facilities |
| | | | | |
Onshore US Eagle Ford | | | | | | | | | | |
Blackhawk / Hawkville Onshore, USsouthern Texas | | Oil, condensate, gas and NGL | | Blackhawk – BHP Billiton working interest in wells range from 5% to 100% BHP Billiton average net working interest is approximately 55% Largest partners include Devon Energy Hawkville – BHP Billiton working interest in wells range from 9% to 100% BHP Billiton average net working interest is approximately 83% Largest partners include Lewis Energy, Swift Energy & Hunt Oil Company | | Blackhawk – BHP Billiton operated approximately 15% of approximately 772 gross wells Hawkville – BHP Billiton operated approximately 84% of approximately 494 gross wells | | Blackhawk – we currently own leasehold interests in approximately 0.1 million net acres Leases associated with producing wells remain in place as long as oil and gas is produced in paying quantities Hawkville – we currently own leasehold interests in approximately 0.2 million net acres Leases associated with producing wells remain in place as long as oil and gas is produced in paying quantities | | Blackhawk – average daily production during FY2015 130 MMcf/d gas 82 Mbbl/d oil and condensate 24 Mbbl/d NGL Hawkville – average daily production during FY2015 168 MMcf/d gas 15 Mbbl/d oil and condensate 17 Mbbl/d NGL | | Producing oil and gas wells and associated pipeline and compression facilities |
| | | | | | |
| Permian | | | | | | | | | | | | |
Fayetteville,
Arkansas
Eagle Ford,
SouthPermian, western Texas
Haynesville,
Northern
Louisiana and
east Texas
Permian, west Texas
| | Oil, condensate, gas and NGL | | BHP Billiton working interest in leaseswells range from <1%14% to 100% BHP Billiton average net working interest is approximately 32%93% LargestResidual ownership held by multiple partners include
Southwestern Energy, XTO, JW Energy
| | BHP Billiton operated approximately 33%93% of over 7,200approximately 81 gross wells | | We currently own leasehold interests in approximately 1.50.2 million net acres: Fayetteville – 0.4 million acres
Eagle Ford – 0.3 million acres
Haynesville – 0.2 million acres
Permian – 0.5 million acres
Other – 0.1 million acres
Leases associated with producing wells remain in place as long as oil and gas is produced in paying quantities | | Average daily production during FY2013FY2015 1,31330 MMcf/d gas
32.110 Mbbl/d oil and condensate
20.94 Mbbl/d NGL
| | Fayetteville – producing gas wells with associated pipeline and compression infrastructure
Eagle Ford – producing oil and gas wells and associated pipeline and compression facilities
Haynesville – producing gas wells with a third party operated pipeline network
Permian –Producing oil and gas wells with associated gathering systems, processing plant and compression facilities
All production from Onshore US fields is transported to various intrastate and interstate pipelines through multiple interconnects
|
| | | | | | | | | | | | |
Operation &
location | | Product | | Ownership | | Operator | | Title, leases or options | | Nominal production
capacity | | Facilities, use & condition |
| Haynesville | | | | | | | | | | | | |
| Haynesville, northern Louisiana and eastern Texas | | Gas | | BHP Billiton working interest in wells range from less than 1% to 100% BHP Billiton average networking interest is approximately 38% Largest partners include Chesapeake Energy and Exco Resources | | BHP Billiton operated approximately 37% of approximately 1,045 gross wells | | We currently own leasehold interests in approximately 0.2 million net acres Leases associated with producing wells remain in place as long as oil and gas is produced in paying quantities | | Average daily production during FY2015 446 MMcf/d gas | | Producing gas wells with an associated pipeline owned by a third party and compression infrastructure |
| | | | | | |
| Fayetteville | | | | | | | | | | | | |
| Fayetteville, northern central Arkansas | | Gas | | BHP Billiton working interest in wells range from less than 1% to 100% BHP Billiton average net working interest is approximately 22% Largest partners include Southwestern Energy and XTO Energy | | BHP Billiton operated approximately 20% of approximately 4,950 gross wells | | We currently own leasehold interests in approximately 0.4 million net acres Leases associated with producing wells remain in place as long as oil and gas is produced in paying quantities | | Average daily production during FY2015 379 MMcf/d gas | | Producing gas wells with associated pipeline and compression infrastructure |
| | | | | | |
| Australia | | | | | | | | | | | | |
| | | | | | |
| Bass Strait | | | | | | | | | | | | |
Offshore and onshore Victoria | | Oil and gas | | Gippsland Basin Joint Venture (GBJV): BHP Billiton 50% Esso Australia (Exxon Mobil subsidiary) 50% Oil Basins Ltd 2.5% royalty interest in 19 production licences Kipper Unit Joint Venture (KUJV): BHP Billiton 32.5% Esso Australia 32.5% Santos Offshore Pty Ltd 35% | | Esso Australia | | 20 production licences and 2 retention leases issued by Australian Government Expire between 2016 and end of life of field One production licence held with Santos Ltd | | 200 Mbbl/d oil 1,075 MMcf/d gas 5,150 tpd LPG 850 tpd ethane | | 20 producing fields with 2123 offshore developments (14(15 steel jacket platforms, 34 subsea developments, 2 steel gravity based mono towers, 2 concrete gravity based platforms) Onshore infrastructure: – Longford facility (3 gas plants, liquid processing facilities) – Interconnecting pipelines – Long Island Point LPG and oil storage facilities – Ethane pipeline |
| | | | | | |
Minerva | | | | | | | | | | | | |
Offshore and
onshore
Victoria
| | Gas and condensate | | BHP Billiton 90%
Santos (BOL) 10%
| | BHP Billiton | | Production licence issued by Australian Government expires 5 years after production ceases | | 150 TJ/d gas
600 bbl/d condensate
| | 2 well completions
Single flow line transports gas to onshore gas processing facility
Gas plant located approximately 4 km inland from Port Campbell
|
| | | | | | | | | | | | |
Operation &
location | | Product | | Ownership | | Operator | | Title, leases or options | | Nominal production
capacity | | Facilities, use & condition |
| Minerva | | | | | | | | | | | | |
| Offshore and onshore Victoria | | Gas and condensate | | BHP Billiton 90% Santos (BOL) 10% | | BHP Billiton | | Production licence issued by Australian Government expires 5 years after production ceases | | 150 TJ/d gas 600 bbl/d condensate | | 2 well completions Single flow line transports gas to onshore gas processing facility Gas plant located approximately 4 km inland from Port Campbell |
|
| North West Shelf |
Offshore and onshore Western Australia North Rankin Goodwyn Perseus Angel and Searipple fields | | Domestic gas, LPG, condensate, LNG | | North West Shelf Project is an unincorporated JV BHP Billiton: 8.33% of original domestic gas JV, will progressivelyultimately increase to 16.67% 16.67% of Incremental Pipeline Gas (IPG) domestic gas JV 16.67% of original LNG JV 12.5% of China LNG JV 16.67% of LPG JV Other participants: subsidiaries of Woodside, Energy, Chevron, BP, Shell, Mitsubishi/Mitsui and China National Offshore Oil Corporation | | Woodside Petroleum Ltd | | 9 production licences issued by Australian Government 6 expire in 2022 and 3 expire 5 years from end of production | | North Rankin A platform: 2,300Complex: 2,500 MMcf/d gas 60 Mbbl/d condensate Goodwyn A platform: 1,450 MMcf/d gas 110 Mbbl/d condensate Angel platform: 960 MMcf/d gas 50 Mbbl/d condensate Withnell Bay gas plant: 600 MMcf/d gas 5-train LNG plant: 45,000 tpd LNG | | Production from North Rankin and Perseus processed through the interconnected North Rankin A platformand North Rankin B platforms Production from Goodwyn and Searipple processed through Goodwyn A platform 4 subsea wells in Perseus field tied into Goodwyn A platform Production from Angel field processed through Angel platform Onshore gas treatment plant at Withnell Bay processes gas for domestic market 5-train LNG plant |
| | | | | | |
| North West Shelf | | | | | | | | | | | | |
Offshore Western Australia Wanaea Cossack Lambert and Hermes fields | | Oil | | BHP Billiton 16.67% Woodside Energy 33.34%, BP, Chevron, Japan Australia LNG (MIMI) 16.67% each | | Woodside Petroleum Ltd | | 3 production licences issued by Australian Government in September 2014 expire in 2014, 2018, 2033, and 2033,2035 respectively | | Production: 60 Mbbl/d Storage: 1 MMbbl | | Floating production storage and off-take (FPSO) unit |
| | | | | | |
Pyrenees | | | | | | | | | | | | |
Offshore Western Australia
Crosby and Stickle Ravensworth fields
| | Oil | | WA-42-L permit:
BHP Billiton 71.43%
Apache PVG 28.57%
WA-43-L permit: BHP Billiton 40%
Apache Permits 31.5% Inpex Alpha 28.5%
| | BHP Billiton | | Production licence issued by Australian Government expires 5 years after production ceases | | Production: 96 Mbbl/d oil
Storage: 920 Mbbl
| | 18 subsea well completions (14 producers, 3 water injectors, 1 gas injector), FPSO unit |
| | | | | | | | | | | | |
Operation &
location | | Product | | Ownership | | Operator | | Title, leases or options | | Nominal production
capacity | | Facilities, use & condition |
| Pyrenees | | | | | | | | | | | | |
Offshore Western Australia Crosby Moondyne Wild Bull Tanglehead Stickle and Ravensworth fields | | Oil | | WA-42-L permit: BHP Billiton 71.43% Apache PVG 28.57% WA-43-L permit: BHP Billiton 40% Apache APG Permits 31.5% Inpex Alpha 28.5% | | BHP Billiton | | Production licence issued by Australian Government expires 5 years after production ceases | | Production: 96 Mbbl/d oil Storage: 920 Mbbl | | 24 subsea well completions (19 producers, 4 water injectors, 1 gas injector), FPSO |
| | | | | | |
| Macedon | | | | | | | | | | | | |
| Offshore and onshore Western Australia | | Gas and condensate | | WA-42-L permit BHP Billiton 71.43% Apache PVG 28.57% | | BHP Billiton | | Production licence issued by Australian Government expires 5 years after production ceases | | Production: 200 MMcf/d gas 20 bbl/d condensate | | 4 well completions Single flow line transports gas to onshore gas processing facility Gas plant located approximately 17 km southwest of Onslow |
| | | | | | |
| Stybarrow | | | | | | | | | | | | |
Offshore Western Australia Stybarrow and Eskdale fields | | Oil and gas | | BHP Billiton 50% Woodside Energy 50% | | BHP Billiton | | Production licence issued by Australian Government expires 5 years after production ceases | | Production: 80 Mbbl/d oil Storage: 900 Mbbl | | 10 subsea well completions (6 producers, 3 water injectors, 1 gas injector) Gas production is reinjected |
| | | | |
Other production operations | | | | | | | | |
| | | | | | |
Algeria | | | | | | | | | | | | |
| | | | | | |
ROD Integrated Development | | | | | | | | | | | | |
Onshore Berkine Basin, 900 km southeast of Algiers, Algeria | | Oil | | BHP Billiton 45% interest in 401a/402a production sharing contract ENI 55%
BHP Billiton effective 38% interestCeased production in ROD unitised integrated development ENI 62%
| | Joint Sonatrach/ENI entity | | Production sharing contract with Sonatrach (title holder)
Expires 2016 with option for two 5-year extensions under certain conditions
| | Approximately 80 Mbbl/d oil | | Development and production of 6 oil fields
2 largest fields (ROD and SFNE) extend into neighbouring blocks 403a, 403d
Production through dedicated processing train on block 403
|
| | | | | | |
United Kingdom | | | | | | | | | | | | |
| | | | | | |
Bruce/Keith | | | | | | | | | | | | |
Offshore North Sea, UK | | Oil and gas | | Bruce:
BHP Billiton 16%
BP 37%
Total SA 43.25%
Marubeni 3.75%
Keith:
BHP Billiton 31.83%
BP 34.84%
Total SA 25%
Marubeni 8.33%
| | Keith – BHP Billiton
Bruce – BP
| | 3 production licences issued by UK Government expireJune 2015 2018 and 2046 | | 920 MMcf/d gas | | Integrated oil and gas platform
Keith developed as tie-back to Bruce facilities
|
| | | | | | | | | | | | |
Operation &
location | | Product | | Ownership | | Operator | | Title, leases or options | | Nominal production
capacity | | Facilities, use & condition |
Liverpool BayOther production operations | | | | | | | | | | | | |
Offshore northwest England, Irish Sea
Douglas and Douglas West oil fields, Lennox, Hamilton, Hamilton North gas fields
| | Oil and gas | | BHP Billiton 46.1%
ENI 53.9%
| | BHP Billiton | | 3 production licences issued by UK Government expire 2016, 2025 and 2027 | | 308 MMcf/d gas 70 Mbbl/d oil and condensate | | Integrated development of 5 producing fields
Oil treated at Douglas complex then piped to oil storage barge for export by tankers
Gas processed at Douglas complex then piped by subsea pipeline to Point of Ayr gas terminal for further processing
|
| | | | | | |
| Trinidad and Tobago | | | | | | | | | | | | |
| | | | | | |
| Greater Angostura | | | | | | | | | | | | |
| Offshore Trinidad and Tobago | | Oil and gas | | BHP Billiton 45% Total SANational Gas Company 30%
Chaoyang 25% | | BHP Billiton | | Production sharing contract with the Government of Trinidad and Tobago Government entitles us to operate Greater Angostura until 20212026 | | 100 Mbbl/d oil 280 MMcf/d gas | | Integrated oil and gas development: central processing platform connected to the Kairi-2 platform and gas export platform with 3 satellite wellhead protector platforms and flow lines Oil pipeline from processing platform to storage and export at Guayaguayare Gas supplied to Trinidad and Tobago domestic markets |
| | | | | | |
| Algeria | | | | | | | | | | | | |
| | | | | | |
| ROD Integrated Development | | | | | | | | | | | | |
| Onshore Berkine Basin, 900 kilometres southeast of Algiers, Algeria | | Oil | | BHP Billiton 45% interest in 401a/402a production sharing contract ENI 55% BHP Billiton effective 38% interest in ROD unitised integrated development ENI 62% | | Joint Sonatrach/ENI entity | | Production sharing contract with Sonatrach (title holder) Expires in 2016 with option for two 5-year extensions under certain conditions specified in the contracts | | Approximately 80 Mbbl/d oil | | Development and production of 6 oil fields 2 largest fields (ROD and SFNE) extend into neighbouring blocks 403a, 403d Production through dedicated processing train on block 403 |
| | | | | | | | | | | | |
Operation &
location | | Product | | Ownership | | Operator | | Title, leases or options | | Nominal production
capacity | | Facilities, use & condition |
| United Kingdom | | | | | | | | | | | | |
| | | | | | |
| Bruce/Keith | | | | | | | | | | | | |
| Offshore North Sea, UK | | Oil and gas | | Bruce: BHP Billiton 16% BP 37% Total SA 43.25% Marubeni 3.75% Keith: BHP Billiton 31.83% BP 34.84% Total SA 25% Marubeni 8.33% | | Bruce – BP Keith – BHP Billiton | | 3 production licences issued by UK Government expire in 2018 and 2046 and end of life of field | | 920 MMcf/d gas | | Integrated oil and gas platform Keith developed as tie-back to Bruce facilities |
| | | | | | |
| Pakistan | | | | | | | | | | | | |
| | | | | | |
| Zamzama | | | | | | | | | | | | |
Onshore Sindh Province, Pakistan | | Gas and condensate | | BHP Billiton 38.5% ENI Pakistan 17.75% PKP Exploration 9.375% PKP Exploration 2 9.375% Government Holdings 25% | | BHP Billiton | | 20-year development and production lease from the Pakistan Government of Pakistan expires in 2022 (option to extend 5 years) | | 500 MMcf/d gas 3,350 bbl/d condensate | | 10 production wells 4 process trains 2 front end compression trains |
Capital projects
United States
Shenzi Water InjectionOnshore US
The Shenzi Water Injection program includesdevelopment phase of an onshore shale operation requires an extensive drilling and completion program, which may include associated gas compression and treatment facilities and connecting pipelines. Shale development has a repetitive, manufacturing-like nature that provides opportunities for increased efficiency. Much of five water injection wells and provides facilities to inject up to 125 thousand barrels per day (Mbbl/d) of water at 7,000 pounds per square inch (psi). The program was approved as partour development of the original sanctioned Shenzi project, which began productionshale reservoirs utilises horizontal drilling, with average lateral lengths between 1,500 and 1,600 metres. We enter into service contracts with third parties to provide drilling and completion services at our operated sites. At the end of FY2015, we had 10 drilling rigs in 2009 to supplement aquifer pressure for additional recovery. To date, Water Injector (WI) #1 and WI #2 have been drilled and completed. As of 30 June 2013, drilling of WI #3 was underway and is expected to be completed in CY2013. US$344 million of costs had been incurred as of 30 June 2013. We are the operator with a 44 per cent interest and Repsol and Hess Corporation each hold a 28 per cent interest.
Atlantis South Water Injection
The Atlantis South Water Injection project is in the execution phase and involves drilling four subsea water injectors, tying them into the existing infrastructure and commissioning the 75 Mbbl/d of water injection facilities. This water injection project mitigates natural production decline due to low aquifer pressure. Our share of development costs is approximately US$246 million, of which US$237 million was incurred as of 30 June 2013. BP is the operator and we hold a 44 per cent working interest.
Onshore USoperation.
BHP Billiton’s Onshore US drilling and development expenditure in FY2013FY2015, which is presented on an accruals basis within this section, was US$4.83.3 billion with(FY2014: US$3.9 billion spent in the liquids-focused areas of Eagle Ford and Permian, and US$0.9 billion in the gas-focused areas of Haynesville and Fayetteville.4.2 billion). The expenditure was primarily related to drilling and completion activities at all four areas. Our onshorein our liquids-rich Black Hawk and Permian fields, while deferring development in areas that are predominantly gas.
Eagle Ford capital expenditure for FY2015 was US$2.1 billion (FY2014: US$3.1 billion). The expenditure was primarily related to drilling activityand completion activities, resulting in FY2013 resulted in 365188 net development wells completed primarily induring the Eagle Ford and Permian areas.
period. Of the US$4.82.1 billion, approximately US$50095 million was spent on the installation of over 400more than 52 kilometres of pipeline infrastructure and additional gas processing facilities,facilities. The operated rig count was seven for the year (FY2014: 17).
Permian capital expenditure for FY2015 was US$0.7 billion (FY2014: US$0.5 billion). The expenditure was primarily in our Eagle Ford and Permian areas.
Duerelated to low US natural gas prices in FY2013, the majority of drilling and completion activityactivities, resulting in Onshore US45 net development wells completed during the year. Of the US$0.7 billion, approximately US$54 million was directed towards the liquids-focused Eagle Ford and Permian areas to capitalisespent on the stronger liquid prices. Atinstallation of more than 101 kilometres of pipeline infrastructure and additional gas processing facilities. The operated rig count was three for the year (FY2014: four).
Haynesville capital expenditure for FY2015 was US$0.3 billion (FY2014: US$0.4 billion). The expenditure was primarily related to drilling and completion activities, resulting in 25 net development wells completed during the year. There were no operated rigs in Haynesville at the end of FY2013, over 80 per cent ofthis year (FY2014: three).
Fayetteville capital expenditure for FY2015 was US$0.2 billion (FY2014: US$0.2 billion). The expenditure was primarily related to participation in drilling activity was focused on these areas.and completion activities for wells operated by third parties, resulting in 45 net development wells completed during the year.
Our Onshore US capital expenditureinvestment is expected to declinedecrease to US$3.91.5 billion in FY2014, as we continueFY2016 in response to optimise our drilling program.changes in the global commodity markets. This includes a forecast reduction in ouran operated rig count to an average of 25nine for the period. Approximately 75period, with shale oil investment accounting for approximately 80 per cent of operated drilling activitythe investment. Our decision to cut spending will be focused on our liquids-rich acreagemean deferring gas volumes in the Eagle Ford area. The remaining activity will occur in the Haynesville area and the Permian area, where we are continuing to evaluatenear term with our most prospective acreage. Our operated drilling programprograms in the Fayetteville area has beenand Haynesville areas remaining temporarily suspended; however,suspended. However, we will continueexpect to invest in wells operatedrealise greater value by third parties where we see value.developing our acreage as prices recover.
Australia
Macedon
Macedon is a domestic gas development that includes a gas field located offshore approximately 75 kilometres west of Onslow, Western Australia, and a gas processing facility onshore near Onslow. The project consists of a 200 million cubic feet per day (MMcf/d) stand-alone gas plant, four subsea production wells, a 90-kilometre, 20-inch wet gas pipeline and a 67-kilometre, 20-inch sales gas pipeline. In August 2010, the project was approved at an investment level of US$1.1 billion (BHP Billiton share), with US$1.2 billion incurred as of 30 June 2013. First gas production was achieved in the third quarter of CY2013. We are the operator with a 71.43 per cent interest, and Apache PVG holds the remaining 28.57 per cent interest.
Bass Strait Kipper gas field development
Initial development of the Kipper gas field in the Gippsland Basin, located offshore from Victoria, was approved by the Board in December 2007. A supplemental approval of the development was granted in January 2011. The first phase of the project included two new subsea wells, three new pipelines and platform modifications to supply 10 Mbbl/dthousand barrels per day (Mbbl/d) of condensate and 80 MMcf/dmillion cubic feet per day (MMcf/d) of gas. Facilities were completed in September 2012, and first production will commence once the mercury removal project is complete. This is expected to occur in CY2016, subject to appropriate approvals for this work. Preliminary engineering work to design the mercury removal facilities has started and will continue through CY2013, with a final decision expected in FY2014.
Our share of development costs incurred through 30 June 2013 was US$905 million, against a budget of US$900 million. Gas and liquids will be processed via the existing Gippsland Basin Joint Venture facilities. The Kipper gas field development is comprised ofcomprises the Kipper Unit Joint Venture and the Gippsland Basin Joint Venture. We own a
32.5 per cent interest in the Kipper Unit Joint Venture, with Esso Australia owning 32.5 per cent and Santos owning the remaining 67.535 per cent. We own a 50 per cent interest in the Gippsland Basin Joint Venture, with Esso Australia owning the remaining 50 per cent.
The main Kipper gas field facilities were completed in September 2012; however, first production has not yet commenced due to the need to provide for mercury removal. Funding for the installation of the mercury treatment facilities of US$120 million was approved in March 2014, with completion expected to occur in CY2016. Our share of costs incurred to 30 June 2015 was US$59 million.
Bass Strait Turrum field development
Further expansion of the Gippsland Basin facilities is underway following approval by the Board in July 2008 of the full field development of the Turrum oil and gas field. A supplemental approval of the development was obtained in January 2011. The project consists of four production and two injectionfive wells and a new platform, Marlin B, linked by a bridge to the existing Marlin A platform. The Turrum field, which has a capacity of 11 Mbbl/d of oil and 200 MMcf/d of gas, is located 42 kilometres from shoreoffshore in approximately 60 metres of water. Our share of development costs is approximately US$1.4 billion, of which US$1.21.3 billion was incurred as of 30 June 2013. 2015.
The Turrum field development operates under the Gippsland Basin Joint Venture, in which we own a 50 per cent interest, with Esso Australia owning the remaining 50 per cent. Initial production of low carbon dioxide gas through the Turrum facilities occurred in June 2013. Additional highHigh carbon dioxide gas production from the Turrum reservoir will come online with completion of the Longford Gas Conditioning Plant in CY2016.
Bass Strait Longford Gas Conditioning
The Longford Gas Conditioning Plant (LGCP) Project was approved by the Board in December 2012 to enable the production of Turrum reserves plus the production of Kipper and other undeveloped high carbon dioxide content hydrocarbons. The projectProject scope includes a carbon dioxide extraction facility, brownfield tie-ins, an electrical upgrade and multiple supporting utilities. Our share of development costs is approximately US$520 million, of which US$26356 million was incurred as of 30 June 2013.2015. First gas production is expected in CY2016. Esso Australia is the operator of the LGCP, owning a 50 per cent interest and BHP Billiton owns the remaining 50 per cent.
North West Shelf North Rankin gas compression project
The North West Shelf gas compression project was approved by the Board in March 2008 to recover remaining lower pressure gas from the North Rankin and Perseus gas fields. The project consists of a new gas compression platform, North Rankin B, capable of processing 2,500 MMcf/d of gas, which will be constructed adjacent to the existing North Rankin A platform, 135 kilometres offshore from Karratha on the northwest coast of Western Australia. The two platforms will be connected by a 100-metre long bridge and operate as a single facility. We own a 16.67 per cent share in the project and our development costs are approximately US$850 million, of which US$619 million was incurred as of 30 June 2013. First gas production is expected later in CY2013. This project is operated by Woodside, with an equally shared interest between Woodside, BHP Billiton, BP, Chevron, MIMI and Shell.
North West Shelf Greater Western Flank–A
The North West Shelf Greater Western Flank–A (GWF-A) gas project was approved by the Board in November 2011 to recover gas from the near field Goodwyn H and Tidepole fields. The project consists of a five well subsea tie-back of the Goodwyn H and Tidepole fields to the Goodwyn A platform. The Goodwyn A platform is located in 130 metres of water, approximately 130 kilometres offshore from Karratha on the northwest coast of Australia. Our share of development costs is approximately US$400 million, of which US$107237 million was incurred as of 30 June 2013.2015. First gas production is expected in CY2016. Woodside is the operator and we own a 16.67 per cent share.interest.
Significant evaluation activities
We perform development evaluation activities to determine the technical feasibility and commercial viability of prospective projects after exploration and appraisal. Our significant recent evaluation activities include the following:
United States
Mad Dog Phase 2
In April 2012, we announced approval for US$708 million (BHP Billiton share) in pre-commitment funding for the Mad Dog Phase 2 project. The Mad Dog Phase 2 project is in response to the successful Mad Dog South appraisal well, which confirmed significant hydrocarbons in the southern portion of the Mad Dog field. However, theThe project has beenwas sent back to study phase
in 2013, following which a revised development concept was selected by the study phase. Discussions are ongoing with the operator to potentially modify the development plan.owners. The revised concept will undergo further refinement and undertake additional investigations in FY2016. BP is the operator and we hold a 23.90 per cent working interest.
Stampede (formerly known as Knotty Head)
Development planning for the Stampede project is in progress. The development assumptions for this project consist of a joint wet tree tension leg platform (TLP) development, production and water injection wells. Hess is the operator and we hold a 2023.9 per cent working interest.
Australia
Scarborough
Development planning for the large Scarborough gas field offshore Western Australia is in progress. We continueFollowing an assessment, floating LNG has been selected as the preferred development option. Further work to evaluateoptimise the preferred development options.option is ongoing. Esso is the operator of the WA-1-R lease and we hold a 50 per cent working interest. We are the operator of, and have a 100 per cent working interest in, the adjacent Thebe discovery and the WA-346-P block.
North West Shelf Other – (Persephone/Greater Western Flank ‘2’)
Planning is underwaycontinues for the development of the Persephone field and Greater Western Flank ‘2’. The Persephone field is located near existing North West Shelf infrastructure, approximately eight kilometres northeast of the North Rankin A platform. Greater Western Flank ‘2’ represents the second phase of development of the core Greater Western Flank fields, behind the GWF-A development, and is located to the southwest of the existing Goodwyn A platform. Woodside is the operator and we own a 16.67 per cent share of both Persephone and Greater Western Flank ‘2’.share. During FY2015, the project scope was further defined, with a final investment decision expected in CY2015.
Exploration and appraisal
WeOur exploration strategy is to focus on capturingmaterial opportunities, at high working interest, with a bias for liquids and operating large acreage positions primarily in areas that are in proven hydrocarbon basins.operatorship. While the majority of ourthe expenditure occursincurred was in our two principalGulf of Mexico, Western Australia and Trinidad and Tobago focus areas, we also incurred expenditure in South Africa, Brazil, South-East Asia, India and Onshore US.
Access
In FY2015, we accessed acreage in the US sector of activity, the Gulf of Mexico
and Western Australia,in Trinidad and Tobago and Barbados. In the Gulf of Mexico, we were awarded 14 blocks (100 per cent working interest and operator on all blocks; 315 square kilometres) from Lease Sale 238 held during the September 2014 quarter. In addition, BHP Billiton was also have exploration activitiesawarded all nine of its high bid leases, totalling 210 square kilometres in Central Lease Sale 235 in the June 2015 quarter. In the Caribbean, Brazil, South Africa, South East Asiawe finalised production sharing contracts and India. joint operating agreements for a 65 per cent interest and operatorship in Trinidad and Tobago Blocks 3 and 7 (totalling 2,096 square kilometres) with BG Group Ltd, and signed exploration licences for Barbados Blocks Bimshire and Carlisle Bay (100 per cent working interest; 5,004 square kilometres).
Exploration program expenditure details
During FY2013,FY2015, our gross expenditure on exploration was US$675567 million, of which US$522481 million was expensed.
Access
In FY2013, we gained access to new acreageExploration and appraisal wells drilled or in the deepwater Gulfprocess of Mexico (26 leases covering 618 square kilometres), Trinidad and Tobago (four deepwater blocks covering 4,111 square kilometres) and India (NELP IX offshore block covering 7,963 square kilometres). Additionally, indrilling during the fourth quarter of FY2013, we were notified that we were the high bidder for two blocks off the northeast Atlantic coast of Brazil (covering 3,069 square kilometres). We expect to finalise the award of these blocks in the fourth quarter of FY2014.year:
Exploration program expenditure details
| | | | | | | | | | | | | | |
Well | | Location | | Target | | BHP Billiton
equity | | Spud date | | Water depth | | Total well depth | | Status |
Shenzi North-2 | | Gulf of Mexico GC609 | | Oil | | 44% (Operator) | | 9 April 2015 | | 1,309 metres | | 8,733 metres | | Plugged and abandoned; currently sidetracking |
| | | | | | | |
Shenzi North-ST1 | | Gulf of Mexico GC609 | | Oil | | 44% (Operator) | | 14 June 2015 | | 1,309 metres | | 8,238 metres | | Drilling |
In Western Australia, BHP Billiton drilled the Homevale well and has a 60 per cent interest. The well partially fulfilled the commitment on WA-475P. The well was spud in April 2013 and subsequently plugged and abandoned as a dry hole in June 2013. Also in Western Australia, we participated in the non-operated Goodwyn North near field exploration well (BHP Billiton 16.7 per cent interest, Woodside operator), which spud in January 2013 and was plugged, abandoned and expensed as a dry hole in February 2013.
In the Gulf of Mexico, we participated in four wells during FY2013. In our coredrilled the Shenzi North-2 exploration well on Green Canyon area, The Ness Deep exploration well (BHP Billiton 50Block 609 (44 per cent working interest and operator) during the June 2015 quarter. The lower section of the hole was spud in June 2012, with a subsequent sidetrack beginning in October 2012. The well encountered non-commercial quantities of hydrocarbonsplugged and was subsequently plugged, abandoned and expensedassociated costs expensed. We are currently drilling a sidetrack to further test the opportunity. Significant investment in December 2012. We participated in the non-operated Atlantis East appraisal well (BHP Billiton 44 per cent working interest, BP operator), which was spud in April 2012seismic data acquisition, licensing and subsequently plugged, abandoned and expensed as a dry hole in November 2012. The Gunflint-3 appraisal well wasreprocessing were also completed in order to evaluate prospectivity in our focus areas.
In Western Australia, we continue to evaluate exploration potential in line with our strategic priorities. To assist this, we are participating in a regional multi-client 3D seismic survey totalling 10,032 square kilometres. The program is anticipated to be completed by the first quarterhalf of FY2013. We subsequently exited this prospect, selling our interest to existing partners inFY2016.
In Trinidad and Tobago, we completed the Gunflint joint venture.
Extending our Gulfacquisition of Mexico footprint to Desoto Canyon, we spud21,220 square kilometres of 3D seismic data over Blocks 3, 5, 6, 7, 14, 23a, 23b, 28 and 29 by the Raptor exploration well in January 2013 (BHP Billiton 50 per cent working interest, Anadarko operator) and subsequently sidetracked in May 2013. Drillingend of the sidetrack was in progress at 30 June 2013March 2015 quarter. Evaluation of this information is ongoing. Regional environmental and completed in July 2013. The well encountered approximately 150 net feetgeological surveys were also carried out during the year, as part of oil; further evaluation is ongoing.our ongoing assessment programs.
In South Africa, we ownhold 100 per cent exploration rights to Block 3B/4B off the west coast of South Africa. In FY2014, we completed the processing of the 10,075 square kilometres of 3D seismic survey that was acquired in FY2013. Evaluation of this information is ongoing.
In Brazil, we are planning to acquire 3D seismic data over our two blocks in the deepwater Foz do Amazonas Basin, to fulfil our minimum work commitment.
In Malaysia, we completed the acquisition of 2,941 square kilometres of 3D seismic survey over Block SK-2A and operate a 90formally assigned our 60 per cent interest and operatorship in Block N to Total during the June 2015 quarter.
In the Philippines, we finalised the re-assignment of our 75 per cent interest and operatorship to PNOC, completing our exit from the region during the June 2015 quarter.
In India, together with the operator BG, we have notified the government of our intent to exit our remaining 50 per cent interest in one deepwater block 3B/4B. Duringacquired during the year, we fulfilledNELP IX licensing round. We are currently awaiting government approval of our minimum work obligation for the current phase by acquiring a 10,075 square kilometre 3D seismic survey. Processingexit of the survey will commence in early FY2014.
In India, we hold interests in and operate ten offshorenine operated blocks acquired during the NELP VII and VIII licensing rounds. We are currently in discussions with the Government of India as we seek to obtain unencumbered access to these blocks to allow for petroleum explorationrounds and production. Until the access is obtained, the blocks remain in force majeure. In India, we also have a 50 per centone non-operated interest (BG operator) in a deepwater block acquired during the NELP IX licensing round. As this block has not been impacted by the access issue, we participated in the acquisition of 2,000 square kilometres of 2D seismic data.
In Onshore US, we continue to evaluate opportunities aligned with our strategic priorities, leveraging the Philippines, we operate the SC55 block with a 60 per cent working interest. While we are committed to fulfillingexpertise gained from our commitment to drill the Cinco prospect, as of 30 June we were waiting on the regulatory approvals required to drill the well. To preserve the licence, the joint venture has suspended SC55 under force majeure until regulatory approval of the well can be obtained.production units.
Drilling
The number of wells in the process of being drilled (including temporarily suspended wells and excluding wells drilled and completed in FY2013)drilling and/or completion as of 30 June 20132015 was as follows:
| | | | Exploratory wells | | | Development Wells | | | Total | | | Exploratory wells | | | Development wells | | | Total | |
| | | Gross | | | Net (1) | | | Gross | | | Net (1) | | | Gross | | | Net (1) | | | Gross | | | Net (1) | | | Gross | | | Net(1) | | | Gross | | | Net (1) | |
Australia | | | – | | | | – | | | | 10 | | | | 4 | | | | 10 | | | | 4 | | | | – | | | | – | | | | 5 | | | | 1 | | | | 5 | | | | 1 | |
United States | | | 3 | | | | 3 | | | | 471 | | | | 259 | | | | 474 | | | | 262 | | | | 1 | | | | – | | | | 236 | | | | 108 | | | | 237 | | | | 109 | |
Other | | | – | | | | – | | | | 2 | | | | 1 | | | | 2 | | | | 1 | | | | – | | | | – | | | | – | | | | – | | | | – | | | | – | |
| | | | | | | | | | | | | | | | | | | |
Total | | | 3 | | | | 3 | | | | 483 | | | | 264 | | | | 486 | | | | 267 | | | | 1 | | | | – | | | | 241 | | | | 109 | | | | 242 | | | | 110 | |
| | | | | | | | | | | | | | | | | | | |
| (1) | Represents our share of the gross well count. |
Delivery commitments
We have delivery commitments of natural gas and LNG of approximately 3,2212,180 billion cubic feet through to 2032 (61FY2031 (82 per cent Australia 17and Asia, eight per cent USUnited States and 2210 per cent Other), crude and condensate
commitments of 17.3 million barrels through FY2022 (51 per cent United States, 39 per cent Australia and Asia and 10 per cent Other) and crude, condensate and NGLLPG commitments of 12 million barrels332,072 metric tonnes through to 2023 (44 per cent United States, 41 per cent Australia and 15 per cent Other).FY2017. We have sufficient proved reserves and production capacity to fulfil these delivery commitments. Further information
We have obligations for contracted capacity on reserves can be found in section 2.13.1.transportation pipelines and gathering systems on which we are the shipper. In FY2016, volume commitments to gather and transport are 1,123 billion cubic feet of gas (97 per cent Onshore US and three per cent Other) and 42.4 million barrels of oil (51 per cent Onshore US and 49 per cent Offshore US). The agreements with the gas gatherers and transporters have annual escalation clauses.
Potash
Our Potash strategy is to build a material industry position over the long term.
We have acquiredhold exploration permits and mining leases, issued by the Government of Saskatchewan, covering over 14,000more than 16,000 square kilometres of mineral rights in the Provinceprovince of Saskatchewan in Canada. The permitsGovernment of Saskatchewan has issued a Potash Lease Special Agreement (KLSA) for the Jansen Potash Project, which provides long-term security of tenure to allow the ongoing development and subsequent operation of Jansen for the life of the operation.
We have progressively explored our permit areas over the past eight years and continue to evaluate their economic development potential. We are a result ofconverting our acquisitions, primarily of Anglo Potash Ltd in CY2008 and Athabasca Potash Inc in CY2010. Our existing exploration permits are expected to convertlong-term mining leases as these permits mature in order to lease between CY2013 and CY2016 in accordance with our planned lease conversion strategy. Our existing government mineral leases expire in CY2033 and CY2034 unless renewed forenable further terms.evaluation. To date, we have secured more than 8,000 square kilometres under long-term mining leases.
We continue advancing ourto progress Jansen, Project, a greenfield potash project, located approximately 146140 kilometres east of Saskatoon in southsouth-central Saskatchewan. We believe Jansen is currently being designedone of the world’s best undeveloped potash resources and is likely to ultimately produce almost 10 Mtpabe a low-cost source of agricultural grade potash for more than 50 years.supply once fully developed. Investment in Jansen could underpin a potential fifth Business within BHP Billiton, given the opportunity to develop a multi-decade, multi-mine basin in Saskatchewan.
Jansen progressed into the feasibility study phase (an advanced stage of our project approvals process) in February 2011. On 20 August 2013, we announced an additional US$2.6 billion investment was announced forin Jansen, bringing total approved spending to US$3.8 billion. This represents pre-commitment spending to fundinvestment is funding the excavation and lining of the Jansen Potash ProjectProject’s production and service shafts, and to continue the installation of essential surface infrastructure and utilities. Completionutilities and was 46 per cent complete as of both shafts30 June 2015.
The level of expenditure on the Project in FY2015 was US$423 million. Shaft excavation is expected during CY2016,progressing, while the associated works programconstruction workforce camp and service shaft permanent headframe have been completed. Necessary infrastructure work continues to be progressed.
With our investment premised on the attractive longer-term market fundamentals for potash, we will extend into CY2017.
The investment will be spread over a numbercontinue to modulate the pace of years, with annual instalments of approximately US$800 million. We are looking at thedevelopment. The introduction of one or more minority partners, consistent with our approach for certainsome of our other resource operations.operations, will be considered at the appropriate time.
On the basis of our current projections and subject to Board approval, Jansen is likely to ramp-up production in the decade beginning 2020.
We are continuing to execute a ground freezing program, inevaluate other areas for which the ground is frozen using a closed system of refrigeration pipes through which brine is circulated to allow for the sinking of the service and production shafts. Shaft collars were completed in December 2012 and shaft sinking began at the end of CY2012. The eventual depth of the service and production shafts will be approximately one kilometre.
We are continuing to study other potential projectswe have exploration permits in the Saskatchewan potash basin, including Young, Boulder, Burr and Melville, and are progressing these projects. We are also conducting a potashthrough analysis of the extensive data collected from successive exploration program in the same basin, including 3D seismic survey and drilling programs.
2.2.2In October 2014, the management of the closed mine sites associated with Base Metals North America was transitioned from the Potash to the Petroleum Business. All locations are in care and maintenance or in various stages of closure.
As at 1 August 2015, management of the Jansen Potash Project transferred from the Petroleum Business to BHP Billiton’s Chief Commercial Officer.
2.1.2 Copper Business
Our Copper Business, headquartered in Santiago, Chile, is one of the world’s premierleading producers of copper silver, leadconcentrate and cathode, uranium oxide, and a leading producer of zinc.zinc concentrate. Our portfolio of large, long-life mining operations includes the Escondida mine in Chile, the world’s largest singlea leading producer of copper, and Olympic Dam in South Australia, a major producer of copper and uranium with potential for expansion.
oxide. Our total copper production in FY2013FY2015 was 1.21.7 million tonnes (Mt). Our concentrate production, which represents 5260 per cent of total production, comesresults from flotation of sulphide ores mined at our Escondida Antamina and Pinto ValleyAntamina mines. Oxide ores and sulphide ores amenable to leaching are mined and processed into copper cathode, using conventional heap leaching, followed by solvent extraction and electrowinning processes at Escondida, Cerro Colorado Spence and Pinto Valley.Spence. Copper cathode is also produced at Olympic Dam, our only copper underground operation, where sulphide ores are processed through conventional flotation and the resulting concentrate is further transformed into cathodes through a smelting and refining process.
In addition to conventional mine development, we have a small number of focused, technology development projects, at different stages of maturity, that we expect will transform our assets into the next generation of mining, addressing resource extraction, productivity, costs and sustainability drivers. An example of this is leaching of low-grade chalcopyrite ores, currently being validated at large scale at Escondida, which has the potential to recover copper from ores previously considered uneconomical.
We market fivefour primary products: copper cathodes, copper concentrates, zinc concentrates and uranium oxide. We sell our copper cathodes,cathode production to wire rod mills, brass mills and casting plants around the world under contracts with prices at premiums to the London Metal Exchange (LME) or the Commodity Exchange Inc (COMEX) prices. We sell the majority of our uranium oxide lead concentratesto electricity generating utilities, principally in Western Europe, North America and zinc concentrates.
East Asia. Uranium is typically sold under a mix of long-term and short-term contracts. We sell most of our copper lead and zinc concentrates to smelters located in diversified geographic markets such as China, Chile,South America, Japan, India and South Korea, under long-term volume contracts at prices based on the London Metal Exchange (LME) price for the contained metal. Prices are typically set three or four months after shipment, less treatmentKorea. Treatment charges and refining charges (collectively referred to as TCRCs) that are negotiated with counterparties on a variety of tenors.tenors, trending towards shorter-term, more market-based pricing periods (less than one year). Some of the ores we mine contain quantities of silver and gold, which remain in the base metal concentrates we sell.sell, and are typically subject to payment credits. We receive payment credits for thesell refined silver and gold recovered by our customersfrom Olympic Dam. Our five operating assets, which are located in the smelting and refining process.
We sell most of our copper cathode production to wire rod mills, brass mills and casting plants around the world under annual contracts with prices at premiums to LME prices set at the month after shipment. We sell uranium oxide to electricity generating utilities, principally in western Europe, NorthSouth America and east Asia. Uranium is typically sold under a mixAustralia, consist of longer-term and shorter-term contracts. A portion of our uranium production is sold into fixed price contracts, although increasingly sales are based on flexible pricing terms.
We have the following six assets in the Americas and Australia:following:
Americas
Escondida
Our 57.5 per cent owned and operated Escondida mine is the largesta leading producer of copper in the world.copper. Located in the Atacama Desert in the north ofnorthern Chile, Escondida employs approximately 12,000 operational employees and contractors and has the capacity to move in excess of 1.3 Mt of material per day. Its two open-cut pits currently feed twothree concentrator plants, which use grindingLaguna Seca, Los Colorados and flotation technologies to produce copper concentrate,the recently commissioned Organic Growth Project 1 (OGP1), as well as two leaching operations (oxide and sulphide). The Los Colorados concentrator plant will be placed into care and maintenance once OGP1 ramp-up has been completed as current water source volumes cannot sustain the operation of three concentrators at nominal capacity. Escondida is assessing extending the life of the Los Colorados concentrator plant on the completion of the Escondida Water Supply (EWS) project based on the availability of water and mine stability. All three concentrator plants use grinding and flotation technologies to produce copper concentrate. In FY2013,FY2015, our share of Escondida production was 478.1526.7 kilotonnes (kt) of payable copper in concentrate and 171.3178.4 kt of copper cathode. Escondida has aproduction for FY2016 will be impacted by an anticipated 27 per cent decline in ore grades. This will be partly offset by increased throughput, enabled by the completion of the OGP1 and operational improvements. The reserve life of 54 years.is discussed in section 2.3.2.
The availability of key inputs like power and water at competitive prices is an important focus for theour Copper Business. Escondida’s power demandIn November 2013, we awarded a long-term energy agreement to a consortium consisting of approximately 450 megawatts (MW) is currently covered by four contracts: one of which provides 340 MW until 2029;Korea Southern Power Co. and the balance of which provide 252 MW until 2016. As part of the longer-term power supply strategy, we are currently undergoing an international tendering processSamsung Construction & Trading Corp. for the development, operation and maintenance of a 517 megawatt (MW) combined-cycle gas-fired power plant (Kelar power plant) in the town of Mejillones, Chile. The plant, which will be connected to the Northern Interconnected Grid (SING), will supply
the increasing demand for electricity at our operations. Construction work is progressing as planned with (65.4 per cent completed as of 30 June 2015) and production is expected to begin in the October 2017 quarter.
A contract for the supply of natural gas to the Kelar power plant has been secured with Gas Natural Fenosa. First deliveries are scheduled to commence in CY2016, which will tie-in with the commissioning and commercial operation of the licensed Kelar Power Plant site at Mejillones in order to secure the future power needs for Escondida and Pampa Norte.plant.
To address limitations on the availability of water, we desalinate sea water and carefully manage our use andre-use reuse of available water. The recently approved Escondida Water Supply (EWS)EWS project, which involves the construction of a second desalination plant, will reduce our reliance on the region’s aquifers and help us meet our environmental commitments. The EWS project is expected to be commissioned in 2017.CY2017.
Pampa Norte
Pampa Norte consists of two operations – Spence and Cerro Colorado. Copper cathode is produced at both operations following a leaching, solvent extraction and electrowinning process.
Our wholly owned Spence copper mine is located in the Atacama Desert, 162 kilometres northeast of Antofagasta in Chile. During FY2013,FY2015, Spence produced 161.1171.4 kt of high-quality copper cathode. Spence has acathode, using oxide and sulphide ore treatment through leaching, solvent extraction and electrowinning processes. The reserve life of 10 years.is discussed in section 2.3.2.
Our wholly owned Cerro Colorado mine, located in the Atacama Desert, 120 kilometres east of Iquique in Chile, remains a significant producer of copper cathode, although production levels have declinedfallen in recent years as grades have declined. ProductionDespite this, production in FY2013 was 71.5FY2015 reached 78.2 kt of copper cathode. The reserve life is discussed in section 2.3.2. The extension of the existing environmental and mining licences to continue to enable Cerro Colorado has a reserve life of nine years.to operate beyond December 2016 is currently pending approval.
Antamina
We own 33.75 per cent of Antamina, a large, low-cost long-life copper and zinc mine in north central Peru. Our share of Antamina’s FY2013total production for FY2015 was 139.7107.7 kt of copper in concentrate and 71.966.4 kt of zinc in concentrate. Antamina also produces molybdenum and lead/bismuth concentrate, together with smalleras well as small amounts of silver in the form ofby-products. Antamina has a The reserve life of 14 years.is discussed in section 2.3.2.
In FY2013,FY2015, following the identification of a number of debottlenecking opportunities, Antamina completed execution of an expansion project, increasingsuccessfully increased nominal milling capacity by 38to 53 million tonnes per cent to 130 kt per day.
Pinto Valley
In April 2013, we signed a definitive agreement to sell our wholly owned Pinto Valley Operation located in Arizona, United States, and the associated San Manuel Arizona Railroad Company to Capstone Mining Corp. for an aggregate cash consideration of US$650 million. Ownership is expected to transfer to Capstone in the first half of FY2014 subject to the successful transfer of the operational permits.
During FY2013, sulphide mining resumed at Pinto Valley with production for FY2013 of 16.6 kt of copper concentrate and 4.9 kt of copper cathode.annum (Mtpa).
Australia
Cannington
Our wholly owned Cannington mine is one of the world’s largest producers of silver and lead. Located in northwest Queensland, Australia, the underground mine feeds a beneficiation processing facility that extracts silver/lead and zinc concentrates from sulphide ore. In FY2013, Cannington produced concentrates containing 213.4 kt of lead, 56.3 kt of zinc and approximately 31.1 million ounces of silver. Cannington has a reserve life of 11 years.
Olympic Dam
Our wholly owned Olympic Dam mine is a producer of copper cathode and uranium oxide and a refiner of gold and silver bullion. The site includes an underground mine, where the primary method of ore extraction islong-hole open stoping with cemented aggregate fill, and an integrated metallurgical processing plant.
The underground mine extracts copper uranium ore and hauls the ore by an automated train and trucking network feeding underground crushing, storage and ore hoisting facilities. The processing plant consists of two grinding circuits in which high-quality copper concentrate is extracted from sulphide ore through a flotation extraction process. The operation includes a fully integrated metallurgical complex with a grinding and concentrating circuit, a hydrometallurgical plant incorporating solvent extraction circuits for copper and uranium, a copper smelter, a copper refinery and a recovery circuit for precious metals.
The Svedala mill, which accounts for approximately 60 per cent of Olympic Dam’s production, experienced an electrical failure in January 2015. Repairs were completed by June 2015 and the mill is now operating at full capacity. In FY2013,FY2015, Olympic Dam produced 166.2124.5 kt of copper cathode, 4.13.1 kt of uranium oxide, 113.2104.8 kilo-ounces (koz) of refined gold and 880724 koz of refined silver. Olympic Dam has aThe reserve life is discussed in section 2.3.2.
Cannington
In May 2015, our Cannington silver-lead-zinc mine was included in the demerger of 56 years.South32. Further information can be found in sections 1.3.7, 1.6.4, and 2.1.7 and note 29 ‘Discontinued operations’ to the Financial Statements.
Information on Copper mining operations
The following table contains additional details of our mining operations. This table should be read in conjunction with the production (see(refer to section 2.3.2)2.2.2) and reserve tables (see(refer to section 2.13.2)2.3.2).
| | | | | | | | | | | | | | | | |
Mine & location | | Means of access | | Ownership | | Operator | | Title, leases or
options | | History | | Mine type &
mineralisation
style | | Power source | | Facilities, use &
condition(1) |
Americas | | | | | | | | | | | | | | | | |
| | | | | | | | |
Copper | | | | | | | | | | | | | | | | |
| | | | | | | | |
Escondida | | | | | | | | | | | | | | | | |
| Atacama Desert, 170 km southeast of Antofagasta, Chile | | Public road Copper cathode transported by privately owned rail to ports at Antofagasta and Mejillones Copper concentrate transported by Escondida-owned pipelinepipelines to its Coloso port facilities | | BHP Billiton 57.5% of Minera Escondida Limitada (MEL) Rio Tinto 30% JECO Corporation consortium comprising Mitsubishi, JX Nippon Mining and Metals 10% JECO2 Ltd 2.5% | | BHP Billiton | | Mining
concession from
Chilean
Government
valid indefinitely (subject
(subject to
payment of
annual fees) | | Original construction completed in 1990 Sulphide Leachleach copper production commenced in 2006 | | 2 open-cut pits: Escondida and Escondida Norte Escondida and Escondida Norte mineral deposits are adjacent but distinct supergene enriched porphyry copper deposits | | Escondida-owned transmission lines connect to Chile’s northern power grid Electricity purchased under contractcontracts expiring 2016 and 2029 | | 23 concentrator plants extract copper concentrate from sulphide ore by flotation extraction process
2 solvent extraction plants produce copper cathode Nominal design capacity: 3.4153.7 Mtpa copper concentrate(nominal milling capacity) and 330350 ktpa copper cathode (nominal capacity of tank house capacity)house) Two 168 km concentrate pipelines 167 km water pipeline Port facilities at Coloso, Antofagasta |
| | | | | | | | | | | | | | | | |
Mine & location | | Means of access | | Ownership | | Operator | | Title, leases or
options | | History | | Mine type &
mineralisation
style | | Power source | | Facilities, use &
condition |
| Pampa Norte Spence | | | | | | | | | | | | | | | | |
| Atacama Desert, 162 km northeast of Antofagasta, Chile | | Public road Copper cathode transported by rail to ports at Mejillones and Antofagasta | | 100% | | BHP Billiton | | Mining
concession from
Chilean
Government
valid indefinitely (subject
(subject to
payment of
annual fees) | | Development cost of US$1.1 billion approved in 2004 First copper produced in 2006 | | Open-cut Supergene enrichedEnriched and oxidised porphyry copper deposit that includespresents dominantly in situ copper oxide ores overlyingmineralisation that overlies a near-horizontal sequence of supergene sulphide, zonetransitional sulphide, and lower-most primary (hypogene) sulphide mineralisation
| | Spence-owned transmission lines connect to Chile’s northern power grid Electricity purchased under contract | | Processing and crushing facilities, separate dynamic (on-off) leach pads, solvent extraction plant, electrowinning plant Nominal capacity of tank house capacity: 200house: 179 ktpa copper cathode |
| | | | | | | | | | | | | | | | |
Mine & location | | Means of access | | Ownership | | Operator | | Title, leases or
options | | History | | Mine type &
mineralisation
style | | Power source | | Facilities, use &
condition(1) |
| Pampa Norte Cerro Colorado | | | | | | | | | | | | | | | | |
| Atacama Desert, 120 km east of Iquique, Chile | | Public road Copper cathode trucked to port at Iquique | | 100% | | BHP Billiton | | Mining concession
from Chilean
Government valid
indefinitely (subject
(subject to
payment of
annual fees) | | Commercial production commenced in 1994 Expansions in 1996 and 1998 | | Open-cut Supergene enrichedEnriched and oxidised porphyry copper deposit that consistspresents dominantly in situ copper oxide mineralisation that overlies a near-horizontal sequence of asupergene sulphide, enrichment zone overlayed by oxide ore (chrysocollatransitional sulphide, and brochantite)lower-most primary (hypogene) sulphide mineralisation
| | Long-term contracts with northern Chile power grid | | 2 primary, secondary and tertiary crushers, leaching pads, solvent extraction plant, electrowinning plant Nominal capacity of tank house capacity: 120house: 102 ktpa copper cathode |
| | | | | | | | |
Pinto Valley
| | | | | | | | | | | | | | | | |
104 km east of Phoenix, Arizona, US | | Public road
Copper and molybdenum concentrate transported by truck
| | 100%
Definitive sale agreement signed in April 2013
Sale expected to be finalised in FY2014
| | BHP Billiton | | Freehold title to the land | | Acquired 1996 as part of Magma Copper acquisition
Sulphide mining and milling operations restarted in 2012
Residual SXEW production continues
| | Pinto Valley: open-pit
Miami Unit: in situ leach
Porphyry copper deposit of low-grade primary mineralisation
| | Salt River Project | | 2 SXEW operations at Pinto Valley and Miami
Copper in concentrate production capacity approx. 60 ktpa
|
| | | | | | | | | | | | | | | | |
Mine & location
| | Means of access
| | Ownership
| | Operator
| | Title, leases or
options
| | History
| | Mine type &
mineralisation
style
| | Power
source
| | Facilities, use &
condition(1)
|
| Copper and zinc | | | | | | | | | | | | | | | | |
| | | | | | | | |
| Antamina | | | | | | | | | | | | | | | | |
| Andes mountain range, 270 km north of Lima, north central Peru | | Public road Copper and zinc concentrates transported by pipeline to port of Huarmey Molybdenum and lead/bismuth concentrates transported by truck | | BHP Billiton 33.75% of Compañía Minera Antamina SA Glencore Xstrata 33.75% Teck 22.5% Mitsubishi 10% | | Compañía Minera Antamina SA | | Mining rights
from Peruvian
Government held
indefinitely,
subject to
payment of
annual fees and
supply of
information on
investment and
production | | Commercial production commenced in 2001 Capital cost US$2.3 billion (100%) | | Open-cut Zoned porphyry and skarn deposit with central Cu-onlycopper-only ores and an outer band of Cu-Zncopper-zinc ore zone | | Long-term contracts with individual power producers | | Primary crusher, concentrator, (nominal capacity 130,000 tpd), copper and zinc flotation circuits, bismuth/moly cleaning circuit Nominal milling capacity 53 Mtpa 300 km concentrate pipeline (design throughput 2.3 dry Mtpa) Port facilities at Huarmey |
| | | | | | | | |
Australia | | | | | | | | | | | | | | | | |
| | | | | | | | |
Silver, lead and zinc | | | | | | | | | | | | | | | | |
| | | | | | | | |
Cannington | | | | | | | | | | | | | | | | |
200 km southeast of Mt Isa, Queensland, Australia | | Public road and Group-owned airstrip
Product trucked to Yurbi, then by rail to public port
| | 100% | | BHP Billiton | | Mining leases granted by Queensland Government expire 2029 | | Concentrate production commenced 1997, subsequent projects improved mill throughput and metal recovery | | Underground Broken Hill-type silver-lead-zinc sulphide deposit | | On-site power station operated under contract | | Beneficiation plant: primary and secondary grinding circuits, pre-flotation circuits, flotation circuits , leaching circuits, concentrate filtration circuit, paste plant
Nominal milling capacity: 3.4 Mtpa
|
| | | | | | | | | | | | | | | | |
Mine & location | | Means of access | | Ownership | | Operator | | Title, leases or
options | | History | | Mine type &
mineralisation
style | | Power source | | Facilities, use &
condition(1) |
Copper and uraniumAustralia | | | | | | | | | | | | | | | | |
| | | | | | | | |
Olympic DamCopper and uranium | | | | | | | | | | | | | | | | |
|
| Olympic Dam |
| 560 km northwest of Adelaide, South Australia | | Public road Copper cathode trucked to ports Uranium oxide transported by road to ports | | 100% | | BHP Billiton | | Mining lease
granted by South
Australian
Government
expires in 2036 Right of
extension for
50 years (subject
to remaining
mine life) | | Acquired in 2005 as part of WMC acquisition Copper production began in 1988 ThroughputNominal milling capacity raised to 9 Mtpa in 1999
Optimisation project completed in 2002 New copper solvent extraction plant commissioned in 2004 | | Underground Large poly-metallic deposit of iron oxide-copper-uranium-gold mineralisation | | Supplied via 275 kV power line from Port Augusta, transmitted by ElectraNet | | Underground automated train and trucking network feeding crushing, storage and ore hoisting facilities 2 grinding circuits Nominal milling capacity: 10.3 Mtpa Flash furnace produces copper anodes, then refined to produce copper cathodes(2) Nominal capacity: 200 ktpa copper cathode
|
(1) | Capacities are based on maximum original design capacity, which is subject to grade and ore hardness variability year-on-year. As mines age, material mined is typically harder and of lower grade than the original ore. |
(2) | Electrowon copper cathode and uranium oxide concentrate produced by leaching and solvent extracting flotation tailings.tailings |
Development projects
Americas
Escondida
The Organic Growth Project 1 (OGP1), which is the replacement of the Los Coloradosa new concentrator with a new 152 ktkilotonnes per day plant, is currently in execution. The(ktpd) plant. We expect this project providesto provide additional processing capacity and allowsallow access to higher-gradehigh-grade ore. The OGP1 project was approved in February 2012 with budgeted expenditure of US$3.8 billion (US$2.2 billion BHP Billiton share). Project completion is targeted forA US$361 million increase in the first halfbudget of CY2015. Work on the OGP1 project was 41 per cent complete at 30 June 2013.
The Oxide Leach Area Project (OLAP), also in execution, involves the creation of a new dynamic leaching pad and mineral handling system that will include several overland conveyors. The new pad is expected to maintain oxide leaching capacity at current levels following the exhaustion of the existing heap leach in CY2014. OLAPUS$4.2 billion (US$ 2.4 billion BHP Billiton share) was approved in February 2012October 2014 following challenges associated with budgeted expenditure of US$721 million (US$414 million BHP Billiton share). Work on the projectcontractor’s progress. The Project was 61 per cent complete at 30 June 2013,completed in May 2015 and is on track for commissioningcurrently in the first half of CY2014.commissioning and ramp-up phase.
The Escondida Water Supply (EWS) project (EWS) was approved by BHP Billiton in July 2013 and consists of a new 2,500 litrelitres per second sea water desalination facility. This project will provide an alternative water supply to Escondida, as water usage increases upon completion of the 152 kt per dayktpd OGP1 copper concentrator. Construction of the new desalination facility commenced in July 2013 and will includeincludes the development of two pipelines, four high-pressure pump stations, a reservoir at the mine site and high-voltage infrastructure to support the system. The new facility is expected to be commissioned in 2017CY2017 at a cost of US$3.4 billion (US$2.0 billion BHP Billiton share). Prior
The Oxide Leach Area Project (OLAP) was completed in November 2014 and now in production. The Project involved the creation of a new dynamic leaching pad and mineral handling system that included several overland conveyors. The new pad is expected to completion of the EWS project, water supply for the OGP1 copper concentrator will be sourced from existing aquifers.
Antamina
In FY2013, Antamina completed execution of its expansion project, increasing millingmaintain oxide leaching capacity by 38 per cent to 130 kt per day. The projectat current levels. OLAP was approved in FY2010February 2012 with budgeted expenditure of US$721 million (US$414 million BHP Billiton share) and included a new SAG mill, a 55-kilometre transmission power line, an expanded truck shop facility and upgradesUS$212 million increase in the budget of OLAP to the crushing and tailing systems, flotation circuit and port capacity. The projectUS$933 million (US$536 million BHP Billiton share) was delivered at a totalapproved in March 2014. Expected final cost ofis US$1.5 billion899 million (US$511517 million BHP Billiton share).
Pampa Norte
The Spence Growth Option (SGO) project, currently at pre-feasibility phase, endeavours to maximise Spence’s value by exploiting the large and expandable hypogene resource with associated molybdenum sulphide by building a 95 ktpd concentrator. This would increase the mine life by approximately 50 years beyond the current FY2025 closure date. The proposed investment is approximately US$3.2 billion and the project is scheduled to commence at the end of the November 2019 quarter. The hypogene ore underlies the supergene reserves currently being exploited and therefore eliminates the need for pre-stripping and additional mine maintenance infrastructure. The option to maximise the use of existing heap leach infrastructure, to recover copper from the lower-grade chalcopyrite ores, is being developed as a complementary process to the concentrator (CPY leach project). The implementation of both the SGO and CPY leach projects will enable Spence to achieve a total copper production of approximately 260 kt on average during the first 10 years of operation.
Olympic Dam
An Identification PhaseThe focus at Olympic Dam is to transform the existing operation to materially lower the cost of production safely and sustainably. We are progressing a pre-feasibility study is being conducted intoto examine potential future optimisation and expansion opportunities.
During FY2015, we received approval from the proposed expansionAustralian and South Australian Governments to construct a site-based heap leaching demonstration plant, as part of Olympic Dam. The objectiveour efforts to identify an alternative, less capital-intensive process for extracting metals from ore mined underground. Construction of the studydemonstration plant is subject to identify the full range of development path alternatives for Olympic Dam by investigating all possible mining methodsongoing, off-site demonstration and less capital intensive designs, including new technologies to substantially improve the economics of any expansion.test work outcomes and Board approvals.
Resolution Copper
Guinea Iron Ore
We holdBHP Billiton has a 4541.3 per cent interest in a joint venture that holds the Nimba Mining Concession and four iron ore prospecting permits in southeast Guinea.
On 29 July 2014, BHP Billiton and ArcelorMittal signed an agreement for the acquisition by ArcelorMittal of BHP Billiton’s 43.5 per cent stake in Euronimba Limited, which holds an effective 95 per cent interest in the Resolution CopperMount Nimba iron ore project in Arizona, United States, operatedGuinea. In May 2015, ArcelorMittal terminated the transaction following failure to meet the conditions to closing by Rio Tinto (55the agreed deadline. We will continue to assess our options for the Mount Nimba iron ore project.
Liberia Iron Ore
BHP Billiton has a 100 per cent interest). Resolution Copper is undertakinginterest in a pre-feasibility study intoMineral Development Agreement with the Government of Liberia. This enables the further exploration and development of our Liberian iron ore mineral leases.
On 25 August 2014, BHP Billiton and Cavalla Resources signed a substantial underground copper minesale and processing facility.
In FY2013, Resolution Copper continued to advancepurchase agreement for the sinkingacquisition by Cavalla Resources of BHP Billiton’s 100 per cent interest in its Liberia iron ore project. Completion of the No. 10 Shaft in order to gain accesstransaction remains subject to the receipt of regulatory approval and other customary closing conditions.
Performance
Total iron ore depositproduction, including our proportional share of production for characterisation workwhich profit is derived from our equity accounted investments, increased by 14 per cent in FY2015 to a record 233 Mt. WAIO production increased by 13 per cent to a record 254 Mt (100 per cent basis) as a result of mineralisationcontinued improvement in the performance of our integrated supply chain and geotechnical conditions. Work is continuing towards gaining approval from the US Congresssuccessful ramp-up of the Jimblebar mining hub. Continued optimisation of the port facilities and an increase in direct to ship ore resulted in record sales volumes at WAIO of 256 Mt (100 per cent basis). Samarco production increased by 33 per cent to 29 Mt (100 per cent basis) as the fourth pellet plant ramped up to full capacity.
Iron Ore revenue decreased by US$6.6 billion to US$14.8 billion, which included a 31 per cent decrease in revenue for WAIO of US$6.4 billion to US$14.4 billion. The major contributor to this decline was a federal land exchange41 per cent decline in average realised price of iron ore to accessUS$61 per wet metric tonne (FOB), which was partially offset by an increase in WAIO sales volumes.
Underlying EBIT for FY2015 decreased by US$5.2 billion to US$6.9 billion. The fall in the average realised price of iron ore deposit and advance the project.
Yeelirrie
On 27 August 2012, we announced we had signed an agreement to sell our wholly owned Yeelirrie uranium deposit in Western Australia to Cameco Corporation forreduced Underlying EBIT by US$4308.7 billion, net of price-linked costs, although this was partially offset by a weaker Australian dollar, which increased Underlying EBIT by US$499 million. The sale was settled on 19 December 2012.improved performance of our integrated supply chain at WAIO and the successful ramp-up of the Jimblebar mining hub supported an increase of US$1.9 billion volume impact to Underlying EBIT. Cost efficiencies from productivity initiatives increased Underlying EBIT by US$1.2 billion.
2.2.3 Iron Ore Business
Our Iron Ore BusinessUnit cash costs is one of the leadingfinancial measures used to monitor the performance of our individual assets.
WAIO unit cash costs (excluding freight and royalties) declined by 31 per cent to US$19 per tonne, underpinned by reductions in labour, contractor and maintenance costs, lower diesel prices and a stronger US dollar against the Australian dollar.
Outlook
Total iron ore producersproduction is forecast to increase by six per cent in FY2016 to 247 Mt. WAIO production is forecast to increase to approximately 270 Mt (100 per cent basis) as a result of improved efficiency at Mining Area C, Newman and our rail and port operations.
Further productivity improvements and the world. We sell lump and fines products produced in Australia and pellets from our operations in Brazil.
Our two assets consistlow-cost expansion of the following:Jimblebar mining hub, which comprises the installation of a new primary crusher and additional conveying capacity, are expected to deliver an increase in system capacity to 290 Mtpa (100 per cent basis) over time.
Western Australia Iron Ore
Operations at Western Australia Iron Ore (WAIO) involve an integrated system of mines and more than 1,000 kilometres of rail infrastructure and port facilities in the Pilbara region of northern Western Australia,Costs associated with the headquarters located in Perth. Our strategy is to maximise output utilising available infrastructure at our disposal. Our priorities are to continue our growth projects currently in execution,Jimblebar expansion, as well as maintaining our options for future growth.
Our WAIO operations consist of four joint ventures: Mt Newman, Yandi, Mt Goldsworthythe investment to purchase additional tugs and Jimblebar. Our interest in Mt Newman, Yandi and Mt Goldsworthy Joint Ventures is 85 per cent. Mitsui and ITOCHU own the remaining 15 per cent. On 10 July 2013, our ownership in Jimblebar Joint Venture reduced to 85 per cent following the issuing of equity inconstruct a subsidiary company, for which BHP Billiton received total consideration of US$1.5 billion in shares and loans of the subsidiary.
The Mt Newman Joint Venture (JV) consists of a number of ore bodies joined by conveyors and spur lines to a mining hub at Mt Whaleback. Ore is crushed, beneficiated (where necessary) and blended to create the Mt Newman blend for lump and fines. The ore is then transported to port using Mt Newman JV-owned rail facilities. Ore produced by Yandi JV is processed at the Yandi mine and transported by rail on the Newman main line. The Mt Goldsworthy JV consists of the Area C mine in the central Pilbara and Yarrie mine in northern Pilbara.
All ore is transported by rail on the Mt Newman and Mt Goldsworthy rail lines to port facilities. A typical train configuration consists of two locomotives per 124 ore cars, called a rake, with two rakes per train. Each individual ore car carries approximately 128 tonnes of iron ore. Our rail operations are controlled from Perth via our integrated remote operations centre which co-locates rail control, port production control, mine dispatch control and mine fixed plant control.
Our port facilities are located on both sides of thenew tug harbour at Port Hedland, consistingare expected to be included within WAIO’s average sustaining capital expenditure budget of Nelsonapproximately US$5 per tonne. WAIO unit costs are expected to fall to US$15 per tonne in FY2016.
1.12.5 Coal Business
Our Coal Business, headquartered in Brisbane, Australia, is the world’s largest supplier of seaborne metallurgical coal, a key input in steel production. Our Coal Business is also a large supplier of seaborne energy coal (also known as thermal or steaming coal) and a domestic energy coal supplier in the countries where our mines are located.
Results
| | | | | | | | | | | | |
Year ended 30 June (1) | | 2015
US$M | | | 2014
US$M
Restated | | | 2013
US$M
Restated | |
| | | |
Revenue | | | 5,885 | | | | 6,563 | | | | 6,574 | |
Underlying EBIT | | | 348 | | | | 575 | | | | 424 | |
Capital expenditure | | | 729 | | | | 1,971 | | | | 3,136 | |
Net operating assets | | | 11,769 | | | | 11,909 | | | | 10,632 | |
Production – metallurgical coal (Mt) | | | 43 | | | | 38 | | | | 30 | |
Production – energy coal (Mt) | | | 41 | | | | 43 | | | | 41 | |
| (1) | Information included in this table excludes Energy Coal South Africa and Illawarra Coal given they formed part of the South32 demerger. The numbers for FY2013 and FY2014 have been restated to exclude Energy Coal South Africa and Illawarra Coal. |
A summary of the assets, development projects and FY2015 performance of our Coal Business is presented as follows.
Description of the Coal Business
Our assets comprise the following:
Queensland Coal (Australia)
Queensland Coal comprises the BHP Billiton Mitsubishi Alliance (BMA) and BHP Billiton Mitsui Coal (BMC) Assets in the Bowen Basin in Central Queensland, Australia.
The Bowen Basin is well positioned to supply the seaborne market because of its high-quality metallurgical coals, which are ideally suited to efficient blast furnace operations, and its geographical proximity to Asian customers. We have access to key infrastructure in the Bowen Basin, including a modern, multi-user rail network, and our own coal loading terminal at Hay Point, located near the city of Mackay. We also have contracted capacity at three other multi-user port facilities, including the Port of Gladstone (RG Tanna Coal Terminal), Dalrymple Bay Coal Terminal and Abbot Point Coal Terminal.
Map of Queensland Coal
BHP Billiton Mitsubishi Alliance – BMA owns and operates open-cut and underground metallurgical coal mines in the Bowen Basin, and also owns and operates the Hay Point Coal Terminal. We share 50–50 ownership with Mitsubishi Development. BMA operates the Goonyella Riverside, Broadmeadow, Daunia, Caval Ridge, Peak Downs, Saraji, Gregory Crinum and Blackwater mines. Our share of total production in FY2015 was 33.9 Mt. During FY2015, BMA announced the ramping down of the Crinum underground mine as it approaches the end of its economic reserve life, with longwall production expected to cease in the March 2016 quarter.
BHP Billiton Mitsui Coal – BMC is a subsidiary company owned by the Mt Newman JV,BHP Billiton (80 per cent) and Finucane Island, owned by the Mt Goldsworthy JV. The port facilities include five ore car dumpers, three screening plants, nine stackers, five reclaimers, stockMitsui and blending yards,Co (20 per cent). BMC owns and eight ship loaders. Vessels depart the harbour via a dredged channel that is approximately 45 kilometres longoperates South Walker Creek and has a width of 300 metres.
Lump and fines products are sold to steel mills in China, South Korea, Japan, Singapore, Hong Kong, Taiwan, Switzerland and Australia, under long-term and short-term contracts. Contract prices are generally linked to market indices.
After the acquisition of HWE Mining Subsidiaries from Leighton Holdings on 30 September 2011, we now operate allPoitrel, both open-cut metallurgical coal mines except for Wheelarra and Orebody 18, as noted in the table below.
Bowen Basin. Total production in FY2015 was 8.7 Mt.New Mexico Coal (United States)
AlongWe own and operate the San Juan energy coal mine located in the US state of New Mexico. The mine transports its production directly to the nearby San Juan Generating Station (SJGS). Production for FY2015 was 5.1 Mt.
To ensure the ongoing supply of coal to the SJGS beyond 2017, in May 2015, the SJGS owners reached an in principle agreement for a new Coal Supply Agreement with Westmoreland Coal Company. In conjunction with this, in July 2015, New Mexico Coal executed a sales agreement with Westmoreland for the other joint venture participants, wepurchase of the San Juan Mine. Subject to regulatory approval, the transaction is expected to be completed at the end of CY2015 with Westmoreland assuming full operation of the mine from 1 January 2016.
We also operate the nearby Navajo mine, located on Navajo Nation land in New Mexico. Full ownership of the Navajo Coal Company transferred to the Navajo Transitional Energy Company (NTEC), an entity of the Navajo Nation, effective 30 December 2013. New Mexico Coal and NTEC have entered into marketing agreementsa Mine Management Agreement where New Mexico Coal will continue as mine operator until 31 December 2016, at which time
control will pass to a new mine manager. Navajo mine transports its production directly to the nearby Four Corners Power Plant. Production for FY2015 was 4.9 Mt. As we retain control of the mine until full consideration is paid, production continues to be reported by the Group.
New South Wales Energy Coal (Australia)
Our wholly owned New South Wales Energy Coal Asset owns and operates the Mt Arthur Coal open-cut energy coal mine in the formHunter Valley region of joint ventures with certain customers. These customer joint ventures, JW4, Wheelarra and POSMAC, involve subleases of part of WAIO’s existing mineral leases, with ore being sold to the existing joint ventures with contractual terms applying to the customers’ share. As a consequence, we are entitled to 85 per cent of production from these subleases and the customer joint ventures are accounted for as marketing arrangements rather than as jointly controlled assets.New South Wales, Australia.
New South Wales Energy Coal produced 19.7 Mt in FY2015.
Cerrejón (Colombia)
We have been expandinga one-third interest in Cerrejón, which owns, operates and markets one of the world’s largest open-cut export energy coal mines, located in the La Guajira province of Colombia.
In FY2015, our WAIOshare of Cerrejón production was approximately 11.3 Mt.
More information on our assets and operations is presented in response to increasing demand for iron ore. Since 2001,section 2.1.4 of this Annual Report.
Completed development projects
Cerrejón P40 Project
In August 2011, we have completed sixannounced a US$437 million (BHP Billiton share) investment in the expansion projects and are undertaking a further two projectsof Cerrejón, known as the P40 Project, which is expected to increase our mine, rail and port capacity from 67 million tonnes per annum (Mtpa)Cerrejón’s thermal coal production by 8 Mtpa to an expected minimum capacity of 220approximately 40 Mtpa (100 per cent basis). The project scope includes a second berth and dual quadrant ship loader at Cerrejón’s 100 per cent owned and operated Puerto Bolivar, along with necessary mine, rail and associated supply chain infrastructure. Construction commenced in CY2011 and the project handled its first coal in the December 2013 quarter. However, operational issues are expected to constrain capacity to approximately 35 Mtpa (100 per cent basis) in the medium term. The final cost was US$376 million (BHP Billiton share) and the project was completed during the December 2014 quarter.
Development projects in execution at year-end
Hay Point Coal Terminal Expansion Stage 3
In March 2011, we approved the third expansion of the Hay Point Coal Terminal. The expansion of the terminal will deliver an additional 11 Mt of annual port capacity (100 per cent basis). The project investment has a budget of US$1.5 billion (BHP Billiton share). In January 2015, first coal was loaded through the expanded terminal and the project was 97.6 per cent complete at 30 June 2015.
Newcastle Port Third Phase Expansion
In August 2011, we announced a US$367 million (BHP Billiton share) investment in the third stage development of the Newcastle Coal Infrastructure Group’s coal handling facility in Newcastle. The port expansion project is expected to increase total capacity at the coal terminal from 53 Mtpa to 66 Mtpa. This is expected to increase New South Wales Energy Coal’s allocation by 4.6 Mtpa to 19.2 Mtpa. First coal on ship, being the first ship loaded through the new facility, was achieved in June 2013, ahead of schedule. At 30 June 2015, the project was 99.5 per cent complete.
IndoMet Coal Project
IndoMet Coal comprises seven coal contracts of work covering a large metallurgical coal resource in Central and East Kalimantan, Indonesia, which was discovered by BHP Billiton in the 1990s. Following an assessment of the importance of local participation in developing the project, in 2010 we sold a 25 per cent interest in the project to a subsidiary of PT Adaro Energy TBK. We retain 75 per cent of the project and hold management responsibility.
During FY2015, IndoMet completed infrastructure development and received an operating permit to commence mining at Haju mine. Production is expected to commence from the 1 Mtpa Haju mine in Indonesia during FY2016.
More information on our development projects is presented in section 2.4 of this Annual Report.
Performance
Metallurgical coal production increased by 13 per cent in FY2015 to a record 43 Mt. Record production and sales volumes at Queensland Coal were supported by the successful ramp-up of the Caval Ridge mine and continued productivity improvements. An increase in equipment and wash-plant utilisation rates underpinned record volumes at six other operations.
Energy coal production, including our proportional share of production for which profit is derived from our equity accounted investments, for FY2015 decreased by five per cent to 41 Mt as anticipated. Lower production reflected drought conditions and the need to manage dust emissions at Cerrejón, as well as reduced demand for our Navajo Coal product.
Coal revenue for FY2015 decreased by US$678 million to US$5.9 billion. The decrease in revenues was driven by a 20 per cent reduction in the average realised price for hard coking coal to US$105/t, a 21 per cent reduction in the average price received for weak coking coal to US$88/t and a 22 per cent reduction in the average realised price for thermal coal to US$58/t.
Underlying EBIT for FY2015 decreased by US$227 million to US$348 million. The price impact, net of price-linked costs, on Underlying EBIT for FY2015 was a decrease of US$1.0 billion. This was partially offset by a stronger US dollar against the Australian dollar, which increased Underlying EBIT by US$406 million, and productivity cost efficiencies which increased Underlying EBIT by US$418 million.
Unit cash costs is one of the financial measures used to monitor the performance of our individual assets.
Queensland Coal unit cash costs (excluding freight and royalties) declined by 23 per cent to US$65 per tonne, supported by increased equipment and wash-plant utilisation rates, a continued reduction in labour, contractor and maintenance costs and a favourable currency movement.
Outlook
Metallurgical coal production is forecast to decrease in FY2016 to 40 Mt as operations at Crinum are expected to cease in the first quarter of CY2016 as the mine approaches the end of its economic reserve life. Energy coal production is forecast to remain broadly unchanged in FY2016 at 40 Mt.
In FY2016, unit costs are expected to decline to US$61 per tonne as the benefits from embedded productivity initiatives and a stronger US dollar, more than offset the removal of low-cost Crinum volumes and the expenses associated with its closure.
1.12.6 Other assets
Our Other assets include the following:
Nickel West (Australia)
Our wholly owned Nickel West Asset in Western Australia consists of an integrated system of mines, concentrators, a smelter and a refinery. Nickel West production in FY2015 was 89.9 kt of contained nickel. On 31 October 2013, production at the Nickel West Leinster Perseverance underground mine was suspended following a significant seismic event. A subsequent review of the incident determined it was unsafe to resume operations.
Performance
Revenue for Nickel West decreased by 13 per cent to US$1.4 billion predominantly due to lower sales volumes.
Underlying EBIT for Nickel West increased by US$134 million due to cost efficiencies and a favourable exchange rate movement, which was partially offset by a movement in ceased and sold operations from the closure of the Nickel West Leinster Perseverance underground mine during FY2014.
More information on our assets and operations is presented in section 2.1.5 of this Annual Report.
1.13 Our people
Enabling our organisation to realise its potential through our people is fundamental to our success. We are focused on facilitating a culture where our employees are provided with opportunities to develop, are valued and are encouraged to contribute toward making work safer, simpler and more productive. Achieving this in a focused and collaborative way will mean we can deliver greater value to our shareholders.
1.13.1 Employees and contractors
Our Charter enables us to align our people around a common purpose and values, as well as provide clear guidance for how we do business and the way in which we work, wherever we are based in the world.
The table below provides the average number of employees and contractors over the last three financial years.
| | | | | | | | | | | | | | | | |
Year ended 30 June | | 2015 | | | 2015 | | | 2014 (b) | | | 2013 (b) | |
| | | Continuing
operations (a) | | | Discontinued
operations (a) | | | | | | | |
Employees | | | 29,670 | | | | 13,159 | | | | 47,044 | | | | 46,892 | |
Contractors | | | 50,698 | | | | 13,352 | | | | 76,759 | | | | 79,330 | |
| | | | | | | | | | | | | | | | |
Total | | | 80,368 | | | | 26,511 | | | | 123,803 | | | | 126,222 | |
| | | | | | | | | | | | | | | | |
The table below shows the gender composition of our workforce, senior leaders and the Board over the last three financial years.
| | | | | | | | | | | | | | | | |
Year ended 30 June | | 2015 | | | 2015 | | | 2014 (b) | | | 2013 (b) | |
| | | Continuing
operations (a) | | | Discontinued
operations (a) | | | | | | | |
Male employees | | | 24,487 | | | | 11,331 | | | | 39,517 | | | | 38,920 | |
Female employees | | | 5,183 | | | | 1,828 | | | | 7,527 | | | | 7,972 | |
Female employees (%) | | | 17 | | | | 14 | | | | 16 | | | | 17 | |
Male senior leaders (c) | | | 293 | | | | 85 | | | | 317 | | | | 326 | |
Female senior leaders (c) | | | 62 | | | | 19 | | | | 55 | | | | 40 | |
Female senior leaders (%) | | | 17 | | | | 18 | | | | 15 | | | | 11 | |
Male Board members | | | 10 | | | | | | | | 12 | | | | 11 | |
Female Board members (d) | | | 2 | | | | | | | | 2 | | | | 2 | |
Female Board members (%) | | | 17 | | | | | | | | 14 | | | | 15 | |
| (a) | For a description of the South32 demerger and reporting of Continuing and Discontinued operations, see sections 1.3.7, 1.6.4, and 2.1.7 of this Annual Report and note 29 ‘Discontinued operations’ to the Financial Statements. |
| (b) | These figures have not been restated for the purposes of the South32 demerger or reporting of Continuing and Discontinued operations. |
| (c) | For UK law purposes, we are required to show information for ‘senior managers’, which is defined to include both senior leaders and any persons who are directors of any subsidiary company even if they are not senior leaders. In FY2015, 355 senior leaders comprise the top people in the organisation. There are 50 directors of subsidiary companies who are not senior leaders, comprising 36 males and 14 females. Therefore, for UK law purposes, the total number of senior managers is 329 males and 76 females (19 per cent female). |
| (d) | For information relating to changes to the Board following year-end please refer to section 3.1 of this Annual Report. |
The tables below provide a breakdown of the average number of employees across the Group, in accordance with our reporting requirements under the UK Companies Act 2006. The calculation includes the Executive Director, 100 per cent of employees of subsidiary companies, and our share of joint operations, for each of the past three financial years. Employees of equity accounted entities are not included. Part-time employees are included on a full-time equivalent basis. Employees of businesses acquired or disposed of during a particular year are included for the period of ownership. Contractors are not included.
| | | | | | | | | | | | |
Year ended 30 June | | 2015 | | | 2014 (a) | | | 2013 (a) | |
Average number of employees for Continuing operations | | | | | | | | | | | | |
Petroleum and Potash | | | 4,224 | | | | 4,207 | | | | 4,449 | |
Copper | | | 9,138 | | | | 9,414 | | | | 9,765 | |
Iron Ore | | | 7,483 | | | | 8,035 | | | | 6,883 | |
Coal | | | 5,579 | | | | 6,160 | | | | 6,006 | |
Group and unallocated | | | 3,246 | | | | 3,687 | | | | 4,054 | |
| | | | | | | | | | | | |
Total average number of employees for Continuing operations | | | 29,670 | | | | 31,503 | | | | 31,157 | |
| | | | | | | | | | | | |
Total average number of employees from Discontinued operations | | | 13,159 | | | | 15,541 | | | | 15,735 | |
| | | | | | | | | | | | |
Total average number of employees | | | 42,829 | | | | 47,044 | | | | 46,892 | |
| | | | | | | | | | | | |
| (a) | These figures have not been restated for the purposes of the South32 demerger or reporting of Continuing and Discontinued operations. |
The table below provides a breakdown of our average number of employees by geographic region for each of the last three financial years.
| | | | | | | | | | | | | | | | |
Year ended 30 June | | 2015 | | | 2015 | | | 2014 (b) | | | 2013 (b) | |
| | | Continuing
operations (a) | | | Discontinued
operations (a) | | | | | | | |
Africa | | | 117 | | | | 6,875 | | | | 9,035 | | | | 9,121 | |
Asia | | | 1,022 | | | | 121 | | | | 1,105 | | | | 1,183 | |
Australasia | | | 16,839 | | | | 4,589 | | | | 23,048 | | | | 21,977 | |
Europe | | | 83 | | | | 19 | | | | 146 | | | | 231 | |
North America | | | 4,188 | | | | – | | | | 4,373 | | | | 5,116 | |
South America | | | 7,421 | | | | 1,555 | | | | 9,337 | | | | 9,264 | |
| | | | | | | | | | | | | | | | |
Total | | | 29,670 | | | | 13,159 | | | | 47,044 | | | | 46,892 | |
| | | | | | | | | | | | | | | | |
| (a) | For a description of the South32 demerger and reporting of Continuing and Discontinued operations, see sections 1.3.7, 1.6.4, and 2.1.7 of this Annual Report and note 29 ‘Discontinued operations’ to the Financial Statements. |
| (b) | These figures have not been restated for the purposes of the South32 demerger or reporting of Continuing and Discontinued operations. |
Changes in market conditions, and our business transformation programs focused on improving efficiencies and driving greater productivity have resulted in a decrease in our workforce requirements. Additionally, the deferral of some projects has had a consequential reduction in the workforce required for such projects. The FY2015 reductions were predominately in our contractor workforce, primarily in our Petroleum and Potash, Iron Ore and Coal Businesses.
1.13.2 Employee policies and engagement
At BHP Billiton, our people are fundamental to our success. Our people strategy focuses on developing our future leaders, engaging and supporting our high-performance workforce, and continuing to build a diverse team and inclusive workplace culture.
Our people strategy reflects our desire to have a highly motivated team and the importance of building effective leadership and deep functional expertise across our workforce to enable productivity. We strongly believe that having employees who are engaged and connected to our organisation reinforces our shared purpose, aligned toOur Charter, and will result in a more harmonious workplace.
An important component of our people strategy is how we enable our leaders to step up and drive greater productivity. In FY2015, a new leadership development framework, Leading the Future, was developed and implemented to address the findings of our FY2013 employee survey. Based on the premise that leadership drives culture and culture drives performance, the framework is globally consistent, sustainable and designed to build a distinctive BHP Billiton leadership capability. The first program introduced was Leading Step Up, a global approach to shifting our culture in the areas of employee engagement, the way we lead change, and how we develop our people. Targeted at all frontline people leaders in our operations, Group Functions and Marketing, Leading Step Up is delivered locally by BHP Billiton leaders, taught through practical everyday routines, and reinforced with regular feedback and coaching. To ensure continuous improvement, the program will be measured through local observation and feedback discussions, and through our annual employee surveys. Leading the Future will continue to be implemented across the business in FY2016.
Integral to achieving effective employee engagement is our approach to communication. We believe communication is a two-way process that we undertake through a variety of channels, including face-to-face, the
internet, intranet, email, newsletters, online collaboration forums and other means designed to cater for the local environment. Annually we seek feedback from our employees via an Employee Perception Survey. The findings from these surveys inform our HR practices and are used to measure and track people-related performance.
Our Charter, the BHP BillitonCode of Business Conduct and Human Resources GLDs prescribe what we will do and the behaviours that we expect of those who work for, or on behalf of, BHP Billiton. All of these documents are accessible to employees. Also, our employees can access our Annual Reports either via the internet or hard copy and receive regular communications on BHP Billiton goals and performance, as well as on other important issues such as health and safety, the environment and theCode of Business Conduct. Dispute and grievance handling processes exist to address issues across the Company. A business conduct advisory service, EthicsPoint, operates worldwide to allow concerns to be raised about conduct that is out of step withOur Charter values, our policies and procedures or legislation.
To help our people focus on clear goals, deliver our strategic and operational priorities and align behaviour toOur Charter, in FY2015, 86 per cent of our total number of employees participated in a formal performance management process, including 86 per cent of our operators and support staff. This process also provides the opportunity for employees to receive feedback and coaching, and identify skills and capabilities requiring further development. Due to industrial agreements, not all our employees are able to participate in individual performance or reward programs.
BHP Billiton is committed to creating a diverse workforce and inclusive work environment in which every employee is respected, treated fairly and embraced for their unique skills, experiences and perspectives. Discrimination on any basis, including disability, is not acceptable. In instances where employees require support for a disability, we work with them to identify roles that meet their skill, experience and capability, and offer retraining where required. Where practical to do so, flexible work practices are offered, taking into account the needs of the employee and those of the particular workplace. The employment packages under our remuneration policy, which must comply with local regulations, are aligned to our business requirements and are designed to be sufficiently attractive to recruit and retain highly capable and experienced candidates.
Our employee share purchase plan, Shareplus, is available to all permanent full-time and part-time employees, and those on fixed-term contracts, except where local regulations limit operation of the scheme. In these instances, alternate arrangements are in place. As at 30 June 2015, 14,077 employees were participants in Shareplus. Short-term and long-term incentive schemes also operate across the Group. Rewards for eligible individuals are predicated on the need to meet targets relating to the Group’s performance in areas such as health, safety and achievement of financial measures and on the personal performance of each employee.
1.13.3 Inclusion and diversity at BHP Billiton
Our Charter and Human Resources GLDs provide guidance on all aspects of our human resource management, including our approach to inclusion and diversity.
We believe that an inclusive work environment and a diverse workforce, where the unique skills, experiences and perspectives of our people are embraced, is pivotal to sustaining performance and further increasing our productivity. At BHP Billiton, we celebrate diversity in a broad sense, including differences in thought, perspectives, nationality, gender, sexual orientation, age and experience. In relation to gender, the Board had a goal of increasing the number of women on the Board to three by the end of CY2015. This has now been achieved with the announcement on 14 August 2015 that Anita Frew has been appointed to the Board (effective 15 September 2015) and will stand for election at the 2015 AGMs.
Each financial year, the Board considers, approves and monitors progress on the Group’s performance objectives. More details are set out below.
Our approach to inclusion and diversity is underpinned by the following principles:
a diverse workforce and an inclusive environment are necessary to the delivery of our strategy that is predicated on diversification by commodity, geography and market;
our aspiration is to have a workforce that best represents the communities in which our assets are located and our employees live;
actions that support our inclusion and diversity objectives should be consistent with our established approach to talent, performance and reward;
achieving an appropriate level of diversity is facilitated by line leadership and structured programs that support employees from an early career stage in developing the necessary skills and experiences for leadership roles;
| • | | creating an inclusive work environment will require every employee and leader to embrace diversity and act in a way that is consistent withOur Charter; |
measurable objectives in support of inclusion and diversity will be transparent, fit for purpose and focus on (i) engaging, enabling and developing our workforce and (ii) establishing appropriate representation goals.
Progress against measurable objectives
A summary of the three objectives committed to in FY2015 and progress to date are set out below.
| 1. | Each Business, Group Function and Marketing will be evaluated on progress in executing the measurable objectives that form part of its multi-year diversity plan. |
As in previous years, monitoring and tracking performance against inclusion and diversity plans was undertaken as part of the Group’s internal compliance requirements. Performance for each Business, Group Function and Marketing was evaluated against FY2015 measurable objectives and the results of these evaluations were taken into account in determining bonus remuneration.
| 2. | Execute the inclusion and diversity strategy and actions approved by the GMC. |
Our Businesses, Group Functions and Marketing executed the GMC approved inclusion and diversity plan. During the reporting period:
| – | | Our CEO and senior management across the organisation reinforced the Company’s commitment to inclusion and diversity through internal and external communication channels, including leadership messages, town hall meetings and participation in external industry events. |
| – | | Our CEO and the executive team participated in an Inclusive Leadership and Unconscious Bias development experience. Key content was also included in the BHP Billiton Group-wide Leadership Development Program, Leading Step Up, seeking to strengthen the ability of all people leaders to engage, lead change and develop our people. |
| – | | A Senior Executive Sponsorship program for female talent was launched. In addition, Businesses continued executing their female mentoring programs. These initiatives have contributed to increasing female representation in pipelines to manager and above level roles. |
| – | | After successful pilot programs during FY2014, flexible work arrangements were implemented in some Businesses, Group Functions and Marketing. Implementation was supported by information and engagement sessions led by line managers. |
| – | | Initiatives to keep employees engaged while on parental leave were successfully implemented. These included keep in touch meetings with employees during their parental leave and parental coaching sessions for managers. |
| – | | Initiatives to develop and promote diverse talent continued to be deployed across different regions. Key initiatives included career panel discussions, talent discussions sessions for diverse employees and implementing inclusion of diverse candidates for vacant roles. |
| – | | Actions to increase representation of Indigenous peoples (including Aboriginal and Torres Strait Islander peoples) in our workforce continued to be executed. Actions included targeted resourcing strategies, training programs and integration initiatives to broaden their employment opportunities. |
| – | | From our baseline in 2010, female representation increased by (i) 13 per cent in manager and senior leadership roles to 21 per cent and (ii) two per cent in our overall workforce representation to 17 per cent(a). We remain committed to increasing overall female representation, with a specific focus on operational areas. |
| – | | In FY2015, female representation in our graduate intake increased by 7.6 per cent at a global level to 42 per cent and by 10 per cent to 46 per cent in Australia(b). Representation of Aboriginal and Torres Strait Islander peoples in the graduate intake in Australia increased by six per cent to 11 per cent. |
| 3. | Demonstrate year-on-year improvement in creating a work environment of inclusion, as measured by our employee survey index. |
As part of our employee survey, we gauge employees’ perceptions of feeling valued and heard. Results, together with tools and materials to assist action planning and improvement, were cascaded to business leaders and line managers. Results demonstrate a three per cent increase from last year.
| (a) | These figures represent outcomes for Continuing operations. For Discontinued operations, female representation in manager and senior leadership roles was 17 per cent (totalling 19 per cent for the Group for FY2015) and female representation for the overall Discontinued operations workforce was 14 per cent (totalling 16 per cent for the Group for FY2015). We remain committed to increasing overall female representation, with a specific focus on operational areas. |
| (b) | These figures represent outcomes for the total Group (including Discontinued operations). In relation to Discontinued operations, three per cent of these graduates from the total Group were transferred to South32 as part of the demerger. |
Continuous improvement
In FY2016, we will continue to focus on creating a more inclusive work environment and on enhancing our gender and diversity profile. We will take the following steps to achieve this commitment:
demonstrate progress against key objectives to improve the diversity of our workforce profile with particular emphasis on increasing female representation year-on-year, both overall and in leadership roles;
demonstrate year-on-year improvement in creating a work environment of inclusion, as measured by our employee survey index.
As in previous years, each Business, Group Function and Marketing will be evaluated on progress in executing the measurable objectives that form part of their scorecards and appraisal commitments. Successful completion of these objectives will be taken into account in determining bonus remuneration. Progress against each year’s measurable objectives will continue to be tracked as part of the Group’s internal compliance requirements and disclosed in the Annual Report.
1.14 Sustainability
Sustainability is core to our business strategy and integrated into our decision-making. It helps us liveOur Charter values of putting health and safety first, being environmentally responsible and supporting our host communities.
In reporting our sustainability performance, we include our impact on the environment and approach to climate change, water stewardship, resource conservation and biodiversity; and our efforts to ensure the broader economic contributions of our operations benefit the regions in which we operate.
The information (including performance data) contained in this section, unless otherwise stated, covers assets that have been wholly owned and operated by BHP Billiton or that have been operated by BHP Billiton in a joint venture operation (operated assets) for FY2015. It also includes information (including performance data) relating to, and including, the demerged assets for the period from 1 July 2014 to 8 May 2015. Unless otherwise stated, data included in this section is presented on a Continuing operations basis.
We acknowledge the importance of measuring our broader impact. As such, in FY2015 we expanded our definition of work-related activities to align with the recording boundaries of the International Council on Mining and Metals (ICMM). This includes the recording of events that occur outside of our operated locations where we have established the work to be performed and can set and verify the health and safety standards.
1.14.1 Identifying our material sustainability issues
To deliver successfully on our business strategy, we identify and respond to the sustainability issues that have a direct or indirect impact on our business and our stakeholders. Using a materiality assessment process, we identify and prioritise material sustainability issues. The following issues are discussed in this Annual Report:
| | | | | | |
Governance | | Health and safety | | Environment | | Society |
• Governance and sustainability • Identifying and managing our material risks • Operating with integrity • Climate change | | • Keeping our people and operations safe • Focusing on the health of our people | | • Biodiversity management • Water • Responsibly managing hydraulic fracturing | | • Engaging with our host communities • Respecting human rights • Making a positive contribution to society |
Additional information relating to our materiality assessment process and our sustainability performance for FY2015 is available in our Sustainability Report 2015 and can be found online atwww.bhpbilliton.com.
1.14.2 Governance
Governance and sustainability
Our Board governs the Group in a manner consistent withOur Charter, our strategy and our commitment to a transparent and high-quality governance system. The Board has established a number of committees to assist in exercising its authority, including monitoring the performance of the Group.
The Sustainability Committee assists the Board in oversight of health, safety, environment and community (HSEC) matters, including climate change. This includes overseeing areas relating to HSEC risk control, compliance with applicable legal and regulatory requirements, and overall HSEC performance of the Group.
During FY2015, the Sustainability Committee continued to assist the Board in its oversight of HSEC issues and performance. This included consideration of strategic environmental and community matters, HSEC audits and trends, and the detailed reports from management of the relevant operation on the event, actions taken and investigations in the event of a fatality or significant incident.
Below the level of the Board, key management decisions are made by the CEO, the GMC, other management committees and individual members of management to whom authority has been delegated.
At the Group level, health, safety, environment and community teams provide guidance and thought leadership by developing and implementing HSEC management frameworks, focusing on catastrophic and fatal hazards management; identifying relevant HSEC trends; tracking performance and alignment with other Company requirements; and reporting progress against targets.
To link HSEC matters to remuneration, 20 per cent of the FY2015 short-term incentive opportunity for GMC members was based on HSEC performance. Given the importance the Group places on safety, the short-term incentive opportunity attached to HSEC has been increased for FY2016 to 25 per cent. The Sustainability Committee assists the Remuneration Committee in determining appropriate HSEC metrics to be included in GMC scorecards and in assessing performance against those measures.
The Remuneration Committee and the Board also have discretion over both the short-term and long-term incentive opportunities for GMC members and take into consideration HSEC performance. As a consequence of the five tragic fatalities in FY2015, the Board and the Remuneration Committee concluded, after taking advice from the Sustainability Committee, that a zero outcome was appropriate for the CEO’s FY2015 short-term incentive HSEC component, with the decision supported by the CEO.
Further information on the metrics and their assessment is available in the Remuneration Report contained in section 4 of this Annual Report.
Identifying and managing our material risks
In addition to the legal requirements of the countries in which we operate, our approach to sustainability risks is defined by our GLDs. These clearly describe our mandatory minimum performance requirements and accountabilities across the Group and are the foundation for developing and implementing management systems at our operations.
GLDs relating to HSEC matters set our Group-wide HSEC-related performance requirements to ensure effective management control of our sustainability risks. Our GLDs are consistent with the principles and mandatory requirements of the position statements of the ICMM Sustainable Development Framework, the United Nations (UN) Global Compact, the UN Declaration of Human Rights and the Voluntary Principles on Security and Human Rights.
At our operated assets, we have the ability to set workplace HSEC standards and enforce their application. Contractors working at our operated assets must comply with the minimum performance requirements in our relevant GLDs. In addition we seek to ensure our customers, suppliers, agents and service providers maintain business practices and workplaces that are aligned with our GLDs. We also seek to apply GLD performance requirements to our non-operated assets.
We use the framework in ourRisk Management GLD to identify and manage the risk involved in our business activities, functions and processes. This provides a strong foundation for our active and consistent risk-based approach to sustainability. A broader discussion of our risk factors and management approach is provided in section 1.7 of this Annual Report.
Operating with integrity
Integrity and accountability are core values at BHP Billiton and central to our reputation as one of the world’s leading companies. We are committed to ethical business practices and high-quality governance in all that we do. Regardless of the country or culture within which our people work, ourAnti-corruption GLD andCode of Business Conduct prohibit bribery and corruption in all our business dealings. Particulars in relation to theCode of Business Conduct and anti-corruption are referred to the Sustainability Report 2015 and in section 3.17 of this Annual Report. Specific discussion on legal proceedings is available in section 6 of this Annual Report.
Transparency of payments to governments
BHP Billiton considers the licences we have to operate in jurisdictions around the world as a privilege that bestows upon us a responsibility to contribute to the economic and social development of our host countries. A critical component of this responsibility is our taxation obligations to our host governments.
Our payments to governments in FY2015 on a country-by-country basis of US$7.3 billion are presented in our Sustainability Report 2015. Approximately US$1.4 billion in taxes collected on behalf of employees was also remitted to governments in FY2015. More than 99 per cent (excludes demerged assets) of our payments were made to nine countries. Of these, our largest payments were made in Australia, where we have the majority of our assets.
BHP Billiton has long been deeply committed to the role transparency plays in contributing to the good governance of natural resources for the benefit of the governments and citizens of countries that host our operations. This is why BHP Billiton has voluntarily publicly reported our payments of taxes and royalties in our Annual Sustainability Report in increasing detail over the last 15 years and has been a member of the Extractive Industries Transparency Initiative (EITI) since its inception in 2002. We continue our strong support through our active participation on the EITI Board.
We believe that transparency by governments and companies around revenue flows from the extraction of natural resources is an important element in the fight against corruption. A level and globally consistent playing field will ensure all companies disclose on the same basis and reduce the reporting burden for those operating in multiple jurisdictions. To this end, and consistent with our Transparency Principles, we support appropriate national and extra-territorial mandatory corporate reporting to complement the EITI and provide a globally consistent regulatory framework for all extractive industry companies.
We have disclosed our payments of taxes and royalties on a project-by-project basis, and payments to state and provincial governments at a subnational level, in a stand-alone BHP Billiton Economic contribution and payments to governments Report. This Report is available online atwww.bhpbilliton.com.
Closure planning
Closure planning is an important consideration in the planning and development of our mining and petroleum operations. We recognise the significant risks associated with ineffective closure and seek to minimise these through our closure governance framework. The closure framework integrates resource planning and development, health, safety and environment, stakeholder engagement, finance and assurance into business operational design.
Specifically, the framework requires each asset to develop closure plans. These plans describe closure objectives and the management process in place to reduce closure liabilities over the life of the asset.
An ongoing internal audit program continues to test the effectiveness of these closure plans and the business alignment to the closure planning framework, including the financial provisions. Information on these provisions can be found in note 14 ‘Closure and rehabilitation provisions’ to the Financial Statements. Audit findings are reviewed annually and reported to the relevant Business Presidents, while summary reports are considered by the Sustainability Committee of the Board. During FY2015, 11 audits were conducted against performance criteria and recommendations from such audits have been initiated.
Climate change
Our perspective on climate change
We accept the Intergovernmental Panel on Climate Change (IPCC) assessment of climate change science, which has found that warming of the climate is unequivocal, the human influence is clear and physical impacts are unavoidable.
Sustainable economic growth requires an effective response to climate change. The world needs reliable, affordable energy to support higher living standards and lower GHG emissions to keep the global average temperature rise below two degrees Celsius. We do not prioritise one of these requirements over the other. Both are essential.
Even allowing for significant improvements in energy efficiency, energy demand is expected to increase as the global population grows and living standards improve. Today, fossil fuels are often the most affordable, reliable and accessible way of meeting this demand and provide more than 80 per cent of the world’s primary energy. However, their growing use would substantially increase GHG emissions and exacerbate climate change unless new technology reduces their impact. To meet its development and climate goals, the world must find ways to progressively decarbonise the use of fossil fuels, improve energy efficiency and increase the use of alternative energy sources such as renewables and nuclear power.
Climate change governance
BHP Billiton’s strategy is tied to economic growth in both emerging and developed economies, and sustainable growth requires an effective response to climate change. Responding to climate change is a priority Board governance and strategic issue for our Company.
Our GMC has primary responsibility for the design and implementation of an effective position and response to climate, and accountability for performance against GHG emissions, our climate change metric. We also seek input and insight from external experts, such as the Forum on Corporate Responsibility.
To reflect updates in scientific knowledge and global regulatory and political responses, we regularly review our position on climate change. We incorporate climate change considerations into our Group scenario planning to understand potential impacts on our portfolio. We also conduct annual reviews of performance against Business GHG targets to ensure we are on track to achieve our Company target. The Sustainability Committee has considered a range of climate change scenarios and continues to monitor the actions being taken to manage a range of climate change impacts and policy responses.
Our approach
Our strategic approach to climate change is underpinned by engagement with policy makers and other stakeholders, including investors, companies and non-government organisations. We believe industry has a key role to play in climate change policy development by working with governments and other stakeholders to inform the development of effective long-term policy framework that delivers a measured transition to a lower emissions economy. BHP Billiton believes an effective policy framework should include a complementary set of measures, including a price on carbon, support for low-emissions technologies and measures to build resilience.
We continue to share lessons learnt with our stakeholders and identify solutions that we believe can drive emissions reductions at the lowest cost. In September 2014, BHP Billiton signed the World Bank’s Putting a Price on Carbon statement, which was presented at the 2014 UN Climate Summit in New York and we are a member of their Carbon Pricing Leadership Coalition. In 2015, we made two climate change policy submissions in response to the Australian Government’s discussion papers Setting Australia’s Post-2020 Target for GHG Emissions and Emission Reduction Fund: Safeguard Mechanism, sharing our perspective on the importance of this issue.
We have also hosted several policy roundtables, bringing cross-sectoral business groups together to discuss different ways that business and government can address climate change. Internationally, we look forward to the 21st Conference of the Parties (COP21) in Paris in December 2015 delivering a positive outcome that puts the world on a path to limit global temperatures to less than 2 degrees Celsius above pre-industrial levels, in line with current international commitments.
We are committed to transparent and open communications and have an ongoing and extensive engagement program with investors, government and the broader society, including our voluntary submission to the CDP (formerly known as the Carbon Disclosure Project). The CDP score is a measure of the actions that a company has demonstrated in carbon management. Our commitment to continuing transparency and disclosure has resulted in an improvement in our CDP score since 2013.
We have been taking action for many years to understand and manage the impacts of climate change on our business. We have been applying an internal price on carbon in our investment decisions and portfolio evaluation for more than a decade and were early adopters of this approach. We maintain a view on carbon pricing using a carbon price protocol, which we update regularly. Our carbon price protocol tracks the progress of national emissions reduction ambitions to tackle climate change throughout the world, including in our major operating regions and customer demand centres. In parallel, we look at the potential for reductions in emissions and the cost associated with those reductions to determine an appropriate long-term price level. We carry out this assessment for various scenarios which reflect the effectiveness and ambition of policies, the timing to implement reductions, the interaction between policy mechanisms and the role of low carbon technologies. We have an integrated approach to addressing climate change that has three key areas: mitigation, adaptation andlow-emissions technology.
Mitigation
As a major producer and consumer of energy, we prioritise GHG reductions and energy efficiency.
BHP Billiton is among the sector leaders in setting an absolute target to limit our GHG emissions. As we grow our business, this target encourages us to look for ways to improve our energy efficiency, increase productivity and implement additional GHG reduction projects across our operations. All our Businesses are required to identify, evaluate and implement suitable GHG reduction opportunities, including during project design and equipment selection.
In FY2015, the Group’s total GHG emissions were 38.3 million tonnes (Mt) of carbon dioxide equivalent (CO2-e). Taking into account the impact of the demerger, this represents a six per cent reduction on FY2014 GHG emissions. For the purposes of the FY2014 comparison, emissions from assets demerged with South32 for the period 1 July 2014 to 30 April 2015 were annualised. This reduction has been driven in part by GHG reduction projects across our Businesses and improved productivity.
GHG Scope 1 and 2 (millions of tonnes CO2-e)(a)
| | | | | | | | | | | | |
Year ended 30 June (b) | | 2015 | | | 2014 | | | 2013 | |
Scope 1 (c) | | | 20.7 | | | | 22.7 | | | | 22.0 | |
Scope 2 (d) | | | 17.6 | | | | 22.3 | | | | 24.7 | |
| | | | | | | | | | | | |
Total GHG millions of tonnes CO2-e | | | 38.3 | | | | 45.0 | | | | 46.7 | |
| | | | | | | | | | | | |
| (a) | Measured according to the World Resources Institute/World Business Council for Sustainable Development Greenhouse Gas Protocol. |
| (b) | Includes data for Continuing and Discontinued operations. |
| (c) | Scope 1 refers to direct GHG emissions from our operated assets. |
| (d) | Scope 2 refers to indirect GHG emissions from the generation of purchased electricity and steam that is consumed by our operated assets. |
In line with the requirements of the UK Companies Act 2006, our reported FY2015 GHG intensity was 3.8 tonnes of CO2-e per tonne of copper equivalent production (FY2014: 4.9 tonnes of CO2-e). Our reported FY2015 energy intensity was 30 petajoules per million tonnes of copper equivalent production. Copper
equivalent production has been based on FY2013 average realised product prices. Rather than use an intensity metric, we have set ourselves a challenging goal to limit our overall emissions by keeping our absolute FY2017 GHG emissions below our FY2006 baseline while we continue to grow our business.
A key example of our ongoing activity to reduce GHG emissions is our Fuel Quality Network that brings people together from across our Company to understand and test the benefits of improving fuel quality. Our investigations have shown that improving fuel chemistry can deliver significant reductions in diesel exhaust particulates and GHG emissions. We estimate that improving the quality of fuel delivered to our mobile plants has the potential to reduce energy consumption across the Company by around 4,600 terajoules (TJ) per annum and reduce GHG emissions by approximately 320,000 tonnes of CO2-e per annum. In addition, the Fuel Quality Network will help us to achieve cost savings in maintenance operations and deliver improved productivity.
Projects and initiatives such as these keep us on track to achieve our GHG emissions reduction target. We are committed to continued focus on the delivery of GHG reduction opportunities within our Businesses.
In addition to identifying opportunities within our Company, we also seek to contribute to global GHG emissions reductions. We are currently implementing a strategy to support REDD+ (Reducing Emissions from Deforestation and Forest Degradation), an international mechanism that provides economic, social and environmental incentives for developing countries to reduce GHG emissions from deforestation and related activities through the creation of carbon credits. Through project support, improved governance and climate finance market stimulation, BHP Billiton is playing a role in reducing deforestation, enhancing community livelihoods and improving biodiversity and watershed conservation. BHP Billiton and the International Finance Corporation are exploring ways of stimulating demand for REDD+ credits to support forest protection and conservation.
Adaptation
BHP Billiton’s corporate strategy is based on owning and operating long-life assets diversified by commodity, geography and market. Our success over many years can be attributed to the way we have successfully adapted to the changing business landscape. Building resilience to the physical impacts of climate change is just as essential to long-term business success.
We take a multifaceted approach to climate change adaptation, building resilience across activities both within our operations and investments, and outside of our operational control in our communities and ecosystems. We seek to leverage many of our established core business processes such as risk and planning. Climate risks may occur as a result of acute (extreme) weather events (e.g. floods and cyclones); chronic (incremental) changes in climate conditions, which may progressively increase risk over time (e.g. changes to temperature); and cumulative impacts from the interaction of direct and indirect climate impacts (e.g. changes to water availability). Our analysis has found that climate change will exacerbate existing risks while also exposing our Businesses to new risks. For example, cyclone management is critical for our Western Australia Iron Ore (WAIO) Asset and maintaining adaptive management practices will allow WAIO to respond to the expected increase in cyclone intensity in the Pilbara. We also require new investments to assess risks associated with the forecast impacts of climate change. For example, during the project design, identification and assessment of increasing storm intensity and storm surge levels resulted in raising the height of the trestle at our Hay Point coal port facility in Queensland, Australia, as part of our expansion plans.
Effective analysis of climate science is critical to our resilience planning and we take care to understand what variables and analysis make the most sense to our business. We are currently working with the CSIRO (Australia’s national science agency) to obtain analyses of the climate science. This will inform climate resilience planning at an asset level, improving our understanding of the material climate vulnerabilities that face our Businesses.
Technology
Technology and innovation have the potential to significantly reduce global emissions and meet long-term climate goals. Given that fossil fuels are likely to continue to be a significant part of the energy mix for decades, it is vital that low-emissions technologies (LET) are available at scale, lower cost and much faster than the usual commercial time frames to meet the challenge of climate change. Industry has a significant collaborative role to play with government, academia and the community to facilitate this necessary step change.
Since 2007, we have spent over US$400 million on LET research, development and deployment across a number of projects ranging in scale and complexity. For example, the West Cliff Ventilation Air Methane Project (WestVAMP) first piloted at Illawarra Coal’s Appin Colliery in 2001, utilises 20 per cent of available mine ventilation air to produce electricity. This reduces the site’s overall GHG emissions footprint by removing the methane from mine ventilation air.
BHP Billiton is also part of ONE Future, a coalition of companies from across the natural gas industry in the United States focused on identifying solutions for fugitive methane emissions management. ONE Future has developed an approach, that if widely adopted, could lower the total methane emissions of participating coalition companies to less than one per cent of gross production.
To build upon this contribution to the development of LET, we have recently established an integrated strategy that considers investment across a range of technologies that can lead to material emissions reductions in our operations and across our supply chains. When evaluating opportunity areas for potential investment, we look at several different factors, including the potential to impact upon global emissions and the opportunity to use our own skills and expertise to accelerate the change required, including our expertise in geology, engineering and markets.
We also seek to leverage our investments with the contribution of suitable partners, including governments, peers and research organisations. The focus for us is to consider the catalytic role that BHP Billiton can play in working with others to accelerate the deployment of technology to address material sources of emissions.
Our roadmap for investment includes the development and demonstration of carbon capture and storage (CCS) technologies, the reduction of fugitive methane emissions from coal and petroleum operations, high-efficiency/low-emissions power generation, low-emissions transportation and improvement and application of battery storage to enhance the wider deployment of renewable energy.
CCS can play a pivotal role in reducing emissions from oil and gas production, and from the use of fossil fuels in power generation and industrial processes. The key components of CCS (capture, transport and storage of CO2) have all been demonstrated successfully for many years. The challenge for large-scale deployment of CCS technology in the power and industrial sectors is the integration of the key components of CCS and appropriate commercial and regulatory support to foster further development.
Addressing the key barriers to deployment (regulatory uncertainty, cost and stakeholder concern) is essential if CCS is to become a global mitigation tool at the scale required to make a meaningful contribution to long-term climate goals. We have previously contributed to the development of CCS in both Australia and the United States and we are a founding member of CO2CRC, one of the world’s leading collaborative research organisations focused on long-term geological storage of carbon dioxide.
Portfolio evaluation
As well as taking action to reduce emissions, build resilience to the physical impacts of climate change, develop and deploy LETs and support an effective global response, we continue to identify and assess the impacts of climate change on our portfolio.
The starting point of our corporate planning process is the construction of a central case based on extensive analysis and research. Our current central case assumes the US economy continues to recover and strengthen, progressive development of China and India, integration of emerging economies into a multi-polar economic environment, and action on climate change centred on national policies.
Our corporate planning process uses scenario analysis to encompass a wide spectrum of potential outcomes for key global uncertainties. Designed to interpret external factors including technical, economic, political and governance trends facing the global resources industry, the scenarios offer a means by which to explore potential portfolio discontinuities and opportunities, as well as to test the robustness of decisions. Our scenarios do not constitute preferred outcomes for BHP Billiton. The scenarios are designed to be divergent, but also plausible and internally consistent, spanning unique potential future business environments.
According to independent bodies such as the International Energy Agency (IEA), fossil fuels will continue to supply a significant amount of the world’s energy for decades. This is the case even in the IEA’s ‘450 Scenario’, under which the world achieves a 2ºC outcome. Oil, coal and gas are likely to continue to constitute a significant part of the energy supply mix in countries like China and India, notwithstanding strong growth in renewables.
Given the ongoing role of fossil fuels, and the many uncertainties facing not only the resources sector but the world in general, accurately predicting how the world will respond to the challenge posed by climate change is difficult. Our scenario planning approach endeavours to consider a range of potential outcomes in order to understand the impacts on our portfolio and the critical signposts we must monitor in order to respond in a timely and effective way.
Our analysis highlights that our uniquely diversified portfolio of high-quality assets is robust across our scenarios and is highly unlikely to result in BHP Billiton assets being ‘stranded’. In a scenario where there is strong impetus to develop and implement cleaner, more energy efficient solutions and unified societal action to address climate change, our analysis indicates that there is a potential of upside for uranium, our high-quality hard coking coal and iron ore lump product. Copper is resilient and would offer continued opportunity for growth and our gas exposure may yet provide opportunities during a transition to a lower carbon economy. In aggregate, we anticipate these commodities are robust and provide options that could mitigate potential negative impacts on other commodities.
Regardless of the path the world chooses, we are committed to reducing our own emissions and to supporting global efforts to reduce general emissions.
1.14.3 Health and safety
Keeping our people and operations safe
The health and safety of our people and of the broader communities in which we operate is central to every aspect of our business. Regardless of where our people are located, the area of the organisation in which they work, or the type of work they undertake, we strive to create an environment that is free from occupational harm. However, we do recognise that environments we operate in can be hazardous.
Despite our goal to achieve zero work-related fatalities, tragically we lost five of our colleagues in FY2015. Four fatalities occurred during on-site work activities and one fatality occurred in an off-site transportation accident. Independent investigations were undertaken for each incident, with remedial action taken and findings from the investigations shared across the Group. In FY2014, we had no work-related fatalities at our operated assets, a goal that we will continue to work towards.
As part of our ongoing focus to eliminate fatal and other serious incidents, a Company-level safety intervention was initiated in FY2015. The safety intervention was launched with engagement across our business through a variety of methods, including workshops, team talks and surveys. Feedback was presented at our senior leaders’
meeting in July 2015, identifying the key controls, programs, systems, processes and tools currently in place that require improvement and Company-wide adoption through focused leadership.
Safety risk controls for Company-wide risks are included in ourSafety GLD and serve as the minimum mandatory controls. Each Business is required to assess whether additional controls are required to manage risks and to meet the objective of no fatalities.
During FY2015, our overall total recordable injury frequency (TRIF) performance of 4.1 injuries per million hours worked improved by two per cent compared with FY2014. Over the past five years, our TRIF has reduced by 18 per cent.
Total recordable injury frequency (per million hours worked)
| | | | | | | | | | | | |
Year ended 30 June (a) | | 2015 | | | 2014 | | | 2013 | |
Total recordable injury frequency (TRIF) | | | 4.1 | | | | 4.2 | | | | 4.6 | |
| | | | | | | | | | | | |
| (a) | Includes data for Continuing and Discontinued operations for the financial years being reported. |
Focusing on the health of our people
We want our people to be fit for work and make sure their work does not negatively impact their health or wellbeing now or in the future.
During FY2015, we continued to establish, maintain and review our exposure profiles and manage significant health risks. The minimum mandatory controls contained within ourHealth GLD are structured around three principal aims: the prevention of illness from exposure; ensuring people are fit for work; and returning people to work after illness or injury. These principal aims form the cornerstone of our health risk management framework.
In FY2012, we established a health target baseline and committed to reduce potential occupational exposure to carcinogens and airborne contaminants by 10 per cent by FY2017. In FY2015, the number of potential exposures to carcinogens and airborne contaminants requiring the use of personal protective equipment reduced by 40 per cent compared with our FY2012 baseline. We have therefore exceeded our target to date. While good progress has been made in relation to occupational exposures to carcinogens and airborne contaminants, we remain vigilant in adopting and maintaining effective exposure controls. Our FY2015 results are due to a number of initiatives across our operations, details of which can be found in our Sustainability Report 2015.
In FY2015, the incidence of employee occupational illness was 4.93 per million hours worked, an increase of 74 per cent compared with FY2014. Noise induced hearing loss cases increased significantly due to a more accurate assessment triggered by incorrectly applying our hearing loss criteria in previous years at some assets. Our reduction in musculoskeletal illnesses was primarily due to the introduction of a multifaceted control program at one of our assets.
| | | | | | | | | | | | |
Year ended 30 June (a) | | 2015 | | | 2014 | | | 2013 | |
Noise induced hearing loss | | | 3.05 | | | | 0.68 | | | | 0.51 | |
Musculoskeletal | | | 1.52 | | | | 1.61 | | | | 1.24 | |
Other illnesses | | | 0.36 | | | | 0.55 | | | | 0.64 | |
| | | | | | | | | | | | |
Total | | | 4.93 | | | | 2.84 | | | | 2.39 | |
| | | | | | | | | | | | |
| (a) | Includes data for Continuing and Discontinued operations for the financial years being reported. |
1.14.4 Environment
We seek to demonstrate our environmental responsibility by minimising our environmental impacts and leaving lasting benefits. We approach our environmental management in ways that address our responsibilities to firstly understand and minimise impacts, and, secondly to contribute more broadly as environmental stewards.
We complement our core business processes of risk management, and corporate planning, community development and stakeholder engagement with the minimum mandatory requirements for environmental management of ourEnvironment GLD. In this GLD, we take a risk-based approach and emphasise implementation of the mitigation hierarchy to avoid, minimise and rehabilitate direct, indirect and cumulative impacts within our area of influence across both short-term and long-term business horizons. We require our Businesses to set target environmental outcomes for land, biodiversity, water resources and air, and prevent or minimise GHG emissions, including in project design. Where unacceptable impacts remain to important biodiversity and ecosystems, we apply compensatory actions to address the residual impacts.
Biodiversity management
A sustainable society depends on biodiversity and its associated ecosystem services, such as food, air and water. Similarly, our operations depend on and have the potential to impact biodiversity and its related ecosystem services.
We have two targets focused on biodiversity that acknowledge the importance of maintaining the unique ecosystems and biodiversity of the areas in which we operate and the importance of conserving these more broadly. The first target requires the development and maintenance of land and biodiversity management plans that include controls demonstrating application of the mitigation hierarchy to manage the biodiversity and ecosystem impacts of our operations. This target is supported by the requirements of ourEnvironment GLD. In FY2015, consistent with our target, all operations developed land and biodiversity management plans.
The second target is at a wider Group level and is a voluntary commitment to financing the conservation and ongoing management of areas of high biodiversity and ecosystem value that are of national or international conservation significance. In FY2012, we established an alliance with Conservation International to support the delivery of this target and improve our approach to biodiversity management more broadly. As a result, we will improve our environmental performance and broaden our contributions to lasting environmental benefits beyond what could be achieved by our operations alone. As of FY2015, we have committed more than US$35 million to conservation, in addition to the environmental management activities at our operations.
A central part of our approach to managing our impacts on land and biodiversity is the rehabilitation of land no longer required for our activities. Our Businesses are required to maintain rehabilitation plans that support life-of-asset and closure plans. This includes rehabilitating disturbed areas that are no longer required for our operational purposes, consistent with the pre-disturbance land use or alternate land use, while taking into account regulatory requirements and stakeholder expectations. As at the end of FY2015, our total land rehabilitated was 40,800 hectares, a five per cent increase since FY2014, on the total area rehabilitated.
Water
The sustainability of our operations relies on our ability to obtain an appropriate quality and quantity of water, use it responsibly and manage it appropriately, including taking account of natural supply variations. As economies and populations continue to expand and pressure for water becomes more intense, we recognise the role we have as responsible stewards of the water we share with our host communities. We anticipate climate change is likely to make the patterns and cycles of water flow less predictable and require our operations to implement adaptive responses. Managing our shared water resources is therefore a complex task for our business.
To manage our shared water resources, our operations are required to assess the direct, indirect and cumulative impacts and risks to water resources. We do this by understanding the social, cultural, ecological and economic values of these resources at a catchment level within our area of influence. Based on the risks and impacts, our operations apply a mitigation hierarchy; implement controls and monitor their effectiveness. At the operational level, we maintain quantitative water balance models to predict and support the management of water inputs, use and outputs and to enable timely management responses to water-related risks. Where possible, we seek to use lower-quality or recycled water to minimise extraction requirements from higher-quality water resources.
Recognising the regional nature of our water risks, we introduced a target in FY2013 requiring our operations with water-related material risks to implement projects to reduce their impact on associated water resources. The target allows our Businesses to annually review and focus on the water challenges specific to the regions in which they operate. Further discussion on projects implemented as part of our water target can be found in our Sustainability Report 2015.
We report on our water use publicly, consistent with the Input Output model of the Minerals Council of Australia’s Water Accounting Framework (WAF). We are working with the ICMM to support broader adoption across the industry. The WAF aims to improve data integrity and comparability across the sector to allow a more meaningful analysis on which to base policy making and deliver improved outcomes.
Under the WAF, water is categorised as Type 1 (close to drinking water standards), Type 2 (suitable for some purposes), and Type 3 (unsuitable for most purposes). In FY2015, our total water input (water intended for use) was 340,200 megalitres across the Group, with 85 per cent defined as Type 2 or Type 3. Our use of Type 2 and Type 3 water demonstrates our approach to utilising lower-quality water wherever feasible.
Responsibly managing hydraulic fracturing
Since 2011, we have conducted onshore shale operations in the Eagle Ford, Permian, Haynesville and Fayetteville shale operations according to our North America Shale Operating Principles. These principles state our commitment to safety, and to protect the land where we operate, safeguard and manage water resources, minimise air emissions from our operations, and be a good neighbour to our host communities. We construct and operate our facilities in an environmentally sensitive manner. We conduct environmental assessments, and prepare plans with controls to minimise impacts to air, water, land and biodiversity.
We publicly report the ingredients of the fracturing fluids from each well completion into FracFocus, the hydraulic fracturing chemical disclosure registry. We don’t use benzene, toluene, ethylbenzene or xylene (BTEX) or diesel in our fracturing fluids, and we work with our service companies to reduce toxicity of fracturing fluids where possible.
We check every well we drill against our list of critical elements to ensure well integrity and the safety of our operations. Our Groundwater Risk Management Plan incorporates controls to prevent the loss of containment of pressurised fluids, including: casing annulus monitoring procedures to verify well integrity; proper wellhead and casing design and construction; and specialised training to assure competency. During FY2015, we voluntarily implemented a pre-drilling groundwater monitoring program in the active drilling areas of the Eagle Ford, Permian and Haynesville shale operations to establish a baseline of groundwater quality.
To improve management of water resources and reduce fresh water demand at our Eagle Ford operations, we implemented a mobile reverse osmosis system to produce potable water and treat waste water for reuse in drilling and completions at our drilling camps, while reducing trucking of water and waste. In our Permian shale operation, we use predominately a blend of brackish water and recycled produced water for our drilling and completions operations.
The majority of our air emissions relate to GHG emissions from fuel combustion, flaring and venting during well construction and production. We reduce methane emissions across our shale operations by capturing and selling the produced natural gas that would otherwise be vented or flared.
At our Permian shale operation, we increased the percentage of produced water sent through pipeline to disposal, eliminating a portion of trucking to disposal wells, which also contributed to GHG reductions. We utilise temporary pipelines instead of trucks throughout our shale operations to supply water to our construction operations. This reduces air emissions and relieves traffic stress on local roads and communities.
We accept the scientific basis for linking seismic activity to waste water injection wells associated with unconventional oil and gas production. As such, we conduct enhanced seismicity monitoring and other types of data acquisition to better understand and mitigate the risk of the potential for induced seismic activity associated with waste water disposal operations. We actively participate in cooperative efforts with stakeholders (industry, government, science community and the public) to better understand and promote best practice risk management in our operations.
1.14.5 Society
We strive to be a valued partner in the communities in which we operate and, through all our interactions, seek to foster meaningful, long-term relationships that respect local cultures and create lasting benefits. We believe this is fundamental to being a responsible corporate citizen and is a clear demonstration ofOur Charter values.
Engaging effectively in communities
OurCommunity GLD prescribes an inclusive and proactive approach to stakeholder engagement. We seek to build connections with stakeholders early in the life cycle of our operations, maintain open and ongoing communications with them, and operate transparently in relation to our plans and performance. In order to be effective and reach as many people as possible, we ensure these engagement activities are culturally and socially inclusive.
Our stakeholder engagement process requires our assets and operations to identify and analyse stakeholder groups to determine the level of impact the Company has on them and their level of interest in engaging with us. Each asset and operation then designs community engagement activities suitable for each of the stakeholder groups and individuals, where appropriate. Through engagement, with our host communities we also develop an understanding of the social and economic environment, including potential impacts and opportunities.
To measure the effectiveness of our engagement and community development activities, our operations are required to complete a community perception survey every three years. These surveys provide a valuable external perspective on the quality of our engagement and whether our stakeholders believe we are addressing their key concerns.
Respecting human rights
BHP Billiton’s corporate responsibility to respect human rights is embedded within the Company’s systems and processes and aligns with the UN Declaration of Human Rights and the UN Global Compact principles. The UN Guiding Principles on Business and Human Rights require companies to address three aspects to fulfil their responsibility to respect human rights: express a commitment to human rights through a policy statement; perform human rights due diligence to identify, prevent, mitigate and account for potential human rights impacts; and provide remediation where business enterprises have been identified as having caused or contributed to adverse human rights impacts. We meet these requirements by embedding them into our Company systems and processes.
BHP Billiton’s commitment to human rights is publicly stated in ourCode of Business Conduct (the Code), which clearly outlines our responsibilities and expectations. All employees and certain contractors are provided with the Code on commencement of employment with BHP Billiton, and it is a condition of that employment that they behave in accordance with the Code. Annual risk-basedCode of Business Conduct training and communication plans must be completed and executed by each area of the Group. In addition, we measure effectiveness and obtain assurance of our human rights processes through the internal audits of our GLDs.
As part of our human rights due diligence process, our operations are required to identify and document key potential human rights risks by completing a Human Rights Impact Assessment (HRIA). This includes assessing performance against the articles of the UN Universal Declaration of Human Rights, the UN Global Compact principles, and host country legislation governing human rights issues. We require each HRIA to be reviewed internally on an annual basis.
Every three years, each HRIA is required to be verified through an engagement process with stakeholders and, in medium- and high-risk jurisdictions, validated by a qualified human rights specialist. Where a HRIA identifies a material risk, a Human Rights Management Plan is required to be implemented and reviewed annually. Selected employees and contractors receive training on compliance with BHP Billiton’s human rights commitments.
Managing our security-related material risks
The nature and global reach of our organisation can result in our people working in countries where there is potential exposure to personal and business risks. We require an assessment of each country for the degree of risk associated with visiting, exploring and operating within it, and appropriate controls are developed to mitigate identified risks.
Through our commitment to the Voluntary Principles on Security and Human Rights (VPs), we seek to protect people and property from material security-related risks. Performance requirements related to the VPs are implemented through ourSecurity and Emergency Management GLD. Our operations are required to identify security-related material risks to people and property, and engage relevant stakeholders to develop and manage security programs that respect human rights and fundamental freedoms.
In addition, we require our operations to conduct an annual review for alignment with the VPs and implement an improvement plan to close identified gaps. The process also provides an opportunity to further build awareness and understanding of the VPs across the Company.
Respecting and including Indigenous communities
As many of our operations are located on or near Indigenous peoples’ lands, it is important we recognise the traditional rights and values of Indigenous peoples, respect their cultural heritage and the significance of their lands and provide opportunities for inclusion and advancement.
BHP Billiton’s approach to engaging with and supporting Indigenous peoples is articulated in our Indigenous Peoples Policy Statement, which was developed and approved by our GMC in FY2015. Implementation of the Policy Statement will help us strengthen relationships with Indigenous peoples and be a valued partner in their economic, social and cultural empowerment. We are currently in the process of developing a Group-wide Indigenous Peoples Strategy to guide implementation of the Policy Statement.
As a member of the ICMM, our Indigenous Peoples Policy Statement is consistent with the 2013 ICMM Indigenous Peoples and Mining Position Statement and is implemented in accordance with ourCommunity GLD.
Commitments through our Policy Statement include understanding Indigenous peoples’ rights and interests; building cross-cultural understanding; agreeing on appropriate engagement processes; and ensuring effective
participation in decision-making. A number of related commitments address how we engage where government is responsible for managing Indigenous peoples’ interests and how to move forward when differences of opinion arise.
Our Policy Statement specifically addresses the issue of free, prior and informed consent through committing to seek the consent of Indigenous peoples for new operations or major capital projects that are located on lands traditionally owned by, or under customary use of, Indigenous peoples and which are likely to have significant adverse impacts on Indigenous peoples.
In making this commitment, we recognise the right of governments to ultimately make decisions on the development of resources and that, in most countries, neither Indigenous peoples nor other groups have a right to veto projects. Where consent cannot be reached, a host government may decide to proceed with a project after balancing the rights and interests of Indigenous peoples with the wider population. In these circumstances, BHP Billiton will determine whether we remain involved with the project. The BHP Billiton Indigenous Peoples Policy Statement can be found in our Sustainability Report 2015.
Respecting customary rights
At a very early stage of a project, we seek to identify customary owners, occupiers and users of the land on which we intend to operate, as well as conduct land usage surveys. Knowing who is connected to the land and how it is used is critical to establishing effective community consultation and engagement. This helps to ensure people potentially affected by our operations are fully aware of our activities and have an opportunity to express their concerns and aspirations.
In instances where land may be used for customary purposes and no formal land title has been issued, information is requested from relevant organisations, including government authorities with responsibilities for customary land uses, and Indigenous peoples’ representative organisations, such as land and tribal councils. Further enquiries are also made directly with the people in the area to help identify those with connections to the land. Arising from this engagement, the operational work plan may be amended to reduce potential impacts on landowners and users.
Our projects are designed in a way that avoids or minimises resettlement of individuals or communities. If resettlement is required (voluntary or involuntary), programs must be implemented consistent with the requirements set out in the International Finance Corporation’s Performance Standard 5, Land Acquisition and Involuntary Resettlement. This includes being planned and implemented in a participatory manner that leads to a demonstrable improvement in livelihoods of the displaced persons or communities.
Ok Tedi
BHP Billiton exited from Ok Tedi Mining Limited (OTML) in February 2002. The exit arrangements included the transfer of BHP Billiton’s shares in OTML to Papua New Guinea Sustainable Development Program Limited (PNGSDP) and a statutory undertaking protecting BHP Billiton from environmental claims by the PNG Government. In September 2013, the PNG Parliament passed laws which compulsorily acquired PNGSDP’s shares in OTML and changed other aspects of the exit arrangements, including the repeal of the protection from environmental claims by the PNG Government. PNGSDP is challenging the validity of actions taken by the PNG Government to restructure and obtain control of PNGSDP. BHP Billiton retains an indemnity from PNGSDP in respect of environmental claims by the PNG Government and certain environmental claims by third parties. This indemnity is secured against certain key assets of PNGSDP. BHP Billiton remains committed to ensuring that the substantial long-term fund held by PNGSDP remains well governed for the benefit of the people of Papua New Guinea and the Western Province in particular.
Making a positive contribution to society
We know we are successful when our host communities value their relationship with us. Our aim is to work alongside host communities to help them achieve sustainable economic and social benefits, as well as diversified
and resilient local economies, so that these benefits continue beyond the life of our operations. Our broader contribution to local economies can be realised through indirect employment and our support of local businesses that provide a range of services and products, which enable our operations to function effectively.
Our operations around the world support local and national economies through creating jobs, providing infrastructure, purchasing goods and services and contributing significant payments of taxes and royalties to governments. By supplying many of our commodities to markets in developing countries, we also support economic development to help improve living standards and quality of life.
Improving the quality of life in our host communities
We aim to be partners with our host communities and are committed to understanding their needs and priorities. We seek to invest in projects that will continue to promote a benefit to the community beyond the life of the project. Using data from a social baseline study and social impact and opportunity assessment, we prepare a community development management plan. Community development projects and donations are required to be aligned to the overall community development management plan, implemented in consultation with local stakeholders, and meet our due diligence and anti-corruption requirements.
We voluntarily invest one per cent of our pre-tax profit, calculated on the average of the previous three years’ pre-tax profit, in community programs that aim to have a long-lasting, positive impact on people’s quality of life, including implementing new and supporting existing community projects. With a focus on improving quality of life, our community development programs are developed by working openly with governments and the communities in which we operate, and focusing on the needs and resources of our key stakeholders. This is how we are contributing to economic and social development.
During FY2015, our voluntary community investment totalled US$225 million, comprising US$142 million cash, in-kind support and administrative costs, and a US$83 million contribution to the BHP Billiton Foundation. The BHP Billiton Foundation was established in FY2013 to identify and support large sustainable development projects in countries and regions of interest to BHP Billiton, in order to complement the local programs managed by our assets. This builds on contributions that have previously been paid to the BHP Billiton Sustainable Communities charitable organisation. At the end of FY2015, BHP Billiton Sustainable Communities had a total of US$62.5 million and the BHP Billiton Foundation had a total of US$219.2 million in funds available for future sustainable development projects.
Community investment (US$M)
| | | | | | | | | | | | |
Year ended 30 June | | 2015 | | | 2014 | | | 2013 | |
Expenditure (1) (including in-kind support and administrative costs) | | | 142.0 | | | | 141.7 | | | | 139.8 | |
Contribution into BHP Billiton Sustainable Communities and BHP Billiton Foundation | | | 83.0 | | | | 100.0 | | | | 106.0 | |
| | | | | | | | | | | | |
Total Community investment | | | 225.0 | | | | 241.7 | | | | 245.8 | |
| | | | | | | | | | | | |
| (1) | Includes BHP Billiton’s equity share for both operated and non-operated joint venture operations. Includes payments made by operations demerged with South32. |
BHP Billiton Social Investment Framework
During FY2015, we developed a new BHP Billiton Social Investment Framework to guide our approach to voluntary social investment (social and environmental programs with net social benefit) between FY2016 and FY2020, providing a unified and integrated framework across our Company. The Framework is the outcome of an extensive review of BHP Billiton’s existing approach to social investment and has been informed by a thorough analysis of information about our internal and external operating context. Specific inputs to the review
included our material sustainability risks, emerging global trends and the stakeholder needs and expectations of our host communities. Using this information to inform our Social Investment Framework has ensured a strong linkage between our business and social investment objectives.
BHP Billiton is committed to ensuring our significant social investment adds value to the communities in which we operate and leaves behind a lasting change. Details of our new Social Investment Framework can be found in our Sustainability Report 2015.
1.15 Additional information
1.15.1 External factors and trends
The following section describes some of the external factors and trends that have had a material impact on our financial condition and results of operations. We operate our business in a dynamic and changing environment and with information that is rarely complete and exact. We primarily manage the risks discussed in this section under our portfolio risk management approach, which relies on the effects of diversification, rather than individual risk management programs. Details of our risk factors can be found in section 1.7.2 of this Annual Report. Details of our financial risk management strategies and financial instruments outstanding at 30 June 2015 can be found in section 1.7.3 of this Annual Report and in note 23 ‘Financial risk management’ to the Financial Statements.
Management monitors particular trends arising from external factors with a view to managing the potential impact on our future financial condition and results of operations. The following external factors could have a material adverse effect on our business and areas where we make decisions on the basis of information that is incomplete or uncertain.
Information in this section has been presented on a Continuing operations basis to exclude the contribution from assets that were demerged with South32, unless otherwise noted. Details of the contribution of the South32 assets to the Group’s results are disclosed in note 29 ‘Discontinued operations’ to the Financial Statements.
Commodity prices
The prices we obtain for our products represent a key driver of our business, and fluctuations in these commodity prices affect our results, including cash flows and asset values. The estimated impact on FY2015 profit after taxation of changes of commodity prices is set out below.
| | | | |
| | US$M | |
US$1/bbl on oil price | | | 54 | |
US¢10/MMBtu on US gas price | | | 27 | |
US¢1/lb on copper price | | | 24 | |
US$1/t on iron ore price | | | 144 | |
US$1/t on metallurgical coal price | | | 23 | |
US$1/t on energy coal price | | | 11 | |
US¢1/lb on nickel price | | | 2 | |
Commodity markets were influenced by modest growth in global economic activity in FY2015. Solid momentum in the US economy, supported by improved growth in the Eurozone and Japan, saw developed economies contribute an improved share of activity relative to emerging markets. A number of emerging economies, including China, saw growth slow while Russia and Brazil experienced recessions. In the case of most steelmaking raw materials and energy commodities, supply growth was greater than demand growth resulting in lower prices. The price for crude oil dropped significantly, while the Henry Hub gas price declined on higher supply and increased inventory levels relative to the previous year. The Asian LNG price dropped on greater
supply and lower oil prices. The copper price was also lower as supply disruptions were offset by weaker than expected consumption. Although aluminium demand grew, supply exceeded consumption due to increasing production from China. In the manganese market, the supply side response to weak demand growth was slower than expected resulting in a decrease in prices.
The following tables show the prices for our most significant commodities for the years ended 30 June 2015, 2014 and 2013, on both a Continuing and Discontinued operations basis. These prices represent selected quoted prices from the relevant sources as indicated, and will differ from the realised prices on the sale of the Group’s production due to differences in quotation periods, quality of products, delivery terms and the range of quoted prices that are used for contracting sales in different markets.
Continuing operations
| | | | | | | | | | | | | | | | | | | | | | | | |
Year ended 30 June | | 2015
Closing | | | 2014
Closing | | | 2013
Closing | | | 2015
Average | | | 2014
Average | | | 2013
Average | |
Natural gas Henry Hub (1) (US$/MMBtu) | | | 2.81 | | | | 4.39 | | | | 3.73 | | | | 3.32 | | | | 4.25 | | | | 3.44 | |
Natural gas Asian Spot LNG (2) (US$/MMBtu) | | | 7.30 | | | | 11.28 | | | | 15.40 | | | | 9.74 | | | | 16.38 | | | | 15.14 | |
Crude oil (Brent) (3) (US$/bbl) | | | 61.05 | | | | 111.02 | | | | 102.46 | | | | 73.91 | | | | 109.36 | | | | 108.64 | |
Ethane (4) (US$/bbl) | | | 8.40 | | | | 12.02 | | | | 9.92 | | | | 8.56 | | | | 11.92 | | | | 12.15 | |
Propane (5) (US$/bbl) | | | 16.25 | | | | 44.47 | | | | 35.52 | | | | 29.34 | | | | 48.05 | | | | 37.31 | |
Butane (6) (US$/bbl) | | | 23.89 | | | | 54.39 | | | | 49.51 | | | | 36.89 | | | | 56.70 | | | | 61.74 | |
Copper (LME cash) (US$/lb) | | | 2.60 | | | | 3.15 | | | | 3.06 | | | | 2.89 | | | | 3.18 | | | | 3.48 | |
Iron ore (7) (US$/dmt) | | | 59.50 | | | | 93.25 | | | | 116.25 | | | | 71.61 | | | | 122.70 | | | | 127.23 | |
Metallurgical coal (8) (US$/t) | | | 88.00 | | | | 110.50 | | | | 130.00 | | | | 102.91 | | | | 128.40 | | | | 159.13 | |
Energy coal (9) (US$/t) | | | 61.66 | | | | 70.89 | | | | 78.89 | | | | 64.37 | | | | 78.38 | | | | 89.10 | |
Nickel (LME cash) (US$/lb) | | | 5.30 | | | | 8.49 | | | | 6.21 | | | | 7.02 | | | | 6.88 | | | | 7.43 | |
| (1) | Platts Gas based on Henry Hub – typically applies to gas sales in the US gas market. |
| (2) | Platts Liquefied Natural Gas Delivery Ex-Ship (DES) Japan/Korea Marker – typically applies to Asian LNG spot sales. |
| (3) | Platts Dated Brent is a benchmark price assessment of the spot market value of physical cargoes of North Sea light sweet crude oil. |
| (4) | OPIS Mont Belvieu non-Tet Ethane – typically applies to ethane sales in the US Gulf Coast market. |
| (5) | OPIS Mont Belvieu non-Tet Propane – typically applies to propane sales in the US Gulf Coast market. |
| (6) | OPIS Mont Belvieu non-Tet Normal Butane – typically applies to butane sales in the US Gulf Coast market. |
| (7) | Platts 62 per cent Fe Cost and Freight (CFR) China – used for fines. |
| (8) | Platts Low-Vol hard coking coal Index FOB Australia – representative of high-quality hard coking coals. |
| (9) | GlobalCOAL FOB Newcastle 6,000kcal/kg NCV – typically applies to coal sales in the Asia Pacific market. |
The following summarises the average and closing pricing trends of our most significant commodities for FY2015.
Natural gas Henry Hub: The Platts US Henry Hub natural gas price decreased by 22 per cent during FY2015. The decrease was a result of increased production growth, partially offset by consumption growth in the power sector. Natural gas inventories ended the year at 2,577 Billion cubic feet (Bcf), one per cent above the five-year average and 35 per cent higher year-on-year. The year-end price was 15 per cent below the average for the year. Since 30 June 2015, the US Henry Hub natural gas price decreased five per cent on 31 August 2015.
Natural gas Asian Spot LNG: The Asian liquefied natural gas spot price decreased by 41 per cent during FY2015. The decrease was driven by weaker north Asian end-user demand and ample global supply availability. In turn, this allowed for more spot purchases on lower prices and provided some support for Asian buyers to maintain higher inventory levels. Meanwhile, the drop in crude oil prices has had a lagged negative impact on oil-linked LNG contracts in the second half of FY2015. The year-end price was 25 per cent below the average for the year.
Crude oil: The Platts Dated Brent crude price decreased by 32 per cent during FY2015 following increases in global crude supply, particularly from US production, growing faster than demand. Libyan supply outages returned to market in the latter half of CY2014, and OPEC decided to maintain its production levels. The year-end price was 17 per cent below the average for the year. Since 30 June 2015, the Dated Brent crude price decreased 21 per cent on 28 August 2015.
NGL: A barrel of natural gas liquids consists mainly of ethane and liquefied petroleum gas (propane and butane). The Mont Belvieu ethane and propane price decreased by 28 per cent and 39 per cent, respectively, during FY2015 following increases in ethane and propane supply. Mont Belvieu butane prices decreased by 35 per cent during FY2015 following a decrease in the West Texas Intermediate oil price. The year-end propane and butane prices were 45 per cent and 35 per cent below the average for the year, respectively. Since 30 June 2015, the Mont Belvieu ethane price decreased seven per cent and the Mont Belvieu propane price increased nine per cent on 31 August 2015.
Copper: The London Metal Exchange (LME) copper cash settlement price decreased by nine per cent in FY2015. The copper price trended downwards during the first seven months amid improved supply, weaker than anticipated consumption and the strengthening of the US dollar. The price decreased to a five-year low in mid-January on short-selling by Chinese-backed hedge funds. The price increased in February, impacted by Chilean supply disruption due to flooding, while softening of Chinese demand dampened prices since May. Since 30 June 2015, the copper price decreased 11 per cent on 28 August 2015.
Iron ore: The Platts 62 per cent iron ore CFR China decreased 42 per cent over FY2015 as low-cost seaborne iron ore supply outpaced demand growth. Productivity and cost compression on the supply side also impacted price as mining companies lowered their cost structures in response to the changed environment. The year-end price was 17 per cent below the average price for the year. Since 30 June 2015, the iron ore CFR price decreased six per cent on 31 August 2015.
Metallurgical coal: The Platts Low-Vol Hard Coking Coal Index decreased by 20 per cent during FY2015. While demand from traditional markets recovered steadily, the price decrease was mainly driven by continuing supply growth and weak Chinese demand. The year-end price was 15 per cent below the average price for the year. Since 30 June 2015, the Hard Coking Coal Index decreased eight per cent on 31 August 2015.
Energy coal: The globalCOAL Newcastle FOB price decreased by 18 per cent during FY2015. The decrease was driven by weak Chinese seaborne demand, despite healthy growth from India, and sustained supply from Australia and Indonesia supported by depreciating currencies. Since 30 June 2015, the Newcastle energy coal price decreased seven per cent on 31 August 2015.
Nickel: The LME cash settlement nickel price increased two per cent during FY2015 though the price decreased over the course of the financial year driven by weak demand and adequate supply, as evidenced by rising LME stocks. The year-end price was 25 per cent below the average price for the year. Since 30 June 2015, the nickel price decreased 14 per cent on 28 August 2015.
Discontinued operations
| | | | | | | | | | | | | | | | | | | | | | | | |
Year ended 30 June (1) | | 2015
Closing | | | 2014
Closing | | | 2013
Closing | | | 2015
Average | | | 2014
Average | | | 2013
Average | |
Aluminium (LME cash) (US$/t) | | | 1,647 | | | | 1,851 | | | | 1,731 | | | | 1,880 | | | | 1,764 | | | | 1,938 | |
Alumina (2) (US$/t) | | | 323 | | | | 312 | | | | 318 | | | | 339 | | | | 321 | | | | 327 | |
Manganese Alloys (3) (US$/t) | | | 821 | | | | 999 | | | | 1,038 | | | | 879 | | | | 1,020 | | | | 1,106 | |
Manganese Ores (4) (US$/dmtu) | | | 2.98 | | | | 4.20 | | | | 5.54 | | | | 3.89 | | | | 4.95 | | | | 5.29 | |
| (1) | Post-demerger BHP Billiton’s results will not be impacted by fluctuations in the prices of commodities (aluminium, alumina, manganese alloys and ores) that no longer form part of post-demerger operations. Refer to section 1.6.4 for more details. |
| (2) | Platts PAX Free on Board (FOB) Australia – market price assessment of calcined metallurgical/smelter grade alumina. |
| (3) | Bulk FerroAlloy high carbon ferromanganese (HCFeMn) Western Europe DDP. |
| (4) | Metal Bulletin manganese ore 44 per cent Mn Cost Insurance Freight (CIF). |
The FY2015 pricing trends for the commodities that comprise our Discontinued operations were as follows:
Aluminium: The LME cash settlement price increased by seven per cent during FY2015. However, price premiums in Japan, Europe and the United States ended lower, reflecting the market surplus on increasing production from China. The year-end price was 12 per cent below the average for the year.
Alumina: The FOB Australia price increased six per cent during FY2015, supported by a lack of bauxite availability as a result of the Indonesian ore ban, and growing demand from China.
Manganese: The Metal Bulletin manganese ore China CIF price decreased 21 per cent during FY2015. Demand growth slowed and the market was well supplied amid high Chinese inventories. The year-end price was 23 per cent below the average price for the year. The Western Europe spot high carbon ferromanganese price decreased 14 per cent during FY2015, driven by persistent oversupply and the currency depreciation of major producers in India, Australia, South Africa and Europe.
Exchange rates
We remain exposed to exchange rate transaction risk on foreign currency sales and purchases, as we believe active currency hedging does not provide long-term benefits to our shareholders. Operating costs and costs of locally sourced equipment are influenced by fluctuations in local currencies, primarily the Australian dollar and Chilean peso. Foreign exchange gains and losses reflected in operating costs owing to fluctuations in the local currencies relative to the US dollar may potentially offset one another. The majority of our sales are denominated in US dollars and we borrow and hold surplus cash predominately in US dollars; those transactions and balances provide no foreign exchange exposure relative to the US dollar functional currency of the Group.
The US dollar strengthened against our main local currencies during FY2015, resulting in stronger average US dollar rates versus the Australian dollar and Chilean peso. Average and closing exchange rates for current and prior periods are contained within note 42 ‘Functional and presentation currency’ to the Financial Statements.
We are also exposed to exchange rate translation risk in relation to net monetary liabilities, being our foreign currency denominated monetary assets and liabilities, including certain debt and other long-term liabilities. Details of our exposure to foreign currency fluctuations are contained within note 23 ‘Financial risk management’ to the Financial Statements.
Changes in product demand and supply
The global economy grew at a modest rate in FY2015 with a mild improvement in developed economies offsetting a moderation in emerging markets.
In China, a slowdown in the property sector and fixed asset investment led to lower economic growth following policy tightening in CY2014. Consumer spending remained resilient reflecting the continued rebalancing of the economy. A number of interest rate reductions, cuts in bank reserve requirements, boosts to infrastructure spending and administrative measures supporting the property market are likely to buttress growth over the remainder of CY2015. In line with our expectations, the economy is growing more slowly, though off a higher base, as it matures over the medium term and the government’s reform program promotes domestic consumption over investment. We expect near-term volatility to continue as the authorities press ahead with reform in a cautious but sustained manner as they seek to improve the efficiency of capital allocation in the economy while maintaining support for employment. However, our robust longer-term outlook for China remains intact as the economy transitions.
The US economy continued to improve despite weakness in the March 2015 quarter caused by severe weather in the northeast and a stronger US dollar. Ongoing strength in the labour market, rising disposable incomes, higher equity markets and improved housing prices supported consumer demand. After a period in which businesses failed to respond to improved economic conditions and higher levels of profitability, corporate investment has begun to show signs of recovery. The Federal Reserve is expected to begin increasing interest rates in the first half of FY2016.
The European Central Bank began a program of quantitative easing in March 2015, which appears to be driving a modest pick-up in economic growth. Activity has improved across the Eurozone, with the exception of Greece, reflecting a broad-based lift in domestic demand and we expect the improvement in growth to continue in FY2016.
Japan’s economy saw growth improve in annualised terms as the year progressed, supported by the Bank of Japan’s quantitative easing and a weaker yen. Growth should be supported by stronger business investment into FY2016. A longer-term, sustainable recovery is contingent on the scale and speed of structural reform.
Commodity prices generally trended downwards in FY2015, with prices for most of our commodities notably lower going into the new financial year.
Chinese steel production declined by 1.3 per cent in the second half of FY2015 versus the corresponding period in FY2014, triggered largely by a slowing construction sector. New construction starts were lower this year due to considerable levels of existing stock. Although China’s steel exports are at an all-time high, we expect subdued crude steel production growth over the remainder of CY2015 with some upside potential should the construction sector recover. However, with steel stock per capita still well below that of developed nations, we expect moderate but sustainable growth in Chinese steel production over the next decade. An extended view on the life cycle of steel usage has resulted in a lower but longer plateau for crude steel production, peaking between 935 Mt and 985 Mt in the middle of the next decade. The implications for pig iron demand, and therefore iron ore and metallurgical coal, are mitigated in the medium term by lower scrap availability as the scrap cycle in China will take longer to develop. Outside China, steel production growth is improving steadily driven by India, the Middle East and South-East Asia.
The supply of most steelmaking raw materials has grown faster than demand. In iron ore, we estimate that approximately 100 Mt of incremental lower cost seaborne supply will enter the market in CY2015, outweighing demand growth. In this context, higher cost Chinese domestic production, along with high-cost seaborne exports, continues to exit the market. Private mines in China have seen their operating rates fall from approximately 90 per cent in CY2011 to approximately 35 per cent today. Many producers have also cut their costs. As a result, the iron ore cost curve has both flattened and fallen from previous levels.
In metallurgical coal, while uneconomic high-cost supply has slowly withdrawn from the seaborne market, prices remain subdued as industry-wide cost reductions and weaker producer currencies against the US dollar support continued production from marginal suppliers. Recent quality restrictions have also weakened China’s import demand but this was partially offset by growth in traditional markets. The long-term outlook remains robust as the supply of premium hard coking coals becomes scarce.
Depreciating currencies have sustained Indonesian and Australian thermal coal exports, prolonging the weak pricing environment. Despite healthy seaborne demand growth from India, China’s import demand has weakened, limiting prospects for price recovery in the near term.
In copper, prices were affected by weaker than expected consumption and the strengthening US dollar. In the near term, new supply under development is expected to keep the market well supplied. However, a deficit is expected to emerge at the end of this decade as grade decline, rising costs and a scarcity of high-quality future development opportunities are likely to constrain the industry’s ability to meet attractive demand growth.
Global crude oil demand growth was outpaced by supply growth putting pressure on prices throughout the year. Despite strong demand growth, liquids supply exceeded demand by 2.6 MMboe/d in the second half of FY2015. We expect prices to remain range bound in the short term due to available supply capacity from the United States and OPEC. The long-term demand outlook remains healthy, underpinned by the transport sector, notably in the Asian region.
US natural gas prices declined during the year as production growth was only partially offset by increased consumption in the power sector. In the longer term, demand is expected to benefit from increasing industrial use, growth in gas-fired power generation and the start of LNG exports. As core acreage is depleted, less productive and higher cost shale areas will be required to meet growing demand. In the LNG market, weaker North Asian end-user demand and ample supply have kept prices subdued.
We expect modest growth of the global economy. In the longer term, urbanisation and industrialisation will remain the primary drivers of commodity demand. The transition to consumption-led growth in emerging economies should provide particular support for industrial metals, energy and fertilisers.
Capital expenditure
Capital expenditure is important in pursuing our strategy through the development of large-scale resource projects and in sustaining our existing operations. Capital expenditure is disclosed for each Business in section 1.6.3 of this Annual Report.
Operating costs
Information in this section has been presented on a Continuing operations basis to exclude the contribution from assets that were demerged with South32, unless otherwise noted. Details of the contribution of the South32 assets to the Group’s results are disclosed in note 29 ‘Discontinued operations’ to the Financial Statements.
As the prices for our products are determined by the global commodity markets in which we operate, we do not generally have the ability to offset cost pressures through corresponding price increases; therefore, controlling our operating costs is a key driver of our results. Operating costs for the last three years are set out in section 1.11.1 as well as an analysis of the change in Total expenses. Further analysis of the factors that impacted expenses during FY2015 is set out below and in section 1.15.3.
In discussing the factors that affected Total expenses, we refer to the change in operating cash costs and change in exploration and business development. Collectively we refer to these as change in controllable cash costs. Operating cash costs by definition do not include non-cash costs being depreciation, amortisation, impairments,
movements in deferred stripping balances and movements in provisions. The change in operating cash costs also excludes the impact of exchange rates and inflation on the actual costs incurred in the corresponding period, changes in fuel and energy costs, changes in exploration and business development costs and one-off items. These items are excluded so as to provide a consistent measurement of changes in costs across all the Businesses based on the factors that are within their control and responsibility.
Change in operating cash costs and change in controllable cash costs are not measures that are recognised under International Financial Reporting Standards (IFRS) and they may differ from similarly titled measures reported by other companies. A reconciliation of the movements in Underlying EBIT to the financial statement line items in the Consolidated Income Statement is included in section 2.5 of this Annual Report.
Our focus on reducing operating costs through productivity initiatives saw a decrease in operating cash costs of US$2.7 billion and a reduction in exploration and business development of US$29 million for a combined reduction in controllable cash costs of US$2.7 billion. In addition, the improvement in operating costs was complemented by favourable exchange rate impacts of US$1.7 billion. These improvements were partially offset by inflation of US$433 million and an increase in the production costs associated with higher volumes of US$3.2 billion. With higher depreciation and amortisation charges of US$1.4 billion and higher impairment charges of US$350 million. Total expenses excluding exceptional items of US$3.2 billion decreased from US$36.5 billion to US$33.8 billion.
Exploration and development of resources
Minerals exploration
Over the past six years, brownfield exploration has increased our reserve base around our portfolio of existing assets in large resource basins, which now provide us with growth opportunities. This has allowed us to reduce brownfield exploration expenditure and rationalise our greenfield exploration program.
Greenfield minerals (new sites) exploration is focused on advancing targets within Chile, Peru, southwestern United States and is organised through our Copper Business. Greenfield activities include opportunity identification, application for and acquisition of mineral title, early reconnaissance operations and multi-million dollar delineation drilling programs.
In addition to our activities focused on finding new world-class deposits, several of our Businesses undertake brownfield exploration, principally aimed at delineating and categorising mineral deposits near existing operations, and advancing projects through the development pipeline.
Our expenditure on minerals exploration over the last three financial years is set out below.
| | | | | | | | | | | | |
Year ended 30 June | | 2015 | | | 2014 | | | 2013 | |
| | US$M | | | US$M
Restated | | | US$M
Restated | |
Greenfield exploration | | | 55 | | | | 46 | | | | 179 | |
Brownfield exploration | | | 194 | | | | 340 | | | | 467 | |
| | | | | | | | | | | | |
Total minerals exploration (1) | | | 249 | | | | 386 | | | | 646 | |
| | | | | | | | | | | | |
| (1) | Excludes minerals exploration from Discontinued operations. |
The Group’s minerals exploration expenditure declined by 36 per cent in FY2015 to US$249 million as we sharpened our focus on advancing copper targets within Chile, Peru and southwestern United States.
Petroleum exploration
We have reduced exploration expenditure in Petroleum over recent years with a focus on high-impact liquids opportunities in the Gulf of Mexico, Western Australia and Trinidad and Tobago.
| | | | | | | | | | | | |
Year ended 30 June | | 2015
US$M | | | 2014
US$M | | | 2013
US$M | |
| | | |
Petroleum exploration | | | 567 | | | | 600 | | | | 675 | |
Exploration expense
Exploration expense represents that portion of exploration expenditure that is not capitalised in accordance with our accounting policies, as set out in note 43 ‘Significant accounting policies’ to the Financial Statements.
Exploration expense for each Business over the three-year period is set out below.
| | | | | | | | | | | | |
Year ended 30 June | | 2015
US$M | | | 2014
US$M
Restated | | | 2013
US$M
Restated | |
| | | |
Exploration expense (1) (2) | | | | | | | | | | | | |
Petroleum and Potash | | | 532 | | | | 544 | | | | 709 | |
Copper | | | 90 | | | | 111 | | | | 266 | |
Iron Ore | | | 38 | | | | 56 | | | | 74 | |
Coal | | | 20 | | | | 29 | | | | 32 | |
Group and unallocated items | | | 18 | | | | 30 | | | | 47 | |
| | | | | | | | | | | | |
BHP Billiton Group | | | 698 | | | | 770 | | | | 1,128 | |
| | | | | | | | | | | | |
| (1) | Excludes exploration expenses from Discontinued operations. |
| (2) | Includes US$28 million (2014: US$72 million; 2013: US$102 million) exploration expense previously capitalised, written off as impaired. |
Following our focus on productivity and reducing costs, the reduction in the Group’s exploration expense, excluding impairment of exploration expenditure previously capitalised, increased Underlying EBIT in FY2015 by US$28 million.
Interest rates
We are exposed to interest rate risk on our outstanding borrowings and investments. Our policy on interest rate exposure is to pay or receive on a US dollar floating interest rate basis. To achieve this policy, we often use derivative financial instruments, including cross currency and interest rate swaps, to convert an underlying exposure to a US dollar floating rate exposure. Deviation from our policy requires approval from our Financial Risk Management Committee and is managed within our portfolio risk management approach.
Our earnings are sensitive to changes in interest rates on the floating component of the Group’s net borrowings. Our main exposure is to the 3 month US LIBOR benchmark, which increased by 0.010 per cent in FY2015 to an average of 0.252 per cent. Further information, including the Group’s sensitivity to movements in interest rates, can be found in note 23 ‘Financial risk management’ to the Financial Statements.
Health, safety, environment and community
We operate in an industry where many of our activities are highly regulated by laws governing health, safety and the environment. We are committed to compliance with the laws and regulations of the countries in which we
operate and, where applicable, to exceeding legal and other requirements which are less stringent than our own. However, regulatory standards and community expectations are constantly evolving. As a result, we may be exposed to increased litigation, compliance costs and unforeseen environmental rehabilitation expenses, despite our best efforts to work with governments, community groups and scientists to keep pace with regulations, law and public expectations.
Further information about our compliance with HSEC regulations can be found in section 1.14 of this Annual Report.
Insurance
During FY2015, we maintained an insurance program encompassing property damage, business interruption, sabotage and terrorism, marine cargo, construction, directors’ and officers’ liability and public and certain other liabilities. The program includes a combination of self-insurance via subsidiary captive insurance companies, industry mutuals and external market insurance and reinsurance. Mandates are established as to risk retention levels, policy cover and, where applicable, insurance and reinsurance counterparty security. As part of our portfolio risk management approach, we regularly conduct an assessment of maximum foreseeable loss potential, cash flow at risk, loss experience, claims received and insurance premiums paid, and will make adjustments to the balance of self-insurance and external insurance and reinsurance as required.
The Group is largely self-insured for losses arising from property damage and business interruption, sabotage and terrorism, marine cargo, construction, primary public liability and employee benefits. For these risks, we internally insure our Businesses (for wholly owned assets and, where permissible, by local insurance regulation and/or commercial market terms our share of joint venture assets) via our captive insurance companies. Any losses incurred will consequently impact the Financial Statements as they arise.
1.15.2 Application of critical accounting policies
The preparation of the Consolidated Financial Statements requires management to make judgements and estimates and form assumptions that affect the amounts of assets, liabilities, contingent liabilities, revenues and expenses reported in the Financial Statements. On an ongoing basis, management evaluates its judgements and estimates in relation to assets, liabilities, contingent liabilities, revenue and expenses. Management bases its judgements and estimates on historical experience and on other factors it believes to be reasonable under the circumstances, the results of which form the basis of the reported amounts that are not readily apparent from other sources. Actual results may differ from these estimates under different assumptions and conditions.
The Group has identified the following critical accounting policies under which significant judgements, estimates and assumptions are made and where actual results may differ from these estimates under different assumptions and conditions and may materially affect financial results or the financial position reported in future periods:
reserve estimates;
exploration and evaluation expenditure;
development expenditure;
taxation;
property, plant and equipment and intangible assets – recoverable amount; and
provision for closure and rehabilitation.
In accordance with IFRS, we are required to include information regarding the nature of the estimates and judgements and potential impacts on our financial results or financial position in the Financial Statements. This information can be found in note 44 ‘Application of accounting estimates, assumptions and judgements’ to the Financial Statements.
1.15.3 Operating results
The following table describes the approximate impact of the principal factors that affected Underlying EBIT for FY2015 and FY2014. Underlying EBIT is earnings before net finance costs, taxation, Discontinued operations and any exceptional items.
| | | | | | | | |
Year ended 30 June | | 2015
US$M | | | 2014
US$M
Restated | |
| | |
Underlying EBIT | | | 22,098 | | | | 21,680 | |
Net price impact: | | | | | | | | |
Change in sales prices | | | (16,433 | ) | | | (2,639 | ) |
Price-linked costs | | | 1,209 | | | | (111 | ) |
| | | | | | | | |
| | | (15,224 | ) | | | (2,750 | ) |
| | | | | | | | |
Change in volumes: | | | | | | | | |
Productivity | | | 1,220 | | | | 1,029 | |
Growth | | | 1,822 | | | | 1,929 | |
| | | | | | | | |
| | | 3,042 | | | | 2,958 | |
| | | | | | | | |
Change in controllable cash costs: | | | | | | | | |
Operating cash costs | | | 2,678 | | | | 1,131 | |
Exploration and business development | | | 29 | | | | 398 | |
| | | | | | | | |
| | | 2,707 | | | | 1,529 | |
| | | | | | | | |
Change in other costs: | | | | | | | | |
Exchange rates | | | 1,567 | | | | 1,188 | |
Inflation on costs | | | (433 | ) | | | (575 | ) |
Fuel and energy | | | 518 | | | | (3 | ) |
Non-cash | | | (1,304 | ) | | | (1,737 | ) |
One-off items | | | (456 | ) | | | – | |
| | | | | | | | |
| | | (108 | ) | | | (1,127 | ) |
| | | | | | | | |
Asset sales | | | (72 | ) | | | 61 | |
Ceased and sold operations | | | 22 | | | | (349 | ) |
Share of operating profit from equity accounted investments | | | (637 | ) | | | 43 | |
Other | | | 38 | | | | 53 | |
| | | | | | | | |
Underlying EBIT | | | 11,866 | | | | 22,098 | |
| | | | | | | | |
The method of calculation of the factors that affected Underlying EBIT and the Financial Statement line items of Revenue, Other income and Expenses (excluding net finance costs) that are affected by the factors are as follows.
| | | | |
Factor affecting
Underlying EBIT | | Method of calculation | | Financial statement line item affected |
Change in sales prices | | Change in average realised price for each operation from the corresponding period to the current period, multiplied by current period volumes. | | Revenue |
| | |
Price-linked costs | | Change in price-linked costs for each operation from the corresponding period to the current period, multiplied by current period volumes. | | Expenses |
| | |
Volumes – Productivity | | Change in volumes for each operation not included in the Growth category from the corresponding period to the current period, multiplied by the prior year Underlying EBIT margin. | | Revenue and Expenses |
| | |
Volumes – Growth | | Volume – Growth comprises Underlying EBIT for operations that are new or acquired in the current period minus Underlying EBIT for operations that are new or acquired in the corresponding period, change in volumes for operations identified as a Growth project from the corresponding period to the current period multiplied by the prior year Underlying EBIT margin, and change in volume for Petroleum Business from the corresponding period to the current period multiplied by the prior year Underlying EBIT margin. | | Revenue and Expenses |
| | |
Operating cash costs | | Change in total costs, other than price-linked costs, exchange rates, inflation on costs, fuel and energy costs, non-cash costs and one-off items as defined below for each operation from the corresponding period to the current period. | | Expenses |
| | |
| Exploration and business development | | Exploration and business development expense in the current period minus exploration and business development expense in the corresponding period. | | Expenses |
| | |
Exchange rates | | Change in exchange rate multiplied by current period local currency revenue and expenses. The majority of the Group’s selling prices are denominated in US dollars and so there is little impact of exchange rate changes on Revenue. | | Revenue and Expenses |
| | |
Inflation on costs | | Change in inflation rate applied to expenses, other than depreciation and amortisation, price-linked costs, exploration and business development expenses, expenses in ceased and sold operations and expenses in new and acquired operations. | | Expenses |
| | |
Fuel and energy | | Fuel and energy expense in the current period minus fuel and energy expense in the corresponding period. | | Expenses |
| | |
Non-cash | | Includes non-cash items, mainly depreciation, amortisation and impairments. | | Expenses |
| | |
One-off items | | Change in costs exceeding a pre-determined threshold associated with an unexpected event that had not occurred in the last two years and is not reasonably likely to occur within the next two years. | | Expenses |
| | | | |
Factor affecting
Underlying EBIT | | Method of calculation | | Financial statement line item affected |
Asset sales | | Profit/loss on the sale of assets or operations in the current period minus profit/loss on sale in the corresponding period. | | Other income |
| | |
| Ceased and sold operations | | Underlying EBIT for operations that are ceased or sold operations in the current period minus Underlying EBIT for operations that are ceased or sold in the corresponding period. | | Revenue, Other income and Expenses |
| | |
| Share of operating profit from equity accounted investments | | Share of operating profit from equity accounted investments for the period minus Share of operating profit from equity accounted investments in the corresponding period. | | Share of operating profit from equity accounted investments |
| | |
Other | | Variances not explained by the above factors. | | Revenue, Other income and Expenses |
A reconciliation of the movements in Underlying EBIT for FY2015 to the Financial Statement line items in the Consolidated Income Statement is included in section 2.5 of this Annual Report.
The following commentary describes the principal factors outlined in the table above for FY2015 and FY2014.
Prices
Lower realised prices reduced Underlying EBIT by US$16.4 billion in FY2015. A 41 per cent decline in the average realised price of iron ore was the major contributor and reduced Underlying EBIT by US$9.5 billion. Weaker average realised prices for our Petroleum, Copper and Coal Businesses decreased Underlying EBIT by US$4.2 billion, US$1.6 billion and US$1.1 billion, respectively. A reduction in price-linked costs increased Underlying EBIT by US$1.2 billion and primarily reflected lower royalty charges in our Iron Ore Business.
Volumes
Productivity-led volume efficiencies and the ramp up of major projects underpinned a US$3.0 billion increase in Underlying EBIT. Western Australia Iron Ore (WAIO) was the major contributor as the improved performance of our integrated supply chain and the ramp-up of the Jimblebar mining hub supported a US$1.9 billion increase in Underlying EBIT. A doubling of liquids production from both Black Hawk and Permian supported a further US$799 million volume-related increase in Petroleum’s Underlying EBIT.
Controllable cash costs
Operating cash costs
Our focus on best-in-class performance underpinned a US$2.7 billion reduction in operating cash costs during FY2015.
A reduction in labour, contractor and maintenance costs increased Underlying EBIT by US$1.5 billion during the period. This was most evident in WAIO where the standardisation of our equipment and maintenance systems, and the insourcing of third party services facilitated a step change in the performance of our mining operations. Mining-related efficiencies contributed to a further US$580 million reduction in cash costs and largely reflected improved productivity at Escondida.
Exploration and business development
The Group’s exploration and business development expenditure was broadly in line with FY2014. Our exploration program remains focused on greenfield copper targets within Chile, Peru and the southwestern United States, and petroleum liquids opportunities in the Gulf of Mexico, Western Australia and Trinidad and Tobago.
Other costs
Exchange rates
A stronger US dollar increased Underlying EBIT by US$1.6 billion during the period. This included the restatement of monetary items in the balance sheet, which increased Underlying EBIT by US$637 million relative to FY2014. Further information can be found in note 42 ‘Functional and presentation currency’ to the Financial Statements.
Inflation on costs
The impact of inflation reduced Underlying EBIT by US$433 million during the period. This was most notable in Australia and Chile, which accounted for over 85 per cent of the total variance.
Fuel and energy
A reduction in diesel prices across our minerals businesses supported a US$518 million increase in Underlying EBIT.
Non-cash
An increase in non-cash charges reduced Underlying EBIT by US$1.3 billion during the period.
A US$839 million increase in non-cash charges in our Copper Business reflects: higher ore mined which resulted in increased depletion of stripping capitalised at Escondida; increased depreciation following the completion of the Escondida Oxide Leach Area Project; and a US$199 million impairment driven by a lower copper price and permitting uncertainty for the proposed mine life extension at Cerro Colorado.
A US$639 million increase in non-cash charges in our Petroleum Business reflects: US$316 million of higher depreciation and amortisation charges in Onshore US following the ramp-up of liquids production at Black Hawk and the progressive development of our Permian acreage; and US$328 million of impairment charges associated with the divestment of assets in north Louisiana and the Pecos field in the Permian. During the period, a US$79 million impairment of Neptune was also recognised as the fall in near-term oil prices has affected its value due to its short field life.
The decrease in non-cash charges relates to mine site rehabilitation provision charges recognised in FY2014 for the Group’s North American closed mines.
One-off items
One-off items recognised during the period comprise a US$268 million expense related to the mill outage at Olympic Dam and US$188 million costs associated with the implementation of the Escondida Voluntary Redundancy Program.
Asset sales
The contribution of asset sales to Underlying EBIT decreased by US$72 million from FY2014, which included the sale of Liverpool Bay.
Ceased and sold operations
Underlying EBIT from ceased and sold operations increased by US$22 million in FY2015. This largely reflected an unfavourable US$143 million adjustment to the Browse divestment proceeds, due to unitisation changes subsequent to the completion of the sale, offset by the closure of the Nickel West Leinster Perseverance underground mine, both during FY2014.
Share of operating profit from equity accounted investments
Lower average realised prices received by our equity accounted investments decreased Underlying EBIT US$637 million.
Net finance costs
Net finance costs decreased by US$300 million to US$614 million. The decrease reflected foreign exchange gains on finance leases and the early redemption of the Petrohawk Energy Corporation Senior Notes in August 2014, which resulted in a gain on redemption and lower interest expense.
Taxation expense
The Group’s adjusted effective tax rate, which excludes the influence of exchange rate movements, remeasurement of deferred tax assets associated with the Minerals Resource Rent Tax (MRRT) and exceptional items, was 31.8 per cent (30 June 2014: 32.2 per cent).
Total taxation expense, including royalty-related taxation, exceptional items and exchange rate movements, was US$3.7 billion, representing a statutory effective tax rate of 45.5 per cent (30 June 2014: 31.2 per cent).
Government imposed royalty arrangements calculated by reference to profits are reported as royalty-related taxation. An exceptional item of US$698 million tax expense (2014: US$ nil) was recognised on a Continuing operations basis for the derecognition of deferred tax assets upon the repeal of the MRRT legislation in Australia.
Adjusted effective tax rate is not an IFRS measure and is reconciled to the Statutory effective tax rate below:
| | | | | | | | | | | | | | | | |
| | | 2015 | | | 2014 | |
| | | | | | Restated | |
Year ended 30 June | | Profit
before tax | | Income tax
expense | | % | | | Profit
before tax | | Income tax
expense | | % | |
| | | US$M | | US$M | | | | | US$M | | US$M | | | |
Statutory effective tax rate | | 8,056 | | (3,666) | | | 45.5 | % | | 21,735 | | (6,780) | | | 31.2 | % |
Less: | | | | | | | | | | | | | | | | |
Exchange rate movements | | – | | 339 | | | | | | – | | (34) | | | | |
Remeasurement of deferred tax assets associated with the MRRT | | – | | – | | | | | | – | | (170) | | | | |
Exceptional items | | 3,196 | | (250) | | | | | | (551) | | 166 | | | | |
| | | | | | | | | | | | | | | | |
Adjusted effective tax rate | | 11,252 | | (3,577) | | | 31.8 | % | | 21,184 | | (6,818) | | | 32.2 | % |
| | | | | | | | | | | | | | | | |
Other royalty and excise arrangements that are not profit based are recognised as operating costs within Profit before taxation. These amounted to US$1.7 billion during the period (30 June 2014: US$2.4 billion).
Exceptional items
| | | | | | | | | | | | |
Year ended 30 June 2015 | | Gross | | | Tax | | | Net | |
| | | US$M | | | US$M | | | US$M | |
Exceptional items by category | | | | | | | | | | | | |
Impairment of Onshore US assets | | | (2,787 | ) | | | 829 | | | | (1,958 | ) |
Impairment of Nickel West assets | | | (409 | ) | | | 119 | | | | (290 | ) |
Repeal of Minerals Resource Rent Tax legislation(1) | | | – | | | | (698 | ) | | | (698 | ) |
| | | | | | | | | | | | |
| | | (3,196 | ) | | | 250 | | | | (2,946 | ) |
| | | | | | | | | | | | |
| (1) | Includes amounts attributable to non-controlling interests of US$(12) million. |
The Group recognised an impairment charge of US$2.0 billion (after tax benefit) in relation to its Onshore US assets. The gas-focused Hawkville field accounts for the substantial majority of this charge reflecting its geological complexity, product mix, acreage relinquishments and amended development plans. The remainder relates to the impairment of goodwill associated with the Petrohawk acquisition.
On 12 November 2014, the Group announced that the review of its Nickel West business was complete and the preferred option, the sale of the business, was not achieved on an acceptable basis. As a result of operational decisions made subsequent to the conclusion of this process, an impairment charge of US$290 million (after tax benefit) was recognised in FY2015.
The legislation to repeal the MRRT in Australia took effect on 30 September 2014. As a result, the Group derecognised a MRRT deferred tax asset of US$809 million, and corresponding taxation charges of US$698 million related to Continuing operations and US$111 million related to Discontinued operations were recognised in FY2015.
Refer to note 2 ‘Exceptional items’ to the Financial Statements for more information.
| | | | | | | | | | | | |
Year ended 30 June 2014 | | Gross | | | Tax | | | Net | |
| | | US$M | | | US$M | | | US$M | |
Exceptional items by category | | | | | | | | | | | | |
Sale of Pinto Valley | | | 551 | | | | (166 | ) | | | 385 | |
| | | | | | | | | | | | |
| | | 551 | | | | (166 | ) | | | 385 | |
| | | | | | | | | | | | |
On 11 October 2013, the Group announced it had completed the sale of its Pinto Valley mining operation for cash consideration of US$653 million, after working capital adjustments. A gain on sale of US$385 million (after tax expense) was recognised in FY2014.
Refer to note 2 ‘Exceptional items’ to the Financial Statements for more information. An analysis of exceptional items for FY2013 are included in section 2.5.5 of this Annual Report.
Discontinued operations
On 25 May 2015, the Group announced that it completed the demerger of a selection of its aluminium, coal, manganese, nickel and silver-lead-zinc assets to create an independent metals and mining company, South32.
South32’s contribution to BHP Billiton’s FY2015 results comprised a US$753 million profit after taxation excluding exceptional items. Exceptional items comprised a tax expense of US$111 million related to the repeal of the MRRT and a net loss on demerger of US$2.2 billion (after tax benefit). This contribution has been included in Attributable loss after taxation from Discontinued operations of US$1.6 billion.
Third party sales
We differentiate sales of our production from sales of third party products due to the significant difference in profit margin earned on these sales. The table below shows the breakdown between our production and third party products.
| | | | | | | | | | | | |
Year ended 30 June (1) | | 2015
US$M | | | 2014
US$M
Restated | | | 2013
US$M
Restated | |
| | | |
Group production | | | | | | | | | | | | |
Revenue | | | 43,457 | | | | 55,045 | | | | 52,637 | |
Related operating costs | | | (31,605 | ) | | | (32,962 | ) | | | (31,021 | ) |
| | | | | | | | | | | | |
Underlying EBIT | | | 11,852 | | | | 22,083 | | | | 21,616 | |
Underlying EBIT Margin | | | 27.3 | % | | | 40.1 | % | | | 41.1 | % |
| | | | | | | | | | | | |
Third party products | | | | | | | | | | | | |
Revenue | | | 1,179 | | | | 1,717 | | | | 1,223 | |
Related operating costs | | | (1,165 | ) | | | (1,702 | ) | | | (1,159 | ) |
| | | | | | | | | | | | |
Operating profit | | | 14 | | | | 15 | | | | 64 | |
Margin on third party products (2) | | | 1.2 | % | | | 0.9 | % | | | 5.2 | % |
| | | | | | | | | | | | |
| (1) | Excluding exceptional items and Discontinued operations. |
| (2) | Operating profit divided by revenue. |
We engage in third party trading for the following reasons:
Production variability and occasional shortfalls from our own assets means that we sometimes source third party materials to ensure a steady supply of product to our customers.
To optimise our supply chain outcomes, we may buy physical product from third parties.
In order to support the development of liquid markets, we will sometimes source third party physical product and manage risk through both the physical and financial markets.
1.15.4 Cash flow analysis
A Consolidated Cash Flow Statement is contained in the Financial Statements. The explanatory notes appear in note 37 ‘Notes to the consolidated cash flow statement’ to the Financial Statements. A summary table has been presented below to show the key sources and uses of cash.
| | | | | | | | | | | | |
Year ended 30 June | | 2015
US$M | | | 2014
US$M
Restated | | | 2013
US$M
Restated | |
| | | |
Cash generated from operations | | | 21,620 | | | | 29,318 | | | | 27,026 | |
Dividends received | | | 740 | | | | 1,264 | | | | 716 | |
Net interest paid | | | (541 | ) | | | (795 | ) | | | (848 | ) |
Taxation paid | | | (4,025 | ) | | | (6,147 | ) | | | (7,877 | ) |
| | | | | | | | | | | | |
Net operating cash flows from Continuing operations | | | 17,794 | | | | 23,640 | | | | 19,017 | |
| | | | | | | | | | | | |
Net operating cash flows from Discontinued operations | | | 1,502 | | | | 1,724 | | | | 1,137 | |
| | | | | | | | | | | | |
Net operating cash flows | | | 19,296 | | | | 25,364 | | | | 20,154 | |
| | | | | | | | | | | | |
Purchases of property plant and equipment | | | (11,947 | ) | | | (15,224 | ) | | | (21,104 | ) |
Exploration expenditure | | | (816 | ) | | | (986 | ) | | | (1,321 | ) |
Exploration expenditure expensed and included in operating cash flows | | | 670 | | | | 698 | | | | 1,026 | |
Purchases of intangibles | | | (98 | ) | | | (192 | ) | | | (380 | ) |
Investment in financial assets | | | (15 | ) | | | (1,168 | ) | | | (455 | ) |
Investment in equity accounted investments | | | (71 | ) | | | (44 | ) | | | (84 | ) |
Net proceeds from investing activities | | | 775 | | | | 1,782 | | | | 4,697 | |
| | | | | | | | | | | | |
Net investing cash flows from Continuing operations | | | (11,502 | ) | | | (15,134 | ) | | | (17,621 | ) |
| | | | | | | | | | | | |
Net investing cash flows from Discontinued operations | | | (1,066 | ) | | | (700 | ) | | | (1,105 | ) |
| | | | | | | | | | | | |
Cash disposed on demerger of South32 | | | (586 | ) | | | – | | | | – | |
| | | | | | | | | | | | |
Net investing cash flows | | | (13,154 | ) | | | (15,834 | ) | | | (18,726 | ) |
| | | | | | | | | | | | |
Net (repayment of)/proceeds from interest bearing liabilities | | | (728 | ) | | | (1,011 | ) | | | 7,255 | |
Dividends paid | | | (7,052 | ) | | | (6,506 | ) | | | (6,945 | ) |
Contributions from non-controlling interests | | | 53 | | | | 1,435 | | | | 73 | |
Other financing activities | | | (346 | ) | | | (354 | ) | | | (433 | ) |
| | | | | | | | | | | | |
Net financing cash flows from Continuing operations | | | (8,073 | ) | | | (6,436 | ) | | | (50 | ) |
| | | | | | | | | | | | |
Net financing cash flows from Discontinued operations | | | (203 | ) | | | (32 | ) | | | (148 | ) |
| | | | | | | | | | | | |
Net financing cash flows | | | (8,276 | ) | | | (6,468 | ) | | | (198 | ) |
| | | | | | | | | | | | |
Net (decrease)/increase in cash and cash equivalents from Continuing operations | | | (1,781 | ) | | | 2,070 | | | | 1,346 | |
| | | | | | | | | | | | |
Net increase/(decrease) in cash and cash equivalents from Discontinued operations | | | 233 | | | | 992 | | | | (116 | ) |
| | | | | | | | | | | | |
Cash disposed on demerger of South32 | | | (586 | ) | | | – | | | | – | |
| | | | | | | | | | | | |
Net operating cash flows from Continuing operations after interest and tax decreased by 25 per cent to US$17.8 billion during FY2015. The major contributor was the US$7.7 billion decrease in cash generated from operations (after changes in working capital balances), which was partially offset by a decrease of US$2.1 billion in net taxes paid.
Net investing cash outflows from Continuing operations decreased by US$3.6 billion to US$11.5 billion during FY2015 and reflected a US$3.4 billion reduction in capital and exploration expenditure. Expenditure on growth projects totalled US$9.3 billion, including US$4.5 billion on Petroleum projects and US$4.8 billion on Minerals projects. Sustaining capital expenditure and other items totalled US$2.6 billion. Exploration expenditure was US$816 million, including US$670 million classified within net operating cash flows.
Net financing cash outflows from Continuing operations increased by US$1.6 billion to US$8.1 billion. A decrease in proceeds from interest bearing liabilities of US$2.6 billion, a decrease in contributions fromnon-controlling interests of US$1.4 billion and higher dividends paid to non-controlling interests of US$435 million were partially offset by a decrease in repayments of interest bearing liabilities of US$2.9 billion during FY2015.
1.15.5 Net debt and sources of liquidity
Our policies on debt and liquidity management pursue the following objectives:
a solid ‘A’ credit rating;
gearing to be a maximum of 40 per cent;
diversification of funding sources;
maintain borrowings and excess cash predominantly in US dollars.
Gearing and net debt
Net debt, comprising Interest bearing liabilities less Cash and cash equivalents, was US$24.4 billion, which represented a decrease of US$1.4 billion compared with the net debt position at 30 June 2014. Gearing, which is the ratio of net debt to net debt plus net assets, was 25.7 per cent at 30 June 2015, compared with 23.2 per cent at 30 June 2014. IFRS 5/AASB 5 ‘Non-current Assets Held for Sale and Discontinued Operations’ does not require the Consolidated Balance Sheet to be restated for comparative periods. The FY2014 figures therefore includes assets and liabilities of the Businesses demerged with South32. For information relating to Discontinued operations refer to note 29 ‘Discontinued operations’ to the Financial Statements.
Cash and cash equivalents less overdrafts at 30 June 2015 was US$6.6 billion compared with US$8.8 billion at 30 June 2014. Included within Cash and cash equivalents were short-term deposits of US$5.8 billion compared with US$7.1 billion at 30 June 2014.
Funding sources
During FY2015, we issued the following long-term debt:
In March 2015, we issued an A$1.0 billion 3.000 per cent Australian bond due 2020.
In April 2015, we issued a three tranche Euro bond comprising €600 million Floating Rate Notes due 2020 paying three-month Euribor plus 0.350 per cent, €650 million 0.750 per cent bonds due 2022 and €750 million 1.500 per cent bonds due 2030.
None of our Group-level borrowing facilities are subject to financial covenants. Certain specific financing facilities in relation to specific Businesses are the subject of financial covenants that vary from facility to facility, but which would be considered normal for such facilities.
In addition to the Group’s uncommitted debt issuance programs, we hold the following committed standby facilities.
| | | | | | | | | | | | | | | | | | | | | | | | |
| | | Facility
available
2015 | | | Drawn
2015 | | | Undrawn
2015 | �� | | Facility
available
2014 | | | Drawn
2014 | | | Undrawn
2014 | |
| | | US$M | | | US$M | | | US$M | | | US$M | | | US$M | | | US$M | |
Revolving credit facility (1) | | | 6,000 | | | | – | | | | 6,000 | | | | 6,000 | | | | – | | | | 6,000 | |
| | | | | | | | | | | | | | | | | | | | | | | | |
Total financing facilities | | | 6,000 | | | | – | | | | 6,000 | | | | 6,000 | | | | – | | | | 6,000 | |
| | | | | | | | | | | | | | | | | | | | | | | | |
| (1) | The Group’s committed US$6.0 billion revolving credit facility operates as a back-stop to the Group’s uncommitted commercial paper program. The combined amount drawn under the facility or as commercial paper will not exceed US$6.0 billion. As at 30 June 2015, US$ nil commercial paper was drawn (2014: US$ nil), therefore US$6.0 billion of committed facility was available to use (2014: US$6.0 billion). The revolving credit facility has a five-year maturity with one remaining one-year extension option. A commitment fee is payable on the undrawn balance and an interest rate comprising an interbank rate plus a margin applies to any drawn balance. The agreed margins are typical for a credit facility extended to a company with the Group’s credit rating. |
Additional information regarding the maturity profile of our debt obligations and details of our standby and support agreements is included in note 23 ‘Financial risk management’ to the Financial Statements.
The Group’s credit ratings are currently A1/P-1 (Moody’s – long-term/short-term) and A+/A-1 (Standard & Poor’s – long-term/short-term). The credit ratings from both agencies remained unchanged in FY2015, however on 4 May 2015 Standard & Poor’s revised the Group’s ratings outlook to negative from stable.
1.15.6 Other information
Quantitative and qualitative disclosures about market risk
We identified our primary market risks in section 1.15.1 of this Annual Report. A description of how we manage our market risks, including both quantitative and qualitative information about our market risk sensitive instruments outstanding at 30 June 2015, is contained in note 23 ‘Financial risk management’ to the Financial Statements.
Off-balance sheet arrangements and contractual commitments
Information in relation to our material off-balance sheet arrangements, principally contingent liabilities, commitments for capital expenditure and commitments under leases at 30 June 2015 is provided in note 34 ‘Commitments’ and note 35 ‘Contingent liabilities’ to the Financial Statements.
Subsidiary information
Information about our significant subsidiaries is included in note 30 ‘Subsidiaries’ to the Financial Statements.
Related party transactions
Related party transactions are outlined in note 33 ‘Related party transactions’ to the Financial Statements.
Significant changes since the end of the year
Significant changes since the end of the year are outlined in note 36 ‘Subsequent events’ to the Financial Statements.
The Strategic Report is made in accordance with a resolution of the Board.
Jac Nasser AO
Chairman
Dated: 10 September 2015
2 Business overview
2.1 Business Groups
2.1.1 Petroleum and Potash Business
Our Petroleum and Potash Business headquartered in Houston, United States, comprises conventional and non-conventional oil and gas operations and a potash project based in Saskatchewan, Canada.
Petroleum
Our Petroleum Business includes exploration, development, production and marketing activities. We have a high-quality resource base concentrated in the United States and Australia. Our core production operations are located in the US Gulf of Mexico, Australia and Trinidad and Tobago (conventional) and Onshore US (unconventional). We produce crude oil and condensate, gas and natural gas liquids (NGLs).
Our overall production for FY2015 was 255.7 million barrels of oil equivalent (MMboe). This was mainly attributable to our US and Australian operations, which produced 162.3 MMboe and 77.7 MMboe, respectively, with the majority of US production coming from Onshore US, which produced 125.7 MMboe. Operations outside Australia and the United States delivered the remaining production volumes. Information relating to our oil and gas reserves is set out in section 2.3.1.
In line with our aim of simplification and a sharper strategic focus, we continue to evaluate our existing portfolio in order to optimise our position around our core business.
United States
Our production operations include the following:
Gulf of Mexico
We operate two fields in the Gulf of Mexico (Shenzi with a 44 per cent interest and Neptune with a 35 per cent interest) and hold non-operating interests in three other fields (Atlantis with a 44 per cent interest, Mad Dog with a 23.9 per cent interest, and Genesis with a 4.95 per cent interest). We have ongoing infill drilling in most of our Gulf of Mexico fields and also planned ongoing water injection wells at the Shenzi and Atlantis fields. All the fields are located between 155 and 210 kilometres offshore from the US state of Louisiana. We also own 25 per cent and 22 per cent, respectively, of the companies that own and operate the Caesar oil pipeline and the Cleopatra gas pipeline. These pipelines transport oil and gas from the Green Canyon area, where our Gulf of Mexico fields are located, to connecting pipelines that transport product onshore. Our US oil production is delivered to refineries along the Gulf Coast of the United States.
Onshore US
We produce oil, condensate, gas and NGLs in four shale areas: Eagle Ford, Permian, Haynesville and Fayetteville. Shale reservoirs are characterised by low permeability, so it is necessary to stimulate the reservoir to create additional permeability and, therefore, the flow of liquids and gas to the wellbore. Extracting oil and gas from shale involves hydraulic fracturing, which is a process developed to efficiently access supplies of oil and gas locked inside dense subsurface rock formations, such as shale. Hydraulic fracturing involves the use of water, sand and chemicals to fracture the hydrocarbon-bearing rock formation to allow the well to produce commercial volumes.
Prices for oil, NGLs and gas are based on US regional price indices, including West Texas Intermediate prices for oil, relevant published US regional gas indices for natural gas and Mont Belvieu prices for NGLs.
Eagle Ford
The Eagle Ford production operation is located primarily in the southern Texas counties of DeWitt, Karnes, McMullen and LaSalle. We produce oil, condensate, gas and NGLs from two fields, Black Hawk and Hawkville. The oil and gas produced is sold domestically in the United States, via connections to intrastate and interstate pipelines, and internationally through the export of processed condensate from Black Hawk. The Eagle Ford gathering system consists of 1,602 kilometres of gathering lines that deliver gathered volumes to five central delivery points (CDPs), from where processed volumes are transported to market.
Our Black Hawk acreage comprises 0.1 million net acres and is located primarily in the DeWitt and Karnes Counties in southern Texas. Our ownership interests range from five per cent to 100 per cent. A majority of our interest (50 per cent share) in the Black Hawk is held with Devon Energy. At 30 June 2015, we held an interest in approximately 772 gross wells and approximately 427 net wells. We acted as joint venture operator for approximately 15 per cent of our gross wells.
Our Hawkville acreage comprises 0.2 million net acres and is located primarily in the McMullen and La Salle Counties in southern Texas. Our ownership interests range from nine per cent to 100 per cent. At 30 June 2015, we held an interest in approximately 494 gross wells and approximately 409 net wells. We acted as joint venture operator for approximately 84 per cent of our gross wells.
Permian
The Permian production operation consists of 0.2 million net acres and is primarily located in the western Texas county of Reeves. We produce oil, gas and NGLs. The oil and gas produced is sold domestically in the United States, via connections to intrastate and interstate pipelines. Our ownership interests range from 14 per cent to 100 per cent. At 30 June 2015, we held an interest in approximately 81 gross wells and approximately 75 net
wells. We acted as joint venture operator for approximately 93 per cent of our gross wells. The Permian gathering system consists of 145 kilometres of gathering lines that deliver gathered volumes to third party CDPs, from where processed volumes are transported to market. During FY2015, as part of our continued focus on investing and operating core assets, we sold our interest in our upstream Onshore US Pecos shale operation, located in the Permian Basin, to Silverback Exploration, LLC for a cash consideration of US$75 million. We also sold our Pecos midstream operations to EagleClaw Midstream, LLC for a cash consideration of US$52 million.
Haynesville
The Haynesville production operation is located primarily in northern Louisiana and consists of 0.2 million net acres. We produce gas that is sold domestically in the United States, via connections to intrastate and interstate pipelines. Our ownership interests range from less than one per cent to 100 per cent. At 30 June 2015, we held an interest in approximately 1,045 gross wells and approximately 395 net wells. We acted as joint venture operator for approximately 37 per cent of our gross wells. During FY2015, as part of our continued focus on investing and operating core assets, we sold our interest in our Onshore North Louisiana conventional operations to JW Operating Company for a cash consideration of US$135 million.
Fayetteville
The Fayetteville production operation is located in north central Arkansas and consists of 0.4 million net acres. We produce gas that is sold domestically in the United States, via connections to intrastate and interstate pipelines. Our ownership interests range from less than one per cent to 100 per cent. At 30 June 2015, we held an interest in approximately 4,950 gross wells and approximately 1,070 net wells. We acted as joint venture operator for approximately 20 per cent of our gross wells. The Fayetteville gathering system consists of 763 kilometres of gathering lines that deliver gathered volumes to 14 CDPs, from where processed volumes are transported to market.
Australia
Bass Strait
Together with our 50-50 joint venture partner, Esso Australia (a subsidiary of ExxonMobil), through the Gippsland Basin Joint Venture, we participated in the original discovery of hydrocarbons in 1965 and we have been producing oil and gas from Bass Strait for more than 40 years. The Bass Strait operations are located between 25 and 80 kilometres off the southeastern coast of Australia.
We sell the majority of our Bass Strait crude oil and condensate production to refineries along the east coast of Australia under 12-month contracts. The contract price is based on the average Dated Brent price. Gas is piped onshore to the joint venture’s Longford processing facility, from where we sell our share of production to domestic distributors under contracts with periodic price reviews. Liquefied petroleum gas (LPG) is dispatched via pipeline, road tanker or sea tanker. Ethane is dispatched via pipeline to petrochemical plants in western Melbourne.
Minerva
We are the operator of Minerva (90 per cent interest), a gas field located 11 kilometres south-southwest of Port Campbell in western Victoria. The operation consists of two subsea wells, with gas piped onshore to a processing plant. After processing, the gas is delivered into a pipeline and sold domestically under long-term contracts.
North West Shelf
We are a joint venture participant in the North West Shelf Project, located approximately 125 kilometres northwest of Dampier in Western Australia. The North West Shelf Project supplies gas to the Western Australian domestic market, mainly under long-term contracts, and liquefied natural gas (LNG) to buyers in Japan, South Korea and China under a series of long-term contracts.
North West Shelf gas is piped from the fields to the Karratha Gas Plant for processing. LPG, condensate and LNG are transported to market by ship, while domestic gas is transported by the Natural Gas and Pilbara Energy pipelines. We are also a joint venture partner in four nearby oil fields – Cossack, Wanaea, Lambert and Hermes. All North West Shelf gas and oil joint ventures are operated by Woodside.
Pyrenees
We operate six oil fields in Pyrenees, which are located offshore approximately 23 kilometres northwest of Northwest Cape, Western Australia. We had an effective 62 per cent interest in the fields as at 30 June 2015, based on inception-to-date production from two permits in which we have interests of 71.43 per cent and 40 per cent, respectively. The project uses a floating, production, storage and off-take (FPSO) facility. The crude oil produced is sold internationally on the spot market.
Macedon
We are the operator of Macedon (71.43 per cent interest), an offshore gas field located approximately 75 kilometres west of Onslow, Western Australia, and an onshore gas processing facility, located approximately 17 kilometres southwest of Onslow. The operation achieved first gas in August 2013 and consists of four subsea wells, with gas piped onshore to the processing plant. After processing, the gas is delivered into a pipeline and sold into the Western Australian domestic market, mainly under long-term contracts.
Stybarrow
We are the operator of Stybarrow (50 per cent interest), an oil field located 55 kilometres west-northwest of Exmouth, Western Australia. The project uses a FPSO facility. The crude oil produced is sold internationally on the spot market. Stybarrow reached the end of its field life and ceased production on 30 June 2015.
Other production operations
Trinidad and Tobago
We operate the Greater Angostura field (45 per cent interest in the production sharing contract), an integrated oil and gas development, located offshore, 40 kilometres east of Trinidad. The crude oil is sold on a spot basis to international markets, while the gas is sold domestically under term contracts.
Algeria
Our Algerian operations comprise an effective 38 per cent interest in the ROD Integrated Development, which consists of six satellite oil fields that pump oil back to a dedicated processing train. The oil is sold on a spot basis to international markets. Our interest in ROD is subject to a contractual determination with our joint venture partner ENI, which could result in a future change in our interest under certain conditions.
United Kingdom
We hold a 16 per cent non-operating interest in the Bruce oil and gas field in the North Sea and operate the Keith oil and gas field (31.83 per cent interest), a subsea tie-back. Oil and gas from both fields is processed via the Bruce platform facilities.
Pakistan
We operate the Zamzama gas project (38.5 per cent interest) in the Sindh province of Pakistan. Both gas and condensate are sold domestically under term contracts in accordance with the Pakistan Government’s pricing policies.
During February 2015, BHP Billiton and Tri-Resources Investments Inc. (a subsidiary of the Hashoo Group) signed a share purchase agreement for the acquisition by Tri-Resources of BHP Billiton’s entire interest in BHP Petroleum (Pakistan), which holds a 38.5 per cent interest in the Zamzama Joint Venture. Completion of the transaction is subject to receipt of regulatory approvals and other customary closing conditions.
Information on Petroleum operations
The following table contains additional details of our production operations. This table should be read in conjunction with the production (refer to section 2.2.1) and reserve tables (refer to section 2.3.1).
| | | | | | | | | | | | |
Operation &
location | | Product | | Ownership | | Operator | | Title, leases or options | | Nominal production
capacity | | Facilities, use & condition |
| United States | | | | | | | | | | |
| Neptune (Green Canyon 613) | | | | | | | | | | | | |
Offshore deepwater Gulf of Mexico (1,300m) | | Oil and gas | | BHP Billiton 35% Marathon Oil 30% W&T Offshore 20% Maxus US Exploration 15% | | BHP Billiton | | Lease from US Government as long as oil and gas produced in paying quantities | | 50 Mbbl/d oil 50 MMcf/d gas | | Permanently moored tension leg platform (TLP) |
| | | | | | |
| Shenzi (Green Canyon 653) | | | | | | | | | | | | |
Offshore deepwater Gulf of Mexico (1,310m) | | Oil and gas | | BHP Billiton 44% Hess Corporation 28% Repsol 28% | | BHP Billiton | | Lease from US Government as long as oil and gas produced in paying quantities | | 100 Mbbl/d oil 50 MMcf/d gas | | Stand-alone TLP Genghis Khan field (part of same geological structure) tied back to Marco Polo TLP |
| | | | | | |
| Atlantis (Green Canyon 743) | | | | | | | | | | | | |
Offshore deepwater Gulf of Mexico (2,155m) | | Oil and gas | | BHP Billiton 44% BP 56% | | BP | | Lease from US Government as long as oil and gas produced in paying quantities | | 200 Mbbl/d oil 180 MMcf/d gas | | Permanently moored semi-submersible platform |
| | | | | | |
| Mad Dog (Green Canyon 782) | | | | | | | | | | | | |
Offshore deepwater Gulf of Mexico (1,310m) | | Oil and gas | | BHP Billiton 23.9% BP 60.5% Chevron 15.6% | | BP | | Lease from US Government as long as oil and gas produced in paying quantities | | 80 Mbbl/d oil 60 MMcf/d gas | | Permanently moored integrated truss spar, facilities for simultaneous production and drilling operations |
| | | | | | | | | | | | |
Operation &
location | | Product | | Ownership | | Operator | | Title, leases or options | | Nominal production
capacity | | Facilities, use & condition |
| Genesis (Green Canyon 205) | | | | | | | | | | | | |
Offshore deepwater Gulf of Mexico (approximately 790m) | | Oil and gas | | BHP Billiton 4.95% Chevron 56.67% ExxonMobil 38.38% | | Chevron | | Lease from US Government as long as oil and gas produced in paying quantities | | 55 Mbbl/d oil 72 MMcf/d gas | | Floating cylindrical hull (spar) moored to seabed with integrated drilling facilities |
| | | | | |
Onshore US Eagle Ford | | | | | | | | | | |
Blackhawk / Hawkville Onshore, southern Texas | | Oil, condensate, gas and NGL | | Blackhawk – BHP Billiton working interest in wells range from 5% to 100% BHP Billiton average net working interest is approximately 55% Largest partners include Devon Energy Hawkville – BHP Billiton working interest in wells range from 9% to 100% BHP Billiton average net working interest is approximately 83% Largest partners include Lewis Energy, Swift Energy & Hunt Oil Company | | Blackhawk – BHP Billiton operated approximately 15% of approximately 772 gross wells Hawkville – BHP Billiton operated approximately 84% of approximately 494 gross wells | | Blackhawk – we currently own leasehold interests in approximately 0.1 million net acres Leases associated with producing wells remain in place as long as oil and gas is produced in paying quantities Hawkville – we currently own leasehold interests in approximately 0.2 million net acres Leases associated with producing wells remain in place as long as oil and gas is produced in paying quantities | | Blackhawk – average daily production during FY2015 130 MMcf/d gas 82 Mbbl/d oil and condensate 24 Mbbl/d NGL Hawkville – average daily production during FY2015 168 MMcf/d gas 15 Mbbl/d oil and condensate 17 Mbbl/d NGL | | Producing oil and gas wells and associated pipeline and compression facilities |
| | | | | | |
| Permian | | | | | | | | | | | | |
| Permian, western Texas | | Oil, gas and NGL | | BHP Billiton working interest in wells range from 14% to 100% BHP Billiton average net working interest is approximately 93% Residual ownership held by multiple partners | | BHP Billiton operated approximately 93% of approximately 81 gross wells | | We currently own leasehold interests in approximately 0.2 million net acres Leases associated with producing wells remain in place as long as oil and gas is produced in paying quantities | | Average daily production during FY2015 30 MMcf/d gas 10 Mbbl/d oil and condensate 4 Mbbl/d NGL | | Producing oil and gas wells with associated gathering systems, processing plant and compression facilities |
| | | | | | | | | | | | |
Operation &
location | | Product | | Ownership | | Operator | | Title, leases or options | | Nominal production
capacity | | Facilities, use & condition |
| Haynesville | | | | | | | | | | | | |
| Haynesville, northern Louisiana and eastern Texas | | Gas | | BHP Billiton working interest in wells range from less than 1% to 100% BHP Billiton average networking interest is approximately 38% Largest partners include Chesapeake Energy and Exco Resources | | BHP Billiton operated approximately 37% of approximately 1,045 gross wells | | We currently own leasehold interests in approximately 0.2 million net acres Leases associated with producing wells remain in place as long as oil and gas is produced in paying quantities | | Average daily production during FY2015 446 MMcf/d gas | | Producing gas wells with an associated pipeline owned by a third party and compression infrastructure |
| | | | | | |
| Fayetteville | | | | | | | | | | | | |
| Fayetteville, northern central Arkansas | | Gas | | BHP Billiton working interest in wells range from less than 1% to 100% BHP Billiton average net working interest is approximately 22% Largest partners include Southwestern Energy and XTO Energy | | BHP Billiton operated approximately 20% of approximately 4,950 gross wells | | We currently own leasehold interests in approximately 0.4 million net acres Leases associated with producing wells remain in place as long as oil and gas is produced in paying quantities | | Average daily production during FY2015 379 MMcf/d gas | | Producing gas wells with associated pipeline and compression infrastructure |
| | | | | | |
| Australia | | | | | | | | | | | | |
| | | | | | |
| Bass Strait | | | | | | | | | | | | |
| Offshore and onshore Victoria | | Oil and gas | | Gippsland Basin Joint Venture (GBJV): BHP Billiton 50% Esso Australia (Exxon Mobil subsidiary) 50% Oil Basins Ltd 2.5% royalty interest in 19 production licences Kipper Unit Joint Venture (KUJV): BHP Billiton 32.5% Esso Australia 32.5% Santos Offshore Pty Ltd 35% | | Esso Australia | | 20 production licences and 2 retention leases issued by Australian Government Expire between 2016 and end of life of field One production licence held with Santos Ltd | | 200 Mbbl/d oil 1,075 MMcf/d gas 5,150 tpd LPG 850 tpd ethane | | 20 producing fields with 23 offshore developments (15 steel jacket platforms, 4 subsea developments, 2 steel gravity based mono towers, 2 concrete gravity based platforms) Onshore infrastructure: – Longford facility (3 gas plants, liquid processing facilities) – Interconnecting pipelines – Long Island Point LPG and oil storage facilities – Ethane pipeline |
| | | | | | | | | | | | |
Operation &
location | | Product | | Ownership | | Operator | | Title, leases or options | | Nominal production
capacity | | Facilities, use & condition |
| Minerva | | | | | | | | | | | | |
| Offshore and onshore Victoria | | Gas and condensate | | BHP Billiton 90% Santos (BOL) 10% | | BHP Billiton | | Production licence issued by Australian Government expires 5 years after production ceases | | 150 TJ/d gas 600 bbl/d condensate | | 2 well completions Single flow line transports gas to onshore gas processing facility Gas plant located approximately 4 km inland from Port Campbell |
|
| North West Shelf |
Offshore and onshore Western Australia North Rankin Goodwyn Perseus Angel and Searipple fields | | Domestic gas, LPG, condensate, LNG | | North West Shelf Project is an unincorporated JV BHP Billiton: 8.33% of original domestic gas JV, will ultimately increase to 16.67% 16.67% of Incremental Pipeline Gas (IPG) domestic gas JV 16.67% of original LNG JV 12.5% of China LNG JV 16.67% of LPG JV Other participants: subsidiaries of Woodside, Chevron, BP, Shell, Mitsubishi/Mitsui and China National Offshore Oil Corporation | | Woodside Petroleum Ltd | | 9 production licences issued by Australian Government 6 expire in 2022 and 3 expire 5 years from end of production | | North Rankin Complex: 2,500 MMcf/d gas 60 Mbbl/d condensate Goodwyn A platform: 1,450 MMcf/d gas 110 Mbbl/d condensate Angel platform: 960 MMcf/d gas 50 Mbbl/d condensate Withnell Bay gas plant: 600 MMcf/d gas 5-train LNG plant: 45,000 tpd LNG | | Production from North Rankin and Perseus processed through the interconnected North Rankin A and North Rankin B platforms Production from Goodwyn and Searipple processed through Goodwyn A platform 4 subsea wells in Perseus field tied into Goodwyn A platform Production from Angel field processed through Angel platform Onshore gas treatment plant at Withnell Bay processes gas for domestic market 5-train LNG plant |
|
| North West Shelf |
Offshore Western Australia Wanaea Cossack Lambert and Hermes fields | | Oil | | BHP Billiton 16.67% Woodside 33.34% BP, Chevron, Japan Australia LNG (MIMI) 16.67% each | | Woodside Petroleum Ltd | | 3 production licences issued by Australian Government in September 2014 expire in 2018, 2033, and 2035 respectively | | Production: 60 Mbbl/d Storage: 1 MMbbl | | FPSO unit |
| | | | | | | | | | | | |
Operation &
location | | Product | | Ownership | | Operator | | Title, leases or options | | Nominal production
capacity | | Facilities, use & condition |
| Pyrenees | | | | | | | | | | | | |
Offshore Western Australia Crosby Moondyne Wild Bull Tanglehead Stickle and Ravensworth fields | | Oil | | WA-42-L permit: BHP Billiton 71.43% Apache PVG 28.57% WA-43-L permit: BHP Billiton 40% Apache APG Permits 31.5% Inpex Alpha 28.5% | | BHP Billiton | | Production licence issued by Australian Government expires 5 years after production ceases | | Production: 96 Mbbl/d oil Storage: 920 Mbbl | | 24 subsea well completions (19 producers, 4 water injectors, 1 gas injector), FPSO |
| | | | | | |
| Macedon | | | | | | | | | | | | |
| Offshore and onshore Western Australia | | Gas and condensate | | WA-42-L permit BHP Billiton 71.43% Apache PVG 28.57% | | BHP Billiton | | Production licence issued by Australian Government expires 5 years after production ceases | | Production: 200 MMcf/d gas 20 bbl/d condensate | | 4 well completions Single flow line transports gas to onshore gas processing facility Gas plant located approximately 17 km southwest of Onslow |
| | | | | | |
| Stybarrow | | | | | | | | | | | | |
Offshore Western Australia Stybarrow and Eskdale fields | | Oil and gas | | BHP Billiton 50% Woodside 50% | | BHP Billiton | | Production licence issued by Australian Government expires 5 years after production ceases | | Production: 80 Mbbl/d oil Storage: 900 Mbbl | | 10 subsea well completions (6 producers, 3 water injectors, 1 gas injector) Gas production is reinjected Ceased production in June 2015 |
| | | | | | | | | | | | |
Operation &
location | | Product | | Ownership | | Operator | | Title, leases or options | | Nominal production
capacity | | Facilities, use & condition |
| Other production operations | | | | | | | | |
| | | | | | |
| Trinidad and Tobago | | | | | | | | | | | | |
| | | | | | |
| Greater Angostura | | | | | | | | | | | | |
| Offshore Trinidad and Tobago | | Oil and gas | | BHP Billiton 45% National Gas Company 30% Chaoyang 25% | | BHP Billiton | | Production sharing contract with the Trinidad and Tobago Government entitles us to operate Greater Angostura until 2026 | | 100 Mbbl/d oil 280 MMcf/d gas | | Integrated oil and gas development: central processing platform connected to the Kairi-2 platform and gas export platform with 3 satellite wellhead protector platforms and flow lines Oil pipeline from processing platform to storage and export at Guayaguayare Gas supplied to Trinidad and Tobago domestic markets |
| | | | | | |
| Algeria | | | | | | | | | | | | |
| | | | | | |
| ROD Integrated Development | | | | | | | | | | | | |
| Onshore Berkine Basin, 900 kilometres southeast of Algiers, Algeria | | Oil | | BHP Billiton 45% interest in 401a/402a production sharing contract ENI 55% BHP Billiton effective 38% interest in ROD unitised integrated development ENI 62% | | Joint Sonatrach/ENI entity | | Production sharing contract with Sonatrach (title holder) Expires in 2016 with option for two 5-year extensions under certain conditions specified in the contracts | | Approximately 80 Mbbl/d oil | | Development and production of 6 oil fields 2 largest fields (ROD and SFNE) extend into neighbouring blocks 403a, 403d Production through dedicated processing train on block 403 |
| | | | | | | | | | | | |
Operation &
location | | Product | | Ownership | | Operator | | Title, leases or options | | Nominal production
capacity | | Facilities, use & condition |
| United Kingdom | | | | | | | | | | | | |
| | | | | | |
| Bruce/Keith | | | | | | | | | | | | |
| Offshore North Sea, UK | | Oil and gas | | Bruce: BHP Billiton 16% BP 37% Total SA 43.25% Marubeni 3.75% Keith: BHP Billiton 31.83% BP 34.84% Total SA 25% Marubeni 8.33% | | Bruce – BP Keith – BHP Billiton | | 3 production licences issued by UK Government expire in 2018 and 2046 and end of life of field | | 920 MMcf/d gas | | Integrated oil and gas platform Keith developed as tie-back to Bruce facilities |
| | | | | | |
| Pakistan | | | | | | | | | | | | |
| | | | | | |
| Zamzama | | | | | | | | | | | | |
Onshore Sindh Province, Pakistan | | Gas and condensate | | BHP Billiton 38.5% ENI Pakistan 17.75% PKP Exploration 9.375% PKP Exploration 2 9.375% Government Holdings 25% | | BHP Billiton | | 20-year development and production lease from the Pakistan Government expires in 2022 (option to extend 5 years) | | 500 MMcf/d gas 3,350 bbl/d condensate | | 10 production wells 4 process trains 2 front end compression trains |
Capital projects
United States
Onshore US
The development phase of an onshore shale operation requires an extensive drilling and completion program, which may include associated gas compression and treatment facilities and connecting pipelines. Shale development has a repetitive, manufacturing-like nature that provides opportunities for increased efficiency. Much of our development of the shale reservoirs utilises horizontal drilling, with average lateral lengths between 1,500 and 1,600 metres. We enter into service contracts with third parties to provide drilling and completion services at our operated sites. At the end of FY2015, we had 10 drilling rigs in operation.
BHP Billiton’s Onshore US drilling and development expenditure in FY2015, which is presented on an accruals basis within this section, was US$3.3 billion (FY2014: US$4.2 billion). The expenditure was primarily related to drilling and completion activities in our liquids-rich Black Hawk and Permian fields, while deferring development in areas that are predominantly gas.
Eagle Ford capital expenditure for FY2015 was US$2.1 billion (FY2014: US$3.1 billion). The expenditure was primarily related to drilling and completion activities, resulting in 188 net development wells completed during the period. Of the US$2.1 billion, approximately US$95 million was spent on the installation of more than 52 kilometres of pipeline infrastructure and additional gas processing facilities. The operated rig count was seven for the year (FY2014: 17).
Permian capital expenditure for FY2015 was US$0.7 billion (FY2014: US$0.5 billion). The expenditure was primarily related to drilling and completion activities, resulting in 45 net development wells completed during the year. Of the US$0.7 billion, approximately US$54 million was spent on the installation of more than 101 kilometres of pipeline infrastructure and additional gas processing facilities. The operated rig count was three for the year (FY2014: four).
Haynesville capital expenditure for FY2015 was US$0.3 billion (FY2014: US$0.4 billion). The expenditure was primarily related to drilling and completion activities, resulting in 25 net development wells completed during the year. There were no operated rigs in Haynesville at the end of this year (FY2014: three).
Fayetteville capital expenditure for FY2015 was US$0.2 billion (FY2014: US$0.2 billion). The expenditure was primarily related to participation in drilling and completion activities for wells operated by third parties, resulting in 45 net development wells completed during the year.
Our Onshore US capital investment is expected to decrease to US$1.5 billion in FY2016 in response to changes in the global commodity markets. This includes an operated rig count of nine for the period, with shale oil investment accounting for approximately 80 per cent of the investment. Our decision to cut spending will mean deferring gas volumes in the near term with our drilling programs in the Fayetteville and Haynesville areas remaining temporarily suspended. However, we expect to realise greater value by developing our acreage as prices recover.
Australia
Bass Strait Kipper gas field development
Initial development of the Kipper gas field in the Gippsland Basin, located offshore from Victoria, was approved by the Board in December 2007. A supplemental approval of the development was granted in January 2011. The first phase of the project included two new subsea wells, three new pipelines and platform modifications to supply 10 thousand barrels per day (Mbbl/d) of condensate and 80 million cubic feet per day (MMcf/d) of gas.
Gas and liquids will be processed via the existing Gippsland Basin Joint Venture facilities. The Kipper gas field development comprises the Kipper Unit Joint Venture and the Gippsland Basin Joint Venture. We own a
32.5 per cent interest in the Kipper Unit Joint Venture, with Esso Australia owning 32.5 per cent and Santos owning 35 per cent. We own a 50 per cent interest in the Gippsland Basin Joint Venture, with Esso Australia owning the remaining 50 per cent.
The main Kipper gas field facilities were completed in September 2012; however, first production has not yet commenced due to the need to provide for mercury removal. Funding for the installation of the mercury treatment facilities of US$120 million was approved in March 2014, with completion expected to occur in CY2016. Our share of FY2013costs incurred to 30 June 2015 was US$59 million.
Bass Strait Turrum field development
Further expansion of the Gippsland Basin facilities is underway following approval by the Board in July 2008 of the full field development of the Turrum oil and gas field. A supplemental approval of the development was obtained in January 2011. The project consists of five wells and a new platform, Marlin B, linked by a bridge to the existing Marlin A platform. The Turrum field, which has a capacity of 11 Mbbl/d of oil and 200 MMcf/d of gas, is located 42 kilometres offshore in approximately 60 metres of water. Our share of development costs is approximately US$1.4 billion, of which US$1.3 billion was incurred as of 30 June 2015.
The Turrum field development operates under the Gippsland Basin Joint Venture, in which we own a 50 per cent interest, with Esso Australia owning the remaining 50 per cent. Initial production of low carbon dioxide gas through the Turrum facilities occurred in June 2013. High carbon dioxide gas production from the Turrum reservoir will come online with completion of the Longford Gas Conditioning Plant in CY2016.
Bass Strait Longford Gas Conditioning
The Longford Gas Conditioning Plant (LGCP) Project was 158.9 Mtapproved by the Board in December 2012 to enable the production of ore. Turrum reserves plus the production of Kipper and other undeveloped high carbon dioxide content hydrocarbons. The Project scope includes a carbon dioxide extraction facility, brownfield tie-ins, an electrical upgrade and multiple supporting utilities. Our share of development costs is approximately US$520 million, of which US$356 million was incurred as of 30 June 2015. First gas production is expected in CY2016. Esso Australia is the operator of the LGCP, owning a 50 per cent interest and BHP Billiton owns the remaining 50 per cent.
North West Shelf Greater Western Flank–A
The North West Shelf Greater Western Flank–A (GWF-A) gas project was approved by the Board in November 2011 to recover gas from the Goodwyn H and Tidepole fields. The project consists of a five well subsea tie-back of the Goodwyn H and Tidepole fields to the Goodwyn A platform. The Goodwyn A platform is located in 130 metres of water, approximately 130 kilometres offshore from Karratha on the northwest coast of Australia. Our share of development costs is approximately US$400 million, of which US$237 million was incurred as of 30 June 2015. First gas production is expected in CY2016. Woodside is the operator and we own a 16.67 per cent interest.
Significant evaluation activities
We nowperform development evaluation activities to determine the technical feasibility and commercial viability of prospective projects after exploration and appraisal. Our significant recent evaluation activities include the following:
United States
Mad Dog Phase 2
The Mad Dog Phase 2 project is in response to the successful Mad Dog South appraisal well, which confirmed significant hydrocarbons in the southern portion of the Mad Dog field. The project was sent back to study phase
in 2013, following which a revised development concept was selected by the owners. The revised concept will undergo further refinement and undertake additional investigations in FY2016. BP is the operator and we hold a 23.9 per cent working interest.
Australia
Scarborough
Development planning for the large Scarborough gas field offshore Western Australia is in progress. Following an assessment, floating LNG has been selected as the preferred development option. Further work to optimise the preferred development option is ongoing. Esso is the operator of the WA-1-R lease and we hold a 50 per cent working interest. We are the operator of, and have a 100 per cent working interest in, the adjacent Thebe discovery and the WA-346-P block.
North West Shelf Other – Greater Western Flank ‘2’
Planning continues for the development of Greater Western Flank ‘2’. Greater Western Flank ‘2’ represents the second phase of development of the core Greater Western Flank fields, behind the GWF-A development, and is located to the southwest of the existing Goodwyn A platform. Woodside is the operator and we own a 16.67 per cent share. During FY2015, the project scope was further defined, with a final investment decision expected in CY2015.
Exploration and appraisal
Our exploration strategy is to focus on material opportunities, at high working interest, with a bias for liquids and operatorship. While the majority of the expenditure incurred was in our Gulf of Mexico, Western Australia and Trinidad and Tobago focus areas, we also incurred expenditure in South Africa, Brazil, South-East Asia, India and Onshore US.
Access
In FY2015, we accessed acreage in the US sector of the Gulf of Mexico and in Trinidad and Tobago and Barbados. In the Gulf of Mexico, we were awarded 14 blocks (100 per cent working interest and operator on all blocks; 315 square kilometres) from Lease Sale 238 held during the September 2014 quarter. In addition, BHP Billiton was also awarded all nine of its high bid leases, totalling 210 square kilometres in Central Lease Sale 235 in the June 2015 quarter. In the Caribbean, we finalised production sharing contracts and joint operating agreements for a 65 per cent interest and operatorship in Trinidad and Tobago Blocks 3 and 7 (totalling 2,096 square kilometres) with BG Group Ltd, and signed exploration licences for Barbados Blocks Bimshire and Carlisle Bay (100 per cent working interest; 5,004 square kilometres).
Exploration program expenditure details
During FY2015, our gross expenditure on exploration was US$567 million, of which US$481 million was expensed.
Exploration and appraisal wells drilled or in the process of drilling during the year:
| | | | | | | | | | | | | | |
Well | | Location | | Target | | BHP Billiton
equity | | Spud date | | Water depth | | Total well depth | | Status |
Shenzi North-2 | | Gulf of Mexico GC609 | | Oil | | 44% (Operator) | | 9 April 2015 | | 1,309 metres | | 8,733 metres | | Plugged and abandoned; currently sidetracking |
| | | | | | | |
Shenzi North-ST1 | | Gulf of Mexico GC609 | | Oil | | 44% (Operator) | | 14 June 2015 | | 1,309 metres | | 8,238 metres | | Drilling |
In the Gulf of Mexico, we drilled the Shenzi North-2 exploration well on Green Canyon Block 609 (44 per cent working interest and operator) during the June 2015 quarter. The lower section of the hole was plugged and abandoned and associated costs expensed. We are currently drilling a sidetrack to further test the opportunity. Significant investment in seismic data acquisition, licensing and reprocessing were also completed in order to evaluate prospectivity in our focus areas.
In Western Australia, we continue to evaluate exploration potential in line with our strategic priorities. To assist this, we are participating in a regional multi-client 3D seismic survey totalling 10,032 square kilometres. The program is anticipated to be completed by the first half of FY2016.
In Trinidad and Tobago, we completed the acquisition of 21,220 square kilometres of 3D seismic data over Blocks 3, 5, 6, 7, 14, 23a, 23b, 28 and 29 by the end of the March 2015 quarter. Evaluation of this information is ongoing. Regional environmental and geological surveys were also carried out during the year, as part of our ongoing assessment programs.
In South Africa, we hold 100 per cent exploration rights to Block 3B/4B off the west coast of South Africa. In FY2014, we completed the processing of the 10,075 square kilometres of 3D seismic survey that was acquired in FY2013. Evaluation of this information is ongoing.
In Brazil, we are planning to acquire 3D seismic data over our two blocks in the deepwater Foz do Amazonas Basin, to fulfil our minimum work commitment.
In Malaysia, we completed the acquisition of 2,941 square kilometres of 3D seismic survey over Block SK-2A and formally assigned our 60 per cent interest and operatorship in Block N to Total during the June 2015 quarter.
In the Philippines, we finalised the re-assignment of our 75 per cent interest and operatorship to PNOC, completing our exit from the region during the June 2015 quarter.
In India, together with the operator BG, we have notified the government of our intent to exit our remaining 50 per cent interest in one deepwater block acquired during the NELP IX licensing round. We are currently awaiting government approval of our exit of nine operated blocks acquired during the NELP VII and VIII licensing rounds and one non-operated block acquired during the NELP IX licensing round.
In Onshore US, we continue to evaluate opportunities aligned with our strategic priorities, leveraging the expertise gained from our production units.
Drilling
The number of wells in the process of drilling and/or completion as of 30 June 2015 was as follows:
| | | | | | | | | | | | | | | | | | | | | | | | |
| | | Exploratory wells | | | Development wells | | | Total | |
| | | Gross | | | Net (1) | | | Gross | | | Net(1) | | | Gross | | | Net (1) | |
Australia | | | – | | | | – | | | | 5 | | | | 1 | | | | 5 | | | | 1 | |
United States | | | 1 | | | | – | | | | 236 | | | | 108 | | | | 237 | | | | 109 | |
Other | | | – | | | | – | | | | – | | | | – | | | | – | | | | – | |
| | | | | | | | | | | | | | | | | | | | | | | | |
Total | | | 1 | | | | – | | | | 241 | | | | 109 | | | | 242 | | | | 110 | |
| | | | | | | | | | | | | | | | | | | | | | | | |
| (1) | Represents our share of the gross well count. |
Delivery commitments
We have delivery commitments of gas and LNG of approximately 2,180 billion cubic feet through FY2031 (82 per cent Australia and Asia, eight per cent United States and 10 per cent Other), crude and condensate
commitments of 17.3 million barrels through FY2022 (51 per cent United States, 39 per cent Australia and Asia and 10 per cent Other) and LPG commitments of 332,072 metric tonnes through FY2017. We have sufficient proved reserves and production capacity to fulfil these delivery commitments.
We have obligations for contracted capacity on transportation pipelines and gathering systems on which we are the shipper. In FY2016, volume commitments to gather and transport are 1,123 billion cubic feet of gas (97 per cent Onshore US and three per cent Other) and 42.4 million barrels of oil (51 per cent Onshore US and 49 per cent Offshore US). The agreements with the gas gatherers and transporters have annual escalation clauses.
Potash
Our Potash strategy is to build a material industry position over the long term.
We hold exploration permits and mining leases, issued by the Government of Saskatchewan, covering more than 16,000 square kilometres of mineral rights in the province of Saskatchewan in Canada. The Government of Saskatchewan has issued a Potash Lease Special Agreement (KLSA) for the Jansen Potash Project, which provides long-term security of tenure to allow the ongoing development and subsequent operation of Jansen for the life of the operation.
We have progressively explored our permit areas over the past eight years and continue to evaluate their economic development potential. We are converting our exploration permits to long-term mining leases as these permits mature in order to enable further evaluation. To date, we have secured more than 8,000 square kilometres under long-term mining leases.
We continue to progress Jansen, a greenfield potash project, located approximately 140 kilometres east of Saskatoon in south-central Saskatchewan. We believe Jansen is one of the world’s best undeveloped potash resources and is likely to be a low-cost source of supply once fully developed. Investment in Jansen could underpin a potential fifth Business within BHP Billiton, given the opportunity to develop a multi-decade, multi-mine basin in Saskatchewan.
On 20 August 2013, we announced an additional projectsUS$2.6 billion investment in Jansen, bringing total approved spending to US$3.8 billion. This investment is funding the excavation and lining of the Project’s production and service shafts, and the installation of essential surface infrastructure and utilities and was 46 per cent complete as of 30 June 2015.
The level of expenditure on the Project in FY2015 was US$423 million. Shaft excavation is progressing, while the construction workforce camp and service shaft permanent headframe have been completed. Necessary infrastructure work continues to be progressed.
With our investment premised on the attractive longer-term market fundamentals for potash, we will continue to modulate the pace of development. The introduction of one or more minority partners, consistent with our approach for some of our other resource operations, will be considered at the appropriate time.
On the basis of our current projections and subject to Board approval, Jansen is likely to ramp-up production in the decade beginning 2020.
We are continuing to evaluate other areas for which we have exploration permits in the Saskatchewan potash basin, including Young, Boulder, Burr and Melville, through analysis of the extensive data collected from successive exploration programs.
In October 2014, the management of the closed mine sites associated with Base Metals North America was transitioned from the Potash to the Petroleum Business. All locations are in care and maintenance or in various stages of closure.
As at 1 August 2015, management of the project life cycle (including construction)Jansen Potash Project transferred from the Petroleum Business to further increase system capacity (see Development projects below).BHP Billiton’s Chief Commercial Officer.
2.1.2 Copper Business
Our Pilbara reserve baseCopper Business, headquartered in Santiago, Chile, is relatively concentrated, allowing usone of the world’s leading producers of copper concentrate and cathode, uranium oxide, and a producer of zinc concentrate. Our portfolio of mining operations includes the Escondida mine in Chile, a leading producer of copper, and Olympic Dam in South Australia, a major producer of copper and uranium oxide. Our total copper production in FY2015 was 1.7 million tonnes (Mt). Our concentrate production, which represents 60 per cent of total production, results from flotation of sulphide ores mined at our Escondida and Antamina mines. Oxide ores and sulphide ores amenable to planleaching are mined and processed into copper cathode, using conventional heap leaching, followed by solvent extraction and electrowinning processes at Escondida, Cerro Colorado and Spence. Copper cathode is also produced at Olympic Dam, where sulphide ores are processed through conventional flotation and the resulting concentrate is further transformed into cathodes through a smelting and refining process.
We market four primary products: copper cathodes, copper concentrates, zinc concentrates and uranium oxide. We sell our developmentcopper cathode production to wire rod mills, brass mills and casting plants around a series of integrated mining hubs joinedthe world under contracts with prices at premiums to the orebodiesLondon Metal Exchange (LME) or the Commodity Exchange Inc (COMEX) prices. We sell the majority of our uranium oxide to electricity generating utilities, principally in Western Europe, North America and East Asia. Uranium is typically sold under a mix of long-term and short-term contracts. We sell most of our copper and zinc concentrates to smelters located in diversified geographic markets such as China, South America, Japan, India and South Korea. Treatment charges and refining charges (collectively referred to as TCRCs) are negotiated with counterparties on a variety of tenors, trending towards shorter-term, more market-based pricing periods (less than one year). Some of the ores we mine contain quantities of silver and gold, which remain in the base metal concentrates we sell, and are typically subject to payment credits. We sell refined silver and gold from Olympic Dam. Our five operating assets, which are located in South America and Australia, consist of the following:
Americas
Escondida
Our 57.5 per cent owned and operated Escondida mine is a leading producer of copper. Located in the Atacama Desert in northern Chile, Escondida employs approximately 12,000 operational employees and contractors and has the capacity to move in excess of 1.3 Mt of material per day. Its two open-cut pits currently feed three concentrator plants, Laguna Seca, Los Colorados and the recently commissioned Organic Growth Project 1 (OGP1), as well as two leaching operations (oxide and sulphide). The Los Colorados concentrator plant will be placed into care and maintenance once OGP1 ramp-up has been completed as current water source volumes cannot sustain the operation of three concentrators at nominal capacity. Escondida is assessing extending the life of the Los Colorados concentrator plant on the completion of the Escondida Water Supply (EWS) project based on the availability of water and mine stability. All three concentrator plants use grinding and flotation technologies to produce copper concentrate. In FY2015, our share of Escondida production was 526.7 kilotonnes (kt) of payable copper in concentrate and 178.4 kt of copper cathode. Escondida production for FY2016 will be impacted by conveyors or spur lines.an anticipated 27 per cent decline in ore grades. This approach enables uswill be partly offset by increased throughput, enabled by the completion of the OGP1 and operational improvements. The reserve life is discussed in section 2.3.2.
The availability of key inputs like power and water at competitive prices is an important focus for our Copper Business. In November 2013, we awarded a long-term energy agreement to maximisea consortium consisting of Korea Southern Power Co. and Samsung Construction & Trading Corp. for the valuedevelopment, operation and maintenance of installed infrastructure bya 517 megawatt (MW) combined-cycle gas-fired power plant (Kelar power plant) in the town of Mejillones, Chile. The plant, which will be connected to the Northern Interconnected Grid (SING), will supply
the increasing demand for electricity at our operations. Construction work is progressing as planned with (65.4 per cent completed as of 30 June 2015) and production is expected to begin in the October 2017 quarter.
A contract for the supply of natural gas to the Kelar power plant has been secured with Gas Natural Fenosa. First deliveries are scheduled to commence in CY2016, which will tie-in with the commissioning and commercial operation of the Kelar plant.
To address limitations on the availability of water, we desalinate sea water and carefully manage our use and reuse of available water. The EWS project, which involves the construction of a second desalination plant, will reduce our reliance on the region’s aquifers and help meet our environmental commitments. The EWS project is expected to be commissioned in CY2017.
Pampa Norte
Pampa Norte consists of two operations – Spence and Cerro Colorado. Copper cathode is produced at both operations following a leaching, solvent extraction and electrowinning process.
Our wholly owned Spence copper mine is located in the Atacama Desert, 162 kilometres northeast of Antofagasta in Chile. During FY2015, Spence produced 171.4 kt of high-quality copper cathode, using oxide and sulphide ore treatment through leaching, solvent extraction and electrowinning processes. The reserve life is discussed in section 2.3.2.
Our wholly owned Cerro Colorado mine, located in the same processing plantAtacama Desert, 120 kilometres east of Iquique in Chile, remains a significant producer of copper cathode, although production levels have fallen in recent years as grades have declined. Despite this, production in FY2015 reached 78.2 kt of copper cathode. The reserve life is discussed in section 2.3.2. The extension of the existing environmental and rail infrastructuremining licences to continue to enable Cerro Colorado to operate beyond December 2016 is currently pending approval.
Antamina
We own 33.75 per cent of Antamina, a large, low-cost copper and zinc mine in north central Peru. Antamina’s total production for FY2015 was 107.7 kt of copper in concentrate and 66.4 kt of zinc in concentrate. Antamina also produces molybdenum and lead/bismuth concentrate, as well as small amounts of silver in the form ofby-products. The reserve life is discussed in section 2.3.2.
In FY2015, following the identification of a number of orebodies.debottlenecking opportunities, Antamina successfully increased nominal milling capacity to 53 million tonnes per annum (Mtpa).
Australia
Olympic Dam
Our wholly owned Olympic Dam mine is a producer of copper cathode and uranium oxide and a refiner of gold and silver bullion. The site includes an underground mine, where the primary method of ore extraction islong-hole open stoping with cemented aggregate fill, and an integrated metallurgical processing plant.
The underground mine extracts copper uranium ore and hauls the ore by an automated train and trucking network feeding underground crushing, storage and ore hoisting facilities. The processing plant consists of two grinding circuits in which high-quality copper concentrate is extracted from sulphide ore through a flotation extraction process. The operation includes a fully integrated metallurgical complex with a grinding and concentrating circuit, a hydrometallurgical plant incorporating solvent extraction circuits for copper and uranium, a copper smelter, a copper refinery and a recovery circuit for precious metals.
The Svedala mill, which accounts for approximately 60 per cent of Olympic Dam’s production, experienced an electrical failure in January 2015. Repairs were completed by June 2015 and the mill is now operating at full capacity. In FY2015, Olympic Dam produced 124.5 kt of copper cathode, 3.1 kt of uranium oxide,104.8 kilo-ounces (koz) of refined gold and 724 koz of refined silver. The reserve life ofis discussed in section 2.3.2.
Cannington
In May 2015, our Western Australia mines is 17 years.
WAIO Mineral Reserves reported in FY2013 have been changed to a Pilbara basis by ore type, to align with our future strategy for a Pilbara lump product. This also reflects our single logistics chain and associated management system.
Samarco
We are a 50–50 joint venture partner with Vale at the Samarco operation in Brazil. Samarco is currently comprised of aCannington silver-lead-zinc mine and two concentrators, locatedwas included in the Statedemerger of Minas Gerais,South32. Further information can be found in sections 1.3.7, 1.6.4, and three pellet plants2.1.7 and a port, located in the State of Espirito Santo. Two 396-kilometre pipelines connect the mine sitenote 29 ‘Discontinued operations’ to the pelletising facilities.
Samarco’s main product is iron ore pellets. Extraction and beneficiation of iron ore is conducted at the Germano facilities in the municipalities of Mariana and Ouro Preto. Conveyor systems are used to extract the ore and convey it from the mines. Ore beneficiation then occurs in concentrators, where crushing, milling, desliming and flotation processes produce iron concentrate. The concentrate leaves the concentrators as slurry and is pumped through the slurry pipelines from the Germano facilities to the pellet plants in Ubu, where the slurry is processed into pellets. The iron ore pellets are then heat treated.
The pellet output is stored in a stockpile yard before being shipped out of the Samarco owned Port of Ubu in Anchieta. Pellets are independently marketed by Samarco and sold to steelmakers in 25 countries in the Americas, Asia, Africa, the Middle East and Europe, with prices generally linked to market indices.
In FY2013, our share of production was 11 Mt of pellets. The reserve life of Samarco is 40 years.Financial Statements.
Information on Iron OreCopper mining operations
The following table contains additional details of our mining operations. This table should be read in conjunction with the production (see(refer to section 2.3.2)2.2.2) and reserve tables (see(refer to section 2.13.2)2.3.2).
| | | | | | | | | | | | | | | | |
Mine & location | | Means of access | | Ownership | | Operator | | Title, leases or
options
| | History | | Mine type &
mineralisation
style style
| | Power source | | Facilities, use &
condition
|
Iron ore
|
| | | | | | | | |
Mt Newman Joint VentureAmericas | | | | | | | | | | | | | | | | |
Pilbara region, Western Australia
Mt Whaleback
Orebodies 18, 23, 24, 25, 29 and 30
| | Private road
Iron ore transported by Mt Newman JV-owned rail to Port Hedland (427 km)
| | BHP Billiton 85%
Mitsui ITOCHU Iron 10% ITOCHU Minerals and Energy of Australia 5%
| | BHP Billiton:
Mt Whaleback Orebodies 23, 24, 25, 29 and 30
Independent contractors:
Orebody 18
| | Mining lease under the Iron Ore (Mt Newman) Agreement Act 1964 expires 2030 with right to successive renewals of 21 years | | Production began at Mt Whaleback orebody 1969
Production from Orebodies 18, 23, 24, 25, 29 and 30 complements production from Mt Whaleback
First ore from Newman Hub as part of RGP4 construction delivered 2009
| | Open-cut
Bedded ore types classified as per host Archaean or Proterozoic iron formation, which are Brockman, and Marra Mamba
| | Alinta Dewap’s Newman gas-fired power station via Mt Newman JV-owned power lines | | Newman Hub: primary and secondary crushing and screening plants (nominal capacity 60 Mtpa); heavy media beneficiation plant, stockyard blending facility, single cell rotary car dumper, train-loading facility
Orebody 23/25: primary and secondary crushing and screening plant (nominal capacity 10 Mtpa)
|
| | | | | | | | |
Yandi Joint VentureCopper | | | | | | | | | | | | | | | | |
Pilbara region, Western Australia | | | | | | | | |
| Escondida | | | | | | | | | | | | | | | | |
| Atacama Desert, 170 km southeast of Antofagasta, Chile | | PrivatePublic road
Iron oreCopper cathode transported by Mt Newman JV-ownedprivately owned rail to Port Hedland (316 km)ports at Antofagasta and Mejillones
Yandi JV’s railway spur links Yandi mineCopper concentrate transported by Escondida-owned pipelines to Newman main lineits Coloso port facilities
| | BHP Billiton 85%57.5% of Minera Escondida Limitada (MEL) Mitsui Iron OreRio Tinto 30% JECO Corporation 7% ITOCHU Mineralsconsortium comprising Mitsubishi,
JX Nippon Mining and Energy of Australia 8%Metals 10% JECO2 Ltd 2.5% | | BHP Billiton | | Mining lease under the Iron Ore (Marillana Creek) Agreement Act 1991 expires 2033 with one renewal right
concession from
Chilean
Government
valid indefinitely
(subject to a further 21 years
payment of
annual fees) | | Development began 1991Original construction completed in 1990
First shipment 1992Sulphide leach copper production commenced in
Capacity expanded between 1994-20132006
| | Open-cut2 open-cut pits: Escondida and Escondida Norte
Channel Iron DepositsEscondida and Escondida Norte mineral deposits are Cainozoic fluvial sedimentsadjacent but distinct supergene enriched porphyry copper deposits
| | Alinta Dewap’s Newman gas-firedEscondida-owned transmission lines connect to Chile’s northern power station via Mt Newman JV-owned power linesgrid Electricity purchased under contracts expiring 2016 and 2029 | | 3 processingconcentrator plants primary crusherextract copper concentrate from sulphide ore by flotation extraction process 2 solvent extraction plants produce copper cathode Nominal capacity: 153.7 Mtpa (nominal milling capacity) and overland conveyor350 ktpa copper cathode (nominal capacity 75 Mtpa)of tank house) Ore delivered to 2 train-loadingTwo 168 km concentrate pipelines
167 km water pipeline Port facilities at Coloso, Antofagasta |
| | | | | | | | | | | | | | | | |
Mine & location | | Means of access | | Ownership | | Operator | | Title, leases or
options
| | History | | Mine type &
mineralisation
style style
| | Power source | | Facilities, use &
condition
|
JW4 Joint VenturePampa Norte Spence | | | | | | | | | | | | | | | | |
Pilbara region, Western AustraliaAtacama Desert, 162 km northeast of Antofagasta, Chile | | PrivatePublic road
Iron ore on-sold to Yandi JV, thenCopper cathode transported viaby rail to Finucane Islandports at Mejillones and Nelson Point shipping facilities, Port HedlandAntofagasta
| | BHP Billiton 68%
ITOCHU Minerals and Energy of Australia 6.4%, Mitsui Iron Ore Corporation 5.6%,
JFE Steel Australia 20%
Sublease agreement over JW4 deposit
| | BHP Billiton | | Sublease over part of the mining lease under the Iron Ore (Marillana Creek) Agreement Act 1991 expires 2033 with one renewal right for a further 21 years | | Operations began April 2006
Ore currently being produced is sold to Yandi JV and blended with Yandi ore
| | Open-cut
Channel Iron Deposits are Cainozoic fluvial sediments
| | Alinta Dewap’s Newman gas-fired power station via Mt Newman JV- owned power lines | | Mine site |
| | | | | | | | |
Jimblebar Joint Venture | | | | | | | | | | | | | | | | |
Pilbara region, Western Australia | | Private road | | BHP Billiton 100% of the Jimblebar lease at 30 June 2013
BHP Billiton share reduced to 85% on 10 July 2013 following an issue of equity
ITOCHU Minerals and Energy of Australia 8%, Mitsui Iron Ore Corporation 7%
| | BHP Billiton | | Mining lease under the Iron Ore (McCamey’s Monster) Agreement Authorisation Act 1972 expires 2030 with rights
concession from
Chilean
Government
valid indefinitely
(subject to successive renewals
payment of 21 years
annual fees) | | Production at Jimblebar began March 1989Development cost of US$1.1 billion approved in 2004
From 2004, production was transferred to Wheelarra as part of the Wheelarra sublease agreement
New mine under construction is both inside and outside of the Wheelarra subleaseFirst copper produced in 2006
| | Open-cut Bedded ore types classified as per host Archaean or Proterozoic banded iron formation, which are BrockmanEnriched and Marra Mambaoxidised porphyry copper deposit that presents dominantly in situ copper oxide mineralisation that overlies a near-horizontal sequence of supergene sulphide, transitional sulphide, and lower-most primary (hypogene) sulphide mineralisation
| | Alinta Dewap’s Newman gas-firedSpence-owned transmission lines connect to Chile’s northern power station via Mt Newman JV-owned power linesgrid Electricity purchased under contract | | PrimaryProcessing and secondary crusher, ore handlingcrushing facilities, separate dynamic (on-off) leach pads, solvent extraction plant, stockyards and supporting mining hub infrastructure are in the commissioning phase (nominalelectrowinning plant Nominal capacity 35 Mtpa at full capacity in FY2014)of tank house: 179 ktpa copper cathode |
| | | | | | | | | | | | | | | | |
Mine & location | | Means of access | | Ownership | | Operator | | Title, leases or
options
| | History | | Mine type &
mineralisation
style style
| | Power source | | Facilities, use &
condition
|
Wheelarra Joint VenturePampa Norte Cerro Colorado | | | | | | | | | | | | | | | | |
Pilbara region, Western AustraliaAtacama Desert, 120 km east of Iquique, Chile | | PrivatePublic road
Iron ore transported by Mt Newman JV-owned railCopper cathode trucked to Port Hedland via 32 km spur line linking to Newman main lineport at Iquique
| | 100% | | BHP Billiton 51%ITOCHU Minerals and Energy
| | Mining concession
from Chilean
Government valid
indefinitely
(subject to
payment of Australia 4.8% Mitsui Iron Ore Corporation 4.2%Maanshan Iron & Steel Australia 10% Shagang Australia 10% Hebei Iron & Steel Australia 10%
Wugang Australia 10%
Sublease agreement over Wheelarra deposit
annual fees) | | Operated by
independent
contractors
| | Sublease agreement over the Wheelarra deposit of Jimblebar lease with ITOCHU Minerals and Energy of Australia, Mitsui Iron Ore and four separate subsidiaries of Chinese steelmakers
This arrangement, entitles us to 85% ofCommercial production from the Wheelarra sublease consistent with BHP Billiton ownershipcommenced in Mt Newman JV
| | Wheelarra JV produces iron ore from Wheelarra deposit of Jimblebar lease1994
Ore currently being produced is sold to Mt Newman JVExpansions in 1996 and blended with ore produced from Mt Whaleback and satellite Orebodies 18, 23, 24 and 25 to create Mt Newman blend1998
| | Open-cut Bedded ore types classified as per host Archaean or Proterozoic banded iron formation, which is BrockmanEnriched and oxidised porphyry copper deposit that presents dominantly in situ copper oxide mineralisation that overlies a near-horizontal sequence of supergene sulphide, transitional sulphide, and lower-most primary (hypogene) sulphide mineralisation
| | Alinta Dewap’s Newman gas-firedLong-term contracts with northern Chile power station via Mt Newman JV-owned power linesgrid | | Wheelarra: 2 primary, secondary and tertiary crushers, leaching pads, solvent extraction plant, electrowinning plant Nominal capacity of tank house: 102 ktpa copper cathode |
| | | | | | | | |
| Copper and zinc | | | | | | | | | | | | | | | | |
|
| Antamina |
| Andes mountain range, 270 km north of Lima, north central Peru | | Public road Copper and zinc concentrates transported by pipeline to port of Huarmey Molybdenum and lead/bismuth concentrates transported by truck | | BHP Billiton 33.75% of Compañía Minera Antamina SA Glencore 33.75% Teck 22.5% Mitsubishi 10% | | Compañía Minera Antamina SA | | Mining rights
from Peruvian
Government held
indefinitely,
subject to
payment of
annual fees and
supply of
information on
investment and
production | | Commercial production commenced in 2001 Capital cost US$2.3 billion (100%) | | Open-cut Zoned porphyry and skarn deposit with central copper-only ores and an outer band of copper-zinc ore zone | | Long-term contracts with individual power producers | | Primary crushing plant (nominalcrusher, concentrator, copper and zinc flotation circuits, bismuth/moly cleaning circuit Nominal milling capacity 13.9 Mtpa)53 Mtpa 300 km concentrate pipeline Port facilities at Huarmey |
| | | | | | | | | | | | | | | | |
Mine & location | | Means of access | | Ownership | | Operator | | Title, leases or
options
| | History | | Mine type &
mineralisation
style style
| | Power source | | Facilities, use &
condition
|
Mt Goldsworthy Joint VentureAustralia | | | | | | | | | | | | | | | | |
Pilbara region, Western Australia
Area C Yarrie Nimingarra
| | Private road
Yarrie and Nimingarra iron ore transported by Mt Goldsworthy JV-owned rail to Port Hedland (218 km)
Area C iron ore transported by Mt Newman JV-owned rail to Port Hedland (360 km)
Mt Goldsworthy JV railway spur links Area C mine to Yandi railway spur
| | BHP Billiton 85%
Mitsui Iron Ore Corporation 7% ITOCHU Minerals and Energy of Australia 8%
| | BHP Billiton | | 4 mineral leases under the Iron Ore (Mt Goldsworthy) Agreement Act 1964 and the Iron Ore (Goldsworthy – Nimingarra) Agreement Act 1972, expire between 2014 and 2028, with rights to successive renewals of 21 years
A number of smaller mining leases granted under the Mining Act 1978 expire in 2026
| | Operations commenced Mt Goldsworthy 1966, at Shay Gap 1973
Original Goldsworthy mine closed 1982
Associated Shay Gap mine closed 1993
Mining at Nimingarra mine ceased 2007, has since continued from adjacent Yarrie area
Opened Area C mine 2003
| | Area C, Yarrie and Nimingarra all open-cut
Bedded ore types classified as per host Archaean or Proterozoic iron formation, which are Brockman, Marra Mamba and Nimingarra
| | Yarrie and Nimingarra: Alinta Dewap’s Port Hedland gas-fired power station under long-term contracts
Area C: Alinta Dewap’s Newman gas-fired power station under long-term contracts
| | Area C: ore processing plant, primary crusher and overland conveyor (nominal capacity: 50 Mtpa)
Yarrie: mobile in-pit crushing plant (nominal capacity: 2 Mtpa)
Primary crushers at Yarrie and Nimingarra in care and maintenance
|
| | | | | | | | |
POSMAC Joint VentureCopper and uranium | | | | | | | | | | | | | | | | |
Pilbara Region, Western Australia | | Private road
Iron ore on-sold to Mt Goldsworthy JV, it is then transported via Mt Goldsworthy JV-owned rail and Mt Newman JV-owned rail to Port Hedland
| | BHP Billiton 65%
ITOCHU Minerals and Energy of Australia 8%, Mitsui Iron Ore Corporation 7%,
POSCO 20%
Sublease agreement over POSMAC deposit
| | BHP Billiton | | Sublease over part of mineral lease held by Mt Goldsworthy JV under the Iron Ore (Mt Goldsworthy) Agreement Act 1964 with rights to successive renewals of 21 years | | Operations commenced October 2003
Iron ore currently being produced is sold to Mt Goldsworthy JV and blended with Area C ore
| | Open-cut
Bedded ore types classified as per host Archaean or Proterozoic iron formation, which are Brockman and Marra Mamba
| | Alinta Dewap’s Newman gas-fired power station under long-term contracts | | Mine site |
| | | | | | | | | | | | | | | | |
Mine & location
| | Means of
access
| | Ownership
| | Operator
| | Title, leases or
options
| | History
| | Mine type &
mineralisation
style
| | Power
source
| | Facilities, use &
condition
Olympic Dam |
Samarco | | | | | | | | | | | | | | | | |
Southeast Brazil560 km northwest of Adelaide, South Australia | | Public road Conveyor belts transport iron oreCopper cathode trucked to beneficiation plantports
Two slurry pipelines transport concentrateUranium oxide transported by road to pellet plants on coastports
| | 100% | | BHP Billiton | | Mining lease
granted by South
Australian
Government
expires in 2036 Iron pellets exported via port facilitiesRight of
extension for
50 years (subject
to remaining
mine life)
| | BHP Billiton 50%Acquired in 2005 as part of Samarco Mineração SAWMC acquisition
Vale 50%
| | Samarco | | Mining concessions granted by Brazilian Government as long as Alegria complex mined according to agreed plan | | ProductionCopper production began at Germano mine 1977, at Alegria complex 1992in 1988
Two expansions completed with a second pellet plant built 1997 and a third pellet plant, second concentrator and second pipeline built 2008Nominal milling capacity raised to 9 Mtpa in 1999
In April 2011, Samarco’s shareholders approved the fourth pelletOptimisation project completed in 2002
New copper solvent extraction plant commissioned in 2004 | | Open-cutUnderground
Itabirites (metamorphic quartz-hematite rock) and friable hematite oresLarge poly-metallic deposit of iron oxide-copper-uranium-gold mineralisation
| | Samarco holds interests in 2 hydroelectricSupplied via 275 kV power plants which supply 20.3% of its electricityline from Port Augusta, transmitted by ElectraNet
| | Underground automated train and trucking network feeding crushing, storage and ore hoisting facilities Power supply contract with Cemig Geração e Transmissão expires 20222 grinding circuits
| | Facilities with capacityNominal milling capacity: 10.3 Mtpa Flash furnace produces copper anodes, then refined to processproduce copper cathodes Electrowon copper cathode and pump 24 Mtpa oreuranium oxide concentrate produced by leaching and produce and ship 22.3 Mtpa pellets (100% basis)solvent extracting flotation tailings |
Development projects
Western Australia Iron OreAmericas
In March 2011, we announced approval of anEscondida
The Organic Growth Project 1 (OGP1) is a new concentrator with a 152 kilotonnes per day (ktpd) plant. We expect this project to provide additional US$7.4 billion (BHP Billiton share US$6.6 billion) of capitalprocessing capacity and allow access to high-grade ore. OGP1 was approved in February 2012 with budgeted expenditure to continue production growth in our WAIO operations. This investment is the final approval of projects initiated in 2010, with pre-commitment funding of US$2.33.8 billion (BHP(US$2.2 billion BHP Billiton shareshare). A US$2.1 billion). It361 million increase in the budget of OGP1 to US$4.2 billion (US$ 2.4 billion BHP Billiton share) was approved in October 2014 following challenges associated with contractor’s progress. The Project was completed in May 2015 and is currently in the commissioning and ramp-up phase.
The Escondida Water Supply (EWS) project was approved in July 2013 and consists of a new 2,500 litres per second sea water desalination facility. This project will provide an alternative water supply to Escondida, as water usage increases upon completion of the 152 ktpd OGP1 copper concentrator. Construction of the new desalination facility commenced in July 2013 and includes the development of two pipelines, four high-pressure pump stations, a reservoir at the mine site and high-voltage infrastructure to support the system. The new facility is expected to deliver an integrated operation withbe commissioned in CY2017 at a minimum capacitycost of 220 Mtpa (100 per cent basis), with first production expected from Jimblebar in the December 2013 quarter.
This additional investment includes:
US$3.4 billion (BHP Billiton share US$3.3 billion) Jimblebar Mine Expansion project to develop the Jimblebar mine and rail links, and procure mining equipment and rolling stock to deliver an initial capacity of 35 Mtpa, expandable to 55 Mtpa. Work on this project is on schedule for first production in the December 2013 quarter and will broadly match mine and port capacity at 220 Mtpa (100 per cent basis). The overall project was 89 per cent complete at 30 June 2013. The original investment amount has been increased by US$354 million (BHP Billiton share US$340 million) as a result of appreciation of the Australian dollar against the United States dollar. In addition, as a result of the issue of equity by a(US$2.0 billion BHP Billiton subsidiary on 10 July 2013, BHP Billiton share has reduced to US$3.2 billion;
share).US$2.3 billion (BHP Billiton share US$1.9 billion) to further develop Port Hedland, including two additional berthsThe Oxide Leach Area Project (OLAP) was completed in November 2014 and ship loaders, a car dumper, connecting conveyor routes, and associated rail works and rolling stock.now in production. The first production was achieved followingProject involved the commissioning of the fifth car dumper at Finucane Island in the December 2012 quarter. The car dumper is the last major piece of infrastructure required to increase the port capacity from the December 2012 quarter annualised rate of 188 Mtpa to 220 Mtpa (100 per cent basis). Work on this project was 92 per cent complete at 30 June 2013;
US$1.7 billion (BHP Billiton share US$1.4 billion) for port blending facilities and rail yards to enable ore blending, expand resource life and prepare for the anticipated growth of the business beyond the Inner Harbour. In FY2013, a decision was made to prioritise capital efficient growth in the Inner Harbour. This resulted in the construction of port blending and rail yard facilities at the South Stockyard being taken out of scope and reduced the project spend by US$470 million (BHP Billiton share US$400 million). Work on this project is on schedule and budget. The overall project was 86 per cent complete at 30 June 2013.
Port Hedland Harbour Strategy
In February 2012, we announced approval of US$917 million (BHP Billiton share US$779 million) in pre-commitment funding for the construction of an Outer Harbour facility associated with our WAIO operations.
On 24 August 2012, we announced that Western Australia’s Minister for Transport and the Port Hedland Port Authority had granted WAIO the right to develop two additional berths in the Inner Harbour, subject to the state approvals processes. On 20 February 2013, we announced a decision to defer the Outer Harbour development beyond the five-year planning horizon as our focus has shifted to maximising our potential capacity from the Inner Harbour and capitalising on infrastructure from previous investment.
Western Australia Iron Ore – Orebody 24 mine
In November 2011, we announced approvalcreation of a US$822 million (BHP Billiton share US$698 million) investment for the development of the Orebody 24 mine, located approximately 10 kilometres northeast of Newman, Western Australia. Orebody 24 is a sustaining mine to maintain iron ore production output from the Mt Newman JV operations. Orebody 24new dynamic leaching pad and mineral handling system that included several overland conveyors. The new pad is expected to havemaintain oxide leaching capacity at current levels. OLAP was approved in February 2012 with budgeted expenditure of US$721 million (US$414 million BHP Billiton share) and a capacity of 17 Mtpa and will include the construction of an ore crushing plant, train loadout facility, rail spur and other associated support facilities. First production was achievedUS$212 million increase in the December 2012 quarterbudget of OLAP to US$933 million (US$536 million BHP Billiton share) was approved in March 2014. Expected final cost is US$899 million (US$517 million BHP Billiton share).
Pampa Norte
The Spence Growth Option (SGO) project, currently at pre-feasibility phase, endeavours to maximise Spence’s value by exploiting the large and expandable hypogene resource with associated molybdenum sulphide by building a 95 ktpd concentrator. This would increase the mine life by approximately 50 years beyond the current FY2025 closure date. The proposed investment is approximately US$3.2 billion and the project is scheduled to commence at the end of the November 2019 quarter. The hypogene ore underlies the supergene reserves currently being exploited and therefore eliminates the need for pre-stripping and additional mine maintenance infrastructure. The option to maximise the use of existing heap leach infrastructure, to recover copper from the lower-grade chalcopyrite ores, is being developed as a complementary process to the concentrator (CPY leach project). The implementation of both the SGO and CPY leach projects will enable Spence to achieve a total copper production of approximately 260 kt on average during the first 10 years of operation.
Olympic Dam
The focus at Olympic Dam is to transform the existing operation to materially lower the cost of production safely and sustainably. We are progressing a pre-feasibility study to examine potential future optimisation and expansion opportunities.
During FY2015, we received approval from the Australian and South Australian Governments to construct a site-based heap leaching demonstration plant, as part of our efforts to identify an alternative, less capital-intensive process for extracting metals from ore mined underground. Construction of the demonstration plant is subject to ongoing, off-site demonstration and test work on the overall project was 88 per cent complete at 30 June 2013.outcomes and Board approvals.
Samarco
During FY2011, Samarco shareholders approved a US$3.5 billion (BHP Billiton share US$1.75 billion) expansion project consisting of a fourth pellet plant, a new concentrator and a third slurry pipeline. The Fourth Pellet Plant Project (P4P) is expected to expand Samarco’s iron ore pellet production capacity from 22.3 Mtpa to 30.5 Mtpa. First pellet production is expected in the first half of CY2014. The project was 90 per cent complete as at 30 June 2013.
Exploration activities
Western Australia
WAIO has a substantial existing reserve base supported by considerable additional mineralisation all within a 250-kilometre radius of our existing infrastructure. This concentration of orebodies also gives WAIO the flexibility to add growth tonnes to existing hub infrastructure and link Greenfield developments to our existing mainline rail and port facilities. The total area covered by exploration and mining tenure amounts to 5,308 square kilometres. This excludes miscellaneous and general purpose licences, which are used for infrastructure space and access.
The majority of deposits are located on five main lease areas held by BHP Billiton and our joint venture partners, as appropriate. Iron ore mineralised materials fall mainly within the Hamersley Ranges of the Pilbara district, with a minor component of the inventory lying within the Pilbara Craton of northwest Western Australia.
There are four main material types for the deposits:
Brockman Iron Formation;
Marra Mamba Iron;
Channel Iron Deposits;
Nimingarra Iron Formation.
In FY2013, exploration activity was completed over multiple project areas and deposits. The total drilling carried out amounts to 453,000 metres composed of RC (reverse circulation) of 392,000 metres, DD (diamond drilling) of 43,000 metres and Hyd (hydrology drilling) of 18,000 metres consisting of approximately 4,000 drill holes. Total exploration expenditure amounted to US$214 million.
Guinea Iron Ore
BHP Billiton currently has a 41.3 per cent interest in a joint venture that holds the Nimba Mining Concession and four iron ore prospecting permits in southeast Guinea. The joint venture is continuing to undertake a pre-feasibility study
On 29 July 2014, BHP Billiton and ArcelorMittal signed an agreement for the developmentacquisition by ArcelorMittal of BHP Billiton’s 43.5 per cent stake in Euronimba Limited, which holds an effective 95 per cent interest in the Concession and associated transport infrastructure.Mount Nimba iron ore project in Guinea. In May 2015, ArcelorMittal terminated the transaction following failure to meet the conditions to closing by the agreed deadline. We will continue to assess our options for the Mount Nimba iron ore project.
Liberia Iron Ore
BHP Billiton currently has a 100 per cent interest in a Mineral Development Agreement with the Government of Liberia. This enables the further exploration and development of our Liberian iron ore mineral leases. Exploration
On 25 August 2014, BHP Billiton and developmentCavalla Resources signed a sale and purchase agreement for the acquisition by Cavalla Resources of these leases continues,BHP Billiton’s 100 per cent interest in its Liberia iron ore project. Completion of the transaction remains subject to the receipt of regulatory approval and other customary closing conditions.
Performance
Total iron ore production, including our proportional share of production for which profit is derived from our equity accounted investments, increased by 14 per cent in FY2015 to a record 233 Mt. WAIO production increased by 13 per cent to a record 254 Mt (100 per cent basis) as a result of continued improvement in the performance of our integrated supply chain and the successful ramp-up of the Jimblebar mining hub. Continued optimisation of the port facilities and an increase in direct to ship ore resulted in record sales volumes at WAIO of 256 Mt (100 per cent basis). Samarco production increased by 33 per cent to 29 Mt (100 per cent basis) as the fourth pellet plant ramped up to full capacity.
Iron Ore revenue decreased by US$6.6 billion to US$14.8 billion, which included a 31 per cent decrease in revenue for WAIO of US$6.4 billion to US$14.4 billion. The major contributor to this decline was a 41 per cent decline in average realised price of iron ore to US$61 per wet metric tonne (FOB), which was partially offset by an increase in WAIO sales volumes.
Underlying EBIT for FY2015 decreased by US$5.2 billion to US$6.9 billion. The fall in the average realised price of iron ore reduced Underlying EBIT by US$8.7 billion, net of price-linked costs, although this was partially offset by a weaker Australian dollar, which increased Underlying EBIT by US$499 million. The improved performance of our integrated supply chain at WAIO and the successful ramp-up of the Jimblebar mining hub supported an increase of US$1.9 billion volume impact to Underlying EBIT. Cost efficiencies from productivity initiatives increased Underlying EBIT by US$1.2 billion.
Unit cash costs is one of the financial measures used to monitor the performance of our individual assets.
WAIO unit cash costs (excluding freight and royalties) declined by 31 per cent to US$19 per tonne, underpinned by reductions in labour, contractor and maintenance costs, lower diesel prices and a stronger US dollar against the Australian dollar.
Outlook
Total iron ore production is forecast to increase by six per cent in FY2016 to 247 Mt. WAIO production is forecast to increase to approximately 270 Mt (100 per cent basis) as a result of improved efficiency at Mining Area C, Newman and our rail and port operations.
Further productivity improvements and the low-cost expansion of the Jimblebar mining hub, which comprises the installation of a new primary crusher and additional conveying capacity, are expected to deliver an increase in system capacity to 290 Mtpa (100 per cent basis) over time.
Costs associated with drilling conducted on select targets.the Jimblebar expansion, as well as the investment to purchase additional tugs and construct a new tug harbour at Port Hedland, are expected to be included within WAIO’s average sustaining capital expenditure budget of approximately US$5 per tonne. WAIO unit costs are expected to fall to US$15 per tonne in FY2016.
2.2.41.12.5 Coal Business
Metallurgical Coal
Our Coal Business, headquartered in Brisbane, Australia, is the world’s largest supplier of seaborne metallurgical coal. Metallurgical coal, along with iron ore and manganese, is a key input in steel production. Our Coal Business is also a large supplier of seaborne energy coal (also known as thermal or steaming coal) and a domestic energy coal supplier in the productioncountries where our mines are located.
Results
| | | | | | | | | | | | |
Year ended 30 June (1) | | 2015
US$M | | | 2014
US$M
Restated | | | 2013
US$M
Restated | |
| | | |
Revenue | | | 5,885 | | | | 6,563 | | | | 6,574 | |
Underlying EBIT | | | 348 | | | | 575 | | | | 424 | |
Capital expenditure | | | 729 | | | | 1,971 | | | | 3,136 | |
Net operating assets | | | 11,769 | | | | 11,909 | | | | 10,632 | |
Production – metallurgical coal (Mt) | | | 43 | | | | 38 | | | | 30 | |
Production – energy coal (Mt) | | | 41 | | | | 43 | | | | 41 | |
| (1) | Information included in this table excludes Energy Coal South Africa and Illawarra Coal given they formed part of the South32 demerger. The numbers for FY2013 and FY2014 have been restated to exclude Energy Coal South Africa and Illawarra Coal. |
A summary of steel. Total Metallurgicalthe assets, development projects and FY2015 performance of our Coal production in FY2013 was 37.7 Mt.
Business is presented as follows.Description of the Coal Business
MetallurgicalOur assets comprise the following:
Queensland Coal (Australia)
Queensland Coal comprises the BHP Billiton Mitsubishi Alliance (BMA) and BHP Billiton Mitsui Coal (BMC) Assets in the Bowen Basin in Central Queensland, Australia, and the Illawarra Coal Asset in the Illawarra region of New South Wales, Australia.
The Bowen Basin is well positioned to supply the seaborne market because of its high-quality metallurgical coals, which are ideally suited to efficient blast furnace operations, and its geographical proximity to Asian customers. We also have access to key infrastructure in the Bowen Basin, including a modern, integrated electricmulti-user rail network, and our own coal loading terminal at Hay Point, located near the city of Mackay. We also have contracted capacity at three other multi-user port facilities, including the Port of Gladstone (RG Tanna Coal Terminal), Dalrymple Bay Coal Terminal and Abbot Point Coal Terminal.
The Hay Point terminal currently consists
Map of coal inloading dump stations, stacker reclaimersQueensland Coal
BHP Billiton Mitsubishi Alliance – BMA owns and two ship loaders, capable of loading 44 Mtpa of coal. The terminal is currently undergoing expansion to increase its capacity to 55 Mtpa through the addition of a third shiploader. This infrastructure enables us to maximise throughput and blending of products from multiple mines of BMA and BMC, to optimise the value of our production and to satisfy customer requirements.
Our Metallurgical Coal Assets are comprised of bothoperates open-cut and underground mines. At our open-cutmetallurgical coal mines overburden is removed after blasting using either draglines or truckin the Bowen Basin, and shovel.also owns and operates the Hay Point Coal is then extracted using excavators or loaders and loaded onto trucks to be taken to stockpiles. At our underground mines, coal is extracted by either longwall or continuous miner. The coal is then transported to the surface by conveyor to stockpiles. Coal from stockpiles is then crushed, washed and processed through the coal preparation plant. Export coal is transported to the port via trucks or trains. The majority of sales to domestic customers are transported by truck.
Our export customers are steel producers around the world, principally in China, India, Japan and Europe. In FY2013, the majority of our contracts were based on annual or longer-term volumes, with prices largely negotiated on a monthly, quarterly or spot basis.
Our Metallurgical Coal Assets are:
BHP Billiton Mitsubishi Alliance
BMA comprises two unincorporated joint ventures – Central Queensland Coal Associates Joint Venture (CQCA) and Gregory Joint Venture.Terminal. We share 50–50 ownership with Mitsubishi Development.
BMA operates the Goonyella Riverside, Broadmeadow, Daunia, Caval Ridge, Peak Downs, Saraji, Norwich Park (production ceased), Blackwater, Broadmeadow, Daunia and Gregory Crinum (open-cut production ceased) mines, together with the Hay Point Coal terminal. In May 2012, production ceased at Norwich Park mine indefinitely, following a review of the mine’s viability. In October 2012, production also ceased at Gregory open-cut mine, part of the Gregory Crinum complex. Production commenced at Daunia in March 2013.
and Blackwater mines. Our share of total production in FY2013FY2015 was 22.633.9 Mt. Production figures forDuring FY2015, BMA include some energy coal (less than two per cent). The reserve livesannounced the ramping down of our mines range from three years at Gregorythe Crinum to 39 years at Saraji. Theunderground mine as it approaches the end of its economic reserve life, for each mine is set outwith longwall production expected to cease in section 2.13.2.the March 2016 quarter.
BHP Billiton Mitsui Coal
–BMC is a subsidiary company owned by BHP Billiton (80 per cent) and Mitsui and Co (20 per cent). BMC owns and operates South Walker Creek and Poitrel, mines.
The reserve lives of ourboth open-cut metallurgical coal mines are 13 years at Poitrel and 21 years at South Walker Creek.in the Bowen Basin. Total production in FY2013FY2015 was 7.18.7 Mt.
New Mexico Coal (United States)
We own and operate the San Juan energy coal mine located in the US state of New Mexico. The mine transports its production directly to the nearby San Juan Generating Station (SJGS). Production for FY2015 was 5.1 Mt.
To ensure the ongoing supply of coal to the SJGS beyond 2017, in May 2015, the SJGS owners reached an in principle agreement for a new Coal Supply Agreement with Westmoreland Coal Company. In conjunction with this, in July 2015, New Mexico Coal executed a sales agreement with Westmoreland for the purchase of the San Juan Mine. Subject to regulatory approval, the transaction is expected to be completed at the end of CY2015 with Westmoreland assuming full operation of the mine from 1 January 2016.
We also operate the nearby Navajo mine, located on Navajo Nation land in New Mexico. Full ownership of the Navajo Coal Company transferred to the Navajo Transitional Energy Company (NTEC), an entity of the Navajo Nation, effective 30 December 2013. New Mexico Coal and NTEC have entered into a Mine Management Agreement where New Mexico Coal will continue as mine operator until 31 December 2016, at which time
Illawarracontrol will pass to a new mine manager. Navajo mine transports its production directly to the nearby Four Corners Power Plant. Production for FY2015 was 4.9 Mt. As we retain control of the mine until full consideration is paid, production continues to be reported by the Group.
New South Wales Energy Coal (Australia)
IllawarraOur wholly owned New South Wales Energy Coal Asset owns and operates three undergroundthe Mt Arthur Coal open-cut energy coal mines, these being Appin, West Cliff and Dendrobium,mine in the IllawarraHunter Valley region of New South Wales, Australia,Australia.
New South Wales Energy Coal produced 19.7 Mt in FY2015.
Cerrejón (Colombia)
We have a one-third interest in Cerrejón, which supply metallurgicalowns, operates and markets one of the world’s largest open-cut export energy coal tomines, located in the nearby BlueScope Port Kembla steelworks,La Guajira province of Colombia.
In FY2015, our share of Cerrejón production was approximately 11.3 Mt.
More information on our assets and other domestic and export markets. Coaloperations is exported via Port Kembla Coal terminal, in which we own a 16.67 per cent share. Total production in FY2013 was 7.9 Mt. The reserve lives of our mines range from three years at West Cliff to 26 years at Appin. The reserve life for each mine is set outpresented in section 2.13.2.2.1.4 of this Annual Report.
Production figures for Illawarra Coal include some energy coal (less than 17 per cent).
Information on Metallurgical Coal mining operations
The following table contains additional details of our mining operations. The tables should be read in conjunction with the production (see section 2.3.2) and reserves tables (see section 2.13.2).
| | | | | | | | | | | | | | | | |
Mine & location
| | Means of
access
| | Ownership
| | Operator
| | Title, leases or
options
| | History
| | Mine type &
mineralisation
style
| | Power
source
| | Facilities, use &
condition
|
Metallurgical coal | | | | | | | | | | | | | | |
| | | | | | | | |
Central Queensland Coal Associates (CQCA) Joint Venture | | | | | | | | | | | | | | | | |
Bowen Basin, Queensland, Australia
Goonyella Riverside, Peak Downs, Saraji, Norwich Park, Blackwater, Broadmeadow and Daunia mines
| | Public road
Coal transported by rail to Hay Point and Gladstone ports
Distances between the mines and port are between 160 km and 315 km
| | BHP Billiton 50%
Mitsubishi Development 50%
| | BMA | | Mining leases, including undeveloped tenements, expire between 2014–2043, renewable for further periods as Queensland Government legislation allows
Mining is permitted to continue under the legislation during the renewal application period
| | Goonyella mine commenced 1971, merged with adjoining Riverside mine 1989 Operates as Goonyella Riverside
Production commenced:
Peak Downs 1972 Saraji 1974 Norwich Park 1979
Blackwater 1967
Broadmeadow (longwall operations) 2005
Daunia 2013
| | All open-cut except Broadmeadow: longwall underground
Bituminous coal is mined from the Permian Moranbah and Rangal Coal measures
Products range from premium quality, low volatile, high vitrinite, hard coking coal to medium volatile hard coking coal, to weak coking coal, some pulverised coal injection (PCI) coal and medium ash thermal coal as a secondary product
| | Queensland electricity grid | | On-site beneficiation processing facilities
Combined nominal capacity: in excess of 58 Mtpa following first coal from Daunia
Hay Point Coal terminal
|
| | | | | | | | | | | | | | | | |
Mine & location
| | Means of
access
| | Ownership
| | Operator
| | Title, leases or
options
| | History
| | Mine type &
mineralisation
style
| | Power
source
| | Facilities, use &
condition
|
Gregory Joint Venture | | | | | | | | | | | | | | | | |
Bowen Basin, Queensland, Australia
Gregory and Crinum mines
| | Public road
Coal transported by rail to Hay Point and Gladstone ports
Distances between the mines and port are between 310 km and 370 km
| | BHP Billiton 50%
Mitsubishi Development 50%
| | BMA | | Mining leases including undeveloped tenements, expire between 2014–2027, renewable for further periods as Queensland Government legislation allows | | Production commenced:
Gregory 1979
Crinum mine (longwall) 1997
Production at Gregory open-cut mine ceased October 2012
| | Gregory: open-cut
Crinum: longwall underground
Bituminous coal is mined from the Permian German Creek Coal measures
Product is a high volatile, low ash hard coking coal
| | Queensland electricity grid | | On-site beneficiation processing facility
Nominal capacity: in excess of 5 Mtpa
|
| | | | | | | | |
BHP Billiton Mitsui Coal | | | | | | | | | | | | | | | | |
Bowen Basin, Queensland, Australia
South Walker Creek and Poitrel mines
| | Public road
Coal transported by rail to Hay Point port
Distances between the mines and port are between 135 km and 165 km
| | BHP Billiton 80%
Mitsui and Co 20%
| | BMC | | Mining leases, including undeveloped tenements expire between 2014–2031, and are renewable for further periods as Queensland Government legislation allows | | South Walker Creek commenced 1996
Poitrel commenced 2006
| | Open-cut
Bituminous coal is mined from the Permian Rangal Coal measures
Produces a range of coking coal, PCI coal and thermal coal products with medium to high phosphorus and ash properties
| | Queensland electricity grid | | South Walker Creek coal beneficiated on-site
Nominal capacity: in excess of 4 Mtpa
Poitrel mine has Red Mountain joint venture with adjacent Millennium Coal mine to share processing and rail loading facilities
Nominal capacity: 3 Mtpa
|
| | | | | | | | | | | | | | | | |
Mine & location
| | Means of
access
| | Ownership
| | Operator
| | Title, leases or
options
| | History
| | Mine type &
mineralisation
style
| | Power
source
| | Facilities, use &
condition
|
Illawarra Coal
| | | | | | | | | | | | | | |
Illawarra, New South Wales, Australia
Dendrobium, Appin and West Cliff mines
| | Public road
Coal transported by road or rail to BlueScope Steel’s Port Kembla steelworks or Port Kembla for export
Distances between the mines and port are between 5 km and 55 km
| | 100% | | BHP Billiton | | Mining leases expire between 2016–2033, renewable for further periods as NSW Government legislation allows | | Production commenced:
Appin 1962 (longwall operations 1969)
West Cliff 1976
Dendrobium 2005
| | Underground
Bituminous coal is mined from the Permian Illawarra Coal Measures
Produces premium-quality hard coking coal and some thermal coal from the Wongawilli and Bulli seams
| | New South Wales electricity grid | | 2 beneficiation facilities
Nominal capacity: in excess of 9 Mtpa
|
DevelopmentCompleted development projects
BMA ExpansionsCerrejón P40 Project
In NovemberAugust 2011, approval was given for the development of the Caval Ridge mine project and expansion of the Peak Downs mine in the Bowen Basin in Central Queensland, Australia, with an investment ofwe announced a US$2.1 billion437 million (BHP Billiton share). The Caval Ridge mine will be an open-cut dragline and truck and shovel operation, with investment in the expansion of Cerrejón, known as the P40 Project, which is expected to increase Cerrejón’s thermal coal railedproduction by 8 Mtpa to the BMA Hay Point Coal terminal.
In response to the challenging environment, we have chosen to delay indefinitely the 2.5approximately 40 Mtpa (100 per cent basis) expansion of Peak Downs that is. The project scope includes a second berth and dual quadrant ship loader at Cerrejón’s 100 per cent owned and operated Puerto Bolivar, along with necessary mine, rail and associated withsupply chain infrastructure. Construction commenced in CY2011 and the Caval Ridge mine development. The revised investment is US$1.9 billion (BHP Billiton share) forproject handled its first coal in the Caval Ridge mine project. The 5.5December 2013 quarter. However, operational issues are expected to constrain capacity to approximately 35 Mtpa capacity (100 per cent basis) Caval Ridge minein the medium term. The final cost was 71 per cent completeUS$376 million (BHP Billiton share) and the project was completed during the December 2014 quarter.
Development projects in execution at 30 June 2013 and remains on schedule to deliver first production in CY2014.year-end
Hay Point Coal Terminal Expansion Stage 3
In March 2011, approval was given for three key metallurgical coal projects located inwe approved the Bowen Basin, with a total investment of US$2.5 billion (BHP Billiton share). These projects have contributed 4.9 Mt of annual mine capacity (100 per cent basis) through development of the Daunia mine and a new mining area at Broadmeadow, known as the Broadmeadow Life Extension project. The third project is the expansion of the BMA Hay Point Coal Terminal. The expansion of the terminal deliveringwill deliver an additional 11 Mt of annual port capacity (100 per cent basis).
The new mining area at Broadmeadow was completed in FY2013 withproject investment has a budget of US$1.5 billion (BHP Billiton share). In January 2015, first coal in March 2013. First coal from Daunia mine also occurred in March 2013was loaded through the expanded terminal and the project was 9797.6 per cent complete at 30 June 2013. The project was completed in the September quarter of CY2013. First shipment from the expanded Hay Point Coal terminal was expected in CY2014; however,2015.
Newcastle Port Third Phase Expansion
In August 2011, we announced a review of both schedule and budget was undertaken during FY2013. The investment has now been revised from US$1.25 billion to US$1.5 billion367 million (BHP Billiton share) and first shipmentinvestment in the third stage development of the Newcastle Coal Infrastructure Group’s coal handling facility in Newcastle. The port expansion project is now expected in CY2015. The project wasto increase total capacity at the coal terminal from 53 Mtpa to 66 per cent complete at 30 June 2013.
Appin Area 9 Project
In June 2012, approval was givenMtpa. This is expected to invest US$845 million to sustain operations at Illawarra Coal, in southernincrease New South Wales Australia,Energy Coal’s allocation by establishing a replacement mining area at Appin mine. The replacement area will have a production capacity4.6 Mtpa to 19.2 Mtpa. First coal on ship, being the first ship loaded through the new facility, was achieved in June 2013, ahead of 3.5 Mtpa and will sustain Illawarra Coal’s production capacity at 9 Mtpa. The Appin Area 9schedule. At 30 June 2015, the project was 4499.5 per cent complete at 30 June 2013 and is expected to be operational in CY2016, whereupon it will replace production at the West Cliff mine. The project includes roadway development, new ventilation infrastructure, new and reconfigured conveyors and other mine services.complete.
IndoMet Coal Project
IndoMet Coal comprises seven coal contracts of work (CCoWs) covering a large metallurgical coal resource in Central and East Kalimantan, Indonesia, which was discovered by BHP Billiton in the 1990s. Following an assessment of the importance of local participation in developing the project, in FY2010,2010 we sold a 25 per cent interest in the project to a subsidiary of PT Adaro Energy TBK. We retain 75 per cent of the project and hold management responsibility.
Early work onDuring FY2015, IndoMet completed infrastructure development and received an operating permit to commence mining at Haju mine. Production is expected to commence from the 1 Mtpa Haju mine in Indonesia during FY2016.
More information on our development projects is presented in section 2.4 of this Annual Report.
Performance
Metallurgical coal production increased by 13 per cent in FY2015 to a record 43 Mt. Record production and sales volumes at Queensland Coal were supported by the successful ramp-up of the Caval Ridge mine and continued productivity improvements. An increase in equipment and wash-plant utilisation rates underpinned record volumes at six other operations.
Energy coal production, including our proportional share of production for which profit is derived from our equity accounted investments, for FY2015 decreased by five per cent to 41 Mt as anticipated. Lower production reflected drought conditions and the need to manage dust emissions at Cerrejón, as well as reduced demand for our Navajo Coal product.
Coal revenue for FY2015 decreased by US$678 million to US$5.9 billion. The decrease in revenues was driven by a 20 per cent reduction in the average realised price for hard coking coal to US$105/t, a 21 per cent reduction in the average price received for weak coking coal to US$88/t and a 22 per cent reduction in the average realised price for thermal coal to US$58/t.
Underlying EBIT for FY2015 decreased by US$227 million to US$348 million. The price impact, net of price-linked costs, on Underlying EBIT for FY2015 was a decrease of US$1.0 billion. This was partially offset by a stronger US dollar against the Australian dollar, which increased Underlying EBIT by US$406 million, and productivity cost efficiencies which increased Underlying EBIT by US$418 million.
Unit cash costs is one of the financial measures used to monitor the performance of our individual assets.
Queensland Coal unit cash costs (excluding freight and royalties) declined by 23 per cent to US$65 per tonne, supported by increased equipment and wash-plant utilisation rates, a continued reduction in labour, contractor and maintenance costs and a favourable currency movement.
Outlook
Metallurgical coal production is forecast to decrease in FY2016 to 40 Mt as operations at Crinum are expected to cease in the first quarter of CY2016 as the mine approaches the end of its economic reserve life. Energy coal production is forecast to remain broadly unchanged in FY2016 at 40 Mt.
In FY2016, unit costs are expected to decline to US$61 per tonne as the benefits from embedded productivity initiatives and a stronger US dollar, more than offset the removal of low-cost Crinum volumes and the expenses associated with its closure.
1.12.6 Other assets
Our Other assets include the following:
Nickel West (Australia)
Our wholly owned Nickel West Asset in Western Australia consists of an integrated system of mines, concentrators, a smelter and a refinery. Nickel West production in FY2015 was 89.9 kt of contained nickel. On 31 October 2013, production at the Nickel West Leinster Perseverance underground mine was suspended following a significant seismic event. A subsequent review of the incident determined it was unsafe to resume operations.
Performance
Revenue for Nickel West decreased by 13 per cent to US$1.4 billion predominantly due to lower sales volumes.
Underlying EBIT for Nickel West increased by US$134 million due to cost efficiencies and a favourable exchange rate movement, which was partially offset by a movement in ceased and sold operations from the closure of the Nickel West Leinster Perseverance underground mine during FY2014.
More information on our assets and operations is presented in section 2.1.5 of this Annual Report.
1.13 Our people
Enabling our organisation to realise its potential through our people is fundamental to our success. We are focused on facilitating a culture where our employees are provided with opportunities to develop, are valued and are encouraged to contribute toward making work safer, simpler and more productive. Achieving this in a focused and collaborative way will mean we can deliver greater value to our shareholders.
1.13.1 Employees and contractors
Our Charter enables us to align our people around a common purpose and values, as well as provide clear guidance for how we do business and the way in which we work, wherever we are based in the world.
The table below provides the average number of employees and contractors over the last three financial years.
| | | | | | | | | | | | | | | | |
Year ended 30 June | | 2015 | | | 2015 | | | 2014 (b) | | | 2013 (b) | |
| | | Continuing
operations (a) | | | Discontinued
operations (a) | | | | | | | |
Employees | | | 29,670 | | | | 13,159 | | | | 47,044 | | | | 46,892 | |
Contractors | | | 50,698 | | | | 13,352 | | | | 76,759 | | | | 79,330 | |
| | | | | | | | | | | | | | | | |
Total | | | 80,368 | | | | 26,511 | | | | 123,803 | | | | 126,222 | |
| | | | | | | | | | | | | | | | |
The table below shows the gender composition of our workforce, senior leaders and the Board over the last three financial years.
| | | | | | | | | | | | | | | | |
Year ended 30 June | | 2015 | | | 2015 | | | 2014 (b) | | | 2013 (b) | |
| | | Continuing
operations (a) | | | Discontinued
operations (a) | | | | | | | |
Male employees | | | 24,487 | | | | 11,331 | | | | 39,517 | | | | 38,920 | |
Female employees | | | 5,183 | | | | 1,828 | | | | 7,527 | | | | 7,972 | |
Female employees (%) | | | 17 | | | | 14 | | | | 16 | | | | 17 | |
Male senior leaders (c) | | | 293 | | | | 85 | | | | 317 | | | | 326 | |
Female senior leaders (c) | | | 62 | | | | 19 | | | | 55 | | | | 40 | |
Female senior leaders (%) | | | 17 | | | | 18 | | | | 15 | | | | 11 | |
Male Board members | | | 10 | | | | | | | | 12 | | | | 11 | |
Female Board members (d) | | | 2 | | | | | | | | 2 | | | | 2 | |
Female Board members (%) | | | 17 | | | | | | | | 14 | | | | 15 | |
| (a) | For a description of the South32 demerger and reporting of Continuing and Discontinued operations, see sections 1.3.7, 1.6.4, and 2.1.7 of this Annual Report and note 29 ‘Discontinued operations’ to the Financial Statements. |
| (b) | These figures have not been restated for the purposes of the South32 demerger or reporting of Continuing and Discontinued operations. |
| (c) | For UK law purposes, we are required to show information for ‘senior managers’, which is defined to include both senior leaders and any persons who are directors of any subsidiary company even if they are not senior leaders. In FY2015, 355 senior leaders comprise the top people in the organisation. There are 50 directors of subsidiary companies who are not senior leaders, comprising 36 males and 14 females. Therefore, for UK law purposes, the total number of senior managers is 329 males and 76 females (19 per cent female). |
| (d) | For information relating to changes to the Board following year-end please refer to section 3.1 of this Annual Report. |
The tables below provide a breakdown of the average number of employees across the Group, in accordance with our reporting requirements under the UK Companies Act 2006. The calculation includes the Executive Director, 100 per cent of employees of subsidiary companies, and our share of joint operations, for each of the past three financial years. Employees of equity accounted entities are not included. Part-time employees are included on a full-time equivalent basis. Employees of businesses acquired or disposed of during a particular year are included for the period of ownership. Contractors are not included.
| | | | | | | | | | | | |
Year ended 30 June | | 2015 | | | 2014 (a) | | | 2013 (a) | |
Average number of employees for Continuing operations | | | | | | | | | | | | |
Petroleum and Potash | | | 4,224 | | | | 4,207 | | | | 4,449 | |
Copper | | | 9,138 | | | | 9,414 | | | | 9,765 | |
Iron Ore | | | 7,483 | | | | 8,035 | | | | 6,883 | |
Coal | | | 5,579 | | | | 6,160 | | | | 6,006 | |
Group and unallocated | | | 3,246 | | | | 3,687 | | | | 4,054 | |
| | | | | | | | | | | | |
Total average number of employees for Continuing operations | | | 29,670 | | | | 31,503 | | | | 31,157 | |
| | | | | | | | | | | | |
Total average number of employees from Discontinued operations | | | 13,159 | | | | 15,541 | | | | 15,735 | |
| | | | | | | | | | | | |
Total average number of employees | | | 42,829 | | | | 47,044 | | | | 46,892 | |
| | | | | | | | | | | | |
| (a) | These figures have not been restated for the purposes of the South32 demerger or reporting of Continuing and Discontinued operations. |
The table below provides a breakdown of our average number of employees by geographic region for each of the last three financial years.
| | | | | | | | | | | | | | | | |
Year ended 30 June | | 2015 | | | 2015 | | | 2014 (b) | | | 2013 (b) | |
| | | Continuing
operations (a) | | | Discontinued
operations (a) | | | | | | | |
Africa | | | 117 | | | | 6,875 | | | | 9,035 | | | | 9,121 | |
Asia | | | 1,022 | | | | 121 | | | | 1,105 | | | | 1,183 | |
Australasia | | | 16,839 | | | | 4,589 | | | | 23,048 | | | | 21,977 | |
Europe | | | 83 | | | | 19 | | | | 146 | | | | 231 | |
North America | | | 4,188 | | | | – | | | | 4,373 | | | | 5,116 | |
South America | | | 7,421 | | | | 1,555 | | | | 9,337 | | | | 9,264 | |
| | | | | | | | | | | | | | | | |
Total | | | 29,670 | | | | 13,159 | | | | 47,044 | | | | 46,892 | |
| | | | | | | | | | | | | | | | |
| (a) | For a description of the South32 demerger and reporting of Continuing and Discontinued operations, see sections 1.3.7, 1.6.4, and 2.1.7 of this Annual Report and note 29 ‘Discontinued operations’ to the Financial Statements. |
| (b) | These figures have not been restated for the purposes of the South32 demerger or reporting of Continuing and Discontinued operations. |
Changes in market conditions, and our business transformation programs focused on improving efficiencies and driving greater productivity have resulted in a decrease in our workforce requirements. Additionally, the deferral of some projects has had a consequential reduction in the workforce required for such projects. The FY2015 reductions were predominately in our contractor workforce, primarily in our Petroleum and Potash, Iron Ore and Coal Businesses.
1.13.2 Employee policies and engagement
At BHP Billiton, our people are fundamental to our success. Our people strategy focuses on developing our future leaders, engaging and supporting our high-performance workforce, and continuing to build a diverse team and inclusive workplace culture.
Our people strategy reflects our desire to have a highly motivated team and the importance of building effective leadership and deep functional expertise across our workforce to enable productivity. We strongly believe that having employees who are engaged and connected to our organisation reinforces our shared purpose, aligned toOur Charter, and will result in a more harmonious workplace.
An important component of our people strategy is how we enable our leaders to step up and drive greater productivity. In FY2015, a new leadership development framework, Leading the Future, was developed and implemented to address the findings of our FY2013 employee survey. Based on the premise that leadership drives culture and culture drives performance, the framework is globally consistent, sustainable and designed to build a distinctive BHP Billiton leadership capability. The first program introduced was Leading Step Up, a global approach to shifting our culture in the areas of employee engagement, the way we lead change, and how we develop our people. Targeted at all frontline people leaders in our operations, Group Functions and Marketing, Leading Step Up is delivered locally by BHP Billiton leaders, taught through practical everyday routines, and reinforced with regular feedback and coaching. To ensure continuous improvement, the program will be measured through local observation and feedback discussions, and through our annual employee surveys. Leading the Future will continue to be implemented across the business in FY2016.
Integral to achieving effective employee engagement is our approach to communication. We believe communication is a two-way process that we undertake through a variety of channels, including face-to-face, the
internet, intranet, email, newsletters, online collaboration forums and other means designed to cater for the local environment. Annually we seek feedback from our employees via an Employee Perception Survey. The findings from these surveys inform our HR practices and are used to measure and track people-related performance.
Our Charter, the BHP BillitonCode of Business Conduct and Human Resources GLDs prescribe what we will do and the behaviours that we expect of those who work for, or on behalf of, BHP Billiton. All of these documents are accessible to employees. Also, our employees can access our Annual Reports either via the internet or hard copy and receive regular communications on BHP Billiton goals and performance, as well as on other important issues such as health and safety, the environment and theCode of Business Conduct. Dispute and grievance handling processes exist to address issues across the Company. A business conduct advisory service, EthicsPoint, operates worldwide to allow concerns to be raised about conduct that is out of step withOur Charter values, our policies and procedures or legislation.
To help our people focus on clear goals, deliver our strategic and operational priorities and align behaviour toOur Charter, in FY2015, 86 per cent of our total number of employees participated in a formal performance management process, including 86 per cent of our operators and support staff. This process also provides the opportunity for employees to receive feedback and coaching, and identify skills and capabilities requiring further development. Due to industrial agreements, not all our employees are able to participate in individual performance or reward programs.
BHP Billiton is committed to creating a diverse workforce and inclusive work environment in which every employee is respected, treated fairly and embraced for their unique skills, experiences and perspectives. Discrimination on any basis, including disability, is not acceptable. In instances where employees require support for a disability, we work with them to identify roles that meet their skill, experience and capability, and offer retraining where required. Where practical to do so, flexible work practices are offered, taking into account the needs of the employee and those of the particular workplace. The employment packages under our remuneration policy, which must comply with local regulations, are aligned to our business requirements and are designed to be sufficiently attractive to recruit and retain highly capable and experienced candidates.
Our employee share purchase plan, Shareplus, is available to all permanent full-time and part-time employees, and those on fixed-term contracts, except where local regulations limit operation of the scheme. In these instances, alternate arrangements are in place. As at 30 June 2015, 14,077 employees were participants in Shareplus. Short-term and long-term incentive schemes also operate across the Group. Rewards for eligible individuals are predicated on the need to meet targets relating to the Group’s performance in areas such as health, safety and achievement of financial measures and on the personal performance of each employee.
1.13.3 Inclusion and diversity at BHP Billiton
Our Charter and Human Resources GLDs provide guidance on all aspects of our human resource management, including our approach to inclusion and diversity.
We believe that an inclusive work environment and a diverse workforce, where the unique skills, experiences and perspectives of our people are embraced, is pivotal to sustaining performance and further increasing our productivity. At BHP Billiton, we celebrate diversity in a broad sense, including differences in thought, perspectives, nationality, gender, sexual orientation, age and experience. In relation to gender, the Board had a goal of increasing the number of women on the Board to three by the end of CY2015. This has now been achieved with the announcement on 14 August 2015 that Anita Frew has been appointed to the Board (effective 15 September 2015) and will stand for election at the 2015 AGMs.
Each financial year, the Board considers, approves and monitors progress on the Group’s performance objectives. More details are set out below.
Our approach to inclusion and diversity is underpinned by the following principles:
a diverse workforce and an inclusive environment are necessary to the delivery of our strategy that is predicated on diversification by commodity, geography and market;
our aspiration is to have a workforce that best represents the communities in which our assets are located and our employees live;
actions that support our inclusion and diversity objectives should be consistent with our established approach to talent, performance and reward;
achieving an appropriate level of diversity is facilitated by line leadership and structured programs that support employees from an early career stage in developing the necessary skills and experiences for leadership roles;
| • | | creating an inclusive work environment will require every employee and leader to embrace diversity and act in a way that is consistent withOur Charter; |
measurable objectives in support of inclusion and diversity will be transparent, fit for purpose and focus on (i) engaging, enabling and developing our workforce and (ii) establishing appropriate representation goals.
Progress against measurable objectives
A summary of the three objectives committed to in FY2015 and progress to date are set out below.
| 1. | Each Business, Group Function and Marketing will be evaluated on progress in executing the measurable objectives that form part of its multi-year diversity plan. |
As in previous years, monitoring and tracking performance against inclusion and diversity plans was undertaken as part of the Group’s internal compliance requirements. Performance for each Business, Group Function and Marketing was evaluated against FY2015 measurable objectives and the results of these evaluations were taken into account in determining bonus remuneration.
| 2. | Execute the inclusion and diversity strategy and actions approved by the GMC. |
Our Businesses, Group Functions and Marketing executed the GMC approved inclusion and diversity plan. During the reporting period:
| – | | Our CEO and senior management across the organisation reinforced the Company’s commitment to inclusion and diversity through internal and external communication channels, including leadership messages, town hall meetings and participation in external industry events. |
| – | | Our CEO and the executive team participated in an Inclusive Leadership and Unconscious Bias development experience. Key content was also included in the BHP Billiton Group-wide Leadership Development Program, Leading Step Up, seeking to strengthen the ability of all people leaders to engage, lead change and develop our people. |
| – | | A Senior Executive Sponsorship program for female talent was launched. In addition, Businesses continued executing their female mentoring programs. These initiatives have contributed to increasing female representation in pipelines to manager and above level roles. |
| – | | After successful pilot programs during FY2014, flexible work arrangements were implemented in some Businesses, Group Functions and Marketing. Implementation was supported by information and engagement sessions led by line managers. |
| – | | Initiatives to keep employees engaged while on parental leave were successfully implemented. These included keep in touch meetings with employees during their parental leave and parental coaching sessions for managers. |
| – | | Initiatives to develop and promote diverse talent continued to be deployed across different regions. Key initiatives included career panel discussions, talent discussions sessions for diverse employees and implementing inclusion of diverse candidates for vacant roles. |
| – | | Actions to increase representation of Indigenous peoples (including Aboriginal and Torres Strait Islander peoples) in our workforce continued to be executed. Actions included targeted resourcing strategies, training programs and integration initiatives to broaden their employment opportunities. |
| – | | From our baseline in 2010, female representation increased by (i) 13 per cent in manager and senior leadership roles to 21 per cent and (ii) two per cent in our overall workforce representation to 17 per cent(a). We remain committed to increasing overall female representation, with a specific focus on operational areas. |
| – | | In FY2015, female representation in our graduate intake increased by 7.6 per cent at a global level to 42 per cent and by 10 per cent to 46 per cent in Australia(b). Representation of Aboriginal and Torres Strait Islander peoples in the graduate intake in Australia increased by six per cent to 11 per cent. |
| 3. | Demonstrate year-on-year improvement in creating a work environment of inclusion, as measured by our employee survey index. |
As part of our employee survey, we gauge employees’ perceptions of feeling valued and heard. Results, together with tools and materials to assist action planning and improvement, were cascaded to business leaders and line managers. Results demonstrate a three per cent increase from last year.
| (a) | These figures represent outcomes for Continuing operations. For Discontinued operations, female representation in manager and senior leadership roles was 17 per cent (totalling 19 per cent for the Group for FY2015) and female representation for the overall Discontinued operations workforce was 14 per cent (totalling 16 per cent for the Group for FY2015). We remain committed to increasing overall female representation, with a specific focus on operational areas. |
| (b) | These figures represent outcomes for the total Group (including Discontinued operations). In relation to Discontinued operations, three per cent of these graduates from the total Group were transferred to South32 as part of the demerger. |
Continuous improvement
In FY2016, we will continue to focus on creating a more inclusive work environment and on enhancing our gender and diversity profile. We will take the following steps to achieve this commitment:
demonstrate progress against key objectives to improve the diversity of our workforce profile with particular emphasis on increasing female representation year-on-year, both overall and in leadership roles;
demonstrate year-on-year improvement in creating a work environment of inclusion, as measured by our employee survey index.
As in previous years, each Business, Group Function and Marketing will be evaluated on progress in executing the measurable objectives that form part of their scorecards and appraisal commitments. Successful completion of these objectives will be taken into account in determining bonus remuneration. Progress against each year’s measurable objectives will continue to be tracked as part of the Group’s internal compliance requirements and disclosed in the Annual Report.
1.14 Sustainability
Sustainability is core to our business strategy and integrated into our decision-making. It helps us liveOur Charter values of putting health and safety first, being environmentally responsible and supporting our host communities.
In reporting our sustainability performance, we include our impact on the environment and approach to climate change, water stewardship, resource conservation and biodiversity; and our efforts to ensure the broader economic contributions of our operations benefit the regions in which we operate.
The information (including performance data) contained in this section, unless otherwise stated, covers assets that have been wholly owned and operated by BHP Billiton or that have been operated by BHP Billiton in a joint venture operation (operated assets) for FY2015. It also includes information (including performance data) relating to, and including, the demerged assets for the period from 1 July 2014 to 8 May 2015. Unless otherwise stated, data included in this section is presented on a Continuing operations basis.
We acknowledge the importance of measuring our broader impact. As such, in FY2015 we expanded our definition of work-related activities to align with the recording boundaries of the International Council on Mining and Metals (ICMM). This includes the recording of events that occur outside of our operated locations where we have established the work to be performed and can set and verify the health and safety standards.
1.14.1 Identifying our material sustainability issues
To deliver successfully on our business strategy, we identify and respond to the sustainability issues that have a direct or indirect impact on our business and our stakeholders. Using a materiality assessment process, we identify and prioritise material sustainability issues. The following issues are discussed in this Annual Report:
| | | | | | |
Governance | | Health and safety | | Environment | | Society |
• Governance and sustainability • Identifying and managing our material risks • Operating with integrity • Climate change | | • Keeping our people and operations safe • Focusing on the health of our people | | • Biodiversity management • Water • Responsibly managing hydraulic fracturing | | • Engaging with our host communities • Respecting human rights • Making a positive contribution to society |
Additional information relating to our materiality assessment process and our sustainability performance for FY2015 is available in our Sustainability Report 2015 and can be found online atwww.bhpbilliton.com.
1.14.2 Governance
Governance and sustainability
Our Board governs the Group in a manner consistent withOur Charter, our strategy and our commitment to a transparent and high-quality governance system. The Board has established a number of committees to assist in exercising its authority, including monitoring the performance of the Group.
The Sustainability Committee assists the Board in oversight of health, safety, environment and community (HSEC) matters, including climate change. This includes overseeing areas relating to HSEC risk control, compliance with applicable legal and regulatory requirements, and overall HSEC performance of the Group.
During FY2015, the Sustainability Committee continued to assist the Board in its oversight of HSEC issues and performance. This included consideration of strategic environmental and community matters, HSEC audits and trends, and the detailed reports from management of the relevant operation on the event, actions taken and investigations in the event of a fatality or significant incident.
Below the level of the Board, key management decisions are made by the CEO, the GMC, other management committees and individual members of management to whom authority has been delegated.
At the Group level, health, safety, environment and community teams provide guidance and thought leadership by developing and implementing HSEC management frameworks, focusing on catastrophic and fatal hazards management; identifying relevant HSEC trends; tracking performance and alignment with other Company requirements; and reporting progress against targets.
To link HSEC matters to remuneration, 20 per cent of the FY2015 short-term incentive opportunity for GMC members was based on HSEC performance. Given the importance the Group places on safety, the short-term incentive opportunity attached to HSEC has been increased for FY2016 to 25 per cent. The Sustainability Committee assists the Remuneration Committee in determining appropriate HSEC metrics to be included in GMC scorecards and in assessing performance against those measures.
The Remuneration Committee and the Board also have discretion over both the short-term and long-term incentive opportunities for GMC members and take into consideration HSEC performance. As a consequence of the five tragic fatalities in FY2015, the Board and the Remuneration Committee concluded, after taking advice from the Sustainability Committee, that a zero outcome was appropriate for the CEO’s FY2015 short-term incentive HSEC component, with the decision supported by the CEO.
Further information on the metrics and their assessment is available in the Remuneration Report contained in section 4 of this Annual Report.
Identifying and managing our material risks
In addition to the legal requirements of the countries in which we operate, our approach to sustainability risks is defined by our GLDs. These clearly describe our mandatory minimum performance requirements and accountabilities across the Group and are the foundation for developing and implementing management systems at our operations.
GLDs relating to HSEC matters set our Group-wide HSEC-related performance requirements to ensure effective management control of our sustainability risks. Our GLDs are consistent with the principles and mandatory requirements of the position statements of the ICMM Sustainable Development Framework, the United Nations (UN) Global Compact, the UN Declaration of Human Rights and the Voluntary Principles on Security and Human Rights.
At our operated assets, we have the ability to set workplace HSEC standards and enforce their application. Contractors working at our operated assets must comply with the minimum performance requirements in our relevant GLDs. In addition we seek to ensure our customers, suppliers, agents and service providers maintain business practices and workplaces that are aligned with our GLDs. We also seek to apply GLD performance requirements to our non-operated assets.
We use the framework in ourRisk Management GLD to identify and manage the risk involved in our business activities, functions and processes. This provides a strong foundation for our active and consistent risk-based approach to sustainability. A broader discussion of our risk factors and management approach is provided in section 1.7 of this Annual Report.
Operating with integrity
Integrity and accountability are core values at BHP Billiton and central to our reputation as one of the world’s leading companies. We are committed to ethical business practices and high-quality governance in all that we do. Regardless of the country or culture within which our people work, ourAnti-corruption GLD andCode of Business Conduct prohibit bribery and corruption in all our business dealings. Particulars in relation to theCode of Business Conduct and anti-corruption are referred to the Sustainability Report 2015 and in section 3.17 of this Annual Report. Specific discussion on legal proceedings is available in section 6 of this Annual Report.
Transparency of payments to governments
BHP Billiton considers the licences we have to operate in jurisdictions around the world as a privilege that bestows upon us a responsibility to contribute to the economic and social development of our host countries. A critical component of this responsibility is our taxation obligations to our host governments.
Our payments to governments in FY2015 on a country-by-country basis of US$7.3 billion are presented in our Sustainability Report 2015. Approximately US$1.4 billion in taxes collected on behalf of employees was also remitted to governments in FY2015. More than 99 per cent (excludes demerged assets) of our payments were made to nine countries. Of these, our largest payments were made in Australia, where we have the majority of our assets.
BHP Billiton has long been deeply committed to the role transparency plays in contributing to the good governance of natural resources for the benefit of the governments and citizens of countries that host our operations. This is why BHP Billiton has voluntarily publicly reported our payments of taxes and royalties in our Annual Sustainability Report in increasing detail over the last 15 years and has been a member of the Extractive Industries Transparency Initiative (EITI) since its inception in 2002. We continue our strong support through our active participation on the EITI Board.
We believe that transparency by governments and companies around revenue flows from the extraction of natural resources is an important element in the fight against corruption. A level and globally consistent playing field will ensure all companies disclose on the same basis and reduce the reporting burden for those operating in multiple jurisdictions. To this end, and consistent with our Transparency Principles, we support appropriate national and extra-territorial mandatory corporate reporting to complement the EITI and provide a globally consistent regulatory framework for all extractive industry companies.
We have disclosed our payments of taxes and royalties on a project-by-project basis, and payments to state and provincial governments at a subnational level, in a stand-alone BHP Billiton Economic contribution and payments to governments Report. This Report is available online atwww.bhpbilliton.com.
Closure planning
Closure planning is an important consideration in the planning and development of our mining and petroleum operations. We recognise the significant risks associated with ineffective closure and seek to minimise these through our closure governance framework. The closure framework integrates resource planning and development, health, safety and environment, stakeholder engagement, finance and assurance into business operational design.
Specifically, the framework requires each asset to develop closure plans. These plans describe closure objectives and the management process in place to reduce closure liabilities over the life of the asset.
An ongoing internal audit program continues to test the effectiveness of these closure plans and the business alignment to the closure planning framework, including the financial provisions. Information on these provisions can be found in note 14 ‘Closure and rehabilitation provisions’ to the Financial Statements. Audit findings are reviewed annually and reported to the relevant Business Presidents, while summary reports are considered by the Sustainability Committee of the Board. During FY2015, 11 audits were conducted against performance criteria and recommendations from such audits have been initiated.
Climate change
Our perspective on climate change
We accept the Intergovernmental Panel on Climate Change (IPCC) assessment of climate change science, which has found that warming of the climate is unequivocal, the human influence is clear and physical impacts are unavoidable.
Sustainable economic growth requires an effective response to climate change. The world needs reliable, affordable energy to support higher living standards and lower GHG emissions to keep the global average temperature rise below two degrees Celsius. We do not prioritise one of these requirements over the other. Both are essential.
Even allowing for significant improvements in energy efficiency, energy demand is expected to increase as the global population grows and living standards improve. Today, fossil fuels are often the most affordable, reliable and accessible way of meeting this demand and provide more than 80 per cent of the world’s primary energy. However, their growing use would substantially increase GHG emissions and exacerbate climate change unless new technology reduces their impact. To meet its development and climate goals, the world must find ways to progressively decarbonise the use of fossil fuels, improve energy efficiency and increase the use of alternative energy sources such as renewables and nuclear power.
Climate change governance
BHP Billiton’s strategy is tied to economic growth in both emerging and developed economies, and sustainable growth requires an effective response to climate change. Responding to climate change is a priority Board governance and strategic issue for our Company.
Our GMC has primary responsibility for the design and implementation of an effective position and response to climate, and accountability for performance against GHG emissions, our climate change metric. We also seek input and insight from external experts, such as the Forum on Corporate Responsibility.
To reflect updates in scientific knowledge and global regulatory and political responses, we regularly review our position on climate change. We incorporate climate change considerations into our Group scenario planning to understand potential impacts on our portfolio. We also conduct annual reviews of performance against Business GHG targets to ensure we are on track to achieve our Company target. The Sustainability Committee has considered a range of climate change scenarios and continues to monitor the actions being taken to manage a range of climate change impacts and policy responses.
Our approach
Our strategic approach to climate change is underpinned by engagement with policy makers and other stakeholders, including investors, companies and non-government organisations. We believe industry has a key role to play in climate change policy development by working with governments and other stakeholders to inform the development of effective long-term policy framework that delivers a measured transition to a lower emissions economy. BHP Billiton believes an effective policy framework should include a complementary set of measures, including a price on carbon, support for low-emissions technologies and measures to build resilience.
We continue to share lessons learnt with our stakeholders and identify solutions that we believe can drive emissions reductions at the lowest cost. In September 2014, BHP Billiton signed the World Bank’s Putting a Price on Carbon statement, which was presented at the 2014 UN Climate Summit in New York and we are a member of their Carbon Pricing Leadership Coalition. In 2015, we made two climate change policy submissions in response to the Australian Government’s discussion papers Setting Australia’s Post-2020 Target for GHG Emissions and Emission Reduction Fund: Safeguard Mechanism, sharing our perspective on the importance of this issue.
We have also hosted several policy roundtables, bringing cross-sectoral business groups together to discuss different ways that business and government can address climate change. Internationally, we look forward to the 21st Conference of the Parties (COP21) in Paris in December 2015 delivering a positive outcome that puts the world on a path to limit global temperatures to less than 2 degrees Celsius above pre-industrial levels, in line with current international commitments.
We are committed to transparent and open communications and have an ongoing and extensive engagement program with investors, government and the broader society, including our voluntary submission to the CDP (formerly known as the Carbon Disclosure Project). The CDP score is a measure of the actions that a company has demonstrated in carbon management. Our commitment to continuing transparency and disclosure has resulted in an improvement in our CDP score since 2013.
We have been taking action for many years to understand and manage the impacts of climate change on our business. We have been applying an internal price on carbon in our investment decisions and portfolio evaluation for more than a decade and were early adopters of this approach. We maintain a view on carbon pricing using a carbon price protocol, which we update regularly. Our carbon price protocol tracks the progress of national emissions reduction ambitions to tackle climate change throughout the world, including in our major operating regions and customer demand centres. In parallel, we look at the potential for reductions in emissions and the cost associated with those reductions to determine an appropriate long-term price level. We carry out this assessment for various scenarios which reflect the effectiveness and ambition of policies, the timing to implement reductions, the interaction between policy mechanisms and the role of low carbon technologies. We have an integrated approach to addressing climate change that has three key areas: mitigation, adaptation andlow-emissions technology.
Mitigation
As a major producer and consumer of energy, we prioritise GHG reductions and energy efficiency.
BHP Billiton is among the sector leaders in setting an absolute target to limit our GHG emissions. As we grow our business, this target encourages us to look for ways to improve our energy efficiency, increase productivity and implement additional GHG reduction projects across our operations. All our Businesses are required to identify, evaluate and implement suitable GHG reduction opportunities, including during project design and equipment selection.
In FY2015, the Group’s total GHG emissions were 38.3 million tonnes (Mt) of carbon dioxide equivalent (CO2-e). Taking into account the impact of the demerger, this represents a six per cent reduction on FY2014 GHG emissions. For the purposes of the FY2014 comparison, emissions from assets demerged with South32 for the period 1 July 2014 to 30 April 2015 were annualised. This reduction has been driven in part by GHG reduction projects across our Businesses and improved productivity.
GHG Scope 1 and 2 (millions of tonnes CO2-e)(a)
| | | | | | | | | | | | |
Year ended 30 June (b) | | 2015 | | | 2014 | | | 2013 | |
Scope 1 (c) | | | 20.7 | | | | 22.7 | | | | 22.0 | |
Scope 2 (d) | | | 17.6 | | | | 22.3 | | | | 24.7 | |
| | | | | | | | | | | | |
Total GHG millions of tonnes CO2-e | | | 38.3 | | | | 45.0 | | | | 46.7 | |
| | | | | | | | | | | | |
| (a) | Measured according to the World Resources Institute/World Business Council for Sustainable Development Greenhouse Gas Protocol. |
| (b) | Includes data for Continuing and Discontinued operations. |
| (c) | Scope 1 refers to direct GHG emissions from our operated assets. |
| (d) | Scope 2 refers to indirect GHG emissions from the generation of purchased electricity and steam that is consumed by our operated assets. |
In line with the requirements of the UK Companies Act 2006, our reported FY2015 GHG intensity was 3.8 tonnes of CO2-e per tonne of copper equivalent production (FY2014: 4.9 tonnes of CO2-e). Our reported FY2015 energy intensity was 30 petajoules per million tonnes of copper equivalent production. Copper
equivalent production has been based on FY2013 average realised product prices. Rather than use an intensity metric, we have set ourselves a challenging goal to limit our overall emissions by keeping our absolute FY2017 GHG emissions below our FY2006 baseline while we continue to grow our business.
A key example of our ongoing activity to reduce GHG emissions is our Fuel Quality Network that brings people together from across our Company to understand and test the benefits of improving fuel quality. Our investigations have shown that improving fuel chemistry can deliver significant reductions in diesel exhaust particulates and GHG emissions. We estimate that improving the quality of fuel delivered to our mobile plants has the potential to reduce energy consumption across the Company by around 4,600 terajoules (TJ) per annum and reduce GHG emissions by approximately 320,000 tonnes of CO2-e per annum. In addition, the Fuel Quality Network will help us to achieve cost savings in maintenance operations and deliver improved productivity.
Projects and initiatives such as these keep us on track to achieve our GHG emissions reduction target. We are committed to continued focus on the delivery of GHG reduction opportunities within our Businesses.
In addition to identifying opportunities within our Company, we also seek to contribute to global GHG emissions reductions. We are currently implementing a strategy to support REDD+ (Reducing Emissions from Deforestation and Forest Degradation), an international mechanism that provides economic, social and environmental incentives for developing countries to reduce GHG emissions from deforestation and related activities through the creation of carbon credits. Through project support, improved governance and climate finance market stimulation, BHP Billiton is playing a role in reducing deforestation, enhancing community livelihoods and improving biodiversity and watershed conservation. BHP Billiton and the International Finance Corporation are exploring ways of stimulating demand for REDD+ credits to support forest protection and conservation.
Adaptation
BHP Billiton’s corporate strategy is based on owning and operating long-life assets diversified by commodity, geography and market. Our success over many years can be attributed to the way we have successfully adapted to the changing business landscape. Building resilience to the physical impacts of climate change is just as essential to long-term business success.
We take a multifaceted approach to climate change adaptation, building resilience across activities both within our operations and investments, and outside of our operational control in our communities and ecosystems. We seek to leverage many of our established core business processes such as risk and planning. Climate risks may occur as a result of acute (extreme) weather events (e.g. floods and cyclones); chronic (incremental) changes in climate conditions, which may progressively increase risk over time (e.g. changes to temperature); and cumulative impacts from the interaction of direct and indirect climate impacts (e.g. changes to water availability). Our analysis has found that climate change will exacerbate existing risks while also exposing our Businesses to new risks. For example, cyclone management is critical for our Western Australia Iron Ore (WAIO) Asset and maintaining adaptive management practices will allow WAIO to respond to the expected increase in cyclone intensity in the Pilbara. We also require new investments to assess risks associated with the forecast impacts of climate change. For example, during the project design, identification and assessment of increasing storm intensity and storm surge levels resulted in raising the height of the trestle at our Hay Point coal port facility in Queensland, Australia, as part of our expansion plans.
Effective analysis of climate science is critical to our resilience planning and we take care to understand what variables and analysis make the most sense to our business. We are currently working with the CSIRO (Australia’s national science agency) to obtain analyses of the climate science. This will inform climate resilience planning at an asset level, improving our understanding of the material climate vulnerabilities that face our Businesses.
Technology
Technology and innovation have the potential to significantly reduce global emissions and meet long-term climate goals. Given that fossil fuels are likely to continue to be a significant part of the energy mix for decades, it is vital that low-emissions technologies (LET) are available at scale, lower cost and much faster than the usual commercial time frames to meet the challenge of climate change. Industry has a significant collaborative role to play with government, academia and the community to facilitate this necessary step change.
Since 2007, we have spent over US$400 million on LET research, development and deployment across a number of projects ranging in scale and complexity. For example, the West Cliff Ventilation Air Methane Project (WestVAMP) first piloted at Illawarra Coal’s Appin Colliery in 2001, utilises 20 per cent of available mine ventilation air to produce electricity. This reduces the site’s overall GHG emissions footprint by removing the methane from mine ventilation air.
BHP Billiton is also part of ONE Future, a coalition of companies from across the natural gas industry in the United States focused on identifying solutions for fugitive methane emissions management. ONE Future has developed an approach, that if widely adopted, could lower the total methane emissions of participating coalition companies to less than one per cent of gross production.
To build upon this contribution to the development of LET, we have recently established an integrated strategy that considers investment across a range of technologies that can lead to material emissions reductions in our operations and across our supply chains. When evaluating opportunity areas for potential investment, we look at several different factors, including the potential to impact upon global emissions and the opportunity to use our own skills and expertise to accelerate the change required, including our expertise in geology, engineering and markets.
We also seek to leverage our investments with the contribution of suitable partners, including governments, peers and research organisations. The focus for us is to consider the catalytic role that BHP Billiton can play in working with others to accelerate the deployment of technology to address material sources of emissions.
Our roadmap for investment includes the development and demonstration of carbon capture and storage (CCS) technologies, the reduction of fugitive methane emissions from coal and petroleum operations, high-efficiency/low-emissions power generation, low-emissions transportation and improvement and application of battery storage to enhance the wider deployment of renewable energy.
CCS can play a pivotal role in reducing emissions from oil and gas production, and from the use of fossil fuels in power generation and industrial processes. The key components of CCS (capture, transport and storage of CO2) have all been demonstrated successfully for many years. The challenge for large-scale deployment of CCS technology in the power and industrial sectors is the integration of the key components of CCS and appropriate commercial and regulatory support to foster further development.
Addressing the key barriers to deployment (regulatory uncertainty, cost and stakeholder concern) is essential if CCS is to become a global mitigation tool at the scale required to make a meaningful contribution to long-term climate goals. We have previously contributed to the development of CCS in both Australia and the United States and we are a founding member of CO2CRC, one of the world’s leading collaborative research organisations focused on long-term geological storage of carbon dioxide.
Portfolio evaluation
As well as taking action to reduce emissions, build resilience to the physical impacts of climate change, develop and deploy LETs and support an effective global response, we continue to identify and assess the impacts of climate change on our portfolio.
The starting point of our corporate planning process is the construction of a central case based on extensive analysis and research. Our current central case assumes the US economy continues to recover and strengthen, progressive development of China and India, integration of emerging economies into a multi-polar economic environment, and action on climate change centred on national policies.
Our corporate planning process uses scenario analysis to encompass a wide spectrum of potential outcomes for key global uncertainties. Designed to interpret external factors including technical, economic, political and governance trends facing the global resources industry, the scenarios offer a means by which to explore potential portfolio discontinuities and opportunities, as well as to test the robustness of decisions. Our scenarios do not constitute preferred outcomes for BHP Billiton. The scenarios are designed to be divergent, but also plausible and internally consistent, spanning unique potential future business environments.
According to independent bodies such as the International Energy Agency (IEA), fossil fuels will continue to supply a significant amount of the world’s energy for decades. This is the case even in the IEA’s ‘450 Scenario’, under which the world achieves a 2ºC outcome. Oil, coal and gas are likely to continue to constitute a significant part of the energy supply mix in countries like China and India, notwithstanding strong growth in renewables.
Given the ongoing role of fossil fuels, and the many uncertainties facing not only the resources sector but the world in general, accurately predicting how the world will respond to the challenge posed by climate change is difficult. Our scenario planning approach endeavours to consider a range of potential outcomes in order to understand the impacts on our portfolio and the critical signposts we must monitor in order to respond in a timely and effective way.
Our analysis highlights that our uniquely diversified portfolio of high-quality assets is robust across our scenarios and is highly unlikely to result in BHP Billiton assets being ‘stranded’. In a scenario where there is strong impetus to develop and implement cleaner, more energy efficient solutions and unified societal action to address climate change, our analysis indicates that there is a potential of upside for uranium, our high-quality hard coking coal and iron ore lump product. Copper is resilient and would offer continued opportunity for growth and our gas exposure may yet provide opportunities during a transition to a lower carbon economy. In aggregate, we anticipate these commodities are robust and provide options that could mitigate potential negative impacts on other commodities.
Regardless of the path the world chooses, we are committed to reducing our own emissions and to supporting global efforts to reduce general emissions.
1.14.3 Health and safety
Keeping our people and operations safe
The health and safety of our people and of the broader communities in which we operate is central to every aspect of our business. Regardless of where our people are located, the area of the organisation in which they work, or the type of work they undertake, we strive to create an environment that is free from occupational harm. However, we do recognise that environments we operate in can be hazardous.
Despite our goal to achieve zero work-related fatalities, tragically we lost five of our colleagues in FY2015. Four fatalities occurred during on-site work activities and one fatality occurred in an off-site transportation accident. Independent investigations were undertaken for each incident, with remedial action taken and findings from the investigations shared across the Group. In FY2014, we had no work-related fatalities at our operated assets, a goal that we will continue to work towards.
As part of our ongoing focus to eliminate fatal and other serious incidents, a Company-level safety intervention was initiated in FY2015. The safety intervention was launched with engagement across our business through a variety of methods, including workshops, team talks and surveys. Feedback was presented at our senior leaders’
meeting in July 2015, identifying the key controls, programs, systems, processes and tools currently in place that require improvement and Company-wide adoption through focused leadership.
Safety risk controls for Company-wide risks are included in ourSafety GLD and serve as the minimum mandatory controls. Each Business is required to assess whether additional controls are required to manage risks and to meet the objective of no fatalities.
During FY2015, our overall total recordable injury frequency (TRIF) performance of 4.1 injuries per million hours worked improved by two per cent compared with FY2014. Over the past five years, our TRIF has reduced by 18 per cent.
Total recordable injury frequency (per million hours worked)
| | | | | | | | | | | | |
Year ended 30 June (a) | | 2015 | | | 2014 | | | 2013 | |
Total recordable injury frequency (TRIF) | | | 4.1 | | | | 4.2 | | | | 4.6 | |
| | | | | | | | | | | | |
| (a) | Includes data for Continuing and Discontinued operations for the financial years being reported. |
Focusing on the health of our people
We want our people to be fit for work and make sure their work does not negatively impact their health or wellbeing now or in the future.
During FY2015, we continued to establish, maintain and review our exposure profiles and manage significant health risks. The minimum mandatory controls contained within ourHealth GLD are structured around three principal aims: the prevention of illness from exposure; ensuring people are fit for work; and returning people to work after illness or injury. These principal aims form the cornerstone of our health risk management framework.
In FY2012, we established a health target baseline and committed to reduce potential occupational exposure to carcinogens and airborne contaminants by 10 per cent by FY2017. In FY2015, the number of potential exposures to carcinogens and airborne contaminants requiring the use of personal protective equipment reduced by 40 per cent compared with our FY2012 baseline. We have therefore exceeded our target to date. While good progress has been made in relation to occupational exposures to carcinogens and airborne contaminants, we remain vigilant in adopting and maintaining effective exposure controls. Our FY2015 results are due to a number of initiatives across our operations, details of which can be found in our Sustainability Report 2015.
In FY2015, the incidence of employee occupational illness was 4.93 per million hours worked, an increase of 74 per cent compared with FY2014. Noise induced hearing loss cases increased significantly due to a more accurate assessment triggered by incorrectly applying our hearing loss criteria in previous years at some assets. Our reduction in musculoskeletal illnesses was primarily due to the introduction of a multifaceted control program at one of our assets.
| | | | | | | | | | | | |
Year ended 30 June (a) | | 2015 | | | 2014 | | | 2013 | |
Noise induced hearing loss | | | 3.05 | | | | 0.68 | | | | 0.51 | |
Musculoskeletal | | | 1.52 | | | | 1.61 | | | | 1.24 | |
Other illnesses | | | 0.36 | | | | 0.55 | | | | 0.64 | |
| | | | | | | | | | | | |
Total | | | 4.93 | | | | 2.84 | | | | 2.39 | |
| | | | | | | | | | | | |
| (a) | Includes data for Continuing and Discontinued operations for the financial years being reported. |
1.14.4 Environment
We seek to demonstrate our environmental responsibility by minimising our environmental impacts and leaving lasting benefits. We approach our environmental management in ways that address our responsibilities to firstly understand and minimise impacts, and, secondly to contribute more broadly as environmental stewards.
We complement our core business processes of risk management, and corporate planning, community development and stakeholder engagement with the minimum mandatory requirements for environmental management of ourEnvironment GLD. In this GLD, we take a risk-based approach and emphasise implementation of the mitigation hierarchy to avoid, minimise and rehabilitate direct, indirect and cumulative impacts within our area of influence across both short-term and long-term business horizons. We require our Businesses to set target environmental outcomes for land, biodiversity, water resources and air, and prevent or minimise GHG emissions, including in project design. Where unacceptable impacts remain to important biodiversity and ecosystems, we apply compensatory actions to address the residual impacts.
Biodiversity management
A sustainable society depends on biodiversity and its associated ecosystem services, such as food, air and water. Similarly, our operations depend on and have the potential to impact biodiversity and its related ecosystem services.
We have two targets focused on biodiversity that acknowledge the importance of maintaining the unique ecosystems and biodiversity of the areas in which we operate and the importance of conserving these more broadly. The first target requires the development and maintenance of land and biodiversity management plans that include controls demonstrating application of the mitigation hierarchy to manage the biodiversity and ecosystem impacts of our operations. This target is supported by the requirements of ourEnvironment GLD. In FY2015, consistent with our target, all operations developed land and biodiversity management plans.
The second target is at a wider Group level and is a voluntary commitment to financing the conservation and ongoing management of areas of high biodiversity and ecosystem value that are of national or international conservation significance. In FY2012, we established an alliance with Conservation International to support the delivery of this target and improve our approach to biodiversity management more broadly. As a result, we will improve our environmental performance and broaden our contributions to lasting environmental benefits beyond what could be achieved by our operations alone. As of FY2015, we have committed more than US$35 million to conservation, in addition to the environmental management activities at our operations.
A central part of our approach to managing our impacts on land and biodiversity is the rehabilitation of land no longer required for our activities. Our Businesses are required to maintain rehabilitation plans that support life-of-asset and closure plans. This includes rehabilitating disturbed areas that are no longer required for our operational purposes, consistent with the pre-disturbance land use or alternate land use, while taking into account regulatory requirements and stakeholder expectations. As at the end of FY2015, our total land rehabilitated was 40,800 hectares, a five per cent increase since FY2014, on the total area rehabilitated.
Water
The sustainability of our operations relies on our ability to obtain an appropriate quality and quantity of water, use it responsibly and manage it appropriately, including taking account of natural supply variations. As economies and populations continue to expand and pressure for water becomes more intense, we recognise the role we have as responsible stewards of the water we share with our host communities. We anticipate climate change is likely to make the patterns and cycles of water flow less predictable and require our operations to implement adaptive responses. Managing our shared water resources is therefore a complex task for our business.
To manage our shared water resources, our operations are required to assess the direct, indirect and cumulative impacts and risks to water resources. We do this by understanding the social, cultural, ecological and economic values of these resources at a catchment level within our area of influence. Based on the risks and impacts, our operations apply a mitigation hierarchy; implement controls and monitor their effectiveness. At the operational level, we maintain quantitative water balance models to predict and support the management of water inputs, use and outputs and to enable timely management responses to water-related risks. Where possible, we seek to use lower-quality or recycled water to minimise extraction requirements from higher-quality water resources.
Recognising the regional nature of our water risks, we introduced a target in FY2013 requiring our operations with water-related material risks to implement projects to reduce their impact on associated water resources. The target allows our Businesses to annually review and focus on the water challenges specific to the regions in which they operate. Further discussion on projects implemented as part of our water target can be found in our Sustainability Report 2015.
We report on our water use publicly, consistent with the Input Output model of the Minerals Council of Australia’s Water Accounting Framework (WAF). We are working with the ICMM to support broader adoption across the industry. The WAF aims to improve data integrity and comparability across the sector to allow a more meaningful analysis on which to base policy making and deliver improved outcomes.
Under the WAF, water is categorised as Type 1 (close to drinking water standards), Type 2 (suitable for some purposes), and Type 3 (unsuitable for most purposes). In FY2015, our total water input (water intended for use) was 340,200 megalitres across the Group, with 85 per cent defined as Type 2 or Type 3. Our use of Type 2 and Type 3 water demonstrates our approach to utilising lower-quality water wherever feasible.
Responsibly managing hydraulic fracturing
Since 2011, we have conducted onshore shale operations in the Eagle Ford, Permian, Haynesville and Fayetteville shale operations according to our North America Shale Operating Principles. These principles state our commitment to safety, and to protect the land where we operate, safeguard and manage water resources, minimise air emissions from our operations, and be a good neighbour to our host communities. We construct and operate our facilities in an environmentally sensitive manner. We conduct environmental assessments, and prepare plans with controls to minimise impacts to air, water, land and biodiversity.
We publicly report the ingredients of the fracturing fluids from each well completion into FracFocus, the hydraulic fracturing chemical disclosure registry. We don’t use benzene, toluene, ethylbenzene or xylene (BTEX) or diesel in our fracturing fluids, and we work with our service companies to reduce toxicity of fracturing fluids where possible.
We check every well we drill against our list of critical elements to ensure well integrity and the safety of our operations. Our Groundwater Risk Management Plan incorporates controls to prevent the loss of containment of pressurised fluids, including: casing annulus monitoring procedures to verify well integrity; proper wellhead and casing design and construction; and specialised training to assure competency. During FY2015, we voluntarily implemented a pre-drilling groundwater monitoring program in the active drilling areas of the Eagle Ford, Permian and Haynesville shale operations to establish a baseline of groundwater quality.
To improve management of water resources and reduce fresh water demand at our Eagle Ford operations, we implemented a mobile reverse osmosis system to produce potable water and treat waste water for reuse in drilling and completions at our drilling camps, while reducing trucking of water and waste. In our Permian shale operation, we use predominately a blend of brackish water and recycled produced water for our drilling and completions operations.
The majority of our air emissions relate to GHG emissions from fuel combustion, flaring and venting during well construction and production. We reduce methane emissions across our shale operations by capturing and selling the produced natural gas that would otherwise be vented or flared.
At our Permian shale operation, we increased the percentage of produced water sent through pipeline to disposal, eliminating a portion of trucking to disposal wells, which also contributed to GHG reductions. We utilise temporary pipelines instead of trucks throughout our shale operations to supply water to our construction operations. This reduces air emissions and relieves traffic stress on local roads and communities.
We accept the scientific basis for linking seismic activity to waste water injection wells associated with unconventional oil and gas production. As such, we conduct enhanced seismicity monitoring and other types of data acquisition to better understand and mitigate the risk of the potential for induced seismic activity associated with waste water disposal operations. We actively participate in cooperative efforts with stakeholders (industry, government, science community and the public) to better understand and promote best practice risk management in our operations.
1.14.5 Society
We strive to be a valued partner in the communities in which we operate and, through all our interactions, seek to foster meaningful, long-term relationships that respect local cultures and create lasting benefits. We believe this is fundamental to being a responsible corporate citizen and is a clear demonstration ofOur Charter values.
Engaging effectively in communities
OurCommunity GLD prescribes an inclusive and proactive approach to stakeholder engagement. We seek to build connections with stakeholders early in the life cycle of our operations, maintain open and ongoing communications with them, and operate transparently in relation to our plans and performance. In order to be effective and reach as many people as possible, we ensure these engagement activities are culturally and socially inclusive.
Our stakeholder engagement process requires our assets and operations to identify and analyse stakeholder groups to determine the level of impact the Company has on them and their level of interest in engaging with us. Each asset and operation then designs community engagement activities suitable for each of the stakeholder groups and individuals, where appropriate. Through engagement, with our host communities we also develop an understanding of the social and economic environment, including potential impacts and opportunities.
To measure the effectiveness of our engagement and community development activities, our operations are required to complete a community perception survey every three years. These surveys provide a valuable external perspective on the quality of our engagement and whether our stakeholders believe we are addressing their key concerns.
Respecting human rights
BHP Billiton’s corporate responsibility to respect human rights is embedded within the Company’s systems and processes and aligns with the UN Declaration of Human Rights and the UN Global Compact principles. The UN Guiding Principles on Business and Human Rights require companies to address three aspects to fulfil their responsibility to respect human rights: express a commitment to human rights through a policy statement; perform human rights due diligence to identify, prevent, mitigate and account for potential human rights impacts; and provide remediation where business enterprises have been identified as having caused or contributed to adverse human rights impacts. We meet these requirements by embedding them into our Company systems and processes.
BHP Billiton’s commitment to human rights is publicly stated in ourCode of Business Conduct (the Code), which clearly outlines our responsibilities and expectations. All employees and certain contractors are provided with the Code on commencement of employment with BHP Billiton, and it is a condition of that employment that they behave in accordance with the Code. Annual risk-basedCode of Business Conduct training and communication plans must be completed and executed by each area of the Group. In addition, we measure effectiveness and obtain assurance of our human rights processes through the internal audits of our GLDs.
As part of our human rights due diligence process, our operations are required to identify and document key potential human rights risks by completing a Human Rights Impact Assessment (HRIA). This includes assessing performance against the articles of the UN Universal Declaration of Human Rights, the UN Global Compact principles, and host country legislation governing human rights issues. We require each HRIA to be reviewed internally on an annual basis.
Every three years, each HRIA is required to be verified through an engagement process with stakeholders and, in medium- and high-risk jurisdictions, validated by a qualified human rights specialist. Where a HRIA identifies a material risk, a Human Rights Management Plan is required to be implemented and reviewed annually. Selected employees and contractors receive training on compliance with BHP Billiton’s human rights commitments.
Managing our security-related material risks
The nature and global reach of our organisation can result in our people working in countries where there is potential exposure to personal and business risks. We require an assessment of each country for the degree of risk associated with visiting, exploring and operating within it, and appropriate controls are developed to mitigate identified risks.
Through our commitment to the Voluntary Principles on Security and Human Rights (VPs), we seek to protect people and property from material security-related risks. Performance requirements related to the VPs are implemented through ourSecurity and Emergency Management GLD. Our operations are required to identify security-related material risks to people and property, and engage relevant stakeholders to develop and manage security programs that respect human rights and fundamental freedoms.
In addition, we require our operations to conduct an annual review for alignment with the VPs and implement an improvement plan to close identified gaps. The process also provides an opportunity to further build awareness and understanding of the VPs across the Company.
Respecting and including Indigenous communities
As many of our operations are located on or near Indigenous peoples’ lands, it is important we recognise the traditional rights and values of Indigenous peoples, respect their cultural heritage and the significance of their lands and provide opportunities for inclusion and advancement.
BHP Billiton’s approach to engaging with and supporting Indigenous peoples is articulated in our Indigenous Peoples Policy Statement, which was developed and approved by our GMC in FY2015. Implementation of the Policy Statement will help us strengthen relationships with Indigenous peoples and be a valued partner in their economic, social and cultural empowerment. We are currently in the process of developing a Group-wide Indigenous Peoples Strategy to guide implementation of the Policy Statement.
As a member of the ICMM, our Indigenous Peoples Policy Statement is consistent with the 2013 ICMM Indigenous Peoples and Mining Position Statement and is implemented in accordance with ourCommunity GLD.
Commitments through our Policy Statement include understanding Indigenous peoples’ rights and interests; building cross-cultural understanding; agreeing on appropriate engagement processes; and ensuring effective
participation in decision-making. A number of related commitments address how we engage where government is responsible for managing Indigenous peoples’ interests and how to move forward when differences of opinion arise.
Our Policy Statement specifically addresses the issue of free, prior and informed consent through committing to seek the consent of Indigenous peoples for new operations or major capital projects that are located on lands traditionally owned by, or under customary use of, Indigenous peoples and which are likely to have significant adverse impacts on Indigenous peoples.
In making this commitment, we recognise the right of governments to ultimately make decisions on the development of resources and that, in most countries, neither Indigenous peoples nor other groups have a right to veto projects. Where consent cannot be reached, a host government may decide to proceed with a project after balancing the rights and interests of Indigenous peoples with the wider population. In these circumstances, BHP Billiton will determine whether we remain involved with the project. The BHP Billiton Indigenous Peoples Policy Statement can be found in our Sustainability Report 2015.
Respecting customary rights
At a very early stage of a project, we seek to identify customary owners, occupiers and users of the land on which we intend to operate, as well as conduct land usage surveys. Knowing who is connected to the land and how it is used is critical to establishing effective community consultation and engagement. This helps to ensure people potentially affected by our operations are fully aware of our activities and have an opportunity to express their concerns and aspirations.
In instances where land may be used for customary purposes and no formal land title has been issued, information is requested from relevant organisations, including government authorities with responsibilities for customary land uses, and Indigenous peoples’ representative organisations, such as land and tribal councils. Further enquiries are also made directly with the people in the area to help identify those with connections to the land. Arising from this engagement, the operational work plan may be amended to reduce potential impacts on landowners and users.
Our projects are designed in a way that avoids or minimises resettlement of individuals or communities. If resettlement is required (voluntary or involuntary), programs must be implemented consistent with the requirements set out in the International Finance Corporation’s Performance Standard 5, Land Acquisition and Involuntary Resettlement. This includes being planned and implemented in a participatory manner that leads to a demonstrable improvement in livelihoods of the displaced persons or communities.
Ok Tedi
BHP Billiton exited from Ok Tedi Mining Limited (OTML) in February 2002. The exit arrangements included the transfer of BHP Billiton’s shares in OTML to Papua New Guinea Sustainable Development Program Limited (PNGSDP) and a statutory undertaking protecting BHP Billiton from environmental claims by the PNG Government. In September 2013, the PNG Parliament passed laws which compulsorily acquired PNGSDP’s shares in OTML and changed other aspects of the exit arrangements, including the repeal of the protection from environmental claims by the PNG Government. PNGSDP is challenging the validity of actions taken by the PNG Government to restructure and obtain control of PNGSDP. BHP Billiton retains an indemnity from PNGSDP in respect of environmental claims by the PNG Government and certain environmental claims by third parties. This indemnity is secured against certain key assets of PNGSDP. BHP Billiton remains committed to ensuring that the substantial long-term fund held by PNGSDP remains well governed for the benefit of the people of Papua New Guinea and the Western Province in particular.
Making a positive contribution to society
We know we are successful when our host communities value their relationship with us. Our aim is to work alongside host communities to help them achieve sustainable economic and social benefits, as well as diversified
and resilient local economies, so that these benefits continue beyond the life of our operations. Our broader contribution to local economies can be realised through indirect employment and our support of local businesses that provide a range of services and products, which enable our operations to function effectively.
Our operations around the world support local and national economies through creating jobs, providing infrastructure, purchasing goods and services and contributing significant payments of taxes and royalties to governments. By supplying many of our commodities to markets in developing countries, we also support economic development to help improve living standards and quality of life.
Improving the quality of life in our host communities
We aim to be partners with our host communities and are committed to understanding their needs and priorities. We seek to invest in projects that will continue to promote a benefit to the community beyond the life of the project. Using data from a social baseline study and social impact and opportunity assessment, we prepare a community development management plan. Community development projects and donations are required to be aligned to the overall community development management plan, implemented in consultation with local stakeholders, and meet our due diligence and anti-corruption requirements.
We voluntarily invest one per cent of our pre-tax profit, calculated on the average of the previous three years’ pre-tax profit, in community programs that aim to have a long-lasting, positive impact on people’s quality of life, including implementing new and supporting existing community projects. With a focus on improving quality of life, our community development programs are developed by working openly with governments and the communities in which we operate, and focusing on the needs and resources of our key stakeholders. This is how we are contributing to economic and social development.
During FY2015, our voluntary community investment totalled US$225 million, comprising US$142 million cash, in-kind support and administrative costs, and a US$83 million contribution to the BHP Billiton Foundation. The BHP Billiton Foundation was established in FY2013 to identify and support large sustainable development projects in countries and regions of interest to BHP Billiton, in order to complement the local programs managed by our assets. This builds on contributions that have previously been paid to the BHP Billiton Sustainable Communities charitable organisation. At the end of FY2015, BHP Billiton Sustainable Communities had a total of US$62.5 million and the BHP Billiton Foundation had a total of US$219.2 million in funds available for future sustainable development projects.
Community investment (US$M)
| | | | | | | | | | | | |
Year ended 30 June | | 2015 | | | 2014 | | | 2013 | |
Expenditure (1) (including in-kind support and administrative costs) | | | 142.0 | | | | 141.7 | | | | 139.8 | |
Contribution into BHP Billiton Sustainable Communities and BHP Billiton Foundation | | | 83.0 | | | | 100.0 | | | | 106.0 | |
| | | | | | | | | | | | |
Total Community investment | | | 225.0 | | | | 241.7 | | | | 245.8 | |
| | | | | | | | | | | | |
| (1) | Includes BHP Billiton’s equity share for both operated and non-operated joint venture operations. Includes payments made by operations demerged with South32. |
BHP Billiton Social Investment Framework
During FY2015, we developed a new BHP Billiton Social Investment Framework to guide our approach to voluntary social investment (social and environmental programs with net social benefit) between FY2016 and FY2020, providing a unified and integrated framework across our Company. The Framework is the outcome of an extensive review of BHP Billiton’s existing approach to social investment and has been informed by a thorough analysis of information about our internal and external operating context. Specific inputs to the review
included our material sustainability risks, emerging global trends and the stakeholder needs and expectations of our host communities. Using this information to inform our Social Investment Framework has ensured a strong linkage between our business and social investment objectives.
BHP Billiton is committed to ensuring our significant social investment adds value to the communities in which we operate and leaves behind a lasting change. Details of our new Social Investment Framework can be found in our Sustainability Report 2015.
1.15 Additional information
1.15.1 External factors and trends
The following section describes some of the external factors and trends that have had a material impact on our financial condition and results of operations. We operate our business in a dynamic and changing environment and with information that is rarely complete and exact. We primarily manage the risks discussed in this section under our portfolio risk management approach, which relies on the effects of diversification, rather than individual risk management programs. Details of our risk factors can be found in section 1.7.2 of this Annual Report. Details of our financial risk management strategies and financial instruments outstanding at 30 June 2015 can be found in section 1.7.3 of this Annual Report and in note 23 ‘Financial risk management’ to the Financial Statements.
Management monitors particular trends arising from external factors with a view to managing the potential impact on our future financial condition and results of operations. The following external factors could have a material adverse effect on our business and areas where we make decisions on the basis of information that is incomplete or uncertain.
Information in this section has been presented on a Continuing operations basis to exclude the contribution from assets that were demerged with South32, unless otherwise noted. Details of the contribution of the South32 assets to the Group’s results are disclosed in note 29 ‘Discontinued operations’ to the Financial Statements.
Commodity prices
The prices we obtain for our products represent a key driver of our business, and fluctuations in these commodity prices affect our results, including cash flows and asset values. The estimated impact on FY2015 profit after taxation of changes of commodity prices is set out below.
| | | | |
| | US$M | |
US$1/bbl on oil price | | | 54 | |
US¢10/MMBtu on US gas price | | | 27 | |
US¢1/lb on copper price | | | 24 | |
US$1/t on iron ore price | | | 144 | |
US$1/t on metallurgical coal price | | | 23 | |
US$1/t on energy coal price | | | 11 | |
US¢1/lb on nickel price | | | 2 | |
Commodity markets were influenced by modest growth in global economic activity in FY2015. Solid momentum in the US economy, supported by improved growth in the Eurozone and Japan, saw developed economies contribute an improved share of activity relative to emerging markets. A number of emerging economies, including China, saw growth slow while Russia and Brazil experienced recessions. In the case of most steelmaking raw materials and energy commodities, supply growth was greater than demand growth resulting in lower prices. The price for crude oil dropped significantly, while the Henry Hub gas price declined on higher supply and increased inventory levels relative to the previous year. The Asian LNG price dropped on greater
supply and lower oil prices. The copper price was also lower as supply disruptions were offset by weaker than expected consumption. Although aluminium demand grew, supply exceeded consumption due to increasing production from China. In the manganese market, the supply side response to weak demand growth was slower than expected resulting in a decrease in prices.
The following tables show the prices for our most significant commodities for the years ended 30 June 2015, 2014 and 2013, on both a Continuing and Discontinued operations basis. These prices represent selected quoted prices from the relevant sources as indicated, and will differ from the realised prices on the sale of the Group’s production due to differences in quotation periods, quality of products, delivery terms and the range of quoted prices that are used for contracting sales in different markets.
Continuing operations
| | | | | | | | | | | | | | | | | | | | | | | | |
Year ended 30 June | | 2015
Closing | | | 2014
Closing | | | 2013
Closing | | | 2015
Average | | | 2014
Average | | | 2013
Average | |
Natural gas Henry Hub (1) (US$/MMBtu) | | | 2.81 | | | | 4.39 | | | | 3.73 | | | | 3.32 | | | | 4.25 | | | | 3.44 | |
Natural gas Asian Spot LNG (2) (US$/MMBtu) | | | 7.30 | | | | 11.28 | | | | 15.40 | | | | 9.74 | | | | 16.38 | | | | 15.14 | |
Crude oil (Brent) (3) (US$/bbl) | | | 61.05 | | | | 111.02 | | | | 102.46 | | | | 73.91 | | | | 109.36 | | | | 108.64 | |
Ethane (4) (US$/bbl) | | | 8.40 | | | | 12.02 | | | | 9.92 | | | | 8.56 | | | | 11.92 | | | | 12.15 | |
Propane (5) (US$/bbl) | | | 16.25 | | | | 44.47 | | | | 35.52 | | | | 29.34 | | | | 48.05 | | | | 37.31 | |
Butane (6) (US$/bbl) | | | 23.89 | | | | 54.39 | | | | 49.51 | | | | 36.89 | | | | 56.70 | | | | 61.74 | |
Copper (LME cash) (US$/lb) | | | 2.60 | | | | 3.15 | | | | 3.06 | | | | 2.89 | | | | 3.18 | | | | 3.48 | |
Iron ore (7) (US$/dmt) | | | 59.50 | | | | 93.25 | | | | 116.25 | | | | 71.61 | | | | 122.70 | | | | 127.23 | |
Metallurgical coal (8) (US$/t) | | | 88.00 | | | | 110.50 | | | | 130.00 | | | | 102.91 | | | | 128.40 | | | | 159.13 | |
Energy coal (9) (US$/t) | | | 61.66 | | | | 70.89 | | | | 78.89 | | | | 64.37 | | | | 78.38 | | | | 89.10 | |
Nickel (LME cash) (US$/lb) | | | 5.30 | | | | 8.49 | | | | 6.21 | | | | 7.02 | | | | 6.88 | | | | 7.43 | |
| (1) | Platts Gas based on Henry Hub – typically applies to gas sales in the US gas market. |
| (2) | Platts Liquefied Natural Gas Delivery Ex-Ship (DES) Japan/Korea Marker – typically applies to Asian LNG spot sales. |
| (3) | Platts Dated Brent is a benchmark price assessment of the spot market value of physical cargoes of North Sea light sweet crude oil. |
| (4) | OPIS Mont Belvieu non-Tet Ethane – typically applies to ethane sales in the US Gulf Coast market. |
| (5) | OPIS Mont Belvieu non-Tet Propane – typically applies to propane sales in the US Gulf Coast market. |
| (6) | OPIS Mont Belvieu non-Tet Normal Butane – typically applies to butane sales in the US Gulf Coast market. |
| (7) | Platts 62 per cent Fe Cost and Freight (CFR) China – used for fines. |
| (8) | Platts Low-Vol hard coking coal Index FOB Australia – representative of high-quality hard coking coals. |
| (9) | GlobalCOAL FOB Newcastle 6,000kcal/kg NCV – typically applies to coal sales in the Asia Pacific market. |
The following summarises the average and closing pricing trends of our most significant commodities for FY2015.
Natural gas Henry Hub: The Platts US Henry Hub natural gas price decreased by 22 per cent during FY2015. The decrease was a result of increased production growth, partially offset by consumption growth in the power sector. Natural gas inventories ended the year at 2,577 Billion cubic feet (Bcf), one per cent above the five-year average and 35 per cent higher year-on-year. The year-end price was 15 per cent below the average for the year. Since 30 June 2015, the US Henry Hub natural gas price decreased five per cent on 31 August 2015.
Natural gas Asian Spot LNG: The Asian liquefied natural gas spot price decreased by 41 per cent during FY2015. The decrease was driven by weaker north Asian end-user demand and ample global supply availability. In turn, this allowed for more spot purchases on lower prices and provided some support for Asian buyers to maintain higher inventory levels. Meanwhile, the drop in crude oil prices has had a lagged negative impact on oil-linked LNG contracts in the second half of FY2015. The year-end price was 25 per cent below the average for the year.
Crude oil: The Platts Dated Brent crude price decreased by 32 per cent during FY2015 following increases in global crude supply, particularly from US production, growing faster than demand. Libyan supply outages returned to market in the latter half of CY2014, and OPEC decided to maintain its production levels. The year-end price was 17 per cent below the average for the year. Since 30 June 2015, the Dated Brent crude price decreased 21 per cent on 28 August 2015.
NGL: A barrel of natural gas liquids consists mainly of ethane and liquefied petroleum gas (propane and butane). The Mont Belvieu ethane and propane price decreased by 28 per cent and 39 per cent, respectively, during FY2015 following increases in ethane and propane supply. Mont Belvieu butane prices decreased by 35 per cent during FY2015 following a decrease in the West Texas Intermediate oil price. The year-end propane and butane prices were 45 per cent and 35 per cent below the average for the year, respectively. Since 30 June 2015, the Mont Belvieu ethane price decreased seven per cent and the Mont Belvieu propane price increased nine per cent on 31 August 2015.
Copper: The London Metal Exchange (LME) copper cash settlement price decreased by nine per cent in FY2015. The copper price trended downwards during the first seven months amid improved supply, weaker than anticipated consumption and the strengthening of the US dollar. The price decreased to a five-year low in mid-January on short-selling by Chinese-backed hedge funds. The price increased in February, impacted by Chilean supply disruption due to flooding, while softening of Chinese demand dampened prices since May. Since 30 June 2015, the copper price decreased 11 per cent on 28 August 2015.
Iron ore: The Platts 62 per cent iron ore CFR China decreased 42 per cent over FY2015 as low-cost seaborne iron ore supply outpaced demand growth. Productivity and cost compression on the supply side also impacted price as mining companies lowered their cost structures in response to the changed environment. The year-end price was 17 per cent below the average price for the year. Since 30 June 2015, the iron ore CFR price decreased six per cent on 31 August 2015.
Metallurgical coal: The Platts Low-Vol Hard Coking Coal Index decreased by 20 per cent during FY2015. While demand from traditional markets recovered steadily, the price decrease was mainly driven by continuing supply growth and weak Chinese demand. The year-end price was 15 per cent below the average price for the year. Since 30 June 2015, the Hard Coking Coal Index decreased eight per cent on 31 August 2015.
Energy coal: The globalCOAL Newcastle FOB price decreased by 18 per cent during FY2015. The decrease was driven by weak Chinese seaborne demand, despite healthy growth from India, and sustained supply from Australia and Indonesia supported by depreciating currencies. Since 30 June 2015, the Newcastle energy coal price decreased seven per cent on 31 August 2015.
Nickel: The LME cash settlement nickel price increased two per cent during FY2015 though the price decreased over the course of the financial year driven by weak demand and adequate supply, as evidenced by rising LME stocks. The year-end price was 25 per cent below the average price for the year. Since 30 June 2015, the nickel price decreased 14 per cent on 28 August 2015.
Discontinued operations
| | | | | | | | | | | | | | | | | | | | | | | | |
Year ended 30 June (1) | | 2015
Closing | | | 2014
Closing | | | 2013
Closing | | | 2015
Average | | | 2014
Average | | | 2013
Average | |
Aluminium (LME cash) (US$/t) | | | 1,647 | | | | 1,851 | | | | 1,731 | | | | 1,880 | | | | 1,764 | | | | 1,938 | |
Alumina (2) (US$/t) | | | 323 | | | | 312 | | | | 318 | | | | 339 | | | | 321 | | | | 327 | |
Manganese Alloys (3) (US$/t) | | | 821 | | | | 999 | | | | 1,038 | | | | 879 | | | | 1,020 | | | | 1,106 | |
Manganese Ores (4) (US$/dmtu) | | | 2.98 | | | | 4.20 | | | | 5.54 | | | | 3.89 | | | | 4.95 | | | | 5.29 | |
| (1) | Post-demerger BHP Billiton’s results will not be impacted by fluctuations in the prices of commodities (aluminium, alumina, manganese alloys and ores) that no longer form part of post-demerger operations. Refer to section 1.6.4 for more details. |
| (2) | Platts PAX Free on Board (FOB) Australia – market price assessment of calcined metallurgical/smelter grade alumina. |
| (3) | Bulk FerroAlloy high carbon ferromanganese (HCFeMn) Western Europe DDP. |
| (4) | Metal Bulletin manganese ore 44 per cent Mn Cost Insurance Freight (CIF). |
The FY2015 pricing trends for the commodities that comprise our Discontinued operations were as follows:
Aluminium: The LME cash settlement price increased by seven per cent during FY2015. However, price premiums in Japan, Europe and the United States ended lower, reflecting the market surplus on increasing production from China. The year-end price was 12 per cent below the average for the year.
Alumina: The FOB Australia price increased six per cent during FY2015, supported by a lack of bauxite availability as a result of the Indonesian ore ban, and growing demand from China.
Manganese: The Metal Bulletin manganese ore China CIF price decreased 21 per cent during FY2015. Demand growth slowed and the market was well supplied amid high Chinese inventories. The year-end price was 23 per cent below the average price for the year. The Western Europe spot high carbon ferromanganese price decreased 14 per cent during FY2015, driven by persistent oversupply and the currency depreciation of major producers in India, Australia, South Africa and Europe.
Exchange rates
We remain exposed to exchange rate transaction risk on foreign currency sales and purchases, as we believe active currency hedging does not provide long-term benefits to our shareholders. Operating costs and costs of locally sourced equipment are influenced by fluctuations in local currencies, primarily the Australian dollar and Chilean peso. Foreign exchange gains and losses reflected in operating costs owing to fluctuations in the local currencies relative to the US dollar may potentially offset one another. The majority of our sales are denominated in US dollars and we borrow and hold surplus cash predominately in US dollars; those transactions and balances provide no foreign exchange exposure relative to the US dollar functional currency of the Group.
The US dollar strengthened against our main local currencies during FY2015, resulting in stronger average US dollar rates versus the Australian dollar and Chilean peso. Average and closing exchange rates for current and prior periods are contained within note 42 ‘Functional and presentation currency’ to the Financial Statements.
We are also exposed to exchange rate translation risk in relation to net monetary liabilities, being our foreign currency denominated monetary assets and liabilities, including certain debt and other long-term liabilities. Details of our exposure to foreign currency fluctuations are contained within note 23 ‘Financial risk management’ to the Financial Statements.
Changes in product demand and supply
The global economy grew at a modest rate in FY2015 with a mild improvement in developed economies offsetting a moderation in emerging markets.
In China, a slowdown in the property sector and fixed asset investment led to lower economic growth following policy tightening in CY2014. Consumer spending remained resilient reflecting the continued rebalancing of the economy. A number of interest rate reductions, cuts in bank reserve requirements, boosts to infrastructure spending and administrative measures supporting the property market are likely to buttress growth over the remainder of CY2015. In line with our expectations, the economy is growing more slowly, though off a higher base, as it matures over the medium term and the government’s reform program promotes domestic consumption over investment. We expect near-term volatility to continue as the authorities press ahead with reform in a cautious but sustained manner as they seek to improve the efficiency of capital allocation in the economy while maintaining support for employment. However, our robust longer-term outlook for China remains intact as the economy transitions.
The US economy continued to improve despite weakness in the March 2015 quarter caused by severe weather in the northeast and a stronger US dollar. Ongoing strength in the labour market, rising disposable incomes, higher equity markets and improved housing prices supported consumer demand. After a period in which businesses failed to respond to improved economic conditions and higher levels of profitability, corporate investment has begun to show signs of recovery. The Federal Reserve is expected to begin increasing interest rates in the first half of FY2016.
The European Central Bank began a program of quantitative easing in March 2015, which appears to be driving a modest pick-up in economic growth. Activity has improved across the Eurozone, with the exception of Greece, reflecting a broad-based lift in domestic demand and we expect the improvement in growth to continue in FY2016.
Japan’s economy saw growth improve in annualised terms as the year progressed, supported by the Bank of Japan’s quantitative easing and a weaker yen. Growth should be supported by stronger business investment into FY2016. A longer-term, sustainable recovery is contingent on the scale and speed of structural reform.
Commodity prices generally trended downwards in FY2015, with prices for most of our commodities notably lower going into the new financial year.
Chinese steel production declined by 1.3 per cent in the second half of FY2015 versus the corresponding period in FY2014, triggered largely by a slowing construction sector. New construction starts were lower this year due to considerable levels of existing stock. Although China’s steel exports are at an all-time high, we expect subdued crude steel production growth over the remainder of CY2015 with some upside potential should the construction sector recover. However, with steel stock per capita still well below that of developed nations, we expect moderate but sustainable growth in Chinese steel production over the next decade. An extended view on the life cycle of steel usage has resulted in a lower but longer plateau for crude steel production, peaking between 935 Mt and 985 Mt in the middle of the next decade. The implications for pig iron demand, and therefore iron ore and metallurgical coal, are mitigated in the medium term by lower scrap availability as the scrap cycle in China will take longer to develop. Outside China, steel production growth is improving steadily driven by India, the Middle East and South-East Asia.
The supply of most steelmaking raw materials has grown faster than demand. In iron ore, we estimate that approximately 100 Mt of incremental lower cost seaborne supply will enter the market in CY2015, outweighing demand growth. In this context, higher cost Chinese domestic production, along with high-cost seaborne exports, continues to exit the market. Private mines in China have seen their operating rates fall from approximately 90 per cent in CY2011 to approximately 35 per cent today. Many producers have also cut their costs. As a result, the iron ore cost curve has both flattened and fallen from previous levels.
In metallurgical coal, while uneconomic high-cost supply has slowly withdrawn from the seaborne market, prices remain subdued as industry-wide cost reductions and weaker producer currencies against the US dollar support continued production from marginal suppliers. Recent quality restrictions have also weakened China’s import demand but this was partially offset by growth in traditional markets. The long-term outlook remains robust as the supply of premium hard coking coals becomes scarce.
Depreciating currencies have sustained Indonesian and Australian thermal coal exports, prolonging the weak pricing environment. Despite healthy seaborne demand growth from India, China’s import demand has weakened, limiting prospects for price recovery in the near term.
In copper, prices were affected by weaker than expected consumption and the strengthening US dollar. In the near term, new supply under development is expected to keep the market well supplied. However, a deficit is expected to emerge at the end of this decade as grade decline, rising costs and a scarcity of high-quality future development opportunities are likely to constrain the industry’s ability to meet attractive demand growth.
Global crude oil demand growth was outpaced by supply growth putting pressure on prices throughout the year. Despite strong demand growth, liquids supply exceeded demand by 2.6 MMboe/d in the second half of FY2015. We expect prices to remain range bound in the short term due to available supply capacity from the United States and OPEC. The long-term demand outlook remains healthy, underpinned by the transport sector, notably in the Asian region.
US natural gas prices declined during the year as production growth was only partially offset by increased consumption in the power sector. In the longer term, demand is expected to benefit from increasing industrial use, growth in gas-fired power generation and the start of LNG exports. As core acreage is depleted, less productive and higher cost shale areas will be required to meet growing demand. In the LNG market, weaker North Asian end-user demand and ample supply have kept prices subdued.
We expect modest growth of the global economy. In the longer term, urbanisation and industrialisation will remain the primary drivers of commodity demand. The transition to consumption-led growth in emerging economies should provide particular support for industrial metals, energy and fertilisers.
Capital expenditure
Capital expenditure is important in pursuing our strategy through the development of large-scale resource projects and in sustaining our existing operations. Capital expenditure is disclosed for each Business in section 1.6.3 of this Annual Report.
Operating costs
Information in this section has been presented on a Continuing operations basis to exclude the contribution from assets that were demerged with South32, unless otherwise noted. Details of the contribution of the South32 assets to the Group’s results are disclosed in note 29 ‘Discontinued operations’ to the Financial Statements.
As the prices for our products are determined by the global commodity markets in which we operate, we do not generally have the ability to offset cost pressures through corresponding price increases; therefore, controlling our operating costs is a key driver of our results. Operating costs for the last three years are set out in section 1.11.1 as well as an analysis of the change in Total expenses. Further analysis of the factors that impacted expenses during FY2015 is set out below and in section 1.15.3.
In discussing the factors that affected Total expenses, we refer to the change in operating cash costs and change in exploration and business development. Collectively we refer to these as change in controllable cash costs. Operating cash costs by definition do not include non-cash costs being depreciation, amortisation, impairments,
movements in deferred stripping balances and movements in provisions. The change in operating cash costs also excludes the impact of exchange rates and inflation on the actual costs incurred in the corresponding period, changes in fuel and energy costs, changes in exploration and business development costs and one-off items. These items are excluded so as to provide a consistent measurement of changes in costs across all the Businesses based on the factors that are within their control and responsibility.
Change in operating cash costs and change in controllable cash costs are not measures that are recognised under International Financial Reporting Standards (IFRS) and they may differ from similarly titled measures reported by other companies. A reconciliation of the movements in Underlying EBIT to the financial statement line items in the Consolidated Income Statement is included in section 2.5 of this Annual Report.
Our focus on reducing operating costs through productivity initiatives saw a decrease in operating cash costs of US$2.7 billion and a reduction in exploration and business development of US$29 million for a combined reduction in controllable cash costs of US$2.7 billion. In addition, the improvement in operating costs was complemented by favourable exchange rate impacts of US$1.7 billion. These improvements were partially offset by inflation of US$433 million and an increase in the production costs associated with higher volumes of US$3.2 billion. With higher depreciation and amortisation charges of US$1.4 billion and higher impairment charges of US$350 million. Total expenses excluding exceptional items of US$3.2 billion decreased from US$36.5 billion to US$33.8 billion.
Exploration and development of resources
Minerals exploration
Over the past six years, brownfield exploration has increased our reserve base around our portfolio of existing assets in large resource basins, which now provide us with growth opportunities. This has allowed us to reduce brownfield exploration expenditure and rationalise our greenfield exploration program.
Greenfield minerals (new sites) exploration is focused on advancing targets within Chile, Peru, southwestern United States and is organised through our Copper Business. Greenfield activities include opportunity identification, application for and acquisition of mineral title, early reconnaissance operations and multi-million dollar delineation drilling programs.
In addition to our activities focused on finding new world-class deposits, several of our Businesses undertake brownfield exploration, principally aimed at delineating and categorising mineral deposits near existing operations, and advancing projects through the development pipeline.
Our expenditure on minerals exploration over the last three financial years is set out below.
| | | | | | | | | | | | |
Year ended 30 June | | 2015 | | | 2014 | | | 2013 | |
| | US$M | | | US$M
Restated | | | US$M
Restated | |
Greenfield exploration | | | 55 | | | | 46 | | | | 179 | |
Brownfield exploration | | | 194 | | | | 340 | | | | 467 | |
| | | | | | | | | | | | |
Total minerals exploration (1) | | | 249 | | | | 386 | | | | 646 | |
| | | | | | | | | | | | |
| (1) | Excludes minerals exploration from Discontinued operations. |
The Group’s minerals exploration expenditure declined by 36 per cent in FY2015 to US$249 million as we sharpened our focus on advancing copper targets within Chile, Peru and southwestern United States.
Petroleum exploration
We have reduced exploration expenditure in Petroleum over recent years with a focus on high-impact liquids opportunities in the Gulf of Mexico, Western Australia and Trinidad and Tobago.
| | | | | | | | | | | | |
Year ended 30 June | | 2015
US$M | | | 2014
US$M | | | 2013
US$M | |
| | | |
Petroleum exploration | | | 567 | | | | 600 | | | | 675 | |
Exploration expense
Exploration expense represents that portion of exploration expenditure that is not capitalised in accordance with our accounting policies, as set out in note 43 ‘Significant accounting policies’ to the Financial Statements.
Exploration expense for each Business over the three-year period is set out below.
| | | | | | | | | | | | |
Year ended 30 June | | 2015
US$M | | | 2014
US$M
Restated | | | 2013
US$M
Restated | |
| | | |
Exploration expense (1) (2) | | | | | | | | | | | | |
Petroleum and Potash | | | 532 | | | | 544 | | | | 709 | |
Copper | | | 90 | | | | 111 | | | | 266 | |
Iron Ore | | | 38 | | | | 56 | | | | 74 | |
Coal | | | 20 | | | | 29 | | | | 32 | |
Group and unallocated items | | | 18 | | | | 30 | | | | 47 | |
| | | | | | | | | | | | |
BHP Billiton Group | | | 698 | | | | 770 | | | | 1,128 | |
| | | | | | | | | | | | |
| (1) | Excludes exploration expenses from Discontinued operations. |
| (2) | Includes US$28 million (2014: US$72 million; 2013: US$102 million) exploration expense previously capitalised, written off as impaired. |
Following our focus on productivity and reducing costs, the reduction in the Group’s exploration expense, excluding impairment of exploration expenditure previously capitalised, increased Underlying EBIT in FY2015 by US$28 million.
Interest rates
We are exposed to interest rate risk on our outstanding borrowings and investments. Our policy on interest rate exposure is to pay or receive on a US dollar floating interest rate basis. To achieve this policy, we often use derivative financial instruments, including cross currency and interest rate swaps, to convert an underlying exposure to a US dollar floating rate exposure. Deviation from our policy requires approval from our Financial Risk Management Committee and is managed within our portfolio risk management approach.
Our earnings are sensitive to changes in interest rates on the floating component of the Group’s net borrowings. Our main exposure is to the 3 month US LIBOR benchmark, which increased by 0.010 per cent in FY2015 to an average of 0.252 per cent. Further information, including the Group’s sensitivity to movements in interest rates, can be found in note 23 ‘Financial risk management’ to the Financial Statements.
Health, safety, environment and community
We operate in an industry where many of our activities are highly regulated by laws governing health, safety and the environment. We are committed to compliance with the laws and regulations of the countries in which we
operate and, where applicable, to exceeding legal and other requirements which are less stringent than our own. However, regulatory standards and community expectations are constantly evolving. As a result, we may be exposed to increased litigation, compliance costs and unforeseen environmental rehabilitation expenses, despite our best efforts to work with governments, community groups and scientists to keep pace with regulations, law and public expectations.
Further information about our compliance with HSEC regulations can be found in section 1.14 of this Annual Report.
Insurance
During FY2015, we maintained an insurance program encompassing property damage, business interruption, sabotage and terrorism, marine cargo, construction, directors’ and officers’ liability and public and certain other liabilities. The program includes a combination of self-insurance via subsidiary captive insurance companies, industry mutuals and external market insurance and reinsurance. Mandates are established as to risk retention levels, policy cover and, where applicable, insurance and reinsurance counterparty security. As part of our portfolio risk management approach, we regularly conduct an assessment of maximum foreseeable loss potential, cash flow at risk, loss experience, claims received and insurance premiums paid, and will make adjustments to the balance of self-insurance and external insurance and reinsurance as required.
The Group is largely self-insured for losses arising from property damage and business interruption, sabotage and terrorism, marine cargo, construction, primary public liability and employee benefits. For these risks, we internally insure our Businesses (for wholly owned assets and, where permissible, by local insurance regulation and/or commercial market terms our share of joint venture assets) via our captive insurance companies. Any losses incurred will consequently impact the Financial Statements as they arise.
1.15.2 Application of critical accounting policies
The preparation of the Consolidated Financial Statements requires management to make judgements and estimates and form assumptions that affect the amounts of assets, liabilities, contingent liabilities, revenues and expenses reported in the Financial Statements. On an ongoing basis, management evaluates its judgements and estimates in relation to assets, liabilities, contingent liabilities, revenue and expenses. Management bases its judgements and estimates on historical experience and on other factors it believes to be reasonable under the circumstances, the results of which form the basis of the reported amounts that are not readily apparent from other sources. Actual results may differ from these estimates under different assumptions and conditions.
The Group has identified the following critical accounting policies under which significant judgements, estimates and assumptions are made and where actual results may differ from these estimates under different assumptions and conditions and may materially affect financial results or the financial position reported in future periods:
reserve estimates;
exploration and evaluation expenditure;
development expenditure;
taxation;
property, plant and equipment and intangible assets – recoverable amount; and
provision for closure and rehabilitation.
In accordance with IFRS, we are required to include information regarding the nature of the estimates and judgements and potential impacts on our financial results or financial position in the Financial Statements. This information can be found in note 44 ‘Application of accounting estimates, assumptions and judgements’ to the Financial Statements.
1.15.3 Operating results
The following table describes the approximate impact of the principal factors that affected Underlying EBIT for FY2015 and FY2014. Underlying EBIT is earnings before net finance costs, taxation, Discontinued operations and any exceptional items.
| | | | | | | | |
Year ended 30 June | | 2015
US$M | | | 2014
US$M
Restated | |
| | |
Underlying EBIT | | | 22,098 | | | | 21,680 | |
Net price impact: | | | | | | | | |
Change in sales prices | | | (16,433 | ) | | | (2,639 | ) |
Price-linked costs | | | 1,209 | | | | (111 | ) |
| | | | | | | | |
| | | (15,224 | ) | | | (2,750 | ) |
| | | | | | | | |
Change in volumes: | | | | | | | | |
Productivity | | | 1,220 | | | | 1,029 | |
Growth | | | 1,822 | | | | 1,929 | |
| | | | | | | | |
| | | 3,042 | | | | 2,958 | |
| | | | | | | | |
Change in controllable cash costs: | | | | | | | | |
Operating cash costs | | | 2,678 | | | | 1,131 | |
Exploration and business development | | | 29 | | | | 398 | |
| | | | | | | | |
| | | 2,707 | | | | 1,529 | |
| | | | | | | | |
Change in other costs: | | | | | | | | |
Exchange rates | | | 1,567 | | | | 1,188 | |
Inflation on costs | | | (433 | ) | | | (575 | ) |
Fuel and energy | | | 518 | | | | (3 | ) |
Non-cash | | | (1,304 | ) | | | (1,737 | ) |
One-off items | | | (456 | ) | | | – | |
| | | | | | | | |
| | | (108 | ) | | | (1,127 | ) |
| | | | | | | | |
Asset sales | | | (72 | ) | | | 61 | |
Ceased and sold operations | | | 22 | | | | (349 | ) |
Share of operating profit from equity accounted investments | | | (637 | ) | | | 43 | |
Other | | | 38 | | | | 53 | |
| | | | | | | | |
Underlying EBIT | | | 11,866 | | | | 22,098 | |
| | | | | | | | |
The method of calculation of the factors that affected Underlying EBIT and the Financial Statement line items of Revenue, Other income and Expenses (excluding net finance costs) that are affected by the factors are as follows.
| | | | |
Factor affecting
Underlying EBIT | | Method of calculation | | Financial statement line item affected |
Change in sales prices | | Change in average realised price for each operation from the corresponding period to the current period, multiplied by current period volumes. | | Revenue |
| | |
Price-linked costs | | Change in price-linked costs for each operation from the corresponding period to the current period, multiplied by current period volumes. | | Expenses |
| | |
Volumes – Productivity | | Change in volumes for each operation not included in the Growth category from the corresponding period to the current period, multiplied by the prior year Underlying EBIT margin. | | Revenue and Expenses |
| | |
Volumes – Growth | | Volume – Growth comprises Underlying EBIT for operations that are new or acquired in the current period minus Underlying EBIT for operations that are new or acquired in the corresponding period, change in volumes for operations identified as a Growth project from the corresponding period to the current period multiplied by the prior year Underlying EBIT margin, and change in volume for Petroleum Business from the corresponding period to the current period multiplied by the prior year Underlying EBIT margin. | | Revenue and Expenses |
| | |
Operating cash costs | | Change in total costs, other than price-linked costs, exchange rates, inflation on costs, fuel and energy costs, non-cash costs and one-off items as defined below for each operation from the corresponding period to the current period. | | Expenses |
| | |
| Exploration and business development | | Exploration and business development expense in the current period minus exploration and business development expense in the corresponding period. | | Expenses |
| | |
Exchange rates | | Change in exchange rate multiplied by current period local currency revenue and expenses. The majority of the Group’s selling prices are denominated in US dollars and so there is little impact of exchange rate changes on Revenue. | | Revenue and Expenses |
| | |
Inflation on costs | | Change in inflation rate applied to expenses, other than depreciation and amortisation, price-linked costs, exploration and business development expenses, expenses in ceased and sold operations and expenses in new and acquired operations. | | Expenses |
| | |
Fuel and energy | | Fuel and energy expense in the current period minus fuel and energy expense in the corresponding period. | | Expenses |
| | |
Non-cash | | Includes non-cash items, mainly depreciation, amortisation and impairments. | | Expenses |
| | |
One-off items | | Change in costs exceeding a pre-determined threshold associated with an unexpected event that had not occurred in the last two years and is not reasonably likely to occur within the next two years. | | Expenses |
| | | | |
Factor affecting
Underlying EBIT | | Method of calculation | | Financial statement line item affected |
Asset sales | | Profit/loss on the sale of assets or operations in the current period minus profit/loss on sale in the corresponding period. | | Other income |
| | |
| Ceased and sold operations | | Underlying EBIT for operations that are ceased or sold operations in the current period minus Underlying EBIT for operations that are ceased or sold in the corresponding period. | | Revenue, Other income and Expenses |
| | |
| Share of operating profit from equity accounted investments | | Share of operating profit from equity accounted investments for the period minus Share of operating profit from equity accounted investments in the corresponding period. | | Share of operating profit from equity accounted investments |
| | |
Other | | Variances not explained by the above factors. | | Revenue, Other income and Expenses |
A reconciliation of the movements in Underlying EBIT for FY2015 to the Financial Statement line items in the Consolidated Income Statement is included in section 2.5 of this Annual Report.
The following commentary describes the principal factors outlined in the table above for FY2015 and FY2014.
Prices
Lower realised prices reduced Underlying EBIT by US$16.4 billion in FY2015. A 41 per cent decline in the average realised price of iron ore was the major contributor and reduced Underlying EBIT by US$9.5 billion. Weaker average realised prices for our Petroleum, Copper and Coal Businesses decreased Underlying EBIT by US$4.2 billion, US$1.6 billion and US$1.1 billion, respectively. A reduction in price-linked costs increased Underlying EBIT by US$1.2 billion and primarily reflected lower royalty charges in our Iron Ore Business.
Volumes
Productivity-led volume efficiencies and the ramp up of major projects underpinned a US$3.0 billion increase in Underlying EBIT. Western Australia Iron Ore (WAIO) was the major contributor as the improved performance of our integrated supply chain and the ramp-up of the Jimblebar mining hub supported a US$1.9 billion increase in Underlying EBIT. A doubling of liquids production from both Black Hawk and Permian supported a further US$799 million volume-related increase in Petroleum’s Underlying EBIT.
Controllable cash costs
Operating cash costs
Our focus on best-in-class performance underpinned a US$2.7 billion reduction in operating cash costs during FY2015.
A reduction in labour, contractor and maintenance costs increased Underlying EBIT by US$1.5 billion during the period. This was most evident in WAIO where the standardisation of our equipment and maintenance systems, and the insourcing of third party services facilitated a step change in the performance of our mining operations. Mining-related efficiencies contributed to a further US$580 million reduction in cash costs and largely reflected improved productivity at Escondida.
Exploration and business development
The Group’s exploration and business development expenditure was broadly in line with FY2014. Our exploration program remains focused on greenfield copper targets within Chile, Peru and the southwestern United States, and petroleum liquids opportunities in the Gulf of Mexico, Western Australia and Trinidad and Tobago.
Other costs
Exchange rates
A stronger US dollar increased Underlying EBIT by US$1.6 billion during the period. This included the restatement of monetary items in the balance sheet, which increased Underlying EBIT by US$637 million relative to FY2014. Further information can be found in note 42 ‘Functional and presentation currency’ to the Financial Statements.
Inflation on costs
The impact of inflation reduced Underlying EBIT by US$433 million during the period. This was most notable in Australia and Chile, which accounted for over 85 per cent of the total variance.
Fuel and energy
A reduction in diesel prices across our minerals businesses supported a US$518 million increase in Underlying EBIT.
Non-cash
An increase in non-cash charges reduced Underlying EBIT by US$1.3 billion during the period.
A US$839 million increase in non-cash charges in our Copper Business reflects: higher ore mined which resulted in increased depletion of stripping capitalised at Escondida; increased depreciation following the completion of the Escondida Oxide Leach Area Project; and a US$199 million impairment driven by a lower copper price and permitting uncertainty for the proposed mine life extension at Cerro Colorado.
A US$639 million increase in non-cash charges in our Petroleum Business reflects: US$316 million of higher depreciation and amortisation charges in Onshore US following the ramp-up of liquids production at Black Hawk and the progressive development of our Permian acreage; and US$328 million of impairment charges associated with the divestment of assets in north Louisiana and the Pecos field in the Permian. During the period, a US$79 million impairment of Neptune was also recognised as the fall in near-term oil prices has affected its value due to its short field life.
The decrease in non-cash charges relates to mine site rehabilitation provision charges recognised in FY2014 for the Group’s North American closed mines.
One-off items
One-off items recognised during the period comprise a US$268 million expense related to the mill outage at Olympic Dam and US$188 million costs associated with the implementation of the Escondida Voluntary Redundancy Program.
Asset sales
The contribution of asset sales to Underlying EBIT decreased by US$72 million from FY2014, which included the sale of Liverpool Bay.
Ceased and sold operations
Underlying EBIT from ceased and sold operations increased by US$22 million in FY2015. This largely reflected an unfavourable US$143 million adjustment to the Browse divestment proceeds, due to unitisation changes subsequent to the completion of the sale, offset by the closure of the Nickel West Leinster Perseverance underground mine, both during FY2014.
Share of operating profit from equity accounted investments
Lower average realised prices received by our equity accounted investments decreased Underlying EBIT US$637 million.
Net finance costs
Net finance costs decreased by US$300 million to US$614 million. The decrease reflected foreign exchange gains on finance leases and the early redemption of the Petrohawk Energy Corporation Senior Notes in August 2014, which resulted in a gain on redemption and lower interest expense.
Taxation expense
The Group’s adjusted effective tax rate, which excludes the influence of exchange rate movements, remeasurement of deferred tax assets associated with the Minerals Resource Rent Tax (MRRT) and exceptional items, was 31.8 per cent (30 June 2014: 32.2 per cent).
Total taxation expense, including royalty-related taxation, exceptional items and exchange rate movements, was US$3.7 billion, representing a statutory effective tax rate of 45.5 per cent (30 June 2014: 31.2 per cent).
Government imposed royalty arrangements calculated by reference to profits are reported as royalty-related taxation. An exceptional item of US$698 million tax expense (2014: US$ nil) was recognised on a Continuing operations basis for the derecognition of deferred tax assets upon the repeal of the MRRT legislation in Australia.
Adjusted effective tax rate is not an IFRS measure and is reconciled to the Statutory effective tax rate below:
| | | | | | | | | | | | | | | | |
| | | 2015 | | | 2014 | |
| | | | | | Restated | |
Year ended 30 June | | Profit
before tax | | Income tax
expense | | % | | | Profit
before tax | | Income tax
expense | | % | |
| | | US$M | | US$M | | | | | US$M | | US$M | | | |
Statutory effective tax rate | | 8,056 | | (3,666) | | | 45.5 | % | | 21,735 | | (6,780) | | | 31.2 | % |
Less: | | | | | | | | | | | | | | | | |
Exchange rate movements | | – | | 339 | | | | | | – | | (34) | | | | |
Remeasurement of deferred tax assets associated with the MRRT | | – | | – | | | | | | – | | (170) | | | | |
Exceptional items | | 3,196 | | (250) | | | | | | (551) | | 166 | | | | |
| | | | | | | | | | | | | | | | |
Adjusted effective tax rate | | 11,252 | | (3,577) | | | 31.8 | % | | 21,184 | | (6,818) | | | 32.2 | % |
| | | | | | | | | | | | | | | | |
Other royalty and excise arrangements that are not profit based are recognised as operating costs within Profit before taxation. These amounted to US$1.7 billion during the period (30 June 2014: US$2.4 billion).
Exceptional items
| | | | | | | | | | | | |
Year ended 30 June 2015 | | Gross | | | Tax | | | Net | |
| | | US$M | | | US$M | | | US$M | |
Exceptional items by category | | | | | | | | | | | | |
Impairment of Onshore US assets | | | (2,787 | ) | | | 829 | | | | (1,958 | ) |
Impairment of Nickel West assets | | | (409 | ) | | | 119 | | | | (290 | ) |
Repeal of Minerals Resource Rent Tax legislation(1) | | | – | | | | (698 | ) | | | (698 | ) |
| | | | | | | | | | | | |
| | | (3,196 | ) | | | 250 | | | | (2,946 | ) |
| | | | | | | | | | | | |
| (1) | Includes amounts attributable to non-controlling interests of US$(12) million. |
The Group recognised an impairment charge of US$2.0 billion (after tax benefit) in relation to its Onshore US assets. The gas-focused Hawkville field accounts for the substantial majority of this charge reflecting its geological complexity, product mix, acreage relinquishments and amended development plans. The remainder relates to the impairment of goodwill associated with the Petrohawk acquisition.
On 12 November 2014, the Group announced that the review of its Nickel West business was complete and the preferred option, the sale of the business, was not achieved on an acceptable basis. As a result of operational decisions made subsequent to the conclusion of this process, an impairment charge of US$290 million (after tax benefit) was recognised in FY2015.
The legislation to repeal the MRRT in Australia took effect on 30 September 2014. As a result, the Group derecognised a MRRT deferred tax asset of US$809 million, and corresponding taxation charges of US$698 million related to Continuing operations and US$111 million related to Discontinued operations were recognised in FY2015.
Refer to note 2 ‘Exceptional items’ to the Financial Statements for more information.
| | | | | | | | | | | | |
Year ended 30 June 2014 | | Gross | | | Tax | | | Net | |
| | | US$M | | | US$M | | | US$M | |
Exceptional items by category | | | | | | | | | | | | |
Sale of Pinto Valley | | | 551 | | | | (166 | ) | | | 385 | |
| | | | | | | | | | | | |
| | | 551 | | | | (166 | ) | | | 385 | |
| | | | | | | | | | | | |
On 11 October 2013, the Group announced it had completed the sale of its Pinto Valley mining operation for cash consideration of US$653 million, after working capital adjustments. A gain on sale of US$385 million (after tax expense) was recognised in FY2014.
Refer to note 2 ‘Exceptional items’ to the Financial Statements for more information. An analysis of exceptional items for FY2013 are included in section 2.5.5 of this Annual Report.
Discontinued operations
On 25 May 2015, the Group announced that it completed the demerger of a selection of its aluminium, coal, manganese, nickel and silver-lead-zinc assets to create an independent metals and mining company, South32.
South32’s contribution to BHP Billiton’s FY2015 results comprised a US$753 million profit after taxation excluding exceptional items. Exceptional items comprised a tax expense of US$111 million related to the repeal of the MRRT and a net loss on demerger of US$2.2 billion (after tax benefit). This contribution has been included in Attributable loss after taxation from Discontinued operations of US$1.6 billion.
Third party sales
We differentiate sales of our production from sales of third party products due to the significant difference in profit margin earned on these sales. The table below shows the breakdown between our production and third party products.
| | | | | | | | | | | | |
Year ended 30 June (1) | | 2015
US$M | | | 2014
US$M
Restated | | | 2013
US$M
Restated | |
| | | |
Group production | | | | | | | | | | | | |
Revenue | | | 43,457 | | | | 55,045 | | | | 52,637 | |
Related operating costs | | | (31,605 | ) | | | (32,962 | ) | | | (31,021 | ) |
| | | | | | | | | | | | |
Underlying EBIT | | | 11,852 | | | | 22,083 | | | | 21,616 | |
Underlying EBIT Margin | | | 27.3 | % | | | 40.1 | % | | | 41.1 | % |
| | | | | | | | | | | | |
Third party products | | | | | | | | | | | | |
Revenue | | | 1,179 | | | | 1,717 | | | | 1,223 | |
Related operating costs | | | (1,165 | ) | | | (1,702 | ) | | | (1,159 | ) |
| | | | | | | | | | | | |
Operating profit | | | 14 | | | | 15 | | | | 64 | |
Margin on third party products (2) | | | 1.2 | % | | | 0.9 | % | | | 5.2 | % |
| | | | | | | | | | | | |
| (1) | Excluding exceptional items and Discontinued operations. |
| (2) | Operating profit divided by revenue. |
We engage in third party trading for the following reasons:
Production variability and occasional shortfalls from our own assets means that we sometimes source third party materials to ensure a steady supply of product to our customers.
To optimise our supply chain outcomes, we may buy physical product from third parties.
In order to support the development of liquid markets, we will sometimes source third party physical product and manage risk through both the physical and financial markets.
1.15.4 Cash flow analysis
A Consolidated Cash Flow Statement is contained in the Financial Statements. The explanatory notes appear in note 37 ‘Notes to the consolidated cash flow statement’ to the Financial Statements. A summary table has been presented below to show the key sources and uses of cash.
| | | | | | | | | | | | |
Year ended 30 June | | 2015
US$M | | | 2014
US$M
Restated | | | 2013
US$M
Restated | |
| | | |
Cash generated from operations | | | 21,620 | | | | 29,318 | | | | 27,026 | |
Dividends received | | | 740 | | | | 1,264 | | | | 716 | |
Net interest paid | | | (541 | ) | | | (795 | ) | | | (848 | ) |
Taxation paid | | | (4,025 | ) | | | (6,147 | ) | | | (7,877 | ) |
| | | | | | | | | | | | |
Net operating cash flows from Continuing operations | | | 17,794 | | | | 23,640 | | | | 19,017 | |
| | | | | | | | | | | | |
Net operating cash flows from Discontinued operations | | | 1,502 | | | | 1,724 | | | | 1,137 | |
| | | | | | | | | | | | |
Net operating cash flows | | | 19,296 | | | | 25,364 | | | | 20,154 | |
| | | | | | | | | | | | |
Purchases of property plant and equipment | | | (11,947 | ) | | | (15,224 | ) | | | (21,104 | ) |
Exploration expenditure | | | (816 | ) | | | (986 | ) | | | (1,321 | ) |
Exploration expenditure expensed and included in operating cash flows | | | 670 | | | | 698 | | | | 1,026 | |
Purchases of intangibles | | | (98 | ) | | | (192 | ) | | | (380 | ) |
Investment in financial assets | | | (15 | ) | | | (1,168 | ) | | | (455 | ) |
Investment in equity accounted investments | | | (71 | ) | | | (44 | ) | | | (84 | ) |
Net proceeds from investing activities | | | 775 | | | | 1,782 | | | | 4,697 | |
| | | | | | | | | | | | |
Net investing cash flows from Continuing operations | | | (11,502 | ) | | | (15,134 | ) | | | (17,621 | ) |
| | | | | | | | | | | | |
Net investing cash flows from Discontinued operations | | | (1,066 | ) | | | (700 | ) | | | (1,105 | ) |
| | | | | | | | | | | | |
Cash disposed on demerger of South32 | | | (586 | ) | | | – | | | | – | |
| | | | | | | | | | | | |
Net investing cash flows | | | (13,154 | ) | | | (15,834 | ) | | | (18,726 | ) |
| | | | | | | | | | | | |
Net (repayment of)/proceeds from interest bearing liabilities | | | (728 | ) | | | (1,011 | ) | | | 7,255 | |
Dividends paid | | | (7,052 | ) | | | (6,506 | ) | | | (6,945 | ) |
Contributions from non-controlling interests | | | 53 | | | | 1,435 | | | | 73 | |
Other financing activities | | | (346 | ) | | | (354 | ) | | | (433 | ) |
| | | | | | | | | | | | |
Net financing cash flows from Continuing operations | | | (8,073 | ) | | | (6,436 | ) | | | (50 | ) |
| | | | | | | | | | | | |
Net financing cash flows from Discontinued operations | | | (203 | ) | | | (32 | ) | | | (148 | ) |
| | | | | | | | | | | | |
Net financing cash flows | | | (8,276 | ) | | | (6,468 | ) | | | (198 | ) |
| | | | | | | | | | | | |
Net (decrease)/increase in cash and cash equivalents from Continuing operations | | | (1,781 | ) | | | 2,070 | | | | 1,346 | |
| | | | | | | | | | | | |
Net increase/(decrease) in cash and cash equivalents from Discontinued operations | | | 233 | | | | 992 | | | | (116 | ) |
| | | | | | | | | | | | |
Cash disposed on demerger of South32 | | | (586 | ) | | | – | | | | – | |
| | | | | | | | | | | | |
Net operating cash flows from Continuing operations after interest and tax decreased by 25 per cent to US$17.8 billion during FY2015. The major contributor was the US$7.7 billion decrease in cash generated from operations (after changes in working capital balances), which was partially offset by a decrease of US$2.1 billion in net taxes paid.
Net investing cash outflows from Continuing operations decreased by US$3.6 billion to US$11.5 billion during FY2015 and reflected a US$3.4 billion reduction in capital and exploration expenditure. Expenditure on growth projects totalled US$9.3 billion, including US$4.5 billion on Petroleum projects and US$4.8 billion on Minerals projects. Sustaining capital expenditure and other items totalled US$2.6 billion. Exploration expenditure was US$816 million, including US$670 million classified within net operating cash flows.
Net financing cash outflows from Continuing operations increased by US$1.6 billion to US$8.1 billion. A decrease in proceeds from interest bearing liabilities of US$2.6 billion, a decrease in contributions fromnon-controlling interests of US$1.4 billion and higher dividends paid to non-controlling interests of US$435 million were partially offset by a decrease in repayments of interest bearing liabilities of US$2.9 billion during FY2015.
1.15.5 Net debt and sources of liquidity
Our policies on debt and liquidity management pursue the following objectives:
a solid ‘A’ credit rating;
gearing to be a maximum of 40 per cent;
diversification of funding sources;
maintain borrowings and excess cash predominantly in US dollars.
Gearing and net debt
Net debt, comprising Interest bearing liabilities less Cash and cash equivalents, was US$24.4 billion, which represented a decrease of US$1.4 billion compared with the net debt position at 30 June 2014. Gearing, which is the ratio of net debt to net debt plus net assets, was 25.7 per cent at 30 June 2015, compared with 23.2 per cent at 30 June 2014. IFRS 5/AASB 5 ‘Non-current Assets Held for Sale and Discontinued Operations’ does not require the Consolidated Balance Sheet to be restated for comparative periods. The FY2014 figures therefore includes assets and liabilities of the Businesses demerged with South32. For information relating to Discontinued operations refer to note 29 ‘Discontinued operations’ to the Financial Statements.
Cash and cash equivalents less overdrafts at 30 June 2015 was US$6.6 billion compared with US$8.8 billion at 30 June 2014. Included within Cash and cash equivalents were short-term deposits of US$5.8 billion compared with US$7.1 billion at 30 June 2014.
Funding sources
During FY2015, we issued the following long-term debt:
In March 2015, we issued an A$1.0 billion 3.000 per cent Australian bond due 2020.
In April 2015, we issued a three tranche Euro bond comprising €600 million Floating Rate Notes due 2020 paying three-month Euribor plus 0.350 per cent, €650 million 0.750 per cent bonds due 2022 and €750 million 1.500 per cent bonds due 2030.
None of our Group-level borrowing facilities are subject to financial covenants. Certain specific financing facilities in relation to specific Businesses are the subject of financial covenants that vary from facility to facility, but which would be considered normal for such facilities.
In addition to the Group’s uncommitted debt issuance programs, we hold the following committed standby facilities.
| | | | | | | | | | | | | | | | | | | | | | | | |
| | | Facility
available
2015 | | | Drawn
2015 | | | Undrawn
2015 | �� | | Facility
available
2014 | | | Drawn
2014 | | | Undrawn
2014 | |
| | | US$M | | | US$M | | | US$M | | | US$M | | | US$M | | | US$M | |
Revolving credit facility (1) | | | 6,000 | | | | – | | | | 6,000 | | | | 6,000 | | | | – | | | | 6,000 | |
| | | | | | | | | | | | | | | | | | | | | | | | |
Total financing facilities | | | 6,000 | | | | – | | | | 6,000 | | | | 6,000 | | | | – | | | | 6,000 | |
| | | | | | | | | | | | | | | | | | | | | | | | |
| (1) | The Group’s committed US$6.0 billion revolving credit facility operates as a back-stop to the Group’s uncommitted commercial paper program. The combined amount drawn under the facility or as commercial paper will not exceed US$6.0 billion. As at 30 June 2015, US$ nil commercial paper was drawn (2014: US$ nil), therefore US$6.0 billion of committed facility was available to use (2014: US$6.0 billion). The revolving credit facility has a five-year maturity with one remaining one-year extension option. A commitment fee is payable on the undrawn balance and an interest rate comprising an interbank rate plus a margin applies to any drawn balance. The agreed margins are typical for a credit facility extended to a company with the Group’s credit rating. |
Additional information regarding the maturity profile of our debt obligations and details of our standby and support agreements is included in note 23 ‘Financial risk management’ to the Financial Statements.
The Group’s credit ratings are currently A1/P-1 (Moody’s – long-term/short-term) and A+/A-1 (Standard & Poor’s – long-term/short-term). The credit ratings from both agencies remained unchanged in FY2015, however on 4 May 2015 Standard & Poor’s revised the Group’s ratings outlook to negative from stable.
1.15.6 Other information
Quantitative and qualitative disclosures about market risk
We identified our primary market risks in section 1.15.1 of this Annual Report. A description of how we manage our market risks, including both quantitative and qualitative information about our market risk sensitive instruments outstanding at 30 June 2015, is contained in note 23 ‘Financial risk management’ to the Financial Statements.
Off-balance sheet arrangements and contractual commitments
Information in relation to our material off-balance sheet arrangements, principally contingent liabilities, commitments for capital expenditure and commitments under leases at 30 June 2015 is provided in note 34 ‘Commitments’ and note 35 ‘Contingent liabilities’ to the Financial Statements.
Subsidiary information
Information about our significant subsidiaries is included in note 30 ‘Subsidiaries’ to the Financial Statements.
Related party transactions
Related party transactions are outlined in note 33 ‘Related party transactions’ to the Financial Statements.
Significant changes since the end of the year
Significant changes since the end of the year are outlined in note 36 ‘Subsequent events’ to the Financial Statements.
The Strategic Report is made in accordance with a resolution of the Board.
Jac Nasser AO
Chairman
Dated: 10 September 2015
2 Business overview
2.1 Business Groups
2.1.1 Petroleum and Potash Business
Our Petroleum and Potash Business headquartered in Houston, United States, comprises conventional and non-conventional oil and gas operations and a potash project based in Saskatchewan, Canada.
Petroleum
Our Petroleum Business includes exploration, development, production and marketing activities. We have a high-quality resource base concentrated in the United States and Australia. Our core production operations are located in the US Gulf of Mexico, Australia and Trinidad and Tobago (conventional) and Onshore US (unconventional). We produce crude oil and condensate, gas and natural gas liquids (NGLs).
Our overall production for FY2015 was 255.7 million barrels of oil equivalent (MMboe). This was mainly attributable to our US and Australian operations, which produced 162.3 MMboe and 77.7 MMboe, respectively, with the majority of US production coming from Onshore US, which produced 125.7 MMboe. Operations outside Australia and the United States delivered the remaining production volumes. Information relating to our oil and gas reserves is set out in section 2.3.1.
In line with our aim of simplification and a sharper strategic focus, we continue to evaluate our existing portfolio in order to optimise our position around our core business.
United States
Our production operations include the following:
Gulf of Mexico
We operate two fields in the Gulf of Mexico (Shenzi with a 44 per cent interest and Neptune with a 35 per cent interest) and hold non-operating interests in three other fields (Atlantis with a 44 per cent interest, Mad Dog with a 23.9 per cent interest, and Genesis with a 4.95 per cent interest). We have ongoing infill drilling in most of our Gulf of Mexico fields and also planned ongoing water injection wells at the Shenzi and Atlantis fields. All the fields are located between 155 and 210 kilometres offshore from the US state of Louisiana. We also own 25 per cent and 22 per cent, respectively, of the companies that own and operate the Caesar oil pipeline and the Cleopatra gas pipeline. These pipelines transport oil and gas from the Green Canyon area, where our Gulf of Mexico fields are located, to connecting pipelines that transport product onshore. Our US oil production is delivered to refineries along the Gulf Coast of the United States.
Onshore US
We produce oil, condensate, gas and NGLs in four shale areas: Eagle Ford, Permian, Haynesville and Fayetteville. Shale reservoirs are characterised by low permeability, so it is necessary to stimulate the reservoir to create additional permeability and, therefore, the flow of liquids and gas to the wellbore. Extracting oil and gas from shale involves hydraulic fracturing, which is a process developed to efficiently access supplies of oil and gas locked inside dense subsurface rock formations, such as shale. Hydraulic fracturing involves the use of water, sand and chemicals to fracture the hydrocarbon-bearing rock formation to allow the well to produce commercial volumes.
Prices for oil, NGLs and gas are based on US regional price indices, including West Texas Intermediate prices for oil, relevant published US regional gas indices for natural gas and Mont Belvieu prices for NGLs.
Eagle Ford
The Eagle Ford production operation is located primarily in the southern Texas counties of DeWitt, Karnes, McMullen and LaSalle. We produce oil, condensate, gas and NGLs from two fields, Black Hawk and Hawkville. The oil and gas produced is sold domestically in the United States, via connections to intrastate and interstate pipelines, and internationally through the export of processed condensate from Black Hawk. The Eagle Ford gathering system consists of 1,602 kilometres of gathering lines that deliver gathered volumes to five central delivery points (CDPs), from where processed volumes are transported to market.
Our Black Hawk acreage comprises 0.1 million net acres and is located primarily in the DeWitt and Karnes Counties in southern Texas. Our ownership interests range from five per cent to 100 per cent. A majority of our interest (50 per cent share) in the Black Hawk is held with Devon Energy. At 30 June 2015, we held an interest in approximately 772 gross wells and approximately 427 net wells. We acted as joint venture operator for approximately 15 per cent of our gross wells.
Our Hawkville acreage comprises 0.2 million net acres and is located primarily in the McMullen and La Salle Counties in southern Texas. Our ownership interests range from nine per cent to 100 per cent. At 30 June 2015, we held an interest in approximately 494 gross wells and approximately 409 net wells. We acted as joint venture operator for approximately 84 per cent of our gross wells.
Permian
The Permian production operation consists of 0.2 million net acres and is primarily located in the western Texas county of Reeves. We produce oil, gas and NGLs. The oil and gas produced is sold domestically in the United States, via connections to intrastate and interstate pipelines. Our ownership interests range from 14 per cent to 100 per cent. At 30 June 2015, we held an interest in approximately 81 gross wells and approximately 75 net
wells. We acted as joint venture operator for approximately 93 per cent of our gross wells. The Permian gathering system consists of 145 kilometres of gathering lines that deliver gathered volumes to third party CDPs, from where processed volumes are transported to market. During FY2015, as part of our continued focus on investing and operating core assets, we sold our interest in our upstream Onshore US Pecos shale operation, located in the Permian Basin, to Silverback Exploration, LLC for a cash consideration of US$75 million. We also sold our Pecos midstream operations to EagleClaw Midstream, LLC for a cash consideration of US$52 million.
Haynesville
The Haynesville production operation is located primarily in northern Louisiana and consists of 0.2 million net acres. We produce gas that is sold domestically in the United States, via connections to intrastate and interstate pipelines. Our ownership interests range from less than one per cent to 100 per cent. At 30 June 2015, we held an interest in approximately 1,045 gross wells and approximately 395 net wells. We acted as joint venture operator for approximately 37 per cent of our gross wells. During FY2015, as part of our continued focus on investing and operating core assets, we sold our interest in our Onshore North Louisiana conventional operations to JW Operating Company for a cash consideration of US$135 million.
Fayetteville
The Fayetteville production operation is located in north central Arkansas and consists of 0.4 million net acres. We produce gas that is sold domestically in the United States, via connections to intrastate and interstate pipelines. Our ownership interests range from less than one per cent to 100 per cent. At 30 June 2015, we held an interest in approximately 4,950 gross wells and approximately 1,070 net wells. We acted as joint venture operator for approximately 20 per cent of our gross wells. The Fayetteville gathering system consists of 763 kilometres of gathering lines that deliver gathered volumes to 14 CDPs, from where processed volumes are transported to market.
Australia
Bass Strait
Together with our 50-50 joint venture partner, Esso Australia (a subsidiary of ExxonMobil), through the Gippsland Basin Joint Venture, we participated in the original discovery of hydrocarbons in 1965 and we have been producing oil and gas from Bass Strait for more than 40 years. The Bass Strait operations are located between 25 and 80 kilometres off the southeastern coast of Australia.
We sell the majority of our Bass Strait crude oil and condensate production to refineries along the east coast of Australia under 12-month contracts. The contract price is based on the average Dated Brent price. Gas is piped onshore to the joint venture’s Longford processing facility, from where we sell our share of production to domestic distributors under contracts with periodic price reviews. Liquefied petroleum gas (LPG) is dispatched via pipeline, road tanker or sea tanker. Ethane is dispatched via pipeline to petrochemical plants in western Melbourne.
Minerva
We are the operator of Minerva (90 per cent interest), a gas field located 11 kilometres south-southwest of Port Campbell in western Victoria. The operation consists of two subsea wells, with gas piped onshore to a processing plant. After processing, the gas is delivered into a pipeline and sold domestically under long-term contracts.
North West Shelf
We are a joint venture participant in the North West Shelf Project, located approximately 125 kilometres northwest of Dampier in Western Australia. The North West Shelf Project supplies gas to the Western Australian domestic market, mainly under long-term contracts, and liquefied natural gas (LNG) to buyers in Japan, South Korea and China under a series of long-term contracts.
North West Shelf gas is piped from the fields to the Karratha Gas Plant for processing. LPG, condensate and LNG are transported to market by ship, while domestic gas is transported by the Natural Gas and Pilbara Energy pipelines. We are also a joint venture partner in four nearby oil fields – Cossack, Wanaea, Lambert and Hermes. All North West Shelf gas and oil joint ventures are operated by Woodside.
Pyrenees
We operate six oil fields in Pyrenees, which are located offshore approximately 23 kilometres northwest of Northwest Cape, Western Australia. We had an effective 62 per cent interest in the fields as at 30 June 2015, based on inception-to-date production from two permits in which we have interests of 71.43 per cent and 40 per cent, respectively. The project uses a floating, production, storage and off-take (FPSO) facility. The crude oil produced is sold internationally on the spot market.
Macedon
We are the operator of Macedon (71.43 per cent interest), an offshore gas field located approximately 75 kilometres west of Onslow, Western Australia, and an onshore gas processing facility, located approximately 17 kilometres southwest of Onslow. The operation achieved first gas in August 2013 and consists of four subsea wells, with gas piped onshore to the processing plant. After processing, the gas is delivered into a pipeline and sold into the Western Australian domestic market, mainly under long-term contracts.
Stybarrow
We are the operator of Stybarrow (50 per cent interest), an oil field located 55 kilometres west-northwest of Exmouth, Western Australia. The project uses a FPSO facility. The crude oil produced is sold internationally on the spot market. Stybarrow reached the end of its field life and ceased production on 30 June 2015.
Other production operations
Trinidad and Tobago
We operate the Greater Angostura field (45 per cent interest in the production sharing contract), an integrated oil and gas development, located offshore, 40 kilometres east of Trinidad. The crude oil is sold on a spot basis to international markets, while the gas is sold domestically under term contracts.
Algeria
Our Algerian operations comprise an effective 38 per cent interest in the ROD Integrated Development, which consists of six satellite oil fields that pump oil back to a dedicated processing train. The oil is sold on a spot basis to international markets. Our interest in ROD is subject to a contractual determination with our joint venture partner ENI, which could result in a future change in our interest under certain conditions.
United Kingdom
We hold a 16 per cent non-operating interest in the Bruce oil and gas field in the North Sea and operate the Keith oil and gas field (31.83 per cent interest), a subsea tie-back. Oil and gas from both fields is processed via the Bruce platform facilities.
Pakistan
We operate the Zamzama gas project (38.5 per cent interest) in the Sindh province of Pakistan. Both gas and condensate are sold domestically under term contracts in accordance with the Pakistan Government’s pricing policies.
During February 2015, BHP Billiton and Tri-Resources Investments Inc. (a subsidiary of the Hashoo Group) signed a share purchase agreement for the acquisition by Tri-Resources of BHP Billiton’s entire interest in BHP Petroleum (Pakistan), which holds a 38.5 per cent interest in the Zamzama Joint Venture. Completion of the transaction is subject to receipt of regulatory approvals and other customary closing conditions.
Information on Petroleum operations
The following table contains additional details of our production operations. This table should be read in conjunction with the production (refer to section 2.2.1) and reserve tables (refer to section 2.3.1).
| | | | | | | | | | | | |
Operation &
location | | Product | | Ownership | | Operator | | Title, leases or options | | Nominal production
capacity | | Facilities, use & condition |
| United States | | | | | | | | | | |
| Neptune (Green Canyon 613) | | | | | | | | | | | | |
Offshore deepwater Gulf of Mexico (1,300m) | | Oil and gas | | BHP Billiton 35% Marathon Oil 30% W&T Offshore 20% Maxus US Exploration 15% | | BHP Billiton | | Lease from US Government as long as oil and gas produced in paying quantities | | 50 Mbbl/d oil 50 MMcf/d gas | | Permanently moored tension leg platform (TLP) |
| | | | | | |
| Shenzi (Green Canyon 653) | | | | | | | | | | | | |
Offshore deepwater Gulf of Mexico (1,310m) | | Oil and gas | | BHP Billiton 44% Hess Corporation 28% Repsol 28% | | BHP Billiton | | Lease from US Government as long as oil and gas produced in paying quantities | | 100 Mbbl/d oil 50 MMcf/d gas | | Stand-alone TLP Genghis Khan field (part of same geological structure) tied back to Marco Polo TLP |
| | | | | | |
| Atlantis (Green Canyon 743) | | | | | | | | | | | | |
Offshore deepwater Gulf of Mexico (2,155m) | | Oil and gas | | BHP Billiton 44% BP 56% | | BP | | Lease from US Government as long as oil and gas produced in paying quantities | | 200 Mbbl/d oil 180 MMcf/d gas | | Permanently moored semi-submersible platform |
| | | | | | |
| Mad Dog (Green Canyon 782) | | | | | | | | | | | | |
Offshore deepwater Gulf of Mexico (1,310m) | | Oil and gas | | BHP Billiton 23.9% BP 60.5% Chevron 15.6% | | BP | | Lease from US Government as long as oil and gas produced in paying quantities | | 80 Mbbl/d oil 60 MMcf/d gas | | Permanently moored integrated truss spar, facilities for simultaneous production and drilling operations |
| | | | | | | | | | | | |
Operation &
location | | Product | | Ownership | | Operator | | Title, leases or options | | Nominal production
capacity | | Facilities, use & condition |
| Genesis (Green Canyon 205) | | | | | | | | | | | | |
Offshore deepwater Gulf of Mexico (approximately 790m) | | Oil and gas | | BHP Billiton 4.95% Chevron 56.67% ExxonMobil 38.38% | | Chevron | | Lease from US Government as long as oil and gas produced in paying quantities | | 55 Mbbl/d oil 72 MMcf/d gas | | Floating cylindrical hull (spar) moored to seabed with integrated drilling facilities |
| | | | | |
Onshore US Eagle Ford | | | | | | | | | | |
Blackhawk / Hawkville Onshore, southern Texas | | Oil, condensate, gas and NGL | | Blackhawk – BHP Billiton working interest in wells range from 5% to 100% BHP Billiton average net working interest is approximately 55% Largest partners include Devon Energy Hawkville – BHP Billiton working interest in wells range from 9% to 100% BHP Billiton average net working interest is approximately 83% Largest partners include Lewis Energy, Swift Energy & Hunt Oil Company | | Blackhawk – BHP Billiton operated approximately 15% of approximately 772 gross wells Hawkville – BHP Billiton operated approximately 84% of approximately 494 gross wells | | Blackhawk – we currently own leasehold interests in approximately 0.1 million net acres Leases associated with producing wells remain in place as long as oil and gas is produced in paying quantities Hawkville – we currently own leasehold interests in approximately 0.2 million net acres Leases associated with producing wells remain in place as long as oil and gas is produced in paying quantities | | Blackhawk – average daily production during FY2015 130 MMcf/d gas 82 Mbbl/d oil and condensate 24 Mbbl/d NGL Hawkville – average daily production during FY2015 168 MMcf/d gas 15 Mbbl/d oil and condensate 17 Mbbl/d NGL | | Producing oil and gas wells and associated pipeline and compression facilities |
| | | | | | |
| Permian | | | | | | | | | | | | |
| Permian, western Texas | | Oil, gas and NGL | | BHP Billiton working interest in wells range from 14% to 100% BHP Billiton average net working interest is approximately 93% Residual ownership held by multiple partners | | BHP Billiton operated approximately 93% of approximately 81 gross wells | | We currently own leasehold interests in approximately 0.2 million net acres Leases associated with producing wells remain in place as long as oil and gas is produced in paying quantities | | Average daily production during FY2015 30 MMcf/d gas 10 Mbbl/d oil and condensate 4 Mbbl/d NGL | | Producing oil and gas wells with associated gathering systems, processing plant and compression facilities |
| | | | | | | | | | | | |
Operation &
location | | Product | | Ownership | | Operator | | Title, leases or options | | Nominal production
capacity | | Facilities, use & condition |
| Haynesville | | | | | | | | | | | | |
| Haynesville, northern Louisiana and eastern Texas | | Gas | | BHP Billiton working interest in wells range from less than 1% to 100% BHP Billiton average networking interest is approximately 38% Largest partners include Chesapeake Energy and Exco Resources | | BHP Billiton operated approximately 37% of approximately 1,045 gross wells | | We currently own leasehold interests in approximately 0.2 million net acres Leases associated with producing wells remain in place as long as oil and gas is produced in paying quantities | | Average daily production during FY2015 446 MMcf/d gas | | Producing gas wells with an associated pipeline owned by a third party and compression infrastructure |
| | | | | | |
| Fayetteville | | | | | | | | | | | | |
| Fayetteville, northern central Arkansas | | Gas | | BHP Billiton working interest in wells range from less than 1% to 100% BHP Billiton average net working interest is approximately 22% Largest partners include Southwestern Energy and XTO Energy | | BHP Billiton operated approximately 20% of approximately 4,950 gross wells | | We currently own leasehold interests in approximately 0.4 million net acres Leases associated with producing wells remain in place as long as oil and gas is produced in paying quantities | | Average daily production during FY2015 379 MMcf/d gas | | Producing gas wells with associated pipeline and compression infrastructure |
| | | | | | |
| Australia | | | | | | | | | | | | |
| | | | | | |
| Bass Strait | | | | | | | | | | | | |
| Offshore and onshore Victoria | | Oil and gas | | Gippsland Basin Joint Venture (GBJV): BHP Billiton 50% Esso Australia (Exxon Mobil subsidiary) 50% Oil Basins Ltd 2.5% royalty interest in 19 production licences Kipper Unit Joint Venture (KUJV): BHP Billiton 32.5% Esso Australia 32.5% Santos Offshore Pty Ltd 35% | | Esso Australia | | 20 production licences and 2 retention leases issued by Australian Government Expire between 2016 and end of life of field One production licence held with Santos Ltd | | 200 Mbbl/d oil 1,075 MMcf/d gas 5,150 tpd LPG 850 tpd ethane | | 20 producing fields with 23 offshore developments (15 steel jacket platforms, 4 subsea developments, 2 steel gravity based mono towers, 2 concrete gravity based platforms) Onshore infrastructure: – Longford facility (3 gas plants, liquid processing facilities) – Interconnecting pipelines – Long Island Point LPG and oil storage facilities – Ethane pipeline |
| | | | | | | | | | | | |
Operation &
location | | Product | | Ownership | | Operator | | Title, leases or options | | Nominal production
capacity | | Facilities, use & condition |
| Minerva | | | | | | | | | | | | |
| Offshore and onshore Victoria | | Gas and condensate | | BHP Billiton 90% Santos (BOL) 10% | | BHP Billiton | | Production licence issued by Australian Government expires 5 years after production ceases | | 150 TJ/d gas 600 bbl/d condensate | | 2 well completions Single flow line transports gas to onshore gas processing facility Gas plant located approximately 4 km inland from Port Campbell |
|
| North West Shelf |
Offshore and onshore Western Australia North Rankin Goodwyn Perseus Angel and Searipple fields | | Domestic gas, LPG, condensate, LNG | | North West Shelf Project is an unincorporated JV BHP Billiton: 8.33% of original domestic gas JV, will ultimately increase to 16.67% 16.67% of Incremental Pipeline Gas (IPG) domestic gas JV 16.67% of original LNG JV 12.5% of China LNG JV 16.67% of LPG JV Other participants: subsidiaries of Woodside, Chevron, BP, Shell, Mitsubishi/Mitsui and China National Offshore Oil Corporation | | Woodside Petroleum Ltd | | 9 production licences issued by Australian Government 6 expire in 2022 and 3 expire 5 years from end of production | | North Rankin Complex: 2,500 MMcf/d gas 60 Mbbl/d condensate Goodwyn A platform: 1,450 MMcf/d gas 110 Mbbl/d condensate Angel platform: 960 MMcf/d gas 50 Mbbl/d condensate Withnell Bay gas plant: 600 MMcf/d gas 5-train LNG plant: 45,000 tpd LNG | | Production from North Rankin and Perseus processed through the interconnected North Rankin A and North Rankin B platforms Production from Goodwyn and Searipple processed through Goodwyn A platform 4 subsea wells in Perseus field tied into Goodwyn A platform Production from Angel field processed through Angel platform Onshore gas treatment plant at Withnell Bay processes gas for domestic market 5-train LNG plant |
|
| North West Shelf |
Offshore Western Australia Wanaea Cossack Lambert and Hermes fields | | Oil | | BHP Billiton 16.67% Woodside 33.34% BP, Chevron, Japan Australia LNG (MIMI) 16.67% each | | Woodside Petroleum Ltd | | 3 production licences issued by Australian Government in September 2014 expire in 2018, 2033, and 2035 respectively | | Production: 60 Mbbl/d Storage: 1 MMbbl | | FPSO unit |
| | | | | | | | | | | | |
Operation &
location | | Product | | Ownership | | Operator | | Title, leases or options | | Nominal production
capacity | | Facilities, use & condition |
| Pyrenees | | | | | | | | | | | | |
Offshore Western Australia Crosby Moondyne Wild Bull Tanglehead Stickle and Ravensworth fields | | Oil | | WA-42-L permit: BHP Billiton 71.43% Apache PVG 28.57% WA-43-L permit: BHP Billiton 40% Apache APG Permits 31.5% Inpex Alpha 28.5% | | BHP Billiton | | Production licence issued by Australian Government expires 5 years after production ceases | | Production: 96 Mbbl/d oil Storage: 920 Mbbl | | 24 subsea well completions (19 producers, 4 water injectors, 1 gas injector), FPSO |
| | | | | | |
| Macedon | | | | | | | | | | | | |
| Offshore and onshore Western Australia | | Gas and condensate | | WA-42-L permit BHP Billiton 71.43% Apache PVG 28.57% | | BHP Billiton | | Production licence issued by Australian Government expires 5 years after production ceases | | Production: 200 MMcf/d gas 20 bbl/d condensate | | 4 well completions Single flow line transports gas to onshore gas processing facility Gas plant located approximately 17 km southwest of Onslow |
| | | | | | |
| Stybarrow | | | | | | | | | | | | |
Offshore Western Australia Stybarrow and Eskdale fields | | Oil and gas | | BHP Billiton 50% Woodside 50% | | BHP Billiton | | Production licence issued by Australian Government expires 5 years after production ceases | | Production: 80 Mbbl/d oil Storage: 900 Mbbl | | 10 subsea well completions (6 producers, 3 water injectors, 1 gas injector) Gas production is reinjected Ceased production in June 2015 |
| | | | | | | | | | | | |
Operation &
location | | Product | | Ownership | | Operator | | Title, leases or options | | Nominal production
capacity | | Facilities, use & condition |
| Other production operations | | | | | | | | |
| | | | | | |
| Trinidad and Tobago | | | | | | | | | | | | |
| | | | | | |
| Greater Angostura | | | | | | | | | | | | |
| Offshore Trinidad and Tobago | | Oil and gas | | BHP Billiton 45% National Gas Company 30% Chaoyang 25% | | BHP Billiton | | Production sharing contract with the Trinidad and Tobago Government entitles us to operate Greater Angostura until 2026 | | 100 Mbbl/d oil 280 MMcf/d gas | | Integrated oil and gas development: central processing platform connected to the Kairi-2 platform and gas export platform with 3 satellite wellhead protector platforms and flow lines Oil pipeline from processing platform to storage and export at Guayaguayare Gas supplied to Trinidad and Tobago domestic markets |
| | | | | | |
| Algeria | | | | | | | | | | | | |
| | | | | | |
| ROD Integrated Development | | | | | | | | | | | | |
| Onshore Berkine Basin, 900 kilometres southeast of Algiers, Algeria | | Oil | | BHP Billiton 45% interest in 401a/402a production sharing contract ENI 55% BHP Billiton effective 38% interest in ROD unitised integrated development ENI 62% | | Joint Sonatrach/ENI entity | | Production sharing contract with Sonatrach (title holder) Expires in 2016 with option for two 5-year extensions under certain conditions specified in the contracts | | Approximately 80 Mbbl/d oil | | Development and production of 6 oil fields 2 largest fields (ROD and SFNE) extend into neighbouring blocks 403a, 403d Production through dedicated processing train on block 403 |
| | | | | | | | | | | | |
Operation &
location | | Product | | Ownership | | Operator | | Title, leases or options | | Nominal production
capacity | | Facilities, use & condition |
| United Kingdom | | | | | | | | | | | | |
| | | | | | |
| Bruce/Keith | | | | | | | | | | | | |
| Offshore North Sea, UK | | Oil and gas | | Bruce: BHP Billiton 16% BP 37% Total SA 43.25% Marubeni 3.75% Keith: BHP Billiton 31.83% BP 34.84% Total SA 25% Marubeni 8.33% | | Bruce – BP Keith – BHP Billiton | | 3 production licences issued by UK Government expire in 2018 and 2046 and end of life of field | | 920 MMcf/d gas | | Integrated oil and gas platform Keith developed as tie-back to Bruce facilities |
| | | | | | |
| Pakistan | | | | | | | | | | | | |
| | | | | | |
| Zamzama | | | | | | | | | | | | |
Onshore Sindh Province, Pakistan | | Gas and condensate | | BHP Billiton 38.5% ENI Pakistan 17.75% PKP Exploration 9.375% PKP Exploration 2 9.375% Government Holdings 25% | | BHP Billiton | | 20-year development and production lease from the Pakistan Government expires in 2022 (option to extend 5 years) | | 500 MMcf/d gas 3,350 bbl/d condensate | | 10 production wells 4 process trains 2 front end compression trains |
Capital projects
United States
Onshore US
The development phase of an onshore shale operation requires an extensive drilling and completion program, which may include associated gas compression and treatment facilities and connecting pipelines. Shale development has a repetitive, manufacturing-like nature that provides opportunities for increased efficiency. Much of our development of the shale reservoirs utilises horizontal drilling, with average lateral lengths between 1,500 and 1,600 metres. We enter into service contracts with third parties to provide drilling and completion services at our operated sites. At the end of FY2015, we had 10 drilling rigs in operation.
BHP Billiton’s Onshore US drilling and development expenditure in FY2015, which is presented on an accruals basis within this section, was US$3.3 billion (FY2014: US$4.2 billion). The expenditure was primarily related to drilling and completion activities in our liquids-rich Black Hawk and Permian fields, while deferring development in areas that are predominantly gas.
Eagle Ford capital expenditure for FY2015 was US$2.1 billion (FY2014: US$3.1 billion). The expenditure was primarily related to drilling and completion activities, resulting in 188 net development wells completed during the period. Of the US$2.1 billion, approximately US$95 million was spent on the installation of more than 52 kilometres of pipeline infrastructure and additional gas processing facilities. The operated rig count was seven for the year (FY2014: 17).
Permian capital expenditure for FY2015 was US$0.7 billion (FY2014: US$0.5 billion). The expenditure was primarily related to drilling and completion activities, resulting in 45 net development wells completed during the year. Of the US$0.7 billion, approximately US$54 million was spent on the installation of more than 101 kilometres of pipeline infrastructure and additional gas processing facilities. The operated rig count was three for the year (FY2014: four).
Haynesville capital expenditure for FY2015 was US$0.3 billion (FY2014: US$0.4 billion). The expenditure was primarily related to drilling and completion activities, resulting in 25 net development wells completed during the year. There were no operated rigs in Haynesville at the end of this year (FY2014: three).
Fayetteville capital expenditure for FY2015 was US$0.2 billion (FY2014: US$0.2 billion). The expenditure was primarily related to participation in drilling and completion activities for wells operated by third parties, resulting in 45 net development wells completed during the year.
Our Onshore US capital investment is expected to decrease to US$1.5 billion in FY2016 in response to changes in the global commodity markets. This includes an operated rig count of nine for the period, with shale oil investment accounting for approximately 80 per cent of the investment. Our decision to cut spending will mean deferring gas volumes in the near term with our drilling programs in the Fayetteville and Haynesville areas remaining temporarily suspended. However, we expect to realise greater value by developing our acreage as prices recover.
Australia
Bass Strait Kipper gas field development
Initial development of the Kipper gas field in the Gippsland Basin, located offshore from Victoria, was approved by the Board in December 2007. A supplemental approval of the development was granted in January 2011. The first phase of the project included two new subsea wells, three new pipelines and platform modifications to supply 10 thousand barrels per day (Mbbl/d) of condensate and 80 million cubic feet per day (MMcf/d) of gas.
Gas and liquids will be processed via the existing Gippsland Basin Joint Venture facilities. The Kipper gas field development comprises the Kipper Unit Joint Venture and the Gippsland Basin Joint Venture. We own a
32.5 per cent interest in the Kipper Unit Joint Venture, with Esso Australia owning 32.5 per cent and Santos owning 35 per cent. We own a 50 per cent interest in the Gippsland Basin Joint Venture, with Esso Australia owning the remaining 50 per cent.
The main Kipper gas field facilities were completed in September 2012; however, first production has not yet commenced due to the need to provide for mercury removal. Funding for the installation of the mercury treatment facilities of US$120 million was approved in March 2014, with completion expected to occur in CY2016. Our share of costs incurred to 30 June 2015 was US$59 million.
Bass Strait Turrum field development
Further expansion of the Gippsland Basin facilities is underway following approval by the Board in July 2008 of the full field development of the Turrum oil and gas field. A supplemental approval of the development was obtained in January 2011. The project consists of five wells and a new platform, Marlin B, linked by a bridge to the existing Marlin A platform. The Turrum field, which has a capacity of 11 Mbbl/d of oil and 200 MMcf/d of gas, is located 42 kilometres offshore in approximately 60 metres of water. Our share of development costs is approximately US$1.4 billion, of which US$1.3 billion was incurred as of 30 June 2015.
The Turrum field development operates under the Gippsland Basin Joint Venture, in which we own a 50 per cent interest, with Esso Australia owning the remaining 50 per cent. Initial production of low carbon dioxide gas through the Turrum facilities occurred in June 2013. High carbon dioxide gas production from the Turrum reservoir will come online with completion of the Longford Gas Conditioning Plant in CY2016.
Bass Strait Longford Gas Conditioning
The Longford Gas Conditioning Plant (LGCP) Project was approved by the Board in December 2012 to enable the production of Turrum reserves plus the production of Kipper and other undeveloped high carbon dioxide content hydrocarbons. The Project scope includes a carbon dioxide extraction facility, brownfield tie-ins, an electrical upgrade and multiple supporting utilities. Our share of development costs is approximately US$520 million, of which US$356 million was incurred as of 30 June 2015. First gas production is expected in CY2016. Esso Australia is the operator of the LGCP, owning a 50 per cent interest and BHP Billiton owns the remaining 50 per cent.
North West Shelf Greater Western Flank–A
The North West Shelf Greater Western Flank–A (GWF-A) gas project was approved by the Board in November 2011 to recover gas from the Goodwyn H and Tidepole fields. The project consists of a five well subsea tie-back of the Goodwyn H and Tidepole fields to the Goodwyn A platform. The Goodwyn A platform is located in 130 metres of water, approximately 130 kilometres offshore from Karratha on the northwest coast of Australia. Our share of development costs is approximately US$400 million, of which US$237 million was incurred as of 30 June 2015. First gas production is expected in CY2016. Woodside is the operator and we own a 16.67 per cent interest.
Significant evaluation activities
We perform development evaluation activities to determine the technical feasibility and commercial viability of prospective projects after exploration and appraisal. Our significant recent evaluation activities include the following:
United States
Mad Dog Phase 2
The Mad Dog Phase 2 project is underway. IndoMet remainsin response to the successful Mad Dog South appraisal well, which confirmed significant hydrocarbons in the southern portion of the Mad Dog field. The project was sent back to study phase
in 2013, following which a valuable futurerevised development concept was selected by the owners. The revised concept will undergo further refinement and undertake additional investigations in FY2016. BP is the operator and we hold a 23.9 per cent working interest.
Australia
Scarborough
Development planning for the large Scarborough gas field offshore Western Australia is in progress. Following an assessment, floating LNG has been selected as the preferred development option. Further work to optimise the preferred development option is ongoing. Esso is the operator of the WA-1-R lease and we hold a 50 per cent working interest. We are the operator of, and have a 100 per cent working interest in, the adjacent Thebe discovery and the WA-346-P block.
North West Shelf Other – Greater Western Flank ‘2’
Planning continues for our Coal Business.the development of Greater Western Flank ‘2’. Greater Western Flank ‘2’ represents the second phase of development of the core Greater Western Flank fields, behind the GWF-A development, and is located to the southwest of the existing Goodwyn A platform. Woodside is the operator and we own a 16.67 per cent share. During FY2015, the project scope was further defined, with a final investment decision expected in CY2015.
Energy CoalExploration and appraisal
Our Coal Businessexploration strategy is to focus on material opportunities, at high working interest, with a bias for liquids and operatorship. While the majority of the expenditure incurred was in our Gulf of Mexico, Western Australia and Trinidad and Tobago focus areas, we also incurred expenditure in South Africa, Brazil, South-East Asia, India and Onshore US.
Access
In FY2015, we accessed acreage in the US sector of the Gulf of Mexico and in Trinidad and Tobago and Barbados. In the Gulf of Mexico, we were awarded 14 blocks (100 per cent working interest and operator on all blocks; 315 square kilometres) from Lease Sale 238 held during the September 2014 quarter. In addition, BHP Billiton was also awarded all nine of its high bid leases, totalling 210 square kilometres in Central Lease Sale 235 in the June 2015 quarter. In the Caribbean, we finalised production sharing contracts and joint operating agreements for a 65 per cent interest and operatorship in Trinidad and Tobago Blocks 3 and 7 (totalling 2,096 square kilometres) with BG Group Ltd, and signed exploration licences for Barbados Blocks Bimshire and Carlisle Bay (100 per cent working interest; 5,004 square kilometres).
Exploration program expenditure details
During FY2015, our gross expenditure on exploration was US$567 million, of which US$481 million was expensed.
Exploration and appraisal wells drilled or in the process of drilling during the year:
| | | | | | | | | | | | | | |
Well | | Location | | Target | | BHP Billiton
equity | | Spud date | | Water depth | | Total well depth | | Status |
Shenzi North-2 | | Gulf of Mexico GC609 | | Oil | | 44% (Operator) | | 9 April 2015 | | 1,309 metres | | 8,733 metres | | Plugged and abandoned; currently sidetracking |
| | | | | | | |
Shenzi North-ST1 | | Gulf of Mexico GC609 | | Oil | | 44% (Operator) | | 14 June 2015 | | 1,309 metres | | 8,238 metres | | Drilling |
In the Gulf of Mexico, we drilled the Shenzi North-2 exploration well on Green Canyon Block 609 (44 per cent working interest and operator) during the June 2015 quarter. The lower section of the hole was plugged and abandoned and associated costs expensed. We are currently drilling a sidetrack to further test the opportunity. Significant investment in seismic data acquisition, licensing and reprocessing were also completed in order to evaluate prospectivity in our focus areas.
In Western Australia, we continue to evaluate exploration potential in line with our strategic priorities. To assist this, we are participating in a regional multi-client 3D seismic survey totalling 10,032 square kilometres. The program is anticipated to be completed by the first half of FY2016.
In Trinidad and Tobago, we completed the acquisition of 21,220 square kilometres of 3D seismic data over Blocks 3, 5, 6, 7, 14, 23a, 23b, 28 and 29 by the end of the March 2015 quarter. Evaluation of this information is ongoing. Regional environmental and geological surveys were also carried out during the year, as part of our ongoing assessment programs.
In South Africa, we hold 100 per cent exploration rights to Block 3B/4B off the west coast of South Africa. In FY2014, we completed the processing of the 10,075 square kilometres of 3D seismic survey that was acquired in FY2013. Evaluation of this information is ongoing.
In Brazil, we are planning to acquire 3D seismic data over our two blocks in the deepwater Foz do Amazonas Basin, to fulfil our minimum work commitment.
In Malaysia, we completed the acquisition of 2,941 square kilometres of 3D seismic survey over Block SK-2A and formally assigned our 60 per cent interest and operatorship in Block N to Total during the June 2015 quarter.
In the Philippines, we finalised the re-assignment of our 75 per cent interest and operatorship to PNOC, completing our exit from the region during the June 2015 quarter.
In India, together with the operator BG, we have notified the government of our intent to exit our remaining 50 per cent interest in one deepwater block acquired during the NELP IX licensing round. We are currently awaiting government approval of our exit of nine operated blocks acquired during the NELP VII and VIII licensing rounds and one non-operated block acquired during the NELP IX licensing round.
In Onshore US, we continue to evaluate opportunities aligned with our strategic priorities, leveraging the expertise gained from our production units.
Drilling
The number of wells in the process of drilling and/or completion as of 30 June 2015 was as follows:
| | | | | | | | | | | | | | | | | | | | | | | | |
| | | Exploratory wells | | | Development wells | | | Total | |
| | | Gross | | | Net (1) | | | Gross | | | Net(1) | | | Gross | | | Net (1) | |
Australia | | | – | | | | – | | | | 5 | | | | 1 | | | | 5 | | | | 1 | |
United States | | | 1 | | | | – | | | | 236 | | | | 108 | | | | 237 | | | | 109 | |
Other | | | – | | | | – | | | | – | | | | – | | | | – | | | | – | |
| | | | | | | | | | | | | | | | | | | | | | | | |
Total | | | 1 | | | | – | | | | 241 | | | | 109 | | | | 242 | | | | 110 | |
| | | | | | | | | | | | | | | | | | | | | | | | |
| (1) | Represents our share of the gross well count. |
Delivery commitments
We have delivery commitments of gas and LNG of approximately 2,180 billion cubic feet through FY2031 (82 per cent Australia and Asia, eight per cent United States and 10 per cent Other), crude and condensate
commitments of 17.3 million barrels through FY2022 (51 per cent United States, 39 per cent Australia and Asia and 10 per cent Other) and LPG commitments of 332,072 metric tonnes through FY2017. We have sufficient proved reserves and production capacity to fulfil these delivery commitments.
We have obligations for contracted capacity on transportation pipelines and gathering systems on which we are the shipper. In FY2016, volume commitments to gather and transport are 1,123 billion cubic feet of gas (97 per cent Onshore US and three per cent Other) and 42.4 million barrels of oil (51 per cent Onshore US and 49 per cent Offshore US). The agreements with the gas gatherers and transporters have annual escalation clauses.
Potash
Our Potash strategy is to build a material industry position over the long term.
We hold exploration permits and mining leases, issued by the Government of Saskatchewan, covering more than 16,000 square kilometres of mineral rights in the province of Saskatchewan in Canada. The Government of Saskatchewan has issued a Potash Lease Special Agreement (KLSA) for the Jansen Potash Project, which provides long-term security of tenure to allow the ongoing development and subsequent operation of Jansen for the life of the operation.
We have progressively explored our permit areas over the past eight years and continue to evaluate their economic development potential. We are converting our exploration permits to long-term mining leases as these permits mature in order to enable further evaluation. To date, we have secured more than 8,000 square kilometres under long-term mining leases.
We continue to progress Jansen, a greenfield potash project, located approximately 140 kilometres east of Saskatoon in south-central Saskatchewan. We believe Jansen is one of the world’s largest producers and marketers of export energy coal (also known as thermal or steaming coal)best undeveloped potash resources and is likely to be a domestic supplierlow-cost source of supply once fully developed. Investment in Jansen could underpin a potential fifth Business within BHP Billiton, given the opportunity to develop a multi-decade, multi-mine basin in Saskatchewan.
On 20 August 2013, we announced an additional US$2.6 billion investment in Jansen, bringing total approved spending to US$3.8 billion. This investment is funding the excavation and lining of the Project’s production and service shafts, and the installation of essential surface infrastructure and utilities and was 46 per cent complete as of 30 June 2015.
The level of expenditure on the Project in FY2015 was US$423 million. Shaft excavation is progressing, while the construction workforce camp and service shaft permanent headframe have been completed. Necessary infrastructure work continues to be progressed.
With our investment premised on the attractive longer-term market fundamentals for potash, we will continue to modulate the pace of development. The introduction of one or more minority partners, consistent with our approach for some of our other resource operations, will be considered at the appropriate time.
On the basis of our current projections and subject to Board approval, Jansen is likely to ramp-up production in the decade beginning 2020.
We are continuing to evaluate other areas for which we have exploration permits in the Saskatchewan potash basin, including Young, Boulder, Burr and Melville, through analysis of the extensive data collected from successive exploration programs.
In October 2014, the management of the closed mine sites associated with Base Metals North America was transitioned from the Potash to the electricity generation industryPetroleum Business. All locations are in Australia, South Africacare and the United States. Our domestic sales are generally made to nearby power stations under long-termmaintenance or in various stages of closure.
fixed price or cost plus arrangements. Our export sales are deliveredAs at 1 August 2015, management of the Jansen Potash Project transferred from the Petroleum Business to power generators and some industrial users in Asia, Europe and the United States, under contracts that are generally index linked. Energy Coal produced approximately 72.9 Mt in FY2013.BHP Billiton’s Chief Commercial Officer.
2.1.2 Copper Business
Our Energy Coal Assets comprise both open-cut and underground mines. At our open-cut mines, overburdenCopper Business, headquartered in Santiago, Chile, is removed after blasting, using either draglines or truck and shovel. Coal is then extracted using excavators or loaders and loaded onto trucks to be taken to stockpiles. At our underground mines, coal is extracted by either longwall or continuous miner. The coal is then transported to the surface by conveyor to stockpiles. Coal from stockpiles is crushed and, for a numberone of the world’s leading producers of copper concentrate and cathode, uranium oxide, and a producer of zinc concentrate. Our portfolio of mining operations washedincludes the Escondida mine in Chile, a leading producer of copper, and processed. Domestic coal is then transported to the nearby customer via conveyor, truck or rail. Export coal is loaded onto trainsOlympic Dam in South Australia, a major producer of copper and transported to port.
Energy Coal South Africa
Energy Coal South Africa (known as BECSA) operates four coal mines, being Khutala, Klipspruit, Middelburg and Wolvekrans,uranium oxide. Our total copper production in the Witbank region in the province of Mpumalanga, South Africa. Production in FY2013FY2015 was 31.6 Mt. The Khutala and Klipspruit mines both have a reserve life of seven years, while Middelburg and Wolvekrans have a reserve life of 24 years and 22 years, respectively.
In FY2013, approximately 561.7 million tonnes (Mt). Our concentrate production, which represents 60 per cent of BECSA’s sales weretotal production, results from flotation of sulphide ores mined at our Escondida and Antamina mines. Oxide ores and sulphide ores amenable to Eskom,leaching are mined and processed into copper cathode, using conventional heap leaching, followed by solvent extraction and electrowinning processes at Escondida, Cerro Colorado and Spence. Copper cathode is also produced at Olympic Dam, where sulphide ores are processed through conventional flotation and the government-ownedresulting concentrate is further transformed into cathodes through a smelting and refining process.
We market four primary products: copper cathodes, copper concentrates, zinc concentrates and uranium oxide. We sell our copper cathode production to wire rod mills, brass mills and casting plants around the world under contracts with prices at premiums to the London Metal Exchange (LME) or the Commodity Exchange Inc (COMEX) prices. We sell the majority of our uranium oxide to electricity utilitygenerating utilities, principally in Western Europe, North America and East Asia. Uranium is typically sold under a mix of long-term and short-term contracts. We sell most of our copper and zinc concentrates to smelters located in diversified geographic markets such as China, South America, Japan, India and South Korea. Treatment charges and refining charges (collectively referred to as TCRCs) are negotiated with counterparties on a variety of tenors, trending towards shorter-term, more market-based pricing periods (less than one year). Some of the ores we mine contain quantities of silver and gold, which remain in the base metal concentrates we sell, and are typically subject to payment credits. We sell refined silver and gold from Olympic Dam. Our five operating assets, which are located in South Africa.America and Australia, consist of the following:
Americas
Escondida
Our 57.5 per cent owned and operated Escondida mine is a leading producer of copper. Located in the Atacama Desert in northern Chile, Escondida employs approximately 12,000 operational employees and contractors and has the capacity to move in excess of 1.3 Mt of material per day. Its two open-cut pits currently feed three concentrator plants, Laguna Seca, Los Colorados and the recently commissioned Organic Growth Project 1 (OGP1), as well as two leaching operations (oxide and sulphide). The remainingLos Colorados concentrator plant will be placed into care and maintenance once OGP1 ramp-up has been completed as current water source volumes cannot sustain the operation of three concentrators at nominal capacity. Escondida is assessing extending the life of the Los Colorados concentrator plant on the completion of the Escondida Water Supply (EWS) project based on the availability of water and mine stability. All three concentrator plants use grinding and flotation technologies to produce copper concentrate. In FY2015, our share of Escondida production was exported, predominantly to China526.7 kilotonnes (kt) of payable copper in concentrate and India, via the Richards Bay Coal Terminal (RBCT), in which we own a 22178.4 kt of copper cathode. Escondida production for FY2016 will be impacted by an anticipated 27 per cent share.decline in ore grades. This will be partly offset by increased throughput, enabled by the completion of the OGP1 and operational improvements. The reserve life is discussed in section 2.3.2.
The conversionavailability of BECSA’s old order mining rightskey inputs like power and water at competitive prices is an important focus for our Copper Business. In November 2013, we awarded a long-term energy agreement to new order mining rights underpins BECSA’s licencea consortium consisting of Korea Southern Power Co. and Samsung Construction & Trading Corp. for the development, operation and maintenance of a 517 megawatt (MW) combined-cycle gas-fired power plant (Kelar power plant) in the town of Mejillones, Chile. The plant, which will be connected to operate. In order to achieve this, during FY2013, BECSA finalised an empowerment transactionthe Northern Interconnected Grid (SING), will supply
the increasing demand for electricity at our operations. Construction work is progressing as planned with a Black-owned consortium, led by Pembani Group Proprietary Limited, transferring an eight(65.4 per cent equity interestcompleted as of 30 June 2015) and production is expected to begin in BECSA.the October 2017 quarter.
A contract for the supply of natural gas to the Kelar power plant has been secured with Gas Natural Fenosa. First deliveries are scheduled to commence in CY2016, which will tie-in with the commissioning and commercial operation of the Kelar plant.
To address limitations on the availability of water, we desalinate sea water and carefully manage our use and reuse of available water. The shareholdersEWS project, which involves the construction of BECSA also approveda second desalination plant, will reduce our reliance on the implementation of an Employee Share Ownership Plan (ESOP)region’s aquifers and help meet our environmental commitments. The EWS project is expected to be commissioned in which participating employees will hold a beneficial interestCY2017.
Pampa Norte
Pampa Norte consists of two per cent equityoperations – Spence and Cerro Colorado. Copper cathode is produced at both operations following a leaching, solvent extraction and electrowinning process.
Our wholly owned Spence copper mine is located in BECSA for a vested period.the Atacama Desert, 162 kilometres northeast of Antofagasta in Chile. During FY2015, Spence produced 171.4 kt of high-quality copper cathode, using oxide and sulphide ore treatment through leaching, solvent extraction and electrowinning processes. The ESOP and empowerment transaction were implementedreserve life is discussed in January and May 2013, respectively, and reduced our ownership interest in BECSA to 90 per cent.section 2.3.2.
New Mexico Coal
We own and operate the Navajo mine, located on Navajo Nation land in New Mexico, United States, and the nearby San JuanOur wholly owned Cerro Colorado mine, located in the stateAtacama Desert, 120 kilometres east of New Mexico. Each mine transports itsIquique in Chile, remains a significant producer of copper cathode, although production directly to a nearby power station.levels have fallen in recent years as grades have declined. Despite this, production in FY2015 reached 78.2 kt of copper cathode. The reserve lives of our mines are three years at Navajo mine and five years at San Juan Mine, whichlife is the lifediscussed in section 2.3.2. The extension of the current customer contracts. New Mexico Coal produced 13.2 Mt in FY2013.
New Mexico Coalexisting environmental and the Navajo Nation have entered into a Memorandum of Understanding to pursue discussions to transition full ownership of the Navajo Coal Company to the Navajo Nation. Binding agreements are expected to be signed during FY2014. The Navajo Nation has formed the Navajo Transitional Energy Company (NTEC) to acquire Navajo Mine. A subsidiary of New Mexico Coal and NTEC expect to enter into a Mine Management Agreement where we expect the subsidiarymining licences to continue as mine manager until the end of CY2016.to enable Cerro Colorado to operate beyond December 2016 is currently pending approval.
New South Wales Energy CoalAntamina
New South Wales Energy Coal’s operating asset is the Mt Arthur Coal open-cut mine in the Hunter Valley region of New South Wales, Australia. New South Wales Energy Coal produced 18.0 Mt in FY2013 and has a reserve life of 40 years. In FY2013, we delivered approximately sixWe own 33.75 per cent of Mt Arthur’sAntamina, a large, low-cost copper and zinc mine in north central Peru. Antamina’s total production for FY2015 was 107.7 kt of copper in concentrate and 66.4 kt of zinc in concentrate. Antamina also produces molybdenum and lead/bismuth concentrate, as well as small amounts of silver in the form ofby-products. The reserve life is discussed in section 2.3.2.
In FY2015, following the identification of a number of debottlenecking opportunities, Antamina successfully increased nominal milling capacity to 53 million tonnes per annum (Mtpa).
Australia
Olympic Dam
Our wholly owned Olympic Dam mine is a local power stationproducer of copper cathode and exporteduranium oxide and a refiner of gold and silver bullion. The site includes an underground mine, where the rest, predominantly to Japanprimary method of ore extraction islong-hole open stoping with cemented aggregate fill, and China, viaan integrated metallurgical processing plant.
The underground mine extracts copper uranium ore and hauls the portore by an automated train and trucking network feeding underground crushing, storage and ore hoisting facilities. The processing plant consists of Newcastle.two grinding circuits in which high-quality copper concentrate is extracted from sulphide ore through a flotation extraction process. The operation includes a fully integrated metallurgical complex with a grinding and concentrating circuit, a hydrometallurgical plant incorporating solvent extraction circuits for copper and uranium, a copper smelter, a copper refinery and a recovery circuit for precious metals.
We are a 35.5The Svedala mill, which accounts for approximately 60 per cent shareholderof Olympic Dam’s production, experienced an electrical failure in Newcastle Coal Infrastructure Group, a jointly controlled entity thatJanuary 2015. Repairs were completed by June 2015 and the mill is now operating the Newcastle Third Port export coal loading facilityat full capacity. In FY2015, Olympic Dam produced 124.5 kt of copper cathode, 3.1 kt of uranium oxide,104.8 kilo-ounces (koz) of refined gold and currently has a project724 koz of refined silver. The reserve life is discussed in execution (see Development projects below). We also have a 1.75 per cent interest in Port Waratah Coal Services Limited, which operates two coal loading facilities at the Port of Newcastle.section 2.3.2.
CerrejónCannington
We have a one-third interest in Cerrejón Coal Company, which owns and operates, one of the largest open-cut export coal minesIn May 2015, our Cannington silver-lead-zinc mine was included in the worlddemerger of South32. Further information can be found in sections 1.3.7, 1.6.4, and 2.1.7 and note 29 ‘Discontinued operations’ to the La Guajira province of Colombia. Cerrejón also owns and operates integrated rail and port facilities through which the majority of production is exported to European, Middle Eastern, North American and Asian customers. In FY2013, our share of Cerrejón production was approximately 10.0 Mt. Cerrejón has a reserve life of 19 years.
In FY2012, Cerrejón commenced an expansion project (P40), which is expected to increase our share of production from 10.7 Mtpa to 13.3 Mtpa (see Development projects below).Financial Statements.
Information on Energy CoalCopper mining operations
The following table contains additional details of our mining operations. TheThis table should be read in conjunction with the production (see(refer to section 2.3.2)2.2.2) and reservesreserve tables (see(refer to section 2.13.2)2.3.2).
| | | | | | | | | | | | | | | | |
Mine & location | | Means of access | | Ownership | | Operator | | Title, leases or
options
| | History | | Mine type &
mineralisation
style
| | Power source | | Facilities, use &
condition |
Energy coal
Americas | | | | | | | | | | | | | | | | |
| | | | | | | | |
South Africa
Copper | | | | | | | | | | | | | | | | |
| | | | | | | | |
| Escondida | | | | | | | | | | | | | | | | |
| Atacama Desert, 170 km southeast of Antofagasta, Chile | | KhutalaPublic road
Copper cathode transported by privately owned rail to ports at Antofagasta and Mejillones Copper concentrate transported by Escondida-owned pipelines to its Coloso port facilities | | BHP Billiton 57.5% of Minera Escondida Limitada (MEL) Rio Tinto 30% JECO Corporation consortium comprising Mitsubishi, JX Nippon Mining and Metals 10% JECO2 Ltd 2.5% | | BHP Billiton | | Mining
concession from
Chilean
Government
valid indefinitely
(subject to
payment of
annual fees) | | Original construction completed in 1990 Sulphide leach copper production commenced in 2006 | | 2 open-cut pits: Escondida and Escondida Norte Escondida and Escondida Norte mineral deposits are adjacent but distinct supergene enriched porphyry copper deposits | | Escondida-owned transmission lines connect to Chile’s northern power grid Electricity purchased under contracts expiring 2016 and 2029 | | 3 concentrator plants extract copper concentrate from sulphide ore by flotation extraction process 2 solvent extraction plants produce copper cathode Nominal capacity: 153.7 Mtpa (nominal milling capacity) and 350 ktpa copper cathode (nominal capacity of tank house) Two 168 km concentrate pipelines 167 km water pipeline Port facilities at Coloso, Antofagasta |
| | | | | | | | | | | | | | | | |
Mine & location | | Means of access | | Ownership | | Operator | | Title, leases or
options | | History | | Mine type &
mineralisation
style | | Power source | | Facilities, use &
condition |
| Pampa Norte Spence | | | | | | | | | | | | | | | | |
| Atacama Desert, 162 km northeast of Antofagasta, Chile | | Public road Copper cathode transported by rail to ports at Mejillones and Antofagasta | | 100% | | BHP Billiton | | Mining
concession from
Chilean
Government
valid indefinitely
(subject to
payment of
annual fees) | | Development cost of US$1.1 billion approved in 2004 First copper produced in 2006 | | Open-cut Enriched and oxidised porphyry copper deposit that presents dominantly in situ copper oxide mineralisation that overlies a near-horizontal sequence of supergene sulphide, transitional sulphide, and lower-most primary (hypogene) sulphide mineralisation | | Spence-owned transmission lines connect to Chile’s northern power grid Electricity purchased under contract | | Processing and crushing facilities, separate dynamic (on-off) leach pads, solvent extraction plant, electrowinning plant Nominal capacity of tank house: 179 ktpa copper cathode |
| | | | | | | | | | | | | | | | |
Mine & location | | Means of access | | Ownership | | Operator | | Title, leases or
options | | History | | Mine type &
mineralisation
style | | Power source | | Facilities, use &
condition |
| Pampa Norte Cerro Colorado | | | | | | | | | | | | | | | | |
| Atacama Desert, 120 km east of Iquique, Chile | | Public road Copper cathode trucked to port at Iquique | | 100% | | BHP Billiton | | Mining concession
from Chilean
Government valid
indefinitely
(subject to
payment of
annual fees) | | Commercial production commenced in 1994 Expansions in 1996 and 1998 | | Open-cut Enriched and oxidised porphyry copper deposit that presents dominantly in situ copper oxide mineralisation that overlies a near-horizontal sequence of supergene sulphide, transitional sulphide, and lower-most primary (hypogene) sulphide mineralisation | | Long-term contracts with northern Chile power grid | | 2 primary, secondary and tertiary crushers, leaching pads, solvent extraction plant, electrowinning plant Nominal capacity of tank house: 102 ktpa copper cathode |
| | | | | | | | |
| Copper and zinc | | | | | | | | | | | | | | | | |
|
| Antamina |
| Andes mountain range, 270 km north of Lima, north central Peru | | Public road Copper and zinc concentrates transported by pipeline to port of Huarmey Molybdenum and lead/bismuth concentrates transported by truck | | BHP Billiton 33.75% of Compañía Minera Antamina SA Glencore 33.75% Teck 22.5% Mitsubishi 10% | | Compañía Minera Antamina SA | | Mining rights
from Peruvian
Government held
indefinitely,
subject to
payment of
annual fees and
supply of
information on
investment and
production | | Commercial production commenced in 2001 Capital cost US$2.3 billion (100%) | | Open-cut Zoned porphyry and skarn deposit with central copper-only ores and an outer band of copper-zinc ore zone | | Long-term contracts with individual power producers | | Primary crusher, concentrator, copper and zinc flotation circuits, bismuth/moly cleaning circuit Nominal milling capacity 53 Mtpa 300 km concentrate pipeline Port facilities at Huarmey |
| | | | | | | | | | | | | | | | |
Mine & location | | Means of access | | Ownership | | Operator | | Title, leases or
options | | History | | Mine type &
mineralisation
style | | Power source | | Facilities, use &
condition |
| Australia | | | | | | | | | | | | | | | | |
| | | | | | | | |
| Copper and uranium | | | | | | | | | | | | | | | | |
|
| Olympic Dam |
| 560 km northwest of Adelaide, South Australia | | Public road Copper cathode trucked to ports Uranium oxide transported by road to ports | | 100% | | BHP Billiton | | Mining lease
granted by South
Australian
Government
expires in 2036Right of
extension for
50 years (subject
to remaining
mine life) | | Acquired in 2005 as part of WMC acquisition Copper production began in 1988 Nominal milling capacity raised to 9 Mtpa in 1999 Optimisation project completed in 2002 New copper solvent extraction plant commissioned in 2004 | | Underground Large poly-metallic deposit of iron oxide-copper-uranium-gold mineralisation | | Supplied via 275 kV power line from Port Augusta, transmitted by ElectraNet | | Underground automated train and trucking network feeding crushing, storage and ore hoisting facilities 2 grinding circuits Nominal milling capacity: 10.3 Mtpa Flash furnace produces copper anodes, then refined to produce copper cathodes Electrowon copper cathode and uranium oxide concentrate produced by leaching and solvent extracting flotation tailings |
Development projects
Americas
Escondida
The Organic Growth Project 1 (OGP1) is a new concentrator with a 152 kilotonnes per day (ktpd) plant. We expect this project to provide additional processing capacity and allow access to high-grade ore. OGP1 was approved in February 2012 with budgeted expenditure of US$3.8 billion (US$2.2 billion BHP Billiton share). A US$361 million increase in the budget of OGP1 to US$4.2 billion (US$ 2.4 billion BHP Billiton share) was approved in October 2014 following challenges associated with contractor’s progress. The Project was completed in May 2015 and is currently in the commissioning and ramp-up phase.
The Escondida Water Supply (EWS) project was approved in July 2013 and consists of a new 2,500 litres per second sea water desalination facility. This project will provide an alternative water supply to Escondida, as water usage increases upon completion of the 152 ktpd OGP1 copper concentrator. Construction of the new desalination facility commenced in July 2013 and includes the development of two pipelines, four high-pressure pump stations, a reservoir at the mine site and high-voltage infrastructure to support the system. The new facility is expected to be commissioned in CY2017 at a cost of US$3.4 billion (US$2.0 billion BHP Billiton share).
The Oxide Leach Area Project (OLAP) was completed in November 2014 and now in production. The Project involved the creation of a new dynamic leaching pad and mineral handling system that included several overland conveyors. The new pad is expected to maintain oxide leaching capacity at current levels. OLAP was approved in February 2012 with budgeted expenditure of US$721 million (US$414 million BHP Billiton share) and a US$212 million increase in the budget of OLAP to US$933 million (US$536 million BHP Billiton share) was approved in March 2014. Expected final cost is US$899 million (US$517 million BHP Billiton share).
Pampa Norte
The Spence Growth Option (SGO) project, currently at pre-feasibility phase, endeavours to maximise Spence’s value by exploiting the large and expandable hypogene resource with associated molybdenum sulphide by building a 95 ktpd concentrator. This would increase the mine life by approximately 50 years beyond the current FY2025 closure date. The proposed investment is approximately US$3.2 billion and the project is scheduled to commence at the end of the November 2019 quarter. The hypogene ore underlies the supergene reserves currently being exploited and therefore eliminates the need for pre-stripping and additional mine maintenance infrastructure. The option to maximise the use of existing heap leach infrastructure, to recover copper from the lower-grade chalcopyrite ores, is being developed as a complementary process to the concentrator (CPY leach project). The implementation of both the SGO and CPY leach projects will enable Spence to achieve a total copper production of approximately 260 kt on average during the first 10 years of operation.
Olympic Dam
The focus at Olympic Dam is to transform the existing operation to materially lower the cost of production safely and sustainably. We are progressing a pre-feasibility study to examine potential future optimisation and expansion opportunities.
During FY2015, we received approval from the Australian and South Australian Governments to construct a site-based heap leaching demonstration plant, as part of our efforts to identify an alternative, less capital-intensive process for extracting metals from ore mined underground. Construction of the demonstration plant is subject to ongoing, off-site demonstration and test work outcomes and Board approvals.
Resolution Copper
We hold a 45 per cent interest in the Resolution Copper project in the US state of Arizona, a project which is operated by Rio Tinto (55 per cent interest). Resolution Copper is among the top 10 largest undeveloped copper projects in the world and could eventually become the largest copper producer in North America.
In FY2014, Resolution Copper completed a pre-feasibility study into a 120 ktpd underground panel cave operation and processing facility. Further opportunities to economically optimise the project and minimise any technical risks have been identified, and the project plans to continue to study these opportunities. Additionally, a General Mine Plan of Operations was submitted to the US Forest Service in November 2013. In December 2014, President Obama signed legislation that will allow the US Federal Government to exchange 2,400 acres of federally owned land immediately adjacent to Resolution’s operational site, for 5,300 acres of important wildlife habitat, conservation and recreational land owned by Resolution. Both the land exchange and proposed mine plan will now undergo a comprehensive environmental and regulatory review that includes an assessment under the US National Environmental Policy Act. This process will include public input, government-to-government consultation with Arizona Native American tribes, and a US Federal Government appraisal of the exchange lands.
In November 2014, Resolution Copper completed construction of the No#10 Shaft to a final depth of 2,116 metres. Our share of project expenditure for FY2015 was US$55 million.
Exploration activities
Our greenfield copper exploration activities during FY2015 were focused on advancing targets within Chile, Peru and southwestern United States. Greenfield activities include opportunity identification, application for and acquisition of mineral title, early reconnaissance operations and drilling programs.
2.1.3 Iron Ore Business
Our Iron Ore Business, headquartered in Perth, Australia, is one of the leading iron ore producers in the world. We sell lump and fines products produced in Australia and produce pellets from our operations in Brazil.
Our two assets consist of the following:
Western Australia Iron Ore
Operations at Western Australia Iron Ore (WAIO) involve an integrated system of mines and more than 1,000 kilometres of rail infrastructure and port facilities in the Pilbara region of northern Western Australia, with our headquarters located in Perth. Our focus is to safely maximise output through operating our mines and utilising available infrastructure at our disposal.
Since 2001, we have expanded our WAIO operations in response to increasing demand for iron ore, particularly from China. We have completed eight expansion projects during this period to increase our mine, rail and port capacity. This includes the recent completion of a number of expansion projects and ongoing debottlenecking of the supply chain to underpin potential further growth in capacity to 290 Mtpa (100 per cent basis). Our share of FY2015 production was 218.0 Mt of ore, which is expected to increase in FY2016 to 233 Mtpa. The reserve lives for our WAIO operations are discussed in section 2.3.2.
Our Pilbara reserve base is relatively concentrated, allowing us to plan our development around a series of integrated mining hubs joined to the orebodies by conveyors or spur lines. This approach enables us to maximise the value of installed infrastructure by using the same processing plant and rail infrastructure for a number of orebodies.
Lump and fines products are sold to steel mills in China, South Korea, Japan, Singapore, Hong Kong, Taiwan, Switzerland and Australia under long-term and short-term contracts. Contract prices are generally linked to market indices.
In order to establish a consistent, long-term, high-quality lump ore product with a stable grade, we produce a blended lump product. The product is a blend of lump ores produced from the Newman, Area C and Jimblebar mining areas, known as Newman Blend lump. During FY2015, 23 per cent of our sales were lump and 77 per cent were fines.
WAIO operations
Our WAIO operations consist of four main joint ventures: Mt Newman, Yandi, Mt Goldsworthy and Jimblebar. Our interest in the joint ventures is 85 per cent, with Mitsui and ITOCHU owning the remaining 15 per cent. The joint ventures are unincorporated, except Jimblebar.
The Mt Newman Joint Venture (JV) consists of a number of orebodies joined by conveyors and spur lines to a mining hub at Mt Whaleback. Ore is crushed, beneficiated (where necessary) and blended to create lump and fine products. The ore is then transported to port using Mt Newman JV-owned rail facilities. The Yandi JV comprises the Yandi mine where ore is crushed and screened and then transported by rail on the Newman main line. The Mt Goldsworthy JV consists of the Area C mine in the central Pilbara and the Yarrie mine in northern Pilbara. Ore is crushed and screened at Area C and transported by rail to Port Hedland. Production at the Yarrie mine in the northern Pilbara has been suspended since 25 February 2014, following improved productivity at our other mining operations. The Jimblebar operation comprises the Jimblebar mine, located 40 kilometres east of Newman. Jimblebar delivered first production in the September 2013 quarter and produced 17 Mt during FY2015. The Jimblebar mining hub ramped-up to a production rate exceeding 45 Mtpa during FY2015. All ore is transported by rail on the Mt Newman JV and Mt Goldsworthy JV rail lines to our port facilities. A typical train configuration consists of two locomotives per 124 ore cars, called a rake, with two rakes per train. Each individual ore car carries approximately 132 tonnes of iron ore. Our rail operations are controlled from Perth via our integrated remote operations centre, which co-locates rail control, port production control, mine dispatch control and mine fixed plant control.
Our port facilities are located on both sides of the harbour at Port Hedland. These facilities consist of Nelson Point, owned by the Mt Newman JV, and Finucane Island, owned by the Mt Goldsworthy JV. The port facilities include five ore car dumpers, three lump rescreening plants, eight stackers, five reclaimers, stock and blending yards, and eight ship loaders. Vessels depart the harbour via a dredged channel that is approximately 45 kilometres long and has a width of 300 metres.
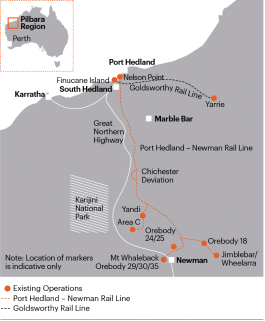
Along with the other joint venture partners, we have entered into marketing agreements in the form of joint ventures with some customers. These customer joint ventures, JW4, Wheelarra and POSMAC, involve subleases of part of WAIO’s existing mineral leases. The ore is sold to the existing joint ventures with contractual terms applying to the customers’ share. As a consequence, we are entitled to 85 per cent of production from these subleases and the customer joint ventures are not joint operations for accounting purposes.
WAIO Ore Reserves are reported for the Pilbara as a whole by ore type, to reflect our production of the Newman Blend lump product and fines, as well as our single logistics chain and associated management system. The reserve lives of our Western Australian mines are discussed in section 2.3.2.
Samarco
We are a 50–50 joint venture partner with Vale at the Samarco operation in Brazil. Samarco currently comprises a mine and three concentrators located in the state of Minas Gerais, and four pellet plants and a port, located in Anchieta in the state of Espirito Santo. Three 400-kilometre pipelines connect the mine site to the pelletising facilities.
Samarco’s main product is iron ore pellets. Extraction and beneficiation of iron ore are conducted at the Germano facilities in the municipalities of Mariana and Ouro Preto. Conveyor systems are used to extract the ore and convey it from the mines. Ore beneficiation then occurs in concentrators, where crushing, milling, desliming and flotation processes produce iron concentrate. The concentrate leaves the concentrators as slurry and is pumped through the slurry pipelines from the Germano facilities to the pellet plants in Ubu, Anchieta, where the slurry is processed into pellets. The iron ore pellets are then heat treated. The pellet output is stored in a stockpile yard before being shipped out of the Samarco-owned Port of Ubu in Anchieta.
Pellets are independently marketed by Samarco and sold to steelmakers in 19 countries, with prices generally linked to market indices.
In FY2015, our share of production was 14.5 Mt of pellets. The reserve life for Samarco is discussed in section 2.3.2.
Information on Iron Ore mining operations
The following table contains additional details of our mining operations. This table should be read in conjunction with the production (refer to section 2.2.2) and reserve tables (refer to section 2.3.2).
| | | | | | | | | | | | | | | | |
Mine & location | | Means of access | | Ownership | | Operator | | Title, leases or options | | History | | Mine type &
mineralisation style | | Power source | | Facilities, use &
condition |
Iron ore |
| | | | | | | | |
| Mt Newman Joint Venture | | | | | | | | | | | | | | | | |
100 km east of Johannesburg, Gauteng Province,Pilbara region, Western Australia
South Africa
Mt Whaleback Orebodies 18, 23, 24, 25, 29, 30 and 35 | | PublicPrivate road
Domestic coalIron ore transported by overland conveyorMt Newman JV-owned rail to Kendal Power StationPort Hedland (427 km)
| | BHP Billiton 90%85% Newshelf 1129 Proprietary Limited (BEE SPV) 8%
Eyami Trust Management Company (RF) Proprietary Limited (ESOP) 2%Mitsui ITOCHU Iron 10% ITOCHU Minerals and Energy of Australia 5%
| | BHP Billiton: Mt Whaleback Orebodies 18, 23, 24, 25, 29, 30 and 35 Operatorship of Orebody 18 transitioned to BHP Billiton in July 2014 | | BECSA holds a 100% shareMining lease under the Iron Ore (Mt Newman) Agreement Act 1964 expires in 2030 with right to successive renewals of Converted Mining Right, granted October 2011
Mining Right was amended 15 February 2013 to include Portion 16 of Zondagsvlei 9 IS
21 years | | Production commenced 1984began at Mt Whaleback orebody in 1969 Open-cut operations 1996Production from Orebodies 18, 23, 24, 25, 29, 30 and 35 complements production from Mt Whaleback
Commenced mining thermal/metallurgical coal for domestic market 2003First ore from Newman Hub as part of RGP4 construction delivered in 2009
| | Combination open-cut and undergroundOpen-cut
Produces a medium rank bituminous thermal coal (non-coking)Bedded ore types classified as per host Archaean or Proterozoic iron formation, which are Brockman and Marra Mamba
| | Eskom (nationalFrom May 2014 Yarnima power supplier) under long-term contracts station started supplying approximately two thirds of power, with a supplementary contract with Alinta Dewap Newman power station for the remaining amount | | CrushingNewman Hub: primary and secondary crushing and screening plants (nominal capacity 63 Mtpa); heavy media beneficiation plant, for energy coalstockyard blending facility, single cell rotary car dumper, train-loading facility
Nominal capacity: 18 Mtpa
Smaller crusher to beneficiate metallurgical coal Nominal capacity: 1.5 MtpaOrebody 25: primary and secondary crushing and screening plant (nominal capacity 13 Mtpa)
|
| | | | | | | | |
Middelburg/WolvekransYandi Joint Venture | | | | | | | | | | | | | | | | |
20 km southeast of Witbank, Mpumalanga Province, South AfricaPilbara region, Western Australia | | PublicPrivate road
Export coalIron ore transported by Mt Newman JV-owned rail to RBCT by third party rail (558Port Hedland (316 km)
Domestic coal transported by conveyorYandi JV’s railway spur links Yandi mine to Duvha Power StationNewman main line
| | BHP Billiton 90%85% Newshelf 1129 Proprietary Limited (BEE SPV)Mitsui Iron Ore Corporation 7% ITOCHU Minerals and Energy of Australia 8%
Eyami Trust Management Company (RF) Proprietary Limited (ESOP) 2%
Previous JV (84:16) with
Glencore Xstrata Plc (through Tavistock Collieries Pty Limited) was amended in February 2008
| | BHP Billiton | | BECSA and Tavistock are joint holders of 3 Converted Mining Rightslease under the Iron Ore (Marillana Creek) Agreement Act 1991 expires in the previous JV ratio (84:16)
BECSA is the 100% holder of2033 with one renewal right to a fourth Converted Mining Right
All 4 Rights comprise the Middelburg Mine Complex(1)
The Converted Mining Rights were granted during October and December 2011(2)
further 21 years | | Production commenced 1982Development began in 1991
Middelburg Mine Services (MMS) and Duvha Opencast became one operationFirst shipment in 19951992
Douglas-Middelburg Optimisation project completed July 2010
Mine was split into MiddelburgCapacity expanded between 1994 and Wolvekrans during FY20112013
| | Open-cut Produces a medium rank bituminous thermal coal, most of which can be beneficiated for the European or Asian export marketsChannel Iron Deposits are Cainozoic fluvial sediments
| | Eskom under long-term contractsFrom May 2014 Yarnima power station started supplying approximately two thirds of power, with a supplementary contract with Alinta Dewap Newman power station | | Beneficiation facilities: tipsThree processing plants, primary crusher and crushing plants, 2 export wash plants, middlings wash plant, de-stone plantoverland conveyor (nominal capacity 80 Mtpa)
Nominal capacity: 41.4 MtpaOre delivered to two train-loading facilities
|
| | | | | | | | | | | | | | | | |
Mine & location | | Means of access | | Ownership | | Operator | | Title, leases or options | | History | | Mine type &
mineralisation
style | | Power source | | Facilities, use &
condition |
Klipspruit
JW4 Joint Venture | | | | | | | | | | | | | | | | |
30 km west of Witbank, Mpumalanga Province, South AfricaPilbara region, Western Australia | | PublicPrivate road
Export coalIron oreon-sold to Yandi JV, then transported via rail to RBCT by third party rail (611 km)Finucane Island and Nelson Point shipping facilities, Port Hedland
| | BHP Billiton 90%68% Newshelf 1129 Proprietary Limited (BEE SPV) 8%ITOCHU Minerals and Energy of Australia 6.4%
Eyami Trust Management Company (RF) Proprietary Limited (ESOP) 2%Mitsui Iron Ore Corporation 5.6%
JFE Steel Australia 20% Phola Coal Plant in JV with Anglo Inyosi Coal 50%Sublease agreement over JW4 deposit
| | BHP Billiton | | BECSA holdsSublease over part of the mining lease under the Iron Ore (Marillana Creek) Agreement Act 1991 expires in 2033 with one renewal right for a Converted Mining Right, granted 11 October 2011further 21 years | | Production commenced 2003Operations began in April 2006
Expansion project completed FY2010, includes 50% share in Phola Coal Plant
Run of mine (ROM) capacity: 8.0 Mtpa at full ramp-upOre currently being produced is sold to Yandi JV and blended with Yandi ore
| | Open-cut Produces a medium rank bituminous thermal coal, most of which can be beneficiated for the European or Asian export marketsChannel Iron Deposits are Cainozoic fluvial sediments
| | Eskom, under long-term contractsFrom May 2014 Yarnima power station started supplying approximately two thirds of power, with a supplementary contract with Alinta Dewap Newman power station | | Beneficiation facilities: tip and crushing plant, export wash plant
Nominal capacity Phola Coal Processing Plant: 16 Mtpa
JW4 processes ore through Yandi |
| | | | | | | | |
Australia
Jimblebar operation | | | | | | | | | | | | | | | | |
| Pilbara region, Western Australia | | Private road | | BHP Billiton 85% ITOCHU Minerals and Energy of Australia 8%, Mitsui Iron Ore Corporation 7% | | BHP Billiton | | Mining lease under the Iron Ore (McCamey’s Monster) Agreement Authorisation Act 1972 expires in 2030 with rights to successive renewals of 21 years | | Production at Jimblebar began in March 1989 From 2004, production was transferred to Wheelarra as part of the Wheelarra sublease agreement First ore from newly commissioned Jimblebar mine was delivered in September 2013 | | Open-cut Bedded ore types classified as per host Archaean or Proterozoic banded iron formation, which are Brockman and Marra Mamba | | From May 2014 Yarnima power station started supplying approximately two thirds of power, with a supplementary contract with Alinta Dewap Newman power station | | Two primary and secondary crushers, ore handling plant, stockyards and supporting mining hub infrastructure (nominal capacity 55 Mtpa) |
| | | | | | | | | | | | | | | | |
Mt Arthur Coal
| | | | | | | | | | | | | | |
Approximately 125 km northwest of Newcastle,
New South Wales, AustraliaMine & location
| | Public roadMeans of
Domestic coal transported by conveyor to Bayswater Power Station
Export coal transported by third party rail to Newcastle port
| | 100% | | BHP Billiton | | Various mining leases and licences expire 2010 – 2032
Renewal is being sought for expired mining leases
The original approvals permit mining and other activities to continue during renewal applicationaccess
| | Production commenced 2002
Government approval permits extraction of up to 36 Mtpa of run of mine coal from underground and open-cut operations, with open-cut extraction limited to 32 MtpaOwnership
| | Open-cut
Produces a medium rank bituminous thermal coal (non- coking)Operator
| | Local energy providersTitle, leases or options | | Beneficiation facilities: coal handling, preparation, washing plantsHistory
| | Mine type &
mineralisation style | | Power Nominal capacity: in excess of 18 Mtpasource
| | Facilities, use &
condition |
United States
Wheelarra Joint Venture | | | | | | | | | | | | | | | | |
| Pilbara region, Western Australia | | Private road Iron ore is transported via conveyor to Jimblebar mine (6 km) | | BHP Billiton 51% ITOCHU Minerals and Energy of Australia 4.8% Mitsui Iron Ore Corporation 4.2% Maanshan Iron & Steel Australia 10% Shagang Australia 10% Hebei Iron & Steel Australia 10% Wugang Australia 10% Sublease agreement over Wheelarra deposit | | BHP Billiton | | Sublease agreement over the Wheelarra deposit of Jimblebar lease with ITOCHU Minerals and Energy of Australia, Mitsui Iron Ore and four separate subsidiaries of Chinese steelmakers This arrangement, entitles us to 85% of production from the Wheelarra sublease consistent with BHP Billiton ownership in Mt Newman JV | | Wheelarra JV produces iron ore from Wheelarra deposit of Jimblebar lease Ore produced is processed and blended with Jimblebar ore at Jimblebar mine and then sold to Mt Newman JV | | Open-cut Bedded ore types classified as per host Archaean or Proterozoic banded iron formation, which is Brockman | | From May 2014 Yarnima power station started supplying approximately two thirds of power, with a supplementary contract with Alinta Dewap Newman power station | | Wheelarra processes ore through the Jimblebar hub |
| | | | | | | | | | | | | | | | |
NavajoMine & location
| | Means of access | | Ownership | | Operator | | Title, leases or options | | History | | Mine type &
mineralisation style | | Power source | | Facilities, use &
condition |
| Mt Goldsworthy Joint Venture | | | | | | | | | | | | | | | | |
30 km southwest of Farmington, New Mexico, USPilbara region, Western Australia Area C Yarrie Nimingarra | | PublicPrivate road
CoalYarrie and Nimingarra iron ore transported by Mt Goldsworthy JV-owned rail to Four Corners Power PlantPort Hedland (218 km)
Area C iron ore transported by Mt Newman JV-owned rail to Port Hedland (360 km) Mt Goldsworthy JV railway spur links Area C mine to Yandi railway spur | | 100%BHP Billiton 85% Mitsui Iron Ore Corporation 7% ITOCHU Minerals and Energy of Australia 8% | | BHP Billiton | | Long-term lease from Navajo Nation continues for as long as coal can be economically produced4 mineral leases under the Iron Ore (Mt Goldsworthy) Agreement Act 1964 and soldthe Iron Ore (Goldsworthy – Nimingarra) Agreement Act 1972, expire between 2014 and 2028, with rights to successive renewals of 21 years A number of smaller mining leases granted under the Mining Act 1978 expire in paying quantities | | Production commenced 19632026 | | Open-cutOperations commenced at Mt Goldsworthy in 1966 and at Shay Gap in 1973
Produces a medium rank bituminous thermal coal (non-coking suitable for the domestic market only)Original Goldsworthy mine closed in 1982
Associated Shay Gap mine closed in 1993 Mining at Nimingarra mine ceased in 2007, then continued from adjacent Yarrie area Opened Area C mine in 2003 Yarrie mine suspended operations in February 2014 | | Four Corners Power PlantArea C, Yarrie and Nimingarra all open-cut Bedded ore types classified as per host Archaean or Proterozoic iron formation, which are Brockman, Marra Mamba and Nimingarra | | From May 2014 Yarnima power station started supplying approximately two thirds of power, with a supplementary contract with Alinta Dewap Newman power station | | StackersOre processing plant, primary crusher and reclaimers used to size and blend coal to contract specificationsoverland conveyor
Nominal capacity: 7.4 Mtpa(nominal capacity 60 Mtpa)
|
| | | | | | | | | | | | | | | | |
Mine & location | | Means of access | | Ownership | | Operator | | Title, leases or options | | History | | Mine type &
mineralisation
style | | Power source | | Facilities, use &
condition |
| POSMAC Joint Venture | | | | | | | | | | | | | | | | |
| Pilbara Region, Western Australia | | Private road Iron ore on-sold to Mt Goldsworthy JV, it is then transported via Mt Goldsworthy JV-owned rail and Mt Newman JV-owned rail to Port Hedland | | BHP Billiton 65% ITOCHU Minerals and Energy of Australia 8%, Mitsui Iron Ore Corporation 7% POSCO 20% Sublease agreement over POSMAC deposit | | BHP Billiton | | Sublease over part of mineral lease held by Mt Goldsworthy JV under the Iron Ore (Mt Goldsworthy) Agreement Act 1964 with rights to successive renewals of 21 years | | Operations commenced in October 2003 Iron ore currently being produced is sold to Mt Goldsworthy JV and blended with Area C ore | | Open-cut Bedded ore types classified as per host Archaean or Proterozoic iron formation, which is Marra Mamba | | From May 2014 Yarnima power station started supplying approximately two thirds of power, with a supplementary contract with Alinta Dewap Newman power station | | POSMAC processes through Mt Goldsworthy |
| | | | | | | | |
| Samarco | | | | | | | | | | | | | | | | |
| Southeast Brazil | | Public road Conveyor belts transport iron ore to beneficiation plant Three slurry pipelines transport concentrate to pellet plants on coast Iron pellets exported via port facilities | | BHP Billiton 50% of Samarco Mineração SA Vale SA 50% | | Samarco | | Mining concessions granted by Brazilian Government as long as Alegria complex mined according to agreed plan | | Production began at Germano mine in 1977 and at Alegria complex in 1992 Second pellet plant built in 1997 Third pellet plant, second concentrator and second pipeline built in 2008 Fourth pellet plant, third concentrator and third pipeline built in 2014 | | Open-cut Itabirites (metamorphic quartz-hematite rock) and friable hematite ores | | Samarco holds interests in 2 hydroelectric power plants which supply 14.5% of its electricity Power supply contract with Cemig Geração e Transmissão expires in 2022 | | Facilities with capacity to process and pump 32 Mtpa ore concentrate and produce and ship 30.5 Mtpa pellets (100% basis) |
Development projects
Western Australia Iron Ore
WAIO has been executing a number of expansion projects in recent years. These projects, approved in March 2011 for a total of US$7.4 billion (US$6.6 billion BHP Billiton share) plus pre-commitment funding of US$2.3 billion (US$2.1 billion BHP Billiton share), were designed to deliver an integrated operation with a minimum capacity of 220 Mtpa (100 per cent basis).
These projects, each of which is substantially complete, included:
the Jimblebar Mine Expansion project to develop the Jimblebar mine and rail links, and procure mining equipment and rolling stock in order to deliver a capacity of 35 Mtpa. Initial production was achieved in the September 2013 quarter. The project costs as at 30 June 2015 amounted to US$3.5 billion (BHP Billiton share). Final costs are expected to be delivered below the revised budget of US$3.6 billion;
further development of Port Hedland, including two additional berths and ship loaders, a car dumper, connecting conveyor route, and associated rail works and rolling stock. Initial production was achieved in the December 2012 quarter. The project costs as at 30 June 2015 amounted to US$1.8 billion (BHP Billiton share). Final costs are expected to be delivered below the revised budget of US$1.9 billion;
port blending facilities and rail yards to enable ore blending. Initial production was achieved in the December 2013 quarter. The project costs as at 30 June 2015 amounted to US$0.9 billion (BHP Billiton share). Final costs are expected to be delivered below the revised budget of US$1.0 billion.
Our plan to continue to grow production following the recent completion of a number of expansion projects includes ongoing debottlenecking of the supply chain to underpin potential further growth in capacity to 290 Mtpa (100 per cent basis).
Western Australia Iron Ore – Orebody 24 mine
In FY2014, WAIO completed execution of its development of the Orebody 24 mine, located approximately 10 kilometres northeast of Newman. Orebody 24 is a sustaining mine to maintain iron ore production output from the Mt Newman JV operations. The project was approved in November 2011 and included the construction of an ore crushing plant, train loadout facility, rail spur and other associated support facilities. The project costs as at 30 June 2015 amounted to US$0.6 billion (BHP Billiton share). Final costs are expected to be delivered below the revised budget of US$0.7 billion.
Exploration activities
Western Australia
WAIO has a substantial existing reserve base supported by considerable additional mineralisation, all within a 250-kilometre radius of our existing infrastructure. This concentration of orebodies also gives WAIO the flexibility to add growth tonnes to existing hub infrastructure and link brownfield developments to our existing mainline rail and port facilities. The total area covered by exploration and mining tenure amounts to 6,500 square kilometres. This excludes crown leases, and general purpose and miscellaneous licences, which are used for infrastructure space and access.
The majority of deposits are located on five main lease areas held by BHP Billiton and our joint venture partners, as appropriate. Iron ore mineralised materials fall mainly within the Hamersley Ranges of the Pilbara district, with a minor component of the inventory lying within the Pilbara Craton of northwest Western Australia.
In FY2015, exploration activity was completed over multiple project areas and deposits. The total drilling carried out amounts to approximately 486.7 kilometres, composed of reverse circulation drilling of 445.5 kilometres, diamond drilling of 25.1 kilometres and hydrology drilling of 16.2 kilometres, consisting of approximately 4,500 drill holes. Total exploration expenditure in FY2015 amounted to US$118 million.
Guinea Iron Ore
BHP Billiton has a 41.3 per cent interest in a joint venture that holds the Nimba Mining Concession and four iron ore prospecting permits in southeast Guinea.
On 29 July 2014, BHP Billiton and ArcelorMittal signed an agreement for the acquisition by ArcelorMittal of BHP Billiton’s 43.5 per cent stake in Euronimba Limited, which holds an effective 95 per cent interest in the Mount Nimba iron ore project in Guinea.
In May 2015, ArcelorMittal terminated the transaction following failure to meet the conditions to closing by the agreed deadline.
We will continue to assess our options for the Mount Nimba iron ore project.
Liberia Iron Ore
BHP Billiton has a 100 per cent interest in a Mineral Development Agreement with the Government of Liberia. This enables the further exploration and development of our Liberian iron ore mineral leases.
On 25 August 2014, BHP Billiton and Cavalla Resources signed a sale and purchase agreement for the acquisition by Cavalla Resources of BHP Billiton’s 100 per cent interest in its Liberia iron ore project. Completion of the transaction remains subject to the receipt of regulatory approval and other customary closing conditions.
2.1.4 Coal Business
Our Coal Business, headquartered in Brisbane, Australia, is the world’s largest supplier of seaborne metallurgical coal, a key input in steel production. Our Coal Business is also a large supplier of seaborne energy coal (also known as thermal or steaming coal) and a domestic energy coal supplier in the countries where our mines are located.
Our export metallurgical coal customers are steel producers around the world, principally in China, India, Japan and Europe. In FY2015, the majority of our metallurgical coal sales contracts were based on annual volumes, with prices largely index-linked (with negotiated differentials for quality) or on a spot basis.
We are a domestic supplier of energy coal to the electricity generation industry in Australia and the United States. Our domestic energy sales are generally made to nearby power stations under long-term fixed price or cost plus arrangements. Export sales are delivered to power generators and industrial users principally in China, India and Japan, under contracts that are generally index-linked or short-term fixed.
Total metallurgical coal production in FY2015 was 42.6 Mt and total energy coal production in FY2015 was 41.0 Mt.
Our assets, located in Australia, Colombia and the United States, consist of both open-cut and underground mines. At our open-cut mines, overburden is removed after blasting, using either draglines or truck and shovel. Coal is then extracted using excavators or loaders and loaded onto trucks to be taken to stockpiles or directly to our beneficiation facility. At our underground mines, coal is extracted by either longwall or continuous miner. The coal is then transported to stockpiles on the surface by conveyor. Coal from stockpiles is then crushed, and for a number of the operations, washed and processed through the coal preparation plant. Domestic coal is transported to nearby customers via conveyor, truck or rail. Export coal is transported to the port via trains, and as part of this coal supply chain both single and multi-user rail and port infrastructure is used.
Our assets consist of the following:
Queensland Coal
Queensland Coal comprises the BHP Billiton Mitsubishi Alliance (BMA) and BHP Billiton Mitsui Coal (BMC) Assets in the Bowen Basin in Central Queensland, Australia.
The Bowen Basin is well positioned to supply the seaborne market because of its high-quality metallurgical coals, which are ideally suited to efficient blast furnace operations, and its geographical proximity to Asian customers. We have access to key infrastructure in the Bowen Basin, including a modern, multi-user rail network and our own coal loading terminal at Hay Point, located near the city of Mackay. We also have contracted capacity at three other multi-user port facilities, including the Port of Gladstone (RG Tanna Coal Terminal), Dalrymple Bay Coal Terminal and Abbot Point Coal Terminal.
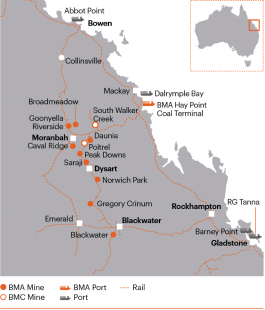
BHP Billiton Mitsubishi Alliance
BMA comprises two unincorporated joint ventures – Central Queensland Coal Associates Joint Venture (CQCA) and Gregory Joint Venture. We share 50–50 ownership with Mitsubishi Development.
BMA owns and operates open-cut and underground metallurgical coal mines in the Bowen Basin and also owns and operates the Hay Point Coal Terminal. The terminal consists of coal inloading dump stations, stacker reclaimers and two ship loaders, capable of loading 44 Mtpa of coal. The terminal has been undergoing expansion to increase its capacity to 55 Mtpa through the addition of a third berth and ship loader. The terminal expansion is near completion and first coal was loaded through the expanded terminal in January 2015. The terminal infrastructure enables us to blend products from multiple mines of BMA to optimise the value of our production and to satisfy customer requirements.
BMA operates the Goonyella Riverside, Broadmeadow, Daunia, Caval Ridge, Peak Downs, Saraji, Gregory Crinum and Blackwater mines. In May 2012, production ceased at Norwich Park mine, following a review of the mine’s viability. In October 2012, production also ceased at the Gregory open-cut mine, part of the Gregory Crinum complex. During the year, BMA announced the ramping down of the Crinum underground mine as it approaches the end of its economic reserve life, with longwall production expected to cease in the March 2016 quarter.
Our share of total production in FY2015 was 33.9 Mt. Production figures for BMA include some energy coal (less than three per cent). The reserve lives are discussed in section 2.3.2.
BHP Billiton Mitsui Coal
BMC is a subsidiary company owned by BHP Billiton (80 per cent) and Mitsui and Co (20 per cent). BMC owns and operates South Walker Creek and Poitrel, both open-cut metallurgical coal mines in the Bowen Basin. Total production in FY2015 was 8.7 Mt. The reserve lives are discussed in section 2.3.2.
New Mexico Coal
We own and operate the San Juan energy coal mine located in the US state of New Mexico. The mine transports its production directly to the nearby San Juan Generating Station (SJGS). Production for FY2015 was 5.1 Mt. The reserve life is discussed in section 2.3.2, which is the life of the current customer contract.
To ensure the ongoing supply of coal to the SJGS beyond 2017, in May 2015, the SJGS owners reached an in principle agreement for a new Coal Supply Agreement with Westmoreland Coal Company. In conjunction with this, in July 2015, New Mexico Coal executed a sales agreement with Westmoreland for the purchase of the San Juan Mine. Subject to regulatory approval, the transaction is expected to be completed at the end of CY2015 with Westmoreland assuming full operation of the mine from 1 January 2016.
We also operate the nearby Navajo mine, located on Navajo Nation land in New Mexico. Full ownership of the Navajo Coal Company transferred to the Navajo Transitional Energy Company (NTEC), an entity of the Navajo Nation, effective 30 December 2013. New Mexico Coal and NTEC entered into a Mine Management Agreement where New Mexico Coal will continue as mine operator until 31 December 2016, at which time control will pass to a new mine manager. The reserve life is discussed in section 2.3.2.
Navajo mine transports its production directly to the nearby Four Corners Power Plant. Navajo mine reduced capacity during FY2015 from 5.4 Mtpa to 4.8 Mtpa in response to reduced customer demand. Production for FY2015 was 4.9 Mt. As we retain control of the mine until full consideration is paid, production continues to be reported by the Group.
New South Wales Energy Coal
Our wholly owned New South Wales Energy Coal Asset owns and operates the Mt Arthur Coal open-cut energy coal mine in the Hunter Valley region of New South Wales, Australia. New South Wales Energy Coal produced 19.7 Mt in FY2015. The reserve life is discussed in section 2.3.2. In FY2015, we delivered approximately six per cent of Mt Arthur’s production to a local power station and exported the rest, predominantly to Japan and China, via the port of Newcastle.
We own a 35.5 per cent interest in the Newcastle Coal Infrastructure Group, which operates the Newcastle Third Port export coal loading facility. The facility currently has a port expansion project in execution (refer to Development projects). We also have a 1.75 per cent interest in Port Waratah Coal Services Limited, which operates two coal loading facilities at the port of Newcastle.
Cerrejón
We have a one-third interest in Cerrejón, which owns, operates and markets one of the world’s largest open-cut export energy coal mines, located in the La Guajira province of Colombia. Cerrejón also owns and operates integrated rail and port facilities through which the majority of production is exported to European, Asian, North and South American customers. In FY2015, our share of Cerrejón production was approximately 11.3 Mt. The reserve life is discussed in section 2.3.2.
In FY2012, Cerrejón commenced an expansion project (P40), which is expected to increase our share of production to 13.3 Mtpa (BHP Billiton share). The P40 project scope includes a second berth and dual quadrant ship loader at Cerrejón’s 100 per cent owned and operated Puerto Bolivar, along with necessary mine, rail and associated supply chain infrastructure. The project was completed during the December 2014 quarter. However, operational issues are expected to constrain capacity to 11.7 Mtpa (BHP Billiton share) in the medium term (refer to Development projects).
Illawarra Coal and Energy Coal South Africa
In May 2015, our Illawarra Coal mines and our 90 per cent interest in Energy Coal South Africa mines were included in the demerger of South32. Information relating to the South32 demerger can be found in sections 1.3.7, 1.6.4 and 2.1.7 of this Annual Report and note 29 ‘Discontinued operations’ of the Financial Statements.
Information on Coal mining operations
The following table contains additional details of our mining operations. The tables should be read in conjunction with the production (refer to section 2.2.2) and reserves tables (refer to section 2.3.2).
| | | | | | | | | | | | | | | | |
Mine & location | | Means of access | | Ownership | | Operator | | Title, leases or options | | History | | Mine type &
mineralisation style | | Power source | | Facilities, use &
condition |
| Australia | | | | | | | | | | | | | | |
| | | | | | | | |
| Central Queensland Coal Associates Joint Venture | | | | | | | | | | | | | | | | |
Bowen Basin, Queensland, Australia Goonyella Riverside, Broadmeadow Daunia Caval Ridge Peak Downs Saraji Blackwater and Norwich Park mines | | Public road Coal transported by rail to Hay Point, Gladstone, Dalrymple Bay and Abbot Point ports Distances between the mines and port are between 160 km and 315 km | | BHP Billiton 50% Mitsubishi Development 50% | | BMA | | Mining leases, including undeveloped tenements, expire between 2015 and 2043, renewable for further periods as Queensland Government legislation allows Mining is permitted to continue under the legislation during the renewal application period | | Goonyella mine commenced in 1971, merged with adjoining Riverside mine in 1989 Operates as Goonyella Riverside Production commenced at: Peak Downs in 1972 Saraji in 1974 Norwich Park in 1979 Blackwater in 1967 Broadmeadow (longwall operations) in 2005 Daunia in 2013 and Caval Ridge in 2014 Production at Norwich Park ceased in May 2012 | | All open-cut except Broadmeadow: longwall underground Bituminous coal is mined from the Permian Moranbah and Rangal Coal measures Products range from premium quality, low volatile, high vitrinite, hard coking coal to medium volatile hard coking coal, to weak coking coal, some pulverised coal injection (PCI) coal and medium ash thermal coal as a secondary product | | Queensland electricity grid connection is under long-term contracts and power source is under 5-year contracts | | On-site beneficiation processing facilities Combined nominal capacity: in excess of 61 Mtpa |
| | | | | | | | | | | | | | | | |
Mine & location | | Means of access | | Ownership | | Operator | | Title, leases or options | | History | | Mine type &
mineralisation style | | Power source | | Facilities, use &
condition |
| Gregory Joint Venture | | | | | | | | | | | | | | | | |
Bowen Basin, Queensland, Australia Gregory and Crinum mines | | Public road Coal transported by rail to Hay Point and Gladstone ports Distances between the mines and port are between 310 km and 370 km | | BHP Billiton 50% Mitsubishi Development 50% | | BMA | | Mining leases, including undeveloped tenements, expire between 2018 and 2035, renewable for further periods as Queensland Government legislation allows Mining is permitted to continue under the legislation during the renewal application period | | Production commenced at: Gregory in 1979 Crinum mine (longwall) commenced in 1997 Production at Gregory open-cut mine ceased in October 2012 | | Gregory: open-cut Crinum: longwall underground Bituminous coal is mined from the Permian German Creek Coal measures Product is a high volatile, low ash hard coking coal | | Queensland electricity grid connection is under long-term contracts and power source is under 5-year contracts | | On-site beneficiation processing facility Nominal capacity: in excess of 6 Mtpa |
| | | | | | | | |
| BHP Billiton Mitsui Coal | | | | | | | | | | | | | | | | |
Bowen Basin, Queensland, Australia South Walker Creek and Poitrel mines | | Public road Coal transported by rail to Hay Point and Dalrymple Bay ports Distances between the mines and port are between 135 km and 165 km | | BHP Billiton 80% Mitsui and Co 20% | | BMC | | Mining leases, including undeveloped tenements expire between 2015 and 2034, and are renewable for further periods as Queensland Government legislation allows Mining is permitted to continue under the legislation during the renewal application period | | South Walker Creek commenced in 1996 Poitrel commenced in 2006 | | Open-cut Bituminous coal is mined from the Permian Rangal Coal measures Produces a range of coking coal and pulverised coal injection (PCI) coal | | Queensland electricity grid | | South Walker Creek coal beneficiated on-site Nominal capacity: in excess of 5 Mtpa Poitrel mine has Red Mountain joint venture with adjacent Millennium Coal mine to share processing and rail loading facilities Nominal capacity: in excess of 3 Mtpa |
| | | | | | | | | | | | | | | | |
Mine & location | | Means of access | | Ownership | | Operator | | Title, leases or options | | History | | Mine type &
mineralisation style | | Power source | | Facilities, use &
condition |
Mt Arthur Coal | | | | | | | | | | | �� | | | |
Approximately 126 km northwest of Newcastle, New South Wales, Australia | | Public road Domestic coal transported by conveyor to Bayswater Power Station Export coal transported by third party rail to Newcastle port | | 100% | | BHP Billiton | | Various mining leases and licences expire between 2015 and 2032 Renewal is being sought for expired mining leases The original approvals permit mining and other activities to continue during renewal application | | Production commenced in 2002 Government approval permits extraction of up to 36 Mtpa of run of mine coal from underground and open-cut operations, with open-cut extraction limited to 32 Mtpa | | Open-cut Produces a medium rank bituminous thermal coal (non-coking) | | Local energy providers | | Beneficiation facilities: coal handling, preparation, washing plants Nominal capacity: in excess of 23 Mtpa |
| | | | | | | | |
| United States | | | | | | | | | | | | | | | | |
| | | | | | | | |
| San Juan | | | | | | | | | | | | | | | | |
| 25 km west of Farmington, New Mexico, US | | Public road Coal transported by truck and conveyor to San Juan Generating Station | | 100% | | BHP Billiton | | Mining leases from federal and state governments Leases viable as long as minimum production criteria achieved | | Surface mine operations commenced in 1973 Development of underground mine to replace open-cut mine approved in 2000 | | Underground Produces a medium rank bituminous thermal coal (non-coking suitable for the domestic market only) | | San Juan Generating Station | | Coal sized and blended to meet contract specifications using stockpilesquantities and specification Nominal capacity: 5.66 Mtpa |
Colombia
| | | | | | | | |
| Navajo | | | | | | | | | | | | | | | | |
| | | | | | | | |
Cerrejón
| | | | | | | | | | | | | | | | |
La Guajira province, Colombia40 km southwest of Farmington, New Mexico, US | | Public road Coal exportedtransported by company-owned rail to Puerto Bolivar (150 km)Four Corners Power Plant | | BHP Billiton 33.33%0% Anglo American 33.33% Glencore Xstrata 33.33%Navajo Transitional Energy Company 100%
| | Cerrejón CoalBHP Billiton | | Lease held by Navajo Transitional Energy Company | | Mining leases expire 2034 | | Original mine began producingProduction commenced in 19761963
Divested in FY2014 BHP Billiton interest acquired in 2000continues as operator | | Open-cut Produces a medium rank bituminous thermal coal (non-coking suitable for the export market)domestic market only) | | Local Colombian power systemFour Corners Power Plant | | Beneficiation facilities: crushing plant with capacity of 32 MtpaStackers and washing plantreclaimers used to size and blend coal to meet contract quantities and specification
Nominal capacity: 34.8 Mtpa |
(1) | This includes the Wolvekrans and Middelburg collieries and excludes the portion Tavistock obtained as a result of the amendment of the Douglas-Tavistock JV agreement. |
(2) | JV agreement has been amended so that upon the Department of Mineral Resources amending the Converted Mining Rights, the mining area will be divided into an area wholly owned and operated by Tavistock and an area wholly owned and operated by BECSA as the new Douglas-Middelburg mine. Applications were made in December 2008 to the Department of Mineral Resources to amend the Converted Mining Rights, but a date for execution has not yet been provided. Ministerial consent to amend the Mining Rights has been granted. |
Development projects
Cerrejón P40 Project
On 18 August 2011, we announced a US$437 million (BHP Billiton share) investment in the expansion of Cerrejón, known as the P40 Project, which will enable Cerrejón’s thermal coal production to increase by 8 Mtpa to approximately 40 Mtpa. The expansion project is expected to increase our share of production from 10.7 Mtpa to 13.3 Mtpa. Construction commenced in CY2011 with completion expected in CY2013. At 30 June 2013 the project was 71 per cent complete. The project scope includes a second berth and dual quadrant ship loader at Cerrejón’s 100 per cent owned and operated Puerto Bolivar, along with necessary mine, rail and associated supply chain infrastructure.
Newcastle Port Third Phase Expansion
On 31 August 2011, we announced a US$367 million (BHP Billiton share) investment in the third stage development of the Newcastle Coal Infrastructure Group’s coal handling facility in Newcastle, Australia. The port expansion project is expected to increase total capacity at the coal terminal from 53 Mtpa to 66 Mtpa. This is expected to increase New South Wales Energy Coal’s allocation by a further 4.6 Mtpa to 19.2 Mtpa. First coal on ship, being the first ship loading through the new facility, was achieved in June 2013, ahead of schedule. At 30 June 2013, the project was 76 per cent complete.
2.2.5 Aluminium, Manganese and Nickel Business
Aluminium
Our Aluminium Business has a portfolio of assets in three stages of the aluminium value chain: mining bauxite, refining bauxite into alumina and smelting alumina into aluminium metal. We are a major producer of aluminium, with total production in FY2013 of 1.2 Mt. We also produced 4.9 Mt of alumina.
During FY2013, we consumed 33 per cent of our alumina production in our aluminium smelters and sold the balance to third party smelters. Our alumina and aluminium customers are located principally in western Europe and Asia. Our alumina sales are a mixture of legacy long-term contract sales at LME-linked prices and, increasingly, long-term contracts priced from an alumina index or spot negotiated prices. Prices for our aluminium sales are generally linked to prevailing LME prices. We have a diversified customer portfolio, with demand driven by end-use consumption in transportation, packaging, construction and household items.
Our Aluminium Assets include the following operations:
Boddington/Worsley
Boddington/Worsley is an integrated bauxite mining/alumina refining operation located in Western Australia. The Boddington bauxite mine supplies bauxite ore to the Worsley alumina refinery via a 62-kilometre long conveying system. We own 86 per cent of the mine and the refinery. It is our sole integrated bauxite, mining/alumina refining asset, and one of the largest and lowest-cost refineries in the world. Worsley is near completion of a ramp-up of production from the Efficiency and Growth project that will increase the capacity of the refinery to 4.6 Mtpa (100 per cent) of alumina. Completion is expected by the end of CY2013. Our share of Worsley’s FY2013 production was 3.7 Mt of alumina. Worsley’s export customers include our own Hillside, Bayside and Mozal smelters in southern Africa. Boddington has a reserve life of 17 years.
Mineração Rio do Norte
We own a 14.8 per cent investment in Mineração Rio do Norte (MRN), which owns and operates a large bauxite mine, located at Porto Trombetas in the province of Pará, Brazil.
Alumar
Alumar is an integrated alumina refinery/aluminium smelter. We own 36 per cent of the Alumar refinery and 40 per cent of the smelter. Alcoa operates both facilities. The operations, and their integrated port facility, are located at São Luís in the Maranhão province of Brazil. Alumar sources the majority of its bauxite from MRN. During FY2013, approximately 25 per cent of Alumar’s alumina production was used to feed the smelter, while the remainder was exported. Our share of Alumar’s FY2013 saleable production was 1,205 kt of alumina and 154 kt of aluminium.
Hillside and Bayside
Our wholly owned Hillside and Bayside smelters are located at Richards Bay, South Africa. Hillside is the largest aluminium smelter in the southern hemisphere. In 2009, Bayside reduced smelting capacity to approximately 97 kilotonnes per annum (ktpa) in support of a national energy conservation scheme. Hillside imports alumina from our Worsley refinery and Alcoa, while Bayside imports all of its alumina from Worsley. Both Hillside and Bayside source power from Eskom, the South African state utility, under long-term contracts, with prices linked to the LME price of aluminium (except for Hillside Potline 3, the price of which is linked to the South African and US producer price indices). Potline capacity at Hillside returned to normal during FY2013 after a major unplanned outage in the March 2012 quarter. Production in FY2013 for Hillside was 665 kt and Bayside was 96 kt.
Mozal
We own 47.1 per cent of and operate the Mozal aluminium smelter located near Maputo, Mozambique. Mozal sources power generated by Hydro Cahora Basa via Motraco, a transmission joint venture between Eskom and the national electricity utilities of Mozambique and Swaziland. Our share of Mozal’s FY2013 production was 264 kt.
Information on Aluminium mining operations
The following table contains additional details of our mining operations. This table should be read in conjunction with the production (see section 2.3.2) and reserve tables (see section 2.13.2).
| | | | | | | | | | | | | | | | |
Mine & location | | Means of access | | Ownership | | Operator | | Title, leases or options | | History | | Mine type &
mineralisation style | | Power source | | Facilities, use &
condition |
Bauxite
Colombia | | | | | | | | | | | | | | | | |
| | | | | | | | |
Boddington bauxite mineCerrejón | | | | | | | | | | | | | | | | |
Boddington, 123 km southeast of Perth, Western AustraliaLa Guajira province, Colombia | | Public road Ore transportedCoal exported by company-owned rail to Worsley alumina refinery by a 62 km conveyorPuerto Bolivar (150 km)
| | BHP Billiton 86%33.33% Sojitz Alumina 4%
Japan Alumina Associates 10%
Ownership structure of operator as per Worsley JVAnglo American 33.33% Glencore 33.33%
| | BHP Billiton Worsley Alumina Pty LtdCerrejón | | Mining leases expire in 2034 | | Mining leases from Western Australia Government expire over the period 2014–2032, all with 21-year renewal availableOriginal mine began producing in 1976
2 subleases from Alcoa of Australia
| | Opened 1983
Significantly extendedBHP Billiton interest acquired in 2000
| | Open-cut Surficial gibbsite-rich lateritic weathering of Darling Range rocksProduces a medium rank bituminous thermal coal (non-coking, suitable for the export market)
| | JV-owned powerline connected to Worsley alumina refinery site | | Crushing plant Nominal capacity: 19 Mtpa bauxite |
| | | | | | | | |
Mineração Rio do Norte | | | | | | | | | | | | | | | | |
Porto Trombetas, 416 km east of Manaus, Brazil | | Sealed road and 28 km of rail connects mine area with Porto Trombetas | | BHP Billiton 14.8%
Alcoa and affiliates 18.2% Vale 40%
Rio Tinto Alcan 12%
Votorantim 10%
Hydro 5%
| | MRN | | Mining rights granted by Brazilian Government until reserves exhausted | | Production commenced 1979
Expanded 2003
| | Open-cut
Lateritic weathering of nepheline syenite occurring primarily as gibbsite in a clay matrix overlain by clay sediments
| | On-site fuel oil generators | | Crushing facilities, conveyors, wash plant
Nominal capacity: 18 Mtpa washed bauxite
|
Information on Aluminium smelters and refineries
| | | | | | | | | | | | | | |
Smelter,
refinery or
processing
plant
| | Location
| | Ownership
| | Operator
| | Title, leases or
options
| | Product
| | Nominal
production
capacity
| | Power source
|
Aluminium and alumina
| | | | | | | | | | |
| | | | | | | |
Hillside
| | | | | | | | | | | | | | |
Aluminium smelter
| | Richards Bay, 200 km north of Durban, South Africa | | 100% | | BHP Billiton | | Freehold title to property, plant, equipment
Leases over harbour facilities
| | Standard aluminium ingots | | 726 ktpa primary aluminium | | Eskom (nationalLocal Colombian power supplier) under long-term contracts
Contract prices for Hillside 1 and 2 linked to LME aluminium price
Prices for Hillside 3 linked to SA and US producer price indices
|
| | | | | | | |
Bayside
| | | | | | | | | | | | | | |
Aluminium smelter
| | Richards Bay, 200 km north of Durban,
South Africa
| | 100% | | BHP Billiton | | Freehold title to property, plant, equipment | | Primary aluminium, slab products | | 97 ktpa primary aluminium on remaining
Potline A | | Eskom, under long-term contract
Contract price linked to LME aluminium price
|
| | | | | | | |
Mozal
| | | | | | | | | | | | | | |
Aluminium smelter
| | 17 km from Maputo, Mozambique | | BHP Billiton 47.1% of Mozal SARL
Mitsubishi 25% Industrial Development Corporation of South Africa Ltd 24%
Mozambique Government 3.9%
| | BHP Billiton | | 50-year government concession to use the land
Renewable for 50 years
| | Standard aluminium ingots | | 561 ktpa | | Motraco under long-term contract
Contract price linked to SA producer price index
|
| | | | | | | |
Worsley
| | | | | | | | | | | | | | |
Alumina refinery
| | 55 km northeast of Bunbury, Western Australia | | BHP Billiton 86%
Sojitz Alumina 4% Japan Alumina Associates 10%
Ownership structure of operator as per Worsley JV
| | BHP Billiton Worsley Alumina Pty Ltd | | 2,480 ha refinery lease from Western Australia Government expires 2025
21-year renewal available
| | Metallurgical grade alumina | | 4.6 Mtpa | | JV-owned on-site coal power station, third party on-site gas-fired steam power generation plant, third party leased on-site multifuel co-generation steam and power generation plant |
| | | | | | | | | | | | | | |
Smelter,
refinery or
processing
plant
| | Location
| | Ownership
| | Operator
| | Title, leases or
options
| | Product
| | Nominal
production
capacity
| | Power source
|
Alumar
| | | | | | | | | | | | | | |
Alumina refinery and aluminium smelter | | São Luís, Maranhão, Brazil | | Aluminium smelter: BHP Billiton 40%
Alcoa 60%
Alumina refinery: BHP Billiton 36%
Alcoa and affiliates 54%
Rio Tinto 10%
| | Alcoa operates both facilities | | All assets held freehold | | Alumina and aluminium ingots | | Refinery: 3.5 Mtpa alumina
Smelter: 447 ktpa primary aluminium
| | Electronorte (Brazilian public power generation concessionaire), under long-term contract |
Development projects
Worsley Efficiency and Growth project
In May 2008, we announced the Board’s approval of an expansion project to increase the capacity of the Worsley refinery from 3.5 Mtpa of alumina to 4.6 Mtpa (100 per cent capacity) through expanded mining operations at Boddington, additional refinery capacity and upgraded port facilities. The expansion project achieved first production in March 2012 and continued to ramp-up throughout FY2013, achieving record production for the asset. Full production is on track to be achieved by the end of CY2013. As at 30 June 2013, total capital expenditure was US$3.1 billion.
Guinea Alumina
On 9 July 2013, we completed the sale of our one-third interest in a joint venture that was undertaking a feasibility study into the construction of a 10 Mtpa bauxite mine, an alumina refinery with processing capacity exceeding 3.3 Mtpa and associated infrastructure, located approximately 110 kilometres from the port of Kamsar in Guinea.
Manganese
Our Manganese Business produces a combination of ores and alloys from sites in South Africa and Australia. We are the world’s largest producer of manganese ore and one of the top global producers of manganese alloy. Manganese alloy is a key input into the steelmaking process. Manganese high-grade ore is particularly valuable to alloy producers because of the value in use differential over low-grade ore. The value in use differential is the degree to which high-grade ore is proportionately more efficient than low-grade ore to process in the production of alloy.
Our strategy is to focus on upstream resource assets. Manganese alloy smelters are a key conduit of manganese alloy and ore into steelmaking and enable us to access markets with an optimal mix of ore and alloy, optimise production to best suit market conditions and give us technical insight into the performance of our ores in smelters.
Approximately 80 per cent of our ore production is sold directly to external customers, predominantly located in China, South Korea and India, and the remainder is used as feedstock in our alloy smelters. Manganese alloy is sold to steel mills, mainly in Europe and North America. Manganese ore and alloy are increasingly sold on short-term or spot contracts, with prices linked to published indices. Neither commodity is exchange traded, and prices are largely determined by supply and demand balances. Ore is priced per dry metric tonne unit and referenced to a benchmark ore of 43 per cent manganese grade cost insurance freight (CIF) China. Alloy is priced per tonne, typically on a delivered basis (DDP). Manganese production in FY2013 was 8,517 kt of ore and 608 kt of alloy.
We own and manage all of our manganese mining operations and alloy plants through the Samancor Manganese joint ventures with Anglo American. In South Africa, we own 60 per cent of Samancor Manganese (Proprietary) Ltd, which operates the Metalloys division. Samancor Manganese owns 74 per cent of Hotazel Manganese Mines (Pty) Ltd (HMM), which gives us an effective interest of 44.4 per cent in HMM. The remaining 26 per cent of HMM is owned under the terms of the South African Black Economic Empowerment (BEE) legislation, which reflects our commitment to economic transformation in South Africa. In Australia, we own 60 per cent of Groote Eylandt Mining Company Pty Ltd (GEMCO) and we have an effective interest of 60 per cent in GEMCO’s wholly owned subsidiary, Tasmanian Electro Metallurgical Company Pty Ltd (TEMCO).
Our Manganese Assets, Manganese Australia and Manganese South Africa, comprise the following:
Mines
HMM
HMM owns the Mamatwan open-cut mine and the Wessels underground mine. Manganese high-grade ore from these mines is particularly valuable to alloy producers because of the value in use differential over low-grade ore.
Mined ore is processed into a saleable product through a crushing and wet screening operation, with some ore undergoing further processing in the form of dense media separation and sintering. More than 25 per cent of the ore mined is beneficiated into alloy at Metalloys, with the rest being exported via road and rail through Port Elizabeth (approximately 950 kilometres) and Durban (approximately 1,100 kilometres). In FY2013, the total manganese ore production was 3,490 kt. Wessels has a reserve life of 48 years and Mamatwan has a reserve life of 20 years.
GEMCO
As a result of its location, 16 kilometres from our port facilities at Milner Bay, and its simple, open-cut mining operation, GEMCO is one of the world’s lowest-cost manganese ore producers. These operations, consisting of crushing, screening, washing and dense media separation, combined with its high-grade ore and relative proximity to Asian export markets, make GEMCO unique among the world’s manganese mines. FY2013 production of manganese ore was 5,027 kt. GEMCO has a reserve life of 12 years.
Alloy Plants
Metalloys
The Samancor Manganese Metalloys alloy plant is one of the largest manganese alloy producers in the world. Due to its size and access to high-quality feedstock from HMM operations, it is also one of the lowest-cost alloy producers of ferromanganese. Metalloys only produces high- and medium-carbon ferromanganese, after silicomanganese production ceased due to the permanent closure of the energy-intensive Metalloys South plant in January 2012. The high-carbon ferromanganese furnace M14 at the Metalloys West Plant was completed in March 2013. This furnace has added an additional 130 ktpa capacity of high-carbon ferromanganese, but replaces the now-closed 120 ktpa silicomanganese South Plant, taking Metalloys capacity to 500 ktpa. The M14 furnace contributes to power efficiency at the Metalloys site as it adds to the site’s own generation capacity, utilising the furnace off-gases.
TEMCO
TEMCO is a medium-sized producer of high-carbon ferromanganese, silicomanganese and sinter using ore shipped from GEMCO, primarily using hydroelectric power.
Information on Manganese mining operations
The following table contains additional details of our mining operations. These tables should be read in conjunction with the production (see section 2.3.2) and reserve tables (see section 2.13.2).
| | | | | | | | | | | | | | | | |
Mine & location
| | Means of
access
| | Ownership
| | Operator
| | Title, leases or
options
| | History
| | Mine type &
mineralisation
style
| | Power
source
| | Facilities, use &
condition
|
Manganese ore
| | | | | | | | | | | | | | | | |
| | | | | | | | |
Hotazel Manganese Mines (HMM) | | | | | | | | | | | | | | | | |
Kalahari Basin, South Africa
Mamatwan and
Wessels mines
| | Public road
Most ore and sinter products transported by rail
Approximately 29% of ore beneficiated locally, balance exported via Port Elizabeth (approximately 950 km) and Durban (approximately 1,100 km)
| | BHP Billiton
44.4%
Anglo American 29.6%
Ntsimbintle 9% NCAB 7%
Iziko 5%
HMM Education Trust 5%
| | BHP Billiton | | Existing New Order Rights valid until 2035 | | Mamatwan commissioned 1964
Wessels commissioned 1973
| | Mamatwan: open-cut
Wessels: underground
Banded iron manganese ore type
| | Eskom
(national power supplier) under contracts at regulated prices
| | Mamatwan beneficiation plant: primary, secondary and tertiary crushing with associated screening plants
Dense medium separator and sinter plant (capacity 1 Mtpa sinter)(1)
Wessels: primary and secondary crushing circuits with associated screening(1)
|
| | | | | | | | |
Groote Eylandt Mining Company (GEMCO) | | | | | | | | | | | | | | | | |
Groote Eylandt, Northern Territory, Australia | | Ore transported 16 km from concentrator by road train to port at Milner Bay | | BHP Billiton 60%
Anglo American 40%
| | BHP Billiton | | All leases on Aboriginal land held under Aboriginal Land Rights (Northern Territory) Act 1976 Valid until 2031 | | Commissioned 1965 | | Open-cut
Sandstone claystone sedimentary manganese ore type
| | On-site diesel power generationsystem | | Beneficiation process:facilities: crushing screening,plant with capacity of 35 Mtpa and washing and dense media separation Produces lump and fines products Capacity: 4.2 wet Mtpa
|
(1) | Capacity: Mamatwan – approximately 3.5 Mtpa of ore; Wessels – approximately 1 Mtpa of ore. |
Information on Manganese smelters, refineries and processing plants
| | | | | | | | | | | | | | |
Smelter, refinery or
processing plant
| | Location
| | Ownership
| | Operator
| | Title, leases or options
| | Product
| | Nominal production
capacity
| | Power source
|
Manganese alloy
| | | | | | | | | | | | | | |
| | | | | | | |
Metalloys
| | | | | | | | | | | | | | |
Manganese alloy plant
(division of Samancor Manganese (Pty) Ltd)
| | Meyerton, South Africa | | BHP Billiton 60%
Anglo American 40%
| | BHP Billiton | | Freehold title over property, plant and equipment | | Manganese alloys including high-carbon ferromanganese, refined (medium-carbon ferromanganese) alloy | | 410 ktpa high-carbon ferromanganese (including hot metal) 90 ktpa medium-carbon ferromanganese | | Eskom
30 MW of internal power generated from furnace off-gases
|
| | | | | | | |
Tasmanian Electro Metallurgical Company (TEMCO) | | | | | | | | | | | | | | |
Manganese alloy plant
| | Bell Bay, Tasmania, Australia | | BHP Billiton 60%
Anglo American 40%
| | BHP Billiton | | Freehold title over property, plant and equipment | | Ferroalloys, including high-carbon ferromanganese, silicomanganese and sinter | | 130 ktpa high-carbon ferromanganese 125 ktpa silicomanganese 350 ktpa sinter | | Aurora Energy
On-site energy recovery unit generates 11 MW for internal useNominal capacity: 3 Mtpa
|
Development projects
GEMCOHay Point Coal Terminal Expansion Stage 3
In March 2011, we approved the third expansion
of the Hay Point Coal Terminal. The expansion of the terminal will deliver an additional 11 Mt of annual port capacity (100 per cent basis). The project investment has a budget of US$279 million GEMCO Expansion Project (GEEP2) (US$167 million BHP1.5 billion (BHP Billiton share), approved. In January 2015, first coal was loaded through the expanded terminal and the project was 97.6 per cent complete at 30 June 2015.
Cerrejón P40 Project
In August 2011, we announced a US$437 million (BHP Billiton share) investment in July 2011, is nearing completion and is expected to be commissioned during the latter halfexpansion of CY2013. GEEP2Cerrejón, known as the P40 Project, which is expected to increase GEMCO’s capacity from 4.2Cerrejón’s thermal coal production by 8 Mtpa to 4.8approximately 40 Mtpa through(100 per cent basis). The project scope includes a second berth and dual quadrant ship loader at Cerrejón’s 100 per cent owned and operated Puerto Bolivar, along with necessary mine, rail and associated supply chain infrastructure. Construction commenced in CY2011 and the introduction of a dense media circuit by-pass facility. The expansion is alsoproject handled its first coal in the December 2013 quarter. However, operational issues are expected to address key infrastructure constraints by increasing road and portconstrain capacity to 5.9approximately 35 Mtpa creating 1.1 Mtpa(100 per cent basis) in the medium term. The final cost was US$376 million (BHP Billiton share) and the project was completed during the December 2014 quarter.
Newcastle Port Third Phase Expansion
In August 2011, we announced a US$367 million (BHP Billiton share) investment in the third stage development of additional capacity for future expansions.
HMM
the Newcastle Coal Infrastructure Group’s coal handling facility in Newcastle. The central block development project at the Wessels underground mine is being progressed in two phases. The first phase is to ensure key ventilation infrastructure is put in place to maintain current production levels, while the second phase will complete infrastructure required to expand the mine to 1.5 Mtpa. The first phase of theport expansion project is expected to be completedincrease total capacity at the coal terminal from 53 Mtpa to 66 Mtpa. This is expected to increase New South Wales Energy Coal’s allocation by 4.6 Mtpa to 19.2 Mtpa. First coal on ship, being the first ship loaded through the new facility, was achieved in FY2014 atJune 2013, ahead of schedule. At 30 June 2015, the project was 99.5 per cent complete.
IndoMet Coal Project
IndoMet Coal comprises seven coal contracts of work covering a cost of US$106 million (US$63.6 millionlarge metallurgical coal resource in Central and East Kalimantan, Indonesia, which was discovered by BHP Billiton share), and will comprisein the construction1990s. Following an assessment of the ventilation shaft and developmentimportance of local participation in developing the associated underground ventilation network. Phase 2project, in 2010 we sold a 25 per cent interest in the project to a subsidiary of PT Adaro Energy TBK. We retain 75 per cent of the project is currently undergoing a feasibility study, and will comprise the completion of the underground crusher and mobile workshops.
Metalloys
The high-carbon M14 furnace at the Metalloys West Plant was completed in March 2013 with a total cost of US$99 million (US$59.4 million BHP Billiton share).
Samancor Gabon Manganese projecthold management responsibility.
During 2013, we withdrewFY2015, IndoMet completed infrastructure development and received an operating permit to commence mining at Haju mine. Production is expected to commence from the Samancor Gabon Manganese project following the completion of the feasibility study.1 Mtpa Haju mine in Indonesia during FY2016.
Nickel2.1.5 Other assets
Our Nickel Business primarily supplies customers in the stainless steel industry, principally in northern Asia and western Europe. Nickel is an important component of the most commonly used types of stainless steel. We also supply nickel to other markets, including the specialty alloy, foundry, chemicals and refractory material industries. We are a major producer of nickel with total production in FY2013 of 154 kt of contained nickel. We sell our nickel products at various stages including concentrate, matte and metal under a mix of long-term, medium-term and spot volume contracts, with prices linked to the LME nickel price.
Our Nickel Assets include the following operations:
Nickel West
Our wholly owned Western Australian Nickel Asset, Nickel West Asset in Western Australia consists of an integrated system of mines, concentrators, a smelter and a refinery. We mine nickel-bearing sulphide ore at our Mt Keith Leinster and Cliffs Operationsoperations, located north of Kalgoorlie. The reserve lives are discussed in section 2.3.2.
We operate concentrator plants at Mt Keith and at Leinster, which also concentrate ore from Cliffs. On 31 October 2013, production at the Nickel West Leinster and Mt Keith have reserve lives of eight and 12 years, respectively; both have options for further expansion. Cliffs is a high-gradePerseverance underground mine withwas suspended following a reserve lifesignificant seismic event. A subsequent review of four years.the incident determined it was unsafe to resume operations.
We also operate the Kambalda concentrator south of Kalgoorlie, where we source ore through tolling and concentrate purchase arrangements with third parties in the Kambalda region. We also have purchase agreements in place for the direct purchase of concentrate, which we re-pulp, dry and blend with other concentrate processed at Kambalda.
Ore from our Mt Keith mine is concentrated at Mt Keith and then transported by road approximately 110 kilometres to Leinster for drying. Ore from the Cliffs and Leinster mines is concentrated and dried at Leinster. Dry
nickel concentrate is then transported via road and rail approximately 375 kilometres to our Kalgoorlie smelter. Concentrate from Kambalda is transported via rail approximately 60 kilometres to our Kalgoorlie smelter.
Small volumes of concentrate are sold into the external market; however, the majority of volumes are processed into nickel matte, containing approximately 6865 per cent nickel. In FY2013,FY2015, we exported approximately 3430 per cent of our nickel matte production. The remaining nickel matte is transported, principally by rail, to our Kwinana nickel refinery, a distance of approximately 650 kilometres. The nickel matte is processed into nickel metal in the form of LME grade briquettes and nickel powder, together with a range of saleable by-products.
Nickel West production in FY2013FY2015 was 10390 kt of contained nickel.
Cerro Matoso
Cerro Matoso, our 99.94 per cent ownedOn 14 May 2014, we announced we were reviewing the long-term future of Nickel Asset in Colombia, combines a lateritic nickel ore deposit with a ferronickel smelter. Cerro Matoso is oneWest, including considering the sale of some or all of the largest producers of ferronickel and is oneasset. Having carefully considered all of the lowest-cost producersoptions available to us, on 12 November 2014, we announced that Nickel West will remain part of ferronickel. The smelter produces high-purity, low-carbon ferronickel granules. Cerro Matoso has an estimated reserve life of 28 years. Production in FY2013 was 50.8 kt of nickel in ferronickel form.
During FY2013, Cerro Matoso successfully extended its mining concessions with the Colombian Government until 2029, with a conditional extension until 2044. The agreement includes an increase in the royalty rate from 12 per centBHP Billiton, and that we will continue to 13 per cent. The extension of the contract termoperate it to 2044 is conditional on Cerro Matoso increasing processing capacity by 50 per cent by 2022.process our known ore reserves.
Information on Nickel mining operations
The following table contains additional details of our mining operations. This table should be read in conjunction with the production (see(refer to section 2.3.2)2.2.2) and reserve tables (see(refer to section 2.13.2)2.3.2).
| | | | | | | | | | | | | | | | |
Mine & location | | Means of access | | Ownership | | Operator | | Title, leases or options | | History | | Mine type &
mineralisation style | | Power source | | Facilities, use &
condition |
Nickel
Australia | | | | | | | | | | | | | | | | |
| | | | | | | | |
Nickel | | | | | | | | | | | | | | | | |
| | | | | | | | |
| Nickel West | | | | | | | | | | | | | | | | |
| Mt Keith | | | | | | | | | | | | | | | | |
| 485 km north of Kalgoorlie, Western Australia | | Private road Nickel concentrate transported by road to Leinster nickel operations for drying and on-shipping | | 100% | | BHP Billiton | | Mining leases granted by Western Australia Government Key leases expire 2015 – 2034between 2029 and 2036 Renewals at government discretion | | Officially commissionedCommissioned in 1995 by WMC
Acquired in 2005 as part of WMC acquisition | | Open-cut Disseminated textured magmatic nickel-sulphide mineralisation associated with a metamorphosed ultramafic intrusion | | On-site third party gas-fired turbines Contracts expire January 2014 Contract renewal negotiations progressingin December 2023
Natural gas sourced and transported under separate long-term contracts | | Concentration plant with a nominal capacity: 11.6 11 Mtpa of ore |
| | | | | | | | |
Leinster | | | | | | | | | | | | | | | | |
| 375 km north of Kalgoorlie, Western Australia | | Public road Nickel concentrate shipped by road and rail to Kalgoorlie nickel smelter | | 100% | | BHP Billiton | | Mining leases granted by Western Australia Government Key leases expire between 2019 –and 2034 Renewals at government discretion | | Production commenced in 1979 Acquired in 2005 as part of WMC acquisition Perseverance underground mine ceased operations during 2013 | | Underground and open-cutOpen-cut
Steeply dipping disseminated and massive texturednickel-sulphide mineralisation associated with metamorphosed ultramafic lava flows and intrusions | | On-site thirdparty gas-fired turbines Contracts expire January 2014 Contract renewal negotiations progressingin December 2023
Natural gas sourced and transported under separate long-term contracts | | Concentration plant with a nominal capacity: 3 Mtpa of ore |
| | | | | | | | | | | | | | | | |
Mine & location | | Means of access | | Ownership | | Operator | | Title, leases or options | | History | | Mine type &
mineralisation style | | Power source | | Facilities, use &
condition |
Cliffs | | | | | | | | | | | | | | | | |
| 481 km north of Kalgoorlie, Western Australia | | Private road Nickel ore transported by road to Leinster nickel operations for further processing | | 100% | | BHP Billiton | | Mining leases granted by Western Australia Government Key leases expire between 2025 –and 2028 Renewals at government discretion | | Production commenced in 2008 Acquired in 2005 as part of WMC acquisition | | Underground Steeply dipping massive textured nickel-sulphide mineralisation associated with metamorphosed ultramafic lava flows | | Supplied from Mt Keith | | Mine site |
Cerro Matoso
| | | | | | | | | | | | | | | | |
Montelibano, Córdoba, Colombia | | Public road | | BHP Billiton 99.94%
Employees and former employees 0.06%
| | BHP Billiton | | New terms agreed effective 1 October 2012 until 2029 with conditional extension to 2044 if ore processing capacity is increased 50% by 2022 | | Mining commenced 1980
Nickel production started 1982
Ownership increased to 53% in 1989 and to 99.94% in 2007
Expansion project to double installed capacity completed 2001
| | Open-cut
Nickel-laterite mineralisation formed from residual weathering of ophiolitic peridotite
| | National electricity grid under contracts expiring December 2014
Domestic natural gas for drier and kiln operation supplied by pipeline from national grid
Gas supply contracts expiring December 2021
| | Ferronickel smelter and refinery integrated with the mine
Beneficiation plant: primary and secondary crusher
Nominal capacity: 50 ktpa of nickel in ferronickel form
Actual production depends on nickel grade from the mine
|
Information on Nickel smelters, refineries and processing plants
| | | | | | | | | | | | | | |
Smelter, refinery or
processing plant | | Location | | Ownership | | Operator | | Title, leases or options | | Product | | Nominal production
capacity | | Power source |
Nickel | | | | | | | | | | | | | | |
| | | | | | | |
Kambalda | | | | | | | | | | | | | | |
Nickel concentrator | | 56 km south of Kalgoorlie, Western Australia | | 100% | | BHP Billiton | | MineralMining leases granted by Western Australia Government
Key leases expirein 2028 Renewals at government discretion | | Concentrate containing approximately 15%13% nickel | | 1.6 Mtpa ore Ore sourced through tolling and concentrate purchase arrangements with third parties in Kambalda region | | On-site third party gas-fired turbines supplemented by access to grid power Contracts expire January 2014 Contract renewal negotiations progressingin December 2023
Natural gas sourced and transported under separate long-term contracts |
| | | | | | | |
Kalgoorlie | | | | | | | | | | | | | | |
Nickel smelter | | Kalgoorlie, Western Australia | | 100% | | BHP Billiton | | Freehold title over the property | | Matte containing approximately 68%65% nickel | | 111110 ktpa nickel matte | | On-site third party gas-fired turbines supplemented by access to grid power Contracts expire January 2014 Contract renewal negotiations progressingin December 2023
Natural gas sourced and transported under separate long-term contracts |
| | | | | | | |
Kwinana | | | | | | | | | | | | | | |
Nickel refinery | | 30 km south of Perth, Western Australia | | 100% | | BHP Billiton | | Freehold title over the property | | LME grade nickel briquettes, nickel powder Also intermediate products, including copper sulphide, cobalt-nickel-sulphide, ammonium-sulphate | | 6970 ktpa nickel metalmatte | | A combination of power generated by Southern Cross Energy and distributed via Western Power’s network and powerPower is sourced from other generators on the Western Power networklocal grid, which is supplied under a retail contract |
Development projects2.1.6 Marketing
Marketing supports the Group’s strategy by:
securing sales of BHP Billiton product;
realising the full value of our products;
managing the supply chain from resources to markets;
supporting strategic decision-making by providing market insights;
minimising operating costs and optimising working capital.
Marketing’s responsibilities, activities and organisational structure are designed to give effect to this purpose.
The Nickel Business had no active development projectsMarketing organisation is accountable for managing the Group’s revenue line. Marketing adds value by leveraging the intrinsic value of our products, customer relationships and the Group’s broader value proposition relative to other market participants to maximise realised sales prices, minimising the cost of raw materials inputs, optimising freight and other distribution costs, minimising overheads, enabling the Businesses to maximise upstream resource value, managing market-related risks, and ensuring the Group’s long-run view of markets is well informed and insightful. This allows the Businesses to focus on safety, production and cost, while Marketing focuses on optimising realised prices and sales outcomes.
Marketing is organised into trading and marketing units (TMUs) that are specialised in FY2013.marketing particular commodities, to enable tailored strategies for the differences and features of each of the markets for BHP Billiton’s products. Even within a specific commodity type, the markets can be quite different (e.g. the market for copper cathode is quite different to the market for copper concentrates).
2.2.6 Divested businessesEach TMU is responsible for forming strong partnerships with our customers and placing the right product with the right customer at the right time. A solid understanding of both the intrinsic value of our products and the technical requirements of each customer is reflected in the fair value of our products.
During FY2013,Marketing also engages in technical collaboration with many customers to enhance mutual understanding of customer perceptions and requirements and how BHP Billiton products will better serve such requirements by:
developing a solid understanding of the technical requirements of a customer’s individual production processes and specific product requirement;
assisting in ensuring customers are able to make optimal use of BHP Billiton’s products.
Consistent with our philosophy of locating our major units close to their main activities, the primary hub for our marketing activities is Singapore, where we soldemploy approximately 480 people, while our marketing of oil and gas is headquartered in Houston, United States. The two Marketing hub offices incorporate all the functions required to manage sales and distribution from our Businesses to our customers. In addition, we have regional marketers located close to our customers in nine cities across the world. Having our primary marketing hub in Singapore ensures that we are close to our major customers with Asian commodity flows, which increasingly dominate world flows. Sixty-eight per cent of BHP Billiton’s sales are in Asia.
Singapore not only provides a highly skilled work force, but also provides for a stable and transparent regulatory framework that supports trade and investment. Furthermore, Singapore is a world leader in logistic capabilities and provides a base for world-class connectivity with an effective transportation network. Singapore’s workforce also gives us access to staff that speak the languages of our key customers in Asia. The high living standards in Singapore attract the highly qualified mobile people we need to manage our continuously evolving business.
The consolidation of commercial accountabilities through a centralised model presents one face to markets and customers across multiple commodities, and allows our assets to focus on their key priorities of maximising production safely at a low cost of production. The model enables the optimisation of BHP Billiton’s sales positions, provides greater value to distribution activities, and ensures more effective governance and risk management, which improves commercial capability thereby maximising sales prices for our commodities benefitting the Group as a whole and our production assets specifically. Marketing also utilises a structured, rigorous and consistent framework to identify, plan and execute productivity improvement opportunities.
Co-location of TMUs ensures that market insights can be leveraged across products. Based on these shared insights, our marketers have been able to drive major value accretive initiatives and efficiencies within the Group, as well as across the wider industry. For example, BHP Billiton’s cross-industry engagement and leadership in the drive towards improved liquidity and transparency in the markets for many of the Group’s products through support of and investment in, centrally located transparent multilateral electronic physical transaction platforms, such as globalORE, globalCOAL and the China Beijing International Mining Exchange.
Freight and distribution costs account for approximately 80 per cent of the total costs managed by Marketing. Marketing has a centralised ocean freight team that manages in-house freight requirements for the Group. The objective of the freight business is to create a competitive advantage through the procurement of safe, sustainable shipping solutions, which both maximise production throughput and minimise costs through the Group’s supply chains.
BHP Billiton is one of the largest global shippers of bulk commodities. The Group’s key role in the market allows us to drive safety and best practice via our interactions and usage of the highest quality freight service providers and ship owners. The scope and scale of our commodity portfolio and extensive fleet of hire chartered vessels allows the Group to arbitrage and optimise positions to minimise freight costs. This includes flexibility in diverting tonnages between markets, maximising tonnages for both inbound and outbound journeys, and parcelling of commodities.
BHP Billiton’s market insight is enhanced by the Group’s proximity to customers and the flow of information through the centralised structure. Marketing analyses the fundamentals of demand and supply to inform our long-run views of commodity markets. We consider various global scenarios in our modelling, and regularly monitor ‘signposts’ in the market to ensure an in-depth understanding of evolving trends.
Our commodity price forecasts support asset and portfolio level investment decisions, strategic planning and capital management. Marketing’s outlook on the global economy, the resource industry and each of the commodities in our portfolio also serve to inform broader organisational priorities, such as our position on climate change.
2.1.7 Discontinued operations
The assets that were demerged from BHP Billiton to form South32 (now Discontinued operations) are summarised below. The information below reflects the assets as at 25 May 2015. For further information on the demerger, see sections 1.3.7 or 1.6.4 of this Annual Report or note 29 ‘Discontinued operations’ to the Financial Statements.
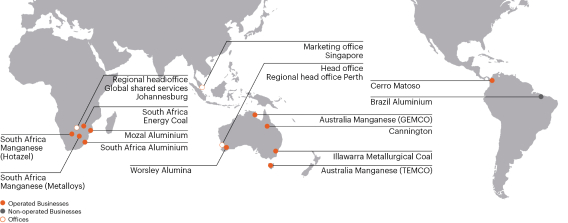
Alumina
Worsley Alumina
Worsley Alumina is an integrated bauxite mining and alumina refining operation located in Western Australia. At the time of separation, Bauxite ore mined near Boddington was conveyed to the Worsley Alumina refinery, located near Bunbury. Alumina was then railed from the refinery to Bunbury for export to Worsley Alumina’s export customers, including South32’s Hillside and Mozal Aluminium smelters in southern Africa.
Aluminium
South Africa Aluminium
South Africa Aluminium comprises the Hillside smelter near Richards Bay, South Africa. Hillside imported alumina from the Worsley Alumina refinery. At the time of separation, approximately 80 per cent of Hillside’s aluminium production was exported through Richards Bay Port with the balance of Hillside’s aluminium production trucked to the Bayside casthouse or to domestic customers.
Mozal Aluminium
Mozal Aluminium is an aluminium smelter located near Maputo, Mozambique. At the time of separation, alumina was supplied to Mozal Aluminium from the Worsley Alumina refinery, which is now majority owned by South32. Most of Mozal Aluminium’s aluminium was exported to Europe through Matola, the port of Maputo.
Brazil Aluminium
Brazil Aluminium comprises an interest in the Mineração Rio do Norte (MRN) Mine, as well as its interests in the diamonds businessAlumar alumina refinery and the titanium minerals business Alumar aluminium smelter, together with some interests in ancillary facilities
and exited these industries.
Diamonds
Our diamonds business comprised the EKATI Diamondlands. The MRN Mine is located in the Northwest Territories of Canada. Our interest in EKATI consisted of an 80 per cent operated interestTrombetas region in the Core Zone Joint Venture, comprising existing operationsstate of Para, Brazil and a 58.8 per cent interestAlumar is located at Sao Luis in the Buffer Zone Joint Venture, that primarily focused on exploration targets. On 10 April 2013 westate of Maranhao, Brazil. At the time of separation, the majority of the bauxite produced from the MRN Mine was sold our 80 per cent operated interest in EKATIto its shareholders and related parties. Bauxite produced from the MRN Mine was previously supplied to the Dominion Diamond Corporation for US$553 million after adjustments.Alumar refinery, where most of the alumina produced was exported via the nearby Sao Marcos Bay facilities, with a small portion transferred to the Alumar smelter. All of Alumar’s aluminium production was trucked to domestic customers.
In FY2012, sales from EKATI (100 per cent terms) representedCoal
South Africa Energy Coal
South Africa Energy Coal operates four energy coal mines in the Witbank region, located in the Mpumalanga province of South Africa. At the time of separation, approximately two55 per cent of current world rough diamond supply by weightcoal produced was sold domestically and the remainder was exported through the Richards Bay Coal Terminal (RBCT).
Illawarra Metallurgical Coal
Illawarra Metallurgical Coal operates three underground metallurgical coal mines near Wollongong in New South Wales, Australia. At the time of separation, metallurgical coal was trucked to Port Kembla Coal Terminal or to BlueScope Steel Limited’s Port Kembla steelworks.
Manganese
Australia Manganese
Australia Manganese comprises the GEMCO open-cut manganese mine and the TEMCO manganese alloy plant. At the time of separation, GEMCO, which is located in the Northern Territory, Australia, exported approximately six90 per cent by value. During FY2013, up untilof its ore product to customers through port facilities at Milner Bay and the datebalance of sale, EKATI producedthe ore was shipped to the TEMCO manganese alloy plant in Bell Bay, Tasmania, Australia. The majority of TEMCO’s alloy production was exported to customers in Asia and North America, with the balance of TEMCO’s production being sold to steel customers in Australia and New Zealand.
South Africa Manganese
South Africa Manganese comprises the Hotazel Mines, being the Mamatwan open-cut mine and the Wessels underground mine, and the Metalloys plant. The Hotazel Mines are located near the town of Kuruman, South Africa. At the time of separation, approximately 972 thousand carats of rough diamonds (BHP Billiton share).
Titanium minerals
Our interest in titanium minerals consisted of a 37.7675 per cent non-operated interestof the ore was processed at the mine resulting in Richards Bay Minerals (RBM). RBMexport saleable product. The remainder of the ore was converted to alloy at the Metalloys plant, which is located near Johannesburg, South Africa.
Nickel
Cerro Matoso
Cerro Matoso is an open-cut lateritic nickel mine and ferronickel smelter, located near Montelibano, in the Cordoba Department in northern Colombia, which produces high-purity, low-carbon ferronickel granules. At the time of separation, the product was transported approximately 260 kilometres by road to Cartagena.
Silver
Cannington
Cannington is a major producersilver, lead and zinc underground mine and concentrator operation located approximately 200 kilometres southeast of titania slag, high-purity pig iron, rutile and zircon from mineral sands.
In February 2012, we announced that we had exercised an option to sell our non-operated interestMount Isa in RBMnorthwest Queensland, Australia. At the time of separation, concentrate produced at Cannington was trucked to the operatorYurbi rail loading facility and then railed approximately 800 kilometres to the Port of RBM, Rio Tinto. The sale was completed on 7 September 2012,Townsville for proceeds of US$1.7 billion after adjustments.
Information on the diamondsexport to customers mainly located in northeast Asia, Europe and titanium minerals mining operationsCanada.
The following table contains additional details of the mining operations. This table should be read in conjunction with the production (see section 2.3.2) and reserve tables (see section 2.13.2).
| | | | | | | | | | | | | | | | |
Mine & location
| | Means of
access
| | Ownership
| | Operator
| | Title, leases or
options
| | History
| | Mine type &
mineralisation
style
| | Power
source
| | Facilities, use &
condition
|
Diamonds | | | | | | | | | | | | | | | | |
| | | | | | | | |
EKATI Diamond Mine | | | | | | | | | | | | | | | | |
310 km northeast of Yellowknife, Northwest Territories, Canada | | Aircraft
Ice road open approximately 10 weeks per year
| | Core Zone JV BHP Billiton 80%
Buffer Zone JV BHP Billiton 58.8%
Remaining interest held by 2 individuals
Entire interest in Core Zone and Buffer Zone sold on 10 April 2013
| | BHP Billiton | | Mining leases granted by Canadian Government until 2022 | | Production began 1997
Mine and processing plant began operating 1998
Ownership increased with acquisition of Dia Met Minerals in 2001
| | Fox: open-cut Koala and Koala North: underground
Eocene age kimberlite pipes – dominantly volcaniclastic infill
| | JV-owned and operated diesel power station | | Crushers, washers/scrubber and grinder and heavy media separator
Magnetics and X-ray sorters for diamond recovery
Fuel storage
|
Titanium minerals | | | | | | | | | | | | | | | | |
| | | | | | | | |
Richards Bay Minerals | | | | | | | | | | | | | | | | |
10–50 km north of Richards Bay, KwaZulu-Natal, South Africa | | Public road
Product transported by public rail to port
| | BHP Billiton 37.76% economic interest through 50% interest in the 2 legal entities that comprise RBM, Richards Bay Mining (Pty) Ltd and Richards Bay Titanium (Pty) Ltd
RBM functions as a single economic entity
Entire interest sold on 7 September 2012
| | Rio Tinto | | Long-term renewable mineral leases from South African Government subject to South African Mining Charter | | RBM formed 1976
Fifth mine added 2000
One mining plant decommissioned in 2008
| | Dune sand dredging
Quaternary age coastal dune deposits – heavy mineral sands concentrated by wave and wind action
| | Eskom (national utility company) | | 4 dune sand dredge mines, minor supplementary dry mining
Gravity separation produces heavy mineral concentrate which is trucked to central processing plant to produce rutile, zircon and ilmenite
Nominal titanium slag capacity(1) 1.05 Mtpa
|
| | | | | | | |
(1) | Smelter processes ilmenite to produce titanium dioxide slag and high-purity iron. |
2.32.2 Production
2.3.12.2.1 Petroleum
The table below details Petroleum‘sPetroleum’s historical net crude oil and condensate, natural gas and natural gas liquids production, primarily by geographic segment, for each of the three years ended 30 June 2013, 20122015, 2014 and 2011.2013. We have shown volumes of marketable production after deduction of applicable royalties, fuel and flare. We have included in the table average production costs per unit of production and average sales prices for oil and condensate and natural gas for each of those periods.
| | | | BHP Billiton Group share of production
Year ended 30 June | | | BHP Billiton Group share of production
Year ended 30 June | |
| | | 2013 | | 2012 | | 2011 | | | 2015 | | 2014 | | 2013 | |
Production volumes | | | | | | | | | | | | |
Crude oil and condensate(’000 of barrels) | | | | | | | | | | | | |
Australia | | | 25,922 | | | | 31,145 | | | | 40,447 | | | | 21,397 | | | 23,645 | | | 25,922 | |
United States | | | 38,724 | | | | 30,824 | | | | 30,157 | | | | 71,626 | | | 53,964 | | | 38,724 | |
Other(5) | | | 7,866 | | | | 9,232 | | | | 9,987 | | | | 5,559 | | | 6,452 | | | 7,866 | |
| | | | | | | | | | | | | | | | | | |
Total crude oil and condensate | | | 72,512 | | | | 71,201 | | | | 80,591 | | | | 98,582 | | | 84,061 | | | 72,512 | |
| | | | | | | | | | | | | | | | | | |
Natural gas(billion cubic feet) | | | | | | | | | | | | |
Australia | | | 276.13 | | | | 249.97 | | | | 274.74 | | | | 294.8 | | | 287.5 | | | 276.13 | |
United States | | | 489.03 | | | | 456.69 | | | | 49.09 | | | | 431.7 | | | 460.2 | | | 489.03 | |
Other(5) | | | 109.11 | | | | 115.60 | | | | 81.23 | | | | 60.1 | | | 91.6 | | | 109.11 | |
| | | | | | | | | | | | | | | | | | |
Total natural gas | | | 874.27 | | | | 822.26 | | | | 405.06 | | | | 786.6 | | | 839.3 | | | 874.27 | |
| | | | | | | | | | | | | | | | | | |
Natural gas liquids(1) (’000 of barrels) | | | | | | | |
Natural Gas Liquids (1) (’000 of barrels) | | | | | | | |
Australia | | | 7,927 | | | | 7,943 | | | | 7,962 | | | | 7,214 | | | 8,448 | | | 7,927 | |
United States | | | 9,575 | | | | 5,744 | | | | 1,980 | | | | 18,681 | | | 13,620 | | | 9,575 | |
Other(5) | | | 37 | | | | 398 | | | | 1,341 | | | | 101 | | | 18 | | | 37 | |
| | | | | | | | | | | | | | | | | | |
Total NGL(1) | | | 17,539 | | | | 14,085 | | | | 11,283 | | | | 25,996 | | | 22,086 | | | 17,539 | |
| | | | | | | | | | | | | | | | | | |
Total production of petroleum products(million barrels of oil equivalent)(2) | | | | | | | | | | | | |
Australia | | | 79.87 | | | | 80.75 | | | | 94.20 | | | | 77.74 | | | 80.01 | | | 79.87 | |
United States | | | 129.80 | | | | 112.69 | | | | 40.32 | | | | 162.26 | | | 144.28 | | | 129.80 | |
Other(5) | | | 26.09 | | | | 28.90 | | | | 24.86 | | | | 15.68 | | | 21.74 | | | 26.09 | |
| | | | | | | | | | | | | | | | | | |
Total production of petroleum products(million barrels of oil equivalent)(2) | | | 235.76 | | | | 222.34 | | | | 159.38 | | |
Total production of petroleum products | | | | 255.68 | | | 246.03 | | | 235.76 | |
| | | | | | | | | | | | | | | | | | |
Average sales price | | | | | | | | | | | | |
Crude oil and condensate(US$ per barrel) | | | | | | | | | | | | |
Australia | | | 110.83 | | | | 114.33 | | | | 96.32 | | | | 76.30 | | | 111.88 | | | 110.83 | |
United States | | | 102.33 | | | | 106.22 | | | | 90.01 | | | | 64.77 | | | 97.57 | | | 102.33 | |
Other(5) | | | 107.46 | | | | 113.26 | | | | 90.69 | | | | 72.90 | | | 108.13 | | | 107.46 | |
| | | | | | | | | | | | | | | | | | |
Total crude oil and condensate | | | 105.91 | | | | 110.66 | | | | 93.29 | | | | 67.68 | | | 102.47 | | | 105.91 | |
| | | | | | | | | | | | | | | | | | |
Natural gas(US$ per thousand cubic feet) | | | | | | | | | | | | |
Australia | | | 4.73 | | | | 4.62 | | | | 4.21 | | | | 4.88 | | | 5.20 | | | 4.73 | |
United States | | | 3.29 | | | | 2.82 | | | | 3.48 | | | | 3.27 | | | 4.10 | | | 3.29 | |
Other(5) | | | 4.42 | | | | 4.13 | | | | 3.92 | | | | 4.00 | | | 3.92 | | | 4.42 | |
| | | | | | | | | | | | | | | | | | |
Total natural gas | | | 3.76 | | | | 3.40 | | | | 4.00 | | | | 3.77 | | | 4.35 | | | 3.76 | |
| | | | | | | | | | | | | | | | | | |
Natural gas liquids(US$ per barrel) | | | | | | | |
Natural Gas Liquids(US$ per barrel) | | | | | | | |
Australia | | | 63.13 | | | | 61.61 | | | | 58.05 | | | | 63.26 | | | 63.12 | | | 63.13 | |
United States | | | 30.41 | | | | 45.72 | | | | 49.79 | | | | 18.35 | | | 30.28 | | | 30.41 | |
Other(5) | | | 28.61 | | | | 55.06 | | | | 59.54 | | | | 29.55 | | | 32.00 | | | 28.61 | |
| | | | | | | | | | | | | | | | | | |
Total NGL | | | 45.70 | | | | 54.85 | | | | 56.77 | | | | 44.72 | | | 42.28 | | | 45.70 | |
| | | | | | | | | | | | | | | | | | |
Total Average production cost(US$ per barrel of oil equivalent)(3) (4) | | | | | | | |
Total average production cost(US$ per barrel of oil equivalent) (3) (4) | | | | | | | |
Australia | | | 8.23 | | | | 7.95 | | | | 5.75 | | | | 7.08 | | | 8.18 | | | 8.23 | |
United States | | | 6.27 | | | | 5.91 | | | | 6.45 | | | | 7.73 | | | 7.80 | | | 6.27 | |
Other(5) | | | 8.45 | | | | 7.84 | | | | 8.39 | | | | 13.32 | | | 9.58 | | | 8.45 | |
| | | | | | | | | | | | | | | | | | |
Total Average production cost(US$ per barrel of oil equivalent)(3) (4) | | | 7.18 | | | | 6.90 | | | | 6.34 | | |
Total average production cost | | | | 7.88 | | | 8.08 | | | 7.18 | |
| | | | | | | | | | | | | | | | | | |
| (1) | LPG and ethane are reported as natural gas liquidsNatural Gas Liquids (NGL). |
(2)(2) | Total barrels of oil equivalent (boe) conversion is based on the following: 6,000 scfstandard cubic feet (scf) of natural gas equals one boe. |
| (3) | Average production costs include direct and indirect costs relating to the production of hydrocarbons and the foreign exchange effect of translating local currency denominated costs into US dollars, but excludes ad valorem and severance taxes. |
| (4) | Total average production costs reported here do not include the costs to transport our produced hydrocarbons to the point of sale. Total production costs, including transportation costs, but excluding ad valorem and severance taxes, were US$10.8511.09 per boe, US$10.0011.70 per boe, and US$7.3710.85 per boe for the years ended 30 June 2013, 20122015, 2014 and 2011,2013, respectively. |
| (5) | Other is comprised of Algeria, Pakistan, Trinidad and Tobago, and the United Kingdom. |
2.3.22.2.2 Minerals
The table below details our mineral and derivative product production for all Businesses except Petroleum for the three years ended 30 June 2013, 20122015, 2014 and 2011. Production shows2013. Unless otherwise stated, the production numbers represent our share unless otherwise stated.of production and include the proportional share of production from which profit is derived from our equity accounted investments. Production information for equity accounted investments is included to provide insight into the operational performance of these entities. For discussion of minerals pricing during the past three years, refer to section 3.4.1.1.15.1.
| | | | BHP Billiton
Group interest
% | | | BHP Billiton Group share of production
Year ended 30 June | | | BHP Billiton
Group interest
% | | | BHP Billiton Group share of production (1)
Year ended 30 June | |
| | | 2013 | | | 2012 | | | 2011 | | | 2015 | | | 2014 | | | 2013 | |
Copper Business | | | | | | | | | | | | | | | | |
Copper | | | | | | | | | | | | | | | | |
Payable metal in concentrate (’000 tonnes) | | | | | | | | | | | | | | | | |
Escondida, Chile | | | 57.5 | | | | 478.1 | | | | 333.8 | | | | 390.5 | | |
Antamina, Peru | | | 33.8 | | | | 139.7 | | | | 127.0 | | | | 97.8 | | |
Pinto Valley, United States (1) | | | 100 | | | | 16.6 | | | | – | | | | – | | |
Escondida, Chile (3) | | | | 57.5 | | | | 916.1 | | | | 844.7 | | | | 831.5 | |
Antamina, Peru (4) | | | | 33.75 | | | | 107.7 | | | | 143.5 | | | | 139.7 | |
Pinto Valley, United States (5) | | | | 100 | | | | – | | | | 12.5 | | | | 16.6 | |
| | | | | | | | | | | | | | | | | | | | | | |
Total copper concentrate | | | | | 634.4 | | | | 460.8 | | | | 488.3 | | | | | | 1,023.8 | | | | 1,000.7 | | | | 987.8 | |
| | | | | | | | | | | | | | | | | | | | | | |
Copper cathode(’000 tonnes) | | | | | | | | | | | | | | | | |
Escondida, Chile | | | 57.5 | | | | 171.3 | | | | 172.0 | | | | 179.1 | | |
Escondida, Chile (3) | | | | 57.5 | | | | 310.4 | | | | 308.0 | | | | 297.9 | |
Pampa Norte, Chile(2)(6) | | | 100 | | | | 232.6 | | | | 263.7 | | | | 272.2 | | | | 100 | | | | 249.6 | | | | 233.1 | | | | 232.6 | |
Pinto Valley, United States(1) | | | 100 | | | | 4.9 | | | | 5.4 | | | | 5.7 | | |
Pinto Valley, United States (5) | | | | 100 | | | | – | | | | 0.9 | | | | 4.9 | |
Olympic Dam, Australia | | | 100 | | | | 166.2 | | | | 192.6 | | | | 194.1 | | | | 100 | | | | 124.5 | | | | 184.4 | | | | 166.2 | |
| | | | | | | | | | | | | | | | | | | | | | |
Total copper cathode | | | | | 575.0 | | | | 633.7 | | | | 651.1 | | | | | | 684.5 | | | | 726.4 | | | | 701.6 | |
| | | | | | | | | | | | | | | | | | | | | | |
Total copper concentrate and cathode | | | | | 1,209.4 | | | | 1,094.5 | | | | 1,139.4 | | | | | | 1,708.3 | | | | 1,727.1 | | | | 1,689.4 | |
| | | | | | | | | | | | | | | | | | | | | | |
Lead | | | | | | | | | | | | | | | | |
Payable metal in concentrate (’000 tonnes) | | | | | | | | | | | | | | | | |
Cannington, Australia | | | 100 | | | | 213.4 | | | | 239.1 | | | | 243.4 | | |
Antamina, Peru | | | 33.8 | | | | 1.0 | | | | 0.8 | | | | 1.2 | | |
Antamina, Peru (4) | | | | 33.75 | | | | 2.1 | | | | 1.5 | | | | 1.0 | |
| | | | | | | | | | | | | | | | | | | | | | |
Total lead | | | | | 214.4 | | | | 239.9 | | | | 244.6 | | | | | | 2.1 | | | | 1.5 | | | | 1.0 | |
| | | | | | | | | | | | | | | | | | | | | | |
Zinc | | | | | | | | | | | | | | | | |
Payable metal in concentrate (’000 tonnes) | | | | | | | | | | | | | | | | |
Cannington, Australia | | | 100 | | | | 56.3 | | | | 54.7 | | | | 60.7 | | |
Antamina, Peru | | | 33.8 | | | | 71.9 | | | | 57.5 | | | | 91.5 | | |
Antamina, Peru (4) | | | | 33.75 | | | | 66.4 | | | | 52.0 | | | | 71.9 | |
| | | | | | | | | | | | | | | | | | | | | | |
Total zinc | | | | | 128.2 | | | | 112.2 | | | | 152.2 | | | | | | 66.4 | | | | 52.0 | | | | 71.9 | |
| | | | | | | | | | | | | | | | | | | | | | |
| | | | | | | | | | | | | | | | |
| | | BHP Billiton
Group interest
% | | | BHP Billiton Group share of production
Year ended 30 June | |
| | | | 2013 | | | 2012 | | | 2011 | |
Gold | | | | | | | | | | | | | | | | |
Payable metal in concentrate (’000 ounces) | | | | | | | | | | | | | | | | |
Escondida, Chile | | | 57.5 | | | | 41.1 | | | | 50.9 | | | | 84.7 | |
Olympic Dam, Australia (refined gold) | | | 100 | | | | 113.3 | | | | 117.8 | | | | 111.4 | |
| | | | | | | | | | | | | | | | |
Total gold | | | | | | | 154.4 | | | | 168.7 | | | | 196.1 | |
| | | | | | | | | | | | | | | | |
Silver | | | | | | | | | | | | | | | | |
Payable metal in concentrate (’000 ounces) | | | | | | | | | | | | | | | | |
Escondida, Chile | | | 57.5 | | | | 1,702 | | | | 1,921 | | | | 2,849 | |
Antamina, Peru | | | 33.8 | | | | 3,952 | | | | 4,272 | | | | 3,600 | |
Cannington, Australia | | | 100 | | | | 31,062 | | | | 34,208 | | | | 35,225 | |
Olympic Dam, Australia (refined silver) | | | 100 | | | | 880 | | | | 907 | | | | 982 | |
Pinto Valley, United States | | | 100 | | | | 59 | | | | – | | | | – | |
| | | | | | | | | | | | | | | | |
Total silver | | | | | | | 37,655 | | | | 41,308 | | | | 42,656 | |
| | | | | | | | | | | | | | | | |
Uranium oxide | | | | | | | | | | | | | | | | |
Payable metal in concentrate (tonnes) | | | | | | | | | | | | | | | | |
Olympic Dam, Australia | | | 100 | | | | 4,102 | | | | 3,885 | | | | 4,045 | |
| | | | | | | | | | | | | | | | |
Total uranium oxide | | | | | | | 4,102 | | | | 3,885 | | | | 4,045 | |
| | | | | | | | | | | | | | | | |
Molybdenum | | | | | | | | | | | | | | | | |
Payable metal in concentrate (tonnes) | | | | | | | | | | | | | | | | |
Antamina, Peru | | | 33.8 | | | | 1,561 | | | | 2,346 | | | | 1,445 | |
| | | | | | | | | | | | | | | | |
Total molybdenum | | | | | | | 1,561 | | | | 2,346 | | | | 1,445 | |
| | | | | | | | | | | | | | | | |
Iron Ore Business | | | | | | | | | | | | | | | | |
WAIO(3) | | | | | | | | | | | | | | | | |
Production (’000 tonnes) | | | | | | | | | | | | | | | | |
Newman, Australia (4) | | | 85 | | | | 52,997 | | | | 51,326 | | | | 45,245 | |
Mt Goldsworthy Joint Venture – Yarrie, Australia | | | 85 | | | | 1,106 | | | | 768 | | | | 1,198 | |
Mt Goldsworthy Joint Venture – Area C, Australia | | | 85 | | | | 44,717 | | | | 42,425 | | | | 39,794 | |
Yandi Joint Venture, Australia | | | 85 | | | | 60,054 | | | | 53,536 | | | | 36,460 | |
| | | | | | | | | | | | | | | | |
Total WAIO | | | | | | | 158,874 | | | | 148,055 | | | | 122,697 | |
| | | | | | | | | | | | | | | | |
Samarco, Brazil | | | 50 | | | | 10,982 | | | | 11,423 | | | | 11,709 | |
| | | | | | | | | | | | | | | | |
Total iron ore | | | | | | | 169,856 | | | | 159,478 | | | | 134,406 | |
| | | | | | | | | | | | | | | | |
Coal Business | | | | | | | | | | | | | | | | |
Metallurgical coal | | | | | | | | | | | | | | | | |
Production (’000 tonnes)(5) | | | | | | | | | | | | | | | | |
Blackwater, Australia | | | 50 | | | | 5,432 | | | | 4,435 | | | | 4,589 | |
Goonyella Riverside, Australia(6) | | | 50 | | | | 6,221 | | | | 5,003 | | | | 5,359 | |
Peak Downs, Australia | | | 50 | | | | 4,545 | | | | 3,534 | | | | 3,402 | |
Saraji, Australia | | | 50 | | | | 3,449 | | | | 3,053 | | | | 2,779 | |
Norwich Park, Australia(7) | | | 50 | | | | – | | | | 1,175 | | | | 1,055 | |
Gregory joint venture, Australia(8) | | | 50 | | | | 2,523 | | | | 1,411 | | | | 2,717 | |
Daunia, Australia(9) | | | 50 | | | | 475 | | | | – | | | | – | |
| | | | | | | | | | | | | | | | |
Total BMA | | | | | | | 22,645 | | | | 18,611 | | | | 19,901 | |
| | | | | | | | | | | | | | | | |
| | | | | | | | | | | | | | | | |
| | | BHP Billiton
Group interest
% | | | BHP Billiton Group share of production (1)
Year ended 30 June | |
| | | | 2015 | | | 2014 | | | 2013 | |
Gold | | | | | | | | | | | | | | | | |
Payable metal in concentrate (’000 ounces) | | | | | | | | | | | | | | | | |
Escondida, Chile (3) | | | 57.5 | | | | 81.5 | | | | 72.9 | | | | 71.5 | |
Pinto Valley, United States (5) | | | 100 | | | | – | | | | 0.1 | | | | – | |
Olympic Dam, Australia (refined gold) | | | 100 | | | | 104.8 | | | | 121.3 | | | | 113.3 | |
| | | | | | | | | | | | | | | | |
Total gold | | | | | | | 186.3 | | | | 194.3 | | | | 184.8 | |
| | | | | | | | | | | | | | | | |
Silver | | | | | | | | | | | | | | | | |
Payable metal in concentrate (’000 ounces) | | | | | | | | | | | | | | | | |
Escondida, Chile (3) | | | 57.5 | | | | 4,786 | | | | 4,271 | | | | 2,960 | |
Antamina, Peru (4) | | | 33.75 | | | | 3,826 | | | | 4,359 | | | | 3,952 | |
Olympic Dam, Australia (refined silver) | | | 100 | | | | 724 | | | | 972 | | | | 880 | |
Pinto Valley, United States (5) | | | 100 | | | | – | | | | 41 | | | | 59 | |
| | | | | | | | | | | | | | | | |
Total silver | | | | | | | 9,336 | | | | 9,643 | | | | 7,851 | |
| | | | | | | | | | | | | | | | |
Uranium | | | | | | | | | | | | | | | | |
Payable metal in concentrate (tonnes) | | | | | | | | | | | | | | | | |
Olympic Dam, Australia | | | 100 | | | | 3,144 | | | | 3,988 | | | | 4,066 | |
| | | | | | | | | | | | | | | | |
Total uranium | | | | | | | 3,144 | | | | 3,988 | | | | 4,066 | |
| | | | | | | | | | | | | | | | |
Molybdenum | | | | | | | | | | | | | | | | |
Payable metal in concentrate (tonnes) | | | | | | | | | | | | | | | | |
Antamina, Peru (4) | | | 33.75 | | | | 472 | | | | 1,201 | | | | 1,561 | |
| | | | | | | | | | | | | | | | |
Total molybdenum | | | | | | | 472 | | | | 1,201 | | | | 1,561 | |
| | | | | | | | | | | | | | | | |
Iron Ore Business | | | | | | | | | | | | | | | | |
Western Australia Iron Ore | | | | | | | | | | | | | | | | |
Production (’000 tonnes) (7) | | | | | | | | | | | | | | | | |
Newman, Australia | | | 85 | | | | 63,697 | | | | 56,915 | | | | 44,620 | |
Yarrie, Australia (8) | | | 85 | | | | – | | | | 836 | | | | 1,106 | |
Area C Joint Venture, Australia | | | 85 | | | | 49,994 | | | | 46,960 | | | | 44,717 | |
Yandi Joint Venture, Australia | | | 85 | | | | 68,551 | | | | 68,518 | | | | 60,054 | |
Jimblebar, Australia (9) | | | 85 | | | | 16,759 | | | | 8,863 | | | | – | |
Wheelarra, Australia (10) | | | 85 | | | | 18,994 | | | | 10,553 | | | | 8,377 | |
| | | | | | | | | | | | | | | | |
Total Western Australia Iron Ore | | | | | | | 217,995 | | | | 192,645 | | | | 158,874 | |
| | | | | | | | | | | | | | | | |
Samarco, Brazil (4) | | | 50 | | | | 14,513 | | | | 10,919 | | | | 10,982 | |
| | | | | | | | | | | | | | | | |
Total iron ore | | | | | | | 232,508 | | | | 203,564 | | | | 169,856 | |
| | | | | | | | | | | | | | | | |
| | | | | | | | | | | | | | | | |
| | | BHP Billiton
Group interest
% | | | BHP Billiton Group share of production
Year ended 30 June | |
| | | | 2013 | | | 2012 | | | 2011 | |
South Walker Creek, Australia | | | 80 | | | | 4,351 | | | | 4,081 | | | | 3,134 | |
Poitrel, Australia | | | 80 | | | | 2,712 | | | | 2,612 | | | | 2,759 | |
| | | | | | | | | | | | | | | | |
Total BHP Billiton Mitsui Coal(10) | | | | | | | 7,063 | | | | 6,693 | | | | 5,893 | |
| | | | | | | | | | | | | | | | |
Total Queensland Coal | | | | | | | 29,708 | | | | 25,304 | | | | 25,794 | |
| | | | | | | | | | | | | | | | |
Illawarra Coal, Australia | | | 100 | | | | 7,942 | | | | 7,926 | | | | 6,884 | |
| | | | | | | | | | | | | | | | |
Total metallurgical coal | | | | | | | 37,650 | | | | 33,230 | | | | 32,678 | |
| | | | | | | | | | | | | | | | |
Energy coal | | | | | | | | | | | | | | | | |
Production (’000 tonnes) | | | | | | | | | | | | | | | | |
Navajo, United States | | | 100 | | | | 6,544 | | | | 7,004 | | | | 7,472 | |
San Juan, United States | | | 100 | | | | 6,694 | | | | 2,408 | | | | 4,140 | |
| | | | | | | | | | | | | | | | |
Total New Mexico Coal | | | | | | | 13,238 | | | | 9,412 | | | | 11,612 | |
| | | | | | | | | | | | | | | | |
Middelburg/Wolvekrans, South Africa | | | 90 | | | | 14,669 | | | | 14,848 | | | | 14,328 | |
Khutala, South Africa | | | 90 | | | | 9,554 | | | | 10,863 | | | | 12,928 | |
Klipspruit, South Africa | | | 90 | | | | 7,404 | | | | 7,568 | | | | 7,072 | |
| | | | | | | | | | | | | | | | |
Total Energy Coal South Africa(11) | | | | | | | 31,627 | | | | 33,279 | | | | 34,328 | |
| | | | | | | | | | | | | | | | |
Mt Arthur Coal, Australia | | | 100 | | | | 18,010 | | | | 16,757 | | | | 13,671 | |
Cerrejón, Colombia | | | 33.3 | | | | 10,017 | | | | 11,663 | | | | 9,889 | |
| | | | | | | | | | | | | | | | |
Total energy coal | | | | | | | 72,892 | | | | 71,111 | | | | 69,500 | |
| | | | | | | | | | | | | | | | |
Aluminium, Manganese and Nickel Business | | | | | | | | | | | | | | | | |
Alumina | | | | | | | | | | | | | | | | |
Saleable production (’000 tonnes) | | | | | | | | | | | | | | | | |
Worsley, Australia | | | 86 | | | | 3,675 | | | | 2,917 | | | | 2,902 | |
Alumar, Brazil | | | 36 | | | | 1,205 | | | | 1,235 | | | | 1,108 | |
| | | | | | | | | | | | | | | | |
Total alumina | | | | | | | 4,880 | | | | 4,152 | | | | 4,010 | |
| | | | | | | | | | | | | | | | |
Aluminium | | | | | | | | | | | | | | | | |
Production (’000 tonnes) | | | | | | | | | | | | | | | | |
Hillside, South Africa | | | 100 | | | | 665 | | | | 621 | | | | 711 | |
Bayside, South Africa | | | 100 | | | | 96 | | | | 98 | | | | 97 | |
Alumar, Brazil | | | 40 | | | | 154 | | | | 170 | | | | 174 | |
Mozal, Mozambique | | | 47 | | | | 264 | | | | 264 | | | | 264 | |
| | | | | | | | | | | | | | | | |
Total aluminium | | | | | | | 1,179 | | | | 1,153 | | | | 1,246 | |
| | | | | | | | | | | | | | | | |
Manganese ores | | | | | | | | | | | | | | | | |
Saleable production (’000 tonnes) | | | | | | | | | | | | | | | | |
Hotazel Manganese Mines, South Africa | | | 44.4 | | | | 3,490 | | | | 3,625 | | | | 3,007 | |
GEMCO, Australia | | | 60 | | | | 5,027 | | | | 4,306 | | | | 4,086 | |
| | | | | | | | | | | | | | | | |
Total manganese ores(12) | | | | | | | 8,517 | | | | 7,931 | | | | 7,093 | |
| | | | | | | | | | | | | | | | |
Manganese alloys | | | | | | | | | | | | | | | | |
Saleable production (’000 tonnes) | | | | | | | | | | | | | | | | |
Metalloys, South Africa (13) | | | 60 | | | | 374 | | | | 404 | | | | 486 | |
TEMCO, Australia | | | 60 | | | | 234 | | | | 198 | | | | 267 | |
| | | | | | | | | | | | | | | | |
Total manganese alloys(12) | | | | | | | 608 | | | | 602 | | | | 753 | |
| | | | | | | | | | | | | | | | |
| | | | | | | | | | | | | | | | |
| | | BHP Billiton
Group interest
% | | | BHP Billiton Group share of production (1)
Year ended 30 June | |
| | | | 2015 | | | 2014 | | | 2013 | |
Coal Business | | | | | | | | | | | | | | | | |
Metallurgical coal | | | | | | | | | | | | | | | | |
Production (’000 tonnes) (11) | | | | | | | | | | | | | | | | |
Blackwater, Australia | | | 50 | | | | 6,994 | | | | 6,730 | | | | 5,432 | |
Goonyella Riverside, Australia | | | 50 | | | | 8,510 | | | | 7,330 | | | | 6,221 | |
Peak Downs, Australia | | | 50 | | | | 5,111 | | | | 4,909 | | | | 4,545 | |
Saraji, Australia | | | 50 | | | | 4,506 | | | | 4,558 | | | | 3,449 | |
Gregory Joint Venture, Australia | | | 50 | | | | 3,294 | | | | 2,965 | | | | 2,523 | |
Daunia, Australia | | | 50 | | | | 2,383 | | | | 2,201 | | | | 475 | |
Caval Ridge, Australia (12) | | | 50 | | | | 3,064 | | | | 563 | | | | – | |
| | | | | | | | | | | | | | | | |
Total BHP Billiton Mitsubishi Alliance | | | | | | | 33,862 | | | | 29,256 | | | | 22,645 | |
| | | | | | | | | | | | | | | | |
South Walker Creek, Australia (13) | | | 80 | | | | 5,293 | | | | 5,246 | | | | 4,351 | |
Poitrel, Australia (13) | | | 80 | | | | 3,466 | | | | 3,063 | | | | 2,712 | |
| | | | | | | | | | | | | | | | |
Total BHP Billiton Mitsui Coal | | | | | | | 8,759 | | | | 8,309 | | | | 7,063 | |
| | | | | | | | | | | | | | | | |
Total Queensland Coal | | | | | | | 42,621 | | | | 37,565 | | | | 29,708 | |
| | | | | | | | | | | | | | | | |
Total metallurgical coal | | | | | | | 42,621 | | | | 37,565 | | | | 29,708 | |
| | | | | | | | | | | | | | | | |
Energy coal | | | | | | | | | | | | | | | | |
Production (’000 tonnes) | | | | | | | | | | | | | | | | |
Navajo, United States (14) | | | 100 | | | | 4,858 | | | | 5,127 | | | | 7,468 | |
San Juan, United States | | | 100 | | | | 5,165 | | | | 5,685 | | | | 5,323 | |
| | | | | | | | | | | | | | | | |
Total New Mexico Coal | | | | | | | 10,023 | | | | 10,812 | | | | 12,791 | |
| | | | | | | | | | | | | | | | |
New South Wales Energy Coal, Australia | | | 100 | | | | 19,698 | | | | 19,964 | | | | 18,010 | |
Cerrejón, Colombia (4) | | | 33.3 | | | | 11,291 | | | | 12,332 | | | | 10,017 | |
| | | | | | | | | | | | | | | | |
Total energy coal | | | | | | | 41,012 | | | | 43,108 | | | | 40,818 | |
| | | | | | | | | | | | | | | | |
Other assets | | | | | | | | | | | | | | | | |
Nickel | | | | | | | | | | | | | | | | |
Saleable production (’000 tonnes) | | | | | | | | | | | | | | | | |
Nickel West, Australia | | | 100 | | | | 89.9 | | | | 98.9 | | | | 103.3 | |
| | | | | | | | | | | | | | | | |
Total nickel | | | | | | | 89.9 | | | | 98.9 | | | | 103.3 | |
| | | | | | | | | | | | | | | | |
Discontinued operations (15) | | | | | | | | | | | | | | | | |
Lead | | | | | | | | | | | | | | | | |
Payable metal in concentrate (’000 tonnes) | | | | | | | | | | | | | | | | |
Cannington, Australia | | | 100 | | | | 151.6 | | | | 186.5 | | | | 213.4 | |
| | | | | | | | | | | | | | | | |
Total lead | | | | | | | 151.6 | | | | 186.5 | | | | 213.4 | |
| | | | | | | | | | | | | | | | |
Zinc | | | | | | | | | | | | | | | | |
Payable metal in concentrate (’000 tonnes) | | | | | | | | | | | | | | | | |
Cannington, Australia | | | 100 | | | | 60.0 | | | | 57.9 | | | | 56.3 | |
| | | | | | | | | | | | | | | | |
Total zinc | | | | | | | 60.0 | | | | 57.9 | | | | 56.3 | |
| | | | | | | | | | | | | | | | |
| | | | | | | | | | | | | | | | |
| | | BHP Billiton
Group interest
% | | | BHP Billiton Group share of production
Year ended 30 June | |
| | | | 2013 | | | 2012 | | | 2011 | |
Nickel | | | | | | | | | | | | | | | | |
Saleable production (’000 tonnes) | | | | | | | | | | | | | | | | |
Cerro Matoso, Colombia | | | 99.9 | | | | 50.8 | | | | 48.9 | | | | 40.0 | |
Nickel West, Australia | | | 100 | | | | 103.3 | | | | 109.0 | | | | 112.7 | |
| | | | | | | | | | | | | | | | |
Total nickel | | | | | | | 154.1 | | | | 157.9 | | | | 152.7 | |
| | | | | | | | | | | | | | | | |
Divested businesses | | | | | | | | | | | | | | | | |
Diamonds | | | | | | | | | | | | | | | | |
Production (’000 carats) | | | | | | | | | | | | | | | | |
| | | | | | | | | | | | | | | | |
EKATI™, Canada(14) | | | 80 | | | | 972 | | | | 1,784 | | | | 2,506 | |
| | | | | | | | | | | | | | | | |
Total diamonds | | | | | | | 972 | | | | 1,784 | | | | 2,506 | |
| | | | | | | | | | | | | | | | |
Titanium minerals(15) | | | | | | | | | | | | | | | | |
Production (’000 tonnes) | | | | | | | | | | | | | | | | |
Titanium slag | | | | | | | | | | | | | | | | |
Richards Bay Minerals, South Africa | | | 37.76 | | | | 53 | | | | 384 | | | | 366 | |
Rutile | | | | | | | | | | | | | | | | |
Richards Bay Minerals, South Africa | | | 37.76 | | | | 6 | | | | 38 | | | | 32 | |
Zircon | | | | | | | | | | | | | | | | |
Richards Bay Minerals, South Africa | | | 37.76 | | | | 16 | | | | 100 | | | | 83 | |
| | | | | | | | | | | | | | | | |
Total titanium minerals | | | | | | | 75 | | | | 522 | | | | 481 | |
| | | | | | | | | | | | | | | | |
| | | | | | | | | | | | | | | | |
| | | BHP Billiton
Group interest
% | | | BHP Billiton Group share of production (1)
Year ended 30 June | |
| | | | 2015 | | | 2014 | | | 2013 | |
Silver | | | | | | | | | | | | | | | | |
Payable metal in concentrate (’000 ounces) | | | | | | | | | | | | | | | | |
Cannington, Australia | | | 100 | | | | 18,718 | | | | 25,161 | | | | 31,062 | |
| | | | | | | | | | | | | | | | |
Total silver | | | | | | | 18,718 | | | | 25,161 | | | | 31,062 | |
| | | | | | | | | | | | | | | | |
Metallurgical coal | | | | | | | | | | | | | | | | |
Production (’000 tonnes) | | | | | | | | | | | | | | | | |
Illawarra Coal, Australia | | | 100 | | | | 7,216 | | | | 7,513 | | | | 7,942 | |
| | | | | | | | | | | | | | | | |
Total metallurgical coal | | | | | | | 7,216 | | | | 7,513 | | | | 7,942 | |
| | | | | | | | | | | | | | | | |
Energy coal | | | | | | | | | | | | | | | | |
Production (’000 tonnes) | | | | | | | | | | | | | | | | |
Energy Coal South Africa, South Africa (16) | | | 90 | | | | 28,677 | | | | 30,384 | | | | 31,627 | |
| | | | | | | | | | | | | | | | |
Total energy coal | | | | | | | 28,677 | | | | 30,384 | | | | 31,627 | |
| | | | | | | | | | | | | | | | |
Nickel | | | | | | | | | | | | | | | | |
Saleable production (’000 tonnes) | | | | | | | | | | | | | | | | |
Cerro Matoso, Columbia | | | 99.9 | | | | 33.7 | | | | 44.3 | | | | 50.8 | |
| | | | | | | | | | | | | | | | |
Total nickel | | | | | | | 33.7 | | | | 44.3 | | | | 50.8 | |
| | | | | | | | | | | | | | | | |
Alumina | | | | | | | | | | | | | | | | |
Saleable production (’000 tonnes) | | | | | | | | | | | | | | | | |
Worsley, Australia | | | 86 | | | | 3,181 | | | | 3,916 | | | | 3,675 | |
Alumar, Brazil | | | 36 | | | | 1,103 | | | | 1,262 | | | | 1,205 | |
| | | | | | | | | | | | | | | | |
Total alumina | | | | | | | 4,284 | | | | 5,178 | | | | 4,880 | |
| | | | | | | | | | | | | | | | |
Aluminium | | | | | | | | | | | | | | | | |
Production (’000 tonnes) | | | | | | | | | | | | | | | | |
Hillside, South Africa | | | 100 | | | | 581 | | | | 715 | | | | 665 | |
Bayside, South Africa (17) | | | 100 | | | | – | | | | 89 | | | | 96 | |
Alumar, Brazil | | | 40 | | | | 40 | | | | 104 | | | | 154 | |
Mozal, Mozambique | | | 47 | | | | 222 | | | | 266 | | | | 264 | |
| | | | | | | | | | | | | | | | |
Total aluminium | | | | | | | 843 | | | | 1,174 | | | | 1,179 | |
| | | | | | | | | | | | | | | | |
Manganese ores | | | | | | | | | | | | | | | | |
Saleable production (’000 tonnes) | | | | | | | | | | | | | | | | |
Hotazel Manganese Mines, South Africa (18) | | | 44.4 | | | | 3,138 | | | | 3,526 | | | | 3,490 | |
GEMCO, Australia (18) | | | 60 | | | | 4,086 | | | | 4,776 | | | | 5,027 | |
| | | | | | | | | | | | | | | | |
Total manganese ores | | | | | | | 7,224 | | | | 8,302 | | | | 8,517 | |
| | | | | | | | | | | | | | | | |
Manganese alloys | | | | | | | | | | | | | | | | |
Saleable production (’000 tonnes) | | | | | | | | | | | | | | | | |
Metalloys, South Africa (18) (19) | | | 60 | | | | 379 | | | | 377 | | | | 374 | |
TEMCO, Australia (18) | | | 60 | | | | 233 | | | | 269 | | | | 234 | |
| | | | | | | | | | | | | | | | |
Total manganese alloys | | | | | | | 612 | | | | 646 | | | | 608 | |
| | | | | | | | | | | | | | | | |
| | | | | | | | | | | | | | | | |
| | | BHP Billiton
Group interest
% | | | BHP Billiton Group share of production (1)
Year ended 30 June | |
| | | | 2015 | | | 2014 | | | 2013 | |
Divested businesses | | | | | | | | | | | | | | | | |
Diamonds | | | | | | | | | | | | | | | | |
Production (’000 carats) | | | | | | | | | | | | | | | | |
EKATITM, Canada | | | 80 | | | | – | | | | – | | | | 972 | |
| | | | | | | | | | | | | | | | |
Total diamonds | | | | | | | – | | | | – | | | | 972 | |
| | | | | | | | | | | | | | | | |
Titanium minerals | | | | | | | | | | | | | | | | |
Production (’000 tonnes) | | | | | | | | | | | | | | | | |
Titanium slag | | | | | | | | | | | | | | | | |
Richards Bay Minerals, South Africa | | | 37.76 | | | | – | | | | – | | | | 53 | |
Rutile | | | | | | | | | | | | | | | | |
Richards Bay Minerals, South Africa | | | 37.76 | | | | – | | | | – | | | | 6 | |
Zircon | | | | | | | | | | | | | | | | |
Richards Bay Minerals, South Africa | | | 37.76 | | | | – | | | | – | | | | 16 | |
| | | | | | | | | | | | | | | | |
Total titanium minerals | | | | | | | – | | | | – | | | | 75 | |
| | | | | | | | | | | | | | | | |
| (1) | Sulphide mining and milling operations at Pinto Valley recommenced in FY2013. The operations were placed on care and maintenance in January 2009, but continued to produce copper cathode through sulphide leaching.BHP Billiton Group share of production includes the proportional share of production for which profit is derived from our equity accounted investments, unless otherwise stated. |
| (2) | Metal production is reported on the basis of payable metal. |
| (3) | Shown on 100 per cent basis following the application of IFRS 10, which came into effect from 1 July 2013. BHP Billiton interest in saleable production is 57.5 per cent. |
| (4) | For statutory financial reporting purposes, this is an equity accounted investment. We have included production numbers from our equity accounted investments as the level of production and operating performance from these operations impacts Underlying EBIT of the Group. Our use of Underlying EBIT is explained in section 1.11.1 of this Annual Report. |
| (5) | On 11 October 2013, BHP Billiton completed the sale of its Pinto Valley operations. |
| (6) | Includes Cerro Colorado and Spence. |
(3)(7) | Iron ore production is reported on a wet tonnes basis. |
(4)(8) | Newman includes Mt Newman Joint Venture and Jimblebar.Yarrie ceased production on 25 February 2014. |
(5)(9) | Shown on 100 per cent basis. BHP Billiton interest in saleable production is 85 per cent. |
| (10) | All production from Wheelarra is now processed via the Jimblebar processing hub. |
| (11) | Metallurgical coal production is reported on the basis of saleable product. Production figures include some energythermal coal. |
(6)(12) | Goonyella Riverside includes the Broadmeadow underground mine. |
(7) | Norwich Park ceased production on 11 May 2012. |
(8) | Gregory open-cut mine ceased production on 10 October 2012. |
(9) | Daunia projectCaval Ridge achieved first production in the March 2013June 2014 quarter. |
(10)(13) | Shown on 100 per cent basis. BHP Billiton interest in saleable production is 80 per cent (FY2012: 80 per cent; FY2011: 80 per cent).cent. |
(11)(14) | BHP Billiton completed the sale of Navajo Mine on 30 December 2013. As BHP Billiton will retain control of the mine until full consideration is received, production will continue to be reported by the Group. |
| (15) | Production shown from 1 July 2014 to 30 April 2015. Refer to sections 1.3.7, 1.6.4, 2.1.7 and note 29 ‘Discontinued operations’ to the Financial Statements for more information on the demerger of assets to form South32. |
| (16) | Shown on 100 per cent basis. BHP Billiton interest in saleable production reduced tois 90 per cent during the second half of FY2013.cent. |
(12)(17) | Aluminium smelting at Bayside ceased with the closure of the final potline in June 2014. |
| (18) | Shown on 100 per cent basis. BHP Billiton interest in saleable production is 60 per cent, except Hotazel Manganese Mines which is 44.4 per cent (FY2012: 44.4 per cent; FY2011: 44.4 per cent).cent. |
(13)(19) | Production includes medium-carbon ferromanganese. |
(14) | Our 80 per cent operated interest in EKATI was sold on 10 April 2013. |
(15) | Our 37.76 per cent non-operated interest in Richards Bay Minerals was sold on 7 September 2012. For FY2011, data was sourced from the TZ Minerals International Pty Ltd Mineral Sands Annual Review 2012, and amounts represent production for the preceding year ended 31 December 2011. |
2.4 Marketing
BHP Billiton’s Marketing network manages the Group’s revenue line and is responsible for:
selling our products and managing the Marketing supply chain;
purchasing of all major raw materials;
managing credit and price risk associated with the revenue line;
achieving market clearing prices for the Group’s products;
defining our view of long-term market fundamentals.
Our responsibilities require an active presence in the various commodities markets and the global freight market, through which we oversee the management of the supply chain for our various products, extending from our assets to markets and, for raw materials, from suppliers to our assets. We also work to manage credit and price risk by assessing customers for creditworthiness and ensuring that the Group’s revenue is determined predominantly on an index or floating price basis.
Our market insight is strengthened by the multi-commodity nature of the Group, our proximity to our customers and the easy flow of information in our centralised marketing structure. We study the fundamentals of demand and the supply cycles and integrate these to form a long-term view of the market, through interaction with customers, forums and analysts. This allows us to better assess and respond to shifts in long-term pricing and demand and address trends across commodity markets.
The global hub for our marketing activities for all commodities, except oil and gas, is centralised in Singapore. The global hub for our marketing activities for oil and gas is centralised in Houston, United States.
During FY2013, the Marketing hub office in The Hague, Netherlands, was closed and most activities moved to Singapore, reflecting the continued predominance of sales in Asia.
The two marketing hub offices incorporate all the functions required to manage product marketing and distribution from our assets to final customers. In addition, we have marketers located in regional offices in 14 cities around the world.
Within the Singapore Marketing hub, we have a centralised ocean freight business that manages our in-house freight requirements. The primary purpose of the freight business is to create a competitive advantage for our shipments through the procurement and operation of quality, cost-effective shipping.
2.5 Minerals exploration
Our minerals exploration program is integral to our growth strategy and is focused on discovering and acquiring operating interests in mineral deposits with the potential to support large, long-life, low-cost, expandable upstream assets, diversified by commodity, geography and market.
Our greenfield (new sites) activities allow us to explore some of the most geologically prospective terrains in a number of countries and operating environments. Greenfield minerals exploration is focused on advancing targets within Chile and Peru, and is organised through our Copper Business. Greenfield activities include opportunity identification, application for and acquisition of mineral title, early reconnaissance operations and multi-million dollar delineation drilling programs.
In addition to our activities focused on finding new world-class deposits, several of our Businesses undertake brownfield (developments on existing sites) exploration, principally aimed at delineating and categorising mineral deposits near existing operations, and advancing projects through the development pipeline.
Our expenditure on minerals exploration over the last three years was:
| | | | | | | | | | | | |
Year ended 30 June | | 2013 | | | 2012 | | | 2011 | |
| | | US$M | | | US$M | | | US$M | |
| |
Greenfield exploration | | | 179 | | | | 324 | | | | 207 | |
Brownfield exploration | | | 472 | | | | 773 | | | | 476 | |
| | | | | | | | | | | | |
Total minerals exploration | | | 651 | | | | 1,097 | | | | 683 | |
| | | | | | | | | | | | |
2.6 Group Resource and Business Optimisation
Group Resource and Business Optimisation (RBO) provides governance and functional leadership for resource planning and development and Ore Reserve reporting. RBO is focused on ensuring optimal value recovery from our resources. The team includes functional experts in mineral resource evaluation, exploration, planning, research and development, work management, production processes, mine engineering and mineral process engineering.
RBO engages directly with assets to deliver guidance and assess compliance in resource development and Ore Reserve reporting. It provides the Group Management Committee with performance reports and portfolio analysis. RBO also provides functional expertise to audits and to investment review programs conducted by other Group Functions.
RBO’s accountabilities include governance for all resource and reserve estimation and Ore Reserve reporting.
2.7 Government regulations
Government regulations touch all aspects of our operations. However, the geographical diversity of our operations reduces the risk that any one set of government regulations would have a material effect on our business, taken as a whole.
The ability to extract minerals, oil and natural gas is fundamental to BHP Billiton. In most jurisdictions, the rights to undeveloped mineral or petroleum deposits are owned by the state. In those jurisdictions, we rely upon the rights granted to us by the government that owns the mineral, oil or natural gas. These rights usually take the form of a lease or licence, which gives us the right to access the land and extract the product. The terms of the lease or licence, including the time period for which it is effective, are specific to the laws of the relevant government. Generally, we own the product we extract and royalties or similar taxes are payable to the government. In certain jurisdictions in which we operate, such as Trinidad and Tobago, a production sharing contract (PSC) governs the relationship between the government and companies concerning how much of the oil and gas extracted from the country each will receive. In production sharing contracts the government awards rights for the execution of exploration, development and production activities to the company. The company bears the financial risk of the initiative, and explores, develops and ultimately produces the field as required. When successful, the company is permitted to use the money from a certain set percentage of produced oil and gas to recover capital and operational expenditures, known as ‘cost oil’. The remaining production is known as ‘profit oil’ and is split between the government and the company at a rate determined by the government and set out in the PSC.
Related to the ability to extract is the ability to process the minerals, oil or natural gas. Again, we rely upon the relevant government to grant the rights necessary to transport and treat the extracted material in order to ready it for sale.
Underlying our business of extracting and processing natural resources is the ability to explore for those natural resources. Typically, the rights to explore for minerals, oil and natural gas are granted to us by the government that owns those natural resources that we wish to explore. Usually, the right to explore carries with it the obligation to spend a defined amount of money on the exploration or to undertake particular exploration activities.
Although onshore oil and gas rights in the United States can be derived from government (state and federal) mineral rights, they are primarily derived from private ownership of the rights, which is the case for our onshore oil and gas rights. Oil and gas rights primarily take the form of a lease, but also can be owned onshore outright in fee. If the rights granted are by lease, we are afforded the rights to access, explore, extract, produce and market the oil and gas for a period of years and then generally so long thereafter as there is oil or gas production or operations on the leased lands.
Governments also impose obligations on us in respect of environmental protection, land rehabilitation, occupational health and safety, and native land title with which we must comply in order to continue to enjoy the right to conduct our operations within that jurisdiction. These obligations often require us to make substantial expenditures to minimise or remediate the environmental impact of our operations, to ensure the safety of our employees and contractors and the like. Environmental protection, land rehabilitation and occupational health and safety onshore in the United States are principally regulated by the government and to a lesser degree, if applicable, by the lease contract with the landowner. For further information on these types of obligations, refer to section 2.8 of this Annual Report.
Of particular note are the following regulatory regimes:
2.7.1 Uranium production in Australia
To mine, process, transport and sell uranium from within Australia, we are required to hold possession and export permissions, which are also subject to regulation by the Australian Government or bodies that report to the Australian Government.
To possess nuclear material, such as uranium, in Australia, a Permit to Possess Nuclear Materials (Possession Permit) must be held pursuant to the Australian Nuclear Non-Proliferation (Safeguards) Act 1987 (Non-Proliferation Act). A Possession Permit is issued by the Australian Safeguards and Non-Proliferation Office, an office established under the Non-Proliferation Act, which administers Australia’s domestic nuclear safeguards requirements and reports to the Australian Government.
To export uranium from Australia, a Permit to Export Natural Uranium (Export Permit) must be held pursuant to the Australian Customs (Prohibited Exports) Regulations 1958. The Export Permit is issued by the Minister for Resources and Energy.
A special transport permit is required under the Non-Proliferation Act by a party that transports nuclear material from one specified location to another specified location. As we engage service providers to transport uranium, those service providers are required to hold a special transport permit.
2.7.2 Exchange controls and shareholding limits
BHP Billiton Plc
There are no laws or regulations currently in force in the United Kingdom that restrict the export or import of capital or the remittance of dividends to non-resident holders of BHP Billiton Plc’s shares, although the Group does operate in some other jurisdictions where remittances of funds could be affected as they are subject to exchange control approvals. There are certain sanctions adopted by the UK Government which implement
resolutions of the Security Council of the United Nations and sanctions imposed by the European Union (EU) against certain countries, entities and individuals and may restrict the export or import of capital or the remittance of dividends to certain non-resident holders of BHP Billiton Plc’s shares. Any enforcement of financial sanctions by the UK Government would be initiated by HM Treasury. Such sanctions may be in force from time to time and include those against:
(i) certain entities and/or individuals associated with Afghanistan, Belarus, Cote d’Ivoire, the Democratic People’s Republic of Korea (North Korea), the Democratic Republic of Congo, Egypt, Eritrea, the Republic of Guinea, the Republic of Guinea-Bissau, Iran, Lebanon, Liberia, Somalia, Sudan, Syria, Tunisia, Zimbabwe and the previous regimes of Iraq, Libya and Yugoslavia;
(ii) individuals indicted by the International Criminal Tribunal for the former Yugoslavia;
(iii) entities and individuals linked with the Taliban, Al-Qaeda and other terrorist organisations.
There are no restrictions under BHP Billiton Plc’s Articles of Association or (subject to the effect of any sanctions) under English law that limit the right of non-resident or foreign owners to hold or vote BHP Billiton Plc’s shares.
There are certain restrictions on shareholding levels under BHP Billiton Plc’s Articles of Association described under the heading ‘BHP Billiton Limited’ below.
BHP Billiton Limited
From time to time, the United Nations Security Council and the Australian Government impose international sanctions on certain countries and organisations. The countries and organisations that are currently subject to United Nations sanctions are certain individuals or entities linked with the Taliban, Al-Qaeda and associated individuals and entities, other designated individuals and entities associated with terrorism, certain entities and individuals associated with the Democratic Republic of Congo, Cote d’Ivoire, the Democratic People’s Republic of Korea (North Korea), Eritrea, Guinea-Bissau, Iran, Iraq, Lebanon, Liberia, Libya, Sudan and Somalia. The countries currently subject to the Australian Government’s autonomous sanctions are Myanmar, the Democratic People’s Republic of Korea (North Korea), Fiji, the former Federal Republic of Yugoslavia, Iran, Libya, Syria and Zimbabwe. The controls impose certain approval and reporting requirements on transactions involving such countries, entities and individuals and/or assets controlled or owned by them. Transfers into or out of Australia of amounts greater than A$10,000 in any currency are also subject to reporting requirements. In addition, under the Australian Banking (Foreign Exchange) Regulations 1959, the Reserve Bank of Australia may impose restrictions on certain financial transactions and require the consent of the Reserve Bank of Australia for the movement of funds into and out of Australia. No such restrictions are currently in place.
Remittances of any dividends, interest or other payments by BHP Billiton Limited to non-resident holders of BHP Billiton Limited’s securities are not restricted by exchange controls or other limitations, save that in certain circumstances, BHP Billiton may be required to withhold Australian taxes.
There are no limitations, either under the laws of Australia or under the Constitution of BHP Billiton Limited, on the right of non-residents to hold or vote BHP Billiton Limited ordinary shares other than as set out below.
The Australian Foreign Acquisitions and Takeovers Act 1975 (the FATA) restricts certain acquisitions of interests in shares in BHP Billiton. Generally, under the FATA, the prior approval of the Australian Treasurer must be obtained for proposals by a foreign person (either alone or together with associates) to acquire control of 15 per cent or more of the voting power or issued shares in BHP Billiton Limited.
The FATA also empowers the Treasurer to make certain orders prohibiting acquisitions by foreign persons in BHP Billiton Limited (and requiring divestiture if the acquisition has occurred) where he considers the acquisition to be contrary to the national interest and the 15 per cent threshold referred to above would be exceeded as a result. Such orders may also be made in respect of acquisitions by foreign persons where two or more foreign persons (and their associates) in aggregate already control 40 per cent or more of the issued shares or voting power in BHP Billiton Limited.
There are certain other statutory restrictions, and restrictions under BHP Billiton Limited’s Constitution and BHP Billiton Plc’s Articles of Association, that apply generally to acquisitions of shares in BHP Billiton (i.e. the restrictions are not targeted at foreign persons only). These include restrictions on a person (and associates) breaching a voting power threshold of:
20 per cent in relation to BHP Billiton Limited on a ‘stand-alone’ basis, i.e. calculated as if there were no Special Voting Share and only counting BHP Billiton Limited’s ordinary shares.
30 per cent of BHP Billiton Plc. This is the threshold for a mandatory offer under Rule 9 of the UK takeover code and this threshold applies to all voting rights of BHP Billiton Plc (therefore including voting rights attached to the BHP Billiton Plc Special Voting Share).
30 per cent in relation to BHP Billiton Plc on a ‘stand-alone’ basis, i.e. calculated as if there were no Special Voting Share and only counting BHP Billiton Plc’s ordinary shares.
20 per cent in relation to the BHP Billiton Group, calculated having regard to all the voting power on a joint electorate basis, i.e. calculated on the aggregate of BHP Billiton Limited’s and BHP Billiton Plc’s ordinary shares.
Under BHP Billiton Limited’s Constitution and BHP Billiton Plc’s Articles of Association, sanctions for breach of any of these thresholds, other than by means of certain ‘permitted acquisitions’, include withholding of dividends, voting restrictions and compulsory divestment of shares to the extent a shareholder and its associates exceed the relevant threshold.
2.8 Sustainability
Our BHP Billiton Charter value of Sustainability reflects our priority of putting health and safety first, being environmentally responsible and supporting our communities.
Our ability to operate globally is dependent upon gaining access to natural resources and maintaining our licence to operate. Sustainable development is core to our strategy; we integrate health, safety, environmental, social and economic factors into our key decision-making. The sustainability dimensions that we report on include the health and safety of our people; governance and risk management processes; how we contribute to improved standards of living and self-sustaining communities; our impact on the environment and approach to resource conservation and biodiversity; and how we ensure the broader economic contributions of our operations benefit the regions in which we operate.
The information contained in this section covers assets that have been wholly owned and operated by BHP Billiton or that have been operated by BHP Billiton in a joint venture operation (controlled assets) for FY2013. Additional information relating to our sustainability performance for FY2013 is available in our Sustainability Report 2013 and is available online atwww.bhpbilliton.com.
2.8.1 Governance and sustainability
The Sustainability Committee of the Board assists the Board in oversight of health, safety, environment and community (HSEC) matters. This includes overseeing areas relating to HSEC risk, compliance with applicable legal and regulatory requirements, and overall HSEC performance of the Group.
More specifically, management is accountable for the design and implementation of sustainability-related processes and performance necessary to comply with our suite of HSEC Group Level Documents (GLDs). GLDs describe the mandatory minimum performance requirements and accountabilities for definitive business obligations, processes, functions and activities across BHP Billiton. They are the foundation for developing and implementing management systems at our operations. Internal audits are required to be conducted annually to test compliance with the requirements of the HSEC GLDs. Audit results are used by management to create action
plans where the Businesses have not yet achieved full compliance with the GLD requirements. Key findings are reported to senior management; and summary reports are considered by the Sustainability Committee of the Board and, where appropriate, by the Risk and Audit Committee of the Board.
2.8.2 Identifying and managing our material risks
We identify risks we consider material to our organisation and take into consideration the potential health, safety, environmental, social, reputational, legal and financial impacts. The severity of any particular risk is assessed according to the degree of harm, injury or loss from the most severe impact associated with a specific risk. The objectives of the risk management process are to understand the nature and tolerance of the material risks for the Group and to ensure they are managed through the verification and effectiveness testing of critical controls. Information relating to the material risks for the Group, including sustainability risks, is available in section 1.7 in this Annual Report. Our risk management processes are consistent with the hierarchy of controls described in Article 6 of International Labour Organization Safety and Health in Mines Convention, 1995 (No. 176).
2.8.3 Identifying our sustainability issues
We identified the sustainability issues included in this Annual Report and the Sustainability Report 2013 through a three-step materiality process. Step one of the process identified issues by reviewing our internal risk registers, enquiries from our shareholders and investors and daily print media coverage. Step two involved rating the significance of these issues from our stakeholders’ perspective and the potential impact on our organisation as low, medium or high. The third step was to review the issues and seek feedback from key stakeholders. A number of material issues are discussed in the following sections:
Operating with integrity and conducting business transparently.
Keeping our people and operations safe.
Focusing on the health and wellbeing of our people.
Developing our people.
Climate change and energy.
Biodiversity and land management.
Water management.
Supporting and engaging with our communities.
Respecting human rights.
Making a positive contribution to society.
Informing our thinking through the Forum on Corporate Responsibility
Established in 1999, the Forum on Corporate Responsibility (the Forum) is an advisory body, comprising nine highly respected civil society leaders who engage with our executive team on the Group’s material sustainability issues. The Forum is a key component of our stakeholder engagement program, contributing significant insight into society’s current and future priorities and providing an opportunity to understand and debate issues from multiple viewpoints.
BHP Billiton representatives benefit from engaging directly with a group of civil society leaders who represent different perspectives on current and emerging sustainability issues. The Forum helps to ensure societal implications are understood and considered in important Company decisions.
Our Chief Executive Officer chairs the meetings, which were held twice during FY2013. Sustainability topics discussed in the past financial year included emerging global social and environmental trends; climate change scenarios and adaptation; issues facing Indigenous peoples, including free, prior and informed consent; sustainability reporting; and transparency.
2.8.4 Operating with integrity and conducting business transparently
Wherever we operate in the world, we strive to work with integrity – doing what is right and doing what we say we will do. We care as much about how results are achieved as we do about the results themselves. We believe that to maintain our position as one of the world’s leading companies, we must commit to high ethical business practices and governance standards in all our dealings. We strive to foster a culture that values and rewards exemplary ethical standards, personal and corporate integrity and respect for others.
Regardless of the country or culture within which our people work, ourAnti-corruption GLD and the BHP BillitonCode of Business Conduct prohibit bribery and corruption in all our business dealings. Particulars in relation to theCode of Business Conduct and anti-corruption are referred to in section 5.16 in this Annual Report. Specific discussion on legal proceedings is available in section 8 in this Annual Report.
Product Stewardship
As our primary activities are in the extraction (and, in some cases, processing) stages of a product’s life cycle, the majority of the life cycles of our products occur after the products have left our control. Through our membership of the International Council on Mining and Metals (ICMM), we commit to implementing the ICMM Sustainable Development Framework, which requires that we facilitate and encourage responsible design, use, reuse, recycling and disposal of our products along the supply chain. We recognise there is strong business merit in implementing product stewardship programs with other participants involved in the life cycles of our products.
In FY2013, we engaged in a number of product stewardship initiatives, related to the International Manganese Institute, Steel Stewardship Forum, International Aluminium Institute, and Australian Petroleum Production and Exploration Association. For other commodities, including copper and nickel, we participate in the stewardship programs also incorporated within their industry associations.
For uranium, we practice and follow the product stewardship principles established by the World Nuclear Association, of which we are a member. These principles include supporting the safe and peaceful use of nuclear technology and promoting sustainable development for the whole industry. Product stewardship activities involving BHP Billiton range from participation in national and international programs to the transparency of allowing customers to physically audit our HSEC activities.
A number of our coal operations have also participated in initiatives relevant to product stewardship, including consideration of international certifications, as well as internal and external audits, with a view to providing transparency of the HSEC activities undertaken by our operations.
Many of our products are required to have a specific safety data sheet (SDS). These SDSs outline the relevant health, safety and environmental aspects of our products and are available to customers and the transporters of our products.
Working with our contractors and suppliers
Our globally managed contractors and suppliers have requirements in their contracts consistent withOur Charter,Code of Business Conduct, theAnti-corruption GLD and HSEC GLDs. Additionally, in ourSupply ‘Source to Contract’ GLD, we specify that our suppliers align with our zero tolerance of a number of human rights infringements, including child labour, inhumane treatment of employees and forced or compulsory labour.
Contracted suppliers are categorised depending on their HSEC and business conduct risk and our level of commercial dependency. A procedure to engage with each supplier is developed appropriate to the level of risk.
Closure Planning
Closure planning is a key consideration in the planning and development of our projects and operations. Operations are required to maintain Closure Plans, which describe the proposed methods to rehabilitate and remediate following resource development and also address closure obligations. The Closure Plans provide the basis for estimating the closure costs and the associated accounting for closure and rehabilitation provisions. Detailed closure planning requirements, including the issues to be addressed, accuracy of cost estimates and risks to be assessed are described in ourCorporation Alignment Planning GLD. Information on our closure and rehabilitation provisions can be found in note 18, ‘Provisions’, to the Consolidated Financial Statements in this Annual Report. In addition to our projects and operating assets, we are also responsible for a number of legacy operations that are in various stages of decommissioning, rehabilitation or post-closure care and maintenance.
Transparently reporting our taxes
Through our membership of the ICMM, we support the Extractive Industries Transparency Initiative (EITI). The EITI is a global initiative to improve governance in resource-rich countries through the verification and full publication of company payments and government revenues from oil, gas and mining. We are committed to supporting and cooperating in the implementation of country-level EITI Work Plans as our host countries progress the initiative.
In line with our support for the EITI, we have reported in the Sustainability Report 2013 payments of taxes and royalties derived from resource developments on a country-by-country basis. We have presented the data as the taxes and royalties that we pay as BHP Billiton (such as corporate income taxes and royalties) and also those that we collect on behalf of employees.
2.8.5 Keeping our people and operations safe
The safety and health of our people is core to every aspect of our business. Having our people return home safe and well at the end of every working day and enabling them to end their working life fit and healthy are central to everything we do. This is reflected in the processes and controls we have in place throughout our organisation.
Our safety performance
We remain vigilant in our focus on material safety risks, ensuring we have the appropriate controls in place to address these risks and that our people are appropriately trained. During FY2013, we increased our focus on assessing the effectiveness of controls for material risks, which required us to assess whether the critical controls were being deployed as designed and to the standard required. To monitor the effectiveness of these critical controls, they are established and then tracked through business systems, such as 1SAP and internal audit processes. The ability to monitor the effectiveness of critical controls prior to a potential event occurring provides the organisation with a leading indicator for the control of these risks.
The FY2013 total recordable injury frequency (TRIF) performance of 4.6 per million hours worked improved by two per cent compared with 4.7 in FY2012. While we continue to see year-on-year improvement, we recognise that TRIF is principally an indicator in highlighting broad personal injury trends, and we are reminded by the three work-related fatalities suffered in FY2013 that lower injury rates alone will not prevent fatalities. It also reinforces our efforts to improve the identification and management of material HSEC risks.
Total recordable injury frequency
| | | | | | | | | | | | |
Year ended 30 June | | 2013 | | | 2012 | | | 2011 | |
Total recordable injury frequency (TRIF) | | | 4.6 | | | | 4.7 | | | | 5.0 | |
Managing our aviation risks
Aviation is a significant material safety risk, as we move over 450,000 people each year by chartered aircraft. We use two key assurance processes for the selection and use of contracted aircraft operators: the Basic Aviation Risk Standard (BARS) audit program managed by the Flight Safety Foundation (FSF) to verify design effectiveness and our own operational reviews to validate operating effectiveness, which are undertaken by our aviation specialists. The continued use of this approach, combined with the review of BHP Billiton and industry incidents, provides the basis for continued improvement of the control and management of our aviation risks.
After experiencing three pressurisation incidents since May 2011, we worked with the FSF and industry colleagues through the BARS program to increase industry standards. As an added control, pressurised aircraft are now required to adopt aural cabin pressure warnings (when available for the aircraft type) to help eliminate incidents related to pressurisation failure.
Responsibly undertaking deepwater drilling
Deepwater oil and gas exploration is an important aspect of our worldwide business. Our skilled drilling professionals use comprehensive and proven processes and systems to conduct deepwater drilling operations in a safe manner that complies with the regulations where we operate and our own strict requirements. We maintain common worldwide standards, cultivate a culture of continuous improvement and focus on reducing risk in all of our offshore oil and gas drilling operations.
2.8.6 Focusing on the health and wellbeing of our people
The acute and immediate nature of serious accidents can make them an obvious health and safety focus. However, the life-altering disabilities that can result from chronic exposure to health risks are equally serious. Health risks faced by our people include fatigue and occupational exposure to noise, silica, manganese, diesel exhaust particulate, fluorides, coal tar pitch, nickel and sulphuric acid mist. It is important that our people are fit for work; and we require our operations to have systems in place to minimise the risk of exposures, incidents and injuries. We are continuously working to reduce the potential for chronic exposure to health risks that can lead to life-altering disabilities.
Since FY2011, we have seen an increase in the reporting of musculoskeletal illnesses and a decrease in noise induced hearing loss (NIHL) case reporting. This change in reported cases has largely been driven by improved application of the United States Government Occupational Safety and Health Administration reporting guidelines.
Occupational illness incidence per 10,000 employees(1)
| | | | | | | | | | | | |
Year ended 30 June | | 2013 | | | 2012 | | | 2011 | |
Noise induced hearing loss (NIHL) | | | 10.2 | | | | 19.4 | | | | 20.7 | |
Musculoskeletal | | | 24.8 | | | | 20.7 | | | | 17.4 | |
Other illnesses | | | 12.9 | | | | 7.0 | | | | 5.4 | |
| | | | | | | | | | | | |
Total | | | 47.9 | | | | 47.1 | | | | 43.5 | |
| | | | | | | | | | | | |
(1) | From FY2013 onwards, incidence of occupational illness is calculated on the average number of employees. This has been applied retrospectively to prior reporting years. |
Managing our occupational exposures
Our priority is to control occupational exposures at their source, and we are focused on improving our occupational exposure controls to offer greater protection and further improve our performance. In those situations where we cannot control the source, a range of measures are employed, including the provision of
personal protective equipment (PPE) to safeguard our people. Operations are required to establish, understand and maintain an exposure risk profile to harmful agents for employees and contractors and to identify the need for exposure controls and medical surveillance programs. We establish our own occupational exposure limits (OELs) when we believe local regulatory limits do not provide adequate protection for workers’ health. If a potential exposure to harmful agents exceeds 50 per cent of the OEL, medical surveillance is required to be implemented to identify potential illness or health effects at an early stage and to provide feedback as to whether the exposure controls we have in place are functioning as designed.
In FY2013, we set a target to reduce potential occupational exposure to carcinogens and airborne contaminants by 10 per cent by FY2017. This reduction is for exposures that exceed our baseline occupational exposure limits if not for the use of PPE. In FY2013, we had a 5.7 per cent decrease in the number of potential exposures to carcinogens and airborne contaminants (data for the divested EKATI Diamond Mine Asset was not included). This decrease was driven by the successful implementation of exposure reduction initiatives at two of our coal operations. It was also influenced by a reduction in head count at our copper operations and by small reductions in exposures at our nickel operations in Australia. Exposures could therefore rise again if our head count increases or if the small changes in nickel exposure are not sustainable. The overall decrease in exposures was adversely impacted by an increase in dust exposures at our aluminium operations in South Africa primarily due to major maintenance work following an unplanned potline outage dating from the March 2012 quarter.
2.8.7 Developing our people
Employing and developing talented and motivated people who shareOur Charter values is critical to our long-term success. Each individual brings unique skills, experience and perspectives; and we recognise that we are strengthened by diversity. We are committed to providing a work environment in which everyone is treated fairly and with respect and has the opportunity to maximise their potential.
Recruitment is managed on a local basis by each area of our organisation, and employment is offered on merit. Every person applying for a job is evaluated according to their job-related skills, qualifications, abilities, aptitudes and alignment withOur Charter values. In some jurisdictions, targeted affirmative action through programs such as Indigenous employment and training and Black Economic Empowerment may be required to address historical imbalances and past discrimination.
Additional information relating to diversity, and employee policies and involvement at BHP Billiton is available in sections 5.17 and 7.8 in this Annual Report.
2.8.8 Climate change and energy
As a global organisation operating in an energy-intensive industry, we are actively managing risks associated with climate change, which are discussed in section 1.7 of this Annual Report.
Managing the potential impacts of climate change
Potential physical impacts of climate change on our operations may include changes in precipitation patterns, increased storm intensities and higher average temperatures, which may adversely affect the productivity and financial performance of our operations.
Regulations to control greenhouse gas (GHG) emissions can impact operational costs, particularly for more GHG-intensive assets, as well as impacting demand for fossil fuel products such as coal and gas. In the medium and long term, we are likely to see changes in the costs associated with our GHG-intensive assets as a result of regulatory requirements in a number of the countries where we operate, which may also have implications for our suppliers and customers. Inconsistency of regulations, particularly between developed and developing countries, could affect the investment attractiveness of assets in different jurisdictions.
Engaging in policy development
The issues associated with climate change continue to be a challenge for governments, communities and industries around the world; and it seems a global solution to climate change is some time away. Until then, nations are likely to continue to pursue their domestic GHG emissions reduction efforts to establish low-carbon economies, balancing their needs to ensure a reliable energy supply and sustainable economic growth.
We engage with policy makers on climate change policies in the key regions where we operate, including Australia, South Africa and South America. In FY2013, we engaged with Australian policy makers on the implementation of the Australian Government’s carbon price legislation.
Governments globally are considering a variety of legislative and regulatory options to mitigate GHG emissions. In our view, assessing these options requires an understanding of their likely effectiveness, scale and cost, as well as their implications for economic growth and quality of life. Our position is that any policy response should be broad-based and use a portfolio of complementary measures to deliver abatement. We believe the diversity of our portfolio, combined with actions focused on emissions abatement, will position us well to manage future policy developments. We have developed six principles to outline what we think any climate change policy should encompass to best tackle carbon emissions reduction: clear price signal; revenue neutral; trade friendly; broad-based; predictable and gradual; simple and effective.
We continue to hold the view that a price on carbon is just one of the potential policy measures that governments can adopt to address climate change. Independently, we maintain a Carbon Pricing Protocol, an internal mechanism for pricing carbon and determining carbon price impacts on our greenfield and brownfield developments and on mergers and acquisitions. Our Carbon Pricing Protocol is updated annually to reflect internal and external carbon price modelling and the proposed treatment of carbon permits in countries where we operate.
Reducing greenhouse gas emissions
We strive to continually improve energy and GHG management. At our operations where emissions exceed or are anticipated to exceed 50,000 tonnes of carbon dioxide equivalent (CO2-e) per annum, we require an Energy and GHG Management Plan to be implemented and maintained. In FY2013, over 90 per cent of our operations had emissions above this limit and they were required to identify, evaluate and implement energy efficiency and GHG-reduction projects.
We are committed to delivering emissions abatement opportunities and transparent public reporting of our emissions. In FY2013, we set an ambitious target to maintain our FY2017 GHG emissions below FY2006 baseline levels, while we continue to grow our business. The FY2006 baseline is adjusted for material acquisitions and divestments based on asset GHG emissions at the time of transaction. In order to achieve our target, we intend to focus on the continued implementation of identified abatement opportunities by our Businesses. Without this focus, we forecast that our absolute emissions would exceed the FY2006 baseline as a result of growth across our organisation.
In FY2013, our Scope 1 and 2 GHG emissions have increased by 6.5 million tonnes (Mt) to 46.7 Mt, predominantly due to increases across our Aluminium and Onshore US operations. Maintenance downtime due to torrential rain caused supply interruptions of hydropower to our Mozal aluminium smelter. This resulted in a GHG emissions increase of 3.6 Mt as the operation switched to coal-fired power supply. Continued development of the Onshore US unconventional oil and gas operations increased emissions by 1.3 Mt. We remain in line with our FY2017 target, with emissions lower than our FY2006 baseline. Of the assets that committed to implementing abatement projects in FY2013, 64 per cent did not achieve this due to resource and other constraints. This was partially offset by strong performance at three of our Copper operations, which exceeded their GHG abatement targets this year.
Supplying, accessing and efficiently using energy
Accessing a secure supply of energy is necessary for our continued growth. Many factors influence our ability to access energy, including increased global demand, issues related to local generation, transmission of power, and political and regulatory uncertainties. We are addressing these risks and securing energy supply through improving the energy efficiency of our operations, negotiating long-term contracts with energy providers and using diverse power sources.
Our total energy consumption was up 10.2 per cent on FY2012, largely driven by increased production at our Worsley and Onshore US operations. Within Australia, in compliance with the national Energy Efficiency Opportunities (EEO) Act 2006, we progressed a number of energy efficiency measures. The results of our participation in the EEO program for FY2013 will be available online in December 2013 atwww.bhpbilliton.com.
2.8.9 Biodiversity and land management
Securing access to land and managing it effectively are essential components of our commitment to operate in a responsible and sustainable manner. We depend upon biodiversity and the related benefits derived from ecosystems such as food, air and water.
Biodiversity, land and our organisation
We acknowledge the importance of preserving biodiversity and the challenge this presents to all land users. Host governments and communities are seeking a greater demonstration of effective land stewardship as a critical component in their decision to grant land access. Competition for land is growing, whether it is from mining, agriculture, forestry, water supply or biodiversity conservation. Consequently, this requires broader consideration of how we manage land use and biodiversity at our operations and how this is balanced with other societal needs. Obtaining community support is most challenging when there is strong competition for the use of the land, such as the competition between resource development and agriculture.
We draw on the resources of the World Database on Protected Areas to identify whether our operations are in or adjacent to protected areas. We also have explicit requirements in ourEnvironment GLD relating to areas of high environmental sensitivity and also in relation to threatened species. This GLD mandates the assessment, planning and management of the potential land and biodiversity impacts of our operations throughout their life cycle. Our operations are required to have Land and Biodiversity Management Plans that incorporate baseline and impact assessments, controls designed to mitigate impacts on biodiversity, land use and water resources, and monitoring programs to verify effectiveness of controls. Commonly described as a mitigation hierarchy, we aim to avoid land disturbance and, where this is not possible, to minimise our impacts, including rehabilitating land (both during operations and closure). Where unacceptable impacts remain, we look to undertake compensatory actions, such as biodiversity offsets.
Managing land access and rehabilitation
Our approach to land access is undertaken on a case-by-case basis and takes into account potential environmental, societal, economic or cultural impacts. We consider what land we need and seek to identify the uses of the land and the stakeholders who may be affected by our activities. We then look at our possible short-term and long-term impacts on that land, including the effects that our use may have on biodiversity, water resources, air and communities.
The rehabilitation of land no longer required for our activities continues to be a central part of our approach to managing our effects on land. We are required to rehabilitate disturbed areas consistent with the pre-disturbance land use or alternative land uses developed in consultation with stakeholders.
Enhancing biodiversity and contributing to conservation
In FY2013, we introduced new biodiversity and conservation targets. The first target focuses on a core business requirement to develop Land and Biodiversity Management Plans that include controls to prevent, minimise, rehabilitate and offset impacts to biodiversity and ecosystem services, which has been achieved by all our operations. We also introduced a new conservation target to finance the conservation and continuing management of areas of high biodiversity and ecosystem value that are of national and international conservation significance. To date, the Five Rivers Conservation Project, in Australia, and the Valdivian Coastal Reserve Conservation Project, in Chile, have been established.
2.8.10 Water management
The sustainability of our operations relies on our ability to obtain the appropriate quality and quantity of water and to use this resource responsibly.
Addressing water risks across our operations
The range of potential water-related risks and their possible impacts on water resources, biodiversity and communities makes managing water a complex task for our Businesses. Water risks and impacts experienced by our operations vary from region to region and from site to site, with some sites facing multiple and varying risks. Some are located in water scarce environments; others have to manage water excess, water quality or water discharge issues. At the same time, we anticipate climate change is likely to make the patterns and cycles of water flow less predictable, requiring our operations to have adaptive responses.
To address issues related to water availability and stakeholder expectations, our operations are required to develop a Water Management Plan. The plan takes into consideration the baseline quantity and quality of water potentially affected by our operations and requires the operation to quantify the acceptable level of impact to water resources, taking into account regulatory requirements and stakeholder expectations. Our operations also consider cumulative effects on water resources when multiple operations are active within a region. Preventive and mitigating controls necessary to achieve the acceptable level of impact are detailed in the plan, and each operation is required to implement a monitoring and review program that verifies the effectiveness of these controls.
To manage for potential risks, we set a target in FY2013 that required operations with water-related material risks, including volume and quality considerations, to set targets and to implement projects to reduce their impacts on water resources. This target recognises the local and regional context of water, and allows operations to annually review and define the necessary projects that will best address their material water risks. Our operations identified 80 projects that were expected to be completed during FY2013, of which 54 were implemented. The reasons projects were not implemented included a need to defer the project due to changing Business priorities, projects were found to not be viable after initial investigation or not likely to achieve the original benefits, or they were replaced with new projects to address the current needs of our Businesses.
Water reporting
Unlike the more established accounting approach to GHG emissions, there is no internationally consistent approach to water accounting and reporting. However, during FY2013, we aligned our water reporting across our global operations with the Minerals Council of Australia’s Water Accounting Framework. The framework aims to improve data integrity, allow more meaningful analysis on which to base policy-making and deliver improved outcomes for industry and communities. In adopting the Minerals Council of Australia Water Accounting Framework across our operations globally, we have refined the way we publicly report our water usage so as to incorporate water inputs by source and quality, and water output by quality and destination.
Managing waste
Mining and minerals processing operations produce large quantities of mineral waste, including waste rock, tailings and slag, which need to be effectively managed. Our operations are required to implement and maintain Waste Management Plans, which address waste minimisation, storage, transportation and disposal in a manner that controls the risk of adverse impacts on the environment and communities.
Tailings dams are operated, monitored and assessed to manage material risks, including the risk of failure. We are required to analyse mineral wastes and identify potential impacts arising from erosion, acid rock drainage, salinity, radioactivity and metal leaching. OurEnvironment GLD prohibits the disposal of tailings or waste rock into river or marine environments.
Safely managing our unconventional oil and gas resources
Following our entry into the onshore shale business in CY2011, we established our North America Shale Operating Principles to guide how we operate. Public concerns have been raised about risks related to hydraulic fracturing fluids, groundwater contamination, seismicity, land resources, GHG emissions and increased vehicular traffic. We work to understand these risks and what can be done to reduce or eliminate any potential impacts associated with our operations. Our North America Shale Operating Principles highlight our commitment to be the safest company in the industry; protect the land where we operate; safeguard and manage our water resources; minimise air emissions from our operations; and to be a good neighbour to our communities.
Producing gas from shale involves injecting water, sand and a small amount of chemicals under high pressure into the shale rock. This process is known as hydraulic fracturing. Typically, this occurs hundreds of metres below the water table, with protective rock between the groundwater aquifers and the shale gas formation. The hydraulic fracturing process enables hydrocarbons to be released into the wells, which are lined with protective steel casings and cemented across the groundwater intervals and water-producing formations to form continuous barriers between the well and any groundwater.
We do not drill or conduct hydraulic fracturing operations in an area without having confidence that water resources are protected. Our goal is to minimise our impact on surface water and groundwater and protect local resources. We have introduced an initiative to reduce water usage across our operations and are evaluating technologies to improve the re-use and recycling of water.
The water produced from the wells, including the hydraulic fracturing fluids, is disposed of in accordance with applicable oil and gas industry regulations and BHP Billiton operating standards. The composition of hydraulic fracturing fluids, including chemicals, is publicly disclosed in the hydraulic fracturing Chemical Disclosure Registry, FracFocus (www.fracfocus.org).
2.8.11 Supporting and engaging with our communities
With operations across the globe, we interact with a wide range of stakeholders who represent our host communities, regions and nations. We take their views and concerns into account in our decision-making and always strive for mutually beneficial outcomes.
We define stakeholders as those who are potentially affected by our operations or who have an interest in or influence what we do. Our operations are required to establish platforms for dialogue and to consider stakeholder expectations and concerns for activities throughout the life cycle of an operation.
Effectively engaging with communities
We seek to build trust with stakeholders at the earliest possible stage of a project’s life. OurCommunity GLD requires that a Stakeholder Engagement Management Plan be in place from the development phase of a project and be reviewed annually. The plans identify the interests and relationships of stakeholders and contain a range of culturally and socially inclusive engagement activities to encourage open communication.
Engagement activities vary from monthly meetings to open public forums, with topics ranging from town amenity and housing to impacts of growth and expansion projects, contractor management, security, cultural issues and socio-economic development. Our responses to concerns or complaints are recorded, as are any commitments we may make.
Our operations are required to measure the effectiveness of their stakeholder engagement by conducting community perception surveys every three years. These surveys provide a valuable external perspective on the quality of our engagement and whether our stakeholders believe we are effectively addressing the key concerns of their communities.
Addressing community concerns
Our operations are required to have local processes to accept, assess and resolve community concerns, complaints and grievances about the performance or behaviour of BHP Billiton and our people. The processes reflect the country context and associated risks and are transparent, culturally appropriate and readily accessible to all segments of the community. As part of the resolution process, all complaints and grievances are required to be acknowledged, documented and investigated internally. As required, appropriate actions are implemented and complainants are advised of the outcome.
Free Prior and Informed Consent
We have worked with the ICMM to develop a progressive position statement on Indigenous Peoples and Mining. This statement, which comes into effect in May 2015, specifically addresses the issue of Free Prior and Informed Consent (FPIC). As a member of ICMM, we will work to incorporate these elements in our internal standards, engage with government and potentially impacted Indigenous peoples and endeavour to obtain the relevant consent for our new projects in accordance with the statement.
The statement describes FPIC as a process based on good faith negotiation through which Indigenous peoples can give or withhold their consent using processes consistent with their traditional decision-making practices. Supporting commitments address understanding their rights and interests, building cross-cultural understanding, and agreeing on appropriate engagement processes and participation in decision-making.
A number of related commitments address how ICMM members should engage where government is responsible for managing Indigenous peoples’ interests and how to move forward when differences of opinion arise. The ICMM’s position recognises the right of governments to ultimately make decisions on development of resources and that, in most countries, neither Indigenous peoples nor other groups have a right to veto projects. Where consent cannot be reached, a host government may decide to proceed with a project after balancing the rights and interests of Indigenous peoples with the wider population. In these circumstances, it will be up to ICMM member companies to determine whether they remain involved with the project.
Acknowledging customary rights
At a very early stage in a project, we seek to identify landowners, occupiers and users who may be affected by our activities. Knowing who is connected to and uses the land is critical to establishing an effective community consultation and engagement program. It helps to ensure people potentially affected by our operations are fully aware of our activities and have an opportunity to express their concerns and aspirations. Arising from this engagement, the operational work plan may be amended to reduce potential impacts on landowners and users.
Surveys are commissioned to identify the customary owners and how the land is being used to ensure these uses are taken into account in our development plans. In instances where land may be used for customary purposes and no formal land title has been issued, information is requested from relevant organisations, including government authorities with responsibilities for customary land uses and Indigenous people’s representative organisations, such as land and tribal councils. Further enquiries are also made directly with the people in the area to help identify those with connections to the land.
2.8.12 Respecting human rights
We have a responsibility to understand our potential impacts on human rights and to mitigate or eliminate them. We are committed to operating in accordance with the United Nations (UN) Universal Declaration of Human Rights, UN Guiding Principles on Business and Human Rights and the UN Global Compact Principles,Our Charterand Code of Business Conduct, and the performance requirements detailed in our GLDs support this commitment.
Our human rights due diligence process
Our human rights due diligence process requires our operations to identify and document key potential human rights risks by completing a human rights impact assessment (HRIA). We require each HRIA to be verified and validated through an engagement process with stakeholders, and by a qualified specialist every three years and must be internally reviewed on an annual basis. Where a HRIA identifies a material risk, we require that a Human Rights Management Plan be developed and implemented. Selected employees and contractors receive training on how to comply with BHP Billiton’s human rights commitments.
Security and country risk
OurSecurity and Emergency Management GLD requires all our operations to identify security-related material risks to our people and property and engage relevant stakeholders to develop and manage security programs that respect human rights and fundamental freedoms. The nature and global reach of our organisation can result in our people working in countries where there is potential exposure to personal and business risk. We require an assessment of each country for the degree of risk associated with visiting, exploring and operating within it; and appropriate controls are developed to mitigate identified risks. The Voluntary Principles on Security and Human Rights (VPs) assist organisations to maintain the safety and security of their operations through the provision of an operating framework.
We use both public and private security providers to protect our people and assets. OurSecurity and Emergency Management GLD requires private security providers engaged by BHP Billiton to be signatories to, or agree in writing to align with, the International Code of Conduct for Private Security Providers. In addition to this, written advice is given to security providers outlining our commitment to the VPs and our expectations. Occasionally, it is necessary to provide armed security protection for the safety of our people. Firearms are only deployed under a set of approved rules of engagement and when it can be demonstrated that no other options exist to protect a human life, to carry out stewardship requirements (such as injured livestock management) or as a means of last resort when threatened by dangerous wildlife. Criteria for the use of firearms and rules of engagement must comply with the International Association of Oil and Gas Producers, ‘Firearms and the Use of Force’ (Report number 320, Revision 2).
2.8.13 Making a positive contribution to society
We believe we have an economic and social responsibility to make a positive contribution to the development of communities, regions and countries where we operate.
Our broad socio-economic contribution
At a Group level, we are an active participant in industry and sustainable development forums, such as the ICMM. We seek to understand our socio-economic impact on local communities and host regions through our participation in the ICMM’s Mining: Partnerships for Development initiative. This global initiative builds on the ICMM’s Resource Endowment initiative and seeks to enhance mining’s contribution to development and poverty reduction through multi-stakeholder partnerships.
We engage with governments on a range of policy issues and also play a role in advocating transparent and ethical governance, through our own actions and in discussion with opinion leaders. Nationally and regionally, we contribute taxes and royalties to governments that in turn provide infrastructure and services to their constituents. Additionally, we often develop infrastructure that provides local communities and businesses with benefits such as airports, roads, community childcare centres and medical clinics.
Training and employing local people is important to us. However, our ability to have a significant impact on unemployment is limited by the nature of our operations, as typically we require highly skilled people with relevant industry and technical experience. We make a broader economic contribution through indirect employment, where we focus on building the capacity of local businesses to provide us with a diverse range of services and products. In FY2013, 63 per cent of our Group spend was with local and regional suppliers. Local and regional spend, in this context, refers to spend within the communities in which we operate and the regions, such as states and provinces, where our operations are located.
We voluntarily invest one per cent of our pre-tax profit, calculated on the average of the previous three years’ pre-tax profit, in community programs that aim to have a long-lasting positive impact on people’s quality of life. This includes implementing new and supporting existing community projects.
Investing in the community
Our community development programs are focused on improving the quality of life for people in our host communities. Each community development project is required to be linked to a Community Development Management Plan. The plans are developed in consultation with local stakeholders and formulated from data gathered from an impacts and opportunities assessment and a social baseline study that identifies key quality-of-life indicators. We will monitor progress by tracking changes against these indicators every three years.
Community development projects are selected on the basis of their capacity to have a positive impact on quality-of-life indicators for the relevant community and to support the Group’s licence to operate. Projects are required to have documented objectives specifically linked to the achievement of long-term, sustainable outcomes and improvements in indicators identified in the social baseline study. Prior to approval, community projects are required to be assessed in relation to anti-corruption requirements, and are implemented in accordance with ourCode of Business Conduct.
During FY2013, our voluntary community investment totalled US$245.8 million, comprising US$121 million cash, US$18.8 million for in-kind support and administrative costs and a US$106 million contribution to the BHP Billiton Foundation. The BHP Billiton Foundation was established in FY2013 to identify and support large sustainable development projects in countries and regions of interest to BHP Billiton to complement the local programs managed by our assets. This builds on contributions that have previously been made to the BHP Billiton Sustainable Communities charitable organisation in the United Kingdom. During FY2013, BHP Billiton Sustainable Communities’ expenditure was US$17 million, which included major projects, support for disaster relief efforts and donations to not-for-profit organisations as part of the Company’s Matched Giving Program. At the end of June 2013, BHP Billiton Sustainable Communities and the BHP Billiton Foundation had a total of US$277.4 million in funds available for future sustainable development projects.
Community investment
| | | | | | | | | | | | |
Year ended 30 June | | 2013 | | | 2012 | | | 2011 | |
Community investment (US$M)(1) | | | 245.8 | | | | 214.1 | | | | 195.5 | |
(1) | The expenditure represents BHP Billiton’s equity share for both operated and non-operated joint venture operations. |
The US$121 million cash component of our investment supported: community programs; the Group’s charitable foundations (excluding the BHP Billiton Foundation); and the enterprise and socio-economic development components of our broad-based Black Economic Empowerment programs in South Africa. Of the US$121 million in cash expenditure during FY2013, 37 per cent was invested in local communities; 41 per cent was invested regionally and the remaining 22 per cent was invested in national or international programs in countries where we operate.
Supporting employee contributions through matched giving
In addition to the social programs directly supported by the Group, many of our employees make a valuable contribution to their local communities by giving donations and their personal time and expertise to a range of activities. One of the most significant ways we support the efforts of our employees engaged in community activities is through our global Matched Giving Program, whereby employee volunteering hours and donation contributions are matched. The program aims to strengthen local communities by supporting and encouraging employees who volunteer or donate to not-for-profit organisations. In FY2013, more than 5,700 employees participated in the Matched Giving Program, volunteering a total of approximately 56,800 hours of their own time to community activities important to them. Employee contributions benefited more than 1,500 not-for-profit organisations, which received US$7.5 million as part of the program.
2.9 Employees
People are the foundation of our organisation and underpin our success. We value our people and encourage the development of talented and motivated employees to support the continued performance and growth of our diverse operations. We strive to build a sense of purpose and achievement among all our people in the work we do.
By working toOur Charter we align our people around our common purpose and values. We all useOur Charter as a vital reference point for how we do business, wherever we are in the world, and whatever work we do.
Our organisation is structured in three component parts: our five core Businesses (as of 10 May 2013), Group Functions and Marketing – each part of the organisation has a clear mandate that sets out the scope of responsibilities and accountabilities.
The average number of employees and contractors over the last three financial years is as follows:
| | | | | | | | | | | | |
Year ended 30 June | | 2013 | | | 2012 | | | 2011 | |
Employees | | | 49,496 | | | | 46,370 | | | | 40,757 | |
Contractors | | | 79,330 | | | | 78,813 | | | | 64,548 | |
| | | | | | | | | | | | |
Total | | | 128,826 | | | | 125,183 | | | | 105,305 | |
| | | | | | | | | | | | |
The percentages of females in our workforce and of our senior leaders are as follows: | |
Year ended 30 June | | 2013 | | | 2012 | | | 2011 | |
Female employees | | | 17 | % | | | 17 | % | | | 16 | % |
Senior leaders | | | 366 | | | | 406 | | | | 364 | |
Female senior leaders | | | 11 | % | | | 10 | % | | | 10 | % |
For further information about our employees and our approach to diversity, refer to sections 2.8.7, 5.17 and 7.8 of this Annual Report.
The table below provides a breakdown of the average number of employees, in accordance with our International Financial Reporting Standards (IFRS) reporting requirements, which includes our proportionate share of jointly
controlled entities’ employees, the Executive Director and 100 per cent of employees of subsidiary companies, by Business for each of the past three financial years. Part-time employees are included on a full-time equivalent basis. Employees of businesses acquired or disposed of during a particular year are included for the period of ownership. Contractors are not included in the figures below.
| | | | | | | | | | | | |
Year ended 30 June | | 2013 | | | 2012 | | | 2011 | |
Petroleum and Potash | | | 3,838 | | | | 3,273 | | | | 2,430 | |
Copper | | | 9,648 | | | | 8,775 | | | | 7,602 | |
Iron Ore | | | 8,140 | | | | 5,784 | | | | 4,047 | |
Coal | | | 14,225 | | | | 13,512 | | | | 12,771 | |
Aluminium, Manganese and Nickel | | | 11,115 | | | | 11,388 | | | | 10,437 | |
Group and unallocated | | | 2,530 | | | | 3,638 | | | | 3,470 | |
| | | | | | | | | | | | |
Total | | | 49,496 | | | | 46,370 | | | | 40,757 | |
| | | | | | | | | | | | |
The increase in employees during FY2013 is primarily due to the increase in Iron Ore as a result of the expansion of Jimblebar. For further information regarding the expansion of Jimblebar, refer to section 2.2.3 of this Annual Report.
The table below provides a breakdown of our average number of employees by geographic location for each of the past three financial years.
| | | | | | | | | | | | |
Year ended 30 June | | 2013 | | | 2012 | | | 2011 | |
Africa | | | 9,280 | | | | 10,311 | | | | 10,061 | |
Asia | | | 1,183 | | | | 1,114 | | | | 970 | |
Australasia | | | 21,953 | | | | 19,330 | | | | 16,222 | |
Europe | | | 289 | | | | 532 | | | | 560 | |
North America | | | 5,158 | | | | 4,166 | | | | 3,168 | |
South America | | | 11,633 | | | | 10,917 | | | | 9,776 | |
| | | | | | | | | | | | |
Total | | | 49,496 | | | | 46,370 | | | | 40,757 | |
| | | | | | | | | | | | |
2.10 Organisational structure
2.10.1 General
The BHP Billiton Group consists of the BHP Billiton Limited Group and the BHP Billiton Plc Group as a combined enterprise, following the completion of the DLC merger in June 2001. Refer to note 26 ‘Subsidiaries’ to the financial statements for a list of BHP Billiton Limited and BHP Billiton Plc significant subsidiaries.
The BHP Billiton DLC merger was designed to place shareholders of both companies in a position where they effectively have an interest in a single group that combines the assets, and is subject to the liabilities, of both companies. BHP Billiton Limited and BHP Billiton Plc have each retained their separate corporate identities and maintain separate stock exchange listings, but they are operated and managed as if they are a single unified economic entity, with their boards and senior executive management comprising the same people.
2.10.2 DLC structure
The principles of the BHP Billiton DLC are reflected in the BHP Billiton Sharing Agreement and include the following:
the two companies are to operate as if they are a single unified economic entity, through Boards of Directors that comprise the same individuals and a unified senior executive management;
the Directors of both companies will, in addition to their duties to the company concerned, have regard to the interests of BHP Billiton Limited shareholders and BHP Billiton Plc shareholders as if the two companies were a single unified economic entity and, for that purpose, the Directors of each company take into account in the exercise of their powers the interests of the shareholders of the other;
certain DLC equalisation principles must be observed. These are designed to ensure that for so long as the Equalisation Ratio between a BHP Billiton Limited share and a BHP Billiton Plc share is 1:1, the economic and voting interests in the combined BHP Billiton Group resulting from the holding of one BHP Billiton Limited share are equivalent to that resulting from one BHP Billiton Plc share. Further details are set out in the sub-section ‘Equalisation of economic and voting rights’ below.
Additional documents that affect the DLC include:
BHP Billiton Limited Constitution
BHP Billiton Plc Articles of Association
BHP Billiton Special Voting Shares Deed
BHP Billiton Limited Deed Poll Guarantee
BHP Billiton Plc Deed Poll Guarantee.
Australian Foreign Investment Review Board (FIRB) conditions
The Treasurer of Australia approved the DLC merger subject to certain conditions, the effect of which was to require that, among other things, BHP Billiton Limited continues to:
be an Australian company, which is managed from Australia;
ultimately manage and control the companies conducting the business that was conducted by it at the time of the merger for as long as those businesses form part of the BHP Billiton Group.
The conditions have effect indefinitely, subject to amendment of the Australian Foreign Acquisitions and Takeovers Act 1975 or any revocation or amendment by the Treasurer of Australia. If BHP Billiton Limited no longer wishes to comply with these conditions, it must obtain the prior approval of the Treasurer. Failure to comply with the conditions attracts substantial penalties under the Foreign Acquisitions and Takeovers Act 1975.
Equalisation of economic and voting rights
BHP Billiton Limited shareholders and BHP Billiton Plc shareholders have economic and voting interests in the combined BHP Billiton Group. The economic and voting interests represented by a share in one company relative to the economic and voting interests of a share in the other company are determined by reference to a ratio known as the Equalisation Ratio. Presently, the economic and voting interests attached to each BHP Billiton Limited share and each BHP Billiton Plc share are the same, since the Equalisation Ratio is 1:1. The Equalisation Ratio would change if either BHP Billiton Limited or BHP Billiton Plc returned value to only its shareholders and no matching action was taken.
This means that the amount of any cash dividend paid by BHP Billiton Limited in respect of each BHP Billiton Limited share is normally matched by an equivalent cash dividend by BHP Billiton Plc in respect of each BHP Billiton Plc share, and vice versa. If one company has insufficient profits or is otherwise unable to pay the agreed dividend, BHP Billiton Limited and BHP Billiton Plc will, as far as practicable, enter into such transactions as are necessary to enable both companies to pay the agreed amount of pre-tax dividends per share.
Joint Electorate Actions
Under the terms of the DLC agreements, the BHP Billiton Limited Constitution and the BHP Billiton Plc Articles of Association have implemented special voting arrangements so that the shareholders of both companies vote
together as a single decision-making body on matters affecting the shareholders of each company in similar ways (such matters are referred to as Joint Electorate Actions). For so long as the Equalisation Ratio remains 1:1, each BHP Billiton Limited share will effectively have the same voting rights as each BHP Billiton Plc share on Joint Electorate Actions.
A Joint Electorate Action requires approval by ordinary resolution (or special resolution if required by statute, regulation, applicable listing rules or other applicable requirements) of BHP Billiton Limited and also of BHP Billiton Plc. Both the BHP Billiton Limited ordinary shareholders and the holder of the BHP Billiton Limited Special Voting Share vote as a single class and, in the case of BHP Billiton Plc, the BHP Billiton Plc ordinary shareholders and the holder of the BHP Billiton Plc Special Voting Share vote as a single class.
Class Rights Actions
In the case of certain actions in relation to which the two bodies of shareholders may have divergent interests (referred to as Class Rights Actions), the company wishing to carry out the Class Rights Action requires the prior approval of the shareholders in the other company voting separately and, where appropriate, the approval of its own shareholders voting separately. Depending on the type of Class Rights Action undertaken, the approval required is either an ordinary or special resolution of the relevant company.
These voting arrangements are secured through the constitutional documents of the two companies, the BHP Billiton Sharing Agreement, the BHP Billiton Special Voting Shares Deed and rights attaching to a specially created Special Voting Share issued by each company and held in each case by a Special Voting Company. The shares in the Special Voting Companies are held legally and beneficially by Law Debenture Trust Corporation Plc.
Cross guarantees
BHP Billiton Limited and BHP Billiton Plc have each executed a Deed Poll Guarantee, pursuant to which creditors entitled to the benefit of the BHP Billiton Limited Deed Poll Guarantee and the BHP Billiton Plc Deed Poll Guarantee will, to the extent possible, be placed in the same position as if the relevant debts were owed by both BHP Billiton Limited and BHP Billiton Plc on a combined basis.
Restrictions on takeovers of one company only
The BHP Billiton Limited Constitution and the BHP Billiton Plc Articles of Association have been drafted to ensure that, except with the consent of the Board, a person cannot gain control of one company without having made an equivalent offer to the shareholders of both companies on equivalent terms. Sanctions for breach of these provisions would include withholding of dividends, voting restrictions and the compulsory divestment of shares to the extent a shareholder and its associates exceed the relevant threshold.
2.11 Material contracts
DLC agreements
On 29 June 2001, BHP Billiton Limited (then known as BHP Limited) and BHP Billiton Plc (then known as Billiton Plc) merged by way of a DLC structure. To effect the DLC, BHP Limited and Billiton Plc (as they were then known) entered into the following agreements designed to place the shareholders of both companies in a position where they effectively have an interest in a single group that combines the assets, and is subject to all the liabilities, of both companies:
BHP Billiton Sharing Agreement
BHP Billiton Special Voting Shares Deed
BHP Billiton Limited Deed Poll Guarantee
BHP Billiton Plc Deed Poll Guarantee.
The effect of each of these agreements and the manner in which they operate are described in section 2.10 of this Annual Report.
2.12 Constitution
The following text summarises the Constitution of BHP Billiton Limited and the Articles of Association of BHP Billiton Plc. The effect of the Constitution of BHP Billiton Limited and the Articles of Association of BHP Billiton Plc is, so far as possible, identical. Where the term ‘BHP Billiton’ is used in this description of the Constitution and Articles of Association, it can be read to mean either BHP Billiton Limited or BHP Billiton Plc.
Certain provisions of the Constitution of BHP Billiton Limited and the Articles of Association of BHP Billiton Plc can only be amended where such amendment is approved by special resolution either:
by approval as a Class Rights Action, where the amendment results in a change to an ‘Entrenched Provision’; or
otherwise, as a Joint Electorate Action.
A description of Joint Electorate Actions and Class Rights Actions is contained under the heading ‘Equalisation of economic and voting rights’ in section 2.10.2 of this Annual Report.
2.12.1 Directors
The management and control of the business and affairs of BHP Billiton are vested in the Board of Directors, which may exercise all powers of BHP Billiton, other than those which are required to be exercised or done by BHP Billiton in a general meeting.
2.12.2 Power to issue securities
BHP Billiton may, pursuant to the Constitution and Articles of Association, issue any shares or other securities (including redeemable shares) with preferred, deferred or other special rights, obligations or restrictions as and when the Directors may determine and on any other terms the Directors consider appropriate, provided that:
any such issue does not affect any special rights conferred on the holders of any shares;
any such issue is subject to the provisions regarding shareholder approval in the Constitution and Articles of Association;
the rights attaching to a class other than ordinary shares are expressed at the date of issue.
2.12.3 Restrictions on voting by Directors
A Director may not vote in respect of any contract or arrangement or any other proposal in which he or she has a material personal interest. A Director shall not be counted in the quorum at a meeting in relation to any resolution on which he or she is not entitled to vote.
In addition, under the UK Companies Act 2006, a Director has a duty to avoid a situation in which he or she has (or can have) a direct or indirect interest that conflicts (or may conflict) with the interests of the company. The duty is not infringed, if among other things, the situation is authorised by non-interested Directors. The Articles of Association of BHP Billiton Plc enable the Board to authorise a matter that might otherwise involve a Director breaching his or her duty to avoid conflicts of interest. An interested Director may not vote or be counted towards a quorum for a resolution authorising such a situation. Where the Board gives such authorisation, the Board may prohibit, or may establish regulations which prohibit, the relevant Director from voting on any matter relating to the conflict. The Board has adopted procedures to manage these voting restrictions.
Subject to applicable laws, a Director is entitled to vote, and be counted in the quorum, in respect of any resolution concerning any of the following matters, namely where the material personal interest:
arises because the Director is a shareholder of BHP Billiton and is held in common with the other shareholders of BHP Billiton;
arises in relation to the Director’s remuneration as a Director of BHP Billiton;
relates to a contract BHP Billiton is proposing to enter into that is subject to approval by the shareholders and will not impose any obligation on BHP Billiton if it is not approved by the shareholders;
arises merely because the Director is a guarantor or has given an indemnity or security for all or part of a loan, or proposed loan, to BHP Billiton;
arises merely because the Director has a right of subrogation in relation to a guarantee or indemnity referred to above;
relates to a contract that insures, or would insure, the Director against liabilities the Director incurs as an officer of BHP Billiton, but only if the contract does not make BHP Billiton or a related body corporate the insurer;
relates to any payment by BHP Billiton or a related body corporate in respect of an indemnity permitted by law, or any contract relating to such an indemnity; or
is in a contract, or proposed contract with, or for the benefit of, or on behalf of, a related body corporate and arises merely because the Director is a director of a related body corporate.
2.12.4 Loans by Directors
Any Director may lend money to BHP Billiton at interest with or without security or may, for a commission or profit, guarantee the repayment of any money borrowed by BHP Billiton and underwrite or guarantee the subscription of shares or securities of BHP Billiton or of any corporation in which BHP Billiton may be interested without being disqualified as a Director and without being liable to account to BHP Billiton for any commission or profit.
2.12.5 Retirement of Directors
In 2011, the Board adopted a policy consistent with the UK Corporate Governance Code, under which all Directors must, if they wish to remain on the Board, seek re-election by shareholders annually. This policy took effect at the 2011 Annual General Meetings, and replaced the previous system, as set out in the Constitution and Articles of Association, under which Directors were required to submit themselves to shareholders for re-election at least every three years.
2.12.6 Rights attaching to shares
Dividend rights
Under English law, dividends on shares may only be paid out of profits available for distribution. Under Australian law, dividends on shares may only be paid out of net assets, provided that the payment is fair and reasonable to the company’s shareholders as a whole and the payment of the dividend does not materially prejudice the company’s ability to pay its creditors. The Constitution and Articles of Association provide that payment of any dividend may be made in any manner, by any means and in any currency determined by the Board.
All unclaimed dividends may be invested or otherwise used by the Board for the benefit of whichever of BHP Billiton Limited or BHP Billiton Plc declared that dividend, until claimed or, in the case of BHP Billiton Limited, otherwise disposed of according to law. In the case of BHP Billiton Plc, any dividend unclaimed after a period of 12 years from the date on which such dividend was declared or became due for payment shall be forfeited and shall revert to BHP Billiton Plc.
Voting rights
Voting at any general meeting of BHP Billiton Limited shareholders can, in the first instance, be conducted by a show of hands unless a poll is demanded by any of the following (except in relation to the election of a chairman of a meeting or, unless the Chairman otherwise determines, the adjournment of a meeting), or is otherwise required (as outlined below):
the Chairman;
any shareholder under the law; or
the holder of the BHP Billiton Limited Special Voting Share.
Voting at any general meeting of BHP Billiton Plc can, in the first instance, be conducted by a show of hands unless a poll is demanded by any of the following, (except in relation to the election of a chairman of a meeting or, unless the Chairman otherwise determines, the adjournment of a meeting), or is otherwise required (as outlined below):
the Chairman;
not less than five members present in person or by proxy and entitled to vote;
a member or members present in person or by proxy and representing not less than five per cent of the total voting rights of all the members having the right to vote at the meeting; or
the holder of the BHP Billiton Plc Special Voting Share.
As described under the heading ‘Equalisation of economic and voting rights’ in section 2.10.2 of this Annual Report, certain matters may be decided as Joint Electorate Actions or Class Rights Actions. Any matter considered by shareholders at an Annual General Meeting of BHP Billiton Limited or BHP Billiton Plc constitutes a Joint Electorate Action and shall therefore be decided on a poll. Therefore, in practice, generally all items of business at Annual General Meetings proceed directly to poll.
In addition, at any general meeting a resolution, other than a procedural resolution, put to the vote of the meeting on which the holder of the relevant BHP Billiton Special Voting Share is entitled to vote shall be decided on a poll.
For the purposes of determining which shareholders are entitled to attend or vote at a meeting of BHP Billiton Plc or BHP Billiton Limited, and how many votes such shareholder may cast, the relevant company will specify in any notice of meeting a time, not more than 48 hours before the time fixed for the meeting, by which a shareholder must be entered on the Register of Shareholders in order to have the right to attend or vote at the relevant meeting.
Shareholders who wish to appoint a proxy to attend, vote or speak at a meeting of BHP Billiton Plc or BHP Billiton Limited (as appropriate) on their behalf, must deposit the relevant form appointing a proxy in accordance with the instructions contained in any notice of meeting, so as to be received in the specified manner not less than 48 hours before the time appointed for holding the meeting to which the appointment of a proxy relates.
Rights to share in BHP Billiton Limited’s profits
The rights attached to the shares of BHP Billiton Limited, as regards the participation in the profits available for distribution, are as follows:
The holders of any preference shares shall be entitled, in priority to any payment of dividend to the holders of any other class of shares, to a preferred right to participate as regards dividends up to but not beyond a specified amount in distribution.
Subject to the special rights attaching to any preference shares, but in priority to any payment of dividends on all other classes of shares, the holder of the Equalisation Share (if any) shall be entitled to be paid such dividends as are declared or paid thereon.
Any surplus remaining after payment of the distributions above shall be payable to the holders of BHP Billiton Limited ordinary shares and the BHP Billiton Limited Special Voting Share in equal amounts per share.
Rights to share in BHP Billiton Plc’s profits
The rights attached to the shares of BHP Billiton Plc, in relation to the participation in the profits available for distribution, are as follows:
The holders of the cumulative preference shares shall be entitled, in priority to any payment of dividend to the holders of any other class of shares, to be paid a fixed cumulative preferential dividend (Preferential Dividend) at a rate of 5.5 per cent per annum, to be paid annually in arrears on 31 July in each year or, if any such date shall be a Saturday, Sunday or public holiday in England, on the first business day following such date in each year. Payments of Preferential Dividends shall be made to holders on the register at any date selected by the Directors up to 42 days prior to the relevant fixed dividend date.
Subject to the rights attaching to the cumulative preference shares, but in priority to any payment of dividends on all other classes of shares, the holder of the BHP Billiton Plc Special Voting Share shall be entitled to be paid a fixed dividend of US$0.01 per annum, payable annually in arrears on 31 July.
Subject to the rights attaching to the cumulative preference shares and the BHP Billiton Plc Special Voting Share, but in priority to any payment of dividends on all other classes of shares, the holder of the Equalisation Share shall be entitled to be paid such dividends as the Board may decide to pay thereon.
Any surplus remaining after payment of the distributions above shall be payable to the holders of the BHP Billiton Plc ordinary shares in equal amounts per BHP Billiton Plc ordinary share.
2.12.7 Right on a return of assets on liquidation
On a return of assets on liquidation of BHP Billiton Limited, the assets of BHP Billiton Limited remaining available for distribution among shareholders, after giving effect to the payment of all prior ranking amounts owed to all creditors and holders of preference shares, and to all prior ranking statutory entitlements, shall be applied in paying to the holders of the BHP Billiton Limited Special Voting Share and the Equalisation Share (if any) an amount of up to A$2.00 on each such share, on an equal priority with any amount paid to the holders of BHP Billiton Limited ordinary shares, and any surplus remaining shall be applied in making payments solely to the holders of BHP Billiton Limited ordinary shares in accordance with their entitlements.
On a return of assets on liquidation of BHP Billiton Plc, subject to the payment of all prior ranking amounts owed to the creditors of BHP Billiton Plc and to all prior ranking statutory entitlements, the assets of BHP Billiton Plc to be distributed on a winding up shall be distributed to the holders of shares in the following order of priority:
To the holders of the cumulative preference shares, the repayment of a sum equal to the nominal capital paid up or credited as paid up on the cumulative preference shares held by them and accrual, if any, of the Preferential Dividend, whether such dividend has been earned or declared or not, calculated up to the date of commencement of the winding-up.
To the holders of the BHP Billiton Plc ordinary shares and to the holders of the BHP Billiton Plc Special Voting Share and the Equalisation Share, the payment out of surplus, if any, remaining after the distribution above of an equal amount for each BHP Billiton Plc ordinary share, the BHP Billiton Plc Special Voting Share and the Equalisation Share, if issued, subject to a maximum in the case of the BHP Billiton Plc Special Voting Share and the Equalisation Share of the nominal capital paid up on such shares.
2.12.8 Redemption of preference shares
If BHP Billiton Limited at any time proposes to create and issue any preference shares, the preference shares may be issued on the terms that they are to be redeemed or, at the option of either or both BHP Billiton Limited and the holder, are liable to be redeemed, whether out of share capital, profits or otherwise.
The preference shares confer on the holders the right to convert the preference shares into ordinary shares if, and on the basis, the Board determines at the time of issue of the preference shares.
The preference shares are to confer on the holders:
the right (on redemption and on a winding up) to payment in cash in priority to any other class of shares of (i) the amount paid or agreed to be considered as paid on each of the preference shares; (ii) the amount, if any, equal to the aggregate of any dividends accrued but unpaid and of any arrears of dividends; and
the right, in priority to any payment of dividend on any other class of shares, to the preferential dividend.
There is no equivalent provision in the Articles of Association of BHP Billiton Plc although as noted in section 2.12.2 above, BHP Billiton can issue preference shares which are subject to a right of redemption on terms the Board considers appropriate.
2.12.9 Capital calls
Subject to the terms on which any shares may have been issued, the Board may make calls on the shareholders in respect of all monies unpaid on their shares. BHP Billiton has a lien on every partly paid share for all amounts payable in respect of that share. Each shareholder is liable to pay the amount of each call in the manner, at the time and at the place specified by the Board (subject to receiving at least 14 days’ notice specifying the time and place for payment). A call is considered to have been made at the time when the resolution of the Board authorising the call was passed.
2.12.10 Borrowing powers
Subject to relevant law, the Directors may exercise all powers of BHP Billiton to borrow money, and to mortgage or charge its undertaking, property, assets (both present and future) and all uncalled capital or any part or parts thereof and to issue debentures and other securities, whether outright or as collateral security for any debt, liability or obligation of BHP Billiton or of any third party.
2.12.11 Changes to rights of shareholders
Rights attached to any class of shares issued by either BHP Billiton Limited or BHP Billiton Plc can only be varied (whether as a Joint Electorate Action or a Class Rights Action) where such variation is approved both:
by the Company that issued the relevant shares, as a special resolution; and
by the holders of the issued shares of the affected class, either by a special resolution passed at a separate meeting of the holders of the issued shares of the class affected, or with the written consent of members with at least 75 per cent of the votes of that class.
2.12.12 Conditions governing general meetings
All provisions relating to general meetings apply with any necessary modifications to any special meeting of any class of shareholders that may be held. Therefore, the following information relates equally to general meetings and any special meeting of any class of shareholders.
The Board may and shall on requisition in accordance with applicable laws call a general meeting of the shareholders at the time and place or places and in the manner determined by the Board. No shareholder may
convene a general meeting of BHP Billiton except where entitled under law to do so. Any Director may convene a general meeting whenever the Director thinks fit. General meetings can also be cancelled, postponed or adjourned, where permitted by law or the Constitution or Articles of Association. Notice of a general meeting must be given to each shareholder entitled to vote at the meeting and such notice of meeting must be given in the form and manner in which the Board thinks fit. Five shareholders of the relevant company present in person or by proxy constitute a quorum for a meeting. A shareholder who is entitled to attend and cast a vote at a general meeting of BHP Billiton may appoint a person as a proxy to attend and vote for the shareholder in accordance with the law.
2.12.13 Limitations on rights to own securities
Neither the Constitution of BHP Billiton Limited nor the Articles of Association of BHP Billiton Plc impose any limitations on the rights to own securities other than restrictions that reflect the takeovers codes under relevant Australian and UK law. In addition, the Australian Foreign Acquisitions and Takeovers Act 1975 imposes a number of conditions that restrict foreign ownership of Australian-based companies.
Share control limits imposed by the Constitution and the Articles of Association, as well as relevant laws, are described in sections 2.7.2 and 2.10.2 of this Annual Report.
2.12.14 Documents on display
You can consult reports and other information about BHP Billiton Limited that it has filed pursuant to the rules of the Australian Securities Exchange (ASX) atwww.asx.com.au. You can consult reports and other information filed for publication by BHP Billiton Plc pursuant to the rules of the UK Listing Authority at the Authority’s document viewing facility (the National Storage Mechanism) atwww.morningstar.co.uk/uk/NSM . Information filed on the ASX, or pursuant to the rules of the UK Listing Authority is not incorporated by reference into this Annual Report. The documents referred to in this Annual Report as being available on our website,www.bhpbilliton.com, are not incorporated by reference and do not form part of this Annual Report.
BHP Billiton Limited and BHP Billiton Plc both file annual and special reports and other information with the US Securities and Exchange Commission (SEC). These filings are available on the SEC website atwww.sec.gov. You may also read and copy any document that either BHP Billiton Limited or BHP Billiton Plc files at the SEC’s public reference room located at 100 F Street, NE, Washington, DC 20549. Please call the SEC at1-800-SEC-0330 or access the SEC website atwww.sec.gov for further information on the public reference room.
2.132.3 Reserves
2.13.12.3.1 Petroleum reserves
Reserves and production
BHP Billiton Petroleum proved reserves are estimated and reported according to SEC standards. For FY2013, proved oilUS Securities and gas reservesExchange Commission (SEC) standards and have been determined in accordance with SEC Rule 4-10(a) ofRegulation S-X. Proved oil and gas reserves are those quantities of crude oil, natural gas and natural gas liquids (NGL), which, that, by analysis of geoscience and engineering data, can be estimated with reasonable certainty to be economically producible from a given date forward from known reservoirs, and under existing economic conditions, operating methods, operating contracts and government regulations. Unless evidence indicates that renewal of existing operating contracts is reasonably certain, estimates of economically producible reserves reflect only the period before the contracts expire. The project to extract the hydrocarbons must have commenced or the operator must be reasonably certain that it will commence within a reasonable time. Developed oil and gas reserves are reserves that can be expected to be recovered through existing wells with existing equipment and operating methods, and
through installed extraction equipment and infrastructure operational at the time of the reserve estimate if the extraction is by means not involving a well. As specified in SEC Rule 4-10(a) of Regulation S-X, oil and gas prices are taken as the unweighted average of the corresponding first day of the month prices for the 12 months prior to the ending date of the period covered.
Estimates of oil and gas reserves are inherently imprecise, require the application of judgement and are subject to future revision. Accordingly, financial and accounting measures (such as the standardised measure of discounted cash flows, depreciation, depletion and amortisation charges, the assessment of impairments and the assessment of valuation allowances against deferred tax assets) that are based on reserve estimates are also subject to change.
Proved reserves were estimated by reference to available well and reservoir information, including but not limited to well logs, well test data, core data, production and pressure data, geologic data, seismic data and, in some cases, to similar data from analogous, producing reservoirs. A wide range of engineering and geoscience methods, including performance analysis, well analogues and geologic studies were used to estimate high confidence proved developed and undeveloped reserves in accordance with SEC regulations. For our conventional assets,operations, performance of producing wells was based on rate and pressure decline methods, including material balance, and was supplemented by reservoir simulation models where appropriate. In our Onshore US shale assets,operations, performance of producing wells was based on rate decline and pressure normalised decline curve analysis methods. For wells that lacked sufficient production history, reserves were estimated using performance-based type curves and offset location analogues with similar geologic and reservoir characteristics. When assessing proved undeveloped locations, a combination of geologic and engineering data, and where appropriate, statistical analysis was used to support the assignment of proved undeveloped reserves. Performance data, along with log and core data, was used to delineate consistent, continuous reservoir characteristics in core areas of the development. Proved undeveloped locations were included in core areas between known data and adjacent to productive wells. Locations where a high degree of certainty could not be demonstrated using the above technologies and techniques were not categorised as proved.
Proved reserve estimates were attributed to future development projects only where there is a significant commitment to project funding and execution, and for which applicable government and regulatory approvals have been secured or are reasonably certain to be secured. Furthermore, estimates of proved reserves include only volumes for which access to market is assured with reasonable certainty. All proved reserve estimates are
subject to revision, either upward or downward, based on new information, such as from development drilling and production activities, or from changes in economic factors, including product prices, contract terms or development plans.
Reserve estimates contained in this section have been estimated with deterministic methodology, with the exception of the North West Shelf gas operation in Australia, where probabilistic methodology has been utilised to estimate and aggregate reserves for the reservoirs dedicated to the gas project only. The probabilistic based portion of these reserves totals 38 MMboe (total boe conversion is based on the following: 6,000 scf of natural gas equals 1 boe) and represents approximately two per cent of our total reported proved reserves. Aggregation of proved reserves beyond the field/project level has been performed by arithmetic summation. Due to portfolio effects, aggregates of proved reserves may be conservative. The custody transfer point(s) or point(s) of sale applicable for each field or project are the reference point for reserves. The reserves replacement ratio is the reserves change during the year before production, divided by the production during the year stated as a percentage.
The Petroleum Reserves Group (PRG) is a dedicated group that provides oversight of the reserves’ assessment and reporting processes. It is independent of the various assetoperation teams directly responsible for development and production activities. The PRG is staffed by individuals averaging over 30more than 20 years’ experience in the oil and gas industry. The manager of the PRG, Abhijit Gadgil, is a full-time employee of BHP Billiton and is the individual responsible for overseeing and supervising the preparation of the reserve estimates and compiling the information for inclusion in this Annual Report. He has an advanced degree in engineering and overmore than 30 years of diversified industry experience in reservoir engineering, reserves assessment, field development and technical management and is a 30-year member of the Society of Petroleum Engineers (SPE). He has also served on the Society of Petroleum Engineers Oil and Gas Reserves Committee. Mr Gadgil has the qualifications and experience required to act as a qualified petroleum reserves evaluator under the Australian Securities Exchange (ASX) Listing Rules. The PRG managerestimates of petroleum reserves are based on, and fairly represent, information and supporting documentation prepared under the supervision of Mr Gadgil and he has reviewed and agrees with the information included in section 2.13.12.3.1 of this Annual Report.Report and has given his prior written consent for its publication. No part of the individual compensation for members of the PRG is dependent on reported reserves.
Petroleum’s reserves are estimated as of 30 June 2013.2015. Reserve assessments for all Petroleum propertiesoperations were conducted by technical staff within the operating organisation. These individuals meet the professional qualifications outlined by the Society of Petroleum Engineers,SPE, are trained in the fundamentals of SEC reserves reporting and the reserves processes and are endorsed by the PRG. Each reserve assessment is reviewed annually by the PRG to ensure technical quality, adherence to internally published Petroleum business guidelines and
compliance with SEC reporting requirements. Once endorsed by the PRG, all reserves receive final endorsement by senior management and the Risk and Audit Committee prior to public reporting. Our internal Group Risk Assessment and Assurance provides secondary assurance of the oil and gas reserve reporting processes through annual audits.
Production for FY2013FY2015 totalled 236 million barrels of oil equivalent(1) (MMboe)256 MMboe in sales, which is an increase of 1410 MMboe over FY2012.from FY2014. There waswere an additional 56 MMboe in non-sales production, primarily for fuel consumed in our Petroleum operations. During FY2013, Petroleum added a total
As of 246 MMboe of proved oil and gas reserves. Excluding net purchases and sales of negative 2 MMboe, proved additions of 248 MMboe replaced 103 per cent of production sales through extensions, discoveries, revisions and improved recovery. At 30 June 2013, approximately 482015, our proved reserves of 1907.9 MMboe reflect a net reduction of 274 MMboe and total production of 261 MMboe (including 5 MMboe in non-sales production primarily related to fuel consumed in Petroleum operations) compared to the previous estimate as at 30 June 2014. Approximately 58 per cent of our proved reserves as of 30 June 2015 were in conventional assets,operations, while approximately 5242 per cent were in unconventional assets.operations. As discussed below, the decrease in proved reserves was largely driven by the very challenging commodity price environment and a reduced capital and drilling program for the Onshore US, which has resulted in deferral of drilling into future years. As we continue to defer development of these operations for long-term value, the related proved undeveloped reserves have been migrated to non-proven categories within our resource base in accordance with applicable SEC standards.
New additions from
Discoveries and extensions and discoveries totalled 501during the year added 208 MMboe primarily for new liquids-focused development projectsto proved reserves, including 165 MMboe of extensions related to drilling in our US shale operations, 5 MMboe of extensions related to drilling in the Eagle Ford area, located onshoreAtlantis field in the United States.US Gulf of Mexico and 38 MMboe of discoveries following approval of the Greater Western Flank Phase 2 project in Australia, which allowed the transfer of the contingent resources carried for the project into proved undeveloped reserves. Improved recovery additions were 14resulted in a further 4 MMboe and are associated withincrease to proved reserves for a new water injection project atin the Shenzi field in the US Gulf of Mexico. Revisions
The divestment of conventional operations in North Louisiana and unconventional operations in the Pecos area in our Permian operation contributed to a reduction of 34 MMboe. There were negative 267no purchases during the year.
During FY2015, net revisions to our prior estimates reduced proved reserves by 452 MMboe, primarily due to the very challenging price environment. In addition, lower commodity prices have prompted reductions in our capital program which have resulted in the deferral of development plans and aretransfer of proved undeveloped reserves into other non-proven categories within our resource base.
In our US operations, the overall reduction in proved reserves through revisions totalled 484 MMboe, including downward revisions of 496 MMboe for our onshore unconventional operations that were partially offset by additions of 12 MMboe for better than expected performance, primarily in the Shenzi field in our Gulf of Mexico operations. The downward revisions in our onshore unconventional operations comprised reductions related to price impact on economic productive life, deferral of development drilling beyond the required five-year development window, reductions of prior estimated due to new information and other development program revisions and data adjustments. The Haynesville operation had the largest reductions due to price and deferral of development drilling, while the largest reduction through revisions of prior estimates occurred in undeveloped areasthe Hawkville operation. The majority of the Eagle Ford, HaynesvilleHawkville reductions of prior estimates reflect interference between wells related to the combination of completion design and Fayetteville areas that contain relatively dry gasnatural reservoir fractures. When combined with little or no associated liquids.the 165 MMboe addition for US unconventional drilling extensions noted above, the net effect of revisions and extensions in our US unconventional operations resulted in a net reduction of 331 MMboe.
OurThe reductions noted above were also partially offset by the addition of 25 MMboe to proved reserves for conventional assets decreased by 7 MMboe in FY2013. The Mad Dog Phase 2 project accounted for 65 MMboe of this reductionAustralia through better than expected performance primarily in the Macedon field and, was due to a partial salelesser extent, a number of interest (2 MMboe) and the decision to send the project back to the study phase in view of higher projected costs for the originally approved development. Partially offsetting this were the noted Shenzi improved recovery additions, extensions of 6 MMboe in fields in the Bass Strait and the North West Shelf areaproject. Operations outside of Australia and Atlantisthe USA also added a combined 8 MMboe for better than expected performance, primarily in the Gulf of Mexico along with 38 MMboe of revisionsAngostura field in several other fields.
In the North American shale fields, proved reserves increased by 253 MMboe. Net developed reserve extensions due to drilling were 144 MMboe while conversions from undeveloped to developed reserves totalled 44 MMboe. Field performance added an additional 28 MMboe to proved reserves. During FY2013, forward drilling plans were directed towards liquids-focused areas having higher value,Trinidad and allowed 350 MMboe of proved undeveloped reserves to be added as extensions. Proved undeveloped well locations that are now planned to be drilled in more than five years’ time, as a result of refocused drilling plans, have been reclassified out of proved undeveloped and resulted in a reduction of 269 MMboe.Tobago.
These results are summarised in the following tables, below, which detail estimated oil, condensate, NGL and natural gas reserves at 30 June 2013,2015, 30 June 20122014 and 30 June 2011,2013, with a reconciliation of the changes in each year. Reserves have been calculated using the economic interest method and represent net interest volumes after deduction of applicable royalty. Reserves of 6672 MMboe are in two production and risk-sharing arrangements that involve the Group in upstream risks and rewards without transfer of ownership of the products. At 30 June 2013,2015, approximately twofour per cent of the proved reserves are attributable to thosesuch arrangements.
(1) | Total boe conversion is based on the following: 6000 scf of natural gas equals 1 boe. |
| | | | | | | | | | | | | | | | |
Millions of barrels | | Australia | | | United
States | | | Other (c) | | | Total | |
Proved developed and undeveloped oil and condensate reserves (a)(b) | | | | | | | | | | | | | | | | |
Reserves at 30 June 2010 | | | 207.2 | | | | 262.7 | | | | 46.7 | | | | 516.6 | |
| | | | | | | | | | | | | | | | |
Improved recovery | | | 0.4 | | | | 21.2 | | | | – | | | | 21.6 | |
Revisions of previous estimates | | | 1.3 | | | | 2.5 | | | | 3.9 | | | | 7.7 | |
Extensions and discoveries | | | 2.8 | | | | 1.6 | | | | 0.2 | | | | 4.6 | |
Purchase/sales of reserves | | | – | | | | – | | | | – | | | | – | |
Production(b) | | | (40.4 | ) | | | (30.2 | ) | | | (10.0 | ) | | | (80.6 | ) |
| | | | | | | | | | | | | | | | |
Total changes | | | (36.0 | ) | | | (4.8 | ) | | | (5.9 | ) | | | (46.7 | ) |
| | | | | | | | | | | | | | | | |
Reserves at 30 June 2011 | | | 171.2 | | | | 257.9 | | | | 40.8 | | | | 469.9 | |
| | | | | | | | | | | | | | | | |
Improved recovery | | | – | | | | 33.2 | | | | – | | | | 33.2 | |
Revisions of previous estimates | | | 8.7 | | | | 120.6 | | | | 5.1 | | | | 134.4 | |
Extensions and discoveries | | | 8.8 | | | | 2.9 | | | | – | | | | 11.7 | |
Purchase/sales of reserves | | | – | | | | 32.0 | | | | – | | | | 32.0 | |
Production(b) | | | (31.2 | ) | | | (30.8 | ) | | | (9.2 | ) | | | (71.2 | ) |
| | | | | | | | | | | | | | | | |
Total changes | | | (13.6 | ) | | | 157.8 | | | | (4.1 | ) | | | 140.1 | |
| | | | | | | | | | | | | | | | |
Reserves at 30 June 2012 | | | 157.6 | | | | 415.7 | | | | 36.6 | | | | 610.0 | |
| | | | | | | | | | | | | | | | |
Improved recovery | | | – | | | | 12.6 | | | | 0.1 | | | | 12.7 | |
Revisions of previous estimates | | | 13.7 | | | | (65.7 | ) | | | 1.1 | | | | (50.9 | ) |
Extensions and discoveries | | | 0.2 | | | | 137.5 | | | | 0.2 | | | | 137.9 | |
Purchase/sales of reserves | | | – | | | | (1.9 | ) | | | – | | | | (1.9 | ) |
Production(b) | | | (25.9 | ) | | | (38.7 | ) | | | (7.9 | ) | | | (72.5 | ) |
| | | | | | | | | | | | | | | | |
Total changes | | | (12.0 | ) | | | 43.8 | | | | (6.5 | ) | | | 25.4 | |
| | | | | | | | | | | | | | | | |
Reserves at 30 June 2013 | | | 145.7 | | | | 459.6 | | | | 30.1 | | | | 635.4 | |
| | | | | | | | | | | | | | | | |
Developed | | | | | | | | | | | | | | | | |
Proved developed oil and condensate reserves | | | | | | | | | | | | | | | | |
as of 30 June 2010 | | | 150.1 | | | | 104.5 | | | | 42.2 | | | | 296.8 | |
as of 30 June 2011 | | | 116.0 | | | | 92.2 | | | | 38.5 | | | | 246.7 | |
as of 30 June 2012 | | | 101.5 | | | | 148.6 | | | | 36.5 | | | | 286.6 | |
Developed Reserves as of 30 June 2013 | | | 105.0 | | | | 209.5 | | | | 27.7 | | | | 342.2 | |
| | | | | | | | | | | | | | | | |
Undeveloped | | | | | | | | | | | | | | | | |
Proved undeveloped oil and condensate reserves | | | | | | | | | | | | | | | | |
as of 30 June 2010 | | | 57.1 | | | | 158.2 | | | | 4.5 | | | | 219.8 | |
as of 30 June 2011 | | | 55.2 | | | | 165.7 | | | | 2.2 | | | | 223.1 | |
as of 30 June 2012 | | | 56.2 | | | | 267.1 | | | | 0.1 | | | | 323.4 | |
Undeveloped Reserves as of 30 June 2013 | | | 40.6 | | | | 250.1 | | | | 2.5 | | | | 293.2 | |
| | | | | | | | | | | | | | | | |
(a) | Small differences are due to rounding to first decimal place. |
(b) | Production for reserves reconciliation differs slightly from marketable production due to timing of sales and corrections to previous estimates. |
(c) | Other is comprised of Algeria, Pakistan, Trinidad and Tobago, and the United Kingdom. |
| Millions of barrels | | Australia | | United
States | | Other (c) | | Total | | | Australia | | United
States | | Other (b) | | Total | |
Proved developed and undeveloped NGL reserves(a) | | | | | | | | | |
Reserves at 30 June 2010 | | | 109.5 | | | | 11.7 | | | | 2.2 | | | | 123.4 | | |
| | | | | | | | | | | | | |
Improved recovery | | | 0.3 | | | | 0.9 | | | | – | | | | 1.2 | | |
Revisions of previous estimates | | | 0.7 | | | | (1.0 | ) | | | (0.2 | ) | | | (0.5 | ) | |
Extensions and discoveries | | | 0.4 | | | | – | | | | – | | | | 0.4 | | |
Purchase/sales of reserves | | | – | | | | – | | | | – | | | | – | | |
Production(b) | | | (8.0 | ) | | | (2.0 | ) | | | (1.3 | ) | | | (11.3 | ) | |
| | | | | | | | | | | | | |
Total changes | | | (6.5 | ) | | | (2.2 | ) | | | (1.5 | ) | | | (10.2 | ) | |
| | | | | | | | | | | | | |
Reserves at 30 June 2011 | | | 102.9 | | | | 9.6 | | | | 0.7 | | | | 113.2 | | |
| | | | | | | | | | | | | |
Improved recovery | | | – | | | | 0.9 | | | | – | | | | 0.9 | | |
Revisions of previous estimates | | | 0.2 | | | | 49.7 | | | | (0.1 | ) | | | 49.9 | | |
Extensions and discoveries | | | – | | | | 2.1 | | | | – | | | | 2.1 | | |
Purchase/sales of reserves | | | – | | | | 41.9 | | | | – | | | | 41.9 | | |
Production(b) | | | (7.9 | ) | | | (5.7 | ) | | | (0.4 | ) | | | (14.1 | ) | |
| | | | | | | | | | | | | |
Total changes | | | (7.7 | ) | | | 89.0 | | | | (0.5 | ) | | | 80.8 | | |
| | | | | | | | | | | | | |
Proved developed and undeveloped oil and condensate reserves (a) | | | | | | | | | |
Reserves at 30 June 2012 | | | 95.2 | | | | 98.6 | | | | 0.2 | | | | 194.0 | | | | 157.6 | | | | 415.7 | | | | 36.6 | | | | 610.0 | |
| | | | | | | | | | | | | | | | | | | | | | | | |
Improved recovery | | | – | | | | 1.0 | | | | – | | | | 1.0 | | | | – | | | 12.6 | | | 0.1 | | | 12.7 | |
Revisions of previous estimates | | | 3.5 | | | | (23.3 | ) | | | – | | | | (19.8 | ) | | 13.7 | | | (65.7 | ) | | 1.1 | | | (50.9 | ) |
Extensions and discoveries | | | 0.1 | | | | 82.2 | | | | – | | | | 82.3 | | | 0.2 | | | 137.5 | | | 0.2 | | | 137.9 | |
Purchase/sales of reserves | | | – | | | | – | | | | – | | | | 0.0 | | | | – | | | (1.9 | ) | | | – | | | (1.9 | ) |
Production(b) | | | (7.9 | ) | | | (9.6 | ) | | | – | | | | (17.5 | ) | |
Production | | | (25.9 | ) | | (38.7 | ) | | (7.9 | ) | | (72.5 | ) |
| | | | | | | | | | | | | | | | | | | | | | | | |
Total changes | | | (4.3 | ) | | | 50.3 | | | | – | | | | 45.9 | | | (12.0 | ) | | 43.8 | | | (6.5 | ) | | 25.4 | |
| | | | | | | | | | | | | | | | | | | | | | | | |
Reserves at 30 June 2013 | | | 90.9 | | | | 148.9 | | | | 0.2 | | | | 239.9 | | | | 145.7 | | | | 459.6 | | | | 30.1 | | | | 635.4 | |
| | | | | | | | | | | | | | | | | | | | | | | | |
Improved recovery | | | | – | | | | – | | | | – | | | | – | |
Revisions of previous estimates | | | 14.2 | | | (50.0 | ) | | (0.4 | ) | | (36.1 | ) |
Extensions and discoveries | | | | – | | | 99.0 | | | 0.3 | | | 99.3 | |
Purchase/sales of reserves | | | | – | | | (0.4 | ) | | (3.5 | ) | | (3.9 | ) |
Production | | | (23.6 | ) | | (54.0 | ) | | (6.5 | ) | | (84.1 | ) |
| | | | | | | | | | | | | |
Total changes | | | (9.4 | ) | | (5.4 | ) | | (10.0 | ) | | (24.8 | ) |
| | | | | | | | | | | | | |
Reserves at 30 June 2014 | | | | 136.2 | | | | 454.2 | | | | 20.1 | | | | 610.5 | |
| | | | | | | | | | | | | |
Improved recovery | | | | – | | | 3.4 | | | 0.1 | | | 3.5 | |
Revisions of previous estimates | | | 3.2 | | | (53.7 | ) | | 2.4 | | | (48.1 | ) |
Extensions and discoveries | | | 5.9 | | | 52.0 | | | | – | | | 58.0 | |
Purchase/sales of reserves | | | | – | | | (1.0 | ) | | | – | | | (1.0 | ) |
Production | | | (21.4 | ) | | (71.6 | ) | | (5.6 | ) | | (98.5 | ) |
| | | | | | | | | | | | | |
Total changes | | | (12.2 | ) | | (70.9 | ) | | (3.1 | ) | | (86.2 | ) |
| | | | | | | | | | | | | |
Reserves at 30 June 2015 | | | | 124.0 | | | | 383.3 | | | | 17.1 | | | | 524.3 | |
| | | | | | | | | | | | | |
Developed | | | | | | | | | | | | | | | | |
Proved developed NGL reserves | | | | | | | | | |
as of 30 June 2010 | | | 67.0 | | | | 4.4 | | | | 2.2 | | | | 73.6 | | |
as of 30 June 2011 | | | 60.3 | | | | 2.6 | | | | 0.7 | | | | 63.6 | | |
Proved developed oil and condensate reserves | | | | | | | | | |
as of 30 June 2012 | | | 53.9 | | | | 22.5 | | | | 0.2 | | | | 76.6 | | | 101.5 | | | 148.6 | | | 36.5 | | | 286.6 | |
Developed Reserves as of 30 June 2013 | | | 54.7 | | | | 54.1 | | | | 0.2 | | | | 108.9 | | |
as of 30 June 2013 | | | 105.0 | | | 209.5 | | | 27.7 | | | 342.2 | |
as of 30 June 2014 | | | 96.5 | | | 237.8 | | | 14.7 | | | 349.0 | |
Developed reserves as of 30 June 2015 | | | | 81.2 | | | | 225.4 | | | | 11.7 | | | | 318.3 | |
| | | | | | | | | | | | | | | | | | | | | | | | |
Undeveloped | | | | | | | | | | | | | | | | |
Proved undeveloped NGL reserves | | | | | | | | | |
as of 30 June 2010 | | | 42.5 | | | | 7.3 | | | | – | | | | 49.8 | | |
as of 30 June 2011 | | | 42.6 | | | | 7.0 | | | | 0.1 | | | | 49.7 | | |
Proved undeveloped oil and condensate reserves | | | | | | | | | |
as of 30 June 2012 | | | 41.3 | | | | 76.1 | | | | – | | | | 117.4 | | | 56.2 | | | 267.1 | | | 0.1 | | | 323.4 | |
Undeveloped Reserves as of 30 June 2013 | | | 36.2 | | | | 94.8 | | | | – | | | | 131.0 | | |
as of 30 June 2013 | | | 40.6 | | | 250.1 | | | 2.5 | | | 293.2 | |
as of 30 June 2014 | | | 39.7 | | | 216.4 | | | 5.4 | | | 261.5 | |
Undeveloped reserves as of 30 June 2015 | | | | 42.7 | | | | 157.9 | | | | 5.4 | | | | 206.0 | |
| | | | | | | | | | | | | | | | | | | | | | | | |
| (a) | Small differences are due to rounding to first decimal place. |
| (b) | Production for reserves reconciliation differs slightly from marketable productionOther is comprised of Algeria, Pakistan, Trinidad and Tobago and the United Kingdom. |
| | | | | | | | | | | | | | | | |
Millions of barrels | | Australia | | | United
States | | | Other (c) | | | Total | |
Proved developed and undeveloped NGL reserves (a) | | | | | | | | | | | | | | | | |
Reserves at 30 June 2012 | | | 95.2 | | | | 98.6 | | | | 0.2 | | | | 194.0 | |
| | | | | | | | | | | | | | | | |
Improved recovery | | | – | | | | 1.0 | | | | – | | | | 1.0 | |
Revisions of previous estimates | | | 3.5 | | | | (23.3 | ) | | | – | | | | (19.8 | ) |
Extensions and discoveries | | | 0.1 | | | | 82.2 | | | | – | | | | 82.3 | |
Purchase/sales of reserves | | | – | | | | – | | | | – | | | | – | |
Production (b) | | | (7.9 | ) | | | (9.6 | ) | | | – | | | | (17.5 | ) |
| | | | | | | | | | | | | | | | |
Total changes | | | (4.3 | ) | | | 50.3 | | | | – | | | | 45.9 | |
| | | | | | | | | | | | | | | | |
Reserves at 30 June 2013 | | | 90.9 | | | | 148.9 | (d) | | | 0.2 | | | | 239.9 | (d) |
| | | | | | | | | | | | | | | | |
Improved recovery | | | – | | | | – | | | | – | | | | – | |
Revisions of previous estimates | | | (0.3 | ) | | | (25.3 | ) | | | (0.1 | ) | | | (25.7 | ) |
Extensions and discoveries | | | – | | | | 46.9 | | | | – | | | | 46.9 | |
Purchase/sales of reserves | | | – | | | | (0.2 | ) | | | – | | | | (0.2 | ) |
Production (b) | | | (8.5 | ) | | | (13.6 | ) | | | – | | | | (22.1 | ) |
| | | | | | | | | | | | | | | | |
Total changes | | | (8.8 | ) | | | 7.7 | | | | (0.1 | ) | | | (1.2 | ) |
| | | | | | | | | | | | | | | | |
Reserves at 30 June 2014 | | | 82.1 | | | | 156.6 | (d) | | | – | | | | 238.7 | (d) |
| | | | | | | | | | | | | | | | |
Improved recovery | | | – | | | | 0.3 | | | | – | | | | 0.3 | |
Revisions of previous estimates | | | 0.6 | | | | (62.4 | ) | | | 0.1 | | | | (61.7 | ) |
Extensions and discoveries | | | 1.1 | | | | 33.1 | | | | – | | | | 34.2 | |
Purchase/sales of reserves | | | – | | | | (0.2 | ) | | | – | | | | (0.2 | ) |
Production (b) | | | (7.2 | ) | | | (18.7 | ) | | | (0.1 | ) | | | (26.0 | ) |
| | | | | | | | | | | | | | | | |
Total changes | | | (5.5 | ) | | | (48.0 | ) | | | – | | | | (53.5 | ) |
| | | | | | | | | | | | | | | | |
Reserves at 30 June 2015 | | | 76.6 | | | | 108.6 | (d) | | | – | | | | 185.2 | |
| | | | | | | | | | | | | | | | |
Developed | | | | | | | | | | | | | | | | |
Proved developed NGL reserves | | | | | | | | | | | | | | | | |
as of 30 June 2012 | | | 53.9 | | | | 22.5 | | | | 0.2 | | | | 76.6 | |
as of 30 June 2013 | | | 54.7 | | | | 54.1 | | | | 0.2 | | | | 108.9 | |
as of 30 June 2014 | | | 46.0 | | | | 75.0 | | | | – | | | | 121.0 | |
Developed reserves as of 30 June 2015 | | | 40.1 | | | | 59.7 | | | | – | | | | 99.8 | |
| | | | | | | | | | | | | | | | |
Undeveloped | | | | | | | | | | | | | | | | |
Proved undeveloped NGL reserves | | | | | | | | | | | | | | | | |
as of 30 June 2012 | | | 41.3 | | | | 76.1 | | | | – | | | | 117.4 | |
as of 30 June 2013 | | | 36.2 | | | | 94.8 | | | | – | | | | 131.0 | |
as of 30 June 2014 | | | 36.1 | | | | 81.5 | | | | – | | | | 117.7 | |
Undeveloped reserves as of 30 June 2015 | | | 36.5 | | | | 48.9 | | | | – | | | | 85.4 | |
| | | | | | | | | | | | | | | | |
| (a) | Small differences are due to timing of sales and correctionsrounding to previous estimates.first decimal place. |
| (b) | Production includes volumes consumed in operations. |
| (c) | Other is comprised of Algeria, Pakistan, Trinidad and Tobago and the United Kingdom. |
| (d) | For FY2013, FY2014 and FY2015, amounts include 4.0, 3.9 and 4.2 million barrels respectively, which are anticipated to be consumed in operations in the United States. |
| Billions of Cubic Feet | | Australia (b) | | United
States | | Other (f) | | Total | | |
Billions of cubic feet | | | Australia (c) | | United
States | | Other (d) | | Total | |
Proved developed and undeveloped natural gas reserves(a) | | | | | | | | | | | | | | | | |
Reserves at 30 June 2010 | | | 3,666.3 | | | | 86.6 | | | | 772.8 | | | | 4,525.7 | | |
| | | | | | | | | | | | | |
Improved recovery | | | – | | | | 3.5 | | | | – | | | | 3.5 | | |
Revisions of previous estimates | | | 582.8 | | | | 197.9 | | | | 12.4 | | | | 793.1 | | |
Extensions and discoveries | | | 63.7 | | | | 0.3 | | | | 31.6 | | | | 95.6 | | |
Purchase/sales of reserves | | | – | | | | 2,490.6 | | | | – | | | | 2,490.6 | | |
Production(c) | | | (274.7 | ) | | | (49.1 | ) | | | (81.2 | ) | | | (405.0 | ) | |
| | | | | | | | | | | | | |
Total changes | | | 371.8 | | | | 2,643.1 | | | | (37.2 | ) | | | 2,977.8 | | |
| | | | | | | | | | | | | |
Reserves at 30 June 2011 | | | 4,038.1 | | | | 2,729.8 | | | | 735.6 | | | | 7,503.5 | | |
| | | | | | | | | | | | | |
Improved recovery | | | – | | | | 3.3 | | | | – | | | | 3.3 | | |
Revisions of previous estimates | | | 90.1 | | | | 328.1 | | | | 29.1 | | | | 447.3 | | |
Extensions and discoveries | | | 6.6 | | | | 128.3 | | | | – | | | | 134.9 | | |
Purchase/sales of reserves | | | – | | | | 3,297.3 | | | | – | | | | 3,297.3 | | |
Production(c) (e) | | | (276.1 | ) | | | (458.4 | ) | | | (122.6 | ) | | | (857.2 | ) | |
| | | | | | | | | | | | | |
Total changes | | | (179.5 | ) | | | 3,298.7 | | | | (93.5 | ) | | | 3,025.7 | | |
| | | | | | | | | | | | | |
Reserves at 30 June 2012 | | | 3,858.6 | | | | 6,028.5 | | | | 642.1 | | | | 10,529.2 | | | | 3,858.6 | | | | 6,028.5 | | | | 642.1 | | | | 10,529.2 | |
| | | | | | | | | | | | | | | | | | | | | | | | |
Improved recovery | | | – | | | | 3.4 | | | | – | | | | 3.4 | | | | – | | | 3.4 | | | | – | | | 3.4 | |
Revisions of previous estimates | | | 34.6 | | | | (1,159.5 | ) | | | (54.9 | ) | | | (1,179.8 | ) | | | 34.6 | | | (1,159.5 | ) | | (54.9 | ) | | (1,179.8 | ) |
Extensions and discoveries | | | 8.7 | | | | 1,675.4 | | | | – | | | | 1,684.1 | | | | 8.7 | | | 1,675.4 | | | | – | | | 1,684.1 | |
Purchase/sales of reserves | | | – | | | | (0.5 | ) | | | – | | | | (0.5 | ) | | | – | | | (0.5 | ) | | | – | | | (0.5 | ) |
Production(c) (e) | | | (299.3 | ) | | | (491.3 | ) | | | (116.3 | ) | | | (906.9 | ) | |
Production(b) | | | | (299.3 | ) | | (491.3 | ) | | (116.3 | ) | | (906.9 | ) |
| | | | | | | | | | | | | | | | | | | | | | | | |
Total changes | | | (255.9 | ) | | | 27.4 | | | | (171.2 | ) | | | (399.7 | ) | | | (255.9 | ) | | 27.4 | | | (171.2 | ) | | (399.7 | ) |
| | | | | | | | | | | | | | | | | | | | | | | | |
Reserves at 30 June 2013 | | | 3,602.6 | | | | 6,055.9 | | | | 471.0 | | | | 10,129.5 | | | | 3,602.6 | (e) | | | 6,055.9 | (f) | | | 471.0 | (g) | | | 10,129.5 | (h) |
| | | | | | | | | | | | | | | | | | | | | | | | |
Improved recovery | | | | – | | | | – | | | | – | | | | – | |
Revisions of previous estimates | | | | 207.9 | | | (1,174.3 | ) | | 3.4 | | | (962.9 | ) |
Extensions and discoveries | | | | – | | | 1,205.9 | | | 123.6 | | | 1,329.5 | |
Purchase/sales of reserves | | | | – | | | (1.5 | ) | | (58.4 | ) | | (59.9 | ) |
Production(b) | | | | (315.2 | ) | | (462.7 | ) | | (96.9 | ) | | (874.8 | ) |
| | | | �� | | | | | | | | | |
Total changes | | | | (107.2 | ) | | (432.4 | ) | | (28.4 | ) | | (568.0 | ) |
| | | | | | | | | | | | | |
Reserves at 30 June 2014 | | | | 3,495.4 | (e) | | | 5,623.5 | (f) | | | 442.6 | (g) | | | 9,561.5 | (h) |
| | | | | | | | | | | | | |
Improved recovery | | | | – | | | 0.8 | | | | – | | | 0.8 | |
Revisions of previous estimates | | | | 124.3 | | | (2,207.6 | ) | | 32.8 | | | (2,050.5 | ) |
Extensions and discoveries | | | | 185.4 | | | 509.7 | | | | – | | | 695.1 | |
Purchase/sales of reserves | | | | – | | | (195.6 | ) | | | – | | | (195.6 | ) |
Production(b) | | | | (321.8 | ) | | (434.6 | ) | | (64.8 | ) | | (821.1 | ) |
| | | | | | | | | | | | | |
Total changes | | | | (12.0 | ) | | (2,327.3 | ) | | (32.0 | ) | | (2,371.3 | ) |
| | | | | | | | | | | | | |
Reserves at 30 June 2015 | | | | 3,483.4 | (e) | | | 3,296.1 | (f) | | | 410.6 | (g) | | | 7,190.2 | (h) |
| | | | | | | | | | | | | |
Developed | | | | | | | | | | | | | | | | |
Proved developed natural gas reserves | | | | | | | | | | | | | | | | |
as of 30 June 2010(d) | | | 1,724.8 | | | | 30.3 | | | | 236.8 | | | | 1,991.9 | | |
as of 30 June 2011 | | | 1,754.0 | | | | 1,122.1 | | | | 719.9 | | | | 3,596.0 | | |
as of 30 June 2012 | | | 1,619.0 | | | | 2,742.5 | | | | 634.5 | | | | 4,996.0 | | | | 1,619.0 | | | 2,742.5 | | | 634.5 | | | 4,996.0 | |
Developed Reserves as of 30 June 2013 | | | 2,674.4 | | | | 3,094.3 | | | | 471.0 | | | | 6,239.7 | | |
as of 30 June 2013 | | | | 2,674.4 | | | 3,094.3 | | | 471.0 | | | 6,239.7 | |
as of 30 June 2014 | | | | 2,553.7 | | | 3,208.3 | | | 315.5 | | | 6,077.5 | |
Developed reserves as of 30 June 2015 | | | | 2,400.7 | | | | 2,499.0 | | | | 281.1 | | | | 5,180.7 | |
| | | | | | | | | | | | | | | | | | | | | | | | |
Undeveloped | | | | | | | | | | | | | | | | |
Proved undeveloped natural gas reserves | | | | | | | | | | | | | | | | |
as of 30 June 2010(d) | | | 1,941.5 | | | | 56.4 | | | | 535.9 | | | | 2,533.8 | | |
as of 30 June 2011 | | | 2,284.1 | | | | 1,607.7 | | | | 15.7 | | | | 3,907.4 | | |
as of 30 June 2012 | | | 2,239.6 | | | | 3,286.0 | | | | 7.6 | | | | 5,533.2 | | | | 2,239.6 | | | 3,286.0 | | | 7.6 | | | 5,533.2 | |
Undeveloped Reserves as of 30 June 2013 | | | 928.2 | | | | 2,961.6 | | | | – | | | | 3,889.8 | | |
as of 30 June 2013 | | | | 928.2 | | | 2,961.6 | | | | – | | | 3,889.8 | |
as of 30 June 2014 | | | | 941.7 | | | 2,415.2 | | | 127.1 | | | 3,484.0 | |
Undeveloped reserves as of 30 June 2015 | | | | 1,082.7 | | | | 797.1 | | | | 129.6 | | | | 2,009.4 | |
| | | | | | | | | | | | | | | | | | | | | | | | |
| (a) | Small differences are due to rounding to first decimal place. |
| (b) | Production includes volumes consumed by operations. |
| (c) | Production for Australia includes gas sold as LNG. |
(c) | Production for reserves reconciliation differs slightly from marketable production due to timing of sales and corrections to previous estimates. |
| (d) | Reserves at 30 June 2010 do not include volumes expected to be consumed by operations. |
(e) | Production includes volumes consumed by operations. |
(f) | Other is comprised of Algeria, Pakistan, Trinidad and Tobago and the United Kingdom. |
| (e) | For FY2013, FY2014 and FY2015, amounts include 387, 360 and 343 billion cubic feet respectively, which are anticipated to be consumed in operations in Australia. |
| (f) | For FY 2013, FY2014 and FY2015, amounts include 91, 185 and 154 billion cubic feet respectively, which are anticipated to be consumed in operations in the United States. |
| (g) | For FY2013, FY2014 and FY2015, amounts include 49, 30, and 27 billion cubic feet respectively, which are anticipated to be consumed in operations in Other areas. |
| (h) | For FY2013, FY2014 and FY2015, amounts include 527, 575 and 524 billion cubic feet respectively, which are anticipated to be consumed in operations. |
| Millions of barrels of oil equivalent(a) | | Australia | | United
States | | Other (f) | | Total | | | Australia | | United
States | | Other (d) | | Total | |
Proved developed and undeveloped oil, condensate, natural gas and NGL reserves(b) | | | | | | | | | | | | | | | | |
Reserves at 30 June 2010(d) | | | 927.7 | | | | 288.8 | | | | 177.7 | | | | 1,394.3 | | |
Reserves at 30 June 2012 | | | | 895.9 | | | | 1,519.0 | | | | 143.9 | | | | 2,558.8 | |
| | | | | | | | | | | | | | | | | | | | | | | | |
Improved recovery | | | 0.7 | | | | 22.6 | | | | – | | | | 23.3 | | | | – | | | 14.2 | | | | – | | | 14.2 | |
Revisions of previous estimates | | | 99.1 | | | | 34.5 | | | | 5.9 | | | | 139.5 | | | | 23.0 | | | (282.3 | ) | | (8.1 | ) | | (267.3 | ) |
Extensions and discoveries | | | 13.9 | | | | 1.6 | | | | 5.4 | | | | 20.9 | | | | 1.8 | | | 498.9 | | | 0.2 | | | 500.9 | |
Purchase/sales of reserves | | | – | | | | 415.1 | | | | – | | | | 415.1 | | | | – | | | (2.0 | ) | | | – | | | (2.0 | ) |
Production(c) | | | (94.2 | ) | | | (40.3 | ) | | | (24.9 | ) | | | (159.4 | ) | | | (83.7 | ) | | (130.2 | ) | | (27.3 | ) | | (241.2 | ) |
| | | | | | | | | | | | | | | | | | | | | | | | |
Total changes | | | 19.5 | | | | 433.5 | | | | (13.6 | ) | | | 439.4 | | | | (59.0 | ) | | 98.7 | | | (35.1 | ) | | 4.7 | |
| | | | | | | | | | | | | | | | | | | | | | | | |
Reserves at 30 June 2011 | | | 947.2 | | | | 722.4 | | | | 164.1 | | | | 1,833.7 | | |
Reserves at 30 June 2013 | | | | 837.0 | (e) | | | 1,617.7 | (f) | | | 108.8 | (g) | | | 2,563.5 | (h) |
| | | | | | | | | | | | | | | | | | | | | | | | |
Improved recovery | | | – | | | | 34.7 | | | | – | | | | 34.7 | | | | – | | | | – | | | | – | | | | – | |
Revisions of previous estimates | | | 23.9 | | | | 225.0 | | | | 9.9 | | | | 258.8 | | | | 48.6 | | | (271.0 | ) | | 0.1 | | | (222.4 | ) |
Extensions and discoveries | | | 9.9 | | | | 26.4 | | | | – | | | | 36.3 | | | | – | | | 346.8 | | | 20.9 | | | 367.7 | |
Purchase/sales of reserves | | | – | | | | 623.5 | | | | – | | | | 623.5 | | | | – | | | (0.9 | ) | | (13.2 | ) | | (14.1 | ) |
Production(c) (e) | | | (85.1 | ) | | | (113.0 | ) | | | (30.1 | ) | | | (228.2 | ) | |
Production (c) | | | | (84.6 | ) | | (144.7 | ) | | (22.6 | ) | | (251.9 | ) |
| | | | | | | | | | | | | | | | | | | | | | | | |
Total changes | | | (51.3 | ) | | | 796.6 | | | | (20.2 | ) | | | 725.2 | | | | (36.1 | ) | | (69.7 | ) | | (14.9 | ) | | (120.6 | ) |
| | | | | | | | | | | | | | | | | | | | | | | | |
Reserves at 30 June 2012 | | | 895.9 | | | | 1,519.0 | | | | 143.9 | | | | 2,558.8 | | |
Reserves at 30 June 2014 | | | | 800.9 | (e) | | | 1,548.0 | (f) | | | 93.9 | (g) | | | 2,442.8 | (h) |
| | | | | | | | | | | | | | | | | | | | | | | | |
Improved recovery | | | – | | | | 14.2 | | | | – | | | | 14.2 | | | | – | | | 3.8 | | | 0.1 | | | 3.9 | |
Revisions of previous estimates | | | 23.0 | | | | (282.3 | ) | | | (8.1 | ) | | | (267.3 | ) | | | 24.6 | | | (484.0 | ) | | 7.9 | | | (451.5 | ) |
Extensions and discoveries | | | 1.8 | | | | 498.9 | | | | 0.2 | | | | 500.9 | | | | 37.9 | | | 170.0 | | | | – | | | 208.0 | |
Purchase/sales of reserves | | | – | | | | (2.0 | ) | | | – | | | | (2.0 | ) | | | – | | | (33.8 | ) | | | – | | | (33.8 | ) |
Production(c) (e) | | | (83.7 | ) | | | (130.2 | ) | | | (27.3 | ) | | | (241.2 | ) | |
Production (c) | | | | (82.2 | ) | | (162.7 | ) | | (16.5 | ) | | (261.4 | ) |
| | | | | | | | | | | | | | | | | | | | | | | | |
Total changes | | | (59.0 | ) | | | 98.7 | | | | (35.1 | ) | | | 4.7 | | | | (19.8 | ) | | (506.7 | ) | | (8.4 | ) | | (534.9 | ) |
| | | | | | | | | | | | | | | | | | | | | | | | |
Reserves at 30 June 2013 | | | 837 | | | | 1,617.7 | | | | 108.8 | | | | 2,563.5 | | |
Reserves at 30 June 2015 | | | | 781.1 | (e) | | | 1,041.3 | (f) | | | 85.5 | (g) | | | 1,907.9 | (h) |
| | | | | | | | | | | | | | | | | | | | | | | | |
Developed | | | | | | | | | | | | | | | | |
Proved developed oil, condensate, natural gas and NGL reserves | | | | | | | | | | | | | | | | |
as of 30 June 2010(d) | | | 504.6 | | | | 114 | | | | 83.9 | | | | 702.4 | | |
as of 30 June 2011 | | | 468.6 | | | | 281.9 | | | | 159.2 | | | | 909.7 | | |
as of 30 June 2012 | | | 425.1 | | | | 628.2 | | | | 142.5 | | | | 1,195.8 | | | | 425.1 | | | 628.2 | | | 142.5 | | | 1,195.8 | |
Developed Reserves as of 30 June 2013 | | | 605.5 | | | | 779.2 | | | | 106.3 | | | | 1,491.0 | | |
as of 30 June 2013 | | | | 605.5 | | | 779.2 | | | 106.3 | | | 1,491.0 | |
as of 30 June 2014 | | | | 568.1 | | | 847.6 | | | 67.3 | | | 1,483.0 | |
Developed reserves as of 30 June 2015 | | | | 521.5 | | | | 701.6 | | | | 58.5 | | | | 1,281.6 | |
| | | | | | | | | | | | | | | | | | | | | | | | |
Undeveloped | | | | | | | | | | | | | | | | |
Proved developed oil, condensate, natural gas and NGL reserves | | | | | | | | | |
as of 30 June 2010(d) | | | 423.2 | | | | 174.9 | | | | 93.8 | | | | 691.9 | | |
as of 30 June 2011 | | | 478.6 | | | | 440.5 | | | | 4.9 | | | | 924.0 | | |
Proved undeveloped oil, condensate, natural gas and NGL reserves | | | | | | | | | |
as of 30 June 2012 | | | 470.8 | | | | 890.8 | | | | 1.4 | | | | 1,363.0 | | | | 470.8 | | | 890.8 | | | 1.4 | | | 1,363.0 | |
Undeveloped Reserves as of 30 June 2013 | | | 231.5 | | | | 838.5 | | | | 2.5 | | | | 1,072.5 | | |
as of 30 June 2013 | | | | 231.5 | | | 838.5 | | | 2.5 | | | 1,072.5 | |
as of 30 June 2014 | | | | 232.8 | | | 700.4 | | | 26.6 | | | 959.8 | |
Undeveloped reserves as of 30 June 2015 | | | | 259.6 | | | | 339.7 | | | | 27.0 | | | | 626.3 | |
| | | | | | | | | | | | | | | | | | | | | | | | |
| (a) | Barrel oil equivalent conversion based on 6,000 scf of natural gas equals 1 boe. |
| (b) | Small differences are due to rounding to first decimal place. |
| (c) | Production for reserves reconciliation differs slightly from marketable production due to timing of sales and corrections to previous estimates. |
(d) | Reserves at 30 June 2010 do not include volumes expected to be consumed by operations. |
(e) | Production includes volumes consumed by operations. |
(f)(d) | Other is comprised of Algeria, Pakistan, Trinidad and Tobago and the United Kingdom. |
| (e) | For FY2013, FY2014 and FY2015, amounts include 64, 60 and 57 million barrels equivalent respectively, which are anticipated to be consumed in operations in Australia. |
| (f) | For FY2013, FY2014 and FY2015, amounts include 19, 35 and 30 million barrels equivalent respectively, which are anticipated to be consumed in operations in the United States. |
| (g) | For FY2013, FY2014 and FY2015, amounts include 8, 5 and 4 million barrels equivalent respectively, which are anticipated to be consumed in operations in Other areas. |
| (h) | For FY2013, FY2014 and FY2015, amounts include 92, 100 and 91 million barrels equivalent respectively, which are anticipated to be consumed in operations. |
Proved undeveloped reserves
At 30 June 2013,2015, Petroleum had 1,072626 MMboe of proved undeveloped reserves, as compared to 1,363which represented 33 per cent of our year-end 2015 proved reserves of 1,908 MMboe. Approximately 373 MMboe or 60 per cent of the proved undeveloped reserves resides primarily in our conventional offshore fields in Australia, the Gulf of Mexico and Trinidad and Tobago, while 253 MMboe or 40 per cent reside in our North American shale fields.
The current proved undeveloped reserves reflect a net reduction of 334 MMboe from the 960 MMboe reported at 30 June 2012. The successful completion2014. This reduction was the combined result of development activities and commissioning of both the North Rankin B compression platform and the Macedon gas project on the North West Shelf in Australiathat converted approximately 242121 MMboe of proved undeveloped to proved developed reserves, and was the primary reason for the reduction from FY2012.
Proved undeveloped reserves were removed from Mad Dog Phase 2 as previously noted. The 343 MMboe ofdownward proved undeveloped reserves revisions of 361 MMboe primarily driven by the decline in product prices in FY2015 and reductions in our planned Onshore US drilling program in response to the lower price environment. The Onshore US portion of these reductions totalled 356 MMboe. Partially offsetting the reductions were new additions of 148 MMboe as extensions/discoveries and improved recovery for new development projects, including 102 MMboe for new drilling locations in our Onshore US fields which extended the proven area of the fields (all of which will be drilled within five years), and the approval of the Greater Western Flank Phase 2 project in Australia, which added 38 MMboe (which is reported as a discovery). Also included were an extension of reservoir limits in the conventional fieldsAtlantis field, which added 5 MMboe; and an improved recovery project in the Shenzi field, which added 4 MMboe, both of which are located in large offshore projects. These reserves require significant capital expenditures and multi-year lead times before initial production can be achieved. Based on the current project schedule, 99 per centGulf of Mexico.
Of the 1,072626 MMboe currently classified as proved undeveloped isat 30 June 2015, 225 MMboe has been reported for five or more years. All of these reserves are in our offshore conventional fields that are currently producing fields or fields being actively pursued,have significant development in place, which are scheduled to start producing within the next five years. The largest component of this is 133 MMboe in the Kipper-Tuna-Turrum project in Bass Strait, Australia. This project is expected to be on production in 2016 when the gas conditioning plant is completed. The Atlantis field in the Gulf of Mexico contains 31 MMboe, which is actively being drilled. The remainder resides in other Australian offshore fields that have active development plans. Our North American shale fields do not contain any proved undeveloped reserves that have been reported for five or more years. In addition, management plans anticipate drilling all the proved undeveloped reserves in the North American shale fields in the next five years, with none of the proved undeveloped reserves being more than five years old at the time they are drilled.
During FY2015, Petroleum continued active development of our inventory of proved undeveloped projects by converting 121 MMboe to proved developed reserves. Over the past three years, the conversion of proved undeveloped to developed has totalled 636 MMboe, averaging 212 MMboe per year. In currently producing conventional fields, the remaining proved undeveloped reserves will be developed and brought on stream in a phased manner to best optimise the use of production facilities and to meet long-term gas supply contracts.
The majority of proved undeveloped reserves at 30 June 2013 were in the North American shale fields, accounting for 729 MMboe. In these fields, approximately half of this volume is in the Eagle Ford area, which is where we are increasing the focus of our drilling to develop and produce higher value, liquids-rich gas. Management plans anticipate drilling all of these proved undeveloped reserves in the North American shale fields in the next five years. None of these proved undeveloped reserves will be more than five years old at the time they are drilled.
Petroleum has an established track record of progressing large proved undeveloped reserves to developed, as evidenced by the conversion of 301 MMboe to developed in FY2013. Over the past three years, the conversion of proved undeveloped to developed has averaged 153 MMboe per year. This is twice the average conversion rate reported in FY2012.sales commitments. During FY2013,FY2015, Petroleum spent US$7.24.5 billion progressingon development of undeveloped reservesactivities worldwide.
2.13.2
2.3.2 Ore Reserves
Ore Reserves are estimates of the amount of ore that can be economically and legally extracted and processed from our mining properties. In order to estimate reserves, assumptions are required about a range of geological, technical and economic factors, including quantities, grades, production techniques, recovery rates, production costs, transport costs, commodity demand, commodity prices and exchange rates. Estimating the quantity and/or grade of Ore Reserves requires the size, shape and depth of ore bodies to be determined by analysing geological data such as drilling samples. Because the economic assumptions used to estimate reserves change from period to period and becauseas additional geological and operational data is generated during the course of operations, estimates of reserves may change from period to period. All of the Ore Reserve figuresReserves estimates presented are reported in 100 per cent terms, and represent estimates at 30 June 2013 (unless otherwise stated).2015 and have been prepared by experienced engineers. All tonnes and grade information has been rounded, hence small differences may be present in the totals. Tonnes are reported as dry metric tonnes unless(unless otherwise stated.stated).
Our mineral leases are of sufficient duration (or convey a legal right to renew for sufficient duration) to enable all Ore Reserves on the leased properties to be mined in accordance with current production schedules. Our Ore Reserves may include areas where some additional approvals remain outstanding but where based on the technical investigations we carry out as part of our mine planning process, and our knowledge and experience of the approvals process, we expect that such approvals will be obtained as part of the normal course of business and within the timeframe required by the current life of mine schedule.
The reported Ore Reserves contained in this Annual Report do not exceed the quantities that we estimate could be extracted economically if future prices for each commodity were equal to the average historical prices for the
three years to 31 December 2012,2014, using current operating costs. However, we do not use a bauxite, aluminium or alumina price to determine bauxite reserves. The primary criteria for determining bauxite reserves are the feed specifications required by the captive alumina refinery. In addition to these specifications a number of modifying factors are used to differentiate bauxite reserves from other mineralised material. For our Hotazel Manganese Mines, geological stratigraphic controls, cut-off grade and plant feed requirements are used to determine reserves.
Also, in some cases where commodities are produced as by-products (or co-products) with other metals, we use the three-year average historical prices for the combination of commodities produced at the relevant mine in order to verify that each ore reserve is economic. The three-year historical average prices used for each traded commodity to test for impairment of the Ore Reserves contained in this Annual Report are as follows:
| | | | |
Commodity Price | | | | US$ |
Copper | | | | 3.68/3.35/lb |
Gold | | | | 1,488/1,449/oz |
Nickel | | | | 9.42/7.47/lb |
Silver | | | | 28.84/24.68/oz |
Lead | | | | 1.00/0.95/lb |
Zinc | | | | 0.95/0.91/lb |
Uranium | | | | 50.36/40.08/lb |
Iron Ore – Fines Iron Ore – Lump | | | | 2.246/1.811/dmtu
2.427/1.970/dmtu
|
Metallurgical Hard Coking Coal | | | | 199.9/151.0/t |
Thermal Coal Newcastle(1) | | | | 104.7/82.9/t |
Thermal Coal Colombia(1) | | | | 90.6/73.6/t |
| (1) | Thermal coal prices reported are sourced from the McCloskey Report FOB by region. Newcastle and Columbia 6000 kcal/tonne Net As Received and Colombia 11,300 British Thermal Units Gross As Received. These are comparable to realised prices used to test for impairment. The realised price for South African Coal used to test for impairment is not aligned with the McCloskey Report price and is not disclosed in this table due to contractual commercial sensitivity. |
The reported reserves may differ in some respects from the reserves we report in our home jurisdictions of Australia and the UK. Those jurisdictions require the use of the Australasian Code for reporting of Exploration Results, Mineral Resources and Ore Reserves, December 2012 (the JORC Code), which contemplatesprovides guidance on the use of reasonable investment assumptions in calculating reserve estimates.
Ore Reserves of mining operations assigned to South32 in May 2015 as part of the Demerger are not reported because those mining operations are no longer owned or operated by BHP Billiton. For further information on the South32 Demerger, refer to sections 1.3.7, 1.6.4 and 2.1.7.
Copper Business
Ore Reserves in accordance with Industry Guide 7
| | | | | | | | | | | | | | | | | | | | | | | | | | | | | | | | | | | | | | | | | | | | | | | | | | | | | | | | | | | | | | | | | | | | | | | | | | | | | | | | | | | | | | | | | | | | | | |
As at 30 June 2013 | | | As at 30 June 2012 | |
Commodity Deposit(1)(2)(3)(4) | | Ore Type | | Proven Ore Reserves | | | Probable Ore Reserves | | | Total Ore Reserves | | | Reserve
Life
(years) | | | BHP
Billiton
Interest
% | | | Total Ore Reserves | | | Reserve
Life
(years) | |
| | | Mt | | | % TCu | | | % SCu | | | | | | | | | Mt | | | % TCu | | | % SCu | | | | | | | | | Mt | | | % TCu | | | % SCu | | | | | | | | | | | Mt | | | % TCu | | | % SCu | | | | | | | | |
Copper | | | | | | | | | | | | | | | | | | | | | | | | | | | | | | | | | | | | | | | | | | | | | | | | | | | | | | | | | | | | | | | | | | | | | | | | | | | | | | | | | | | | | | | | | | | | | | |
Escondida | | Oxide | | | 84 | | | | 0.88 | | | | – | | | | | | | | | | | | 61 | | | | 0.71 | | | | – | | | | | | | | | | | | 145 | | | | 0.81 | | | | – | | | | | | | | | | | | 54 | | | | 57.5 | | | | 116 | | | | 0.89 | | | | – | | | | | | | | | | | | 54 | |
| | Sulphide | | | 3,760 | | | | 0.76 | | | | – | | | | | | | | | | | | 1,340 | | | | 0.60 | | | | – | | | | | | | | | | | | 5,100 | | | | 0.72 | | | | – | | | | | | | | | | | | | | | | | | | | 4,928 | | | | 0.71 | | | | – | | | | | | | | | | | | | |
| | Sulphide
Leach | | | 1,470 | | | | 0.45 | | | | – | | | | | | | | | | | | 550 | | | | 0.42 | | | | – | | | | | | | | | | | | 2,020 | | | | 0.44 | | | | – | | | | | | | | | | | | | | | | | | | | 1,977 | | | | 0.47 | | | | – | | | | | | | | | | | | | |
Cerro Colorado (5) | | Oxide | | | 22 | | | | 0.63 | | | | 0.46 | | | | | | | | | | | | 91 | | | | 0.58 | | | | 0.41 | | | | | | | | | | | | 113 | | | | 0.59 | | | | 0.42 | | | | | | | | | | | | 9 | | | | 100 | | | | 131 | | | | 0.61 | | | | 0.44 | | | | | | | | | | | | 10 | |
| | Sulphide | | | 24 | | | | 0.72 | | | | 0.12 | | | | | | | | | | | | 42 | | | | 0.60 | | | | 0.13 | | | | | | | | | | | | 66 | | | | 0.64 | | | | 0.13 | | | | | | | | | | | | | | | | | | | | 71 | | | | 0.65 | | | | 0.13 | | | | | | | | | | | | | |
Spence(6) | | Oxide | | | 31 | | | | 0.80 | | | | 0.57 | | | | | | | | | | | | 4.0 | | | | 0.73 | | | | 0.60 | | | | | | | | | | | | 35 | | | | 0.79 | | | | 0.57 | | | | | | | | | | | | 10 | | | | 100 | | | | 36 | | | | 0.85 | | | | 0.62 | | | | | | | | | | | | 11 | |
| | Oxide
Low
Solubility | | | 20 | | | | 0.99 | | | | 0.45 | | | | | | | | | | | | 18 | | | | 0.65 | | | | 0.27 | | | | | | | | | | | | 38 | | | | 0.83 | | | | 0.36 | | | | | | | | | | | | | | | | | | | | 23 | | | | 1.04 | | | | 0.54 | | | | | | | | | | | | | |
| | Sulphide | | | 116 | | | | 0.98 | | | | 0.12 | | | | | | | | | | | | 37 | | | | 0.73 | | | | 0.12 | | | | | | | | | | | | 153 | | | | 0.92 | | | | 0.12 | | | | | | | | | | | | | | | | | | | | 165 | | | | 0.94 | | | | 0.12 | | | | | | | | | | | | | |
| | ROM | | | – | | | | – | | | | – | | | | | | | | | | | | 85 | | | | 0.35 | | | | 0.09 | | | | | | | | | | | | 85 | | | | 0.35 | | | | 0.09 | | | | | | | | | | | | | | | | | | | | 62 | | | | 0.42 | | | | 0.10 | | | | | | | | | | | | | |
Pinto Valley(7) | | Sulphide | | | 25 | | | | 0.37 | | | | – | | | | | | | | | | | | 42 | | | | 0.41 | | | | – | | | | | | | | | | | | 67 | | | | 0.39 | | | | – | | | | | | | | | | | | 4 | | | | 100 | | | | 75 | | | | 0.40 | | | | – | | | | | | | | | | | | 4 | |
| | Low-grade
Leach | | | 6.0 | | | | 0.21 | | | | – | | | | | | | | | | | | 7.0 | | | | 0.20 | | | | – | | | | | | | | | | | | 13 | | | | 0.21 | | | | – | | | | | | | | | | | | | | | | | | | | 13 | | | | 0.21 | | | | – | | | | | | | | | | | | | |
| | | | | | | | | | | | | | | | | | | | | | | | |
| | | | | Mt | | | % Cu | | | kg/t
U3O8 | | | g/t Au | | | g/t Ag | | | Mt | | | % Cu | | | kg/t
U3O8 | | | g/t Au | | | g/t Ag | | | Mt | | | % Cu | | | kg/t
U3O8 | | | g/t Au | | | g/t Ag | | | | | | | | | Mt | | | % Cu | | | kg/t
U3O8 | | | g/t Au | | | g/t Ag | | | | |
Copper Uranium | | | | | | | | | | | | | | | | | | | | | | | | | | | | | | | | | | | | | | | | | | | | | | | | | | | | | | | | | | | | | | | | | | | | | | | | | | | | | | | | | | | | | | | | | | | | | | |
Olympic Dam | | Sulphide | | | 151 | | | | 1.92 | | | | 0.59 | | | | 0.70 | | | | 4 | | | | 468 | | | | 1.71 | | | | 0.56 | | | | 0.75 | | | | 3 | | | | 619 | | | | 1.76 | | | | 0.57 | | | | 0.74 | | | | 3 | | | | 56 | | | | 100 | | | | 629 | | | | 1.76 | | | | 0.57 | | | | 0.73 | | | | 3.36 | | | | 57 | |
| | | | | | | | | | | | | | | | | | | | | | | | |
| | | | | Mt | | | % Cu | | | % Zn | | | g/t Ag | | | ppmMo | | | Mt | | | % Cu | | | % Zn | | | g/t Ag | | | ppmMo | | | Mt | | | % Cu | | | % Zn | | | g/t Ag | | | ppmMo | | | | | | | | | Mt | | | % Cu | | | % Zn | | | g/t Ag | | | % Mo | | | | |
Copper Zinc | | | | | | | | | | | | | | | | | | | | | | | | | | | | | | | | | | | | | | | | | | | | | | | | | | | | | | | | | | | | | | | | | | | | | | | | | | | | | | | | | | | | | | | | | | | | | | |
Antamina(8) | | Sulphide
Cu only | | | 87 | | | | 0.89 | | | | 0.11 | | | | 8 | | | | 280 | | | | 411 | | | | 0.93 | | | | 0.11 | | | | 9 | | | | 290 | | | | 498 | | | | 0.92 | | | | 0.11 | | | | 9 | | | | 290 | | | | 14 | | | | 33.75 | | | | 549 | | | | 0.96 | | | | 0.15 | | | | 8.7 | | | | 0.027 | | | | 16 | |
| | Sulphide
Cu-Zn | | | 41 | | | | 0.89 | | | | 1.88 | | | | 15 | | | | 70 | | | | 185 | | | | 0.98 | | | | 2.13 | | | | 15 | | | | 70 | | | | 226 | | | | 0.96 | | | | 2.08 | | | | 15 | | | | 70 | | | | | | | | | | | | 214 | | | | 0.82 | | | | 1.96 | | | | 14.4 | | | | 0.006 | | | | | |
| | | | | | | | | | | | | | | | | | | | | | | | |
| | | | | Mt | | | g/t Ag | | | % Pb | | | % Zn | | | | | | Mt | | | g/t Ag | | | % Pb | | | % Zn | | | | | | Mt | | | g/t Ag | | | % Pb | | | % Zn | | | | | | | | | | | | Mt | | | g/t Ag | | | % Pb | | | % Zn | | | | | | | |
Silver Lead Zinc | | | | | | | | | | | | | | | | | | | | | | | | | | | | | | | | | | | | | | | | | | | | | | | | | | | | | | | | | | | | | | | | | | | | | | | | | | | | | | | | | | | | | | | | | | | | | | |
Cannington(9) | | UG
Sulphide | | | 22 | | | | 249 | | | | 6.51 | | | | 3.79 | | | | | | | | 3.0 | | | | 234 | | | | 5.97 | | | | 3.93 | | | | | | | | 25 | | | | 247 | | | | 6.45 | | | | 3.81 | | | | | | | | 11 | | | | 100 | | | | 23 | | | | 266 | | | | 7.0 | | | | 3.7 | | | | | | | | 8 | |
| | | | | | | | | | | | | | | | | | | | | | | | | | | | | | | | | | | | | | | | | | | | | | | | | | | | | | | | | | | | | | | | | | | | | | | | | | | | | | | | | | | | | | | | | | | | | | |
As at 30 June 2015 | | | As at 30 June 2014 | |
Commodity
Deposit (1)(2)(3)(4) | | Ore Type | | Proven Ore Reserves | | | Probable Ore Reserves | | | Total Ore Reserves | | | Reserve
Life
(years) | | | BHP
Billiton
Interest
% | | | Total Ore Reserves | | | Reserve
Life
(years) | |
| | | Mt | | | % TCu | | | % SCu | | | | | | | | | Mt | | | % TCu | | | % SCu | | | | | | | | | Mt | | | % TCu | | | % SCu | | | | | | | | | | | Mt | | | % TCu | | | % SCu | | | | | | | | |
Copper | | | | | | | | | | | | | | | | | | | | | | | | | | | | | | | | | | | | | | | | | | | | | | | | | | | | | | | | | | | | | | | | | | | | | | | | | | | | | | | | | | | | | | | | | | | | | | |
Escondida (5) | | Oxide | | | 105 | | | | 0.81 | | | | – | | | | | | | | | | | | 42 | | | | 0.63 | | | | – | | | | | | | | | | | | 147 | | | | 0.76 | | | | – | | | | | | | | | | | | 54 | | | | 57.5 | | | | 145 | | | | 0.80 | | | | – | | | | | | | | | | | | 52 | |
| | Sulphide | | | 3,720 | | | | 0.73 | | | | – | | | | | | | | | | | | 1,890 | | | | 0.56 | | | | – | | | | | | | | | | | | 5,610 | | | | 0.67 | | | | – | | | | | | | | | | | | | | | | | | | | 5,150 | | | | 0.70 | | | | – | | | | | | | | | | | | | |
| | Sulphide
Leach | | | 1,880 | | | | 0.46 | | | | – | | | | | | | | | | | | 770 | | | | 0.41 | | | | – | | | | | | | | | | | | 2,640 | | | | 0.45 | | | | – | | | | | | | | | | | | | | | | | | | | 2,260 | | | | 0.44 | | | | – | | | | | | | | | | | | | |
Cerro Colorado(6) | | Oxide | | | 16 | | | | 0.59 | | | | 0.43 | | | | | | | | | | | | 83 | | | | 0.56 | | | | 0.39 | | | | | | | | | | | | 99 | | | | 0.56 | | | | 0.40 | | | | | | | | | | | | 7.9 | | | | 100 | | | | 103 | | | | 0.56 | | | | 0.38 | | | | | | | | | | | | 9.0 | |
| | Sulphide | | | 16 | | | | 0.68 | | | | 0.11 | | | | | | | | | | | | 38 | | | | 0.61 | | | | 0.12 | | | | | | | | | | | | 54 | | | | 0.63 | | | | 0.12 | | | | | | | | | | | | | | | | | | | | 62 | | | | 0.65 | | | | 0.12 | | | | | | | | | | | | | |
Spence(7) | | Oxide | | | 38 | | | | 0.68 | | | | 0.48 | | | | | | | | | | | | 2.9 | | | | 0.72 | | | | 0.60 | | | | | | | | | | | | 41 | | | | 0.68 | | | | 0.49 | | | | | | | | | | | | 8.9 | | | | 100 | | | | 37 | | | | 0.76 | | | | 0.54 | | | | | | | | | | | | 10 | |
| | Oxide
Low
Solubility | | | 14 | | | | 0.86 | | | | 0.39 | | | | | | | | | | | | 12 | | | | 0.57 | | | | 0.22 | | | | | | | | | | | | 26 | | | | 0.73 | | | | 0.31 | | | | | | | | | | | | | | | | | | | | 33 | | | | 0.82 | | | | 0.36 | | | | | | | | | | | | | |
| | Supergene
Sulphide | | | 104 | | | | 0.93 | | | | 0.12 | | | | | | | | | | | | 31 | | | | 0.62 | | | | 0.11 | | | | | | | | | | | | 135 | | | | 0.86 | | | | 0.12 | | | | | | | | | | | | | | | | | | | | 153 | | | | 0.90 | | | | 0.12 | | | | | | | | | | | | | |
| | ROM | | | – | | | | – | | | | – | | | | | | | | | | | | 55 | | | | 0.37 | | | | 0.08 | | | | | | | | | | | | 55 | | | | 0.37 | | | | 0.08 | | | | | | | | | | | | | | | | | | | | 61 | | | | 0.39 | | | | 0.09 | | | | | | | | | | | | | |
| | | | | | | | | | | | | | | | | | | | | | | | |
| | | | | Mt | | | % Cu | | | kg/t
U3O8 | | | g/tAu | | | g/tAg | | | Mt | | | % Cu | | | kg/t
U3O8 | | | g/tAu | | | g/tAg | | | Mt | | | % Cu | | | kg/t
U3O8 | | | g/tAu | | | g/tAg | | | | | | | | | Mt | | | % Cu | | | kg/t
U3O8 | | | g/tAu | | | g/tAg | | | | |
Copper Uranium | | | | | | | | | | | | | | | | | | | | | | | | | | | | | | | | | | | | | | | | | | | | | | | | | | | | | | | | | | | | | | | | | | | | | | | | | | | | | | | | | | | | | | | | | | | | | | |
Olympic Dam(8) | | Sulphide | | | 144 | | | | 2.02 | | | | 0.61 | | | | 0.71 | | | | 5 | | | | 340 | | | | 1.92 | | | | 0.58 | | | | 0.75 | | | | 3 | | | | 484 | | | | 1.95 | | | | 0.59 | | | | 0.74 | | | | 4 | | | | 48 | | | | 100 | | | | 518 | | | | 1.86 | | | | 0.57 | | | | 0.72 | | | | 4 | | | | 47 | |
| | SP | | | 7.9 | | | | 0.99 | | | | 0.36 | | | | 0.59 | | | | 2 | | | | 36 | | | | 0.99 | | | | 0.37 | | | | 0.49 | | | | 2 | | | | 44 | | | | 0.99 | | | | 0.37 | | | | 0.51 | | | | 2 | | | | | | | | | | | | – | | | | – | | | | – | | | | – | | | | – | | | | | |
| | | | | | | | | | | | | | | | | | | | | | | | |
| | | | | Mt | | | % Cu | | | % Zn | | | g/tAg | | | ppmMo | | | Mt | | | % Cu | | | % Zn | | | g/tAg | | | ppmMo | | | Mt | | | % Cu | | | % Zn | | | g/tAg | | | ppmMo | | | | | | | | | Mt | | | % Cu | | | % Zn | | | g/tAg | | | ppmMo | | | | |
Copper Zinc | | | | | | | | | | | | | | | | | | | | | | | | | | | | | | | | | | | | | | | | | | | | | | | | | | | | | | | | | | | | | | | | | | | | | | | | | | | | | | | | | | | | | | | | | | | | | | |
Antamina | | Sulphide
Cu only | | | 128 | | | | 1.03 | | | | 0.15 | | | | 9 | | | | 370 | | | | 224 | | | | 0.98 | | | | 0.18 | | | | 8 | | | | 330 | | | | 352 | | | | 1.00 | | | | 0.17 | | | | 8 | | | | 340 | | | | 12 | | | | 33.75 | | | | 413 | | | | 0.99 | | | | 0.16 | | | | 9 | | | | 310 | | | | 13 | |
| | Sulphide
Cu-Zn | | | 62 | | | | 1.05 | | | | 2.24 | | | | 17 | | | | 100 | | | | 200 | | | | 0.83 | | | | 2.07 | | | | 13 | | | | 80 | | | | 262 | | | | 0.88 | | | | 2.11 | | | | 14 | | | | 80 | | | | | | | | | | | | 260 | | | | 0.95 | | | | 1.89 | | | | 15 | | | | 74 | | | | | |
| | | | |
Deposit | | Ore Type | | Ore Reserves |
Escondida | | Oxide | | ³0.30%TCu 0.20%SCu |
| | Sulphide | | – |
| | Sulphide Leach | | ³0.30%TCu and lower than variable cut-off grade (V_COG) of concentrator – thisconcentrator. Sulphide Leach is a complementaryan alternative process to the concentrators. |
| | Concentrator | | Greater than V_COG – mine plans optimised considering financial and technical parameters in order to maximise Net Present ValueValue. |
Cerro Colorado | | Oxide & Sulphide | | ³ 0.30%TCu |
Spence | | Oxide | | ³ 0.30%TCu |
| | Oxide Low Solubility | | ³ 0.30%TCu |
| | Supergene Sulphide | | ³ 0.30%TCu |
| | ROM | | ³ 0.10%TCu |
Pinto Valley
| | Sulphide | | ³ 0.25%TCu |
| | Low-grade Leach | | ³ 0.15%TCu |
Olympic Dam | | Sulphide | | Variable between 1.3%0.8%Cu and 1.8%1.4% Cu |
| | SP | | ³ 0.16% Cu |
Antamina | | Sulphide Cu only | | Net value per concentrator hour incorporating all material revenue and cost factors and includes metallurgical recovery (see footnote 4 for averages). Mineralisation at the US$6,000/hr limit averages 0.24%0.25% Cu, 6g/5g/tAg, 69ppmMo10ppmMo and 5,800t/6,700t/hr mill throughput. |
| | Sulphide Cu-Zn | | Net value per concentrator hour incorporating all material revenue and cost factors and includes metallurgical recovery (see footnote 4 for averages). Mineralisation at the US$6,000/hr limit averages 0.09%0.11% Cu, 0.93%0.75% Zn, 9g/8g/tAg and 5,430t/6,400t/hr mill throughput. |
Cannington
| | UG Sulphide
| | Net value cut-off incorporating material revenue and cost factors and includes metallurgical recovery (see footnote 4 for averages). Mineralisation at A$145/t averages 79g/tAg, 3.54%Pb and 2.85%Zn.
|
Antamina and Cannington:– All metals used in net value calculations for the Antamina and Cannington reserves arewere assumed to be recovered into concentrate (see footnote 4 for averages) and sold.
| (2) | Approximate drill hole spacings used to classify the reserves were: |
| | | | |
Deposit | | Proven Ore Reserves | | Probable Ore Reserves |
Escondida | | Oxide: 45m30m x 45m30m
Sulphide: 50m x 50m
Sulphide Leach: 60m x 60m
Sulphide: 50m x 50m | | Oxide: 45m x 45m
Sulphide: 90m x 90m
Sulphide Leach: 115m x 115m
Sulphide: 90m x 90m |
Cerro Colorado | | 70m x 70m on first kriging pass45m to 55m drill spacing | | 120m x 120m on second kriging passdrill spacing |
Spence | | Oxide: maximum 50m x 50m
Supergene Sulphide: maximum 75m65m x 75m65m | | Oxide and Supergene Sulphide: approximately 100m continuous square grid |
Pinto Valley
| | 60mmaximum 125m x 120m | | 200m x 200m125m |
Olympic Dam | | Drilling grid of 20m to 30m | | Drilling grid of 30m to 70m |
Antamina | | 30m drill spacingDrilling grid of 25m to 35m | | 55m drill spacing |
Cannington
| | 12.5m sectional x 15m vertical | | 25m sectional x 25m verticalDrilling grid of 40m to 60m |
| (3) | Ore delivered to process plant. |
| (4) | Metallurgical recoveries for the operations were: |
| | |
Deposit | | Metallurgical Recovery |
Escondida | | Oxide: 68%70%
Sulphide: 83%84%
Sulphide Leach: 29%32% |
Cerro Colorado | | 71% average forof TCu |
Spence | | Oxide: 73%
Oxide Low Solubility: 71%
Supergene Sulphide: 72%
ROM: 30% |
Pinto Valley
| | Mill: 86%
Leach: 25% |
Olympic Dam | | Cu 94%, U3O8 72%73%, Au 70%71%, Ag 66%64% |
Antamina | | Sulphide Cu only: Cu 92%93%, Zn 0%, Ag 78%79%, Mo 62%64%
Sulphide Cu-Zn: Cu 80%78%, Zn 78%81%, Ag 67%66%, Mo 0% |
Cannington
| | Ag 87%, Pb 85%, Zn 77% |
| (5) | Cerro ColoradoEscondida – The decreaseincrease in reservesOre Reserves was mainly due to changes in economic parameters.additional drilling to define and convert Probable Reserves to Proven Reserves. Inherent within the Reserve Life calculation were Oxide and Sulphide Leach which have a Reserve Life of 11 and 51 years respectively. |
| (6) | SpenceCerro Colorado – IncreaseEnvironmental and mining permit approvals required to continue operations were delayed, but are expected to be granted during CY2015 as part of the normal course of business. The current Environmental Qualification Resolution is in reserves was due to a combination of additional drilling information and the addition of mixed Sulphide and Oxide ores and Oxide Low Solubility ores previously considered waste.effect until December 2016. |
| (7) | Pinto ValleySpence – Mining resumed in November 2012. Pinto Valley is being divested with the transaction completion anticipated in FY2014.Ore type previously reported as Sulphide was redefined as Supergene Sulphide. |
| (8) | Antamina – Mo now reported as ppm, previously reported as %. |
(9) | CanningtonOlympic Dam – The increase in reserves was primarily due to increased confidence as a result of drilling which allowed for mineralisation to be converted to reserves.Ore Reserves were based on underground sub-level open stoping extraction. |
Iron Ore Business
Ore Reserves in accordance with Industry Guide 7
| | | | | | | | | | | | | | | | | | | | | | | | | | | | | | | | | | | | | | | | | | | | | | | | | | | | | | | | | | | | | | | | | | | | | | | | | | | | | | | | | | | | | | | | | | | | | | | | | | | | | | | | | | | | | | |
As at 30 June 2013 | | | As at 30 June 2012 | |
| | | | | Proven Ore Reserves | | | Probable Ore Reserves | | | Total Ore Reserves | | | Reserve
Life
(years) | | | BHP
Billiton
Interest
% | | | Total Ore Reserves | | | | | | | | | Reserve
Life
(years) | |
Commodity
Deposit(1)(2)(3)(4)(5)(6)(7) | | Ore
Type | | Mt | | | % Fe | | | % P | | | % SiO2 | | | % Al2O3 | | | % LOI | | | Mt | | | % Fe | | | % P | | | % SiO2 | | | % Al2O3 | | | % LOI | | | Mt | �� | | % Fe | | | % P | | | % SiO2 | | | % Al2O3 | | | % LOI | | | | | Mt | | | % Fe | | | % P | | | % SiO2 | | | % Al2O3 | | | % LOI | | |
Iron Ore | | | | | | | | | | | | | | | | | | | | | | | | | | | | | | | | | | | | | | | | | | | | | | | | | | | | | | | | | | | | | | | | | | | | | | | | | | | | | | | | | | | | | | | | | | | | | | | | | | | | | | | | | | | | | | |
WAIO (8)(9)(10)(11)(12) | | BKM | | | 580 | | | | 63.8 | | | | 0.10 | | | | 3.0 | | | | 1.9 | | | | 3.3 | | | | 1,400 | | | | 62.1 | | | | 0.12 | | | | 3.7 | | | | 2.2 | | | | 4.8 | | | | 2,000 | | | | 62.6 | | | | 0.11 | | | | 3.5 | | | | 2.1 | | | | 4.3 | | | | 17 | | | | 88 | | | | 1,810 | | | | 63.0 | | | | 0.11 | | | | 3.3 | | | | 2.0 | | | | 4.1 | | | | 20 | |
| | BKM Bene | | | 90 | | | | 61.1 | | | | 0.09 | | | | 6.8 | | | | 2.8 | | | | 1.7 | | | | 70 | | | | 59.9 | | | | 0.09 | | | | 8.3 | | | | 2.9 | | | | 1.8 | | | | 160 | | | | 60.6 | | | | 0.09 | | | | 7.5 | | | | 2.9 | | | | 1.7 | | | | | | | | | | | | 204 | | | | 59.9 | | | | 0.09 | | | | 8.0 | | | | 3.0 | | | | 2.0 | | | | | |
| | CID | | | 640 | | | | 56.4 | | | | 0.05 | | | | 6.2 | | | | 1.7 | | | | 11.0 | | | | 310 | | | | 56.9 | | | | 0.04 | | | | 6.4 | | | | 1.5 | | | | 10.4 | | | | 950 | | | | 56.6 | | | | 0.05 | | | | 6.2 | | | | 1.6 | | | | 10.8 | | | | | | | | | | | | 866 | | | | 57.2 | | | | 0.04 | | | | 5.7 | | | | 1.5 | | | | 10.7 | | | | | |
| | MM | | | 210 | | | | 62.3 | | | | 0.07 | | | | 3.0 | | | | 1.7 | | | | 5.6 | | | | 290 | | | | 61.2 | | | | 0.07 | | | | 3.7 | | | | 2.0 | | | | 6.1 | | | | 500 | | | | 61.7 | | | | 0.07 | | | | 3.4 | | | | 1.9 | | | | 5.9 | | | | | | | | | | | | 531 | | | | 61.9 | | | | 0.06 | | | | 3.3 | | | | 1.8 | | | | 5.9 | | | | | |
| | NIM | | | 10 | | | | 59.8 | | | | 0.06 | | | | 9.7 | | | | 1.5 | | | | 2.5 | | | | 10 | | | | 59.9 | | | | 0.05 | | | | 10.2 | | | | 1.0 | | | | 2.1 | | | | 20 | | | | 59.9 | | | | 0.06 | | | | 10.0 | | | | 1.2 | | | | 2.3 | | | | | | | | | | | | 26 | | | | 60.2 | | | | 0.06 | | | | 9.3 | | | | 1.3 | | | | 2.5 | | | | | |
| | | | | | | | | | | | | | | | | | | | | | | | | | | | |
| | | | | Mt | | | | % Fe | | | | % Pc | | | | | | | | | | | | | | | | Mt | | | | % Fe | | | | % Pc | | | | | | | | | | | | | | | | Mt | | | | % Fe | | | | % Pc | | | | | | | | | | | | | | | | | | | | | | | | Mt | | | | % Fe | | | | % Pc | | | | | | | | | | | | | | | | | |
Samarco JV (13) | | ROM | | | 1,900 | | | | 40.2 | | | | 0.05 | | | | | | | | | | | | | | | | 1,100 | | | | 38.8 | | | | 0.05 | | | | | | | | | | | | | | | | 3,000 | | | | 39.7 | | | | 0.05 | | | | | | | | | | | | | | | | 40 | | | | 50 | | | | 2,021 | | | | 41.1 | | | | 0.05 | | | | | | | | | | | | | | | | 31 | |
(1) | Western Australia Iron Ore (WAIO) reserves are reported in FY2013 on a Pilbara basis by ore type to align with our future strategy for a Pilbara lump product. This also reflects our single logistics chain and associated management system and our equalisation of joint venture equity (refer footnote 12). |
(2) | WAIO BHP Billiton interest is reported as Pilbara reserve tonnes weighted average across all Joint Ventures. |
(3) | Approximate drill hole spacings used to classify the reserves were: |
| | | | |
Deposit
| | Proven Ore Reserves
| | Probable Ore Reserves
|
WAIO
| | 50m x 50m | | 150m x 50m |
Samarco JV
| | 200m x 200m x 16m | | 400m x 400m x 16m |
(4) | WAIO metallurgical recovery was 100%, except for BKM Bene-Brockman Beneficiated Ore, where recovery was 74% (tonnage basis), Samarco JV recovery was 82% (metal basis). |
(5) | The reserves grades listed refer to in situ mass percentage on a dry weight basis. WAIO tonnages represent wet tonnes based on the following moisture contents: BKM – Brockman 3%, BKM Bene – 3%, MM – Marra Mamba 4%, CID – Channel Iron Deposits 8%, NIM – Nimingarra 3.5%. For Samarco JV, the reserve tonnages also represent wet tonnes based on a moisture content of 6.5% for ROM. Iron ore is marketed as Lump (direct blast furnace feed) and Fines (sinter plant feed) (WAIO) and as Fines (sinter plant feed), direct reduction and blast furnace pellets (Samarco JV). |
(6) | Cut-off grades – WAIO: 50 – 58% Fe for all material types; Samarco JV: Fe³ 22%, Pc£ 0.097% (phosphorous in concentrate) and PPCc£ 7.7% (LOI in concentrate). |
(7) | Ore delivered to process plant. |
(8) | WAIO reserves are all located on State Agreement mining leases that guarantee the right to mine, except Cattle Gorge and Callawa (part of Mt Goldsworthy JV Northern), which reside on standard Western Australian mining leases. Across WAIO, we are required to obtain certain State Government approvals (including environmental and heritage clearances) before we commence mining operations in a particular area. We have included in our Ore Reserves areas where one or more approvals remain outstanding but where, based on the technical investigations we carry out as part of our mine planning process and our knowledge and experience of the approvals process, we expect that such approvals will be obtained as part of the normal course of business and within the time frame required by the current mine schedule. |
(9) | WAIO – Decrease in Reserve Life was due to an increase in nominated production from 170Mtpa in FY2012 to 207Mtpa in FY2013. |
(10) | WAIO – Decrease in BKM Bene reserves was due to revision of economic assumptions used in the mine planning process. |
(11) | WAIO – Reserves tonnage increase was due to revision of economic assumptions used in the mine planning process. |
(12) | Jimblebar JV – Following completion of the ITOCHU and Mitsui transaction in July 2013, whereby ITOCHU and Mitsui have agreed to increase capital contributions to the project, BHP Billiton’s economic interest in the Jimblebar JV was reduced to 85%. |
(13) | Samarco JV – Increase in reserves was due to a model update incorporating additional drilling and a lower cut-off grade. |
Coal Business
Coal Reserves in accordance with Industry Guide 7
| | | | | | | | | | | | | | | | | | | | | | | | | | | | | | | | | | | | | | | | | | | | | | | | | | | | | | | | | | | | | | | | | | | | | | | | | | | | | | | | | | | | | | | | | | | | |
As at 30 June 2013 | | | As at 30 June 2012 | |
Commodity
Deposit (1)(2)(3)(4)(5) | | Mining
Method | | Coal
Type | | Proven Coal
Reserves | | | Probable Coal
Reserves | | | Total Coal
Reserves | | | Proven Marketable
Coal Reserves | | | Probable Marketable
Coal Reserves | | | Total Marketable Coal
Reserves | | | Reserve
Life
(years) | | | BHP
Billiton
Interest % | | | Total Marketable Coal
Reserves | | | Reserve
Life
(years) | |
| | | | Mt | | | Mt | | | Mt | | | Mt | | | % Ash | | | % VM | | | % S | | | Mt | | | % Ash | | | % VM | | | % S | | | Mt | | | % Ash | | | % VM | | | % S | | | | | Mt | | | % Ash | | | % VM | | | % S | | |
Metallurgical Coal | | | | | | | | | | | | | | | | | | | | | | | | | | | | | | | | | | | | | | | | | | | | | | | | | | | | | | | | | | | | | | | | | | | | | | | | | | | | | | | | | | | | | | | | | | | | |
Queensland Coal | | | | | | | | | | | | | | | | | | | | | | | | | | | | | | | | | | | | | | | | | | | | | | | | | | | | | | | | | | | | | | | | | | | | | | | | | | | | | | | | | | | | | | | | | | | | |
CQCA JV | | | | | | | | | | | | | | | | | | | | | | | | | | | | | | | | | | | | | | | | | | | | | | | | | | | | | | | | | | | | | | | | | | | | | | | | | | | | | | | | | | | | | | | | | | | | |
Goonyella Riverside Broadmeadow (6) | | OC | | Met | | | 338 | | | | 224 | | | | 562 | | | | 257 | | | | 9.3 | | | | 22.7 | | | | 0.50 | | | | 160 | | | | 10.5 | | | | 22.7 | | | | 0.50 | | | | 417 | | | | 9.8 | | | | 22.7 | | | | 0.50 | | | | 32 | | | | 50 | | | | 426 | | | | 9.8 | | | | 22.7 | | | | 0.50 | | | | 36 | |
| | UG | | Met | | | 43 | | | | 135 | | | | 178 | | | | 36 | | | | 6.9 | | | | 24.1 | | | | 0.51 | | | | 110 | | | | 7.0 | | | | 24.2 | | | | 0.52 | | | | 146 | | | | 7.0 | | | | 24.2 | | | | 0.52 | | | | | | | | | | | | 149 | | | | 7.0 | | | | 24.2 | | | | 0.52 | | | | | |
Peak Downs | | OC | | Met | | | 515 | | | | 548 | | | | 1,063 | | | | 309 | | | | 10.6 | | | | 22.3 | | | | 0.60 | | | | 317 | | | | 10.3 | | | | 21.9 | | | | 0.59 | | | | 626 | | | | 10.5 | | | | 22.1 | | | | 0.60 | | | | 34 | | | | 50 | | | | 634 | | | | 10.5 | | | | 22.1 | | | | 0.60 | | | | 35 | |
Saraji | | OC | | Met | | | 400 | | | | 153 | | | | 553 | | | | 249 | | | | 10.6 | | | | 18.0 | | | | 0.60 | | | | 87 | | | | 10.6 | | | | 18.5 | | | | 0.70 | | | | 336 | | | | 10.6 | | | | 18.1 | | | | 0.63 | | | | 39 | | | | 50 | | | | 343 | | | | 10.6 | | | | 18.1 | | | | 0.63 | | | | 40 | |
Norwich Park | | OC | | Met | | | 154 | | | | 62 | | | | 216 | | | | 111 | | | | 10.3 | | | | 16.8 | | | | 0.70 | | | | 42 | | | | 10.3 | | | | 16.4 | | | | 0.70 | | | | 153 | | | | 10.3 | | | | 16.7 | | | | 0.70 | | | | 25 | | | | 50 | | | | 154 | | | | 10.3 | | | | 16.7 | | | | 0.70 | | | | 25 | |
Blackwater | | OC | | Met/Th | | | 158 | | | | 379 | | | | 537 | | | | 139 | | | | 8.0 | | | | 26.7 | | | | 0.40 | | | | 333 | | | | 9.1 | | | | 26.1 | | | | 0.40 | | | | 472 | | | | 8.8 | | | | 26.3 | | | | 0.40 | | | | 35 | | | | 50 | | | | 483 | | | | 8.8 | | | | 26.3 | | | | 0.40 | | | | 36 | |
Daunia(7) | | OC | | Met | | | 93 | | | | 50 | | | | 143 | | | | 76 | | | | 8.2 | | | | 20.8 | | | | 0.36 | | | | 40 | | | | 8.4 | | | | 20.5 | | | | 0.34 | | | | 116 | | | | 8.2 | | | | 20.7 | | | | 0.36 | | | | 32 | | | | 50 | | | | 117 | | | | 8.2 | | | | 20.7 | | | | 0.34 | | | | 26 | |
Gregory JV | | | | | | | | | | | | | | | | | | | | | | | | | | | | | | | | | | | | | | | | | | | | | | | | | | | | | | | | | | | | | | | | | | | | | | | | | | | | | | | | | | | | | | | | | | | | |
Gregory Crinum (8) | | OC | | Met | | | 6.6 | | | | 0.3 | | | | 6.9 | | | | 5.4 | | | | 7.0 | | | | 34.8 | | | | 0.60 | | | | 0.2 | | | | 7.0 | | | | 35.3 | | | | 0.60 | | | | 5.6 | | | | 7.0 | | | | 34.8 | | | | 0.60 | | | | 3 | | | | 50 | | | | 8.0 | | | | 7.4 | | | | 33.0 | | | | 0.60 | | | | 4 | |
| | UG | | Met | | | – | | | | 17 | | | | 17 | | | | – | | | | – | | | | – | | | | – | | | | 14 | | | | 7.5 | | | | 33.7 | | | | 0.60 | | | | 14 | | | | 7.5 | | | | 33.7 | | | | 0.60 | | | | | | | | | | | | 19 | | | | 7.5 | | | | 33.7 | | | | 0.60 | | | | | |
BHP Billiton Mitsui | | | | | | | | | | | | | | | | | | | | | | | | | | | | | | | | | | | | | | | | | | | | | | | | | | | | | | | | | | | | | | | | | | | | | | | | | | | | | | | | | | | | | | | | | | | | |
South Walker Creek(9) | | OC | | Met | | | 76 | | | | 42 | | | | 118 | | | | 55 | | | | 9.0 | | | | 14.5 | | | | 0.30 | | | | 30 | | | | 9.0 | | | | 14.0 | | | | 0.30 | | | | 85 | | | | 9.0 | | | | 14.3 | | | | 0.30 | | | | 21 | | | | 80 | | | | 88 | | | | 9.1 | | | | 13.2 | | | | 0.30 | | | | 21 | |
Poitrel-Winchester (10) | | OC | | Met | | | 32 | | | | 22 | | | | 54 | | | | 23 | | | | 8.5 | | | | 23.3 | | | | 0.30 | | | | 16 | | | | 8.5 | | | | 23.9 | | | | 0.40 | | | | 38 | | | | 8.5 | | | | 23.5 | | | | 0.34 | | | | 13 | | | | 80 | | | | 44 | | | | 8.0 | | | | 23.5 | | | | 0.35 | | | | 14 | |
Illawarra Coal | | | | | | | | | | | | | | | | | | | | | | | | | | | | | | | | | | | | | | | | | | | | | | | | | | | | | | | | | | | | | | | | | | | | | | | | | | | | | | | | | | | | | | | | | | | | |
Appin(11) | | UG | | Met/Th | | | 26 | | | | 133 | | | | 159 | | | | 22 | | | | 8.9 | | | | 23.5 | | | | 0.37 | | | | 112 | | | | 8.9 | | | | 24.9 | | | | 0.36 | | | | 134 | | | | 8.9 | | | | 24.7 | | | | 0.36 | | | | 26 | | | | 100 | | | | 103 | | | | 8.9 | | | | 24.2 | | | | 0.36 | | | | 31 | |
West Cliff(12) | | UG | | Met/Th | | | 2.2 | | | | 5.5 | | | | 7.7 | | | | 1.6 | | | | 8.9 | | | | 21.0 | | | | 0.35 | | | | 4.2 | | | | 8.9 | | | | 20.6 | | | | 0.36 | | | | 5.8 | | | | 8.9 | | | | 20.7 | | | | 0.36 | | | | 3 | | | | 100 | | | | 7.9 | | | | 8.9 | | | | 21.0 | | | | 0.36 | | | | 4 | |
Dendrobium(13) | | UG | | Met/Th | | | 26 | | | | 24 | | | | 50 | | | | – | | | | – | | | | – | | | | – | | | | – | | | | – | | | | – | | | | – | | | | – | | | | – | | | | – | | | | – | | | | 10 | | | | 100 | | | | – | | | | – | | | | – | | | | – | | | | 15 | |
| | UG | | Met | | | – | | | | – | | | | – | | | | 10 | | | | 9.7 | | | | 23.8 | | | | 0.59 | | | | 10 | | | | 9.7 | | | | 24.2 | | | | 0.59 | | | | 20 | | | | 9.7 | | | | 24.0 | | | | 0.59 | | | | | | | | | | | | 21 | | | | 9.7 | | | | 24.0 | | | | 0.59 | | | | | |
| | UG | | Th | | | – | | | | – | | | | – | | | | 6.4 | | | | 23.0 | | | | – | | | | – | | | | 6.4 | | | | 23.0 | | | | – | | | | – | | | | 13 | | | | 23.0 | | | | – | | | | – | | | | | | | | | | | | 12 | | | | 23.0 | | | | – | | | | – | | | | | |
(1) | Only geophysically logged, fully analysed cored holes with greater than 95% recovery were used to classify the reserves. Drill hole spacings vary between seams and geological domains and were determined in conjunction with geostatistical analyses where applicable. The range of maximum spacings was: |
| | | | |
Deposit
| | Proven Coal Reserves
| | Probable Coal Reserves
|
Goonyella Riverside Broadmeadow
| | 500m to 1,000m plus 3D seismic coverage for UG | | 1,000m to 2,050m |
Peak Downs
| | 500m to 1,050m | | 500m to 2,100m |
Saraji
| | 500m to 1,040m | | 900m to 2,100m |
Norwich Park
| | 500m to 1,400m | | 1,000m to 2,800m |
Blackwater
| | 500m | | 500m to 1,000m |
Daunia
| | 500m to 1,000m | | 1,000m to 2,000m |
Gregory Crinum
| | 850m plus 3D seismic coverage for UG | | 850m to 1,700m |
South Walker Creek
| | 500m to 800m | | 1,000m to 1,500m |
Poitrel-Winchester
| | 300m to 950m | | 550m to 1,850m |
Appin
| | 700m | | 1,500m |
West Cliff
| | 700m | | 1,500m |
Dendrobium
| | 700m | | 1,500m |
(2) | Processing recoveries for the operations were: |
| | |
Deposit
| | Processing Recovery
|
Goonyella Riverside Broadmeadow
| | 76% |
Peak Downs
| | Peak Downs: 62%
Caval Ridge: 56%
|
Saraji
| | 63% |
Norwich Park
| | 71% |
Blackwater
| | 88% |
Daunia
| | 80% |
Gregory Crinum
| | 82% |
South Walker Creek
| | 72% |
Poitrel-Winchester
| | 67% |
Appin
| | 84% |
West Cliff
| | 75% |
Dendrobium
| | 67% |
(3) | Total Coal Reserves are at the moisture content when mined (BHP Billiton Mitsui at 4% Moisture Content). Total Marketable Coal Reserves (tonnes) are the tonnage of coal available, at moisture content (9% CQCA JV, Gregory JV, BHP Billiton Mitsui; 9% Appin, West Cliff; 13.5% Dendrobium Met; 7% Dendrobium Th) and air-dried quality, for sale after the beneficiation of the Total Coal Reserves. Note that where the coal will not be beneficiated, the tonnes of Total Coal Reserves are the tonnes of Total Marketable Coal Reserves, with moisture adjustment where applicable. |
(4) | Cut-off criteria applied were – Goonyella Riverside Broadmeadow, Peak Downs, Norwich Park, Blackwater and South Walker Creek:³0.5m seam thickness; Daunia, Gregory Crinum and Poitrel-Winchester:³0.3m seam thickness; Saraji:³0.3m seam thickness and³20% yield; Appin, Westcliff, Dendrobium:³1.8m seam thickness. |
(5) | Coal delivered to wash plant. |
(6) | Goonyella Riverside Broadmeadow – The decrease in Reserve Life was due to an increase in the nominated production rate from 21 Mtpa in FY2012 to 23 Mtpa in FY2013. |
(7) | Daunia – The increase in Reserve Life was due to a decrease in the nominated production rate from 5.6 Mtpa in FY2012 to 4.5 Mtpa in FY2013. |
(8) | Gregory Crinum – Decrease in Coal Reserves was due to revised economic parameters. |
(9) | South Walker Creek – Coal type previously called Met/Th is now called Met based on product specifications. A new geological model incorporating additional structural and analytical data resulted in processing recovery being reduced from 75% in FY2012 to 72% in FY2013. The decrease in Coal Reserves was due to the processing recovery downgrade and economic factors. |
(10) | Poitrel-Winchester – A new geological model incorporating additional structural and analytical data resulted in processing recovery being reduced from 74% in FY2012 to 67% in FY2013. |
(11) | Appin – Increase in Coal Reserves was due to the inclusion of an additional mining domain that is contiguous with the current operations and is covered by an existing mining tenement. The decrease in Reserve Life was due to an increase in the nominated production rate from 3.9 Mtpa in FY2012 to 6.1 Mtpa in FY2013. |
(12) | West Cliff – Decrease in Coal Reserves was due to exclusion of a thin low quality seam. |
(13) | Dendrobium – Decrease in Reserve Life was due to an increased nominated production rate from 3.2 Mtpa in FY2012 to 5 Mtpa in FY2013. |
Coal Business
Coal Reserves in accordance with Industry Guide 7
| | | | | | | | | | | | | | | | | | | | | | | | | | | | | | | | | | | | | | | | | | | | | | | | | | | | | | | | | | | | | | | | | | | | | | | | | | | | | | | | | | | | | | | | | | | | | | | | | | | | | | | | | | | | | | | | | | | | |
As at 30 June 2013 | | | As at 30 June 2012 | |
Commodity Deposit(1)(2)(3)(4) | | Mining
Method | | Coal
Type | | Proven
Coal
Reserves | | | Probable
Coal
Reserves | | | Total
Coal
Reserves | | | Proven Marketable Coal
Reserves | | | Probable Marketable Coal
Reserves | | | Total Marketable Coal Reserves | | | Reserve
Life
(years) | | | BHP
Billiton
Interest % | | | Total Marketable Coal Reserves | | | Reserve
Life
(years) | |
| | | | Mt | | | Mt | | | Mt | | | Mt | | | % Ash | | | % VM | | | % S | | | KCal/kg
CV | | | Mt | | | % Ash | | | % VM | | | % S | | | KCal/kg
CV | | | Mt | | | % Ash | | | % VM | | | % S | | | KCal/kg
CV | | | % Total
Moisture (5) | | | | | Mt | | | % Ash | | | % VM | | | % S | | | KCal/kg
CV | | | % Total
Moisture | | |
Energy Coal | | | | | | | | | | | | | | | | | | | | | | | | | | | | | | | | | | | | | | | | | | | | | | | | | | | | | | | | | | | | | | | | | | | | | | | | | | | | | | | | | | | | | | | | | | | | | | | | | | | | | | | | | | | | | | | | | | | | |
New Mexico | | | | | | | | | | | | | | | | | | | | | | | | | | | | | | | | | | | | | | | | | | | | | | | | | | | | | | | | | | | | | | | | | | | | | | | | | | | | | | | | | | | | | | | | | | | | | | | | | | | | | | | | | | | | | | | | | | | | |
San Juan(6) | | UG | | Th | | | 25 | | | | – | | | | 25 | | | | 25 | | | | 22.7 | | | | – | | | | 0.85 | | | | 5,400 | | | | – | | | | – | | | | – | | | | – | | | | – | | | | 25 | | | | 22.7 | | | | – | | | | 0.85 | | | | 5,400 | | | | 8.5 | | | | 4 | | | | 100 | | | | 31 | | | | 22.4 | | | | – | | | | 0.80 | | | | 5,300 | | | | 8.5 | | | | 6 | |
Navajo(6)(7) | | OC | | Th | | | 22 | | | | – | | | | 22 | | | | 22 | | | | 21.8 | | | | – | | | | 0.76 | | | | 4,900 | | | | – | | | | – | | | | – | | | | – | | | | – | | | | 22 | | | | 21.8 | | | | – | | | | 0.76 | | | | 4,900 | | | | 13.0 | | | | 3 | | | | 100 | | | | 30 | | | | 23.2 | | | | – | | | | 0.76 | | | | 4,800 | | | | 13.0 | | | | 4 | |
South Africa(8) | | | | | | | | | | | | | | | | | | | | | | | | | | | | | | | | | | | | | | | | | | | | | | | | | | | | | | | | | | | | | | | | | | | | | | | | | | | | | | | | | | | | | | | | | | | | | | | | | | | | | | | | | | | | | | | | | | | | |
Khutala(9) | | OC | | Th | | | 4.0 | | | | – | | | | 4.0 | | | | 3.0 | | | | 34.0 | | | | 21.6 | | | | 1.25 | | | | 4,700 | | | | – | | | | – | | | | – | | | | – | | | | – | | | | 3.0 | | | | 34.0 | | | | 21.6 | | | | 1.25 | | | | 4,700 | | | | 7.0 | | | | 7 | | | | 90 | | | | – | | | | – | | | | – | | | | – | | | | – | | | | – | | | | 8 | |
| | UG | | Th | | | 47 | | | | – | | | | 47 | | | | 44 | | | | 34.4 | | | | 20.1 | | | | 0.70 | | | | 4,400 | | | | – | | | | – | | | | – | | | | – | | | | – | | | | 44 | | | | 34.4 | | | | 20.1 | | | | 0.70 | | | | 4,400 | | | | 7.0 | | | | | | | | | | | | 58 | | | | 34.8 | | | | 20.1 | | | | 0.73 | | | | 4,400 | | | | 7.0 | | | | | |
Wolvekrans(10) | | OC | | Th | | | 276 | | | | 151 | | | | 427 | | | | 195 | | | | 24.1 | | | | 22.6 | | | | 0.48 | | | | 5,900 | | | | 133 | | | | 24.2 | | | | 22.6 | | | | 0.48 | | | | 5,900 | | | | 328 | | | | 24.2 | | | | 22.6 | | | | 0.48 | | | | 5,900 | | | | 8.0 | | | | 22 | | | | 90 | | | | 348 | | | | 19.9 | | | | 22.3 | | | | 0.76 | | | | 5,800 | | | | 7.5 | | | | 24 | |
Middelburg(11) | | OC | | Th | | | 125 | | | | – | | | | 125 | | | | 93 | | | | 24.5 | | | | 22.5 | | | | 0.50 | | | | 5,900 | | | | – | | | | – | | | | – | | | | – | | | | – | | | | 93 | | | | 24.5 | | | | 22.5 | | | | 0.50 | | | | 5,900 | | | | 8.0 | | | | 24 | | | | 90 | | | | 104 | | | | 20.9 | | | | 22.7 | | | | 0.63 | | | | 6,000 | | | | 7.5 | | | | 29 | |
Klipspruit(12) | | OC | | Th | | | 53 | | | | 2.0 | | | | 55 | | | | 46 | | | | 23.0 | | | | 23.3 | | | | 0.62 | | | | 5,800 | | | | 1.0 | | | | 17.5 | | | | 23.8 | | | | 0.50 | | | | 6,000 | | | | 47 | | | | 22.9 | | | | 23.3 | | | | 0.61 | | | | 5,800 | | | | 8.7 | | | | 7 | | | | 90 | | | | 53 | | | | 17.5 | | | | 23.8 | | | | 0.53 | | | | 6,200 | | | | 7.6 | | | | 8 | |
Australia | | | | | | | | | | | | | | | | | | | | | | | | | | | | | | | | | | | | | | | | | | | | | | | | | | | | | | | | | | | | | | | | | | | | | | | | | | | | | | | | | | | | | | | | | | | | | | | | | | | | | | | | | | | | | | | | | | | | |
Mt Arthur Coal(13) | | OC | | Th | | | 585 | | | | 464 | | | | 1,049 | | | | 465 | | | | 16.6 | | | | 30.7 | | | | 0.57 | | | | 6,400 | | | | 372 | | | | 16.8 | | | | 29.9 | | | | 0.50 | | | | 6,400 | | | | 837 | | | | 16.7 | | | | 30.3 | | | | 0.54 | | | | 6,400 | | | | 8.7 | | | | 40 | | | | 100 | | | | 808 | | | | 16.4 | | | | 30.4 | | | | 0.56 | | | | 6,500 | | | | 8.3 | | | | 45 | |
Colombia | | | | | | | | | | | | | | | | | | | | | | | | | | | | | | | | | | | | | | | | | | | | | | | | | | | | | | | | | | | | | | | | | | | | | | | | | | | | | | | | | | | | | | | | | | | | | | | | | | | | | | | | | | | | | | | | | | | | |
Cerrejón | | OC | | Th | | | 661 | | | | 93 | | | | 754 | | | | 640 | | | | 9.4 | | | | 33.8 | | | | 0.60 | | | | 6,200 | | | | 90 | | | | 9.0 | | | | 32.7 | | | | 0.60 | | | | 6,100 | | | | 730 | | | | 9.3 | | | | 33.7 | | | | 0.60 | | | | 6,200 | | | | 12.5 | | | | 19 | | | | 33.33 | | | | 763 | | | | 8.8 | | | | 33.0 | | | | 0.60 | | | | 6,200 | | | | 12.7 | | | | 21 | |
(1) | Approximate drill hole spacings used to classify the reserves were: |
| | | | |
Deposit
| | Proven Coal Reserves
| | Probable Coal Reserves
|
San Juan
| | < 500 m (250m radius from drill hole) | | 500m to 1,000m (250m to 500m radius from drill hole) |
Navajo
| | < 500 m (250m radius from drill hole) | | 500m to 1,000m (250m to 500m radius from drill hole) |
Khutala
| | >8 boreholes per 100ha | | 4 to 8 boreholes per 100ha |
Wolvekrans
| | >8 boreholes per 100ha | | 4 to 8 boreholes per 100ha |
Middelburg
| | >8 boreholes per 100ha | | 4 to 8 boreholes per 100ha |
Klipspruit
| | >8 boreholes per 100ha | | 4 to 8 boreholes per 100ha |
Mt Arthur Coal
| | < 500m | | 500m to 1,000m |
Cerrejón
| | >6 boreholes per 100ha | | 2 to 6 boreholes per 100ha |
(2) | Processing recoveries for the operations were: |
| | |
Deposit
| | Processing Recovery
|
San Juan
| | 100% |
Navajo
| | 100% |
Khutala
| | 93% |
Wolvekrans
| | 65% |
Middelburg
| | 65% |
Klipspruit
| | 87% |
Mt Arthur Coal
| | 70% |
Cerrejón
| | 97% |
(3) | Cut-off criteria applied were – San Juan:³ 3.0m seam thickness,³ 5,000KCal/kg CV; Navajo:³ 0.6m seam thickness; Khutala:³ 1.0m seam thickness for OC and³ 3.8m seam thickness for UG; Wolvekrans, Middelburg:³ 1.0m seam thickness,£45% ash,³ 17.9% dry ash-free volatile matter; Klipspruit:³ 1.0m seam thickness,£ 45% ash ; Mt Arthur Coal:³ 0.3m mineable seam thickness,£ 26.5% ash,³ 50% product yield; Cerrejón:³ 0.65m seam thickness. |
(4) | Coal delivered to wash plant, except for Navajo and San Juan where coal is not washed. |
(5) | Total moisture is for Total Marketable Coal Reserves product. |
(6) | San Juan and Navajo – Coal Reserves were reduced to align with current sales contracts. |
(7) | Navajo – Divestment is in progress with binding agreements anticipated in FY2014. |
(8) | South Africa – BHP Billiton interest has decreased from 100% to 90% in FY2013 due to the divestment of 8% shareholding in BHP Billiton Energy Coal South Africa (BECSA) to a Black Economic Empowerment consortium and 2% shareholding to BECSA employees through a share ownership plan. |
(9) | Khutala – The decrease in Marketable Coal Reserves was due to application of a crusher recovery factor. |
(10) | Wolvekrans – The decrease in Coal Reserves and Marketable Coal Reserves was due to additional drilling and remodelling, revised extraction factors for remaining underground pillar reserves on some coal seams and the exclusion of devolatilised coal. |
(11) | Middelburg – The decrease in Coal Reserves and Marketable Coal Reserves was due to a lower ash cut-off (58% reduced to 45%) as a result of economic constraints, the exclusion of environmentally sensitive areas and losses due to devolatilised coal. |
(12) | Klipspruit – The decrease in Coal Reserves was due to additional drilling and remodeling. Devolatilised coal was also excluded around a major intrusive dyke. |
(13) | Mt Arthur Coal – The increase in Marketable Coal Reserves was due to an increase in total moisture content, inclusion of an additional pit in the Life of Asset plan and increased product yield assumptions. The decrease in Reserve Life was due to an increase in the nominated production rate from 23.5 Mtpa in FY2012 to 26 Mtpa in FY2013. |
Aluminium, Manganese & Nickel Business
Ore Reserves in accordance with Industry Guide 7
| | | | | | | | | | | | | | | | | | | | | | | | | | | | | | | | | | | | | | | | | | | | | | | | | | | | | | | | | | | | | | | | |
As at 30 June 2013 | | | As at 30 June 2012 | |
Commodity
Deposit (1)(2)(3)(4) | | | | | Proven Ore Reserves | | | Probable Ore Reserves | | | Total Ore Reserves | | | Reserve
Life
(years) | | | BHP
Billiton
Interest
% | | | Total Ore Reserves | | | Reserve
Life
(years) | |
| | Ore Type | | | Mt | | | % A.Al2O3 | | | % R.SiO2 | | | Mt | | | % A.Al2O3 | | | % R.SiO2 | | | Mt | | | % A.Al2O3 | | | % R.SiO2 | | | | | Mt | | | % A.Al2O3 | | | % R.SiO2 | | |
Bauxite | | | | | | | | | | | | | | | | | | | | | | | | | | | | | | | | | | | | | | | | | | | | | | | | | | | | | | | | | | | | | | | | |
Australia | | | | | | | | | | | | | | | | | | | | | | | | | | | | | | | | | | | | | | | | | | | | | | | | | | | | | | | | | | | | | | | | |
Worsley | | | Laterite | | | | 250 | | | | 31.0 | | | | 1.8 | | | | 51 | | | | 30.5 | | | | 1.8 | | | | 301 | | | | 30.9 | | | | 1.8 | | | | 17 | | | | 86 | | | | 312 | | | | 31.0 | | | | 1.8 | | | | 18 | |
Brazil | | | | | | | | | | | | | | | | | | | | | | | | | | | | | | | | | | | | | | | | | | | | | | | | | | | | | | | | | | | | | | | | |
MRN (5)(6) | |
| MRN
Washed |
| | | 39 | | | | 51.0 | | | | 4.0 | | | | 12 | | | | 50.5 | | | | 4.3 | | | | 51 | | | | 50.9 | | | | 4.1 | | | | 3 | | | | 14.8 | | | | 74 | | | | 50.7 | | | | 4.2 | | | | 5 | |
(1) | Cut-off grades – Worsley:³ 24% A.Al2O3 and£ 3% R.SiO2; MRN:³ 50% TAl2O3,£ 10% TSiO2 ,³ 1m thickness and³ 30% recovery on a weight percent basis. |
(2) | Ore delivered to process plant. |
(3) | Approximate drill hole spacings used to classify the reserves were: |
| | | | |
Deposit
| | Proven Ore Reserves
| | Probable Ore Reserves
|
Worsley
| | Maximum 80m | | Maximum 160m |
MRN
| | A bauxite intersection grid of 200m, plus at least 10 samples reached by search ellipsoid. Mining and metallurgical characterisation (test pit/bulk sample), plus a reliable suite of chemical and size distribution data | | Those areas with a bauxite intersection grid spacing of less than 400 metres and/ or a 400m spaced grid with a 200m offset fill in, plus a minimum of 7 samples reached by search ellipsoid, plus a reliable suite of chemical and size distribution data |
(4) | Metallurgical recoveries for the operations were: |
| | |
Deposit
| | Estimated Metallurgical Recovery of A.Al2O3
|
Worsley (Worsley Refinery)
| | 88% |
MRN (Alumar Refinery)
| | 92% |
(5) | MRN – Washed tonnes and grade represent expected product based on forecast beneficiated yield. |
(6) | MRN – The reserves are located on mining leases that provide MRN the right to mine. Current mining areas have environmental approval to operate, however, there was a decrease in reserves due to an increase in the environmental buffer zone from 10m to 30m. |
Aluminium, Manganese & Nickel Business
Ore Reserves in accordance with Industry Guide 7
| | | | | | | | | | | | | | | | | | | | | | | | | | | | | | | | | | | | | | | | | | | | | | | | | | | | | | | | | | | | | | |
As at 30 June 2013 | | | As at 30 June 2012 | |
Commodity Deposit(1)(2)(3)(4) | | Ore Type | | Proven Ore
Reserves | | | Probable Ore
Reserves | | | Total Ore Reserves | | | Reserve
Life
(years) | | | BHP
Billiton
Interest % | | | Total Ore Reserves | | | Reserve
Life
(years) | |
| | | Mt | | | % Mn | | | % Yield | | | Mt | | | % Mn | | | % Yield | | | Mt | | | % Mn | | | % Yield | | | | | Mt | | | % Mn | | | % Yield | | |
Manganese | | | | | | | | | | | | | | | | | | | | | | | | | | | | | | | | | | | | | | | | | | | | | | | | | | | | | | | | | | | | | | |
Australia | | | | | | | | | | | | | | | | | | | | | | | | | | | | | | | | | | | | | | | | | | | | | | | | | | | | | | | | | | | | | | |
GEMCO(5) | | ROM | | | 73 | | | | 44.7 | | | | 59 | | | | 28 | | | | 44.7 | | | | 59 | | | | 101 | | | | 44.7 | | | | 59 | | | | 12 | | | | 60 | | | | 103 | | | | 45.2 | | | | 55 | | | | 12 | |
| | | | | | | | | | | | | | | | |
| South Africa(6) | | | | Mt | | | % Mn | | | % Fe | | | Mt | | | % Mn | | | % Fe | | | Mt | | | % Mn | | | % Fe | | | | | | | | | Mt | | | % Mn | | | % Fe | | | | |
Wessels | | Lower Body-HG | | | 1.9 | | | | 47.8 | | | | 11.2 | | | | 8.8 | | | | 47.5 | | | | 12.0 | | | | 11 | | | | 47.6 | | | | 11.9 | | | | 48 | | | | 44.4 | | | | 12 | | | | 47.8 | | | | 11.2 | | | | 46 | |
| | Lower Body-LG | | | 2.0 | | | | 42.3 | | | | 11.8 | | | | 11 | | | | 42.1 | | | | 13.4 | | | | 13 | | | | 42.1 | | | | 13.2 | | | | | | | | | | | | 9.7 | | | | 42.0 | | | | 11.8 | | | | | |
| | Upper Body | | | – | | | | – | | | | – | | | | 48 | | | | 41.5 | | | | 17.9 | | | | 48 | | | | 41.5 | | | | 17.9 | | | | | | | | | | | | 48 | | | | 42.0 | | | | 17.9 | | | | | |
Mamatwan | | M, C, N Zones | | | 36 | | | | 37.2 | | | | 4.5 | | | | 29 | | | | 37.1 | | | | 4.5 | | | | 65 | | | | 37.2 | | | | 4.5 | | | | 20 | | | | 44.4 | | | | 69 | | | | 37.2 | | | | 4.4 | | | | 21 | |
| | X Zone | | | 3.4 | | | | 36.7 | | | | 4.8 | | | | 0.6 | | | | 36.4 | | | | 4.5 | | | | 4.0 | | | | 36.7 | | | | 4.8 | | | | | | | | | | | | 6.1 | | | | 36.7 | | | | 4.7 | | | | | |
(1) | Cut-off grades – GEMCO:³ 40%Mn washed product and³ 1m ore thickness; Wessels:³ 45%Mn for Lower Body-HG,³ 37.5%Mn for Lower Body-LG and Upper Body; Mamatwan:³ 35%Mn for M, C, N and X Zones. |
(2) | Approximate drill hole spacings used to classify the reserves were: |
| | | | |
Deposit
| | Proven Ore Reserves
| | Probable Ore Reserves
|
GEMCO
| | 60m x 120m and 60m x 60m | | 120m x 120m |
Wessels
| | Defined as rim ±30m wide around mined-out areas, supplemented by some economically viable remnant blocks within mined-out areas | | Defined as all ground beyond 30m |
Mamatwan
| | 80m x 80m | | 160m x 160m |
(3) | Metallurgical recoveries for the operations were: |
| | |
Deposit
| | Metallurgical Recovery
|
GEMCO
| | See yield in Ore Reserves table |
Wessels
| | 88% |
Mamatwan
| | 96% |
(4) | Ore delivered to process plant. |
(5) | GEMCO – Tonnes are stated as ROM, manganese grades are given as per washed ore samples and should be read together with their respective tonnage yields. |
(6) | Wessels and Mamatwan – Tonnes are stated as wet tonnes. |
Aluminium, Manganese & Nickel Business
Ore Reserves in accordance with Industry Guide 7
| | | | | | | | | | | | | | | | | | | | | | | | | | | | | | | | | | | | | | | | | | | | | | |
As at 30 June 2013 | | | As at 30 June 2012 | |
Commodity Deposit(1)(2)(3)(4) | | Ore Type | | Proven Ore
Reserves | | | Probable Ore
Reserves | | | Total Ore
Reserves | | | Reserve
Life
(years) | | | BHP
Billiton
Interest
% | | | Total Ore
Reserves | | | Reserve
Life
(years) | |
| | | Mt | | | % Ni | | | Mt | | | % Ni | | | Mt | | | % Ni | | | | | Mt | | | % Ni | | |
Nickel Colombia | | | | | | | | | | | | | | | | | | | | | | | | | | | | | | | | | | | | | | | | | | | | | | |
Cerro Matoso(5)(6) | | Laterite | | | 25 | | | | 1.4 | | | | 18 | | | | 1.0 | | | | 43 | | | | 1.2 | | | | 28 | | | | 99.94 | | | | 57 | | | | 1.2 | | | | 32 | |
| | SP | | | 40 | | | | 1.2 | | | | – | | | | – | | | | 40 | | | | 1.2 | | | | | | | | | | | | 34 | | | | 1.2 | | | | | |
| | MNR Ore | | | 18 | | | | 0.2 | | | | – | | | | – | | | | 18 | | | | 0.2 | | | | | | | | | | | | 19 | | | | 0.2 | | | | | |
Australia – Nickel West | | | | | | | | | | | | | | | | | | | | | | | | | | | | | | | | | | | | | | | | | | | | | | |
Leinster | | OC | | | 2.9 | | | | 1.3 | | | | 0.2 | | | | 0.9 | | �� | | 3.1 | | | | 1.3 | | | | 8 | | | | 100 | | | | 3.1 | | | | 1.3 | | | | 8 | |
| | UG | | | 5.1 | | | | 1.9 | | | | 4.2 | | | | 1.8 | | | | 9.3 | | | | 1.8 | | | | | | | | | | | | 10 | | | | 1.8 | | | | | |
| | SP | | | – | | | | – | | | | 0.1 | | | | 2.3 | | | | 0.1 | | | | 2.3 | | | | | | | | | | | | – | | | | – | | | | | |
Mt Keith(7) | | OC | | | 87 | | | | 0.6 | | | | 6.0 | | | | 0.5 | | | | 93 | | | | 0.6 | | | | 12 | | | | 100 | | | | 99 | | | | 0.56 | | | | 13 | |
| | SP | | | 11 | | | | 0.5 | | | | 9.0 | | | | 0.5 | | | | 20 | | | | 0.5 | | | | | | | | | | | | 28 | | | | 0.52 | | | | | |
Cliffs | | UG | | | 0.4 | | | | 3.0 | | | | 1.2 | | | | 2.7 | | | | 1.6 | | | | 2.8 | | | | 4 | | | | 100 | | | | 1.5 | | | | 3.1 | | | | 3 | |
(1) | Cut-off grades – Cerro Matoso:³ 0.8%Ni; Leinster:³ 0.6%Ni for OC,³ 0.9%Ni for UG and SP; Mt Keith:³ 0.35%Ni for OC and SP; Cliffs:³ 1.1%Ni for UG. |
(2) | Approximate drill hole spacings used to classify the reserves were: |
| | | | |
Deposit
| | Proven Ore Reserves
| | Probable Ore Reservess
|
Cerro Matoso
| | 35m or less with three drill holes | | 35m to 100m with three drill holes |
Leinster
| | 25m x 25m | | 25m x 50m |
Mt Keith
| | 60m x 40m | | 80m x 80m |
Cliffs
| | 25m x 25m (and development) | | 50m x 50m |
(3) Metallurgical recoveries for the operations were:
|
Deposit
| | Metallurgical Recovery
|
Cerro Matoso
| | 84% (reserves to metal) |
Leinster
| | 86% based on blended plant recovery curves and 13% Ni in concentrate |
Mt Keith
| | 65% at 21% concentrate grade |
Cliffs
| | 92% at 11% concentrate grade |
(4) | Ore delivered to process plant. |
(5) | Cerro Matoso – The decrease in laterite reserves was due to revised metallurgical parameters, revised economic parameters and an updated geotechnical model. |
(6) | Cerro Matoso – Environmental Licence approval required for the mine expansion project has been delayed but is expected to be granted. Approval of both the Environmental and Social Impact Assessment and Mining Work Program Plan is an administrative exercise and forms part of the normal course of business. |
(7) | Mt Keith – The decrease in reserves was due to the revision of mining recovery and revised recoveries for long term stockpiles. |
Petroleum & Potash Business
Ore Reserves in accordance with Industry Guide 7
| | | | | | | | | | | | | | | | | | | | | | | | | | | | | | | | | | | | | | | | | | | | | | |
As at 30 June 2013 | | | As at 30 June 2012 | |
Commodity Deposit | | Ore
Type | | Proven Ore
Reserves | | | Probable Ore
Reserves | | | Total Ore
Reserves | | | Reserve
Life
(years) | | | BHP
Billiton
Interest
% | | | Total Ore
Reserves | | | Reserve
Life
(years) | |
| | | Mt | | | cpt | | | Mt | | | cpt | | | Mt | | | cpt | | | | | Mt | | | cpt | | |
Diamonds | | | | | | | | | | | | | | | | | | | | | | | | | | | | | | | | | | | | | | | | | | | | | | |
EKATI Core Zone(1) | | OC | | | – | | | | – | | | | – | | | | – | | | | – | | | | – | | | | – | | | | – | | | | 13 | | | | 1.2 | | | | 3 | |
| | SP | | | – | | | | – | | | | – | | | | – | | | | – | | | | – | | | | | | | | | | | | 0.2 | | | | 0.3 | | | | | |
| | UG | | | – | | | | – | | | | – | | | | – | | | | – | | | | – | | | | | | | | | | | | 4.2 | | | | 0.6 | | | | | |
(1) | EKATI Core Zone and EKATI Buffer Zone – Divestment was completed in April 2013. |
3 Operating and financial review and prospects
3.1 Introduction
This section is intended to convey management’s perspective on the BHP Billiton Group’s recent operational and financial performance. We intend this disclosure to assist readers to understand and interpret the financial statements prepared in accordance with International Financial Reporting Standards (IFRS) included in this Annual Report. The basis of preparation of the financial statements is set out in note 1 ‘Accounting policies’ to the financial statements. The Operating and financial review and prospects should be read in conjunction with the financial statements, together with the accompanying notes.
We are the world’s largest diversified natural resources company, with a combined market capitalisation of approximately US$147.1 billion as at 30 June 2013. We generated Revenue of US$66.0 billion and Profit attributable to shareholders of US$10.9 billion for FY2013.
We extract and process minerals, oil and gas from our production operations located primarily in Australia, the Americas and southern Africa. We sell our products globally with sales and marketing taking place principally through our hubs in Singapore and Houston.
The following table shows the revenue by location of our customers.
| | | | | | | | | | | | |
| | | Revenue by location of customer | |
Year ended 30 June | | 2013 | | | 2012 | | | 2011 | |
| | | US$M | | | US$M | | | US$M | |
Australia | | | 4,583 | | | | 5,318 | | | | 5,487 | |
United Kingdom | | | 1,651 | | | | 956 | | | | 1,043 | |
Rest of Europe | | | 6,317 | | | | 7,419 | | | | 8,370 | |
China | | | 19,365 | | | | 21,617 | | | | 20,261 | |
Japan | | | 7,783 | | | | 8,920 | | | | 9,002 | |
Rest of Asia | | | 13,642 | | | | 15,035 | | | | 15,805 | |
North America | | | 8,417 | | | | 8,099 | | | | 6,167 | |
South America | | | 1,782 | | | | 2,013 | | | | 2,592 | |
Southern Africa | | | 1,316 | | | | 1,437 | | | | 1,548 | |
Rest of world | | | 1,112 | | | | 1,412 | | | | 1,464 | |
| | | | | | | | | | | | |
Total revenue | | | 65,968 | | | | 72,226 | | | | 71,739 | |
| | | | | | | | | | | | |
During FY2013, we implemented a new organisational structure, removing a layer of management to create a more direct line of communication with our operations. We consolidated and renamed our previous Customer Sector Groups (CSGs) into five Businesses. We now operate these five Businesses aligned with the commodities that we extract and market, reflecting the structure used by management to assess the performance of the Group.
The Group completed the following organisational changes during FY2013:
Following the sale of our diamonds business and interests in Richards Bay Minerals, we consolidated our Potash development activity with the Petroleum CSG to form the Petroleum and Potash Business. In view of the new management structure, this Business is now considered to be a single reportable segment. There were no inter-segment transactions between the Petroleum CSG and Potash business, and therefore the comparative amounts reported for the new Petroleum and Potash segment for FY2012 and FY2011 are an aggregation of Petroleum and Potash. The remaining amounts reported previously for the Diamonds and Specialty Products CSG have been included in Group and unallocated items.
The Base Metals CSG was renamed the Copper Business.
We consolidated the Metallurgical Coal and Energy Coal CSGs to form the Coal Business. In view of the new management structure, this Business is now considered to be a single reportable segment. There were no inter-segment transactions between the Metallurgical Coal and Energy Coal CSGs and therefore the comparative amounts reported for the new Coal segment for FY2012 and FY2011 are an aggregation of previously reported amounts.
We consolidated the Aluminium, Manganese and Stainless Steel Materials CSGs to form the Aluminium, Manganese and Nickel Business. In view of the new management structure, this Business is now considered to be a single reportable segment. There were no inter-segment transactions between the Stainless Steel Materials, Aluminium and Manganese CSGs, and therefore the comparative amounts reported for the new Aluminium, Manganese and Nickel segment for FY2012 and FY2011 are an aggregation of previously reported amounts.
| | |
Business
| | Principal activities
|
Petroleum and Potash
| | Exploration, development and production of oil and gas
Potash development
|
| |
Copper
| | Mining of copper, silver, lead, zinc, molybdenum, uranium and gold |
| |
Iron Ore
| | Mining of iron ore |
| |
Coal
| | Mining of metallurgical coal and energy (thermal) coal |
| |
Aluminium, Manganese and Nickel
| | Mining of bauxite, refining of bauxite into alumina and smelting of alumina into aluminium metal |
| |
| | Mining of manganese ore and production of manganese metal and alloys |
| |
| | Mining and production of nickel products |
The work of our Businesses is supported by our Group Functions and Marketing teams.
A discussion of our Businesses is located in section 2.2 ‘Business overview’. A discussion of our Marketing and minerals exploration activities is located in sections 2.4 ‘Marketing’ and 2.5 ‘Minerals exploration’, respectively.
3.2 Our strategy
Our strategy is to own and operate large, long-life, low-cost, expandable, upstream assets diversified by commodity, geography and market.
Further information about our strategic drivers can be found in section 1.5 ‘Our strategy and business model’ and in section 3.4 ‘External factors and trends affecting our results’ below.
3.3 Key measures
Our management and Board monitor a range of financial and operational performance indicators, reported on a monthly basis, to measure performance over time.
Overall financial performance
We use several financial measures to monitor the financial performance of our overall strategy. The two key measures are Profit after taxation attributable to members of the BHP Billiton Group (Attributable profit) and Underlying EBIT.
| | | | | | | | | | | | |
Year ended 30 June US$M except where stated | | 2013 | | | 2012 | | | 2011 | |
Revenue | | | 65,968 | | | | 72,226 | | | | 71,739 | |
Profit from operations | | | 19,225 | | | | 23,752 | | | | 31,816 | |
Attributable profit | | | 10,876 | | | | 15,417 | | | | 23,648 | |
Underlying EBIT(1)(2) | | | 21,127 | | | | 27,238 | | | | 31,980 | |
Net operating cash flow(3) | | | 18,252 | | | | 24,384 | | | | 30,080 | |
Underlying EBIT margin(2)(4) | | | 33.2 | % | | | 39.4 | % | | | 47.0 | % |
Underlying return on capital(2)(5) | | | 13.5 | % | | | 23.0 | % | | | 38.5 | % |
Gearing | | | 28.8 | % | | | 26.0 | % | | | 9.2 | % |
Basic earnings per share (US cents) | | | 204.4 | | | | 289.6 | | | | 429.1 | |
(1) | Underlying EBIT is earnings before net finance costs, taxation and any exceptional items. Underlying EBIT is included in the FY2013 financial statements as required by IFRS 8 ‘Operating Segments’. Our use of Underlying EBIT is explained in section 3.6.2. |
(2) | Not an IFRS measure and may be defined and used in differing ways by different entities. We believe that these non-IFRS measures provide useful information, but should not be considered as an indication of or alternative to an IFRS measure of profitability, financial performance or liquidity. Non-IFRS measures have not been subject to audit or review. |
(3) | Net operating cash flows are after net interest and taxation. |
(4) | Underlying EBIT margin comprises Underlying EBIT, excluding third party EBIT, divided by revenue, excluding third party product revenue. |
| | | | | | | | | | | | |
Year ended 30 June | | 2013 | | | 2012 | | | 2011 | |
| | | US$M | | | US$M | | | US$M | |
Revenue – Group production | | | 63,203 | | | | 68,747 | | | | 67,903 | |
Underlying EBIT(2) | | | 21,127 | | | | 27,238 | | | | 31,980 | |
Profit from operations (EBIT) – Third party products | | | (121 | ) | | | (126 | ) | | | (98 | ) |
| | | | | | | | | | | | |
Profit from operations – Group production, excluding exceptional items | | | 21,006 | | | | 27,112 | | | | 31,882 | |
| | | | | | | | | | | | |
Underlying EBIT margin(2) | | | 33.2 | % | | | 39.4 | % | | | 47.0 | % |
| | | | | | | | | | | | |
(5) | Underlying return on capital represents net profit after tax, excluding exceptional items and net finance costs (after tax), divided by average capital employed. Capital employed is net assets plus net debt. |
| | | | | | | | | | | | |
Year ended 30 June | | 2013 | | | 2012 | | | 2011 | |
| | | US$M | | | US$M | | | US$M | |
Profit after taxation excluding exceptional items and net finance costs: | | | | | | | | | | | | |
Profit after taxation | | | 11,075 | | | | 15,532 | | | | 23,946 | |
Net exceptional items after taxation | | | 922 | | | | 1,741 | | | | (1,964 | ) |
| | | | | | | | | | | | |
Profit after taxation excluding exceptional items(2) | | | 11,997 | | | | 17,273 | | | | 21,982 | |
| | | | | | | | | | | | |
Net finance costs | | | 1,353 | | | | 730 | | | | 561 | |
Income tax benefit of net finance costs(a) | | | (402 | ) | | | (239 | ) | | | (153 | ) |
| | | | | | | | | | | | |
Net finance costs (after taxation) | | | 951 | | | | 491 | | | | 408 | |
| | | | | | | | | | | | |
Profit after taxation excluding exceptional items and net finance costs(2) | | | 12,948 | | | | 17,764 | | | | 22,390 | |
| | | | | | | | | | | | |
Capital employed: | | | | | | | | | | | | |
Net assets | | | 72,035 | | | | 67,085 | | | | 57,755 | |
Net debt(b) | | | 29,105 | | | | 23,607 | | | | 5,823 | |
| | | | | | | | | | | | |
Capital employed | | | 101,140 | | | | 90,692 | | | | 63,578 | |
| | | | | | | | | | | | |
Average capital employed | | | 95,916 | | | | 77,135 | | | | 58,108 | |
| | | | | | | | | | | | |
Underlying return on capital(2) | | | 13.5 | % | | | 23.0 | % | | | 38.5 | % |
| | | | | | | | | | | | |
| (a) | Calculated at a nominal tax rate of 30 per cent adjusted for non-deductibility/assessability of exchange variations on net debt of US$13 million (2012: US$(65) million; 2011: US$51 million). Refer to note 6 ‘Net finance costs’ to the financial statements. |
| (b) | Net debt (comprising Interest bearing liabilities less Cash and cash equivalents at 30 June 2013) includes Cash and cash equivalents of US$ nil (2012: US$120 million; 2011: US$ nil) and Interest bearing liabilities of US$ nil (2012: US$178 million; 2011: US$ nil) included in assets and liabilities held for sale. |
The following are other measures that assist us to monitor our overall performance.
Production
A summary of our actual production volumes for FY2013 and the previous two financial years is shown below. Further details appear in section 2.3 ‘Production’.
| | | | | | | | | | | | |
Year ended 30 June | | 2013 | | | 2012 | | | 2011 | |
Total Petroleum production (millions of barrels of oil equivalent) | | | 235.8 | | | | 222.3 | | | | 159.4 | |
Copper (’000 tonnes) | | | 1,209.4 | | | | 1,094.5 | | | | 1,139.4 | |
Iron ore (’000 tonnes) | | | 169,856 | | | | 159,478 | | | | 134,406 | |
Metallurgical coal (’000 tonnes) | | | 37,650 | | | | 33,230 | | | | 32,678 | |
Energy coal (’000 tonnes) | | | 72,892 | | | | 71,111 | | | | 69,500 | |
Alumina (’000 tonnes) | | | 4,880 | | | | 4,152 | | | | 4,010 | |
Aluminium (’000 tonnes) | | | 1,179 | | | | 1,153 | | | | 1,246 | |
Manganese ores (’000 tonnes) | | | 8,517 | | | | 7,931 | | | | 7,093 | |
Manganese alloys (’000 tonnes) | | | 608 | | | | 602 | | | | 753 | |
Nickel (’000 tonnes) | | | 154.1 | | | | 157.9 | | | | 152.7 | |
Financial strength
Financial strength is measured by Attributable profit and Underlying EBIT as overall measures, along with measures of liquidity and capital management. Our credit rating, gearing and net debt are discussed in section 3.7.3. The final dividend declared for FY2013 maintains our progressive dividend policy.
Project pipeline
Our project pipeline focuses on commodities that are expected to be high-margin and create significant future value. The details of our project pipeline are located in sections 3.7.2 and 2.2 ‘Business overview’, with a summary presented below.
| | | | | | | | | | | | |
Year ended 30 June(1) | | 2013 | | | 2012 | | | 2011 | |
Major projects | | | | | | | | | | | | |
Number of projects approved during the year | | | 1 | | | | 8 | | | | 11 | |
Number of projects currently under development (approved in prior years) | | | 17 | | | | 12 | | | | 7 | |
Number of completed projects(2) | | | 2 | | | | 6 | | | | 3 | |
Budgeted capital expenditure for projects (approved in the year) (US$M) | | | 520 | | | | 7,468 | | | | 12,942 | |
Budgeted capital expenditure for projects under development (approved in prior years) (US$M) | | | 20,663 | | | | 15,323 | | | | 11,575 | |
Capital expenditure of completed projects (US$M) | | | 1,388 | | | | 9,160 | | | | 1,202 | |
(1) | Does not include major projects approved after 30 June 2013, including the Escondida desalination facility and expenditure on the Jansen Potash Project – refer to section 3.7.2. |
(2) | Includes Bass Strait Kipper project, which is not yet in production pending completion of the mercury removal project. |
3.4 External factors and trends affecting our results
The following section describes some of the external factors and trends that have had a material impact on our financial condition and results of operations. We operate our business in a dynamic and changing environment and with information that is rarely complete and exact. We primarily manage the risks discussed in this section under our portfolio risk management approach, which relies on the effects of diversification, rather than individual risk management programs. Details of our risk factors may be found in section 1.7.1 ‘Risk factors’. Details of our financial risk management strategies and financial instruments outstanding at 30 June 2013 may be found in section 1.7.3 ‘Management of principal risks’ and in note 29 ‘Financial risk management’ to the financial statements.
Management monitors particular trends arising from external factors with a view to managing the potential impact on our future financial condition and results of operations. The following external factors could have a material adverse effect on our business and areas where we make decisions on the basis of information that is incomplete or uncertain.
3.4.1 Commodity prices
The prices we obtain for our products is a key driver of our business, and fluctuations in these commodity prices affect our results including, cash flows and asset values. The estimated impact on FY2013 profit after taxation of changes of commodity prices is set out below.
| | | | |
| | US$M | |
US$1/bbl on oil price
| | | 47 | |
US¢10/MMBtu on US gas price
| | | 32 | |
US¢1/lb on copper price
| | | 19 | |
US$1/t on iron ore price
| | | 113 | |
US$1/t on metallurgical coal price
| | | 24 | |
US$1/t on energy coal price
| | | 27 | |
US¢1/lb on aluminium price
| | | 26 | |
US¢10/dmtu on manganese ore price
| | | 21 | |
US$1/t on manganese alloy price
| | | 1 | |
US¢1/lb on nickel price
| | | 2 | |
The following table shows prices of our most significant commodities for FY2013, FY2012 and FY2011. These prices represent selected quoted prices from the relevant sources as indicated. These prices differ from the realised prices on the sale of the Group’s production due to differences in quotational periods, quality of products, delivery terms and the range of quoted prices that are used for contracting sales in different markets.
| | | | | | | | | | | | | | | | | | | | | | | | |
Year ended 30 June | | 2013
Closing | | | 2012
Closing | | | 2011
Closing | | | 2013
Average | | | 2012
Average | | | 2011
Average | |
Crude oil (Brent)(1) (US$/bbl) | | | 102.46 | | | | 94.50 | | | | 111.51 | | | | 108.64 | | | | 112.49 | | | | 95.92 | |
Natural gas Henry Hub(2) (US$/MMBtu) | | | 3.73 | | | | 2.81 | | | | 4.39 | | | | 3.44 | | | | 3.05 | | | | 4.16 | |
Natural gas Asian Spot LNG(3) (US$/MMBtu) | | | 15.40 | | | | 14.95 | | | | 13.80 | | | | 15.14 | | | | 16.25 | | | | 10.41 | |
Ethane(4) (US$/bbl) | | | 9.92 | | | | 12.29 | | | | 32.47 | | | | 12.15 | | | | 27.31 | | | | 26.74 | |
Propane(5) (US$/bbl) | | | 35.52 | | | | 34.44 | | | | 62.42 | | | | 37.31 | | | | 54.72 | | | | 54.40 | |
Butane(6) (US$/bbl) | | | 49.51 | | | | 51.29 | | | | 74.16 | | | | 61.74 | | | | 76.72 | | | | 69.48 | |
Copper (LME cash) (US$/lb) | | | 3.06 | | | | 3.45 | | | | 4.22 | | | | 3.48 | | | | 3.71 | | | | 3.92 | |
Iron ore(7) (US$/dmt) | | | 116.25 | | | | 135.25 | | | | 170.75 | | | | 127.23 | | | | 151.17 | | | | 162.98 | |
Metallurgical coal(8) (US$/t) | | | 130.00 | | | | 221.50 | | | | 282.50 | | | | 159.13 | | | | 239.18 | | | | 248.63 | |
Energy coal(9) (US$/t) | | | 78.89 | | | | 89.22 | | | | 120.97 | | | | 89.10 | | | | 111.95 | | | | 120.42 | |
Aluminium (LME cash) (US$/t) | | | 1,731 | | | | 1,835 | | | | 2,509 | | | | 1,938 | | | | 2,168 | | | | 2,375 | |
Alumina(10) (US$/t) | | | 318 | | | | 305 | | | | 386 | | | | 327 | | | | 334 | | | | 369 | |
Manganese Alloys(11) (US$/t) | | | 1,060 | | | | 1,250 | | | | 1,320 | | | | 1,143 | | | | 1,260 | | | | 1,319 | |
Manganese Ores(12) (US$/dmtu) | | | 5.58 | | | | 5.06 | | | | 5.24 | | | | 5.21 | | | | 4.90 | | | | 6.29 | |
Nickel (LME cash) (US$/lb) | | | 6.21 | | | | 7.47 | | | | 10.49 | | | | 7.43 | | | | 8.77 | | | | 10.86 | |
(1) | Platts Dated Brent is a benchmark price assessment of the spot market value of physical cargoes of North Sea light sweet crude oil. |
(2) | Platts Gas based on Henry Hub – typically applies to gas sales in the US gas market. |
(3) | Platts Liquefied Natural Gas Delivery Ex-Ship (DES) Japan/Korea Marker – typically applies to Asian LNG spot sales. |
(4) | OPIS Mont Belvieu non-Tet Ethane – typically applies to ethane sales in the US Gulf Coast market. |
(5) | OPIS Mont Belvieu non-Tet Propane – typically applies to propane sales in the US Gulf Coast market. |
(6) | OPIS Mont Belvieu non-Tet Normal Butane – typically applies to butane sales in the US Gulf Coast market. |
(7) | Platts 62 per cent Fe Cost and Freight (CFR) China – used for fines. |
(8) | Platts Low-Vol hard coking coal Index FOB Australia – representative of high-quality hard coking coals. |
(9) | GlobalCoal FOB Newcastle 6,000 kcal/kg NCV – typically applies to coal sales in the Asia Pacific market. |
(10) | 2013 and 2012 Platts PAX Free on Board (FOB) Australia – market price assessment of calcined Metallurgical/Smelter Grade Alumina. 2011 CRU FOB Australia. |
(11) | Bulk FerroAlloy high-carbon ferromanganese (HCFeMn) US ex-warehouse. |
(12) | CRU Cost Insurance Freight (CIF) China import 43 per cent contained manganese. |
During FY2013, commodity markets were impacted by a slower pace of growth in China that was balanced in part by increased stability in European sovereign debt markets and an improved private sector performance in the United States. In the case of most steelmaking raw materials, demand growth rates outside China decreased, and combined with robust supply growth from seaborne sources, resulted in lower raw material prices than the previous year. The metals commodities attracted lower prices than the previous year as a result of supply growing faster than demand. For energy commodities, geopolitical tensions and United States economic improvements provided price support for crude oil, while the US gas prices increased due to increased seasonal demand in the residential and commercial sector and decreased storage inventories from the previous year.
The following summarises the pricing trends, based on the year-end prices, of our most significant commodities for FY2013.
Crude oil: The Platts Dated Brent crude price increased by eight per cent during FY2013, driven by Chinese demand growth in the first half of the year followed by moderate improvements in macroeconomics in the United States in the second half. Middle East political tensions provided price support, which offset negative drivers, including ongoing Eurozone concerns and a two per cent increase in US crude oil inventories.
Gas: The Platts US Henry Hub natural gas price increased by 33 per cent during FY2013. The Henry Hub price increase was driven by increased seasonal demand in the residential and commercial sector in the United States. The Asian liquefied natural gas spot price increased by three per cent during FY2013. This increase was supported by sustained demand from Japan to replace suspended nuclear capacity and growth in emerging Asian markets and Latin America.
Natural gas liquids: A barrel of natural gas liquids consists mainly of ethane and liquefied petroleum gas (propane and butane). The Mont Belvieu ethane price decreased by 19 per cent in FY2013 due to increases in supply, while Mont Belvieu propane prices increased by three per cent due to increased exports. Mont Belvieu butane prices decreased by three per cent due to lower gasoline demand.
Copper: The London Metal Exchange (LME) copper cash settlement price decreased by 11 per cent during FY2013 driven by supply growing faster than demand. Copper mine production recovered strongly in FY2013 from a constrained level, which was caused by disruptions in FY2012. Consumption remained flat during the first half of FY2013, but increased in the second half, as Chinese end-use demand increased by seven per cent.
Iron ore: The Platts 62 per cent iron ore CFR China price decreased by 14 per cent during FY2013 due to increased iron ore seaborne supply and inventory destocking at Chinese steel mills. Prices fluctuated between US$88.5 per dry metric tonne (dmt) and US$160/dmt, as movements in iron ore inventories caused volatility. Seaborne imports to China increased, as Australian supply growth more than offset the decrease in Brazilian and Indian exports. Global demand for iron ore was primarily driven by China’s record pig iron production, which recovered strongly in the second half of the financial year, after a seasonal decrease in the first half.
Metallurgical coal: The Platts Low-Vol hard coking coal Index decreased by 41 per cent during FY2013, driven by decreased growth rates of global pig iron production. Pig iron production decreased in Europe, which historically accounts for a large share of hard coking coal import demand. Supply increased during the year, particularly from Australia and Canada.
Energy coal: The Global Coal Newcastle FOB price decreased by 12 per cent during FY2013. Seaborne demand growth was driven by China and India, where volumes reached all-time record levels. Prices decreased as Indonesian, Australian and US exports increased simultaneously.
Aluminium: The LME aluminium cash settlement price decreased by six per cent during FY2013. Demand growth slowed, while simultaneously new supply continued to be added, which contributed to an increasing market surplus. During this period, LME stocks reached record levels, driven by the attractiveness of warehouse financing deals to investors.
Alumina: The Platts FOB Australia price increased by four per cent during FY2013, with price support coming from increasing demand and supply disruptions during the year. The market remained balanced, with refinery production continuing to grow in China.
Manganese: The CRU China ore import price increased by 10 per cent during FY2013. Rising ore prices in the second half of FY2013 were supported by record Chinese steel output, while supply from South Africa, Australia and Gabon increased to meet the higher demand. The US spot high-carbon ferromanganese alloy price decreased 15 per cent during FY2013. Declining alloy prices were driven by oversupply in a weak export market due to lower steel production in the developed economies of Europe and the United States
Nickel: The LME cash settlement nickel price decreased by 17 per cent during FY2013. Demand for nickel continued to grow, but at a lower rate compared with the previous year. The price decreased as a result of the demand growth being outpaced by increasing supply tonnages, coming mainly from Chinese nickel pig iron, as well as new production from greenfield projects.
3.4.2 Exchange rates
We are exposed to exchange rate transaction risk on foreign currency sales and purchases, as we believe that active currency hedging does not provide long-term benefits to our shareholders. Because a majority of our sales are denominated in US dollars, and the US dollar plays a dominant role in our business, we borrow and hold surplus cash predominantly in US dollars to provide a natural hedge. Operating costs and costs of locally sourced equipment are influenced by fluctuations in local currencies, primarily the Australian dollar, Brazilian real, Chilean peso and South African rand. Foreign exchange gains and losses reflected in operating costs owing to fluctuations in the local currencies relative to the US dollar may potentially offset one another. Volatility increased during the year, with a strengthening of the US dollar in the last quarter of FY2013. Overall the Australian dollar, Brazilian real and South African rand ended the financial year weaker against the US dollar, while the Chilean peso strengthened.
We are also exposed to exchange rate translation risk in relation to net monetary liabilities, being our foreign currency denominated monetary assets and liabilities, including debt and other long-term liabilities. Details of our exposure to foreign currency fluctuations are contained within note 29 ‘Financial risk management’ to the financial statements.
3.4.3 Changes in product demand and supply
Global demand and supply for the commodities we produce is a key driver of commodity prices, and fluctuations in product demand and supply affect our results, including cash flows and asset values.
Economic conditions over the second half of FY2013 were affected by lower than expected growth in emerging economies. Weaker trade and soft manufacturing activity pulled growth rates slightly below expectations in China. However, with employment conditions and income growth remaining resilient, the Chinese Government has room to pursue reforms that support its agenda of stable, long-term growth.
Significant cuts in government spending affected growth in the United States; however, this was offset by improved private sector demand, leading to modest rates of economic growth overall. Housing and stock market prices have also strengthened household balance sheets over the past year. As a result, we believe the recovery will continue, although risks remain regarding the unwinding of monetary policy stimulus.
The renewed policy push in Japan is also positive for medium-term growth expectations if the government can achieve its stated objectives. Europe remained relatively stable during the period; however, we do not anticipate a strong or rapid recovery while fundamental structural problems remain.
Overall, we expect more balanced global growth over the long term as China continues to develop its economy and large developed economies, such as the United States, grow despite fiscal challenges. We expect the rebalancing of the Chinese economy to be significant in terms of the nature of domestic demand, as well as the types of goods and services the economy will produce. These changes will take place gradually, particularly in relation to savings behaviour and levels of fixed asset investment. We also see India and South East Asia as significant sources of economic growth in the long term.
Prices responded to changes in the underlying fundamentals of several major commodities during FY2013. Increased demand in the United States supported natural gas markets, while record steel production rates in Asia underpinned strong demand for steelmaking raw materials. However, supply of iron ore, metallurgical coal and copper more than kept pace with increased demand, leading to a reduction in prices over the period.
In the short term, increased supply is expected to exert downward pressure on prices, although a lower rate of investment growth across the industry should, in time, lead to more balanced supply and demand. The growth rates for steel demand in Asia are expected to moderate, as the Chinese economy gradually rebalances. This rebalancing should support growth in demand for other industrial metals, energy and agricultural products.
We expect overcapacity in the aluminium and nickel industries to persist, while robust near-term supply in copper and US domestic gas should, over time, give way to market conditions more influenced by resource decline.
3.4.4 Operating costs
As the prices for our products are determined by the global commodity markets in which we operate, we do not generally have the ability to offset cost pressures through corresponding price increases; therefore, controlling our operating costs is a key driver of our results. Operating costs for the last three years are set out below.
| | | | | | | | | | | | |
Year ended 30 June | | 2013 | | | 2012 | | | 2011 | |
| | | US$M | | | US$M | | | US$M | |
Raw materials and consumables used | | | 9,445 | | | | 8,483 | | | | 8,148 | |
Employee benefits expense | | | 7,432 | | | | 6,663 | | | | 5,299 | |
External services (including transportation) (1) | | | 12,849 | | | | 14,716 | | | | 11,705 | |
Third party commodity purchases | | | 2,642 | | | | 3,381 | | | | 3,758 | |
Net foreign exchange (gains)/losses | | | (280 | ) | | | (519 | ) | | | 1,241 | |
Fair value change on derivatives | | | 79 | | | | (143 | ) | | | (104 | ) |
Government royalties paid and payable | | | 2,679 | | | | 3,051 | | | | 2,887 | |
Depreciation and amortisation expense | | | 6,945 | | | | 6,408 | | | | 5,039 | |
Exploration and evaluation expenditure | | | 1,022 | | | | 1,602 | | | | 981 | |
Impairment of assets (2) | | | 5,595 | | | | 3,763 | | | | 74 | |
Operating lease rentals | | | 754 | | | | 635 | | | | 451 | |
Other operating expenses (3) | | | 1,711 | | | | 1,340 | | | | 975 | |
| | | | | | | | | | | | |
Total expenses | | | 50,873 | | | | 49,380 | | | | 40,454 | |
| | | | | | | | | | | | |
Less exceptional items | | | (5,222 | ) | | | (3,786 | ) | | | (164 | ) |
| | | | | | | | | | | | |
Total expenses excluding exceptional items | | | 45,651 | | | | 45,594 | | | | 40,290 | |
| | | | | | | | | | | | |
(1) | Includes exceptional items of US$96 million (2012: US$ nil; 2011: US$314 million). |
(2) | Includes exceptional items of US$5,284 million (2012: US$3,663 million; 2011: US$ nil). |
(3) | Includes exceptional items of US$158 million relating to the decrease in the rehabilitation obligations in respect of former operations at the Newcastle steelworks (2012: US$ nil; 2011: US$150 million). |
We focus on operating costs excluding exceptional items because they represent a component of Underlying EBIT. Our operating costs excluding exceptional items have increased at an average rate of 10.7 per cent per annum over the past three years. During FY2013, total operating costs excluding exceptional items have remained stable, as reductions in various costs were offset by higher non-cash costs and one-off items.
Our focus on curtailing operating costs was demonstrated by a decrease of external services costs of US$1.9 billion, a decrease of third party commodity purchases of US$739 million, reduced government royalties of US$372 million and a reduction of exploration and evaluation expenditure of US$580 million.
These savings were predominantly offset by higher impairment charges of US$1.8 billion, higher depreciation and amortisation charges of US$537 million, lower foreign exchange gains of US$239 million and an unfavourable variance in fair value change on derivatives of US$222 million.
3.4.5 Capital expenditure
Capital and exploration expenditure are both important in pursuing our strategy. Capital and exploration expenditure is disclosed for each Business in the table below (presented on an accruals basis).
| | | | | | | | | | | | |
Year ended 30 June | | 2013 | | | 2012 | | | 2011 | |
| | | US$M | | | US$M | | | US$M | |
Capital and exploration expenditure(1) | | | | | | | | | | | | |
Petroleum and Potash | | | 8,494 | | | | 7,865 | | | | 2,828 | |
Copper | | | 2,366 | | | | 2,980 | | | | 1,670 | |
Iron Ore | | | 6,472 | | | | 5,921 | | | | 3,777 | |
Coal | | | 3,929 | | | | 3,875 | | | | 2,026 | |
Aluminium, Manganese and Nickel | | | 815 | | | | 1,862 | | | | 2,342 | |
Group and unallocated items | | | 132 | | | | 172 | | | | 207 | |
| | | | | | | | | | | | |
BHP Billiton Group | | | 22,208 | | | | 22,675 | | | | 12,850 | |
| | | | | | | | | | | | |
(1) | Capital and exploration expenditure includes accrued capital expenditure and excludes capitalised interest. Exploration expenditure is capitalised in accordance with our accounting policies, as set out in note 1 ‘Accounting policies’ in the financial statements. All other exploration expenditure is expensed in the period. |
Capital expenditure encompasses expenditure on major projects, as set out in section 3.7.2, and capital expenditure on sustaining and other items.
| | | | | | | | | | | | |
Year ended 30 June | | 2013 | | | 2012 | | | 2011 | |
| | | US$M | | | US$M | | | US$M | |
Capital expenditure | | | | | | | | | | | | |
Growth | | | 18,401 | | | | 17,735 | | | | 9,366 | |
Sustaining and other | | | 2,481 | | | | 2,488 | | | | 2,244 | |
| | | | | | | | | | | | |
Total | | | 20,882 | | | | 20,223 | | | | 11,610 | |
| | | | | | | | | | | | |
Exploration expenditure | | | | | | | | | | | | |
Petroleum | | | 675 | | | | 1,355 | | | | 557 | |
Minerals | | | 651 | | | | 1,097 | | | | 683 | |
| | | | | | | | | | | | |
Total | | | 1,326 | | | | 2,452 | | | | 1,240 | |
| | | | | | | | | | | | |
Total capital and exploration expenditure | | | 22,208 | | | | 22,675 | | | | 12,850 | |
| | | | | | | | | | | | |
Deferred stripping | | | (538 | ) | | | (782 | ) | | | (469 | ) |
| | | | | | | | | | | | |
Total capital and exploration expenditure excluding deferred stripping | | | 21,670 | | | | 21,893 | | | | 12,381 | |
| | | | | | | | | | | | |
Our capital and exploration expenditure increased significantly from FY2011 to FY2012, growing 76.5 per cent from US$12.9 billion to US$22.7 billion. This reflected increased investment in our project pipeline, particularly in Petroleum, Iron Ore, Coal and Copper. In FY2013, we focused on controlling capital and exploration expenditure. Total capital expenditure increased by US$659 million from FY2012 to US$20.9 billion in FY2013, whereas exploration expenditure decreased by US$1.1 billion to US$1.3 billion. Increases in capital expenditure, primarily in Onshore US (increase of US$1.5 billion) and Western Australia Iron Ore (WAIO) (increase of US$509 million) outweighed decreases, primarily in Copper and Aluminium, Manganese and Nickel. Exploration expenditure decreased across all Businesses, with the largest decrease of US$811 million in Petroleum and Potash.
No major growth projects and only one major project were approved during FY2013. At the end of FY2013, we had 18 major projects in execution, of which approximately 70 per cent were expected to deliver first production by the end of CY2014.
A detailed discussion of our project pipeline (including projects approved after 30 June 2013) is located in section 3.7.2.
We expect our capital and exploration expenditure for FY2014, excluding deferred stripping, to be approximately US$16.2 billion, which includes exploration expenditure of US$1.0 billion.
3.4.6 Exploration and development
Exploration expense represents that portion of exploration expenditure that is not capitalised in accordance with our accounting policies, as set out in note 1 ‘Accounting policies’ to the financial statements.
Exploration expense for each Business over the three-year period is set out below.
| | | | | | | | | | | | |
Year ended 30 June | | 2013 | | | 2012 | | | 2011 | |
| | | US$M | | | US$M | | | US$M | |
Exploration expense(1) | | | | | | | | | | | | |
Petroleum and Potash | | | 709 | | | | 1,038 | | | | 543 | |
Copper | | | 246 | | | | 324 | | | | 266 | |
Iron Ore | | | 74 | | | | 135 | | | | 60 | |
Coal | | | 42 | | | | 174 | | | | 93 | |
Aluminium, Manganese and Nickel | | | 53 | | | | 68 | | | | 77 | |
Group and unallocated items | | | – | | | | 7 | | | | 15 | |
| | | | | | | | | | | | |
BHP Billiton Group | | | 1,124 | | | | 1,746 | | | | 1,054 | |
| | | | | | | | | | | | |
(1) | Includes US$102 million (2012: US$144 million, 2011: US$73 million) exploration expense previously capitalised, written off as impaired. |
Exploration expense increased significantly between FY2011 and FY2012, growing by US$692 million from US$1,054 million to US$1,746 million reflecting increased exploration for oil, gas and minerals. Petroleum exploration was focused on offshore Western Australia, the Gulf of Mexico, South East Asia and our Onshore US Asset. Minerals exploration was focused on greenfield copper targets in South America and iron ore and potash targets globally.
In FY2013, the quality, scale and diversification of our existing assets have allowed us to substantially reduce our exploration. Total exploration expense declined by 36 per cent to US$1.1 billion in FY2013, with a sharpened focus on greenfield copper porphyry targets in Chile and Peru, and oil and gas prospects in the Gulf of Mexico and offshore Western Australia.
We expect exploration expenditure for FY2014 to be approximately US$1.0 billion, of which approximately US$600 million is expected to be for offshore oil and gas, and the balance related primarily to exploration for copper.
3.4.7 Interest rates
We are exposed to interest rate risk on our outstanding borrowings and investments. Our policy on interest rate exposure is for interest on our borrowings to be on a US dollar floating interest rate basis. Deviation from our policy requires the prior approval of our Financial Risk Management Committee and is managed within our Cash Flow at Risk (CFaR) framework, which is described in note 29 ‘Financial risk management’ to the financial
statements. When required under this strategy, we use interest rate swaps, including cross currency interest rate swaps, to convert a fixed rate exposure to a floating rate exposure, as well as using swaptions to manage the fixed interest rate exposure. As at 30 June 2013, the Group held US$5.4 billion (2012: US$4.3 billion) of centrally managed fixed interest rate borrowings, as well as US$4.4 billion (2012: US$4.0 billion) of other fixed interest rate borrowings, that have not been swapped to floating interest rates, primarily arising from debt raised during FY2012 and FY2013, debt assumed as part of the acquisition of Petrohawk and debt raised prior to the DLC merger.
Our earnings are sensitive to changes in interest rates on the floating interest rate component of the Group’s net borrowings. Based on the net debt position as at 30 June 2013, taking into account interest rate swaps, cross currency interest rate swaps and swaptions, it is estimated that a one percentage point increase in the US LIBOR interest rate will decrease the Group’s equity and profit after taxation by US$136 million (2012: decrease of US$103 million). This assumes that the change in interest rates is effective from the beginning of the financial year and the fixed/floating mix and balances are constant over the year. However, interest rates and the net debt profile of the Group may not remain constant over the coming financial year and therefore such sensitivity analysis should be used with care.
3.4.8 Health, safety, environment and community
We are subject to extensive regulation surrounding the health and safety of our people and the environment. We make every effort to comply with the regulations and, where less stringent than our standards, we aim to exceed applicable legal and other requirements. However, regulatory standards and community expectations are constantly evolving. As a result, we may be exposed to increased litigation, compliance costs and unforeseen environmental rehabilitation expenses, despite our best efforts to work with governments, community groups and scientists to keep pace with regulations, law and public expectations.
Further information about our compliance with HSEC regulations can be found in section 2.8 ‘Sustainability’.
3.4.9 Insurance
During FY2013, we maintained an insurance program encompassing property damage, business interruption, sabotage and terrorism, marine cargo, construction, directors’ and officers’ liability and public and certain other liabilities. The program includes a combination of self-insurance via subsidiary captive insurance companies, industry mutuals and external market reinsurance. Mandates are established as to risk retention levels, policy cover and, where applicable, reinsurance counter parties. As part of our portfolio risk management approach, we regularly conduct an assessment of maximum foreseeable loss potential, cash flow at risk, loss experience, claims received and insurance premiums paid, and will make adjustments to the balance of self-insurance and reinsurance as required.
The Group is largely self-insured for losses arising from property damage and business interruption, sabotage and terrorism, marine cargo, construction and primary public liability. For these risks, we internally insure our operations (for wholly owned assets and for our share of joint venture assets) via our captive insurance companies. Any losses incurred will consequently impact the financial statements as they arise.
3.5 Application of critical accounting policies
The preparation of our financial statements requires management to make estimates and judgements that affect the reported amounts of assets and liabilities, the disclosure of contingent liabilities at the date of the financial statements and the reported revenue and expenses during the periods presented therein. On an ongoing basis, management evaluates its estimates and judgements in relation to assets, liabilities, contingent liabilities, revenue and expenses. Management bases its estimates and judgements on historical experience and on various other factors it believes to be reasonable under the circumstances, the results of which form the basis of making judgements about the carrying values of assets and liabilities that are not readily apparent from other sources. Actual results may differ from these estimates under different assumptions and conditions.
We have identified the following critical accounting policies under which significant judgements, estimates and assumptions are made and where actual results may differ from these estimates under different assumptions and conditions and may materially affect financial results or the financial position reported in future periods:
reserve estimates;
exploration and evaluation expenditure;
development expenditure;
property, plant and equipment and intangible assets – recoverable amount;
defined benefit pension schemes;
provision for closure and rehabilitation;
taxation.
In accordance with IFRS, we are required to include information regarding the nature of the estimates and judgements and potential impacts on our financial results or financial position in the financial statements. This information can be found in note 1 ‘Accounting policies’ to the financial statements.
3.6 Operating results
The following tables provide a summary of Revenue and Underlying EBIT for FY2013 and the two prior corresponding periods of our Businesses and the Group. Our use of Underlying EBIT is explained in section 3.6.2.
| | | | | | | | | | | | |
Year ended 30 June | | 2013 | | | 2012 | | | 2011 | |
| | | US$M | | | US$M | | | US$M | |
Revenue(1) | | | | | | | | | | | | |
Petroleum and Potash | | | 13,213 | | | | 12,937 | | | | 10,737 | |
Copper | | | 11,991 | | | | 11,596 | | | | 14,152 | |
Iron Ore | | | 20,215 | | | | 22,601 | | | | 20,412 | |
Coal | | | 10,723 | | | | 13,598 | | | | 13,080 | |
Aluminium, Manganese and Nickel | | | 9,278 | | | | 9,911 | | | | 11,505 | |
Group and unallocated items(2) | | | 548 | | | | 1,583 | | | | 1,853 | |
| | | | | | | | | | | | |
BHP Billiton Group | | | 65,968 | | | | 72,226 | | | | 71,739 | |
| | | | | | | | | | | | |
| | | |
Year ended 30 June | | 2013 | | | 2012 | | | 2011 | |
| | | US$M | | | US$M | | | US$M | |
Underlying EBIT(3) | | | | | | | | | | | | |
Petroleum and Potash | | | 5,651 | | | | 6,020 | | | | 6,201 | |
Copper | | | 3,622 | | | | 3,965 | | | | 6,790 | |
Iron Ore | | | 11,121 | | | | 14,201 | | | | 13,328 | |
Coal | | | 746 | | | | 2,797 | | | | 3,799 | |
Aluminium, Manganese and Nickel | | | 164 | | | | (24 | ) | | | 1,551 | |
Group and unallocated items(2) | | | (177 | ) | | | 279 | | | | 311 | |
| | | | | | | | | | | | |
BHP Billiton Group | | | 21,127 | | | | 27,238 | | | | 31,980 | |
| | | | | | | | | | | | |
(1) | Includes the sale of third party product. |
(2) | Includes the Group’s diamonds business (divested effective 10 April 2013), interest in titanium minerals (divested effective 3 September 2012), non-Potash corporate costs incurred by the former Diamonds and Specialty Products CSG, consolidation adjustments, unallocated items and external sales of freight and fuel via the Group’s transport and logistics operations. |
(3) | Underlying EBIT is earnings before net finance costs, taxation and any exceptional items and includes the sale of third party product. Underlying EBIT is not an IFRS measure of profitability, financial performance or liquidity and may be defined and used in differing ways by different entities. Underlying EBIT is included in the FY2013 financial statements as required by IFRS 8 ‘Operating Segments’. We believe that Underlying EBIT provides useful information, but should not be considered as an indication of, or alternative to, Attributable profit as an indicator of operating performance. Our use of Underlying EBIT is explained in section 3.6.2. |
3.6.1 Consolidated results
Year ended 30 June 2013 compared with year ended 30 June 2012
Revenue in FY2013 was US$66.0 billion, a decrease of US$6.2 billion, or 8.7 per cent, from US$72.2 billion in the corresponding period. The revenue decrease was primarily driven by the Iron Ore and Coal Businesses, with decreases of US$2.4 billion and US$2.9 billion, respectively, and the loss of revenue due to the sale of assets previously reported in the former Diamonds and Specialty Products CSG, which represented a reduction of US$879 million.
The decrease in revenue in Iron Ore was primarily due to lower realised prices of US$4.1 billion, partially offset by higher sales volumes of US$1.4 billion. The revenue decrease in Coal also reflected lower realised prices of US$3.7 billion, partially offset by higher sales volumes of US$416 million.
Underlying EBIT in FY2013 declined by 22.4 per cent, or US$6.1 billion, to US$21.1 billion. A substantial reduction in commodity prices reduced Underlying EBIT by US$8.9 billion, which more than offset the US$546 million reduction in costs (rate and usage), the US$649 million reduction in price-linked costs and the US$938 million reduction in exploration and business development costs achieved during the period. Consistently strong operating performance across the Group contributed to a US$1.8 billion volume related increase in Underlying EBIT.
Further description of the changes in revenue is included in the analysis of Underlying EBIT for the Group in section 3.6.2 and for the Businesses in section 3.6.6.
Attributable profit excluding exceptional items (comprising Profit after taxation attributable to members of BHP Billiton Group less exceptional items as described in section 3.6.5) of US$11.8 billion was negatively affected by an increase in the Group’s effective tax rate from 34.8 per cent to 39.3 per cent (excluding exceptional items) and financing charges of US$280 million incurred managing interest rate exposure on recently issued debt securities. Exceptional items of US$922 million (after tax) contributed to the 29.5 per cent decrease in Attributable profit to US$10.9 billion.
Exceptional items during FY2013 included a gain on sale of our wholly owned Yeelirrie uranium deposit of US$420 million (after tax expense), a gain on sale of our interest in Richards Bay Minerals of US$1.2 billion (after tax expense) and a gain on sale of our 8.33 per cent interest in the East Browse Joint Venture, and 20 per cent interest in the West Browse Joint Venture of US$1.4 billion (after tax expense).
These gains were offset by an impairment charge of US$1.2 billion (after tax benefit) at Nickel West, an impairment charge of US$1.6 billion (after tax benefit) at Worsley, an impairment charge of US$167 million (after tax benefit) of assets in the Permian Basin (United States), an impairment charge of US$237 million (after tax expense) arising from the sale of our interests in the EKATI Diamond Mine and an impairment charge and other restructuring costs of US$715 million (after tax benefit) arising from the capital project review. Finally, the Group recognised a decrease of US$158 million (before tax expense) to its rehabilitation obligations in respect of former operations at the Newcastle steelworks (Australia).
Net operating cash flow of US$18.3 billion declined by 25.1 per cent from US$24.4 billion in FY2012; however, despite the challenging environment, the Group’s Underlying EBIT margin remained in excess of 30 per cent, while Underlying return on capital was 13.5 per cent, down from 23.0 per cent in FY2012.
Year ended 30 June 2012 compared with year ended 30 June 2011
In FY2012, revenue was US$72.2 billion, an increase of US$487 million, or 0.7 per cent, from US$71.7 billion in the corresponding period. The revenue increases of US$2.2 billion in both our Petroleum and Potash, and Iron Ore Businesses were partially offset by decreases in other Businesses, in particular our Copper and Aluminium, Manganese and Nickel Businesses of US$2.6 billion and US$1.6 billion, respectively.
The increase in revenue in Iron Ore related primarily to higher sales volumes of US$3.4 billion, offset by lower realised prices of US$1.2 billion. Revenue increases in Petroleum and Potash related primarily to US$2.2 billion of revenue in Onshore US for FY2012, an increase of US$2.1 billion from FY2011. The impact of higher realised prices in Petroleum’s conventional (primarily offshore) operations was largely offset by lower sales volumes.
The revenue decrease in Copper reflected lower sales volumes of US$861 million and lower realised prices of US$1.5 billion. The decrease in revenue in Aluminium, Manganese and Nickel of US$1.6 billion was primarily due to lower realised prices.
Further description on the changes in revenue is included in the analysis of Underlying EBIT for the Group in section 3.6.2 and for the Businesses in section 3.6.6.
Our Attributable profit of US$15.4 billion in FY2012 represented a decrease of 34.8 per cent from US$23.6 billion in the corresponding period.
Attributable profit in FY2012 included a number of exceptional items: an impairment of the Fayetteville (United States) dry gas assets acquired from Chesapeake Energy in March 2011 of US$1.8 billion (US$2.8 billion before tax); an impairment of the Nickel West (Australia) assets of US$355 million (US$449 million before tax) and a US$342 million (US$452 million before tax) charge for the suspension or early closure of operations and the change in status of specific projects, which included an impairment of the Olympic Dam Project of US$242 million (US$346 million before tax).
Other exceptional items included the settlement of insurance claims at Queensland Coal (Australia) which resulted in other income of US$199 million (US$284 million before tax), while a US$637 million non-cash income tax credit was recognised following the passage of Australia’s Minerals Resource Rent Tax (MRRT) and Petroleum Resource Rent Tax (PRRT) extension into legislation in March 2012.
Attributable profit excluding exceptional items of US$17.1 billion represented a decrease of 21.1 per cent from US$21.7 billion in FY2011. The US$4.6 billion decrease in Attributable profit excluding exceptional items primarily reflects the decrease in Underlying EBIT of US$4.8 billion.
The decrease in Underlying EBIT from the prior year is a result of weaknesses in the price of, and demand for, commodities and industry-wide cost pressure. The rate of cost escalation was most severe in those Businesses that experienced disruptions, outages or grade-related issues. The increased revenue for Onshore US, from US$107 million in FY2011 to US$2.2 billion in FY2012, did not result in additional EBIT due to the impact of lower realised gas prices in the United States.
Net operating cash flow of US$24.4 billion declined by 18.9 per cent, while Underlying return on capital was 23.0 per cent. The value of the Group’s diversified strategy was reflected in the Group’s Underlying EBIT margin, which remained at a robust 39.4 per cent.
3.6.2 Consolidated results – Underlying EBIT
In discussing the operating results of the Group, we focus on a financial measure we refer to as Underlying EBIT. Underlying EBIT is the key measure that management uses internally to assess the performance of our Businesses, make decisions on the allocation of resources and assess operational management. Management uses this measure because financing structures and tax regimes differ across our assets and substantial components of our tax and interest charges are levied at a Group rather than an operational level.
We exclude exceptional items from Underlying EBIT in order to enhance the comparability of the measure from period to period and provide clarity into the underlying performance of our operations. Our management monitors exceptional items separately.
The following table reconciles Underlying EBIT to Profit from operations.
| | | | | | | | | | | | |
Year ended 30 June | | 2013 | | | 2012 | | | 2011 | |
| | | US$M | | | US$M | | | US$M | |
Underlying EBIT | | | 21,127 | | | | 27,238 | | | | 31,980 | |
Exceptional items (before taxation) – refer section 3.6.5 | | | (1,902 | ) | | | (3,486 | ) | | | (164 | ) |
Profit from operations (EBIT) | | | 19,225 | | | | 23,752 | | | | 31,816 | |
The following table describes the approximate impact of the principal factors that affected Underlying EBIT for FY2013 and FY2012.
| | | | | | | | |
Year ended 30 June | | 2013 | | | 2012 | |
| | | US$M | | | US$M | |
Underlying EBIT as reported in the prior year | | | 27,238 | | | | 31,980 | |
Change in volumes: | | | | | | | | |
Increase in volumes | | | 2,057 | | | | 2,529 | |
Decrease in volumes | | | (266 | ) | | | (2,221 | ) |
| | | | | | | | |
| | | 1,791 | | | | 308 | |
| | | | | | | | |
Net price impact: | | | | | | | | |
Change in sales prices | | | (8,895 | ) | | | (2,213 | ) |
Price-linked costs | | | 649 | | | | 253 | |
| | | | | | | | |
| | | (8,246 | ) | | | (1,960 | ) |
| | | | | | | | |
Change in costs: | | | | | | | | |
Costs (rate and usage) | | | 546 | | | | (3,138 | ) |
Exchange rates | | | 390 | | | | 820 | |
Inflation on costs | | | (650 | ) | | | (764 | ) |
| | | | | | | | |
| | | 286 | | | | (3,082 | ) |
| | | | | | | | |
Asset sales | | | (66 | ) | | | 78 | |
Ceased and sold operations | | | (847 | ) | | | 347 | |
New and acquired operations | | | (112 | ) | | | (86 | ) |
Exploration and business development | | | 938 | | | | (819 | ) |
Other | | | 145 | | | | 472 | |
| | | | | | | | |
Underlying EBIT | | | 21,127 | | | | 27,238 | |
| | | | | | | | |
The method of calculation of the factors that affected Underlying EBIT and the financial statement line items of Revenue, Other income and Expenses (excluding net finance costs) that are affected by the factors are as follows.
| | | | |
Factor affecting Underlying EBIT
| | Method of calculation
| | Financial
statement
line item
affected |
Volumes
| | Change in volumes for each operation from the corresponding period to the current period multiplied by prior year Underlying EBIT margin. | | Revenue and
Expenses |
| | |
Change in sales prices
| | Change in average realised price for each operation from the corresponding period to the current period multiplied by current period volumes. | | Revenue |
| | |
Price-linked costs
| | As for change in sales prices. | | Expenses |
| | |
Costs (rate and usage)
| | Change in total costs, other than exchange rates, inflation and those changes included in other categories below, for each operation from the corresponding period to the current period. | | Expenses |
| | |
Exchange rates
| | Change in exchange rate multiplied by current period local currency revenue and expenses – the majority of the Group’s selling prices are denominated in US dollars and so there is little impact of exchange rate changes on Revenue. | | Revenue and
Expenses |
| | |
Inflation on costs
| | Change in inflation rate applied to expenses, other than depreciation and amortisation, price-linked costs, exploration and business development expenses, expenses in ceased and sold operations and expenses in new and acquired operations. | | Expenses |
| | |
Asset sales
| | Profit/loss on the sale of assets or operations in the current period minus profit/loss on sale in the corresponding period. | | Other
income |
| | |
Ceased and sold operations
| | Underlying EBIT for operations that are ceased or sold operations in the current period minus Underlying EBIT for operations that are ceased or sold in the corresponding period. | | Revenue,
Other
income and
Expenses |
| | |
New and acquired operations
| | Underlying EBIT for operations that are new or acquired in the current period minus Underlying EBIT for operations that are new or acquired in the corresponding period. | | Revenue,
Other
income and
Expenses |
| | |
Exploration and business development
| | Exploration and business development expense in the current period minus exploration and business development expense in the corresponding period. | | Expenses |
| | |
Other
| | Variances not explained by the above factors. | | Expenses |
The following commentary describes the principal factors outlined in the table above for FY2013 and FY2012.
Year ended 30 June 2013 compared with year ended 30 June 2012
Underlying EBIT for FY2013 was US$21.1 billion, compared with US$27.2 billion in the corresponding period, a decrease of 22.4 per cent.
Volumes
Strong operating performance across the Group’s major basins in FY2013 delivered an increase in total production volumes in a number of Businesses. This was underpinned by a thirteenth consecutive annual production record at WAIO and a 28 per cent increase in copper production at Escondida. This volume growth was supported by a significant recovery in production at Queensland Coal and a 76 per cent increase in liquids production at our Onshore US Asset. This momentum is expected to continue in the medium term.
In this context, stronger sales volumes increased Underlying EBIT by US$1.8 billion in FY2013. Increased iron ore, copper and metallurgical coal sales were the major contributors and together increased Underlying EBIT by US$2.2 billion. In contrast, natural field decline at our conventional Australian oil and gas assets contributed to a US$266 million volume related reduction in Petroleum’s Underlying EBIT.
Prices
Substantially lower prices reduced Underlying EBIT by US$8.9 billion in FY2013. The major contributor to the decline was a 17 per cent reduction in the average realised price of iron ore, which reduced Underlying EBIT by US$4.1 billion. The recovery in low-cost supply led to a significant decline in metallurgical coal prices, which, together with softer energy coal prices, reduced Underlying EBIT by a further US$3.7 billion. Overcapacity in the nickel and aluminium markets, and concerns of a near-term rebalancing in the copper market, also weighed on metals prices and reduced Underlying EBIT by a combined US$1.0 billion.
A 17 per cent increase in the average realised price of US natural gas and a four per cent rise in the average realised price of liquefied natural gas (LNG) benefited Underlying EBIT during the period; however, this was largely offset by a four per cent decrease in the average realised price of oil.
A reduction in price-linked costs increased Underlying EBIT by US$649 million during the period and primarily reflected lower price-linked royalty charges in our Iron Ore and Metallurgical Coal Businesses.
Costs
The Group’s concentrated effort to reduce operating costs and drive productivity improvements realised tangible results. The total cost related variance, which excludes exploration and business development expenditure, exceptional items, the impacts of inflation and exchange rate volatility, increased Underlying EBIT by US$546 million during the period.
Increased labour productivity across the Group, and both a change in scope and renegotiation of terms for specific contracts at Queensland Coal, contributed to a US$383 million reduction in costs. These savings were offset by payments associated with the finalisation of multi-year collective labour agreements at each of our South American copper assets.
Mining related efficiencies contributed to a US$251 million reduction in costs. This largely reflected productivity gains at Escondida associated with a 12 per cent improvement in concentrator throughput following a major maintenance campaign and a 24 per cent increase in the ore grade mined during the period which increased Underlying EBIT by US$481 million. These savings were offset by lower grade and smelter availability at Olympic Dam, which decreased Underlying EBIT by US$172 million.
Depreciation, impairments and other non-cash costs increased by US$241 million, which reflected the recent completion of several projects mainly in Copper and Iron Ore and impairments of project costs associated with the WAIO Tug Harbour and the Mad Dog Phase 2 (United States).
Exchange rates
A stronger US dollar against several producer currencies, in particular the South African rand, benefited our cost base during the period and increased Underlying EBIT by US$480 million. This was partially offset by the revaluation of monetary items in the balance sheet with year-end exchange rates, which reduced Underlying EBIT by US$90 million. In total, exchange rate volatility increased Underlying EBIT by US$390 million.
Average and closing exchange rates for FY2013 and FY2012 are detailed in note 1 ‘Accounting policies’ to the financial statements.
Inflation on costs
Inflation had an unfavourable impact on all Businesses and reduced Underlying EBIT by US$650 million in FY2013. This was most notable in Australia and South Africa, which accounted for over 75 per cent of the total variance.
Asset sales
The divestments of Yeelirrie (Australia), Richards Bay Minerals (South Africa), the East and West Browse Joint Ventures (Australia) and our diamonds business were completed during the period. The gains or losses arising from each sale were reported within exceptional items, and therefore were not included in Underlying EBIT.
The contribution of asset sales to Underlying EBIT declined by US$66 million in FY2013. The variance was largely attributable to a post-closing payment received during FY2012 that followed the divestment of our interests in Cascade and Chinook (United States).
Ceased and sold operations
Underlying EBIT from ceased and sold operations declined by US$847 million in FY2013. The decline largely reflected a reduced contribution (decrease in Underlying EBIT of US$499 million) from both Richards Bay Minerals, following the sale of our 37.76 per cent non-operated effective interest to Rio Tinto, which was completed on 7 September 2012; and EKATI (Canada), following the sale of our diamonds business to Dominion Diamond Corporation, which was completed on 10 April 2013. Ceased and sold operations included a further reduction of Underlying EBIT of US$126 million related to the sale of Pinto Valley mining operation (United States) and the associated San Manuel Arizona Railroad Company.
New and acquired operations
We classify assets as new and acquired operations until there is a full-year period for comparison. In FY2012, new and acquired operations comprised the Onshore US Asset (Fayetteville acquired in March 2011 and Petrohawk acquired in August 2011) and HWE Mining (acquired in September 2011). In FY2013, new and acquired operations comprised the former Petrohawk operations within Onshore US and HWE Mining.
New and acquired operations reduced Underlying EBIT by US$112 million in FY2013. This reflected a further loss on Petrohawk compared with the corresponding period loss, which included a one-off gain of US$192 million associated with legacy US gas derivatives. The increase in revenue in Onshore US from higher volumes and stronger prices was offset by higher depreciation and the impact of rig termination costs. A discussion of our Onshore US Asset’s results is set out in section 3.6.6.
This loss was partially offset by Iron Ore contribution of US$144 million, driven by the favourable contractor mining costs pertaining to the removal of contractor margins included in mining rates prior to the HWE Mining acquisition.
Exploration and business development
Our increased focus on reducing our cost base in FY2013 and our confidence in the quality and longevity of our asset base led to a substantial US$938 million reduction in the Group’s exploration and business development expenditure. Total exploration expenditure declined by 46 per cent to US$1.3 billion in FY2013, with a focus on greenfield copper porphyry targets in Chile and Peru and oil and gas prospects in the Gulf of Mexico (United States) and offshore Western Australia. The associated decline in the Group’s exploration expense increased Underlying EBIT by US$594 million.
A general reduction in business development expenditure increased Underlying EBIT by a further US$344 million in FY2013, primarily in Iron Ore for US$102 million and Coal for US$194 million.
Other
The largest contributor to a US$145 million increase in Underlying EBIT was a non-cash adjustment of our Angostura (Trinidad and Tobago) Production Sharing Contract.
Year ended 30 June 2012 compared with year ended 30 June 2011
Underlying EBIT for FY2012 was US$27.2 billion, compared with US$32.0 billion in the corresponding period, a decrease of 14.8 per cent.
Volumes
In FY2012, we achieved a twelfth consecutive annual production record at WAIO and record annual production at another nine operations. In aggregate, volumes increased Underlying EBIT by US$308 million in the period.
WAIO shipments rose to a record annualised rate of 179 million tonnes (Mt) in the June 2012 quarter (100 per cent basis). The resultant 23 Mt (BHP Billiton share) uplift in WAIO shipments increased Underlying EBIT by US$2.4 billion in FY2012.
Downtime at our non-operated facilities in the Gulf of Mexico and the North West Shelf (Australia) and natural field decline, particularly at Pyrenees (Australia), were the major contributors to the volume related US$1.1 billion reduction in Underlying EBIT for the Petroleum and Potash Business. The Atlantis and Mad Dog (both United States) facilities resumed production in August 2012. Annual copper production records were set at Antamina and Spence (Chile) although lower grades and industrial action constrained performance at Escondida. An overall decline in Copper volumes reduced Underlying EBIT by US$509 million in the period.
The impact on EBIT arising from the increase in volume relating to the acquisition of our Onshore US Asset is included under the heading ‘New and acquired operations’.
Prices
Prices for many of BHP Billiton’s products declined during FY2012 as global economic growth slowed and concerns surrounding the economic outlook increased. In total, lower average realised prices reduced Underlying EBIT by US$2.0 billion in FY2012, net of price-linked costs. The impact was most apparent in our Copper and Iron Ore Businesses, where weaker prices reduced Underlying EBIT by US$1.6 billion and US$1.3 billion,
respectively. No respite was provided for our Aluminium, Manganese and Nickel Business, where lower realised prices reduced Underlying EBIT by a combined US$1.2 billion.
In Petroleum and Potash, a 19 per cent increase in the average realised price of oil and a 29 per cent rise in the average realised price of liquefied natural gas contributed to a US$1.5 billion increase in Underlying EBIT in FY2012. In addition, stronger thermal and metallurgical coal realised prices increased Underlying EBIT by a combined US$434 million, net of price-linked costs.
Costs
Industry-wide cost pressure resulted in a decline in Underlying EBIT of US$3.1 billion, particularly in Copper and in Coal, where industrial action at Escondida and Queensland Coal created additional pressure on costs.
Higher costs, excluding the impacts of inflation, exchange rate volatility and non-cash items, reduced Underlying EBIT by US$2.7 billion in FY2012. Labour and contractor cost increases and higher raw material costs accounted for more than half of this increase.
We were quick to respond to changes in the operating environment and acted decisively by closing energy-intensive silicomanganese alloy production capacity in South Africa and by temporarily closing capacity at TEMCO. In addition, metallurgical coal production at Norwich Park was suspended following a review of the mine’s profitability.
Non-cash items, which included foreign exchange rate related adjustments to the carrying value of inventory and higher depreciation associated with the completion of major projects, reduced Underlying EBIT by a further US$435 million in FY2012.
Exchange rates
The cost related impact of the stronger Australian dollar reduced Underlying EBIT by US$565 million in FY2012. However, the positive restatement of monetary items in the balance sheet that followed the general strengthening of the US dollar against a basket of currencies at the end of the period resulted in a US$1.1 billion increase in Underlying EBIT. In total, exchange rate volatility increased Underlying EBIT by US$820 million.
Average and closing exchange rates for FY2012 and FY2011 are detailed in note 1 ‘Accounting policies’ to the financial statements.
Inflation on costs
Inflationary pressure had an unfavourable impact on all Businesses and reduced Underlying EBIT by US$764 million during FY2012. The pressure was most notable in Australia and South Africa, which accounted for 75 per cent of the total impact.
Asset sales
The contribution of asset sales to Underlying EBIT increased by US$78 million from the corresponding period and primarily reflected the receipt of a post-closing payment that followed the 2006 divestment of our interests in Cascade and Chinook.
Ceased and sold operations
A favourable foreign exchange related restatement and partial release of the Newcastle steelworks, Australia, rehabilitation provision accounted for the majority of the US$347 million increase in Underlying EBIT.
New and acquired operations
We classify assets as new and acquired operations until there is a full-year period for comparison. New and acquired operations reduced Underlying EBIT by US$86 million in FY2012. Iron Ore’s acquisition of the HWE Mining business in Western Australia increased Underlying EBIT by US$97 million, which was more than offset by a decrease in Underlying EBIT for the Onshore US Asset of US$183 million – being a loss of US$140 million in FY2012 compared with a profit of US$43 million in FY2011.
The additional revenue of US$2.1 billion for Onshore US in FY2012 did not result in additional EBIT due to the impact of lower realised gas prices in the United States.
Exploration and business development
Exploration expense increased by US$662 million to US$1.7 billion in FY2012. Within Minerals (US$928 million expense), greenfield exploration was focused on copper targets in South America, nickel and copper targets in Australia, and iron ore and potash targets globally.
Petroleum exploration expense was US$818 million and included a US$144 million impairment of exploration previously capitalised. Our activities focused on offshore Western Australia, the Gulf of Mexico, South East Asia and our recently acquired Onshore US Asset.
A general increase in the level of business development expenditure reduced Underlying EBIT by a further US$157 million in FY2012.
Other
The absence of specific provisions and non-cash charges that were reported in the Aluminium, Manganese and Nickel and Copper Businesses in FY2011, largely accounted for a US$472 million increase in Underlying EBIT in the period.
3.6.3 Net finance costs
Year ended 30 June 2013 compared with year ended 30 June 2012
Net finance costs increased to US$1.4 billion from US$730 million in the corresponding period. This was primarily attributable to an increase in net interest expense on higher net debt and financing charges of US$280 million incurred managing interest rate exposure on recently issued debt securities. The US$280 million was composed of realised fair value losses of US$97 million on non-hedging derivatives recognised in interest on borrowings and unrealised fair value losses of US$183 million on similar instruments.
At 30 June 2013, net debt, comprising interest bearing liabilities less cash and cash equivalents, was US$29.1 billion, which represented an increase of US$5.5 billion compared with the net debt position at 30 June 2012.
Year ended 30 June 2012 compared with year ended 30 June 2011
Net finance costs increased to US$730 million from US$561 million in the corresponding period. This was primarily driven by increased net interest expense on higher net debt, partially offset by exchange rate variations on net debt.
At 30 June 2012, net debt, comprising interest bearing liabilities less cash and cash equivalents, was US$23.6 billion, which represented an increase of US$17.8 billion compared with the net debt position at 30 June 2011.
3.6.4 Taxation expense
Year ended 30 June 2013 compared with year ended 30 June 2012
Total taxation expense, including royalty-related taxation, exceptional items and exchange rate movements, was US$6.8 billion, representing an effective tax rate of 38.0 per cent (2012: 32.5 per cent).
Exceptional items decreased taxation expense by US$980 million (2012: decrease of US$1.7 billion), predominately due to the income tax benefit on impairments of US$1.4 billion, which more than offset the income tax expense associated with divestments of US$376 million, as detailed in section 3.6.5. Excluding exceptional items, the Group’s effective tax rate was 39.3 per cent (2012: 34.8 per cent).
Government imposed royalty arrangements calculated by reference to profits are reported as royalty-related taxation. Royalty-related taxation, excluding exceptional items, contributed US$1.2 billion to taxation expense representing an effective tax rate of 6.0 per cent (2012: US$889 million and 3.4 per cent). The Minerals Resource Rent Tax (MRRT) came into effect in Australia on 1 July 2012 and the Group expensed US$454 million of MRRT in FY2013. This was partially offset by the recognition of deferred tax assets associated with the MRRT, which reduced taxation expense by US$133 million.
Exchange rate movements increased taxation expense by US$315 million, representing an effective tax rate of 1.6 per cent (2012: increase of US$250 million and 0.9 per cent).
Excluding the impacts of royalty-related taxation, exceptional items and exchange rate movements, taxation expense was US$6.3 billion, representing an Underlying effective tax rate of 31.7 per cent (2012: 30.5 per cent). Underlying effective tax rate is not an IFRS measure and comprises total taxation expense excluding royalty-related taxation, exceptional items and exchange rate movements included in taxation expense divided by Profit before taxation and exceptional items.
Other royalty and excise arrangements, which are not profit based, are recognised as operating costs within Profit before taxation. These amounted to US$2.7 billion during the period (2012: US$3.1 billion).
Year ended 30 June 2012 compared with year ended 30 June 2011
Total taxation expense, including royalty-related taxation, exceptional items and exchange rate movements, was US$7.5 billion, representing an effective rate of 32.5 per cent (2011: 23.4 per cent).
Exchange rate movements increased taxation expense by US$250 million (2011: decrease of US$1.5 billion). The reduced impact compared with FY2011 was predominantly due to eligible Australian entities electing to adopt a US dollar tax functional currency from 1 July 2011.
Exceptional items decreased taxation expense by US$1.7 billion (2011: decrease of US$2.1 billion), predominantly due to the recognition of tax benefits of US$1.2 billion arising from the impairments of goodwill and other assets in relation to the Fayetteville shale gas assets, Nickel West and the Olympic Dam expansion project, and the recognition of a net income tax benefit of US$637 million on enactment of the MRRT and PRRT extension legislation in Australia.
Government imposed royalty arrangements calculated by reference to profits after adjustment for temporary differences are reported as royalty-related taxation. Royalty-related taxation (excluding exceptional items) contributed US$889 million to taxation expense, representing an effective tax rate of 3.9 per cent (2011: US$828 million and 2.6 per cent).
Other royalty and excise arrangements that did not have these characteristics are recognised as operating costs within Profit before taxation. These amounted to US$3.1 billion during the period (2011: US$2.9 billion).
3.6.5 Exceptional items
Year ended 30 June 2013
| | | | | | | | | | | | |
Year ended 30 June 2013 | | Gross | | | Tax | | | Net | |
| | | US$M | | | US$M | | | US$M | |
Exceptional items by category | | | | | | | | | | | | |
Sale of Yeelirrie uranium deposit | | | 420 | | | | – | | | | 420 | |
Sale of Richards Bay Minerals | | | 1,373 | | | | (183 | ) | | | 1,190 | |
Sale of diamonds business | | | (232 | ) | | | (5 | ) | | | (237 | ) |
Sale of East and West Browse Joint Ventures | | | 1,539 | | | | (188 | ) | | | 1,351 | |
Impairment of Nickel West assets | | | (1,698 | ) | | | 454 | | | | (1,244 | ) |
Impairment of Worsley assets | | | (2,190 | ) | | | 559 | | | | (1,631 | ) |
Impairment of Permian Basin assets | | | (266 | ) | | | 99 | | | | (167 | ) |
Other impairments arising from capital project review | | | (1,006 | ) | | | 291 | | | | (715 | ) |
Newcastle steelworks rehabilitation | | | 158 | | | | (47 | ) | | | 111 | |
| | | | | | | | | | | | |
| | | (1,902 | ) | | | 980 | | | | (922 | ) |
| | | | | | | | | | | | |
On 27 August 2012, the Group announced the sale of its wholly owned Yeelirrie uranium deposit and the transaction was completed on 19 December 2012. A gain on sale of US$420 million was recognised in FY2013, while the associated tax expense was offset by the recognition of deferred tax benefits on available tax losses of US$126 million.
On 7 September 2012, the Group announced it had completed the sale of its 37.76 per cent effective interest in Richards Bay Minerals. A gain on sale of US$1.2 billion (after tax expense) was recognised in FY2013.
On 13 November 2012, the Group announced the sale of its diamonds business, comprising its interests in the EKATI Diamond Mine and Diamond Marketing operations. The transaction was completed on 10 April 2013 for an aggregate cash consideration of US$553 million (after adjustments). An impairment charge of US$237 million (after tax expense) was recognised based on the final consideration.
On 12 December 2012, the Group signed a definitive agreement to sell its 8.33 per cent interest in the East Browse Joint Venture and 20 per cent interest in the West Browse Joint Venture. A gain on sale of US$1.5 billion was recognised in FY2013. The associated tax expense of US$462 million was partly offset by the recognition of deferred tax benefits on available tax losses of US$241 million and the derecognition of deferred tax liabilities of US$33 million. The transaction was completed on 7 June 2013.
As a result of expected continued strength in the Australian dollar and weak nickel prices, the Group recognised an impairment charge of US$1.2 billion (after tax benefit) at Nickel West in FY2013.
The Group recognised an impairment of assets at Worsley as a result of expected continued strength in the Australian dollar and weak alumina prices. A total impairment charge of US$1.6 billion (after tax benefit) was recognised in FY2013.
An impairment charge of US$167 million (after tax benefit) was recognised as the performance of specific evaluation wells in certain areas of the Permian Basin (United States) do not support economic development.
In FY2013, WAIO refocused its attention on the capital efficient expansion opportunity that exists within the Port Hedland Inner Harbour, and all early works associated with the Outer Harbour development option were suspended. This revision to the WAIO development sequence and the change in status of other minor capital projects across the Group resulted in the recognition of impairment charges of US$639 million (after tax benefit)
and other restructuring costs of US$76 million (after tax benefit) in FY2013, of which US$580 million (after tax benefit) were related to WAIO.
The Group recognised a decrease of US$158 million (before tax expense) to its rehabilitation obligations in respect of former operations at the Newcastle steelworks (Australia). This followed the completion of the Hunter River Remediation Project and reaching agreement with the Environment Protection Authority in March 2013 regarding the necessary scope of work to repeal the Environmental Classification at Steel River.
Exceptional items during FY2013 are classified by nature as follows.
| | | | | | | | | | | | | | | | | | | | |
Year ended 30 June 2013 US$M | | Sale of
assets | | | Impairment
of goodwill
and other
assets | | | Restructuring
costs | | | Closure and
rehabilitation
provisions
released | | | Gross | |
Sale of Yeelirrie uranium deposit | | | 420 | | | | – | | | | – | | | | – | | | | 420 | |
Sale of Richards Bay Minerals | | | 1,373 | | | | – | | | | – | | | | – | | | | 1,373 | |
Sale of diamonds business | | | – | | | | (232 | ) | | | – | | | | – | | | | (232 | ) |
Sale of East and West Browse Joint Ventures | | | 1,539 | | | | – | | | | – | | | | – | | | | 1,539 | |
Impairment of Nickel West assets | | | – | | | | (1,698 | ) | | | – | | | | – | | | | (1,698 | ) |
Impairment of Worsley assets | | | – | | | | (2,190 | ) | | | – | | | | – | | | | (2,190 | ) |
Impairment of Permian Basin assets | | | – | | | | (266 | ) | | | – | | | | – | | | | (266 | ) |
Other impairments arising from capital project review | | | – | | | | (898 | ) | | | (108 | ) | | | – | | | | (1,006 | ) |
Newcastle steelworks rehabilitation | | | – | | | | – | | | | – | | | | 158 | | | | 158 | |
| | | | | | | | | | | | | | | | | | | | |
| | | 3,332 | | | | (5,284 | ) | | | (108 | ) | | | 158 | | | | (1,902 | ) |
| | | | | | | | | | | | | | | | | | | | |
Refer to note 3 ‘Exceptional items’ to the financial statements for more information.
Year ended 30 June 2012
| | | | | | | | | | | | |
Year ended 30 June 2012 | | Gross | | | Tax | | | Net | |
| | | US$M | | | US$M | | | US$M | |
Exceptional items by category | | | | | | | | | | | | |
Impairment of Fayetteville goodwill and other assets | | | (2,835 | ) | | | 996 | | | | (1,839 | ) |
Impairment of Nickel West goodwill and other assets | | | (449 | ) | | | 94 | | | | (355 | ) |
Suspension or early closure of operations and the change in status of specific
projects (1) | | | (502 | ) | | | 108 | | | | (394 | ) |
Settlement of insurance claims(1) | | | 300 | | | | (90 | ) | | | 210 | |
Recognition of deferred tax assets on enactment of MRRT and PRRT extension legislation in Australia | | | – | | | | 637 | | | | 637 | |
| | | | | | | | | | | | |
| | | (3,486 | ) | | | 1,745 | | | | (1,741 | ) |
| | | | | | | | | | | | |
(1) | Includes amounts attributable to non-controlling interests of US$(34) million (US$7 million tax expense). |
As a result of the fall in United States domestic gas prices and the Company’s decision to adjust its development plans, the Group recognised impairments of goodwill and other assets in relation to its Fayetteville shale gas assets. A total impairment charge of US$1.8 billion (after tax benefit) was recognised in FY2012.
The Group recognised impairments of goodwill and other assets at Nickel West as a result of the continued downturn in the nickel price and margin deterioration. A total impairment charge of US$355 million (after tax benefit) was recognised in FY2012.
As part of our regular portfolio review, various operations and projects around the Group were either suspended, closed early or changed in status. These included: the change in status of the Olympic Dam expansion project; the temporary suspension of production at TEMCO and the permanent closure of the Metalloys South Plant in South Africa; the indefinite cessation of production at Norwich Park; and the suspension of other minor capital projects. As a result, impairment charges of US$338 million (after tax benefit), idle capacity costs and inventory write-down of US$28 million (after tax benefit) and other restructuring costs of US$28 million (after tax benefit) were recognised in FY2012, of which US$242 million (after tax benefit) related to Olympic Dam.
During 2008, extreme weather across the central Queensland coalfields affected production from the BHP Billiton Mitsubishi Alliance (BMA) and BHP Billiton Mitsui Coal (BMC) operations. The Group settled insurance claims in respect of the lost production and insurance claim income of US$210 million (after tax expense) was recognised in FY2012.
The Australian MRRT and PRRT extension legislation were enacted in March 2012. Under the legislation, the Group is entitled to a deduction against future MRRT and PRRT liabilities based on the market value of its Coal, Iron Ore and Petroleum assets. A deferred tax asset, and an associated net income tax benefit of US$637 million, was recognised in FY2012 to reflect the future deductibility of these market values for MRRT and PRRT purposes, to the extent they were considered recoverable.
Exceptional items during FY2012 are classified by nature as follows.
| | | | | | | | | | | | | | | | | | | | |
Year ended 30 June 2012 US$M | | Impairment of
goodwill and
other assets | | | Idle
capacity
costs and
inventory
write-downs | | | Restructuring
costs | | | Insurance
recoveries | | | Gross | |
Impairment of Fayetteville goodwill and other assets | | | (2,835 | ) | | | – | | | | – | | | | – | | | | (2,835 | ) |
Impairment of Nickel West goodwill and other assets | | | (406 | ) | | | (43 | ) | | | – | | | | – | | | | (449 | ) |
Suspension or early closure of operations and the change in status of specific projects | | | (422 | ) | | | (40 | ) | | | (40 | ) | | | – | | | | (502 | ) |
Settlement of insurance claims | | | – | | | | – | | | | | | | | 300 | | | | 300 | |
| | | | | | | | | | | | | | | | | | | | |
| | | (3,663 | ) | | | (83 | ) | | | (40 | ) | | | 300 | | | | (3,486 | ) |
| | | | | | | | | | | | | | | | | | | | |
Year ended 30 June 2011
| | | | | | | | | | | | |
Year ended 30 June 2011 | | Gross | | | Tax | | | Net | |
| | | US$M | | | US$M | | | US$M | |
Exceptional items by category | | | | | | | | | | | | |
Withdrawn offer for PotashCorp | | | (314 | ) | | | – | | | | (314 | ) |
Newcastle steelworks rehabilitation | | | 150 | | | | (45 | ) | | | 105 | |
Release of income tax provisions | | | – | | | | 718 | | | | 718 | |
Reversal of deferred tax liabilities | | | – | | | | 1,455 | | | | 1,455 | |
| | | | | | | | | | | | |
| | | (164 | ) | | | 2,128 | | | | 1,964 | |
| | | | | | | | | | | | |
The Group withdrew its offer for PotashCorp on 15 November 2010, following the Board’s conclusion that the condition of the offer relating to receipt of a net benefit, as determined by the Minister of Industry under the Investment Canada Act, could not be satisfied. The Group incurred fees associated with the US$45 billion debt facility (US$240 million), investment bankers’, lawyers’ and accountants’ fees, printing expenses and other charges (US$74 million) in progressing this matter during the period up to the withdrawal of the offer, which were expensed as operating costs in the year ended 30 June 2011.
The Group recognised a decrease of US$150 million (before tax expense) to its rehabilitation obligations in respect of former operations at the Newcastle steelworks (Australia) following a full review of the progress of the Hunter River Remediation Project and estimated costs to completion.
The Australian Taxation Office (ATO) issued amended assessments in prior years denying bad debt deductions arising from the investments in Beenup and Boodarie Iron (both Australia) and the denial of capital allowance claims made on the Boodarie Iron project. The Group challenged the assessments and was successful on all counts before the Full Federal Court. The ATO obtained special leave in September 2010 to appeal to the High Court in respect of the denial of capital allowance claims made on the Boodarie Iron project. The Group’s position in respect of the capital allowance claims on the Boodarie Iron project was confirmed by the High Court in June 2011. As a result of these appeals, US$138 million was released from the Group’s income tax provision in September 2010 and US$580 million in June 2011.
Consistent with the functional currency of the Group’s operations, eligible Australian entities elected to adopt a US dollar tax functional currency from 1 July 2011. As a result, the deferred tax liability (DTL) relating to certain US dollar denominated financial arrangements has been derecognised, resulting in a credit to income tax expense of US$1.5 billion.
Exceptional items during FY2011 are classified by nature as follows.
| | | | | | | | | | | | |
Year ended 30 June 2011 US$M | | External
services | | | Closure and
rehabilitation
provisions
released | | | Gross | |
Withdrawn offer for PotashCorp | | | (314 | ) | | | – | | | | (314 | ) |
Newcastle steelworks rehabilitation | | | – | | | | 150 | | | | 150 | |
| | | | | | | | | | | | |
| | | (314 | ) | | | 150 | | | | (164 | ) |
| | | | | | | | | | | | |
3.6.6 Business summary
The discussion of results for our Businesses is set out below and focuses on Underlying EBIT, as defined in section 3.3. Underlying EBITDA is Underlying EBIT before depreciation, impairments and amortisation. Underlying EBIT and Underlying EBITDA are not IFRS measures of profitability, financial performance or liquidity and may be defined and used in differing ways by different entities. We believe that Underlying EBIT and Underlying EBITDA provide useful information, but should not be considered as an indication of, or alternative to, Attributable profit as an indicator of operating performance. Our use of Underlying EBIT is explained in section 3.6.2.
For further information on our Business results, refer note 2 ‘Segment reporting’ to the financial statements.
Petroleum and Potash
Year ended 30 June 2013 compared with year ended 30 June 2012
Petroleum production increased by six per cent in FY2013, to 236 million barrels of oil equivalent (MMboe) (BHP Billiton share) and included strong performance from Onshore US, which delivered 99 MMboe (BHP Billiton share). The Eagle Ford area contributed 33 per cent of total Onshore US production to become Petroleum’s largest producing field at the end of the period.
Petroleum and Potash revenue increased by US$276 million to US$13.2 billion. Revenue for Onshore US grew by US$818 million to US$3.0 billion, an increase of 37.7 per cent. The increase in revenue in Onshore US resulted from higher volumes, which grew by 15.9 per cent. The increase in volume included a 76 per cent increase in higher value liquids production and a seven per cent increase in natural gas production. Increases in revenue at Mad Dog of US$276 million, with recommencement of operations during the year, and an increase at North West Shelf (NWS) (Australia) of US$203 million, due to higher LNG sales, were partially offset by reductions in our other assets, primarily due to natural field decline at our operated Australian oil and gas assets.
The average realised price of natural gas across our portfolio increased by 11 per cent in FY2013 to US$3.76 per thousand standard cubic feet (scf). This included a 17 per cent increase in the average realised price of US natural gas to US$3.29 per thousand scf. The average realised price of LNG also increased during the period, rising by four per cent to US$14.82 per thousand scf. These gains were partially offset by a four per cent decrease in the average realised price of oil to US$106 per barrel. The average realised price of natural gas liquids (NGLs) was US$45.70 per barrel.
Petroleum and Potash Underlying EBIT for FY2013 declined by US$369 million to US$5.7 billion. Petroleum’s Underlying EBIT decreased by US$363 million to US$6.0 billion. The natural field decline at our Australian assets contributed to a US$266 million volume related reduction in Underlying EBIT. A series of one-off charges, which included Onshore US drill rig contract termination costs and an impairment that followed the suspension of studies and re-evaluation of alternative development options associated with the Mad Dog Phase 2 project, reduced Underlying EBIT by a further US$160 million. In contrast, a US$126 million reduction in exploration and business development expense reflected our sharpened focus on high value oil and gas prospects in the Gulf of Mexico and offshore Western Australia.
The Onshore US Underlying EBIT was a loss of US$287 million compared with a loss of US$140 million in FY2012. The FY2013 loss included a one-off charge for the drill rig termination costs of US$77 million. The FY2012 loss included a one-off gain of US$192 million associated with legacy US gas derivatives. Adjusting for the one-off gains and losses, the loss in Underlying EBIT reduced year-over-year. The reduced loss was primarily due to increased volumes and prices partially offset by higher depreciation and amortisation of US$355 million and higher transportation costs due to higher volumes.
Capital expenditure for our conventional and unconventional operations totalled US$7.1 billion in FY2013. This included US$4.8 billion in Onshore US drilling and development expenditure, with over 80 per cent of drilling
activity directed towards the Eagle Ford and Permian areas, as planned. While still in its early stages, the Permian evaluation program continues to deliver encouraging results, as demonstrated by the 1 MMboe produced in FY2013. The contribution of approximately 4 MMboe is expected in FY2014.
Onshore US overview for FY2013
| | | | | | | | | | | | | | |
FY2013 | | Liquids-focused
areas (Eagle
Ford and
Permian) | | | Gas-focused areas
(Haynesville and
Fayetteville) | | | Total | |
Capital expenditure | | US$ billion | | | 3.9 | | | | 0.9 | | | | 4.8 | |
Production | | MMboe | | | 33.4 | | | | 65.8 | | | | 99.2 | |
Product mix | | Natural gas | | | 42 | % | | | 100 | % | | | | |
| | Natural Gas Liquid | | | 23 | % | | | – | | | | | |
| | Crude and condensate | | | 35 | % | | | – | | | | | |
Onshore US capital expenditure is expected to decline to US$3.9 billion in FY2014 as we continue to optimise our drilling program. This includes a forecast reduction in our operated rig count to an average of 25 for the period. Approximately 75 per cent of operated drilling activity will be focused on our liquids-rich acreage in the Eagle Ford area. The remaining activity will occur in the Haynesville and Permian areas, where we are continuing to evaluate our most prospective acreage. Our operated drilling program in the Fayetteville area has been temporarily suspended; however, we will continue to invest in wells operated by third parties where we see value.
Petroleum exploration expenditure for FY2013 was US$675 million, of which US$522 million was expensed. A US$600 million exploration program, largely focused on the Gulf of Mexico and Western Australia, is planned for FY2014.
Petroleum production is forecast to increase to 250 MMboe (BHP Billiton share) in FY2014. This includes 114 MMboe (BHP Billiton share) from Onshore US, underpinned by an anticipated 75 per cent increase in liquids production. Production from the conventional operations is expected to remain stable, with new volumes from Macedon and increased production at Atlantis (United States) offset by expected natural field decline and planned maintenance.
The Potash Business is not in production and had a loss, in Underlying EBIT terms, for FY2013 of US$334 million, which was largely unchanged from the prior period. A reduction in our global potash exploration activity was offset by higher costs associated with the establishment of our Potash Business in Saskatchewan (Canada). In August 2013, we announced our decision to invest a further US$2.6 billion, which brings the total approved spending to US$3.8 billion, to finish the excavation and lining of the Jansen Potash Project production and service shafts, and to continue the installation of essential surface infrastructure and utilities. Completion of both shafts is expected during CY2016, while the associated works program will extend into CY2017.
Supplementary information for FY2013 and FY2012 for the Petroleum and Potash Business is presented below.
Year ended 30 June 2013
| | | | | | | | | | | | | | | | | | | | | | | | | | | | |
| | | US$ million | |
| | | Revenue (1) | | | Underlying
EBITDA | | | D&A | | | Underlying
EBIT | | | Capital
expenditure (2) | | | Exploration
gross(3) | | | Exploration
to profit(4) | |
Bass Strait | | | 1,921 | | | | 1,564 | | | | 119 | | | | 1,445 | | | | 457 | | | | | | | | | |
North West Shelf | | | 2,578 | | | | 1,913 | | | | 234 | | | | 1,679 | | | | 218 | | | | | | | | | |
Atlantis | | | 853 | | | | 710 | | | | 147 | | | | 563 | | | | 391 | | | | | | | | | |
Shenzi | | | 1,614 | | | | 1,519 | | | | 283 | | | | 1,236 | | | | 265 | | | | | | | | | |
Mad Dog | | | 276 | | | | 233 | | | | 98 | | | | 135 | | | | 121 | | | | | | | | | |
Onshore US(5) | | | 2,987 | | | | 1,508 | | | | 1,795 | | | | (287 | ) | | | 4,816 | | | | | | | | | |
Algeria(6) | | | 533 | | | | 460 | | | | 18 | | | | 442 | | | | 24 | | | | | | | | | |
UK | | | 244 | | | | 95 | | | | 46 | | | | 49 | | | | 8 | | | | | | | | | |
Exploration | | | – | | | | (522 | ) | | | 230 | | | | (752 | ) | | | – | | | | | | | | | |
Other(7) (8) | | | 2,032 | | | | 1,746 | | | | 282 | | | | 1,464 | | | | 772 | | | | | | | | | |
| | | | | | | | | | | | | | | | | | | | | | | | | | | | |
Total Petroleum | | | 13,038 | | | | 9,226 | | | | 3,252 | | | | 5,974 | | | | 7,072 | | | | 675 | | | | 620 | |
| | | | | | | | | | | | | | | | | | | | | | | | | | | | |
Potash | | | – | | | | (309 | ) | | | 25 | | | | (334 | ) | | | 658 | | | | | | | | | |
| | | | | | | | | | | | | | | | | | | | | | | | | | | | |
Total Potash | | | – | | | | (309 | ) | | | 25 | | | | (334 | ) | | | 658 | | | | 89 | | | | 89 | |
| | | | | | | | | | | | | | | | | | | | | | | | | | | | |
Total Petroleum and Potash from Group production | | | 13,038 | | | | 8,917 | | | | 3,277 | | | | 5,640 | | | | 7,730 | | | | | | | | | |
| | | | | | | | | | | | | | | | | | | | | | | | | | | | |
Third party products | | | 175 | | | | 11 | | | | – | | | | 11 | | | | – | | | | | | | | | |
| | | | | | | | | | | | | | | | | | | | | | | | | | | | |
Total Petroleum and Potash | | | 13,213 | | | | 8,928 | | | | 3,277 | | | | 5,651 | | | | 7,730 | | | | 764 | | | | 709 | |
| | | | | | | | | | | | | | | | | | | | | | | | | | | | |
Year ended 30 June 2012
| | | | | | | | | | | | | | | | | | | | | | | | | | | | |
| | | US$ million | |
| | | Revenue (1) | | | Underlying
EBITDA | | | D&A | | | Underlying
EBIT | | | Capital
expenditure (2) | | | Exploration
gross(3) | | | Exploration
to profit(4) | |
Bass Strait | | | 1,950 | | | | 1,560 | | | | 110 | | | | 1,450 | | | | 699 | | | | | | | | | |
North West Shelf | | | 2,375 | | | | 1,819 | | | | 211 | | | | 1,608 | | | | 278 | | | | | | | | | |
Atlantis | | | 769 | | | | 638 | | | | 146 | | | | 492 | | | | 298 | | | | | | | | | |
Shenzi | | | 1,767 | | | | 1,650 | | | | 333 | | | | 1,317 | | | | 343 | | | | | | | | | |
Mad Dog | | | – | | | | (28 | ) | | | 9 | | | | (37 | ) | | | 105 | | | | | | | | | |
Onshore US(5) | | | 2,169 | | | | 1,300 | | | | 1,440 | | | | (140 | ) | | | 3,293 | | | | | | | | | |
Algeria(6) | | | 635 | | | | 560 | | | | 52 | | | | 508 | | | | 24 | | | | | | | | | |
UK | | | 322 | | | | 223 | | | | 35 | | | | 188 | | | | 12 | | | | | | | | | |
Exploration | | | – | | | | (636 | ) | | | 188 | | | | (824 | ) | | | – | | | | | | | | | |
Other(7) (8) (9) | | | 2,720 | | | | 2,326 | | | | 543 | | | | 1,783 | | | | 778 | | | | | | | | | |
| | | | | | | | | | | | | | | | | | | | | | | | | | | | |
Total Petroleum | | | 12,707 | | | | 9,412 | | | | 3,067 | | | | 6,345 | | | | 5,830 | | | | 1,355 | | | | 818 | |
| | | | | | | | | | | | | | | | | | | | | | | | | | | | |
Potash | | | – | | | | (328 | ) | | | – | | | | (328 | ) | | | 460 | | | | | | | | | |
| | | | | | | | | | | | | | | | | | | | | | | | | | | | |
Total Potash | | | – | | | | (328 | ) | | | – | | | | (328 | ) | | | 460 | | | | 220 | | | | 220 | |
| | | | | | | | | | | | | | | | | | | | | | | | | | | | |
Total Petroleum and Potash from Group production | | | 12,707 | | | | 9,084 | | | | 3,067 | | | | 6,017 | | | | 6,290 | | | | | | | | | |
| | | | | | | | | | | | | | | | | | | | | | | | | | | | |
Third party products | | | 230 | | | | 3 | | | | – | | | | 3 | | | | – | | | | | | | | | |
| | | | | | | | | | | | | | | | | | | | | | | | | | | | |
Total Petroleum and Potash | | | 12,937 | | | | 9,087 | | | | 3,067 | | | | 6,020 | | | | 6,290 | | | | 1,575 | | | | 1,038 | |
| | | | | | | | | | | | | | | | | | | | | | | | | | | | |
(1) | Petroleum revenue from Group production includes crude oil US$7,604 million (2012: US$7,804 million), natural gas US$2,842 million (2012: US$2,426 million), LNG US$1,686 million (2012: US$1,483 million), NGL US$823 million (2012: US$780 million) and other US$83 million (2012: US$214 million). |
(2) | Capital expenditure in aggregate comprises Petroleum US$6,926 million growth and US$146 million other (2012: US$5,709 million growth and US$121 million other) and Potash US$646 million growth and US$12 million other (2012: US$460 million growth and US$ nil other). |
(3) | Includes US$153 million of Petroleum capitalised exploration (2012: US$681 million). |
(4) | Includes US$98 million of Petroleum exploration expenditure previously capitalised, written off as impaired (included in depreciation and amortisation) (2012: US$144 million) |
(5) | Includes Petrohawk Energy Corporation (acquired on 20 August 2011). The year ended June 2012 includes a gain on hedging activity of US$192 million. |
(6) | Algeria includes ROD and Ohanet. The Ohanet Risk Sharing Contract expired in October 2011. |
(7) | Includes the following fields – Macedon, Pyrenees, Stybarrow, Neptune, Minerva, Angostura, West Cameron 76, Genesis, Starlifter and Pakistan. West Cameron 76 and Starlifter were divested in May 2012. |
(8) | Includes an unrealised loss of US$84 million related to Angostura embedded derivative (2012: US$99 million unrealised gain). |
(9) | Includes a post-closing payment of US$100 million received in December 2011 relating to the 2006 divestment of BHP Billiton’s interest in Cascade and Chinook. |
Year ended 30 June 2012 compared with year ended 30 June 2011
In combination with our worldwide conventional oil and gas operations, the integration of the Eagle Ford, Haynesville and Permian operations from the Petrohawk acquisition strengthened our operating position in the Onshore US and combined with the Fayetteville field contributed to a 40 per cent increase in Petroleum production to 222.3 MMboe for FY2012. Our total production averaged 608,000 barrels of oil equivalent per day. This achievement was realised despite extended downtime at our non-operated facilities in the Gulf of Mexico.
Petroleum and Potash revenue increased by US$2.2 billion to US$12.9 billion. This was primarily due to the additional revenue of US$2.1 billion for Onshore US. Increases at other Assets were mainly offset by the downtime at the Mad Dog facilities.
Petroleum and Potash Underlying EBIT for FY2012 declined from US$6.2 billion to US$6.0 billion.
Petroleum’s contribution to Underlying EBIT for FY2012 was unchanged from the prior period at US$6.3 billion. This financial performance was achieved despite natural field decline at Pyrenees and the substantial deferral of production due to extended downtime in the Gulf of Mexico and the NWS. Higher prices for our offshore production increased Underlying EBIT by US$1.5 billion, largely as a result of a 19 per cent increase in the average realised price of oil to US$110.66 per barrel and a 29 per cent rise in the average realised price of LNG to US$14.23 per thousand scf. For US natural gas, our average realised price in FY2012 was US$2.82 per thousand scf, and for NGLs our average realised price in FY2012 was US$54.85. The low natural gas price in the United States resulted in Onshore US having a loss of US$140 million compared with a profit of US$43 million in FY2011.
Capital expenditure across our offshore and onshore operations totalled US$5.8 billion in FY2012. Spending in major capital projects across our conventional portfolio was US$2.5 billion and primarily included projects in Western Australia and the Gulf of Mexico.
Exploration and development expenditure specifically within our Onshore US Asset totalled US$3.7 billion in FY2012 and was expected to rise to US$4.0 billion in FY2013. At the end of FY2012, over 80 per cent of the activity of our approximately 40 drilling rigs in the Onshore US Asset was focused on the Eagle Ford and Permian areas.
We achieved success in our conventional exploration program in FY2012 as seven of 12 wells encountered hydrocarbons. The associated rise in our level of activity resulted in a US$798 million increase in gross exploration spend for the period to US$1.4 billion. Capitalised exploration costs increased from US$153 million in FY2011 to US$681 million in FY2012.
The strong liquids growth potential of our Onshore US Asset was demonstrated by the 60 per cent increase in LNG production, to more than 40,000 barrels per day over the 10-month period since the acquisition of Petrohawk.
Higher potash exploration and business development costs resulted in a loss in FY2012 Underlying EBIT of US$328 million.
Copper
Year ended 30 June 2013 compared with year ended 30 June 2012
Copper production increased by 10 per cent in FY2013 to 1.2 Mt (BHP Billiton share). Escondida (Chile) copper production increased by 28 per cent to 1.1 Mt (100 per cent basis) as the average copper grade mined rose to
1.4 per cent and milling rates improved. Record annual copper production at Antamina (Peru) also contributed to the strong result having benefited from a full-year contribution from the recently expanded concentrator.
Copper revenue increased by US$395 million to US$12.0 billion, largely driven by production increases at Escondida and Antamina, partially offset by a five per cent decrease in average realised copper prices. Revenue for Escondida increased US$925 million to US$4.9 billion due to the 28 per cent increase in production, driven by higher average copper grades mined and improved milling rates partially offset by lower average realised prices. The increase in revenue at Escondida was partially offset by decreases at Pampa Norte (Chile), Cannington and Olympic Dam (both Australia) in line with lower production and lower average realised prices.
Underlying EBIT for FY2013 declined by US$343 million to US$3.6 billion. Increased sales volumes and cost savings associated with productivity gains and broader economies of scale increased Underlying EBIT by US$428 million. In this context, strong production growth and a material reduction in costs contributed towards a 15 per cent reduction in unit cash costs at Escondida. These savings were offset by payments associated with the finalisation of multi-year collective labour agreements at each of our South American assets and major planned maintenance programs at Escondida and Olympic Dam. The external influences of lower prices, inflation and foreign exchange variations reduced Underlying EBIT by a further US$658 million.
Revenue for Olympic Dam decreased by US$273 million to US$1.9 billion, primarily due to lower prices and reduced volumes. Price, grade and smelter availability contributed to the decrease in Underlying EBIT from US$214 million in FY2012 to an Underlying EBIT loss of US$4 million in FY2013.
The average realised price of copper for the period declined by five per cent to US$3.41 per pound. At 30 June 2013, the Group had 283,753 tonnes of outstanding copper sales that were revalued at a weighted average price of US$3.08 per pound. The final price of these sales will be determined in FY2014. In addition, 278,547 tonnes of copper sales from FY2012 were subject to a finalisation adjustment in FY2013. Provisional pricing and finalisation adjustments decreased Underlying EBIT by US$224 million in FY2013 (FY2012: US$265 million loss).
During the period, we signed a definitive agreement to sell our Pinto Valley mining operation and the associated San Manuel Arizona Railroad Company to Capstone Mining Corp. for an aggregate cash consideration of US$650 million. The transaction is subject to regulatory approval and other customary conditions, and is expected to be completed in the second half of the CY2013.
Escondida production is forecast to remain steady at approximately 1.1 Mt (100 per cent basis) in FY2014, before increasing to approximately 1.3 Mt (100 per cent basis) in FY2015.
Copper production for FY2014 is expected to remain largely unchanged at approximately 1.2 Mt (BHP Billiton share excluding Pinto Valley production). Production at Spence is expected to be weighted towards the second half of FY2014, as lower recoveries reduce output in the September 2013 quarter. At Antamina, mining will transition from a copper to zinc rich ore zone in the second half of FY2014, consistent with the mine plan.
Supplementary information for FY2013 and FY2012 for the Copper Business is presented below.
Year ended 30 June 2013
| | | | | | | | | | | | | | | | | | | | | | | | | | | | |
| | | US$ million | |
| | | Revenue | | | Underlying
EBITDA | | | D&A | | | Underlying
EBIT | | | Capital
expenditure (1) | | | Exploration
gross(2) | | | Exploration
to profit | |
Escondida | | | 4,927 | | | | 2,788 | | | | 372 | | | | 2,416 | | | | 1,301 | | | | | | | | | |
Pampa Norte(3) | | | 1,818 | | | | 695 | | | | 227 | | | | 468 | | | | 119 | | | | | | | | | |
Antamina | | | 1,303 | | | | 795 | | | | 80 | | | | 715 | | | | 214 | | | | | | | | | |
Cannington | | | 1,365 | | | | 646 | | | | 40 | | | | 606 | | | | 35 | | | | | | | | | |
Olympic Dam | | | 1,873 | | | | 245 | | | | 249 | | | | (4 | ) | | | 225 | | | | | | | | | |
Other(4) | | | 127 | | | | (557 | ) | | | 19 | | | | (576 | ) | | | 226 | | | | | | | | | |
| | | | | | | | | | | | | | | | | | | | | | | | | | | | |
Total Copper from Group production | | | 11,413 | | | | 4,612 | | | | 987 | | | | 3,625 | | | | 2,120 | | | | | | | | | |
| | | | | | | | | | | | | | | | | | | | | | | | | | | | |
Third party products | | | 578 | | | | (3 | ) | | | – | | | | (3 | ) | | | – | | | | | | | | | |
| | | | | | | | | | | | | | | | | | | | | | | | | | | | |
Total Copper | | | 11,991 | | | | 4,609 | | | | 987 | | | | 3,622 | | | | 2,120 | | | | 246 | | | | 246 | |
| | | | | | | | | | | | | | | | | | | | | | | | | | | | |
Year ended 30 June 2012
| | | | | | | | | | | | | | | | | | | | | | | | | | | | |
| | | US$ million | |
| | | Revenue | | | Underlying
EBITDA | | | D&A | | | Underlying
EBIT | | | Capital
expenditure (1) | | | Exploration
gross(2) | | | Exploration
to profit | |
Escondida | | | 4,002 | | | | 2,101 | | | | 273 | | | | 1,828 | | | | 1,173 | | | | | | | | | |
Pampa Norte(3) | | | 2,152 | | | | 1,037 | | | | 200 | | | | 837 | | | | 242 | | | | | | | | | |
Antamina | | | 1,229 | | | | 824 | | | | 40 | | | | 784 | | | | 256 | | | | | | | | | |
Cannington | | | 1,590 | | | | 908 | | | | 53 | | | | 855 | | | | 96 | | | | | | | | | |
Olympic Dam | | | 2,146 | | | | 434 | | | | 220 | | | | 214 | | | | 394 | | | | | | | | | |
Other(4) | | | 43 | | | | (600 | ) | | | (64 | ) | | | (536 | ) | | | 489 | | | | | | | | | |
| | | | | | | | | | | | | | | | | | | | | | | | | | | | |
Total Copper from Group production | | | 11,162 | | | | 4,704 | | | | 722 | | | | 3,982 | | | | 2,650 | | | | | | | | | |
| | | | | | | | | | | | | | | | | | | | | | | | | | | | |
Third party products | | | 434 | | | | (17 | ) | | | – | | | | (17 | ) | | | – | | | | | | | | | |
| | | | | | | | | | | | | | | | | | | | | | | | | | | | |
Total Copper | | | 11,596 | | | | 4,687 | | | | 722 | | | | 3,965 | | | | 2,650 | | | | 330 | | | | 324 | |
| | | | | | | | | | | | | | | | | | | | | | | | | | | | |
(1) | Capital expenditure in aggregate comprises US$1,468 million growth and US$652 million other (2012: US$2,010 million growth and US$640 million other). |
(2) | Includes US$ nil capitalised exploration (2012: US$6 million). |
(3) | Includes Spence and Cerro Colorado. |
(4) | Includes Pinto Valley. Depreciation and amortisation includes impairment reversals of US$ nil relating to Pinto Valley (2012: US$71 million). BHP Billiton has agreed to sell its Pinto Valley mining operation. The transaction is subject to regulatory approval, and other customary conditions, and is expected to be completed in the second half of CY2013. |
Year ended 30 June 2012 compared with year ended 30 June 2011
We established strong momentum in our Copper Business in the June 2012 quarter. Escondida copper production increased by 22 per cent from the March 2012 quarter as mining activities progressed towards higher-grade ore, while quarterly material mined, mill throughput and copper production records at Antamina added to the strong finish to the year. Annual copper production, however, declined marginally in FY2012 as lower grades and industrial action constrained performance at Escondida for the first nine months of the year. Production from Pampa Norte, Olympic Dam and Cannington during FY2012 was in line with production in FY2011.
Revenue for FY2012 decreased by US$2.6 billion to US$11.6 billion. The reduction was mainly driven by a US$1.6 billion decrease at Escondida due to a 14 per cent decrease in copper volume sold and to a 14 per cent fall in the average realised price of copper to US$3.58 per pound. Lowers prices also contributed to decreases at Pampa Norte and Australian Assets, of US$332 million and US$363 million respectively.
Underlying EBIT for FY2012 decreased by US$2.8 billion to US$4.0 billion, primarily due to the decrease in revenue. General cost pressure across the Copper Business portfolio, together with unit cost escalation specifically associated with industrial activity and lower ore grades at Escondida, reduced Underlying EBIT by US$841 million.
At 30 June 2012, the Group had 278,547 tonnes of outstanding copper sales that were revalued at a weighted average price of US$3.49 per pound. The final price of these sales was determined in FY2013. In addition, 239,156 tonnes of copper sales from FY2011 were subject to a finalisation adjustment in FY2012. This finalisation adjustment and the provisional pricing impact as at 30 June 2012 decreased Underlying EBIT by US$265 million for the period.
| | | | | | | | | | | | | | | | | | | | | | | | | | | | | | | | | | | | | | | | | | | | | | | | | | | | | | | | | | | | | | | | | | | | | | | | | | | | | | | | | | | | | | | | | | | | | | | | | | | | | | | | | | | | | | |
As at 30 June 2015 | | | As at 30 June 2014 | |
| | | | | Proven Ore Reserves | | | Probable Ore Reserves | | | Total Ore Reserves | | | Reserve
Life
(years) | | | BHP
Billiton
Interest
% | | | Total Ore Reserves | | | | | | | | | Reserve
Life
(years) | |
Commodity
Deposit(1)(2)(3)(4)(5) | | Ore
Type | | Mt | | | %Fe | | | %P | | | %SiO2 | | | %Al2O3 | | | %LOI | | | Mt | | | %Fe | | | %P | | | %SiO2 | | | %Al2O3 | | | %LOI | | | Mt | | | %Fe | | | %P | | | %SiO2 | | | %Al2O3 | | | %LOI | | | | | Mt | | | %Fe | | | %P | | | %SiO2 | | | %Al2O3 | | | %LOI | | |
Iron Ore | | | | | | | | | | | | | | | | | | | | | | | | | | | | | | | | | | | | | | | | | | | | | | | | | | | | | | | | | | | | | | | | | | | | | | | | | | | | | | | | | | | | | | | | | | | | | | | | | | | | | | | | | | | | | | |
Year ended WAIO(6)(7)(8)(9)(10)
| | BKM | | | 940 | | | | 63.1 | | | | 0.11 | | | | 3.1 | | | | 2.1 | | | | 4.0 | | | | 1,400 | | | | 61.5 | | | | 0.12 | | | | 4.2 | | | | 2.3 | | | | 4.9 | | | | 2,400 | | | | 62.2 | | | | 0.12 | | | | 3.8 | | | | 2.2 | | | | 4.6 | | | | 15 | | | | 89 | | | | 2,100 | | | | 62.2 | | | | 0.12 | | | | 3.7 | | | | 2.2 | | | | 4.5 | | | | 16 | |
| | BKM Bene | | | 80 | | | | 61.5 | | | | 0.11 | | | | 6.2 | | | | 2.8 | | | | 1.7 | | | | 90 | | | | 60.8 | | | | 0.13 | | | | 6.9 | | | | 2.7 | | | | 1.7 | | | | 170 | | | | 61.2 | | | | 0.12 | | | | 6.5 | | | | 2.7 | | | | 1.7 | | | | | | | | | | | | 170 | | | | 60.7 | | | | 0.09 | | | | 7.5 | | | | 2.7 | | | | 1.7 | | | | | |
| | CID | | | 600 | | | | 56.2 | | | | 0.05 | | | | 6.4 | | | | 1.8 | | | | 10.9 | | | | 130 | | | | 57.6 | | | | 0.05 | | | | 5.5 | | | | 1.4 | | | | 10.4 | | | | 740 | | | | 56.5 | | | | 0.05 | | | | 6.2 | | | | 1.7 | | | | 10.8 | | | | | | | | | | | | 840 | | | | 56.5 | | | | 0.05 | | | | 6.1 | | | | 1.7 | | | | 10.8 | | | | | |
| | MM | | | 200 | | | | 62.3 | | | | 0.06 | | | | 3.0 | | | | 1.6 | | | | 5.8 | | | | 410 | | | | 60.7 | | | | 0.07 | | | | 4.0 | | | | 2.2 | | | | 6.3 | | | | 610 | | | | 61.2 | | | | 0.07 | | | | 3.6 | | | | 2.0 | | | | 6.1 | | | | | | | | | | | | 530 | | | | 61.5 | | | | 0.07 | | | | 3.5 | | | | 1.9 | | | | 6.0 | | | | | |
| | NIM | | | – | | | | – | | | | – | | | | – | | | | – | | | | – | | | | – | | | | – | | | | – | | | | – | | | | – | | | | – | | | | – | | | | – | | | | – | | | | – | | | | – | | | | – | | | | | | | | | | | | 30 June 2013 compared with year ended 30 June 2012 | | | | 59.8 | | | | 0.05 | | | | 10.2 | | | | 1.2 | | | | 2.3 | | | | | |
| | | | | | | | | | | | | | | | | | | | | | | | | | | | |
| | | | | Mt | | | | %Fe | | | | %Pc | | | | | | | | | | | | | | | | Mt | | | | %Fe | | | | %Pc | | | | | | | | | | | | | | | | Mt | | | | %Fe | | | | %Pc | | | | | | | | | | | | | | | | | | | | | | | | Mt | | | | %Fe | | | | %Pc | | | | | | | | | | | | | | | | | |
Samarco JV(11) | | ROM | | | 1,400 | | | | 40.4 | | | | 0.05 | | | | | | | | | | | | | | | | 1,500 | | | | 38.8 | | | | 0.05 | | | | | | | | | | | | | | | | 2,900 | | | | 39.6 | | | | 0.05 | | | | | | | | | | | | | | | | 38 | | | | 50 | | | | 2,900 | | | | 39.6 | | | | 0.05 | | | | | | | | | | | | | | | | 39 | |
| (1) | Approximate drill hole spacings used to classify the reserves were: |
| | | | |
Deposit | | Proven Ore Reserves | | Probable Ore Reserves |
WAIO | | 50m x 50m | | 150m x 50m |
Samarco JV | | Maximum 150m x 100m | | Maximum 300m x 200m |
| (2) | WAIO recovery was 100%, except for BKM Bene – Brockman Beneficiated Ore, where recovery was 74% (tonnage basis) due to the beneficiation plant processing ore from Whaleback. Samarco JV recovery was 82% (metal basis). |
| (3) | The reserve grades listed refer to in situ mass percentage on a dry weight basis. WAIO tonnages represent wet tonnes based on the following moisture contents: BKM – Brockman 3%, BKM Bene – 3%, CID – Channel Iron Deposits 8%, MM – Marra Mamba 4%, NIM – Nimingarra 3.5%. For Samarco JV, the reserve tonnages also represent wet tonnes based on a moisture content of 6.5% for ROM. Iron ore production increasedis marketed for WAIO as Lump (direct blast furnace feed) and Fines (sinter plant feed) and Samarco JV as Fines (sinter plant feed), direct reduction and blast furnace pellets. |
| (4) | Cut-off grades: WAIO 50–58%Fe for all material types; Samarco JV Fe³ 22%, Pc£ 0.097% (phosphorous in concentrate) and PPCc£ 7.7% (LOI in concentrate). |
| (5) | Ore delivered to process plant. |
| (6) | WAIO reserves are reported on a Pilbara basis by seven per cent in FY2013ore type to 170 Mt (BHP Billiton share). WAIOalign with our production of 187 Mt (100 per cent basis) representedthe Newman Blend lump product which comprises of BKM, BKM Bene and MM ore types, in addition to other lump and fines products. This also reflects our single logistics chain and associated management system. |
| (7) | WAIO BHP Billiton interest is reported as Pilbara reserve tonnes weighted average across all Joint Ventures. BHP Billiton ownership varies between 85% and 100%. |
| (8) | WAIO reserves are all located on State Agreement mining leases that guarantee the right to mine. Across WAIO, State Government approvals (including environmental and heritage clearances) are required before commencing mining operations in a thirteenth consecutive annual production record. The delivery of WAIO’s capital efficient growth program and continued strong operating performance across the supply chain contributed to this record result. The three pellet plants at Samarco (Brazil) continued to operate at capacity during the period.Iron Ore revenue decreased by US$2.4 billion to US$20.2 billion in FY2013. Revenue for WAIO decreased US$2.0 billion to US$18.5 billion, a decrease of 9.9 per cent. Record sales volumes at WAIO, which increased 9.6 per cent, were more than offset by a 17 per cent fallparticular area. Included in the average realised pricereserves are select areas where one or more approvals remain outstanding, but where, based on the technical investigations carried out as part of iron ore to US$110 per tonne.
Underlying EBIT for FY2013 declined by US$3.1 billion to US$11.1 billion. The increased sales volumes at WAIO increased Underlying EBIT by US$1.4 billion. However, this was more than offsetthe mine planning process and company knowledge and experience of the approvals process, it is expected that such approvals will be obtained as part of the normal course of business and within the time frame required by the fallcurrent mine schedule.
|
| (9) | WAIO – Reporting of NIM ore type was discontinued due to suspension of mining activities at the Yarrie mine in the average realised price of iron ore, which reduced Underlying EBIT by US$3.9 billion, net of price-linked costs. WAIO’s export volumes for FY2013 were sold on the basis of shorter term, market-based prices. Revenue for the period reflected the average index price one month priorNorthern Pilbara in February 2014. |
| (10) | WAIO – The increase in reserves was due to the month of shipment, adjusted for product characteristics such as iron and moisture content. Approximately 65 per cent of shipments were delivered on a Cost and Freight (CFR) basis.Increased labour and contractor costs reduced Underlying EBIT by US$151 million during the period. This largely reflected our decision to invest in operating capability prior to the full commissioning and ramp-up of expanded capacity at WAIO. WAIO unit cash costs, including freight and royalty charges of US$856 million and US$1.2 billion, respectively, remained largely unchanged during FY2013. Increased depreciation and amortisation charges reduced Underlying EBIT by US$239 million, and reflected the recent completion of
several major projects and a US$86 million impairment of project costs associated with the WAIO Tug Harbour project.
On 10 July 2013, we completed the extension of our long-term WAIO joint venture relationship with ITOCHU Corporation (ITOCHU) and Mitsui & Co., Ltd. (Mitsui). This transaction has aligned interests across the WAIO supply chain. Under the terms of the agreement, ITOCHU and Mitsui invested approximately US$822 million and US$720 million, respectively, in shares and loans of BHP Iron Ore (Jimblebar) Pty Ltd, representing an eight per cent and seven per cent interestrevised economic assumptions used in the Jimblebar mining hub and resource.mine planning process. The consideration included a share of capital costs associated with the Jimblebar Mine Expansion project.
Several major milestones were achieved at our WAIO Asset during FY2013, includingdecrease in Reserve Life was due to an increase in port capacitynominated production rate from 233Mt in FY2014 to 220 million tonnes per annum (Mtpa) (100 per cent basis) following the successful installation of all major infrastructure associated with the Port Hedland Inner Harbour Expansion project. First production from the Jimblebar Mine Expansion, which is expected264Mt in FY2015.
|
| (11) | Samarco JV – Delays in environmental approvals due to increase mine capacity to 220 Mtpa (100 per cent basis), is expectedchanges in the December 2013 quarter, ahead of schedule. Longer term, the progressive debottlenecking of the supply chain is expected to underpin substantial low-cost growth in our WAIO Asset.WAIO production is expected to increase by 10 per cent to approximately 207 Mt (100 per cent basis) in FY2014. The associated productivity gains should benefit unit costs in FY2014; however, this is expected to be more than offset by a temporary increase in strip ratios as the Jimblebar Mine Expansion ramps up production. Total iron ore production for FY2014, which includes Samarco production, is forecast to increase by 11 per cent to 188 Mt (BHP Billiton share).
Supplementary information for FY2013 and FY2012Brazilian legislation for the Iron Ore Businessprotection of caves within the declared reserves footprint resulted in downgrading of 400Mt Proven Reserves to Probable Reserves. Although it is presented below.
Year ended 30 June 2013too early to assess the final impact of these regulations on Samarco’s operations, industry precedent suggests that such approvals could be anticipated.
|
Coal Business
Coal Reserves in accordance with Industry Guide 7
| | | | | | | | | | | | | | | | | | | | | | | | | | | | | | | | | | | | | | | | | | | | | | | | | | | | | | | | | | | | | | | | | | | | | | | | | | | | | | | | | | | | | | | | | | | | |
As at 30 June 2015 | | | As at 30 June 2014 | |
Commodity Deposit (1)(2)(3)(4)(5) | | Mining
Method | | Coal
Type | | Proven Coal
Reserves | | | Probable Coal
Reserves | | | Total Coal
Reserves | | | Proven Marketable
Coal Reserves | | | Probable Marketable
Coal Reserves | | | Total Marketable
Coal Reserves | | | Reserve
Life
(years) | | | BHP
Billiton
Interest % | | | Total Marketable
Coal Reserves | | | Reserve
Life
(years) | |
| | | | Mt | | | Mt | | | Mt | | | Mt | | | %Ash | | | %VM | | | %S | | | Mt | | | %Ash | | | %VM | | | %S | | | Mt | | | %Ash | | | %VM | | | %S | | | | | Mt | | | %Ash | | | %VM | | | %S | | |
Metallurgical Coal | | | | | | | | | | | | | | | | | | | | | | | | | | | | | | | | | | | | | | | | | | | | | | | | | | | | | | | | | | | | | | | | | | | | | | | | | | | | | | | | | | | | | | | | | | | | |
Queensland Coal | | | | | | | | | | | | | | | | | | | | | | | | | | | | | | | | | | | | | | | | | | | | | | | | | | | | | | | | | | | | | | | | | | | | | | | | | | | | | | | | | | | | | | | | | | | | |
CQCA JV | | | | | | | | | | | | | | | | | | | | | | | | | | | | | | | | | | | | | | | | | | | | | | | | | | | | | | | | | | | | | | | | | | | | | | | | | | | | | | | | | | | | | | | | | | | | |
Goonyella Riverside Broadmeadow (6) | | OC | | Met | | | 599 | | | | 19 | | | | 618 | | | | 469 | | | | 9.1 | | | | 22.8 | | | | 0.53 | | | | 14 | | | | 10.9 | | | | 23.1 | | | | 0.57 | | | | 483 | | | | 9.2 | | | | 22.8 | | | | 0.53 | | | | 33 | | | | 50 | | | | 404 | | | | 9.8 | | | | 22.7 | | | | 0.50 | | | | 30 | |
| | UG | | Met | | | 37 | | | | 160 | | | | 197 | | | | 30 | | | | 8.0 | | | | 23.0 | | | | 0.52 | | | | 110 | | | | 9.3 | | | | 23.6 | | | | 0.55 | | | | 140 | | | | 9.0 | | | | 23.4 | | | | 0.54 | | | | | | | | | | | | 144 | | | | 9.0 | | | | 23.4 | | | | 0.54 | | | | | |
Peak Downs(7) | | OC | | Met | | | 463 | | | | 548 | | | | 1,011 | | | | 282 | | | | 10.6 | | | | 22.3 | | | | 0.60 | | | | 319 | | | | 10.3 | | | | 21.9 | | | | 0.59 | | | | 601 | | | | 10.5 | | | | 22.1 | | | | 0.60 | | | | 33 | | | | 50 | | | | 613 | | | | 10.5 | | | | 22.1 | | | | 0.60 | | | | 34 | |
Saraji (8) | | OC | | Met | | | 372 | | | | 153 | | | | 525 | | | | 234 | | | | 10.6 | | | | 18.0 | | | | 0.60 | | | | 88 | | | | 10.6 | | | | 18.5 | | | | 0.70 | | | | 322 | | | | 10.6 | | | | 18.1 | | | | 0.63 | | | | 30 | | | | 50 | | | | 327 | | | | 10.6 | | | | 18.1 | | | | 0.63 | | | | 37 | |
Norwich Park(9) | | OC | | Met | | | 154 | | | | 76 | | | | 230 | | | | 112 | | | | 10.3 | | | | 16.9 | | | | 0.70 | | | | 54 | | | | 10.3 | | | | 16.9 | | | | 0.70 | | | | 166 | | | | 10.3 | | | | 16.9 | | | | 0.70 | | | | 66 | | | | 50 | | | | 153 | | | | 10.3 | | | | 16.7 | | | | 0.70 | | | | 25 | |
Blackwater | | OC | | Met/Th | | | 128 | | | | 379 | | | | 507 | | | | 114 | | | | 8.0 | | | | 26.7 | | | | 0.40 | | | | 337 | | | | 9.1 | | | | 26.1 | | | | 0.40 | | | | 451 | | | | 8.8 | | | | 26.3 | | | | 0.40 | | | | 29 | | | | 50 | | | | 459 | | | | 8.8 | | | | 26.3 | | | | 0.40 | | | | 30 | |
Daunia | | OC | | Met | | | 84 | | | | 55 | | | | 139 | | | | 69 | | | | 8.0 | | | | 20.8 | | | | 0.35 | | | | 47 | | | | 9.1 | | | | 19.9 | | | | 0.34 | | | | 116 | | | | 8.4 | | | | 20.4 | | | | 0.35 | | | | 25 | | | | 50 | | | | 112 | | | | 8.3 | | | | 20.7 | | | | 0.35 | | | | 25 | |
Gregory JV | | | | | | | | | | | | | | | | | | | | | | | | | | | | | | | | | | | | | | | | | | | | | | | | | | | | | | | | | | | | | | | | | | | | | | | | | | | | | | | | | | | | | | | | | | | | |
Gregory Crinum(9) | | OC | | Met | | | 6.6 | | | | 0.3 | | | | 6.9 | | | | 5.4 | | | | 7.0 | | | | 34.8 | | | | 0.60 | | | | 0.2 | | | | 7.0 | | | | 35.3 | | | | 0.60 | | | | 5.6 | | | | 7.0 | | | | 34.8 | | | | 0.60 | | | | 4.0 | | | | 50 | | | | 5.6 | | | | 7.0 | | | | 34.8 | | | | 0.60 | | | | 2.8 | |
| | UG | | Met | | | – | | | | 2.4 | | | | 2.4 | | | | – | | | | – | | | | – | | | | – | | | | 2.2 | | | | 7.2 | | | | 34.2 | | | | 0.57 | | | | 2.2 | | | | 7.2 | | | | 34.2 | | | | 0.57 | | | | | | | | | | | | 11 | | | | 7.2 | | | | 33.8 | | | | 0.58 | | | | | |
BHP Billiton Mitsui | | | | | | | | | | | | | | | | | | | | | | | | | | | | | | | | | | | | | | | | | | | | | | | | | | | | | | | | | | | | | | | | | | | | | | | | | | | | | | | | | | | | | | | | | | | | |
South Walker Creek(10) | | OC | | Met | | | 73 | | | | 35 | | | | 108 | | | | 52 | | | | 9.2 | | | | 12.8 | | | | 0.32 | | | | 25 | | | | 9.2 | | | | 12.4 | | | | 0.31 | | | | 77 | | | | 9.2 | | | | 12.7 | | | | 0.32 | | | | 14 | | | | 80 | | | | 65 | | | | 9.0 | | | | 14.2 | | | | 0.32 | | | | 11 | |
Poitrel-Winchester(11) | | OC | | Met | | | 61 | | | | 36 | | | | 97 | | | | 42 | | | | 9.0 | | | | 23.5 | | | | 0.32 | | | | 25 | | | | 8.9 | | | | 24.0 | | | | 0.31 | | | | 67 | | | | 9.0 | | | | 23.7 | | | | 0.31 | | | | 20 | | | | 80 | | | | 45 | | | | 8.3 | | | | 23.6 | | | | 0.34 | | | | 14 | |
| | | | | | | | | | | | | | | | | | | | | | | | | | | | |
| | | US$ million | |
| | | Revenue (1) | | | Underlying
EBITDA | | | D&A | | | Underlying
EBIT | | | Capital
expenditure (2) | | | Exploration
gross(3) | | | Exploration
to profit | |
Western Australia Iron Ore | | | 18,452 | | | | 11,428 | | | | 1,004 | | | | 10,424 | | | | 5,483 | | | | | | | | | |
Samarco | | | 1,622 | | | | 811 | | | | 61 | | | | 750 | | | | 772 | | | | | | | | | |
Other | | | – | | | | (84 | ) | | | – | | | | (84 | ) | | | – | | | | | | | | | |
| | | | | | | | | | | | | | | | | | | | | | | | | | | | |
Total Iron Ore from Group production | | | 20,074 | | | | 12,155 | | | | 1,065 | | | | 11,090 | | | | 6,255 | | | | | | | | | |
| | | | | | | | | | | | | | | | | | | | | | | | | | | | |
Third party products (4) | | | 141 | | | | 31 | | | | – | | | | 31 | | | | – | | | | | | | | | |
| | | | | | | | | | | | | | | | | | | | | | | | | | | | |
Total Iron Ore | | | 20,215 | | | | 12,186 | | | | 1,065 | | | | 11,121 | | | | 6,255 | | | | 217 | | | | 74 | |
| | | | | | | | | | | | | | | | | | | | | | | | | | | | |
Year ended 30 June 2012
| | | | | | | | | | | | | | | | | | | | | | | | | | | | |
| | | US$ million | |
| | | Revenue (1) | | | Underlying
EBITDA | | | D&A | | | Underlying
EBIT | | | Capital
expenditure (2) | | | Exploration
gross(3) | | | Exploration
to profit | |
Western Australia Iron Ore | | | 20,480 | | | | 14,025 | | | | 763 | | | | 13,262 | | | | 4,974 | | | | | | | | | |
Samarco | | | 1,996 | | | | 1,106 | | | | 55 | | | | 1,051 | | | | 602 | | | | | | | | | |
Other | | | – | | | | (135 | ) | | | 8 | | | | (143 | ) | | | 58 | | | | | | | | | |
| | | | | | | | | | | | | | | | | | | | | | | | | | | | |
Total Iron Ore from Group production | | | 22,476 | | | | 14,996 | | | | 826 | | | | 14,170 | | | | 5,634 | | | | | | | | | |
| | | | | | | | | | | | | | | | | | | | | | | | | | | | |
Third party products (4) | | | 125 | | | | 31 | | | | – | | | | 31 | | | | – | | | | | | | | | |
| | | | | | | | | | | | | | | | | | | | | | | | | | | | |
Total Iron Ore | | | 22,601 | | | | 15,027 | | | | 826 | | | | 14,201 | | | | 5,634 | | | | 287 | | | | 135 | |
| | | | | | | | | | | | | | | | | | | | | | | | | | | | |
(1) | Includes inter-segment revenue of US$55 million (2012: US$39 million). |
(2) | Capital expenditure in aggregate comprises US$6,072 million growth and US$183 million other (2012: US$5,584 million growth and US$50 million other). |
(3) | Includes US$143 million capitalised exploration (2012: US$152 million). |
(4) | Includes Boodarie Iron sales of contracted gas purchases and US$15 million mark to market gain on an embedded derivative (2012: US$27 million gain). |
Year ended 30 June 2012 compared with year ended 30 June 2011
Our commitment to invest throughout the economic cycle helped to deliver a twelfth consecutive annual production record in iron ore. WAIO shipments rose to a record annualised rate of 179 Mt in the June 2012 quarter (100 per cent basis). Consistently strong operating performance, the ramp-up of Ore Handling Plant 3 at Yandi, dual tracking of the Company’s rail infrastructure and additional ship loading capacity at Port Hedland contributed to the record result. The three pellet plants at Samarco continued to operate at capacity in the period.
Iron Ore revenue increased by US$2.2 billion to US$22.6 billion in FY2012. Revenue for WAIO increased by US$2.3 billion to US$20.5 billion, an increase of 13 per cent, mainly due to record sales volumes, which increased by 19 per cent. This was partially offset by a seven per cent and five per cent decline in fines and lump prices, respectively.
Underlying EBIT for FY2012 increased by US$873 million to a record US$14.2 billion. The outstanding financial performance was underpinned by record production at WAIO, which increased Underlying EBIT by US$2.4 billion. This was partially offset by the decline in realised prices, which reduced Underlying EBIT by US$1.3 billion, net of price-linked costs. While the acquisition of the HWE Mining subsidiaries in September 2012 eliminated third party contractor margin, one-off integration costs and an increase in exploration expense more than offset the cost savings achieved during the period.
Coal
Year ended 30 June 2013 compared with year ended 30 June 2012
Metallurgical coal production increased by 13 per cent in FY2013 to 38 Mt. A 19 per cent increase (100 per cent basis) in production at Queensland Coal was underpinned by record annual performance at both
| (1) | Cut-off criteria applied were: Goonyella Riverside, Peak Downs, Saraji, Norwich Park, Blackwater, Daunia and Gregory³ 0.5m seam thickness; Broadmeadow³ 2.5m seam thickness; Crinum³ 2.0m seam thickness; South Walker Creek and thisPoitrel-Winchester seam thickness cut-off applied after economic assessment. |
| (2) | Only geophysically logged, fully analysed cored holes with greater than 95% recovery were used to classify the reserves. Drill hole spacings vary between seams and geological domains and were determined in conjunction with geostatistical analyses where applicable. The range of maximum spacings was: |
| | | | |
Deposit | | Proven Coal Reserves | | Probable Coal Reserves |
Goonyella Riverside Broadmeadow | | 900m to 1,300m plus 3D seismic coverage for UG | | 1,750m to 2,400m |
Peak Downs | | 500m to 1,050m | | 500m to 2,100m |
Saraji | | 500m to 1,040m | | 900m to 2,100m |
Norwich Park | | 500m to 1,400m | | 1,000m to 2,800m |
Blackwater | | 500m | | 500m to 1,000m |
Daunia | | 650m | | 1,200m |
Gregory Crinum | | 850m plus 3D seismic coverage for UG | | 850m to 1,700m |
South Walker Creek | | 500m to 800m | | 1,000m to 1,500m |
Poitrel-Winchester | | 300m to 950m | | 550m to 1,850m |
| Goonyella | Riverside Broadmeadow and Daunia – The classification criteria were revised based on a drill hole spacing analysis study. |
| (3) | Product recoveries for the operations were: |
| | |
Deposit | | Product Recovery |
Goonyella Riverside Broadmeadow | | 76% |
Peak Downs | | 56-62% |
Saraji | | 61% |
Norwich Park | | 72% |
Blackwater | | 89% |
Daunia | | 83% |
Gregory Crinum | | 84% |
South Walker Creek | | 71% |
Poitrel-Winchester | | 69% |
| (4) | Total Coal Reserves were at the moisture content when mined (4% CQCA JV, Gregory JV, BHP Billiton Mitsui). Total Marketable Coal Reserves were at a product specific moisture content (9.5-10% Goonyella Riverside Broadmeadow; 9.5-10% Peak Downs; 10% Saraji; 7.5-11% Blackwater; 9.5-10% Daunia; 10-11% Norwich Park; 8.5% Gregory Crinum; 9% South Walker Creek; 9.5-12% Poitrel-Winchester) and at an air-dried quality basis, for sale after the beneficiation of the Total Coal Reserves. |
| (5) | Coal delivered to wash plant. |
| (6) | Goonyella Riverside Broadmeadow – The increase in Coal Reserves was achieved despite the indefinite closuredue to revised mining and cost assumptions. |
| (7) | Peak Downs – The Coal Reserves for Caval Ridge are reported as part of Peak Downs. |
| (8) | Saraji – The decrease in Reserve Life was due to an increased nominated production rate from 14.4Mtpa in FY2014 to 17.3Mtpa in FY2015. |
| (9) | Norwich Park and Gregory. In addition, IllawarraGregory mines remain on care and maintenance. The increases in Reserve Life were due to revised assumptions and are subject to ongoing review. |
| (10) | South Walker Creek – The increase in Coal (Australia) achieved record annual productionReserves was due to revised economic assumptions. |
| (11) | Poitrel-Winchester – The increase in Coal Reserves was due to incorporation of additional drilling information. |
Coal Business
Coal Reserves in accordance with Industry Guide 7
| | | | | | | | | | | | | | | | | | | | | | | | | | | | | | | | | | | | | | | | | | | | | | | | | | | | | | | | | | | | | | | | | | | | | | | | | | | | | | | | | | | | | | | | | | | | | | | | | | | | | | | | | | | | |
As at 30 June 2015 | | | As at 30 June 2014 | |
Commodity Deposit(1)(2)(3)(4)(5) | | Mining
Method | | Coal
Type | | Proven
Coal
Reserves | | | Probable
Coal
Reserves | | | Total
Coal
Reserves | | | Proven Marketable Coal
Reserves | | | Probable Marketable Coal
Reserves | | | Total Marketable Coal Reserves | | | Reserve
Life
(years) | | | BHP
Billiton
Interest % | | | Total Marketable Coal Reserves | | | Reserve
Life
(years) | |
| | | | Mt | | | Mt | | | Mt | | | Mt | | | % Ash | | | % VM | | | % S | | | KCal/kg
CV | | | Mt | | | % Ash | | | % VM | | | % S | | | KCal/kg
CV | | | Mt | | | % Ash | | | % VM | | | % S | | | KCal/kg
CV | | | | | Mt | | | % Ash | | | % VM | | | % S | | | KCal/kg
CV | | |
Energy Coal | | | | | | | | | | | | | | | | | | | | | | | | | | | | | | | | | | | | | | | | | | | | | | | | | | | | | | | | | | | | | | | | | | | | | | | | | | | | | | | | | | | | | | | | | | | | | | | | | | | | | | | | | | | | |
New Mexico | | | | | | | | | | | | | | | | | | | | | | | | | | | | | | | | | | | | | | | | | | | | | | | | | | | | | | | | | | | | | | | | | | | | | | | | | | | | | | | | | | | | | | | | | | | | | | | | | | | | | | | | | | | | |
San Juan(6)(7) | | UG | | Th | | | 15 | | | | – | | | | 15 | | | | 15 | | | | 17.2 | | | | – | | | | 0.99 | | | | 5,640 | | | | – | | | | – | | | | – | | | | – | | | | – | | | | 15 | | | | 17.2 | | | | – | | | | 0.99 | | | | 5,640 | | | | 2.5 | | | | 100 | | | | 21 | | | | 17.2 | | | | – | | | | 0.99 | | | | 5,640 | | | | 3.5 | |
Navajo(6)(8) | | OC | | Th | | | 13 | | | | – | | | | 13 | | | | 13 | | | | 21.8 | | | | – | | | | 0.76 | | | | 4,900 | | | | – | | | | – | | | | – | | | | – | | | | – | | | | 13 | | | | 21.8 | | | | – | | | | 0.76 | | | | 4,900 | | | | 2.6 | | | | – | | | | 17 | | | | 21.8 | | | | – | | | | 0.76 | | | | 4,900 | | | | 3.1 | |
Australia | | | | | | | | | | | | | | | | | | | | | | | | | | | | | | | | | | | | | | | | | | | | | | | | | | | | | | | | | | | | | | | | | | | | | | | | | | | | | | | | | | | | | | | | | | | | | | | | | | | | | | | | | | | | |
Mt Arthur Coal(9) | | OC | | Th | | | 519 | | | | 479 | | | | 998 | | | | 409 | | | | 17.3 | | | | 30.5 | | | | 0.56 | | | | 6,380 | | | | 376 | | | | 17.6 | | | | 29.6 | | | | 0.49 | | | | 6,410 | | | | 785 | | | | 17.4 | | | | 30.1 | | | | 0.53 | | | | 6,400 | | | | 31 | | | | 100 | | | | 817 | | | | 16.7 | | | | 30.3 | | | | 0.54 | | | | 6,410 | | | | 33 | |
Colombia | | | | | | | | | | | | | | | | | | | | | | | | | | | | | | | | | | | | | | | | | | | | | | | | | | | | | | | | | | | | | | | | | | | | | | | | | | | | | | | | | | | | | | | | | | | | | | | | | | | | | | | | | | | | |
Cerrejón (10) | | OC | | Th | | | 557 | | | | 92 | | | | 648 | | | | 543 | | | | 9.0 | | | | 32.8 | | | | 0.60 | | | | 6,080 | | | | 90 | | | | 8.8 | | | | 32.6 | | | | 0.50 | | | | 5,970 | | | | 633 | | | | 9.0 | | | | 32.8 | | | | 0.60 | | | | 6,070 | | | | 17 | | | | 33.33 | | | | 704 | | | | 9.3 | | | | 33.7 | | | | 0.60 | | | | 6,170 | | | | 17 | |
| | |
Deposit | | Coal Reserves |
San Juan | | ³ 3.0m seam thickness,³ 5,000KCal/kg CV |
Navajo | | ³ 0.6m seam thickness |
Mt Arthur Coal | | ³ 0.3m mineable seam thickness,£ 26.5% ash,³ 50% product yield |
Cerrejón | | ³ 0.65m seam thickness |
| (2) | Approximate drill hole spacings used to classify the reserves were: |
| | | | |
Deposit | | Proven Coal Reserves | | Probable Coal Reserves |
San Juan | | < 500m (250m radius from drill hole) | | 500m to 1,000m (250m to 500m radius from drill hole) |
Navajo | | < 500m (250m radius from drill hole) | | 500m to 1,000m (250m to 500m radius from drill hole) |
Mt Arthur Coal | | < 500m | | 500m to 1,000m |
Cerrejón | | > 6 drill holes per 100ha | | 2 to 6 drill holes per 100ha |
| (3) | Product recoveries for the operations were: |
| | |
Deposit | | Product Recovery |
San Juan | | 100% |
Navajo | | 100% |
Mt Arthur Coal | | 79% |
Cerrejón | | 98% |
| (4) | Total Coal Reserves were at the moisture content when mined (8.5% San Juan; 13.0% Navajo; 8.7% Mt Arthur Coal; 13.2% Cerrejón). Total Marketable Coal Reserves were at a product specific moisture content (8.5% San Juan; 13.0% Navajo; 9.6% Mt Arthur Coal; 14.2% Cerrejón) and at an air-dried quality basis, for sale after the beneficiation of the Total Coal Reserves. |
| (5) | Coal delivered to wash plant, except for San Juan and Navajo, where coal is not washed. |
| (6) | Volatile matter was not estimated for San Juan and Navajo because %VM is not a quality requirement in the period.current sales contract. |
Energy coal
| (7) | San Juan – Divestment is in progress. |
| (8) | Navajo – Divestment completed in December 2013. BHP Billiton will remain the mine manager and operator until 2016 and therefore production increased by three per cent in FY2013will continue to 73 Mt, which included record annual production from New South Wales Energy Coal (Australia) following the successful ramp-up of the RX1 project.Coal revenue for FY2013be reported. The Reserve Life decreased by US$2.9 billiondue to US$10.7 billion. Revenue at Queensland Coal decreased US$1.4 billion to US$4.5 billion, a decrease of 24.2 per cent. Volume increases at Queenslandin nominated production rate from 5.4Mtpa in FY2014 to 4.8Mtpa in FY2015.
|
| (9) | Mt Arthur Coal were more than offset by the effect of decreases in average realised prices. Hard coking coal and weak coking coal prices fell 34 per cent and 31 per cent, respectively. Revenue at Energy Coal South Africa (BECSA) and Cerrejón (Colombia)– The Reserve Life decreased US$437 million and US$258 million, respectively, reflecting reduced production and decreased thermal coal prices, which fell 18 per cent during FY2013. Revenue at New South Wales Energy Coal and New Mexico Coal were in line with FY2012, with volume increases offset by reduced thermal coal prices.Underlying EBIT for FY2013 declined by US$2.1 billion to US$746 million. The fall in hard coking coal, weak coking coal and thermal coal prices, reduced Underlying EBIT by US$3.4 billion, net of price-linked costs. This was partially offset by increased sales volumes and cost savings, which increased Underlying EBIT by US$1.2 billion. A strong focus on contractor usage and rates and a significant reduction in consumables expenditure contributed to the substantial reduction in operating costs at Queensland Coal, as demonstrated by the 30 per cent decline in mine site unit cash costs at BMA. Exploration and business development costs decreased by US$326 million.
During FY2013, the Daunia and Broadmeadow Life Extension projects (both Australia) delivered first production, ahead of schedule. First coal was also loaded from the Newcastle Third Port Stage 3 project (Australia). The Caval Ridge (Australia), Cerrejón P40 and Appin Area 9 projects remain on schedule and budget. Following a review of the Hay Point Stage Three Expansion project, we approved a US$255 million increase to the original budget of US$1.25 billion (BHP Billiton share). Shipments from the new facilities are now expected to commence in CY2015. The revised schedule and budget reflects the impact of significant weather interruptions and associated productivity issues that have affected the marine works. The schedule delay is not expected to impact the production profile of the Queensland Coal operation.
The continued ramp-up of Daunia and scheduled commissioning of Caval Ridge is expected to increase the capacity of our Queensland Coal operation to 66 Mtpa (100 per cent basis) by the end of CY2014. Metallurgical coal production for FY2014 is expected to increase to approximately 41 Mt (BHP Billiton share), while energy coal production is expected to remain steady at 73 Mt (BHP Billiton share).
Supplementary information for FY2013 and FY2012 for the Coal Business is presented below.
Year ended 30 June 2013
| | | | | | | | | | | | | | | | | | | | | | | | | | | | | | | | US$ million | | | | | Revenue | | | Underlying
EBITDA | | | D&A | | | Underlying
EBIT | | | Capital
expenditure (1) | | | Exploration
gross | | | Exploration
to profit | | Queensland Coal | | | 4,452 | | | | 627 | | | | 376 | | | | 251 | | | | 2,651 | | | | | | | | | | Illawarra | | | 1,287 | | | | 311 | | | | 148 | | | | 163 | | | | 409 | | | | | | | | | | South Africa Coal | | | 1,457 | | | | 177 | | | | 211 | | | | (34 | ) | | | 101 | | | | | | | | | | New Mexico | | | 588 | | | | 95 | | | | 49 | | | | 46 | | | | 28 | | | | | | | | | | New South Wales Energy Coal | | | 1,526 | | | | 314 | | | | 120 | | | | 194 | | | | 348 | | | | | | | | | | Colombia | | | 828 | | | | 307 | | | | 65 | | | | 242 | | | | 265 | | | | | | | | | | Other | | | – | | | | (158 | ) | | | 2 | | | | (160 | ) | | | 85 | | | | | | | | | | | | | | | | | | | | | | | | | | | | | | | | | | | | | | | Total Coal from Group production | | | 10,138 | | | | 1,673 | | | | 971 | | | | 702 | | | | 3,887 | | | | | | | | | | | | | | | | | | | | | | | | | | | | | | | | | | | | | | | Third party products | | | 585 | | | | 44 | | | | – | | | | 44 | | | | – | | | | | | | | | | | | | | | | | | | | | | | | | | | | | | | | | | | | | | | Total Coal | | | 10,723 | | | | 1,717 | | �� | | 971 | | | | 746 | | | | 3,887 | | | | 42 | | | | 42 | | | | | | | | | | | | | | | | | | | | | | | | | | | | | | |
Year ended 30 June 2012
| | | | | | | | | | | | | | | | | | | | | | | | | | | | | | | | US$ million | | | | | Revenue | | | Underlying
EBITDA | | | D&A | | | Underlying
EBIT | | | Capital
expenditure (1) | | | Exploration
gross | | | Exploration
to profit | | Queensland Coal | | | 5,875 | | | | 1,480 | | | | 260 | | | | 1,220 | | | | 2,465 | | | | | | | | | | Illawarra | | | 1,701 | | | | 826 | | | | 159 | | | | 667 | | | | 316 | | | | | | | | | | South Africa Coal | | | 1,894 | | | | 468 | | | | 190 | | | | 278 | | | | 162 | | | | | | | | | | New Mexico | | | 587 | | | | 36 | | | | 45 | | | | (9 | ) | | | 40 | | | | | | | | | | New South Wales Energy Coal | | | 1,599 | | | | 538 | | | | 80 | | | | 458 | | | | 565 | | | | | | | | | | Colombia | | | 1,086 | | | | 537 | | | | 59 | | | | 478 | | | | 126 | | | | | | | | | | Other | | | – | | | | (383 | ) | | | 2 | | | | (385 | ) | | | 27 | | | | | | | | | | | | | | | | | | | | | | | | | | | | | | | | | | | | | | | Total Coal from Group production | | | 12,742 | | | | 3,502 | | | | 795 | | | | 2,707 | | | | 3,701 | | | | | | | | | | | | | | | | | | | | | | | | | | | | | | | | | | | | | | | Third party products | | | 856 | | | | 90 | | | | – | | | | 90 | | | | – | | | | | | | | | | | | | | | | | | | | | | | | | | | | | | | | | | | | | | | Total Coal | | | 13,598 | | | | 3,592 | | | | 795 | | | | 2,797 | | | | 3,701 | | | | 174 | | | | 174 | | | | | | | | | | | | | | | | | | | | | | | | | | | | | | |
(1) | Capital expenditure in aggregate comprises US$3,023 million growth and US$864 million other (2012: US$2,668 million growth and US$1,033 million other). |
Year ended 30 June 2012 compared with year ended 30 June 2011
A modest increase in metallurgical coal production was achieved in FY2012 despite numerous operating challenges. Production at Queensland Coal remained constrained largely as a result of industrial action, weather related downtime and geotechnical issues at Gregory Crinum. Record annual production at Illawarra Coal followed successful commissioning of the West Cliff Coal Preparation Plant upgrade project.
Annual production records were achieved in energy coal at two of our export oriented operations, Cerrejón and New South Wales Energy Coal. The RX1 Project at New South Wales Energy Coal delivered first production during the June 2012 quarter, significantly ahead of schedule. This project capitalised on strong demand for high ash coal in our key growth markets.
Coal revenue for FY2012 increased by US$518 million to US$13.6 billion. Metallurgical Coal revenue was flat. The impact of stronger realised prices, particularly a six per cent increase in the price of hard coking coal, were offset by a reduction of 4 per cent in sales volumes, mainly at Queensland Coal. Energy Coal revenue increased by US$515 million, which was mainly driven by a higher average realised prices and higher proportion of export sales. These factors increased revenue at BECSA by US$140 million, at NSWEC by US$157 million, and at Cerrejón by US$163 million.
Coal Underlying EBIT for FY2012 decreased by US$1.0 billion to US$2.8 billion. The lower production volumes in metallurgical coal reduced Underlying EBIT by US$135 million. This was offset by stronger volumes and the higher proportion of export sales in energy coal, largely associated with improved rail performance at BECSA and the accelerated expansion of New South Wales Energy Coal, which increased Underlying EBIT by US$152 million in the period.
In contrast, the increase in the price of hard coking coal and higher average realised prices in energy coal, most notably at Cerrejón, increased Underlying EBIT by US$434 million, net of price-linked costs.
Higher labour, raw material and other operating costs, primarily at Queensland Coal, contributed to a US$1.2 billion reduction in Underlying EBIT. The progression of our development pipeline also leddue to an increase in exploration and business development costsnominated production rate from 30.8Mtpa in the period.
In July 2012, force majeure was lifted across all BMA sites. In addition, BMA and the unions reached a framework agreement that guided the finalisation of the BMA Enterprise Agreement. Further work was underwayFY2014 to finalise local mine site details.
In response to the challenging external environment, the Group chose to delay the 2.5 Mtpa (100 per cent basis) expansion of Peak Downs associated with the Caval Ridge mine development. Following a review of the Norwich Park mine’s profitability, we also announced the indefinite closure of this operation during the June 2012 quarter and the cessation of mining at the Gregory open-cut mine.
The Group announced approval of the US$845 million Appin Area 9 Project32Mtpa in the period.FY2015.
|
During FY2012, we also approved a further 8 Mtpa (100 per cent basis) expansion of the
| (10) | Cerrejón mine. The US$437 million project (BHP Billiton share) would increase export capacity to approximately 40 Mtpa (100 per cent basis). In addition, the partners approved the third phase of expansion of the Newcastle Coal Infrastructure Group’s (NCIG) coal handling facility in Newcastle (Australia).Aluminium, Manganese and Nickel
The Aluminium, Manganese and Nickel Business represents the consolidation of three former Customer Sector Groups under a single management structure.
Year ended 30 June 2013 compared with year ended 30 June 2012
Alumina production increased by 18 per cent in FY2013 to a record 4.9 Mt (BHP Billiton share), underpinned by the ramp-up of the Efficiency and Growth project at Worsley. Aluminium production increased by two per cent to 1.2 Mt (BHP Billiton share), with improved performance at our southern African smelters.
Total manganese ore production increased by seven per cent in FY2013 to a record 8.5 Mt (100 per cent basis) and reflected a substantial improvement in plant availability at GEMCO (Australia). Total manganese alloy volumes were largely unchanged from FY2012. The recovery in TEMCO (Australia) production that followed the temporary suspension of operations in the prior period was offset by the permanent closure of energy-intensive silicomanganese production at Metalloys (South Africa) in January 2012.
Nickel production in FY2013 was largely unchanged from the prior period. Strong operating performance at Cerro Matoso (Colombia) was offset by planned maintenance at the Nickel West Kalgoorlie smelter and Kwinana refinery.
Aluminium, Manganese and Nickel revenue decreased by 6.4 per cent, or US$633 million, to US$9.3 billion. The reduction was primarily due to decreases at Nickel West of US$270 million and from sales of third party products of US$392 million.– The decrease in revenueCoal Reserves was mainly driven by lower realised prices across all parts of the Business. In this context, lower average realised prices for aluminium (down six per cent to US$2,191 per tonne), alumina (down nine per cent to US$302 per tonne), nickel (down 15 per cent to US$16,319 per tonne) and manganese alloy (down 10 per cent to US$1,051 per tonne) were only partially offset by an increase in the average realised price of manganese ore (up nine per cent to US$4.83 per dry metric tonne unit).
Underlying EBIT for FY2013 increased by US$188 million to US$164 million. With productivity improvements already well advanced, consisting principally of the improvement plan at Worsley, substantial cost savings of US$437 million were achieved during the period, while a stronger US dollar increased Underlying EBIT by a further US$243 million. In contrast, weaker markets continued to challenge the Business as lower average realised prices contributeddue to a US$474 million reductionrevised life of mine plan. The Reserve Life remained constant due to a decrease in Underlying EBIT, net of price-linked costs.nominated production rate from 41.5Mtpa in FY2014 to 38.8Mtpa in FY2015.
|
The US$167 million (BHP Billiton share) GEEP2 expansion
Other Assets
Ore Reserves in accordance with Industry Guide 7
| | | | | | | | | | | | | | | | | | | | | | | | | | | | | | | | | | | | | | | | | | | | | | |
As at 30 June 2015 | | | As at 30 June 2014 | |
Commodity Deposit (1)(2)(3)(4) | | | | Proven Ore Reserves | | | Probable Ore Reserves | | | Total Ore Reserves | | | Reserve
Life
(years) | | | BHP
Billiton
Interest
% | | | Total Ore Reserves | | | Reserve
Life
(years) | |
| | Ore Type | | Mt | | | %Ni | | | Mt | | | %Ni | | | Mt | | | %Ni | | | | | Mt | | | %Ni | | |
Nickel | | | | | | | | | | | | | | | | | | | | | | | | | | | | | | | | | | | | | | | | | | | | | | |
Nickel West | | | | | | | | | | | | | | | | | | | | | | | | | | | | | | | | | | | | | | | | | | | | | | |
Leinster (5) | | OC | | | – | | | | – | | | | – | | | | – | | | | – | | | | – | | | | – | | | | 100 | | | | 3.0 | | | | 1.3 | | | | 1.5 | |
Mt Keith | | OC | | | 46 | | | | 0.6 | | | | 1.0 | | | | 0.5 | | | | 47 | | | | 0.6 | | | | 5.0 | | | | 100 | | | | 52 | | | | 0.6 | | | | 5.9 | |
| | SP | | | 3.6 | | | | 0.5 | | | | 3.1 | | | | 0.5 | | | | 6.7 | | | | 0.5 | | | | | | | | | | | | 11 | | | | 0.5 | | | | | |
Cliffs(5) | | UG | | | – | | | | – | | | | – | | | | – | | | | – | | | | – | | | | – | | | | 100 | | | | 1.6 | | | | 2.6 | | | | 3.2 | |
| (1) | Cut-off grades – Mt Keith: variable ranging from 0.35-0.40% Ni and³ 0.18% recoverable Ni for OC and SP. |
| (2) | Approximate drill hole spacings used to classify the Mt Keith reserves were: Proven Reserves 60m x 40m, Probable Reserves 80m x 80m. |
| (3) | Ore delivered to process plant. |
| (4) | Metallurgical recoveries for Mt Keith for FY2015 were 58% at GEMCO delivered first production during17% concentrate grade. Metallurgical recoveries differ from the period, ahead of schedule. The project has increased processing capacity from 4.2recovery assumptions applied to 4.8 Mtpa (100 per cent basis) andgenerate the ramp-up ofreserves due to variable ore quality. |
| (5) | Leinster (including Cliffs) – Ore Reserves were not reported due to being uneconomic after testing with the operation is largely complete.Supplementary information for FY2013 and FY2012 for the Aluminium, Manganese and Nickel Business is presented below.
Year ended 30 June 20133 year average historical nickel price.
|
2.4 Major projects
Major projects
At the end of FY2015, BHP Billiton had three brownfield major projects under development and one major ‘pre-development’ project in evaluation (Jansen Potash) with a combined budget of US$7.0 billion. The Group completed the Escondida Oxide Leach Area Project (OLAP) in November 2014 and the Escondida Organic Growth Project 1 (OGP1) in May 2015. In January 2015, first coal was loaded through the expanded Hay Point Coal Terminal and the project was 97.6 per cent complete at 30 June 2015.
BHP Billiton’s share of capital and exploration expenditure declined by 24 percent during FY2015, to US$11.0 billion. Capital and exploration expenditure is expected to decline to US$8.5 billion in FY2016.
Projects completed or which delivered first production during the 2015 financial year
| | | | | | | | | | | | | | | | | | | | |
Business | | Project and ownership | | Capacity (1) | | Capital
expenditure
(US$M) (1) | | | Date of initial production | |
| | | | Actual (2) | | | Budget | | | Actual | | | Target | |
Copper | | Escondida Oxide Leach Area Project (Chile) 57.5% | | New dynamic leaching pad and mineral handling system. Maintains oxide leaching capacity | | | 899 | | | | 933 | (3) | | | Q4 CY14 | | | | H2 CY14 | (3) |
| | Escondida Organic Growth Project 1 (Chile) 57.5% | | Replaces the Los Colorados concentrator with a new 152,000 tonnes per day plant | | | 4,279 | | | | 4,199 | (3) | | | Q2 CY15 | | | | H1 CY15 | |
Coal | | Hay Point Stage Three Expansion (Australia) 50% | | Increases port capacity from 44 million tonnes per annum to 55 million tonnes per annum and reduces storm vulnerability | | | 1,505 | | | | 1,505 | (3)(4) | | | Q1 CY15 | | | | H1 CY15 | (3) |
| | | | | | | | | | | | | | | | | | | | |
| | | | | | | 6,683 | | | | 6,637 | | | | | | | | | |
| | | | | | | | | | | | | | | | | | | | |
Projects in execution at the end of the 2015 financial year
| | | | | | | | | | | | | | | | | | | | | | | | | | | | |
| | | US$ million | |
| | | Revenue (1) | | | Underlying
EBITDA | | | D&A | | | Underlying
EBIT | | | Capital
expenditure (2)(3) | | | Exploration
gross(4) | | | Exploration
to profit(5) | |
Alumina | | | 1,422 | | | | 119 | | | | 239 | | | | (120 | ) | | | 98 | | | | | | | | | |
Aluminium | | | 2,620 | | | | 92 | | | | 127 | | | | (35 | ) | | | 27 | | | | | | | | | |
Intra-divisional adjustment | | | (638 | ) | | | – | | | | – | | | | – | | | | – | | | | | | | | | |
| | | | | | | | | | | | | | | | | | | | | | | | | | | | |
| | | 3,404 | | | | 211 | | | | 366 | | | | (155 | ) | | | 125 | | | | | | | | | |
| | | | | | | | | | | | | | | | | | | | | | | | | | | | |
Manganese | | | 2,113 | | | | 580 | | | | 102 | | | | 478 | | | | 322 | | | | | | | | | |
Nickel West | | | 1,773 | | | | (100 | ) | | | 208 | | | | (308 | ) | | | 263 | | | | | | | | | |
Cerro Matoso | | | 803 | | | | 235 | | | | 79 | | | | 156 | | | | 44 | | | | | | | | | |
Other | | | – | | | | (45 | ) | | | – | | | | (45 | ) | | | 4 | | | | | | | | | |
| | | | | | | | | | | | | | | | | | | | | | | | | | | | |
Total Aluminium, Manganese and Nickel from Group production | | | 8,093 | | | | 881 | | | | 755 | | | | 126 | | | | 758 | | | | | | | | | |
| | | | | | | | | | | | | | | | | | | | | | | | | | | | |
Third party products | | | 1,185 | | | | 38 | | | | – | | | | 38 | | | | – | | | | | | | | | |
| | | | | | | | | | | | | | | | | | | | | | | | | | | | |
Total Aluminium, Manganese and Nickel | | | 9,278 | | | | 919 | | | | 755 | | | | 164 | | | | 758 | | | | 57 | | | | 53 | |
| | | | | | | | | | | | | | | | | | | | | | | | | | | | |
| | | | | | | | | | | | | | | | |
Business | | Project and ownership | | Year ended 30 June 2012Capacity (1)
| | | | | | | | | | | | | | | | | | | | | | | | | | | | | | | | US$ million | | | | | Revenue (1) | | | Underlying
EBITDA | | | D&A | | | Underlying
EBIT | | | Capital
expenditure (2)(3) | | | Exploration
gross(4) | | | Exploration
to profit(5) | | Alumina | | | 1,277 | | | | (14 | ) | | | 190 | | | | (204 | ) | | | 827 | | | | | | | | | | Aluminium | | | 2,638 | | | | 38 | | | | 126 | | | | (88 | ) | | | 25 | | | | | | | | | | Intra-divisional adjustment | | | (636 | ) | | | – | | | | – | | | | – | | | | – | | | | | | | | | | | | | | | | | | | | | | | | | | | | | | | | | | | | | | | | | | 3,279 | | | | 24 | | | | 316 | | | | (292 | ) | | | 852 | | | | | | | | | | | | | | | | | | | | | | | | | | | | | | | | | | | | | | | Manganese | | | 2,136 | | | | 355 | | | | 124 | | | | 231 | | | | 418 | | | | | | | | | | Nickel West | | | 2,043 | | | | 83 | | | | 312 | | | | (229 | ) | | | 337 | | | | | | | | | | Cerro Matoso | | | 876 | | | | 414 | | | | 80 | | | | 334 | | | | 105 | | | | | | | | | | Other | | | – | | | | (86 | ) | | | 1 | | | | (87 | ) | | | 71 | | | | | | | | | | | | | | | | | | | | | | | | | | | | | | | | | | | | | | | Total Aluminium, Manganese and Nickel from Group production | | | 8,334 | | | | 790 | | | | 833 | | | | (43 | ) | | | 1,783 | | | | | | | | | | | | | | | | | | | | | | | | | | | | | | | | | | | | | | | Third party products | | | 1,577 | | | | 19 | | | | – | | | | 19 | | | | – | | | | | | | | | | | | | | | | | | | | | | | | | | | | | | | | | | | | | | | Total Aluminium, Manganese and Nickel | | | 9,911 | | | | 809 | | | | 833 | | | | (24 | ) | | | 1,783 | | | | 79 | | | | 68 | | | | | | | | | | | | | | | | | | | | | | | | | | | | | | |
(1) | Includes inter-segment revenue of US$20 million (2012: US$14 million). | | Capital expenditure
(US$M) (1) | | | Date of initial production | |
|
Projects under development (2) | Capital expenditure in aggregate comprises US$206 million growth and US$552 million other (2012: US$1,182 million growth and US$601 million other). | | | | Budget | | | | | Target | |
|
Petroleum (3) | Capital expenditure includes US$4 million of expenditure in relation to centralising offices (2012: US$71 million). |
(4) | Includes US$8 million capitalised exploration (2012: US$11 million). |
(5) | Includes US$4 million exploration expenditure previously capitalised, written off as impaired (included in depreciation & amortisation) (2012: US$ nil). |
Year ended 30 June 2012 compared with year ended 30 June 2011
Record annual production at the Alumar refinery (Brazil) contributed to a four per cent increase in total alumina production in FY2012. Aluminium production was lower as potline capacity at Hillside, South Africa, was temporarily curtailed following a major unplanned outage in the March 2012 quarter.
Consistently strong operating performance and improved
| | North West Shelf Greater Western Flank-A (Australia) 16.67% (non-operator) | | To maintain LNG plant availability at both GEMCO and Hotazel (South Africa) underpinned annual manganese ore production and sales records in FY2012. Manganese alloy production was substantially lower than the corresponding period following the termination of energy-intensive silicomanganese production at Metalloys and the temporary suspension of production at TEMCO.The successful replacement of the Line 1 furnace at Cerro Matoso in the September 2011 quarter led to an increase in annual nickel production of 3.4 per cent.
Aluminium, Manganese and Nickel revenue decreased by 14 per cent, or US$1.6 billion, to US$9.9 billion. This was driven, in part, by an eight per cent reduction in the average realised price of aluminium (to US$2,314 per tonne) and a three per cent decline in the average realised price of alumina (to US$333 per tonne), which reduced revenue by US$274 million. A 22 per cent decline in the average realised price of manganese ore and a 10 per cent decline in the average realised price of manganese alloy further reduced revenue by US$479 million. Finally, a 22 per cent decline in the average realised nickel price reduced revenue by US$831 million. In contrast, record manganese ore sales were offset by lower volumes for other products.
Underlying EBIT for FY2012 decreased by US$1.6 billion to a loss of US$24 million. The decrease in Underlying EBIT is primarily due to the decrease in revenue. At Nickel West’s Mt Keith operation, a reduction in mining activity and the commissioning of the Talc Redesign project delivered tangible cost benefits during the period. These were offset by cost escalation, which drove significant margin compression over the Business. Higher raw material costs for alumina and aluminium inputs, such as coke and caustic soda, led to a further US$337 million decline in Underlying EBIT. Costs associated with the Hillside outage added to the decline.
The Worsley Efficiency and Growth project delivered first production during FY2012. Construction of the new Kwinana hydrogen plant was also completed in FY2012.
Group and unallocated items
This category includes the Group’s diamonds business (divested effective 10 April 2013), our interest in titanium minerals (divested effective 3 September 2012), non-Potash corporate costs incurred by the former Diamonds and Specialty Products CSG and corporate activities, including Group Treasury, Freight, Transport and Logistics operations.
Year ended 30 June 2013 compared with year ended 30 June 2012
Underlying EBIT declined by US$456 million to a loss of US$177 million. The decline largely reflected a reduced contribution from Richards Bay Minerals and EKATI, following their sale during FY2013.
Year ended 30 June 2012 compared with year ended 30 June 2011
Underlying EBIT for Group and Unallocated in FY2012 decreased by US$32 million to US$279 million. Stronger diamond and titanium prices increased Underlying EBIT by US$246 million, but were offset by the decline in production at EKATI, which reduced Underlying EBIT by US$357 million. Higher corporate and information technology costs were more than offset by a foreign exchange related restatement and partial release of the Newcastle steelworks rehabilitation provision.
3.6.7 Third party sales
We differentiate sales of our production from sales of third party products due to the significant difference in profit margin earned on these sales. The table below shows the breakdown between our production and third party products.
| | | | | | | | | | | | | Year ended 30 June(1) | | 2013 | | | 2012 | | | 2011 | | | | | US$M | | | US$M | | | US$M | | Group production | | | | | | | | | | | | | Revenue | | | 63,203 | | | | 68,747 | | | | 67,903 | | Related operating costs | | | (42,197 | ) | | | (41,635 | ) | | | (36,021 | ) | | | | | | | | | | | | | | Operating profit (EBIT) | | | 21,006 | | | | 27,112 | | | | 31,882 | | Underlying EBIT Margin | | | 33.2 | % | | | 39.4 | % | | | 47.0 | % | | | | | | | | | | | | | | Third party products | | | | | | | | | | | | | Revenue | | | 2,765 | | | | 3,479 | | | | 3,836 | | Related operating costs | | | (2,644 | ) | | | (3,353 | ) | | | (3,738 | ) | | | | | | | | | | | | | | Operating profit (EBIT) | | | 121 | | | | 126 | | | | 98 | | Margin(2) | | | 4.3 | % | | | 3.6 | % | | | 2.6 | % | | | | | | | | | | | | | |
(1) | Excluding exceptional items. |
(2) | Operating profit divided by revenue. |
We engage in third party trading for the following reasons:
Production variability and occasional shortfalls from our own assets means that we sometimes source third party materials to ensure a steady supply of product to our customers.
To optimise our supply chain outcomes, we may buy physical product from third parties.
In order to support development of more liquid markets, we will sometimes source third party physical product and manage risk through both the physical and financial markets.
3.7 Liquidity and capital resources
As a result of our record production volumes and record prices in many of our key commodities over the past several years, we have generated very strong cash flows throughout our operations. Despite the changing economic and market conditions, our net operating cash flow in FY2013 of US$18.3 billion reflected the strong cash generating capacity of the Group throughout the economic cycle.
These cash flows have been fundamental to the funding of our existing operations, maintaining a pipeline of growth projects and returning capital to shareholders through dividends and, in prior years, share buy-backs. Our priority for cash is to reinvest in the Company. In line with our strategy, we have grown our business through project developments and acquisitions. Through a combination of borrowings and payments to shareholders, we manage our balance sheet with the goal of maintaining levels of gearing that we believe optimise our costs of capital and return on capital employed.
Net operating cash flows are our principal source of cash. We also raise fundsthroughput from the debt markets to manage our liquidity position and to refinance existing debt. Our liquidity position is supported by our strong credit rating and committed debt facilities.
3.7.1 Cash flow analysis
A full consolidated cash flow statement is contained in the financial statements. The explanatory notes appear in note 23 ‘Notes to the consolidated cash flow statement’ to the financial statements. A summary table has been presented below to show the key sources and uses of cash.
| | | | | | | | | | | | | Year ended 30 June | | 2013 | | | 2012 | | | 2011 | | | | | US$M | | | US$M | | | US$M | | Cash generated from operations | | | 27,649 | | | | 33,274 | | | | 37,081 | | Dividends received and net interest paid | | | (871 | ) | | | (563 | ) | | | (443 | ) | Taxation paid | | | (8,526 | ) | | | (8,327 | ) | | | (6,558 | ) | | | | | | | | | | | | | | Net operating cash flows | | | 18,252 | | | | 24,384 | | | | 30,080 | | | | | | | | | | | | | | | Purchases of property plant and equipment | | | (21,573 | ) | | | (18,385 | ) | | | (11,147 | ) | Exploration expenditure | | | (1,326 | ) | | | (2,452 | ) | | | (1,240 | ) | Exploration expenditure expensed and included in operating cash flows | | | 1,022 | | | | 1,602 | | | | 981 | | Purchases of intangibles | | | (400 | ) | | | (220 | ) | | | (211 | ) | Investment in financial assets | | | (338 | ) | | | (341 | ) | | | (238 | ) | Investment in subsidiaries, operations and jointly controlled entities | | | – | | | | (12,556 | ) | | | (4,807 | ) | Net proceeds from investing activities | | | 4,744 | | | | 316 | | | | 198 | | | | | | | | | | | | | | | Net investing cash flows | | | (17,871 | ) | | | (32,036 | ) | | | (16,464 | ) | | | | | | | | | | | | | | Net proceeds from/(repayment of) interest bearing liabilities | | | 7,395 | | | | 8,827 | | | | (577 | ) | Share buy-back | | | – | | | | (83 | ) | | | (9,860 | ) | Dividends paid | | | (6,222 | ) | | | (5,933 | ) | | | (5,144 | ) | Other financing activities | | | (351 | ) | | | (302 | ) | | | (437 | ) | | | | | | | | | | | | | | Net financing activities | | | 822 | | | | 2,509 | | | | (16,018 | ) | | | | | | | | | | | | | | Net increase/(decrease) in cash and cash equivalents | | | 1,203 | | | | (5,143 | ) | | | (2,402 | ) | | | | | | | | | | | | | |
Year ended 30 June 2013 compared with year ended 30 June 2012
Net operating cash flows after interest and tax declined by 25.1 per cent to US$18.3 billion for FY2013. A US$5.6 billion reduction in cash generated fromNorth West Shelf operations (after changes in working capital balances) was the major contributor to the decline.
A US$14.2 billion reduction in net investing cash outflows to US$17.9 billion primarily reflected the acquisition of Petrohawk Energy Corporation in the prior period and a US$4.4 billion increase in proceeds from asset sales. Capital and exploration expenditure totalled US$22.9 billion in FY2013. Expenditure on major growth projects was US$18.8 billion, including US$6.9 billion on Petroleum projects and US$11.9 billion on Minerals projects. Capital expenditure on sustaining and other items was US$2.8 billion. Exploration expenditure was US$1.3 billion, including US$1.0 billion classified within net operating cash flows. The breakdown of capital and exploration expenditure by Business is set out in section 3.4.5.
Net financing cash flows included proceeds from borrowings of US$10.0 billion and were partially offset by debt repayments of US$2.6 billion and dividend payments of US$6.2 billion. Proceeds from borrowings include the issuance of a two tranche Euro bond of €2.0 billion, a two tranche Sterling bond of £1.75 billion, an Australian dollar bond of A$1.0 billion, a Euro bond of €750 million and a Canadian dollar bond of C$750 million.
Net debt, comprising interest bearing liabilities less cash, was US$29.1 billion, an increase of US$5.5 billion compared to the net debt position at 30 June 2012.
Year ended 30 June 2012 compared with year ended 30 June 2011
Net operating cash flows after interest and tax decreased by 18.9 per cent to US$24.4 billion for FY2012. A US$3.8 billion reduction in cash generated from operations (after changes in working capital balances) was the major contributor to the decline. Higher net income tax paid and increased royalty-related taxation payments further reduced net operating cash flows after interest and tax by US$1.4 billion and US$408 million, respectively.
Investing cash flows increased by US$15.6 billion, primarily driven by investment in subsidiaries and operations of US$12.6 billion in FY2012, the majority of which related to the purchase of Petrohawk, with a resulting cash outflow of US$12.0 billion. Capital and exploration expenditure, including exploration expenditure expensed and included in operating cash flows, totalled US$20.8 billion in FY2012. Expenditure on major growth projects was US$16.3 billion, including US$5.1 billion on Petroleum projects and US$11.2 billion on Minerals projects. Capital expenditure on sustaining and other items was US$2.0 billion.
Net financing cash flows include proceeds from borrowings of US$13.3 billion, partially offset by dividend payments of US$5.9 billion and debt repayments of US$4.3 billion. Proceeds from borrowings include the issuance of a three tranche Global Bond of US$3.0 billion, a five tranche Global Bond of US$5.25 billion, a two tranche Euro Bond of €2.0 billion and proceeds from Commercial Paper of US$995 million.
Net debt, comprising interest bearing liabilities less cash and cash equivalents, was US$23.6 billion, an increase of US$17.8 billion compared with the net debt position at 30 June 2011.
3.7.2 Major projects
At the end of FY2013, we had 18 major projects, which are largely brownfield, in execution with a combined budget of US$21.2 billion. The majority of these projects are scheduled to deliver first production before the end of CY2014. This budget does not include annual capital expenditure at Onshore US, which is expected to approximate US$3.9 billion in FY2014.
The Broadmeadow Life Extension and
| | | | | 400 | | | | | | CY16 | |
| | Bass Strait Kipper projects (both Australia) were completed during FY2013. In addition, four major projects achieved either first production or shipment in the period; namely, WAIO Port Hedland Inner Harbour Expansion, WAIO Orebody 24, Daunia and the Newcastle Third Port Stage 3 project (all Australia).The Bass Strait Kipper project will commence production upon completion of the mercury removal project (refer to section 2.2.1 for further details).
During FY2013, we approved the US$520 million (BHP Billiton share) Longford Gas Conditioning Plant (LGCP) project as part(Australia) 50%(non-operator)
| | Designed to process approximately 400 million cubic feet per day of the Gippsland Basin Joint Venture (Bass Strait, Australia). The LGCP will add carbon dioxide (COhigh CO2) removal capacity which is necessary to condition production from the Bass Strait Turrum project currently in development. gas | | | | | 520 | | | | | | CY16 | |
Copper On 25 July 2013, we announced an investment of US$2.0 billion (BHP Billiton share) to construct a
| | Escondida Water Supply (Chile) 57.5% | | New desalination facility which will deliver sustainableto ensure continued water supply to Escondida over the long term. | | | | | 3,430 | | | | | | CY17 | |
| | | | | | | | | On 20 August 2013, we announced an investment of US$2.6 billion
| | | | | | | |
| | | | | | | | | 4,350 | | | | | | | |
| | | | | | | | | | | �� | | | | | |
Other projects in progress at the end of the 2015 financial year
| | | | | | | | |
Business | | Project and ownership | | Scope | | Capital expenditure
(US$M) (1) | |
Projects under development | | | | | | Budget | |
Potash | | Jansen Potash (Canada) 100% | | Investment to finish the excavation and lining of the Jansen Potash Project production and service shafts, and to continue the installation of essential surface infrastructure and utilities. This investment will be spread overutilities | | | 2,600 | |
| | | | | | | | |
| | | | | | | 6,950 | |
| | | | | | | | |
| (1) | Unless noted otherwise, references to capacity are on a number of years, with completion of both shafts expected during CY2016, while the associated works program will extend into CY2017. Including previous commitments, total approved investment at Jansen has increased to US$3.8 billion.The WAIO Jimblebar Mine Expansion, which is set to increase supply chain capacity to 220 Mtpa (100100 per cent basis), is expectedbasis, references to achieve first production in the December 2013 quarter, ahead of schedule. As previously announced, the project remainscapital expenditure from subsidiaries are reported on budget in local currency terms, although the capital cost in US dollars is expected to be 10a 100 per cent higher than the original budget. This increase was offset bybasis and references to capital expenditure from joint operations are reported on a proportionate consolidation basis.
|
| (2) | Number subject to finalisation. |
| (3) | As per revised budget and/or schedule. |
| (4) | Excludes announced pre-commitment funding. |
2.5 Business performance
The discussion of results for our Businesses is set out in section 1.12 of this Annual Report with further information below.
2.5.1 Group Revenue and Underlying EBIT
Year ended 30 June 2015 compared with year ended 30 June 2014
An analysis of the financial performance of the Group for FY2015 compared to FY2014 is included in section 1.15.3.
Information in this section has been presented on a Continuing operations basis to exclude the contribution from assets that were demerged with South32, unless otherwise noted. Details of the contribution of the South32 assets to the Group’s results are disclosed in note 29 ‘Discontinued operations’ to the Financial Statements.
The following table reconciles our statutory income statement to the principal factors that affected Underlying EBIT for FY2015. For further information on our use of Underlying EBIT, see section 1.11.1 of this Annual Report.
| | | | | | | | | | | | | | | | | | | | |
| | | Revenue
US$M | | | Total expenses,
other income and
share of equity
accounted
investments
US$M | | | Profit from
operations
US$M | | | Exceptional
Items
US$M | | | Underlying
EBIT
US$M | |
For the year ended 30 June 2014 (Restated) | | | | | | | | | | | | | | | | | | | | |
Revenue | | | 56,762 | | | | | | | | | | | | | | | | | |
Other income | | | | | | | 1,225 | | | | | | | | | | | | | |
Expenses excluding net finance costs | | | | | | | (36,523 | ) | | | | | | | | | | | | |
Share of operating profit of equity accounted investments | | | | | | | 1,185 | | | | | | | | | | | | | |
| | | | | | | | | | | | | | | | | | | | |
Total expenses, other income and share of equity accounted investments | | | | | | | (34,113 | ) | | | | | | | | | | | | |
| | | | | | | | | | | | | | | | | | | | |
Profit from operations | | | | | | | | | | | 22,649 | | | | | | | | | |
Exceptional items | | | | | | | | | | | | | | | (551 | ) | | | | |
| | | | | | | | | | | | | | | | | | | | |
Underlying EBIT | | | | | | | | | | | | | | | | | | | 22,098 | |
| | | | | |
Changes in volumes: | | | | | | | | | | | | | | | | | | | | |
Productivity | | | 2,774 | | | | (1,554 | ) | | | 1,220 | | | | – | | | | 1,220 | |
Growth | | | 3,421 | | | | (1,599 | ) | | | 1,822 | | | | – | | | | 1,822 | |
| | | | | | | | | | | | | | | | | | | | |
| | | 6,195 | | | | (3,153 | ) | | | 3,042 | | | | – | | | | 3,042 | |
| | | | | | | | | | | | | | | | | | | | |
Net Price impact: | | | | | | | | | | | | | | | | | | | | |
Change in sales prices | | | (17,046 | ) | | | 613 | | | | (16,433 | ) | | | – | | | | (16,433 | ) |
Price-linked costs | | | – | | | | 1,209 | | | | 1,209 | | | | – | | | | 1,209 | |
| | | | | | | | | | | | | | | | | | | | |
| | | (17,046 | ) | | | 1,822 | | | | (15,224 | ) | | | – | | | | (15,224 | ) |
| | | | | | | | | | | | | | | | | | | | |
Change in controllable cash costs: | | | | | | | | | | | | | | | | | | | | |
Operating cash costs | | | – | | | | 2,678 | | | | 2,678 | | | | – | | | | 2,678 | |
Exploration and business development | | | – | | | | 29 | | | | 29 | | | | – | | | | 29 | |
| | | | | | | | | | | | | | | | | | | | |
| | | – | | | | 2,707 | | | | 2,707 | | | | – | | | | 2,707 | |
| | | | | | | | | | | | | | | | | | | | |
Change in other costs: | | | | | | | | | | | | | | | | | | | | |
Exchange rates | | | (87 | ) | | | 1,654 | | | | 1,567 | | | | – | | | | 1,567 | |
Inflation on costs | | | – | | | | (433 | ) | | | (433 | ) | | | – | | | | (433 | ) |
Fuel and energy | | | – | | | | 518 | | | | 518 | | | | – | | | | 518 | |
Non-cash | | | – | | | | (1,304 | ) | | | (1,304 | ) | | | – | | | | (1,304 | ) |
One-off items | | | – | | | | (456 | ) | | | (456 | ) | | | – | | | | (456 | ) |
| | | | | | | | | | | | | | | | | | | | |
| | | (87 | ) | | | (21 | ) | | | (108 | ) | | | – | | | | (108 | ) |
| | | | | | | | | | | | | | | | | | | | |
Asset sales | | | – | | | | (72 | ) | | | (72 | ) | | | – | | | | (72 | ) |
Ceased and sold operations | | | (448 | ) | | | 470 | | | | 22 | | | | – | | | | 22 | |
Exceptional items | | | – | | | | (3,747 | ) | | | (3,747 | ) | | | 3,747 | | | | – | |
Profit from equity accounted investments | | | – | | | | (637 | ) | | | (637 | ) | | | – | | | | (637 | ) |
Other | | | (740 | ) | | | 778 | | | | 38 | | | | – | | | | 38 | |
| | | | | | | | | | | | | | | | | | | | |
For the year ended 30 June 2015 | | | | | | | | | | | | | | | | | | | | |
Revenue | | | 44,636 | | | | | | | | | | | | | | | | | |
Other Income | | | | | | | 496 | | | | | | | | | | | | | |
Expenses excluding net finance costs | | | | | | | (37,010 | ) | | | | | | | | | | | | |
Share of operating profit of equity accounted investments | | | | | | | 548 | | | | | | | | | | | | | |
| | | | | | | | | | | | | | | | | | | | |
Total expenses, other income and share of equity accounted investments | | | | | | | (35,966 | ) | | | | | | | | | | | | |
| | | | | | | | | | | | | | | | | | | | |
Profit from operations | | | | | | | | | | | 8,670 | | | | | | | | | |
Exceptional items | | | | | | | | | | | | | | | 3,196 | | | | | |
| | | | | | | | | | | | | | | | | | | | |
Underlying EBIT | | | | | | | | | | | | | | | | | | | 11,866 | |
Management believes the following information presented by each Business provides meaningful indicators of the underlying performance of the assets, including equity accounted investments, of each reportable segment. Information relating to equity accounted investments has been provided on a ‘proportionate consolidation’ basis to provide insight into the drivers of the equity accounted results from these operations. Segment information is reported on a statutory basis in accordance with IFRS 8 ‘Operating Segments’ and consequently the tables below include adjustments to reconcile the proportionate consolidation information to the statutory segment results.
As discussed in section 1.11.1 of this Annual Report, Underlying EBIT is one measure used by management to assess the performance of our Businesses, make decisions on the allocation of resources and assess operational management. Underlying EBIT at the segment or statutory level is reported net of the Group’s share of net finance costs and taxation of equity accounted investments.
Year ended 30 June 2014 compared with year ended 30 June 2013
Comparative financial information for FY2014 and FY2013 has been restated for the effects of the application of IFRS 5/AASB 5 ‘Non-current Assets Held for Sale and Discontinued Operations’ following the demerger of South32, unless otherwise noted. The Consolidated Balance Sheet for these periods is not required to be and has not been restated, for further information refer to note 41 ‘Basis of preparation and measurement’ to the Financial Statements.
Information in this section has been presented on a Continuing operations basis to exclude the contribution from assets that were demerged with South32, unless otherwise noted. Details of the contribution of the South32 assets to the Group’s results are disclosed in note 29 ‘Discontinued operations’ to the Financial Statements.
Revenue in FY2014 was US$56.8 billion, an increase of US$2.9 billion, or five per cent, from US$53.9 billion in the corresponding period. The revenue increase was primarily reflected in the Iron Ore and Petroleum and Potash Businesses, with increases of US$2.8 billion and US$1.6 billion, respectively. These increases were offset by decreases in our Copper Business of US$383 million, in our Coal Business of US$11 million and the loss of revenue of our disposed former Diamonds and Specialty Products Business of US$325 million.
The increase in revenue in Iron Ore was primarily due to an increase in sales volumes of 17 per cent to 202 Mt, which contributed to an increase in revenue of US$3.2 billion, partially offset by a six per cent decline in average realised price of iron ore to US$103 per wet metric tonne (FOB), which reduced revenue by US$522 million. The increase in revenue in Petroleum was primarily due to an increase in volume of four per cent in FY2014 to 246 MMboe, which contributed to an increase in revenue of US$1.4 billion, and to higher realised prices, which contributed to an additional increase of US$219 million. The decrease in other businesses mainly reflected lower realised prices in our Copper Business of US$1.0 billion and Coal Business of US$1.1 billion.
Overall, the US$2.9 billion increase in revenue in FY2014 can be attributed to US$6.3 billion related to increased volumes, which are within our control, offset primarily by US$2.6 billion related to prices, which are uncontrollable, US$468 million for ceased and sold operations, and US$128 million for exchange rates.
| | | | | | | | |
Year ended 30 June | | 2014
US$M
Restated | | | 2013
US$M
Restated | |
| | |
Raw materials and consumables used | | | 5,540 | | | | 5,407 | |
Employee benefits expense | | | 5,413 | | | | 5,578 | |
External services (including transportation)(1) | | | 9,899 | | | | 10,202 | |
Third party commodity purchases | | | 1,702 | | | | 1,158 | |
Net foreign exchange losses/(gains) | | | 168 | | | | (187 | ) |
Fair value change on derivatives | | | (122 | ) | | | 63 | |
Government royalties paid and payable | | | 2,412 | | | | 2,179 | |
Depreciation and amortisation expense | | | 7,716 | | | | 6,067 | |
Exploration and evaluation expenditure | | | 698 | | | | 1,026 | |
Impairment of assets(2) | | | 478 | | | | 3,286 | |
Operating lease rentals | | | 665 | | | | 679 | |
Other operating expenses(3) | | | 1,954 | | | | 1,371 | |
| | | | | | | | |
Total expenses | | | 36,523 | | | | 36,829 | |
| | | | | | | | |
Less exceptional items | | | – | | | | (2,862 | ) |
| | | | | | | | |
Total expenses excluding exceptional items | | | 36,523 | | | | 33,967 | |
| | | | | | | | |
| (1) | Includes exceptional items of US$ nil (2013: US$96 million). |
| (2) | Includes exceptional items of US$ nil (2013: US$2,924 million). |
| (3) | Includes exceptional items of US$ nil (2013: credit of US$158 million). |
Total expenses decreased from US$36.8 billion in FY2013 to US$36.5 billion in FY2014. Excluding exceptional items, the majority of which related to impairments in FY2013, total expenses have increased by US$2.6 billion or eight per cent during FY2014 from US$33.9 billion to US$36.5 billion.
The majority of the increase relates to non-cash expenses for depreciation and amortisation of US$1.6 billion and changes to provisions for mine site rehabilitation of US$300 million. Increases in other non-cash charges also included provisions for restructuring and a lower capitalisation rate for deferred stripping at Escondida and Pampa Norte. Increases in costs attributable to inflation were US$575 million.
Higher expenses associated with increased production across our four major Businesses were partially offset by reduced operating costs. Our focus on reducing operating costs through productivity initiatives saw cost efficiencies in our Businesses, in particular our Coal Business.
Additional increases in Total expenses were recognised in Third party commodity purchases of US$544 million and Other operating expenses (excluding exceptionals) of US$425 million. In total operating costs were decreased by favourable exchange rate impacts of US$1.3 billion.
Other income decreased from US$3.8 billion in FY2013 to US$1.2 billion due to exceptional items in FY2013, the majority of which relates to gains on the sale of assets. For further information, refer to note 5 ‘Other income’ to the Financial Statements.
Profit from operations increased by US$672 million, or three per cent, from US$22.0 billion to US$22.6 billion. Exceptional items during FY2014 comprised of a gross exceptional income on the sale of our Pinto Valley
mining operation of US$551 million, compared with gross exceptional charges of US$297 million in FY2013. FY2014 Profit from operations excluding exceptional items, which we refer to as Underlying EBIT, increased by 1.9 per cent, or US$418 million, to US$22.1 billion.
Underlying EBIT
In discussing the operating results of the Group, we focus on a financial measure we refer to as Underlying EBIT. Underlying EBIT is the key measure that management uses internally to assess the performance of our Businesses, make decisions on the allocation of resources and assess operational management. Management uses this measure because financing structures and tax regimes differ across our assets and substantial components of our tax and interest charges are levied at a Group level rather than an operational level.
We exclude exceptional items from Underlying EBIT in order to enhance the comparability of the measure from period to period and provide clarity into the underlying performance of our operations. Our management monitors exceptional items separately.
The following table reconciles Underlying EBIT to Profit from operations.
| | | | | | | | |
Year ended 30 June | | 2014
US$M
Restated | | | 2013
US$M
Restated | |
| | |
Underlying EBIT | | | 22,098 | | | | 21,680 | |
Exceptional items (before taxation) – refer section 1.15.3 | | | 551 | | | | 297 | |
| | | | | | | | |
Profit from operations (EBIT) | | | 22,649 | | | | 21,977 | |
| | | | | | | | |
Attributable profit increased by 23 per cent to US$13.8 billion mainly driven by a decrease in the Group’s effective tax rate.
Net operating cash flows from Continuing operations after interest and tax increased by 24 per cent to US$23.6 billion in FY2014. A US$2.3 billion increase in cash generated from operations (after changes in working capital balances) and a US$1.7 billion decrease in net taxes paid were the major contributors to the increase. We delivered a substantial US$7.1 billion increase in free cash flow, being Net operating cash flows less Net investing cash flows, despite weaker commodity prices. Capital and exploration expenditure (BHP Billiton share) declined to US$14.6 billion for the period.
We finished the period with net debt of US$25.8 billion (2013: US$27.5 billion), which included finance leases of US$1.3 billion (2013: US$137 million), for a gearing ratio of 23 per cent (2013: 27 per cent). IFRS 5/AASB 5 ‘Non-current Assets Held for Sale and Discontinued Operations’ does not require the Consolidated Balance Sheet to be restated for comparative periods. The FY2014 and FY2013 figures therefore includes assets and liabilities of the Businesses demerged with South32. For information relating to Discontinued operations refer to note 29 ‘Discontinued operations’ to the Financial Statements.
2.5.2 Underlying EBIT
Year ended 30 June 2015 compared with year ended 30 June 2014
An analysis of the consolidated EBIT for FY2015 compared to FY2014 is included in section 1.15.3.
Year ended 30 June 2014 compared with year ended 30 June 2013
For FY2014, Underlying EBIT declined 1.9 per cent to US$22.1 billion.
A reduction in commodity prices reduced Underlying EBIT by US$2.6 billion. This was offset by cost improvements which underpinned a decrease in operating cash costs of US$1.1 billion and a decrease in exploration and business development costs of US$398 million. In addition, higher volumes attributed to our development projects coming on line and through productivity efficiencies at existing assets, primarily in Iron Ore and Petroleum, contributed an additional US$3.0 billion to Underlying EBIT. This was offset by increased depreciation and amortisation which reduced Underlying EBIT by US$1.6 billion.
Prices
Lower average prices reduced Underlying EBIT by US$2.6 billion in FY2014.
In metallurgical coal, an increase in seaborne supply and the resilience of higher cost, along with uneconomic capacity led to a 19 per cent and 14 per cent decline in the average realised price of hard coking coal and weak coking coal, respectively. The average price received for thermal coal also declined by 14 per cent during the period. In total, lower average realised prices in our Coal Business reduced Underlying EBIT by US$1.2 billion.
A five per cent decline in the average realised price of copper reflected the near-term rebalancing of the market, while the acceleration of low-cost, seaborne iron ore supply growth, predominantly from Australia’s Pilbara region, weighed on prices in the June 2014 half year. In total, lower average realised prices for copper and iron ore reduced Underlying EBIT by US$1.4 billion.
The value of diversification was again evident as higher average realised prices for our petroleum products increased Underlying EBIT by US$219 million. The average price achieved for our natural gas sales book, covering domestic and international markets, increased by 16 per cent.
Price-linked costs decreased Underlying EBIT by US$111 million during the period, primarily reflecting higher royalty charges in our Petroleum and Iron Ore Businesses.
Volumes
Volume efficiencies attributed to productivity and the ramp-up of major projects, underpinned an increase in production in a number of Businesses in FY2014 and an additional US$3.0 billion in Underlying EBIT. WAIO was the major contributor as the ramp-up of the Jimblebar mining hub and a series of productivity initiatives raised the capacity of our integrated supply chain and supported a US$1.8 billion increase in Underlying EBIT. Despite the impact of natural field decline, stronger volumes in our Petroleum Business generated an additional US$994 million of Underlying EBIT, reflecting 73 per cent growth in Onshore US liquids volumes and a near doubling of production at Atlantis.
Controllable cash costs
A broad-based improvement in productivity underpinned a decrease in controllable cash costs of US$1.5 billion during the period, including a decrease in operating cash costs of US$1.1 billion and a decrease in exploration and business development costs of US$398 million.
Operating cash costs
The Group’s commitment to further improve the competitive position of its assets delivered tangible results in FY2014 as operating cash costs declined by US$1.1 billion. A general increase in labour and contractor productivity had the greatest impact, increasing Underlying EBIT by US$1.3 billion.
Exploration and business development
The Group’s exploration expenditure declined by 25 per cent in FY2014 to US$986 million as we sharpened our focus on greenfield copper porphyry targets in Chile and Peru, and high impact liquids opportunities in the Gulf of Mexico, Western Australia and Trinidad and Tobago. The associated reduction in the Group’s exploration expense increased Underlying EBIT by US$328 million.
Other costs
Exchange rates
A stronger US dollar increased Underlying EBIT by US$1.2 billion and included the restatement of monetary items in the balance sheet, which reduced Underlying EBIT by US$352 million. Average and closing exchange rates for FY2014 and FY2013 are detailed in note 42 ‘Functional and presentation currency’ to the Financial Statements.
Inflation on costs
Inflation had an unfavourable impact on all Businesses and reduced Underlying EBIT by US$575 million during FY2014. This was most notable in Australia and Chile, which accounted for 85 per cent of the total variance.
Non-cash
An increase in non-cash charges reduced Underlying EBIT by US$1.7 billion during the period.
A US$631 million increase in the depreciation and amortisation charge at Onshore US reflected the ramp-up of liquids production and the progressive development of our Permian acreage. We continue to expect the depreciation rate in the Permian to normalise at a lower level as reserves are booked and the production rate grows towards 100 Mboe per day over the medium term. The completion and progressive ramp-up of several major projects in our Iron Ore and Coal Businesses resulted in an US$704 million increase in the depreciation and amortisation expense during the period.
Depreciation and amortisation expense included the following impairment charges: a US$184 million charge related to minor Gulf of Mexico assets; and a US$68 million charge associated with our decision to allow the exclusivity agreement for Terminal 5 at the Port of Vancouver (United States) to lapse.
A US$300 million charge related to the revision of mine site rehabilitation provisions for the Group’s North American closed mines and a lower capitalisation rate for deferred stripping at Escondida and Pampa Norte also contributed to the increase in non-cash charges.
Asset sales
The divestment of Liverpool Bay more than accounted for the US$61 million increase in Underlying EBIT related to asset sales.
Ceased and sold operations
Underlying EBIT from ceased and sold operations decreased by US$349 million in FY2014 and largely reflected: a US$143 million negative adjustment to the Browse divestment price and the closure of the Nickel West Leinster Perseverance underground mine in November 2013.
2.5.3 Net finance costs
Year ended 30 June 2015 compared with year ended 30 June 2014
An analysis of net finance costs for FY2015 compared to FY2014 is included in section 1.15.3.
Year ended 30 June 2014 compared with year ended 30 June 2013
Net finance costs of US$914 million decreased by US$235 million from the prior period. This was primarily due to a decrease of US$299 million in net interest expense, partially offset by less interest capitalised of US$108 million.
2.5.4 Taxation expense
Year ended 30 June 2015 compared with year ended 30 June 2014
An analysis of taxation expenses for FY2015 compared to FY2014 is included in section 1.15.3.
Year ended 30 June 2014 compared with year ended 30 June 2013
Total taxation expense, including royalty-related taxation, exchange rate movements and exceptional items, was US$6.8 billion, representing a statutory effective tax rate of 31.2 per cent (30 June 2013: 32.1 per cent).
Government imposed royalty arrangements calculated by reference to profits are reported as royalty-related taxation. The Minerals Resource Rent Tax (MRRT) reduced taxation expense by US$198 million in FY2014 (30 June 2013: increase of US$180 million) as royalty-related credits in the Coal Business more than offset Iron Ore MRRT expense for the period. This included the remeasurement of deferred tax assets associated with the MRRT which decreased taxation expense by US$170 million in the period (30 June 2013: increase of US$12 million).
The Group’s adjusted effective tax rate, which excludes the influence of exchange rate movements, exceptional items and the remeasurement of deferred tax assets associated with the MRRT, was 32.2 per cent (30 June 2013: 33.8 per cent).
Adjusted effective tax rate is not an IFRS measure and is reconciled to the statutory effective tax rate below:
| | | | | | | | | | | | | | | | |
Year ended 30 June | | 2014
Restated | | | 2013
Restated | |
| | | Profit
before tax
US$M | | Income tax
expense
US$M | | % | | | Profit
before tax
US$M | | Income tax
expense
US$M | | % | |
| | | | | | | |
Statutory effective tax rate | | 21,735 | | (6,780) | | | 31.2 | % | | 20,828 | | (6,696) | | | 32.1 | % |
Less: | | | | | | | | | | | | | | | | |
Exchange rate movements | | – | | (34) | | | | | | – | | 134 | | | | |
Remeasurement of deferred tax assets associated with the MRRT | | – | | (170) | | | | | | – | | 12 | | | | |
Exceptional items | | (551) | | 166 | | | | | | �� (297) | | (384) | | | | |
| | | | | | | | | | | | | | | | |
Adjusted effective tax rate | | 21,184 | | (6,818) | | | 32.2 | % | | 20,531 | | (6,934) | | | 33.8 | % |
| | | | | | | | | | | | | | | | |
Other royalty and excise arrangements that are not profit based are recognised as operating costs within Profit before taxation. These amounted to US$2.4 billion during the period (30 June 2013: US$2.2 billion).
2.5.5 Exceptional items
Years ended 30 June 2015 and 30 June 2014
An analysis of the exceptional items for FY2015 and FY2014 are included in section 1.15.3.
| | | | | | | | | | | | |
Year ended 30 June 2013 | | Gross
US$M | | | Tax
US$M | | | Net
US$M | |
| | | |
Exceptional items by category | | | | | | | | | | | | |
Sale of Yeelirrie uranium deposit | | | 420 | | | | – | | | | 420 | |
Sale of Richards Bay Minerals | | | 1,212 | | | | (183 | ) | | | 1,029 | |
Sale of diamonds business | | | (97 | ) | | | (42 | ) | | | (139 | ) |
Sale of East and West Browse Joint Ventures | | | 1,539 | | | | (188 | ) | | | 1,351 | |
Impairment of Nickel West assets | | | (1,698 | ) | | | 454 | | | | (1,244 | ) |
Impairment of Permian Basin assets | | | (266 | ) | | | 99 | | | | (167 | ) |
Other impairments arising from capital project review | | | (971 | ) | | | 291 | | | | (680 | ) |
Newcastle steelworks rehabilitation | | | 158 | | | | (47 | ) | | | 111 | |
| | | | | | | | | | | | |
| | | 297 | | | | 384 | | | | 681 | |
| | | | | | | | | | | | |
The Group announced the sale of its wholly owned Yeelirrie uranium deposit resulting in a gain on sale of US$420 million, while the associated tax expense was offset by the recognition of deferred tax benefits on available tax losses.
The Group announced it had completed the sale of its 37.76 per cent effective interest in Richards Bay Minerals resulting in a gain on sale of US$1.0 billion (after tax expense).
The Group announced the sale of its diamonds business, comprising its interests in the EKATI Diamond Mine and Diamond Marketing operations. The transaction was completed on 10 April 2013 for an aggregate cash consideration of US$553 million (after adjustments). An impairment charge of US$139 million (after tax expense) was recognised based on the final consideration.
The Group signed a definitive agreement to sell its 8.33 per cent interest in the East Browse Joint Venture and 20 per cent interest in the West Browse Joint Venture resulting in a gain on sale of US$1.5 billion being recognised in FY2013. The associated tax expense of US$462 million was partly offset by the recognition of deferred tax benefits on available tax losses of US$241 million and the derecognition of deferred tax liabilities of US$33 million. The final sales price was determined during FY2014 requiring a loss of US$143 million recognised in FY2014.
As a result of expected continued strength in the Australian dollar and weak nickel prices, the Group recognised an impairment charge of US$1.2 billion (after tax benefit) at Nickel West in FY2013.
An impairment charge of US$167 million (after tax benefit) was recognised as the performance of specific evaluation wells in certain areas of the Permian Basin (United States) did not support economic development.
In FY2013, WAIO refocused its attention on the capital efficient expansion opportunity that exists within the Port Hedland inner harbour, and all early works associated with the outer harbour development option were suspended. This revision to the WAIO development sequence and the change in status of other minor capital projects across the Group resulted in the recognition of impairment charges of US$604 million (after tax benefit) and other restructuring costs of US$76 million (after tax benefit) in FY2013, of which US$580 million (after tax benefit) were related to WAIO.
The Group recognised a decrease of US$158 million (before tax expense) to its rehabilitation obligations in respect of former operations at the Newcastle steelworks (Australia). This followed the completion of the Hunter River Remediation Project and reaching agreement with the Environment Protection Authority in March 2013 regarding the necessary scope of work to repeal the Environmental Classification at Steel River.
| | | | | | | | | | | | | | | | | | | | |
Year ended 30 June 2013 US$M | | Sale of
assets | | | Impairment of
goodwill and
other assets | | | Restructuring
costs | | | Closure and
rehabilitation
provisions
released | | | Gross | |
Sale of Yeelirrie uranium deposit | | | 420 | | | | – | | | | – | | | | – | | | | 420 | |
Sale of Richards Bay Minerals | | | 1,212 | | | | – | | | | – | | | | – | | | | 1,212 | |
Sale of diamonds business | | | – | | | | (97 | ) | | | – | | | | – | | | | (97 | ) |
| Sale of East and West Browse Joint Ventures | | | 1,539 | | | | – | | | | – | | | | – | | | | 1,539 | |
Impairment of Nickel West assets | | | – | | | | (1,698 | ) | | | – | | | | – | | | | (1,698 | ) |
Impairment of Permian Basin assets | | | – | | | | (266 | ) | | | – | | | | – | | | | (266 | ) |
| Other impairments arising from capital project review | | | – | | | | (863 | ) | | | (108 | ) | | | – | | | | (971 | ) |
Newcastle steelworks rehabilitation | | | – | | | | – | | | | – | | | | 158 | | | | 158 | |
| | | | | | | | | | | | | | | | | | | | |
| | | 3,171 | | | | (2,924 | ) | | | (108 | ) | | | 158 | | | | 297 | |
| | | | | | | | | | | | | | | | | | | | |
2.5.6 Petroleum and Potash Business
An analysis of the financial performance of our Petroleum and Potash Business for FY2015 compared to FY2014 is included in section 1.12.2.
Financial information for the Petroleum and Potash Business for FY2015 and FY2014 is presented below.
| | | | | | | | | | | | | | | | | | | | | | | | | | | | | | | | |
Year ended 30 June 2015 US$M | | Revenue (i) | | | Underlying
EBITDA | | | D&A | | | Underlying
EBIT | | | Net
operating
assets | | | Capital
expenditure | | | Exploration
gross (ii) | | | Exploration
to profit (iii) | |
Australia Production Unit (iv) | | | 1,003 | | | | 862 | | | | 337 | | | | 525 | | | | 1,091 | | | | 44 | | | | | | | | | |
Bass Strait | | | 1,291 | | | | 1,025 | | | | 127 | | | | 898 | | | | 3,055 | | | | 328 | | | | | | | | | |
North West Shelf | | | 1,899 | | | | 1,351 | | | | 186 | | | | 1,165 | | | | 1,400 | | | | 135 | | | | | | | | | |
Atlantis | | | 1,071 | | | | 904 | | | | 368 | | | | 536 | | | | 2,146 | | | | 354 | | | | | | | | | |
Shenzi | | | 973 | | | | 868 | | | | 287 | | | | 581 | | | | 1,399 | | | | 268 | | | | | | | | | |
Mad Dog | | | 175 | | | | 87 | | | | 34 | | | | 53 | | | | 581 | | | | 101 | | | | | | | | | |
Eagle Ford (v) | | | 2,932 | | | | 1,792 | | | | 2,172 | | | | (380 | ) | | | 10,754 | | | | 2,315 | | | | | | | | | |
Permian (v)(vi) | | | 263 | | | | 69 | | | | 502 | | | | (433 | ) | | | 1,096 | | | | 773 | | | | | | | | | |
Haynesville(v)(vi) | | | 532 | | | | 13 | | | | 554 | | | | (541 | ) | | | 5,916 | | | | 411 | | | | | | | | | |
Fayetteville(v) | | | 448 | | | | 162 | | | | 195 | | | | (33 | ) | | | 2,960 | | | | 183 | | | | | | | | | |
Trinidad/Tobago (iv) | | | 220 | | | | 159 | | | | 28 | | | | 131 | | | | 827 | | | | 10 | | | | | | | | | |
Algeria | | | 309 | | | | 247 | | | | 38 | | | | 209 | | | | 97 | | | | 23 | | | | | | | | | |
Exploration | | | – | | | | (481 | ) | | | 48 | | | | (529 | ) | | | 733 | | | | – | | | | | | | | | |
Other(vii)(viii) | | | 276 | | | | 98 | | | | 342 | | | | (244 | ) | | | 2,518 | | | | 78 | | | | | | | | | |
| | | | | | | | | | | | | | | | | | | | | | | | | | | | | | | | |
Total Petroleum | | | 11,392 | | | | 7,156 | | | | 5,218 | | | | 1,938 | | | | 34,573 | | | | 5,023 | | | | 567 | | | | 529 | |
| | | | | | | | | | | | | | | | | | | | | | | | | | | | | | | | |
Potash | | | – | | | | (178 | ) | | | 6 | | | | (184 | ) | | | 2,684 | | | | 336 | | | | 3 | | | | 3 | |
Other(ix) | | | – | | | | 47 | | | | – | | | | 47 | | | | (970 | ) | | | – | | | | – | | | | – | |
| | | | | | | | | | | | | | | | | | | | | | | | | | | | | | | | |
Total Petroleum and Potash from Group production | | | 11,392 | | | | 7,025 | | | | 5,224 | | | | 1,801 | | | | 36,287 | | | | 5,359 | | | | 570 | | | | 532 | |
| | | | | | | | | | | | | | | | | | | | | | | | | | | | | | | | |
Third party products | | | 69 | | | | 1 | | | | – | | | | 1 | | | | – | | | | – | | | | | | | | | |
| | | | | | | | | | | | | | | | | | | | | | | | | | | | | | | | |
Total Petroleum and Potash | | | 11,461 | | | | 7,026 | | | | 5,224 | | | | 1,802 | | | | 36,287 | | | | 5,359 | | | | 570 | | | | 532 | |
| | | | | | | | | | | | | | | | | | | | | | | | | | | | | | | | |
Adjustment for equity accounted investments (x) | | | (14 | ) | | | (3 | ) | | | (3 | ) | | | – | | | | – | | | | – | | | | – | | | | – | |
| | | | | | | | | | | | | | | | | | | | | | | | | | | | | | | | |
Total Petroleum and Potash statutory result | | | 11,447 | | | | 7,023 | | | | 5,221 | | | | 1,802 | | | | 36,287 | | | | 5,359 | | | | 570 | | | | 532 | |
| | | | | | | | | | | | | | | | | | | | | | | | | | | | | | | | |
| | | | | | | | | | | | | | | | | | | | | | | | | | | | | | | | |
Year ended 30 June 2014 (Restated) US$M | | Revenue (i) | | | Underlying
EBITDA | | | D&A | | | Underlying
EBIT | | | Net
operating
assets | | | Capital
expenditure | | | Exploration
gross (ii) | | | Exploration
to profit (iii) | |
Australia Production Unit (iv) | | | 1,418 | | | | 1,220 | | | | 309 | | | | 911 | | | | 1,464 | | | | 419 | | | | | | | | | |
Bass Strait | | | 1,885 | | | | 1,555 | | | | 132 | | | | 1,423 | | | | 2,864 | | | | 259 | | | | | | | | | |
North West Shelf(xi) | | | 2,432 | | | | 1,599 | | | | 175 | | | | 1,424 | | | | 1,691 | | | | 193 | | | | | | | | | |
Atlantis | | | 1,535 | | | | 1,407 | | | | 335 | | | | 1,072 | | | | 2,272 | | | | 385 | | | | | | | | | |
Shenzi | | | 1,430 | | | | 1,281 | | | | 243 | | | | 1,038 | | | | 1,598 | | | | 210 | | | | | | | | | |
Mad Dog | | | 217 | | | | 171 | | | | 16 | | | | 155 | | | | 461 | | | | 68 | | | | | | | | | |
Onshore US(v) | | | 4,264 | | | | 2,270 | | | | 2,426 | | | | (156 | ) | | | 23,377 | | | | 4,226 | | | | | | | | | |
Trinidad/Tobago(iv) | | | 273 | | | | 374 | | | | 52 | | | | 322 | | | | 709 | | | | 8 | | | | | | | | | |
Algeria | | | 465 | | | | 396 | | | | 30 | | | | 366 | | | | 104 | | | | 19 | | | | | | | | | |
Exploration | | | – | | | | (369 | ) | | | 113 | | | | (482 | ) | | | 464 | | | | – | | | | | | | | | |
Other(vii)(viii)(xii) | | | 491 | | | | 220 | | | | 426 | | | | (206 | ) | | | 3,264 | | | | 92 | | | | | | | | | |
| | | | | | | | | | | | | | | | | | | | | | | | | | | | | | | | |
Total Petroleum | | | 14,410 | | | | 10,124 | | | | 4,257 | | | | 5,867 | | | | 38,268 | | | | 5,879 | | | | 600 | | | | 497 | |
| | | | | | | | | | | | | | | | | | | | | | | | | | | | | | | | |
Potash | | | – | | | | (211 | ) | | | 74 | | | | (285 | ) | | | 2,255 | | | | 544 | | | | 47 | | | | 47 | |
Other(ix) | | | – | | | | (298 | ) | | | – | | | | (298 | ) | | | (1,009 | ) | | | – | | | | – | | | | – | |
| | | | | | | | | | | | | | | | | | | | | | | | | | | | | | | | |
Total Petroleum and Potash from Group production | | | 14,410 | | | | 9,615 | | | | 4,331 | | | | 5,284 | | | | 39,514 | | | | 6,423 | | | | 647 | | | | 544 | |
| | | | | | | | | | | | | | | | | | | | | | | | | | | | | | | | |
Third party products | | | 437 | | | | 3 | | | | – | | | | 3 | | | | – | | | | – | | | | | | | | | |
| | | | | | | | | | | | | | | | | | | | | | | | | | | | | | | | |
Total Petroleum and Potash | | | 14,847 | | | | 9,618 | | | | 4,331 | | | | 5,287 | | | | 39,514 | | | | 6,423 | | | | 647 | | | | 544 | |
| | | | | | | | | | | | | | | | | | | | | | | | | | | | | | | | |
Adjustment for equity accounted investments (x) | | | (14 | ) | | | (3 | ) | | | (3 | ) | | | – | | | | – | | | | – | | | | – | | | | – | |
| | | | | | | | | | | | | | | | | | | | | | | | | | | | | | | | |
Total Petroleum and Potash statutory result | | | 14,833 | | | | 9,615 | | | | 4,328 | | | | 5,287 | | | | 39,514 | | | | 6,423 | | | | 647 | | | | 544 | |
| | | | | | | | | | | | | | | | | | | | | | | | | | | | | | | | |
| (i) | Petroleum revenue from Group production includes: crude oil US$6,592 million (2014: US$8,645 million), natural gas US$2,489 million (2014: US$3,119 million), LNG US$1,366 million (2014: US$1,614 million), NGL US$665 million (2014: US$916 million) and other US$266 million (2014: US$102 million). |
| (ii) | Includes US$86 million of capitalised exploration (2014: US$231 million). |
| (iii) | Includes US$48 million of exploration expenditure previously capitalised, written off as impaired (included in scopedepreciation and amortisation) (2014: US$400128 million). |
| (iv) | Australia Production Unit includes Macedon, Pyrenees, Minerva and Stybarrow. Comparative period has been restated to report Australia Production Unit and Trinidad/Tobago separately from Other. |
| (v) | For FY2015 onwards Onshore US has been reported separately between Eagle Ford, Permian, Haynesville and Fayetteville. |
| (vi) | Includes US$328 million reduction in the budget for the WAIO Port Blending and Rail Yard Facilities project, which reflects the decision to prioritise capital efficient growth in the Inner Harbour. As a result, WAIO remains well positioned to deliver 220 Mtpa of supply chain capacity ahead of schedule and on budget.Following a review of the Hay Point Stage Three Expansion project (Australia), BHP Billiton approved a US$255 million increase to the original budget of US$1.25 billion (BHP Billiton share). Shipments from the new facilities are now expected to commence in CY2015. The revised schedule and budget reflects the impact of significant weather interruptions andimpairments associated productivity issues, which have affected the marine works. The schedule delay is not expected to impact the production profile of the Queensland Coal operation.
Projects completed during FY2013
| | | | | | | | | | | | | | | | | | | | | Business | | Project | | Capacity (1) | | Capital expenditure
(US$M)(1) | | | Date of initial production (2) | | | | | | Actual (3) | | | Budget | | | Actual | | | Target | | Petroleum | | Bass Strait Kipper (Australia) BHP Billiton – 32.5% – 50% Non-operator | | 10,000 barrels of condensate per day and processing capacity of 80 million cubic feet of gas per day (MMcf/d). | | | 905 | | | | 900 | | | | Q3 2012 | (4) | | | 2012 | (4) | Coal | | Broadmeadow Life Extension (Australia) BHP Billiton – 50% | | Increases productive capacity by 0.4 Mtpa of metallurgical coal and extends life of the mine by 21 years. | | | 483 | | | | 450 | | | | Q1 2013 | | | | 2013 | | | | | | | | | | | | | | | | | | | | | | | | | | | | | | 1,388 | | | | 1,350 | | | | | | | | | | | | | | | | | | | | | | | | | | | | | | |
Projects in execution at the end of FY2013
| | | | | | | | | | | | | | | | | | | | | Business | | Project | | Capacity (1) | | Capital expenditure
(US$M)(1) | | | Date of initial production(2) | | Projects that delivered first production during FY2013 | | Actual (3) | | | Budget | | | Actual | | | Target | | Iron Ore | | WAIO Port Hedland Inner Harbour Expansion (Australia) BHP Billiton – 85% | | Increases total Inner Harbour capacity to 220 Mtpa. Debottlenecking opportunities that would add substantial, low cost capacity are being evaluated. | | | 1,900 | (5) | | | 1,900 | (5) | | | Q4 2012 | | | | H2 2012 | | | | WAIO Orebody 24 (Australia) BHP Billiton – 85% | | Maintains iron ore production output from the Newman Joint Venture operations. | | | 698 | | | | 698 | | | | Q4 2012 | | | | H2 2012 | | Coal | | Daunia (Australia) BHP Billiton – 50% | | Greenfield mine development with 4.5 Mtpa of export metallurgical coal capacity. | | | 676 | | | | 800 | | | | Q1 2013 | | | | 2013 | | | | Newcastle Third Port Project Stage 3 (Australia) BHP Billiton – 35.5% | | Increases total coal terminal capacity from 53 Mtpa to 66 Mtpa. | | | 367 | | | | 367 | | | | Q2 2013 | | | | 2014 | | | | | | | Projects under development (approved in prior years) | | | | | Budget | | | | | | Target | | Petroleum | | Macedon (Australia) BHP Billiton – 71.43% Operator | | 200 MMcf/d. | | | | | | | 1,050 | | | | | | | | 2013 | | | | Bass Strait Turrum (Australia) BHP Billiton – 50%Non-operator | | 11,000 barrels of condensate per day and processing capacity of 200 MMcf/d. | | | | | | | 1,350 | (6) | | | | | | | 2013 | (6)(7) | | | North West Shelf Greater Western Flank-A (Australia) BHP Billiton – 16.67%Non-operator | | To maintain LNG plant throughput from the North West Shelf operations. | | | | | | | 400 | | | | | | | | 2016 | | | | North West Shelf North Rankin B Gas Compression (Australia) BHP Billiton – 16.67% Non-operator | | 2,500 MMcf/d. | | | | | | | 850 | | | | | | | | 2013 | | Copper | | Escondida Organic Growth Project 1 (Chile) BHP Billiton – 57.5% | | Replaces the Los Colorados concentrator with a new 152,000 tonnes per day plant. | | | | | | | 2,207 | | | | | | | | H1 2015 | | | | Escondida Oxide Leach Area Project (Chile) BHP Billiton – 57.5% | | New dynamic leaching pad and mineral handling system. Maintains oxide leaching capacity. | | | | | | | 414 | | | | | | | | H1 2014 | | Iron Ore | | WAIO Jimblebar Mine Expansion (Australia) BHP Billiton – 85% (8) | | Increases mining and processing capacity to 35 Mtpa with incremental debottlenecking opportunities to 55 Mtpa. | | | | | | | 3,220 | (5)(6)(8) | | | | | | | Q4 2013 | (6) |
| | | | | | | | | | | | | | | | | Business | | Project | | Capacity (1) | | Capital expenditure
(US$M)(1) | | | Date of initial production(2) | | Projects under development (approved in prior years) (continued) | | | | Budget | | | | | Target | | | | WAIO Port Blending and Rail Yard Facilities (Australia) BHP Billiton – 85% | | Optimises resource and enhances efficiency across the WAIO supply chain. | | | | | 1,000 | (5)(6)(9) | | | | | H2 2014 | | | | Samarco Fourth Pellet Plant (Brazil) BHP Billiton – 50% | | Increases iron ore pellet production capacity by 8.3 Mtpa to 30.5 Mtpa. | | | | | 1,750 | | | | | | H1 2014 | | Coal | | Hay Point Stage Three Expansion (Australia) BHP Billiton – 50% | | Increases port capacity from 44 Mtpa to 55 Mtpa and reduces storm vulnerability. | | | | | 1,505 | (5)(6) | | | | | 2015 | (6) | | | Caval Ridge (Australia) BHP Billiton – 50% | | Greenfield mine development to produce an initial 5.5 Mtpa of export metallurgical coal. | | | | | 1,870 | (5) | | | | | 2014 | | | | Appin Area 9 (Australia) BHP Billiton – 100% | | Maintains Illawarra Coal’s production capacity with a replacement mining domain and capacity to produce 3.5 Mtpa of metallurgical coal. | | | | | 845 | | | | | | 2016 | | | | Cerrejon P40 Project (Colombia) BHP Billiton – 33.3% | | Increases saleable thermal coal production by eight Mtpa to approximately 40 Mtpa. | | | | | 437 | | | | | | 2013 | | Projects under development (approved during FY2013) | | | | Budget | | | | | Target | | Petroleum | | Bass Strait Longford Gas Conditioning Plant (Australia) BHP Billiton – 50% Non-operator | | Designed to process approximately 400 MMcf/d of high CO2 gas. | | | | | 520 | | | | | | 2016 | | | | | | | | | | | | | | | | | | | | | | | | | | | | 21,183 | | | | | | | | | | | | | | | | | | | | | | | | |
(1) | All references to capacity are 100 per cent unless noted otherwise. All references to capital expenditure are BHP Billiton’s share unless noted otherwise. |
(2) | References are based on calendar years. |
(3) | Number subject to finalisation. |
(4) | Facilities were completed in September 2012 and will be ready for first production once the mercury removal project is complete. |
(5) | Excludes announced pre-commitment funding. |
(6) | As per revised budget and/or schedule. |
(7) | Initial production through the Turrum facilities, scheduled for CY2013, will be low CO2 gas. Additional high CO2 production from the Turrum reservoir will come online with completion of the Longford Gas Conditioning Plant in CY2016. |
(8) | Prior to completion of the ITOCHU and Mitsui transaction in July 2013, BHP Billiton’s economic interest in the Jimblebar Mine Expansion project was 96 per cent and our share of approved capital expenditure was US$3.6 billion. |
(9) | The construction of port blending and rail yard facilities at the South Stockyard is no longer included in the scope of the WAIO Port Blending and Rail Yard Facilities project. |
3.7.3 Net debt and sources of liquidity
Our policies on debt and treasury management are as follows:
a commitment to a solid ‘A’ credit rating;
gearing to be a maximum of 40 per cent;
diversification of funding sources;
generally to maintain borrowings and excess cash in US dollars.
Gearing and net debt
30 June 2013 compared with 30 June 2012
Net debt, comprising Interest bearing liabilities less Cash and cash equivalents, was US$29.1 billion, which represented an increase of US$5.5 billion compared with the net debt position at 30 June 2012. Gearing,divestment of assets in North Louisiana (Haynesville) and the Pecos field (Permian).
|
| (vii) | Predominantly divisional activities, business development, Pakistan, UK, Neptune, Genesis and ceased and sold operations. Also includes the Caesar oil pipeline and the Cleopatra gas pipeline which isare equity accounted investments and are reported on a proportionate consolidation basis (with the ratioexception of net debt to net debt plus net assets, was 28.8 per cent at 30 June 2013, comparedoperating assets). |
| (viii) | Goodwill associated with 26.0 per cent at 30 June 2012. The primary reason for the increase in gearing during FY2013 was due to the issueOnshore US of bonds during the period.Cash at bank and in hand less overdrafts at 30 June 2013 was US$6.1 billion compared with US$4.9 billion at 30 June 2012. Included within this were short-term deposits at 30 June 2013 of US$3.2 billion compared with US$3.3 billion at 30 June 2012.
30 June 2012 compared with 30 June 2011
Net debt was US$23.6 billion, which represented an increase of US$17.8 billion compared with the net debt position at 30 June 2011. Gearing was 26.0 per cent at 30 June 2012, compared with 9.2 per cent at 30 June 2011. The primary reason for the increase in gearing during FY2012 was the purchase of Petrohawk for US$12.0 billion and assumption of net debt of US$3.8 billion.
Cash at bank and in hand less overdrafts at 30 June 2012 was US$4.9 billion compared with US$10.1 billion at 30 June 2011. Included within this were short-term deposits at 30 June 2012 of US$3.3 billion compared with US$8.7 billion at 30 June 2011.
Funding sources
During FY2013, we made the following debt issues:
In September 2012, we issued a two tranche Euro bond and a two tranche Sterling bond. The Euro bond issue comprised €1.25 billion 2.250 per cent bonds due 2020 and €7503,026 million 3.250 per cent bonds due 2027. The Sterling bond issue comprised £750 million 3.250 per cent bonds due 2024 and £1.0 billion 4.300 per cent bonds due 2042.
In October 2012, we issued an A$1.0 billion 3.750 per cent Australian dollar bond due 2017.
In April 2013, we issued a €750 million 3.125 per cent Euro bond due 2033.
In May 2013, we issued a C$750 million 3.230 per cent Canadian bond due 2023.
None of our Group level borrowing facilities are subject to financial covenants. Certain specific financing facilities in relation to specific Businesses are the subject of financial covenants that vary from facility to facility, but which would be considered normal for such facilities.
Our maturity profile for US dollar bonds, Euro bonds and Australian dollar bonds for the following five years is set out below.
| | | | | | | | | | | | | | | | | | | | | Year ended 30 June | | 2014 | | | 2015 | | | 2016 | | | 2017 | | | 2018 | | | | | US$M | | | US$M | | | US$M | | | US$M | | | US$M | | USD Bonds | | | 2,704 | | | | 3,389 | | | | 1,050 | | | | 2,750 | | | | – | | Euro Bonds | | | 784 | | | | – | | | | 1,307 | | | | – | | | | – | | AUD Bonds | | | – | | | | – | | | | – | | | | – | | | | 924 | | | | | | | | | | | | | | | | | | | | | | | | | | 3,488 | | | | 3,389 | | | | 2,357 | | | | 2,750 | | | | 924 | | | | | | | | | | | | | | | | | | | | | | |
As at 30 June 2013, the Group’s cash and cash equivalents on hand were US$6.1 billion. Details of major standby and support arrangements are as follows.
| | | | | | | | | | | | | | | | | | | | | | | | | | | | Facility
available
2013 | | | Used
2013 | | | Unused
2013 | | | Facility
available
2012 | | | Used
2012 | | | Unused
2012 | | | | | US$M | | | US$M | | | US$M | | | US$M | | | US$M | | | US$M | | Commercial paper program(1) | | | 6,000 | | | | (1,330 | ) | | | 4,670 | | | | 4,000 | | | | (995 | ) | | | 3,005 | | Other facilities(2) | | | 59 | | | | – | | | | 59 | | | | 60 | | | | – | | | | 60 | | | | | | | | | | | | | | | | | | | | | | | | | | | Total financing facilities | | | 6,059 | | | | (1,330 | ) | | | 4,729 | | | | 4,060 | | | | (995 | ) | | | 3,065 | | | | | | | | | | | | | | | | | | | | | | | | | | |
(1) | The Group has a US$6.0 billion commercial paper program backed by US$6.0 billion of revolving credit facilities. The multi-currency revolving credit facilities consist of US$5.0 billion expiring in December 2015 and US$1.0 billion expiring in December 2013 with the ability to extend to December 2014. These facilities are used for general corporate purposes and as backup for the commercial paper programs. The interest rates under these facilities are based on an interbank rate plus a margin. The applicable margin is typical for a credit facility extended to a company with the Group’s credit rating. The Group had US$1.3 billion outstanding in the US commercial paper market at the end of the financial year (2012: US$995 million). |
(2) | Other bank facilities are arranged with a number of banks with the general terms and conditions agreed on a periodic basis. |
Additional information regarding the maturity profile of our debt obligations and details of our standby and support agreements is included in note 29 ‘Financial risk management’Other Net operating assets (2014: US$3,568 million).
|
| (ix) | Includes closed mining and smelting operations in Canada and the United States. |
| (x) | Total Petroleum and Potash segment Revenue excludes US$14 million (2014: US$14 million) revenue related to the financial statements.Caesar oil pipeline and the Cleopatra gas pipeline. Total Petroleum and Potash segment |
The Group’s long-term credit rating from Moody’s Investor Services is currently A1 (the short-term rating isP-1), and from Standard & Poor’s is A+ (the short-term credit rating is A-1). The ratings outlook from both agencies has not changed during FY2013 or since 30 June 2013.
3.7.4 Quantitative and qualitative disclosures about market risk
We identified our primary market risks in section 3.4. A description of how we manage our market risks, including both quantitative and qualitative information about our market risk sensitive instruments outstanding at 30 June 2013, is contained in note 29 ‘Financial risk management’
| Underlying EBITDA includes US$3 million (2014: US$3 million) D&A related to the Caesar oil pipeline and the Cleopatra gas pipeline. |
| (xi) | Includes an expense of US$143 million incurred in May 2014 related to the purchase price adjustment for the Browse asset sale completed in the 2013 financial statements.year. |
3.7.5 Portfolio management
We continually review our portfolio
| (xii) | Includes an expense of US$112 million incurred in November 2013 related to identify assets that no longer fit our strategy. Our commitmentthe closure of the UK pension plan. Also includes a gain of US$120 million related to simplify our portfolio continued to deliver value for shareholders, with major transactions totalling US$6.5 billion, either announced or completed during the period. We will purchase interests in assets where they fit our strategy.On 19 December 2012, we completed the sale of the Liverpool Bay asset in March 2014.
|
Year ended 30 June 2014 compared with year ended 30 June 2013
Petroleum and Potash revenue increased by US$1.6 billion to US$14.8 billion, mainly due to Onshore US, which increased by 43 per cent to US$4.3 billion, and Atlantis, which increased by 80 per cent to US$1.5 billion.
The increase in revenue primarily resulted from an increase in volume of four per cent in FY2014 to 246 MMboe. A 16 MMboe increase in liquids production was underpinned by a 73 per cent increase in Onshore US liquids volumes and a near doubling of production at Atlantis. Natural gas volumes declined by four per cent as the delivery of first gas from Macedon partially offset lower demand at Bass Strait and natural field decline at Haynesville.
The average realised price of natural gas across our portfolio increased by 16 per cent to US$4.35 per thousand standard cubic feet (Mscf). This included a 25 per cent increase in the average realised price of US natural gas to US$4.10 per Mscf. This increase was partially offset by a four per cent decline in the average realised price of oil to US$102 per bbl, a one per cent decline in the average realised price of LNG to US$14.67 per Mscf and a seven per cent decline in the average realised price of natural gas liquids (NGL) to US$42.28 per barrel.
Underlying EBIT for Petroleum decreased by US$115 million to US$5.9 billion in FY2014. Price-related increases, net of price-linked costs, contributed US$113 million to Underlying EBIT and volumes contributed an additional US$994 million, although this was partially offset by an increase in depreciation and amortisation expense at Onshore US that reflected the ramp-up of liquids production and the progressive development of our Permian acreage. In this regard, our position within our focus area in the Permian increased by 25 per cent in the period to 74 thousand net acres.
Additional charges were also recognised during the period, including: a US$184 million impairment of minor Gulf of Mexico assets; a US$143 million adjustment to the Browse divestment proceeds; and a US$112 million UK pension plan expense. The Group also incurred a charge of US$135 million for underutilised gas pipeline capacity, primarily in the Haynesville.
The Onshore US Underlying EBIT for FY2014 was a loss of US$156 million compared with a loss in FY2013 of US$287 million. The Onshore US Underlying EBITDA for FY2014 was US$2.3 billion compared with US$1.5 billion in FY2013. Second half June 2014 EBITDA increased by more than 60 per cent to US$1.4 billion. As a result, Onshore US generated an Underlying EBIT of US$142 million during the second half of FY2014. This included the aforementioned underutilised gas pipeline capacity charges.
In FY2014, approximately 75 per cent of Onshore US drilling and development expenditure of US$4.2 billion was invested in the Eagle Ford, with the majority focused on our Black Hawk acreage. The repetitive, manufacturing-like nature of shale development is ideally suited to our productivity agenda. Drilling costs in the Black Hawk declined by 16 per cent to US$4.2 million per well during the period while spud to sales timing improved by 21 per cent.
Petroleum exploration expenditure for FY2014 was US$600 million, of which US$369 million was expensed. During the period, we signed a production sharing contract for Block 23b (60 per cent interest and operator) and farmed into Blocks 23a and 14 (70 per cent interest and operator) in Trinidad and Tobago.
During the period, we completed the divestment of our 46.1 per cent interest in Liverpool Bay and our South Midland acreage in the Permian basin, Onshore US. Combined proceeds of US$182 million were realised (before customary adjustments) and a gain on sale of US$116 million was recognised in Underlying EBIT.
Potash recorded an Underlying EBIT loss of US$583 million. This included: a US$68 million impairment associated with our decision to allow the exclusivity agreement for Terminal 5 at the Port of Vancouver (US) to lapse; and a US$300 million charge related to the revision of mine site rehabilitation provisions for the Group’s North American closed mines, which are managed by our Potash Business. In addition, exploration expense for Potash was US$47 million, a US$42 million reduction from FY2013.
The Jansen Potash Project was 30 per cent complete at the end of the period with significant progress made on surface infrastructure and shaft excavation continuing.
2.5.7 Copper Business
An analysis of the financial performance of our Copper Business for FY2015 compared to FY2014 is included in section 1.12.3.
Financial information for the Copper Business for FY2015 and FY2014 is presented below.
| | | | | | | | | | | | | | | | | | | | | | | | | | | | | | | | |
Year ended 30 June 2015 US$M | | Revenue | | | Underlying
EBITDA | | | D&A | | | Underlying
EBIT | | | Net
operating
assets | | | Capital
expenditure | | | Exploration
gross | | | Exploration
to profit | |
Escondida(i) | | | 7,819 | | | | 4,064 | | | | 920 | | | | 3,144 | | | | 13,909 | | | | 3,273 | | | | | | | | | |
Pampa Norte(ii) | | | 1,437 | | | | 762 | | | | 669 | | | | 93 | | | | 1,926 | | | | 242 | | | | | | | | | |
Antamina(iii) | | | 854 | | | | 420 | | | | 107 | | | | 313 | | | | 1,379 | | | | 163 | | | | | | | | | |
Olympic Dam | | | 1,244 | | | | 280 | | | | 253 | | | | 27 | | | | 6,665 | | | | 307 | | | | | | | | | |
Other(iii)(iv) | | | – | | | | (152 | ) | | | 11 | | | | (163 | ) | | | (178 | ) | | | – | | | | | | | | | |
| | | | | | | | | | | | | | | | | | | | | | | | | | | | | | | | |
Total Copper from Group production | | | 11,354 | | | | 5,374 | | | | 1,960 | | | | 3,414 | | | | 23,701 | | | | 3,985 | | | | | | | | | |
| | | | | | | | | | | | | | | | | | | | | | | | | | | | | | | | |
Third party products | | | 953 | | | | 23 | | | | – | | | | 23 | | | | – | | | | – | | | | | | | | | |
| | | | | | | | | | | | | | | | | | | | | | | | | | | | | | | | |
Total Copper | | | 12,307 | | | | 5,397 | | | | 1,960 | | | | 3,437 | | | | 23,701 | | | | 3,985 | | | | 91 | | | | 91 | |
| | | | | | | | | | | | | | | | | | | | | | | | | | | | | | | | |
Adjustment for equity accounted investments (v) | | | (854 | ) | | | (192 | ) | | | (108 | ) | | | (84 | ) | | | – | | | | (163 | ) | | | (1 | ) | | | (1 | ) |
| | | | | | | | | | | | | | | | | | | | | | | | | | | | | | | | |
Total Copper statutory result | | | 11,453 | | | | 5,205 | | | | 1,852 | | | | 3,353 | | | | 23,701 | | | | 3,822 | | | | 90 | | | | 90 | |
| | | | | | | | | | | | | | | | | | | | | | | | | | | | | | | | |
| | | | | | | | | | | | | | | | | | | | | | | | | | | | | | | | |
Year ended 30 June 2014 (Restated) US$M | | Revenue | | | Underlying
EBITDA | | | D&A | | | Underlying
EBIT | | | Net
operating
assets | | | Capital
expenditure | | | Exploration
gross | | | Exploration
to profit | |
Escondida(i) | | | 8,085 | | | | 4,754 | | | | 760 | | | | 3,994 | | | | 11,779 | | | | 3,186 | | | | | | | | | |
Pampa Norte(ii) | | | 1,796 | | | | 785 | | | | 429 | | | | 356 | | | | 2,575 | | | | 336 | | | | | | | | | |
Antamina(iii) | | | 1,261 | | | | 818 | | | | 84 | | | | 734 | | | | 1,341 | | | | 262 | | | | | | | | | |
Olympic Dam | | | 1,777 | | | | 299 | | | | 265 | | | | 34 | | | | 6,320 | | | | 167 | | | | | | | | | |
Other(iii)(iv) | | | 101 | | | | (193 | ) | | | 7 | | | | (200 | ) | | | (18 | ) | | | 13 | | | | | | | | | |
| | | | | | | | | | | | | | | | | | | | | | | | | | | | | | | | |
Total Copper from Group production | | | 13,020 | | | | 6,463 | | | | 1,545 | | | | 4,918 | | | | 21,997 | | | | 3,964 | | | | | | | | | |
| | | | | | | | | | | | | | | | | | | | | | | | | | | | | | | | |
Third party products | | | 1,030 | | | | 8 | | | | – | | | | 8 | | | | – | | | | – | | | | | | | | | |
| | | | | | | | | | | | | | | | | | | | | | | | | | | | | | | | |
Total Copper | | | 14,050 | | | | 6,471 | | | | 1,545 | | | | 4,926 | | | | 21,997 | | | | 3,964 | | | | 113 | | | | 113 | |
| | | | | | | | | | | | | | | | | | | | | | | | | | | | | | | | |
Adjustment for equity accounted investments(v) | | | (1,261 | ) | | | (344 | ) | | | (86 | ) | | | (258 | ) | | | – | | | | (267 | ) | | | (2 | ) | | | (2 | ) |
| | | | | | | | | | | | | | | | | | | | | | | | | | | | | | | | |
Total Copper statutory result | | | 12,789 | | | | 6,127 | | | | 1,459 | | | | 4,668 | | | | 21,997 | | | | 3,697 | | | | 111 | | | | 111 | |
| | | | | | | | | | | | | | | | | | | | | | | | | | | | | | | | |
| (i) | Escondida is consolidated under IFRS 10 and reported on a 100 per cent basis. |
| (ii) | Includes Spence and Cerro Colorado. |
| (iii) | Antamina and Resolution are equity accounted investments and are reported on a proportionate consolidation basis (with the exception of net operating assets). |
| (iv) | Predominantly comprises divisional activities, greenfield exploration, business development and ceased and sold operations. Includes Pinto Valley and Resolution. Pinto Valley was sold effective 11 October 2013. |
| (v) | Total Copper segment Revenue excludes US$854 million (2014: US$1,261 million) revenue related to Antamina. Total Copper segment Underlying EBITDA includes US$108 million (2014: US$86 million) D&A and US$84 million (2014: US$258 million) net finance costs and taxation expense related to Antamina and Resolution that are also included in Underlying EBIT. Copper segment Capital expenditure excludes US$163 million (2014: US$267 million) and US$1 million (2014: US$2 million) Exploration expenditure related to Antamina and Resolution. |
Year ended 30 June 2014 compared with year ended 30 June 2013
Total copper production in FY2014 increased by two per cent to 1.7 Mt. Escondida copper production increased by two per cent to 1.2 Mt as an improvement in mill throughput and concentrator utilisation offset a nine per cent decline in ore grades. Record mining rates at Olympic Dam underpinned an 11 per cent increase in copper production to 184 kt while Pampa Norte copper production of 233 kt was unchanged from the prior period. Antamina achieved record annual mill throughput and copper production in FY2014.
Copper revenue decreased by US$383 million to US$12.8 billion. Revenue for Escondida decreased by six per cent to US$8.1 billion. The decrease in revenue primarily resulted from a five per cent decline in the average realised price of copper to US$3.22 per pound.
Lower average realised prices reduced Underlying EBIT by US$828 million, net of price-linked costs. In contrast, a stronger US dollar against the Chilean peso and Australian dollar increased Underlying EBIT by US$296 million.
Underlying EBIT for FY2014 decreased by US$365 million to US$4.7 billion. Unit cash costs, which we calculate excluding revenue from by-products, at our operated copper assets declined by six per cent during FY2014 despite the impact of the nine per cent reduction in ore grades at Escondida. Productivity cost efficiencies increased Underlying EBIT by US$186 million and reflected insourcing initiatives and the broader optimisation of contractor activities across the business. A reduction in exploration and business development expenditure increased Underlying EBIT by a further US$214 million as the Group sharpened its focus on greenfield copper porphyry targets in Chile and Peru. In contrast, an increase in non-cash charges reflected a lower capitalisation rate for deferred stripping at Escondida and Pampa Norte, and a general increase in depreciation and amortisation, and reduced Underlying EBIT by US$328 million during the period.
Underlying EBIT of Olympic Dam for FY2014 increased by US$38 million to US$34 million, where costs efficiencies offset the decrease in commodities prices.
At 30 June 2014, the Group had 350 kt of outstanding copper sales that were revalued at a weighted average price of US$3.19 per pound. The final price of these sales will be determined in FY2015. In addition, 386 kt of copper sales from FY2013 were subject to a finalisation adjustment in FY2014. These provisional pricing and finalisation adjustments increased Underlying EBIT by US$73 million in FY2014 (FY2013: US$303 million decrease).
A gain on the sale of the Pinto Valley mining operation and the associated San Manuel Arizona Railroad Company of US$385 million (after tax) was recognised in FY2014 and was reported as an exceptional item.
2.5.8 Iron Ore Business
An analysis of the financial performance of our Iron Ore Business for FY2015 compared to FY2014 is included in section 1.12.4.
Financial information for the Iron Ore Business for FY2015 and FY2014 is presented below.
| | | | | | | | | | | | | | | | | | | | | | | | | | | | | | | | |
Year ended 30 June 2015 US$M | | Revenue | | | Underlying
EBITDA | | | D&A | | | Underlying
EBIT | | | Net
operating
assets | | | Capital
expenditure | | | Exploration
gross | | | Exploration
to profit | |
Western Australia
Iron Ore | | | 14,438 | | | | 8,297 | | | | 1,713 | | | | 6,584 | | | | 22,804 | | | | 1,911 | | | | | | | | | |
Samarco(i) | | | 1,406 | | | | 695 | | | | 118 | | | | 577 | | | | 1,044 | | | | 170 | | | | | | | | | |
Other(ii) | | | 135 | | | | (8 | ) | | | 3 | | | | (11 | ) | | | 106 | | | | 19 | | | | | | | | | |
| | | | | | | | | | | | | | | | | | | | | | | | | | | | | | | | |
Total Iron Ore from Group production | | | 15,979 | | | | 8,984 | | | | 1,834 | | | | 7,150 | | | | 23,954 | | | | 2,100 | | | | | | | | | |
| | | | | | | | | | | | | | | | | | | | | | | | | | | | | | | | |
Third party products(iii) | | | 180 | | | | (10 | ) | | | – | | | | (10 | ) | | | – | | | | – | | | | | | | | | |
| | | | | | | | | | | | | | | | | | | | | | | | | | | | | | | | |
Total Iron Ore | | | 16,159 | | | | 8,974 | | | | 1,834 | | | | 7,140 | | | | 23,954 | | | | 2,100 | | | | 118 | | | | 38 | |
| | | | | | | | | | | | | | | | | | | | | | | | | | | | | | | | |
Adjustment for equity accounted investments(iv) | | | (1,406 | ) | | | (326 | ) | | | (118 | ) | | | (208 | ) | | | – | | | | (170 | ) | | | – | | | | – | |
| | | | | | | | | | | | | | | | | | | | | | | | | | | | | | | | |
Total Iron Ore statutory result | | | 14,753 | | | | 8,648 | | | | 1,716 | | | | 6,932 | | | | 23,954 | | | | 1,930 | | | | 118 | | | | 38 | |
| | | | | | | | | | | | | | | | | | | | | | | | | | | | | | | | |
| | | | | | | | | | | | | | | | | | | | | | | | | | | | | | | | |
Year ended 30 June 2014 (Restated) US$M | | Revenue | | | Underlying
EBITDA | | | D&A | | | Underlying
EBIT | | | Net
operating
assets | | | Capital
expenditure | | | Exploration
gross | | | Exploration
to profit | |
Western Australia
Iron Ore(v) | | | 20,883 | | | | 12,966 | | | | 1,427 | | | | 11,539 | | | | 22,223 | | | | 2,947 | | | | | | | | | |
Samarco(i) | | | 1,634 | | | | 846 | | | | 56 | | | | 790 | | | | 1,072 | | | | 424 | | | | | | | | | |
Other(ii)(v) | | | 130 | | | | (32 | ) | | | 2 | | | | (34 | ) | | | 95 | | | | – | | | | | | | | | |
| | | | | | | | | | | | | | | | | | | | | | | | | | | | | | | | |
Total Iron Ore from Group production | | | 22,647 | | | | 13,780 | | | | 1,485 | | | | 12,295 | | | | 23,390 | | | | 3,371 | | | | | | | | | |
| | | | | | | | | | | | | | | | | | | | | | | | | | | | | | | | |
Third party products(iii) | | | 343 | | | | (3 | ) | | | – | | | | (3 | ) | | | – | | | | – | | | | | | | | | |
| | | | | | | | | | | | | | | | | | | | | | | | | | | | | | | | |
Total Iron Ore | | | 22,990 | | | | 13,777 | | | | 1,485 | | | | 12,292 | | | | 23,390 | | | | 3,371 | | | | 169 | | | | 56 | |
| | | | | | | | | | | | | | | | | | | | | | | | | | | | | | | | |
Adjustment for equity accounted investments(iv) | | | (1,634 | ) | | | (246 | ) | | | (56 | ) | | | (190 | ) | | | – | | | | (422 | ) | | | – | | | | – | |
| | | | | | | | | | | | | | | | | | | | | | | | | | | | | | | | |
Total Iron Ore statutory result | | | 21,356 | | | | 13,531 | | | | 1,429 | | | | 12,102 | | | | 23,390 | | | | 2,949 | | | | 169 | | | | 56 | |
| | | | | | | | | | | | | | | | | | | | | | | | | | | | | | | | |
| (i) | Samarco is an equity accounted investment and is reported on a proportionate consolidation basis (with the exception of net operating assets). This includes the wholly owned Yeelirrie uranium deposit for a final cash considerationholding company of US$430 million.Samarco, which is consolidated. |
On 7 September 2012, we completed the sale
| (ii) | Predominantly comprises divisional activities, towage services, business development and ceased operations. |
| (iii) | Includes inter-segment and external sales of our 37.76 per cent effective interest in Richards Bay Minerals for a final cash consideration of US$1.7 billion.contracted gas purchases. |
On 10 April 2013, we completed the sale of our diamonds business, comprising our interests in the EKATI Diamond Mine and Diamond Marketing operations for an aggregate cash consideration of US$553 million (after adjustments).
On 7 June 2013, we completed the sale of our 8.33 per cent interest in the East Browse Joint Venture and 20 per cent interest in the West Browse Joint Venture to Petrochina International Investment (Australia) Pty Ltd for a consideration of US$1.7 billion.
On 29 April 2013, we announced we had signed a definitive agreement to sell our Pinto Valley mining operation and the associated San Manuel Arizona Railroad Company to Capstone Mining Corp for aggregate cash consideration of US$650 million.
On 20 June 2013, we announced an extension of our long-term joint venture relationship with ITOCHU Corporation (ITOCHU) and Mitsui & Co., Ltd. (Mitsui). This transaction was completed on 10 July 2013 and has aligned interests across the WAIO supply chain. Under the terms of the agreement, ITOCHU and Mitsui invested approximately US$822 million and US$720 million, respectively, in shares and loans of BHP
| (iv) | Total Iron Ore (Jimblebar) Pty Ltd, representing an eight per centsegment Revenue excludes US$1,406 million (2014: US$1,634 million) revenue related to Samarco. Total Iron Ore segment Underlying EBITDA includes US$118 million (2014: US$56 million) D&A and seven per cent interestUS$208 million (2014: US$190 million) net finance costs and taxation expense related to Samarco that are also included in the Jimblebar mining hub and resource. The consideration included a share of capital costs associated with the Jimblebar Mine Expansion project.3.7.6 Dividend and capital management
The Group’s priorities for capital management remain unchanged: firstly,Underlying EBIT. Iron Ore segment Capital expenditure excludes US$170 million (2014: US$422 million) related to invest in high-return growth opportunities throughout the economic cycle; secondly, to maintain a solid ‘A’ credit rating and to grow our progressive dividend; and finally, to return excess capital to shareholders.
The disciplined application of these priorities within the framework of our strategy has not only facilitated strong growth in the business, but has also enabled the Company to return US$59.1 billion to shareholders in the form of dividends and share buy-backs over the last 10 years.
BHP Billiton has a progressive dividend policy. The aim of this policy is to steadily increase or at least maintain our base dividend in US dollars at each half-yearly payment.
On 20 August 2013, the Board declared a final dividend for the year of 59 US cents per share. Together with the interim dividend of 57 US cents per share paid to shareholders on 28 March 2013, this brought the total dividend declared for the year to 116 US cents per share, a 3.6 per cent increase over the previous year’s full-year dividend of 112 US cents per share.
Samarco. |
| | | | | | | | | | | | |
Year ended 30 June | | 2013 | | | 2012 | | | 2011 | |
Dividends declared in respect of the period (US cents per share) | | | | | | | | | | | | |
Interim dividend | | | 57.0 | | | | 55.0 | | | | 46.0 | |
Final dividend | | | 59.0 | | | | 57.0 | | | | 55.0 | |
| | | | | | | | | | | | |
| | | 116.0 | | | | 112.0 | | | | 101.0 | |
| | | | | | | | | | | | |
3.8 Off-balance sheet arrangements and contractual commitments
Information in relation to our material off-balance sheet arrangements, principally contingent liabilities, commitments for capital expenditure and commitments under leases at
| (v) | The 30 June 2013 is provided in note 21 ‘Contingent liabilities’2014 period has been restated to reallocate towage services from Western Australian Iron Ore to Other. |
Year ended 30 June 2014 compared with year ended 30 June 2013
Iron Ore revenue increased by US$2.8 billion to US$21.4 billion. Revenue for WAIO increased by US$2.6 billion, an increase of 13.9 per cent. An 18 per cent increase in WAIO sales volumes was the major contributor, which was partially offset by a six per cent decline in average realised price of iron ore to US$103 per wet metric tonne (FOB).
Iron ore production increased by 20 per cent in FY2014 to a record 204 Mt, exceeding initial full-year guidance by more than eight per cent. WAIO production of 225 Mt (100 per cent basis) represents a fourteenth consecutive annual record and was underpinned by the early commissioning of Jimblebar and our productivity agenda, which raised the capacity of our integrated supply chain.
Underlying EBIT for FY2014 increased by US$993 million to US$12.1 billion. The fall in the average realised price of iron ore reduced Underlying EBIT by US$864 million, net of price-linked costs, although this was partially offset by a weaker Australian dollar which increased Underlying EBIT by US$383 million. Iron ore sales, on average, were linked to the index price for the month of shipment, with price differentials reflecting product quality and the increase in WAIO sales volumes, adding US$1.8 billion to Underlying EBIT. Conversely, the progressive ramp-up of several major projects resulted in a US$425 million increase in
depreciation and amortisation expense during the period. Having redirected the WAIO supply-chain bottleneck away from the mines and back to the port, WAIO unit costs decreased by six per cent in FY2014 to US$27.53 per tonne. A 12 per cent reduction in unit costs to US$25.89 per tonne was achieved in the June 2014 half year.
2.5.9 Coal Business
An analysis of the financial performance of our Coal Business for FY2015 compared to FY2014 is included in section 1.12.5.
Financial information for the Coal Business for FY2015 and FY2014 is presented below.
| | | | | | | | | | | | | | | | | | | | | | | | | | | | | | | | |
Year ended 30 June 2015 US$M | | Revenue | | | Underlying
EBITDA | | | D&A | | | Underlying
EBIT | | | Net
operating
assets | | | Capital
expenditure | | | Exploration
gross | | | Exploration
to profit | |
Queensland Coal | | | 4,221 | | | | 1,006 | | | | 719 | | | | 287 | | | | 9,154 | | | | 599 | | | | | | | | | |
New Mexico | | | 531 | | | | 134 | | | | 47 | | | | 87 | | | | 173 | | | | 20 | | | | | | | | | |
New South Wales Energy Coal(i) | | | 1,225 | | | | 303 | | | | 161 | | | | 142 | | | | 1,322 | | | | 121 | | | | | | | | | |
Colombia(i) | | | 719 | | | | 231 | | | | 105 | | | | 126 | | | | 924 | | | | 73 | | | | | | | | | |
Other(ii) | | | – | | | | (91 | ) | | | 1 | | | | (92 | ) | | | 196 | | | | 17 | | | | | | | | | |
| | | | | | | | | | | | | | | | | | | | | | | | | | | | | | | | |
Total Coal from Group production | | | 6,696 | | | | 1,583 | | | | 1,033 | | | | 550 | | | | 11,769 | | | | 830 | | | | | | | | | |
| | | | | | | | | | | | | | | | | | | | | | | | | | | | | | | | |
Third party products | | | 7 | | | | – | | | | – | | | | – | | | | – | | | | – | | | | | | | | | |
| | | | | | | | | | | | | | | | | | | | | | | | | | | | | | | | |
Total Coal | | | 6,703 | | | | 1,583 | | | | 1,033 | | | | 550 | | | | 11,769 | | | | 830 | | | | 20 | | | | 20 | |
| | | | | | | | | | | | | | | | | | | | | | | | | | | | | | | | |
Adjustment for equity accounted investments (iii) | | | (818 | ) | | | (341 | ) | | | (139 | ) | | | (202 | ) | | | – | | | | (101 | ) | | | – | | | | – | |
| | | | | | | | | | | | | | | | | | | | | | | | | | | | | | | | |
Total Coal statutory result | | | 5,885 | | | | 1,242 | | | | 894 | | | | 348 | | | | 11,769 | | | | 729 | | | | 20 | | | | 20 | |
| | | | | | | | | | | | | | | | | | | | | | | | | | | | | | | | |
| | | | | | | | | | | | | | | | | | | | | | | | | | | | | | | | |
Year ended 30 June 2014 (Restated) US$M | | Revenue | | | Underlying
EBITDA | | | D&A | | | Underlying
EBIT | | | Net
operating
assets | | | Capital
expenditure | | | Exploration
gross | | | Exploration
to profit | |
Queensland Coal | | | 4,666 | | | | 949 | | | | 514 | | | | 435 | | | | 9,115 | | | | 1,790 | | | | | | | | | |
New Mexico | | | 520 | | | | 105 | | | | 46 | | | | 59 | | | | 202 | | | | 26 | | | | | | | | | |
New South Wales Energy Coal(i) | | | 1,350 | | | | 324 | | | | 150 | | | | 174 | | | | 1,392 | | | | 170 | | | | | | | | | |
Colombia(i) | | | 814 | | | | 305 | | | | 85 | | | | 220 | | | | 1,037 | | | | 133 | | | | | | | | | |
Other(ii) | | | – | | | | (166 | ) | | | 2 | | | | (168 | ) | | | 162 | | | | 34 | | | | | | | | | |
| | | | | | | | | | | | | | | | | | | | | | | | | | | | | | | | |
Total Coal from Group production | | | 7,350 | | | | 1,517 | | | | 797 | | | | 720 | | | | 11,908 | | | | 2,153 | | | | | | | | | |
| | | | | | | | | | | | | | | | | | | | | | | | | | | | | | | | |
Third party products | | | 27 | | | | – | | | | – | | | | – | | | | 1 | | | | – | | | | | | | | | |
| | | | | | | | | | | | | | | | | | | | | | | | | | | | | | | | |
Total Coal | | | 7,377 | | | | 1,517 | | | | 797 | | | | 720 | | | | 11,909 | | | | 2,153 | | | | 29 | | | | 29 | |
| | | | | | | | | | | | | | | | | | | | | | | | | | | | | | | | |
Adjustment for equity accounted investments (iii) | | | (814 | ) | | | (259 | ) | | | (114 | ) | | | (145 | ) | | | – | | | | (182 | ) | | | – | | | | – | |
| | | | | | | | | | | | | | | | | | | | | | | | | | | | | | | | |
Total Coal statutory result | | | 6,563 | | | | 1,258 | | | | 683 | | | | 575 | | | | 11,909 | | | | 1,971 | | | | 29 | | | | 29 | |
| | | | | | | | | | | | | | | | | | | | | | | | | | | | | | | | |
| (i) | Newcastle Coal Infrastructure Group and note 22 ‘Commitments’Cerrejón are equity accounted investments and are reported on a proportionate consolidation basis (with the exception of net operating assets). |
| (ii) | Predominantly comprises divisional activities and greenfield projects. |
| (iii) | Total Coal segment Revenue excludes US$818 million (2014: US$814 million) revenue related to the financial statements.3.9 SubsidiariesNewcastle Coal Infrastructure Group and Cerrejón. Total Coal segment Underlying EBITDA includes US$105 million (2014: US$85 million) D&A and US$126 million (2014: US$80 million) net finance costs and taxation expense related party transactions
Subsidiary information
Information about our significant subsidiaries isto Cerrejón, that are also included in note 26 ‘Subsidiaries’Underlying EBIT. Total Coal segment Underlying EBITDA excludes US$34 million (2014: US$29 million) D&A and US$76 million (2014: US$65 million) total EBIT related to the financial statements.
Related party transactions
Related party transactions are outlined in note 32 ‘Related party transactions’Newcastle Coal Infrastructure Group, that is excluded from Underlying EBIT. Coal segment Capital expenditure excludes US$101 million (2014: US$182 million) related to the financial statements.
3.10 Significant changes since the end of the year
On 18 September 2013, the Papua New Guinea (PNG) Parliament passed legislation which has altered the arrangements BHP Billiton reached with Papua New Guinea Sustainable Development Program Limited (PNGSDP)Newcastle Coal Infrastructure Group and the PNG Government upon the transfer of its shareholding in Ok Tedi Mining Limited (OTML) to PNGSDP in February 2002. The consequences of this legislation will be as follows:
repeal of the section of a 2001 Act under which BHP Billiton parties were protected from environmental claims by the PNG Government;
cancellation of the shares which the PNGSDP holds in OTML and replacement with shares issued to the PNG Government;
the mortgage given by PNGSDP over its OTML shares to secure the BHP Billiton indemnity and other similar obligations is declared void and of no legal effect; and
any provision in an agreement which limits a person’s right to take proceedings against a BHP Billiton party is rendered null and void.
BHP Billiton is considering the impact of this legislation. BHP Billiton retains a broad indemnity from PNGSDP and has adequate security to back that indemnity. Based on currently available information, the legislation is unlikely to materially alter BHP Billiton’s exposure arising from its past ownership of the Ok Tedi mine.
Other than the matters outlined above or elsewhere in this Annual Report, no matters or circumstances have arisen since the end of the year that have significantly affected, or may significantly affect, the operations, results of operations or state of affairs of the Group in subsequent accounting periods.
4 Board of Directors and Group Management Committee
4.1 Board of DirectorsCerrejón.
|
Year ended 30 June 2014 compared with year ended 30 June 2013
Metallurgical coal production increased by 26 per cent in FY2014 to a record 38 Mt (BHP Billiton share). Record production and sales volumes at Queensland Coal reflected strong performance across all operations. This included first production from Caval Ridge, the successful ramp-up of Daunia and record production at Peak Downs, Saraji, South Walker Creek and Poitrel.
Energy coal production of 43 Mt for FY2014 increased by six percent from the prior period. Another year of robust performance was underpinned by a fifth consecutive annual production record at New South Wales Energy Coal and record volumes at Cerrejón. Navajo Coal production declined following the permanent closure of three of the five power units at the Four Corners Power Plant.
Coal revenue for FY2014 decreased by US$11 million to US$6.6 billion. The decrease in revenues was driven by a 19 per cent reduction in the average price for hard coking coal and 14 per cent reduction in the average price received for both weak coking coal and thermal coal; this was partially offset by an increase in revenue of 5 per cent for Queensland Coal to US$4.7 billion.
Underlying EBIT for FY2014 increased by US$151 million to US$575 million as productivity volume and cost efficiencies of US$1.1 billion were embedded during the period.
A stronger US dollar against the Australian dollar increased Underlying EBIT by US$403 million. This was offset by the reduction in the average price, which in total, reduced Underlying EBIT by US$1.1 billion, net of price-linked costs.
A sustainable increase in truck and wash plant utilisation rates underpinned the improvement in productivity while a reduction in labour, contractor and maintenance costs was also achieved. Redundancies totalling US$28 million were recognised in FY2014 while an increase in non-cash charges reduced Underlying EBIT by a further US$176 million.
2.5.10 Other Assets
Nickel West production declined by four per cent following the closure of the Perseverance underground mine in November 2013.
Underlying EBIT for FY2014 increased by US$106 million to (US$208) million mainly due to cost efficiencies and a favourable exchange rate movement, which was partially offset by costs associated with the closure of the Perseverance underground mine at Nickel West.
2.5.11 Cash flow analysis
Year ended 30 June 2015 compared with year ended 30 June 2014
An analysis of the cash flow for FY2015 compared to FY2014 is included in section 1.15.4.
Year ended 30 June 2014 compared with year ended 30 June 2013
| | | | | | | | |
Year ended 30 June | | 2014
US$M
Restated | | | 2013
US$M
Restated | |
| | |
Cash generated from operations | | | 29,318 | | | | 27,026 | |
Dividends received | | | 1,264 | | | | 716 | |
Net interest paid | | | (795 | ) | | | (848 | ) |
Taxation paid | | | (6,147 | ) | | | (7,877 | ) |
| | | | | | | | |
Net operating cash flows from Continuing operations | | | 23,640 | | | | 19,017 | |
| | | | | | | | |
Net operating cash flows from Discontinued operations | | | 1,724 | | | | 1,137 | |
| | | | | | | | |
Net operating cash flows | | | 25,364 | | | | 20,154 | |
| | | | | | | | |
Purchases of property plant and equipment | | | (15,224 | ) | | | (21,104 | ) |
Exploration expenditure | | | (986 | ) | | | (1,321 | ) |
Exploration expenditure expensed and included in operating cash flows | | | 698 | | | | 1,026 | |
Purchases of intangibles | | | (192 | ) | | | (380 | ) |
Investment in financial assets | | | (1,168 | ) | | | (455 | ) |
Investment in equity accounted investments | | | (44 | ) | | | (84 | ) |
Net proceeds from investing activities | | | 1,782 | | | | 4,697 | |
| | | | | | | | |
Net investing cash flows from Continuing operations | | | (15,134 | ) | | | (17,621 | ) |
| | | | | | | | |
Net investing cash flows from Discontinued operations | | | (700 | ) | | | (1,105 | ) |
| | | | | | | | |
Net investing cash flows | | | (15,834 | ) | | | (18,726 | ) |
| | | | | | | | |
Net (repayment of)/proceeds from interest bearing liabilities | | | (1,011 | ) | | | 7,255 | |
Dividends paid | | | (6,506 | ) | | | (6,945 | ) |
Contributions from non-controlling interests | | | 1,435 | | | | 73 | |
Other financing activities | | | (354 | ) | | | (433 | ) |
| | | | | | | | |
Net financing cash flows from Continuing operations | | | (6,436 | ) | | | (50 | ) |
| | | | | | | | |
Net financing cash flows from Discontinued operations | | | (32 | ) | | | (148 | ) |
| | | | | | | | |
Net financing cash flows | | | (6,468 | ) | | | (198 | ) |
| | | | | | | | |
Net increase in cash and cash equivalents from Continuing operations | | | 2,070 | | | | 1,346 | |
| | | | | | | | |
Net increase/(decrease) in cash and cash equivalents from Discontinued operations | | | 992 | | | | (116 | ) |
| | | | | | | | |
Net operating cash flows after interest and tax increased by 24 per cent to US$23.6 billion in FY2014. A US$2.3 billion increase in cash generated from operations (after changes in working capital balances) and a US$1.7 billion decrease in net taxes paid were the major contributors to the increase. The decrease in net taxes paid was attributed to lower income tax payments in the year of US$798 million in line with our lower effective tax rate and income tax refunds of US$848 million.
Net investing cash outflows decreased by US$2.5 billion to US$15.1 billion during the period. This reflected a US$5.9 billion reduction in capital and exploration expenditure partially offset by a decline in proceeds from asset sales of US$2.9 billion. Expenditure on major growth projects totalled US$13.0 billion, including US$5.6 billion on petroleum projects and US$7.4 billion on minerals projects. Sustaining capital expenditure and other items totalled US$2.2 billion. Exploration expenditure was US$986 million, including US$698 million classified within net operating cash flows.
Net financing cash flows of US$6.4 billion included the proceeds from interest bearing liabilities and contributions from non-controlling interests of US$1.4 billion. The contributions from non-controlling interests was due to the sale of shares in BHP Iron Ore (Jimblebar) Pty Ltd to ITOCHU and Mitsui of eight and seven percent, respectively, in the Jimblebar mining hub and resource. Proceeds from interest bearing liabilities included the issuance of a four tranche Global Bond of US$5.0 billion. These inflows were more than offset by debt repayments of US$7.0 billion and dividend payments to our shareholders of US$6.4 billion.
2.5.12 Net debt and sources of liquidity
Year ended 30 June 2015 compared with year ended 30 June 2014
An analysis of the gearing and net debt for FY2015 compared to FY2014 is included in section 1.15.5.
Year ended 30 June 2014 compared with year ended 30 June 2013
Gearing and net debt
Net debt, comprising Interest bearing liabilities less Cash and cash equivalents, was US$25.8 billion, which represented a decrease of US$1.7 billion compared with the net debt position at 30 June 2013. Gearing, which is the ratio of net debt to net debt plus net assets, was 23.2 per cent at 30 June 2014, compared with 26.8 per cent at 30 June 2013. IFRS 5/AASB 5 ‘Non-current Assets Held for Sale and Discontinued Operations’ does not require the Consolidated Balance Sheet to be restated for comparative periods. The FY2014 and FY2013 figures therefore includes assets and liabilities of the Businesses demerged with South32. For information relating to Discontinued operations refer to note 29 ‘Discontinued operations’ to the Financial Statements.
Cash at bank and in hand less overdrafts at 30 June 2014 was US$8.8 billion compared with US$5.7 billion at 30 June 2013. Included within this were short-term deposits at 30 June 2014 of US$7.1 billion compared with US$3.2 billion at 30 June 2013.
Funding sources
During FY2014, the Group issued a four tranche Global Bond totalling US$5.0 billion comprising US$500 million Senior Floating Rate Notes due 2016 paying interest at three month US dollar LIBOR plus 25 basis points, US$500 million 2.050 per cent Senior Notes due 2018, US$1.5 billion 3.850 per cent Senior Notes due 2023, and US$2.5 billion 5.000 per cent Senior Notes due 2043.
3 Corporate Governance Statement
3.1 Governance at BHP Billiton
Dear Shareholder
At BHP Billiton, we have a governance framework that goes beyond an interest in governance for its own sake or the need to comply with regulatory requirements. We believe that high-quality governance supports long-term value creation. Simply put, we think good governance is good business, and our approach is to adopt what we consider to be the best of the prevailing governance standards in Australia, the United Kingdom and the United States.
In the same spirit, we do not see governance as just a matter for the Board. Good governance is also the responsibility of executive management and is embedded throughout the organisation.
The diagram on the following page describes the governance framework at BHP Billiton. It shows the interaction between the shareholders and the Board, demonstrates how the Board Committee structure facilitates the relationship between the Board and the Chief Executive Officer (CEO) and illustrates the flow of delegation from shareholders. We have robust processes in place to ensure that the delegation flows through the Board and its committees to the CEO and Group Management Committee (GMC) and into the organisation. At the same time, accountability flows upwards from the Company to shareholders. This process helps to ensure alignment with shareholders.
As part of our corporate planning cycle, we include a range of scenarios that are reviewed annually and updated by the Group with executive management involvement. The scenarios, and the governance process supporting them, also form part of the Board agenda.
These scenarios provide a lens to assess the performance of our business portfolio. They include assumptions around commodity prices, currencies, costs, tax rates and the price of carbon and ranges for a number of risks the Group faces. These include global growth, levels of trade, geopolitical situations, climate change and technology. All of the scenarios are used to inform BHP Billiton’s strategy and the resilience of our diversified asset portfolio over the short and long term.
Regardless of which direction the world may take, we will always be guided byOur BHP Billiton Chartervalues, including our value of Sustainability, in how we operate our business, interact with our stakeholders and plan for the future.
Our Charter is core to the governance framework of BHP Billiton. It embodies our corporate purpose, strategy and values, and defines when we are successful. We foster a culture that values and rewards high ethical standards, personal and corporate integrity and respect for others.
We live the values ofOur Charter and adhere to the standards of conduct required by our BHP BillitonCode of Business Conduct.
BHP Billiton governance structure
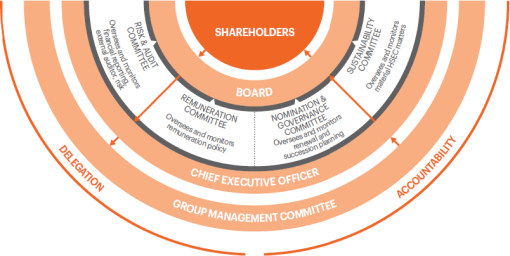
Sir John Buchanan
On 13 July 2015, Sir John Buchanan sadly passed away after an illness. Sir John was a Director of BHP Billiton from February 2003 until the time of his death. He provided wise counsel to his fellow Directors and to management. He made an invaluable contribution as a Director having regard to his long-standing relationships in the investor community, his strategic approach and his financial and business acumen. His many years of experience gave him great insight and perspective when addressing key governance issues. He was a true gentleman and all of us at BHP Billiton miss him greatly.
Ongoing renewal
As noted in last year’s Annual Report, David Crawford retired from the Board at the 2014 BHP Billiton Limited Annual General Meeting (AGM). This followed his appointment as Chairman-designate of South32. Following shareholder approval for the demerger, Keith Rumble also became a Non-executive Director of South32. He retired from the Board of BHP Billiton with effect from 22 May 2015.
On 14 August 2015, we announced that Carlos Cordeiro would be retiring from the Board after the 2015 AGMs. On behalf of all shareholders, I thank Carlos for his service to the Board and the Group over many years, and wish him all the best for the future. We also announced that Anita Frew had been appointed to the Board effective 15 September 2015. Anita has over 18 years’ experience as a director and chairman on public company boards across a range of global sectors, including chemicals, engineering and finance. She is currently Deputy Chairman of Lloyds Banking Group and Chairman of Croda International Plc, the speciality chemicals group. Her appointment reflects the structured and rigorous approach adopted by BHP Billiton to Board succession planning, having regard to the skills, experience and attributes required to effectively govern and manage risk within the business.
We also announced in August 2015 that Shriti Vadera had been appointed as Senior Independent Director of BHP Billiton Plc. The Board believes that Shriti’s skills and attributes, as well as her experience with BHP Billiton over the past four years, will enable her to support the Chairman and the Board in this important governance role. It was also announced that Shriti had been appointed a member of the Nomination and Governance Committee.
A number of other changes were made to the composition of our Board committees during FY2015. Sir John Buchanan stepped down from his role as Chairman of the Remuneration Committee, but remained a member of
that Committee. Carolyn Hewson was appointed Chairman of the Remuneration Committee with effect from 1 January 2015. At the same time, Carolyn stepped down from the Risk and Audit Committee, and Malcolm Broomhead joined the Risk and Audit Committee. Pat Davies was appointed to the Sustainability Committee also with effect from 1 January 2015 and Keith Rumble left the Sustainability Committee at the time he retired from the Board. Further information is set out in section 3.14 of this Annual Report.
In relation to gender diversity, the Board set a goal of increasing the number of women on the Board to at least three. With the appointment of Anita Frew, who joined the Board on 15 September 2015, that goal was met. More details about the Board’s diversity of skills and experience are set out in section 3.8 of this Annual Report.
Continuous improvement
The Board has a commitment to ongoing improvement. This year, the Board undertook a review of the Finance Committee and it was decided that with effect from 1 January 2015, a separate focused committee was no longer required by the Board. The work around capital management (funding, liquidity, balance sheet management and dividends) has become part of the terms of reference for the Risk and Audit Committee. Given the established capital prioritisation process, it is considered appropriate that decisions on investments and divestments remain with the full Board, subject to future delegation.
In addition, we conducted an internal review of compliance with theBoard Governance Document and an externally facilitated evaluation of the Board committees and individual Directors. The assessments determined that each of the committees continues to function effectively. Potential enhancements related to continuing to ensure that the Board, the Group and its systems and processes are right-sized for a simplified BHP Billiton following the demerger of South32. Further information, including outcomes of the Board committee evaluation and the Director assessment, is set out in sections 3.11 and 3.14.
I hope you find this description of our corporate governance useful and look forward to receiving any feedback that fellow shareholders may have.
Jac Nasser AO
Chairman
10 September 2015
3.2 Board of Directors and Group Management Committee
3.2.1 Board of Directors
Jac NasserAO, BBus, Hon DT, 6567
Chairman and Independent Non-executive Director
Director of BHP Billiton Limited and BHP Billiton Plc since June 2006. Appointed Chairman of BHP Billiton Limited and BHP Billiton Plc on 31 March 2010.
Skills and experience:
Following a 33-year career with Ford Motor Company in leadership positions in Europe, Australia, Asia, South America and the United States, Mr Nasser served as a member of the Board of Directors and as President and Chief Executive Officer of Ford Motor Company from 1998 to 2001. He has more than three decades of experience in large-scale global businesses and a decade of private equity investment and operating expertise.
Other directorships and offices (current and recent):
Member of Australian Prime Minister’s Business Advisory Council (since December 2013).
Director of 21st Century Fox (since June 2013).
Director of Koç Holding A.Ş. (since March 2015).
Former Non-executive advisory partner (since March 2010) ofConsultant (March 2010 to August 2014) to One Equity Partners (Partner from November 2002 until March 2010).
Member of the International Advisory Council of Allianz Aktiengesellschaft (since February 2001).
Former Director of British Sky Broadcasting Group plc (from November 2002 to November 2012).
Board Committee membership:
Chairman of the Nomination and Governance Committee.
Andrew MackenzieBSc (Geology), PhD (Chemistry), 5658
Non-independent
Director of BHP Billiton Limited and BHP Billiton Plc since May 2013. Mr Mackenzie was appointed Chief Executive Officer on 10 May 2013.
Skills and experience:
Mr Mackenzie has over 30 years’ experience in oil and gas, petrochemicals and minerals. He joined BHP Billiton in November 2008 as Chief Executive Non-Ferrous and commenced as Chief Executive Officer in May 2013. Prior to BHP Billiton, Mr Mackenzie worked at Rio Tinto, where he was Chief Executive of Diamonds and Minerals, and BP, where he held a number of senior roles, including Group Vice President for Technology and Engineering, and Group Vice President for Chemicals.
Other directorships and offices (current and recent):
Director of the Grattan Institute (since May 2013).
Director of the International Council on Mining and Metals (since May 2013).
Former Non-executive Director of Centrica plc (from September 2005 to May 2013).
Board Committee membership:
None.
Marius KloppersMalcolm Brinded BE (Chem), MBA, PhD (Materials Science), 51MA, 62
Term of office:Independent Non-executive Director
Director of BHP Billiton Limited and BHP Billiton Plc from January 2006 to May 2013. since April 2014.
Skills and experience:
Mr Kloppers resignedBrinded has extensive experience in energy, governance and sustainability. He served as a Director on 10 May 2013. Mr Kloppers was Chief Executive Officer from 1 October 2007 to 10 May 2013.
Skills and experience: Mr Kloppers has extensive knowledgemember of the mining industry andBoard of BHP Billiton’s operations. ActiveDirectors of Royal Dutch Shell plc from 2002 to 2012. During his 37-year career with Shell, Mr Brinded held various leadership positions in the miningUnited Kingdom, Europe, the Middle East and resources industry since 1993, he was appointed Chief Commercial Officer in December 2003 and Group President Non-Ferrous Materials andAsia, including Executive Director in January 2006.of Exploration and Production, Executive Director of Upstream International and Chairman and Upstream Managing Director of Shell UK.
Other directorships and offices (current and recent):
Former Director of Royal Dutch Shell plc (from July 2002 to March 2012, including as a Director of Royal Dutch Petroleum and Shell Transport and Trading Ltd prior to unification of Shell’s corporate structure).
Former Director of Shell Petroleum N.V. (from July 2002 to March 2012).
Director of CH2M Hill Companies, Ltd (since July 2012).
Director of Network Rail Ltd; Network Rail Infrastructure Ltd (since October 2010).
Chairman of the International Council on MiningShell Foundation (from July 2009 and MetalsTrustee from June 2004).
Vice President of The Energy Institute, UK (from October 2011 to May 2013) and former Deputy Chairman (from October 2008 to October 2011).
Board Committee membership:
Member of the Sustainability Committee.
Malcolm BroomheadMBA, BE, 6163
Independent Non-executive Director
Director of BHP Billiton Limited and BHP Billiton Plc since March 2010.
Skills and experience:
Mr Broomhead has extensive experience in running industrial and mining companies with a global footprint and broad global experience in project development in many of the countries in which BHP Billiton operates. Mr BroomheadHe was Managing Director and Chief Executive Officer of Orica Limited from 2001 until September 2005. Prior to joining Orica, Mr Broomhead held a number of senior positions at North Limited, including Managing Director and Chief Executive Officer and, prior to that, held senior management positions with Halcrow (UK), MIM Holdings, Peko Wallsend and Industrial Equity.
Other directorships and offices (current and recent):
Chairman of Asciano Limited (since October 2009).
Former Director of Coates Group Holdings Pty Ltd (from January 2008 to July 2013).
Director of the Walter and Eliza Hall Institute of Medical Research (since July 2014).
Board Committee membership:
Member of the Sustainability Committee.
Member of the Finance Committee.
Sir John Buchanan BSc, MSc (Hons 1), PhD, 70
Senior Independent Director, BHP Billiton Plc
Director of BHP Billiton LimitedRisk and BHP Billiton Plc since February 2003.
Skills and experience: Educated at Auckland, Oxford and Harvard, Sir John has broad international business experience gained in large and complex international businesses. He has substantial experience in the petroleum industry and knowledge of the international investor community. Sir John has held various leadership roles in strategic, financial, operational and marketing positions, including executive experience in different countries. He is a former Executive Director and Group Chief Financial Officer of BP, Treasurer and Chief Executive of BP Finance and Chief Operating Officer of BP Chemicals.
Other directorships and offices (current and recent):
Chairman of ARM Holdings Plc (UK) (since May 2012).
Chairman of Smith & Nephew Plc (since April 2006) and former Deputy Chairman (from February 2005 to April 2006).
Chairman of the International Chamber of Commerce (UK) (since May 2008).
Member of Advisory Board of Ondra Bank (since June 2009).
Chairman of the UK Trustees for the Christchurch Earthquake appeal.
Former Deputy Chairman and Senior Independent Director of Vodafone Group Plc (from July 2006 to July 2012) and Director (from April 2003 to July 2012).
Former Director of AstraZeneca Plc (from April 2002 to April 2010).
Board Committee membership:
Chairman of the Remuneration Committee.
Member of the Nomination and GovernanceAudit Committee.
Carlos Cordeiro AB, MBA, 5759
Independent Non-executive Director
Director of BHP Billiton Limited and BHP Billiton Plc since February 2005.
Skills and experience:
Mr Cordeiro brings to the Board more than 30 years’ experience in providing strategic and financial advice to corporations, financial institutions and governments around the world. Mr CordeiroHe was previously Partner and Managing Director of Goldman Sachs Group Inc and Vice Chairman of Goldman Sachs (Asia) LLC.
Other directorships and offices (current and recent):
Advisory Director of The Goldman Sachs Group Inc (since December 2001).
Non-executive Vice Chairman of Goldman Sachs (Asia) LLC (since December 2001).
Board Committee membership:
Member of the Remuneration Committee.
David Crawford AO, BComm, LLB, FCA, FCPA, 69
Independent Non-executive Director
Director of BHP Limited since May 1994. Director of BHP Billiton Limited and BHP Billiton Plc since June 2001.
Skills and experience: Mr Crawford has extensive experience in risk management and business reorganisation. He has acted as a consultant, scheme manager, receiver and manager and liquidator to very large and complex groups of companies. Mr Crawford was previously Australian National Chairman of KPMG, Chartered Accountants.
Other directorships and offices (current and recent):
Chairman of Australia Pacific Airports Corporation Limited (since May 2012).
Chairman of Lend Lease Corporation Limited (since May 2003) and Director (since July 2001).
Former Chairman (from November 2007 to December 2011) and former Director (from August 2001 to December 2011) of Foster’s Group Limited.
Board Committee membership:
Chairman of the Finance Committee.
Pat DaviesBSc (Mechanical Engineering), 6264
Independent Non-executive Director
Director of BHP Billiton Limited and BHP Billiton Plc since June 2012.
Skills and experience:
Mr Davies has broad experience in the natural resources sector across a number of geographies, commodities and markets. From July 2005 until June 2011, Mr Davieshe was Chief Executive of Sasol Limited, an international energy, chemical and mining company with operations in 38 countries and listings on the Johannesburg and New York stock exchanges. Mr Davies began his career at Sasol in 1975 and held a number of diverse roles, including managing the group’sgroup���s oil and gas businesses, before becoming Chief Executive in July 2005. He is a former Director of various Sasol Group companies and joint ventures.
Other directorships and offices (current and recent):
Former Director (from August 1997 to June 2011) and Chief Executive (from July 2005 to June 2011) of Sasol Limited.
Board Committee membership:
Member of the Remuneration Committee.
Member of the Sustainability Committee.
Anita FrewBA (Hons), MRes, Hon. D.Sc, 58
Independent Non-executive Director
Director of BHP Billiton Limited and BHP Billiton Plc since September 2015.
Skills and experience:
Ms Frew has extensive board, strategy, marketing, governance and risk management experience in the chemicals, engineering, water and finance industries. She is the Chairman of Croda International Plc and Deputy Chairman of Lloyds Banking Group. She was until recently the Chairman of Victrex PLC, Senior Independent Director of Aberdeen Asset Management Plc and IMI Plc and a Non-executive Director of Northumbrian Water.
Other directorships and offices (current and recent):
Chairman of Croda International Plc (since September 2015; Chairman Designate since March 2015).
Deputy Chairman of Lloyds Banking Group (since December 2010).
Former Senior Independent Director of Aberdeen Asset Management Plc (from October 2004 to September 2014).
Former Senior Independent Director of IMI Plc (from March 2006 to May 2015).
Former Chairman of Victrex Plc (from 2008 to October 2014).
Carolyn Hewson AO, BEc (Hons), MA (Econ), 5860
Independent Non-executive Director
Director of BHP Billiton Limited and BHP Billiton Plc since March 2010.
Skills and experience:
Ms Hewson is a former investment banker and has over 30 years’ experience in the finance sector. Ms HewsonShe was previously an Executive Director of Schroders Australia Limited and has extensive financial markets, risk
management and investment management expertise. Ms Hewson is a former Director of BT Investment Management Limited, Westpac Banking Corporation, AMP Limited, CSR Limited, AGL Energy Limited, the Australian Gas Light Company, South Australian Water and the Economic Development Board of South Australia.
Other directorships and offices (current and recent):
Member of Federal Government Growth Centres Advisory Committee (from January 2015).
Director of Stockland Group (since March 2009).
Director of BT Investment Management LimitedTrustee Westpac Foundation (since December 2007)May 2015).
Member of Australian Federal Government Financial Systems Inquiry (from January 2014 to December 2014).
Former Member of the Advisory Board of Nanosonics Limited (since(from June 2007)2007 to August 2015).
Former Director of BT Investment Management Limited (from December 2007 to December 2013).
Former Director of Australian Charities Fund Operations Limited (since(from June 2000)2000 to February 2014).
Former Director and Patron of the Neurosurgical Research Foundation (since(from April 1993)1993 to December 2013).
Former Trustee and Chairman of Westpac Buckland Fund (since(from January 2011)2011 to December 2013) and Chairman of Westpac Matching Gifts Limited (since(from August 2011)2011 to December 2013), together known as the Westpac Foundation.
Former Director of Westpac Banking Corporation (from February 2003 to June 2012).
Board Committee membership:
MemberChairman of the Risk and AuditRemuneration Committee.
Lindsay MaxstedDipBus (Gordon), FCA, FAICD, 5961
Independent Non-executive Director
Director of BHP Billiton Limited and BHP Billiton Plc since March 2011.
Skills and experience:
Mr Maxsted is a corporate recovery specialist who has managed a number of Australia’s largest corporate insolvency and restructuring engagements and, until recently,2011, continued to
undertake consultancy work in the restructuring advisory field. He was the Chief Executive Officer of KPMG Australia between 2001 and 2007. Mr Maxsted is the Board’s nominated ‘audit committee financial expert’ for the purposes of the US Securities and Exchange Commission Rules, and the Board is satisfied that he has recent and relevant financial experience for the purposes of the UK Financial Conduct Authority’s Disclosure and Transparency Rules and the UK Corporate Governance Code.
Other directorships and offices (current and recent):
Chairman of Westpac Banking Corporation (since December 2011) and a Director (since March 2008).
Chairman of Transurban Group (since August 2010) and a Director (since March 2008).
Director and Honorary Treasurer of Baker IDI Heart and Diabetes Institute (since June 2005).
Board Committee membership:
Chairman of the Risk and Audit Committee.
Member of the Finance Committee.
Wayne MurdyBSc (Business Administration), CPA, 6971
Independent Non-executive Director
Director of BHP Billiton Limited and BHP Billiton Plc since June 2009.
Skills and experience:
Mr Murdy has a background in finance and accounting, where he has gained comprehensive experience in the financial management of mining, oil and gas companies during his career with Getty Oil, Apache Corporation and Newmont Mining Corporation. He served as the Chief Executive Officer of Newmont Mining Corporation from 2001 to 2007 and Chairman from 2002 to 2007. Mr Murdy is also a former Chairman of the International Council on Mining and Metals, a former Director of the US National Mining Association and a former member of the Manufacturing Council of the US Department of Commerce.
Other directorships and offices (current and recent):
Director of Weyerhaeuser Company (since January 2009).
Former Director of Qwest Communications International Inc (from September 2005 to April 2011).
Board Committee membership:
Member of the Risk and Audit Committee.
Member of the Finance Committee.
Keith Rumble BSc, MSc (Geology), 59
Independent Non-executive Director
Director of BHP Billiton Limited and BHP Billiton Plc since September 2008.
Skills and experience: Mr Rumble was previously Chief Executive Officer of SUN Mining, a wholly owned entity of the SUN Group, a principal investor and private equity fund manager in Russia, India and other emerging and transforming markets. Mr Rumble has over 30 years’ experience in the resources industry, specifically in titanium and platinum mining, and is a former Chief Executive Officer of Impala Platinum (Pty) Ltd and former Chief Executive Officer of Rio Tinto Iron and Titanium Inc in Canada. Mr Rumble began his career at Richards Bay Minerals in 1980 and held various management positions before becoming Chief Executive Officer in 1996.
Other directorships and offices (current and recent):
Director of Enzyme Technologies (Pty) Limited (since September 2011).
Director of Elite Wealth (Pty) Limited (since August 2010).
Board of Governors of Rhodes University (since April 2005).
Trustee of the World Wildlife Fund, South Africa (since October 2006).
Former Director of Aveng Group Limited (from September 2009 to December 2011).
Board Committee membership:
Member of the Sustainability Committee.
John SchubertAO, BCh Eng, PhD (Chem Eng), 7072
Independent Non-executive Director
Director of BHP Limited since June 2000 and a Director of BHP Billiton Limited and BHP Billiton Plc since June 2001.
Skills and experience:
Dr Schubert has considerable experience in the international oil industry, including at Chief Executive Officer level. Dr SchubertHe has had executive mining and financial responsibilities and was Chief Executive Officer of Pioneer International Limited for six years, where he operated in the building materials industry in 16 countries. Dr Schubert has experience in mergers, acquisitions and divestments, project analysis and management. He was previously Chairman and Managing Director of Esso Australia Limited and President of the Business Council of Australia.
Other directorships and offices (current and recent):
Chairman of Garvan Institute of Medical Research (since May 2013).
Former Chairman of G2 Therapies Pty Limited (from November 2000 to April 2013).
Former Director of Qantas Airways Limited (from October 2000 to November 2012).
Former Chairman (from November 2004 to February 2010) and Director (from October 1991 to February 2010) of Commonwealth Bank of Australia.
Former Chairman and Director of Worley Parsons Limited (from November 2002 to February 2005).
Board Committee membership:
Chairman of the Sustainability Committee.
Member of the Remuneration Committee.
Member of the Nomination and Governance Committee.
Baroness Shriti VaderaMA, 5153
SeniorIndependent Non-executive Director, BHP Billiton Plc
Director of BHP Billiton Limited and BHP Billiton Plc since January 2011.
Skills and experience:
Baroness Vadera brings wide-ranging experience in finance, economics and public policy as well as extensive experience of emerging markets and international institutions. In recent years, sheShe is Chairman of Santander UK and has undertakenbeen a numberDirector of international assignments, including advisingAstraZeneca since 2011. She was an investment banker with S G Warburg / UBS from 1984 to 1999, on the Council of Economic Advisers, HM Treasury 1999 to 2007, Minister in the UK Department of International Development in 2007, Minister in the Cabinet Office and Business Department 2008 to 2009 with responsibility for dealing with the financial crisis, G20 Adviser 2009 to 2010, and advised governments, banks and investors on the Eurozone crisis, banking sector, debt restructuring and working with the Korean chair of the G20. Baroness Vadera was a Minister in the British Governmentmarkets from 20072010 to 2009 in the Department for International Development, the Business Department and the Cabinet Office, where she was responsible for the response to the global financial crisis. She was on the Council of
2014.Economic Advisers, HM Treasury from 1999 to 2007 focusing on business and international economic issues. Prior to her time in the British Government, Baroness Vadera spent 14 years in investment banking at UBS Warburg, where she specialised in advisory work in emerging markets.
Other directorships and offices (current and recent):
Chairman of Santander UK Plc (since March 2015).
Director of AstraZeneca Plc (since January 2011).
Former Trustee of Oxfam (from 2000 until 2005).
Board Committee membership:
Member of the Nomination and Governance Committee
Member of the Remuneration Committee.
Member of the Risk and Audit Committee.
Jane McAloonMargaret Taylor BEc (Hons),BA, LLB, GDipGov, FCIS, 4955
President, Governance and Group Company Secretary and Chairman of the Disclosure Committee
Skills and experience:Ms McAloonTaylor was appointed to the Group Management Committee as President, Governance and Group Company Secretary in May 2013 after serving asof BHP Billiton effective June 2015. Previously she was Group Company Secretary since July 2007. Ms McAloon joinedof Commonwealth Bank of Australia, and before joining the BHP Billiton Group in September 2006 as Company Secretary for BHP Billiton Limited. Prior to joining BHP Billiton, sheBank, held the position of Group General Counsel and Company Secretary of Boral Limited. Prior to that, Ms Taylor was Regional Counsel Australia/Asia with BHP Billiton, and Group Manager Externalearlier, a partner with law firm Minter Ellison, specialising in corporate and Regulatory Services in the Australian Gas Light Company. She previously held various Australian State and Commonwealth government positions, including Director General of the New South Wales Ministry of Energy and Utilities and Deputy Director General for the New South Wales Cabinet Office, as well as working in private legal practice.securities laws. She is a Non-executive Director of Energy Australia, a Fellow of the Governance Institute of Chartered Secretaries and a Director of the Australian War Memorial.Australia.
4.23.2.2 Group Management Committee
Andrew Mackenzie BSc (Geology), PhD (Chemistry), 5658
Chief Executive Officer and Executive Director
Chairman of the Group Management Committee
Mr Mackenzie commenced as Chief Executive Officerhas over 30 years’ experience in May 2013.oil and gas, petrochemicals and minerals. He joined BHP Billiton in November 2008 as Chief Executive Non-Ferrous.Non-Ferrous and commenced as Chief Executive Officer in May 2013. Prior to BHP Billiton, heMr Mackenzie worked at Rio Tinto, where he was Chief Executive of Diamonds and Minerals, and BP, where he held a number of senior roles, including Group Vice President for Technology and Engineering, and Group Vice President for Chemicals.
Peter Beaven BAcc, CA, 46
President, Copper48
Chief Financial Officer
Member of the Group Management Committee
Mr Beaven was appointed President, CopperChief Financial Officer in May 2013.October 2014. Previously he was the President of Base MetalsCopper and prior to that appointment in November 2010,May 2013, President of Base Metals. Mr Beaven was previously the President of BHP Billiton’s Manganese business,Business, and Vice President and Chief Development Officer for Carbon Steel Materials. Mr Beavan joined BHP Billiton in 2003. He has wide experience across a range of regions and businesses in BHP Billiton, UBS Warburg, Kleinwort Benson and UBS Warburg.PricewaterhouseCoopers.
Tim CuttTony Cudmore BA (Politics and Economics), BSc, 53
President, Petroleum and Potash (since 2 July 2013)46
Chief Public Affairs Officer
Member of the Group Management Committee
Mr Cudmore joined BHP Billiton as President, Corporate Affairs in March 2014. Mr Cudmore’s title changed to Chief Public Affairs Officer effective 1 July 2015. Prior to BHP Billiton, Mr Cudmore worked with ExxonMobil for 13 years and held a wide range of senior and global Corporate Affairs roles in Australia and the United States. Before joining ExxonMobil, Mr Cudmore was a Media Relations and Policy Adviser before becoming Principal Adviser to then Premier of Victoria, The Hon Jeff Kennett MP, followed by his role as Assistant Director of the Australian Institute of Petroleum.
Tim Cutt BS (Petroleum Engineering), 55
President, Petroleum
Member of the Group Management Committee
Mr Cutt was appointed President, Petroleum and Potash in July 2013. He joined BHP Billiton in 2007 as the President of the Production Division in the Petroleum business. Mr Cutt was appointed to the position of
President, Diamonds and Specialty Products in 2011.2011 – a role that included responsibility for Potash. He has over 30 years’ experience in the resources industry. Before joining BHP Billiton, Mr Cutt had a successful 24-year careerheld positions in engineering, operations and senior management with Mobil Oil Corporation and then ExxonMobil, where he was President Hibernia Management and Development Company in roles of significant oilCanada and gas responsibility, including President of ExxonMobil de Venezuela and President of Hibernia Management and Development Company.Venezuela.
Dean Dalla Valle MBA, 54
President, Coal56
Chief Commercial Officer
Member of the Group Management Committee
Mr Dalla Valle was appointed President, CoalHSE, Marketing & Technology in May 2013.January 2015. Mr Dalla Valle’s title changed to Chief Commercial Officer effective 1 July 2015. He has 3638 years’ experience in BHP Billiton, having joined the Group in January 1977.Billiton. Mr Dalla Valle was previously the President of the Coal Business, President of the Uranium business for three years and prior to that held the positions of Asset President, Olympic Dam, Asset President of the Cannington silver mine and Vice President Ports for Iron Ore. He was also the General Manager of the Appin, Tower and Westcliff Collieries for Illawarra Coal.
Mike FraserGeoff Healy BCom, MBL, 48
President, Human Resources (since 27 August 2013)BEc, LLB, 49
Chief Legal Counsel
Member of the Group Management Committee
Mr Fraser joined the Group Management Committee in August 2013 as President, Human Resources. He was previously Head of Group Human Resources. Before becoming Head of Human Resources, Mike was Asset President Mozal, based in Mozambique. He joined the Group in 1999. His previous roles with the Group included Human Resources Vice President for the Aluminium and Energy Coal businesses and for South Africa.
Geoff Healy BEc , LLB , 47
Chief Legal Counsel
Member of the Group Management Committee
Mr Healy joined BHP Billiton as Chief Legal Counsel in June 2013. Prior to BHP Billiton, Mr Healy was a partner at Herbert Smith Freehills for 16 years, and a member of its globalGlobal Partnership Council, and worked widely across its network of Australian and international offices. His core field of expertise is complex corporate and regulatory advisory work, risk management, investigations and disputes.
Mike Henry BSc (Chem), 4749
President, HSEC, Marketing and TechnologyCoal
Member of the Group Management Committee
Mr Henry joined the GroupBHP Billiton in 2003 and was appointedhas served as President, HSEC, Marketing and Technology in May 2013.Coal since January 2015. Prior to this, he was ChiefPresident, HSE, Marketing Officer.& Technology. His earlier career with BHP Billiton included various business development and marketing roles, including Chief Marketing Officer, Marketing Director for Petroleum, Marketing Director for Energy Coal and Freight and Vice President, Business Development for the Energy Coal Customer Sector Group.Business. Prior to joining BHP Billiton, Mr Henry worked for Mitsubishi Corporation, where he held a number of commercial roles.
Graham KerrDaniel Malchuk BBus, FCPA, 42
Chief Financial Officer and Chairman of the Investment Committee and Financial Risk Management CommitteeBEng, MBA, 49
President, Copper
Member of the Group Management Committee
Mr Kerr joined the Group in 1994 and was appointed Chief Financial Officer in November 2011. Prior to this, he was President of Diamonds and Specialty Products. Mr Kerr has worked in a wide range of finance, treasury and operational roles across the Group, and has held the positions of Chief Financial Officer of Stainless Steel Materials, Vice President, Finance – BHP Billiton Diamonds and Finance Director for EKATI. In 2004, Mr Kerr left BHP Billiton for a two-year period, when he was General Manager Commercial for Iluka Resources Ltd.
Jane McAloon BEc (Hons), LLB, GDipGov, FCIS, 49
President, Governance and Group Company Secretary and Chairman of the Disclosure Committee
Member of the Group Management Committee
Ms McAloon was appointed to the Group Management Committee as President, Governance and Group Company Secretary in May 2013, after serving as Group Company Secretary since July 2007. Ms McAloon joined the BHP Billiton Group in September 2006 as Company Secretary for BHP Billiton Limited.
Daniel Malchuk BEng, MBA, 48
President, Aluminium, Manganese and Nickel
Member of the Group Management Committee
Mr Malchuk was appointed President, Copper in March 2015. Previously, he was the President of Aluminium, Manganese and Nickel and prior to that appointment in May 2013. Previously, he was the2013, President of Minerals Exploration, a position he held from July 2012. He worked for the Company between 1996 and 1998 in BHP Copper, in the United States, and has held a number of roles in the Base Metals business since he rejoined BHP Billiton in 2002. In 2006, he took the role of Asset Leader Joint Ventures and a year later was appointed Vice President Strategy and Development in Base Metals.
Athalie Williams BA (Hons), 45
Chief People Officer
Member of the Group Management Committee
Ms Williams joined BHP Billiton in 2007 and was appointed to the Group Management Committee as President, Human Resources in January 2015. Ms Williams’ title changed to Chief People Officer effective 1 July 2015. She has previously held senior Human Resources positions including Vice President Human Resources Marketing, Vice President Human Resources for the Uranium business and Group HR Manager, Executive Resourcing & Development. Prior to BHP Billiton, Ms Williams was an organisation strategy and workforce transformation advisor with Accenture (formerly Andersen Consulting) and National Australia Bank.
Jimmy Wilson BSc (Mechanical Engineering), 5153
President, Iron Ore
Member of the Group Management Committee
Mr Wilson was appointed President, Iron Ore in March 2012. He joined BHP Billiton in March 1991. He has had an extensive career in the mining industry, and held key managerial and operational roles throughout BHP Billiton including President, Energy Coal (2009 – 12)2012) and President, Stainless Steel Materials (2007 – 09)2009). Prior to these roles, Mr Wilson was President and Chief Operating Officer Nickel West, President and Chief Operating Officer Samancor Chrome and General Manager of Billiton’s Bayside Aluminium.
Karen Wood BEd, LLB (Hons), FCIS, 57
President, Public Affairs
Member of the Group Management Committee
Ms Wood joined BHP Billiton in 2001. Her previous positions were Chief Governance Officer, Special Adviser and Head of Group Secretariat and Group Company Secretary. She assumed responsibility for Human Resources in 2007, when she was appointed Chief People Officer. On 27 August 2013 she handed her Human Resources accountabilities to Mike Fraser. In 2010 she assumed responsibility for Public Affairs. Before joining BHP Billiton, she was General Counsel and Company Secretary for Bonlac Foods Limited. She is a Fellow of the Institute of Chartered Secretaries.
J Michael Yeager BSc, MSc, 60
Group Executive and Chief Executive – Petroleum (until 1 July 2013)
Member of the Group Management Committee
Mr Yeager joined the Group in April 2006 as Chief Executive Petroleum after 25 years with Mobil and later ExxonMobil. Mr Yeager was previously Vice President, ExxonMobil Development Company, and held the roles of Senior Vice President, Imperial Oil Ltd and Chief Executive Officer, Imperial Oil Resources, Vice President Africa, ExxonMobil Production Company, Vice President Europe, ExxonMobil Production Company and President, Mobil Exploration and Production in the United States.
5 Corporate Governance Statement
5.1 Governance at BHP Billiton
Dear Shareholder
Welcome to BHP Billiton’s Corporate Governance Statement. This section of our Annual Report outlines the corporate governance processes of BHP Billiton.
At BHP Billiton, we have a governance framework to which we are held accountable that goes beyond an interest in governance or our need to fulfil regulatory requirements. Our approach is to adopt what we consider to be the highest of governance standards in Australia, the United Kingdom and the United States. That is because we believe that high-quality governance supports long-term value creation. Simply put, we think good governance is good business.
Governance influences how the objectives of the Company are set and achieved, how risk is monitored and assessed, and how performance is optimised. Therefore, our corporate governance structure encourages the creation of value, while providing accountability and control systems commensurate with risks involved.
We do not see governance as just a matter for the Board. Good governance is also the responsibility of executive management and is embedded throughout the organisation.
Our BHP Billiton Charter is core to the governance framework of BHP Billiton – it embodies our corporate purpose, strategy and values, and defines when we are successful. We foster a culture that values and rewards high ethical standards, personal and corporate integrity and respect for others.
We live the values enshrined inOur Charter and demonstrably adhere to the standards of conduct required by our BHP BillitonCode of Business Conduct.
BHP Billiton governance structure
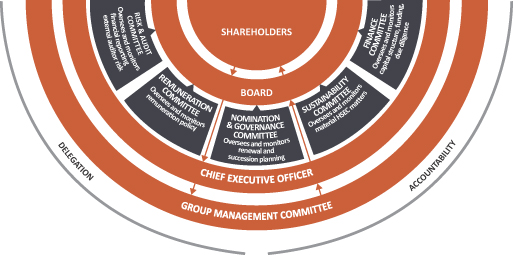
Appointment of Andrew Mackenzie
On 10 May 2013, Andrew Mackenzie was appointed Chief Executive Officer of the Group and became our new Executive Director. His appointment was the result of our long-established leadership development and succession process.
Our planned and considered approach involves attracting and developing the best global talent over a sustained period. This ensures that we have a deep pipeline of leaders at all levels in the Company, including for succession to Chief Executive.
The Board decided that Mr Mackenzie is the right person to lead BHP Billiton in a changing global environment. He brings a unique combination of deep industry knowledge and global management skills to the CEO role, with over 30 years’ experience in the oil and gas, petrochemicals and minerals industries.
Ongoing renewal
We are continuously focused on enhancing the diversity of perspective on the Board. We do this in a structured manner, looking out over a five-year period at the skills, backgrounds, knowledge, experience and diversity on the Board. The right blend of skills, experience and perspective is critical to ensuring the Board oversees BHP Billiton effectively for shareholders.
The Board has set a goal of increasing the number of women on the Board to at least three. This remains our target, and, while we did not achieve this target by the end of FY2013, we continue to work to identify future candidates for the Board. More details about the Board’s diversity of skills and experience are set out in section 5.7.
Continuous improvement
The Board has a commitment to ongoing improvement in the way we carry out our work. Last year, the continued evolution of the Board and its committees resulted in the formation of the Finance Committee. The Board made a commitment to evaluate the role and function of the Finance Committee 12 months after its formation. In the past year, the Committee has focused on capital management planning, including capital allocation and funding, as well as due diligence on divestments. Given our continued focus on capital management, the Board believes that the Finance Committee adds considerable value to the governance of the Group and will continue to operate under its terms of reference. Further details are set out in section 5.13.
During the year, ourBoard Governance Document and Committee terms of reference were reviewed and updated to reflect changing market practice.
I hope you find this description of our corporate governance useful and look forward to receiving any feedback that fellow shareholders may have.
Jac Nasser AO
Chairman
5.23.3 Shareholder engagement
Part of the Board’s commitment to high-quality governance is expressed through the approach we takeBHP Billiton takes to engaging and communicating with shareholders. We encourage shareholders to make their views known to us.
Our shareholders are based across the globe. Outside of the Annual General Meeting (AGM),two AGMs, which are an important step in the governance and investor engagement process, the Board uses a range of formal and informal communication channels to understand shareholder views to ensure it can represent shareholders in governing BHP Billiton. Regular proactive engagement with institutional shareholders and investor representative organisations takes place in Australia, South Africa, the United Kingdom and the United States. ThisThe purpose of these meetings is to discuss the full range of governance issues, as well as the broad strategy of the Group. The meetings are an important opportunity to build relationships and to engage directly with governance managers, fund managers and governance advisers. The meetings are led by:
the Chairman, supported by the President,Group Governance and Group Company SecretarySecretariat team – strategy, governance and remuneration;
the Remuneration Committee Chairman andor Senior Independent Director – governance and remuneration;
the Chief Executive Officer (CEO),| • | | the CEO, Chief Financial Officer (CFO), senior management and the Investor Relations team – strategy, financial and operating performance. Important briefings are webcast live from our website:www.bhpbilliton.com. During FY2015, meetings between management and shareholders were held in Australia, Canada, China, Germany, Japan, Singapore, South Africa, Switzerland, the UK and the US. Meetings between management and bondholders were held in Australia, Canada, China, France, Germany, Singapore, the UK and the US as part of our commitment to engage with providers of all types of capital; |
the Head of Health, Safety and Environment (HSE) – HSE and Community strategy (together, HSEC). Each year, we conduct group and one-on-one meetings and briefings with investors focused on key HSEC issues. During FY2015, these took place in Australia, France, South Africa and the UK, with additional meetings in mainland Europe held by conference call;
Group Governance and Company Secretariat – governance strategy and briefings. The Governance and Company Secretariat team provides a conduit to enable the Board and its committees to remain abreast of evolving investor expectations and to continuously enhance the governance processes of the Group.
The Chairman’s meetings are scheduled throughout the year to ensure continual feedback. This is designed to ensure that governance issues can be discussed separately to the AGM and, where appropriate, allows time to respond to feedback and shape new policies for the forthcoming financial year. During FY2015, the Chairman’s meetings included investors in Australia and the United Kingdom. Alongside these meetings, members of the Group Governance and Investor Relations team – strategy, financialteams met with shareholders in South Africa, the United States, Netherlands, France and operating performance. Important briefings are webcast liveSweden.
As a Group, we take a coordinated approach to engagement on corporate governance, and during the year responded to a wide range of shareholders, their representatives and non-governmental organisations. Issues covered included climate change and strategic risk assessment; safety; biodiversity; water management; hydraulic fracturing; long-termism, tax; remuneration; and collective bargaining.
The Company provides shareholders with the option to receive communications from, and send communications to, the Company and our website: www.bhpbilliton.com.
In addition, shareholdersregistrar electronically. Shareholders can contact us at any time through our Investor Relations team, with contact details available on our website:www.bhpbilliton.com.
Feedback from shareholders is regularly reported to the Board. Shareholder and analyst feedback is shared with the Board through the Chairman, the Chairman of the Remuneration Committee, (also the Senior Independent Director), other Directors, the CEO, the CFO and the CFO.Group Company Secretary. In addition, the Head of Investor Relations providesand Vice President Governance provide regular reports to the Board on shareholder and governance manager feedback and analysis. This approach provides a robust mechanism to ensure Directors are aware of issues raised and have a good understanding of current shareholder views.

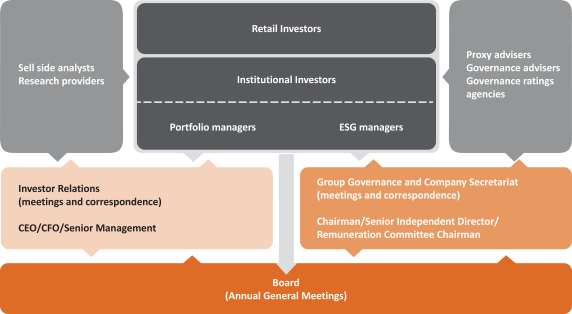
Annual General MeetingMeetings
As described above, a key part of our approach to governance involves shareholders’ views being heard and understood. The AGM isAGMs provide an opportunity for shareholdersimportant forum to ask questions of the Board.facilitate this.
Our Dual Listed Company (DLC) structure means that we hold two AGMs each year. The AGMs are important dates in the BHP Billiton calendar. In October each year, the BHP Billiton Plc meeting is held in the United Kingdom, and in November, the BHP Billiton Limited meeting is held in Australia. These meetings provide an update for shareholders on the Group’s performance and offer an opportunity for shareholders to ask questions and vote. Shareholders vote on important matters affecting the Group, including the election of Directors, any changes to our constitutional documents, the receipt of annual financial statements and incentive arrangements for the Executive Director. Shareholders may appoint proxies electronically through our website, and the Notice of Meeting describes how this can be done. As described above, a key part of our approach to governance is that shareholders’ views are heard and understood. The AGM provides an important forum to enable this.
Questions can be registered prior to the meeting by completing the relevant form accompanying the Notice of Meeting. Shareholders can also email the Group atinvestor.relations@bhpbilliton.com. Questions can be lodged ahead of the meeting and the answers to the most frequently asked questions are posted to our website.meeting.
Key members of management, including the CEO and CFO, are present and available to answer questions. The External Auditor attends the AGMs and is also available to answer questions.
Proceedings at shareholder meetings are webcast live from our website. Copies of the speeches delivered by the Chairman and CEO to the AGMs are released to the stock exchanges and posted to our website. A summary of proceedings and the outcome of voting on the items of business are released to the relevant stock exchanges and posted to our website as soon as they are available following the completion of the BHP Billiton Limited meeting.
Information relating to the 2012 AGMTheBoard Governance Document is available online at
www.bhpbilliton.com/home/investors/shareholderinfo/Pages/Meetings.aspx.meetings.
5.33.4 Role and responsibilities of the Board
The Board’s role is to represent the shareholders. It is accountable to them for creating and delivering value through the effective governance of the Group. This role requires a high-performing Board, with all Directors contributing to the Board’s collective decision-making processes.
TheBoard Governance Document is a statement of the practices and processes the Board has adopted to discharge its responsibilities. It includes the processes the Board has implemented to undertake its own tasks and
activities; the matters it has reserved for its own consideration and decision-making; the authority it has delegated to the CEO, including the limits on the way in which the CEO can execute that authority; and provides guidance on the relationship between the Board and the CEO.
TheBoard Governance Document also specifies the role of the Chairman, the membership of the Board and the role and conduct of Non-executive Directors. It also provides that the Group Company Secretary is accountable to the Board and advises the Chairman, and through the Chairman, the Board and individual Directors, on all matters of governance process. Further information is atset out in sections 5.43.5 to 5.7.
As part of our ongoing commitment to continuous improvement, the Board made high-level changes to theBoard Governance Document in FY2013. The changes reflect revisions to the corporate purpose, enhance clarity and adopt emerging market practice without impacting accountability of roles.3.8.
TheBoard GovernanceDocumentInformation relating to our AGMs is available online at
www.bhpbilliton.com/home/aboutus/ourcompany/Pages/governance.aspx.governance.
Allocation of decision-making authority
The matters that the Board has specifically reserved for its decision are:
appointments to the position of CEO and approval of the appointment of executives reporting directly to the CEO;
approval of strategy and annual budgets of the Group;
determination of capital and non-capital items in accordance with the approved delegations of authority;
determination and adoption of documents (including the publication of reports and statements to shareholders) that are required by the Group’s constitutional documents, by statute or by other external regulation.
The Board is free to alter the matters reserved for its decision, subject to the limitations imposed by the constitutional documents and the law.
The CEO is delegated authority to take all decisions and actions that further the corporate purpose of creating long-term shareholder value through the discovery, acquisition, development and marketing of natural resources. This is subject to the limits imposed by the Board on the CEO’s decision-making authority and set out in theBoard Governance Document, and the matters the Board has specifically reserved for its decision, including in the Group’s authorities framework. The CEO remains accountable to the Board for the authority that is delegated and for the performance of the Group, with the expectation that the CEO works in a constructive partnership with the Board. The Board monitors the decisions and actions of the CEO and the performance of the Group to gain assurance that progress is being made towards the corporate purpose within the limits imposed through the Group’s governance assurance framework. The Board also monitors the performance of the Group and assesses its risk profile through its committees. Reports from each of the committees are set out in section 5.13.3.14.
The CEO is required to report regularly to the Board in a spirit of openness and trust on the progress being made by the Group. The Board and its committees determine the information required from the CEO and any employee or
external party, including the External Auditor. Open dialogue between individual members of the Board and the CEO and other members of the management team is encouraged to enable Directors to gain a better understanding of our Company.the Group.
Independent advice
The Board and its committees may seek advice from independent experts whenever it is considered appropriate. Individual Directors, with the consent of the Chairman, may seek independent professional advice at the Group’s expense on any matter connected with the discharge of their responsibilities, at the Group’s expense.responsibilities.
Strategic focus and review
Within this framework, at the start of the calendar year, the Board agrees its strategic focus and priorities for the year ahead. This ensures that the work of the Board is aligned with the corporate purpose and takes into account the relevant external environment,factors, such as the markets in which we operate,commodity market developments and changes to the externaloperating and regulatory environment.
The Board also evaluates its activities on a regular basis taking into account:
matters considered by the Board (including time spent on those matters);
legal and governance requirements of the Board and its committees;
feedback from shareholders and other stakeholders;
the outcomes of its evaluation process.
The Board is satisfied that it has discharged its obligations as set out in theBoard Governance DocumentDocument..
Key activities during the year
BHP Billiton’s strategy to own and operate large, long-life, low-cost, expandable, upstream assets diversified by commodity, geography and market remains the foundation for creating shareholder value. To extend our track record and create a more productive and capital efficient organisation, we have concentrated our efforts on those world-class basins where we enjoy economies of scale and a competitive advantage.
In addition to the productivity gains delivered during the period, the Group applied strict capital discipline. No major growth projects were approved during FY2013. Our commitment to maintain a solid ‘A’ credit rating remains unchanged. Within this context, theThe Board approved a range of business decisions including:
during the investment of US$520 millionyear, as outlined in the Longford Gas Conditioning Plant (LGCP) project as part of the Gippsland Basin Joint Venture, located in Victoria, Australia. This investment adds carbon dioxide removal capacity to the Longford Gas Plant which is necessary to condition production for the Turrum offshore development project;
entering into a definitive agreement with PetroChina International Investment (Australia) Pty Ltd to sell the 8.33 per cent interest in the East Browse Joint Venture and 20 per cent interest in the West Browse Joint Venture, located offshore Western Australia, with final proceeds from the sale of US$1.7 billion;
the sale of the 37.76 per cent non-operated interest in Richards Bay Minerals to Rio Tinto for cash proceeds of US$1.7 billion after adjustments;
entering into a definitive agreement to sell the Pinto Valley mining operation and the associated San Manuel Arizona Railroad Company to Capstone Mining Corporation for an aggregate cash consideration of US$650 million;
entering into a definitive agreement to sell the diamonds business, comprising the interests in the EKATI Diamond Mine and Diamonds Marketing operations, to Harry Winston Diamond Mines Ltd with final proceeds of US$553 million;
the issuing of a two tranche €2.0 billion bond, and a two tranche £1.75 billion bond, the issuing of afive-year A$1.0 billion note under the Australian Medium Term Note Program, the issuing of a €750 million bond and the issuing of a C$750 million bond;
the sale of the wholly owned Yeelirrie uranium deposit in Western Australia to Cameco Corporation with final proceeds of US$430 million;
the extension of the long-term joint venture relationship with ITOCHU Corporation and Mitsui & Co., Ltd. through the investment by those two joint venture partners of approximately US$822 million and US$720 million, respectively, in shares and loans of BHP Iron Ore (Jimblebar) Pty Ltd, representing an eight per cent and seven per cent interest in the Jimblebar mining hub and resource;
after the year-end, an investment of US$2.0 billion to sustain operations at Escondida in Chile, by constructing a new 2,500 litre per second sea water desalination facility;
the investment of US$2.6 billion, spread over a number of years, with annual instalments of US$800 million, to finish the excavation and lining of the Jansen Potash project production and service shafts, and to continue the installation of essential surface infrastructure and utilities.
Succession
For BHP Billiton, succession of the CEO is an ongoing process, which has worked well for over a decade. This year, Mr Kloppers retired as CEO and Mr Mackenzie was appointed CEO from 10 May 2013.
A critical component of succession at Group Management Committee (GMC) level and below is the existence of a robust senior leadership program that operates across multiple organisational levels to build, develop, renew, recruit and promote our leaders. While the program was driven, during FY2013, by the CEO and President, People and Public Affairs, the Board is actively engaged and oversees President succession and the development of the senior team. Following his appointment, Mr Mackenzie announced the new senior management team and the removal of a layer of management to bring the operations closer to the CEO and ensure alignment between strategic and managerial leadership.section 5.1.
5.43.5 Board membership
The Board currently has 1312 members, each of whom must seek re-election by shareholders annually. Of these, 12, includingFollowing the Chairman, are independent Non-executive Directors.retirement of Carlos Cordeiro after the forthcoming AGMs, the Board will have 11 members. The Non-executive Directors (including Anita Frew) are considered by the Board to be independent of management and free from any business relationship or other circumstance that could materially interfere with the exercise of objective, unfettered or independent judgement. FurtherFor further information on the process for assessing independence, is inrefer to section 5.9.
During the year, the composition of the Board changed with the appointment of Mr Mackenzie as CEO and Executive Director and the retirement of Mr Kloppers from the Board.3.10.
In terms of Non-executive Directors, the Nomination and Governance Committee retains the services of external recruitment specialists to continue to assist in the identification of potential candidates for the Board.
The Board considers that there is an appropriate balance between Executive and Non-executive Directors to promote shareholder interests and govern the businessCompany effectively. While the Board includes a smaller number of Executive Directors than is common for UK-listed companies, its composition is appropriate for the DLC structure and is in line with Australian-listed company practice. In addition, the Board has extensive access to members of senior management, who frequently attend Board meetings, where they make presentations and engage in discussions with Directors, answer questions, and provide input and perspective on their areas of responsibility. The Board, led by the Chairman, also deliberatesholds discussions in the absence of management at the beginning and end of each meeting, which is chaired by the Group Chairman.meeting.
The Directors of the Group, are:
Mr Jac Nasser (Chairman)
Mr Andrew Mackenzie (CEO)
Mr Malcolm Broomhead
Sir John Buchanan
Mr Carlos Cordeiro
Mr David Crawford
Mr Pat Davies
Ms Carolyn Hewson
Mr Lindsay Maxsted
Mr Wayne Murdy
Mr Keith Rumble
Dr John Schubert
Baroness Shriti Vadera
Thealong with their biographical details, of the Directors are set outlisted in section 4.1 of this Annual Report.3.2.1.
5.53.6 Chairman
The Chairman, Jac Nasser, is considered by the Board to be independent. He was appointed Chairman of the Group from 31 March 2010 and has been a Non-executive Director of the Group since 6 June 2006. Mr Nasser was last re-elected at the 20122014 AGMs and, in accordance with the Group’s policy that each Director stand for election annually, will stand for re-election in 2013.2015. Further information in relation to his tenure on the Board is set out in section 3.10.
The Chairman’s role includes:
leading the Board and ensuring that it is operating to the highest governance standards;
encouraging a culture of openness and debate to foster a high-performing and collegial team of Directors that operates effectively;
ensuring strategic issues, shareholder and relevant stakeholder and shareholder views are regularly reviewed, clearly understood and underpin the work of the Board;
facilitating the relationship between the Board and the CEO;
ensuring the provision of accurate, timely and clear information;
setting agendas for meetings of the Board, in consultation with the CEO and Group Company Secretary, that focus on the strategic direction and performance of the Group’s business;
ensuring that adequate time is available for discussion on all agenda items;
leading the Board and individual Director performance assessments;
speaking and acting for the Board and representing the Board to shareholders.
The Board considers that none of Mr Nasser’s other commitments (set out in section 4.1 of this Annual Report) interfere3.2.1) interferes with the discharge of his responsibilities to the Group. The Board is satisfied that he makes sufficient time available to serve the Group effectively.
The Group does not have a Deputy Chairman, but has identified John Schubert to act as Chairman should the need arise at short notice.
5.63.7 Senior Independent Director
TheDuring the year under review, and from February 2003, Sir John Buchanan held the role of Senior Independent Director of BHP Billiton Plc. He acted independently in the best interests of the Group. His expertise and broad international experience materially enhanced the skills and experience profile of the Board hasand he continued to make a substantial contribution as Senior Independent Director and in his other Board roles until his death in July 2015.
On 14 August 2015, the Board announced that it had appointed John BuchananShriti Vadera as the Senior Independent Director of BHP Billiton Plc in accordance with the UK Corporate Governance Code. Sir JohnShe is available to shareholders who have concerns that cannot be addressed through the Chairman, CEO or CFO. As Senior Independent Director, heshe also provides a sounding board for the Chairman and serves as an intermediary for other Directors if necessary.
5.73.8 Director skills, experience and attributes
Skills, experience and attributes required
The Board considers that a diversity of skills, backgrounds, knowledge, experience, geographic location, nationalities and gender is required in order to effectively govern the business. The Board and its committeesNomination and Governance Committee work to ensure that the Board continues to have the right balance of skills, experience, independence and Group knowledge necessary to discharge its responsibilities in accordance with the highest standards of governance.
In order to govern the Group effectively, Non-executive Directors must have a clear understanding of the Group’s overall strategy, together with knowledge about the Group and the industries in which it operates. Non-executive Directors must be sufficiently familiar with the Group’s core business to be effective contributors to the development of strategy and to monitor performance. Part of the required understanding of strategy and the
core business is the requirement to understand the risks that the Group faces and the processes in place to mitigate and manage those risks. We operate in an uncertain external environment, and the Group is exposed to many material risks across its operations, including some that are systemic, such as financial risks and climate change. All those risks are factored into the Board’s approach to strategy and its assessment of an optimised portfolio. The risk management governance structure is described in section 3.15.
TheBoard Governance Document requires that Directors demonstrate unquestioned honesty and integrity, preparedness to question, challenge and critique, and a willingness to understand and commit to the highest standards of governance. Directors must commit to the collective decision-making processes of the Board. Individual Directors are required to debate issues openly and constructively, and are free to question or challenge the opinions of others. Directors must also commit to active involvement in Board decisions and the application of strategic thought to matters in issue. Directors must be clear communicators and good listeners who actively contribute to the Board in a collegial manner. Each Director must ensure that no decision or action is taken that places his or her interests in front of the interests of the business.Company.
Directors must be prepared to commit sufficient time and resources to perform their role effectively. Current Board profile
The Nomination and Governance Committee takes accountBoard considers that each of the other positions held by each potential Director candidate. It assesses whether they will have adequate Non-executive Directors has the following attributes:
time to devoteundertake the responsibilities of the role;
unquestioned honesty and integrity;
a willingness to understand and commit to the highest standards of governance;
an ability to apply strategic thought to relevant matters;
an ability to consider materiality and risk tolerance as key considerations in decision-making;
a preparedness to question, challenge and critique;
experience of managing in the context of uncertainty, and an understanding of the risk environment of the Group, including the potential for risk to impact our health and safety, environment, community, reputation, regulatory, market and financial performance;
knowledge of world capital markets;
a proven track record of creating value for shareholders.
The Executive Director brings additional perspectives to the Board prior to makingthrough a recommendation todeeper understanding of the Board on whether to appoint them as a Director. In addition, Directors are required to consult with the Chairman before accepting any additional commitments that could conflict with or impact on the time Directors can devote to their role.
The NominationGroup’s business and Governance Committee is required to assist the Board in ensuring that the Board is comprised of high-calibre individuals whose background, skills, experience and personal characteristics will augment the present Board and meet its future needs and diversity aspirations.
Current Board profileday-to-day operations.
The following table sets out the keymix of skills and experience ofthat the Board considers necessary or desirable in its Directors and the extent to which they are represented on the Board and its committees. As a Board, the Non-executive Directors contribute:
international business and senior executive experience;
relevant operating experience;
understanding of the sectors in which we operate;
knowledge of world capital markets;
regulatory and government policy experience;
an understanding of the health, safety, environmental and community challenges that we face.
The Executive Director brings additional perspectives to the Board’s work through a deep understanding of the Group’s business.
In addition to the skills and experience set out in the table includes Anita Frew, who joined the Board considers that each Director has the following attributes:on 15 September 2015.
unquestioned honesty and integrity;
a proven track record of creating value for shareholders;
time available to undertake the responsibilities;
an ability to apply strategic thought to matters in issue;
a preparedness to question, challenge and critique;
a willingness to understand and commit to the highest standards of governance.
| | | | | | | | | | | | | | | | | | | | | | | | |
Skills and experience | | Board | | | Risk and
Audit | | | Nomination
and
Governance | | | Remuneration | | | Sustainability | | | Finance | |
Total Directors | | | 1312 Directors | | | | 4 Directors | | | | 3 Directors | | | | 4 Directors | | | | 3 Directors | | | | 4 Directors | |
| | | | | | |
Executive leadership | | | | | | | | | | | | | | | | | | | | | | | | |
| | | | | | |
| Sustainable success in business at a very senior executive level in a successful career. | | | 12 Directors | | | | 34 Directors | | | | 3 Directors | | | | 4 Directors | | | | 3 Directors | | | | 4 Directors | |
| | | | | | |
Global experience | | | | | | | | | | | | | | | | | | | | | | | | |
| | | | | | |
| Senior management or equivalent experience in multiple global locations, exposed to a range of political, cultural, regulatory and business environments. | | | 1312 Directors | | | | 4 Directors | | | | 3 Directors | | | | 4 Directors | | | | 3 Directors | | | | 4 Directors | |
| | | | | | |
Governance
| | | | | | | | | | | | | | | | | | | | | | | | |
| | | | | | |
Commitment to the highest standards of governance, including experience with a major organisation that is subject to rigorous governance standards, and an ability to assess the effectiveness of senior management. | | | 13 Directors | | | | 4 Directors | | | | 3 Directors | | | | 4 Directors | | | | 3 Directors | | | | 4 Directors | |
| | | | | | | | | | | | | | | | | | | | | | | | |
Skills and experience | | Board | | | Risk and
Audit | | | Nomination
and
Governance | | | Remuneration | | | Sustainability | | | Finance | |
| | | | | | |
StrategyGovernance
| | | | | | | | | | | | | | | | | | | | | | | | |
| | | | | | |
Track recordCommitment to the highest standards of developinggovernance, including experience with a major organisation that is subject to rigorous governance standards, and implementing a successful strategy, including appropriately probing and challenging management onan ability to assess the deliveryeffectiveness of agreed strategic planning objectives.senior management. | | | 1312 Directors | | | | 4 Directors | | | | 3 Directors | | | | 4 Directors | | | | 4 Directors | |
| | | | | |
Strategy/Risk | | | | | | | | | | | | | | | | | | | | |
| | | | | |
| Track record of developing and implementing a successful strategy, including appropriately probing and challenging management on the delivery of agreed strategic planning objectives. Track record in developing an asset or business portfolio over the long term that remains resilient to systemic risk. | | | 12 Directors | | | | 4 Directors | | | | 3 Directors | | | | 4 Directors | | | | 4 Directors | |
| | | | | | |
Financial acumen | | | | | | | | | | | | | | | | | | | | | | | | |
| | | | | | |
| Senior executive or equivalent experience in financial accounting and reporting, corporate finance and internal financial controls, including an ability to probe the adequacies of financial and risk controls. | | | 1312 Directors | | | | 4 Directors | | | | 3 Directors | | | | 4 Directors | | | | 3 Directors | | | | 4 Directors | |
| | | | | | |
Capital projects | | | | | | | | | | | | | | | | | | | | | | | | |
| | | | | | |
| Experience working in an industry with projects involving large-scale capital outlays and long-term investment horizons. | | | 1110 Directors | | | | 4 Directors | | | | 3 Directors | | | | 3 Directors | | | | 3 Directors | | | | 32 Directors | | | | 4 Directors | |
| | | | | | |
Health, safety and environment | | | | | | | | | | | | | | | | | | | | | | | | |
| | | | | | |
| Experience related to workplace health and safety, environmental and social responsibility, and community. | | | 1211 Directors | | | | 4 Directors | | | | 3 Directors | | | | 3 Directors | | | | 3 Directors | | | | 4 Directors | |
| | | | | | |
Remuneration | | | | | | | | | | | | | | | | | | | | | | | | |
| | | | | | |
| Board Remuneration Committee membership or management experience in relation to remuneration, including incentive programs and pensions/superannuation and the legislation and contractual framework governing remuneration. | | | 1312 Directors | | | | 4 Directors | | | | 3 Directors | | | | 4 Directors | | | | 34 Directors | |
| | | | | |
Mining | | | | | | | | | | | | | | | | | | | | |
| | | | | |
| Senior executive experience in a large mining organisation combined with an understanding of the Group’s corporate purpose to create long-term shareholder value through the discovery, acquisition, development and marketing of natural resources. | | | 4 Directors | | | | 2 Directors | | | | 0 Directors | | | | 1 Director | | | | 2 Directors | |
| | | | | | | | | | | | | | | | | | | | | | | | |
Skills and experience | | Board | | | Risk and
Audit | | | Nomination
and
Governance | | | Remuneration | | | Sustainability | | | Finance | |
| | | | | | |
Mining
| | | | | | | | | | | | | | | | | | | | | | | | |
| | | | | | |
Senior executive experience in a large mining organisation combined with an understanding of the Group’s corporate purpose to create long-term shareholder value through the discovery, acquisition, development and marketing of natural resources. | | | 5 Directors | | | | 1 Director | | | | 0 Directors | | | | 1 Director | | | | 2 Directors | | | | 2 Directors | |
| | | | | | |
Oil and gas | | | | | | | | | | | | | | | | | | | | | | | | |
| | | | | | |
| Senior executive experience in the oil and gas industry, including in-depth knowledge of the Group’s strategy, markets, competitors, operational issues, technology and regulatory concerns. | | | 5 Directors | | | | 1 Director | | | | 2 Directors | | | | 3 Directors1 Director | | | | 1 Director | | | | 1 Director3 Directors | |
| | | | | | |
Marketing | | | | | | | | | | | | | | | | | | | | | | | | |
| | | | | | |
| Senior executive experience in marketing and a detailed understanding of the Group’s corporate purpose to create long-term shareholder value through the discovery, acquisition, development and marketing of natural resources. | | | 1110 Directors | | | | 3 Directors | | | | 2 Directors | | | | 3 Directors | | | | 4 Directors | | | | 32 Directors | | | | 4 Directors | |
| | | | | | |
Public policy | | | | | | | | | | | | | | | | | | | | | | | | |
| | | | | | |
| Experience in public and regulatory policy, including how it affects corporations. | | | 1312 Directors | | | | 4 Directors | | | | 3 Directors | | | | 4 Directors | | | | 3 Directors | | | | 4 Directors | |
Renewal
The Board plans for its own succession, with the assistance of the Nomination and Governance Committee. In doing this, the Board:
considers the skills, backgrounds, knowledge, experience and diversity of geographic location, nationality and gender necessary to allow it to meet the corporate purpose;
assesses the skills, backgrounds, knowledge, experience and diversity currently represented;
identifies any inadequate representation of those attributes and agrees the process necessary to ensure a candidate is selected who brings them to the Board;
reviews how Board performance might be enhanced, both at an individual Director level and for the Board as a whole.
The Board believes that orderly succession and renewal isare achieved as a result of careful planning, wherewith the appropriate composition of the Board is continually under review. This planning involves looking out over a five-year period, which provides a robust framework within which to consider Board succession and renewal.
When considering new appointments to the Board, the Nomination and Governance Committee oversees the preparation of a position specification that is provided to an independent recruitment organisation retained to conduct a global search. Independent search firms are instructed to consider a wide range of candidates, including taking into account geographic location, nationality and gender. In addition to the specific skills, knowledge and experience deemed necessary, the specification contains the criteria required by theBoard Governance Document.
Once a candidate is identified, the Board, with the assistance of external consultants where necessary, conducts appropriate background and reference checks before the candidate is appointed to the Board or put forward to shareholders for election.
The Board has adopted a letter of appointment that contains the terms on which Non-executive Directors will be appointed, including the basis upon which they will be indemnified. The letter of appointment clearly defines the role of Directors, including the expectations in terms of independence, participation, time commitment and continuous improvement. In summary, Directors are expected to constructively challenge; set the values and standards of the Group; monitor the performance of management and of the Group; satisfy themselves as to the adequacy and integrity of financial statements;the Financial Statements; and satisfy themselves that the systems for the identification and management of risks are robust and appropriate. Directors are also expected to commit sufficient time to carry out their role and to participate in continuous improvement programs and internal reviews to support ongoing development. The letter of appointment also makes it clear that Directors are required to disclose circumstances that may affect, or be perceived to affect, their ability to exercise independent judgement so that the Board can assess independence on a regular basis.
|
A copy of the terms of appointment is available online at
www.bhpbilliton.com/home/aboutus/ourcompany/Pages/governance.aspx.
|
DiversityA copy of the terms of appointment for Non-executive Directors is available online at
www.bhpbilliton.com/aboutus/ourcompany/governance.
Inclusion and diversity
Our Charter and Human Resources Group Level Documents guide management on all aspects of human resource management, including inclusion and diversity. Underpinning the Group Level Documents and supporting the achievement of diversity across the Group are principles and measurable objectives that define our approach to diversity and our focus on creating an inclusive work environment.
The Board and the Nomination and Governance Committee believe that many facets of diversity are required in order to meet the corporate purpose. This diversity is not restricted to gender but also includes geographic location, nationality, skills, background, knowledge and experience.
The Board is committed to ensuring gender diversity is actively pursued and implemented in terms of current and future Board composition. Diversity is a core consideration in ensuring that the Board and its committees have the right balance of skills, experience, independence and Group knowledge necessary to discharge their responsibilities. The right blend of perspectives is critical to ensuring the Board oversees BHP Billiton effectively for shareholders.
In 2011, theFurther information relating to diversity is set out in section 3.14.3.
Alongside Board outlined its aspirational goal of increasing the number of women on the Board to at least three over the following two years, having appointed Carolyn Hewson and Baroness Shriti Vadera in 2010 and 2011, respectively. The Board remains committed to this goal, and continues to work towards it in a structured manner, looking out over a five-year period at the skills, backgrounds, knowledge, experience and diversity on the Board. Independent search firms in the US, UK and Australia have been retained over the last few years to specifically consider potential female candidates. Short-listed candidates are considered by the Nomination and Governance Committee.
Our goal is, however, unlikely to be achieved until FY2015. As disclosed in last year’s Annual Report, our immediate business imperative in FY2012 was to appoint an additional Director with skills and experience in the oil and gas sector. The candidate search actively considered both potential female candidates and other diversity considerations, including background, experience and culture. Ex SASOL CEO Pat Davies was appointed to the Board in 2012, bringing specific oil and gas experience. During FY2013, we have continued to seek additional oil and gas sector experience, given the natural succession planning of the Board. While the work of the Nomination and Governance Committee has continued, we did not appoint any new Non-executive Directors – female or male – during the year.
The Board also considers that it is important to continue to develop the potential of women at all levels of the Company, andcomposition, part of the Board’s role is to consider and approve the Group’s measurable objectives for workforce diversity each financial year, and to oversee the Group’s progress towards thesein achieving those objectives. FollowingThis progress will continue to be disclosed in the changes toAnnual Report, along with the GMC, female representation has now increased to 18 per cent.proportion of women in our workforce, in senior management positions and on the Board. Further information on inclusion and diversity at BHP Billiton, including our progress against FY2015 measurable objectives, and our employee profile more generally, is set out in relation to the initiatives in place to address diversity across the broader Group,sections 1.13.1 and the impact they are having, is contained in section 5.17.1.13.3.
Board skills, experience and diversity
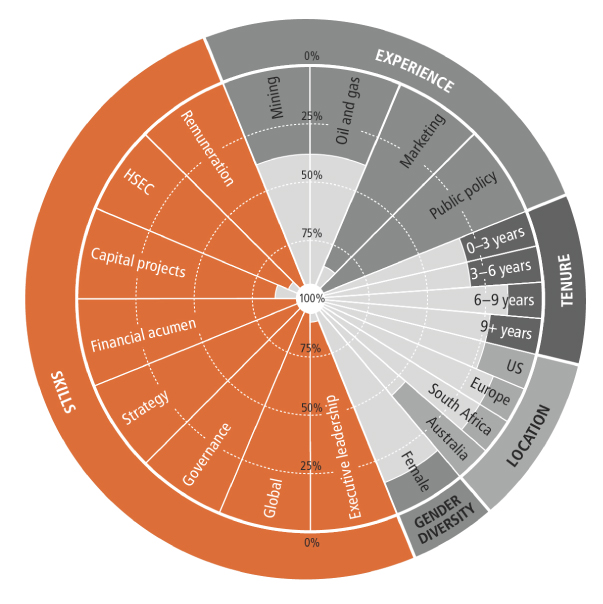
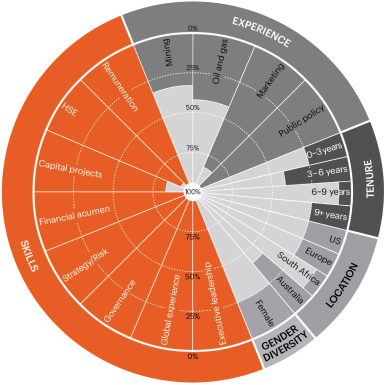
Note: Percentages inThis diagram includes Anita Frew, who joined the diagram reflect the number of Directors represented in each categoryBoard on 15 September 2015
5.83.9 Director induction, training and development
The Board considers that the development of industry and Group knowledge is a continuous and ongoing process.
Upon appointment, each new Non-executive Director undertakes an induction program specifically tailored to their needs.
A copy of an indicative induction program is available online at
www.bhpbilliton.com/home/aboutus/ourcompany/Pages/governance.aspx.governance.
BHP Billiton’s long-stated strategy is to own and operate large, long-life, low-cost, expandable, upstream assets diversified by commodity, geography and market. The Board’s development activity reflects this diversification through the provision of regular updates to Directors on each of the Group’s commodities, geographies and markets.
Non-executive Directors also participate in continuous improvement programs, in accordance with their terms of appointment. Programs are designed to maximise the effectiveness of the Directors throughout their tenure and link in with their individual Director performance evaluations. The Training and Development Program covers a range of matters of a business nature, including environmental, social and governance matters.
Structured opportunities are provided to build knowledge through initiatives such as visits to BHP Billiton sites and briefings provided at Board meetings. Non-executive Directors also build their Group and industry knowledge through the involvement of the GMC and other senior Group employees in Board meetings.
Briefings, site visits and development sessions underpin and support the Board’s work in monitoring and overseeing progress towards the corporate purpose. We therefore continuously build Directors’ knowledge to ensure that the Board remains up to dateup-to-date with developments within our Businesses, as well as developments in the markets in which we operate.
During the year, Non-executive Directors participated in the following activities:
briefings intended to provide each Director with a deeper understanding of the activities, environment and key issues and direction of the Businesses. These briefings are provided to the Board by senior executives, including GMC members and other team members with operational and non-operational responsibilities. They are comprehensive briefings on the commodities, assets and markets in which we operate, including health, safety, environment and community (HSEC),HSEC, and public policy considerations. The briefings provided during FY2013FY2015 covered metallurgical coal, potash, iron orePotash, the Group Technology strategy, Iron Ore, and next generation mining.Group scenario planning (including sign posts). When these briefings were combined with a site visit, they took place on-site, otherwise they took place at Board meetings where the relevant executives joined Directors;
development sessions on specific topics of relevance, such as climate change, commodity markets, world economy, changes in corporate governance standards, diversity and inclusion, Directors’ duties and shareholder feedback;feedback. In relation to climate change, the Board and its committees once again spent time considering systemic climate change as it relates to the resilience of, and opportunities for, the Group’s portfolio, and considering actions to manage the implications of climate change;
visits to Houston, Petroleum, United States; Olympic Dam, Copper, Australia; Western Australia Iron Ore; the Jansen Potash Project, Canada; the Wessels manganese mine in South Africa;Eagle Ford, Petroleum, United States; Peak Downs, Coal, Australia, and the San Juan coal mine in New Mexico, United States,Mount Arthur, Coal, Australia, including briefings on the assets, operations and other relevant issues, and meetings with key personnel;
addresses by expert external speakers, who are generally expertsspeakers.
These sessions and site visits provide not only an update on the main Businesses and assets, but also allow an opportunity to discuss, in their field.
detail, the changing risk environment and the potential for impacts on the achievement of our corporate purpose and business plans. More detail on the management of principal risks is set out in sections 1.7.3 and 3.15. Director involvement and continuous development through site visits, Business Group Risk and Audit Committee (Business Group RAC) meetings and on-site briefings are summarised in the map on the following page.map.
Business Group RAC meetings take place twice yearly as part of our financial governance framework. Directors who are members of the Board’s Risk and Audit Committee chair the Business Group RAC meetings. FurtherFor further information on Business Group RACs, is atrefer to section 5.13.1.3.14.1.
Director site visits, on-site briefings and Business Group RAC meetings 2011-20132013-2015
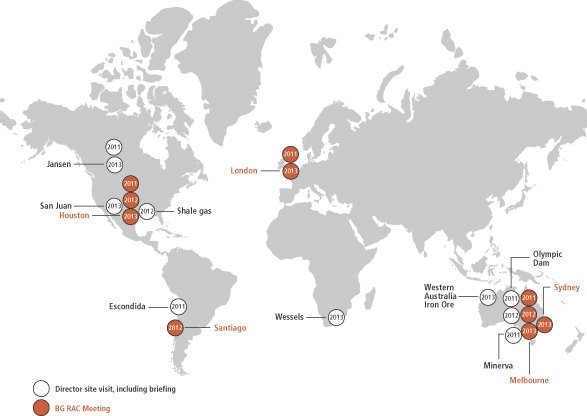
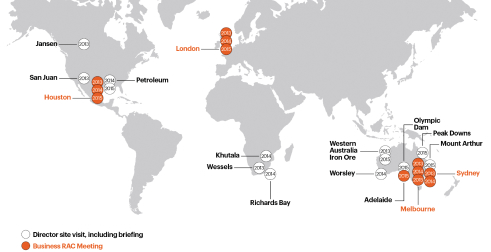
The Nomination and Governance Committee oversees the Directors’ Training and Development Program, and, as part of the yearly review process, the Chairman discusses development areas with each Director. Board committees in turn review and agree their training needs. The benefit of this approach is that induction and learning opportunities can be tailored to Directors’ committee memberships, as well as the Board’s specific areas of focus. In addition, thisThis approach also ensures a coordinated process in relation to succession planning, Board renewal, training and development and committee composition, which are all relevant to the Nomination and Governance Committee’s role in securing the supply of talent to the Board.
In addition, each Board committee provides a standing invitation for any Non-executive Director to attend committee meetings (rather than just limiting attendance to committee members). Committee agendas are provided to all Directors to ensure that Directors are aware of matters to be considered by the committees, and can elect to attend meetings where appropriate.
5.93.10 Independence
The Board is committed to ensuring a majority of Directors areis independent. The Board considers that all the current Non-executive Directors, including the Chairman, are independent.
Process to determine independence
The Board has a policy that it uses to determine the independence of its Directors. This determination is carried out upon appointment, annually and at any other time where the circumstances of a Director change such as to warrant reconsideration.
A copy of the policy on Independence of Directors is available online at
www.bhpbilliton.com/home/aboutus/ourcompany/Pages/governance.aspx.governance.
Under the policy, an ‘independent’ Director is one who is: ‘independent of management and any business or other relationship that could materially interfere with the exercise of objective, unfettered or independent judgement by the Director or the Director’s ability to act in the best interests of the BHP Billiton Group’.
Where a Director is considered by the Board to be independent, but is affected by circumstances that appear relevant to the Board’s assessment of independence, the Board has undertaken to explain the reasons why it reached its conclusion. In applying the independence test, the Board considers relationships with management, major shareholders, subsidiary and associated companies and other parties with whom the Group transacts business against predeterminedpre-determined materiality thresholds, all of which are set out in the policy. A summary of the factors that may be perceived to impact the independence of certain Directors is set out below.
Tenure
ThreeAs at the end of the year under review, four Directors, David Crawford,Jac Nasser, John Schubert, andSir John Buchanan haveand Carlos Cordeiro, had each served on the Board for more than nine years. Mr Crawford, DrTwo of those Directors – Jac Nasser and John Schubert and Sir John– are standing for re-election at the 20132015 AGMs, having each undergone a formal performance assessment.
Although Mr CrawfordNasser was first appointed to the BHP Limited Board in 1994, theJune 2006 as an independent Non-executive Director. The Board considers that he makes a significant contribution to the work of the Board andbelieves that his deep knowledge of the Groupexpertise and broad international business experience remains especially important, in particular in his role as Finance Committee Chairman.materially enhance the skills and experience profile of the Board. In accordance with the UK Corporate Governance Code, Mr Nasser’s term of appointment has been subject to a particularly rigorous review, which took into account the need for progressive refreshing of the Board.
Dr Schubert was first elected to the Board of BHP Limited in 2000. The Board is of the view that Dr Schubert continues to make a valuable contribution through his role as Chairman of the Sustainability Committee and his rolesrole on the Remuneration and Nomination and Governance Committees,Committee, as well as to the work of the Board more broadly. Dr Schubert’s extensive experience as an executive, particularly in the international oil industry, and subsequently as a public company director across multiple industries, adds significantly to the skills and expertise of the Board.
Sir John was first appointed to the Board (and as Senior Independent Director) in February 2003. The Board believes that he continues to act independently in the best interests of the Group. His expertise and broad international experience materially enhance the skills and experience profile of the Board and he continues to make a substantial contribution in his roles, as a member of the Board, Chairman of the Remuneration Committee, a member of the Nomination and Governance Committee and as Senior Independent Director.
The Board does not believe that Mr Crawford’s,Nasser’s or Dr Schubert’s or Sir John’s tenure materially interferes with their ability to act in the best interests of the Group. The Board also believes that each of them has retained independence of character and judgement and has not formed associations with management (or others) that might compromise their ability to exercise independent judgement or act in the best interests of the Group.
Retirement plan
As a former DirectorsDirector of BHP Limited prior(prior to the mergerestablishment of the Dual Listed Company structure with Billiton Plc which formed the Group in 2001, Mr Crawford and2001), Dr Schubert participated in a retirement plan approved by shareholders in 1989. The plan was closed on 24 October 2003. Benefits accrued to that date, together with interest earned on the benefits, have been preserved and will be paid on retirement. The Board does not believe that the independence of any participating DirectorDr Schubert is compromised as a result of this plan.
Relationships and associations
Lindsay Maxsted was the CEO of KPMG in Australia from 2001 until 2007. The Board considers that this prior relationship with KPMG does not materially interfere with Mr Maxsted’s exercise of objective, unfettered or independent judgement, or his ability to act in the best interests of the BHP Billiton Group. The Board has
determined, consistent with its policy on the independence of Directors, that Mr Maxsted is independent. The Board notes in particular that:
at the time of his appointment to the Board, more than three years had elapsed since Mr Maxsted’s retirement from KPMG. The Director independence rules and guidelines that apply to the Group – which are a combination of Australian, UK and US rules and guidelines – all use three years as the benchmark ‘cooling off’ period for former audit firm partners;
| a combination of Australian, UK and US rules and guidelines – all use three years as the benchmark ‘cooling off’ period for former audit firm partners; |
Mr Maxsted has no financial (e.g. pension, retainer or advisory fee) or consulting arrangements with KPMG;
Mr Maxsted was not part of the KPMG audit practice after 1980 and, while at KPMG, was not in any way involved in, or able to influence, any audit activity associated with BHP Billiton.
The Board considers Mr Maxsted’s financial acumen and extensive experience in the corporate restructuring field to be important in the discharge of the Board’s responsibilities. His membership of the Board and Chairmanship of the RACRisk and Audit Committee are considered by the Board to be appropriate and desirable.
Mr Crawford was a partner of KPMG in Australia until his retirement in June 2001. He has had no commercial relationship with KPMG since that time and the Board does not consider Mr Crawford’s independence to be compromised as a result of this association that ended more than 12 years ago.
Some of the Directors hold or have previously held positions in companies with which we haveBHP Billiton has commercial relationships. Those positions and companies are set out in the Director profiles in section 4.1 of this Annual Report.3.2.1. The Board has assessed all of the relationships between the Group and companies in which Directors hold or held positions and has concluded that in all cases the relationships do not interfere with the Directors’ exercise of objective, unfettered or independent judgement or their ability to act in the best interests of the Group.
A specific instance is Malcolm Broomhead, who, during the year under review, wasBrinded. Mr Brinded is a Non-executiveformer executive Director of Coates Group Holdings Pty Limited,Royal Dutch Shell Plc, a company with whichmaterial customer of the BHP Billiton has commercial dealings. Coates Group provides equipment hire toGroup. Mr Brinded stepped down from the miningBoard of Shell on 1 April 2012 and resources industry (among others).left Shell group employment on 30 April 2012. Prior to and since the appointment of Mr BroomheadBrinded as a Director of BHP Billiton, the Board has assessed the relationship between BHP Billiton and Coates Group and remained satisfied that Mr Broomhead was able to apply objective, unfettered and independent judgement and act in the best interests of BHP Billiton. In addition, no commercial dealings with Coates Group were discussed at Board or Board committee level. Since year-end, Mr Broomhead has stepped down from the Board of Coates Group with effect from 29 July 2013.
A second instance is David Crawford, who is an Advisory Board member for the commercial law firm Allens, which advises BHP Billiton on specific matters from time to time but is not one of BHP Billiton’s relationship law firms. Mr Crawford’s role is as a member of the Advisory Board, a wholly advisory body that does not have decision-making authority for Allens. The Board has assessed the relationshipShell group and remains satisfied that Mr Crawford is independent in mind and judgement andBrinded is able to apply objective, unfettered and independent judgement and act in the best interests of BHP Billiton. In addition, the allocation of business to Allens was not discussed at Board or Board committee level, and to the extent it is in the future, Mr Crawford will absent himself fully from those deliberations.
Transactions during the year that amounted to related-partyrelated party transactions with Directors or Director-related entities under International Financial Reporting Standards (IFRS) are outlined in note 31 ‘Key Management Personnel’33 ‘Related party transactions’ to the financial statements.Financial Statements.
Executive Director
The Executive Director, Andrew Mackenzie, is not considered independent because of his executive responsibilities. Mr Mackenzie’s appointment as Chief Executive Officer was announced on 20 February 2013, and took effect from 10 May 2013. HeMackenzie does not hold directorships in any other company included in the ASX 100 or FTSE 100, but he previously served as Non-executive Director of Centrica Plc (from September 2005 to May 2013).100.
Conflicts of interest
The UK Companies Act 2006 requires that BHP Billiton Directors avoid a situation where they have, or can have, an unauthorised direct or indirect interest that conflicts, or possibly may conflict, with the Company’s interests, unless approved by non-interested Directors. In accordance with the UK Companies Act 2006, BHP Billiton Plc’s Articles of Association allow the Directors to authorise conflicts and potential conflicts where appropriate. A procedure operates to ensure the disclosure of conflicts and for the consideration and, if appropriate, the authorisation of them by non-conflicted Directors. The Nomination and Governance Committee supports the Board in this process, both by reviewing requests from Directors for authorisation of situations of actual or potential conflict and making recommendations to the Board, and by regularly reviewing any situations of actual or potential conflict that have previously been authorised by the Board, and making recommendations regarding whether the authorisation remains appropriate. In addition, in accordance with Australian law, if a situation arises for consideration in which a Director has a material personal interest, the affected Director takes no part in decision-making. Provisions for Directors’ interests are set out in the Constitution of BHP Billiton Limited.
5.103.11 Board evaluation
The Board is committed to transparency in determining Board membership and in assessing the performance of Directors. The Board evaluates its performance through a combination of both internal peer and externally facilitated assessments. Contemporary performance measures are considered an important part of this process. Directors’ performance is also measured against their individual development plans.
The Board conducts regular evaluations of its performance, the performance of its committees, the Chairman, individual Directors and the governance processes that support the Board’s work. The Board evaluation process comprises both assessment and review, as summarised in the diagram below. This includes analysis of how the Board and its Directors are functioning, the time spent by the Board considering matters and whether the terms of reference of the Board committees have been met, as well as compliance with theBoard Governance Document.
The assessmentevaluation considers the balance of skills, experience, independence and knowledge of the Board’s performance is conducted by focusing on individual Directors and Board committees in one yearCompany and the Board, its overall diversity, including gender, and how the Board works together as a whole in the following year. Our approach has been to conduct an externally facilitated review of the Board of Directors and committees at least every two years. This year, due to the appointment of the new CEO and the changes to the management structure, the FY2013 Board assessment was internally rather than externally facilitated. The next external review will be conducted in early FY2014. This will provide an opportunity for the new structure to become sufficiently established for a meaningful review, while also adhering to our commitment of continuous improvement.
unit. In addition, each year the Board, with the assistance of the Nomination and Governance Committee, conducts a review of the performance of each Director seeking re-election and uses the results of that review when considering whether to recommend the re-election of each Director. As the Board has adopted a policy of annual election, this effectively means that all Directors are subject to a performance review annually should they wish to remain on the Board.
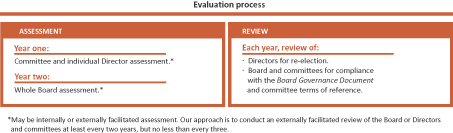
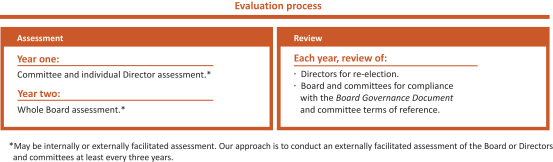
Directors provide anonymous feedback on their peers’ performance and individual contributions to the Board, which is passed on to the relevant Director via the Chairman. In respect of the Chairman’s performance,
Directors provide feedback directly to either Dr Schubert or Sir John Buchanan asthe Senior Independent Director to be passed on anonymously to the Chairman.Director. External independent advisers are engaged to assist with these processes, as necessary. The involvement of an independent third party has assisted in the evaluation processes being rigorous, fair and ensuring continuous improvement in the operation of the Board and committees, as well as the contributions of individual Directors.
Director evaluation
The evaluation of individual Directors focuses on the contribution of the Director to the work of the Board and the expectations of Directors as specified in the Group’s governance framework. The performance of individual Directors is assessed against a range of criteria, including the ability of the Director to:
consistently take the perspective of creating shareholder value;
contribute to the development of strategy;
understand the major risks affecting the Group;
provide clear direction to management;
contribute to Board cohesion;
commit the time required to fulfil the role and perform their responsibilities effectively;
listen to and respect the ideas of fellow Directors and members of management.
Board effectiveness
The effectiveness of the Board as a whole and of its committees is assessed against the accountabilities set down in theBoard Governance Document and each committee’s terms of reference. Matters considered in evaluations include:
the effectiveness of discussion and debate at Board and committee meetings;
the effectiveness of the Board’s and committees’ processes and relationship with management;
the quality and timeliness of meeting agendas, Board and committee papers and secretariat support;
the composition of the Board and each committee, focusing on the blend of skills, experience, independence and knowledge of the Group and its diversity, including geographic location, nationality and gender.
The process is managed by the Chairman, butwith feedback on the Chairman’s performance isbeing provided to him by Dr Schubert.
Information about the performance review process for executives is set out in section 5.15.3.16.
Evaluations conducted in FY2013FY2015
During the year under review, the Board conducted a an internal review of compliance with theBoard performance assessment,Governance Document; an assessment of each Director and reviewed the work and performanceexternally facilitated evaluation of the committees in accordance with the processes outlined above, allBoard committees; and an externally facilitated evaluation of which were internally facilitated.individual Directors.
Board assessmentreview
The internal review conducted over three meetings, covered effectiveness of focused on compliance with theBoard meetings, the nature and format of Board materials, as well as training and development. A range of improvements to the Board’s work and effectiveness were agreed, including:
introducing formal strategy days to the Board program to support the discussions of strategy that currently take place between management and the Board at each meeting;
implementing an updated plan for Board engagement on strategy, execution and monitoring;
effective methods for engaging on the increasing number of Board matters considered out of session;
increased use of the committee report-out process, which is used for committee chairmen to summarise the key discussions;
new items for the training and development of Directors;
updating the format of materials provided to the Board.
Governance Document. The review of the Board as a whole alsoincluded analysis of matters considered by the Board, matters referred by management, monitoring and assurance, and site visits. The review indicated that the Board is continuing to function effectively and in accordance with the terms of theBoard Governance Document.
Director assessment
As reported last year,In respect of FY2015, an externally facilitated assessmentevaluation of each Director was completed in FY2012. Therefore,conducted using the FY2013 review was internally facilitatedelectronic Lintstock service. Lintstock is a UK-based provider of corporate advice, which has no other connection to the BHP Billiton Group. Completed evaluations for individual Directors were submitted to the Chairman, and the overall findings were presentedChairman’s evaluation was submitted to Dr Schubert. The evaluation found that the Board was described as cohesive and discussed. Each Director was providedcollegiate in nature with feedback on their individual and collective contribution toeffective engagement, particularly when addressing difficult issues. The review also noted that as the Board continues to progress through this period of transition, the willingness to speak up, and its committees. This review supported the Board’s decisioneffective working relationships, will continue to endorse all retiring Directors standing for re-election.be an area of focus.
Committee assessment
The assessment conducted this year focused on matters assessed against termsIn respect of reference, time spent by the committees in considering matters, quality of information received, time management and composition, the workFY2015, an externally facilitated evaluation of each Board committee quality of Board and committee interface, and compliance with corporate governance requirements. These reviews utilised anwas conducted using the electronic survey tool provided by Lintstock and were focusedservice. The evaluation was designed to draw out views on work, process and overall effectiveness decision-making and other processes. Outcomes and recommendationsof the committees. Some of the outcomes from each committee will be considered and approved byof the Board prior to implementation.
In addition, as partcommittee evaluations are set out in section 3.14. The assessments determined that each of the process for reviewing theBoard Governance Document, the opportunity was takencommittees continues to review each committee’s terms of referencefunction effectively. Potential enhancements related to continuing to ensure that the Group’s existing practices remain appropriate. A summaryBoard, the Group and its systems and processes are right-sized for a simplified BHP Billiton following the demerger of the changes made to the terms of reference of each committee is set out under the relevant committee report in section 5.13.South32.
Enhancements following previous evaluations
Board and committee evaluations conducted in recent years have led to a number of enhancementsimprovements to Board meeting processes:
Chairman’s matters: For some time,processes to enhance the Board’s work and effectiveness. Following the external assessment of the Board has held a closed session at the end of Board meetings. An additional closed session has been incorporated so that all Board meetings start with a closed session of all Directors (there are no membersin FY2014, changes included streamlining of the GMC present other thanBoard meeting processes and procedures, the Executive Directorintroduction of regular Asset President meetings to allow Board members to engage with operating executives on a broad range of issues, and formalisation of the President Governancefocused Board strategy forum. In addition, as a result of the assessment, the Finance Committee was dissolved and Group Company Secretary). This allows the Chairman to outline matters to be considered byits responsibilities allocated between the Board and the Risk and Audit Committee. Further information is set the context for the meeting. It is also an opportunity for Directors to raise the items of business they believe warrant particular attention or any other relevant issues.out in section 3.14.5.
Assurance items: The Board agenda provides more time for reports from the committee chairmen to the Board. This ensures that the Board is properly and formally informed of the work of its committees and relevant committee papers are also provided to the Board. Where appropriate, presentations made to committees are also presented to the Board during its meeting.
Training and development: Sessions are scheduled during the Board meeting program.
Closed session: Directors continue to have the opportunity to raise matters during the closed session at the end of each Board meeting, which is attended only by the Non-executive Directors.
5.113.12 Board meetings and attendance
The Board meets as often as necessary to fulfil its role. Directors are required to allocate sufficient time to the Group to perform their responsibilities effectively, including adequate time to prepare for Board meetings. During the reporting year, the Board met 1110 times, with fivesix of those meetings being held in Australia threeand four in the United Kingdom and three in the United States.Kingdom. Regularly scheduled Board meetings run over three days (including committee meetings and Director training and development sessions).
Members of the GMC and other members of senior management attended meetings of the Board by invitation. Senior managers delivered presentations on the status and performance of our Businesses and matters reserved for the Board, including the approval of budgets, annual financial statementsFinancial Statements and strategy.
Attendance at Board and standing Board committee meetings during the year ended 30 June 2013FY2015 is set out in the table below.
Attendance at Board and Board committee meetings during the year ended 30 June 2013
| | | | Board | | | Risk
and Audit | | | Nomination
and
Governance | | | Remuneration | | | Sustainability | | | Finance | | | Board | | | Risk
and Audit | | | Nomination and
Governance | | | Remuneration | | | Sustainability | | | Finance | |
| | | A | | | B | | | A | | | B | | | A | | | B | | | A | | | B | | | A | | | B | | | A | | | B | | | A | | | B | | | A | | | B | | | A | | | B | | | A | | | B | | | A | | | B | | | A | | | B | |
Malcolm Brinded | | | | 10 | | | | 10 | | | | | | | | | | | | | | | | 6 | | | | 6 | | | | | |
Malcolm Broomhead | | | 11 | | | | 11 | | | | – | | | | – | | | | – | | | | – | | | | – | | | | – | | | | 7 | | | | 7 | | | | 11 | | | | 11 | | | | 10 | | | | 10 | | | | 3 | | | | 3 | | | | | | | | | | | | 6 | | | | 6 | | | | 2 | | | | 2 | |
John Buchanan | | | 11 | | | | 10 | | | | – | | | | – | | | | 6 | | | | 5 | | | | 9 | | | | 9 | | | | – | | | | – | | | | – | | | | – | | | | 10 | | | | 8 | | | | | | | | 5 | | | | 4 | | | | 7 | | | | 5 | | | | | | | | | |
Carlos Cordeiro | | | 11 | | | | 11 | | | | – | | | | – | | | | – | | | | – | | | | 9 | | | | 7 | | | | – | | | | – | | | | – | | | | – | | | | 10 | | | | 10 | | | | | | | | | | | | 7 | | | | 7 | | | | | | | | | |
David Crawford | | | 11 | | | | 11 | | | | – | | | | – | | | | – | | | | – | | | | – | | | | – | | | | – | | | | – | | | | 11 | | | | 11 | | | | 4 | | | | 4 | | | | | | | | | | | | | | | | | | | | 2 | | | | 2 | |
Pat Davies | | | 11 | | | | 10 | | | | – | | | | – | | | | – | | | | – | | | | 9 | | | | 9 | | | | – | | | | – | | | | – | | | | – | | | | 10 | | | | 10 | | | | | | | | | | | | 7 | | | | 7 | | | | 3 | | | | 3 | | | | | |
Carolyn Hewson | | | 11 | | | | 11 | | | | 12 | | | | 12 | | | | – | | | | – | | | | – | | | | – | | | | – | | | | – | | | | – | | | | – | | | | 10 | | | | 10 | | | | 4 | | | | 4 | | | | | | | | 7 | | | | 7 | | | | | | | | | |
Marius Kloppers | | | 7 | | | | 6 | | | | – | | | | – | | | | – | | | | – | | | | – | | | | – | | | | – | | | | – | | | | – | | | | – | | |
Andrew Mackenzie | | | 1 | | | | 1 | | | | – | | | | – | | | | – | | | | – | | | | – | | | | – | | | | – | | | | – | | | | – | | | | – | | | | 10 | | | | 10 | | | | | | | | | | | | | | | | | | | | | |
Lindsay Maxsted | | | 11 | | | | 11 | | | | 12 | | | | 12 | | | | – | | | | – | | | | – | | | | – | | | | – | | | | – | | | | 11 | | | | 11 | | | | 10 | | | | 10 | | | | 8 | | | | 8 | | | | | | | | | | | | | | | | 2 | | | | 2 | |
Wayne Murdy | | | 11 | | | | 11 | | | | 12 | | | | 12 | | | | – | | | | – | | | | – | | | | – | | | | – | | | | – | | | | 11 | | | | 11 | | | | 10 | | | | 10 | | | | 8 | | | | 8 | | | | | | | | | | | | | | | | 2 | | | | 2 | |
Jac Nasser | | | 11 | | | | 11 | | | | – | | | | – | | | | 6 | | | | 6 | | | | – | | | | – | | | | – | | | | – | | | | – | | | | – | | | | 10 | | | | 10 | | | | | | | | 5 | | | | 5 | | | | | | | | | | | | | |
Keith Rumble | | | 11 | | | | 10 | | | | – | | | | – | | | | – | | | | – | | | | – | | | | – | | | | 7 | | | | 7 | | | | – | | | | – | | | | 9 | | | | 8 | | | | | | | | | | | | | | | | 5 | | | | 5 | | | | | |
John Schubert | | | 11 | | | | 11 | | | | – | | | | – | | | | 6 | | | | 6 | | | | 9 | | | | 9 | | | | 7 | | | | 7 | | | | – | | | | – | | | | 10 | | | | 10 | | | | | | | | 5 | | | | 5 | | | | 4 | | | | 4 | | | | 6 | | | | 6 | | | | | |
Shriti Vadera | | | 11 | | | | 11 | | | | 12 | | | | 11 | | | | – | | | | – | | | | – | | | | – | | | | – | | | | – | | | | – | | | | – | | | | 10 | | | | 10 | | | | 8 | | | | 8 | | | | | | | | 3 | | | | 3 | | | | | | | | | |
Column A –A: indicates the number of scheduled and ad-hoc meetings held during the period the Director was a member of the Board and/or committee.
Column B –B: indicates the number of scheduled and ad-hoc meetings attended by the Director during the period the Director was a member of the Board and/or committee.
5.123.13 Director re-election
The Board has adopted a policy, consistent with the UK Corporate Governance Code, under which all Directors must seek re-election by shareholders annually, if they wish to remain on the Board. This policy took effect at the 2011 Annual General Meetings. It replaced the previous system, as set out in the Constitution of BHP Billiton Limited and the Articles of Association of BHP Billiton Plc, under which Directors are required to submit themselves to shareholders for re-election at least every three years. The adoption of annual re-election reflects the Board’s long-standing commitment that where governance principles vary across jurisdictions, the Board will adopt what it considers to be the higher of the prevailing standards.AGMs. The Board believes that annual re-election promotes and supports accountability to shareholders, and theshareholders. The combined voting outcome of the BHP Billiton Plc and BHP Billiton Limited 20122014 AGMs meant that each Director received more than 9798.3 per cent in support of their re-election.
Board support for reappointment is not automatic. Directors who are seeking re-election are subject to a performance appraisal overseen by the Nomination and Governance Committee of the Board. Annual re-election effectively means all Directors are subject to a performance appraisal annually. The Board, on the recommendation of the Nomination and Governance Committee, makes a determination as to whether it will endorse a retiring Director for re-election. The Board will not endorse a Director for re-election if his or her performance is not considered satisfactory. The Board will advise shareholders in the Notice of Meeting will provide information that is material to a shareholder’s decision whether or not to re-elect a Director, including whether or not re-election is supported.supported by the Board.
BHP Billiton does not apply or implement a ‘no vacancy’ rule in relation to Board appointments. Accordingly, Director candidates can be elected to the Board by ordinary resolution and are not required to out-poll an incumbent Director in order to be elected.
5.133.14 Board committees
The Board has established committees to assist it in exercising its authority, including monitoring the performance of the Group to gain assurance that progress is being made towards the corporate purpose within the limits imposed by the Board.
Each of the permanent committees has terms of reference under which authority is delegated by the Board.
The terms of reference for each committee are available online at
www.bhpbilliton.com/home/aboutus/ourcompany/Pages/governance.aspx.
The office of the Company SecretarySecretariat provides secretariat services for each of the committees. Committee meeting agendas, papers and minutes are made available to all members of the Board. Subject to appropriate controls and the overriding scrutiny of the Board, committee chairmen are free to use whatever resources they consider necessary to discharge their responsibilities.
Reports from each of the committees follow.
5.13.1
The terms of reference for each committee are available online at
www.bhpbilliton.com/aboutus/ourcompany/governance.
3.14.1 Risk and Audit Committee Report
Role and focus
The role of the Risk and Audit Committee (RAC) is to assist the Board in monitoring the decisions and actions of the CEO and the Group and to gain assurance that progress is being made towards the corporate purpose within the limits imposed by the Board, as set out in theBoard Governance Document.
The RAC discharges its responsibilities by overseeing:
the integrity of the Group’s financial statements;Financial Statements;
the appointment, remuneration, qualifications, independence and performance of the External Auditor and the integrity of the audit process as a whole;
the plans, performance, objectivity and leadership of the internal audit function and the integrity of the internal audit process as a whole;
the effectiveness of the systems of internal controls and risk management;
the Group’s systems for compliance with applicable legal and regulatory requirements within the RAC’s area of responsibility;
capital management (funding, liquidity, balance sheet management, dividends);
the CEO’s compliance with the relevant CEO limits .limits.
The role of the RAC in the context of the Board’s broader governance framework is summarised in the diagram below. FurtherFor further information about our approach to risk, can be found inrefer to sections 1.71.7.1 and 5.14.
BHP Billiton governance structure – Risk and Audit Committee
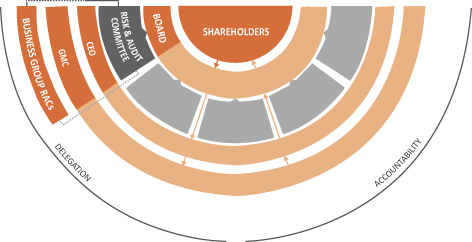
The RAC met 12eight times during the year. Information on meeting attendance by Committee members is included in the table in section 5.113.12 and information on theirCommittee members’ qualifications is includedset out in section 4.1.3.2.1.
In addition to the regular business of the year, the Committee discussed matters including the proposals for change incompliance organisation updates and anti-corruption plan, taxation, funding updates, commodity price protocols, and continued development of the regulatory environment acrossAssurance function. Statements relating to tendering of the jurisdictions in which our securities are listed. These included revisionsexternal audit contract, significant matters relating to the UK Corporate Governance Code, Financial Reporting Council concerns about the reporting of riskStatements and the proposals in respect of audit fromprocess for evaluating the European Commission and the UK Competition Commission. A statement in relation to tendering for external audit isare set out below.
The RAC continues to monitor the debate around reform proposalsregulatory developments in relation to the audit regime and the role of risk and audit committees, from Europe, and will continue to review and assess how these will impact the Group’s responseGroup in the future. In addition, the RAC considered and discussed updates in relation to the updated recommendationsrecently concluded US Securities and Exchange Commission (SEC) anti-corruption investigation, as they progress.
Business Group Risk and Audit committees
To assist management in providingwell as the information necessary to allow the RAC to discharge its responsibilities, Business Group Risk and Audit committees have been established, incorporating each Business, and for key functional areas such as Marketing and Treasury. These committees, known as Business Group RACs, operate as committeesUS Department of management, but are chaired by members of the RAC. The responsible member of the GMC participates in those meetings. Business Group RACs perform an important monitoring function in the overall governance of the Group.
Significant financial and risk matters raised at Business Group RAC meetings are reported to the RAC by the Head of Group Reporting and TaxationJustice investigation, and the Head of Group Risk Assessment and Assurance.ongoing Australian Federal Police (AFP) investigation, which are outlined in section 3.17.
Risk and Audit Committee members during the year
| | |
Name | | Status |
Lindsay Maxsted (Chairman)(a) (1) | | Member for whole period |
Malcolm Broomhead | | Member from 1 January 2015 |
Carolyn Hewson | | Member for whole perioduntil 31 December 2014 |
Wayne Murdy | | Member for whole period |
Shriti Vadera | | Member for whole period |
(a)(1) | Mr Maxsted is the Committee’s financial expert nominated by the Board. |
Business Risk and Audit Committees
To assist management in providing the information necessary to allow the RAC to discharge its responsibilities, Business Risk and Audit Committees have been established, covering each Business, and for key functional areas such as Marketing and Treasury. These committees, known as Business RACs, operate as committees of management, but are chaired by members of the RAC. The responsible member of the GMC participates in those meetings. Business RACs perform an important monitoring function in the overall governance of the Group.
Significant financial and risk matters raised at Business RAC meetings are reported to the RAC by the Head of Group Reporting and the Head of Group Risk Assessment and Assurance.
Activities undertaken during the year
IntegrityFair, balanced and understandable
Directors are required to confirm that they consider the Annual Report, taken as a whole, to be fair, balanced and understandable, and are required to provide the information necessary for shareholders to assess the Group’s performance, business model and strategy.
The Group has a substantial governance framework in place for the Annual Report. This includes management representation letters, CEO and CFO certifications, RAC oversight of the Financial Statements and a range of other financial statementsgovernance procedures focused on the financial section of the Annual Report, together with detailed verification procedures for the narrative reporting section of the Report.
The RAC assistsis required in its terms of reference to provide advice to the Board on whether the Annual Report meets the fair, balanced and understandable requirement. The RAC used the UK Corporate Governance Code provisions to guide its oversight of the project plans that support the preparation of the Annual Report suite, in order to provide the Board with appropriate assurance.
As part of the enhancements to the governance process, which were put in place in FY2014, the following is required:
ensuring all individuals involved in the preparation of any part of the Annual Report are briefed on the fair, balanced and understandable requirement, through training sessions for each content manager that detail the key attributes of ‘fair, balanced and understandable’;
employees who have been closely involved in the preparation of the Financial Statements review the entire narrative for the fair, balanced and understandable requirement, and sign off an appropriate sub-certification;
key members of the team preparing the Annual Report confirm they have taken the fair, balanced and understandable requirement into account and that they have raised, with the Annual Report project team, any concerns they have in relation to meeting this requirement;
the Annual Report suite sub-certification incorporates a fair, balanced and understandable declaration;
in relation to the requirement for the auditor to review parts of the narrative report for consistency with the audited Financial Statements, asking the External Auditor to raise any issues of inconsistency at an early stage.
As a result of the process above, the RAC, and then the Directors, were able to confirm their view that BHP Billiton’s 2015 Annual Report taken as a whole is fair, balanced and understandable. The Board’s statement on the Report is set out in section 5.
Integrity of Financial Statements
In addition to the assurance process above, the RAC continues to assist the Board in assuring the integrity of the financial statements.Financial Statements. The RAC evaluates and makes recommendations to the Board about the appropriateness of accounting policies and practices, areas of judgement, compliance with Accounting Standards, stock exchange and legal requirements and the results of the external audit. It reviews the half-yearly and annual financial statementsFinancial Statements and makes recommendations on specific actions or decisions (including formal adoption of the financial statementsFinancial Statements and reports) the Board should consider in order to maintain the integrity of the financial statements.Financial Statements. From time to time, the Board may delegate authority to the RAC to approve the release of the statements to the stock exchanges, shareholders and the financial community.
TheFor the FY2015 full year and the half year, the CEO and CFO have certified that the 2013Group’s financial statementsrecords have been properly managed and that the 2015 Financial Statements present a true and fair view, in all material respects, of our financial condition and operating results and are in accordance with applicable regulatory requirements.
Significant issues
In addition to the Group’s critical accounting policies and estimates set out in note 44 ‘Application of accounting estimates, assumptions and judgements’ to the 2015 Financial Statements, the Committee also considered the following significant issues:
Carrying value of long-term assets
The Committee reviewed the carrying value of the US Onshore petroleum assets, including goodwill, and concluded that an impairment charge was appropriate. In undertaking the review, specific consideration was given to the most recent short and long-term prices, geological complexity, expected production volumes and mix, amended development plans, operating and capital costs and discount rates.
In addition, the Committee reviewed the carrying value of the following:
conventional onshore assets in north Louisiana, United States;
unconventional gas assets in the Pecos field of the Permian basin;
conventional oil and gas Neptune field in the Gulf of Mexico,
and concluded that impairment charges on these assets were appropriate given specific consideration of most recent prices for both oil and gas.
The Committee reviewed the carrying value of the Nickel West business when the proposed sale of the business was not achieved. Specific consideration was given to most recent prices and foreign exchange rates as well as anticipated cost savings and potential development options.
The Committee reviewed the carrying value of Cerro Colorado and concluded that an impairment charge was appropriate. Specific consideration was given to the recent foreign exchange and copper price curves together with the likelihood of the extension of environmental permits, which directly impacted the life of the asset.
For further information refer to note 12 ‘Intangible assets’ to the Financial Statements.
Tax and royalty liabilities
The Committee reviewed the measurement and disclosure of tax and royalty provisions and contingent liabilities including the following:
transfer pricing estimates impacting taxes and royalties payable in various jurisdictions;
changes in the Chilean Tax law and the repeal of the Minerals Resource Rent Tax in Australia;
other matters where uncertainty exists in the application of the law.
Demerger of South32
The Committee reviewed the measurement and disclosure of the demerger of South32. Specific consideration was given to Discontinued operations disclosures and the fair value of the shares issued to effect the demerger. The Committee also considered measurement issues related to the South32 assets prior to demerger, including the recognised gain on loss of control of the Manganese business and subsequent impairments resulting from the demerged assets being held for distribution.
Closure and rehabilitation provisions
The Committee reviewed the various changes in estimates for closure and rehabilitation provisions recognised during the year. Consideration was given to the results of the most recently completed surveying data, current cost estimates and appropriate inclusion of contingency in cost estimates to allow for both known and residual risks.
External Auditor
The RAC manages the relationship with the External Auditor on behalf of the Board. It considers the reappointment of the External Auditor each year, as well as remuneration and other terms of engagement, and makes a recommendation to the Board. There are no contractual obligations that restrict the RAC’s capacity to recommend a particular firm for appointment as auditor.
The last audit tender was in 2002, at which time the Group had three external auditors following the completion of the DLC merger.structure. The tender resulted in KPMG and PricewaterhouseCoopers being appointed as joint auditors for FY2003 and, therefore, a reduction in audit providers. A competitive audit review was undertaken in 2003, which resulted in KPMG being appointed as the External Auditor by the Board on the recommendation of the RAC.
Following the outcome of the Financial Reporting Council’s consultation on the UK Corporate Governance Code and Guidance on Audit Committees, the Committee considered the new Code provision for tendering the external audit, including the transitional provisions of the Code. The Committee is watching developments with keen interest given the necessity for the Group’s auditor to have international capability and reach, and intends to keep this matter under review.
The lead audit engagement partners in both Australia and the UKUnited Kingdom have been rotated every five years. The current Australian audit engagement partner was appointed forat the FY2010 year-end, and therefore FY2014 will be his last yearstart of involvement before transition to aFY2015. A new engagement partner. The UK audit engagement partner was appointed for the FY2013 year-end, and therefore FY2017 willis scheduled to be his last year.
The Committee has evaluatedis satisfied with the External Auditor’s performance and independence as set out below.and therefore does not believe a tender in the near term is appropriate. Consistent with the UK and EU requirements in regard to audit firm tender and rotation, which were finalised during FY2015, the Committee’s current intention is to conduct an audit firm tender for FY2019.
Evaluation of External Auditor evaluationand external audit process
The RAC evaluates the performance of the External Auditor during its term of appointment against specified criteria, including delivering value to shareholders and the Group.Group, and also assesses the effectiveness of the external audit process. It does so through a range of means, including:
the Committee considers the External Audit Plan, in particular to gain assurance that it is tailored to reflect changes in circumstances from the prior year;
throughout the year, the Committee meets with the audit partners, particularly the lead Australian and UK audit engagement partners, without management present;
following the completion of the audit, the Committee considers the quality of the External Auditor’s performance drawing on survey results. The survey is based on a two-way feedback model where the BHP Billiton and KPMG teams assess each other against a range of criteria. The criteria against which the BHP Billiton team evaluates KPMG’s performance include ethics and integrity, insight, service quality, communication and reporting, and responsiveness;
reviewing the terms of engagement of the External Auditor;
discussing with the audit engagement partners the skills and experience of the broader audit team;
reviewing audit quality inspection reports on KPMG published by the UK Financial Reporting Council;
overseeing (and approving where relevant) non-audit services as described below.
The RAC also reviews the integrity, independence and objectivity of the External Auditor.Auditor, and assesses whether there is any element of the relationship that impairs, or appears to impair, the External Auditor’s judgement of independence. This review includes:
confirming that the External Auditor is, in its judgement, independent of the Group;
obtaining from the External Auditor an account of all relationships between the External Auditor and the Group;
monitoring the number of former employees of the External Auditor currently employed in senior positions within the Group and assessing whether those appointments impair, or appear to impair, the External Auditor’s judgement or independence;Group;
considering whether the various relationships between the Group and the External Auditor collectively impair, or appear to impair, the External Auditor’s judgement or independence;Auditor;
determining whether the compensation of individuals employed by the External Auditor who conduct the audit is tied to the provision of non-audit services and, if so, whether this impairs, or appears to impair, the External Auditor’s judgement or independence;services;
reviewing the economic importance of the Group to the External Auditor and assessing whether that importance impairs, or appears to impair, the External Auditor’s judgement or independence.Auditor.
The External Auditor also certifies its independence to the RAC.
Non-audit services
Although the External Auditor does provide some non-audit services, the objectivity and independence of the External Auditor isare safeguarded through restrictions on the provision of these services. For example, certain types of non-audit serviceservices may only be undertaken by the External Auditor with the prior approval of the RAC (as described below), while other services may not be undertaken at all, including services where the External Auditor:
may be required to audit its own work;
participates in activities that would normally be undertaken by management;
is remunerated through a ‘success fee’ structure;
acts in an advocacy role for the Group.
The RAC has adopted a policy entitled ‘Provision of Audit and Other Services by the External Auditor’, covering the RAC’s pre-approval policies and procedures to maintain the independence of the External Auditor.
Our policy on Provision of Audit and Other Services by the External Auditor can be found on our websiteis available online at
www.bhpbilliton.com/home/aboutus/ourcompany/Pages/governance.aspx.governance.
In addition to audit services, the External Auditor will be permitted to provide other (non-audit) services that are not, and are not perceived to be, in conflict with the role of the External Auditor. In accordance with the requirements of the US1934 Securities Exchange Act and guidance contained in Public Company Accounting Oversight Board (PCAOB) Release 2004-001, certain specific activities are listed in our detailed policy whichthat have been ‘pre-approved’ by the RAC.
The categories of ‘pre-approved’ services are as follows:
Audit services – work that constitutes the agreed scope of the statutory audit and includes the statutory audits of the Group and its entities (including interim reviews). The RAC will monitor the Auditaudit services engagements and approve, if necessary, any changes in terms and conditions resulting from changes in audit scope, Group structure or other relevant events.
Audit-related/assurance services – work that is outside the required scope of the statutory audit, but is consistent with the role of the external statutory auditor. This category includes work that is reasonably related to the performance of an audit or review and is a logical extension of the audit or review scope, is of an assurance or compliance nature and is work that the External Auditor must or is best placed to undertake.
Tax services – work of a tax nature that does not compromise the independence of the External Auditor.
Other advisory services – work of an advisory nature that does not compromise the independence of the External Auditor.
Activities not listed specifically are therefore not ‘pre-approved’ and must be approved by the RAC prior to engagement, regardless of the dollar value involved. Additionally, any engagement for other services with a value over US$100,000, even if listed as a ‘pre-approved’ service, can only be approved by the RAC, and all engagements for other services, whether ‘pre-approved’ or not, and regardless of the dollar value involved, are reported quarterly to the RAC.
While not specifically prohibited by ourBHP Billiton’s policy, any proposed non-audit engagement of the External Auditor relating to internal control (such as a review of internal controls or assistance with implementing the regulatory requirements, including those of the US1934 Securities Exchange Act) must obtain specific prior approval from the RAC. With the exception of the external audit of the Group financial report,Financial Statements, any engagement identified that contains an internal control-related element is not considered to be pre-approved. In addition, while the categories shown above include a list of certain pre-approved services, the use of the External Auditor to perform such services shall always be subject to our overriding governance practices as articulated in the policy.
An exception can be made to the above policy where such an exception is in ourBHP Billiton’s interests and appropriate arrangements are put in place to ensure the integrity and independence of the External Auditor. Any such exception requires the specific prior approval of the RAC and must be reported to the Board. No exceptions were approved during the year ended 30 June 2013.2015.
In addition, the RAC approved no services during the year ended 30 June 20132015 pursuant to paragraph (c)(7)(i)(C) of Rule 2-01 of the SEC Regulation S-X.
Fees paid to the Group’s External Auditor during the year for audit and other services were US$29.630.4 million, of which 6151 per cent comprised audit fees, 3345 per cent related to legislative requirements (including Sarbanes-Oxley)Sarbanes-Oxley and sixservices in connection with the South32 demerger) and four per cent was for other services. Details of the fees paid are set out in note 3538 ‘Auditor’s remuneration’ to the financial statements.Financial Statements.
Based on the review by the RAC, the Board is satisfied that the External Auditor is independent.
Internal Audit
The Internal Audit function is carried out internally by Group Risk Assessment and Assurance (RAA). The role of RAA is to determine whether risk management, control and governance processes are adequate and functioning. The Internal Audit function is independent of the External Auditor. The RAC reviews the mission and charter of RAA, the staffing levels and its scope of work to ensure that it is appropriate in light of the key risks we face. It also reviews and approves the annual internal audit plan.plan and monitors and reviews the overall effectiveness of the internal audit activities.
The RAC also approves the appointment and dismissal of the Head of Group Risk Assessment and AssuranceRAA and assesses his or her performance, independence and objectivity. The role of the Head of Group Risk Assessment and AssuranceRAA includes achievement of the internal audit objectives, risk management policies and insurance strategy. The position was held throughout the year by Stefano Giorgini. Mr Giorgini reported to senior management and had all necessary access to management and the RAC. Following a decision to appoint Mr Giorgini to a line management role in the Group, the Committee appointed Alistair Mytton as Head of Group Risk Assessment and Assurance, effective from FY2014.Mytton. Mr Mytton was formerly Vice President, Finance in BHP Billiton.reports directly to the RAC with functional oversight by the CFO.
Effectiveness of systems of internal control and risk management
In delegating authority to the CEO, the Board has established CEO limits set out in theBoard Governance Document.Document. Limits on the CEO’s authority require the CEO to ensure that there is a system of control in place for identifying and managing risk in the Group. The Directors, through the RAC, review the systems that have been established for this purpose and regularly review their effectiveness. These reviews include assessing whether processes continue to meet evolving external governance requirements.
The RAC is responsible for the oversight of risk management and reviews the internal controls and risk management systems. In undertaking this role, the RAC reviews the following:
procedures for identifying business and operational risks and controlling their financial impact on the Group and the operational effectiveness of the policies and procedures related to risk and control;
budgeting and forecasting systems, financial reporting systems and controls;
policies and practices put in place by the CEO for detecting, reporting and preventing fraud and serious breaches of business conduct and whistle-blowing procedures;
procedures for ensuring compliance with relevant regulatory and legal requirements;
arrangements for protecting intellectual property and other non-physical assets;
operational effectiveness of the Business Group RAC structures;
overseeing the adequacy of the internal controls and allocation of responsibilities for monitoring internal financial controls.
For further discussion on our approach to risk management, refer to sections 1.7 and 5.14.3.15 of this Annual Report. Section 1.7 includes a description of the material risks that could affect BHP Billiton including, but not limited to, economic, environment and social sustainability risks to which the Group has a material exposure. Section 1.7.3 also provides an explanation of how those risks are managed.
During the year, the Board conducted reviews of the effectiveness of the Group’s systems of risk management and internal controls for the financial year and up to the date of this Annual Report in accordance with the UK Corporate Governance Code (including the Turnbull Guidance) and the Principles and Recommendations published by the Australian Securities Exchange (ASX) Corporate Governance Council. These reviews covered financial, operational and compliance controls and risk assessment. During the year, management presented an assessment of the material business risks facing the Group and the level of effectiveness of risk management over the material business risks. The reviews were overseen by the RAC, with findings and recommendations reported to the Board. In addition to considering key risks facing the Group, the Board received an assessment of the effectiveness of internal controls over key risks identified through the work of the Board committees. The Board is satisfied that the effectiveness of the internal controls has been properly reviewed.
Management’s assessment of our internal control over financial reporting
Our management is responsible for establishing and maintaining adequate internal control over financial reporting (as defined in Rule 13a-15(f) and 15d-15(f) under the US1934 Securities Exchange Act of 1934)Act). Under the supervision and with the participation of our management, including our CEO and CFO, we have evaluated the effectiveness of the Group’s internal control over financial reporting has been evaluated based on the framework and criteria established in Internal Controls – Integrated Framework, issued by the Committee of the Sponsoring OrganizationOrganizations of the Treadway Commission (COSO). Based on this evaluation, management has concluded that internal control over financial reporting was effective as at 30 June 2013.2015. There were no material weaknesses in the Group’s internal controls over financial reporting identified by management.
Because of its inherent limitations, internal control over financial reporting may not prevent or detect misstatements and, even when determined to be effective, can only provide reasonable assurance with respect to financial statement preparation and presentation. Also, projections of any evaluation of effectiveness to future periods are subject to the risk that controls may become inadequate because of changes in conditions, or that the degree of compliance with the policies or procedures may deteriorate.
BHP Billiton has engaged our independent registered public accounting firms, KPMG and KPMG Audit PlcLLP, to issue an audit report on our internal control over financial reporting for inclusion in the financial statementsFinancial Statements section of ourthis Annual Report on Form 20-F as filed with the SEC.
There have been no changes in our internal control over financial reporting during FY2013FY2015 that have materially affected, or are reasonably likely to materially affect, our internal control over financial reporting.
The CEO and CFO have certified to the Board that the financial statementsFinancial Statements for the full year and half year are founded on a sound system of risk management and internal control and that the system is operating efficiently and effectively in all material respects.effectively.
During the year, the RAC reviewed our compliance with the obligations imposed by the US Sarbanes-Oxley Act (SOX), including evaluating and documenting internal controls as required by section 404 of the Act.SOX.
Management’s assessment of our disclosure controls and procedures
Our management, with the participation of our CEO and CFO, has performed an evaluation of the effectiveness of the design and operation of our disclosure controls and procedures as of 30 June 2013.2015. Disclosure controls and procedures are designed to provide reasonable assurance that the material financial and non-financial information required to be disclosed by BHP Billiton, including in the reports that it files or submits under the US1934 Securities Exchange Act, of 1934, is recorded, processed, summarised and reported on a timely basis and that such information is accumulated and communicated to BHP Billiton’s management, including our CEO and CFO, as appropriate, to allow timely decisions regarding required disclosure. Based on the foregoing, our management, including the CEO and CFO, has concluded that our disclosure controls and procedures are effective in providing that reasonable assurance.
There are inherent limitations to the effectiveness of any system of disclosure controls and procedures, including the possibility of human error and the circumvention or overriding of the controls and procedures. Accordingly, even effective disclosure controls and procedures can only provide reasonable assurance of achieving their control objectives.
Further, in the design and evaluation of our disclosure controls and procedures, our management was necessarily required to apply its judgement in evaluating the cost-benefit relationship of possible controls and procedures.
Committee reviewassessment
The assessmentAn externally facilitated evaluation of the RACRisk and Audit Committee was conducted this year focused on matters assessed against its terms of reference, time spent by the Committee in considering matters, quality of information received, time management and composition, the work of the Committee, quality of interface between Board and the Committee, and compliance with corporate governance requirements.for FY2015. The review utilised electronic surveys andevaluation was focuseddesigned to draw out views on work, processesprocess and overall effectiveness. Outcomeseffectiveness of the Committee. The evaluation indicated that the Committee continues to operate effectively, with potential enhancements including additional consideration to ensure items such as capital management and recommendations from the review will be considered and approved by the Board prior to implementation.
Terms of reference review
The opportunity was also taken to review the terms of referenceinternal audit are right-sized for the RAC, to ensure the Group’s existing practices remain appropriate. While the terms of reference remained fit for purpose, it was considered prudent to update them to take account of our existing practices that have developed since the last substantive review of the terms of reference, including in relation to Committee report-outs to the Board; more closely reflect the UK Corporate Governance Code and the ASX recommendations, while still taking into account the relevant US rules; and streamline and re-order some of the material to improve the structure and readability of the document.Group following demerger.
The updated terms of reference for the RAC are available online at
www.bhpbilliton.com/home/aboutus/ourcompany/Pages/governance.aspx.governance.
5.13.23.14.2 Remuneration Committee Report
Role and focus
The role of the Remuneration Committee is to assist the Board in overseeing:
the remuneration policy and its specific application to the CEO and the CEO’s direct reports, and its general application to all employees;
the adoption of annual and longer-term incentive plans;
the determination of levels of reward for the CEO and approval of reward to the CEO’s direct reports;
the annual evaluation of the performance of the CEO, by giving guidance to the Group Chairman;
the preparation of the Remuneration Report for inclusion in the Annual Report;
compliance with applicable legal and regulatory requirements associated with remuneration matters;
the review, at least annually, of remuneration by gender.
The role ofSustainability and Risk and Audit Committees assist the Remuneration Committee in the context of BHP Billiton’s broader governance framework is summariseddetermining appropriate HSEC and financial and capital projects metrics, respectively, to be included in the diagram below.
BHP Billiton governance structure – Remuneration Committee
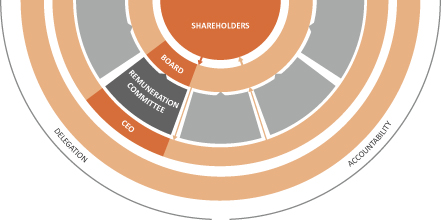
The Remuneration Committee met nineseven times during the year. Information on meeting attendance by Committee members is included in the table in section 5.11.3.12.
Full details of the Committee’s work on behalf of the Board including the review of our remuneration structures conducted by the Committee during FY2013, are set out in the Remuneration Report in section 6.4 of this Annual Report.
Remuneration Committee members during the year
| | |
Name | | Status |
Carolyn Hewson (Chairman)(1) | | Member for whole period |
John Buchanan (Chairman)(1) | | Member for whole period |
Carlos Cordeiro | | Member for whole period |
Pat Davies | | Member for whole period |
John Schubert | | Member for whole perioduntil 31 December 2014 |
Shriti Vadera | | Member from 1 January 2015 |
| (1) | Carolyn Hewson was appointed as Chairman of the Committee with effect from 1 January 2015. Sir John Buchanan, who was previously the Chairman, continued to be a Committee member for the remainder of FY2015. |
Committee reviewassessment
The assessmentAn externally facilitated evaluation of the Remuneration Committee was conducted this year focused on matters assessed against its terms of reference, time spent by the Committee in considering matters, quality of information received, time management and composition, the work of the Committee, quality of interface between Board and the Committee, and compliance with corporate governance requirements.for FY2015. The review utilised electronic surveys andevaluation was focuseddesigned to draw out views on work, processesprocess and overall effectiveness. Outcomes and recommendations fromeffectiveness of the review will be considered and approved by the Board prior to implementation.
Terms of reference review
Committee. The opportunity was also taken to review the terms of reference for the Remuneration Committee, to ensure the Group’s existing practices remain appropriate. While the terms of reference forevaluation indicated that the Committee remained fitcontinues to perform strongly with potential enhancements including deeper understanding of the views of investors and the allocation of more time for purpose, it was considered prudent to update them to take account of changes to the external corporate governance environment; for example, by including the new New York Stock Exchange (NYSE) / Dodd Frank requirement to consider certain independence factorstraining in relation to remuneration advisers; take account of changes to our own governance practices, including in relation to Committee report-outs to the Board; and streamline and re-order some of the material to improve the structure and readability of the document.market practice as it develops.
The updated terms of reference for the Remuneration Committee are available online at
www.bhpbilliton.com/home/aboutus/ourcompany/Pages/governance.aspx.governance.
5.13.33.14.3 Nomination and Governance Committee Report
Role and focus
The role of the Nomination and Governance Committee is to assist in ensuring that the Board comprises individuals who are best able to discharge the responsibilities of a Director, having regard to the highest standards of governance, the strategic direction of the Group and the diversity aspirations of the Board. It does so by focusing on:
the succession planning process for the Board and its committees, including the identification of the skills, experience, independence and knowledge required on the Board, as well as the attributes required of potential Directors;
the identification of suitable candidates for appointment to the Board, taking into account the skills, experience and diversity required on the Board, and the attributes required of Directors;
the succession planning process for the Chairman;
the succession planning process for the Chief Executive OfficerCEO and periodic evaluation of the process;
Board and Director performance evaluation, including evaluation of Directors seeking re-election prior to their endorsement by the Board (see section 5.12);as set out in sections 3.11 and 3.13;
the provision of appropriate training and development opportunities for Directors;
the independence of Non-executive Directors;
the time required from Non-executive Directors;
the authorisation of situations of actual and potential conflict notified by Directors in accordance with the Articles of Association of BHP Billiton Plc (seeas set out in section 5.9);3.10; and
the Group’s corporate governance practices;practices.
the preparation of a report by the Committee to be included in the Annual Report.
The Board outlined its aspirational goal of increasing the number of women onprocess that the Board to at least three. While we have not appointed any new Non-executive Directors duringadopts for its own succession, with the year, we remain committed to achieving this target. The Nomination and Governance Committee continues to take diversity into account in its deliberations and works continuously to identify future candidates for the Board.
Information regarding the Board’s policy on diversity and the Committee’s role in this regard is set out in sections 5.7 and 5.17.
The Nomination and Governance Committee also has oversight of training and development activity for all Directors. The Board believes this enhances the Committee’s ongoing consideration and review in relation to the appropriate skills mix for the Board.
The roleassistance of the Nomination and Governance Committee, is set out in the context of BHP Billiton’s broader governance framework is summarised in the diagram below.
BHP Billiton governance structure – Nomination and Governance Committee
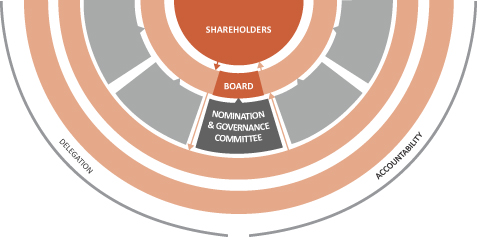
section 3.8.The Nomination and Governance Committee met sixfive times during the year. Information on meeting attendance by Committee members is included in the table in section 5.11.3.12.
Board policy on diversity
The Board and the Nomination and Governance Committee believe that a range of diversity is required in order to effectively represent shareholders’ interests. This diversity is not restricted to gender but also includes geographic location, nationality, skills, background, knowledge and experience.
The Board is committed to ensuring gender diversity is actively pursued and implemented in terms of Board composition. Diversity is a core consideration in ensuring that the Board and its committees have the right balance of skills, experience, independence and Group knowledge necessary to discharge their responsibilities. The right blend of perspectives is critical to ensuring the Board oversees BHP Billiton effectively for shareholders.
For the past three years, two executive search firms, JCA Group and Heidrick & Struggles, have produced all-women short lists focused on the United Kingdom, Europe and the United States, which are continually refreshed. The two lists – combined with our skills and experience profile five-year matrix – ensure we maximise the number of female candidates we talk with and consider for appointment. Short-listed candidates are considered by the Nomination and Governance Committee. During FY2015, the Chairman met regularly with potential female candidates who have a range of backgrounds.
The Board believes that critical mass is important for diversity and, as set out in last year’s Annual Report, the Board had a goal of increasing the number of women on the Board to at least three by the end of CY2015. This has now been achieved with the appointment of Anita Frew to the Board. She brings extensive board, strategy, marketing, governance and risk management experience in the chemicals, engineering, water and finance industries, along with a strong understanding of shareholder expectations. While the Board has achieved its stated goal, diversity of all types remains a priority as the Board continues to be refreshed and renewed, as set out in section 3.8.
External recruitment specialists
There were changes to the composition of the Board during the year, with the appointmentretirement of Mr Mackenzie as CEODavid Crawford with effect from 10the 2014 AGMs and Keith Rumble with effect from 22 May 2013 and2015. The appointment of Anita Frew
followed a process involving the retirement of Mr Kloppers from the Board. Further details relating to the succession process are set out in section 5.3. The Nomination and Governance Committee retained the services of external recruitment specialists Heidrick & Struggles to continue to assistand JCA Group, who have assisted in the identification of potential candidates for the Board, and remains committed to the target set for Board diversity as set out in more detailsection 3.8.
Aside from conducting external searches, in previous years Heidrick & Struggles Leadership Assessment has provided services in respect of Director performance assessment. JCA Group has also provided non-executive search services and facilitated the external Board assessment. In both cases, the search and assessment services operate independently, and neither firm has any other connection with the Group.
Senior Independent Director
As set out in section 5.7.
3.7, in August 2015 the Board announced that Shriti Vadera had been appointed as Senior Independent Director of BHP Billiton Plc. The NominationBoard believes that Shriti Vadera’s skills and Governance Committee also oversawattributes, together with her experience with BHP Billiton over the Director Trainingpast four years will enable her to support the Chairman and Development Program for FY2013.the Board in this important governance role.
Nomination and Governance Committee members during the year
| | |
Name | | Status |
Jac Nasser (Chairman) | | Member for whole period |
John Buchanan | | Member for whole period |
John Schubert | | Member for whole period |
Committee reviewassessment
The assessmentAn externally facilitated evaluation of the Nomination and Governance Committee was conducted this year focused on matters assessed against its terms of reference, time spent by the Committee in considering matters, quality of information received, time management and composition, the work of the Committee, quality of interface between Board and the Committee, and compliance with corporate governance requirements.for FY2015. The review utilised electronic surveys andevaluation was focuseddesigned to draw out views on work, processesprocess and overall effectiveness. Outcomes and recommendations fromeffectiveness of the review will be considered and approved byCommittee. The evaluation indicated that the Committee continues to function strongly. A requirement for additional focus during succession planning on ensuring the Board prior to implementation.
Termsis the appropriate size, and has the right mix of reference review
The opportunityskills and experience, for a simplified BHP Billiton was also taken to review the terms of reference for the Nomination and Governance Committee, to ensure the Group’s existing practices remain appropriate. Key changes that were madenoted as parta result of the update
were to add a new section extending the role of the Committee to cover the Group’s Corporate Governance practices and changing its name to the Nomination and Governance Committee; take account of changes to our own governance practices, including in relation to Committee report-outs to the Board; and streamline and re-order some of the material to improve the structure and readability of the document.
The changes relating to the Group’s Corporate Governance practices include formal recognition of the Nomination and Governance Committee’s role in reviewing and recommending the Corporate Governance Statement for the Board’s approval; advising the Board on applicable governance requirements; recommending the appropriate explanation for departures from ‘comply or explain’ standards; advising the Board periodically with respect to significant developments in the law and practice of corporate governance; and making recommendations to the Board on all matters of corporate governance, including any proposed changes to existing structures or practices. These amendments mean that the terms of reference for the Nomination and Governance Committee now meet the requirements of Section 303A of the Listed Company Manual followed by US companies, in that it includes the purpose for developing and recommending to the Board a set of Corporate Governance principles applicable to the Company. This reflects the Board’s commitment to continuous review.evaluation.
The updated terms of reference for the Nomination and Governance Committee are available online at
www.bhpbilliton.com/home/aboutus/ourcompany/Pages/governance.aspx.governance.
5.13.43.14.4 Sustainability Committee Report
Role and focus
The role of the Sustainability Committee is to assist the Board to take reasonable steps in overseeing the:
adequacy of the Group’s HSEC framework, which consists of:
the CEO limits, which delegate authority to the CEO, including for HSEC matters;
| – | the CEO limits, which delegate authority to the CEO, including for HSEC matters; |
the Committee itself and its terms of reference;
| – | the Committee itself and its terms of reference; |
a robust independent assurance and audit process, established by the RAC;
| – | a robust independent assurance and audit process, established by the RAC; |
independent legal and specialist advice on HSEC matters;
| – | independent legal and specialist advice on HSEC matters; |
the Group’s HSEC Management System;
| – | the Group’s HSEC Management System; |
adequacy of the Group’s HSEC Management System, which is designed and implemented by management. It incorporates the systems and processes, resources, structures and performance standards for the day-to-day identification, management and reporting of HSEC risks and obligations, which are articulated in Group Level Documents;
Group’s compliance with applicable legal and regulatory requirements associated with HSEC matters;
Annualannual Sustainability Report;
performance, resourcing and leadership of the HSEC function;HSE and Community functions;
Group’s performance in relation to HSEC matters, including the HSEC component of the GMC scorecard.
Our approach to sustainability is reflected inOur Charter, which defines our values, purpose and how we measure success, and in our sustainability performance targets, which define our public commitments to safety, health, environment and environmental and social responsibility.community. Further information is set out in the Group’s Sustainability Report. Report 2015.
A copy of the Sustainability Report and further information is available online at
www.bhpbilliton.com/aboutus/ourcompany/governance.
The Committee provides oversight of the preparation and presentation of the Sustainability Report by management, including oversight of internal control systems relevant tomanagement.
The Sustainability Committee met six times during the preparation ofyear. Information on meeting attendance by Committee members is included in the Sustainability Report.
table in section 3.12.The role ofDuring the year, the Sustainability Committee continued to assist the Board in its oversight of HSEC issues and performance. This included consideration of strategic HSEC issues, audits and trends, and the context of BHP Billiton’s broader governance framework is summarised in the diagram below.
BHP Billiton governance structure –findings and action items from accidents and other incidents. In relation to incidents, tragically there were five work-related fatalities during FY2015. The Sustainability Committee has been presented with the findings and recommendations of the investigations in each case. This included direct causes, root causes and contributing factors, along with the priority actions and responses of the management and Business teams.
Sustainability Committee members during the year
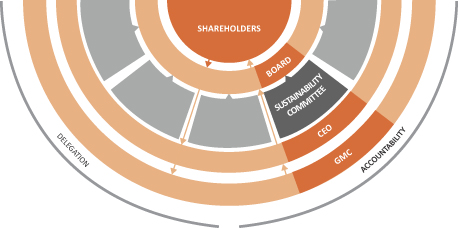
| | |
Name | | Status |
John Schubert (Chairman) | | Member for whole period |
Malcolm Brinded | | Member for whole period |
Malcolm Broomhead | | Member for whole period |
Pat Davies | | Member from 1 January 2015 |
Keith Rumble | | Member until 22 May 2015 |
Sustainable development governance
Our approach to HSEC and sustainable development governance is characterised by:
the Sustainability Committee overseeing material HSEC matters and risks across the Group;
management having primary responsibility for the design and implementation of an effective HSEC management system;
management having accountability for HSEC performance;
the HSEC functionHSE and Community functions providing advice and guidance directly to the Sustainability Committee and the Board as well as through a series of networks across the Group;whole;
seeking input and insight from external experts, such as ourthe BHP Billiton Forum foron Corporate Responsibility;
clear links between remuneration and HSEC performance.
The Sustainability Committee met seven times during the year. Information on meeting attendance by Committee members is included in the table in section 5.11.
During the year, the Sustainability Committee continued to assist the Board in its oversight of HSEC issues and performance. This included consideration of strategic environmental and community issues, HSEC audits and trends, and the findings and action items from accidents and other incidents.
The key areas on which the Committee, management and the HSEC functionHSE and Community functions focus are outlined in the diagram below.
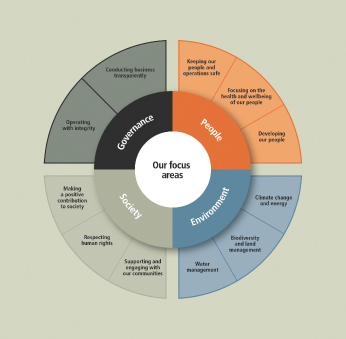

In addition to our focus on the health, safety and wellbeing of our people, the Committee spent considerable time considering environment and climate change scenarios and the actions being taken to manage the implications of climate change regulation in light of the Group’s public target for emissions through to FY2017, as set out in section 2.8.81.14.2.
Climate change
Climate change is treated as a Board-level governance issue with the Sustainability Committee playing a key supporting role. The Committee, along with the Risk and Audit Committee, spends considerable time considering systemic climate change considerations relating to the resilience of, this Annual Report.and opportunities for, the Group’s portfolio. The Committee also receives reports on scenarios and sign posts, which point to longer-term directional change and considers actions to manage the implications of climate change on the Company. Further information on our climate change position and how we consider the impacts on our portfolio is set out in section 1.14.2.
Community investment
We also continued to monitor our progress in relation to our community contributioninvestment, and met our target for investments in community programs, with such investments consisting of cash, in-kind support and administration. This was the equivalent of one per cent of our pre-tax profits, calculated on the average of the previous three years’years pre-tax profit. In total, we investedDuring FY2015, our voluntary community investment totalled US$245.8225 million, in community programs, includingcomprising US$106142 million contributedof cash, in-kind support and administrative costs and a US$83 million contribution to the BHP Billiton Foundation.
The Committee reviewed and recommended to the Board the approval of the annual Sustainability Report for publication. The Sustainability Report identifies our targets for HSEC matters and our performance against those targets, with an emphasis on fact-based measurement and quality data in setting targets. The Committee reviewed
HSEC matters and recommended to the Board the public targets for FY2013 – FY2017.remuneration
In order to link HSEC matters to remuneration, 1520 per cent of the short-term incentive opportunity for GMC members was based on HSEC performance during the year. For FY2014 performance,Given the weighting of this metric will moveimportance placed on safety, the short-term incentive opportunity attached to 20HSEC has been increased for FY2016 to 25 per cent. The Sustainability Committee assists the Remuneration Committee in determining appropriate HSEC metrics to be included in GMC scorecards, and also assists in relation to assessment of performance against those measures. The Board believes this method of assessment is transparent, rigorous and balanced, and provides an appropriate, objective and comprehensive assessment of performance. Further information on the metrics and their assessment is set out in the Remuneration Report.Report in section 4.
In addition, during the year, the Committee considered Directors’ duties under the Australian Model Work Health and Safety legislative reforms. The current approach taken by the Board, the Committee and GMC allows Directors and Officers of the Group to meet the due diligence requirements.assessment
A copy of the Sustainability Report and further information can be found on our website atwww.bhpbilliton.com/home/aboutus/sustainability/Pages/default.aspx.
Sustainability Committee members during the year
| | |
Name
| | Status
|
John Schubert (Chairman)
| | Member for whole period |
Malcolm Broomhead
| | Member for whole period |
Keith Rumble
| | Member for whole period |
Committee review
The assessmentAn externally facilitated evaluation of the Sustainability Committee was conducted this year focused on matters assessed against its terms of reference, time spent by the Committee in considering matters, quality of information received, time management and composition, the work of the Committee, quality of interface between Board and the Committee, and compliance with corporate governance requirements.for FY2015. The review utilised electronic surveys andevaluation was focuseddesigned to draw out views on work, processesprocess and overall effectiveness. Outcomes and recommendations from the review will be considered and approved by the Board prior to implementation.
Terms of reference review
The opportunity was also taken to review the terms of reference for the Sustainability Committee, to ensure the Group’s existing practices remain appropriate. Key changes that were made as parteffectiveness of the update were to more clearly reflect the specific responsibilities ofCommittee. The evaluation indicated that the Committee (and management) having regardreceives high-quality information and uses time effectively. Additional areas of focus for FY2016 are an increased emphasis on community issues and continuing to the due diligence obligations specified in the Australian Model Work Health and Safety legislative reforms; and to ensure that the nature and form of material and advice to be presented for consideration by the Committee is clear and referable to the terms of reference and obligations of the Directors.undertake site visits.
The updated terms of reference for the Sustainability Committee are available online at
www.bhpbilliton.com/home/aboutus/ourcompany/Pages/governance.aspx.governance.
5.13.53.14.5 Finance Committee Report
RoleIn FY2012, the continued evolution of the Board and focus
The roleits committees resulted in the formation of the Finance Committee. At that time, the Board was of the view that the governance structure was enhanced by a committee focused on capital management planning, including capital allocation and funding, as well as due diligence on divestments.
As noted in last year’s Annual Report, the Finance Committee is to assistalso assisted the Board in its consideration for approval and ongoing oversight of matters pertaining to:
capital structure and funding;
capital management planning and initiatives, including capital allocation;
due diligence on acquisitions and investments, including proposals that may have a material impact on the Group’s capital position;
matters the Board may refer to the Committee from time to time in connection with the Group’s capital position.
Upon its establishment in April 2012, the Board made a commitment to evaluate the role and function of the Finance Committee 12 months after its formation. In the past year, the Committee has focused on capital structure, funding, capital management planning and due diligence on divestments, including the Yeelirrie uranium deposit, EKATI Diamond Mine, the interest in the West Browse Joint Venture, the Pinto Valley copper mine and the extensioncreation of the long-term joint venture relationship at the Jimblebar iron ore mine. Given our continued focus on capital management, the Board believes that the Committee adds value to the governance of the Group and should continue to operate under its terms of reference. Recognising that the focus of the Committee’s activities encompasses matters of strategy reserved for the Board, the Committee does not,South32 as a mattermeans of course, have a decision-making role. Instead, its focus is to advise the Board and make recommendations. The Board may, where it considers it appropriate, delegate decision-making power to the Committee in relation to specific matters.
The Board recognised that in establishing a new Board committee, it is important to avoid introducing complexity or overlap in the current governance framework. The matters specified for the consideration of the Finance Committee are not within the current scope or mandate of any of the other Board committees (because they were previously dealt with by ad-hoc committees). However, to avoid any perceived overlap of
responsibilities, the terms of reference of each of the Finance Committee and the Risk and Audit Committee allow the respective committee chairmen to agree the most appropriate committee to fulfil the obligation in question. The role of the Finance Committee in the context of BHP Billiton’s broader governance framework is summarised in the diagram below.
BHP Billiton governance structure – Finance Committee
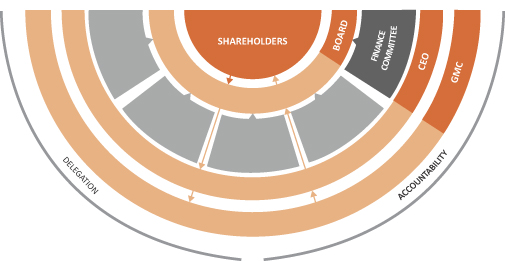
The Committee met 11 times during the year. Information on meeting attendance by Committee members is included in the table in section 5.11.
During the year, the Finance Committee continued to assist the work of the Board by considering matters relating to capital structure and funding, capital management planning and initiatives, capital expenditure prioritisation, divestments and other matters referred to the Committee.accelerating portfolio simplification. The Committee’s considerations resulted in recommendations to the Board on the matters considered.
Since that work was largely completed, the Board undertook a review of the Finance Committee and it was decided that with effect from 1 January 2015, a separate focused committee was no longer required by the Board. The work around capital management (funding, liquidity, balance sheet management, dividends), which was previously handled by the Finance Committee, has become part of the terms of reference for the Risk and Audit Committee.
The Finance Committee met twice in the period 1 July 2014 to 31 December 2014.
Finance Committee members during the year
| | |
Name | | Status |
David Crawford (Chairman) | | Member for whole perioduntil 20 November 2014 |
Malcolm Broomhead | | Member for whole period(1) |
Lindsay Maxsted | | Member for whole period(1) |
Wayne Murdy | | Member for whole period(1) |
| (1) | Refers to whole period of the Committee’s existence during FY2015, being from 1 July 2014 to 31 December 2014. |
3.14.6 South32 demerger – Board committees
In August 2014, the Board announced plans to simplify its portfolio by creating an independent global metals and mining company (South32) based on a selection of its high-quality alumina, aluminium, coal, manganese, nickel, silver, lead and zinc assets. As part of the Board governance process supporting and overseeing the demerger project, it was considered appropriate to establish two sub-committees of the Board, the Board Assurances Committee reviewand the Document Review Committee.
Board Assurances Committee
Members of the Board Assurances Committee (BAC) were all independent Non-executive Directors of the BHP Billiton Board: Shriti Vadera (Chairman), Malcolm Broomhead, David Crawford, Lindsay Maxsted and Wayne Murdy. The Board Chairman, the Chief Executive Officer and the Chairman of the Document Review Committee attended each of the meetings by invitation.
The assessmentBAC was tasked with considering the transaction plans and project execution, including reviewing and making recommendations to the Board on matters such as:
the timetable for the project;
the outcome of external stakeholder engagement and the progress of engagement with regulators;
proposed internal and external communications;
the Transitional Services Agreement, the Separation Deed, the Tax Separation Deed and the Implementation Deed, each between BHP Billiton and South32;
the funding of South32;
the steps required to implement the demerger proposal, including assembly of the various assets.
Project-related matters that would previously have been considered by the Finance Committee conducted this year focused on matters assessed against its terms of reference, time spentwere considered by the BAC.
The Committee in considering matters, qualitymet five times and also considered some items out of information received, time management and composition, the worksession. The final recommendation of the Committee qualitywas to endorse the demerger and to recommend it for Board approval.
Document Review Committee
Members of interface between Boardthe Document Review Committee (DRC) were Carolyn Hewson (Chairman), David Crawford, Lindsay Maxsted, Peter Beaven, Geoff Healy, Graham Kerr, Jane McAloon, Karen Wood and Neil Beaumont, as well as certain external advisers.
The role of the Committee,DRC included:
reviewing the overall nature and compliancescope of the due diligence investigations undertaken in connection with corporate governance requirements. The review utilised electronic surveysthe demerger;
approving the materiality guidelines to be applied in the preparation of the disclosure documents;
reviewing and was focusedwhere applicable, requesting reports and sign-offs from nominated persons (including BHP Billiton and South32 management and legal, tax, accounting, mineral reserves or other experts) in relation to draw out views on work, processesthe content of the disclosure documents;
overseeing and overall effectiveness. Outcomescoordinating the preparation and recommendations fromfinalisation of the review will be considereddisclosure documents to ensure that they complied with applicable legal and approved byregulatory requirements;
reporting to the Board, prior to
implementation.Terms of reference review
The opportunity was also taken to review the terms of reference for the Finance Committee, to ensure the Group’s existing practices remain appropriate. While the terms of reference for the Committee were adopted in 2012, and remained fit for purpose, it was considered prudent to conduct a detailed review. A clause relating to
capital allocation was specifically added reflecting the workdispatch of the Finance Committee. Other changes were made to harmonise clauses in the meetings’ procedures sectiondisclosure documents, confirming that they comply with the RAC’s termsrelevant content requirements.
The Committee met nine times and also considered some items out of reference.session.
The updated termsWith the completion of reference for the Finance Committee are available online atSouth32 demerger in May 2015, both the BAC and DRC sub-committees have been dissolved. For further information on the South32 demerger, refer to sections 1.3.7, 1.6.4, 2.1.7 of this Annual Report and note 29 ‘Discontinued operations’ to the Financial Statements.
www.bhpbilliton.com/home/aboutus/ourcompany/Pages/governance.aspx.
5.143.15 Risk management governance structure
We believe that the identification and management of risk isare central to achieving the corporate purpose of creating long-term shareholder value. Our approach to risk is set out in section 1.7.1.7.1.
The principal aim of the Group’s risk management governance structure and internal control systems is to identify, evaluate and manage business risks, with a view to enhancing the value of shareholders’ investments and safeguarding assets.
Each year, the Board reviews and considers the Group’s risk profile, for the whole Group. This risk profilewhich covers both operational and strategic risks. The Group material risk profile is assessed to ensure it supports the achievement of the Group’s strategy while maintainingseeking to maintain a solid ‘A’ credit rating. The Board’s approach to investment decision-making and portfolio management, and the consideration of risk in that process, is set out in sections 1.6.4 and 1.7 and includes a broad range of scenarios to assess our portfolio. This process allows us to be able to continually adjust the shape of our portfolio to match energy and commodity demand and meet society’s expectations, while maximising shareholder returns.
The Board has delegated the oversight of risk management to the RAC, although the Board retains overall accountability for the Group’s risk profile. In addition, the Board specifically requires the CEO to implement a system of control for identifying and managing risk. The Directors, through the RAC, review the systems that have been established for this purpose, and regularly review their effectiveness.the effectiveness of those systems and monitor that necessary actions have been taken to remedy any significant failings or weaknesses identified from that review. The RAC regularly reports to the Board to enable it to review the Group’s risk framework.
The RAC has established review processes for the nature and extent of material risks taken in achieving our corporate purpose. These processes include the application of materiality and tolerance criteria to determine and assess material risks. Materiality criteria include maximum foreseeable loss and residual risk thresholds and are set at the Group Business and Asset organisational levels.level. Tolerance criteria additionally assess the control effectiveness of material risks.
The diagram below outlines the risk reporting process.
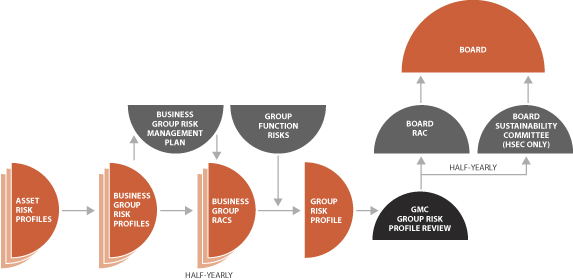
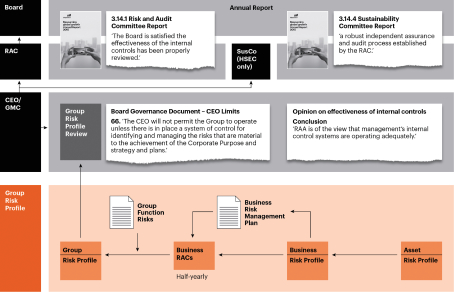
Management has put in place a number of key policies, processes, performance requirements and independent controls to provide assurance to the Board and the RAC as to the integrity of our reporting and effectiveness of our systems of internal control and risk management. Some of the more significant internal control systems include Board and management committees, Business Group RACs and internal audit.
Business Group Risk and Audit Committeescommittees
The Business Group RACs assist the RAC to monitor the Group’s obligations in relation to financial reporting, internal control structure, risk management processes and the internal and external audit functions.
Board committees
Directors also monitor risks and controls through the RAC, the Remuneration Committee and the Sustainability Committee.
Management committees
Management committees also perform roles in relation to risk and control. Strategic risks and opportunities arising from changes in our business environment are regularly reviewed by the GMC and discussed by the Board. The Financial Risk Management Committee (FRMC) reviews the effectiveness of internal controls relating to commodity price risk, counterparty credit risk, currency risk, financing risk, interest rate risk and insurance. Minutes of the GMC and the FRMC meetings are provided to the Board.Board through the RAC. The Investment Committee (IC) provides oversight for investment processes across the Company and coordinates the investment toll-gating process for major investments. Reports are made to the Board on findings by the Investment CommitteeIC in relation to major capital projects. The Disclosure Committee oversees the Group’s compliance with securities dealing and continuous and periodic disclosure requirements, including reviewing information that may require disclosure through stock exchanges and overseeing processes to ensure information disclosed is timely, accurate and complete.
5.153.16 Management
Below the level of the Board, key management decisions are made by the CEO, the GMC, other management committees and individual members of management to whom authority has been delegated.
Following the appointment of Andrew Mackenzie as CEO, a new senior management team was announced, effective from 10 May 2013. Following the changes, Mike Henry, Graham Kerr and Karen Wood remain as GMC members ensuring a strong balance of existing and new membership of the team, and both Mr Henry and Mr Kerr have assumed enhanced responsibilities. The new GMC also has a strong emphasis on functional excellence with the addition of two roles. Geoff Healy, formerly a partner of Herbert Smith Freehills, joined the GMC as Chief Legal Counsel and Jane McAloon joined as President, Governance and Group Company Secretary.
On 27 August Mike Fraser was appointed to the GMC as President, Human Resources: part of the role previously held by Karen Wood, who remains a member of the GMC as President, Public Affairs. Having completed the transition activities associated with the appointment of Andrew Mackenzie as CEO she continues to assist Andrew on a range of specific corporate and Board issues including, development and succession and executive remuneration.
The GMC now comprises:
Chief Executive Officer: Andrew Mackenzie
President, Copper: Peter Beaven
President, Petroleum and Potash: Tim Cutt
President, Coal: Dean Dalla Valle
President, Human Resources: Mike Fraser
Chief Legal Counsel: Geoff Healy
President, HSEC, Marketing and Technology: Mike Henry
Chief Financial Officer: Graham Kerr
President, Aluminium, Manganese and Nickel: Daniel Malchuk
President, Governance and Group Company Secretary: Jane McAloon
President, Iron Ore: Jimmy Wilson
President, Public Affairs: Karen Wood
The diagram below describes the responsibilities of the CEO and four key management committees.
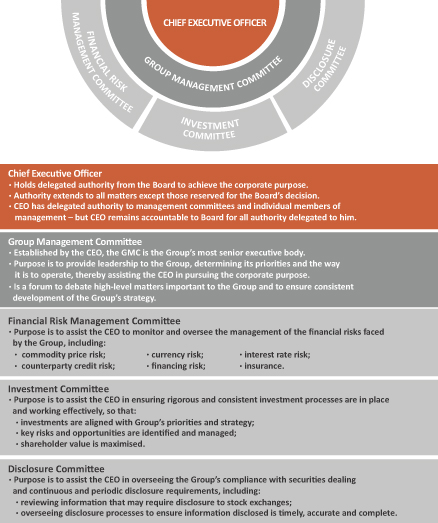
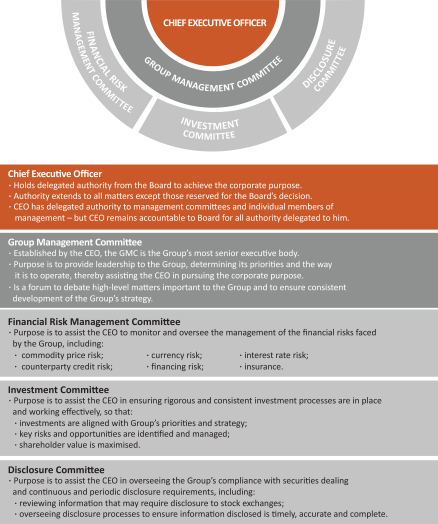
Performance evaluation for executives
The performance of executives and other senior employees is reviewed on an annual basis. For the members of the GMC, this review includes their contribution, engagement and interaction at Board level. The annual performance review process that we employ considers the performance of executives against criteria designed to capture both ‘what’ is achieved and ‘how’ it is achieved. All performance assessments of executives consider
how effective they have been in undertaking their role; what they have achieved against their specified key performance indicators; how they match up to the behaviours prescribed in our leadership modelmodel; and how those behaviours align withOur Charter values. The assessment is therefore holistic and balances absolute achievement with the way performance has been delivered. Progression within the Group is driven equally by personal leadership behaviours and capability to produce excellent results.
A performance evaluation as outlined above iswas conducted for all members of the GMC annually.during FY2015. For the CEO, the performance evaluation iswas led by the Chairman of the Board on behalf of all the Non-executive Directors, drawing on guidance from the Remuneration Committee.
5.163.17 Business conduct
Our Charter and our Code of Business Conduct
We have published theCode of Business Conduct, which reflectsOur Charter is central to our business. It articulates the values of Integritywe uphold, our strategy and Respect. It provides clear direction and advice on conducting business internationally, interacting with communities, governments and business partners and general workplace behaviour. Thehow we measure success.
Our Code of Business Conduct (the Code) is based onOur Charter values and describes the behaviours that we expect of those who work for or on behalf of BHP Billiton. The Code applies to Directorsemployees, directors, officers and to all employees, regardless of their position or location.controlled entities. Consultants and contractors are also expected to act in accordance with the Code when working for BHP Billiton.
The Code describes the behaviours expected to support a safe, respectful and legally compliant working environment, when interacting with governments and the communities in which we operate, when dealing with third parties and when using company resources.
Working with integrity is a condition of employment with BHP Billiton and in some cases a contractual obligation of many of our contractors and suppliers. All employees are required to undertake annual training in relation to the Code to promote awareness and understanding in the behaviours expected of them. Demonstration of the values described inOur Charter and the Code is part of the annual employee performance review process.
The Code of Business Conduct is available online at
www.bhpbilliton.com/aboutus/ourcompany/codeofbusconduct.
EthicsPoint, BHP Billiton’s business conduct advisory service
Where an employee or third party has a concern regarding behaviour that may not be consistent with ourCode of Business Conduct.
, there are reporting options available, which include BHP Billiton’s business conduct advisory service, EthicsPoint. EthicsPoint is a worldwide service available to internal and external stakeholders that facilitates the raising, management and resolution of business conduct queries and concerns via a confidential24-hour, multilingual hotline and online case management system. Reports can be made anonymously and without fear of retaliation. Arrangements are in place to investigate all matters appropriately. Levels of activity and support processes for EthicsPoint are monitored, with activity reports presented to the Board. Further information on EthicsPoint can be found in theThe Code of Business Conduct, available online at www.bhpbilliton.com can be found on our website at.
www.bhpbilliton.com/home/aboutus/ourcompany/Pages/codeofbusconduct.aspx.
Anti-corruption investigation
Following requests for information in August 2009 fromIn May 2015, BHP Billiton announced the resolution of the previously disclosed investigation by the SEC into potential breaches of the US Securities and Exchange Commission (SEC), the Group commenced an internal investigation and disclosed to relevant authorities including theForeign Corrupt Practices Act (FCPA). The US Department of Justice (DOJ), evidence that it has uncovered regarding possible violations of applicable anti-corruption laws involving interactions with government officials.
As has been publicly reported, the Australian Federal Police has indicated that it has commenced an investigation. The Group is fully cooperating with the relevant authorities as it has since the US investigations commenced.
As part of the US process, the SEC and DOJ notified the Group in August 2013 of the issues they consider could form the basis of enforcement actions, and discussions are continuing.also completed its investigation into BHP Billiton without taking any action.
The issues relateinvestigations related primarily to matters in connection with previously terminated minerals exploration and development efforts as well as hospitality provided as partby BHP Billiton at the 2008 Beijing Olympic Games. This concluded the US investigations on all matters.
The matter was resolved with the SEC pursuant to an administrative order, which imposed a US$25 million civil penalty. The SEC order makes no findings of corrupt intent or bribery by BHP Billiton.
The findings announced by the Company’sSEC related to a hospitality program hosted by BHP Billiton that supported its sponsorship of the 2008 Beijing Olympics.
In lightOlympic Games. As part of this program, BHP Billiton invited customers, suppliers, business partners, and government officials, along with BHP Billiton employees, to the Olympic Games. While BHP Billiton made efforts at the time to address the risks related to inviting government officials to the Olympics, the controls it relied upon were insufficient to satisfy the civil books and records and internal accounting controls requirements of the continuing natureFCPA.
The SEC noted the ‘significant cooperation’ BHP Billiton provided during the extensive investigation, which commenced in 2009. It also noted the ‘significant remedial actions’ BHP Billiton has taken over the past five years to enhance its compliance program.
At the time of its sponsorship of the investigations, it is not appropriate at this stage for2008 Beijing Olympics and Paralympics, BHP Billiton had no independent compliance function. Instead, accountability for complying with BHP Billiton’s anti-corruption policies, which were set out in BHP Billiton’s Guide to predict outcomes.Business Conduct, was vested in its operating business units. BHP Billiton has since created an independent compliance function that reports to the head of the legal function and the Risk and Audit Committee of the Board. Today, this function would be required to approve any offer of hospitality of this kind to a government official. Under the SEC order, BHP Billiton will self-report on its compliance program to the SEC for a period of 12 months following the date of the SEC order (20 May 2015).
BHP Billiton is fully committedwill continue to operatingcooperate with integrity, and the Group’s policies specifically prohibit engagingAustralian Federal Police investigation, which was announced in unethical conduct. BHP Billiton has what it considers to be a world-class anti-corruption compliance program.2013.
Insider trading
We have aSecurities Dealing GroupGroup Level Document (GLD) that covers dealings by Directors and identified employees, is consistent with the UK Model Code contained in the UK Financial Conduct Authority Listing Rules, and complies with the ASX Listing Rule requirements for a trading policy. TheSecurities DealingGLD Group Level Document restricts dealings by Directors and identified employees in shares and other securities during designated
prohibited periods and at any time that they are in possession of unpublished price-sensitive information. As part of a regular, planned process, theSecurities DealingGLD Group Level Document is reviewed every two years to ensure it remains current, fit for purpose and in line with our broader governance framework.
A copy of theSecurities Dealing GLD can be found on our websiteGroup Level Document is available online at
www.bhpbilliton.com/home/aboutus/ourcompany/Pages/governance.aspx.
Business Conduct Advisory Service
We have established a Business Conduct Advisory Service so that employees, contractors or members of the community can seek guidance or express concerns on how we work with fellow employees, governments, communities, third parties or how we use our Company resources. Reports can be made anonymously and without fear of retaliation. Arrangements are in place to investigate such matters. Where appropriate, investigations are conducted independently. Levels of activity and support processes for the Business Conduct Advisory Service are monitored, with activity reports presented to the Board. Further information on the Business Conduct Advisory Service can be found in theCode of Business Conductgovernance.
Political donations
We maintain a position of impartiality with respect to party politics and do not make political contributions/donations for political purposes to any political party, politician, elected official or candidate for public office. We do, however, contribute to the public debate of policy issues that may affect the Company in the countries in which we operate. As explained in the Directors’ Report, the Australian Electoral Commission (AEC) disclosure requirements are broad, such that amounts that are not political donations can be reportable for AEC purposes. For example, where a political party or organisation owns shares in BHP Billiton, the AEC filing requires the political party or organisation to disclose the dividend payments received for their shareholding.
5.17 Diversity and inclusion at BHP Billiton
Our BHP Billiton Charter and Human Resources Group Level Documents (GLDs) guide management on all aspects of human resource management, including diversity and inclusion. Underpinning the GLDs and supporting the achievement of diversity across the Group are principles and measurable objectives that define our approach to diversity and our focus on creating an inclusive work environment. The Board believes that critical mass is important for diversity and, in relation to gender, has set a goal of increasing the number of women on the Board. See section 5.7 for further details. Part of the Board’s role is to consider and approve the Group’s measurable objectives for each financial year, and to oversee the Group’s progress in achieving those objectives. Further information is set out below.
Our approach to diversity and inclusion is underpinned by key principles, including:
a diverse workforce and an inclusive environment are necessary to the delivery of our strategy that is predicated on diversification by commodity, geography and market;
our aspiration is to have a workforce that best represents the communities in which our assets are located and our employees live;
actions that support our diversity objectives should be consistent with our established approach to talent, performance and reward;
achieving an appropriate level of diversity will require structured programs at an early career stage that ensure the development of necessary skills and experience for leadership roles;
measurable objectives in support of diversity will be transparent, achievable over a period of time and fit for purpose; and
the set of measurable objectives will focus on (i) enabling a diverse workforce by way of removing barriers and (ii) establishing appropriate representation targets.
Progress against measurable objectives
In FY2013, we committed to three key measurable objectives to enhance our gender diversity profile. A summary of those objectives and a report of our progress are set out below.
Embed diversity and inclusion in the behaviours that demonstrate Our Charter values through Our Charter Values in Action. Employees will be assessed on how they demonstrate Our Charter Values in Action as part of the annual performance review process. Achievements during this reporting period include:
Our Charter Values in Action are the behaviours we expect all employees at BHP Billiton to demonstrate. They were successfully developed and launched to the organisation and are a critical part of the performance review process.
Specific behaviours supporting diversity and creating a collaborative and inclusive work environment are featured in Our Charter Values in Action.
Employees are assessed on Our Charter Values in Action and provided with feedback and coaching. Performance on Our Charter Values in Action is factored into performance ratings, which link to bonus remuneration.
Implement targeted graduate attraction initiatives, focused on specific disciplines, to increase the proportion of female graduates hired year-on-year. This objective builds on our 2011 commitment, where we reviewed our graduate recruitment process and implemented actions to address low female representation. The following highlights examples of work executed during this reporting period to increase female graduate intake representation:
The Australian Graduate Intake Recruitment campaign incorporated a number of new initiatives to attract female graduates. These initiatives had a specific focus on core disciplines. Some examples are targeted digital media advertising; active promotion of graduate opportunities directly with university faculties; and featuring graduate opportunities for women in our marketing materials, industry events and engagement activities.
As a result, female representation in the graduate program, as a percentage of intake, increased in the Australasia, North America and Asia regions.
Each Business, Group Function and Marketing will continue to be evaluated on progress in executing its measurable objectives that form part of its multi-year diversity plan. These will again be taken into account in determining bonus remuneration. Monitoring and tracking performance against diversity plans will continue to be undertaken as part of the Group’s internal compliance requirements. The performance of each Business, Group Function and Marketing was evaluated against its FY2013 measurable objectives, which was taken into account in determining bonus remuneration. The following highlights are examples of work that were delivered during the reporting period:
Specific actions were executed to increase representation of Indigenous employees. These included direct employment and the development of a long-term approach to provide them with the training and qualifications to broaden their overall employment opportunities.
Business leaders championed diversity and inclusion activities from their Business plans and facilitated awareness discussions within their teams. As champions, their involvement included sponsorship of a number of awareness events hosted by Business partners and universities.
Diversity and Inclusion Councils comprised of senior Business leaders were constituted. The Councils endorsed diversity and inclusion plans and objectives and supported the execution.
Learning sessions on unconscious bias and diversity and inclusion were delivered. These were facilitated via specific workshops or through existing development and employee induction programs.
The diversity of the successor pipeline for senior roles was reviewed as part of the talent management process.
Development plans were created for all high-potential female and ethnically diverse talent. As part of this, leader-led mentoring relationships were successfully established.
Targeted sourcing strategies successfully attracted female and ethnically diverse employees.
A range of different flexible work arrangements were launched with positive reception from employees.
Employees’ perspectives were consulted through surveys, focus group and interviews. Insights continue to help inform areas of work in diversity and inclusion.
Continuous improvement
In FY2014, we will take the following steps to further enhance our gender and diversity profile:
each Business, Group Function and Marketing will continue to be evaluated on progress in executing the measurable objectives that form part of its multi-year diversity and inclusion plan;
increase female representation by one in each asset and operations’ leadership team by end of FY2015 (where the Business leadership team comprises less than 50 per cent females);
execute the diversity and inclusion strategy and actions approved by the GMC;
develop recommendations for providing childcare options and flexible work arrangements;
increase the proportion of female and Indigenous graduates hired and retained year-on-year; and
maintain at least 30 per cent female participation in our Accelerated Leadership Development Program (ALDP).
Successful completion of these objectives will again be taken into account in determining bonus remuneration. Monitoring and tracking performance will continue to be undertaken as part of the Group’s internal compliance requirements.
Progress against each year’s measurable objectives will continue to be disclosed in the Annual Report, along with the proportion of women in our workforce, in senior management positions and on the Board. There are currently two women on the Board, and the proportion of women in our workforce and in senior management positions is set out in section 2.9, which also contains further information on diversity and our employee profile more generally.
5.183.18 Market disclosure
We are committed to maintaining the highest standards of disclosure, ensuring that all investors and potential investors have the same access to high-quality, relevant information in an accessible and timely manner to assist them in making informed decisions. The Disclosure Committee manages our compliance with market disclosure obligations and is responsible for implementing reporting processes and controls and setting guidelines for the release of information. As part of our commitment to continuous improvement, and in line with the updated guidance on continuous disclosure that was issued by the ASX and came into effect on 1 May 2013, our disclosure processes were reviewed and updated during the yearwe continue to ensure continued alignment with best practice as it develops in the jurisdictions in which we areBHP Billiton is listed.
Disclosure officers have been appointed in the Group’s Businesses, Group Functions and Marketing. These officers are responsible for identifying and providing the Disclosure Committee with materialreferral information about the activities of the Business or functional areas using disclosure guidelines developed by the Committee. The Committee then makes the decision whether a particular piece of information is material and therefore needs to be disclosed to the market.
To safeguard the effective dissemination of information, we have developed a market disclosure and communications document, which outlines how we identify and distribute information to shareholders and market participants.
A copy of the Market Disclosuremarket disclosure and Communicationscommunications document is available online at
www.bhpbilliton.com/home/aboutus/ourcompany/Pages/governance.aspx.governance.
Copies of announcements to the stock exchanges on which we are listed, investor briefings, half-yearly financial statements,Financial Statements, the Annual Report and other relevant information can be found on our websiteonline atwww.bhpbilliton.com. Any person wishing to receive advice by email of news releases can subscribe atwww.bhpbilliton.com.
5.193.19 Remuneration
Details of our remuneration policies and practices, and the remuneration paid to the Directors (Executive and Non-executive) and members of the GMC, are set out in the Remuneration Report in section 64 of this Annual Report. Shareholders will be invited to consider and to approve the Remuneration Report at the 2013 AGMs. The Australian Corporations Act and the ASX Listing Rules prohibit Directors and members of the GMC from voting on various resolutions relating to Key Management Personnel (KMP) remuneration – including, for example, the adoption of the Remuneration Report, an increase in the maximum aggregate remuneration payable to the Non-executive Directors and the grant of equity to the Executive Director.
5.203.20 Directors’ share ownership
Non-executive Directors have agreed to apply at least 25 per cent of their remuneration to the purchase of BHP Billiton shares until they achieve a shareholding equivalent in value to one year’s remuneration. Thereafter, they must maintain at least that level of shareholding throughout their tenure. All dealings by Directors are subject to the Group’sSecurities Dealing GroupGLD Level Document and are reported to the Board and to the stock exchanges.
Information on our policy governing the use of hedge arrangements over shares in BHP Billiton by both Directors and members of the GMC is set out in section 6.2.4 of this Annual Report.4.4.2.
Details of the shares held by Directors are set out in section 7.19 of this Annual Report.4.2.27.
5.21 Company secretaries
Jane McAloon is the President, Governance and Group Company Secretary. Ms McAloon’s qualifications and experience are set out in section 4.1. The Group Company Secretary is responsible for developing and maintaining the information systems and processes that enable the Board to fulfil its role. The Group Company Secretary is also responsible to the Board for ensuring that Board procedures are complied with and advising the Board on governance matters. All Directors have access to the Group Company Secretary for advice and services. Independent advisory services are retained by the Group Company Secretary at the request of the Board or Board committees. Ms McAloon is supported by Nicola Kleynhans, Deputy Company Secretary of BHP Billiton Limited, Nicole Duncan, Company Secretary BHP Billiton Limited, and Elizabeth Hobley and Geof Stapledon, who are Deputy Company Secretaries of BHP Billiton Plc. The Board appoints and removes the Company Secretaries.
5.223.21 Conformance with corporate governance standards
Our compliance with the governance standards in our home jurisdictions of Australia and the United Kingdom, and with the governance requirements that apply to us as a result of our NYSENew York Stock Exchange (NYSE) listing and our registration with the SEC in the United States, is summarised in this Corporate Governance Statement, the Remuneration Report, the Directors’ Report and the financial statements.Financial Statements.
The Listing Rules and the Disclosure and Transparency Rules of the UK Financial Conduct Authority require UK-listed companies listed in the UK to report on the extent to which they comply with the Main Principles and the provisions of the UK Corporate Governance Code (UK Code), and explain the reasons for any non-compliance. In September 2014, the Financial Reporting Council (FRC) issued the UK Corporate Governance Code 2014 (2014 Code). The FRC has also published guidance for Boards on risk management and internal control and related financial and business reporting. As the 2014 Code and the guidance apply to financial years beginning on or after 1 October 2014, BHP Billiton has considered the impact of the changes, will comply with the 2014 Code and guidance from 1 July 2015 and will report on compliance in the Annual Report for FY2016. The UK Code is available online atwww.frc.org.uk/corporate/ukcgcode.cfm.ukcgcode.cfm.
The Listing Rules of the ASX require Australian-listedASX-listed companies to report on the extent to which they meet the Corporate Governance Principles and Recommendations published by the ASX Corporate Governance Council (ASX Principles and Recommendations) and explain the reasons for any non-compliance. The ASX Principles and Recommendations are available online atwww.asxgroup.com.au/corporate-governance-council.htm.corporate-governance-council.htm.
Both the UK Code and the ASX Principles and Recommendations require the Board to consider the application of the relevant corporate governance principles, while recognising that departures from those principles are appropriate in some circumstances. We complied with the provisions set out in the UK Code and with the ASX Principles and Recommendations during the financial period and continue to comply up to the date of this Annual Report.period.
A checklistAppendix 4G, summarising our compliance with the UK Code and the ASX Principles and Recommendations can be found on our websiteis available online atwww.bhpbilliton.com/home/aboutus/ourcompany/Pages/governance.aspx.governance.
BHP Billiton Limited and BHP Billiton Plc are registrants with the SEC in the United States. Both companies are classified as foreign private issuers and both have American Depositary Shares listed on the NYSE.
We have reviewed the governance requirements currently applicable to foreign private issuers under the Sarbanes-Oxley Act (US), including the rules promulgated by the SEC and the rules of the NYSE and are satisfied that we comply with those requirements.
Section 303A of the NYSE-Listed Company Manual contains a broad regime of corporate governance requirements for NYSE-listed companies. Under the NYSE rules, foreign private issuers, such as ourselves, are permitted to follow home country practice in lieu of the requirements of Section 303A, except for the rule relating to compliance with Rule 10A-3 of the US1934 Securities Exchange Act of 1934 (audit committee independence) and certain notification provisions contained in Section 303A of the Listed Company Manual. Section 303A.11 of the Listed Company Manual, however, requires us to disclose any significant ways in which our corporate governance practices differ from those followed by US companies under the NYSE corporate governance standards. FollowingAfter a comparison of our corporate governance practices with the requirements of Section 303A of the Listed Company Manual followed by US companies, the following significant difference was identified:
Rule 10A-3 of the US1934 Securities Exchange Act of 1934 requires NYSE-listed companies to ensure that their audit committees are directly responsible for the appointment, compensation, retention and oversight of the work of the external auditor unless the company’s governing law or documents or other home country legal requirements require or permit shareholders to ultimately vote on or approve these matters. While the RAC is directly responsible for remuneration and oversight of the External Auditor, the ultimate responsibility for appointment and retention of the External Auditor rests with our shareholders, in accordance with UK law and our constitutional documents. The RAC does, however, make recommendations to the Board on these matters, which are in turn reported to shareholders.
While the Board is satisfied with its level of compliance with the governance requirements in Australia, the United Kingdom and the United States, it recognises that practices and procedures can always be improved, and there is merit in continuously reviewing its own standards against those in a variety of jurisdictions. The Board’s program of review will continue throughout the year ahead.
5.233.22 Additional UK disclosure
The information specified in the UK Financial Conduct Authority Disclosure and Transparency Rules, DTR 7.2.6, is located elsewhere in this Annual Report. The Directors’ Report, atin section 7.22,5.9 of this Annual Report, provides cross-references to where the information is located.
This Corporate Governance Statement was approved by the Board on 1210 September 20132015 and signed on its behalf by:
Jac Nasser AO
Chairman
1210 September 20132015
64 Remuneration Report
| | | | |
Contents of the Remuneration Report |
4.1 | | Annual statement by the Remuneration Committee Chairman |
| |
4.2 | | Introduction to the Remuneration Report |
| |
4.3 | | Remuneration policy report • Remuneration policy for Executive Directors • Remuneration policy for Non-executive Directors |
| |
4.4 | | Annual report on remuneration • Remuneration governance • Remuneration outcomes for the Executive Director (the CEO) • Remuneration outcomes for Non-executive Directors • Remuneration for members of the GMC (other than the CEO) • Other statutory disclosures |
| |
Abbreviation | | Item |
AGM | | | | Annual General Meeting |
| | |
CEO | | | | Chief Executive Officer |
| | |
DEP | | | | Dividend Equivalent Payment |
| | |
EBIT | | | | Earnings Before Interest and Tax |
| | |
GIS | | | | Group Incentive Scheme |
| | |
GMC | | | | Group Management Committee |
| | |
GSTIP | | | | Group Short-Term Incentive Plan |
| | |
HSEC | | | | Health, Safety, Environment and Community |
| | |
IFRS | | | | International Financial Reporting Standards |
| | |
KMP | | | | Key Management Personnel |
| | |
LTI | | | | Long-Term Incentive |
| | |
LTIP | | | | Long-Term Incentive Plan |
| | |
MAP | | | | Management Award Plan |
| | |
MSR | | | | Minimum Shareholding Requirements |
| | |
STI | | | | Short-Term Incentive |
| | |
STIP | | | | Short-Term Incentive Plan |
| | |
TRIF | | | | Total Recordable Injury Frequency |
| | |
TSR | | | | Total Shareholder Return |
6.14.1 Annual statement by the Remuneration Committee Chairman
Dear Shareholder
I am pleased to introduce BHP Billiton’s Remuneration Report for the financial year endedto 30 June 2013.
As I reported to you in2015. This is my letter last year, in 2012 we completed a comprehensive reviewfirst as Chairman of our senior executive remuneration structures and, after consideration of all relevant issues, concluded that our current arrangements, including the changes to the long-term incentive plan approved by shareholders in 2010, remain appropriate. Importantly, we believe that the arrangements continue to support our focus on operational excellence, risk management and the execution of the Group’s strategy. As always, we will continue to seek further improvement opportunities.
At last year’s annual general meetings, we again enjoyed a strong level of support for the Remuneration Report from shareholders, with a vote in favour of 96 per cent. In addition, our policies and approach to providing appropriate remuneration for our senior executives have been broadly endorsed during regular consultation sessions with shareholders. In particular, our long-term incentive plan, approved in 2004, has a five-year performance period, still a longer period than most other companies. This remains a very important feature for the Remuneration Committee, and shareholders.
However, asI want to begin by acknowledging Sir John Buchanan, our esteemed colleague, the long-term incentive plan is approaching its 10-year anniversary, shareholder re-approval is required under UK governance guidelines. Accordingly, shareholders will be asked to voteformer Chairman of the Committee and Senior Independent Director of BHP Billiton Plc who passed away on the long-term incentive plan at this year’s annual general meetings. The plan’s operation will continue to reflect13 July 2015. Sir John’s many years of experience and perspective underpinned the Committee’s unchanged commitmentability to navigate the existing performance hurdle basedcomplexities of executive remuneration, and his intellectual rigour, fairness and judgement served both shareholders and executives well during his decade-long tenure as Committee Chairman. He leaves a very strong foundation for BHP Billiton with respect to remuneration matters and my fellow Committee members and I hold Sir John, and his contribution, in the highest regard. We will endeavour to build on relative shareholder returns, with performance measured over a five-year period. Because we are asking shareholdershis legacy in the years ahead.
Link to re-approve the plan, we have taken the opportunity to introduce stronger malusstrategy
Our Charter sets out our values, placing health and clawback provisions. In our view, these provisions reflect best practice and are consistent with feedback from our shareholders.
The Committee and the Board will continue to adopt an open-door approach to eliciting shareholders’ views so they can be factored into the Group’s future approach.
Remuneration policy in action
Remuneration outcomes for FY2013 provide further tangible evidence of our policy in action. This year,safety first, upon which the Remuneration Committee with the full support of the Board, exercised its discretion to vest fewer than the number of awards allocated under the 2008 long-term incentive plan for members of the Group Management Committee. The decision was taken to reduce the number of awards by 35 per cent for all participants, even though the total shareholder return of BHP Billiton once again materially exceeded its peers over the five years of the plan. In the absence of the Committee exercising its discretion, this performance would have supported 100 per cent vesting of the awards.
This is the first time the Committee has exercised its discretion to reduce vesting under the plan. In doing so, it took into account a range of factors, including the negative total shareholder return over the performance period that shareholders have experienced. It also considered the total remuneration of the executives.
While the Board and Committee believe that our executive remuneration packages have contributed to the consistent and substantial financial outperformance of the Company over many years, they also believed that some downward rebasing of the package for the incoming Chief Executive Officer (CEO), Andrew Mackenzie, relative to that of the former CEO, was appropriate; a view supported by Andrew. The package supports our evolving strategic priorities and does not compromise our need to motivate a high level of performance and ensures alignment with our shareholders’ expectations.
Consistent with this approach, the remuneration packages for other Group Management Committee members have also been rebased downwards. Aligned with this, the Board decided again to freeze fees for Non-executive Directors, for the second consecutive year. These outcomes represent an appropriate alignment of remuneration with the prevailing business environment.
When Mr Mackenzie joined BHP Billiton in 2008, he was granted one-off sign-on awards that were in recognition of equity awards foregone when he left his former employer. The value and quantum of the sign-on awards was based on the value of awards forfeited and calculated by the Committee’s independent adviser. As a result of the outperformance of BHP Billiton, all those sign-on awards would have vested this year. However,places great weight in the circumstances, Mr Mackenzie concluded, and the Committee agreed, that the value that would have been delivered was excessive and he has voluntarily relinquished 50,000determination of those awards.
Marius Kloppers will retire from the Company on 1 October 2013 when the transition to Mr Mackenzie is complete. The terms of Mr Kloppers’ departure reflect the Group’s remuneration policy and the rules of our incentive plans as approved by shareholders. No additional payments are being made. My fellow Non-executive Directors and I wish Marius the very best in the future.
In our quest to further improve the transparency of our reporting, we have included in this section information on the remuneration arrangements of Mr Mackenzie and on the retirement arrangements of Mr Kloppers.
Further details of all of the remuneration aspects described below can be found in later sections of the Remuneration Report.
CEO transition – remuneration of the new CEO Andrew Mackenzie
The new CEO’s target remuneration for FY2014 is made up of:
a base salary of US$1,700,000 (an increase from Mr Mackenzie’s previous base salary of US$1,200,000; a decrease from the previous CEO base salary of US$2,215,200);
pension of 25 per cent of base salary (a decrease from 36 per cent for Mr Mackenzie previously; a decrease from the previous CEO rate of 40 per cent);
a short-term incentive target opportunity of 160 per cent of base salary, with a maximum opportunity of 240 per cent of base salary (maximum reduced from 320 per cent of base salary for Mr Mackenzie and for the previous CEO);
a long-term incentive award for FY2014 of 400 per cent face value of base salary (subject to shareholder approval), which is a face value of US$6,800,000 (US$8,392,683 in FY2013 for the prior CEO).
The target remuneration that will be provided to the CEO in FY2014 is set out in the table below:
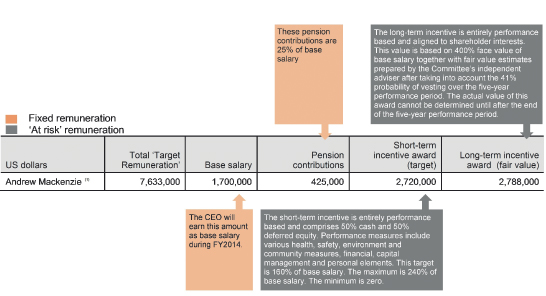
(1) | The target remuneration for the CEO excludes one-off benefits for his relocation from the UK to Australia in FY2013 (refer section 6.4.1). |
Mr Mackenzie’s actual remuneration is linked substantially to business outcomes and shareholder returns. The ‘at risk’ component of his remuneration (comprising short-term incentives and long-term incentives) is 72 per cent of his total target remuneration (at fair value). Fixed remuneration (base salary and pension benefits) comprises 28 per cent of the total.
Mr Mackenzie’s annual short-term incentive is at risk. The scorecard against which his performance is ordinarily assessed is made up of a number of performance measures, including health, safety, environment and community measures, financial outcomes, capital spend and schedule and performance against personal measures. The minimum short-term incentive is zero, as was the outcome for Mr Mackenzie’s predecessor in FY2012.
Mr Mackenzie’s long-term incentive is at risk. BHP Billiton’s business is long term, and decisions are made that are likely to have an impact for many years. It is therefore important that senior executives are rewarded over the long term for long-term performance. BHP Billiton’s long-term incentive plan measures performance over five years.
CEO transition – retirement of the former CEO Marius Kloppers
Marius Kloppers stepped down as CEO, a member of the Group Management Committee and a Director of the Company on 10 May 2013. He will retire from BHP Billiton on 1 October 2013. The terms of Mr Kloppers’ departure reflect the Group’s remuneration policy and the rules of our incentive arrangements as approved by shareholders.
Mr Kloppers will work through the applicable notice period, receive his base salary and pension entitlements at current rates to the date of his retirement; namely, 1 October 2013, be entitled to the value of the pension and superannuation plans that he has accumulated over his 20 years with the Company, together with the value of any
accrued leave to 1 October 2013, and retain on a pro-rata basis awards granted in previous years under the long-term incentive plan. They will vest only if the performance hurdle is met at the end of each five-year performance period (refer further below).
Mr Kloppers has been considered for a short-term incentive payment under the group incentive scheme for the year ended 30 June 2013, assessed by the Remuneration Committee after year-end. That payment was pro-rated to reflect his period of service as CEO during the year ended 30 June 2013 (namely, 1 July 2012 to 10 May 2013). He also participated as usual in the normal vesting of share awards in August 2013.
Mr Kloppers will not receive any financial benefit over and above those provided for within his existing contractual entitlements.
Awards granted in prior years under the long-term incentive plan that may vest in the four years after Mr Kloppers’ departure are retained on a pro-rata basis. Under the terms of the shareholder approved plan, employees who retire are entitled to hold awards granted in prior years. However, the number of awards is reduced to reflect the period of service in relation to each grant. Under the pro-rating rule, Mr Kloppers will retain 504,675 awards, and 412,649 awards will lapse.
Whether the 504,675 retained awards vest will depend on BHP Billiton’s relative total shareholder return performance over the five-year periods to 30 June 2014, 2015, 2016 and 2017, respectively. In addition, even if the performance hurdle is met, the Committee has an overriding discretion under the plan rules to reduce the amount of awards that vest. Accordingly, the vesting outcome and the number of long-term incentive awards that will ultimately vest are unknown at this time. The number of long-term incentive plan awards that vest cannot exceed the 504,675 awards retained.
In this year’s Remuneration Report, we have continued to improve the clarity of the explanation of the remuneration arrangements for our CEO and his executive team, including the early adoption of certain new UK requirements which will formally apply for the first time to next year’s Remuneration Report. This reinforces the importance we see in seeking to explain clearly how BHP Billiton’s remuneration policies support long-term, sustainable value creation.
|
|
John Buchanan |
Chairman, Remuneration Committee |
12 September 2013 |
Contents of the Remuneration Report
The following guide is intended to help the reader use this Remuneration Report. It explains the linkages between BHP Billiton’s remuneration policy and theperformance-based remuneration outcomes for members of the Group Management Committee (GMC) and Non-executive Directors (as shown in section 6.2.6 of this Remuneration Report). All acronyms used are defined in the Remuneration Report or in section 10.
| | | | |
Section
| | What it covers
|
6.1
| | Annual statement by the Remuneration Committee Chairman | | Message from the Chairman of the Remuneration Committee in regard to significant decisions and changes throughout the year and key points to note in this Remuneration Report. |
| | |
6.2
| | Remuneration policy report
Remuneration governance
Remuneration policy for GMC members Remuneration policy for Non-executive Directors
| | Explains how the Board and the Committee make remuneration decisions, including how they use external remuneration consultants. Details the Key Management Personnel (KMP) for FY2013, being the members of the GMC and the Non-executive Directors who served during the year.
Outlines the overarching remuneration policy and framework that guides decisions on remuneration design and outcomes for the GMC members and the Non-executive Directors. Describes the components of remuneration and potential remuneration outcomes for the CEO as a result of the policy.
|
| | |
6.3
| | Remuneration implementation report
Remuneration outcomes for GMC members
Remuneration outcomes for Non-executive Directors
| | Shows the impact of the remuneration policy in FY2013 and how actual performance outcomes link to remuneration outcomes through short-term incentive (STI) and long-term incentive (LTI) arrangements. |
| | |
6.4
| | Statutory disclosures
Statutory remuneration disclosures for GMC members
Equity awards
Other statutory disclosures for Directors
| | Presents additional disclosures required under Australian and UK reporting requirements, including total remuneration for the GMC calculated pursuant to legislative and accounting requirements. Provides details of interests in equity awards resulting from BHP Billiton’s remuneration programs. |
6.2 Remuneration policy report
Remuneration governance
6.2.1 Board oversight
The Board is responsible for ensuring that the Group’s remuneration arrangements are equitable and aligned with the long-term interests of BHP Billiton and its shareholders. In performing this function, it is critical that the Board is independent of management when making decisions affecting remuneration of the CEO, the other members of the GMC and the Group’s employees.
Accordingly, the Board has established a Remuneration Committee to assist it in making decisions affecting employee remuneration. The Committee is comprised solely of Non-executive Directors, all of whom are independent. In order to ensure that it is fully informed when making remuneration decisions, the Committee
receives regular reports and updates from members of management (who the Committee invites to attend meetings as and when appropriate) and can draw on services from a range of external sources, including remuneration consultants.
6.2.2 Remuneration Committee
The activities of the Remuneration Committee are governed by Terms of Reference (most recently approved by the Board in June 2013), which are available on our website. The purpose of the Committee is to assist the Board in its oversight of:
the remuneration policy and its specific application to the CEO, the other members of the GMC and its general application to all Group employees;
the determination of levels of reward for the CEO and approval of reward to the other members of the GMC;
the annual evaluation of the performance of the CEO, by providing guidance to the Group Chairman;
communication with shareholders on the Group’s remuneration policy and the Committee’s work on behalf of the Board;
the Group’s compliance with applicable legal and regulatory requirements associated with remuneration matters;
the preparation of the Remuneration Report to be included in the Group’s Annual Report;
the review, at least annually, of remuneration by gender.
Further information regarding the Committee can be found in section 5.13.2
| | |
Remuneration Committee members | | John Buchanan (Chairman)
Carlos Cordeiro
Pat Davies
John Schubert
|
| |
Number of meetings in FY2013 | | Nine |
| |
Other individuals who regularly attended meetings(1) | | Jac Nasser (Chairman)
Marius Kloppers (CEO to 10 May 2013)
Andrew Mackenzie (CEO from 10 May 2013)
Karen Wood (President, People and Public Affairs in FY2013)
Gary Brown (Head of Group Human Resources)
Andrew Fitzgerald (Vice President, Group Reward)
Jane McAloon (President, Governance and Group Company Secretary)
Geof Stapledon (Vice President, Governance)
|
(1) | These individuals were not present when matters associated with their own remuneration were considered. |
6.2.3 Use of remuneration consultants
The Remuneration Committee seeks and considers advice from independent remuneration advisers where appropriate. Remuneration consultants are engaged by, and report directly to, the Committee. Potential conflicts of interest are taken into account when remuneration consultants are selected and their terms of engagement regulate their level of access to, and require their independence from, BHP Billiton’s management. The advice and recommendations of external advisers are used as a guide, but do not serve as a substitute for thorough consideration of the issues by each Director.
Kepler Associates was appointed by the Committee to act as an independent remuneration adviser to provide specialist remuneration advice and does not provide other services to the Group. Kepler Associates is a member of the UK Remuneration Consultants Group and adheres to its Code of Conduct. During the year, Kepler Associates provided advice and assistance to the Committee on a wide range of matters, including:
advice in regard to remuneration arrangements for the new CEO and the members of the GMC;
benchmarking of pay of senior executives against comparable roles at a range of relevant comparator groups, including sector and size peers;
provision of information and commentary on global trends in executive remuneration;
calculation of accounting fair values of equity awards and performance analysis for LTI awards;
review of, and commentary on, management proposals;
other ad-hoc support and advice as requested by the Committee.
As part of its role, Kepler Associates provided ‘remuneration recommendations’ (as defined in the Australian Corporations Act 2001) to the Committee during the year. Each time Kepler Associates provides a remuneration recommendation, Kepler Associates provides a declaration that the remuneration recommendation was made free from undue influence by the member of KMP to whom the recommendation relates. The Board considered the processes outlined above, the constraints incorporated into Kepler Associates’ terms of engagement, the implementation of a comprehensive protocol for the engagement of remuneration advisers and the receipt of the declaration of no undue influence. It is satisfied that the remuneration recommendations received from Kepler Associates were made free from undue influence by any of the members of KMP to whom the recommendations related.
Total fees paid to Kepler Associates for the above services for the period from 1 July 2012 to 30 June 2013 were £159,000, of which £57,000 was for attendance at Committee meetings and commentary on management proposals, and a total of £81,000 for the provision of remuneration recommendations and technical advice on executive remuneration. The remainder is mainly a non-recurring item relating to advice on arrangements for the new CEO and other new GMC members.
Management also appoints external firms from time to time to assist with remuneration benchmarking, data provision and the like; however, Kepler Associates is the only remuneration consultant appointed by the Committee. While other external firms did provide certain information to management to assist them in deliberations, no remuneration adviser other than Kepler Associates provided remuneration recommendations during the year in relation to KMP.
6.2.4 Prohibition on hedging of BHP Billiton shares and equity instruments
GMC members are not allowed to protect the value of any unvested BHP Billiton securities allocated to them under employee programs or the value of shares and securities held as part of meeting BHP Billiton’s Minimum Shareholding Requirements (MSR) as described below. The policy also prohibits GMC members from using unvested BHP Billiton securities as collateral in any financial transaction, including hedging and margin loan arrangements. Any securities that have vested and are no longer subject to restrictions or performance conditions may be subject to hedging arrangements or used as collateral, provided that consent is obtained from BHP Billiton in advance of the employee entering into the arrangement. BHP Billiton treats compliance with this policy as a serious issue, and takes appropriate measures to ensure that the policy is adhered to.
6.2.5 Share ownership guidelines and the minimum shareholding requirements
The MSR helps to ensure that executives’ and shareholders’ interests remain aligned. In FY2013 and prior, the MSR was 300 per cent of annual gross pre-tax base salary for the CEO and 200 per cent for other GMC members. From FY2014, the MSR will increase to 500 per cent of annual gross pre-tax base salary for the CEO and 300 per cent for other GMC members.
The value of the securities for the purposes of the policy is the market value of the underlying shares. Unvested securities do not qualify, and neither do options with a market-based exercise price. Members of the GMC are expected to grow their holdings to the required level from the scheduled vesting of employee awards over time. Under the policy, employees are not required to meet the holding requirement before awards are allocated to them, but if they are not holding the required number of shares, then they will be prohibited from selling all of the underlying shares arising from their awards. Employees are entitled to sell sufficient shares to satisfy tax obligations arising from the granting, holding, vesting, exercise or sale of employee awards or the underlying shares.
Detailed share ownership information of the CEO and other members of the GMC can be found in sections 7.19 and 7.20.
6.2.6 Key Management Personnel
The Australian Corporations Act 2001, Australian Accounting Standards and International Financial Reporting Standards require BHP Billiton to make certain disclosures for KMP, defined as those persons having authority and responsibility for planning, directing and controlling the activities of the Group, directly or indirectly. For the purposes of this Remuneration Report, it has been determined that the KMP are the members of the GMC and the Non-executive Directors who served during FY2013.
Members of the GMC
Following the announcement of Andrew Mackenzie as CEO in February 2013, BHP Billiton announced a new GMC, which took effect from 10 May 2013. The composition and structure of the GMC reflects a commitment to a relentless focus on the safe execution of the Group’s strategy, and provides the Company with the right balance of skills and experience to lead the Group. While the new GMC is larger in number than its predecessor, with 12 members for FY2014 (eight previously), it reflects a balance of operational and functional roles, and a more streamlined organisation, with the removal of a layer of management below the GMC to create a direct line of communication between the centre and operations and to ensure alignment between strategic and operational leadership. FY2013 remuneration reported in this report is for the period that the individual served in the relevant capacity during the year:
Andrew Mackenzie, Mike Henry, Graham Kerr and Karen Wood were members of the GMC for the whole of FY2013.
Peter Beaven, Dean Dalla Valle, Jane McAloon, Daniel Malchuk and Jimmy Wilson were appointed to the GMC effective from 10 May 2013.
Geoff Healy was appointed to the GMC upon his commencement with BHP Billiton on 3 June 2013.
Marius Kloppers, Alberto Calderon and Marcus Randolph retired from the GMC effective from 10 May 2013 and will leave or have left BHP Billiton during FY2014.
J Michael Yeager retired from the GMC effective from 1 July 2013 and from BHP Billiton effective 8 July 2013, and is therefore included as KMP for the whole of FY2013.
Tim Cutt was appointed to the GMC effective from 2 July 2013 as President, Petroleum and Potash. Mike Fraser was appointed to the GMC effective from 27 August 2013 as President, Human Resources. Mr Cutt and Mr Fraser are therefore not included in this report as KMP, but will be included in FY2014. Also effective 27 August 2013, Karen Wood assumed the role of President, Public Affairs and remains on the GMC.
Dates of appointment of all current GMC members appear in section 4.2 and the dates of their current service contracts appear in the table below. The service contracts for all members of the GMC have no fixed term. They typically outline the components of remuneration paid to the individual, but do not prescribe how remuneration
levels are to be modified from year-to-year. The contracts are all capable of termination by BHP Billiton on 12 months’ notice. The Group retains the right to terminate a contract immediately by making a payment equal to 12 months’ base salary plus retirement benefits for that period. The GMC member must give six months’ notice.
| | | | |
Name
| | Title
| | Date of Contract |
KMP(1)
| | | | |
Andrew Mackenzie
| | Chief Executive Officer and Executive Director from 10 May 2013
Group Executive and Chief Executive, Non-Ferrous to 9 May 2013
| | 3 May 2013 |
Peter Beaven
| | President, Copper from 10 May 2013 | | 3 May 2013 |
Dean Dalla Valle
| | President, Coal from 10 May 2013 | | 3 May 2013 |
Geoff Healy
| | Chief Legal Counsel from 3 June 2013 | | 12 April 2013 |
Mike Henry
| | President, HSEC, Marketing and Technology from 10 May 2013
Group Executive and Chief Marketing Officer to 9 May 2013
| | 3 May 2013 |
Graham Kerr
| | Chief Financial Officer from 10 May 2013
Group Executive and Chief Financial Officer to 9 May 2013
| | 3 May 2013 |
Jane McAloon
| | President, Governance and Group Company Secretary from 10 May 2013 | | 3 May 2013 |
Daniel Malchuk
| | President, Aluminium, Manganese and Nickel from 10 May 2013 | | 3 May 2013 |
Jimmy Wilson
| | President, Iron Ore from 10 May 2013 | | 3 May 2013 |
Karen Wood
| | President, People and Public Affairs from 10 May 2013
Group Executive and Chief People & Public Affairs Officer to 9 May 2013
| | 3 May 2013 |
(1) | In addition to the KMP listed above, Marius Kloppers (Chief Executive Officer and Executive Director, with a date of contract of 12 February 2008), Alberto Calderon (Group Executive and Chief Executive, Aluminium, Nickel & Corporate Development, with a date of contract of 16 January 2008), Marcus Randolph (Group Executive and Chief Executive – Ferrous & Coal, with a date of contract of 13 December 2005) and J Michael Yeager (Group Executive and Chief Executive – Petroleum, with a date of contract of 21 March 2006) served as KMP during FY2013. |
As a consequence of the announcement of a new GMC, the tables that follow in this Remuneration Report list, firstly, the members of the new GMC (who were KMP for all or part of FY2013 and continue as KMP into FY2014) and then, secondly, the members of the prior GMC who no longer serve in that capacity (who were KMP for all or part of FY2013, but who will not be KMP for any part of FY2014).
Non-executive Directors
Details of the Non-executive Directors who held office during FY2013 are set out below. Each of the Non-executive Directors held office for the whole of FY2013. Dates of appointment of all Directors appear in section 4.1.
| | | | | | |
Name
| | Title
| | Name
| | Title
|
Malcolm Broomhead
| | Non-executive Director | | Lindsay Maxsted | | Non-executive Director |
John Buchanan
| | Senior Independent Director | | Wayne Murdy | | Non-executive Director |
Carlos Cordeiro
| | Non-executive Director | | Jac Nasser | | Chairman |
David Crawford
| | Non-executive Director | | Keith Rumble | | Non-executive Director |
Pat Davies
| | Non-executive Director | | John Schubert | | Non-executive Director |
Carolyn Hewson
| | Non-executive Director | | Shriti Vadera | | Non-executive Director |
Remuneration policy for GMC members
This section outlines the overarching remuneration policy and framework that guided decisions on remuneration design and outcomes for the GMC members in FY2013 and will guide decisions in FY2014.
6.2.7 The overarching principles of our remuneration policy
The Remuneration Committee recognises that remuneration has an important role to play in supporting the implementation and achievement of the Group’s strategy and our ongoing performance, aligning the activities of management to the interests of shareholders, and in supportingexecutives.Our Charter. The remuneration policy is reviewed annually and, where appropriate, fine-tuned to ensure that it continues to be effective in achieving these goals.
The key principles of our remuneration policy, which remain unchanged, are to:
support the execution of the Group’s business strategy in accordance with a risk framework that is appropriate for the organisation;
provide competitive rewards to attract, motivate and retain highly skilled executives willing to work around the world;
apply demanding performance measures, including key financial and non-financial measures of performance;
link a large component of pay to our performance and the creation of value for our shareholders from relative performance;
ensure remuneration arrangements are equitable and facilitate the deployment of people around the Group;
limit severance payments on termination to pre-established contractual arrangements (which do not commit us to making any unjustified payments).
6.2.8 Our remuneration policy and arrangements support Our Charter and are focused on the long term
Our Charter also sets out our purpose, our strategy values and how we judgemeasure success. The Committee is guided by those measures in supporting our success.
BHP Billiton’s remuneration arrangements reinforce the achievement of our success, as set outexecutives inOur Charter, and are designed to ensure that executives take taking a long-term approach to decision-making in order to build a sustainable and minimise activities
value-adding business. Our remuneration policy and strategy is focussed on long-term success and minimising short-term behaviours or results that would jeopardise longer-term outcomes.that focus only on short-term results at the expense of longer-term business growth and success. The Remuneration Committee has considered the ways in which risk management and the long-term horizon are reflected throughout BHP Billiton’sWe want executive remuneration arrangements for all executives, and is satisfied that the approach reinforces the desired behaviours.
This is largely achieved through the Group’s approach to STI and LTI awards, which comprise a significant portion of total remuneration for the members of the GMC. The equity component of the STI award is deferred for a two-year period, and performance under the Long Term Incentive Plan (LTIP) is measured over a five-year period. The actual rewards received by members of the GMC therefore reflect the Group’s performance and share price over an extended period.
Itperiod and this is primarily achieved with the Committee’s view that this provides an appropriate focus on BHP Billiton’s sustained performance beyond the endequity component of the initial measurementSTI award being deferred for a two-year period, and with TSR under the LTIP being measured over a five-year performance period. This
Our approach also provides a transparent mechanism for clawback or adjustment in the event of a restatement of Group results, through
We have made no changes to the vesting or non-vesting of deferred equity.
In addition, STI and LTI outcomes are not driven by a purely formulaic approach. The Committee holds discretionunderlying approach to determine that awards are not to be provided or vested in circumstances where it would be inappropriate or would provide unintended outcomes. The Committee has no discretion to allow vesting when performance conditions have not been satisfied (other thanremuneration in the event of death, serious injury, disability, illnesslast year. It is an approach that prohibits continued employment, or totalBHP Billiton has practised for over 10 years and permanent disablement).
6.2.9 How totalwe believe it continues to serve our executives and shareholders well. The remuneration is determined
The Remuneration Committee considersoutcomes continue to appropriately reflect the appropriate total remuneration for each memberperformance of the GMCGroup, of the Businesses and of individuals.
While our approach has been given strong support by examiningshareholders, with a vote ‘for’ the remuneration provided to comparable rolesRemuneration Report in organisationsexcess of similar global complexity, size, reach97 per cent at last year’s AGMs, and industry.
Each year, the Committee’s independent adviser, Kepler Associates, sources and consolidates relevant remuneration data for appropriate roles, based on their analysis of relevant organisations and markets. The adviser prepares a comparison to current GMC remuneration, but does not make specific recommendations regarding the level of individual executives’ remuneration. For more information on the services provided to the Committee by Kepler Associates refer to section 6.2.3.
From this market comparison, the Committee determines the appropriate remuneration for each individual, taking into account their responsibilities, location, skills, experience and performance within the Group. In doing so, the Committee recognises that levels of remuneration should be sufficient to attract, motivate and retain highly skilled executives, but also that the Group should avoid paying more than is necessary for this purpose.
Total remuneration comprises different elements of remuneration to reflect a balance between fixed and at-risk remuneration and between short- and long-term incentives. The mix of remuneration elements and how the remuneration outcomes from each element are impacted by performance are describedindeed over 96 per cent in detail in the following section.
6.2.10 Components of remuneration
The following table shows the building blocks of total remuneration, how performance is assessed and will impact remuneration and how the resulting remuneration outcomes are delivered.
| | | | | | |
Component
| | Description
|
Base salary
| | •
| | Base salary is broadly aligned with salaries for comparable roles in global companies of similar global complexity, size, reach and industry, and reflects an individual’s responsibilities, location, performance, qualifications and experience within the Group, in order to attract and retain executives in pursuit of the Company’s purpose. |
| | |
| | •
| | Base salary is reviewed annually and any changes are effective from 1 September each year. Reviews consider general economic conditions and salary reviews across the rest of the Group. |
| | |
| | •
| | Base salary is denominated in US dollars for all GMC members. |
| | |
Pension contributions
| | •
| | Pension contributions are similarly benchmarked to comparable roles in global companies. |
| | |
| | •
| | All current GMC members are entitled to pension contributions under defined contribution pension plans. They are given a choice of funding vehicles: a Defined Contribution Plan, an unfunded Retirement Savings Plan, an International Retirement Plan or a cash payment in lieu. |
| | |
| | •
| | For FY2014, pension contributions for all GMC members will be 25% of base salary. |
| | |
Other benefits
| | •
| | GMC members are reimbursed for costs such as health and other insurances, the costs of tax return preparation in multiple jurisdictions (to a capped amount), and are provided with cash payments in lieu of untaken annual leave (as required in the US). |
| | |
| | •
| | Relocation allowances and assistance are provided under the Company’s global mobility policy and are ‘one-off’ payments with no trailing entitlements. |
| | |
Short-term incentive
| | •
| | The Remuneration Committee has approved a new Short Term Incentive Plan (STIP) for application to the CEO and other GMC members for FY2014 (and subsequent years). The new STIP replaces the prior Group Incentive Scheme (GIS), which has applied to the CEO and other GMC members for FY2013 and prior years. The features of the new STIP are set out below. Where the terms of the GIS (which covers FY2013 and prior awards) are different to those of the STIP, such differences have been noted below. |
| | |
| | •
| | The purpose of the STIP (and the prior GIS) is to focus management’s efforts on those performance measures and outcomes that have been determined to be priorities for the relevant financial year. |
| |
| | Measuring performance |
| | |
| | •
| | An individual scorecard of measures is set for each executive at the commencement of each financial year. These measures and their relative weightings are chosen by the Committee in order to appropriately drive overall performance in the current year, including achievement of financial outcomes and delivery against measures that impact the long-term sustainability of the Group. The Sustainability Committee assists the Remuneration Committee in determining appropriate health, safety, environment and community (HSEC) metrics to be included in GMC scorecards. |
| | | | | | |
Component
| | Description
|
| | •
| | At the conclusion of the financial year, each executive’s achievement against their measures is assessed by the Committee and the Board, and their STI award determined. The Remuneration Committee is assisted by the Sustainability Committee and by the Risk and Audit Committee in relation to assessment of performance against HSEC and financial measures, respectively. The Board believes this method of assessment is transparent, rigorous and balanced, and provides an appropriate, objective and comprehensive assessment of performance. |
| |
| | Half (50%) is delivered in cash and half (50%) in deferred equity
|
| | |
| | •
| | The value of any STI award is provided half in cash and half in an award of the equivalent face value of BHP Billiton equity, which is deferred for two years. The Committee intends this to provide an appropriate focus on the longer-term time frame, even in regard to annual STI rewards. |
| | |
| | •
| | ‘On-target’ performance against the scorecard measures delivers an STI award of 160% of base salary (being a cash STI award of 80% of base salary and the equivalent value in deferred equity). |
| | |
| | •
| | The maximum STI award payable under the plan is rarely awarded and is only available where all non-financial and financial targets are significantly exceeded. |
| | |
| | •
| | For FY2013, the maximum STI award that could have been earned under the GIS was 320% of base salary (160% of base salary in cash and an equivalent value in deferred equity). The minimum potential STI award was zero. |
| | |
| | •
| | In FY2014, the maximum STI award that can be earned under the new STIP will be 240% of base salary (120% of base salary in cash and an equivalent value in deferred equity). The minimum potential STI award will be zero. |
| | |
| | •
| | The equity is provided as Deferred Shares. Deferred Shares are not ordinary shares and do not carry entitlements to ordinary dividends or other shareholder rights. Each Deferred Share is a conditional right to receive one ordinary BHP Billiton share in the future if the service conditions are met. When the two-year vesting period is over, the Deferred Shares will vest if the holder is still employed by the Company or has left in certain circumstances (as described below this table). |
| |
| | Dividends on deferred equity |
| | |
| | •
| | Dividends are not received by the executives during the vesting period. |
| | |
| | •
| | A Dividend Equivalent Payment (DEP) is provided when the vesting period is over and the holder receives ordinary BHP Billiton shares in respect of the award. The value of the DEP is based on the dividends that would have been payable on ordinary BHP Billiton shares over the period from the allocation date to the time that the DEP is paid. |
| | |
| | •
| | Under the STIP, the Committee intends that DEP will be provided in the form of shares (although the plan accommodates a cash equivalent in appropriate circumstances). DEP provided under the GIS is paid in cash. |
| | |
| | •
| | A DEP is not provided in relation to any securities that are forfeited during the vesting period. |
| | | | | | |
Component
| | Description
|
Long-term incentive
| | •
| | A new LTIP is being proposed to shareholders for approval at the 2013 Annual General Meetings (AGMs) for grants proposed to be made to the CEO and other GMC members in FY2014 (and subsequent years). The new LTIP replaces the prior LTIP, which has applied to the CEO and other GMC members for grants made in FY2013 and prior years. Were the new LTIP not to be approved by shareholders at the 2013 AGMs, the grants proposed to be made in December 2013 would be made under the prior LTIP. The features of the new LTIP, which are not materially different from the prior LTIP, are set out below. Where the features differ from the prior LTIP, such differences have been noted below. |
| | |
| | •
| | The purpose of the LTIP is to focus management’s efforts on the achievement of sustainable long-term value creation and success of the Group (including appropriate management of business risks) and to align senior executive rewards with sustained shareholder wealth creation through the relative Total Shareholder Return (TSR) performance condition (described below). |
| |
| | Value of awards |
| | |
| | •
| | The value of any LTI award is provided as Performance Shares. Performance Shares are not ordinary shares and do not carry entitlements to ordinary dividends or other shareholder rights. Each Performance Share is a conditional right to receive one ordinary BHP Billiton share in the future if the performance and service conditions are met. |
| | |
| | •
| | When the Committee is determining the number of LTI awards to be allocated to GMC members, it uses the face value of the underlying Company shares to determine the value of awards. The Committee also considers the fair value (as below) of LTI awards in its determinations. In FY2013 and prior years, the Committee placed more emphasis on the fair value of an LTIP award to determine its size. |
| | |
| | •
| | The fair value is calculated by Kepler Associates. It reflects outcomes weighted by probability, taking into account the difficulty of achieving the performance conditions and the correlation between these and share price appreciation, together with other factors, including volatility and forfeiture risks. This fair value is not the same as the ‘IFRS fair value’ used in section 6.4.1, which is determined in accordance with the International Financial Reporting Standards (IFRS) 2/AASB 2 Share-based Payments accounting standards. |
| | |
| | •
| | The fair value for the current plan design is 41% of the face value of an award. |
| | |
| | •
| | Under both the prior LTIP and the new LTIP rules, the maximum award size is an award with a fair value equal to 200% of base salary, which is equivalent to a face value of 488% of base salary. |
| | |
| | •
| | The FY2014 award proposed to be made to the CEO in December 2013 has a face value of 400% of base salary. For the purposes of benchmarking and derivation of total target remuneration, the Committee uses the fair value of 164% of base salary (based on the fair value factor of 41%). |
| |
| | Dividends on LTI awards
|
| | |
| | •
| | Dividends are not received by the holder during the vesting period. |
| | |
| | •
| | A DEP (as described above in the STI section of this table) will be provided after the vesting of the award has been determined and the holder receives ordinary BHP Billiton shares in respect of the award. |
| | | | | | |
Component
| | Description
|
| | •
| | Under the new LTIP, the Committee intends that DEP will be provided in the form of shares (although the plan accommodates a cash equivalent in appropriate circumstances). DEP under the prior LTIP was paid in cash. |
| | |
| | •
| | A DEP is not provided in relation to any securities that are forfeited during the vesting period. |
| |
| | Total Shareholder Return (TSR) performance condition
|
| | |
| | •
| | The relative TSR performance condition must be achieved over a five-year period. Full vesting under the LTIP only occurs where BHP Billiton’s TSR significantly outperforms the TSR of the comparator companies. |
| | |
| | •
| | TSR measures the return in US$ delivered to shareholders over a defined period through the change in share price and any dividends paid (which are notionally reinvested for the purposes of the calculation). |
| | |
| | •
| | TSR has been chosen as the most appropriate measure as it allows for an objective external assessment over a sustained period on a basis that is familiar to shareholders. |
| | |
| | •
| | As BHP Billiton’s TSR performance relative to its peers tends to be counter-cyclical, the hurdle used since December 2010 includes both a sector-based comparison (67%) and a comparison to a broad stock market index (the MSCI World) (33%) for assessing the Group’s TSR performance, in order to provide a fairer and more balanced measure of performance. This weighting ensures a majority of the outcome is driven by our performance against that of resource industry peers. More detail on the comparator groups is shown in the final section of this table. The lists of peer companies for FY2013 and for FY2014 are shown in section 6.3.4. |
| |
| | Level of performance required for vesting |
| | |
| | •
| | For all Performance Shares to vest, BHP Billiton’s TSR must exceed the Index TSR by an average of 5.5% per annum, which equates to exceeding the average TSR over the five-year performance period by 30.7%. 25% of Performance Shares vest if BHP Billiton’s TSR is equal to the Index TSR (zero for awards granted prior to December 2010) and vesting occurs on a sliding scale between the Index TSR and the point of full vesting. BHP Billiton’s TSR is a weighted average of the TSRs of BHP Billiton Limited and BHP Billiton Plc. |
| | |
| | •
| | There is no retesting if the performance hurdle is not met. |
| | |
| | •
| | In the event that the Committee does not consider the level of vesting that would otherwise apply based on the Group’s achievement of the TSR hurdle to be a true reflection of the performance of the Group or should it consider that individual performance or other circumstances makes this an inappropriate outcome, it retains the discretion to lapse any or all Performance Shares held by one or more participants. This is an important mitigator against the risk of unintended vesting outcomes. |
| | |
| | •
| | Vested Performance Shares are able to be exercised for up to five years following the date that vesting is determined, with an expiry date prior to the fifth anniversary of vesting. |
| | | | | | | | | | |
Component
| | Description
|
| | | |
| | Awards in respect of years up to and
including FY2010 (granted up to
December 2009)
| | | | Awards made since FY2011 (granted or
to be granted since December 2010)
|
| | •
| | The comparators are sector peer
companies.
| | | | •
| | TSR performance relative to sector peer companies determines the vesting of 67% of the securities.
|
| | •
| | Opening and closing share prices for BHP Billiton and for each of the peer companies are averaged over a three-month period to help ensure that short-term fluctuations in the market do not affect the vesting results. | | | | | |
| | | | | | | •
| | TSR performance against a broad market index (MSCI World) determines the vesting of the remaining awards.
|
| | | | | | | •
| | The share price averaging period has been doubled to six months as added security against short-term price fluctuations. |
| | •
| | No Performance Shares vest if BHP
Billiton’s TSR is at or below the Index TSR.
| | | | |
| | | | | |
| | | | | | | | •
| | No Performance Shares vest if BHP Billiton’s TSR is below the Index TSR. |
| | | | | |
| | | | | | | | •
| | 25% of the Performance Shares vest if BHP Billiton’s TSR is at the Index TSR. |
Treatment of STI and LTI on departure
This section describes the treatment of awards under the new STIP and LTIP on cessation of employment. Where the treatment of awards is different under the prior GIS, this is described in sections 6.4.1 and 6.2.10.
Treatment of STI where a member of the GMC leaves during the financial year
If a participant leaves BHP Billiton during a performance year due to death, serious injury, disability or illness that prohibits continued employment, forced early retirement, retrenchment or redundancy, termination by mutual agreement or retirement with the agreement of the Company, or such other circumstances thatfive years, the Remuneration Committee determines are of a similar nature (other than those set out below),and the Committee may determine in its absolute discretionBoard will continue to pay a pro-rata portion of cash STI basedlisten and give attention to feedback and views from shareholders on the length of employment and performance of the participant upGroup’s approach to that date.pay.
Where a participant leaves BHP Billiton due to resignation or dismissal, then no cash amount will be paid in respect of the current performance year.
If a participant leaves BHP Billiton during a performance year for any reason, no deferred equity awards will be granted in respect of that performance year.
Treatment of STI where a member of the GMC leaves after the end of a financial year, but before awards are provided
Where a participant leaves BHP Billiton for any reason after the end of a performance year, but before the date of payment of any cash amount, no cash amount will be paid under the STIP in respect of that performance year, but the Committee may determine in its discretion to pay a separate amount in respect of the participant’s performance for that year.
Where a participant ceases employment for any reason after the end of a performance year, but before the date of grant of any deferred equity, no deferred equity will be granted in respect of that performance year, but the Committee may determine in its discretion to pay a separate cash amount in respect of the participant’s performance for that year.
Treatment of deferred STI and LTI equity holdings on departure
Where a participant leaves BHP Billiton due to forced early retirement, retrenchment or redundancy, termination by mutual agreement or retirement with the agreement of the Company, or such other circumstances that the Committee determines are of a similar nature (other than those set out below), then:
unvested STI equity awards to be granted under the new STIP will be retained by the participant, but will not vest and become exercisable until the scheduled vesting date. The Committee believes that this is important to assist the Company in applying the malus and clawback provisions, where it is considered appropriate (as described in the following section). This is a significant change from the terms of the GIS (applicable for prior awards and those for FY2013), under which awards vest in full on cessation of employment in such circumstances.
the participant may retain entitlements to a portion of unvested LTI awards, pro-rated to reflect the period of service from the start of the relevant performance period to the date of departure. After the employee’s departure, the LTI awards would only vest and become exercisable to the extent that the performance hurdles are met, and remain subject to available discretions. This ensures that any benefit received by the individual remains linked to their contribution to ongoing Group performance.
If a participant’s employment ends due to death, serious injury, disability or illness that prohibits continued employment or total and permanent disablement, immediate vesting of all of the participant’s STI and LTI awards occurs.
Where a participant leaves BHP Billiton due to resignation or dismissal, then all unvested STI and LTI awards will lapse.
If a participant ceases employment for any other reason, including where the business or company for which the participant works is sold outside the Group, the Committee in its discretion will determine the rights of a participant to the exercise or award or lapse of deferred equity awards.
Malus and clawback
The new STIP and LTIP include malus and clawback provisions to allow the Remuneration Committee to reduce or clawback awards in certain circumstances, including:
for any misconduct or fraud by a participant;
where BHP Billiton becomes aware of a material misstatement or omission in the financial statements of a Group company or the Group; or
any circumstances occur that the Committee determines in good faith to have resulted in an inappropriate benefit to the participant.
In addition, the Committee will have the ability to clawback all or some of the shares allocated to a participant or cash received by a participant in connection with the new STIP or LTIP in order to ensure that no inappropriate benefit is obtained by the participant.
6.2.11 When the components of remuneration are provided
The following graph illustrates the usual time frame for delivery of the components of remuneration.
Cash STI awards are paid in September following the release of the Group’s annual results. The remainder of the STI awards and those under the LTI are delivered after the AGMs and are usually allocated in December. Allocations to the CEO are subject to shareholder approval. Employees will generally not have access to the value of these equity awards for approximately two years in the case of STI awards, and five years in the case of LTI awards, depending on the level of vesting under the LTIP performance hurdle, including the exercise of the Remuneration Committee’s discretion to reduce vesting.
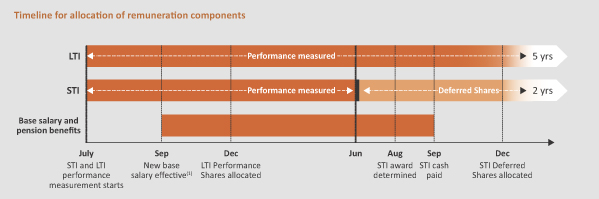
(1) | There were no increases to base salary for any members of the GMC in September 2012. Changes in base salary for GMC members during FY2013 were effective at various times related to the changes in the GMC structure during the year (refer to section 6.3.2). |
6.2.12 Potential remuneration outcomes
While the Board recognises that market forces necessarily influence remuneration practices, it strongly believes that the fundamental driver of our remuneration arrangements should be business performance. Accordingly, while target total remuneration is structured to attract and retain executives, the amount of remuneration actually received is dependent on the achievement of superior business and individual performance and on generating sustained shareholder value from relative performance. At risk components of remuneration therefore represent a significant portion of total remuneration, are subject to performance conditions and to ongoing service, and are designed to deliver appropriate pay over various time horizons.
The diagrams below illustrate the relative proportion of each remuneration component for the CEO if the minimum, target and maximum levels of performance were achieved.
These diagrams have been developed with reference to new UK reporting requirements, and in line with UK guidance:
the figure for other benefits is based on FY2013 actual figures for current GMC members, excluding non-recurring items; and
the impact of potential future share price movements (up and down) on the value of deferred STI and LTI awards have been ignored.
Remuneration mixoutcomes for the CEO
The LTI amount (targetMr Mackenzie, on his appointment as CEO in 2013, supported the view of the Board and maximum)Committee that his remuneration package should be rebased downwards relative to that of the former CEO. Mr Mackenzie’s base salary has not been increased since then, and again, after review in 2015, it will remain unchanged at US$1.700 million per annum. In addition, the other components of his total target remuneration (pension contributions, benefits and short-term and long-term incentive targets) are also unchanged since 2013. Mr Mackenzie is based on the new CEO’s normal award sizeonly Executive Director.
Mr Mackenzie’s annual STI is at risk, with a target outcome of 400160 per cent of base salary, at face value, which is lower than thea maximum permissible award size under the plan rules (an amount equivalent to 488outcome of 240 per cent of base salary, face value). The ‘target’ value for the LTI award is based on the fair valueand a minimum outcome of the award, which is 41 per cent of the face value as this is the expected outcome on the balance of probabilities.
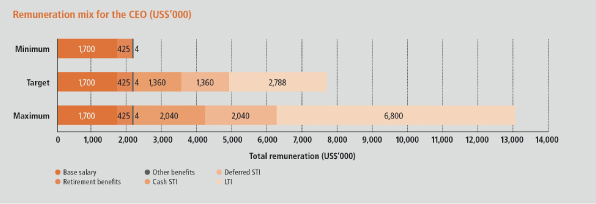
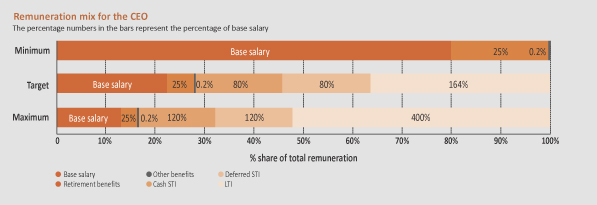
Remuneration mix for other GMC members
The diagram below illustratesAs in past years, the relative proportion of each remuneration component for the other GMC members if the minimum, target and maximum levels of performance-based remuneration were to be provided.
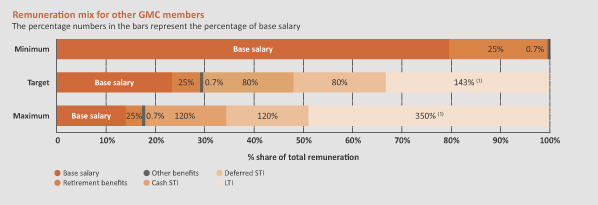
(1) | GMC members (other than the CEO) have a maximum LTI award of 350 per cent of base salary at face value (or 143 per cent of base salary at fair value), with the exception of Jane McAloon, who has a maximum LTI award of 300 per cent of base salary at face value (or 123 per cent of base salary at fair value). |
Remuneration policy for Non-executive Directors
6.2.13 Remuneration policy
Our Non-executive Directors are paid in compliance with the UK Corporate Governance Code (2010) and the ASXCorporate Governance Council’s Principles and Recommendations (2nd Edition).
Remuneration rates for Non-executive Directors are set at a competitive level, with advice on benchmark fees in equivalent sized companies provided by external advisers. The remuneration levels reflect the size and complexity of the Group, the multi-jurisdictional environment arising from the Dual Listed Company structure, the multiple stock exchange listings, the extent of the geographic regions inscorecard against which the Group operates and the enhanced responsibilities associated with membership of Board Committees. They also reflect the considerable travel burden imposed on members of the Board. In setting the remuneration of the Non-executive Directors, the economic environment and the financialhis short-term performance of the Group is taken into account, along with pay and employment conditions of employees elsewhere in the Group.
Non-executive Directors are not eligible to participate in any incentive arrangements. A standard letter of appointment has been developed for Non-executive Directors and is available on our website. Each Non-executive Director is appointed subject to periodic re-election by shareholders (see section 5.12 for an explanation of the process). There are no provisions in any of the Non-executive Directors’ appointment arrangements for compensation payable on early termination of their directorship.
6.2.14 Non-executive Director fees
Fees for the Non-executive Directors are determined by the Chairman and the CEO. The Non-executive Directors do not take part in these discussions. Fees for the Chairman are determined by the Board on the recommendation of the Remuneration Committee. Fees for the Non-executive Directors and Chairman were reviewed in June 2013 and benchmarked against peer companies, with the assistance of externally provided
benchmark data. As a result of the review, a decision was taken to make no change to the fee levels of the Non-executive Directors or the Chairman for FY2014. The table below sets out the fees, and the changes in fee levels, since 1 July 2009. The aggregate sum available to remunerate Non-executive Directors was approved by shareholders at the 2008 AGMs at US$3.8 million.
| | | | | | | | | | | | | | | | | | | | |
Levels of fees and travel
allowances for
Non-executive Directors
(in US dollars) | | From 1 July
2009 | | | From 1 July
2010 | | | From 1 July
2011 | | | From 1 July
2012 | | | From 1 July
2013 | |
Base annual fee | | | 140,000 | | | | 154,000 | | | | 170,000 | | | | 170,000 | | | | 170,000 | |
Plus additional fees for: | | | | | | | | | | | | | | | | | | | | |
| Senior Independent Director of BHP Billiton Plc | | | 30,000 | | | | 35,000 | | | | 48,000 | | | | 48,000 | | | | 48,000 | |
Committee Chair: | | | | | | | | | | | | | | | | | | | | |
Risk and Audit | | | 50,000 | | | | 55,000 | | | | 60,000 | | | | 60,000 | | | | 60,000 | |
Finance(1) | | | – | | | | – | | | | – | | | | 60,000 | | | | 60,000 | |
Remuneration | | | 35,000 | | | | 40,000 | | | | 45,000 | | | | 45,000 | | | | 45,000 | |
Sustainability | | | 35,000 | | | | 40,000 | | | | 45,000 | | | | 45,000 | | | | 45,000 | |
Nomination | | | No additional fees | | | | No additional fees | | | | No additional fees | | | | No additional fees | | | | No additional fees | |
Committee membership: | | | | | | | | | | | | | | | | | | | | |
Risk and Audit | | | 25,000 | | | | 30,000 | | | | 32,500 | | | | 32,500 | | | | 32,500 | |
Finance(1) | | | – | | | | – | | | | – | | | | 32,500 | | | | 32,500 | |
Remuneration | | | 20,000 | | | | 25,000 | | | | 27,500 | | | | 27,500 | | | | 27,500 | |
Sustainability | | | 20,000 | | | | 25,000 | | | | 27,500 | | | | 27,500 | | | | 27,500 | |
Nomination | | | No additional fees | | | | No additional fees | | | | No additional fees | | | | No additional fees | | | | No additional fees | |
Travel allowance:(2) | | | | | | | | | | | | | | | | | | | | |
Greater than 3 but less than 10 hours | | | 7,000 | | | | 7,000 | | | | 7,000 | | | | 7,000 | | | | 7,000 | |
10 hours or more | | | 15,000 | | | | 15,000 | | | | 15,000 | | | | 15,000 | | | | 15,000 | |
| Chairman’s remuneration | | | 1,000,000 | | | | 1,000,000 | | | | 1,100,000 | | | | 1,100,000 | | | | 1,100,000 | |
(1) | The Finance Committee was created on 23 April 2012, and the fees shown are annualised and commenced from that date. |
(2) | In relation to travel for Board business, the time thresholds relate to the flight time to travel to the meeting location (i.e. one way flight time). Until 30 June 2011, the time frames were ‘Greater than 3 but less than 12 hours’ and ‘12 hours or more. |
6.3 Remuneration implementation report
This section of the report shows the impact of the remuneration policy in FY2013 and how actual performance outcomes link to remuneration outcomes.
Remuneration outcomes for GMC members
6.3.1 Total actual remuneration of the CEO
This section shows a single figure of actual remuneration as described under the new UK requirements, the reporting in accordance with which will be effective from BHP Billiton’s FY2014 Remuneration Report.
| | | | | | | | | | | | | | | | | | | | | | | | | | | | | | |
US dollars (’000) | | | | | | | Pension
contribution | | | Other
benefits | | | STI | | | LTI | | | Total | |
| | | | Base salary | | | | | Cash | | | Deferred
equity | | | |
Andrew Mackenzie | | FY2013 | | | 242 | | | | 60 | | | | 702 | | | | 128 | | | | 128 | | | | 1,208 | | | | 2,468 | |
Marius Kloppers | | FY2013 | | | 1,906 | | | | 762 | | | | 72 | | | | 1,442 | | | | 1,442 | | | | 10,367 | | | | 15,991 | |
| | | | | | | | | | | | | | | | | | | | | | | | | | | | | | |
| | FY2012 | | | 2,201 | | | | 880 | | | | 109 | | | | 0 | | | | 0 | | | | 12,902 | | | | 16,092 | |
| | | | | | | | | | | | | | | | | | | | | | | | | | | | | | |
The data included in the above table is determined according to incoming UK requirements and reports only remuneration relating to performance of the services of an Executive Director for the current year and prior year.
For Andrew Mackenzie in FY2013, this means disclosure of the following amounts for the time served as CEO and as an Executive Director:
Base salary: actual cash salary earned from 10 May to 30 June 2013.
Pension contribution: the Company’s contribution to pension plans during the same period at 25 per cent of base salary.
Other benefits: pro-rated portion of all benefits paid during FY2013, plus the full amount of the relocation allowance paid in respect of Mr Mackenzie’s move from the United Kingdom to Australia (refer to section 6.4.1).
STI: a pro-rated portion of Mr Mackenzie’s STI for FY2013, to reflect the period from 10 May to 30 June 2013, provided in cash or deferred in respect of performance for FY2013.
LTI: a pro-rated portion of the value of 243,126 LTIP awards that vested on 22 August 2013, to reflect the period from 10 May to 30 June 2013, as described in section 6.3.4. The total face value of those awards and the associated DEP on the date of vesting and exercise was US$8,480,000.
For Marius Kloppers in FY2013, the amounts disclosed are similarly for the time served as CEO and as an Executive Director from 1 July 2012 to 10 May 2013.
With the exception of pro-rating for time as an Executive Director for Mr Mackenzie, the base salary, pension contribution, other benefits and cash STI amounts shown in the table therefore correspond to the similar columns in the table in section 6.4.1 under Australian disclosure requirements. The values shown above for deferred equity STI and LTI do not correspond to those shown in table 6.4.1 as that table uses a methodology based on amortised IFRS fair values (as described in section 6.4.1).
6.3.2 Fixed remuneration
Base salary
The increase in base salary for Andrew Mackenzie was effective 10 May 2013 upon his appointment as CEO. Changes in base salary for Mike Henry and Graham Kerr reflect their expanded roles, given to them by the new CEO, as a consequence of the GMC restructure effective 10 May 2013. These base salary changes apply from 1 September 2013.
Non-statutory table: Base salary amounts in the table below are effective 1 September and are not linked to any specific financial year. They therefore do not match with the 1 July 2012 to 30 June 2013 salaries shown in section 6.4.1.
| | | | | | | | | | | | | | | | | | | | |
US dollars (’000) | | 1 September
2011 | | | 1 September
2012 | | | %
change | | | 1 September
2013 | | | %
change | |
Andrew Mackenzie | | | 1,200 | | | | 1,200 | | | | 0.0 | | | | 1,700 | | | | 41.7 | |
Peter Beaven(1) | | | – | | | | – | | | | – | | | | 1,000 | | | | – | |
Dean Dalla Valle(1) | | | – | | | | – | | | | – | | | | 1,000 | | | | – | |
Geoff Healy(2) | | | – | | | | – | | | | – | | | | 1,000 | | | | – | |
Mike Henry | | | 1,000 | | | | 1,000 | | | | 0.0 | | | | 1,100 | | | | 10.0 | |
Graham Kerr | | | 1,000 | | | | 1,000 | | | | 0.0 | | | | 1,100 | | | | 10.0 | |
Jane McAloon(1) | | | – | | | | – | | | | – | | | | 750 | | | | – | |
Daniel Malchuk(1) | | | – | | | | – | | | | – | | | | 850 | | | | – | |
Jimmy Wilson(1) | | | – | | | | – | | | | – | | | | 1,000 | | | | – | |
Karen Wood(3) | | | 1,006 | | | | 1,006 | | | | 0.0 | | | | 1,000 | | | | (0.6 | ) |
Marius Kloppers(4) | | | 2,215 | | | | 2,215 | | | | 0.0 | | | | – | | | | – | |
Alberto Calderon(4) | | | 1,144 | | | | 1,144 | | | | 0.0 | | | | – | | | | – | |
Marcus Randolph(4) | | | 1,279 | | | | 1,279 | | | | 0.0 | | | | – | | | | – | |
J Michael Yeager(4) | | | 1,290 | | | | 1,290 | | | | 0.0 | | | | – | | | | – | |
(1) | For Peter Beaven, Dean Dalla Valle, Jane McAloon, Daniel Malchuk and Jimmy Wilson, the table shows the base salary effective from 10 May 2013, for their new roles as GMC members. Their base salaries prior to this time are not applicable for the purposes of the Remuneration Report. |
(2) | For Geoff Healy, the table shows the base salary applicable from 3 June 2013, when he commenced employment with BHP Billiton. |
(3) | The base salary change for Karen Wood was effective from 10 May 2013. |
(4) | Marius Kloppers, Alberto Calderon and Marcus Randolph retired from the GMC, effective from 10 May 2013 and J Michael Yeager has retired from BHP Billiton, effective from 8 July 2013. Their 1 September 2013 base salaries are therefore not applicable for the purposes of the Remuneration Report. |
Pension contribution
The table below sets out the pension or superannuation contribution applicable to each individual for their time as a member of the GMC under defined contribution arrangements.
| | | | | | | | | | |
Name | | % of base salary | | | Name | | % of base salary | |
Andrew Mackenzie(1) | | | 36.0 to 25.0 | | | Daniel Malchuk | | | 25.0 | |
Peter Beaven | | | 25.0 | | | Jimmy Wilson | | | 25.0 | |
Dean Dalla Valle | | | 25.0 | | | Karen Wood(1) | | | 34.4 to 25.0 | |
Geoff Healy | | | 25.0 | | | Marius Kloppers(2) | | | 40.0 | |
Mike Henry | | | 25.0 | | | Alberto Calderon | | | 35.0 | |
Graham Kerr | | | 25.0 | | | Marcus Randolph | | | 34.0 | |
Jane McAloon | | | 25.0 | | | J Michael Yeager | | | 35.8 | |
(1) | The pension contribution percentage for Andrew Mackenzie and for Karen Wood changed to 25.0 per cent of base salary on 10 May 2013 and now align with the pension arrangements for other current GMC members. |
(2) | Prior to his appointment as CEO, and under the terms of a pre-existing contract, Marius Kloppers had the choice of a (1) ‘defined benefit’, (2) ‘defined contribution’ underpinned by a defined benefit promise, or (3) ‘cash in lieu’ pension entitlement for each year since 1 July 2001. He elected to take cash in lieu for each year except for FY2004 when he elected to take a defined contribution entitlement with a defined benefit underpin. Mr Kloppers retains the option to convert the entitlement accrued in the defined contribution fund to a defined benefit entitlement for that one year. Upon his succession as CEO on 1 October 2007, Mr Kloppers relinquished all future defined benefit entitlements. |
Up until 2011 the value of his defined contribution entitlement exceeded, or was only marginally lower than, the transfer value of the defined benefit underpin that he would be entitled to should he revert to the defined benefit promise, and as such the entitlement was treated on a defined contribution basis. However, as measured at 30 June 2012, the transfer value of the underpin was significantly greater than the defined contribution fund and therefore a disclosure was provided for the defined benefit promise. The transfer value of the underpin at 10 May 2013 (US$898,303) is also significantly greater than the defined contribution fund (US$623,278), and as such the disclosure for this defined benefit promise is provided below. The actual amount that may be paid to Mr Kloppers will be recalculated on his leaving date of 1 October 2013.
| | | | | | | | | | | | | | | | |
US dollars | | Increase
in
accrued
pension
during
the year | | | Increase
in
transfer
value
over the
year | | | Transfer value of total accrued
pension | |
Accumulated total accrued
pension at 10 May 2013 | | | |
| | | | at 10 May 2013 | | | at 30 June 2012 | |
31,967 | | | 619 | | | | 119,776 | | | | 898,303 | | | | 778,527 | |
The increase in accrued pension during the period is the difference between the accrued pension at the end of the previous year and the accrued pension at 10 May 2013 without any allowance for inflation. The increase in transfer value over the period is the difference between the transfer value at the end of the period and the transfer value at the beginning of the period less the contributions made to the scheme by the participant (nil), also without any allowance for inflation. The increase in accrued pension after making an allowance for inflation of 2.2 per cent was US$71 and the transfer value of that increase less the contributions made to the scheme by the participant was US$1,995.
Other benefits
The total value of benefits actually provided to each GMC member during FY2013 is shown in the statutory remuneration disclosure table in section 6.4.1.
Shareplus all-employee share purchase plan
Members of the GMC are also eligible to contribute up to US$5,000 per annum from their post-tax base salary to participate in Shareplus, the all-employee share purchase plan. More details of the plan and of the current holdings of GMC members under the plan are shown in section 6.4.7. Given the nature of the plan, no performance conditions apply to the shares allocated under Shareplus, although a service condition applies in respect of the Matched Shares.
For administrative simplicity in regard to stock exchange dealings and announcements, no GMC members currently participate in Shareplus. The table in section 6.4.7 shows Shareplus holdings previously accumulated by members of the GMC, including during the period before they became members of the GMC.
The Remuneration Committee does not consider the value of these benefits when determining total remuneration. An IFRS fair value is ascribed to any Matched Shares and included in remuneration as described in section 6.4.1.
6.3.3 Short-term incentives
FY2013assessed comprises performance measures and outcomes under the GIS
STI outcomes for FY2013 have been determined under the GIS program, with the new STIP effective from FY2014. The GMC scorecard for the FY2013 performance year is shown below. The level of achievement against each of the non-individual measures for the FY2013 performance year as determined by the Remuneration Committee is described below the table.
A performance range is set for each measure with the level of performance determined as:
Threshold: the minimum necessary to qualify for any award.
Target: where the performance requirements are met.
Stretch: where the performance requirements are exceeded.
Exceptional: where the performance requirements are significantly exceeded.
This scorecard applies for each member of the GMC as shown in the table footnotes. As each new member of the GMC has been in their new role for only a short period, their performance for FY2013 has been assessed against their prior scorecard in their previous role for the whole of FY2013 and in accordance with the Group structure in place at the commencement of FY2013. These scorecards were based on similar elements as those measured under the GMC scorecard shown below, in that they comprised measures in regard toincluding HSEC, financial, and production outcomes, corporate citizenship and individual contribution as applicable to each individual’s previous non-GMC role within the Group. Geoff Healy is not eligible for any FY2013 STI assessment or award as he joined BHP Billiton within the last month of the performance year.
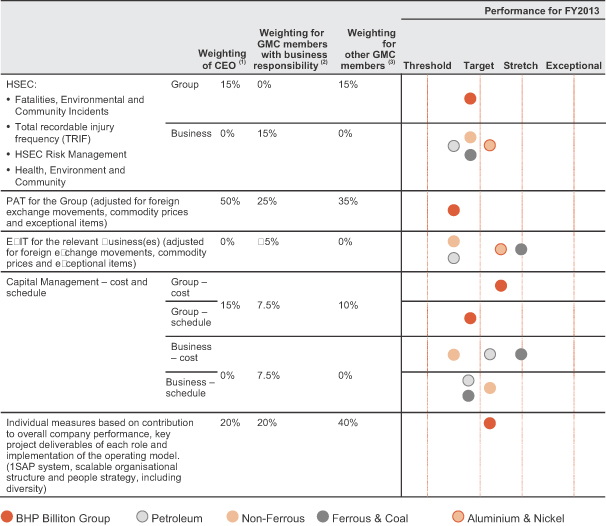
(1) | Applicable weightings for Marius Kloppers to 10 May 2013. |
(2) | Applicable weightings for Andrew Mackenzie and J Michael Yeager for the whole of FY2013 and for Marcus Randolph and Alberto Calderon to 10 May 2013. |
(3) | Applicable weightings for Mike Henry, Graham Kerr and Karen Wood for the whole of FY2013. |
Health, Safety, Environment and Community (HSEC)
As it has done for several years, the Remuneration Committee sought guidance from the Sustainability Committee on HSEC performance for FY2013. In the first instance, the Sustainability Committee reviewed performance against the designated measures (derived from the Group’s HSEC public targets set out on page 5 of the Group’s Sustainability Report) set at the beginning of FY2013. Following the assessment against the designated measures, the Remuneration Committee also considered it appropriate to then take a holistic view of how the Group has performed in critical areas. This approach is consistent with that of prior years.
The Sustainability and Remuneration Committees reflected deeply on the tragic loss of three lives during FY2013 – one in Petroleum, one in Metallurgical Coal and one in Base Metals. We remain committed to eliminating fatalities from our Company and we continue to maintain an ever-vigilant focus on safety and fatality prevention through leadership and effective processes. These elements were paramount in the Committees’ considerations when determining the STI outcomes for the Group and the prior businesses. In conjunction with these considerations, both Committees noted improved performance on TRIF across the Group and also solid outcomes emanating from the Company’s endeavours in respect of HSEC risk management and health. However, outcomes in respect of environment, particularly greenhouse gas and water abatement, lagged expectations in several businesses.
The overall Group result for HSEC fell short of expectations (marginally below Target), with differentiated levels of HSEC performance across the businesses:
Petroleum HSEC performance against targets set was below expectations (between Threshold and Target). Despite reporting significant improvement in TRIF safety performance at our Onshore US shale asset, the occurrence of a fatality and below target performance in the areas of health and environment resulted in the assessment of overall performance being below target.
Ferrous & Coal and Non-Ferrous were considered marginally below expectations (marginally below Target), with a fatality in each and below target performance in the environment area, partly offset by strong performance in respect of health outcomes.
Aluminium & Nickel was considered marginally above expectations (marginally above Target), with on-track outcomes, on average, across a range of HSEC categories.
Profit After Tax (PAT)
For the reasons noted below in respect of EBIT, in combination with unfavourable impacts against the Group’s bottom line of funding costs and taxation against targets, the Group PAT was below expectations (between Threshold and Target).
Earnings Before Interest and Tax (EBIT)
EBIT performance for the businesses against the targets set at the commencement of the year was varied:
Petroleum – below target (between Threshold and Target), with lower production volumes than expected at the commencement of the year.
Ferrous & Coal – above targets set at the start of the year and was rated highly (at Stretch), primarily due to positive results in respect of FY2013 Iron Ore production volumes.
Non-Ferrous – below expectations (between Threshold and Target) as a consequence of below-target performance on production volumes and cost management.
Aluminium & Nickel – above expectations (between Target and Stretch) as a consequence of above-target performance on cost management.
Capital management
Performance in respect of capital project management metrics varied for FY2013. The overall Group outcome was positive for capital cost performance (between Target and Stretch), reflecting strong cost management on several major projects, partly offset by some capital projects taking slightly longer than expected (marginally below Target). In relation to the businesses:
Petroleum – performed in line with expectations on capital cost performance (marginally above Target), offset by below-expectation performance on capital schedule performance metrics (marginally below Target).
Ferrous & Coal – performed positively on capital cost performance (at Stretch), but performed less well on schedule performance metrics (marginally below Target).
Non-Ferrous – performed below expectations on capital cost (between Threshold and Target) and better than expected on schedule performance metrics (marginally above Target).
Aluminium and Nickel – there were no major capital projects in execution for Aluminium and Nickel during FY2013.
These outcomes reflect the varied cost and schedule outcomes for the 23 major projects in the portfolio at the commencement of FY2013.
Individual measures
Individual measures for GMC members are determined at the commencement of the financial year. The Group Chairman determines the measures for the CEO, and the CEO determines measures for remaining GMC members. These comprise each individual’s contribution to the GMC, delivery against projects and initiatives within the scope of his or her role, and his or her contribution to the overall performance of the Group. Personal performance of GMC members was reviewed against these measures by the Committee and, on average, was considered marginally above expectations (marginally above Target).
STI awards for the FY2013 performance year under the GIS
The following table shows the amount of at risk remuneration awarded bypersonal elements. For FY2015, the Remuneration Committee as STI awards as a result of Group, Business and individual performance against the above scorecard objectives for the FY2013 performance year (with comparative prior year data).
The Deferred Share and/or Option awards shown in the table have not yet delivered any realised value to the serving executives, as they generally do not vest and cannot be exercised for at least two years from the end of the relevant performance year, i.e. the FY2013 awards are expected to vest in August 2015. Different vesting treatment may apply for executives who leave the Group under specific circumstances and where an individual leaves BHP Billiton prior to the normal allocation date of the equity awards, they may instead receive an award in cash.
Non-statutory table: Cash STI awards shown below are the same as those reported in section 6.4.1, but this table shows the market value of the Deferred Shares and/or Options at the time of allocation (rather than amortising the IFRS fair value of each award over the relevant performance and service periods as per accounting standards).
| | | | | | | | | | | | | | | | | | | | | | | | | | | | | | | | |
US dollars (’000) | | FY2012
Cash STI | | | FY2012
Deferred
Shares and
Options (1) | | | FY2012
Total | | | % of max
FY2012 | | | FY2013
Cash STI | | | FY2013
Deferred
Shares and
Options (1) | | | FY2013
Total | | | % of max
FY2013 | |
Andrew Mackenzie (2) | | | 630 | | | | 630 | | | | 1,260 | | | | 33 | | | | 899 | | | | 899 | | | | 1,798 | | | | 47 | |
Peter Beaven (3) | | | – | | | | – | | | | – | | | | – | | | | 77 | | | | 77 | | | | 154 | | | | 53 | |
Dean Dalla Valle (3) | | | – | | | | – | | | | – | | | | – | | | | 60 | | | | 60 | | | | 120 | | | | 45 | |
Geoff Healy (4) | | | – | | | | – | | | | – | | | | – | | | | – | | | | – | | | | – | | | | – | |
Mike Henry | | | 474 | | | | 474 | | | | 948 | | | | 50 | | | | 817 | | | | 817 | | | | 1,634 | | | | 51 | |
Graham Kerr | | | 474 | | | | 474 | | | | 948 | | | | 50 | | | | 897 | | | | 897 | | | | 1,794 | | | | 56 | |
Jane McAloon (3) | | | – | | | | – | | | | – | | | | – | | | | 41 | | | | 41 | | | | 82 | | | | 48 | |
Daniel Malchuk (3) | | | – | | | | – | | | | – | | | | – | | | | 51 | | | | 51 | | | | 102 | | | | 48 | |
Jimmy Wilson (3) | | | – | | | | – | | | | – | | | | – | | | | 75 | | | | 75 | | | | 150 | | | | 48 | |
Karen Wood | | | 561 | | | | 561 | | | | 1,122 | | | | 35 | | | | 741 | | | | 741 | | | | 1,482 | | | | 46 | |
Marius Kloppers (5)(6) | | | 0 | | | | 0 | | | | 0 | | | | 0 | | | | 1,442 | | | | 1,442 | | | | 2,884 | | | | 47 | |
Alberto Calderon (6) | | | 603 | | | | 603 | | | | 1,206 | | | | 33 | | | | 784 | | | | 784 | | | | 1,568 | | | | 50 | |
Marcus Randolph (6) | | | 893 | | | | 893 | | | | 1,786 | | | | 44 | | | | 853 | | | | 853 | | | | 1,706 | | | | 49 | |
J Michael Yeager (5) | | | 0 | | | | 0 | | | | 0 | | | | 0 | | | | 885 | | | | 885 | | | | 1,770 | | | | 43 | |
| | | | | | | | | | | | | | | | | | | | | | | | | | | | | | | | |
Average (7) | | | | | | | | | | | | | | | 31 | | | | | | | | | | | | | | | | 48 | |
| | | | | | | | | | | | | | | | | | | | | | | | | | | | | | | | |
(1) | The Deferred Shares and/or Options have the same values as the corresponding cash award. The actual number of Deferred Shares allocated is determined by dividing the relevant value by the share price at the time of allocation. The number of Options required to provide an approximately equivalent value will also be determined (should any members of the GMC nominate this alternative, or a combination of Deferred Shares and Options) based on a valuation conducted by Kepler Associates. The values shown in the FY2013 Deferred Shares and Options column for those individuals who are leaving or have left BHP Billiton prior to the normal allocation date in December 2013 (after the AGMs) represents their notional entitlement to Deferred Shares and Options had they remained in employment at the allocation date. As described in section 6.3.5, these individuals will receive their FY2013 GIS award (pro-rated for the portion of the year served as a GMC member) wholly in the form of cash. These cash awards are not subject to any further deferral. |
(2) | The STI outcome shown for Andrew Mackenzie is based on his performance against his scorecard as Group Executive and Chief Executive – Non-Ferrous. It was also calculated as a percentage of Mr Mackenzie’s base salary in his previous role of Group Executive and Chief Executive – Non-Ferrous as per the rules of the GIS. He will be assessed against the CEO scorecard from FY2014. |
(3) | The STI maximums and outcomes shown for new members of the GMC appointed on 10 May 2013 are based on their performance against their prior scorecard in their previous non-GMC roles for the whole of FY2013 and also on their base salary in those roles (pro-rated for GMC service). They will be assessed against their GMC scorecards from FY2014. These new members of the GMC have received their cash and will receive their equity-based STI awards for FY2013 up to 9 May 2013 under the management Group Short Term Incentive Plan (GSTIP), which applied to their previous non-GMC positions, and under the GIS in respect of the period in their new GMC positions from 10 May 2013 to 30 June 2013. |
(4) | As Geoff Healy’s employment with BHP Billiton commenced on 3 June 2013, he is not eligible for an STI outcome in respect of FY2013. |
(5) | As a result of the impairment against the carrying value of Fayetteville shale gas assets acquired from Chesapeake Energy in March 2011, both Marius Kloppers and Mike Yeager advised the Committee that they did not wish to be considered for a STI award for FY2012. The Committee and the Board respected and agreed with that decision. |
(6) | The STI maximums and outcomes shown for Marius Kloppers, Alberto Calderon and Marcus Randolph are based on the period from 1 July 2012 to 10 May 2013. No STI has been earned by these individuals for the period after their retirement from the GMC. |
(7) | This simple (unweighted) average percentage of maximum is graphed against Group earnings later in this section and includes only the GMC members in office at 30 June 2013 (that is, it excludes Mr Kloppers, Mr Calderon and Mr Randolph). |
Relationship between STI outcomes and Group performance
The following graphs are included as part of satisfying an Australian disclosure requirement to show the relationship between KMP remuneration and performance, including earnings.
As described earlier in this section, STI awards for members of the GMC are based on a balanced scorecard of key performance measures. A substantial component of each scorecard is based on measures that will drive the long-term success and sustainability of the Group, but which may not have a direct correlation to annual profitability.
Only a proportion of STI outcomes are directly related to financial measures, and that proportion varies for different members of the GMC. The profit measure used for calculating scorecard outcomes (as defined earlier in this section) is not the same as the disclosed profit attributable to shareholders used in the graph below.
Due to the factors described above, some correlation between STI outcomes and the measures used in the graphs below is evident over the last five years, but there is no guarantee that this will be the case in the future. Further details of the Group’s attributable profit and basic earnings per share over the past five years can be found in section 1.6.1.
FY2014 performance measures under the STIP
The performance measures and weightings set out in the table below have been set by the Remuneration Committee for FY2014. The measures and weightings for FY2014 differ in certain respects from those used in FY2013, as FY2014 measures and weightings reflect the priorities set for GMC members for FY2014.
| | | | | | | | | | | | | | |
| | | Category
weightings | | | Weighting for
CEO
and functional
GMC members | | | Weighting
for GMC
members
with
Business
responsibility | |
HSEC • Fatalities, environmental and community incidents • Total recordable injury frequency (TRIF) • HSEC risk management • Health, environment and community | | | 20 | % | | | | | 20 | % | | | 20 | % |
Financial outcomes • PAT for the Group (adjusted for foreign exchange movements, commodity prices and exceptional items) | | | 40 | % | | Group | | | 40 | % | | | 20 | % |
| | | | |
• EBIT for the relevant Business(es) (adjusted for foreign exchange movements, commodity prices and exceptional items) | | | | | | Business | | | 0 | % | | | 20 | % |
| | | | |
Capital management • Cost and schedule | | | 20 | % | | Group | | | 20 | % | | | 10 | % |
| | | | |
| | | | | | Business | | | 0 | % | | | 10 | % |
Individual performance • Individual measures based on contribution to the overall performance of the Company and the management team, key deliverables of each role, including productivity and cost improvement, enhanced stakeholder relations and portfolio optimisation | | | 20 | % | | | | | 20 | % | | | 20 | % |
6.3.4 Long-term incentives
FY2013 LTI granted in December 2012
The following table shows the LTI awards provided as part of total remuneration for FY2013, and allocated in December 2012 following approval of the CEO’s award by shareholders at the AGMs (with comparative prior year data). During FY2013, and before their appointment as members of the GMC, all new members of the GMC other than Geoff Healy received awards under the Management Award Plan (MAP), as shown in section 6.4.6. The first awards under the LTIP for these GMC members and for Geoff Healy will be determined by the Remuneration Committee and allocated in December 2013, along with FY2014 awards for the other members of the GMC.
The maximum award under the LTIP for FY2013 granted December 2012 was a fair value of 200 per cent of base salary as at 1 September 2012 (as set out in the table in section 6.2.10).
Non-statutory table: LTI awards shown below are included in the table in section 6.4.1, but this table shows the face value and fair value of the awards as described above (rather than amortising the IFRS fair value of each award over the relevant performance and service periods as per accounting standards).
| | | | | | | | | | | | | | | | | | | | | | | | | | | | | | | | |
Name | | Number of
Performance
Shares
allocated in
December
2011 | | | US dollars (’000)
December 2011 | | | % of max
December
2011 | | | Number of
Performance
Shares
allocated in
December
2012 | | | US dollars (’000)
December 2012 | | | % of max
December
2012 | |
| | | Face
value | | | Fair
value (1) | | | | | Face
value | | | Fair
value(2) | | |
Andrew Mackenzie | | | 146,510 | | | | 4,400 | | | | 1,804 | | | | 75 | | | | 140,326 | | | | 4,400 | | | | 1,804 | | | | 75 | |
Mike Henry | | | – | | | | – | | | | – | | | | – | | | | 121,179 | | | | 3,800 | | | | 1,558 | | | | 78 | |
Graham Kerr | | | – | | | | – | | | | – | | | | – | | | | 108,939 | | | | 3,800 | | | | 1,558 | | | | 78 | |
Karen Wood | | | 85,027 | | | | 3,146 | | | | 1,290 | | | | 64 | | | | 90,234 | | | | 3,146 | | | | 1,290 | | | | 64 | |
Marius Kloppers | | | 226,721 | | | | 8,393 | | | | 3,441 | | | | 78 | | | | 240,603 | | | | 8,393 | | | | 3,441 | | | | 78 | |
Alberto Calderon | | | 146,510 | | | | 4,400 | | | | 1,804 | | | | 79 | | | | 140,326 | | | | 4,400 | | | | 1,804 | | | | 79 | |
Marcus Randolph | | | 119,603 | | | | 4,427 | | | | 1,815 | | | | 71 | | | | 126,926 | | | | 4,427 | | | | 1,815 | | | | 71 | |
J Michael Yeager | | | 119,603 | | | | 4,427 | | | | 1,815 | | | | 70 | | | | 126,926 | | | | 4,427 | | | | 1,815 | | | | 70 | |
| | | | | | | | | | | | | | | | | | | | | | | | | | | | | | | | |
Average | | | | | | | | | | | | | | | 73 | | | | | | | | | | | | | | | | 74 | |
| | | | | | | | | | | | | | | | | | | | | | | | | | | | | | | | |
(1) | December 2011 fair values are calculated by multiplying the average closing share price (in US dollars) over the three months up to and including the grant date (being A$36.54 for BHP Billiton Limited shares and £19.06 for BHP Billiton Plc shares) by the fair value factor of 41 per cent (as determined by Kepler Associates). The fair value for each executive therefore reflects the number of Performance Shares allocated, the entity over which they apply and the relevant exchange rates (where applicable). |
(2) | December 2012 fair values are calculated in the same way as described in footnote (1) above, except that average closing share prices for the three months up to and including the grant date were A$33.64 for BHP Billiton Limited shares and £19.53 for BHP Billiton Plc shares. |
A description of the performance conditions applying to the LTI Performance Shares is set out in the table in section 6.2.10. The index of peer group companies since 2007 is shown below. The list of peer group companies is reviewed by the Committee prior to each LTI award being allocated.
| | | | |
| | December 2007 to 2009
| | December 2010 to 2012
|
Resources (75%)
| | | | |
Alcoa
| | x | | x |
Anglo American
| | x | | x |
Cameco
| | x | | x |
Freeport McMoRan
| | x | | x |
Norilsk
| | x | | x |
Peabody Energy
| | x | | x |
Rio Tinto
| | x | | x |
Southern Copper
| | x | | x |
Teck Cominco
| | x | | x |
Vale
| | x | | x |
GlencoreXstrata(1)
| | x | | x |
| | | | |
| | December 2007 to 2009
| | December 2010 to 2012
|
Oil and Gas (25%)
| | | | |
Apache
| | x | | x |
BG Group
| | x | | x |
BP
| | | | x |
Devon Energy
| | x | | x |
Exxon Mobil
| | | | x |
Shell
| | | | x |
Woodside Petroleum
| | x | | x |
(1) | GlencoreXstrata applicable in the peer group for the December 2012 LTIP award, and replacing Xstrata in the peer group for December 2007 to 2011 awards. |
LTI vesting outcomes and the delivery of LTI award
The performance hurdle for the 2007 and 2008 LTI awards requires BHP Billiton’s TSR to exceed the weighted average TSR of a group of peer companies by 5.5 per cent per annum (on average over the five years), which is 30.7 per cent over five years.
In order to derive TSR outcomes, BHP Billiton’s US$ TSR performance is compared against US$ TSR performance of the LTIP comparator group over the five-year performance period. The following factors comprise the US$ TSR calculation:
movements in shares prices in US$ of BHP Billiton and companies in the LTIP comparator group during the five-year performance period, based on the three-month average US$ share price to the start of the five-year performance period (three months up to and including 30 June 2008) compared to the three-month average US$ share price to the end of the five-year performance period (three months up to and including 30 June 2013). The averaging period is used to mitigate the consequences of short-term share price and exchange rate fluctuations;
dividends paid in US$ by BHP Billiton and companies in the LTIP comparator group during the five-year performance period, assuming that dividends paid are reinvested in the relevant company on the date the dividends were paid.
Upon the introduction of the LTIP in 2004, the Committee, with advice from its independent adviser, Kepler Associates, determined that a common-currency approach using the US$ would be employed for TSR comparisons. The US$ is the Group’s functional and reporting currency, and a common-currency approach helps mitigate the effects of currency movements. In addition, all GMC members, including those domiciled in Australia and the UK, receive their annual salary and cash STI denominated in US$.
TSR is determined for BHP Billiton and each company in the comparator group in US$. The index US$ TSR of the comparator group as a whole is then determined (i.e. the weighted average of the comparators) and BHP Billiton’s TSR performance against that index TSR is tested.
2008 allocations under the LTIP – tested to the end of FY2013 and vested in FY2014
The five-year performance period for the 2008 LTIP ended on 30 June 2013. For awards to vest in full, BHP Billiton must deliver a TSR that exceeds the TSR of a group of peer companies by an average of 5.5 per cent per year for five years, or 30.7 per cent in total compounded over the five-year performance period. The weighted average TSR for peer companies was negative 44.0 per cent, which compared to BHP Billiton’s TSR of negative 9.4 per cent. As a result, BHP Billiton outperformed its peer companies by 34.6 per cent, and therefore met the requisite performance hurdle for full vesting. Of the 15 peer companies, only one company recorded a TSR outcome in excess of BHP Billiton’s, and 14 peer companies recorded negative TSR performance over the five-year performance period.
The impact of the TSR outperformance by BHP Billiton over the weighted average was to add US$78 billion of shareholder value from 1 July 2008 to 30 June 2013 over and above performance in line with the weighted average of the comparators (as shown in the graphs below).
The rules of the LTIP give the Committee discretion to reduce the number of awards that will vest, notwithstanding the fact that the performance hurdle for full vesting has been met. This year, the Committee, with the support of the Board, exercised that discretion and reduced vesting by 35 per cent for all current and former participating GMC members. Accordingly, 35 per cent of awards will not vest and will instead lapse.
In doing so, the Committee took into account a range of factors, including the negative TSR over the five-year performance period that shareholders have experienced. While the Committee recognised that the TSR performance was delivered in a difficult business environment, it also felt that more closely aligning the experience of shareholders and executives was important. As always, the Committee also looked at the total remuneration for executives.
This qualitative judgement, which is applied before final vesting is confirmed, is an important risk management aspect to ensure that vesting is not simply driven by a formula that may give unexpected or unintended remuneration outcomes. While the Committee has exercised its discretion this year, based on its consideration of all relevant factors, this does not imply the discretion will or will not be exercised in future years. The Committee considers its discretion carefully each year, taking account of the circumstances that are relevant to the five-year period under consideration.
A five-year history of BHP Billiton share prices and dividends is provided in section 6.4.8.
The graph below highlights BHP Billiton’s comparative performance against the ASX 100, FTSE 100 and the MSCI World index.
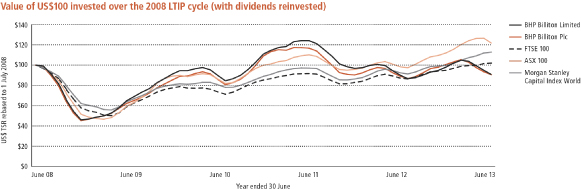
CEO award outcomes under the 2008 LTIP
When Andrew Mackenzie joined BHP Billiton in 2008, he was granted 450,964 awards based on the 2008 LTIP terms.
225,000 of the LTIP awards were granted in the ordinary course in connection with his role as Chief Executive Non-Ferrous and reflected the grant sizes to the other business Chief Executives.
A further 225,964 awards (comprising 100,839 LTIP awards and 125,125 phantom LTIP awards) were granted in order to compensate him for equity awards forgone when he left his former employer (‘Sign-on Awards’). The value and quantum of the sign-on awards was calculated by the Committee’s independent adviser, Kepler Associates, and disclosed at the time.
As all of the 450,964 awards were granted on terms that mirrored the 2008 LTIP, they have now been tested against the TSR performance hurdle and are all subject to the 35 per cent reduction.
In addition, Mr Mackenzie has concluded, and the Committee agrees, that despite the out performance of BHP Billiton compared to its peer group, the value delivered through vesting of the sign-on awards would be excessive. Accordingly, Mr Mackenzie has elected to voluntarily relinquish a further 50,000 of the sign-on awards, on top of the 35 per cent reduction.
This means 243,126 of the 450,964 awards originally granted to Mr Mackenzie have vested. The 243,126 vested awards are delivered to Mr Mackenzie via 211,795 ordinary shares and a cash payment representing 31,331 phantom LTIP awards.
2007 allocations under the LTIP – tested to the end of FY2012 and vested in FY2013
As detailed in last year’s Remuneration Report, the performance period for the 2007 LTIP ended on 30 June 2012, and the 2007 LTIP vested in August 2012. The number and value of vested Performance Shares for each GMC member are provided in section 6.4.3. Over the performance period, BHP Billiton’s TSR was 41.6 per cent. In contrast, the weighted average TSR for the peer group against which the Group’s performance was measured was negative 4.0 per cent. Of the 15 peer companies, only two companies recorded TSR outcomes in excess of BHP Billiton’s 41.6 per cent TSR performance (one at 45.6 per cent and one at 41.9 per cent), and eight peer companies recorded negative TSR performance over the five-year performance period. The impact of this 45.6 per cent outperformance was to add US$75 billion of shareholder value from 1 July 2007 to 30 June 2012 over and above performance in line with the weighted average of the comparators.
Implementation of LTIP for FY2014
Within the LTIP rules, the maximum annual LTI award that can be allocated is set at a fair value of 200 per cent of the participant’s base salary. Based on a fair value factor of 41 per cent (representing the probability of vesting), this equates to a maximum face value of 488 per cent of base salary (i.e. 41 per cent of 488 per cent is 200 per cent). For the FY2014 awards, which are expected to be allocated in December 2013, the Remuneration Committee has determined that the face value of LTI awards to GMC members will be in the range 300 per cent to 400 per cent of base salary.
On the advice of the Committee, the Board has proposed an award of FY2014 Performance Shares for the CEO, with a face value of US$6,800,000 (and fair value of US$2,788,000). The face value is equal to 400 per cent of the CEO’s base salary. The same performance and service conditions will be used for the FY2014 LTI award as was used for the FY2013 LTI awards for all GMC members.
If approved by shareholders, these FY2014 Performance Shares will be granted following the AGMs (i.e. in or around December 2013). The number of Performance Shares allocated will be notified to shareholders, when provided, along with the number of Performance Shares that will be granted to the other members of the GMC on the same date in respect of FY2014 LTI.
The actual number of Performance Shares to be granted will depend on the share price and exchange rate over the 12 months up to the date of grant. As an illustration, if the Performance Shares had been granted on 30 August 2013, the number granted to the CEO would have been 196,234 Performance Shares.
LTIP peer companies for FY2014
The list of peer companies has been reviewed by the Remuneration Committee and is shown below.
| | | | | | |
Resources (75%)
| | Oil and Gas (25%)
|
Alcoa
| | Norilsk | | Anadarko | | Devon Energy |
Anglo American
| | Peabody Energy | | Apache | | EOG Resources |
Cameco
| | Rio Tinto | | BG Group | | Exxon Mobil |
Consol Energy
| | Southern Copper | | BP | | Occidental |
Fortescue Metals
| | Teck Cominco | | Canadian Natural Resources | | Shell |
Freeport McMoRan
| | Vale | | Chevron Corp | | Woodside Petroleum |
GlencoreXstrata
| | | | ConocoPhillips | | |
A cap and collar mechanism is employed to reduce sensitivity to any single constituent company.
6.3.5 Arrangements for GMC members leaving the Group after 30 June 2013
The arrangements for GMC members leaving the Group are within the approval provided by shareholders at the 2011 AGMs in regard to Australian termination benefits legislation, including the provision of performance-based remuneration in accordance with the rules of the relevant short-term incentive and the long-term incentive plans.
The rules of the GIS outline the circumstances in which participants may be entitled to a cash award for the financial year in which they cease employment, and also in the event that cessation occurs after the end of the financial year but before the date the awards are provided. Such circumstances depend on the reason for leaving. The Remuneration Committee has exercised its discretion under the GIS to allow members of the GMC who have retired or are retiring from BHP Billiton prior to the normal grant date of FY2013 deferred equity awards (i.e. in December 2013 after the AGMs) to receive all of their STI award for FY2013 in the form of cash. No deferral period will apply in respect of these cash STI awards.
Marius Kloppers will retire from BHP Billiton on 1 October 2013
Until his retirement, Mr Kloppers will receive his base salary and pension contributions and any applicable benefits. He will not receive any additional payment in relation to his notice period. Upon his retirement, he will be entitled to the value of the pension and superannuation funds that he has accumulated over his 20 years with the Group.
The Remuneration Committee has determined that Mr Kloppers will receive a pro-rated FY2013 STI award in respect of his performance as CEO from 1 July 2012 to 10 May 2013, as assessed by the Committee and described in section 6.3.3. He will receive this award in the form of cash. Mr Kloppers will not be eligible to receive any STI payment for the period after 10 May 2013 until his retirement in October.
The Committee has assessed the performance of Mr Mackenzie and concluded it was below target with a STI outcome of 85 per cent of target (or 136 per cent of base salary). This outcome was primarily due to the FY2009 LTIP awards (granted December 2008)CEO’s overarching accountability for the five fatalities that occurred during FY2015. The Committee takes the Group’s safety record very seriously and determined vesting of these awards in August 2013, as described in section 6.3.4. The remaining LTIP awards heldconcluded, after taking advice from the Sustainability Committee, that a zero outcome was appropriate for the CEO’s FY2015 STI HSEC component, with the decision supported by Mr Kloppers, whichMackenzie. While attributable profit fell from US$13.8 billion in FY2014 to US$1.9 billion in FY2015, controllable financial performance was largely in line with targets. The Committee made a discretionary downwards adjustment to the formulaic financial outcomes in light of the impairment of Onshore US Assets. Capital project management outcomes were granted from December 2009 to December 2012, will be pro-rated,largely in accordanceline with expectations. The Committee also considered the CEO’s strong performance against personal objectives, including significant productivity and capital expenditure improvements, together with the Group’s usual practice, to reflectsuccessful demerger of South32.
Given the percentage of the performance period that has elapsed to 1 October 2013. The remaining LTIP awards will lapse on 1 October 2013 (further details are in section 6.1). The vesting of the retained pro-rated awards will be determined byimportance the Committee places on safety, the scorecard weighting attached to HSEC has been increased for FY2016 to 25 per cent from 20 per cent in FY2015. The capital project management weighting has been reduced to 10 per cent from 20 per cent reflecting a lower number and value of major capital projects in execution, and the personal component weighting has been increased to 25 per cent from 20 per cent. The financial weighting is unchanged at the relevant time in future years. The awards will only vest if the performance hurdle40 per cent.
Mr Mackenzie’s LTI is metalso at the endrisk, and forms an important part of each five-year performance period, subjectrecognising long-term performance.
In relation to the Committee’s ability to reduce vesting through its discretion under the plan rules.
J Michael Yeager retired fromLTI awards granted in 2010, BHP Billiton on 8 July 2013
Mike Yeager, previously Group Executive and Chief Executive, Petroleum, retired from the GMC on 1 July 2013 and from BHP Billiton on 8 July 2013. Mr Yeager has received base salary, pension and applicable benefits up to the date of his retirement. He has received a payment of 12 months base salary and pension in lieu of his notice period, and he has also received the value of the pension and superannuation funds that he has accumulated during his service with the Group.
The Remuneration Committee determined that Mr Yeager would receive a FY2013 short-term incentive award, whichBilliton’s five-year TSR performance was assessed by the Committee, as described in section 6.3.3. He received this award in the form of cash.
Upon his retirement, the unvested deferred shares allocated to him in respect of FY2011 vested to him in full (Mr Yeager did not receive deferred shares in FY2012), and his unvested LTIP awards were pro-rated, in accordance with the Group’s usual practice, to reflect the percentage of the performance period that had elapsed to 8 July 2013. The vesting of the retained pro-rated awards will be determined by the Committee at the relevant time in future years. The awards will only vest if the performance hurdle is met at the end of each five-year performance period, subject to the Committee’s ability to reduce vesting through its discretion under the plan rules.
Marcus Randolph retired from BHP Billiton on 2 September 2013
Until his retirement, Mr Randolph received his base salary and pension and any applicable benefits. He has received a payment of 12 months base salary and pension in lieu of his notice period and is entitled to the value of the pension and superannuation funds that he accumulatednegative 15.2 per cent over the term of his service with the Group.
The Remuneration Committee has determined that Mr Randolph would receive a pro-rated FY2013 short-term incentive award in respect of his performancefive-year period from 1 July 20122010 to 10 May 2013, as assessed by30 June 2015. This is below the Committeeweighted median TSR of peer companies of negative 4.5 per cent and describedbelow the TSR of the MSCI World index of positive 78.6 per cent. This level of performance results in section 6.3.3. He received this award in the form of cash. Mr Randolph was not eligible to receive any short-term incentive paymentzero vesting for the period after 10 May 2013 until his retirement on 2 September 2013. 2010 LTIP awards, and accordingly the awards have lapsed.
In accordanceline with the Group’s usual practice underapproach for Mr Mackenzie, the GIS, Deferred Shares, which were allocated to Mr Randolphbase salaries and total target remuneration packages will also be held constant in regard to FY2012 performance (as shown in section 6.4.2), vested on 2 September 2013.
The Committee has assessed the performance of the FY2009 LTIP awards (granted December 2008) and determined vesting of these awards in August 2013, as described in section 6.3.4. The remaining LTIP awards held by Mr Randolph, which were granted from December 2009 to December 2012, were pro-rated, in accordance with the Group’s usual practice, to reflect the percentage of the performance period that had elapsed to 2 September 2013. The remaining LTIP awards lapsed on 2 September 2013. The vesting of the retainedpro-rated awards will be determined by the Committee at the relevant time in future years. The awards will only vest if the performance hurdle is met at the end of each five-year performance period, subject to the Committee’s ability to reduce vesting through its discretion under the plan rules.
Alberto Calderon will leave BHP Billiton on 9 May 2014
Alberto Calderon, previously Group Executive and Chief Executive, Aluminium, Nickel & Corporate Development, retired from theFY2016 for all other GMC on 10 May 2013 and will remain as an adviser to the CEO until he leaves BHP Billiton on 9 May 2014.members.
In his position as adviser to the CEO, Mr Calderon will continue to receive his base salary and pension and any applicable benefits. He will not receive any additional payment in relation to his notice period when he departs on 9 May 2014. Upon his departure, he will be entitled to the value of the pension and superannuation funds that he has accumulated during his service with the Group.
The Remuneration Committee has determined that Mr Calderon will receive a pro-rated FY2013 short-term incentive award in respect of his performance as a member of the GMC from 1 July 2012 to 10 May 2013, as assessed by the Committee and described in section 6.3.3. He will receive this award in the form of cash and deferred equity. Mr Calderon will not be eligible to receive any short-term incentive payment for the period after 10 May 2013 until he leaves BHP Billiton on 9 May 2014. In accordance with the Group’s usual practice under the GIS, Deferred Shares, which were allocated to Mr Calderon in regard to FY2012 performance (as shown in section 6.4.2), will vest on his leaving date.
The LTIP awards held by Mr Calderon, which were granted from December 2009 to December 2012, will be pro-rated on his departure in May 2014 to reflect the percentage of the performance period that has elapsed to 9 May 2013. The remaining LTIP awards will lapse. In August 2013, the Committee assessed the performance of the LTIP awards granted in December 2008 and determined vesting as described in section 6.3.4. The relevant portion of Mr Calderon’s awards were lapsed (for time to 9 May 2013) before the vesting result was applied. The vesting of the other retained pro-rated awards will be determined by the Committee at the relevant time in future years. The awards will only vest if the performance hurdle is met at the end of each five-year performance period, subject to the Committee’s ability to reduce vesting through its discretion under the plan rules.
Remuneration outcomes for Non-executive Directors
Fee levels for the Non-executive Directors and the Chairman, which are reviewed annually, have remained unchanged since 2011. The annual review includes benchmarking, with the assistance of external advisers, against peer companies. Based on the review conducted in June 2015 the Board, with support from the Chairman, has decided to reduce the Chairman’s fee by approximately 13 per cent from US$1.100 million to US$0.960 million per annum, and the Chairman and the CEO have decided to reduce the Non-executive Director base fee by approximately six per cent from US$0.170 million to US$0.160 million per annum.
These reductions were considered appropriate in light of the challenging external environment and the benchmarking data for peer companies. The different percentage reduction for the Chairman compared with that for Non-executive Directors reflects the relevant benchmarks for those roles.
A decision was also taken to include mandatory superannuation contributions within the relevant base fee from 1 July 2015, which is more closely aligned to the practices of other companies. This has the effect of further reducing remuneration for those Directors who receive mandatory Australian superannuation contributions. For those Directors, this results in an average reduction of approximately 12 per cent in the aggregate of their base fees and superannuation contributions.
Summary
The Committee remains confident that our philosophy and policies on remuneration are appropriate to support long-term value creation, and the outcomes for FY2015 continue to demonstrate the alignment between remuneration and performance at BHP Billiton. I would welcome any comments you may have.
|
|
| Carolyn Hewson |
| Chairman, Remuneration Committee |
10 September 2015
6.3.64.2 Introduction to the Remuneration tableReport
The table below has been preparedcontents of this Remuneration Report are governed by legislation in accordance with the requirements of theUnited Kingdom and Australia.
The UK Companies Act 2006 (andand the Large and Medium-sized Companies and Groups (Accounts and Reports) Regulations 2008 (as amended), which are generally described as UK requirements in this Remuneration Report, require BHP Billiton to make certain disclosures in regard to Directors.
The Australian Corporations Act 2001, Australian Accounting Standards and IFRS require BHP Billiton to make certain disclosures for KMP, defined as those persons having authority and responsibility for planning, directing and controlling the activities of the Group, directly or indirectly. For the purposes of this Remuneration Report, it has been determined that the KMP includes the Non-executive Directors, and the members of the GMC including the CEO.
4.2.1 Members of the GMC
The GMC makes key management decisions under the authorities that have been delegated to it by the Board. The members of the GMC on 30 June 2015 are shown in the table below.
| | |
Name | | Title |
Andrew Mackenzie | | Chief Executive Officer and Executive Director |
Peter Beaven | | Chief Financial Officer since 1 October 2014 President, Copper to 30 September 2014 |
Tony Cudmore | | Chief Public Affairs Officer since 1 July 2015 President, Corporate Affairs to 30 June 2015 |
Tim Cutt | | President, Petroleum since 1 July 2015 President, Petroleum and Potash to 30 June 2015 |
Dean Dalla Valle | | Chief Commercial Officer since 1 July 2015 President, HSE, Marketing and Technology from 1 January 2015 to 30 June 2015 President, Coal to 31 December 2014 |
Geoff Healy | | Chief Legal Counsel |
Mike Henry | | President, Coal since 1 January 2015 President, HSE, Marketing and Technology to 31 December 2014 |
Daniel Malchuk | | President, Copper since 1 March 2015 President, from 1 February 2015 to 28 February 2015 President, Aluminium, Manganese and Nickel to 31 January 2015 |
Athalie Williams | | Chief People Officer since 1 July 2015 President, Human Resources from 1 January 2015 to 30 June 2015 |
Jimmy Wilson | | President, Iron Ore |
Section3.2.2for dates of appointment of GMC members
In addition to the KMP listed above, Karen Wood (President to 19 August 2014), Graham Kerr (Chief Financial Officer to 30 September 2014), Mike Fraser (President, Human Resources to 31 December 2014) and Jane McAloon (President, Governance and Group Company Secretary to 31 May 2015) served as KMP during FY2015.
4.2.2 Non-executive Directors
Details of the Non-executive Directors who held office during FY2015 are set out below. Each Non-executive Director held office for the whole of FY2015 unless otherwise indicated.
| | | | | | |
Name | | Title | | Name | | Title |
Jac Nasser | | Chairman | | Carolyn Hewson | | Non-executive Director |
Malcolm Brinded | | Non-executive Director | | Lindsay Maxsted | | Non-executive Director |
Malcolm Broomhead | | Non-executive Director | | Wayne Murdy | | Non-executive Director |
John Buchanan | | Senior Independent Director to 13 July 2015 | | Keith Rumble | | Non-executive Director to 22 May 2015 |
Carlos Cordeiro | | Non-executive Director | | John Schubert | | Non-executive Director |
David Crawford | | Non-executive Director to 20 November 2014 | | Shriti Vadera | | Senior Independent Director since 14 August 2015 Non-executive Director to 13 August 2015 |
Pat Davies | | Non-executive Director | | | | |
Section 3.2.1for dates of appointment of Non-executive Directors
4.3 Remuneration policy report
This section of the Report describes the overarching remuneration policy that guides the Remuneration Committee’s decisions. Our remuneration policy has not changed from that approved by shareholders at the 2014 AGMs and so the remuneration policy as set out in the 2014 Annual Report continues to apply as set out in this section.
|
Contents of the remuneration policy report |
4.3.1 to 4.3.8 Remuneration policy for Executive Directors |
| 4.3.9 Remuneration policy for Non-executive Directors |
Section 4.4.14 for remuneration policy for the GMC (excluding the CEO)
This section of the Report was introduced last year as a result of new UK legislation, under which this policy report was required to be put to a binding vote at the Group’s 2014 AGMs. Shareholder approval was provided at those meetings, and this remuneration policy became effective for Directors of BHP Billiton immediately after the final 2014 AGM. Under the UK legislation, this policy is binding only in regard to the Directors (including the CEO) and not for other members of the GMC. The UK legislation requires BHP Billiton to present the remuneration policy for this vote at least every three years.
Where the remuneration policy report includes cross-references to other sections of the Remuneration Report or the Annual Report, these are solely for the purposes of assisting the reader to locate related information. The referenced information is not part of the remuneration policy report.
Remuneration policy for Executive Directors
BHP Billiton currently has a single Executive Director, being the CEO. Therefore, for simplicity, this section refers only to the CEO. This remuneration policy would, however, apply for any new Executive Director role, in
the event that one were created during the life of this remuneration policy. In that case, references in this section to the CEO should be read as being to each Executive Director.
4.3.1 Overarching principles
The Remuneration Committee recognises that remuneration has an important role to play in supporting the implementation and achievement of the Group’s strategy and our ongoing performance, aligning the activities of management to the interests of shareholders, and in supportingOur Charter.
On page i of this document:Our Chartersets out our purpose, strategy, values and how we judge our success
The Committee determines the appropriate remuneration for the CEO, taking into account his responsibilities, location, skills, experience and performance within the Group. In doing so, the Committee recognises that levels of remuneration should be sufficient to attract, motivate and retain a highly skilled CEO, but also that the Group should avoid paying more than is necessary for this purpose.
The key principles of our remuneration policy, which remain unchanged, are to:
support the execution of the Group’s business strategy in accordance with a risk framework that is appropriate for the organisation;
provide competitive rewards to attract, motivate and retain highly skilled executives willing to work around the world;
apply demanding performance measures, including key financial and non-financial measures of performance;
link a significant component of pay to our performance and the creation of value for our shareholders from relative outperformance;
ensure remuneration arrangements are equitable and facilitate the deployment of people around the Group;
limit severance payments on termination to pre-established contractual arrangements (which do not commit us to making any unjustified payments).
4.3.2 The purpose of remuneration at BHP Billiton
BHP Billiton’s remuneration arrangements reinforce the achievement of our success, as set out in Our Charter, and are designed to ensure that the CEO takes a long-term approach to decision-making and to minimise activities that focus only on short-term results at the expense of longer-term business growth and success. The Remuneration Committee has considered the ways in which risk management and the long-term horizon are reflected throughout BHP Billiton’s remuneration arrangements for the CEO and all executives, and is satisfied that the approach reinforces the desired behaviours.
This is largely achieved through the Group’s approach to STI and LTI awards, which comprise a significant portion of total remuneration. The equity component of any STI award is deferred for a two-year period, and performance under the LTIP is measured over a five-year period. The actual rewards received by the CEO therefore reflect the Group’s performance and share price over an extended period.
It is the Committee’s view that this provides an appropriate focus on BHP Billiton’s sustained performance beyond the end of the initial measurement period. This approach also provides a transparent mechanism for clawback or adjustment in the event of a restatement of Group results, through changes to the vesting or non-vesting of deferred awards.
In addition, STI and LTI outcomes are not driven by a purely formulaic approach. The Committee holds discretion to determine that awards are not to be provided or vested in circumstances where it would be inappropriate or would provide unintended outcomes. The Committee has no discretion to allow vesting of equity awards when performance conditions have not been satisfied (other than in the event of death or serious injury, disability, illness that prohibits continued employment or total and permanent disablement of the CEO).
4.3.3 Components of remuneration
The following table shows the components of total remuneration, the link to strategy, how each component operates, how performance is assessed and will impact remuneration, and the maximum opportunity for each component.
| | | | |
Remuneration component
and link to strategy | | Operation and performance framework | | Maximum (1) |
Base salary A competitive base salary is paid in order to attract and retain a high-quality and experienced CEO, and to provide appropriate remuneration for this important role in the Group. | | • Base salary is broadly aligned with salaries for comparable roles in global companies of similar global complexity, size, reach and industry, and reflects the CEO’s responsibilities, location, skills, performance, qualifications and experience. • Base salary is reviewed annually with effect from 1 September. Reviews are informed, but not led, by benchmarking to comparable roles (as above), changes in responsibility and general economic conditions. Substantial weight is also given to the general base salary increases for employees. Base salary is not subject to separate performance conditions. • Base salary is denominated in US dollars. • The Remuneration Committee’s discretion in respect of base salary increases applies up to the maximum shown. | | 8% increase per annum (annualised), or inflation if higher in Australia. |
| | |
Pension Provides a market-competitive level of post-employment benefit to attract and retain a high-quality and experienced CEO. | | • Pension contributions are benchmarked to comparable roles in global companies. • Pension contributions are provided, with a choice of funding vehicles: a defined contribution plan, an unfunded retirement savings plan, an international retirement plan or a self-managed superannuation fund. Alternatively, a cash payment may be provided in lieu. • The Committee’s discretion in respect of pension contributions applies up to the maximum shown. | | 25% of base salary. |
| | | | |
Remuneration component
and link to strategy | | Operation and performance framework | | Maximum (1) |
Benefits Provides personal insurances and assistance where BHP Billiton’s structure gives rise to tax obligations across multiple jurisdictions, and a market-competitive level of benefits to attract and retain a high-quality and experienced CEO. | | • Benefits may be provided as determined by the Committee. Currently, this includes such items as the costs of private family health insurance, death and disability insurance, car parking, and personal tax return preparation in the required countries where BHP Billiton has requested that the CEO relocate internationally, or where BHP Billiton’s Dual Listed Company structure requires personal tax returns in multiple jurisdictions. • The CEO may from time to time be accompanied by his spouse/partner on business related travel, including for Board meetings. The costs associated with spouse/partner attendance are met by BHP Billiton. In some instances, they are deemed to be taxable benefits for the CEO. In such cases, BHP Billiton reimburses the CEO for this tax cost. • The CEO is eligible to participate in Shareplus, which is BHP Billiton’s all-employee share purchase plan.Section 4.4.26 for information about Shareplus and the CEO’s participation • The Committee’s discretion in respect of benefits applies up to the maximums shown. • A relocation allowance and assistance is provided only where a change of location is made at BHP Billiton’s request. The Group’s mobility policies provide ‘one-off’ payments with no trailing entitlements. | | Benefits as determined by the Committee but to a limit not exceeding 10% of base salary and (if applicable) a one-off taxable relocation allowance up to US$700,000. |
| | | | |
Remuneration component
and link to strategy | | Operation and performance framework | | Maximum (1) |
STI The purpose of STI is to focus the CEO’s efforts on those performance measures and outcomes that are priorities for the Group for the relevant financial year, and to motivate the CEO to strive to achieve stretch performance objectives. The performance measures for each year are chosen on the basis that they are expected to have a significant short- and long-term impact on the success of the Group. Deferral of a portion of STI awards in deferred equity over BHP Billiton shares encourages a longer-term focus aligned to that of shareholders. Section 4.4.3 for information on MSR for the CEO Section 1.10 for a description of KPIs for the Group | | Setting performance measures and targets • A scorecard of measures is set at the commencement of each financial year. • The measures and their relative weightings are chosen by the Committee, in their discretion, in order to appropriately drive overall performance for the coming year. Specified financial measures will constitute the largest weighting. The scorecard will also include measures that impact the long-term sustainability of the Group. The Sustainability Committee assists the Remuneration Committee in determining appropriate HSEC measures and weightings. • We plan to disclose the weightings of HSEC, financial and individual measures around the beginning of each performance period. • The target is determined for each performance measure at a level that will motivate the CEO to achieve an appropriately stretching annual performance outcome and that will contribute to the longer-term success of the Group and shareholder wealth. The target for each financial measure is derived from the annual budget as approved by the Board for the relevant financial year. • For HSEC and for individual measures the target is ordinarily expressed in narrative form and will be disclosed near the beginning of the performance period. For reasons of commercial sensitivity, while we will provide a narrative description of financial target performance in broad terms, the actual target for each financial measure will not be disclosed in advance. However, we plan to disclose the target for each measure retrospectively. In the rare instances where this may not be prudent on grounds of commercial sensitivity, we will seek to explain why and give an indication of when the target may be disclosed. • Should any other performance measures be added at the discretion of the Committee, we will determine the timing of disclosure of the relevant target with due consideration of commercial sensitivity. Section 4.4.6 for details of performance measures and outcomes for FY2015 Section 4.4.11 for details of performance measures for FY2016 | | Maximum award 240% of base salary (cash 120% and 120% in deferred equity). Target performance 160% of base salary (cash 80% and 80% in deferred equity). Threshold performance 80% of base salary (cash 40% and 40% in deferred equity). Minimum award Zero |
| | | | |
Remuneration component
and link to strategy | | Operation and performance framework | | Maximum (1) |
| | Assessment of performance • At the conclusion of the financial year, the CEO’s achievement against each measure is assessed by the Remuneration Committee and the Board, and an STI award determined. If performance is below the Threshold level for any measure, no STI will be provided in respect of that portion of the STI opportunity. • The Remuneration Committee is assisted by the Sustainability Committee in relation to assessment of performance against HSEC measures, and considers guidance provided by other Committees in respect of other measures. • The Board believes this method of assessment is transparent, rigorous and balanced, and provides an appropriate, objective and comprehensive assessment of performance. • In the event that the Remuneration Committee does not consider the level of vesting that would otherwise apply to be a true reflection of the performance of the Group or should it consider that individual performance or other circumstances makes this an inappropriate outcome, it retains the discretion to not provide all or a part of any STI award. This is an important mitigation against the risk of unintended award outcomes. Delivery of award • STI awards are provided under the STIP. • The value of any STI award is provided half in cash and half in an award of the equivalent value of BHP Billiton equity, which is deferred for two years and may be forfeited if the CEO leaves the Group within the deferral period. • The award of deferred equity comprises rights to receive ordinary BHP Billiton shares in the future if the CEO is still employed by BHP Billiton at the end of the deferral period(2). Before vesting (or exercise), these rights are not ordinary shares and do not carry entitlements to ordinary dividends or other shareholder rights; however, a DEP is provided on vested awards(3). The Committee has a discretion to settle STI awards in cash. • Both cash and equity STI awards are subject to malus and clawback as described below this table. | | |
| | | | |
Remuneration component
and link to strategy | | Operation and performance framework | | Maximum (1) |
LTI The purpose of the LTI is to focus the CEO’s efforts on the achievement of sustainable long-term value creation and success of the Group (including appropriate management of business risks). It aligns the CEO’s reward with sustained shareholder wealth creation in excess of that of relevant comparator group(s), through the relative TSR performance condition. The provision of LTIP awards over BHP Billiton shares also encourages long-term share exposure for the CEO, and aligns the long-term interests of the CEO and shareholders. Demonstration of this alignment between the interests of the CEO and shareholders is seen through the five-year performance period of the LTI, which is consistent with the long-term nature of the resources industry. Section 4.4.3 for information on MSR for the CEO Section 4.4.21 for a table of awards held under the LTIP Section 1.10 for a description of KPIs for the Group | | Relative TSR performance condition • The award is subject to a relative TSR performance condition, which must be achieved over a five-year period. Full vesting under the LTIP only occurs where BHP Billiton’s relative TSR(4) significantly outperforms the TSR of the comparator group(s). The comparator group(s) and the weighting between comparator groups will be determined by the Committee in relation to each grant. Section 4.4.8 for further detail on LTIP comparator group(s) • Relative TSR has been chosen as the most appropriate measure as it allows for an objective external assessment over a sustained period on a basis that is familiar to shareholders. Level of performance required for vesting • None of the award will vest if BHP Billiton’s TSR is below the Peer Group TSR (being the weighted median TSR(6) where the comparator group is a specified group of peer companies) and/or below Index TSR (being the index value where the comparator group is a market index such as the MSCI World index). • For each award, the Committee will determine the level of relative TSR outperformance required on a per annum basis, or on a compounded basis over the five-year period, against the peer group and/or market index in order for the whole of the LTI award to vest. Section 4.4.8 for details of the outperformance required for recent grants • 25% of the award will vest if BHP Billiton’s TSR is equal to the Peer Group TSR and/or Index TSR (as applicable), and vesting occurs on a sliding scale between that point and the point of full vesting. • There is no retesting if the performance condition is not met. In the event that the Committee does not consider the level of vesting that would otherwise apply based on the Group’s achievement of the relative TSR performance condition to be a true reflection of the underlying performance of the Group, or should it consider that individual performance or other circumstances makes this an inappropriate outcome, it retains the discretion to lapse any portion or all of the award. This is an important mitigation against the risk of unintended vesting outcomes. | | Normal Maximum Award Face value of 400% of base salary. Exceptional Maximum Award (5) Face value of 488% of base salary. |
| | | | |
Remuneration component
and link to strategy | | Operation and performance framework | | Maximum (1) |
| | • To ensure that the LTI performance conditions continue to support operational excellence, risk management and the execution of the Group’s strategy, the Committee retains discretion to add further performance measures to supplement the existing relative TSR performance condition. Prior to doing so, consultation would be undertaken with key stakeholders. Should this be the case, the vesting of a portion of any LTI award may instead be linked to performance against the new measure(s). The Committee expects that in the event of introducing an additional performance measure(s), the weighting on relative TSR would remain the majority weighting. Delivery of award • LTI awards are provided under the LTIP approved by shareholders at the 2013 AGMs. When considering the value of the award to be provided, the Committee primarily considers the face value of the award, and also considers its fair value which includes consideration of the performance conditions.(7) • The award of deferred equity comprises rights to receive ordinary BHP Billiton shares in the future if the performance and service conditions are met(2). Before vesting (or exercise), these rights are not ordinary shares and do not carry entitlements to ordinary dividends or other shareholder rights; however, a DEP is provided on vested awards(3). The Committee has a discretion to settle LTI awards in cash. • LTI awards are subject to malus and clawback as described below this table. | | |
Section 4.3.5for how the remuneration policy considers other employees
| (1) | UK regulations require the disclosure of the maximum that may be paid in respect of each remuneration component. Where that is expressed as a maximum annual percentage increase which is annualised it should not be interpreted that it is the Company’s current intention to award an increase of that size in total in any one year, or in each year, and instead it is a maximum required to be disclosed under the regulations. |
| (2) | The award may be retained if the CEO has left the Group in certain circumstances. |
Section 4.3.8 for payments on loss of office
| (3) | A DEP is provided when the award vests (or is exercised). The CEO will receive the value of dividends that would have been payable on ordinary BHP Billiton shares over the period from grant to vest (or exercise). The Committee intends that DEP will be provided in the form of shares, although the plan accommodates a cash equivalent. A DEP is not provided in relation to any STI and LTI awards that are forfeited or lapse. |
| (4) | BHP Billiton’s TSR is a weighted average of the TSRs of BHP Billiton Limited and BHP Billiton Plc. |
| (5) | The maximum award permitted with the LTIP rules (as approved by shareholders at the 2013 AGMs) is expressed as a fair value equal to 200 per cent of base salary. A fair value takes into account the probability of meeting the performance condition and other factors. The current plan design produces a fair value of |
| 41 per cent of face value. The maximum fair value of 200 per cent of base salary is therefore currently equivalent to a face value of 488 per cent of base salary (488% x 41% = 200%). This is shown as the Exceptional Maximum Award in the table. However, it is current policy to provide a maximum award of 400 per cent of base salary, which is therefore shown in the table as the Normal Maximum Award. In any case, all LTI awards to the CEO will only be provided with prior approval by shareholders in the relevant AGMs. |
| (6) | The weighted median TSR means the median outcome when the companies are listed by their TSR, after weighting by market capitalisation. |
| (7) | The fair value is calculated by the Committee’s independent adviser, Kepler Associates. It reflects outcomes weighted by probability, taking into account the difficulty of achieving the performance conditions and the correlation between these and share price appreciation, together with other factors, including volatility and forfeiture risks. The fair value for the current plan design (current comparator groups, outperformance percentage, etc.) is 41 per cent of the face value of an award. This fair value of 41 per cent may change should the Committee vary elements (such as adding a performance measure or altering the level of relative TSR outperformance) not specified in this remuneration policy report. This fair value is different from the fair value used for IFRS disclosures elsewhere in this report. In particular, the IFRS fair value does not take into account forfeiture conditions on the awards. |
Malus and clawback
The STIP and LTIP provisions allow the Committee to reduce or clawback awards in the following circumstances:
the participant acting fraudulently or dishonestly or being in material breach of their obligations to the Group;
where BHP Billiton becomes aware of a material misstatement or omission in the financial statements of a Group company or the Group; or
any circumstances occur that the Committee determines in good faith to have resulted in an unfair benefit to the participant.
These malus and clawback provisions apply whether or not awards are made thereunder)in the form of cash or equity, and whether or not the equity has vested.
Legacy incentive plans under which awards may vest
The remuneration policy approved by shareholders is required to cover awards that were granted under legacy plans and that may vest in the future on their existing terms. Key terms are shown in the table below.
| | | | |
Remuneration component
and link to strategy | | Operation and performance framework | | Maximum value on
vesting |
STI under the GIS The former GIS was replaced by the STIP (described in the previous table) from FY2014. Awards were provided for the same purpose as the STIP. | | • The terms of STI awards provided under the GIS were similar to those provided under the STIP. • Awards were provided to the CEO for performance in FY2013, and vested in August 2015. Section 4.4.20 for a table of awards held under the GIS | | The face value of the award on vesting plus the value of any associated DEP. |
| | | | |
Remuneration component
and link to strategy | | Operation and performance framework | | Maximum value on
vesting |
LTI under the former LTIP The former LTIP was replaced by the new LTIP (described in the previous table) from FY2014. Awards were provided for the same purpose as the new LTIP. | | • The terms of LTI awards provided under the former LTIP were similar to those provided under the new LTIP as described in the previous table, including the performance conditions. • Awards provided to the CEO in December 2010 did not vest in FY2015, as the performance condition was not met, and lapsed. Awards provided to the CEO in December 2011 and 2012 are due to vest from FY2017 to FY2018 to the extent that the performance conditions are met. Section 4.4.7 for details of the 2010 LTIP performance outcomes Section 4.4.21 for a table of awards held under the former LTIP | | The face value of the awards on vesting plus the value of any associated DEP. |
4.3.4 Approach to recruitment and promotion remuneration
The ongoing remuneration arrangements for a newly recruited or promoted CEO, or for another Executive Director should one be appointed, will reflect the remuneration policy as set out in this report. The ongoing components will therefore comprise base salary, pension contributions, benefits, STI and LTI.
A market competitive level of base salary, benefits and pension contributions will be provided to a newly recruited or promoted CEO, or another Executive Director. The same maximum STI and LTI apply as per the remuneration policy for the current CEO. The combined maximum level of STI and LTI that may be provided is 728 per cent of base salary, which is the combination of the maximum 240 per cent of base salary in STI and the exceptional maximum 488 per cent of base salary in LTI as per the remuneration policy for the CEO.
For external appointments, the Remuneration Committee may determine that it is appropriate to provide additional cash and/or equity components to replace any remuneration forfeited from a former employer. It is anticipated that any foregone equity awards would be replaced by equity. The value of the replacement remuneration would not be any greater than the fair value of the awards forgone (as determined by the Committee’s independent adviser). The Committee would determine appropriate service conditions and performance conditions within BHP Billiton’s framework, taking into account the conditions attached to the forgone award. The Committee is mindful of limiting such payments and not providing any more compensation than is necessary.
For any internal CEO (or another Executive Director) appointments, any entitlements provided under former arrangements will be honoured according to their existing terms.
4.3.5 Consideration of employment conditions elsewhere in the Group
When setting remuneration for the CEO, the Remuneration Committee considers the prevailing market conditions, the competitive environment and the positioning and relativities of pay and employment conditions across the wider BHP Billiton workforce.
The Committee is briefed regularly about the pay and conditions of the wider employee population, and takes into account the annual base salary increases for our employee population when determining any change in the CEO’s base salary. Salary increases in Australia, where the CEO is located, are particularly relevant, as they reflect the local economic conditions.
The principles that underpin the remuneration policy for the CEO are the same as those that apply to other employees, although the CEO’s arrangements have a greater emphasis on performance-related pay and a higher proportion of the CEO’s total remuneration is variable in the form of STI and LTI. Like those for the CEO, the performance measures used to determine STI outcomes for all employees are linked to achievement of the Group’s strategy and behaviours aligned to the values inOur Charter.
Although BHP Billiton does not consult directly with employees on Directors’ remuneration, the Group conducts regular employee engagement surveys which give employees an opportunity to provide feedback on remuneration matters. Many employees are ordinary shareholders and have the opportunity to vote on AGM resolutions. In FY2015, more than 14,000 continuing employees were enrolled to purchase BHP Billiton shares under Shareplus, our all-employee share plan.
4.3.6 Consideration of shareholder views
Part of the Board’s commitment to high-quality governance is expressed through the approach we take to engaging and communicating with shareholders. We encourage shareholders to make their views known to us.
Our shareholders are based across the globe. Regular proactive engagement on remuneration and governance matters takes place with institutional shareholders and investor representative organisations. This is overseen by the Remuneration Committee Chairman.
In addition, shareholders can contact us at any time through our Investor Relations team, with contact details available on our website:www.bhpbilliton.com.
Feedback from shareholders and investors is shared with the Board and Remuneration Committee through the Chairman and the Remuneration Committee Chairman and is used as input to decision-making by the Board and the Committee, in respect of executive remuneration policy and application. In particular, this feedback has had a direct bearing on the Committee’s decisions in formulating this remuneration policy report content.
The Committee considers that this approach provides a robust mechanism to ensure Directors are aware of matters raised, have a good understanding of current shareholder views, and formulate policy and make decisions as appropriate.
4.3.7 Potential remuneration outcomes for the CEO
While the Remuneration Committee recognises that market forces necessarily influence remuneration practices, it strongly believes that the fundamental driver of remuneration outcomes should be business performance. It also believes that overall remuneration should be both fair to the individual and commensurate with the expectations of our shareholders.
Accordingly, while target total remuneration is structured to attract and retain a high calibre CEO, the amount of remuneration actually received each year depends on:
the achievement of superior business and individual performance;
generating sustained shareholder value from relative outperformance;
the view of the Committee as to what is fair to the individual and commensurate with shareholder expectations.
STI and LTI are the two components of remuneration that are measured on business performance, with the outcome assessed against pre-determined performance conditions.
The minimum amount the CEO could earn in respect of FY2016 is US$2.270 million, which is fixed remuneration, and made up of his base salary of US$1.700 million, pension contributions of US$0.425 million and benefits of US$0.145 million.
The maximum is US$13.150 million. This assumes he earns the maximum under the STI of US$4.080 million and the normal maximum under the LTI of US$6.800 million. All of these components are shown in the table below at the minimum, target and maximum levels. The normal maximum amount of the LTI has been calculated on the basis of full vesting at the share price on the date of grant. The normal maximum LTI is 400 per cent of base salary.
Before deciding on the final outcome for the CEO (and for other members of the GMC), the Committee first considers the outcome against the pre-determined performance conditions. It then applies its overarching discretion. It can exercise discretion downwards only (i.e. to reduce remuneration).
When the CEO was appointed in May 2013, the Board advised him that the Committee would exercise its discretion on the basis of what it considered to be a fair and commensurate remuneration level to decide if the outcome should be reduced.
To be fair to the individual, remuneration levels need to accurately reflect the CEO’s responsibilities and contributions. To be commensurate with the expectations of shareholders, remuneration levels need to reflect the expectations of our shareholders that their Company’s funds would be used to remunerate our employees in a way that is proportionate to both performance and overall value.
In this way, the Committee believes it can set a remuneration level for the CEO that is sufficient to incentivise him and that is also fair to him and commensurate with shareholder expectations and prevailing market conditions. These same considerations led the Committee to set the incoming CEO’s remuneration when he was appointed in 2013 at a lower level than the previous level for this role.
The diagram below shows the relative proportion of each remuneration component for the CEO if the minimum, target and maximum levels of performance were achieved.

| (1) | Fixed remuneration comprises base salary (US$1.700 million per annum), pension contributions (25 per cent of base salary) and other benefits (US$0.145 million). The amount included for other benefits is based on FY2015 actual figures for the CEO, excluding non-recurring items. |
| (2) | The STI target amount is based on target performance of 160 per cent of base salary. The STI maximum amount is based on a maximum award of 240 per cent of base salary. The impact of potential future share price movements (up and down) on the value of deferred STI awards is not included. |
| (3) | The LTI amount (target and maximum) is based on the CEO’s normal maximum award equal to the face value of 400 per cent of base salary, which is lower than the maximum permissible award size under the plan rules. The ‘target’ value for the LTI award is based on the fair value of the award, which is 41 per cent of the face value, as this is the expected outcome on the balance of probabilities for the current plan design as calculated by the independent adviser to the Remuneration Committee, Kepler Associates. The minimum value for the LTI award is zero, and applies where the relative TSR of BHP Billiton is lower than the Peer |
| Group and/or Index TSR (as applicable for each grant). The impact of potential future share price movements (up and down) on the value of LTI awards is not included. |
Section 4.3.3for more information on the components of remuneration for the CEO
4.3.8 Service contracts and policy on loss of office
The terms of employment for the CEO are formalised in his employment contract. Key terms of the current contract and relevant payments on loss of office are shown below. If a new CEO or another Executive Director was appointed, similar contractual terms would apply, other than where the Remuneration Committee determines that different terms should apply for reasons specific to the individual.
The CEO’s contract has no fixed term. It can be terminated by BHP Billiton on 12 months’ notice. BHP Billiton can terminate the contract immediately by paying base salary plus pension contributions for the notice period. The CEO must give six months’ notice for voluntary resignation. The table below sets out the basis on which payments on loss of office may be made.
| | | | | | | | |
| | Leaving reason (1) (2) |
| | Voluntary
resignation | | Termination for
cause | | Death, serious
injury, disability
or illness (3) | | Cessation of
employment with
the agreement of
the Board (4) |
| Base salary | | • Base salary for the notice period will be paid as a lump sum or progressively over the notice period. | | • No payment will be made. | | • Base salary will be paid for a period of up to four months, after which time employment may cease. | | • Base salary for the notice period will be paid as a lump sum or progressively over the notice period. |
| | | | |
| Pension | | • Pension contributions for the notice period will be paid as a lump sum or progressively over the notice period. | | • No pension contributions will be provided from the date of termination. | | • Pension contributions will be paid for a period of up to four months, after which time employment may cease. | | • Pension contributions for the notice period will be paid as a lump sum or progressively over the notice period. |
| | | | | | | | |
| | Leaving reason (1) (2) |
| | Voluntary
resignation | | Termination for
cause | | Death, serious
injury, disability
or illness (3) | | Cessation of
employment with
the agreement of
the Board (4) |
| Benefits | | • Applicable benefits may continue to be provided during the notice period. • Accumulated annual leave entitlements and any statutory payments will also be paid. • Applicable expenses may be paid for repatriation to the home location where a relocation has been requested by BHP Billiton. • Unvested Shareplus Matched Shares will lapse. | | • No benefits will be provided. • Accumulated annual leave entitlements and any statutory payments will be paid. • Applicable expenses may be paid for repatriation to the home location where a relocation has been requested by BHP Billiton. • Unvested Shareplus Matched Shares will lapse. | | • Applicable benefits may continue to be provided during the notice period. • Accumulated annual leave entitlements and any statutory payments will also be paid. • Applicable expenses may be paid for repatriation to the home location where a relocation has been requested by BHP Billiton. • Unvested Shareplus Matched Shares will vest in full. | | • Applicable benefits may continue to be provided for the relevant year in which employment ceases. • Accumulated annual leave entitlements and any statutory payments will also be paid. • Applicable expenses may be paid for repatriation to the home location where a relocation has been requested by BHP Billiton. • Unvested Shareplus Matched Shares will vest in full. |
| | | | |
STI Where CEO leaves during the financial year or after the end of the financial year, but before an award is provided. | | • No STI will be paid. | | • No STI will be paid. | | • The Committee may determine in its discretion to pay an amount in respect of the participant’s performance for that year. | | • The Committee may determine in its discretion to pay an amount in respect of the participant’s performance for that year. |
| | | | | | | | |
| | Leaving reason (1) (2) |
| | Voluntary
resignation | | Termination for
cause | | Death, serious
injury, disability
or illness (3) | | Cessation of
employment with
the agreement of
the Board (4) |
| Unvested STIP equity | | • Will lapse. | | • Will lapse. | | • Will vest in full. | | • Will continue to be held, on the existing terms, for the scheduled deferral period before vesting (subject to a Committee discretion to lapse some or all of the award). • The awards remain subject to malus and clawback. |
| | | | |
| Vested but unexercised STIP equity | | • Will remain exercisable for the rest of the exercise period, unless the Committee determines they will lapse. | | • Will remain exercisable for the rest of the exercise period, unless the Committee determines they will lapse. | | • Will remain exercisable for the rest of the exercise period. | | • Will remain exercisable for the rest of the exercise period, or for a reduced exercise period, unless the Committee determines they will lapse. |
| | | | |
| Unvested GIS equity | | • Will lapse. | | • Will lapse. | | • Will vest in full. | | • Will vest in full, except in the case of a leaving reason not specified in the plan rules, in which case the Committee has discretion to determine the treatment of equity awards. |
| | | | |
| Vested GIS Options (with a market-based exercise price) previously provided to the CEO – if still held on leaving. | | • Will be retained for the scheduled exercise period, and on the existing terms. | | • Will lapse. | | • Will be retained for the scheduled exercise period, and on the existing terms. | | • Will be retained for the scheduled exercise period, and on the existing terms. |
| | | | | | | | |
| | Leaving reason (1) (2) |
| | Voluntary
resignation | | Termination for
cause | | Death, serious
injury, disability
or illness (3) | | Cessation of
employment with
the agreement of
the Board (4) |
LTI Unvested awards | | • Will lapse. | | • Will lapse. | | • Will vest in full. | | • A pro rata portion of unvested awards (based on the proportion of the performance period served) will continue to be held subject to the LTIP rules and terms of grant. The balance will lapse. • The awards remain subject to malus and clawback. |
| | | | |
| Vested but unexercised awards | | • Will remain exercisable for the rest of the exercise period, unless the Committee determines they will lapse. | | • Will remain exercisable for the rest of the exercise period, unless the Committee determines they will lapse. | | • Will remain exercisable for the rest of the exercise period. | | • Will remain exercisable for the rest of the exercise period, or for a reduced exercise period, unless the Committee determines they will lapse. |
| (1) | If the Committee considers it to be necessary, BHP Billiton may enter into agreements with a CEO which may include the settlement of liabilities in return for payment(s), including reimbursement of legal fees subject to appropriate conditions; or to enter into new arrangements with the departing CEO (for example, entering into consultancy arrangements). |
| (2) | In the event of a change in control event (e.g. takeover, compromise or arrangement, winding up of the Company) as defined in the STIP and LTIP rules: |
base salary, pension contributions and benefits will be paid until the date of the change of control event;
the Committee may determine that a cash payment be made in respect of performance during the current financial year and all unvested STI equity awards would vest in full;
the Committee may determine that unvested LTI awards will either vest to the extent that the Committee determines appropriate (with reference to performance against the performance condition up to the date of the change of control event and expectations regarding future performance) or that the awards be lapsed if the Committee determines that the holders will participate in an acceptable alternative employee equity plan as a term of the change of control event.
| (3) | Defined as occurring when a participant leaves BHP Billiton due to death, serious injury, disability or illness that prohibits continued employment or total and permanent disablement. |
| (4) | Defined as occurring when a participant leaves BHP Billiton due to forced early retirement, retrenchment or redundancy, termination by mutual agreement or retirement with the agreement of the Company, or such other circumstances that do not constitute resignation or termination for cause. |
Remuneration policy for Non-executive Directors
Our Non-executive Directors are paid in compliance with the UK Corporate Governance Code (2012) and the ASX Corporate Governance Council’s Principles and Recommendations (3rd Edition).
4.3.9 Components of remuneration
The following table shows the components of total remuneration for Non-executive Directors, the link to strategy, how each component operates, and how performance is assessed and will impact remuneration and the maximum opportunity for each component.
| | | | |
Remuneration component and link
to strategy | | Operation and performance
framework | | Maximum (1) |
Fees • Competitive base fees are paid in order to attract and retain high-quality individuals, and to provide appropriate remuneration for the role undertaken. • Committee fees are provided to recognise the additional responsibilities, time and commitment required. | | • The Chairman is paid a single fee for all responsibilities. • Non-executive Directors are paid a base fee and relevant committee membership fees. • Committee Chairmen and the Senior Independent Director are paid an additional fee to reflect their extra responsibilities. • All fee levels are reviewed annually and any changes are effective from 1 July. • Fees are set at a competitive level with advice on benchmark fees in equivalent size companies provided by external advisers. Fee levels reflect the size and complexity of the Group, the multi-jurisdictional environment arising from the Dual Listed Company structure, the multiple stock exchange listings and the extent of the geographic regions in which the Group operates. The economic environment and the financial performance of the Group are taken into account. Consideration is also given to salary reviews across the rest of the Group. Section4.4.13 for current fee levels provided to Non-executive Directors | | 8% increase per annum (annualised), or inflation if higher in the location in which duties are primarily performed, on a per fee basis. |
Pension • As required by law. | | • Pension contributions provided on fees only where required by law. | | As required by law. |
| | | | |
Remuneration component and link
to strategy | | Operation and performance
framework | | Maximum (1) |
| | |
Benefits | | | | |
| | |
Travel allowances • Competitive benefits are paid in order to attract and retain high-quality individuals and adequately compensate for the considerable travel burden. | | • Non-executive Directors receive travel allowances on a per-trip basis reflecting the considerable travel burden imposed on members of the Board as a consequence of the Dual Listed Company structure and the resulting Board meetings in Australia and the UK, along with site visits at our multiple geographic locations. | | 8% increase per annum (annualised), or inflation if higher in the location in which duties are primarily performed, on a per-trip basis. |
| | |
Other benefits • Competitive benefits are paid in order to attract and retain high-quality individuals, and to provide appropriate remuneration for the role undertaken. | | • As a consequence of the Dual Listed Company structure, Non-executive Directors are required to prepare personal tax returns in both Australia and the UK, regardless of whether they reside in one or neither of those countries. They are accordingly reimbursed for the costs of personal tax return preparation in whichever of the UK and/or Australia is not their place of residence (including payment of the tax cost associated with the provision of the benefit). • Non-executive Directors may from time to time be accompanied by their spouse/partner to business meetings. The costs associated with spouse/partner attendance at one business meeting per annum are met by BHP Billiton and, in some instances, they are deemed to be taxable benefits for the Non-executive Director. In such cases BHP Billiton reimburses the Non-executive Director for this tax cost. | | Up to a limit not exceeding 20% of fees. |
| | |
STI and LTI | | • Non-executive Directors are not eligible to participate in any STI or LTI arrangements. | | |
| | | | |
Remuneration component and link
to strategy | | Operation and performance
framework | | Maximum (1) |
Payments on early termination | | • There are no provisions in any of the Non-executive Directors’ appointment arrangements for compensation payable on early termination of their directorship. | | |
| (1) | UK regulations require the disclosure of the maximum that may be paid in respect of each remuneration component. Where that is expressed as a maximum annual percentage increase which is annualised, it should not be interpreted that it is the Company’s current intention to award an increase of that size in total in any one year, or in each year, and instead it is a maximum required to be disclosed under the regulations. |
Approach to recruitment remuneration
The ongoing remuneration arrangements for a newly recruited Non-executive Director will reflect the remuneration policy in place for other Non-executive Directors, as above. The components will therefore comprise fees, pension contributions where required by law and benefits as set out in the table above. No variable remuneration (STI and LTI) will be provided to newly recruited Non-executive Directors.
Letters of appointment and policy on loss of office
The standard letter of appointment for Non-executive Directors is available on our website. The Board has adopted a policy consistent with the UK Corporate Governance Code, under which all Non-executive Directors must seek re-election by shareholders annually, if they wish to remain on the Board. As such no Non-executive Directors seeking re-election have an unexpired term in their letter of appointment.
A Non-executive Director may resign on reasonable notice. No payments are made to Non-executive Directors on loss of office. A legacy arrangement provides accrued retirement benefits under the now closed Retirement Plan of BHP Billiton Limited, and this will continue to be honoured.
Section 4.4.30for retirement disclosures for the Non-executive Directors
Considerations when setting Non-executive Director remuneration
When Non-executive Director remuneration is determined, the same considerations in respect of employment conditions elsewhere in the Group and shareholder views, as described in relation to setting remuneration for the CEO, are taken into account.
Section 4.3.5for consideration of employment conditions elsewhere in the Group
Section 4.3.6for consideration of shareholder views
4.4 Annual report on remuneration
This section of the Report shows the impact of the remuneration policy in FY2015 and how remuneration outcomes are linked to actual performance outcomes. It is divided as follows.
| | |
Contents of the annual report on remuneration |
4.4.1 to 4.4.4 | | Remuneration governance |
4.4.5 to 4.4.11 | | Remuneration outcomes for the Executive Director (the CEO) |
4.4.12 to 4.4.13 | | Remuneration outcomes for Non-executive Directors |
4.4.14 to 4.4.18 | | Remuneration for members of the GMC (other than the CEO) |
4.4.19 to 4.4.31 | | Other statutory disclosures |
Remuneration governance
4.4.1 Board oversight and the Remuneration Committee
The Board is responsible for ensuring that the Group’s remuneration arrangements are equitable and aligned with the long-term interests of BHP Billiton and its shareholders. In performing this function, it is critical that the Board is independent of management when making decisions affecting remuneration of the CEO, the other members of the GMC and the Group’s employees.
The Board has therefore established a Remuneration Committee to assist it in making such decisions. The Committee is comprised solely of Non-executive Directors, all of whom are independent. In order to ensure that it is fully informed, the Committee regularly invites members of management to attend meetings to provide reports and updates. The Committee can draw on services from a range of external sources, including remuneration consultants.
Remuneration Committee
| | |
Remuneration Committee members | | • Carolyn Hewson (member to 31 December 2014 and Chairman from 1 January 2015) • John Buchanan (Chairman to 31 December 2014 and member from 1 January 2015) • Carlos Cordeiro • Pat Davies • John Schubert (to 31 December 2014) • Shriti Vadera (from 1 January 2015) |
| Number of meetings in FY2015 | | • Seven |
| Other Directors and employees who regularly attended meetings(1) | | • Jac Nasser (Chairman) • Andrew Mackenzie (CEO) • Athalie Williams (President, Human Resources from 1 January 2015 to 30 June 2015 and Chief People Officer from 1 July 2015) • Mike Fraser (President, Human Resources to 31 December 2014) • Andrew Fitzgerald (Vice President, Group Reward) • Jane McAloon (President, Governance and Group Company Secretary to 31 May 2015) • Margaret Taylor (Group Company Secretary from 1 June 2015) • Geof Stapledon (Vice President, Governance) |
| (1) | These individuals were not present when matters associated with their own remuneration were considered. |
Section 3.14.2 for further information regarding the Committee
The activities of the Remuneration Committee are governed by Terms of Reference (most recently approved by the Board in June 2013), which are available on our website. The purpose of the Committee is to assist the Board in its oversight of:
the remuneration policy and its specific application to the CEO, the other members of the GMC and its general application to all Group employees;
the determination of levels of reward for the CEO and approval of reward to the other members of the GMC;
the annual evaluation of the performance of the CEO, by providing guidance to the Group Chairman;
communication with shareholders on the Group’s remuneration policy and the Committee’s work on behalf of the Board;
the Group’s compliance with applicable legal and regulatory requirements associated with remuneration matters;
the preparation of the Remuneration Report to be included in the Group’s Annual Report;
the review, at least annually, of remuneration by gender.
The use of remuneration consultants
The Committee seeks and considers advice from independent remuneration advisers where appropriate. Remuneration consultants are engaged by, and report directly to, the Committee. Potential conflicts of interest are taken into account when remuneration consultants are selected, and their terms of engagement regulate their level of access to, and require their independence from, BHP Billiton’s management. The advice and recommendations of external advisers are used as a guide, but do not serve as a substitute for thorough consideration of the issues by each Director.
Kepler Associates was appointed by the Committee to act as an independent remuneration adviser to provide specialist remuneration advice and does not provide other services to the Group. Kepler Associates’ parent Mercer, a member of the MMC Group of companies, currently provides human resources services to the Group. Kepler Associates is a member of the UK Remuneration Consultants Group, and adheres to its Code of Conduct. During the year, Kepler Associates provided advice and assistance to the Committee on a wide range of matters, including:
advice in regard to remuneration arrangements for the CEO and the members of the GMC;
benchmarking of pay of senior executives against comparable roles at a range of relevant comparator groups, including sector and size peers;
provision of information and commentary on global trends in executive remuneration;
calculation of fair values for accounting and remuneration setting purposes of equity awards and performance analysis for LTI awards;
assistance in the determination of the remuneration framework for KMP for South32;
review of, and commentary on, management proposals;
other ad-hoc support and advice as requested by the Committee.
Kepler Associates is the only remuneration consultant appointed by the Committee.
Management also appoints external firms from time to time to assist with remuneration benchmarking, data provision and the like. While other external firms did provide certain information to management to assist them in deliberations, no remuneration adviser other than Kepler Associates provided remuneration recommendations during the year in relation to KMP.
Remuneration recommendations
As part of its role, Kepler Associates provided ‘remuneration recommendations’ (as defined in the Australian Corporations Act 2001) to the Committee during the year. Each time Kepler Associates provides a remuneration recommendation, Kepler Associates provides a declaration that the remuneration recommendation was made free from undue influence by the individual to whom the recommendation relates. The Board considered the processes outlined above, the constraints incorporated into Kepler Associates’ terms of engagement, the implementation of a comprehensive protocol for the engagement of remuneration advisers and the receipt of the declaration of no undue influence. It is satisfied that the remuneration recommendations received from Kepler Associates were made free from undue influence by any member of the KMP to whom the recommendations related.
Total fees paid to Kepler Associates for the above services for the period from 1 July 2014 to 30 June 2015 were £161,000, of which £63,850 was for attendance at Committee meetings and commentary on management proposals, and a total of £97,150 for the provision of remuneration recommendations and other technical advice and support on executive remuneration.
4.4.2 Prohibition on hedging of BHP Billiton shares and equity instruments
The CEO and other members of the GMC are not allowed to protect the value of any unvested BHP Billiton equity awards allocated to them under employee programs, or the value of shares and securities held as part of meeting BHP Billiton’s MSR as described below. The policy also prohibits GMC members from using unvested BHP Billiton equity awards as collateral in any financial transaction, including hedging and margin loan arrangements.
Any securities that have vested and are no longer subject to restrictions or performance conditions may be subject to hedging arrangements or used as collateral, provided that consent is obtained from BHP Billiton in advance of the employee entering into the arrangement. BHP Billiton treats compliance with this policy as a serious issue, and takes appropriate measures to ensure that the policy is adhered to.
4.4.3 Share ownership guidelines and the MSR
The share ownership guidelines and the MSR help to ensure that the interests of Directors, executives and shareholders remain aligned.
The value of equity awards and any other securities for the purposes of the MSR is the market value of the underlying shares. Unvested employee equity awards do not qualify, and neither do any options with a market-based exercise price.
The CEO and other members of the GMC are expected to grow their holdings to the MSR from the scheduled vesting of their employee awards over time. Under the policy, employees are not required to meet the holding requirement before awards are allocated to them. Rather, the MSR is tested at the time that shares are to be sold. The GMC members are entitled to sell sufficient shares to satisfy tax obligations arising from the granting, holding, vesting, exercise or sale of the employee awards or the underlying shares. However, if a GMC member wishes to sell additional shares, they will be prohibited from doing so unless they will meet the MSR after the sale.
For FY2015:
the MSR for the CEO was five times annual gross pre-tax base salary and while he met this requirement last year, subsequent movements in foreign exchange rates and share prices (including an impact of the demerger of South32) have resulted in Andrew Mackenzie’s shareholding being 4.4 times annual gross pre-tax base salary at the end of FY2015;
the MSR for other members of the GMC was three times annual gross pre-tax base salary and Peter Beaven, Dean Dalla Valle, Mike Henry and Jimmy Wilson met the MSR at the end of FY2015, while Tony Cudmore, Tim Cutt, Geoff Healy, Daniel Malchuk and Athalie Williams have not yet met the MSR.
Subject to securities dealing constraints, Non-executive Directors have agreed to apply at least 25 per cent of their remuneration (base fees plus Committee fees) to the purchase of BHP Billiton shares until they achieve an MSR equivalent in value to one year’s remuneration (base fees plus Committee fees). Thereafter, they must maintain at least that level of shareholding throughout their tenure. Each Non-executive Director met the MSR at the end of FY2015 with the exception of Carlos Cordeiro. Mr Cordeiro met the MSR last year and the level of his shareholding has not changed since. However, subsequent movements in foreign exchange rates and share prices have reduced the value of his shareholding such that he did not meet the MSR at the end of FY2015.
Section 4.4.27 for details of share ownership information of the CEO, other members of the GMC and the Non-executive Directors
4.4.4 Statement of voting at the 2014 AGMs
BHP Billiton’s remuneration resolutions have attracted a high level of support by shareholders. Voting in regard to those resolutions put to shareholders at the 2014 AGMs is shown below.
| | | | | | | | | | | | | | |
AGM Resolution | | Requirement | | % vote ‘for’ | | | % vote ‘against’ | | | Votes withheld (1) | |
Remuneration policy | | UK | | | 97.19 | | | | 2.81 | | | | 29,834,918 | |
Remuneration Report excluding Remuneration Policy | | UK | | | 98.23 | | | | 1.77 | | | | 13,161,811 | |
Remuneration Report (whole report) | | Australia | | | 98.02 | | | | 1.98 | | | | 13,127,265 | |
Leaving entitlements | | Australia | | | 97.97 | | | | 2.03 | | | | 13,213,709 | |
Approval of grants to Executive Director | | Australia | | | 97.02 | | | | 2.98 | | | | 29,928,012 | |
| (1) | The sum of votes marked ‘Vote Withheld’ at BHP Billiton Plc’s AGM and votes marked ‘Abstain’ at BHP Billiton Limited’s AGM. |
Remuneration outcomes for the Executive Director (the CEO)
The CEO remuneration policy that applied in FY2015 is the same as set out in the remuneration policy report, and the remuneration outcomes described below have therefore been provided in accordance with that same policy.
Section 4.3 for the remuneration policy for the CEO
4.4.5 Single total figure of remuneration
This section shows a single total figure of remuneration as prescribed under UK requirements. It is a measure of actual remuneration and is not intended to meet IFRS accounting standards.
Section 4.4.19 for the Statutory IFRS Remuneration table
| | | | | | | | | | | | | | | | | | | | | | | | | | | | |
US dollars (’000) | | | | | Base salary | | | Benefits | | | STI (1) | | | LTI | | | Pension | | | Total | |
Andrew Mackenzie | | | FY2015 | | | | 1,700 | | | | 145 | | | | 2,312 | | | | 0 | | | | 425 | | | | 4,582 | |
| | | FY2014 | | | | 1,700 | | | | 92 | | | | 3,136 | | | | 2,635 | | | | 425 | | | | 7,988 | |
| (1) | Provided half in cash and half in deferred equity as shown in the table below. |
For Mr Mackenzie, the single total figure of remuneration is calculated as set out below.
| | | | |
| | FY2014 | | FY2015 |
Base salary | | Base salary earned from 1 July 2013 to 30 June 2014 based on a full-year base salary of US$1.700 million as Mr Mackenzie did not receive any salary increase for FY2014. | | Base salary earned from 1 July 2014 to 30 June 2015 based on a full-year base salary of US$1.700 million as Mr Mackenzie did not receive any salary increase for FY2015. |
Benefits (1) Section 4.3.3 for policy for specific benefits | | The full amount of private family health insurance and personal tax return preparation in required countries provided during FY2014, together with spouse business-related travel. | | The full amount of private family health insurance and personal tax return preparation in required countries provided during FY2015, together with spouse business-related travel. |
STI Section 4.4.6 for how STI is determined | | STI awarded for FY2014 performance. Half or US$1.568 million was provided in cash in September 2014, and half or US$1.568 million deferred in an equity award, which is due to vest in FY2017. | | STI awarded for FY2015 performance. Half or US$1.156 million will be provided in cash in September 2015, and half or US$1.156 million deferred in an equity award (subject to shareholder approval at the 2015 AGMs), which will be due to vest in FY2018. |
LTI Section 4.4.7 for the LTI performance condition Section 4.4.8 for LTI awarded during FY2015 | | The value of 69,600 LTI awards that vested on 20 August 2014, based on performance over the five-year period to 30 June 2014 and valued based on the share price on 20 August 2014 of £19.65 (converted to US dollars on that date) plus the associated DEP of US$0.359 million. | | Based on performance during the five-year period to 30 June 2015, the 120,000 LTI awards granted in 2010 did not vest and have lapsed. The value of the awards is zero and no DEP has been paid in respect of these awards. |
Pension | | BHP Billiton’s contribution to a defined contribution pension plan at 25% of base salary. | | BHP Billiton’s contribution to a defined contribution pension plan at 25% of base salary. |
| (1) | Although eligible, the CEO does not currently participate in Shareplus, for reasons of administrative simplicity in terms of stock exchange dealings and announcements. |
When the components of remuneration are provided
The following graph illustrates the usual time frame for delivery of the components of remuneration. It shows how STI and LTI outcomes are deferred.
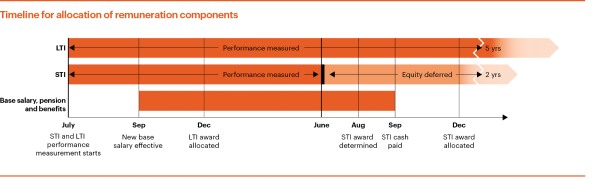
4.4.6 FY2015 STI performance outcomes
The CEO scorecard for the FY2015 performance year is summarised in the following table. A description of each performance measure and the CEO’s level of achievement, as determined by the Remuneration Committee, are shown below the table. The performance range is set for each measure with the level of performance determined on a range of Threshold (the minimum necessary to qualify for any reward outcome), Target (where the performance requirements are met), and Stretch (where the performance requirements are significantly exceeded).
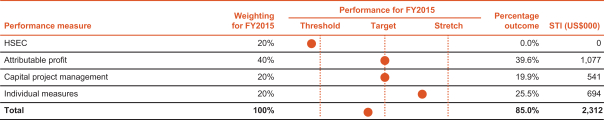
HSEC
The HSEC KPI for the CEO is aligned to the Group’s suite of HSEC five-year public targets as set out in BHP Billiton’s Sustainability Report. As it has done for several years, the Remuneration Committee sought guidance from the Sustainability Committee when assessing HSEC performance. The Sustainability Committee reviewed performance against each of the designated measures. Consistent with prior years, the Remuneration Committee then took a holistic view of how the Group had performed in critical areas.
Targets for FY2015
Fatalities, environmental and community incidents: Nil fatalities and nil actual significant environmental and community incidents.
TRIF and occupational illness: Improved performance compared with FY2014 results, with severity and trends to be considered as a moderating influence on the overall HSEC assessment.
Risk management: Each Business is to have all material risks with HSEC impacts recorded and controlled. For all material risks Businesses to have all critical control designs and critical control assessment test plans reviewed by the material risk owner.
Health, environment and community initiatives: All assets to achieve 100 per cent of planned targets in respect of occupational exposure reduction, water and greenhouse gas projects, local procurement, social investment and community complaints targets.
Performance for FY2015
Fatalities, environmental and community incidents: We tragically lost five of our colleagues in FY2015 and there is no question that this is an unacceptable outcome. As a Company, we need to continue to build our focus on safety and fatality prevention through leadership and effective processes. No significant environmental incidents occurred, however, there were two significant community incidents for FY2015, both being collisions on public roads.
TRIF and occupational illness: Our TRIF in FY2015 improved compared with FY2014 across BHP Billiton as a whole and in most Businesses, with a two per cent reduction to a TRIF of 4.1 for FY2015. Occupational illness rates increased due to the identification of legacy illness cases.
Risk management: All material HSEC risks that have been identified are recorded, and critical control assessments have been completed. In addition, critical control execution and critical control verification tasks have been carried out in accordance with requirements.
Health, environment and community initiatives: Greenhouse gas reduction targets set at the commencement of the year were materially exceeded, with outperformance observed across BHP Billiton. Targets set for water management, reducing occupational health exposures, local procurement plan development and implementation, social investment and community compliants were achieved.
Notwithstanding the positive aspects of FY2015 HSEC performance outlined above, as a consequence of the five tragic fatalities, the Board and Remuneration Committee decided, after taking advice from the Sustainability Committee, that it was appropriate to reduce the CEO’s FY2015 HSEC STI outcome from 12.3 per cent to zero, reflecting the CEO’s overarching accountability for the safety outcomes of the Company.
Attributable profit
Profit after taxation attributable to members of the BHP Billiton Group (attributable profit) is the primary measure used by the Board when assessing the Group’s financial performance. For the purposes of assessing the actual reported outcome against a directly comparable target, the attributable profit KPI is adjusted for changes in commodity prices, foreign exchange movements, and exceptional items to ensure that it appropriately measures outcomes that are within the control and influence of the Group and its executives. Of these, changes in commodity prices are ordinarily the most material due to volatility in prices and the impact on Group revenue.
Targets for FY2015
In respect of FY2015, the Board determined a target for attributable profit of US$1.7 billion, after the adjustments described above.
Performance for FY2015
Attributable profit of US$1.9 billion was reported by BHP Billiton, which was in excess of the target. The key drivers of this outperformance were higher than expected sales volumes, particularly in Iron Ore and, to a lesser extent, in Coal and Petroleum, together with positive productivity and cost performance across a range of Businesses, particularly in Coal. These gains were partly offset by the impact of the Olympic Dam mill outage, water constraints and weather conditions in Copper.
The adjustments for exceptional items in FY2015 (described further in Section 7.1.6 Note 2 of this Annual Report) included an impairment of Onshore US Assets (net loss US$2.0 billion), the repeal of the Minerals Resources Rent Tax legislation (net loss US$0.7 billion), and an impairment of Nickel West (net loss US$0.3 billion). The impairment of Onshore US Assets mainly reflected the Hawkville field’s geological complexity, product mix, acreage relinquishments and amended development plans, together with the impairment of goodwill associated with the Petrohawk acquisition. The acquisition of Petrohawk was made in 2011, prior to the establishment of the GMC in its present form. Accordingly, the impairment had not been taken into account directly for the determination of the FY2015 STI outcomes for the current GMC. However, the impairment and the diminution in the value of Petrohawk assets has directly contributed to a zero vesting outcome under the 2010 LTIP for participants, including the current CEO .
Section 4.4.7 for information on LTIP performance testing
Notwithstanding this, the Board and Committee considers that the CEO should bear a partial impact of the impairment of Onshore US Assets, and decided it was appropriate to reduce the CEO’s attributable profit FY2015 STI outcome by 7.5 per cent from 42.8 per cent to 39.6 per cent to reflect this.
Capital project management
Capital project management measures based on the cost and the schedule outcomes for major capital projects in execution are considered to be effective measures of the delivery of our project pipeline, and consistent with other companies in our sector. The cost KPI is adjusted for foreign exchange movements to ensure that it appropriately measures outcomes that are within the control and influence of the Group and its executives. Consistent with last year, the Committee also considers qualitative factors such as performance on Business level projects, post commissioning performance, capital expenditure efficiency, progress to plan of development projects, relative capital performance against competitors and variations to prior Board approvals.
Targets for FY2015
In respect of FY2015, the Board determined a target for cost of US$19.6 billion, after adjusting for foreign exchange movements, and a target for schedule of 41.5 months, which are weighted averages of the portfolio of major projects under development.
Performance for FY2015
The outcome of US$19.9 billion on cost was slightly behind the target, and the outcome on schedule of 45.4 months was between threshold and target. While the majority of major capital projects proceeded in accordance with approved targets, cost budgets were exceeded on certain projects in Petroleum and Potash and Copper, while favourable cost outcomes were observed in respect of certain other projects in Coal and Iron Ore. Negative impacts on schedule were observed on certain major capital projects in Petroleum and Potash, Coal and Iron Ore, while certain other projects progressed ahead of approved schedule in Coal and Copper. This year, performance overall on qualitative factors was assessed as being between target and stretch, with positive performance observed on progress to plan of development projects and relative performance against competitors.
Individual performance measures for the CEO
Individual measures for the CEO are determined at the commencement of the financial year. The application of personal, qualitative measures remains an important element of effective performance management. These measures seek to provide a balance between the financial and non-financial performance requirements that maintain our position as a leader in our industry.
Targets for FY2015
The CEO’s individual measures for FY2015 comprised a contribution to BHP Billiton’s overall performance and the management team, the delivery of projects and initiatives within the scope of the CEO role as set out by the Board, including portfolio optimisation and simplification, capital management, improvement in leadership capabilities and employee engagement throughout the Group, and GMC member development and succession.
Performance for FY2015
FY2015 represented the completion of the second full financial year in the role by the CEO. The CEO has contributed positively to the performance of the Company and the GMC, with significant productivity and capital expenditure improvements having been achieved during FY2015. In respect of portfolio optimisation, the successful demerger of South32 in May 2015 was a notable achievement. Accordingly, the Committee is of the view the CEO’s performance has been in excess of the targets for individual measures set at the commencement of the year, as set out above.
4.4.7 LTI performance outcomes
LTI vesting based on performance to June 2015
The five-year performance period for the 2010 LTI awards ended on 30 June 2015. The CEO’s 2010 LTI comprised 129,648 awards (inclusive of an uplift of 9,648 awards as a consequence of the demerger of South32), subject to achievement of the relative TSR performance conditions, and any discretion applied by the Remuneration Committee as described below.
Testing the performance condition
For the award to vest in full, BHP Billiton was required to deliver a TSR that exceeded the Peer Group TSR (for 67 per cent of the award) and the Index TSR (for 33 per cent of the award) by an average of 5.5 per cent per year for five years, being 30.7 per cent in total compounded over the five-year performance period from 1 July 2010 to 30 June 2015. TSR includes returns to BHP Billiton shareholders in the form of share price movements along with dividends paid and reinvested in BHP Billiton (including cash and in-specie dividends).
Section 4.3.3 for the description of Peer Group TSR and Index TSR
In relation to the LTI awards granted in 2010, BHP Billiton’s TSR performance was negative 15.2 per cent over the five-year period from 1 July 2010 to 30 June 2015. This is below the weighted median Peer Group TSR of negative 4.5 per cent and below the Index TSR of positive 78.6 per cent over the same period. This level of performance results in zero vesting for the 2010 LTIP awards, and accordingly all 129,648 of the CEO’s 2010 LTIP awards have lapsed. No compensation or DEP was paid in relation to the lapsed awards.
Section 4.4.8 for the 2010 LTIP peer group companies
The graph below shows BHP Billiton’s performance under the 2010 LTIP performance condition.
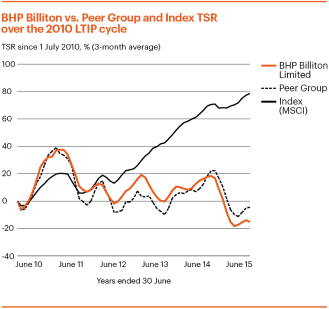
The graph below shows BHP Billiton’s comparative performance against the ASX 100 and the FTSE 100.
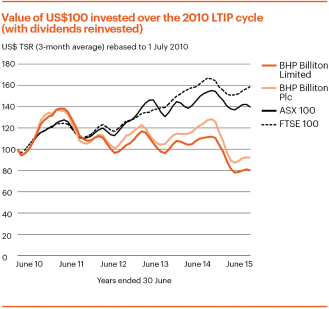
LTI vested during FY2015 based on performance to June 2014
As detailed in last year’s Remuneration Report, the five-year performance period for the 2009 LTIP ended on 30 June 2014. For awards to vest in full, BHP Billiton was required to deliver a TSR that exceeded the Peer Group TSR by an average of 5.5 per cent per year for five years, being 30.7 per cent in total compounded over the five-year performance period. The five-year TSR performance for BHP Billiton was 60.6 per cent and BHP Billiton’s TSR exceeded the weighted average TSR achieved by the comparator group by 17.8 per cent. This performance resulted in 58 per cent vesting of the 2009 LTIP award.
Section 4.3.3for the definition of Peer Group TSR
Section 4.4.8for the 2009 peer group companies
The rules of the LTIP and the terms and conditions of the award give the Committee an overarching discretion to reduce the number of awards that will vest, notwithstanding the fact that the performance condition for partial or full vesting has been met. This qualitative judgement, which is applied before final vesting is confirmed, is an important risk management aspect to ensure that vesting is not simply driven by a formula that may give unexpected or unintended remuneration outcomes. The Committee considers its discretion carefully each year, taking account of the circumstances that are relevant to the five-year period under consideration.
As described last year, and in accordance with its overarching discretion, the Committee considered the TSR outcome in the context of the Group’s performance over the five-year performance period for the 2009 LTIP and determined that the recorded TSR outcome was a fair reflection of performance.
Section 4.4.25for a five-year history of BHP Billiton share prices and dividends
Section 4.4.5for the number and value of vested LTI awards for the CEO
4.4.8 LTI allocated during FY2015
Following shareholder approval at the 2014 AGMs, an LTI award was granted to the CEO on 19 December 2014. The face value and fair value of the award are shown in the table below.
| | | | | | | | | | |
Number of LTI
rights (1) | | Face value US$ (‘000) (2) | | Face value % of salary | | Fair value US$ (‘000) (3) | | Fair value % of salary | | % of max (4) |
208,879 | | 6,800 | | 400 | | 2,788 | | 164 | | 82 |
| (1) | The number of LTI rights is calculated by dividing the face value by the average closing share price over the 12 months immediately prior to the grant date (being A$36.01) using a US$/A$ exchange rate over the same 12-month period, and rounding down to the nearest number of rights. The number was subsequently uplifted by 15,980 to 224,859 to reflect the demerger of South32. |
Section 4.4.19for more information on the treatment of equity awards under the demerger
| (2) | The face value of the award was determined as 400 per cent of Andrew Mackenzie’s base salary of US$1.700 million. |
| (3) | The fair value of the award is calculated by multiplying the face value of the award by the fair value factor of 41 per cent (for the current plan design, as determined by Kepler Associates). |
| (4) | The allocation is 82 per cent of the maximum award that may be provided under the LTIP rules. The maximum is a fair value of 200 per cent of base salary, or face value of 488 per cent of base salary, based on the fair value of 41 per cent for the current plan design (488% x 41% = 200%). |
Terms of the LTI award
Section 4.3.3for the terms of LTI that are set in the remuneration policy for the CEO
In addition to those LTI terms set in the remuneration policy for the CEO, the Remuneration Committee has determined:
The performance period will be 1 July 2014 to 30 June 2019.
An averaging period of six months will be used in the TSR calculations to account for short-term price fluctuations.
BHP Billiton’s performance relative to peers tends to be counter-cyclical. To provide a fair and balanced outcome, TSR relative to the weighted average TSR of sector peer companies selected by the Committee
| (Peer Group TSR) will determine the vesting of 67 per cent of the award. TSR relative to the broad MSCI World index (Index TSR) will determine the vesting of the remaining 33 per cent of the award. |
For the whole of either portion of the award to vest, BHP Billiton’s TSR must exceed the Peer Group TSR or the Index TSR (as applicable) by an average of 5.5 per cent per annum. This equates to exceeding average TSR over the five-year performance period by 30.7 per cent. Threshold vesting of each portion of the award occurs where BHP Billiton’s TSR equals the Peer Group TSR or Index TSR (as applicable).
Peer Group TSR is the weighted median TSR for the companies. Each company in the peer group is weighted by market capitalisation to ensure that it is represented appropriately within the TSR calculation. The maximum weighting for any one company is capped at 15 per cent and the minimum is set at one per cent, to reduce sensitivity to any single peer company.
The sector peer group companies for the FY2015 allocations in December 2014 are below, along with those for prior LTI grants.
| | | | | | | | | | | | |
| | December
2009 | | | December
2010 to
2012 (1) | | | December
2013 and
2014 | |
Resources (75%) | | | | | | | | | | | | |
Alcoa | | | ● | | | | ● | | | | ● | |
Anglo American | | | ● | | | | ● | | | | ● | |
Cameco | | | ● | | | | ● | | | | ● | |
CONSOL Energy | | | | | | | | | | | ● | |
Fortescue Metals | | | | | | | | | | | ● | |
Freeport-McMoRan | | | ● | | | | ● | | | | ● | |
Glencore (2) | | | ● | | | | ● | | | | ● | |
MMC Norilsk Nickel | | | ● | | | | ● | | | | ● | |
Peabody Energy | | | ● | | | | ● | | | | ● | |
Rio Tinto | | | ● | | | | ● | | | | ● | |
Southern Copper | | | ● | | | | ● | | | | ● | |
Teck Resources | | | ● | | | | ● | | | | ● | |
Vale | | | ● | | | | ● | | | | ● | |
| | | | | | | | | | | | |
| | December
2009 | | | December
2010 to
2012 (1) | | | December
2013 and
2014 | |
Oil and Gas (25%) | | | | | | | | | | | | |
Anadarko Petroleum | | | | | | | | | | | ● | |
Apache | | | ● | | | | ● | | | | ● | |
BG Group | | | ● | | | | ● | | | | ● | |
BP | | | | | | | ● | | | | ● | |
Canadian Natural Res. | | | | | | | | | | | ● | |
Chevron | | | | | | | | | | | ● | |
ConocoPhillips | | | | | | | | | | | ● | |
Devon Energy | | | ● | | | | ● | | | | ● | |
EOG Resources | | | | | | | | | | | ● | |
ExxonMobil | | | | | | | ● | | | | ● | |
Occidental Petroleum | | | | | | | | | | | ● | |
Royal Dutch Shell | | | | | | | ● | | | | ● | |
Woodside Petroleum | | | ● | | | | ● | | | | ● | |
| (1) | In 2009 and 2010, the averaging period used in the TSR calculations to account for short-term price fluctuations was three months. This was extended to six months from the December 2011 grants. |
| (2) | Glencore Xstrata replaced Xstrata in the peer group for December 2009 to 2012 awards after the merger of Glencore and Xstrata in May 2013. Glencore Xstrata was renamed Glencore in May 2014. |
4.4.9 CEO remuneration and returns to shareholders
Six-year CEO remuneration
The table below shows the total remuneration earned by Andrew Mackenzie and Marius Kloppers over the last six years, along with the proportion of maximum opportunity earned in relation to each type of incentive.
Section 4.4.5for more detail on, and the methodology used to calculate, the single total figure of remuneration as used in this table
| | | | | | | | | | | | | | | | | | | | | | | | |
Financial year | | FY2010 | | | FY2011 | | | FY2012 | | | FY2013 (1) | | | FY2014 | | | FY2015 | |
Andrew Mackenzie | | | | | | | | | | | | | | | | | | | | | | | | |
Total remuneration (single figure, US$’000) | | | – | | | | – | | | | – | | | | 2,468 | | | | 7,988 | | | | 4,582 | |
STI (% of maximum) | | | – | | | | – | | | | – | | | | 47 | | | | 77 | | | | 57 | |
LTI (% of maximum) | | | – | | | | – | | | | – | | | | 65 | | | | 58 | | | | 0 | |
Marius Kloppers | | | | | | | | | | | | | | | | | | | | | | | | |
Total remuneration (single figure, US$’000) | | | 14,789 | | | | 15,755 | | | | 16,092 | | | | 15,991 | | | | – | | | | – | |
STI (% of maximum) | | | 71 | | | | 69 | | | | 0 | | | | 47 | | | | – | | | | – | |
LTI (% of maximum) | | | 100 | | | | 100 | | | | 100 | | | | 65 | | | | – | | | | – | |
| (1) | As Mr Mackenzie assumed the role of CEO in May 2013, the FY2013 total remuneration shown relates only to the period 10 May to 30 June 2013. The FY2013 total remuneration for Mr Kloppers relates only to the period 1 July 2012 to 10 May 2013. |
Six-year TSR
The graph below shows BHP Billiton’s TSR against the performance of relevant indices over the same six-year period. The indices shown in the graph were chosen as being broad market indices, which include companies of a comparable size and complexity to BHP Billiton.
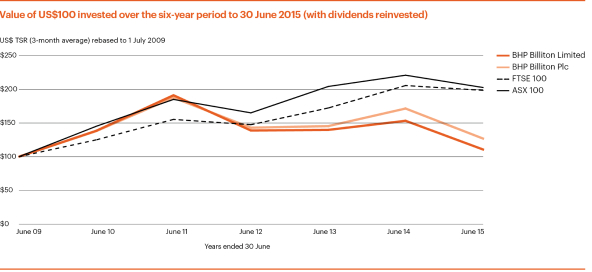
4.4.10 Change in CEO’s remuneration in FY2015
The table below sets out the CEO’s base salary, benefits and STI amounts earned in respect of FY2015, with the percentage change from FY2014. The table also shows the average change in each element for current employees in Continuing operations during FY2015 in Australia (being approximately 17,000 employees). This has been chosen by the Committee as the most appropriate comparison, as the CEO is located in Australia.
| | | | | | | | | | | | | | | | |
| | | | | | Base salary | | | Benefits | | | STI | |
CEO | | | $’000 | | | | 1,700 | | | | 145 | | | | 2,312 | |
| | | % change | | | | 0.0 | | | | 57.6 | | | | (26.3) | |
Australian employees | | | % change (average) | | | | 1.2 | | | | (17.0) | | | | (19.6) | |
4.4.11 Remuneration for the CEO in FY2016
The remuneration for the CEO in FY2016 will be provided in accordance with the remuneration policy approved by shareholders at the 2014 AGMs.
Section 4.3.3 for the remuneration policy for the CEO
Base salary increase in September 2015
Base salary is reviewed annually, and increases are applicable from 1 September. The CEO will not receive a base salary increase in September 2015 and it will remain unchanged at US$1.700 million per annum for FY2016.
FY2016 STI performance measures
STI awards will be determined and provided on the same basis as set out for FY2015, and the HSEC, attributable profit, capital project management and individual performance measures are unchanged. Given the importance the Remuneration Committee places on safety, the scorecard weighting attached to HSEC has been increased for FY2016 to 25 per cent from 20 per cent in FY2015. The capital project management weighting has been reduced to 10 per cent from 20 per cent reflecting a lower number and value of major capital projects in execution, and the individual performance component weighting has been increased to 25 per cent from 20 per cent. The attributable profit weighting is unchanged at 40 per cent.
Section 4.4.6 for a description of STI for FY2015, including the performance measures
The performance measures set out in the table below have been set by the Remuneration Committee for the CEO in FY2016.
| | | | | | |
Performance measure | | Weighting | | | Target performance |
HSEC | | | 25% | | | • Fatalities, environmental and community incidents: Nil fatalities and nil actual significant environmental and community incidents. Year-on-year improvement in trends for events with potential for such outcomes. • TRIF and occupational illness: Improved performance compared with FY2015 results, with severity and trends to be considered as a moderating influence on the overall HSEC assessment. |
| | | | | | |
Performance measure | | Weighting | | | Target performance |
| | | | | | • Risk management: For all material risks, Businesses to have all critical control designs and critical control assessment test plans reviewed by the material risk owner and recorded. Year-on-year improvement in trends for potential events associated with identified material risks. • Health, environment and community initiatives:All assets to achieve 100% of planned targets in respect of occupational exposure reduction, water and greenhouse gas, social investment, quality of life, community perceptions and community complaints. |
Attributable profit (adjusted for commodity prices foreign exchange movements and exceptional items) | | | 40% | | | • For reasons of commercial sensitivity, the target for attributable profit will not be disclosed in advance; however, we plan to disclose targets and outcomes retrospectively. In the rare instances where this may not be prudent on grounds of commercial sensitivity, we will explain why and give an indication of when they will be disclosed. |
Capital project management | | | 10% | | | • For reasons of commercial sensitivity, the targets for capital project management cost and schedule will not be disclosed in advance; however, we plan to disclose targets and outcomes retrospectively. In the rare instances where this may not be prudent on grounds of commercial sensitivity, we will explain why and give an indication of when they will be disclosed. |
Individual performance | | | 25% | | | • The CEO’s individual measures for FY2016 comprise contribution to BHP Billiton’s overall performance and the management team, and the delivery of projects and initiatives within the scope of the CEO role as set out by the Board, including strategy implementation, consolidation of relationships with key stakeholders, improvement in leadership capabilities and employee engagement throughout the Group, delivery of productivity initiatives, and GMC member development and succession. |
FY2016 LTI award
On the advice of the Committee, the Board has proposed an FY2016 LTI award for the CEO with a face value of US$6.800 million, being 400 per cent of the CEO’s base salary. Taking into account the performance condition as represented by the fair value factor of 41 per cent, the fair value of these awards is US$2.788 million.
The FY2016 LTI award will use the same performance and service conditions, vesting schedule and peer groups as the FY2015 LTI award except that Alcoa, Cameco and MMC Norilsk Nickel, have been removed from the
sector peer group of companies primarily as a consequence of the South32 demerger and the capped maximum weighting for any one company has changed from 15 per cent to 20 per cent.
Section 4.4.8 for a description of LTI for FY2015
If approved by shareholders, this FY2016 LTI award will be granted following the AGMs (i.e. in or around December 2015). The number of awards will be notified to shareholders at the time that they are provided.
Remuneration outcomes for Non-executive Directors
The remuneration policy for the Non-executive Directors set out in the remuneration policy report also applied in FY2015, and the remuneration outcomes described below have therefore been provided in accordance with that same policy.
Section 4.3.9 for the remuneration policy for the Non-executive Directors
The maximum aggregate fees payable to Non-executive Directors (including the Chairman) were approved by shareholders at the 2008 AGMs at US$3.8 million per annum. This sum includes base fees, committee fees and pension contributions. Travel allowances and non-monetary benefits are not included in this limit.
4.4.12 Single total figure of remuneration
This section shows a single total figure of remuneration as prescribed under UK requirements. It is a measure of actual remuneration. As Non-executive Directors do not receive any equity awards as part of their remuneration, this table also meets the requirements of the Australian Corporations Act 2001 and relevant accounting standards.
| | | | | | | Short-term benefits | | | Subtotal: UK
Requirements
for FY2013 | | | Post-employment benefits(2) | | | Total:
Australian
requirements | | | | | | | | | | | |
US dollars (’000) | | | | | Fees | | | Committee
Chair fees | | | Committee
membership
fees | | | Travel
allowances | | | Other benefits
(non-
monetary)(1) | | | Superannuation
benefits | | | Retirement
benefits | | | | Financial year | | | Fees (1) | | | Benefits (2) | | | Pensions (3) | | | Total | |
Malcolm Brinded(4) | | | | FY2015 | | | | 198 | | | | 77 | | | | – | | | | 275 | |
| | | | FY2014 | | | | 42 | | | | 15 | | | | – | | | | 57 | |
Malcolm Broomhead | | | 2013 | | | | 170 | | | | – | | | | 60 | | | | 59 | | | | 2 | | | | 291 | | | | 12 | | | | – | | | | 303 | | | | FY2015 | | | | 230 | | | | 47 | | | | 13 | | | | 290 | |
| | | 2012 | | | | 170 | | | | – | | | | 34 | | | | 45 | | | | – | | | | 249 | | | | 11 | | | | – | | | | 260 | | | | FY2014 | | | | 230 | | | | 75 | | | | 12 | | | | 317 | |
John Buchanan | | | 2013 | | | | 218 | | | | 45 | | | | – | | | | 59 | | | | 18 | | | | 340 | | | | – | | | | – | | | | 340 | | | | FY2015 | | | | 254 | | | | 41 | | | | – | | | | 295 | |
| | | 2012 | | | | 218 | | | | 45 | | | | – | | | | 60 | | | | 6 | | | | 329 | | | | – | | | | – | | | | 329 | | | | FY2014 | | | | 263 | | | | 84 | | | | – | | | | 347 | |
Carlos Cordeiro | | | 2013 | | | | 170 | | | | – | | | | 28 | | | | 111 | | | | 2 | | | | 311 | | | | – | | | | – | | | | 311 | | | | FY2015 | | | | 198 | | | | 110 | | | | – | | | | 308 | |
| | | 2012 | | | | 170 | | | | – | | | | 28 | | | | 105 | | | | – | | | | 303 | | | | – | | | | – | | | | 303 | | | | FY2014 | | | | 198 | | | | 103 | | | | – | | | | 301 | |
David Crawford | | | 2013 | | | | 170 | | | | 60 | | | | – | | | | 59 | | | | 2 | | | | 291 | | | | 12 | | | | – | | | | 303 | | |
David Crawford(5) | | | | FY2015 | | | | 90 | | | | 27 | | | | 5 | | | | 122 | |
| | | 2012 | | | | 170 | | | | 22 | | | | – | | | | 60 | | | | 20 | | | | 272 | | | | 10 | | | | – | | | | 282 | | | | FY2014 | | | | 230 | | | | 69 | | | | 12 | | | | 311 | |
Pat Davies(3) | | | 2013 | | | | 170 | | | | – | | | | 28 | | | | 111 | | | | 3 | | | | 312 | | | | – | | | | – | | | | 312 | | |
Pat Davies | | | | FY2015 | | | | 211 | | | | 91 | | | | – | | | | 302 | |
| | | 2012 | | | | 14 | | | | – | | | | 2 | | | | – | | | | – | | | | 16 | | | | – | | | | – | | | | 16 | | | | FY2014 | | | | 198 | | | | 88 | | | | – | | | | 286 | |
Carolyn Hewson | | | 2013 | | | | 170 | | | | – | | | | 33 | | | | 59 | | | | 1 | | | | 263 | | | | 10 | | | | – | | | | 273 | | | | FY2015 | | | | 223 | | | | 62 | | | | 12 | | | | 297 | |
| | | 2012 | | | | 170 | | | | – | | | | 33 | | | | 75 | | | | – | | | | 278 | | | | 10 | | | | – | | | | 288 | | | | FY2014 | | | | 214 | | | | 48 | | | | 12 | | | | 274 | |
Lindsay Maxsted | | | 2013 | | | | 170 | | | | 60 | | | | 33 | | | | 59 | | | | 2 | | | | 324 | | | | 13 | | | | – | | | | 337 | | | | FY2015 | | | | 246 | | | | 70 | | | | 14 | | | | 330 | |
| | | 2012 | | | | 170 | | | | 49 | | | | 12 | | | | 45 | | | | – | | | | 276 | | | | 13 | | | | – | | | | 289 | | | | FY2014 | | | | 263 | | | | 53 | | | | 14 | | | | 330 | |
Wayne Murdy | | | 2013 | | | | 170 | | | | – | | | | 65 | | | | 118 | | | | 2 | | | | 355 | | | | – | | | | – | | | | 355 | | | | FY2015 | | | | 219 | | | | 136 | | | | – | | | | 355 | |
| | | 2012 | | | | 170 | | | | – | | | | 39 | | | | 119 | | | | 20 | | | | 348 | | | | – | | | | – | | | | 348 | | | | FY2014 | | | | 235 | | | | 113 | | | | – | | | | 348 | |
Jac Nasser | | | 2013 | | | | 1,100 | | | | – | | | | – | | | | 103 | | | | 2 | | | | 1,205 | | | | – | | | | – | | | | 1,205 | | | | FY2015 | | | | 1,100 | | | | 108 | | | | – | | | | 1,208 | |
| | | 2012 | | | | 1,100 | | | | – | | | | – | | | | 89 | | | | 2 | | | | 1,191 | | | | – | | | | – | | | | 1,191 | | | | FY2014 | | | | 1,100 | | | | 114 | | | | – | | | | 1,214 | |
Keith Rumble | | | 2013 | | | | 170 | | | | – | | | | 28 | | | | 119 | | | | 2 | | | | 319 | | | | – | | | | – | | | | 319 | | |
Keith Rumble(5) | | | | FY2015 | | | | 177 | | | | 103 | | | | – | | | | 280 | |
| | | 2012 | | | | 170 | | | | – | | | | 28 | | | | 127 | | | | 15 | | | | 340 | | | | – | | | | – | | | | 340 | | | | FY2014 | | | | 198 | | | | 129 | | | | – | | | | 327 | |
John Schubert | | | 2013 | | | | 170 | | | | 45 | | | | 28 | | | | 59 | | | | – | | | | 302 | | | | 12 | | | | – | | | | 314 | | | | FY2015 | | | | 229 | | | | 64 | | | | 13 | | | | 306 | |
| | | 2012 | | | | 170 | | | | 45 | | | | 28 | | | | 67 | | | | 23 | | | | 333 | | | | 20 | | | | – | | | | 353 | | | | FY2014 | | | | 243 | | | | 45 | | | | 13 | | | | 301 | |
Shriti Vadera | | | 2013 | | | | 170 | | | | – | | | | 33 | | | | 89 | | | | 1 | | | | 293 | | | | – | | | | – | | | | 293 | | | | FY2015 | | | | 216 | | | | 46 | | | | – | | | | 262 | |
| | | 2012 | | | | 170 | | | | – | | | | 28 | | | | 60 | | | | 2 | | | | 260 | | | | – | | | | – | | | | 260 | | | | FY2014 | | | | 203 | | | | 79 | | | | – | | | | 282 | |
| (1) | Other benefitsFees include professionalthe annual base fee, plus additional fees as applicable for Directorsthe Senior Independent Director, Committee Chairs and also reimbursementsCommittee memberships. |
Section 4.4.13for details of the fee structure for FY2014 and FY2015
| (2) | The majority of the amounts disclosed for benefits are travel allowances for each Non-executive Director: amounts of between US$15,000 and US$105,000 (US$15,000 and US$112,000 for FY2014). In addition, amounts of between US$ nil and US$5,000 (US$ nil and US$5,000 for FY2014) are included in respect of tax return preparation; amounts of between US$ nil and US$26,000 (US$ nil and US$32,000 for FY2014) are included in respect of costs associated with spouse/partner attendance at a business meeting location; and amounts of between US$ nil and US$11,000 (US$ nil and US$19,000 for FY2014) are included in respect of reimbursement of the tax cost associated with the provision of travel, accommodation and subsistence for Directors’ spouses.taxable benefits. |
(2)(3) | In respect of superannuation benefits, BHP Billiton Limited makesmade minimum superannuation contributions of nine9.5 per cent of fees paidfor FY2015 in accordance with Australian superannuation legislation (increasing tolegislation(increased from 9.25 per cent of fees paid in FY2014). |
(3)(4) | FY2012The FY2014 remuneration for Pat DaviesMalcolm Brinded relates to part of that year only, as he joined the Board duringon 15 April 2014. |
| (5) | The FY2015 remuneration for David Crawford and Keith Rumble relates to part of the year. His dateyear only, as they left the Board on 20 November 2014 and 22 May 2015, respectively. |
4.4.13 Non-executive Directors’ remuneration in FY2016
In FY2016, the remuneration for the Non-executive Directors will be paid in accordance with the remuneration policy approved by shareholders at the 2014 AGMs.
Section 4.3.9 for the remuneration policy for the Non-executive Directors
Fees for the Non-executive Directors (other than the Chairman) are determined by the Chairman and the CEO. Fees for the Chairman are determined by the Board on the recommendation of the Remuneration Committee.
Fee levels for the Non-executive Directors and the Chairman, which are reviewed annually, have remained unchanged since 2011. The annual review includes benchmarking, with the assistance of external advisers, against peer companies. Based on the review conducted in June 2015:
the Board, with support from the Chairman, has decided to reduce the Chairman’s fee by approximately 13 per cent from US$1.100 million to US$0.960 million per annum, and
the Chairman and the CEO have decided to reduce the Non-executive Director base fee by approximately six per cent from US$0.170 million to US$0.160 million per annum
These reductions were considered appropriate in light of the challenging external environment and the benchmarking data for peer companies. The different percentage reduction for the Chairman compared with that for Non-executive Directors reflects the relevant benchmarks for those roles.
A decision was also taken to include mandatory superannuation contributions within the relevant base fee from 1 July 2015, which is more closely aligned to the practices of other companies. This has the effect of further reducing Non-executive Director remuneration for those Directors who receive Australian superannuation contributions. For those Directors, this results in an average reduction of approximately 12 per cent in the aggregate of their base fees and superannuation contributions.
The table below sets out the fee levels for FY2016, and the changes in fee levels since FY2011.
| | | | | | | | | | | | | | | | | | | | |
Levels of fees and travel allowances for Non-executive Directors (in US dollars) | | From 1 July
2011 | | | From 1 July
2012 | | | From 1 July
2013 | | | From 1 July
2014 | | | From 1 July
2015 | |
Base annual fee | | | 170,000 | | | | 170,000 | | | | 170,000 | | | | 170,000 | | | | 160,000 | |
| | | | | | | | | | | | | | | | | | | | |
Plus additional fees for: | | | | | | | | | | | | | | | | | | | | |
Senior Independent Director of
BHP Billiton Plc | | | 48, 000 | | | | 48,000 | | | | 48,000 | | | | 48,000 | | | | 48,000 | |
| | | | | | | | | | | | | | | | | | | | |
Committee Chair: | | | | | | | | | | | | | | | | | | | | |
Risk and Audit | | | 60,000 | | | | 60,000 | | | | 60,000 | | | | 60,000 | | | | 60,000 | |
Finance(1) | | | – | | | | 60,000 | | | | 60,000 | | | | 60,000 | | | | – | |
Remuneration | | | 45,000 | | | | 45,000 | | | | 45,000 | | | | 45,000 | | | | 45,000 | |
Sustainability | | | 45,000 | | | | 45,000 | | | | 45,000 | | | | 45,000 | | | | 45,000 | |
Nomination | |
| No additional
fees |
| |
| No additional
fees |
| |
| No additional
fees |
| |
| No additional
fees |
| |
| No additional
fees |
|
| | | | | | | | | | | | | | | | | | | | |
Committee membership: | | | | | | | | | | | | | | | | | | | | |
Risk and Audit | | | 32,500 | | | | 32,500 | | | | 32,500 | | | | 32,500 | | | | 32,500 | |
Finance(1) | | | – | | | | 32,500 | | | | 32,500 | | | | 32,500 | | | | – | |
Remuneration | | | 27,500 | | | | 27,500 | | | | 27,500 | | | | 27,500 | | | | 27,500 | |
Sustainability | | | 27,500 | | | | 27,500 | | | | 27,500 | | | | 27,500 | | | | 27,500 | |
Nomination | |
| No additional
fees |
| |
| No additional
fees |
| |
| No additional
fees |
| |
| No additional
fees |
| |
| No additional
fees |
|
| | | | | | | | | | | | | | | | | | | | |
Travel allowance: (2) | | | | | | | | | | | | | | | | | | | | |
Greater than 3 but less than 10 hours | | | 7,000 | | | | 7,000 | | | | 7,000 | | | | 7,000 | | | | 7,000 | |
10 hours or more | | | 15,000 | | | | 15,000 | | | | 15,000 | | | | 15,000 | | | | 15,000 | |
| | | | | | | | | | | | | | | | | | | | |
Chairman’s fee | | | 1,100,000 | | | | 1,100,000 | | | | 1,100,000 | | | | 1,100,000 | | | | 960,000 | |
| | | | | | | | | | | | | | | | | | | | |
| (1) | The Finance Committee existed from 23 April 2012 to 31 December 2014, and fees were paid in respect of appointment isthis period. The fees shown in section 4.1.the table above are annualised. |
| (2) | In relation to travel for Board business, the time thresholds relate to the flight time to travel to the meeting location (i.e. one way flight time). |
Remuneration for members of the GMC (other than the CEO)
The information in this section contains details of the remuneration policy that guided the Remuneration Committee’s decisions and resulted in the remuneration outcomes for members of the GMC, other than the CEO (or any other Executive Directors should any be appointed in future).
Section 4.2.1 for members of the GMC
The remuneration policy and structures for the members of the GMC are essentially the same as those already described for the CEO in previous sections of the Remuneration Report. Where this is the case, to avoid repetition, this section of the Report cross-references that prior content.
4.4.14 Remuneration policy
In designing and determining the remuneration for members of the GMC, the Remuneration Committee applies the Group’s remuneration policy. This contains the key principles that support and reinforce the Group’s strategy and ongoing performance and align activities of management with the interests of shareholders.
Section 4.3.1 and 4.3.2 for overarching principles and purpose of remuneration at BHP Billiton
6.4 StatutoryThe Committee considers the appropriate total remuneration for each member of the GMC by examining the remuneration provided to comparable roles in organisations of similar global complexity, size, reach and industry.
Each year, the Committee’s independent adviser, Kepler Associates, sources and consolidates relevant remuneration data for comparable roles, in relevant organisations and markets. The adviser prepares a comparison to current GMC remuneration, but does not make specific recommendations regarding the level of individual executives’ remuneration.
Section 4.4.1 for more information on services provided by Kepler Associates
From this market comparison, the Committee determines the appropriate remuneration for each individual, taking into account their responsibilities, location, skills, qualifications, experience and performance within the Group. In doing so, the Committee recognises that levels of remuneration should be sufficient to attract, motivate and retain high-quality, experienced executives, but also that the Group should avoid paying more than is necessary for this purpose.
4.4.15 Components of remuneration
The components of remuneration for members of the GMC are the same as the CEO, with any differences described below.
Section 4.3.3 for the components of CEO remuneration (including how remuneration links to strategy, how each component operates and how performance is assessed)
Fixed remuneration
As for the CEO, the other members of the GMC receive:
A competitive base salary that is appropriate to the role and attracts and retains high-quality executives.
Pension contributions to a maximum of 25 per cent of base salary.
Relocation allowance and other benefits as determined by the Remuneration Committee, and of a similar nature to those received by the CEO, or as otherwise determined by local policy or practice in the location where the GMC member is located.
Section 4.4.19 for details of significant components of fixed remuneration for each member of the GMC
STI
Members of the GMC are entitled to participate in the STIP on the same basis as the CEO.
Section 4.3.3 for details of the STIP, including the setting of performance measures, assessment of performance, and delivery of awards in cash and deferred equity (including terms in relation to malus and clawback)
Section 4.3.8 for the terms of STI awards on cessation of employment
The performance measures for members of the GMC are similar to those of the CEO, as determined by the Committee. However, the weighting of each performance measure will vary to reflect the focus required from each GMC role. In particular, there are different weightings for GMC members with specific Business responsibilities. The relevant performance measures and weightings and the performance outcomes for FY2015
(as assessed by the Committee) are set out in the diagram below. The individual STI outcome for each GMC member has been determined with reference to the time spent in relevant roles during FY2015.
Section 4.4.6 for a comparable table of performance measures and outcomes for the CEO
Section 4.4.19 for details of the STI amount provided to each member of the GMC for FY2015 performance
The description of the STI outcomes for the CEO explains the FY2015 performance outcomes against targets for HSEC, attributable profit, EBIT and capital project management. This includes the material variations from target performance for BHP Billiton and for its separate Businesses, which correspond to the business outcomes shown in the diagram below.
Individual measures are determined at the commencement of the financial year. These comprise each individual’s contribution to the GMC, delivery against projects and initiatives within the scope of his or her role, and his or her contribution to the overall performance of the Group. Personal performance of GMC members was reviewed against these measures by the Committee and, on average, was considered on target.
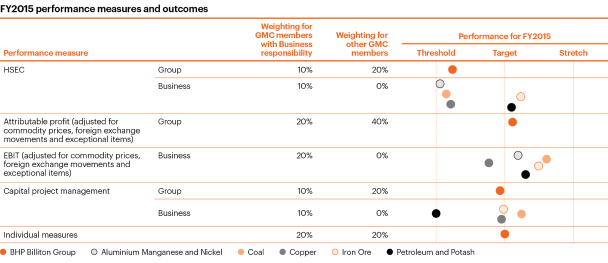
LTI
Members of the GMC receive LTI awards under the LTIP, which are made on the same basis and with the same performance hurdles and vesting conditions as those provided to the CEO.
LTI awards granted to members of the GMC generally have a maximum face value of 350 per cent of base salary, which is a fair value of 143.5 per cent of base salary under the current plan design (with an expected value of 41 per cent, taking into account the performance condition: 350% x 41% = 143.5%). The exception is for Tony Cudmore, Jane McAloon and Athalie Williams, for whom the maximum face value is 300 per cent of base salary (or a fair value of 123.0 per cent of base salary).
Section 4.3.3 for details of the LTIP, including the relative TSR performance condition, and the level of performance required for vesting (including terms in relation to malus and clawback)
Section 4.3.8 for the terms of LTI awards on cessation of employment
Section 4.4.7 for details of the performance outcomes for the 2010 LTIP
Section 4.4.21 for details of LTI awards that vested during FY2015
Transitional GMC awards
Transitional GMC awards are granted to new GMC members recruited from within BHP Billiton to bridge the gap created by the different timeframes of BHP Billiton’s long-term incentive program for GMC members (LTIP) and for senior management (MAP).
Section 4.4.22 for more information on Transitional GMC awards, the circumstances in which they may be provided, and the applicable performance conditions
Mike Henry was holding 21,533 Transitional GMC awards with a service condition to 30 June 2015. As the service condition was satisfied, a performance assessment for the period 1 July 2012 to 30 June 2015 has been made by the Committee. The Committee has absolute discretion to determine if the performance condition has been met and whether any, all or part of the award will vest (or otherwise lapse), having regard to (but not limited to) BHP Billiton’s TSR over the relevant performance period (respectively), the participant’s contribution to Group outcomes and the participant’s personal performance (with guidance on this assessment from the CEO).
The Committee considered that since mid-2012 our TSR performance has matched our peers, and that Group performance over FY2013 to FY2015 (to which Mr Henry contributed effectively) has been positive across a range of factors within management’s control, most notably production, costs and capital expenditure across all years and safety performance in FY2014, offset by the five fatalities in FY2015. In addition, the CEO considered Mr Henry had performed well in his role as President HSE, Marketing and Technology until 31 December 2014, and has commenced well in his role as President Coal since 1 January 2015.
As such, and given the service condition had been satisfied, the Committee decided that a vesting outcome of 83 per cent was appropriate (against a target of 80 per cent, with a maximum of 100 per cent and a minimum of zero). Accordingly, 17,872 of the 21,533 Transitional GMC awards held by Mr Henry with a service condition to 30 June 2015 vested on 27 August 2015 and the remainder lapsed.
Shareplus all-employee share purchase plan
Like the CEO, other members of the GMC are also eligible to participate in Shareplus. For administrative simplicity in regard to stock exchange dealings and announcements, other members of the GMC do not currently participate in Shareplus.
Section 4.4.26 for information about Shareplus and the holdings of GMC members
Equity awards provided for pre-GMC service
Members of the GMC who were promoted from executive roles within BHP Billiton hold GSTIP and MAP awards that were granted to them in respect of their service in non-GMC roles.
Section 4.4.23 and 4.4.24 for details on these awards, including those which have vested during FY2015
4.4.16 Remuneration mix
The Group approach to remuneration for members of the GMC is that a significant portion should be ‘at risk’ to provide strong alignment between remuneration outcomes and the interests of BHP Billiton shareholders.
The diagram below sets out the relative mix of each remuneration component for other members of the GMC. Each component is determined as a percentage of base salary (at the minimum, target and maximum levels of performance-based remuneration).
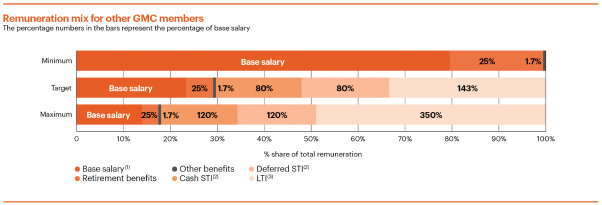
| (1) | Base salary earned by each member of the GMC is set out in section 4.4.19 of this Annual Report. |
| (2) | As for the CEO, the minimum STI award is zero, with an award of 80 per cent of base salary in cash and 80 per cent in deferred equity for target performance, and a maximum award of 120 per cent cash and 120 per cent deferred equity for exceptional performance against KPIs. |
Section 4.4.19 for actual cash STI awards for FY2015 performance, which are shown in the annual cash incentive column of the table
| (3) | Other members of GMC have a maximum LTI award with a face value of 350 per cent of base salary as shown in the chart, with the exception of Tony Cudmore, Jane McAloon and Athalie Williams, who each have a maximum LTI award with a face value of 300 per cent of base salary. |
Section 4.4.21 for actual LTI awards for FY2015, which were granted on 19 December 2014
4.4.17 Employment contracts
The terms of employment for other members of the GMC are formalised in employment contracts, which have no fixed term. They typically outline the components of remuneration paid to the individual, but do not prescribe how remuneration levels are to be modified from year-to-year. A GMC employment contract may be terminated by BHP Billiton on six months’ notice for all new GMC appointees since March 2014, or up to 12 months’ notice for all other GMC appointees. BHP Billiton can terminate a contract immediately by making a payment of up to 12 months’ base salary plus pension contributions for the relevant period. The GMC member must give six months’ notice for voluntary resignation.
Section 4.2.1 for members of the GMC (including the date they commenced in their role if during the current financial year)
4.4.18 Arrangements for GMC members leaving the Group during and after FY2015 (not previously reported)
The arrangements for GMC members leaving the Group are within the approval provided by shareholders at the 2014 AGMs in regard to Australian termination benefits legislation, including the provision of performance-based remuneration in accordance with the rules of the relevant incentive plans. The arrangements for Graham Kerr and Mike Fraser are in accordance with relevant transaction documentation in relation to the
demerger of South32. The FY2014 Remuneration Report contained details of the arrangements for Karen Wood on her retirement from the Group in August 2014.
Graham Kerr
Graham Kerr stepped down from his role as Chief Financial Officer on the GMC effective 30 September 2014 as a result of the South32 demerger proposed at the time, and exited BHP Billiton on 24 May 2015 as a result of Mr Kerr becoming Chief Executive Officer of South32. Mr Kerr received base salary, pension contributions, STI and applicable benefits up to the date of his exit from BHP Billiton. He received no payments in lieu of notice upon exit, but has been paid, or will receive in the future, the value of pension and superannuation funds that he has accumulated during his service with the Group. His statutory leave entitlements transferred to South32.
Upon Mr Kerr’s exit, the unvested deferred shares allocated to him in respect of the FY2013 GIS award vested to him in full. As a result of the South32 demerger and following approval of the Remuneration Committee, Mr Kerr’s FY2013 GMC Transitional Awards, 2012 LTIP and 2013 LTIP lapsed in full, effective 24 May 2015. South32 has replaced these awards with new awards over South32 shares that have similar terms and conditions as the original awards.
Mike Fraser
Mike Fraser stepped down from his role as President, Human Resources on the GMC effective 31 December 2014 as a result of the South32 demerger proposed at the time, and exited BHP Billiton on 24 May 2015 as a result of Mr Fraser becoming President and Chief Operating Officer Africa of South32. Mr Fraser received base salary, pension contributions, STI and applicable benefits up to the date of his exit from BHP Billiton. He received no payments in lieu of notice upon exit, but will receive in the future the value of pension and superannuation funds that he has accumulated during his service with the Group. His statutory leave entitlements transferred to South32.
Upon Mr Fraser’s exit, the unvested deferred shares allocated to him in respect of the FY2013 GSTIP and FY2013 MAP award vested to him in full. As a result of the South32 demerger and following approval from the Remuneration Committee, Mr Fraser’s FY2014 GMC Transitional Awards and 2013 LTIP lapsed in full, effective 24 May 2015. South32 has replaced these awards with new awards over South32 shares that have similar terms and conditions as the original awards.
Jane McAloon
Jane McAloon retired from her role as President, Governance and Group Company Secretary on the GMC on 31 May 2015 and from BHP Billiton on 1 July 2015. Ms McAloon received base salary, pension contributions, STI and applicable benefits up to the date of her retirement. She received no payments in lieu of notice upon retirement, but will receive in the future the value of pension and superannuation funds that she has accumulated during her service with the Group. She was paid the value of her statutory leave entitlements. When determining the STI awards for GMC members, the Remuneration Committee resolved that Ms McAloon would receive a FY2015 short-term incentive award in the form of cash, which was assessed by the Committee, based on her performance. No deferral period will apply in respect of this cash STI award.
Upon Ms McAloon’s retirement, the unvested awards allocated to her in respect of the FY2013 GIS, FY2013 GSTIP and FY2013 MAP vested to her in full and those in respect of the FY2014 STIP will remain on foot and will not vest until August 2016. In accordance with the Group’s usual practice, Ms McAloon’s unvested LTIP awards and Transitional GMC awards were pro-rated, to reflect the percentage of the performance period that had elapsed to 1 July 2015. The vesting of the retained pro-rated awards will be determined by the Committee at the relevant time in future years. The LTIP awards will only vest if the performance condition is met at the end of each five-year performance period, subject to the Committee’s ability to reduce vesting through its discretion under the plan rules.
Other statutory disclosures
This section provides details of any additional statutory disclosures required by Australian or UK regulations that have not been included in the previous sections of the Remuneration Report.
Statutory4.4.19 GMC remuneration disclosures for GMC members
6.4.1 Remuneration table
The table below has been prepared in accordance with the requirements of the UK Companies Act 2006 (and the Large and Medium-sized Companies and Groups (Accounts and Reports) Regulations 2008 made thereunder) and the Australian Corporations Act 2001 and relevant accounting standards. RemunerationWhere applicable, remuneration data for all KMPmembers of the GMC are pro-rated for the periods of FY2012FY2014 and FY2013FY2015 that each individualthey served as a member of the GMC. An explanationAthalie Williams joined the GMC during FY2015 and there is no relevant FY2014 comparison. Mike Fraser, Graham Kerr, Jane McAloon and Karen Wood left the GMC during FY2015.
More information on the policy and operation of the share-based payments terms used in the tableeach element of remuneration is provided following the table and associated footnotes.in prior sections of this Report.
Share-based payments
The figures providedincluded in the shaded columns of the statutory table below for share-based payments were not actually provided to the KMP during FY2013.FY2014 or FY2015. These amounts are calculated in accordance with accounting standards and are the amortised IFRS fair values of equity and equity-related instruments that have been granted to the executives, either in relation to FY2013FY2014 and FY2015 performance or that of prior financial years. Please refer to sections 6.3.3, 6.3.4 and the remainder4.4.20 to 4.4.26 of this sectionAnnual Report for information on awards allocated during FY2012FY2014 and FY2013.FY2015. A further explanation of the share-based payments terms used in the table is provided following the table and its associated footnotes.
| | | | | | | | | | | | | | | | | | | | | | | | | | | | | | | | | | | | | | | | |
| | | | | | Short-term benefits | | | Subtotal:
UK requirements
for FY2013 | | | Post-
employment
benefits | | | Share-based payments (6) | | | Total:
Australian
requirements | |
US dollars (’000) | | | | | Base
Salary (1) | | | Annual cash
incentive (2) | | | Non-
monetary
benefits (3) | | | Other
benefits (4) | | | | Retirement
benefits (5) | | | Value of STI
and Shareplus
awards (7) | | | Value of LTI
awards (8) | | |
Executive Directors | | | | | | | | | | | | | | | | | | | | | | | | | | | | | | | | | | | | | | | | |
Andrew Mackenzie | | | 2013 | | | | 1,271 | | | | 899 | | | | 10 | | | | 700 | | | | 2,880 | | | | 431 | | | | 902 | | | | 888 | | | | 5,101 | |
| | | 2012 | | | | 1,183 | | | | 630 | | | | 14 | | | | – | | | | 1,827 | | | | 426 | | | | 972 | | | | 1,782 | | | | 5,007 | |
Marius Kloppers (9) | | | 2013 | | | | 1,906 | | | | 1,442 | | | | 76 | | | | – | | | | 3,424 | | | | 763 | | | | 1,590 | | | | 4,421 | | | | 10,198 | |
| | | 2012 | | | | 2,201 | | | | – | | | | 109 | | | | – | | | | 2,310 | | | | 880 | | | | 1,476 | | | | 5,155 | | | | 9,821 | |
Other GMC members | | | | | | | | | | | | | | | | | | | | | | | | | | | | | | | | | | | | | | | | |
Peter Beaven (9) | | | 2013 | | | | 143 | | | | 77 | | | | 1 | | | | – | | | | 221 | | | | 36 | | | | 69 | | | | 159 | | | | 485 | |
Alberto Calderon (9) | | | 2013 | | | | 981 | | | | 784 | | | | 41 | | | | – | | | | 1,806 | | | | 342 | | | | 1,574 | | | | 2,178 | | | | 5,900 | |
| | | 2012 | | | | 1,137 | | | | 603 | | | | 56 | | | | 175 | | | | 1,971 | | | | 398 | | | | 964 | | | | 2,442 | | | | 5,775 | |
Dean Dalla Valle (9) | | | 2013 | | | | 143 | | | | 60 | | | | – | | | | 100 | | | | 303 | | | | 35 | | | | 62 | | | | 119 | | | | 519 | |
Geoff Healy (9) | | | 2013 | | | | 77 | | | | – | | | | – | | | | – | | | | 77 | | | | 19 | | | | – | | | | – | | | | 96 | |
Mike Henry | | | 2013 | | | | 1,000 | | | | 817 | | | | 11 | | | | 700 | | | | 2,528 | | | | 250 | | | | 687 | | | | 1,231 | | | | 4,696 | |
| | | 2012 | | | | 592 | | | | 474 | | | | 14 | | | | 87 | | | | 1,167 | | | | 148 | | | | 298 | | | | 422 | | | | 2,035 | |
Graham Kerr | | | 2013 | | | | 1,000 | | | | 897 | | | | 4 | | | | – | | | | 1,901 | | | | 250 | | | | 642 | | | | 1,285 | | | | 4,078 | |
| | | 2012 | | | | 592 | | | | 474 | | | | 41 | | | | 161 | | | | 1,268 | | | | 148 | | | | 284 | | | | 528 | | | | 2,228 | |
Jane McAloon (9) | | | 2013 | | | | 106 | | | | 41 | | | | – | | | | – | | | | 147 | | | | 27 | | | | 42 | | | | 76 | | | | 292 | |
Daniel Malchuk (9) | | | 2013 | | | | 121 | | | | 51 | | | | 3 | | | | 475 | | | | 650 | | | | 31 | | | | 42 | | | | 64 | | | | 787 | |
Marcus Randolph (9) | | | 2013 | | | | 1,097 | | | | 853 | | | | 56 | | | | – | | | | 2,006 | | | | 372 | | | | 1,398 | | | | 2,190 | | | | 5,966 | |
| | | 2012 | | | | 1,271 | | | | 893 | | | | 58 | | | | – | | | | 2,222 | | | | 432 | | | | 1,114 | | | | 2,607 | | | | 6,375 | |
Jimmy Wilson (9) | | | 2013 | | | | 143 | | | | 75 | | | | – | | | | – | | | | 218 | | | | 35 | | | | 77 | | | | 159 | | | | 489 | |
Karen Wood | | | 2013 | | | | 1,005 | | | | 741 | | | | 16 | | | | – | | | | 1,762 | | | | 333 | | | | 740 | | | | 1,881 | | | | 4,716 | |
| | | 2012 | | | | 1,000 | | | | 561 | | | | 15 | | | | – | | | | 1,576 | | | | 344 | | | | 815 | | | | 1,951 | | | | 4,686 | |
J Michael Yeager (9) | | | 2013 | | | | 1,290 | | | | 885 | | | | 17 | | | | 99 | | | | 2,291 | | | | 462 | | | | 1,268 | | | | 2,554 | | | | 6,575 | |
| | | 2012 | | | | 1,281 | | | | – | | | | 20 | | | | 104 | | | | 1,405 | | | | 459 | | | | 856 | | | | 2,583 | | | | 5,303 | |
| | | | | | | | | | | | | | | | | | | | | | | | | | | | | | | | | | | | |
| | | | | | Short-term benefits | | | Post-
Employment
Benefits | | | Share-based payments | | | Total | |
US dollars (’000) | | Financial
year | | | Base
salary (1) | | | Annual cash
incentive(2) | | | Non-
monetary
benefits (3) | | | Other
benefits (4) | | | Retirement
benefits(5) | | | Value of STI
and Shareplus
awards(2)(6) | | | Value of LTI
awards(7) | | |
Executive Directors | | | | | | | | | | | | | | | | | | | | | | | | | | | | | | | | | | | | |
Andrew Mackenzie | | | FY2015 | | | | 1,700 | | | | 1,156 | | | | 145 | | | | – | | | | 425 | | | | 1,163 | | | | 2,345 | | | | 6,934 | |
| | | FY2014 | | | | 1,700 | | | | 1,568 | | | | 92 | | | | – | | | | 425 | | | | 992 | | | | 2,346 | | | | 7,123 | |
Other GMC Members | | | | | | | | | | | | | | | | | | | | | | | | | | | | | | | | | | | | |
Peter Beaven | | | FY2015 | | | | 1,000 | | | | 680 | | | | 32 | | | | 700 | | | | 250 | | | | 667 | | | | 1,259 | | | | 4,588 | |
| | | FY2014 | | | | 1,000 | | | | 850 | | | | 17 | | | | – | | | | 250 | | | | 588 | | | | 1,342 | | | | 4,047 | |
Tony Cudmore | | | FY2015 | | | | 750 | | | | 552 | | | | – | | | | – | | | | 188 | | | | 269 | | | | 312 | | | | 2,071 | |
| | | FY2014 | | | | 247 | | | | 223 | | | | – | | | | – | | | | 62 | | | | 30 | | | | 22 | | | | 584 | |
Tim Cutt | | | FY2015 | | | | 1,000 | | | | 816 | | | | 5 | | | | – | | | | 250 | | | | 787 | | | | 1,187 | | | | 4,045 | |
| | | FY2014 | | | | 1,000 | | | | 867 | | | | 12 | | | | 550 | | | | 250 | | | | 525 | | | | 1,173 | | | | 4,377 | |
Dean Dalla Valle | | | FY2015 | | | | 1,000 | | | | 680 | | | | – | | | | 58 | | | | 250 | | | | 657 | | | | 1,187 | | | | 3,832 | |
| | | FY2014 | | | | 1,000 | | | | 936 | | | | – | | | | – | | | | 250 | | | | 565 | | | | 1,173 | | | | 3,924 | |
Mike Fraser | | | FY2015 | | | | 428 | | | | 290 | | | | 9 | | | | – | | | | 107 | | | | 242 | | | | 302 | | | | 1,378 | |
| | | FY2014 | | | | 717 | | | | 656 | | | | 13 | | | | – | | | | 179 | | | | 284 | | | | 604 | | | | 2,453 | |
Geoff Healy | | | FY2015 | | | | 1,000 | | | | 816 | | | | 44 | | | | – | | | | 250 | | | | 555 | | | | 651 | | | | 3,316 | |
| | | FY2014 | | | | 1,000 | | | | 914 | | | | 29 | | | | – | | | | 250 | | | | 294 | | | | 271 | | | | 2,758 | |
Mike Henry | | | FY2015 | | | | 1,100 | | | | 757 | | | | 16 | | | | 58 | | | | 275 | | | | 830 | | | | 1,362 | | | | 4,398 | |
| | | FY2014 | | | | 1,083 | | | | 1,015 | | | | 20 | | | | – | | | | 271 | | | | 816 | | | | 1,365 | | | | 4,570 | |
Graham Kerr | | | FY2015 | | | | 277 | | | | 211 | | | | 21 | | | | – | | | | 69 | | | | 230 | | | | 244 | | | | 1,052 | |
| | | | | | | | | | | | | | | | | | | | | | | | | | | | | | | | | | | | |
| | | | | | Short-term benefits | | | Post-
Employment
Benefits | | | Share-based payments | | | Total | |
US dollars (’000) | | Financial
year | | | Base
salary (1) | | | Annual cash
incentive(2) | | | Non-
monetary
benefits (3) | | | Other
benefits (4) | | | Retirement
benefits(5) | | | Value of STI
and Shareplus
awards(2)(6) | | | Value of LTI
awards(7) | | |
| | | FY2014 | | | | 1,083 | | | | 1,006 | | | | 68 | | | | – | | | | 271 | | | | 828 | | | | 1,383 | | | | 4,639 | |
Jane McAloon | | | FY2015 | | | | 688 | | | | 523 | | | | – | | | | – | | | | 172 | | | | 1,002 | | | | 732 | | | | 3,117 | |
| | | FY2014 | | | | 750 | | | | 686 | | | | – | | | | – | | | | 188 | | | | 402 | | | | 796 | | | | 2,822 | |
Daniel Malchuk | | | FY2015 | | | | 1,000 | | | | 680 | | | | 33 | | | | – | | | | 250 | | | | 589 | | | | 1,057 | | | | 3,609 | |
| | | FY2014 | | | | 871 | | | | 797 | | | | 29 | | | | – | | | | 218 | | | | 441 | | | | 817 | | | | 3,173 | |
Athalie Williams | | | FY2015 | | | | 372 | | | | 294 | | | | – | | | | 580 | | | | 93 | | | | 57 | | | | 104 | | | | 1,500 | |
Jimmy Wilson | | | FY2015 | | | | 1,000 | | | | 816 | | | | – | | | | – | | | | 250 | | | | 739 | | | | 1,259 | | | | 4,064 | |
| | | FY2014 | | | | 1,000 | | | | 951 | | | | – | | | | – | | | | 250 | | | | 647 | | | | 1,342 | | | | 4,190 | |
Karen Wood | | | FY2015 | | | | 140 | | | | – | | | | – | | | | 665 | | | | 35 | | | | 814 | | | | 182 | | | | 1,836 | |
| | | FY2014 | | | | 1,000 | | | | 922 | | | | – | | | | – | | | | 250 | | | | 711 | | | | 1,542 | | | | 4,425 | |
| (1) | Base salaries are generally reviewed on 1 September each year, although during FY2013 changes were made at various times as a result of change to the GMC structure during the year. Amounts shown in this table reflect the amounts paid over the 12-month period from 1 July 2014 to 30 June each2015 (or for the relevant period that they were KMP, as set out above the table). No changes to salaries occurred during FY2015 except for Athalie Williams who was appointed to the GMC during the year pro-rated for time served on the GMC. All GMCa base salaries are expressed and denominated in US dollars. More detail on base salaries is provided in sections 6.2.10 and 6.3.2.salary of US$0.750 million. |
Section 4.3.3 and 4.4.15 for base salary policy and operation
| (2) | Annual cash incentive is the cash portion of STI awards earned in respect of performance during each financial year (or for the relevant period that they were KMP, as described in sections 6.2.10set out above the table). For Mike Fraser and 6.3.3. Section 6.3.3 showsGraham Kerr, South32 have assumed the STI award earned as a percentageobligation to deliver the whole of the maximum award, where the maximum possible award is 100 per cent. The remaining portion of the 100 per cent maximum has not been earned (i.e. it has been ‘forfeited’). The minimum possible value awarded is nil. Actual payments are made in September, once performance has been assessed, e.g. in September 2013 for FY2013 awards or upon cessation of employment if earlier. The equity portion of STI awards is described in footnote (6) below.FY2015 STI. |
Section 4.3.3, 4.4.6 and 4.4.15 for STI policy and operation and FY2015 STI outcomes
STI is provided half in cash and half in deferred equity (which are included in the share-based payments columns of the table). The minimum possible value awarded to each individual is nil. The maximum STI is 240 per cent of base salary (120 per cent in cash and 120 per cent in deferred equity). For FY2015, GMC members earned the following STI awards as a percentage of the maximum (the remaining portion has not been earned (i.e. has been ‘forfeited’)): Andrew Mackenzie 57 per cent, Peter Beaven 57 per cent, Tony Cudmore 61 per cent, Tim Cutt 68 per cent, Dean Dalla Valle 57 per cent, Mike Fraser 57 per cent, Geoff Healy 68 per cent, Mike Henry 57 per cent, Graham Kerr 63 per cent, Jane McAloon 63 per cent, Daniel Malchuk 57 per cent, Jimmy Wilson 68 per cent, and Athalie Williams 65 per cent. Karen Wood was not eligible to receive an STI award in FY2015 due to the timing of her departure from the Company.
| (3) | Non-monetary benefits are non-pensionable and include such items as health and other insurances and fees for tax return preparation (in(if required in multiple jurisdictions,jurisdictions). This item also includes the cost of domestic flights for Geoff Healey and for Graham Kerr as part of approved commuting arrangements, and travel for Mrs Mackenzie to a capped amount).accompany the CEO on business-related travel. |
| (4) | Other benefits are non-pensionable and includeincluded one-off relocation allowances (with no trailing entitlements) provided to Andrew Mackenzie, Mike HenryTim Cutt in FY2014 and Daniel Malchukto Peter Beaven and Athalie Williams in FY2015 in regard to their international relocations, and to Dean Dalla Valle and Mike Henry in FY2015 in regard to histheir domestic relocation. These allowances are provided under the Group’s global mobility policy and are ’one-off’ payments with no trailing entitlements.relocations. The amount shown as Other benefits also include paymentfor Karen Wood is the value of US$99,202 in lieu for leave accrued but not taken by Mr Yeager in FY2013, as US-based Group executives are not allowed to roll forwardstatutory annual leave and long service leave entitlements from one financial year topaid at the next.time of her retirement. |
| (5) | Retirement benefits are calculated as a percentage25 per cent of base salary for each GMC member, as set out in the table in section 6.3.2.member. |
| (6) | The percentage of the total remuneration for FY2013, which is made up of options and rights (excluding Geoff Healy who has not yet received any allocations), ranges from 13 per cent for Daniel Malchuk to 64 per cent for Alberto Calderon |
(7) | The amounts shown in this column are described below these footnotes. Theyvalue of STI awards includes the estimated IFRS fair value of STI awards provided as deferred equity or cash-settled share-based payments under the GIS, GSTIP and STIP. Awards may include awardsbe paid in the form of cash where the individual ceases employment prior to the scheduled allocation date of the awards, e.g. in December 2013 for FY2013 awards. Section 6.3.3 shows the STI awards earned as a percentage of the maximum award, where the maximum possible award is 100 per cent. The remaining portion of the 100 per cent maximum has not been earned (i.e. it has been ‘forfeited’)(in December 2015 for FY2015 awards). These share-based payments may also be forfeited after allocation in specific circumstances as described in section 6.2.104.3.8 and therefore, the minimum possible value of the awards is nil. The maximum possible value cannot be determined as it depends on future share price movements, but is estimated by the IFRS fair value used for accounting purposes in this table. At the date of this Annual Report, GMC members had not made their elections for Deferred Shares and/or Options in regard to FY2013 GIS awards. No GMC members elected to receive Options in respect of FY2012 awards. The actual number of Deferred Shares allocated in respect of FY2012 awards is shown in section 6.4.2. Section 6.4.7 also describes the Shareplus program and the rights to acquire Matching Shares are included as share-based remuneration in the table. |
| The IFRS fair value of the STI awards is estimated at grant date by discounting the total value of the shares that will be issued in the future using the risk-free interest rate for the period to the date of award. Participants who are provided with awards under the GIS are entitled to a DEP in lieu of the dividends that would have been payable on ordinary BHP Billiton shares over the period from the allocation date to the time they receive ordinary shares in BHP Billiton. Prior to FY2011 awards, a similar DEP entitlement applied to GSTIP awards. This is not the case with awards allocated since October 2011. From FY2011, there was a change in accounting policy to account for the DEP from cash-settled to equity-settled. STI awards are granted to |
| GMC participants following the relevant AGMs (awards to the CEO are subject to shareholder approval). If employment ceases prior to that scheduled allocation of equity awards, the value of the awards may be provided in cash, but would still be included in this column of the table. Once awarded, there is a vesting condition that requires participants to remain in employment for a further two years. Accordingly, the number of securities (if any) that will ultimately vest cannot be determined until the service period has been completed. The IFRS fair value of STI awards is apportioned to annual remuneration based on the expected future service period, which is normally three years (being the performance year in which the STI is earned and the subsequent two-year service period). The vesting of STI awards may be accelerated in the event of leaving the Group, in which case the expected future service period is amended; |
| The value of Shareplus awards includes the estimated IFRS fair value of rights to Matched Shares acquired during each share purchase period under the Shareplus program. These rights are acquired on each of the quarterly share purchase dates under the program (grant dates), and the IFRS fair value is apportioned to annual remuneration based on the future service period required for the Matched Shares to be allocated (i.e. the vesting date of the rights). Where entitlements to the Matched Shares are accelerated on leaving the Group, the expected future service period is amended. |
Section 4.4.20, 4.4.23 and 4.4.26 for the actual numbers of awards allocated to and held by members of the GMC
(8)(7) | The amounts shown in this columnvalue of LTI awards includes the estimated IFRS fair value of awards provided under the LTIP, MAP and as Transitional GMC awards which are described below these footnotes. Section 6.3.4 shows the LTI provideddefined as a percentage of the maximum award, where the maximum possible award is 100 per cent. The remaining portion of the 100 per cent maximum has not been earned (i.e. it has been ‘forfeited’).equity-settled share-based payments. These share-based payments may also be forfeited after allocation in specific circumstances as described in section 6.2.104.3.8 and therefore the minimum possible value of the awards is nil. The maximum possible value cannot be determined as it depends on future share price movements, but is estimated by the IFRS fair value used for accounting purposes in this table. Details |
| The amount in respect of individualeach award under the LTIP is the estimated IFRS fair value of the award as determined by Kepler Associates using a Monte Carlo simulation methodology taking account of the performance condition, the term of the award, the share price at grant date, the expected price volatility of the underlying share, the risk-free interest rate for the term of the award and the value of the DEP that will be received on exercise of the award. The IFRS fair value of each award is apportioned to annual remuneration in equal amounts to each of the years in the expected future service period, which is normally five years. Where entitlements to LTI awards are set out inpreserved on leaving the table in section 6.4.3 and 6.4.6. Group, the expected future service period is amended. |
Section 4.4.21, 4.4.22 and 4.4.24 for the actual numbers of awards allocated to and held by members of the GMC
| This column also includes thean amount allocated to remuneration for each yearin FY2014 and in FY2015 in respect of awards received by Mr Mackenzie on commencement of employment with BHP Billiton, the vesting outcomes of which are described in section 6.3.4. These awards, are in the form of Performance Shares allocated on 4 December 2008 as shown in the table in section 6.4.3 and conditional rights to receive cash sums under two phantom awards, which are treated as cash-settled share-based payments and are included in this column for the purposes of remuneration.vested during FY2013. The awards were approved by the Remuneration Committee for the purposes of compensating Mr Mackenzie for awards forgone by him as a result of leaving his former employer. The awards were subject to performance and/or service conditions. Thefinal value and nature of the awards werewill be determined byat the Committee as being an equivalent fair value astime that forgone by Mr Mackenzie underchooses to redeem the at risk remuneration arrangements operated by his former employer. In valuing the awards, the Committee sought the advice of its independent adviser, Kepler Associates.award, and this column will incorporate an annual true-up amount until that time. Full details of the awardsaward and the relevant terms and conditions were disclosedprovided in the FY2009FY2013 Annual Report. |
(9) | All remuneration details for FY2013 are for the part of the year relating to service as members of the GMC. This includes the amount of base salary and retirement benefits provided for the part of the year as members of the GMC, and the relevant portions of non-monetary benefits and of annual relocation allowances which were paid in relation to international moves prior to their appointment as members of the GMC. The amount shown as annual cash incentive is the amount of cash STI paid for performance for the period as GMC members. The amounts included in share-based payments include the amortised IFRS fair value of awards provided under the MAP and GSTIP equity plans and as Shareplus Matched Shares prior to appointment as members of the GMC. |
The value of STI and Shareplus awards shown in the table includes:
the estimated IFRS fair value of Deferred Shares and Options provided as equity or cash settled share-based payments under the GIS and GSTIP as shown in sections 6.4.2 and 6.4.5. The IFRS fair value of the Deferred Shares and Options is estimated at grant date by discounting the total value of the shares that will be issued in the future using the risk-free interest rate for the period to the date of award. Participants who are provided with awards under the GIS are entitled to a DEP in lieu of the dividends that would have been payable on ordinary BHP Billiton shares over the period from the allocation date to the time their award vests or is exercised and they receive ordinary shares in BHP Billiton. Prior to FY2011 awards, a similar DEP entitlement applied to GSTIP Deferred Shares and Options. This is not the case with awards allocated since October 2011. From FY2011, there was a change in accounting policy to account for the DEP from cash-settled to equity-settled. Deferred Shares and Options are awarded to participants following the relevant AGMs (awards to the CEO are subject to shareholder approval). If employment ceases prior to that scheduled allocation of equity awards, the value of the awards may be provided in cash, but would still be included in this column of table 6.4.1. Once awarded, the only vesting condition is for participants to remain in employment for two further years. Accordingly, the number of securities (if any) that will ultimately vest cannot be determined until the service period has been completed. The estimated IFRS fair value of the Deferred Shares and Options forms part of the STI at risk remuneration appearing throughout this Remuneration Report. The IFRS fair value of Deferred Shares and Options is apportioned to annual remuneration based on the expected future service period, which is normally three years. The vesting of Deferred Shares and Options may be accelerated in the event of leaving the Group, in which case the expected future service period is amended;
the estimated IFRS fair value of rights to Matching Shares acquired during each share purchase period under the Shareplus program, as described in section 6.4.7. These rights are acquired on each of the quarterly share purchase dates under the program (grant dates), and the IFRS fair value is apportioned to annual remuneration based on the future service period required for the Matching Shares to be allocated (i.e. the vesting date of the rights). Where entitlements to the Matching Shares are accelerated on leaving the Group, the expected future service period is amended.
The value of LTI awards shown in the table includes:
Performance Shares allocated under the LTIP, Restricted Shares under the MAP and Performance-conditional Restricted Shares awarded as Transitional GMC grants as shown in sections 6.4.3, 6.4.4 and 6.4.6 are defined as equity-settled share-based payments. The amount in respect of each LTI award is the estimated IFRS fair value of the Performance Shares as determined by Kepler Associates using a Monte Carlo simulation methodology taking account of the performance hurdle, the term of the award, the share price at grant date, the expected price volatility of the underlying share, the risk-free interest rate for the term of the award and the value of the DEP that will be received on exercise of the award. The IFRS fair value of each award is apportioned to annual remuneration in equal amounts to each of the years in the expected future service period, which is normally five years. Where entitlements to Performance Shares are preserved on leaving the Group, the expected future service period is amended.
Equity awards
The following sections set out the interests held by members of the GMC under the Group’s employee equity plans. Each equity award is a conditional right to acquire one ordinary share in BHP Billiton Limited or in BHP Billiton Plc upon satisfaction of the vesting conditions. The vesting conditions will include performance and/or service requirements as relevant to the purpose of the award and as described in each of the following sections. The value of awards over BHP Billiton Limited shares is shown in Australian dollars and the value of securitiesawards over BHP Billiton Plc shares is shown in Sterling.pounds sterling for awards over shares on the LSE and in South African rand for awards over shares on the JSE. TheSecurities Dealing GLD governs and restricts dealing arrangements and the provision of shares on vesting or exercise of awards.
Dividend Equivalent Payments
The awards are not ordinary shares and do not carry entitlements to ordinary dividends or other shareholder rights. Dividends are not received by the executives during the vesting period. Unless stated otherwise inFor awards provided under the
following sections, GIS, STIP and LTIP, a DEP (as described in section 6.2.10) is provided to cover dividends that would have been payable on ordinary BHP Billiton shares over the period between grant andfrom the provisionallocation date to the time that the holder receives ordinary shares in BHP Billiton in respect of the ordinary shares to the holder.award (on vesting or on exercise). A DEP is only provided in relation to awards that have vested upon satisfaction of the relevant conditions. This payment is not made in relation to any securities that are forfeited duringor lapse.
Impact of the vesting period.demerger of South32 on BHP Billiton employee equity plans
The Securities Dealing Group Level Document governsBoard and restricts dealing arrangementsRemuneration Committee gave careful consideration as to how the demerger would affect employees who participated in these plans at the time of the demerger. The Board considered it important that any changes to these plans as a result of the demerger were fair to shareholders and at the provisionsame time ensured that employees continued to be appropriately treated.
The treatment of sharesa GMC member’s unvested awards at the time of the demerger is that the numbers of unvested awards under the STIP, GIS, LTIP, MAP and GSTIP and those provided as Transitional GMC awards were adjusted to reflect the reduction in the value of BHP Billiton after South32 demerged. In relation to unvested awards under Shareplus, the GMC members received no adjustment in the number of their previously accumulated holdings.
The new number of unvested awards for each GMC member under the STIP, GIS, LTIP, MAP, GSTIP and those provided as Transitional GMC awards equals the number of awards held before the demerger multiplied by ((BHP Billiton five-day VWAP plus South32 five-day VWAP) divided by BHP Billiton five-day VWAP).
Prices were based on vesting or exercisethe first five trading days following South32’s listing on the relevant exchanges on 18 May 2015. The value of awards.the calculation, the Uplift factor, on each exchange is 1.0765 (ASX), 1.0804 (LSE) and 1.0792 (JSE).
The additional awards are represented in the column headed ‘Uplift’ in the following tables.
Equity awards provided for GMC service
6.4.24.4.20 STI awards of Deferred Shares and Options under the STIP and GIS
Awards under the GIS will not deliver any value to the holder for at least two years from the beginning of the financial year in which they are granted (unless the executive’s employment with the Group ends earlier in specific circumstances, such as on death, serious injury, disability or illness, retirement with the agreement of the CompanyBHP Billiton and redundancy/retrenchment).
In 2013 a new STIP was approved which applied from FY2014. Awards were allocated under the STIP in December 2014. The terms and conditions of the GISnew STIP are largely the same as those of the new STIP, as set out in section 6.2.10, which will replace the GIS from FY2014. The main differences as noted throughout section 6.2.10 are:
the maximum potential award under the GIS is 320 per cent of base salary (240 per cent under the new STIP);
DEP is provided in cash under the GIS (intended to be provided in shares under the new STIP);
GIS awards vest in full on cessation of employment in circumstances, including retirement and redundancy (awards remain unvested under the new STIP until the scheduled vesting time);
the malus and clawback provisions are strengthened in the new STIP.
Each employee may nominate to receive GIS awards in the form of Options or in the form of Deferred Shares or a combination thereof. The Options have an exercise price determined by the weighted average price at which BHP Billiton shares were traded over the one week up to and including the date of grant. This is the amount payable by the individual to exercise each Option. A greater number of Options are therefore allocated if an executive chooses this alternative.GIS.
| | | | | | | | | | | | | | | | | | | | | | | | | | | | | | | | | | | | | | | | | | | | | | | | | | | | | | | | |
Name | | Date of grant | | | Option
exercise
price
payable | | | At
1 July
2012 | | | Granted | | | Vested | | | Lapsed | | | Exercised | | | At
30 June
2013 | | | Date award
may vest
and become
exercisable (1) | | | Market
price on
date of
grant (2) | | | Market
price on
date of
vesting (3) | | | Market
price on
date of
exercise (4) | | | Aggregate
gain on
awards
(’000) (4) | | | DEP on
awards
(’000) (5) | |
Executive Director | | | | | | | | | | | | | | | | | | | | | | | | | | | | | | | | | | | | | | | | | | | | | | | | | | | | | | | | |
Andrew Mackenzie(6) | | | 5 Dec 2012 | | | | – | | | | – | | | | 20,023 | | | | – | | | | – | | | | – | | | | 20,023 | | | | Aug 2014 | | | | £19.98 | | | | – | | | | – | | | | – | | | | – | |
| | | 5 Dec 2011 | | | | – | | | | 39,230 | | | | – | | | | – | | | | – | | | | – | | | | 39,230 | | | | Aug 2013 | | | | £20.12 | | | | – | | | | – | | | | – | | | | – | |
| | | 6 Dec 2010 | | | | – | | | | 22,700 | | | | – | | | | 22,700 | | | | – | | | | 22,700 | | | | – | | | | 2 Oct 2012 | | | | £24.40 | | | | £19.45 | | | | £19.45 | | | | £442 | | | | US$46 | |
| | | 6 Dec 2010 | | | | £23.71 | | | | 30,389 | | | | – | | | | 30,389 | | | | – | | | | – | | | | 30,389 | | | | 2 Oct 2012 | | | | £24.40 | | | | £19.45 | | | | – | | | | – | | | | – | |
| | | 16 Dec 2009 | | | | £18.68 | | | | 16,119 | | | | – | | | | – | | | | – | | | | – | | | | 16,119 | | |
| 25 Aug
2011 |
| | | £19.06 | | | | £19.60 | | | | – | | | | – | | | | – | |
| | | | | | | | | | | | | | | | | | | | | | | | | | | | | | | | | | | | | | | | | | | | | | | | | | | | | | | | |
Total | | | 108,438 | | | | 20,023 | | | | 53,089 | | | | – | | | | 22,700 | | | | 105,761 | | | | | | | | | | | | | | | | | | | | | | | | | |
| | | | | | | | | | | | | | | | | | | | | | | | | | | | | | | | | | | | | | | | | | | | | | | | | | | | | | | | |
Marius Kloppers (6) | | | 5 Dec 2011 | | | | – | | | | 64,705 | | | | – | | | | – | | | | – | | | | – | | | | 64,705 | | | | Aug 2013 | | | | A$37.26 | | | | – | | | | – | | | | – | | | | – | |
| | | 6 Dec 2010 | | | | – | | | | 54,831 | | | | – | | | | 54,831 | | | | – | | | | 54,831 | | | | – | | | | 2 Oct 2012 | | | | A$44.53 | | | | A$33.54 | | | | A$33.43 | | | | A$1,833 | | | | US$110 | |
| | | | | | | | | | | | | | | | | | | | | | | | | | | | | | | | | | | | | | | | | | | | | | | | | | | | | | | | |
Total | | | 119,536 | | | | – | | | | 54,831 | | | | – | | | | 54,831 | | | | 64,705 | | | | | | | | | | | | | | | | | | | | | | | | | |
| | | | | | | | | | | | | | | | | | | | | | | | | | | | | | | | | | | | | | | | | | | | | | | | | | | | | | | | |
Other members of the GMC | | | | | | | | | | | | | | | | | | | | | | | | | | | | | | | | | | | | | | | | | | | | | | | | | | | | | |
Alberto Calderon(7)/(8) | | | 5 Dec 2012 | | | | – | | | | – | | | | 19,187 | | | | – | | | | – | | | | – | | | | 19,187 | | | | Aug 2014 | | | | £19.98 | | | | – | | | | – | | | | – | | | | – | |
| | | 5 Dec 2011 | | | | – | | | | 38,939 | | | | – | | | | – | | | | – | | | | – | | | | 38,939 | | | | Aug 2013 | | | | £20.12 | | | | – | | | | – | | | | – | | | | – | |
| | | 6 Dec 2010 | | | | – | | | | 14,197 | | | | – | | | | 14,197 | | | | – | | | | 14,197 | | | | – | | | | 2 Oct 2012 | | | | £24.40 | | | | £19.45 | | | | £19.45 | | | | £276 | | | | US$29 | |
| | | 6 Dec 2010 | | | | – | | | | 16,298 | | | | – | | | | 16,298 | | | | – | | | | 16,298 | | | | – | | | | 2 Oct 2012 | | | | £24.40 | | | | £19.45 | | | | £21.51 | | | | £321 | | | | US$42 | |
| | | | | | | | | | | | | | | | | | | | | | | | | | | | | | | | | | | | | | | | | | | | | | | | | | | | | | | | |
Total | | | 69,434 | | | | 19,187 | | | | 30,495 | | | | – | | | | 30,495 | | | | 58,126 | | | | | | | | | | | | | | | | | | | | | | | | | |
| | | | | | | | | | | | | | | | | | | | | | | | | | | | | | | | | | | | | | | | | | | | | | | | | | | | | | | | |
Mike Henry | | | 5 Dec 2012 | | | | – | | | | – | | | | 15,058 | | | | – | | | | – | | | | – | | | | 15,058 | | | | Aug 2014 | | | | £19.98 | | | | – | | | | – | | | | – | | | | – | |
| | | | | | | | | | | | | | | | | | | | | | | | | | | | | | | | | | | | | | | | | | | | | | | | | | | | | | | | |
Total | | | – | | | | 15,058 | | | | – | | | | – | | | | – | | | | 15,058 | | | | | | | | | | | | | | | | | | | | | | | | | |
| | | | | | | | | | | | | | | | | | | | | | | | | | | | | | | | | | | | | | | | | | | | | | | | | | | | | | | | |
Graham Kerr | | | 5 Dec 2012 | | | | – | | | | – | | | | 13,230 | | | | – | | | | – | | | | – | | | | 13,230 | | | | Aug 2014 | | | | A$34.29 | | | | – | | | | – | | | | – | | | | – | |
| | | | | | | | | | | | | | | | | | | | | | | | | | | | | | | | | | | | | | | | | | | | | | | | | | | | | | | | |
Total | | | – | | | | 13,230 | | | | – | | | | – | | | | – | | | | 13,230 | | | | | | | | | | | | | | | | | | | | | | | | | |
| | | | | | | | | | | | | | | | | | | | | | | | | | | | | | | | | | | | | | | | | | | | | | | | | | | | | | | | |
Marcus Randolph(9) | | | 5 Dec 2012 | | | | – | | | | – | | | | 24,939 | | | | – | | | | – | | | | – | | | | 24,939 | | | | Aug 2014 | | | | A$34.29 | | | | – | | | | – | | | | – | | | | – | |
| | | 5 Dec 2011 | | | | – | | | | 36,824 | | | | – | | | | – | | | | – | | | | – | | | | 36,824 | | | | Aug 2013 | | | | A$37.26 | | | | – | | | | – | | | | – | | | | – | |
| | | 6 Dec 2010 | | | | – | | | | 30,819 | | | | – | | | | 30,819 | | | | – | | | | 30,819 | | | | – | | | | 2 Oct 2012 | | | | A$44.53 | | | | A$33.54 | | | | A$33.54 | | | | A$1,034 | | | | US$62 | |
| | | | | | | | | | | | | | | | | | | | | | | | | | | | | | | | | | | | | | | | | | | | | | | | | | | | | | | | |
Total | | | 67,643 | | | | 24,939 | | | | 30,819 | | | | – | | | | 30,819 | | | | 61,763 | | | | | | | | | | | | | | | | | | | | | | | | | |
| | | | | | | | | | | | | | | | | | | | | | | | | | | | | | | | | | | | | | | | | | | | | | | | | | | | | | | | |
Karen Wood | | | 5 Dec 2012 | | | | – | | | | – | | | | 15,685 | | | | – | | | | – | | | | – | | | | 15,685 | | | | Aug 2014 | | | | A$34.29 | | | | – | | | | – | | | | – | | | | – | |
| | | 5 Dec 2011 | | | | – | | | | 28,539 | | | | – | | | | – | | | | – | | | | – | | | | 28,539 | | | | Aug 2013 | | | | A$37.26 | | | | – | | | | – | | | | – | | | | – | |
| | | 6 Dec 2010 | | | | – | | | | 23,197 | | | | – | | | | 23,197 | | | | – | | | | 23,197 | | | | – | | | | 2 Oct 2012 | | | | A$44.53 | | | | A$33.54 | | | | A$33.54 | | | | A$778 | | | | US$47 | |
| | | | | | | | | | | | | | | | | | | | | | | | | | | | | | | | | | | | | | | | | | | | | | | | | | | | | | | | |
Total | | | 51,736 | | | | 15,685 | | | | 23,197 | | | | – | | | | 23,197 | | | | 44,224 | | | | | | | | | | | | | | | | | | | | | | | | | |
| | | | | | | | | | | | | | | | | | | | | | | | | | | | | | | | | | | | | | | | | | | | | | | | | | | | | | | | |
J Michael Yeager | | | 5 Dec 2011 | | | | – | | | | 37,779 | | | | – | | | | – | | | | – | | | | – | | | | 37,779 | | | | Aug 2013 | | | | A$37.26 | | | | – | | | | – | | | | – | | | | – | |
| | | 6 Dec 2010 | | | | – | | | | 31,442 | | | | – | | | | 31,442 | | | | – | | | | 31,442 | | | | – | | | | 2 Oct 2012 | | | | A$44.53 | | | | A$33.54 | | | | A$33.54 | | | | A$1,055 | | | | US$63 | |
| | | | | | | | | | | | | | | | | | | | | | | | | | | | | | | | | | | | | | | | | | | | | | | | | | | | | | | | |
Total | | | | | | | 69,221 | | | | – | | | | 31,442 | | | | – | | | | 31,442 | | | | 37,779 | | | | | | | | | | | | | | | | | | | | | | | | | |
| | | | | | | | | | | | | | | | | | | | | | | | | | | | | | | | | | | | | | | | | | | | | | | | | | | | | | | | |
| | | | | | | | | | | | | | | | | | | | | | | | | | | | | | | | | | | | | | | | | | | | | | | | | | | | | | | | | | | | |
Name | | Date of grant (1) | | | Option
Exercise
price
payable (2) | | | At
1 July
2014 | | | Granted | | | Uplift | | | Vested | | | Lapsed | | | Exercised | | | At
30 June
2015 | | | Award
vesting
date (3) | | | Market
price on
date of
grant (4) | | | Market
price on
date of
vesting (5) | | | Market
price on
date of
exercise (6) | | | Aggregate
gain on
awards
(’000) (6) | | | DEP on
awards
(’000) (7) | |
Andrew Mackenzie | | | 19-Dec-2014 | | | | – | | | | – | | | | 68,301 | | | | 5,226 | | | | – | | | | – | | | | – | | | | 73,527 | | | | Aug 2016 | | | | A$28.98 | | | | – | | | | – | | | | – | | | | – | |
| | | 18-Dec-2013 | | | | – | | | | 28,157 | | | | – | | | | 2,155 | | | | – | | | | – | | | | – | | | | 30,312 | | | | Aug 2015 | | | | A$35.79 | | | | – | | | | – | | | | – | | | | – | |
| | | 05-Dec-2012 | | | | – | | | | 20,023 | | | | – | | | | – | | | | 20,023 | | | | – | | | | 20,023 | | | | – | | | | 20-Aug-2014 | | | | £19.98 | | | | £19.65 | | | | £19.52 | | | | £391 | | | | US$46 | |
| | | 06-Dec-2010 | | | £ | 23.71 | | | | 30,389 | | | | – | | | | – | | | | – | | | | – | | | | – | | | | 30,389 | | | | 02-Oct-2012 | | | | £24.40 | | | | £19.45 | | | | – | | | | – | | | | – | |
| | | | | | | | | | | | | | | | | | | | | | | | | | | | | | | | | | | | | | | | | | | | | | | | | | | | | | | | | | | | |
| | | | | | | | | | | 78,569 | | | | 68,301 | | | | 7,381 | | | | 20,023 | | | | – | | | | 20,023 | | | | 134,228 | | | | | | | | | | | | | | | | | | | | | | | | | |
| | | | | | | | | | | | | | | | | | | | | | | | | | | | | | | | | | | | | | | | | | | | | | | | | | | | | | | | | | | | |
Peter Beaven | | | 19-Dec-2014 | | | | – | | | | – | | | | 37,006 | | | | 2,831 | | | | – | | | | – | | | | – | | | | 39,837 | | | | Aug 2016 | | | | A$28.98 | | | | – | | | | – | | | | – | | | | – | |
| | | 18-Dec-2013 | | | | – | | | | 2,423 | | | | – | | | | 186 | | | | – | | | | – | | | | – | | | | 2,609 | | | | Aug 2015 | | | | A$35.79 | | | | – | | | | – | | | | – | | | | – | |
| | | | | | | | | | | | | | | | | | | | | | | | | | | | | | | | | | | | | | | | | | | | | | | | | | | | | | | | | | | | |
| | | | | | | | | | | 2,423 | | | | 37,006 | | | | 3,017 | | | | – | | | | – | | | | – | | | | 42,446 | | | | | | | | | | | | | | | | | | | | | | | | | |
| | | | | | | | | | | | | | | | | | | | | | | | | | | | | | | | | | | | | | | | | | | | | | | | | | | | | | | | | | | | |
Tony Cudmore | | | 19-Dec-2014 | | | | – | | | | – | | | | 9,734 | | | | 745 | | | | – | | | | – | | | | – | | | | 10,479 | | | | Aug 2016 | | | | A$28.98 | | | | – | | | | – | | | | – | | | | – | |
| | | | | | | | | | | | | | | | | | | | | | | | | | | | | | | | | | | | | | | | | | | | | | | | | | | | | | | | | | | | |
| | | | | | | | | | | – | | | | 9,734 | | | | 745 | | | | – | | | | – | | | | – | | | | 10,479 | | | | | | | | | | | | | | | | | | | | | | | | | |
| | | | | | | | | | | | | | | | | | | | | | | | | | | | | | | | | | | | | | | | | | | | | | | | | | | | | | | | | | | | |
Tim Cutt | | | 19-Dec-2014 | | | | – | | | | – | | | | 37,772 | | | | 2,890 | | | | – | | | | – | | | | – | | | | 40,662 | | | | Aug 2016 | | | | A$28.98 | | | | – | | | | – | | | | – | | | | – | |
| | | | | | | | | | | | | | | | | | | | | | | | | | | | | | | | | | | | | | | | | | | | | | | | | | | | | | | | | | | | |
| | | | | | | | | | | – | | | | 37,772 | | | | 2,890 | | | | – | | | | – | | | | – | | | | 40,662 | | | | | | | | | | | | | | | | | | | | | | | | | |
| | | | | | | | | | | | | | | | | | | | | | | | | | | | | | | | | | | | | | | | | | | | | | | | | | | | | | | | | | | | |
Dean Dalla Valle | | | 19-Dec-2014 | | | | – | | | | – | | | | 40,769 | | | | 3,119 | | | | – | | | | – | | | | – | | | | 43,888 | | | | Aug 2016 | | | | A$28.98 | | | | – | | | | – | | | | – | | | | – | |
| | | 18-Dec-2013 | | | | – | | | | 1,895 | | | | – | | | | 145 | | | | – | | | | – | | | | – | | | | 2,040 | | | | Aug 2015 | | | | A$35.79 | | | | – | | | | – | | | | – | | | | – | |
| | | | | | | | | | | | | | | | | | | | | | | | | | | | | | | | | | | | | | | | | | | | | | | | | | | | | | | | | | | | |
| | | | | | | | | | | 1,895 | | | | 40,769 | | | | 3,264 | | | | – | | | | – | | | | – | | | | 45,928 | | | | | | | | | | | | | | | | | | | | | | | | | |
| | | | | | | | | | | | | | | | | | | | | | | | | | | | | | | | | | | | | | | | | | | | | | | | | | | | | | | | | | | | |
Geoff Healy | | | 19-Dec-2014 | | | | – | | | | – | | | | 39,828 | | | | 3,047 | | | | – | | | | – | | | | – | | | | 42,875 | | | | Aug 2016 | | | | A$28.98 | | | | – | | | | – | | | | – | | | | – | |
| | | | | | | | | | | | | | | | | | | | | | | | | | | | | | | | | | | | | | | | | | | | | | | | | | | | | | | | | | | | |
| | | | | | | | | | | – | | | | 39,828 | | | | 3,047 | | | | – | | | | – | | | | – | | | | 42,875 | | | | | | | | | | | | | | | | | | | | | | | | | |
| | | | | | | | | | | | | | | | | | | | | | | | | | | | | | | | | | | | | | | | | | | | | | | | | | | | | | | | | | | | |
Mike Henry | | | 19-Dec-2014 | | | | – | | | | – | | | | 44,194 | | | | 3,381 | | | | – | | | | – | | | | – | | | | 47,575 | | | | Aug 2016 | | | | A$28.98 | | | | – | | | | – | | | | – | | | | – | |
| | | 18-Dec-2013 | | | | – | | | | 25,594 | | | | – | | | | 1,958 | | | | – | | | | – | | | | – | | | | 27,552 | | | | Aug 2015 | | | | A$35.79 | | | | – | | | | – | | | | – | | | | – | |
| | | 05-Dec-2012 | | | | – | | | | 15,058 | | | | – | | | | – | | | | 15,058 | | | | – | | | | 15,058 | | | | – | | | | 20-Aug-2014 | | | | £19.98 | | | | £19.65 | | | | £19.52 | | | | £294 | | | | US$35 | |
| | | | | | | | | | | | | | | | | | | | | | | | | | | | | | | | | | | | | | | | | | | | | | | | | | | | | | | | | | | | |
| | | | | | | | | | | 40,652 | | | | 44,194 | | | | 5,339 | | | | 15,058 | | | | – | | | | 15,058 | | | | 75,127 | | | | | | | | | | | | | | | | | | | | | | | | | |
| | | | | | | | | | | | | | | | | | | | | | | | | | | | | | | | | | | | | | | | | | | | | | | | | | | | | | | | | | | | |
Graham Kerr(8) | | | 18-Dec-2013 | | | | – | | | | 28,101 | | | | – | | | | – | | | | – | | | | – | | | | – | | | | 28,101 | | | | Aug 2015 | | | | A$35.79 | | | �� | – | | | | – | | | | – | | | | – | |
| | | 05-Dec-2012 | | | | – | | | | 13,230 | | | | – | | | | – | | | | 13,230 | | | | – | | | | 13,230 | | | | – | | | | 20-Aug-2014 | | | | A$34.29 | | | | A$38.13 | | | | A$38.34 | | | | A$507 | | | | US$31 | |
| | | | | | | | | | | | | | | | | | | | | | | | | | | | | | | | | | | | | | | | | | | | | | | | | | | | | | | | | | | | |
| | | | | | | | | | | 41,331 | | | | – | | | | – | | | | 13,230 | | | | – | | | | 13,230 | | | | 28,101 | | | | | | | | | | | | | | | | | | | | | | | | | |
| | | | | | | | | | | | | | | | | | | | | | | | | | | | | | | | | | | | | | | | | | | | | | | | | | | | | | | | | | | | |
Jane McAloon (8) | | | 19-Dec-2014 | | | | – | | | | – | | | | 29,871 | | | | 2,286 | | | | – | | | | – | | | | – | | | | 32,157 | | | | Aug 2016 | | | | A$28.98 | | | | – | | | | – | | | | – | | | | – | |
| | | 18-Dec-2013 | | | | – | | | | 1,270 | | | | – | | | | 98 | | | | – | | | | – | | | | – | | | | 1,368 | | | | Aug 2015 | | | | A$35.79 | | | | – | | | | – | | | | – | | | | – | |
| | | | | | | | | | | | | | | | | | | | | | | | | | | | | | | | | | | | | | | | | | | | | | | | | | | | | | | | | | | | |
| | | | | | | | | | | 1,270 | | | | 29,871 | | | | 2,384 | | | | – | | | | – | | | | – | | | | 33,525 | | | | | | | | | | | | | | | | | | | | | | | | | |
| | | | | | | | | | | | | | | | | | | | | | | | | | | | | | | | | | | | | | | | | | | | | | | | | | | | | | | | | | | | |
Daniel Malchuk | | | 19-Dec-2014 | | | | – | | | | – | | | | 34,735 | | | | 2,658 | | | | – | | | | – | | | | – | | | | 37,393 | | | | Aug 2016 | | | | A$28.98 | | | | – | | | | – | | | | – | | | | – | |
| | | 18-Dec-2013 | | | | – | | | | 1,598 | | | | – | | | | 123 | | | | – | | | | – | | | | – | | | | 1,721 | | | | Aug 2015 | | | | A$35.79 | | | | – | | | | – | | | | – | | | | – | |
| | | | | | | | | | | | | | | | | | | | | | | | | | | | | | | | | | | | | | | | | | | | | | | | | | | | | | | | | | | | |
| | | | | | | | | | | 1,598 | | | | 34,735 | | | | 2,781 | | | | – | | | | – | | | | – | | | | 39,114 | | | | | | | | | | | | | | | | | | | | | | | | | |
| | | | | | | | | | | | | | | | | | | | | | | | | | | | | | | | | | | | | | | | | | | | | | | | | | | | | | | | | | | | |
| | | | | | | | | | | | | | | | | | | | | | | | | | | | | | | | | | | | | | | | | | | | | | | | | | | | | | | | | | | | |
Name | | Date of grant (1) | | | Option
Exercise
price
payable (2) | | | At
1 July
2014 | | | Granted | | | Uplift | | | Vested | | | Lapsed | | | Exercised | | | At
30 June
2015 | | | Award
vesting
date (3) | | | Market
price on
date of
grant (4) | | | Market
price on
date of
vesting (5) | | | Market
price on
date of
exercise (6) | | | Aggregate
gain on
awards
(’000) (6) | | | DEP on
awards
(’000) (7) | |
Jimmy Wilson | | | 19-Dec-2014 | | | | – | | | | – | | | | 41,431 | | | | 3,170 | | | | – | | | | – | | | | – | | | | 44,601 | | | | Aug 2016 | | | | A$28.98 | | | | – | | | | – | | | | – | | | | – | |
| | | 18-Dec-2013 | | | | – | | | | 2,360 | | | | – | | | | 181 | | | | – | | | | – | | | | – | | | | 2,541 | | | | Aug 2015 | | | | A$35.79 | | | | – | | | | – | | | | – | | | | – | |
| | | | | | | | | | | | | | | | | | | | | | | | | | | | | | | | | | | | | | | | | | | | | | | | | | | | | | | | | | | | |
| | | | | | | | | | | 2,360 | | | | 41,431 | | | | 3,351 | | | | – | | | | – | | | | – | | | | 47,142 | | | | | | | | | | | | | | | | | | | | | | | | | |
| | | | | | | | | | | | | | | | | | | | | | | | | | | | | | | | | | | | | | | | | | | | | | | | | | | | | | | | | | | | |
Karen Wood(8) | | | 18-Dec-2013 | | | | – | | | | 23,231 | | | | – | | | | – | | | | 23,231 | | | | – | | | | 23,231 | | | | – | | | | 20-Aug-2014 | | | | A$35.79 | | | | A$38.13 | | | | A$38.34 | | | | A$886 | | | | US$27 | |
| | | 05-Dec-2012 | | | | – | | | | 15,685 | | | | – | | | | – | | | | 15,685 | | | | – | | | | 15,685 | | | | – | | | | 20-Aug-2014 | | | | A$34.29 | | | | A$38.13 | | | | A$38.34 | | | | A$601 | | | | US$36 | |
| | | | | | | | | | | | | | | | | | | | | | | | | | | | | | | | | | | | | | | | | | | | | | | | | | | | | | | | | | | | |
| | | | | | | | | | | 38,916 | | | | – | | | | – | | | | 38,916 | | | | – | | | | 38,916 | | | | – | | | | | | | | | | | | | | | | | | | | | | | | | |
| | | | | | | | | | | | | | | | | | | | | | | | | | | | | | | | | | | | | | | | | | | | | | | | | | | | | | | | | | | | |
| (1) | The holding period for each award ends on 30 June inFrom December 2014 all awards are made under the yearSTIP. Awards made December 2013 and prior were made under the award ‘may vest and become exercisable’ if the conditions for vesting are met (including the relevant service conditions). GIS. |
| (2) | Under the GIS, rules,each employee could nominate to receive a portion of their award in the form of options with a market-based exercise price. Where an individual has made this choice, the option exercise price payable is shown. The exercise price is determined by the weighted average price at which BHP Billiton shares were traded over the one week up to and including the date of grant. A greater number of options were allocated if an individual chose this alternative (as opposed to choosing awards with no exercise price). |
| (3) | Awards will vest and become exercisable on, or as soon as practicable after, the first non-prohibited period date occurring after 30 June.June of the second financial year after allocation, if the conditions for vesting are met (including the relevant service conditions). The estimated vesting month is shown in the table. The expiry date of awards is the day prior to the third anniversary of that vesting date. |
(2)(4) | The market price shown for the December 2012 grantgrants made in FY2015 is the closing price of BHP Billiton shares on 519 December 2012.2014. No price is payable by the individual for acquiring the Deferred Sharesaward at the time of grant. The grant date IFRS fair value of each Deferred Sharesthe awards is estimated as at the start of the vesting period, being 1 July 20122014, and werewas A$31.72 and £18.30.33.60. |
(3)(5) | All (100 per cent) of theThe awards granted under the GIS in December 20102012 became fully vested on 3 October 201220 August 2014 as the service conditions were met, as described in footnote 1.met. The price shown is the closing price of BHP Billiton shares on that date. |
(4)(6) | The market price shown (and used for calculating the aggregate gain)gain of the total award) is the closing price of BHP Billiton shares on the date that the individual exercised their award. |
(5)(7) | The amounts shown in this column are the value of the DEP paid on the awards, as described in section 6.2.10. |
(6) | On 10 May 2013, when Andrew Mackenzie was appointed as a Director, and Marius Kloppers retired as a Director, their holdings were the same as at 30 June 2013. |
(7) | Alberto Calderon exercised some of his vested Deferred Shares on 3 October 2012, and the remainder on 18 December 2013.awards. |
| (8) | Awards shown as held by Graham Kerr, Jane McAloon and Karen Wood at 30 June 2015 are their balances held at the date they ceased to be KMP. The December 2012 GIS Deferred Shares for Mr Calderon will vest on his departure from BHP Billitonsubsequent treatment of their awards is set out in May 2014.section 4.4.18 of the FY2014 or FY2015 report as applicable. |
(9) | The December 2012 GIS Deferred Shares for Marcus Randolph vested on his departure from BHP Billiton on 2 September 2013. |
6.4.34.4.21 LTI awards of Performance Shares under the LTIP
Awards under the LTIP will not deliver any value to the holder for at least five years from the beginning of the financial year in which they are granted (unless the executive’s employment with the Group ends earlier in specific circumstances, such as on death, serious injury, disability or illness).
A new LTIP was approved by shareholders at the 2013 AGMs and was effective for grants from December 2013. The terms and conditions of the new LTIP, including the performance conditions, are described in sections 6.2.104.3.3 and 6.3.4.4.3.8 of this Report and are largely the same as the former LTIP. The key differences betweenrules are available on the prior LTIP and the new LTIP (effective from December 2013 allocations) are:BHP Billiton website.
under the new LTIP, DEP is intended to be provided in the form of shares (rather than in cash);
the malus and clawback provisions are strengthened in the new LTIP.
| | | | | | | | | | | | | | | | | | | | | | | | | | | | | | | | | | | | | | | | | | | | | | | | | | | | | | | | |
Name | | Date of grant | | | At
1 July
2014 | | | Granted | | | Uplift | | | Vested | | | Lapsed | | | Exercised | | | At
30 June
2015 | | | Award
vesting
date (1) | | | Market
price on
date of
grant (2) | | | Market
price on
date of
vesting (3) | | | Market
price on
date of
exercise (4) | | | Aggregate
gain on
awards
(’000)(4) | | | DEP on
awards
(’000) (5) | |
Andrew Mackenzie | | | 19-Dec-2014 | | | | – | | | | 208,879 | | | | 15,980 | | | | – | | | | – | | | | – | | | | 224,859 | | | | Aug 2019 | | | | A$28.98 | | | | – | | | | – | | | | – | | | | – | |
| | | 18-Dec-2013 | | | | 198,514 | | | | – | | | | 15,187 | | | | – | | | | – | | | | – | | | | 213,701 | | | | Aug 2018 | | | | A$35.79 | | | | – | | | | – | | | | – | | | | – | |
| | | 05-Dec-2012 | | | | 140,326 | | | | – | | | | 11,283 | | | | – | | | | – | | | | – | | | | 151,609 | | | | Aug 2017 | | | | £19.98 | | | | – | | | | – | | | | – | | | | – | |
| | | 05-Dec-2011 | | | | 146,510 | | | | – | | | | 11,780 | | | | – | | | | – | | | | – | | | | 158,290 | | | | Aug 2016 | | | | £20.12 | | | | – | | | | – | | | | – | | | | – | |
| | | 06-Dec-2010 | | | | 120,000 | | | | – | | | | 9,648 | | | | – | | | | – | | | | – | | | | 129,648 | | | | Aug 2015 | | | | £24.40 | | | | – | | | | – | | | | – | | | | – | |
| | | 16-Dec-2009 | | | | 120,000 | | | | – | | | | – | | | | 69,600 | | | | 50,400 | | | | 69,600 | | | | – | | | | 20-Aug-2014 | | | | £19.06 | | | | £19.65 | | | | £19.52 | | | | £1,377.00 | | | | US$359 | |
| | | | | | | | | | | | | | | | | | | | | | | | | | | | | | | | | | | | | | | | | | | | | | | | | | | | | | | | |
| | | | | | | 725,350 | | | | 208,879 | | | | 63,878 | | | | 69,600 | | | | 50,400 | | | | 69,600 | | | | 878,107 | | | | | | | | | | | | | | | | | | | | | | | | | |
| | | | | | | | | | | | | | | | | | | | | | | | | | | | | | | | | | | | | | | | | | | | | | | | | | | | | | | | |
Peter Beaven | | | 19-Dec-2014 | | | | – | | | | 107,511 | | | | 8,225 | | | | – | | | | – | | | | – | | | | 115,736 | | | | Aug 2019 | | | | A$28.98 | | | | – | | | | – | | | | – | | | | – | |
| | | 18-Dec-2013 | | | | 102,176 | | | | – | | | | 7,817 | | | | – | | | | – | | | | – | | | | 109,993 | | | | Aug 2018 | | | | A$35.79 | | | | – | | | | – | | | | – | | | | – | |
| | | | | | | | | | | | | | | | | | | | | | | | | | | | | | | | | | | | | | | | | | | | | | | | | | | | | | | | |
| | | | | | | 102,176 | | | | 107,511 | | | | 16,042 | | | | – | | | | – | | | | – | | | | 225,729 | | | | | | | | | | | | | | | | | | | | | | | | | |
| | | | | | | | | | | | | | | | | | | | | | | | | | | | | | | | | | | | | | | | | | | | | | | | | | | | | | | | |
Tony Cudmore | | | 19-Dec-2014 | | | | – | | | | 69,114 | | | | 5,288 | | | | – | | | | – | | | | – | | | | 74,402 | | | | Aug 2019 | | | | A$28.98 | | | | – | | | | – | | | | – | | | | – | |
| | | 03-Mar-2014 | | | | 22,273 | | | | – | | | | 1,704 | | | | – | | | | – | | | | – | | | | 23,977 | | | | Aug 2018 | | | | A$37.40 | | | | – | | | | – | | | | – | | | | – | |
| | | | | | | | | | | | | | | | | | | | | | | | | | | | | | | | | | | | | | | | | | | | | | | | | | | | | | | | |
| | | | | | | 22,273 | | | | 69,114 | | | | 6,992 | | | | – | | | | – | | | | – | | | | 98,379 | | | | | | | | | | | | | | | | | | | | | | | | | |
| | | | | | | | | | | | | | | | | | | | | | | | | | | | | | | | | | | | | | | | | | | | | | | | | | | | | | | | |
Tim Cutt | | | 19-Dec-2014 | | | | – | | | | 107,511 | | | | 8,225 | | | | – | | | | – | | | | – | | | | 115,736 | | | | Aug 2019 | | | | A$28.98 | | | | – | | | | – | | | | – | | | | – | |
| | | 18-Dec-2013 | | | | 102,176 | | | | – | | | | 7,817 | | | | – | | | | – | | | | – | | | | 109,993 | | | | Aug 2018 | | | | A$35.79 | | | | – | | | | – | | | | – | | | | – | |
| | | | | | | | | | | | | | | | | | | | | | | | | | | | | | | | | | | | | | | | | | | | | | | | | | | | | | | | |
| | | | | | | 102,176 | | | | 107,511 | | | | 16,042 | | | | – | | | | – | | | | – | | | | 225,729 | | | | | | | | | | | | | | | | | | | | | | | | | |
| | | | | | | | | | | | | | | | | | | | | | | | | | | | | | | | | | | | | | | | | | | | | | | | | | | | | | | | |
Dean Dalla Valle | | | 19-Dec-2014 | | | | – | | | | 107,511 | | | | 8,225 | | | | – | | | | – | | | | – | | | | 115,736 | | | | Aug 2019 | | | | A$28.98 | | | | – | | | | – | | | | – | | | | – | |
| | | 18-Dec-2013 | | | | 102,176 | | | | – | | | | 7,817 | | | | – | | | | – | | | | – | | | | 109,993 | | | | Aug 2018 | | | | A$35.79 | | | | – | | | | – | | | | – | | | | – | |
| | | | | | | | | | | | | | | | | | | | | | | | | | | | | | | | | | | | | | | | | | | | | | | | | | | | | | | | |
| | | | | | | 102,176 | | | | 107,511 | | | | 16,042 | | | | – | | | | – | | | | – | | | | 225,729 | | | | | | | | | | | | | | | | | | | | | | | | | |
| | | | | | | | | | | | | | | | | | | | | | | | | | | | | | | | | | | | | | | | | | | | | | | | | | | | | | | | |
Mike Fraser(6) | | | 18-Dec-2013 | | | | 86,850 | | | | – | | | | – | | | | – | | | | – | | | | – | | | | 86,850 | | | | Aug 2018 | | | | A$35.79 | | | | – | | | | – | | | | – | | | | – | |
| | | | | | | | | | | | | | | | | | | | | | | | | | | | | | | | | | | | | | | | | | | | | | | | | | | | | | | | |
| | | | | | | 86,850 | | | | – | | | | – | | | | – | | | | – | | | | – | | | | 86,850 | | | | | | | | | | | | | | | | | | | | | | | | | |
| | | | | | | | | | | | | | | | | | | | | | | | | | | | | | | | | | | | | | | | | | | | | | | | | | | | | | | | |
Geoff Healy | | | 19-Dec-2014 | | | | – | | | | 107,511 | | | | 8,225 | | | | – | | | | – | | | | – | | | | 115,736 | | | | Aug 2019 | | | | A$28.98 | | | | – | | | | – | | | | – | | | | – | |
| | | 18-Dec-2013 | | | | 102,176 | | | | – | | | | 7,817 | | | | – | | | | – | | | | – | | | | 109,993 | | | | Aug 2018 | | | | A$35.79 | | | | – | | | | – | | | | – | | | | – | |
| | | | | | | | | | | | | | | | | | | | | | | | | | | | | | | | | | | | | | | | | | | | | | | | | | | | | | | | |
| | | | | | | 102,176 | | | | 107,511 | | | | 16,042 | | | | – | | | | – | | | | – | | | | 225,729 | | | | | | | | | | | | | | | | | | | | | | | | | |
| | | | | | | | | | | | | | | | | | | | | | | | | | | | | | | | | | | | | | | | | | | | | | | | | | | | | | | | |
| | | | | | | | | | | | | | | | | | | | | | | | | | | | | | | | | | | | | | | | | | | | | | | | | | | | |
Name | | Date of grant | | | At
1 July
2012 | | | Granted | | | Vested | | | Lapsed | | | Exercised | | | At
30 June
2013 | | | Date award
may vest and
become
exercisable (1) | | | Market
price on
date of
grant(2) | | | Market
price on
date of
vesting (3) | | | Market
price on
date of
exercise (4) | | | Aggregate
gain on
awards
(’000) | | | DEP on
awards
(’000) (5) | |
Executive Directors | | | | | | | | | | | | | | | | | | | | | | | | | | | | | | | | | | | | | | | | | | | | | | | | | |
Andrew Mackenzie(6)/(7) | | | 5 Dec 2012 | | | | – | | | | 140,326 | | | | – | | | | – | | | | – | | | | 140,326 | | | | Aug 2017 | | | | £19.98 | | | | – | | | | – | | | | – | | | | – | |
| | | 5 Dec 2011 | | | | 146,510 | | | | – | | | | – | | | | – | | | | – | | | | 146,510 | | | | Aug 2016 | | | | £20.12 | | | | – | | | | – | | | | – | | | | – | |
| | | 6 Dec 2010 | | | | 120,000 | | | | – | | | | – | | | | – | | | | – | | | | 120,000 | | | | Aug 2015 | | | | £24.40 | | | | – | | | | – | | | | – | | | | – | |
| | | 14 Dec 2009 | | | | 120,000 | | | | – | | | | – | | | | – | | | | – | | | | 120,000 | | | | Aug 2014 | | | | £19.06 | | | | – | | | | – | | | | – | | | | – | |
| | | 4 Dec 2008 | | | | 325,839 | | | | – | | | | – | | | | – | | | | – | | | | 325,839 | | | | Aug 2013 | | | | £10.60 | | | | – | | | | – | | | | – | | | | – | |
| | | | | | | | | | | | | | | | | | | | | | | | | | | | | | | | | | | | | | | | | | | | | | | | | | | | |
Total | | | | | | | 712,349 | | | | 140,326 | | | | – | | | | – | | | | – | | | | 852,675 | | | | | | | | | | | | | | | | | | | | | | | | | |
| | | | | | | | | | | | | | | | | | | | | | | | | | | | | | | | | | | | | | | | | | | | | | | | | | | | |
Marius Kloppers(7)/(8) | | | 5 Dec 2012 | | | | – | | | | 240,603 | | | | – | | | | – | | | | – | | | | 240,603 | | | | Aug 2017 | | | | A$34.29 | | | | – | | | | – | | | | – | | | | – | |
| | | 5 Dec 2011 | | | | 226,721 | | | | – | | | | – | | | | – | | | | – | | | | 226,721 | | | | Aug 2016 | | | | A$37.26 | | | | – | | | | – | | | | – | | | | – | |
| | | 6 Dec 2010 | | | | 200,000 | | | | – | | | | – | | | | – | | | | – | | | | 200,000 | | | | Aug 2015 | | | | A$44.53 | | | | – | | | | – | | | | – | | | | – | |
| | | 14 Dec 2009 | | | | 250,000 | | | | – | | | | – | | | | – | | | | – | | | | 250,000 | | | | Aug 2014 | | | | A$40.65 | | | | – | | | | – | | | | – | | | | – | |
| | | 4 Dec 2008 | | | | 500,000 | | | | – | | | | – | | | | – | | | | – | | | | 500,000 | | | | Aug 2013 | | | | A$27.50 | | | | – | | | | – | | | | – | | | | – | |
| | | 14 Dec 2007 | | | | 333,327 | | | | – | | | | 333,327 | | | | – | | | | 245,000 | | | | 88,327 | | | | 2 Oct 2012 | | | | A$42.05 | | | | A$33.54 | | | | A$33.43 | | | | A$8,190 | | | | US$1,034 | |
| | | | | | | | | | | | | | | | | | | | | | | | | | | | | | | | | | | | | | | | | | | | | | | | | | | | |
Total | | | | | | | 1,510,048 | | | | 240,603 | | | | 333,327 | | | | – | | | | 245,000 | | | | 1,505,651 | | | | | | | | | | | | | | | | | | | | | | | | | |
| | | | | | | | | | | | | | | | | | | | | | | | | | | | | | | | | | | | | | | | | | | | | | | | | | | | |
Other members of the GMC | | | | | | | | | | | | | | | | | | | | | | | | | | | | | | | | | | | | | | | | | | | | | |
Alberto Calderon(8) | | | 5 Dec 2012 | | | | – | | | | 140,326 | | | | – | | | | – | | | | – | | | | 140,326 | | | | Aug 2017 | | | | £ 19.98 | | | | – | | | | – | | | | – | | | | – | |
| | | 5 Dec 2011 | | | | 146,510 | | | | – | | | | – | | | | – | | | | – | | | | 146,510 | | | | Aug 2016 | | | | £ 20.12 | | | | – | | | | – | | | | – | | | | – | |
| | | 6 Dec 2010 | | | | 120,000 | | | | – | | | | – | | | | – | | | | – | | | | 120,000 | | | | Aug 2015 | | | | £ 24.40 | | | | – | | | | – | | | | – | | | | – | |
| | | 14 Dec 2009 | | | | 120,000 | | | | – | | | | – | | | | – | | | | – | | | | 120,000 | | | | Aug 2014 | | | | £ 19.06 | | | | – | | | | – | | | | – | | | | – | |
| | | 4 Dec 2008 | | | | 225,000 | | | | – | | | | – | | | | – | | | | – | | | | 225,000 | | | | Aug 2013 | | | | £ 10.60 | | | | – | | | | – | | | | – | | | | – | |
| | | 14 Dec 2007 | | | | 211,993 | | | | – | | | | 211,993 | | | | – | | | | 211,993 | | | | – | | | | 2 Oct 2012 | | | | £ 15.45 | | | | £19.45 | | | | £19.45 | | | | £4,123 | | | | US$895 | |
| | | | | | | | | | | | | | | | | | | | | | | | | | | | | | | | | | | | | | | | | | | | | | | | | | | | |
Total | | | | | | | 823,503 | | | | 140,326 | | | | 211,993 | | | | – | | | | 211,993 | | | | 751,836 | | | | | | | | | | | | | | | | | | | | | | | | | |
| | | | | | | | | | | | | | | | | | | | | | | | | | | | | | | | | | | | | | | | | | | | | | | | | | | | |
Mike Henry | | | 5 Dec 2012 | | | | – | | | | 121,179 | | | | – | | | | – | | | | – | | | | 121,179 | | | | Aug 2017 | | | | £ 19.98 | | | | – | | | | – | | | | – | | | | – | |
| | | | | | | | | | | | | | | | | | | | | | | | | | | | | | | | | | | | | | | | | | | | | | | | | | | | |
Total | | | | | | | – | | | | 121,179 | | | | – | | | | – | | | | – | | | | 121,179 | | | | | | | | | | | | | | | | | | | | | | | | | |
| | | | | | | | | | | | | | | | | | | | | | | | | | | | | | | | | | | | | | | | | | | | | | | | | | | | |
Graham Kerr | | | 5 Dec 2012 | | | | – | | | | 108,939 | | | | – | | | | – | | | | – | | | | 108,939 | | | | Aug 2017 | | | | A$34.29 | | | | – | | | | – | | | | – | | | | – | |
| | | | | | | | | | | | | | | | | | | | | | | | | | | | | | | | | | | | | | | | | | | | | | | | | | | | |
Total | | | | | | | – | | | | 108,939 | | | | – | | | | – | | | | – | | | | 108,939 | | | | | | | | | | | | | | | | | | | | | | | | | |
| | | | | | | | | | | | | | | | | | | | | | | | | | | | | | | | | | | | | | | | | | | | | | | | | | | | |
Marcus Randolph(8) | | | 5 Dec 2012 | | | | – | | | | 126,926 | | | | – | | | | – | | | | – | | | | 126,926 | | | | Aug 2017 | | | | A$34.29 | | | | – | | | | – | | | | – | | | | – | |
| | | 5 Dec 2011 | | | | 119,603 | | | | – | | | | – | | | | – | | | | – | | | | 119,603 | | | | Aug 2016 | | | | A$37.26 | | | | – | | | | – | | | | – | | | | – | |
| | | 6 Dec 2010 | | | | 105,000 | | | | – | | | | – | | | | – | | | | – | | | | 105,000 | | | | Aug 2015 | | | | A$44.53 | | | | – | | | | – | | | | – | | | | – | |
| | | 14 Dec 2009 | | | | 120,000 | | | | – | | | | – | | | | – | | | | – | | | | 120,000 | | | | Aug 2014 | | | | A$40.65 | | | | – | | | | – | | | | – | | | | – | |
| | | 4 Dec 2008 | | | | 225,000 | | | | – | | | | – | | | | – | | | | – | | | | 225,000 | | | | Aug 2013 | | | | A$27.50 | | | | – | | | | – | | | | – | | | | – | |
| | | 14 Dec 2007 | | | | 197,676 | | | | – | | | | 197,676 | | | | – | | | | 197,676 | | | | – | | | | 2 Oct 2012 | | | | A$42.05 | | | | A$33.54 | | | | A$33.54 | | | | A$6,630 | | | | US$834 | |
| | | | | | | | | | | | | | | | | | | | | | | | | | | | | | | | | | | | | | | | | | | | | | | | | | | | |
Total | | | | | | | 767,279 | | | | 126,926 | | | | 197,676 | | | | | | | | 197,676 | | | | 696,529 | | | | | | | | | | | | | | | | | | | | | | | | | |
| | | | | | | | | | | | | | | | | | | | | | | | | | | | | | | | | | | | | | | | | | | | | | | | | | | | |
| | | | | | | | | | | | | | | | | | | | | | | | | | | | | | | | | | | | | | | | | | | | | | | | | | | | |
Name | | Date of grant | | | At
1 July
2012 | | | Granted | | | Vested | | | Lapsed | | | Exercised | | | At
30 June
2013 | | | Date award
may vest and
become
exercisable (1) | | | Market
price on
date of
grant(2) | | | Market
price on
date of
vesting (3) | | | Market
price on
date of
exercise (4) | | | Aggregate
gain on
awards
(’000) | | | DEP on
awards
(’000) (5) | |
Karen Wood | | | 5 Dec 2012 | | | | – | | | | 90,234 | | | | – | | | | – | | | | – | | | | 90,234 | | | | Aug 2017 | | | | A$34.29 | | | | – | | | | – | | | | – | | | | – | |
| | | 5 Dec 2011 | | | | 85,027 | | | | – | | | | – | | | | – | | | | – | | | | 85,027 | | | | Aug 2016 | | | | A$37.26 | | | | – | | | | – | | | | – | | | | – | |
| | | 6 Dec 2010 | | | | 75,000 | | | | – | | | | – | | | | – | | | | – | | | | 75,000 | | | | Aug 2015 | | | | A$44.53 | | | | – | | | | – | | | | – | | | | – | |
| | | 1 Feb 2010 | | | | 90,000 | | | | – | | | | – | | | | – | | | | – | | | | 90,000 | | | | Aug 2014 | | | | A$39.20 | | | | – | | | | – | | | | – | | | | – | |
| | | 4 Dec 2008 | | | | 175,000 | | | | – | | | | – | | | | – | | | | – | | | | 175,000 | | | | Aug 2013 | | | | A$27.50 | | | | – | | | | – | | | | – | | | | – | |
| | | 14 Dec 2007 | | | | 154,187 | | | | – | | | | 154,187 | | | | – | | | | 90,000 | | | | 64,187 | | | | 2 Oct 2012 | | | | A$42.05 | | | | A$33.54 | | | | A$33.54 | | | | A$3,019 | | | | US$380 | |
| | | | | | | | | | | | | | | | | | | | | | | | | | | | | | | | | | | | | | | | | | | | | | | | | | | | |
Total | | | | | | | 579,214 | | | | 90,234 | | | | 154,187 | | | | – | | | | 90,000 | | | | 579,448 | | | | | | | | | | | | | | | | | | | | | | | | | |
| | | | | | | | | | | | | | | | | | | | | | | | | | | | | | | | | | | | | | | | | | | | | | | | | | | | |
J Michael Yeager(8) | | | 5 Dec 2012 | | | | – | | | | 126,926 | | | | – | | | | – | | | | – | | | | 126,926 | | | | Aug 2017 | | | | A$34.29 | | | | – | | | | – | | | | – | | | | – | |
| | | 5 Dec 2011 | | | | 119,603 | | | | – | | | | – | | | | – | | | | – | | | | 119,603 | | | | Aug 2016 | | | | A$37.26 | | | | – | | | | – | | | | – | | | | – | |
| | | 6 Dec 2010 | | | | 105,000 | | | | – | | | | – | | | | – | | | | – | | | | 105,000 | | | | Aug 2015 | | | | A$44.53 | | | | – | | | | – | | | | – | | | | – | |
| | | 14 Dec 2009 | | | | 120,000 | | | | – | | | | – | | | | – | | | | – | | | | 120,000 | | | | Aug 2014 | | | | A$40.65 | | | | – | | | | – | | | | – | | | | – | |
| | | 4 Dec 2008 | | | | 225,000 | | | | – | | | | – | | | | – | | | | – | | | | 225,000 | | | | Aug 2013 | | | | A$27.50 | | | | – | | | | – | | | | – | | | | – | |
| | | 14 Dec 2007 | | | | 187,702 | | | | – | | | | 187,702 | | | | – | | | | 187,702 | | | | – | | | | 2 Oct 2012 | | | | A$42.05 | | | | A$33.54 | | | | A$33.54 | | | | A$6,296 | | | | US$792 | |
| | | | | | | | | | | | | | | | | | | | | | | | | | | | | | | | | | | | | | | | | | | | | | | | | | | | |
Total | | | | | | | 757,305 | | | | 126,926 | | | | 187,702 | | | | – | | | | 187,702 | | | | 696,529 | | | | | | | | | | | | | | | | | | | | | | | | | |
| | | | | | | | | | | | | | | | | | | | | | | | | | | | | | | | | | | | | | | | | | | | | | | | | | | | |
| | | | | | | | | | | | | | | | | | | | | | | | | | | | | | | | | | | | | | | | | | | | | | | | | | | | | | | | |
Name | | Date of grant | | | At
1 July
2014 | | | Granted | | | Uplift | | | Vested | | | Lapsed | | | Exercised | | | At
30 June
2015 | | | Award
vesting
date (1) | | | Market
price on
date of
grant (2) | | | Market
price on
date of
vesting (3) | | | Market
price on
date of
exercise (4) | | | Aggregate
gain on
awards
(’000)(4) | | | DEP on
awards
(’000) (5) | |
Mike Henry | | | 19-Dec-2014 | | | | – | | | | 118,262 | | | | 9,048 | | | | – | | | | – | | | | – | | | | 127,310 | | | | Aug 2019 | | | | A$28.98 | | | | – | | | | – | | | | – | | | | – | |
| | | 18-Dec-2013 | | | | 112,394 | | | | – | | | | 8,599 | | | | – | | | | – | | | | – | | | | 120,993 | | | | Aug 2018 | | | | A$35.79 | | | | – | | | | – | | | | – | | | | – | |
| | | 05-Dec-2012 | | | | 121,179 | | | | – | | | | 9,743 | | | | – | | | | – | | | | – | | | | 130,922 | | | | Aug 2017 | | | | £19.98 | | | | – | | | | – | | | | – | | | | – | |
| | | | | | | | | | | | | | | | | | | | | | | | | | | | | | | | | | | | | | | | | | | | | | | | | | | | | | | | |
| | | | | | | 233,573 | | | | 118,262 | | | | 27,390 | | | | – | | | | – | | | | – | | | | 379,225 | | | | | | | | | | | | | | | | | | | | | | | | | |
| | | | | | | | | | | | | | | | | | | | | | | | | | | | | | | | | | | | | | | | | | | | | | | | | | | | | | | | |
Graham Kerr(6) | | | 18-Dec-2013 | | | | 112,394 | | | | – | | | | – | | | | – | | | | – | | | | – | | | | 112,394 | | | | Aug 2018 | | | | A$35.79 | | | | – | | | | – | | | | – | | | | – | |
| | | 05-Dec-2012 | | | | 108,939 | | | | – | | | | – | | | | – | | | | – | | | | – | | | | 108,939 | | | | Aug 2017 | | | | A$34.29 | | | | – | | | | – | | | | – | | | | – | |
| | | | | | | | | | | | | | | | | | | | | | | | | | | | | | | | | | | | | | | | | | | | | | | | | | | | | | | | |
| | | | | | | 221,333 | | | | – | | | | – | | | | – | | | | – | | | | – | | | | 221,333 | | | | | | | | | | | | | | | | | | | | | | | | | |
| | | | | | | | | | | | | | | | | | | | | | | | | | | | | | | | | | | | | | | | | | | | | | | | | | | | | | | | |
Daniel Malchuk | | | 19-Dec-2014 | | | | – | | | | 107,511 | | | | 8,225 | | | | – | | | | – | | | | – | | | | 115,736 | | | | Aug 2019 | | | | A$28.98 | | | | – | | | | – | | | | – | | | | – | |
| | | 18-Dec-2013 | | | | 86,850 | | | | – | | | | 6,645 | | | | – | | | | – | | | | – | | | | 93,495 | | | | Aug 2018 | | | | A$35.79 | | | | – | | | | – | | | | – | | | | – | |
| | | | | | | | | | | | | | | | | | | | | | | | | | | | | | | | | | | | | | | | | | | | | | | | | | | | | | | | |
| | | | | | | 86,850 | | | | 107,511 | | | | 14,870 | | | | – | | | | – | | | | – | | | | 209,231 | | | | | | | | | | | | | | | | | | | | | | | | | |
| | | | | | | | | | | | | | | | | | | | | | | | | | | | | | | | | | | | | | | | | | | | | | | | | | | | | | | | |
Jane McAloon (6) | | | 19-Dec-2014 | | | | – | | | | 69,114 | | | | 5,288 | | | | – | | | | – | | | | – | | | | 74,402 | | | | Aug 2019 | | | | A$28.98 | | | | – | | | | – | | | | – | | | | – | |
| | | 18-Dec-2013 | | | | 65,684 | | | | – | | | | 5,025 | | | | – | | | | – | | | | – | | | | 70,709 | | | | Aug 2018 | | | | A$35.79 | | | | – | | | | – | | | | – | | | | – | |
| | | | | | | | | | | | | | | | | | | | | | | | | | | | | | | | | | | | | | | | | | | | | | | | | | | | | | | | |
| | | | | | | 65,684 | | | | 69,114 | | | | 10,313 | | | | – | | | | – | | | | – | | | | 145,111 | | | | | | | | | | | | | | | | | | | | | | | | | |
| | | | | | | | | | | | | | | | | | | | | | | | | | | | | | | | | | | | | | | | | | | | | | | | | | | | | | | | |
Jimmy Wilson | | | 19-Dec-2014 | | | | – | | | | 107,511 | | | | 8,225 | | | | – | | | | – | | | | – | | | | 115,736 | | | | 31-Aug-2019 | | | | A$28.98 | | | | – | | | | – | | | | – | | | | – | |
| | | 18-Dec-2013 | | | | 102,176 | | | | – | | | | 7,817 | | | | – | | | | – | | | | – | | | | 109,993 | | | | 31-Aug-2018 | | | | A$35.79 | | | | – | | | | – | | | | – | | | | – | |
| | | | | | | | | | | | | | | | | | | | | | | | | | | | | | | | | | | | | | | | | | | | | | | | | | | | | | | | |
| | | | | | | 102,176 | | | | 107,511 | | | | 16,042 | | | | – | | | | – | | | | – | | | | 225,729 | | | | | | | | | | | | | | | | | | | | | | | | | |
| | | | | | | | | | | | | | | | | | | | | | | | | | | | | | | | | | | | | | | | | | | | | | | | | | | | | | | | |
Karen Wood(6) | | | 18-Dec-2013 | | | | 102,176 | | | | – | | | | – | | | | – | | | | 78,899 | | | | – | | | | 23,277 | | | | Aug 2018 | | | | A$35.79 | | | | – | | | | – | | | | – | | | | – | |
| | | 05-Dec-2012 | | | | 90,234 | | | | – | | | | – | | | | – | | | | 51,640 | | | | – | | | | 38,594 | | | | Aug 2017 | | | | A$34.29 | | | | – | | | | – | | | | – | | | | – | |
| | | 05-Dec-2011 | | | | 85,027 | | | | – | | | | – | | | | – | | | | 31,647 | | | | – | | | | 53,380 | | | | Aug 2016 | | | | A$37.26 | | | | – | | | | – | | | | – | | | | – | |
| | | 06-Dec-2010 | | | | 75,000 | | | | – | | | | – | | | | – | | | | 12,898 | | | | – | | | | 62,102 | | | | Aug 2015 | | | | A$44.53 | | | | – | | | | – | | | | – | | | | – | |
| | | 16-Dec-2009 | | | | 90,000 | | | | – | | | | – | | | | 52,200 | | | | 37,800 | | | | 48,063 | | | | 4,137 | | | | 20-Aug-2014 | | | | A$39.20 | | | | A$38.13 | | | | A$38.34 | | | | A$1,843 | | | | US$248 | |
| | | 04-Dec-2008 | | | | 62,937 | | | | – | | | | – | | | | – | | | | – | | | | 62,937 | | | | – | | | | 21-Aug-2013 | | | | A$27.50 | | | | A$35.74 | | | | A$38.34 | | | | A$2,413 | | | | US$376 | |
| | | | | | | | | | | | | | | | | | | | | | | | | | | | | | | | | | | | | | | | | | | | | | | | | | | | | | | | |
| | | | | | | 505,374 | | | | – | | | | – | | | | 52,200 | | | | 212,884 | | | | 111,000 | | | | 181,490 | | | | | | | | | | | | | | | | | | | | | | | | | |
| | | | | | | | | | | | | | | | | | | | | | | | | | | | | | | | | | | | | | | | | | | | | | | | | | | | | | | | |
| (1) | The performance period for each award ends on 30 June in the year the award ‘may vest and become exercisable’ if the conditions for vesting are met (including if the relevant performance hurdle is achieved). Under the LTIP rules, awardsAwards will vest and become exercisable on, or as soon as practicable after, the first non-prohibited period date occurring after 30 June.June of the fifth financial year after allocation if the conditions for vesting are met (including if the relevant performance condition is achieved). The estimated vesting month is shown in the table. The expiry date of awards is the day prior to the fifth anniversary of that vesting date. |
| (2) | The market price shown for the December 2012 grantgrants made in FY2015 is the closing price of BHP Billiton shares on 519 December 2012.2014. No price is payable by the individual for acquiring the Performance Sharesaward at the time of grant. The accounting grant date IFRS fair valuesvalue of the awards areis estimated as at the start of the vesting period, being 1 July 2012,2014, using a Monte Carlo simulation, and werewas A$14.16 and £7.91.18.70. |
| (3) | All (10058 per cent)cent of the Performance SharesLTIP awards granted under the LTIP in December 20072009 became fully vested on 2 October 2012,20 August 2014, following the performance hurdlecondition being fully achieved and the Remuneration Committee considering its discretion over the vesting outcome, as described in section 6.3.4.4.3.3. The remaining 42 per cent of the LTIP awards lapsed and cannot be exercised. The price shown is the closing price of BHP Billiton shares on thatthe vesting date. |
| (4) | The market price shown (and used for calculating the aggregate gain) is the closing price of BHP Billiton shares on the date that the individual exercised their Performance Shares.LTIP award. No price is payable by the individual for exercising the Performance Shares. One ordinary BHP Billiton share is acquired for each Performance Share exercised.award. |
| (5) | The amounts shown in this column are the value of the DEP paid on awards as described in section 6.2.10.awards. |
| (6) | The awards allocated to Andrew Mackenzie on 4 December 2008 included 225,000 Performance Shares allocated to himAwards shown as part of FY2009 Total Remunerationheld by Mike Fraser, Graham Kerr, Jane McAloon and a further 100,839 Performance Shares allocated to him on commencement with BHP Billiton, in relation to at risk rewards forfeited when he left his former employer. More information on Mr Mackenzie’s commencement arrangements is included in footnote 7 to the table in section 6.4.1. |
(7) | On 10 May 2013, when Andrew Mackenzie was appointed as a Director, and Marius Kloppers retired as a Director, their holdings were the same asKaren Wood at 30 June 2013. |
(8) | The Unvested LTIP awards held by members of the GMC on2015 are their balances at the date that they leave BHP Billiton in FY2014 have been, or willceased to be pro-rated asKMP. The subsequent treatment of their awards is set out in section 6.3.5 and remain subject to performance and vesting conditions.4.4.18 of the FY2014 or FY2015 Report, as applicable. |
6.4.4 Awards of Performance-conditional Restricted Shares as4.4.22 Transitional GMC grantsawards
As shown in section 6.4.6, the final MAP awards that are allocated to Mr Henry and Mr Kerr in November 2011individuals in their non-GMC management positions have a three-year service condition, and are due to vest in 2014. Thethe LTIP awards provided to Mr Henry and Mr Kerr in December 2012 as GMC members and shown in section 6.4.3 have a five-year service and performance condition, and may vest in 2017. Therefore, as a transitional step, Mr Henry and Mr Kerr also received Transitional GMC awards in December 2012 as shown in the table below. The Remuneration Committee may determine that similar awards be allocated in December 2013 to individuals who have joined thenew GMC since May 2013members recruited from within BHP Billiton receive Transitional GMC awards to bridge the Company.gap between the two programs.
TheseTransitional GMC awards have two tranches. Tranche one has a three-year service and performance condition and may vest in 2015.condition. Tranche two has a four-year service and performance condition and may vest in 2016.condition. The Committee has absolute discretion to determine if the performance condition has been met and whether any, all or somepart of the Restricted Sharesaward will vest (or otherwise lapse), having regard to (but not limited to) BHP Billiton’s TSR over the three- or four-year performance period (respectively), the participant’s contribution to Group outcomes and the participant’s personal performance (with guidance on this assessment from the CEO). No DEP is payable on these awards.
The treatment of theTransitional GMC awards on cessation of employment will depend on the circumstances and is similar to those for LTIP awards. If the participant’s employment ceases due to dismissal or resignation, any unvested awards will lapse immediately. If the reason for cessation is death, serious injury, disability or illness, then the awards will vest in full on the date of cessation. If the participant retires from the Group with the agreement of the Company,BHP Billiton, is made redundant or employment is terminated by mutual agreement, then a proportion of the award (pro-rated to reflect the percentage of the Performance Periodperformance period that has elapsed) will continue on foot and vest, subject to the performance condition, on the future vesting date. The remaining Restricted Sharesportion of the award will lapse. In all other circumstances, the Committee in its absolute discretion will determine the numberportion of Restricted Sharesthe award that vestvests (or lapse)lapses).
| | | | | | | | | | | | | | | | | | | | | | | | | | | | | | | | | | | | | | | | | | |
Name | | Date of grant | | At
1 July
2012 | | | Granted | | | Vested | | | Lapsed | | | Exercised | | | At
30 June
2013 | | | Date award
may vest (1) | | | Market
price on
date of
grant(2) | | | Market
price on
date of
vesting | | | Aggregate
gain on
awards
(’000) | |
Mike Henry | | 5 Dec 2012 | | | – | | | | 19,930 | | | | – | | | | – | | | | – | | | | 19,930 | | | | Aug 2016 | | | | £19.98 | | | | – | | | | – | |
| | 5 Dec 2012 | | | – | | | | 19,930 | | | | – | | | | – | | | | – | | | | 19,930 | | | | Aug 2015 | | | | £19.98 | | | | – | | | | – | |
| | | | | | | | | | | | | | | | | | | | | | | | | | | | | | | | | | | | | | | | | | |
Total | | | | | – | | | | 39,860 | | | | – | | | | – | | | | – | | | | 39,860 | | | | | | | | | | | | | | | | | |
| | | | | | | | | | | | | | | | | | | | | | | | | | | | | | | | | | | | | | | | | | |
Graham Kerr | | 5 Dec 2012 | | | – | | | | 17,917 | | | | – | | | | – | | | | – | | | | 17,917 | | | | Aug 2016 | | | | A$34.29 | | | | – | | | | – | |
| | 5 Dec 2012 | | | – | | | | 17,917 | | | | – | | | | – | | | | – | | | | 17,917 | | | | Aug 2015 | | | | A$34.29 | | | | – | | | | – | |
| | | | | | | | | | | | | | | | | | | | | | | | | | | | | | | | | | | | | | | | | | |
Total | | | | | – | | | | 35,834 | | | | – | | | | – | | | | – | | | | 35,834 | | | | | | | | | | | | | | | | | |
| | | | | | | | | | | | | | | | | | | | | | | | | | | | | | | | | | | | | | | | | | |
| | | | | | | | | | | | | | | | | | | | | | | | | | | | | | | | | | | | | | | | | | | | | | |
Name | | Date of grant | | At
1 July
2014 | | | Granted | | | Uplift | | | Vested | | | Lapsed | | | Exercised | | | At
30 June
2015 | | | Award
vesting
date (1) | | | Market
price on
date of
grant | | | Market
price on
date of
vesting | | | Aggregate
gain on
awards
(’000) | |
Peter Beaven | | 18-Dec-2013 | | | 18,245 | | | | – | | | | 1,396 | | | | – | | | | – | | | | – | | | | 19,641 | | | | Aug 2017 | | | | A$35.79 | | | | – | | | | – | |
| | 18-Dec-2013 | | | 18,245 | | | | – | | | | 1,396 | | | | – | | | | – | | | | – | | | | 19,641 | | | | Aug 2016 | | | | A$35.79 | | | | – | | | | – | |
| | | | | | | | | | | | | | | | | | | | | | | | | | | | | | | | | | | | | | | | | | | | | | |
| | | | | 36,490 | | | | – | | | | 2,792 | | | | – | | | | – | | | | – | | | | 39,282 | | | | | | | | | | | | | | | | | |
| | | | | | | | | | | | | | | | | | | | | | | | | | | | | | | | | | | | | | | | | | | | | | |
Tim Cutt | | 18-Dec-2013 | | | 18,245 | | | | – | | | | 1,396 | | | | – | | | | – | | | | – | | | | 19,641 | | | | Aug 2017 | | | | A$35.79 | | | | – | | | | – | |
| | 18-Dec-2013 | | | 18,245 | | | | – | | | | 1,396 | | | | – | | | | – | | | | – | | | | 19,641 | | | | Aug 2016 | | | | A$35.79 | | | | – | | | | – | |
| | | | | | | | | | | | | | | | | | | | | | | | | | | | | | | | | | | | | | | | | | | | | | |
| | | | | 36,490 | | | | – | | | | 2,792 | | | | – | | | | – | | | | – | | | | 39,282 | | | | | | | | | | | | | | | | | |
| | | | | | | | | | | | | | | | | | | | | | | | | | | | | | | | | | | | | | | | | | | | | | |
Dean Dalla Valle | | 18-Dec-2013 | | | 18,245 | | | | – | | | | 1,396 | | | | – | | | | – | | | | – | | | | 19,641 | | | | Aug 2017 | | | | A$35.79 | | | | – | | | | – | |
| | 18-Dec-2013 | | | 18,245 | | | | – | | | | 1,396 | | | | – | | | | – | | | | – | | | | 19,641 | | | | Aug 2016 | | | | A$35.79 | | | | – | | | | – | |
| | | | | | | | | | | | | | | | | | | | | | | | | | | | | | | | | | | | | | | | | | | | | | |
| | | | | 36,490 | | | | – | | | | 2,792 | | | | – | | | | – | | | | – | | | | 39,282 | | | | | | | | | | | | | | | | | |
| | | | | | | | | | | | | | | | | | | | | | | | | | | | | | | | | | | | | | | | | | | | | | |
| | | | | | | | | | | | | | | | | | | | | | | | | | | | | | | | | | | | | | | | | | | | | | |
Name | | Date of grant | | At
1 July
2014 | | | Granted | | | Uplift | | | Vested | | | Lapsed | | | Exercised | | | At
30 June
2015 | | | Award
vesting
date (1) | | | Market
price on
date of
grant | | | Market
price on
date of
vesting | | | Aggregate
gain on
awards
(’000) | |
Mike Fraser (2) | | 18-Dec-2013 | | | 15,508 | | | | – | | | | – | | | | – | | | | – | | | | – | | | | 15,508 | | | | Aug 2017 | | | | A$35.79 | | | | – | | | | – | |
| | 18-Dec-2013 | | | 15,508 | | | | – | | | | – | | | | – | | | | – | | | | – | | | | 15,508 | | | | Aug 2016 | | | | A$35.79 | | | | – | | | | – | |
| | | | | | | | | | | | | | | | | | | | | | | | | | | | | | | | | | | | | | | | | | | | | | |
| | | | | 31,016 | | | | – | | | | – | | | | – | | | | – | | | | – | | | | 31,016 | | | | | | | | | | | | | | | | | |
| | | | | | | | | | | | | | | | | | | | | | | | | | | | | | | | | | | | | | | | | | | | | | |
Mike Henry | | 05-Dec-2012 | | | 19,930 | | | | – | | | | 1,603 | | | | – | | | | – | | | | – | | | | 21,533 | | | | Aug 2016 | | | | £19.98 | | | | – | | | | – | |
| | 05-Dec-2012 | | | 19,930 | | | | – | | | | 1,603 | | | | – | | | | – | | | | – | | | | 21,533 | | | | Aug 2015 | | | | £19.98 | | | | – | | | | – | |
| | | | | | | | | | | | | | | | | | | | | | | | | | | | | | | | | | | | | | | | | | | | | | |
| | | | | 39,860 | | | | – | | | | 3,206 | | | | – | | | | – | | | | – | | | | 43,066 | | | | | | | | | | | | | | | | | |
| | | | | | | | | | | | | | | | | | | | | | | | | | | | | | | | | | | | | | | | | | | | | | |
Graham Kerr(2) | | 05-Dec-2012 | | | 17,917 | | | | – | | | | – | | | | – | | | | – | | | | – | | | | 17,917 | | | | Aug 2016 | | | | A$34.29 | | | | – | | | | – | |
| | 05-Dec-2012 | | | 17,917 | | | | – | | | | – | | | | – | | | | – | | | | – | | | | 17,917 | | | | Aug 2015 | | | | A$34.29 | | | | – | | | | – | |
| | | | | | | | | | | | | | | | | | | | | | | | | | | | | | | | | | | | | | | | | | | | | | |
| | | | | 35,834 | | | | – | | | | – | | | | – | | | | – | | | | – | | | | 35,834 | | | | | | | | | | | | | | | | | |
| | | | | | | | | | | | | | | | | | | | | | | | | | | | | | | | | | | | | | | | | | | | | | |
Jane McAloon (2) | | 18-Dec-2013 | | | 13,684 | | | | – | | | | 1,047 | | | | – | | | | – | | | | – | | | | 14,731 | | | | Aug 2017 | | | | A$35.79 | | | | – | | | | – | |
| | 18-Dec-2013 | | | 13,684 | | | | – | | | | 1,047 | | | | – | | | | – | | | | – | | | | 14,731 | | | | Aug 2016 | | | | A$35.79 | | | | – | | | | – | |
| | | | | | | | | | | | | | | | | | | | | | | | | | | | | | | | | | | | | | | | | | | | | | |
| | | | | 27,368 | | | | – | | | | 2,094 | | | | – | | | | – | | | | – | | | | 29,462 | | | | | | | | | | | | | | | | | |
| | | | | | | | | | | | | | | | | | | | | | | | | | | | | | | | | | | | | | | | | | | | | | |
Daniel Malchuk | | 18-Dec-2013 | | | 15,508 | | | | – | | | | 1,187 | | | | – | | | | – | | | | – | | | | 16,695 | | | | Aug 2017 | | | | A$35.79 | | | | – | | | | – | |
| | 18-Dec-2013 | | | 15,508 | | | | – | | | | 1,187 | | | | – | | | | – | | | | – | | | | 16,695 | | | | Aug 2016 | | | | A$35.79 | | | | – | | | | – | |
| | | | | | | | | | | | | | | | | | | | | | | | | | | | | | | | | | | | | | | | | | | | | | |
| | | | | 31,016 | | | | – | | | | 2,374 | | | | – | | | | – | | | | – | | | | 33,390 | | | | | | | | | | | | | | | | | |
| | | | | | | | | | | | | | | | | | | | | | | | | | | | | | | | | | | | | | | | | | | | | | |
Jimmy Wilson | | 18-Dec-2013 | | | 18,245 | | | | – | | | | 1,396 | | | | – | | | | – | | | | – | | | | 19,641 | | | | Aug 2017 | | | | A$35.79 | | | | – | | | | – | |
| | 18-Dec-2013 | | | 18,245 | | | | – | | | | 1,396 | | | | – | | | | – | | | | – | | | | 19,641 | | | | Aug 2016 | | | | A$35.79 | | | | – | | | | – | |
| | | | | | | | | | | | | | | | | | | | | | | | | | | | | | | | | | | | | | | | | | | | | | |
| | | | | 36,490 | | | | – | | | | 2,792 | | | | – | | | | – | | | | – | | | | 39,282 | | | | | | | | | | | | | | | | | |
| | | | | | | | | | | | | | | | | | | | | | | | | | | | | | | | | | | | | | | | | | | | | | |
| (1) | The holding period for each award ends on 30 June in the year the award ‘may vest’ if the conditions for vesting are met as described above the table. Awards will vest on or as soon as practicable after the first non-prohibited period date occurring after 30 June.June of the third financial year after allocation (for tranche one) and the fourth financial year after vesting (for tranche two) if the conditions for vesting are met as described above. The estimated vesting month is shown in the table. No exercise requirement or expiry date applies to these awards and there is no price payable by the individual on vesting. Where performance conditions are not met at vesting, awards will lapse. |
| (2) | The market pricesAwards shown as held by Mike Fraser, Graham Kerr, and Jane McAloon are the closing prices of BHP Billiton shares on 5 December 2012. No price is payable by the individual for acquiring the Restricted Sharestheir balances at the timedate they ceased being KMP. The subsequent treatment of grant. The grant date IFRS fair values of thetheir awards are estimated at the start of the vesting period, being 1 July 2012, and were $28.90 and £16.33 for tranche one, and A$28.10 and £15.78 for tranche two.is set out in section 4.4.18. |
Equity awards provided for pre-GMC service
6.4.54.4.23 STI awards of Deferred Shares and Options under the GSTIP and GIS
The table below shows GSTIP awards that were held by the executives at the time that they were appointed to the GMC or which were allocated in relation to performance and service before they became GMC members.
Prior to their appointment as members of the GMC, the individuals listedshown in the tablestable below received STl awards:
awards under the Group Short Term Incentive Plan (GSTIP),GSTIP which has applied for the non-GMC management of BHP Billiton since the awards allocated in FY2010FY2009 (in relation to FY2009FY2008 performance);
.
prior to that under the GIS, which applied to non-GMC management (as well as to the GMC members) before the GSTIP was introduced.
The terms and conditions of the GSTIP awards are essentially the same as those provided under the GIS.GIS and the STIP. Under both plans,each plan, participants must satisfy applicable STl performance conditions in order to be eligible for any award. Due to changes in the GSTIP, which applied to all participants in that plan, no DEP is payable on the GSTIP awards that were allocated in FY2012 (in relation to FY2011 performance) or since that time.
| Name | | Date of grant | | Option
exercise
price
payable | | At
1 July
2012 (1) | | Granted | | Vested | | Lapsed | | Exercised | | At
30 June
2013 | | Date award
may vest and
become
exercisable (2) | | Market
price on
date of
grant (3) | | Market price
on date of
vesting (4) | | Market
price on
date of
exercise (5) | | Aggregate
gain on
Awards
(’000) (4) | | DEP on
awards
(’000) (6) | | | Date of grant | | At
1 July
2014 | | | Granted | | | Uplift | | | Vested | | | Lapsed | | | At
30 June
2015 | | | Award
vesting
date (1) | | | Market
price on
date of
grant (2) | | | Market
price on
date of
vesting (3) | | | Aggregate
gain on
awards
(’000) (3) | |
Awards under the GSTIP | | | | | | | | | | | | | | | | | | | | | | | | | | | | | |
Peter Beaven | | 31 Oct 2012 | | | – | | | 13,756 | | | – | | | – | | | – | | | – | | | 13,756 | | | Aug 2014 | | | A$ | 34.25 | | | – | | | – | | | – | | | – | | | 18-Dec-2013 | | | 12,082 | | | | – | | | | 925 | | | | – | | | | – | | | | 13,007 | | | | Aug 2015 | | | | A$35.79 | | | | – | | | | – | |
| | 31 Oct 2011 | | | – | | | 13,256 | | | – | | | – | | | – | | | – | | | 13,256 | | | Aug 2013 | | | A$ | 37.80 | | | – | | | – | | | – | | | – | | | 31-Oct-2012 | | | 13,756 | | | | – | | | | – | | | | 13,756 | | | | – | | | | – | | | | 20-Aug-2014 | | | | A$34.25 | | | | A$38.13 | | | | A$525 | |
| | 29 Oct 2010 | | | – | | | 10,596 | | | – | | | – | | | – | | | – | | | 10,596 | | | 22 Aug 2012 | | | A$ | 41.92 | | | A$33.16 | | | – | | | – | | | – | | | | | | | | | | | | | | | | | | | | | | | | | | | | | |
| | 30 Oct 2009 | | | A$ | 38.41 | | | 10,002 | | | – | | | – | | | – | | | – | | | 10,002 | | | 25 Aug 2011 | | | A$ | 37.45 | | | A$38.64 | | | – | | | – | | | – | | | | | | 25,838 | | | | – | | | | 925 | | | | 13,756 | | | | – | | | | 13,007 | | | | | | | | | |
| | 30 Oct 2009 | | | – | | | 8,335 | | | – | | | – | | | – | | | – | | | 8,335 | | | 25 Aug 2011 | | | A$ | 37.45 | | | A$38.64 | | | – | | | – | | | – | | | | | | | | | | | | | | | | | | | | | | | | | | | | | |
Tim Cutt | | | 18-Dec-2013 | | | 10,637 | | | | – | | | | 814 | | | | – | | | | – | | | | 11,451 | | | | Aug 2015 | | | | A$35.79 | | | | – | | | | – | |
| | | | | | | | | | | | | | | | | | | | | | | | | | | | | | | | | | | | 14-Nov-2012 | | | 11,402 | | | | – | | | | – | | | | 11,402 | | | | – | | | | – | | | | 20-Aug-2014 | | | | A$33.73 | | | | A$38.13 | | | | A$435 | |
Total | | | | | | 55,945 | | | – | | | – | | | – | | | – | | | 55,945 | | | | | | | | | | | | | | |
| | | | | | | | | | | | | | | | | | | | | | | | | | | | | |
| | | | | | 22,039 | | | | – | | | | 814 | | | | 11,402 | | | | – | | | | 11,451 | | | | | | | | | |
| | | | | | | | | | | | | | | | | | | | | | | | | | | | | | | | | | | | | | | | | | | | | | | | | | | | | | | | | | | | | | |
Dean Dalla Valle | | 31 Oct 2012 | | | – | | | 12,407 | | | – | | | – | | | – | | | – | | | 12,407 | | | Aug 2014 | | | A$ | 34.25 | | | – | | | – | | | – | | | – | | | 18-Dec-2013 | | | 10,009 | | | | – | | | | 766 | | | | – | | | | – | | | | 10,775 | | | | Aug 2015 | | | | A$35.79 | | | | – | | | | – | |
| | 31 Oct 2011 | | | – | | | 13,561 | | | – | | | – | | | – | | | – | | | 13,561 | | | Aug 2013 | | | A$ | 37.80 | | | – | | | – | | | – | | | – | | | 31-Oct-2012 | | | 12,407 | | | | – | | | | – | | | | 12,407 | | | | – | | | | – | | | | 20-Aug-2014 | | | | A$34.25 | | | | A$38.13 | | | | A$473 | |
| | | | | | | | | | | | | | | | | | | | | | | | | | | | | | | | | | | | | | | | | | | | | | | | | | | | | | | | |
| | | | | | | | | | | | | | | | | | | | | | | | | | | | | | | | | | | | | | | 22,416 | | | | – | | | | 766 | | | | 12,407 | | | | – | | | | 10,775 | | | | | | | | | |
Total | | | | | | 25,968 | | | | – | | | – | | | – | | | – | | | 25,968 | | | | | | | | | | | | | | |
| | | | | | | | | | | | | | | | | | | | | | | | | | | | | | | | | | | | | | | | | | | | | | | | | | | | | | | | | | | | | | |
Mike Fraser(4) | | | 18-Dec-2013 | | | 5,020 | | | | – | | | | – | | | | – | | | | – | | | | 5,020 | | | | Aug 2015 | | | | A$35.79 | | | | – | | | | – | |
| | | 31-Oct-2012 | | | 3,831 | | | | – | | | | – | | | | 3,831 | | | | – | | | | – | | | | 20-Aug-2014 | | | | £19.86 | | | | £19.65 | | | | £76 | |
| | | | | | | | | | | | | | | | | | | | | | | | | | | | | |
| | | | | | 8,851 | | | | – | | | | – | | | | 3,831 | | | | – | | | | 5,020 | | | | | | | | | |
| | | | | | | | | | | | | | | | | | | | | | | | | | | | | |
Mike Henry(5) | | | 22-Aug-2013 | | | 5,715 | | | | – | | | | – | | | | 5,715 | | | | – | | | | – | | | | 20-Aug-2014 | | | | A$35.37 | | | | A$38.13 | | | | A$218 | |
| | | | | | | | | | | | | | | | | | | | | | | | | | | | | |
| | | | | | 5,715 | | | | – | | | | – | | | | 5,715 | | | | – | | | | – | | | | | | | | | |
| | | | | | | | | | | | | | | | | | | | | | | | | | | | | |
Graham Kerr(5) | | | 22-Aug-2013 | | | 4,501 | | | | – | | | | – | | | | 4,501 | | | | – | | | | – | | | | 20-Aug-2014 | | | | A$35.37 | | | | A$38.13 | | | | A$172 | |
| | | | | | | | | | | | | | | | | | | | | | | | | | | | | |
| | | | | | 4,501 | | | | – | | | | – | | | | 4,501 | | | | – | | | | – | | | | | | | | | |
| | | | | | | | | | | | | | | | | | | | | | | | | | | | | |
Jane McAloon (4) | | | 18-Dec-2013 | | | 6,709 | | | | – | | | | 514 | | | | – | | | | – | | | | 7,223 | | | | Aug 2015 | | | | A$35.79 | | | | – | | | | – | |
| | | 14-Nov-2012 | | | 8,698 | | | | – | | | | – | | | | 8,698 | | | | – | | | | – | | | | 20-Aug-2014 | | | | A$33.73 | | | | A$38.13 | | | | A$332 | |
| | | | | | | | | | | | | | | | | | | | | | | | | | | | | |
| | | | | | 15,407 | | | | – | | | | 514 | | | | 8,698 | | | | – | | | | 7,223 | | | | | | | | | |
| | | | | | | | | | | | | | | | | | | | | | | | | | | | | |
Daniel Malchuk | | | 18-Dec-2013 | | | 8,577 | | | | – | | | | 657 | | | | – | | | | – | | | | 9,234 | | | | Aug 2015 | | | | A$35.79 | | | | – | | | | – | |
| | | 31-Oct-2012 | | | 6,884 | | | | – | | | | – | | | | 6,884 | | | | – | | | | – | | | | 20-Aug-2014 | | | | A$34.25 | | | | A$38.13 | | | | A$262 | |
| | | | | | | | | | | | | | | | | | | | | | | | | | | | | |
| | | | | | 15,461 | | | | – | | | | 657 | | | | 6,884 | | | | – | | | | 9,234 | | | | | | | | | |
| | | | | | | | | | | | | | | | | | | | | | | | | | | | | |
| | | | | | | | | | | | | | | | | | | | | | | | | | | | | | | | | | | | | | | | | | | | | | | | | | | | | | | | |
Name | | Date of grant | | | Option
exercise
price
payable | | | At
1 July
2012 (1) | | | Granted | | | Vested | | | Lapsed | | | Exercised | | | At
30 June
2013 | | | Date award
may vest and
become
exercisable (2) | | | Market
price on
date of
grant (3) | | | Market price
on date of
vesting (4) | | | Market
price on
date of
exercise (5) | | | Aggregate
gain on
Awards
(’000) (4) | | | DEP on
awards
(’000) (6) | |
Mike Henry (7) | | | 22 Aug 2013 | | | | – | | | | – | | | | 5,715 | | | | – | | | | – | | | | – | | | | 5,715 | | | | Aug 2014 | | | | A$35.37 | | | | – | | | | – | | | | – | | | | – | |
| | | 31 Oct 2011 | | | | – | | | | 16,566 | | | | – | | | | – | | | | – | | | | – | | | | 16,566 | | | | Aug 2013 | | | | £19.68 | | | | – | | | | – | | | | – | | | | – | |
| | | 29 Oct 2010 | | | | – | | | | 8,259 | | | | – | | | | 8,259 | | | | – | | | | 8,259 | | | | – | | | | 2 Oct 2012 | | | | £22.14 | | | | £19.45 | | | | £19.45 | | | | £161 | | | | US$17 | |
| | | | | | | | | | | | | | | | | | | | | | | | | | | | | | | | | | | | | | | | | | | | | | | | | | | | | | | | |
Total | | | | | | | | | | | 24,825 | | | | 5,715 | | | | 8,259 | | | | – | | | | 8,259 | | | | 22,281 | | | | | | | | | | | | | | | | | | | | | | | | | |
| | | | | | | | | | | | | | | | | | | | | | | | | | | | | | | | | | | | | | | | | | | | | | | | | | | | | | | | |
Graham Kerr (7) | | | 22 Aug 2013 | | | | – | | | | – | | | | 4,501 | | | | – | | | | – | | | | – | | | | 4,501 | | | | Aug 2014 | | | | A$35.37 | | | | – | | | | – | | | | – | | | | – | |
| | | 31 Oct 2011 | | | | – | | | | 11,963 | | | | – | | | | – | | | | – | | | | – | | | | 11,963 | | | | Aug 2013 | | | | A$37.80 | | | | – | | | | – | | | | – | | | | – | |
| | | 29 Oct 2010 | | | | – | | | | 10,160 | | | | – | | | | 10,160 | | | | – | | | | 10,160 | | | | – | | | | 2 Oct 2012 | | | | A$41.92 | | | | A$33.54 | | | | A$33.54 | | | | A$341 | | | | US$20 | |
| | | 30 Oct 2009 | | | A$ | 38.41 | | | | 17,345 | | | | – | | | | – | | | | – | | | | – | | | | 17,345 | | | | 25 Aug 2011 | | | | A$37.45 | | | | A$38.64 | | | | – | | | | – | | | | – | |
| | | 30 Oct 2009 | | | | – | | | | 4,818 | | | | – | | | | – | | | | – | | | | – | | | | 4,818 | | | | 25 Aug 2011 | | | | A$37.45 | | | | A$38.64 | | | | – | | | | – | | | | – | |
| | | | | | | | | | | | | | | | | | | | | | | | | | | | | | | | | | | | | | | | | | | | | | | | | | | | | | | | |
Total | | | | | | | | | | | 44,286 | | | | 4,501 | | | | 10,160 | | | | – | | | | 10,160 | | | | 38,627 | | | | | | | | | | | | | | | | | | | | | | | | | |
| | | | | | | | | | | | | | | | | | | | | | | | | | | | | | | | | | | | | | | | | | | | | | | | | | | | | | | | |
Jane McAloon | | | 14 Nov 2012 | | | | – | | | | 8,698 | | | | – | | | | – | | | | – | | | | – | | | | 8,698 | | | | Aug 2014 | | | | A$33.73 | | | | – | | | | – | | | | – | | | | – | |
| | | 31 Oct 2011 | | | | – | | | | 9,119 | | | | – | | | | – | | | | – | | | | – | | | | 9,119 | | | | Aug 2013 | | | | A$37.80 | | | | – | | | | – | | | | – | | | | – | |
| | | | | | | | | | | | | | | | | | | | | | | | | | | | | | | | | | | | | | | | | | | | | | | | | | | | | | | | |
Total | | | | | | | | | | | 17,817 | | | | – | | | | – | | | | – | | | | – | | | | 17,817 | | | | | | | | | | | | | | | | | | | | | | | | | |
| | | | | | | | | | | | | | | | | | | | | | | | | | | | | | | | | | | | | | | | | | | | | | | | | | | | | | | | |
Daniel Malchuk | | | 31 Oct 2012 | | | | – | | | | 6,884 | | | | – | | | | – | | | | – | | | | – | | | | 6,884 | | | | Aug 2014 | | | | A$34.25 | | | | – | | | | – | | | | – | | | | – | |
| | | 31 Oct 2011 | | | | – | | | | 8,855 | | | | – | | | | – | | | | – | | | | – | | | | 8,855 | | | | Aug 2013 | | | | A$37.80 | | | | – | | | | – | | | | – | | | | – | |
| | | 29 Oct 2010 | | | | – | | | | 4,791 | | | | – | | | | – | | | | – | | | | – | | | | 4,791 | | | | 22 Aug 2012 | | | | A$41.92 | | | | A$33.16 | | | | – | | | | – | | | | – | |
| | | 30 Oct 2009 | | | | – | | | | 5,939 | | | | – | | | | – | | | | – | | | | – | | | | 5,939 | | | | 25 Aug 2011 | | | | A$37.45 | | | | A$38.64 | | | | – | | | | – | | | | – | |
| | | | | | | | | | | | | | | | | | | | | | | | | | | | | | | | | | | | | | | | | | | | | | | | | | | | | | | | |
Total | | | | | | | | | | | 26,469 | | | | – | | | | – | | | | – | | | | – | | | | 26,469 | | | | | | | | | | | | | | | | | | | | | | | | | |
| | | | | | | | | | | | | | | | | | | | | | | | | | | | | | | | | | | | | | | | | | | | | | | | | | | | | | | | |
Jimmy Wilson | | | 31 Oct 2012 | | | | – | | | | 16,611 | | | | – | | | | – | | | | – | | | | – | | | | 16,611 | | | | Aug 2014 | | | | A$34.25 | | | | – | | | | – | | | | – | | | | – | |
| | | 31 Oct 2011 | | | | – | | | | 16,127 | | | | – | | | | – | | | | – | | | | – | | | | 16,127 | | | | Aug 2013 | | | | A$37.80 | | | | – | | | | – | | | | – | | | | – | |
| | | | | | | | | | | | | | | | | | | | | | | | | | | | | | | | | | | | | | | | | | | | | | | | | | | | | | | | |
Total | | | | | | | | | | | 32,738 | | | | – | | | | – | | | | – | | | | – | | | | 32,738 | | | | | | | | | | | | | | | | | | | | | | | | | |
| | | | | | | | | | | | | | | | | | | | | | | | | | | | | | | | | | | | | | | | | | | | | | | | | | | | | | | | |
Awards under the GIS | | | | | | | | | | | | | | | | | | | | | | | | | | | | | | | | | | | | | | | | | | | | | | | | | | | | | | | | |
Graham Kerr | | | 4 Dec 2008 | | | | – | | | | 15,169 | | | | – | | | | – | | | | – | | | | 15,169 | | | | – | | | | 25 Aug 2011 | | | | A$27.50 | | | | A$38.64 | | | | A$34.54 | | | | A$524 | | | | A$73 | |
| | | | | | | | | | | | | | | | | | | | | | | | | | | | | | | | | | | | | | | | | | | | | | | | | | | | | | | | |
| | | | | | | | | | | | | | | | | | | | | | | | | | | | | | | | | | | | | | | | | | | | | | | | | | | | | | | | |
Total | | | | | | | | | | | 15,169 | | | | – | | | | – | | | | – | | | | 15,169 | | | | – | | | | | | | | | | | | | | | | | | | | | | | | | |
| | | | | | | | | | | | | | | | | | | | | | | | | | | | | | | | | | | | | | | | | | | | | | | | | | | | | | | | |
| | | | | | | | | | | | | | | | | | | | | | | | | | | | | | | | | | | | | | | | | | |
Name | | Date of grant | | At
1 July
2014 | | | Granted | | | Uplift | | | Vested | | | Lapsed | | | At
30 June
2015 | | | Award
vesting
date (1) | | | Market
price on
date of
grant (2) | | | Market
price on
date of
vesting (3) | | | Aggregate
gain on
awards
(’000) (3) | |
Athalie Williams (6) | | 03-Nov-2014 | | | 6,692 | | | | – | | | | 512 | | | | – | | | | – | | | | 7,204 | | | | Aug 2016 | | | | A$33.71 | | | | – | | | | – | |
| | 31-Oct-2013 | | | 4,555 | | | | – | | | | 349 | | | | – | | | | – | | | | 4,904 | | | | Aug 2015 | | | | A$37.66 | | | | – | | | | – | |
| | | | | | | | | | | | | | | | | | | | | | | | | | | | | | | | | | | | | | | | | | |
| | | | | 11,247 | | | | – | | | | 861 | | | | – | | | | – | | | | 12,108 | | | | | | | | | | | | | | | | | |
| | | | | | | | | | | | | | | | | | | | | | | | | | | | | | | | | | | | | | | | | | |
Jimmy Wilson | | 18-Dec-2013 | | | 12,466 | | | | – | | | | 954 | | | | – | | | | – | | | | 13,420 | | | | Aug 2015 | | | | A$35.79 | | | | – | | | | – | |
| | 31-Oct-2012 | | | 16,611 | | | | – | | | | – | | | | 16,611 | | | | – | | | | – | | | | 20-Aug-2014 | | | | A$34.25 | | | | A$38.13 | | | A$ | 633 | |
| | | | | | | | | | | | | | | | | | | | | | | | | | | | | | | | | | | | | | | | | | |
| | | | | 29,077 | | | | – | | | | 954 | | | | 16,611 | | | | – | | | | 13,420 | | | | | | | | | | | | | | | | | |
| | | | | | | | | | | | | | | | | | | | | | | | | | | | | | | | | | | | | | | | | | |
| (1) | The opening balance shown for individuals who have become KMP upon joining the GMC on 10 May 2013 reflects their holdings on that date (rather than on 1 July 2012). |
(2) | The holding period for each award ends on 30 June in the year the award ‘may vest and become exercisable’ if the conditions for vesting are met (including the relevant service conditions). Under the GSTIP, awardsAwards will vest and become exercisable on, or as soon as practicable after, the first non-prohibited period date occurring after 30 June.June of the second financial year after allocation, if the conditions for vesting are met (including the relevant service conditions). The estimated vesting month is shown in the table. Where applicable, the expiry date of awards is the day prior to the third anniversary of that vesting date. |
(3)(2) | The market price shown for grants made during FY2013FY2015 is the closing price of BHP Billiton shares on the relevant date of grant.3 November 2014. No price is payable by the individual for acquiring the Deferred Sharesaward at the time of grant. The grant date IFRS fair valuesvalue of the awards areis estimated as at the start of the vesting period, being 1 July 2012,2014, and werewas A$31.72 and £18.30.33.60. No exercise requirement or expiry date applies to these awards (as described above the table). |
(4)(3) | All (100 per cent) of the Deferred SharesThe awards granted under the GSTIP in October 20102012 became fully vested on 3 October 201220 August 2014 as the service conditions were met, as described in footnote 1. The price shown is the closing price of BHP Billiton shares on that date. |
(5) | met. The market price shown (and used for calculating the aggregate gain)gain of the total award) is the closing price of BHP Billiton shares on the date that the individual exercised their Deferred Shares. No price is payable by the individual for exercising the Deferred Shares. One ordinary BHP Billiton share is acquired for each Deferred Share exercised.award vested. |
(6)(4) | Awards shown as held by Mike Fraser, Graham Kerr, and Jane McAloon at 30 June 2015 are their balances at the date they ceased being KMP. The amounts shown in this column are the valuesubsequent treatment of the DEP paid on thetheir awards as describedis set out in section 6.2.10.4.4.18. |
(7)(5) | The awards shown for Mike Henry and Graham Kerr and Mike Henry with a grant date of 22 August 2013 had this allocation date due to administrative reasons, but were made on the same basis as if they had been made on 5 December 2012. |
6.4.6
| (6) | The opening balance of awards for Athalie Williams reflects her holdings on the date she commenced being KMP. |
4.4.24 LTI awards of Restricted Shares under the MAP and Performance Shares under the LTIP
The table below shows awards that were held by the executives at the time that they were appointed to the GMC.
Prior to their appointment as members of the GMC, the individuals listed in the tables below received LTI awards:
under the Management Award Plan (MAP),MAP which has applied for the non-GMC management of BHP Billiton since FY2009;
prior to that under the LTIP which applied to non-GMC management (as well as to the GMC members) before the MAP was introduced.
Mr Henry and Mr Kerr received their firstSection 4.4.21 for details of LTIP awards as membersallocated for GMC service
As the primary purpose of the GMC in December 2012 as shown in section 6.3.4. Other GMC members listed will receive their first LTIP award in December 2013.
TheMAP is the retention of key senior management employees, the plan has no performance conditions after awards are granted and the vesting of MAP awards is subject to a service condition of continued employment with the Group through to the vesting date as shown in the table below.table. Where a participant resigns or is terminated for cause prior to the vesting date, their unvested MAP awards are forfeited. If a participant’s employment ends due to death, illness or injury, a pro rata number of unvested Restricted Shares will vest based on the portion of the relevant vesting period served. Due to changes in the MAP, which applied to all participants in that plan, noNo DEP is payable on the MAP awards that were allocated in FY2012 or since that time.
| | | | | | | | | | | | | | | | | | | | | | | | | | | | | | | | | | | | | | | | | | | | | | | | | | | | |
Name | | Date of grant | | | At
1 July
2012 (1) | | | Granted | | | Vested | | | Lapsed | | | Exercised | | | At
30 June
2013 | | | Date award
may vest and
become
exercisable (2) | | | Market
price on
date of
grant (3) | | | Market
price on
date of
vesting (4) | | | Market
price on
date of
exercise (5) | | | Aggregate
gain on
awards
(’000) | | | DEP on
awards
(’000) (6) | |
Awards under the MAP | |
Peter Beaven | | | 31 Oct 2012 | | | | 34,250 | | | | – | | | | – | | | | – | | | | – | | | | 34,250 | | | | Aug 2015 | | | | A$34.25 | | | | – | | | | – | | | | – | | | | – | |
| | | 31 Oct 2011 | | | | 31,700 | | | | – | | | | – | | | | – | | | | – | | | | 31,700 | | | | Aug 2014 | | | | A$37.80 | | | | – | | | | – | | | | – | | | | – | |
| | | 29 Oct 2010 | | | | 30,500 | | | | – | | | | – | | | | – | | | | – | | | | 30,500 | | | | Aug 2013 | | | | A$41.92 | | | | – | | | | – | | | | – | | | | – | |
| | | 30 Oct 2009 | | | | 21,000 | | | | – | | | | – | | | | – | | | | – | | | | 21,000 | | | | 22 Aug 2012 | | | | A$37.45 | | | | A$33.16 | | | | – | | | | – | | | | – | |
| | | 19 Nov 2008 | | | | 21,000 | | | | – | | | | – | | | | – | | | | – | | | | 21,000 | | | | 25 Aug 2011 | | | | A$38.61 | | | | A$38.64 | | | | – | | | | – | | | | – | |
| | | | | | | | | | | | | | | | | | | | | | | | | | | | | | | | | | | | | | | | | | | | | | | | | | | | |
Total | | | | | | | 138,450 | | | | – | | | | – | | | | – | | | | – | | | | 138,450 | | | | | | | | | | | | | | | | | | | | | | | | | |
| | | | | | | | | | | | | | | | | | | | | | | | | | | | | | | | | | | | | | | | | | | | | | | | | | | | |
Dean Dalla Valle | | | 31 Oct 2012 | | | | 27,000 | | | | – | | | | – | | | | – | | | | – | | | | 27,000 | | | | Aug 2015 | | | | A$34.25 | | | | – | | | | – | | | | – | | | | – | |
| | | 31 Oct 2011 | | | | 25,000 | | | | – | | | | – | | | | – | | | | – | | | | 25,000 | | | | Aug 2014 | | | | A$37.80 | | | | – | | | | – | | | | – | | | | – | |
| | | 29 Oct 2010 | | | | 19,500 | | | | – | | | | – | | | | – | | | | – | | | | 19,500 | | | | Aug 2013 | | | | A$41.92 | | | | – | | | | – | | | | – | | | | – | |
| | | | | | | | | | | | | | | | | | | | | | | | | | | | | | | | | | | | | | | | | | | | | | | | | | | | |
Total | | | | | | | 71,500 | | | | – | | | | – | | | | – | | | | – | | | | 71,500 | | | | | | | | | | | | | | | | | | | | | | | | | |
| | | | | | | | | | | | | | | | | | | | | | | | | | | | | | | | | | | | | | | | | | | | | | | | | | | | |
Mike Henry(7) | | | 25 Nov 2011 | | | | 5,900 | | | | – | | | | – | | | | – | | | | – | | | | 5,900 | | | | Aug 2014 | | | | £17.60 | | | | – | | | | – | | | | – | | | | – | |
| | | 31 Oct 2011 | | | | 29,500 | | | | – | | | | – | | | | – | | | | – | | | | 29,500 | | | | Aug 2014 | | | | £19.68 | | | | – | | | | – | | | | – | | | | – | |
| | | 29 Oct 2010 | | | | 19,500 | | | | – | | | | – | | | | – | | | | – | | | | 19,500 | | | | Aug 2013 | | | | £22.14 | | | | – | | | | – | | | | – | | | | – | |
| | | 30 Oct 2009 | | | | 12,000 | | | | – | | | | 12,000 | | | | – | | | | 12,000 | | | | – | | | | 2 Oct 2012 | | | | £16.44 | | | | £19.45 | | | | £19.45 | | | | £233 | | | | US$34 | |
| | | | | | | | | | | | | | | | | | | | | | | | | | | | | | | | | | | | | | | | | | | | | | | | | | | | |
Total | | | | | | | 66,900 | | | | – | | | | 12,000 | | | | – | | | | 12,000 | | | | 54,900 | | | | | | | | | | | | | | | | | | | | | | | | | |
| | | | | | | | | | | | | | | | | | | | | | | | | | | | | | | | | | | | | | | | | | | | | | | | | | | | |
Graham Kerr(7) | | | 25 Nov 2011 | | | | 9,750 | | | | – | | | | – | | | | – | | | | – | | | | 9,750 | | | | Aug 2014 | | | | A$34.05 | | | | – | | | | – | | | | – | | | | – | |
| | | 31 Oct 2011 | | | | 20,250 | | | | – | | | | – | | | | – | | | | – | | | | 20,250 | | | | Aug 2014 | | | | A$37.80 | | | | – | | | | – | | | | – | | | | – | |
| | | 29 Oct 2010 | | | | 19,500 | | | | – | | | | – | | | | – | | | | – | | | | 19,500 | | | | Aug 2013 | | | | A$41.92 | | | | – | | | | – | | | | – | | | | – | |
| | | 30 Oct 2009 | | | | 21,000 | | | | – | | | | 21,000 | | | | – | | | | 21,000 | | | | – | | | | 2 Oct 2012 | | | | A$37.45 | | | | A$33.43 | | | | A$33.43 | | | | A$702 | | | | US$60 | |
| | | 19 Nov 2008 | | | | 21,000 | | | | – | | | | | | | | – | | | | – | | | | 21,000 | | | | 25 Aug 2011 | | | | A$38.61 | | | | A$38.64 | | | | – | | | | – | | | | – | |
| | | | | | | | | | | | | | | | | | | | | | | | | | | | | | | | | | | | | | | | | | | | | | | | | | | | |
Total | | | | | | | 91,500 | | | | – | | | | 21,000 | | | | – | | | | 21,000 | | | | 70,500 | | | | | | | | | | | | | | | | | | | | | | | | | |
| | | | | | | | | | | | | | | | | | | | | | | | | | | | | | | | | | | | | | | | | | | | | | | | | | | | |
Jane McAloon | | | 14 Nov 2012 | | | | 17,900 | | | | – | | | | – | | | | – | | | | – | | | | 17,900 | | | | Aug 2015 | | | | A$33.73 | | | | – | | | | – | | | | – | | | | – | |
| | | 31 Oct 2011 | | | | 16,600 | | | | – | | | | – | | | | – | | | | – | | | | 16,600 | | | | Aug 2014 | | | | A$37.80 | | | | – | | | | – | | | | – | | | | – | |
| | | 29 Oct 2010 | | | | 11,000 | | | | – | | | | – | | | | – | | | | – | | | | 11,000 | | | | Aug 2013 | | | | A$41.92 | | | | – | | | | – | | | | – | | | | – | |
| | | | | | | | | | | | | | | | | | | | | | | | | | | | | | | | | | | | | | | | | | | | | | | | | | | | |
Total | | | | | | | 45,500 | | | | – | | | | – | | | | – | | | | – | | | | 45,500 | | | | | | | | | | | | | | | | | | | | | | | | | |
| | | | | | | | | | | | | | | | | | | | | | | | | | | | | | | | | | | | | | | | | | | | | | | | | | | | |
| | | | | | | | | | | | | | | | | | | | | | | | | | | | | | | | | | | | | | | | | | | | |
Name | | Date of grant | | | At
1 July
2014 | | | Granted | | | Uplift | | | Vested | | | Lapsed | | | At
30 June
2015 | | | Award
vesting
date (1) | | | Market
price on
date of
grant (2) | | | Market
price on
date of
vesting (3) | | | Aggregate
gain on
awards
(’000) (3) | |
Awards under the MAP | | | | | | | | | | | | | | | | | | | | | | | | | | | | | | | | | | | | | | | | | | | | |
Peter Beaven | | | 31-Oct-2012 | | | | 34,250 | | | | – | | | | 2,621 | | | | – | | | | – | | | | 36,871 | | | | Aug 2015 | | | | A$34.25 | | | | – | | | | – | |
| | | 31-Oct-2011 | | | | 31,700 | | | | – | | | | – | | | | 31,700 | | | | – | | | | – | | | | 20-Aug-2014 | | | | A$37.80 | | | | A$38.13 | | | | A$1,209 | |
| | | | | | | | | | | | | | | | | | | | | | | | | | | | | | | | | | | | | | | | | | | | |
| | | | | | | 65,950 | | | | – | | | | 2,621 | | | | 31,700 | | | | – | | | | 36,871 | | | | | | | | | | | | | | | | | |
| | | | | | | | | | | | | | | | | | | | | | | | | | | | | | | | | | | | | | | | | | | | |
Tim Cutt | | | 14-Nov-2012 | | | | 27,000 | | | | – | | | | 2,066 | | | | – | | | | – | | | | 29,066 | | | | Aug 2015 | | | | A$33.73 | | | | – | | | | – | |
| | | 31-Oct-2011 | | | | 25,000 | | | | – | | | | – | | | | 25,000 | | | | – | | | | – | | | | 20-Aug-2014 | | | | A$37.80 | | | | A$38.13 | | | | A$953 | |
| | | | | | | | | | | | | | | | | | | | | | | | | | | | | | | | | | | | | | | | | | | | |
| | | | | | | 52,000 | | | | – | | | | 2,066 | | | | 25,000 | | | | – | | | | 29,066 | | | | | | | | | | | | | | | | | |
| | | | | | | | | | | | | | | | | | | | | | | | | | | | | | | | | | | | | | | | | | | | |
Dean Dalla Valle | | | 31-Oct-2012 | | | | 27,000 | | | | – | | | | 2,066 | | | | – | | | | – | | | | 29,066 | | | | Aug 2015 | | | | A$34.25 | | | | – | | | | – | |
| | | 31-Oct-2011 | | | | 25,000 | | | | – | | | | – | | | | 25,000 | | | | – | | | | – | | | | 20-Aug-2014 | | | | A$37.80 | | | | A$38.13 | | | | A$953 | |
| | | | | | | | | | | | | | | | | | | | | | | | | | | | | | | | | | | | | | | | | | | | |
| | | | | | | 52,000 | | | | – | | | | 2,066 | | | | 25,000 | | | | – | | | | 29,066 | | | | | | | | | | | | | | | | | |
| | | | | | | | | | | | | | | | | | | | | | | | | | | | | | | | | | | | | | | | | | | | |
Mike Fraser(4) | | | 22-Aug-2013 | | | | 10,045 | | | | – | | | | – | | | | – | | | | – | | | | 10,045 | | | | Aug 2015 | | | | A$35.37 | | | | – | | | | – | |
| | | 31-Oct-2011 | | | | 11,330 | | | | – | | | | – | | | | 11,330 | | | | – | | | | – | | | | 20-Aug-2014 | | | | £19.68 | | | | £19.65 | | | | £224 | |
| | | | | | | | | | | | | | | | | | | | | | | | | | | | | | | | | | | | | | | | | | | | |
| | | | | | | 21,375 | | | | – | | | | – | | | | 11,330 | | | | – | | | | 10,045 | | | | | | | | | | | | | | | | | |
| | | | | | | | | | | | | | | | | | | | | | | | | | | | | | | | | | | | | | | | | | | | |
Mike Henry | | | 25-Nov-2011 | | | | 5,900 | | | | – | | | | – | | | | 5,900 | | | | – | | | | – | | | | 20-Aug-2014 | | | | £17.60 | | | | £19.65 | | | | £117 | |
| | | 31-Oct-2011 | | | | 29,500 | | | | – | | | | – | | | | 29,500 | | | | – | | | | – | | | | 20-Aug-2014 | | | | £19.68 | | | | £19.65 | | | | £584 | |
| | | | | | | | | | | | | | | | | | | | | | | | | | | | | | | | | | | | | | | | | | | | |
| | | | | | | 35,400 | | | | – | | | | – | | | | 35,400 | | | | – | | | | – | | | | | | | | | | | | | | | | | |
| | | | | | | | | | | | | | | | | | | | | | | | | | | | | | | | | | | | | | | | | | | | |
Graham Kerr | | | 25-Nov-2011 | | | | 9,750 | | | | – | | | | – | | | | 9,750 | | | | – | | | | – | | | | 20-Aug-2014 | | | | A$34.05 | | | | A$38.13 | | | | A$372 | |
| | | 31-Oct-2011 | | | | 20,250 | | | | – | | | | – | | | | 20,250 | | | | – | | | | – | | | | 20-Aug-2014 | | | | A$37.80 | | | | A$38.13 | | | | A$772 | |
| | | | | | | | | | | | | | | | | | | | | | | | | | | | | | | | | | | | | | | | | | | | |
| | | | | | | 30,000 | | | | – | | | | – | | | | 30,000 | | | | – | | | | – | | | | | | | | | | | | | | | | | |
| | | | | | | | | | | | | | | | | | | | | | | | | | | | | | | | | | | | | | | | | | | | |
Jane McAloon(4) | | | 14-Nov-2012 | | | | 17,900 | | | | – | | | | 1,370 | | | | – | | | | – | | | | 19,270 | | | | Aug 2015 | | | | A$33.73 | | | | – | | | | – | |
| | | 31-Oct-2011 | | | | 16,600 | | | | – | | | | – | | | | 16,600 | | | | – | | | | – | | | | 20-Aug-2014 | | | | A$37.80 | | | | A$38.13 | | | | A$633 | |
| | | | | | | | | | | | | | | | | | | | | | | | | | | | | | | | | | | | | | | | | | | | |
| | | | | | | 34,500 | | | | – | | | | 1,370 | | | | 16,600 | | | | – | | | | 19,270 | | | | | | | | | | | | | | | | | |
| | | | | | | | | | | | | | | | | | | | | | | | | | | | | | | | | | | | | | | | | | | | |
Daniel Malchuk | | | 31-Oct-2012 | | | | 21,900 | | | | – | | | | 1,676 | | | | – | | | | – | | | | 23,576 | | | | Aug 2015 | | | | A$34.25 | | | | – | | | | – | |
| | | 31-Oct-2011 | | | | 9,600 | | | | – | | | | – | | | | 9,600 | | | | – | | | | – | | | | 20-Aug-2014 | | | | A$37.80 | | | | A$38.13 | | | | A$366 | |
| | | | | | | | | | | | | | | | | | | | | | | | | | | | | | | | | | | | | | | | | | | | |
| | | | | | | 31,500 | | | | – | | | | 1,676 | | | | 9,600 | | | | – | | | | 23,576 | | | | | | | | | | | | | | | | | |
| | | | | | | | | | | | | | | | | | | | | | | | | | | | | | | | | | | | | | | | | | | | |
| | | | | | | | | | | | | | | | | | | | | | | | | | | | | | | | | | | | | | | | | | | | | | | | | | | | |
Name | | Date of grant | | | At
1 July
2012 (1) | | | Granted | | | Vested | | | Lapsed | | | Exercised | | | At
30 June
2013 | | | Date award
may vest and
become
exercisable (2) | | | Market
price on
date of
grant (3) | | | Market
price on
date of
vesting (4) | | | Market
price on
date of
exercise (5) | | | Aggregate
gain on
awards
(’000) | | | DEP on
awards
(’000) (6) | |
Daniel Malchuk | | | 31 Oct 2012 | | | | 21,900 | | | | – | | | | – | | | | – | | | | – | | | | 21,900 | | | | Aug 2015 | | | | A$34.25 | | | | – | | | | – | | | | – | | | | – | |
| | | 31 Oct 2011 | | | | 9,600 | | | | – | | | | – | | | | – | | | | – | | | | 9,600 | | | | Aug 2014 | | | | A$37.80 | | | | – | | | | – | | | | – | | | | – | |
| | | 29 Oct 2010 | | | | 9,250 | | | | – | | | | – | | | | – | | | | – | | | | 9,250 | | | | Aug 2013 | | | | A$41.92 | | | | – | | | | – | | | | – | | | | – | |
| | | 30 Oct 2009 | | | | 7,000 | | | | – | | | | – | | | | – | | | | – | | | | 7,000 | | | | 22 Aug 2012 | | | | A$37.45 | | | | A$33.16 | | | | – | | | | – | | | | – | |
| | | 19 Nov 2008 | | | | 7,000 | | | | – | | | | – | | | | – | | | | – | | | | 7,000 | | | | 25 Aug 2011 | | | | A$38.61 | | | | A$38.64 | | | | – | | | | – | | | | – | |
| | | | | | | | | | | | | | | | | | | | | | | | | | | | | | | | | | | | | | | | | | | | | | | | | | | | |
Total | | | | | | | 54,750 | | | | – | | | | – | | | | – | | | | – | | | | 54,750 | | | | | | | | | | | | | | | | | | | | | | | | | |
| | | | | | | | | | | | | | | | | | | | | | | | | | | | | | | | | | | | | | | | | | | | | | | | | | | | |
Jimmy Wilson | | | 31 Oct 2012 | | | | 34,250 | | | | – | | | | – | | | | – | | | | – | | | | 34,250 | | | | Aug 2015 | | | | A$34.25 | | | | – | | | | – | | | | – | | | | – | |
| | | 31 Oct 2011 | | | | 31,700 | | | | – | | | | – | | | | – | | | | – | | | | 31,700 | | | | Aug 2014 | | | | A$37.80 | | | | – | | | | – | | | | – | | | | – | |
| | | 29 Oct 2010 | | | | 30,500 | | | | – | | | | – | | | | – | | | | – | | | | 30,500 | | | | Aug 2013 | | | | A$41.92 | | | | – | | | | – | | | | – | | | | – | |
| | | | | | | | | | | | | | | | | | | | | | | | | | | | | | | | | | | | | | | | | | | | | | | | | | | | |
Total | | | | | | | 96,450 | | | | – | | | | – | | | | – | | | | – | | | | 96,450 | | | | | | | | | | | | | | | | | | | | | | | | | |
| | | | | | | | | | | | | | | | | | | | | | | | | | | | | | | | | | | | | | | | | | | | | | | | | | | | |
Awards under the LTIP | |
Peter Beaven | | | 14 Dec 2007 | | | | 40,000 | | | | – | | | | – | | | | – | | | | – | | | | 40,000 | | | | 22 Aug 2012 | | | | A$42.05 | | | | A$33.16 | | | | – | | | | – | | | | – | |
| | | 7 Dec 2006 | | | | 40,000 | | | | – | | | | – | | | | – | | | | – | | | | 40,000 | | | | 24 Aug 2011 | | | | A$26.40 | | | | A$38.61 | | | | – | | | | – | | | | – | |
| | | 5 Dec 2005 | | | | 40,000 | | | | – | | | | – | | | | – | | | | – | | | | 40,000 | | | | 24 Aug 2010 | | | | A$22.03 | | | | A$37.44 | | | | – | | | | – | | | | – | |
| | | 3 Dec 2004 | | | | 40,000 | | | | – | | | | – | | | | – | | | | – | | | | 40,000 | | | | 11 Aug 2009 | | | | A$15.28 | | | | A$37.99 | | | | – | | | | – | | | | – | |
| | | | | | | | | | | | | | | | | | | | | | | | | | | | | | | | | | | | | | | | | | | | | | | | | | | | |
Total | | | | | | | 160,000 | | | | – | | | | – | | | | – | | | | – | | | | 160,000 | | | | | | | | | | | | | | | | | | | | | | | | | |
| | | | | | | | | | | | | | | | | | | | | | | | | | | | | | | | | | | | | | | | | | | | | | | | | | | | |
Mike Henry | | | 14 Dec 2007 | | | | 20,000 | | | | – | | | | 20,000 | | | | – | | | | 20,000 | | | | – | | | | 2 Oct 2012 | | | | £15.45 | | | | £19.45 | | | | £19.45 | | | | £389 | | | | US$84 | |
| | | | | | | | | | | | | | | | | | | | | | | | | | | | | | | | | | | | | | | | | | | | | | | | | | | | |
Total | | | | | | | 20,000 | | | | – | | | | 20,000 | | | | – | | | | 20,000 | | | | – | | | | | | | | | | | | | | | | | | | | | | | | | |
| | | | | | | | | | | | | | | | | | | | | | | | | | | | | | | | | | | | | | | | | | | | | | | | | | | | |
Graham Kerr | | | 14 Dec 2007 | | | | 40,000 | | | | – | | | | 40,000 | | | | – | | | | 40,000 | | | | – | | | | 2 Oct 2012 | | | | A$42.05 | | | | A$33.43 | | | | A$33.43 | | | | A$1,337 | | | | US$169 | |
| | | 7 Dec 2006 | | | | 20,000 | | | | – | | | | – | | | | – | | | | – | | | | 20,000 | | | | 24 Aug 2011 | | | | A$26.40 | | | | A$38.61 | | | | – | | | | – | | | | – | |
| | | | | | | | | | | | | | | | | | | | | | | | | | | | | | | | | | | | | | | | | | | | | | | | | | | | |
Total | | | | | | | 60,000 | | | | – | | | | 40,000 | | | | – | | | | 40,000 | | | | 20,000 | | | | | | | | | | | | | | | | | | | | | | | | | |
| | | | | | | | | | | | | | | | | | | | | | | | | | | | | | | | | | | | | | | | | | | | | | | | | | | | |
Daniel Malchuk | | | 4 Dec 2007 | | | | 7,500 | | | | – | | | | – | | | | – | | | | – | | | | 7,500 | | | | 22 Aug 2012 | | | | A$42.05 | | | | A$33.16 | | | | – | | | | – | | | | – | |
| | | 7 Dec 2006 | | | | 5,000 | | | | – | | | | – | | | | – | | | | – | | | | 5,000 | | | | 24 Aug 2011 | | | | A$26.40 | | | | A$38.61 | | | | – | | | | – | | | | – | |
| | | 5 Dec 2005 | | | | 5,000 | | | | – | | | | – | | | | – | | | | – | | | | 5,000 | | | | 24 Aug 2010 | | | | A$22.03 | | | | A$37.44 | | | | – | | | | – | | | | – | |
| | | | | | | | | | | | | | | | | | | | | | | | | | | | | | | | | | | | | | | | | | | | | | | | | | | | |
Total | | | | | | | 17,500 | | | | – | | | | – | | | | – | | | | – | | | | 17,500 | | | | | | | | | | | | | | | | | | | | | | | | | |
| | | | | | | | | | | | | | | | | | | | | | | | | | | | | | | | | | | | | | | | | | | | | | | | | | | | |
Jimmy Wilson | | | 14 Dec 2007 | | | | 80,000 | | | | – | | | | – | | | | – | | | | – | | | | 80,000 | | | | 22 Aug 2012 | | | | A$42.05 | | | | A$33.16 | | | | – | | | | – | | | | – | |
| | | 7 Dec 2006 | | | | 80,000 | | | | – | | | | – | | | | – | | | | – | | | | 80,000 | | | | 24 Aug 2011 | | | | A$26.40 | | | | A$38.61 | | | | – | | | | – | | | | – | |
| | | 3 Dec 2004 | | | | 13,400 | | | | – | | | | – | | | | – | | | | – | | | | 13,400 | | | | 11 Aug 2009 | | | | ZAR66.00 | | | | ZAR207.28 | | | | – | | | | – | | | | – | |
| | | | | | | | | | | | | | | | | | | | | | | | | | | | | | | | | | | | | | | | | | | | | | | | | | | | |
Total | | | | | | | 173,400 | | | | – | | | | – | | | | – | | | | – | | | | 173,400 | | | | | | | | | | | | | | | | | | | | | | | | | |
| | | | | | | | | | | | | | | | | | | | | | | | | | | | | | | | | | | | | | | | | | | | | | | | | | | | |
| | | | | | | | | | | | | | | | | | | | | | | | | | | | | | | | | | | | | | | | | | | | |
Name | | Date of grant | | | At
1 July
2014 | | | Granted | | | Uplift | | | Vested | | | Lapsed | | | At
30 June
2015 | | | Award
vesting
date (1) | | | Market
price on
date of
grant (2) | | | Market
price on
date of
vesting (3) | | | Aggregate
gain on
awards
(’000) (3) | |
Athalie Williams(5) | | | 03-Nov-2014 | | | | 7,250 | | | | – | | | | 555 | | | | – | | | | – | | | | 7,805 | | | | Aug 2017 | | | | A$33.71 | | | | – | | | | – | |
| | | 31-Oct-2013 | | | | 7,525 | | | | – | | | | 576 | | | | – | | | | – | | | | 8,101 | | | | Aug 2016 | | | | A$37.66 | | | | – | | | | – | |
| | | 31-Oct-2012 | | | | 7,300 | | | | – | | | | 559 | | | | – | | | | – | | | | 7,859 | | | | Aug 2015 | | | | A$34.25 | | | | – | | | | – | |
| | | | | | | | | | | | | | | | | | | | | | | | | | | | | | | | | | | | | | | | | | | | |
| | | | | | | 22,075 | | | | – | | | | 1,690 | | | | – | | | | – | | | | 23,765 | | | | | | | | | | | | | | | | | |
| | | | | | | | | | | | | | | | | | | | | | | | | | | | | | | | | | | | | | | | | | | | |
Jimmy Wilson | | | 31-Oct-2012 | | | | 34,250 | | | | – | | | | 2,621 | | | | – | | | | – | | | | 36,871 | | | | Aug 2015 | | | | A$34.25 | | | | – | | | | – | |
| | | 31-Oct-2011 | | | | 31,700 | | | | – | | | | – | | | | 31,700 | | | | – | | | | – | | | | 20-Aug-2014 | | | | A$37.80 | | | | A$38.13 | | | | A$1,209 | |
| | | | | | | | | | | | | | | | | | | | | | | | | | | | | | | | | | | | | | | | | | | | |
| | | | | | | 65,950 | | | | – | | | | 2,621 | | | | 31,700 | | | | – | | | | 36,871 | | | | | | | | | | | | | | | | | |
| | | | | | | | | | | | | | | | | | | | | | | | | | | | | | | | | | | | | | | | | | | | |
| | | | | | | | | | | | | | | | | | | | | | | | | | | | | | | | | | | | | | | | | | | | | | | | | | | | | | | | |
Name | | Date of grant | | | At
1 July
2014 | | | Granted | | | Uplift | | | Vested | | | Lapsed | | | Exercised | | | At
30 June
2015 | | | Award
vesting
date (1) | | | Market
price on
date of
grant (2) | | | Market
price on
date of
vesting | | | Market
price on
date of
exercise (5) | | | Aggregate
gain on
awards
(’000)(5) | | | DEP on
awards (6) | |
Awards under the LTIP | | | | | | | | | | | | | | | | | | | | | | | | | | | | | | | | | | | | | | | | | | | | | | | | | | | | | | | | |
Peter Beaven | | | 14-Dec-2007 | | | | 5,000 | | | | – | | | | – | | | | – | | | | – | | | | 5,000 | | | | – | | | | 23-Aug-2012 | | | A$ | 42.05 | | | A$ | 33.41 | | | A$ | 29.46 | | | A$ | 147 | | | US$ | 48 | |
| | | 05-Dec-2005 | | | | 40,000 | | | | – | | | | – | | | | – | | | | – | | | | 40,000 | | | | – | | | | 25-Aug-2010 | | | | A$22.03 | | | | A$37.44 | | | | A$29.46 | | | | A$1,178 | | | | US$410 | |
| | | | | | | | | | | | | | | | | | | | | | | | | | | | | | | | | | | | | | | | | | | | | | | | | | | | | | | | |
| | | | | | | 45,000 | | | | – | | | | – | | | | – | | | | – | | | | 45,000 | | | | – | | | | | | | | | | | | | | | | | | | | | | | | | |
| | | | | | | | | | | | | | | | | | | | | | | | | | | | | | | | | | | | | | | | | | | | | | | | | | | | | | | | |
Jimmy Wilson | | | 14-Dec-2007 | | | | 57,500 | | | | – | | | | – | | | | – | | | | – | | | | 57,500 | | | | – | | | | 23-Aug-2012 | | | | A$42.05 | | | | A$33.41 | | | | A$38.34 | | | | A$2,205 | | | | US$376 | |
| | | | | | | | | | | | | | | | | | | | | | | | | | | | | | | | | | | | | | | | | | | | | | | | | | | | | | | | |
| | | | | | | 57,500 | | | | – | | | | – | | | | – | | | | – | | | | 57,500 | | | | – | | | | | | | | | | | | | | | | | | | | | | | | | |
| | | | | | | | | | | | | | | | | | | | | | | | | | | | | | | | | | | | | | | | | | | | | | | | | | | | | | | | |
| (1) | The opening balance shown for individuals who have become KMP upon joiningAwards will vest on, or as soon as practicable after, the GMC on 10 May 2013 reflects their holdings on thatfirst non-prohibited period date (rather than on 1 July 2012). |
(2) | The holding period for each award ends onoccurring after 30 June inof the third (MAP awards) or fifth (LTIP awards) financial year the award ‘may vest and become exercisable’after allocation, if the conditions for vesting are met (including the relevant service conditions). UnderThe estimated vesting month is shown in the MAP rules, awards will vest and become exercisable on, or as soon as practicable after, the firstnon-prohibited period date occurring after 30 June.table. Where applicable, expiry date of awards is the day prior to the third (MAP awards) or fifth (LTIP awards) anniversary of that vesting date. |
(3)(2) | The market pricesprice shown for grants made during FY2013 areFY2015 is the closing pricesprice of BHP Billiton shares on the relevant date of grant.3 November 2014. No price is payable by the individual for acquiring the Restricted Sharesaward at the time of grant. The grant date IFRS fair valuesvalue of the awards areis estimated as at the start of the vesting period, being 1 July 2012,2014, and werewas A$31.72 and £18.30.32.46. No exercise requirement or expiry date applies to these awards (as described above the table). |
(4)(3) | All (100 per cent) of the Restricted SharesThe awards granted under the MAP in October 20092011 became fully vested on 3 October 201220 August 2014 as the service conditions were met as in footnote (1).met. The price shown is the closing price of BHP Billiton shares on that date. |
| (4) | Awards shown as held by Mike Fraser and Jane McAloon at 30 June 2015 are their balances held at the date they ceased to be KMP. The subsequent treatment of their awards is set out in section 4.4.18. |
| (5) | The opening balance of awards for Athalie Williams reflects her holdings on the date she commenced being KMP. |
| (6) | The market price shown (and used for calculating the aggregate gain) is the closing price of BHP Billiton shares on the date that the individual exercised their Restricted Shares.LTIP award. No price is payable by the individual for exercising the Restricted Shares. One ordinary BHP Billiton share is acquired for each Restricted Share exercised.award. |
(6)(7) | The amounts shown in this column are the value of the DEP paid on the awards as described in section 6.2.10.awards. |
4.4.25 Estimated value range of equity awards
The current face value of STI and LTI awards allocated during FY2015 and yet to vest (to be disclosed under the Australian Corporations Act 2001) is the number of awards as set out in the previous tables multiplied by the current share price of BHP Billiton Limited or BHP Billiton Plc as applicable.
The actual value that may be received by participants in the future cannot be determined as it is dependent on, and therefore fluctuates with, the share prices of BHP Billiton Limited and BHP Billiton Plc at the date that any particular award is exercised. The table below provides five-year share price history for BHP Billiton Limited and BHP Billiton Plc, history of dividends paid and the Group’s earnings.
Five-year share price, dividend and earnings history
| | | | | | | | | | | | | | | | | | | | | | |
| | | | | FY2011 | | | FY2012 | | | FY2013 | | | FY2014 | | | FY2015 | |
| BHP Billiton Limited | | Share price at beginning of year | | | A$36.94 | | | | A$43.97 | | | | A$31.72 | | | | A$30.94 | | | | A$36.00 | |
| | Share price at end of year | | | A$43.80 | | | | A$31.45 | | | | A$31.37 | | | | A$35.90 | | | | A$27.05 | |
| | Dividends paid | | | A$0.95 | | | | A$1.03 | | | | A$1.10 | | | | A$1.29 | | | | A$3.72 | (1) |
BHP Billiton Plc | | Share price at beginning of year | | | £17.28 | | | | £24.39 | | | | £18.30 | | | | £17.15 | | | | £19.45 | |
| | Share price at end of year | | | £24.47 | | | | £18.06 | | | | £16.82 | | | | £18.90 | | | | £12.49 | |
| | Dividends paid | | | £0.58 | | | | £0.69 | | | | £0.73 | | | | £0.73 | | | | £1.95 | (1) |
| BHP Billiton | | Attributable profit
(US$M, as reported) | | | 23,648 | | | | 15,473 | | | | 11,223 | | | | 13,832 | | | | 1,910 | |
(7)(1) | During FY2012, two MAP awards were allocated to Mr Henry and Mr Kerr. An initial grant of Restricted Shares was provided on the relevant date of grant at the same time and on the same basis as allocations for all other non-GMC management. Additional awards were provided on 25 November 2011The FY2015 Dividends paid includes A$2.25 or £1.15 in recognition of their increased responsibilities as membersrespect of the GMC overin-specie dividend associated with the remainderdemerger of FY2012.South32. |
The highest share price during FY2015 was A$39.74 for BHP Billiton Limited shares and £21.02 for BHP Billiton Plc shares. The lowest share prices during FY2015 were A$26.50 and £12.48, respectively.
6.4.74.4.26 Awards of Matched Shares under the Shareplus all-employee share purchase plan
Like all permanent employees, members of the GMC are eligible to participate in Shareplus, an all-employee share purchase plan. For administrative simplicity in regard to stock exchange dealings and announcements, no GMC members currently participate. This table shows Shareplus holdings previously accumulated by members of the GMC, including during the period before they joined the GMC.GMC are detailed below.
Participants in Shareplus contribute from their post-tax base salary (capped at US$5,000 per year) to acquire shares in BHP Billiton Limited or in BHP Billiton Plc. For each share purchased, the participant receives a right to acquire a Matched Share, which vests provided the participant remains employed by BHP Billiton on the third anniversary of the start of the relevant Shareplus Plan Year.
Differences in exchange rates in relation to the base salaries of the participants in previous financial years and the currencies of each securities exchange result in minor differences in the numbers of shares allocated.
| | | | | | | | | | | | | | | | | | | | | | | | | | | | | | | | |
Name | | Shareplus
Plan Year | | | Vesting date | | | At
1 July
2012 (1) | | | Granted (2) | | | Vested (3) | | | At
30 June
2013 | | | Market
price on
date of
vesting
(’000) (4) | | | Aggregate
gain on
awards
(’000) (3) | |
Peter Beaven | | | 2012 | | | | 7 April 2015 | | | | 108 | | | | – | | | | – | | | | 108 | | | | – | | | | – | |
| | | 2011 | | | | 1 April 2014 | | | | 128 | | | | – | | | | – | | | | 128 | | | | – | | | | – | |
| | | | | | | | | | | | | | | | | | | | | | | | | | | | | | | | |
Total | | | | | | | | | | | 236 | | | | – | | | | – | | | | 236 | | | | | | | | | |
| | | | | | | | | | | | | | | | | | | | | | | | | | | | | | | | |
Alberto Calderon(6) | | | 2012 | | | | 7 April 2015 | | | | – | | | | 43 | | | | – | | | | 43 | | | | – | | | | – | |
| | | 2011 | | | | 1 April 2014 | | | | 169 | | | | – | | | | – | | | | 169 | | | | – | | | | – | |
| | | 2010 | | | | 9 May 2013 | | | | 149 | | | | – | | | | 149 | | | | – | | | | £19.28 | | | | £3 | |
| | | | | | | | | | | | | | | | | | | | | | | | | | | | | | | | |
Total | | | | | | | | | | | 318 | | | | 43 | | | | 149 | | | | 212 | | | | | | | | | |
| | | | | | | | | | | | | | | | | | | | | | | | | | | | | | | | |
Dean Dalla Valle | | | 2012 | | | | 7 April 2015 | | | | 113 | | | | – | | | | – | | | | 113 | | | | – | | | | – | |
| | | 2011 | | | | 1 April 2014 | | | | 149 | | | | – | | | | – | | | | 149 | | | | – | | | | – | |
| | | | | | | | | | | | | | | | | | | | | | | | | | | | | | | | |
Total | | | | | | | | | | | 262 | | | | – | | | | – | | | | 262 | | | | | | | | | |
| | | | | | | | | | | | | | | | | | | | | | | | | | | | | | | | |
Mike Henry | | | 2012 | | | | 7 April 2015 | | | | – | | | | 39 | | | | – | | | | 39 | | | | – | | | | – | |
| | | 2011 | | | | 1 April 2014 | | | | 179 | | | | – | | | | – | | | | 179 | | | | – | | | | – | |
| | | 2010 | | | | 9 May 2013 | | | | 152 | | | | – | | | | 152 | | | | – | | | | £19.28 | | | | £3 | |
| | | | | | | | | | | | | | | | | | | | | | | | | | | | | | | | |
Total | | | | | | | | | | | 331 | | | | 39 | | | | 152 | | | | 218 | | | | | | | | | |
| | | | | | | | | | | | | | | | | | | | | | | | | | | | | | | | |
Graham Kerr | | | 2012 | | | | 7 April 2015 | | | | – | | | | 38 | | | | – | | | | 38 | | | | – | | | | – | |
| | | 2011 | | | | 1 April 2014 | | | | 150 | | | | – | | | | – | | | | 150 | | | | – | | | | – | |
| | | | | | | | | | | | | | | | | | | | | | | | | | | | | | | | |
Total | | | | | | | | | | | 150 | | | | 38 | | | | – | | | | 188 | | | | | | | | | |
| | | | | | | | | | | | | | | | | | | | | | | | | | | | | | | | |
Marius Kloppers(5)/(6) | | | 2012 | | | | 7 April 2015 | | | | – | | | | 36 | | | | – | | | | 36 | | | | – | | | | – | |
| | | 2011 | | | | 1 April 2014 | | | | 149 | | | | – | | | | – | | | | 149 | | | | – | | | | – | |
| | | 2010 | | | | 9 May 2013 | | | | 131 | | | | – | | | | 131 | | | | – | | | | A$34.54 | | | | A$5 | |
| | | | | | | | | | | | | | | | | | | | | | | | | | | | | | | | |
Total | | | | | | | | | | | 280 | | | | 36 | | | | 131 | | | | 185 | | | | | | | | | |
| | | | | | | | | | | | | | | | | | | | | | | | | | | | | | | | |
Jane McAloon | | | 2012 | | | | 7 April 2015 | | | | 103 | | | | – | | | | – | | | | 103 | | | | – | | | | – | |
| | | 2011 | | | | 1 April 2014 | | | | 138 | | | | – | | | | – | | | | 138 | | | | – | | | | – | |
| | | | | | | | | | | | | | | | | | | | | | | | | | | | | | | | |
Total | | | | | | | | | | | 241 | | | | – | | | | – | | | | 241 | | | | | | | | | |
| | | | | | | | | | | | | | | | | | | | | | | | | | | | | | | | |
Andrew Mackenzie(5) | | | 2012 | | | | 7 April 2015 | | | | – | | | | 41 | | | | – | | | | 41 | | | | – | | | | – | |
| | | 2011 | | | | 1 April 2014 | | | | 170 | | | | – | | | | – | | | | 170 | | | | – | | | | – | |
| | | 2010 | | | | 9 May 2013 | | | | 136 | | | | – | | | | 136 | | | | – | | | | £19.28 | | | | £3 | |
| | | | | | | | | | | | | | | | | | | | | | | | | | | | | | | | |
Total | | | | | | | | | | | 306 | | | | 41 | | | | 136 | | | | 211 | | | | | | | | | |
| | | | | | | | | | | | | | | | | | | | | | | | | | | | | | | | |
| | | | | | | | | | | | | | | | | | | | | | | | | | | | | | | | |
Name | | Shareplus
Plan Year | | | Vesting date | | | At
1 July
2012 (1) | | | Granted (2) | | | Vested (3) | | | At
30 June
2013 | | | Market
price on
date of
vesting
(’000) (4) | | | Aggregate
gain on
awards
(’000) (3) | |
Marcus Randolph(6) | | | 2012 | | | | 7 April 2015 | | | | – | | | | 38 | | | | – | | | | 38 | | | | – | | | | – | |
| | | 2011 | | | | 1 April 2014 | | | | 150 | | | | – | | | | – | | | | 150 | | | | – | | | | – | |
| | | 2010 | | | | 9 May 2013 | | | | 132 | | | | – | | | | 132 | | | | – | | | | A$34.54 | | | | A$5 | |
| | | | | | | | | | | | | | | | | | | | | | | | | | | | | | | | |
Total | | | | | | | | | | | 282 | | | | 38 | | | | 132 | | | | 188 | | | | | | | | | |
| | | | | | | | | | | | | | | | | | | | | | | | | | | | | | | | |
Jimmy Wilson | | | 2012 | | | | 7 April 2015 | | | | 106 | | | | – | | | | – | | | | 106 | | | | – | | | | – | |
| | | 2011 | | | | 1 April 2014 | | | | 150 | | | | – | | | | – | | | | 150 | | | | – | | | | – | |
| | | | | | | | | | | | | | | | | | | | | | | | | | | | | | | | |
Total | | | | | | | | | | | 256 | | | | – | | | | – | | | | 256 | | | | | | | | | |
| | | | | | | | | | | | | | | | | | | | | | | | | | | | | | | | |
Karen Wood | | | 2012 | | | | 7 April 2015 | | | | – | | | | 39 | | | | – | | | | 39 | | | | – | | | | – | |
| | | 2011 | | | | 1 April 2014 | | | | 149 | | | | – | | | | – | | | | 149 | | | | – | | | | – | |
| | | 2010 | | | | 9 May 2013 | | | | 132 | | | | – | | | | 132 | | | | – | | | | A$34.54 | | | | A$5 | |
| | | | | | | | | | | | | | | | | | | | | | | | | | | | | | | | |
Total | | | | | | | | | | | 281 | | | | 39 | | | | 132 | | | | 188 | | | | | | | | | |
| | | | | | | | | | | | | | | | | | | | | | | | | | | | | | | | |
J Michael Yeager(6)/(7) | | | 2012 | | | | 7 April 2015 | | | | – | | | | 18 | | | | – | | | | 18 | | | | – | | | | – | |
| | | 2011 | | | | 1 April 2014 | | | | 74 | | | | – | | | | – | | | | 74 | | | | – | | | | – | |
| | | 2010 | | | | 9 May 2013 | | | | 54 | | | | – | | | | 54 | | | | – | | | | US$69.67 | | | | US$4 | |
| | | | | | | | | | | | | | | | | | | | | | | | | | | | | | | | |
Total | | | | | | | | | | | 128 | | | | 18 | | | | 54 | | | | 92 | | | | | | | | | |
| | | | | | | | | | | | | | | | | | | | | | | | | | | | | | | | |
Shareplus 2011 vested for GMC on 20 August 2014 and Matched Shares were allocated to Andrew Mackenzie (170 shares), Peter Beaven (128 shares), Tim Cutt (54 shares), Dean Dalla Valle (149 shares), Mike Fraser (178 shares), Mike Henry (179 shares), Graham Kerr (150 shares), Jane McAloon (138 shares), Jimmy Wilson (150 shares) and Karen Wood (149 shares).
Shareplus 2012 vested for GMC on 25 May 2015 and Matched Shares were allocated to Andrew Mackenzie (41 shares), Peter Beaven (108 shares), Tim Cutt (66 shares and 18 ADRs), Dean Dalla Valle (113 shares), Mike Henry (39 shares), Jane McAloon (103 shares), Athalie Williams (140 shares) and Jimmy Wilson (106 shares).
Athalie Williams joined the GMC on 1 January 2015 holding 140 rights to Matched Shares under Shareplus 2012 which vested during FY2015 as above. Mike Fraser, Graham Kerr and Karen Wood respectively held 89, 38 and 39 rights to Matched Shares under Shareplus 2012 at the time each ceased to be a member of the GMC which subsequently vested during FY2015.
As at 30 June 2015, no GMC member holds any remaining entitlements to receive Matched Shares.
Other disclosures
4.4.27 Ordinary share holdings and transactions
The number of ordinary shares in BHP Billiton Limited or in BHP Billiton Plc held directly, indirectly or beneficially, by each individual (including shares held in the name of the spouse, superannuation fund, nominee and/or other controlled entities) are shown in table below as at 30 June 2015. In addition, there have been no changes in the interests of any Directors in the period to 10 August 2015 (being one month prior to the date of the notice of the 2015 AGMs). These are ordinary shares held without performance conditions or restrictions and are included in MSR calculations for each individual. MSR calculations for members of the GMC (including the CEO) also include any vested but unexercised employee awards as shown in previous sections of the Report.
The interests of Directors and members of the GMC in the ordinary shares of each of BHP Billiton Limited and BHP Billiton Plc as at 30 June 2015 did not exceed, on an individual basis or in the aggregate, one per cent of BHP Billiton Limited’s or BHP Billiton Plc’s issued ordinary shares.
| | | | | | | | | | | | | | | | | | | | | | | | | | | | | | | | | | | | | | | | |
| | | BHP Billiton Limited Shares | | | BHP Billiton Plc Shares | |
| | | Held at 1
July 2014 | | | Purchased | | | Received | | | Sold | | | Held at 30
June 2015 | | | Held at 1
July 2014 | | | Purchased | | | Received | | | Sold | | | Held at 30
June 2015 | |
Executive Director | | | | | | | | | | | | | | | | | | | | | | | | | | | | | | | | | | | | | | | | |
Andrew Mackenzie | | | – | | | | – | | | | – | | | | – | | | | – | | | | 201,921 | | | | – | | | | 96,134 | | | | 31,809 | | | | 266,246 | |
Other Members of the GMC | | | | | | | | | | | | | | | | | | | | | | | | | | | | | | | | | | | | | |
Peter Beaven | | | 184,601 | | | | – | | | | 90,692 | | | | 63,712 | | | | 211,581 | | | | – | | | | – | | | | – | | | | – | | | | – | |
Tony Cudmore | | | – | | | | – | | | | – | | | | – | | | | – | | | | – | | | | – | | | | – | | | | – | | | | – | |
Tim Cutt(1) | | | 36,241 | | | | – | | | | 36,612 | | | | 16,292 | | | | 56,561 | | | | – | | | | – | | | | – | | | | – | | | | – | |
Dean Dalla Valle | | | 127,056 | | | | – | | | | 37,669 | | | | 37,705 | | | | 127,020 | | | | – | | | | – | | | | – | | | | – | | | | – | |
Mike Fraser(3) | | | – | | | | – | | | | – | | | | – | | | | – | | | | 160,549 | | | | – | | | | 15,161 | | | | 3,014 | | | | 172,696 | |
Geoff Healy | | | 3,000 | | | | – | | | | – | | | | – | | | | 3,000 | | | | – | | | | – | | | | – | | | | – | | | | – | |
Mike Henry | | | 18,696 | | | | – | | | | 5,894 | | | | 2,711 | | | | 21,879 | | | | 111,630 | | | | – | | | | 51,041 | | | | – | | | | 162,671 | |
Graham Kerr(3) | | | 94,584 | | | | – | | | | 48,323 | | | | 23,635 | | | | 119,272 | | | | – | | | | – | | | | – | | | | – | | | | – | |
Jane McAloon(3) | | | 46,654 | | | | – | | | | 25,539 | | | | 12,509 | | | | 59,684 | | | | – | | | | – | | | | – | | | | – | | | | – | |
Daniel Malchuk | | | 52,687 | | | | – | | | | 16,484 | | | | 2,864 | | | | 66,307 | | | | – | | | | – | | | | – | | | | – | | | | – | |
Athalie Williams (2) | | | 14,912 | | | | – | | | | 140 | | | | – | | | | 15,052 | | | | – | | | | – | | | | – | | | | – | | | | – | |
Jimmy Wilson(4) | | | 116,135 | | | | – | | | | 106,067 | | | | 106,111 | | | | 116,091 | | | | 59,301 | | | | – | | | | – | | | | – | | | | 59,301 | |
Karen Wood(3) | | | 368,013 | | | | – | | | | – | | | | – | | | | 368,013 | | | | – | | | | – | | | | – | | | | – | | | | – | |
Non-executive Directors | | | | | | | | | | | | | | | | | | | | | | | | | | | | | | | | | | | | | | | | |
Malcolm Brinded | | | – | | | | – | | | | – | | | | – | | | | – | | | | 12,000 | | | | – | | | | – | | | | – | | | | 12,000 | |
Malcolm Broomhead | | | 9,000 | | | | – | | | | – | | | | – | | | | 9,000 | | | | – | | | | – | | | | – | | | | – | | | | – | |
John Buchanan | | | – | | | | – | | | | – | | | | – | | | | – | | | | 20,000 | | | | – | | | | – | | | | – | | | | 20,000 | |
Carlos Cordeiro(1) | | | 6,550 | | | | – | | | | – | | | | – | | | | 6,550 | | | | – | | | | – | | | | – | | | | – | | | | – | |
David Crawford | | | 33,127 | | | | – | | | | – | | | | – | | | | 33,127 | | | | 6,000 | | | | – | | | | – | | | | – | | | | 6,000 | |
Pat Davies | | | – | | | | – | | | | – | | | | – | | | | – | | | | 27,170 | | | | – | | | | – | | | | – | | | | 27,170 | |
| | | | | | | | | | | | | | | | | | | | | | | | | | | | | | | | | | | | | | | | |
| | | BHP Billiton Limited Shares | | | BHP Billiton Plc Shares | |
| | | Held at 1
July 2014 | | | Purchased | | | Received | | | Sold | | | Held at 30
June 2015 | | | Held at 1
July 2014 | | | Purchased | | | Received | | | Sold | | | Held at 30
June 2015 | |
Carolyn Hewson | | | 14,000 | | | | – | | | | – | | | | – | | | | 14,000 | | | | – | | | | – | | | | – | | | | – | | | | – | |
Lindsay Maxsted | | | 6,500 | | | | 5,000 | | | | – | | | | – | | | | 11,500 | | | | – | | | | – | | | | – | | | | – | | | | – | |
Wayne Murdy(1) | | | 8,000 | | | | – | | | | – | | | | – | | | | 8,000 | | | | 14,000 | | | | 10,000 | | | | – | | | | – | | | | 24,000 | |
Jac Nasser(1) | | | 10,400 | | | | 10,000 | | | | – | | | | – | | | | 20,400 | | | | 81,200 | | | | – | | | | – | | | | – | | | | 81,200 | |
Keith Rumble | | | – | | | | – | | | | – | | | | – | | | | – | | | | 20,680 | | | | – | | | | – | | | | – | | | | 20,680 | |
John Schubert | | | 23,675 | | | | – | | | | – | | | | – | | | | 23,675 | | | | – | | | | – | | | | – | | | | – | | | | – | |
Shriti Vadera | | | – | | | | – | | | | – | | | | – | | | | – | | | | 9,000 | | | | – | | | | – | | | | – | | | | 9,000 | |
| (1) | The opening balance shown for individuals who have become KMP upon joiningfollowing BHP Billiton Limited shares and BHP Billiton Plc shares are held in the GMC on 10 May 2013 reflects their holdings on that date (rather than on 1 July 2012)form of American Depositary Shares: Tim Cutt (470 BHP Billiton Limited), Carlos Cordeiro (3,275 BHP Billiton Limited), Wayne Murdy (4,000 BHP Billiton Limited; 12,000 BHP Billiton Plc) and Jac Nasser (5,200 BHP Billiton Limited; 40,600 BHP Billiton Plc). |
| (2) | Rights to Matched Shares were granted quarterly during FY2013 asThe opening balance shown for Athalie Williams reflects her holdings on the participant purchased shares in BHP Billiton under the plan (Acquired Shares) for the 2012 Shareplus Plan Year (i.e. from salary contributions from June 2012 to May 2013).date she became KMP. |
| (3) | Matched Shares allocated uponThe closing balances for Mike Fraser, Graham Kerr, Jane McAloon and Karen Wood reflect their shareholdings on the vesting of rights acquired during the 2010 Shareplus Plan Year (i.e. from salary contributions from June 2010 to May 2011).date that each ceased being KMP. |
| (4) | The market price shown (and usedopening balance of ordinary shares for calculating the aggregate gain) is the closing price of BHP BillitonJimmy Wilson has been corrected to include 20 shares on the relevant vesting date. Matched Shares are allocated on vesting. There is no exercise action required by the holder and no DEP is payable.not previously recorded. |
4.4.28 Payments to past Directors
(5) | On 10 May 2013, when Andrew Mackenzie was appointed as a Director, and Marius Kloppers retired as a Director, their holdings were the same as at 30 June 2013. |
(6) | Unvested rights to Matched Shares held by members of the GMC on the date that they leave BHP Billiton in FY2014 will vest on their date of departure. |
(7) | Mike Yeager received American Depositary Receipts (ADRs) listed on the New York Stock Exchange, each equivalent to two BHP Billiton Limited shares. |
6.4.8 Estimated value rangeUK regulations require the disclosure of equity awardspayments to past Directors(1).
The current face valueAs disclosed in last year’s Report, during FY2015 payments were made to Marius Kloppers (CEO and Executive Director until 10 May 2013) in relation to the vesting of STI and123,250 LTI awards allocated during FY2013 and yetgranted in 2009. As the LTI awards granted in 2010 did not vest, no further payments have been made to vest (to be disclosed under the Australian Corporations Act 2001) is the numberMr Kloppers. During FY2015, Mr Kloppers was provided tax return preparation services of awards as set outUS$13,000 in the previous tables multiplied by the current share pricerespect of his FY2014 tax obligations in multiple jurisdictions in respect of BHP Billiton Limitedemployment income in accordance with contractual arrangements.
There were no payments made for loss of office in FY2014 or BHP Billiton Plc as applicable.FY2015.
The actual value that may be received by participants in the future cannot be determined as it is dependent on, and therefore fluctuates with, the share prices of BHP Billiton Limited and BHP Billiton Plc at the date that any particular award is exercised. The table below provides five-year share price history for BHP Billiton Limited and BHP Billiton Plc, and history of dividends paid.
Five-year share price and dividend history
| | | | | | | | | | | | | | | | | | | | | | |
| | | | FY2009 | | | FY2010 | | | FY2011 | | | FY2012 | | | FY2013 (1) | |
BHP Billiton Limited | | Share price at beginning of year | | | A$44.45 | | | | A$33.96 | | | | A$36.94 | | | | A$43.97 | | | | A$31.72 | |
| | Share price at end of year | | | A$34.72 | | | | A$37.65 | | | | A$43.80 | | | | A$31.45 | | | | A$31.37 | |
| | Dividends paid | | | A$1.12 | | | | A$0.95 | | | | A$0.95 | | | | A$1.03 | | | | A$1.10 | |
BHP Billiton Plc
| | Share price at beginning of year | | | £18.97 | | | | £13.75 | | | | £17.28 | | | | £24.39 | | | | £18.30 | |
| | Share price at end of year | | | £13.64 | | | | £17.54 | | | | £24.47 | | | | £18.06 | | | | £16.82 | |
| | Dividends paid | | | £0.51 | | | | £0.53 | | | | £0.58 | | | | £0.69 | | | | £0.73 | |
| (1) | The highest share price during FY2013 was A$39.00 for BHP Billiton Limited shares and £22.36 for BHP Billiton Plc shares. Lowest share prices during FY2013 were A$30.18 and £16.73 respectively.Remuneration Committee has adopted a de minimis threshold of US$7,500 in relation to disclosure of payments to past Directors under UK requirements. |
Other statutory disclosures for Directors4.4.29 Relative importance of spend on pay
6.4.9The table below sets out the total spend on employee remuneration during FY2015 (and the prior years), compared with other significant expenditure items. The table includes items as prescribed in the UK requirements. BHP Billiton has included tax payments and purchases of property, plant and equipment, being the most significant other outgoings in monetary terms.
| | | | | | | | | | | | |
US dollars million | | FY2015 | | | FY2014 (1) | | | FY2013 (1) | |
Aggregate employee benefits expenseSection 7.1.6 Note 3 | | | 5,100 | | | | 5,545 | | | | 5,762 | |
Dividends paid to BHP Billiton shareholdersSection 7.1.4 | | | 6,498 | | | | 6,387 | | | | 6,167 | |
Share buy-backsSection 7.1.4 | | | – | | | | – | | | | – | |
Income tax paid and royalty-related taxation paid (net of refunds)Section 7.1.4 | | | 4,025 | | | | 6,147 | | | | 7,877 | |
Purchases of property, plant and equipmentSection7.1.4 | | | 11,947 | | | | 15,224 | | | | 21,104 | |
| (1) | The financial information for FY2014 and FY2013 has been restated for the effects of the application of IFRS 5/AASB 5 ‘Non-current Assets Held for Sale and Discontinued Operations’ following the demerger of South32. |
4.4.30 Retirement disclosures for the Non-executive Directors
The following table sets out the accrued retirement benefits under the now-closed Retirement Plan of BHP Billiton Limited. The Retirement Plan was closed on 24 October 2003 and entitlements that had accumulated in respect of each of the participants were frozen. These will be paid on retirement. An earnings rate equal to the five-year Australian Government Bond Rate is being applied to the frozen entitlements from that date.
| US dollars | | Completed service at
30 June 2013 (years) | | | Change in lump sum
entitlement during
the year (1) | | | Lump sum entitlement at | | |
| | | | 30 June 2012 | | | 30 June 2013 | | |
US dollars (’000) | | | Completed service at
30 June 2015 (years) | | | Change in lump sum
entitlement during
the year(1)(2) | | | Lump sum entitlement at | |
| | | | 30 June 2015 | | | 30 June 2014 | |
David Crawford | | | 19 | | | | (16,665 | ) | | 576,606 | | | | 559,941 | | | | 20.5 | | | | (601 | ) | | | – | | | | 601 | |
John Schubert | | | 13 | | | | (8,327 | ) | | 288,119 | | | | 279,792 | | | | 15 | | | | (41 | ) | | | 259 | | | | 300 | |
| (1) | David Crawford retired on 20 November 2014 after serving 20.5 years to that date, and received a gross benefit equivalent to US$563,278 (A$653,834). The balance of US$37,942 reflects the earnings rate and foreign exchange rate movement described below. |
| (2) | SinceNo further entitlements have accrued since the closure of the Retirement Plan no further entitlements have accrued.in 2003. The movement reflects the application of the earnings rate and foreign exchange rate (the translation from Australian dollars to US dollars for the Remuneration Report) to the lump sum entitlement at the date of closure. |
4.4.31 Transactions with KMP
During the financial year, there were no purchases by KMP from the Group (2014: US$ nil; 2013: US$ nil). There are no amounts payable at 30 June 2015 (2014: US$ nil).
6.4.10 Aggregate Directors’ remunerationLoans with KMP
There are US$ nil loans (2014: US$ nil) with KMP.
Transactions with personally related entities
A number of Directors of the Group hold or have held positions in other companies, where it is considered they control or significantly influence the financial or operating policies of those entities. There have been no transactions with those entities and no amounts were owed by the Group to personally related entities (2014: US$ nil).
This table sets out the aggregate remuneration of Executive Directors and Non-executive Directors in accordance with the requirements of the UK Companies Act 2006 (and the Large and Medium-sized Companies and Groups (Accounts and Reports) Regulations 2008 made thereunder). For 2013, the emoluments pension contributions include the relevant portions for each of the Executive Directors, as in section 6.3.1.
| | | | | | | | |
US dollars million | | 2012 | | | 2013 | |
Emoluments | | | 6.5 | | | | 9.1 | |
Termination payments | | | – | | | | – | |
Awards vesting under LTI plans (1) | | | 9.1 | | | | 13.3 | |
Gains on exercise of Options | | | – | | | | – | |
Pension contributions | | | 0.9 | | | | 0.9 | |
| | | | | | | | |
Total | | | 16.5 | | | | 23.3 | |
| | | | | | | | |
(1) | For the purposes of this UK requirement, ‘LTI plans’ includes both the STI and LTI awards for Marius Kloppers, being the Director at the time of vesting. The value shown for 2013 is the US$ equivalent of the aggregate gain of the GIS Deferred Shares exercised as shown in section 6.4.2 and of the LTI Performance Shares vested and exercised as shown in section 6.4.3. |
ThisRemuneration Report was approved by the Board on 1210 September 20132015 and signed on its behalf by:
|
|
John BuchananCarolyn Hewson |
| Chairman, Remuneration Committee |
1210 September 20132015 |
75 Directors’ Report
The information presented by the Directors in this Directors’ Report relates to BHP Billiton Limited and BHP Billiton Plc and their subsidiaries. TheSection 1 ‘Strategic Report’ (which includes the Chairman’s Review in section 1.3,1.1 and the Chief Executive Officer’s Report in section 1.41.2, and incorporates the operating and financial review), section 2 ‘Business overview’, section 3 ‘Corporate Governance Statement’, section 4 ‘Remuneration Report’, section 7.5 ‘Lead Auditor’s Independence Declaration’ and section 1 Key information, section 2 Information on the Company, section 3 Operating and financial review and prospects, section 4 Board of Directors and Group Management Committee, section 5 Corporate Governance Statement, section 6 Remuneration Report, section 9 Financial Statements and section 11 Shareholder information‘Shareholder information’ of this Annual Report are each incorporated by reference into, and form part of, this Directors’ Report. In addition, for the purposes of UK law, the Strategic Report in section 1 and the Directors’ Remuneration Report in section 4 form separate reports and have been separately approved by the Board for that purpose.
7.1 Principal activities, state of affairs and business review
The UK Companies Act 2006 requires this Directors’ Report to include a fair reviewFor the purpose of the business ofUK Listing Authority’s (UKLA) Listing Rule 9.8.4C R, the Group during FY2013 and of the position of the Group at the end of the financial year and a description of the principal risks and uncertainties facing the Group (known as the ‘business review’). In additionapplicable information required to the informationbe disclosed in accordance with UKLA Listing Rule 9.8.4 R is set out below, the information that fulfils the requirements of the business review can be found in the following sections of this Annual Report (which are each incorporated by reference into this Directors’ Report):below.
| | | | |
SectionApplicable information required by UKLA Listing Rule 9.8.4 R
| | Reference | Section in this Annual Report |
Key measures(1) Interest capitalised by group
| | | 1.6 and 3.3 | Section 7, Note 16 |
Risk factors(5) Arrangements to waive emoluments from the company or subsidiary undertakings
| | | 1.7.1 and 5.14 | Section 4.4.5 |
Business overview(6) Waiver of future emoluments
| | | 2.2 | Section 4.4.5 |
Sustainability(12) Shareholder waivers of dividends
| | | 2.8 | Section 7, Note 25 |
Employees(13) Shareholder waivers of future dividends
| | | 2.9 | |
Operating and financial review and prospects
| | | 3 | Section 7, Note 25 |
Paragraphs (2), (4), (7), (8), (9), (10), (11) and (14) of Listing Rule 9.8.4 are not applicable.
The Directors confirm, on the advice of the Risk and Audit Committee, that they consider the Annual Report (including the Financial Statements), taken as a whole, is fair, balanced and understandable and provides the information necessary for shareholders to assess the Group’s performance, business model and strategy.
5.1 Review of operations, principal activities and state of affairs
A review of the operations of the Group during FY2013,FY2015, the results of those operations during FY2013FY2015 and the expected results of those operations in future financial years are set out in section 1, in particular in sections 1.1 to 1.3, 1.4, 2.21.5, 1.11, 1.12 and 31.15 and other material in this Annual Report. Information on the development of the Group and likely developments in future years also appearappears in those sections of this Annual Report. We have excluded certain information from the Operating and financial review and prospects in section 3 (which forms part of this Directors’ Report) on the basis that including the information would cause unreasonable prejudice to the Group because such disclosure could be misleading due to the premature nature of the information, relates to commercially sensitive contracts, would undermine confidentiality between the Group and its suppliers and clients, or would otherwise unreasonably damage the business. The categories of information omitted include forward looking estimates and projections prepared for internal management purposes, information regarding the Group’s assets and projects, which is embryonic and susceptible to change, and information relating to commercial contracts or pricing modules.sections.
Our principal activities during FY2013FY2015 were exploration, development, production, processing and processingmarketing of minerals (in respect of iron ore, metallurgical and energy coal, copper, aluminium, manganese, uranium, nickel, silver and potash), and exploration, development, production and productionmarketing of conventional and unconventional oil and gas. During FY2013, we completedWith the saleexception of our diamondsthe demerger of South32 and titanium minerals businesses. Further information in relation to these sales is provided in sections 2.2.6, 3 and 5the consequent impact on the composition of this Annual Report. Other than these developments,the BHP Billiton portfolio, no significant changes in the nature of the Group’s principal activities occurred during FY2013.FY2015. Information on the demerger is set out in sections 1.3.7, 1.6.4 and 2.1.7 of this Annual Report.
Information in relation to significant changes in the state of affairs of the Group that occurred during FY2013FY2015 and significant post-balance date events is set out below and in sections 2.2, 31.12 and 5.32.1 of this Annual Report.
On 14 July 2014, we announced the redemption of Petrohawk Energy Corporation 7.25 per cent Senior Notes due 2018 and 6.25 per cent Senior Notes due 2019. The total aggregate principal value of the notes to be redeemed was approximately US$1.8 billion.
On 19 August 2014, we announced the proposal to create a new global metals and mining company based on a demerger of a selection of the Group’s high-quality aluminium, coal, manganese, nickel and silver assets to accelerate portfolio simplification. We also announced that shareholders would have the opportunity to vote on the proposal once all necessary approvals were in place. On 8 December 2014, we announced that the new company would be called South32.
On 19 August 2014, following the announcement in relation to South32, we announced that Graham Kerr, then Chief Financial Officer, had been appointed Chief Executive Officer-designate of South32. Graham retired from the Group Management Committee (GMC) on 1 October 2014 and was replaced as Chief Financial Officer by Peter Beaven, previously President, Copper. We also announced that David Crawford would retire from the BHP Billiton Board in November 2014 to be the Chairman of the new company, South32.
Between 25 September 2014 and 11 May 2015, we made several announcements related to the composition of the South32 Board of Directors. These announcements included that (a) Keith Rumble would be appointed as a Non-executive Director of South32 effective 27 February 2015 and would retire from the BHP Billiton Board with effect from 22 May 2015, (b) Frank Cooper, Peter Kukielski, Ntombifuthi (Futhi) Mtoba and Wayne Osborn would each be appointed to the Board of Directors of South32 with effect from 7 May 2015 and (c) Xolani Mkhwanazi would be appointed as a Non-executive Director of South32 with effect from 2 July 2015.
On 6 October 2014, we announced plans to cut unit costs at Western Australia Iron Ore by at least 25 per cent and the potential to increase capacity there by 65 million tonnes per year at a very low capital cost.
On 16 October 2014, we confirmed that we would pursue a Standard listing on the UKLA’s Official List and admission to trading on the London Stock Exchange (LSE) for South32. This was in addition to the proposed primary listing on the Australian Securities Exchange (ASX) and secondary inward listing on the Johannesburg Stock Exchange (JSE). We also announced on 24 November 2014 that BHP Billiton Plc and BHP Billiton Limited shareholders would be entitled to 100 per cent of the shares in South32 through a pro rata in-specie distribution, and that BHP Billiton would not re-base its dividend as a result of the demerger, implying a higher payout ratio.
On 24 November 2014, we announced that on 1 January 2015 Athalie Williams would join the GMC as President, Human Resources, replacing Mike Fraser who would become President and Chief Operating Officer Elect Africa of South32. We also announced that Mike Henry would move to the role of President, Coal, and that Dean Dalla Valle would become President, HSE, Marketing and Technology. We further announced that Daniel Malchuk would become President, Copper on 1 March 2015, that Jane McAloon had advised of her intention to leave BHP Billiton in July 2015, and that Margaret Taylor would join BHP Billiton in early 2015 as Company Secretary. It was subsequently announced on 1 May 2015 that Margaret Taylor would be appointed Group Company Secretary from 1 June 2015 to coincide with the resignation of Jane McAloon from that position.
On 17 March 2015, we announced that the BHP Billiton Board recommended that shareholders approve the proposed demerger of South32 at shareholder meetings to be held on 6 May 2015. It was also announced that with a more focused portfolio, BHP Billiton would be better placed to achieve further productivity benefits in its core assets. A Shareholder Circular dated 16 March 2015 and listing documentation in respect of the proposed demerger were released to shareholders.
On 19 March 2015, we announced the pricing of a five-year A$1.0 billion note issue under the Australian Medium Term Note Program. On 23 April 2015, we announced the pricing of a three tranche EUR2.0 billion bond under the Euro Medium Term Note Programme.
On 6 May 2015, we announced the 2015 General Meeting results, namely that the ordinary resolution to approve the demerger of South32 from BHP Billiton had been passed. On 7 May 2015, we announced that the BHP Billiton Board had resolved to approve the in-specie distribution of South32 shares to shareholders in BHP Billiton, as described in the Shareholder Circular dated 16 March 2015.
On 20 May 2015, we announced the resolution of the previously disclosed investigation by the US Securities and Exchange Commission (SEC) into potential breaches of the US Foreign Corrupt Practices Act. The SEC order made no findings of corrupt intent or bribery by BHP Billiton but imposed a US$25 million civil penalty relating to books and records and internal accounting controls requirements. We
| also announced that the US Department of Justice had completed its investigation into BHP Billiton without taking any action. |
On 25 May 2015, we announced that the implementation of the demerger of South32 from BHP Billiton had been completed.
On 14 July 2015, we advised of the passing of Sir John Buchanan, who had served as Non-executive Director from 2003 up until the time of his death, and was the Senior Independent Director of BHP Billiton Plc.
On 15 July 2015, we announced that we expected to recognise an impairment charge of approximately US$2 billion post-tax (or approximately US$2.8 billion pre-tax) against the carrying value of our Onshore US assets as an exceptional item in the FY2015 results. On 22 July 2015, we announced that we expected underlying attributable profit in the June 2015 half-year to include additional charges in a range of approximately US$350 million to US$650 million.
On 14 August 2015, we announced that Anita Frew had been appointed to the BHP Billiton Board as an independent Non-executive Director, effective as of 15 September 2015. We also announced that Carlos Cordeiro, who has been a Non-executive Director of BHP Billiton since 2005, would retire from the Board at the conclusion of the BHP Billiton Limited Annual General Meeting in November 2015 and that Shriti Vadera had been appointed as the Senior Independent Director for BHP Billiton Plc with effect from 14 August 2015.
No other matter or circumstance has arisen since the end of FY2013FY2015 that has significantly affected or is expected to significantly affect the operations, the results of operations or state of affairs of the Group in future years.
7.25.2 Share capital and buy-back programs
On 28 August 2014, BHP Billiton Plc cancelled 24,113,658 ordinary shares of US$0.50 each held in treasury by BHP Billiton Plc. Following the cancellation, no treasury shares are held by BHP Billiton Plc.
At the Annual General Meetings held in 2012,2014, shareholders authorised BHP Billiton Plc to make on-market purchases of up to 213,618,545211,207,180 of its ordinary shares, representing approximately 10 per cent of BHP Billiton Plc’s issued share capital at that time. During FY2013,FY2015, we did not make any on-market or off-market purchases of BHP Billiton Limited shares or BHP Billiton Plc shares under any share buy-back program. As at the date of this Directors’ Report, there are no current on-market buy-backs.
Shareholders will be asked at the 20132015 Annual General Meetings to renew this authority. TheAs at the date of this Directors’ Report, the Directors have no present intention to exercise this authority, if granted.
Some of our executives receive optionsrights over BHP Billiton shares as part of their remuneration arrangements. Entitlements may be satisfied by the transfer of existing shares, which are acquired on-market by the Employee Share Ownership Plan (ESOP) Trusts, or in respect of some entitlements, by the issue of new shares.
The number of shares referred to in column ‘A’ below were purchased to satisfy awards made under the various BHP Billiton Limited and BHP Billiton Plc employee share schemes during FY2013.FY2015.
| | | | | | | | | | | | | | | | | | | | |
Period | | A
Total
number of
shares
purchased | | | B
Average
price paid
per share (1)
US$ | | | C
Total
number of
shares
purchased
as part of
publicly
announced
plans or
programs | | | D
Maximum number of shares that
may yet be purchased under the
plans or programs | |
| | | | | | | | | | | | BHP Billiton
Limited (2) | | | BHP Billiton
Plc | |
1 July 2012 to 31 July 2012 | | | 2,793,304 | | | | 30.19 | | | | – | | | | – | | | | 213,618,545 | (3) |
1 Aug 2012 to 31 Aug 2012 | | | 2,849,332 | | | | 34.40 | | | | – | | | | – | | | | 213,618,545 | (3) |
1 Sep 2012 to 30 Sep 2012 | | | 2,076,212 | | | | 33.57 | | | | – | | | | – | | | | 213,618,545 | (3) |
1 Oct 2012 to 31 Oct 2012 | | | 2,002,218 | | | | 33.73 | | | | – | | | | – | | | | 213,618,545 | (3) |
1 Nov 2012 to 30 Nov 2012 | | | 287,650 | | | | 35.53 | | | | – | | | | – | | | | 213,618,545 | (4) |
1 Dec 2012 to 31 Dec 2012 | | | 468,456 | | | | 38.13 | | | | – | | | | – | | | | 213,618,545 | (4) |
1 Jan 2013 to 31 Jan 2013 | | | 165,979 | | | | 37.47 | | | | – | | | | – | | | | 213,618,545 | (4) |
1 Feb 2013 to 28 Feb 2013 | | | 120,622 | | | | 38.92 | | | | – | | | | – | | | | 213,618,545 | (4) |
1 Mar 2013 to 31 Mar 2013 | | | 932,961 | | | | 36.36 | | | | – | | | | – | | | | 213,618,545 | (4) |
1 Apr 2013 to 30 Apr 2013 | | | 1,000,984 | | | | 30.85 | | | | – | | | | – | | | | 213,618,545 | (4) |
1 May 2013 to 31 May 2013 | | | 385,943 | | | | 34.51 | | | | – | | | | – | | | | 213,618,545 | (4) |
1 June 2013 to 30 June 2013 | | | 222,828 | | | | 30.94 | | | | – | | | | – | | | | 213,618,545 | (4) |
| | | | | | | | | | | | | | | | | | | | |
Total | | | 13,306,489 | | | | 33.34 | | | | – | | | | – | | | | 213,618,545 | (4) |
| | | | | | | | | | | | | | | | | | | | |
| | | | | | | | | | | | | | | | | | | | |
Period | | A
Total
number of
shares
purchased | | | B
Average
price paid
per share (1)
US$ | | | C
Total
number of
shares
purchased
as part of
publicly
announced
plans or
programs | | | D
Maximum number of shares that
may yet be purchased under the
plans or programs | |
| | | | | | | | | | | | BHP Billiton
Limited (2) | | | BHP Billiton Plc | |
1 Jul 2014 to 31 Jul 2014 | | | 305 | | | | 34.55 | | | | – | | | | – | | | | 213,618,545 | (3) |
1 Aug 2014 to 31 Aug 2014 | | | 9,565,866 | | | | 35.31 | | | | – | | | | – | | | | 213,618,545 | (3) |
1 Sep 2014 to 30 Sep 2014 | | | – | | | | – | | | | – | | | | – | | | | 213,618,545 | (3) |
1 Oct 2014 to 31 Oct 2014 | | | – | | | | – | | | | – | | | | – | | | | 213,618,545 | (3) |
1 Nov 2014 to 30 Nov 2014 | | | 196 | | | | 31.29 | | | | – | | | | – | | | | 211,207,180 | (4) |
1 Dec 2014 to 31 Dec 2014 | | | 3,464 | | | | 31.09 | | | | – | | | | – | | | | 211,207,180 | (4) |
1 Jan 2015 to 31 Jan 2015 | | | – | | | | – | | | | – | | | | – | | | | 211,207,180 | (4) |
1 Feb 2015 to 28 Feb 2015 | | | – | | | | – | | | | – | | | | – | | | | 211,207,180 | (4) |
1 Mar 2015 to 31 Mar 2015 | | | – | | | | – | | | | – | | | | – | | | | 211,207,180 | (4) |
1 Apr 2015 to 30 Apr 2015 | | | – | | | | – | | | | – | | | | – | | | | 211,207,180 | (4) |
1 May 2015 to 31 May 2015 | | | – | | | | – | | | | – | | | | – | | | | 211,207,180 | (4) |
1 Jun 2015 to 30 Jun 2015 | | | 852,554 | | | | 21.21 | | | | – | | | | – | | | | 211,207,180 | (4) |
| | | | | | | | | | | | | | | | | | | | |
Total | | | 10,422,385 | | | | 34.15 | | | | – | | | | – | | | | 211,207,180 | (4) |
| | | | | | | | | | | | | | | | | | | | |
| (1) | The shares were purchased in the currency of the stock exchange on which the purchase took place, and the sale price has been converted into US dollars at the exchange rate on the day of the purchase. |
| (2) | BHP Billiton Limited is able to buy-back and cancel BHP Billiton Limited shares within the ‘10/12 limit’ without shareholder approval in accordance with section 257B of the Australian Corporations Act 2001. Any future on-market share buy-back program will be conducted in accordance with the Australian Corporations Act 2001 and with the ASX Listing Rules. |
| (3) | At the Annual General Meetings held during 2011,2013, shareholders authorised BHP Billiton Plc to make on-market purchases of up to 213,618,545 of its ordinary shares, representing approximately 10 per cent of BHP Billiton Plc’s issued capital at the time. |
| (4) | At the Annual General Meetings held during 2012,2014, shareholders authorised BHP Billiton Plc to make on-market purchases of up to 213,618,545211,207,180 of its ordinary shares, representing approximately 10 per cent of BHP Billiton Plc’s issued capital at the time. |
7.35.3 Results, financial instruments and going concern
Information about our financial position and financial results is included in the financial statementsFinancial Statements in this Annual Report. The income statementConsolidated Income Statement shows profit attributable to BHP Billiton members of US$10.91.9 billion in FY2015, compared with US$15.413.8 billion in FY2012.FY2014.
The Group’s business activities, together with the factors likely to affect its future development, performance and position are discussed in section 31 of this Annual Report. In addition, sections 1.5 to 1.7 and 5.143.15, and note 29 Financial23 ‘Financial risk managementmanagement’ to the financial statementsFinancial Statements detail the Group’s capital management objectives, its approach to financial risk management and exposure to financial risks, liquidity and borrowing facilities.
The Directors, having made appropriate enquiries, have a reasonable expectation that the Group has adequate resources to continue in operational existence for the foreseeable future. Therefore, they continue to adopt the going-concerngoing concern basis of accounting in preparing the annual financial statements.Financial Statements.
7.45.4 Directors
The Directors who served at any time during or since the end of the financial year areor up to 23 September 2015 were Jac Nasser, Andrew Mackenzie, Marius Kloppers,Malcolm Brinded, Malcolm Broomhead, Sir John Buchanan, Carlos Cordeiro, David Crawford, Pat Davies, Carolyn Hewson, Lindsay Maxsted, Wayne Murdy, Keith Rumble, John Schubert, Shriti Vadera and Shriti Vadera.Anita Frew. Further details of the current Directors of BHP Billiton Limited and BHP Billiton Plc are set out in section 4.13.2 of this Annual Report. These details include the period for which each Director held office up to the date of this Directors’ Report, their qualifications, experience and particular responsibilities, the directorships held in other listed companies since 1 July 2010,2012 and the period for which each directorship has been held.
Mr MackenzieDavid Crawford and Keith Rumble retired as Non-executive Directors of BHP Billiton Limited and BHP Billiton Plc with effect from 20 November 2014 and 22 May 2015, respectively. Sir John Buchanan served as a Non-Executive Director of BHP Billiton from 2003 up until his death on 13 July 2015. Sir John was the Senior Independent Director of BHP Billiton Plc.
Carlos Cordeiro has announced that he will retire as a Non-executive Director of BHP Billiton Limited and BHP Billiton Plc at the conclusion of the BHP Billiton Limited Annual General Meeting in November 2015.
Anita Frew was appointed as a Non-executive Director of BHP Billiton Limited and BHP Billiton Plc with effect from 10 May 2013,15 September 2015 and, in accordance with the Constitution of BHP Billiton Limited Constitution and the BHP Billiton Plc Articles of Association, of BHP Billiton Plc, Mr Mackenzie will seek election at the 20132015 Annual General Meetings. Mr Kloppers retired as a
Shriti Vadera was appointed the Senior Independent Director of BHP Billiton Limited andfor BHP Billiton Plc on 10 May 2013.with effect from 14 August 2015.
The number of meetings of the Board and its Committees held during the year and each Director’s attendance at those meetings are set out in section 5.113.12 of this Annual Report.
7.55.5 Remuneration and share interests
7.5.15.5.1 Remuneration
The policy for determining the nature and amount of emoluments of members of the Group Management Committee (GMC)GMC (including the Executive Director) and the Non-executive Directors, and information about the relationship between that policy and our performance, are set out in sections 6.2.7 to 6.2.13, 6.3.34.3 and 6.3.44.4 of this Annual Report.
The remuneration tables contained in sections 6.3 and 6.4section 4.4 of this Annual Report set out the remuneration of members of the GMC (including the Executive Director) and the Non-executive Directors.
7.5.25.5.2 Directors
The table contained in section 7.19Sections 4.4.27 and 5.17 of this Directors’Annual Report setsset out the relevant interests in shares in BHP Billiton Limited and BHP Billiton Plc of the Directors who held office during FY2013,FY2015, at the beginning and end of FY2013,FY2015, and
in relation to all Directors in office as at the date of this Directors’ Report, their relevant interests
in shares in BHP Billiton Limited and BHP Billiton Plc as at the date of this Directors’ Report. No rights or options over shares in BHP Billiton Limited and BHP Billiton Plc are held by any of the Non-executive Directors. Interests held by the Executive Director under share and optionemployee equity plans as at 30 June 20132015 are set out in the tables showing interests in incentive plans contained in section 6.44.4 and note 3124 ‘Key Management Personnel’management personnel’ to the financial statements.Financial Statements.
We have not made available to any Director any interest in a registered scheme.
The former Directors of BHP Limited participated in a retirement plan under which they were entitled to receive a payment on retirement calculated by reference to years of service. This plan was closed on 24 October 2003, and benefits accrued to that date are held by BHP Billiton Limited and will be paid on retirement. Further information about this plan and its closure are set out in section 6.4.84.4.30 of this Annual Report.
7.5.35.5.3 GMC members
The table contained in section 7.20Sections 4.4.27 and 5.18 of this Directors’Annual Report setsset out the relevant interests held by those senior executives who were members of the GMC (other than the Executive Director) during FY2013FY2015 in shares of BHP Billiton Limited and BHP Billiton Plc at the beginning and end of FY2013,FY2015, and at the date of this Directors’ Report. Interests held by members of the GMC under share and optionemployee equity plans as at 30 June 20132015 are set out in the tables showing interests in incentive plans contained in section 6.44.4 and note 3124 ‘Key Management Personnel’management personnel’ to the financial statements.Financial Statements.
7.65.6 Secretaries
Jane McAloonMargaret Taylor is the Group Company Secretary. Details of her qualifications and experience are set out in sections 4.1 and 4.2section 3.2 of this Annual Report. The following people also act, or have acted during the financial year, as the Company Secretariescompany secretaries of either BHP Billiton Limited, or BHP Billiton Plc: Nicola Kleynhans, BBus, Deputy Company Secretary, BHPPlc or both (as indicated): Jane McAloon, BEc (Hons), LLB, GDipGov, FCIS (BHP Billiton Limited and BHP Billiton Plc) (resigned 1 June 2015), Nicole Duncan, BA (Hons), LLB Company Secretary,(BHP Billiton Limited and BHP Billiton Plc) (resigned 12 December 2014), Rachel Agnew, BComm (Economics), LLB (Hons) (BHP Billiton Limited and BHP Billiton Plc) (appointed 12 December 2014), Kathryn Griffiths, BA, LLB (Hons), GDipACG, FCIS, FGIA, GAICD (BHP Billiton Limited) (appointed 12 December 2014), Megan Pepper, BA (Hons), LLB (Hons), GradDipACG, FCIS, FGIA (BHP Billiton Limited) (appointed 12 December 2014), Geof Stapledon, BEc, LLB (Hons), DPhil, FCIS Deputy Company Secretary, BHP(BHP Billiton Plc,Plc) and Elizabeth Hobley, BA (Hons), ACIS Deputy Company Secretary, BHP(BHP Billiton Plc.Plc). Each such individual has experience in a company secretariat role or other relevant fields arising from time spent in such roles within BHP Billiton, large listed companies or other relevant entities.
7.75.7 Indemnities and insurance
Rule 146 of the BHP Billiton Limited Constitution and Article 146 of the BHP Billiton Plc Articles of Association require each Company to indemnify, to the extent permitted by law, each Director, Secretary or Executive Officer of BHP Billiton Limited and BHP Billiton Plc respectively against liability incurred in, or arising out of, the conduct of the business of the Company or the discharge of the duties of the Director, Secretary and Executive Officer. The Directors named in section 4.13.2 of this Annual Report, the Executive Officers and the Company Secretaries of BHP Billiton Limited and BHP Billiton Plc have the benefit of this requirement, as do individuals who formerly held one of those positions.
In accordance with this requirement, BHP Billiton Limited and BHP Billiton Plc have entered into Deeds of Indemnity, Access and Insurance (Deeds of Indemnity) with each of their respective Directors. The Deeds of Indemnity are qualifying third party indemnity provisions for the purposes of the UK Companies Act 2006.2006 and each of these qualifying third party indemnities was in force as at the date of this Directors’ Report.
We have a policy that we will, as a general rule, support and hold harmless an employee, including an employee appointed as a Director of a subsidiary, who, while acting in good faith, incurs personal liability to others as a result of working for us.
In addition, as part of the arrangements to effect the demerger of South32, we have agreed to indemnify certain former Directors, Secretaries and Executive Officers of BHP Billiton, who have transitioned to South32, from certain claims and liabilities incurred in their capacity as Directors or Officers of South32.
From time to time, we engage our External Auditor, KPMG, to conduct non-statutory audit work and provide other services in accordance with our policy on the provision of other services by the External Auditor. The terms of engagement typicallyin the UK include an indemnity in favour of KPMG:
that we must compensate and reimburse KPMG LLP, and protect KPMG LLP against all losses, claims, costs, expenses, actions, demands, damages, liabilitiesany loss, damage, expense, or any proceedings (liabilities)liability incurred by KPMG LLP in respect of third party claims arising from a breach by the Group of any obligation under the engagement terms;
terms.
for all liabilities KPMG has to the Group or any third party as a result of reliance on information provided by the Group that is false, misleading or incomplete.
We have insured against amounts that we may be liable to pay to Directors, Company Secretaries or certain employees (including former Officers) pursuant to Rule 146 of the Constitution of BHP Billiton Limited and Article 146 of the Articles of Association of BHP Billiton Plc or that we otherwise agree to pay by way of indemnity. The insurance policy also insures Directors, Company Secretaries and some employees (including former Officers) against certain liabilities (including legal costs) they may incur in carrying out their duties for us.duties.
We have paid premiums for this ‘DirectorsDirectors’ and Officers’ insurance of US$2,124,8522,068,352 net during FY2013. Directors, Company Secretaries and employees insured under the policy contribute to the premium for this insurance.FY2015.
No indemnity in favour of a current or former officer of BHP Billiton Limited or BHP Billiton Plc, or in favour of the External Auditor, has been called on during FY2013.FY2015.
7.85.8 Employee policies and involvement
WeOur people are committedfundamental to open, honest and productive relationships with our employees.success. At BHP Billiton, we recognise the most important ingredient for success isare committed to shaping a culture where our talentedemployees are provided with opportunities to develop, are valued and motivated workforce, whose members demonstrate behavioursare encouraged to contribute toward making work safer, simpler and more productive. We strongly believe that having employees who are engaged and connected to our organisation, reinforces our shared purpose aligned toOur BHP Billiton Charter values.and will result in a more harmonious workplace.
We have an integrated people strategyFurther information in relation to effectively attract, retain and develop talented people. Our approach is outlined inOur Charter, the BHP BillitonCode of Business Conduct and the Group Level Documents (GLDs) that prescribe what we will do and how we will do it. All of these documents are published and accessible to employees.
Effective communicationemployee engagement and employee engagement is critical for maintaining openpolicies, including communications and productive relationships between leaders and employees. Employees receive communication on BHP Billiton goals and performance, as well as on other important issues such as health and safety and the environment and theCode of Business Conduct. OurCode of Business Conduct is founded onOur Charter values, which make an unqualified commitment to working with integrity. Communication is undertaken through a variety of channels, including the internet, intranet, email, newsletters and other means designed to cater for the local environment. These tools are also used to facilitate employee feedback, as are a variety of consultative processes. Dispute and grievance handling processes are also in place to assist in equitably addressing workplace issues in all businesses. A Business Conduct Advisory Service operates worldwide to allow concerns todisabilities, can be raised about conduct that is out of step withOur Charter values, our policies and procedures or the law.
Our all-employee share purchase plan, Shareplus, is available to all permanent full-time and part-time employees, and those on fixed-term contracts, except where local regulations limit operation of the scheme. In these instances, alternative arrangements are in place. As at 30 June 2013, 24,746 employees, or approximately 50.1 per cent of those eligible for the April 2013 offer, were participants in Shareplus. The Shareplus employee plan is describedfound in section 6.3.2 of this Annual Report. Short-term and long-term incentive schemes also operate across the Group. Rewards for eligible individuals are predicated on the need to meet targets relating to the Group’s performance in areas such as health, safety and achievement of financial measures and on the personal performance of each employee.
Our performance management process aligns individual performance and behaviour toOur Charter1.13.2. and our strategic and operational priorities, as well as working to ensure that individual and team performance is recognised. Our leaders are accountable for providing constructive feedback and identifying development needs to help our employees maximise their performance and realise their full potential. In FY2013, 68 per cent of employees participated in a formal performance review process. Due to industrial agreements, not all employees are able to participate in individual performance or reward programs. The importance we place on employee development and training is demonstrated by the significant amount of training our employees undertake.
BHP Billiton is committed to building and maintaining a diverse workforce and providing a work environment in which every employee is treated fairly and with respect. We work actively to avoid discrimination on any basis, including disability. Where an employee suffers some disability while they are employed, we work to identify roles that meet their skill, experience and capability, and in some cases offer retraining. We also offer flexible work practices, where this is possible, taking into account the needs of the employee and those of the particular workplace. The employment packages under our remuneration policy, which must comply with local regulations, are aligned to our business requirements and are designed to be sufficiently attractive to recruit and retain the best people.
Our employees can access our Annual Reports either via the internet or hard copy.
7.95.9 Corporate Governancegovernance
The UK Financial Conduct Authority’s Disclosure and Transparency Rules (DTR 7.2) require that certain information be included in a corporate governance statement set out in the Directors’ Report. BHP Billiton has an existing practice of issuing a separate corporate governance statement as part of its Annual Report. The information required by the Disclosure and Transparency Rules and the UK Financial Conduct Authority’s Listing Rules (LR 9.8.6) is located in section 5 of this Annual Report,3, with the exception of the information referred to in LR 9.8.6 (1), (3) and (4) and DTR 7.2.6, which is located in section 7.22sections 5.2, 5.3, 5.17 and 5.20 of this Annual Report.
7.105.10 Dividends
A final dividend of 5962 US cents per share will be paid on 2529 September 2013.2015, resulting in total dividends in respect of FY2015 of 124 US cents per share. Details of the dividends paid are set out in sections 1.6.3 and note 19 ‘Dividends’ to the Financial Statements and details of the dividend policy are set out in sections 3.7.61.6.3 and 11.39.7 of this Annual Report.
7.115.11 Auditors
A resolution to appointreappoint KPMG LLP as the auditor of BHP Billiton Plc will be proposed at the 20132015 Annual General Meetings in accordance with section 489 of the UK Companies Act 2006.
MrDuring FY2015, Lindsay Maxsted was the only officer of BHP Billiton during FY2013 who was apreviously held the role of director or partner of the Group’s External Auditor at a time when the Group’s External Auditor conducted an audit of the Group. Mr Maxsted’sHis prior relationship with KPMG is set outoutlined in section 5.93.10 of this Annual Report. MrLindsay Maxsted was not part of the KPMG audit practice after 1980 and, while at KPMG, was not in any way involved in, or able to influence, any audit activity associated with BHP Billiton.
Each person who held the office of Director at the date the Board resolved to approve this Directors’ Report makes the following statements:
so far as the Director is aware, there is no relevant audit information of which the Group’s External Auditor is unaware;
the Director has taken all steps that he or she ought to have taken as a Director to make him or herself aware of any relevant audit information and to establish that the Group’s External Auditor is aware of that information.
This confirmation is given pursuant to section 418 of the UK Companies Act 2006 and should be interpreted in accordance with and subject to these provisions.
7.125.12 Non-audit services
Details of the non-audit services undertaken by our External Auditor, including the amounts paid for non-audit services, are set out in note 3538 ‘Auditor’s remuneration’ to the financial statements.Financial Statements. All non-audit services were approved in accordance with the process set out in the Policy on Provision of Audit and Other Services by the External Auditor, and no non-audit services were carried out that were specifically excluded by the Policy on Provision of Audit and Other Services by the External Auditor. Based on advice provided by the Risk and Audit Committee, the Directors have formed the view that the provision of non-audit services is compatible with the general standard of independence for auditors, and that the nature of non-audit services means that auditor independence was not compromised.
Further information about our policy in relation to the provision of non-audit services by the auditor is set out in section 5.13.13.14.1 of this Annual Report.
7.13 Value of land
Much of our interest in land consists of leases and other rights that permit exploration and production on that land, including the erection of buildings and equipment thereon for the purpose of extracting and processing minerals. Land is mainly carried in the accounts at cost and it is not possible to estimate the market value as it is not readily discernible from the estimated value of each operation situated on the land.
7.145.13 Political and charitable donations
No political contributions/donations for political purposes were made by the Group to any political party, politician, elected official or candidate for public office during FY2013.FY2015.(1)
In FY2013, we made charitable donations for the purposes of funding community programs in the United Kingdom of US$46,689 (cash) (2012: US$71,000). Our worldwide voluntary community investment totalled US$245.8 million (2012: US$214.1 million), comprising cash, in-kind support and administrative costs, and included a US$106 million contribution to the BHP Billiton Foundation. For further information, refer to section 2.8.13 of this Annual Report.
| (1) | Note that Australian Electoral Commission (AEC) disclosure requirements are broad, such that amounts that are not political donations can be reportable for AEC purposes. For example, where a political party or organisation owns shares in BHP Billiton, the AEC filing requires the political party or organisation to disclose the dividend payments received for their shareholding. |
7.155.14 Exploration, research and development
Companies within the Group carry out exploration and research and development necessary to support their activities. Further details are provided in sections 2.2, 2.51.6.3, 1.12, 1.15.1, 2.1 and 2.62.3.2 of this Annual Report.
7.16 Creditor payment policy
When we enter into a new contract with a supplier, payment terms will be communicated with the supplier in the negotiation phase of the contract and confirmed upon both parties signing and executing the agreement. Our approach to payment terms is outlined in our GLD that prescribes what we will do and how we will do it. We settle terms of payment with suppliers when agreeing overall terms of business, and seek to abide by the terms of the contracts to which we are bound. As at 30 June 2013, BHP Billiton Plc (the unconsolidated parent entity) had US$1,286,242 of trade creditors outstanding, which represents 65 days of purchases outstanding in respect of costs, based on the total invoiced by suppliers during FY2013. The calculated 65 days is impacted by the quantum of invoices received during the last week in June (2013: US$1.3 million, 2012: US$0.2 million), which are included in the 30 June creditor balance. All invoices received in June 2013 were fully paid within 30 days after year-end.
7.175.15 Class order
BHP Billiton Limited is a company of a kind referred to in Australian Securities and Investments Commission (ASIC) Class Order No. 98/100 dated 10 July 1998. Amounts in this Directors’ Report and the financial statements,Financial
Statements, except estimates of future expenditure or where otherwise indicated, have been rounded to the nearest million dollars in accordance with that Class Order.
7.185.16 Proceedings on behalf of BHP Billiton Limited
No proceedings have been brought on behalf of BHP Billiton Limited, nor any application made, under section 237 of the Australian Corporations Act 2001.
7.195.17 Directors’ shareholdings
The tables below set outExcept for Malcolm Brinded and Andrew Mackenzie, as at the date of this Directors’ Report, the information pertaining to shares in BHP Billiton Limited and BHP Billiton Plc held directly, indirectly or beneficially, by Directors is the same as set out in BHP Billiton Limited and BHP Billiton Plc.the table in section 4.4.27. Where applicable, the information includes shares held in the name of a spouse, superannuation fund, nominee and/or other controlled entities.
As at the date of this Directors’ Report, Malcolm Brinded indirectly holds 32,000 shares in BHP Billiton Plc and Andrew Mackenzie holds (either directly, indirectly or beneficially) 266,246 shares in BHP Billiton Plc and 16,575 shares in BHP Billiton Limited. Andrew Mackenzie holds rights and options over 340,288 shares in BHP Billiton Plc and 512,087 shares in BHP Billiton Limited as at the date of this Directors’ Report.
| | | | | | | | | | | | | | |
| | | BHP Billiton entity | | As at date of
Directors’ Report | | | As at 30 June 2013 | | | As at 30 June 2012 | |
Malcolm Broomhead | | BHP Billiton Limited | | | 9,000 | | | | 9,000 | | | | 9,000 | |
| | BHP Billiton Plc | | | – | | | | – | | | | – | |
John Buchanan | | BHP Billiton Limited | | | – | | | | – | | | | – | |
| | BHP Billiton Plc | | | 20,000 | | | | 20,000 | | | | 20,000 | |
Carlos Cordeiro(1) | | BHP Billiton Limited | | | 6,550 | | | | 6,550 | | | | 6,550 | |
| | BHP Billiton Plc | | | – | | | | – | | | | – | |
David Crawford | | BHP Billiton Limited | | | 33,127 | | | | 33,127 | | | | 33,127 | |
| | BHP Billiton Plc | | | 6,000 | | | | 6,000 | | | | 6,000 | |
Pat Davies | | BHP Billiton Limited | | | – | | | | – | | | | – | |
| | BHP Billiton Plc | | | 27,170 | | | | 27,170 | | | | 4,170 | |
Carolyn Hewson | | BHP Billiton Limited | | | 14,000 | | | | 7,000 | | | | 7,000 | |
| | BHP Billiton Plc | | | – | | | | – | | | | – | |
Marius Kloppers(2) | | BHP Billiton Limited | | | Not Applicable | | | | 373,666 | | | | 171,668 | |
| | BHP Billiton Plc | | | Not Applicable | | | | 628,982 | | | | 688,895 | |
Andrew Mackenzie(3)(4) | | BHP Billiton Limited | | | – | | | | – | | | | – | |
| | BHP Billiton Plc | | | 201,921 | | | | 72,619 | | | | 61,560 | |
Lindsay Maxsted | | BHP Billiton Limited | | | 6,500 | | | | 3,000 | | | | 3,000 | |
| | BHP Billiton Plc | | | – | | | | – | | | | – | |
Wayne Murdy(1) | | BHP Billiton Limited | | | 8,000 | | | | 8,000 | | | | 8,000 | |
| | BHP Billiton Plc | | | 14,000 | | | | 14,000 | | | | 14,000 | |
Jac Nasser(1) | | BHP Billiton Limited | | | 10,400 | | | | 10,400 | | | | 10,400 | |
| | BHP Billiton Plc | | | 81,200 | | | | 81,200 | | | | 81,200 | |
Keith Rumble | | BHP Billiton Limited | | | – | | | | – | | | | – | |
| | BHP Billiton Plc | | | 14,500 | | | | 14,500 | | | | 14,500 | |
John Schubert | | BHP Billiton Limited | | | 23,675 | | | | 23,675 | | | | 23,675 | |
| | BHP Billiton Plc | | | – | | | | – | | | | – | |
Shriti Vadera | | BHP Billiton Limited | | | – | | | | – | | | | – | |
| | BHP Billiton Plc | | | 9,000 | | | | 9,000 | | | | 9,000 | |
(1) | The following BHP Billiton Limited shares and BHP Billiton Plc shares are held in the form of American Depositary Shares: Carlos Cordeiro (3,275 BHP Billiton Limited), Wayne Murdy (4,000 BHP Billiton Limited; 7,000 BHP Billiton Plc) and Jac Nasser (5,200 BHP Billiton Limited; 40,600 BHP Billiton Plc). |
(2) | Marius Kloppers ceased to be a Director on 10 May 2013. The disclosed holding as at 30 June 2013 reflects his holding as at the date he ceased to be a Director. In addition to the shares specified above, Marius Kloppers held 1,570,541 options and rights over BHP Billiton Limited shares as at 10 May 2013, when he ceased to be a Director. |
(3) | Director appointed to the Board during FY2013: Andrew Mackenzie (10 May 2013). The disclosed holding as at 30 June 2012 reflects his holding as a member of the GMC as at 30 June 2012. |
(4) | In addition to the shares specified above, Andrew Mackenzie held 958,647 options and rights over BHP Billiton Plc shares as at 30 June 2013 and 577,459 options and rights over BHP Billiton Plc shares as at the date of this Directors’ Report. |
7.205.18 GMC members’ shareholdings (other than Directors)
The tables below set outAs at 30 June 2015, the information pertaining to shares in BHP Billiton Limited and BHP Billiton Plc held directly, indirectly or beneficially, by those senior executives who were members of the GMC during FY2013FY2015 (other than the Executive Director). is set out in the table in section 4.4.27. Where applicable, the information includes shares held in the name of a spouse, superannuation fund, nominee and/or other controlled entities.
As at the date of this Directors’ Report, the information pertaining to shares in BHP Billiton Limited and BHP Billiton Plc held directly, indirectly or beneficially, by those senior executives who were members of the GMC during FY2015 (other than the Executive Director) is as follows and, where applicable, the information also includes shares held in the name of a spouse, superannuation fund, nominee and/or other controlled entities:
| | | | | | | | | | | | | | |
| | | BHP Billiton entity | | As at date of
Directors’ Report | | | As at 30 June 2013 | | | As at 30 June 2012 | |
Peter Beaven (1) | | BHP Billiton Limited | | | 184,601 | | | | 73,533 | | | | Not Applicable | |
| | BHP Billiton Plc | | | – | | | | – | | | | Not Applicable | |
Dean Dalla Valle (1) | | BHP Billiton Limited | | | 127,056 | | | | 109,663 | | | | Not Applicable | |
| | BHP Billiton Plc | | | – | | | | – | | | | Not Applicable | |
Geoff Healy (1) | | BHP Billiton Limited | | | 3,000 | | | | 3,000 | | | | Not Applicable | |
| | BHP Billiton Plc | | | – | | | | – | | | | Not Applicable | |
Mike Henry | | BHP Billiton Limited | | | 18,696 | | | | 18,696 | | | | 18,696 | |
| | BHP Billiton Plc | | | 111,630 | | | | 75,564 | | | | 44,254 | |
Graham Kerr | | BHP Billiton Limited | | | 94,584 | | | | 49,598 | | | | 5,422 | |
| | BHP Billiton Plc | | | – | | | | – | | | | – | |
Jane McAloon(1) | | BHP Billiton Limited | | | 46,654 | | | | 36,070 | | | | Not Applicable | |
| | BHP Billiton Plc | | | – | | | | – | | | | Not Applicable | |
Daniel Malchuk(1) | | BHP Billiton Limited | | | 52,687 | | | | – | | | | Not Applicable | |
| | BHP Billiton Plc | | | – | | | | – | | | | Not Applicable | |
Jimmy Wilson(1) | | BHP Billiton Limited | | | 116,115 | | | | 1,552 | | | | Not Applicable | |
| | BHP Billiton Plc | | | 59,301 | | | | 59,301 | | | | Not Applicable | |
Karen Wood | | BHP Billiton Limited | | | 368,013 | | | | 313,013 | | | | 269,645 | |
| | BHP Billiton Plc | | | – | | | | – | | | | – | |
Alberto Calderon(2) | | BHP Billiton Limited | | | Not Applicable | | | | – | | | | – | |
| | BHP Billiton Plc | | | Not Applicable | | | | 302,626 | | | | 175,973 | |
Marcus Randolph(2) | | BHP Billiton Limited | | | Not Applicable | | | | 315,877 | | | | 322,212 | |
| | BHP Billiton Plc | | | Not Applicable | | | | – | | | | – | |
J Michael Yeager(3)(4) | | BHP Billiton Limited | | | 565,997 | | | | 565,997 | | | | 427,059 | |
| | BHP Billiton Plc | | | – | | | | – | | | | – | |
| | | | | | |
GMC Member (1) (2) | | BHP Billiton entity | | As at date of
Directors’ Report | |
Peter Beaven | | BHP Billiton Limited
BHP Billiton Plc | |
| 238,085
– |
|
Tony Cudmore | | BHP Billiton Limited
BHP Billiton Plc | |
| –
– |
|
Tim Cutt (3) | | BHP Billiton Limited
BHP Billiton Plc | |
| 79,507
– |
|
Dean Dalla Valle | | BHP Billiton Limited
BHP Billiton Plc | |
| 148,164
– |
|
Geoff Healy | | BHP Billiton Limited
BHP Billiton Plc | |
| 3,000
– |
|
Mike Henry | | BHP Billiton Limited
BHP Billiton Plc | |
| 38,039
180,543 |
|
Daniel Malchuk | | BHP Billiton Limited
BHP Billiton Plc | |
| 86,927
– |
|
Athalie Williams | | BHP Billiton Limited
BHP Billiton Plc | |
| 21,457
– |
|
Jimmy Wilson | | BHP Billiton Limited
BHP Billiton Plc | |
| 142,763
59,301 |
|
| (1) | New membersmember appointed to the GMC during FY2013: Peter Beaven, Dean Dalla Valle, Jane McAloon, Daniel Malchuk, Jimmy Wilson (all appointed 10 May 2013) and Geoff HealyFY2015 was Athalie Williams (appointed 3 June 2013)1 January 2015). |
| (2) | Alberto CalderonKaren Wood, Graham Kerr, Mike Fraser and Marcus RandolphJane McAloon ceased to be members of the GMC on 10 May 2013.19 August 2014, 1 October 2014, 1 January 2015 and 1 June 2015, respectively. The disclosed holdings as at 30 June 2013 reflect their holdings as at the date of ceasing to be members2015 set out in section 4.4.27 of the GMC. |
(3) | J Michael Yeager ceased to be a member ofAnnual Report reflect the GMC on 1 July 2013 and retired from the Group on 8 July 2013. The disclosed holdings as at the date of the Directors’ Report reflect his holdings as at the date ofindividual ceasing to be a member of the GMC. |
(4)(3) | 1,300940 BHP Billiton Limited shares are held in the form of 650470 American Depositary Shares. |
7.215.19 Performance in relation to environmental regulation
A significantBHP Billiton seeks to be compliant with all applicable environmental incidentlaws and regulations relevant to its operations. We monitor compliance on a regular basis, including through external and internal means, to ensure that the risk of non-compliance is one with a severity rating of four or above based on our internal severity rating scale (tiered from one to seven by increasing severity). There were no significant environmental incidents reported at our controlled operations in FY2013.minimised.
Fines and prosecutions
In FY2013,FY2015, BHP Billiton received eight13 fines at our controlled operationsoperated assets, with a total value of US$195,405.32,454.
WeTwo fines totalling US$17,963 were received in respect of the Cannington silver-lead-zinc mine for contravention of permit conditions at the port facility. One fine was for particulates from a dust collector baghouse stack being above release limit, and the other fine was for failure to notify the event in the timeframe required. Actions including real-time monitoring and process interlocks were implemented to prevent such an incident recurring.
BHP Billiton Mitsubishi Alliance received two fines totalling US$11,371 for separate non-compliances at the Caval Ridge Mine and Saraji Mine. Both incidents were related to uncontrolled releases of US$181,581, levied in South Africa, for activities relatingmine-affected water that did not meet the conditions of each operation’s Environmental Authority governed by the Queensland Environmental Protection Act (1994). Corrective and preventative actions have been implemented to the establishment of fuel, water and effluent infrastructure that were undertaken at our Wolvekrans Colliery without approval under the National Environment Management Act (NEMA) of 1998. We have instituted corrective measures, which include putting in place a process to ensure that all necessary approvals are obtained before any new mining activity commences.prevent these events recurring.
The sevennine other fines, totalling US$13,824,3,120, were levied in Australia,North America and South Africa where our operations were cited for activities including exceeding discharge quality levels, unauthorised land disturbance, failure to update facility contact information and a delinquent mechanical integrity test. The impacted assets are reviewing measures, or have implemented actions, to prevent these incidents from occurring in relationthe future.
Greenhouse gas emissions
The UK Companies Act 2006 requires the Company, to exceeding allowable discharge limits, excessive dust generationthe extent practicable, to obtain relevant information on the Company’s annual quantity of greenhouse gas emissions, which is reported in tonnes of carbon dioxide equivalent. The Company’s total FY2015 greenhouse gas emissions and release events. We have instituted preventive measures for all these occurrences.intensity are set out in sections 1.10 and 1.14.4 of this Annual Report.
Further information in relation to environmental performance, including environmental regulation, can be found in section 2.81.14 of this Annual Report and in the Sustainability Report, which is available online atwww.bhpbilliton.com.
7.225.20 Share capital, restrictions on transfer of shares and other additional information
Information relating to BHP Billiton Plc’s share capital structure, restrictions on the holding or transfer of its securities or on the exercise of voting rights attaching to such securities, certain agreements triggered on a change of control and the existence of branches of BHP Billiton outside of the United Kingdom, is set out in the following sections of this Annual Report:
Section 1.21.4 (BHP Billiton locations)
Section 2.7 (Government regulations)5.2 (Share capital and buy-back programs)
Section 2.109.3 (Organisational structure)
Section 2.119.4 (Material contracts)
Section 2.129.5 (Constitution)
Section 7.2 (Share capital and buy-back programs)
Section 11.29.6 (Share ownership)
Section 9.11 (Government regulations)
Note 1917 ‘Share capital’ and note 3325 ‘Employee share ownership plans’ to the financial statements.Financial Statements.
Further details of all options and rights outstandingunvested equity awards as at the date of this Directors’ Report, including shares issued upon exercise of options and rights,equity awards, are set out in note 3325 ‘Employee share ownership plans’ to the financial statements.Financial Statements. Details of movements in share capital during and since the end of the financial year are set out in note 1917 ‘Share capital’ to the financial statements.Financial Statements.
The Directors’ Report is madeapproved in accordance with a resolution of the Board.
Jac Nasser AO
Chairman
Andrew Mackenzie
Chief Executive Officer
Dated: 1210 September 20132015
86 Legal proceedings
We are involved from time to time in legal proceedings and governmental investigations of a character normally incidental to our business, including claims and pending actions against us seeking damages or clarification of legal rights and regulatory inquiries regarding business practices. In many cases, insurance or other indemnification protection afforded to us relates to such claims and may offset the financial impact on the Group of a successful claim.
This section summarises the significant legal proceedings and investigations in which we are currently involved.involved or have finalised since the last Annual Report.
Rio Algom Pension Plan
In June 2003, Alexander E Lomas, a retired member of the Pension Plan for Salaried Employees of Rio Algom Mines Limited (Plan), filed a Notice of Application in a representative capacity in the Ontario Superior Court of Justice Commercial List against Rio Algom Limited (RAL) and the Plan Trustee alleging certain improprieties in their administration of the Pension Plan and use of Pension Plan funds from January 1966 onward.
Mr Lomas seeks relief, both quantified and unquantified, for himself and those Plan members he purports to represent in respect of a number of alleged breaches committed by RAL, including allegations of breach of employment contracts, breach of trust, and breach of the Trust Agreement underlying the Pension Plan. In particular:
Mr Lomas seeks US$119.25 million (C$125 million) on account of monies alleged to have been improperly paid out or withheld from the Pension Plan, together with compound interest calculated from the date of each alleged wrongdoing; and
punitive, aggravated and exemplary damages in the sum of US$1.91 million (C$2 million).
Mr Lomas purports to represent members of the defined benefits portion of the Pension Plan. In 2005, the defined contribution members of the Pension Plan were included as parties to this action.
A motion to strike Mr Lomas’ request for the winding-up of the Plan was heard on 27 November 2006. The court struck out part of Mr Lomas’ claim, but allowed the remainder to proceed. RAL’s appeal from that decision was dismissed, but further leave to appeal to the Ontario Court of Appeal was granted. On 10 March 2010, the Ontario Court of Appeal ruled in favour of RAL’s motion to strike out that part of the plaintiff’s claim that sought a court order to wind up the Plan. No further step has been taken by the plaintiff to prosecute the proceedings at this time.
RAL has notified its insurers of the application and has advised other third parties of possible claims against them in respect of matters alleged in the application.
Class actionsActions concerning Cerrejón privatisation
TheAs disclosed in last year’s Annual Report, three actions were commenced by the non-government organisation, Corporación Colombia Transparente (CCT), brought three separate class actions (Popular Actions 1,029, 1,032 and 1,048) against various defendants, including Billiton Investment 3 BV and Billiton Investment 8 BV, in connection with the privatisation of 50 per cent of the Cerrejón Zona Norte (CZN) mining complex in Colombia in 2002. Two2002 (i.e. Popular Actions 1,029, 1,032 and 1,048). These actions are now at an end, with the Court finding against CCT in favour of the actions were dismissed leaving only the action against Cerrejón Zona Norte SA (CZN). The mining complex is currently owned by CZN and Carbones del Cerrejón Limited (CDC). Our subsidiary Billiton Investment 3 BV owns a 33 per cent share in CDC, and our subsidiariesdefendants, including Billiton Investment 3 BV and Billiton Investment 8 BV (BHP Billiton Shareholders) collectively own a 33.33 per cent share in CZN.
CCT alleges, in part, that the defendants failed to comply with the privatisation process, and that the offer price for shares in CZN between Stages 1 and 2 of the privatisation process was not correctly adjusted for inflation.
Our share of the alleged adjustment of the CZN share price would be approximately US$4.41 million. In the alternative, CCT seeks declaration that the privatisation is null and void and forfeiture of the transfer price paid, of which our share would be approximately US$147.14 million. In both instances, CCT also seeks unquantified sanctions, including payment of stamp taxes, an award of 15 per cent of all monies recovered by the defendants, together with interest on all amounts at the maximum rate authorised by law.
The CZN action was dismissed on 18 February 2011, the Court determining that there were no irregularities in the privatisation of the Cerrejón Zona Norte mining complex.
CCT’s request for a reconsideration of the judgment was denied. On 15 March 2011, CCT filed an appeal against the dismissal. This appeal was dismissed on 1 February 2013 and on 15 February 2013 the plaintiff filed for a revision of the judgment. Revision of judgment is a new avenue of review introduced by the Columbian Administrative Code that applies to the last instance judgments and may be used when the plaintiff believes certain issues were not considered in the decision. On 15 March 2013, Cerrejón filed an opposition to this revision application.BV.
A separate class action referred to in last year’s Annual Report arising out of the privatisation of the CZN mining complex has been brought by Mr Martín Nicolás Barros Choles against various defendants, including CDC.
Carbones del Cerrejón Limited (which is 33 per cent owned by Billiton Investment 3 BV) has also come to an end with the Court finding against Mr Choles claims that the transfer of rights by CDC to CZN was ineffective because it only involved a transfer of shares and not the transferin favour of the underlying rights indefendants, including Carbones del Cerrejón Limited.
Anti-corruption investigation
In May 2015, the properties and assets used inGroup announced the CZN mining complex. Consequently, he is seeking orders that CDC pays for the use and leaseresolution of the properties and assets until November 2009, and that from that date the properties and assets of the Cerrejón project revert to the State.
Investigations
Following requests for information in August 2009 frompreviously disclosed investigation by the US Securities and Exchange Commission (SEC), into potential breaches of the Group commenced an internal investigation and disclosed to relevant authorities, including theUS Foreign Corrupt Practices Act (FCPA). The US Department of Justice (DOJ), evidence that it has uncovered regarding possible violations of applicable anti-corruption laws involving interactions with government officials.
As has been publicly reported, the Australian Federal Police has indicated that it has commenced an investigation. The Group is fully cooperating with the relevant authorities as it has since the US investigations commenced.
As part of the US process, the SEC and DOJ notified the Group in August 2013 of the issues they consider could form the basis of enforcement actions and discussions are continuing.also completed its investigation into BHP Billiton without taking any action.
The issues relateinvestigations related primarily to matters in connection with previously terminated minerals exploration and development efforts, as well as hospitality provided as partby BHP Billiton at the 2008 Beijing Olympic Games. The US investigations have now been concluded on all matters.
The matter was resolved with the SEC pursuant to an administrative order, which imposed a US$25 million civil penalty. The SEC order made no findings of the Company’scorrupt intent or bribery by BHP Billiton.
The SEC’s findings related to a hospitality program hosted by BHP Billiton that supported its sponsorship of the 2008 Beijing Olympics.Olympic Games. As part of this program, BHP Billiton invited customers, suppliers, business partners, and government officials, along with BHP Billiton employees, to the 2008 Beijing Olympic Games. While BHP Billiton made efforts at the time to address the risks related to inviting government officials to the 2008 Beijing Olympics, the controls it relied upon were insufficient to satisfy the civil books and records and internal accounting controls requirements of the FCPA.
The SEC noted the ‘significant cooperation’ BHP Billiton provided during the extensive investigation, which commenced in 2009. It also noted the ‘significant remedial actions’ BHP Billiton has taken over the past five years to enhance its compliance program.
At the time of its sponsorship of the 2008 Beijing Olympics and Paralympics, BHP Billiton had no independent compliance function. Instead, accountability for complying with BHP Billiton’s anti-corruption policies, which were set out in BHP Billiton’s Guide to Business Conduct, was vested in its operating business units. BHP
Billiton has since created an independent compliance function that reports to the head of the legal function and the Risk and Audit Committee of the BHP Billiton Board. Today, this compliance function would be required to approve any offer of hospitality of this kind to a government official. Under the SEC order, BHP Billiton will self-report on its compliance program to the SEC for a period of 12 months following the date of the SEC order (20 May 2015).
As previously disclosed, an investigation by the Australian Federal Police (AFP) is ongoing and the Group continues to co-operate. In light of the continuing nature of the investigationsAFP investigation, it is not appropriate at this stage for BHP Billiton to predict outcomes.
97 Financial Statements
Refer to the pages beginning on page F-1 in this Annual Report.annual report.
108 Glossary
10.18.1 Mining, oil and gas-related terms
| | |
Term | | Definition |
2D | | Two dimensional.dimensional seismic. |
| |
3D | | Three dimensional.dimensional seismic. |
| |
Alumina | | Aluminium oxide (Al2O3). Alumina is produced from bauxite in the refining process. Alumina is then converted (reduced) in an electrolysis cell to produce aluminium metal. |
| |
Ash | | Inorganic material remaining after combustion. |
| |
AusIMM | | The Australasian Institute of Mining and Metallurgy. |
| |
Bauxite | | ChiefThe chief ore of aluminium. |
| |
Beneficiation | | The process of physically separating ore from gangue (waste material) prior to subsequent processing of the beneficiated ore. |
| |
Bio-leaching
| | Use of naturally occurring bacteria to leach a metal from ore; for example, copper, zinc, uranium, nickel and cobalt from a sulphide mineral. |
| |
Brownfield | | An exploration or development project located within an existing mineral province, which can share infrastructure and management with an existing operation. |
| |
Butane | | A component of natural gas that occurs in two isomeric forms. Where sold separately, is largely butane gas that has been liquefied through pressurisation. One tonne of ethane is approximately equivalent to 14 thousand cubic feet of gas. |
| |
Coal Reserves | | The same meaning as Ore Reserves, but specifically concerning coal. |
| |
Coking coal | | Used in the manufacture of coke, which is used in the steelmaking process by virtue of its carbonisation properties. Coking coal may also be referred to as metallurgical coal. |
| |
Competent Person
| | A minerals industry professional who is a Member or Fellow of The Australasian Institute of Mining and Metallurgy, or of the Australian Institute of Geoscientists, or of a ‘Recognised Professional Organisation’ (RPO), as included in a list available on the JORC and ASX websites. These organisations have enforceable disciplinary processes including the powers to suspend or expel a member. |
| |
| | A Competent Person must have a minimum of five years relevant experience in the style of mineralisation or type of deposit under consideration and in the activity which that person is undertaking. (JORC Code, 2012.) |
| |
Condensate | | A mixture of hydrocarbons that exist in gaseous form in natural underground reservoirs, but which condense to form a liquid at atmospheric conditions. |
| |
Copper cathode | | Electrolytically refined copper that has been deposited on the cathode of an electrolytic bath of acidified copper sulphate solution. The refined copper may also be produced through leaching and electrowinning. |
| |
Conventional Petroleum Resources | | Hydrocarbon accumulations that can be produced by a well drilled into a geologic formation in which the reservoir and fluid characteristics permit the hydrocarbons to readily flow to the wellbore without the use of specialised extraction technologies. |
| |
Crude oil | | A mixture of hydrocarbons that exist in liquid form in natural underground reservoirs, and remain liquid at atmospheric pressure after being produced at the well head and passing through surface separating facilities. |
| | |
Term
| | Definition
|
Cut-off grade | | A nominated grade above which is defined some mineral aspect of the reserve or resource.an Ore Reserve. For example, the lowest grade of mineralised material that qualifies as economic for estimating an Ore Reserve. |
CQCA
| | Central Queensland Coal Associates. |
| |
ECSATerm
| | Engineering CouncilDefinition |
Dated Brent | | A benchmark price assessment of South Africa.the spot market value of physical cargoes of North Sea light sweet crude oil. |
| |
Electrowinning/electrowon | | An electrochemical process in which metal is recovered by dissolving a metal within an electrolyte and plating it onto an electrode. |
| |
Energy coal | | Used as a fuel source in electrical power generation, cement manufacture and various industrial applications. Energy coal may also be referred to as steaming or thermal coal. |
| |
Ethane | | A component of natural gas. Where sold separately, is largely ethane gas that has been liquefied through pressurisation. One tonne of ethane is approximately equivalent to 26.827.9 thousand cubic feet of gas. |
| |
FAusIMM | | Fellow of the Australasian Institute of Mining and Metallurgy. |
| |
Field | | An area consisting of a single reservoir or multiple reservoirs all grouped on or related to the same individual geological structural feature and/or stratigraphic condition. There may be two or more reservoirs in a field that are separated vertically by intervening impervious strata, or laterally by local geologic barriers, or by both. Reservoirs that are associated by being in overlapping or adjacent fields may be treated as a single or common operational field. The geological termsstructural feature ‘structural feature’ andstratigraphic condition ‘stratigraphic condition’ are intended to identify localised geological features as opposed to the broader terms of basins, trends, provinces, plays, areas-of-interest, etc. (per SEC Regulation S-X, Rule 4-10). |
| |
Flotation | | A method of selectively recovering minerals from finely ground ore using a froth created in water by specific reagents. In the flotation process, certain mineral particles are induced to float by becoming attached to bubbles of froth and the unwanted mineral particles sink. |
| |
FPSO (floating,(Floating, production, storage and off take)off-take) | | A floating vessel used by the offshore oil and gas industry for the processing of hydrocarbons and for storage of oil. An FPSO vessel is designed to receive hydrocarbons produced from nearby platforms or subsea template,templates, process them and store oil until it can be offloaded onto a tanker. |
| |
Grade | | The relative quantity,Any physical or chemical measurement of the percentage,characteristics of metalthe material of interest in samples or mineral content in an orebody.product. |
| |
Greenfield | | The development or exploration located outside the area of influence of existing mine operations/infrastructure. |
| |
GSSA | | Geological Society of South Africa. |
| |
Heap leach(ing) | | A process used for the recovery of metals such as copper, nickel, uranium and gold from low-grade ores. The crushed material is laid on a slightly sloping, impermeable pad and leached by uniformly trickling (gravity fed) a chemical solution through the beds to ponds. The metals are recovered from the solution. |
| | |
Term | | Definition |
IlmeniteHypogene Sulphide | | Hypogene mineralisation is formed by fluids at high temperature and pressure derived from magmatic activity. Hypogene sulphide consists predominantly of chalcopyrite and is not amenable to leaching technology. |
| |
| ICSID (International Centre for Settlement of Investment Disputes) | | ICSID is an autonomous international institution that provides facilities and services to support conciliation and arbitration of international investment disputes between investors and States. ICSID was established under the Convention on the Settlement of Investment Disputes between States and Nationals of Other States (the ICSID Convention), with over 140 member States. |
| |
JORC Code | | A set of minimum standards, recommendations and guidelines for public reporting in Australasia of Exploration Results, Mineral Resources and Ore Reserves. The principle ore of titanium composed of iron, titaniumguidelines are defined by the Australasian Joint Ore Reserves Committee (JORC), which is sponsored by the Australian mining industry and oxygen (FeTiO3).its professional organisations. |
| |
Kriging | | A geostatistical method of estimating resources based on a mathematical function known as a semivariogram. |
| |
Leaching | | The process by which a soluble metal can be economically recovered from minerals in ore by dissolution. |
| |
LNG (Liquefied natural gas) | | Consists largely of methane that has been liquefied through chilling and pressurisation. One tonne of LNG is approximately equivalent to 45.9 thousand cubic feet of natural gas. |
| |
LOI (Loss on ignition) | | A measure of the percentage of volatile matter (liquid or gas) contained within a mineral or rock. LOI is determined to calculate loss in mass during pyroprocessingpyroprocessing. |
| |
LPG (Liquefied petroleum gas) | | Consists of propane and butane and a small amount (less than two per cent) of ethane that has been liquefied through pressurisation. One tonne of LPG is approximately equivalent to 11.6 barrels.barrels of oil. |
| |
MAIG | | Member of the Australian Institute of Geoscientists. |
| |
Marketable Coal Reserves | | Represents beneficiated or otherwise enhancedTonnes of coal product where modifications due to mining, dilutionavailable, at specified moisture content and processing have been considered, must be publicly reported in conjunction with, but not instead of, reportsair-dried qualities, for sale after the beneficiation of Coal Reserves. The basis of the predicted yield to achieve Marketable Coal Reserves must be stated. |
| |
MAusIMM | | Member of the Australasian Institute of Mining and Metallurgy. |
| |
Metallurgical coal | | A broader term than coking coal, which includes all coals used in steelmaking, such as coal used for the pulverised coal injection process. |
| |
Metocean | | A term that is commonly used in the offshore oil and gas industry to describe the physical environment and surrounds (i.e. an environment near an offshore oil and gas working platform). |
| |
Mineralisation | | Any single mineral or combination of minerals occurring in a mass, or deposit, of economic interest. |
| |
NAPEG
| | Northwest Territories and Nunavut Association of Professional Engineers and Geoscientists. |
| |
NGL (Natural gas liquids) | | Natural gas liquids, which includeConsists of propane, butane and ethane.ethane – individually or as a mixture. |
| | |
Term | | Definition |
OC/OP (Open-cut/open-pit) | | Surface working in which the working area is kept open to the sky. |
| |
Ore Reserves | | The economically mineableThat part of a Measured and/mineral deposit that can be economically and legally extracted or Indicated Mineral Resource. It includes diluting materials and allowances for losses, which may occur when the material is mined or extracted and is defined by studies at Pre-Feasibility or Feasibility level as appropriate that include application of Modifying Factors. Such studies demonstrate that,produced at the time of reporting,the reserves determination. To establish this, studies appropriate to the type of mineral deposit involved have been carried out to estimate the quantity, grade and value of the ore mineral(s) present. In addition, technical studies have been completed to determine realistic assumptions for the extraction could reasonablyof the minerals including estimates of mining, processing, economic, marketing, legal, environmental, social and governmental factors. The degree of these studies is sufficient to demonstrate the technical and economic feasibility of the project and depends on whether or not the project is an extension of an existing project or operation. The estimates of minerals to be justified.produced include allowances for ore losses and the treatment of unmineralised materials which may occur as part of the mining and processing activities. Ore Reserves are sub-divided in order of increasing confidence into Probable Ore Reserves and Proven Ore Reserves. |
| |
PEGNL | | Association of Professional Engineers and Geoscientists of Newfoundland and Labrador. |
| |
Probable Ore Reserves | | Ore Reserves for which quantity and grade and/or quality are computed from information similar to that used for proven reserves,Proven Ore Reserves, but the sites for inspection, sampling, and measurement are farther apart or are otherwise less adequately spaced. The degree of assurance, although lower than that for proven reserves,Proven Ore Reserves, is high enough to assume continuity between points of observation. |
| | |
TermPropane
| | Definition
A component of natural gas. Where sold separately, is largely propane gas that has been liquefied through pressurisation. One tonne of ethane is approximately equivalent to 19 thousand cubic feet of gas. |
| |
Proved oil and gas reserves | | Those quantities of oil, gas, and natural gas liquids, which, by analysis of geoscience and engineering data, can be estimated with reasonable certainty to be economically producible – from a given date forward, from known reservoirs, and under existing economic conditions, operating methods, and government regulations – prior to the time at which contracts providing the right to operate expire, unless evidence indicates that renewal is reasonably certain, regardless of whether deterministic or probabilistic methods are used for the estimation (from SEC Rules 2010)Modernization of Oil and Gas Reporting, 2009, 17 CFR Parts 210, 211, 229 and 249). |
| |
Proven Ore Reserves | | Ore Reserves for which (a) quantity is computed from dimensions revealed in outcrops, trenches, workings or drill holes; grade and/or quality are computed from the results of detailed sampling and (b) the sites for inspection, sampling and measurement are spaced so closely and the geologic character is so well defined that size, shape, depth and mineral content of reserves arewell-established. well established. |
| | |
Term | | Definition |
| Qualified petroleum reserves and resources evaluator | | A qualified petroleum reserves and resources evaluator, as defined in Chapter 19 of the ASX Listing Rules. |
| |
Reserve life | | Current stated ore reservesOre Reserves estimate divided by the current approved nominated production rate as at the end of the financial year. |
| |
ROM | | Run of mine product (ROM) | | Product mined in the course of regular mining activities. |
| |
Rutile
| | An ore of titanium composed of titanium and oxygen (TiO2). |
| |
SACNASP | | South African Council for Natural Scientific Professions. |
| |
SAIMM | | The Southern African Institute of Mining and Metallurgy. |
| |
SME reg’d member
| | Registered member of the Society of Mining, Metallurgy and Exploration. |
| |
Solvent extraction | | A method of separating one or more metals from a leach solution by treating with a solvent that will extract the required metal, leaving the others. The metal is recovered from the solvent by further treatment. |
| |
Spud | | Commence drilling of an oil or gas well. |
| |
SP (Stockpile) | | An accumulation of ore or mineral built up when demand slackens or when the treatment plant or beneficiation equipment is incomplete or temporarily unable to process the mine output; any heap of material formed to create a buffer for loading or other purposes or material dug and piled for future use. |
| |
SpudSupergene Sulphide | | Commence drillingSupergene is a term used to describe near-surface processes and their products, formed at low temperature and pressure by the activity of an oil or gas well.descending water. Supergene sulphide is mainly formed of chalcocite and covellite and is amenable to heap leaching. |
| |
Tailings | | Those portions of washed or milled ore that are too poor to be treated further or remain after the required metals and minerals have been extracted. |
| |
Titanium slagTLP (Tension leg platform) | | Titanium slag is an upgraded white pigment that comes from ilmeniteA vertically moored floating facility for production of oil and is used in the manufacture of paint, paper and plastics. Titanium slag contains a high percentage of titanium dioxide, which is used largely to produce TiO2 pigment.gas. |
| |
TLP (Tension leg platform) | | A tension leg platform or extended tension leg platform (ETLP) is a vertically moored floating structure normally used for the offshore production of oil or gas, and is particularly suited for water depths greater than 300 metres (about 1000 ft) and less than 1500 metres (about 4900 ft). |
| | |
Term
| | Definition
|
| |
| Total Coal Reserves | | Run of mine reservesCoal Reserves as outputs from the mining activities. |
| |
Total Ore Reserves | | Proven Ore Reserves plus Probable Ore Reserves. |
| |
ZirconUnconventional Petroleum Resources | | Hydrocarbon accumulations which are generally pervasive in nature and may be continuous throughout a large area requiring specialised(1) extraction technologies to produce or recover. Examples include, but are not limited to coalbed methane, basin-centred gas, shale gas, gas hydrates, natural bitumen (tar sands), and oil shale deposits. |
| |
| | |
| |
Yield | | The chief orepercentage of zirconium composedmaterial of zirconium, silicon and oxygen (ZrSiO4).interest that is extracted during mining and/or processing. |
| |
| | |
| (1) | Examples of specialised technologies include: dewatering of coalbed methane, massive fracturing programs for shale gas, steam and/or solvents to mobilise bitumen for in-situ recovery, and, in some cases, mining activities. |
10.2 Finance, marketing8.2 Non-mining, oil and generalgas terms
| | |
Term | | Definition |
1SAP | | 1SAP is a business-led initiative to achieve Company-wide alignment of our business critical data and processes, supported by one integrated system (SAP). This single system provides us access to common data and streamlines common processes. |
| |
A$ | | Australian dollars being the currency of the Commonwealth of Australia. |
| |
API (All Publishers Index)
| | Thermal coal price index as published by Argus Media and IHS McCloskey for: Northwestern Europe – CIF Amsterdam –Rotterdam – Antwerp (API 2); South Africa – FOB Richards Bay (API 4); Australia – FOB Newcastle (API 6). |
| |
ADR (American Depositary Receipt) | | Instruments that trade on the NYSE. |
| |
ADS (American Depositary Share) | | An American Depositary Share is aA share issued under a deposit agreement that has been created to permit US-resident investors to hold shares in non-US companies and trade them on the stock exchanges in the US.United States. One ADS is equal to two BHP Billiton Limited orshares. Similarly one ADS is equal to two BHP Billiton Plc ordinary shares. ADSs are evidenced by American Depositary Receipts, or ADRs, which are the instruments that trade on the NYSE. |
| |
| ASIC (Australian Securities and Investments Commission) | | The Australian Government agency that enforces laws relating to companies, securities, financial services and credit in order to protect consumers, investors and creditors. |
| |
ASX (Australian Securities Exchange) | | ASX is a multi-asset class vertically integrated exchange group that functions as a market operator, clearing house and payments system facilitator. It oversees compliance with its operating rules, promotes standards of corporate governance among Australia’s listed companies and helps educate retail investors. |
| |
Australian Tax Treaty | | Tax ConventionA tax convention between Australia and the United States as to the Avoidanceavoidance of Double Taxation.double taxation. |
| |
BHP Billiton | | Being both companies in the dual listed companyDual Listed Company structure, BHP Billiton Limited and BHP Billiton Plc. |
| |
BHP Billiton Limited share | | A fully paid ordinary share in the capital of BHP Billiton Limited. |
| |
BHP Billiton Limited shareholders | | The holders of BHP Billiton Limited shares. |
| |
BHP Billiton Limited Special Voting Share | | A single voting share issued to facilitate joint voting by shareholders of BHP Billiton Limited on Joint Electorate Actions. |
| |
BHP Billiton Plc equalisation share
| | A share that has been authorised to be issued to enable a distribution to be made by BHP Billiton Plc Group to the BHP Billiton Limited Group should this be required under the terms of the DLC merger. |
| |
BHP Billiton Plc 5.5 per cent preference share | | Shares that have the right to repayment of the amount paid up on the nominal value and any unpaid dividends in priority of any other class of shares in BHP Billiton Plc on a return of capital or winding up. |
| | |
Term
| | Definition
|
| |
BHP Billiton Plc share | | A fully paid ordinary share in the capital of BHP Billiton Plc. |
| |
BHP Billiton Plc shareholders | | The holders of BHP Billiton Plc shares. |
| |
BHP Billiton Plc Special Voting Share | | A single voting share issued to facilitate joint voting by shareholders of BHP Billiton Plc on Joint Electorate Actions. |
| |
Board | | The Board of Directors of BHP Billiton. |
| |
Business | | Refers to one of BHP Billiton’s Petroleum and Potash; Copper; Iron Ore; Coal; Aluminium, Manganese and Nickel Business groupsGroups formed in May 2013. Collectively, they are referred to as the Businesses. |
| |
CEO | | Chief Executive Officer. |
| | |
Term | | Definition |
CFR (Cost and freightfreight... named port of destination) | | The seller must pay the costs and freight necessary to bring the goods to the named port of destination, but the risk of loss of, or damage to the goods, as well as any additional costs due to events occurring after the time the goods have been delivered on board the vessel, is transferred from the seller to the buyer when the goods pass the ship’s rail in the port of shipment. The CFR term requires the seller to clear the goods for shipment. |
| |
CIP (Co-Investment Plan)
| | Legacy employee share scheme. |
| |
Community investment | | Contributions made to support communities in which we operate or have an interest. Our contributions to community programs comprise cash, in-kind support and administration costs. Our targeted level of contribution is one per cent of pre-tax profit calculated on the average of the previous three years’ pre-tax profit.profit as reported. |
| |
Continuing operations | | Assets/operations/entities that were owned and/or operated by BHP Billiton during FY2015 and were not included in the demerger of South32. |
| |
CSG (Customer Sector Group) | | Prior to 10 May 2013, referred to as a BHP Billiton product-based global business unit. |
| |
CY20XX | | Refers to the calendar year ending 31 December 20XX, where XX is the two-digit number of the year. |
| |
Deferred shareDiscontinued operations
| | A nil-priced option Assets/operations/entities that were owned and/or operated by BHP Billiton during FY2015 and demerged into a conditional right to acquire a share issued under the rules of the GIS.new company (South32) on 25 May 2015. |
| |
Dividend Record Date | | The date, determined by a company’s board of directors, by when an investor must be recorded as an owner of shares in order to qualify for a forthcoming dividend. |
| |
DLC | | Dual Listed Company. |
| |
DLC merger | | The Dual Listed Company merger between BHP Billiton Limited and BHP Billiton Plc on 29 June 2001. |
| |
DLC structure | | The corporate structure resulting from the DLC merger. |
| |
EBIT | | Earnings before interestnet finance costs and taxes. |
| |
ESOP (Employee Share Ownership Plan)
| | A legacy employee share plan that commenced under the jurisdiction of BHP Limited prior to the formation of BHP Billiton. |
| | |
Term
| | Definition
|
Expected value
| | Expected value of a share incentive – the average outcome weighted by probability. This measure takes into account the difficulty of achieving performance conditions and the correlation between these and share price appreciation. The valuation methodology also takes into account factors such as volatility and forfeiture risk.taxation. |
| |
| EITI (Extractive Industries Transparency Initiative) | | An international initiative dedicated to the enhancement of transparency around the payments of taxes and royalties derived from resource development. |
| |
Equalisation Share | | A share that has been authorised to be issued to enable a distribution to be made by the BHP Billiton Plc Group to the BHP Billiton Limited Group or by the BHP Billiton Limited Group to the BHP Billiton Plc Group (as applicable) should this be required under the terms of the DLC merger. |
| |
| FOB (Free on board ... named port of shipment) | | The seller delivers when the goods pass the ship’s rail at the named port of shipment. This means that the buyer has to bear all costs and risks of loss of, or damage to the goods from that point. The FOB term requires the seller to clear the goods for export. This term can be used only for sea or inland waterway transport. |
| | |
Term | | Definition |
FPIC (Free prior informed consent) | | A principle requiring that individuals and communities should be informed – in appropriate, accessible language -– about projects that might take place on their land. It also guarantees that they are given the opportunity to give or withhold their consent to a project before it commences. |
| |
FY20XX | | Refers to the financial year ending 30 June 20XX, where XX is the two-digit number for the year. |
| |
GAAP | | Generally accepted accounting principles. |
| |
Gearing | | Gearing is defined as theThe ratio of net debt to net debt plus net assets. |
| |
GHG (Greenhouse gas) | | For BHP Billiton reporting purposes, these are the aggregate anthropogenic carbon dioxide equivalent emissions of carbon dioxide (CO2), methane (CH4), nitrous oxide (N2O), hydrofluorocarbons (HFCs), perfluorocarbons (PFCs) and sulphur hexafluoride (SF6). |
| |
Group | | BHP Billiton Limited, BHP Billiton Plc and their subsidiaries. |
| |
Group Function | | Group Functions act as agents of the Group Management Committee (GMC). They operate under a defined set of mandates that relate to: |
| |
| | •
the governance of BHP Billiton; |
| |
| | •
the CEO limits established by the BHP Billiton Board; |
| |
| | •
the activities necessary to improve the effectiveness of the Group. |
| |
GIS (Group Incentive Scheme)
| | A short-term incentive plan under which annual incentives are provided through a mix of cash and employee equity. The GIS is currently applicable only to members of the GMC. |
| |
GLD (Group Level Document) | | The documents that give effect to the mandatory requirements arising from the BHP Billiton Operating Model as approved by the GMC. They describe the mandatory minimum performance requirements and accountabilities for definitive business obligations, processes, functions and activities across BHP Billiton. |
| | |
Term
| | Definition
|
GMC (Group Management Committee) | | The executive management group within BHP Billiton as determined by the CEO. Its role is defined by the GMC Terms of Reference. |
| |
| IFRS (International Financial Reporting Standards) | | Accounting standards as issued by the International Accounting Standards Board. |
| |
Implementation Deed | | The Implementation Deed entered into on 17 March 2015 between BHP Billiton Ltd, BHP Billiton Plc and South32 Limited. |
| |
JSE | | Johannesburg Stock Exchange. |
| |
JV | | Joint venture. |
| |
KMP (Key Management Personnel) | | Persons having authority and responsibility for planning, directing and controlling the activities of the Group, directly or indirectly (including Executive Directors), and Non-executive Directors. For BHP Billiton it includes the GMC. |
| |
KPI (Key Performance Indicator) | | Used to measure the performance of the Group, individual businesses and executives in any one year. |
| |
LME | | London Metal Exchange. |
| | |
Term | | Definition |
LSE | | London Stock Exchange. |
| |
LTIP (Long-Term Incentive Plan)
| | A long-term incentive plan under which awards are provided in the form of employee equity, with a relative TSR performance hurdle that must be met over a five-year period before the awards vest. The LTIP is currently applicable only to members of the GMC. |
| |
Major capital projects | | Projects where the investment commitment exceeds the Group approval threshold, or complexity or associated reputational risk or exposure necessitates review at a Group level (and within the Group investment process). |
| |
Market value
| | The market value based on closing prices or, in instances when an executive exercises and sells shares, the actual sale price achieved. |
| |
Marketing | | Refers to the BHP Billiton staff, processes and activities that provide marketing services to the whole organisation. |
| |
NYMEX (New York Mercantile Exchange) | | A New York physical futures exchange whichthat trades energy commodities (i.e. crude oil and natural gas) and precious metals in futures and options markets. |
| |
NYSE | | New York Stock ExchangeExchange. |
| |
Occupational illness | | An illness that occurs as a consequence of work-related activities or exposure. It includes acute or chronic illnesses or diseases, which may be caused by inhalation, absorption, ingestion or direct contact. |
| |
OEL (Occupational exposure limit) | | The concentration of a substance or agent, exposure to which, according to current knowledge, should not cause adverse health effects nor cause undue discomfort to nearly all workers. |
| |
Occupational illness | | An occupational illness is an illness that occurs as a consequence of work-related activities or exposure. It includes acute or chronic illnesses or diseases, which may be caused by inhalation, absorption, ingestion or direct contact. |
| |
Option | | A right to acquire a share on payment of an exercise price issued under the rules of the GIS. |
| |
OSHA | | United States Government Occupational Safety and Health Administration. |
| | |
TermPlatts
| | Definition
|
Performance share | | A nil-priced option orPlatts is a conditional right to acquireglobal provider of energy, petrochemicals, metals and agriculture information, and a share, subject to a Performance Hurdle, issued under the rulespremier source of the LTIP.benchmark price assessments for those commodity markets. |
| |
Project investment | | Total budgeted capital expenditure on growth projects under development at year-end. Refer to section 3.7.2 Major projects,2.4 of this Annual Report, for a full listing of these growth projects. |
| |
PSP (Performance share plan) | | An employee share plan that commenced under the jurisdiction of BHP Limited or Billiton Plc and prior to the formation of BHP Billiton. Legacy share scheme. |
| |
Quality-of-life indicators | | Measures of people’s overall wellbeing, including material well-being (standard of living) and non-material components such as the quality of the environment, national security, personal safety, and political and economic freedoms. |
| |
Quoted | | In the context of American Depositary Shares (ADS) and listed investments, the term ‘quoted’ means ‘traded’ on the relevant exchange. |
| |
REi (Resource Endowment initiative) | | An initiative of the International Council on Mining and Metals to enhance industry’s socio-economic contribution to the countries and communities where organisations such as BHP Billiton operate, by better understanding the factors that either inhibit or promote social and economic development linked to large-scale mining projects. |
| |
ROCE (Return on capital employed) | | Return on capital employed is calculatedCalculated as earnings from operations, excluding exceptional items and net finance costs (after tax), divided by average capital employed. Average capital employed is calculated as net assets less net debt. |
| |
RSS (Restricted Share Scheme) | | Legacy employee share scheme. |
| |
| SEC (United States Securities and Exchange Commission) | | United States regulatory commission that aims to protect investors, maintain fair, orderly and efficient markets and facilitate capital formation. |
| | |
Term | | Definition |
Senior manager | | An employee who has responsibility for planning, directing or controlling the activities of the entity or a strategically significant part of it. In the Strategic Report, senior manager includes senior leaders and any persons who are directors of any subsidiary company even if they are not senior leaders. |
| |
Shareplus | | All employeeAll-employee share purchase plan. |
| |
Significant environmental incidentShareholder Circular | | A significant environmental incident is one with a severity ratingThe Shareholder Circular dated 16 March 2015 relating to the demerger of four or above based on our internal severity rating scale (tieredSouth32 Limited from one to seven by increasing severity).BHP Billiton. |
| |
STRATESouth32 | | Share Transactions Totally Electronic is a South African electronic settlement and depository system for dematerialised equities.South32 Limited. |
| |
South32 share | | A fully paid ordinary share in the capital of South 32 Limited. |
| |
Strate | | South Africa’s Central Securities Depositary for the electronic settlement of financial instruments. |
| |
TRIF (Total recordable injury frequency) | | The sum of (fatalities + lost-time cases + restricted work cases + medical treatment cases) x 1,000,000 ÷ actual hours worked. Stated in units of per million hours worked. We adoptBHP Billiton adopts the United StatesUS Government Occupational Safety and Health Administration guidelines for the recording and reporting of occupational injury and illnesses. Excludes non-operated assets. |
| |
TSR (Total shareholder return) | | TSR measures the return delivered to shareholders over a certain period through the change in share price and any dividends paid. It is the measure used to compare BHP Billiton’s performance to that of other relevant companies under the LTIP. |
| | |
Term
| | Definition
|
| UKLA (United Kingdom Listing Authority) | | Term used when the UK Financial ServicesConduct Authority (FSA)(FCA) acts as the competent authority under Part VI of the UK Financial Services and Markets Act (FSMA). |
| |
Underlying EBIT | | Underlying EBIT isCalculated as earnings before net finance costs, taxation, Discontinued operations and any exceptional items. Underlying EBIT is not an IFRS measure of profitability, financial performance, or liquidity and may be defined and used in differing ways by different entities. Underlying EBIT is included in the FY2013 Consolidated Financial Statements as required by IFRS 8 ‘Operating Segments’. We believe that Underlying EBIT provides useful information, but should not be considered as an indication of, or alternative to, Attributable profit as an indicator of operating performance. |
| |
Underlying EBIT margin | | Calculated as Underlying EBIT excluding third party EBIT,product profit from operations, divided by revenue net of third party product revenue. |
| |
US$ | | The Group’s reporting currency and the functional currency of the majority of its operations is the US dollar, as this is assessed to be the principal currency of the economic environments in which they operate. |
| |
WTI (West Texas Intermediate) | | A mixture of hydrocarbons that exists in liquid phase in natural underground reservoirs and remains liquid at atmospheric pressure after passing through surface separating facilities. |
| |
| | Crude oil is refined to produce a wide array of petroleum products, including heating oils; gasoline, diesel and jet fuels; lubricants; asphalt; ethane, propane, and butane; and many other products used for their energy or chemical content. |
| |
| | West Texas Intermediate refers to a crude stream produced in Texas and southern Oklahoma whichthat serves as a reference or “marker”‘marker’ for pricing a number of other crude streams and which is traded in the domestic spot market at Cushing, Oklahoma. |
10.38.3 Terms used in reserves
| | |
Term | | Definition |
A.Al2O3
| | available alumina |
Ag | | silver |
Al2O3
| | alumina |
Anth
| | anthracite |
Au | | gold |
cpt
| | carats per tonne |
Cu | | copper |
CV | | calorific value |
Fe | | iron |
Fe2O3 | | iron oxide |
insolInsol
| | insolubles |
K2OLOI
| | potassium oxideloss on ignition |
Met | | metallurgical coal |
MgO
| | magnesium oxide |
Mn
| | manganese |
Mo | | molybdenum |
Ni | | nickel |
P | | phosphorous |
Pb | | lead |
Pc | | phosphorous in concentrate |
R.SiO2PPCc
| | reactive silicaLOI in concentrate |
S | | sulphur |
SCu | | soluble copper |
SiO2 | | silica |
TCu | | total copper |
Th | | thermal coal |
TiO2
| | titanium oxide |
U3O8 | | uranium oxide |
VM | | volatile matter |
Zn | | zinc |
10.48.4 Units of measure
| | |
Abbreviation | | Description |
% | | percentage or per cent |
bbl/d | | barrels per day |
boe | | barrels of oil equivalent – 6,000 scf of natural gas equals 1 boe |
dmt | | dry metric tonne |
dmtu | | dry metric tonne unit |
g/t | | grams per tonne |
ha | | hectare |
kcal/kg | | kilocalories per kilogram |
kdwt
| | thousand deadweight tonnes |
kg/tonne or kg/t | | kilograms per tonne |
km | | kilometre |
koz | | kilo-ounce |
kV | | kilovolt |
kt | | kilotonnekilotonnes |
ktpa | | kilotonnes per annum |
kVktpd
| | kilovoltkilotonnes per day |
kdwt | | thousand deadweight tonnes |
m | | metre |
Mbbl/d
| | thousand barrels per day |
ML | | megalitre |
mm | | millimetre |
MMbbl/d
| | million barrels per day |
MMboe | | million barrels of oil equivalent |
MMBtu | | million British thermal units – 1 scf of natural gas equals 1,010 Btu |
MMcf/d | | million cubic feet per day |
Mbbl/d | | thousand barrels per day |
MMbbl/d | | million barrels per day |
MMcm/d | | million cubic metres per day |
Mscf | | thousand standard cubic feet |
Mt | | million tonnes |
Mtpa | | million tonnes per annum |
MW | | megawatt |
psi | | pounds per square inch |
ppm | | parts per million |
scf | | standard cubic feet |
t | | tonne |
TJ | | terajoule |
TJ/d | | terajoules per day |
tpa | | tonnes per annum |
tpd | | tonnes per day |
tph | | tonnes per hour |
wmt | | wet metric tonnes |
119 Shareholder information
11.19.1 History and development
BHP Billiton Limited (formerly BHP Limited and, before that, The Broken Hill Proprietary Company Limited) was incorporated in 1885 and is registered in Australia with ABN 49 004 028 077. BHP Billiton Plc (formerly Billiton Plc) was incorporated in 1996 and is registered in England and Wales with registration number 3196209. Successive predecessor entities to BHP Billiton Plc have operated since 1860.
Since 29 June 2001, we have operated under a Dual Listed Company (DLC) structure. Under the DLC structure, the two parent companies, BHP Billiton Limited and BHP Billiton Plc, operate as a single economic entity, run by a unified Board and management team. More details of the DLC structure can be found in section 9.3.2 of this Annual Report.
BHP Billiton Limited and BHP Billiton Plc have each retained their separate corporate identities and maintained their separate stock exchange listings, but they are operated and managed as a single unified economic entity, with their boards and senior executive management comprising the same people.
9.2 Markets
As at the date of this Annual Report, BHP Billiton Limited has a primary listing on the Australian Securities Exchange (ASX) in Australia and BHP Billiton Plc has a premium listing on the UK Listing Authority’s Official List and its ordinary shares are admitted to trading on the London Stock Exchange (LSE). BHP Billiton Plc also has a secondary listing on the Johannesburg Stock Exchange (JSE) in South Africa.
In addition, BHP Billiton Limited and BHP Billiton Plc are listed on the New York Stock Exchange (NYSE) in the United States. Trading on the NYSE is via American Depositary Shares (ADSs), each representing two ordinary shares which are evidenced by American Depositary Receipts (ADRs). Citibank N.A. (Citibank) is the Depositary for both ADRADS programs. BHP Billiton Limited’s ADSs have been listed for trading on the NYSE (ticker BHP) since 28 May 1987 and BHP Billiton Plc’s since 25 June 2003 (ticker BBL).
11.29.3 Organisational structure
9.3.1 General
The BHP Billiton Group consists of the BHP Billiton Limited Group and the BHP Billiton Plc Group, operating as a combined enterprise, following the completion of the DLC merger in June 2001. Refer to note 30 ‘Subsidiaries’ to the Financial Statements for a full list of BHP Billiton Limited and BHP Billiton Plc subsidiaries.
The BHP Billiton DLC merger was designed to place shareholders of both companies in a position where they effectively have an interest in a single group that combines the assets, and is subject to the liabilities, of both companies.
9.3.2 DLC structure
The principles of the BHP Billiton DLC are reflected in the DLC Structure Sharing Agreement and include the following:
the two companies are to operate as if they are a single unified economic entity, through Boards of Directors that comprise the same individuals and a unified senior executive management team;
the Directors of both companies will, in addition to their duties to the company concerned, have regard to the interests of BHP Billiton Limited shareholders and BHP Billiton Plc shareholders as if the two
| companies were a single unified economic entity and, for that purpose, the Directors of each company take into account in the exercise of their powers the interests of the shareholders of the other; |
certain DLC equalisation principles must be observed. These are designed to ensure that for so long as the Equalisation Ratio between a BHP Billiton Limited share and a BHP Billiton Plc share is 1:1, the economic and voting interests in the combined BHP Billiton Group resulting from the holding of one BHP Billiton Limited share are equivalent to that resulting from the holding of one BHP Billiton Plc share. Further details are set out in the sub-section ‘Equalisation of economic and voting rights’ below.
Additional documents that affect the DLC include:
BHP Billiton Limited Constitution
BHP Billiton Plc Articles of Association
BHP Billiton Special Voting Shares Deed
BHP Billiton Limited Deed Poll Guarantee
BHP Billiton Plc Deed Poll Guarantee.
Australian Foreign Investment Review Board (FIRB) conditions
The Treasurer of Australia approved the DLC merger subject to certain conditions, the effect of which was to require that, among other things, BHP Billiton Limited continues to:
be an Australian company, which is headquartered in Australia;
ultimately manage and control the companies conducting the business that was conducted by its subsidiaries at the time of the merger for as long as those businesses form part of the BHP Billiton Group.
The conditions also require the global headquarters of the BHP Billiton Group to be in Australia.
The conditions have effect indefinitely, subject to amendment of the Australian Foreign Acquisitions and Takeovers Act 1975 or any revocation or amendment by the Treasurer of Australia. If BHP Billiton Limited no longer wishes to comply with these conditions, it must obtain the prior approval of the Treasurer. Failure to comply with the conditions attracts substantial penalties under the Foreign Acquisitions and Takeovers Act 1975.
Equalisation of economic and voting rights
BHP Billiton Limited shareholders and BHP Billiton Plc shareholders have economic and voting interests in the combined BHP Billiton Group. The economic and voting interests represented by a share in one company relative to the economic and voting interests of a share in the other company are determined by reference to a ratio known as the Equalisation Ratio. Presently, the economic and voting interests attached to each BHP Billiton Limited share and each BHP Billiton Plc share are the same, since the Equalisation Ratio is 1:1. The Equalisation Ratio would change if either BHP Billiton Limited or BHP Billiton Plc returned value to only its respective shareholders and no matching action was taken.
This means that the amount of any cash dividend paid by BHP Billiton Limited in respect of each BHP Billiton Limited share is normally matched by an equivalent cash dividend by BHP Billiton Plc in respect of each BHP Billiton Plc share, and vice versa. If one company has insufficient profits or is otherwise unable to pay the agreed dividend, BHP Billiton Limited and BHP Billiton Plc will, as far as practicable, enter into such transactions as are necessary to enable both companies to pay the agreed amount of pre-tax dividends per share.
Joint Electorate Actions
Under the terms of the DLC agreements, the BHP Billiton Limited Constitution and the BHP Billiton Plc Articles of Association have implemented special voting arrangements so that the shareholders of both companies vote together as a single decision-making body on matters affecting the shareholders of each company in similar ways (such matters are referred to as Joint Electorate Actions). For so long as the Equalisation Ratio remains 1:1, each BHP Billiton Limited share will effectively have the same voting rights as each BHP Billiton Plc share on Joint Electorate Actions.
A Joint Electorate Action requires approval by ordinary resolution (or special resolution if required by statute, regulation, applicable listing rules or other applicable requirements) of BHP Billiton Limited and also of BHP Billiton Plc. Both the BHP Billiton Limited ordinary shareholders and the holder of the BHP Billiton Limited Special Voting Share vote as a single class and, in the case of BHP Billiton Plc, the BHP Billiton Plc ordinary shareholders and the holder of the BHP Billiton Plc Special Voting Share vote as a single class.
Class Rights Actions
In the case of certain actions in relation to which the two bodies of shareholders may have divergent interests (referred to as Class Rights Actions), the company wishing to carry out the Class Rights Action requires the prior approval of the shareholders in the other company voting separately and, where appropriate, the approval of its own shareholders voting separately. Depending on the type of Class Rights Action undertaken, the approval required is either an ordinary or special resolution of the relevant company.
These voting arrangements are secured through the constitutional documents of the two companies, the DLC Structure Sharing Agreement, the BHP Billiton Special Voting Shares Deed and rights attaching to a specially created Special Voting Share issued by each company and held in each case by a Special Voting Company. The shares in the Special Voting Companies are held legally and beneficially by Law Debenture Trust Corporation Plc.
Cross guarantees
BHP Billiton Limited and BHP Billiton Plc have each executed a Deed Poll Guarantee, pursuant to which creditors entitled to the benefit of the BHP Billiton Limited Deed Poll Guarantee and the BHP Billiton Plc Deed Poll Guarantee will, to the extent possible, be placed in the same position as if the relevant debts were owed by both BHP Billiton Limited and BHP Billiton Plc on a combined basis.
Restrictions on takeovers of one company only
The BHP Billiton Limited Constitution and the BHP Billiton Plc Articles of Association have been drafted to ensure that, except with the consent of the Board, a person cannot gain control of one company without having made an equivalent offer to the shareholders of both companies on equivalent terms. Sanctions for breach of these provisions would include withholding of dividends, voting restrictions and the compulsory divestment of shares to the extent a shareholder and its associates exceed the relevant threshold.
9.4 Material contracts
DLC agreements
On 29 June 2001, BHP Billiton Limited (then known as BHP Limited) and BHP Billiton Plc (then known as Billiton Plc) merged by way of a DLC structure. To effect the DLC, BHP Limited and Billiton Plc (as they were then known) entered into the following agreements designed to place the shareholders of both companies in a
position where they effectively have an interest in a single group that combines the assets, and is subject to all the liabilities, of both companies:
BHP Billiton DLC Structure Sharing Agreement
BHP Billiton Special Voting Shares Deed
BHP Billiton Limited Deed Poll Guarantee
BHP Billiton Plc Deed Poll Guarantee.
The effect of each of these agreements and the manner in which they operate are described in section 9.3 of this Annual Report.
Demerger Implementation Deed
BHP Billiton Limited, BHP Billiton Plc and South32 Limited entered into an Implementation Deed on 17 March 2015 to facilitate the demerger of South32 Limited from the BHP Billiton Group.
The Implementation Deed sets out:
the conditions to the demerger; and
certain steps required to be taken by each of BHP Billiton Limited, BHP Billiton Plc and South32 Limited to implement the demerger.
Implementation of the demerger was completed on 25 May 2015 and resulted in the formation of an independent listed company, South32 Limited, with a portfolio of assets producing alumina, aluminium, coal, manganese, nickel, silver, lead and zinc.
In accordance with the Implementation Deed, the demerger was effected through a distribution of South32 shares to eligible shareholders of BHP Billiton Limited and BHP Billiton Plc by way of an in-specie dividend by each of BHP Billiton Limited and BHP Billiton Plc. Each eligible shareholder of BHP Billiton Limited and BHP Billiton Plc received one South32 share for each share in BHP Billiton Limited or BHP Billiton Plc (as applicable) that it held as at the applicable record date for the demerger.
9.5 Constitution
The following text summarises the Constitution of BHP Billiton Limited and the Articles of Association of BHP Billiton Plc. The effect of the Constitution of BHP Billiton Limited and the Articles of Association of BHP Billiton Plc is, so far as possible, identical. Where the term ‘BHP Billiton’ is used in this description of the Constitution and Articles of Association, it can be read to mean either BHP Billiton Limited or BHP Billiton Plc.
Provisions of the Constitution of BHP Billiton Limited and the Articles of Association of BHP Billiton Plc can be amended only where such amendment is approved by special resolution either:
by approval as a Class Rights Action, where the amendment results in a change to an ‘Entrenched Provision’; or
otherwise, as a Joint Electorate Action.
A description of Joint Electorate Actions and Class Rights Actions is contained under the heading ‘Equalisation of economic and voting rights’ in section 9.3.2 of this Annual Report.
9.5.1 Directors
The management and control of the business and affairs of BHP Billiton are vested in the Board of Directors, which may exercise all powers of BHP Billiton, other than those which are required to be exercised or done by BHP Billiton in a general meeting.
9.5.2 Power to issue securities
BHP Billiton may, pursuant to the Constitution and Articles of Association, issue any shares or other securities (including redeemable shares) with preferred, deferred or other special rights, obligations or restrictions as and when the Board may determine and on any other terms the Board considers appropriate, provided that:
any such issue does not affect any special rights conferred on the holders of any shares;
any such issue is subject to the provisions regarding shareholder approval in the Constitution and Articles of Association;
the rights attaching to a class other than ordinary shares are expressed at the date of issue.
9.5.3 Restrictions on voting by Directors
A Director may not vote in respect of any contract or arrangement or any other proposal in which he or she has a material personal interest. A Director shall not be counted in the quorum at a meeting in relation to any resolution on which he or she is not entitled to vote.
In addition, under the UK Companies Act 2006, a Director has a duty to avoid a situation in which he or she has (or can have) a direct or indirect interest that conflicts (or may conflict) with the interests of the company. The duty is not infringed, if among other things, the situation is authorised by non-interested Directors. The Articles of Association of BHP Billiton Plc enable the Board to authorise a matter that might otherwise involve a Director breaching his or her duty to avoid conflicts of interest. An interested Director may not vote or be counted towards a quorum for a resolution authorising such a situation. Where the Board gives such authorisation, the Board may prohibit, or may establish regulations which prohibit, the relevant Director from voting on any matter relating to the conflict. The Board has adopted procedures to manage these voting restrictions.
Subject to applicable laws, a Director is entitled to vote, and be counted in the quorum, in respect of any resolution concerning any of the following matters, namely where the material personal interest:
arises because the Director is a shareholder of BHP Billiton and is held in common with the other shareholders of BHP Billiton;
arises in relation to the Director’s remuneration as a Director of BHP Billiton;
relates to a contract BHP Billiton is proposing to enter into that is subject to approval by the shareholders and will not impose any obligation on BHP Billiton if it is not approved by the shareholders;
arises merely because the Director is a guarantor or has given an indemnity or security for all or part of a loan, or proposed loan, to BHP Billiton;
arises merely because the Director has a right of subrogation in relation to a guarantee or indemnity referred to above;
relates to a contract that insures, or would insure, the Director against liabilities the Director incurs as an officer of BHP Billiton, but only if the contract does not make BHP Billiton or a related body corporate the insurer;
relates to any payment by BHP Billiton or a related body corporate in respect of an indemnity permitted by law, or any contract relating to such an indemnity; or
is in a contract, or proposed contract with, or for the benefit of, or on behalf of, a related body corporate and arises merely because the Director is a director of a related body corporate.
9.5.4 Loans by Directors
Any Director may lend money to BHP Billiton at interest with or without security or may, for a commission or profit, guarantee the repayment of any money borrowed by BHP Billiton and underwrite or guarantee the
subscription of shares or securities of BHP Billiton or of any corporation in which BHP Billiton may be interested without being disqualified as a Director and without being liable to account to BHP Billiton for any commission or profit.
9.5.5 Appointment and retirement of Directors
Appointment of Directors
The Constitution and Articles of Association provide that a person may be appointed as a Director of BHP Billiton by the existing Directors of BHP Billiton or elected by the shareholders in a general meeting.
Any person appointed as a Director of BHP Billiton by the existing Directors will hold office only until the next general meeting at which the Board proposes, or the Constitution or Articles require that, an election of Directors be held.
A person may be nominated by shareholders as a Director of BHP Billiton if:
a shareholder of BHP Billiton Limited or BHP Billiton Plc provides a valid notice of the nomination; and
the person nominated by the shareholder consents to his or her nomination as Director,
in each case, at least 40 business days before the earlier of the date of the general meeting of BHP Billiton Plc and the corresponding general meeting of BHP Billiton Limited. The person nominated as a Director may be elected to the Board by ordinary resolution passed in a general meeting.
Under the Articles of Association if a person is validly nominated for election as a Director at a general meeting of BHP Billiton Limited, the Directors of BHP Billiton must nominate that person as a Director at the corresponding general meeting of BHP Billiton Plc. An equivalent requirement is included in the Constitution which requires any person validly nominated for election as a Director of BHP Billiton Plc to be nominated as a Director of BHP Billiton Limited.
Retirement of Directors
In 2011, the Board adopted a policy consistent with the UK Corporate Governance Code, under which all Directors must, if they wish to remain on the Board, seek re-election by shareholders annually. This policy took effect at the 2011 Annual General Meetings (AGMs), and replaced the previous system, as set out in the Constitution and Articles of Association, under which Directors were required to submit themselves to shareholders for re-election at least every three years.
A Director may be removed by BHP Billiton in accordance with applicable law and must vacate his or her office as a Director in certain circumstances as set out in the Constitution and Articles of Association. There is no requirement for a Director to retire on reaching a certain age.
9.5.6 Rights attaching to shares
Dividend rights
Under English law, dividends on shares may only be paid out of profits available for distribution. Under Australian law, dividends on shares may only be paid out of net assets, provided that the payment is fair and reasonable to the company’s shareholders as a whole and the payment of the dividend does not materially prejudice the company’s ability to pay its creditors. The Constitution and Articles of Association provide that payment of any dividend may be made in any manner, by any means and in any currency determined by the Board.
All unclaimed dividends may be invested or otherwise used by the Board for the benefit of whichever of BHP Billiton Limited or BHP Billiton Plc determined that dividend, until claimed or, in the case of BHP Billiton Limited, otherwise disposed of according to law. In the case of BHP Billiton Plc, any dividend unclaimed after a period of 12 years from the date on which such dividend was determined or became due for payment shall be forfeited and shall revert to BHP Billiton Plc.
Voting rights
Voting at any general meeting of BHP Billiton Limited shareholders can, in the first instance, be conducted by a show of hands unless a poll is demanded by any of the following (except in relation to the election of a chairman of a meeting or, unless the Chairman otherwise determines, the adjournment of a meeting) or is otherwise required (as outlined below):
the Chairman;
any shareholder under the law; or
the holder of the BHP Billiton Limited Special Voting Share.
Voting at any general meeting of BHP Billiton Plc shareholders can, in the first instance, be conducted by a show of hands unless a poll is demanded by any of the following (except in relation to the election of a chairman of a meeting or, unless the Chairman otherwise determines, the adjournment of a meeting) or is otherwise required (as outlined below):
the Chairman;
not less than five members present in person or by proxy and entitled to vote;
a member or members present in person or by proxy and representing not less than five per cent of the total voting rights of all the members having the right to vote at the meeting; or
the holder of the BHP Billiton Plc Special Voting Share.
As described under the heading ‘Equalisation of economic and voting rights’ in section 9.3.2 of this Annual Report, certain matters may be decided as Joint Electorate Actions or Class Rights Actions. Matters considered by shareholders at an AGM of BHP Billiton Limited or BHP Billiton Plc constitute Joint Electorate Actions and shall therefore be decided on a poll. Therefore, in practice, generally all items of business at AGMs are decided by way of a poll.
In addition, at any general meeting a resolution, other than a procedural resolution, put to the vote of the meeting on which the holder of the relevant BHP Billiton Special Voting Share is entitled to vote shall be decided on a poll.
For the purposes of determining which shareholders are entitled to attend or vote at a meeting of BHP Billiton Plc or BHP Billiton Limited, and how many votes such shareholder may cast, the relevant company will specify in any notice of meeting a time, not more than 48 hours before the time fixed for the meeting, by which a shareholder must be entered on the Register of Shareholders in order to have the right to attend or vote at the relevant meeting.
Shareholders who wish to appoint a proxy to attend, vote or speak at a meeting of BHP Billiton Plc or BHP Billiton Limited (as appropriate) on their behalf must deposit the relevant form appointing a proxy in accordance with the instructions contained in any notice of meeting, so as to be received in the specified manner not less than 48 hours before the time appointed for holding the meeting to which the appointment of a proxy relates.
Rights to share in BHP Billiton Limited’s profits
The rights attached to the shares of BHP Billiton Limited, as regards the participation in the profits available for distribution, are as follows:
The holders of any preference shares shall be entitled, in priority to any payment of dividend to the holders of any other class of shares, to a preferred right to participate as regards dividends up to but not beyond a specified amount in distribution.
Subject to the special rights attaching to any preference shares, but in priority to any payment of dividends on all other classes of shares, the holder of the Equalisation Share (if any) shall be entitled to be paid such dividends as are declared or paid thereon.
Any surplus remaining after payment of the distributions above shall be payable to the holders of BHP Billiton Limited ordinary shares and the BHP Billiton Limited Special Voting Share in equal amounts per share.
Rights to share in BHP Billiton Plc’s profits
The rights attached to the shares of BHP Billiton Plc, in relation to the participation in the profits available for distribution, are as follows:
The holders of the cumulative preference shares shall be entitled, in priority to any payment of dividend to the holders of any other class of shares, to be paid a fixed cumulative preferential dividend (Preferential Dividend) at a rate of 5.5 per cent per annum, to be paid annually in arrears on 31 July in each year or, if any such date shall be a Saturday, Sunday or public holiday in England, on the first business day following such date in each year. Payments of Preferential Dividends shall be made to holders on the register at any date selected by the Directors up to 42 days prior to the relevant fixed dividend date.
Subject to the rights attaching to the cumulative preference shares, but in priority to any payment of dividends on all other classes of shares, the holder of the BHP Billiton Plc Special Voting Share shall be entitled to be paid a fixed dividend of US$0.01 per annum, payable annually in arrears on 31 July.
Subject to the rights attaching to the cumulative preference shares and the BHP Billiton Plc Special Voting Share, but in priority to any payment of dividends on all other classes of shares, the holder of the Equalisation Share shall be entitled to be paid such dividends as the Board may decide to pay thereon.
Any surplus remaining after payment of the distributions above shall be payable to the holders of the BHP Billiton Plc ordinary shares in equal amounts per BHP Billiton Plc ordinary share.
9.5.7 Rights on a return of assets on liquidation
On a return of assets on liquidation of BHP Billiton Limited, the assets of BHP Billiton Limited remaining available for distribution among shareholders, after giving effect to the payment of all prior ranking amounts owed to all creditors and holders of preference shares, and to all prior ranking statutory entitlements, shall be applied in paying to the holders of the BHP Billiton Limited Special Voting Share and the Equalisation Share (if any) an amount of up to A$2.00 on each such share, on an equal priority with any amount paid to the holders of BHP Billiton Limited ordinary shares, and any surplus remaining shall be applied in making payments solely to the holders of BHP Billiton Limited ordinary shares in accordance with their entitlements.
On a return of assets on liquidation of BHP Billiton Plc, subject to the payment of all prior ranking amounts owed to the creditors of BHP Billiton Plc and to all prior ranking statutory entitlements, the assets of BHP Billiton Plc to be distributed on a winding-up shall be distributed to the holders of shares in the following order of priority:
To the holders of the cumulative preference shares, the repayment of a sum equal to the nominal capital paid up or credited as paid up on the cumulative preference shares held by them and accrual, if any, of the
| Preferential Dividend, whether such dividend has been earned or declared or not, calculated up to the date of commencement of the winding-up. |
To the holders of the BHP Billiton Plc ordinary shares and to the holders of the BHP Billiton Plc Special Voting Share and the Equalisation Share, the payment out of surplus, if any, remaining after the distribution above of an equal amount for each BHP Billiton Plc ordinary share, the BHP Billiton Plc Special Voting Share and the Equalisation Share, if issued, subject to a maximum in the case of the BHP Billiton Plc Special Voting Share and the Equalisation Share of the nominal capital paid up on such shares.
9.5.8 Redemption of preferences shares
If BHP Billiton Limited at any time proposes to create and issue any preference shares, the preference shares may be issued on the terms that they are to be redeemed or, at the option of either or both BHP Billiton Limited and the holder, are liable to be redeemed, whether out of share capital, profits or otherwise.
The preference shares confer on the holders the right to convert the preference shares into ordinary shares if, and on the basis, the Board determines at the time of issue of the preference shares.
The preference shares are to confer on the holders:
the right (on redemption and on a winding-up) to payment in cash in priority to any other class of shares of (i) the amount paid or agreed to be considered as paid on each of the preference shares; (ii) the amount, if any, equal to the aggregate of any dividends accrued but unpaid and of any arrears of dividends; and
the right, in priority to any payment of dividend on any other class of shares, to the preferential dividend.
There is no equivalent provision in the Articles of Association of BHP Billiton Plc, although as noted above in section 9.5.2 of this Annual Report, BHP Billiton can issue preference shares which are subject to a right of redemption on terms the Board considers appropriate.
9.5.9 Capital calls
Subject to the terms on which any shares may have been issued, the Board may make calls on the shareholders in respect of all monies unpaid on their shares. BHP Billiton has a lien on every partly paid share for all amounts payable in respect of that share. Each shareholder is liable to pay the amount of each call in the manner, at the time and at the place specified by the Board (subject to receiving at least 14 days’ notice specifying the time and place for payment). A call is considered to have been made at the time when the resolution of the Board authorising the call was passed.
9.5.10 Borrowing powers
Subject to relevant law, the Directors may exercise all powers of BHP Billiton to borrow money, and to mortgage or charge its undertaking, property, assets (both present and future) and all uncalled capital or any part or parts thereof and to issue debentures and other securities, whether outright or as collateral security for any debt, liability or obligation of BHP Billiton or of any third party.
9.5.11 Changes to rights of shareholders
Rights attached to any class of shares issued by either BHP Billiton Limited or BHP Billiton Plc can only be varied (whether as a Joint Electorate Action or a Class Rights Action) where such variation is approved both:
by the Company that issued the relevant shares, as a special resolution; and
by the holders of the issued shares of the affected class, either by a special resolution passed at a separate meeting of the holders of the issued shares of the class affected, or with the written consent of members with at least 75 per cent of the votes of that class.
9.5.12 Conditions governing general meetings
All provisions relating to general meetings apply with any necessary modifications to any special meeting of any class of shareholders that may be held. Therefore, the following information relates equally to general meetings and any special meeting of any class of shareholders.
The Board may and shall on requisition in accordance with applicable laws call a general meeting of the shareholders at the time and place or places and in the manner determined by the Board. No shareholder may convene a general meeting of BHP Billiton except where entitled under law to do so. Any Director may convene a general meeting whenever the Director thinks fit. General meetings can also be cancelled, postponed or adjourned, where permitted by law or the Constitution or Articles of Association. Notice of a general meeting must be given to each shareholder entitled to vote at the meeting and such notice of meeting must be given in the form and manner in which the Board thinks fit. Five shareholders of the relevant company present in person or by proxy constitute a quorum for a meeting. A shareholder who is entitled to attend and cast a vote at a general meeting of BHP Billiton may appoint a person as a proxy to attend and vote for the shareholder in accordance with applicable law.
9.5.13 Limitations of rights to own securities
Neither the Constitution of BHP Billiton Limited nor the Articles of Association of BHP Billiton Plc impose any limitations on the rights to own securities other than restrictions that reflect the takeovers codes under relevant Australian and UK law. In addition, the Australian Foreign Acquisitions and Takeovers Act 1975 imposes a number of conditions that restrict foreign ownership of Australian-based companies.
Share control limits imposed by the Constitution and the Articles of Association, as well as relevant laws, are described in sections 9.11.2 and 9.3.2 of this Annual Report.
9.5.14 Documents on display
You can consult reports and other information about BHP Billiton Limited that it has filed pursuant to the rules of the Australian Securities Exchange (ASX) atwww.asx.com.au. You can consult reports and other information filed for publication by BHP Billiton Plc pursuant to the rules of the UK Listing Authority at the Authority’s document viewing facility (the National Storage Mechanism) atwww.morningstar.co.uk/uk/NSM. Information filed on the ASX, or pursuant to the rules of the UK Listing Authority is not incorporated by reference into this Annual Report. The documents referred to in this Annual Report as being available on our website,www.bhpbilliton.com, are not incorporated by reference and do not form part of this Annual Report.
BHP Billiton Limited and BHP Billiton Plc both file annual and special reports and other information with the US Securities and Exchange Commission (SEC). These filings are available on the SEC website atwww.sec.gov. You may also read and copy any document that either BHP Billiton Limited or BHP Billiton Plc files at the SEC’s public reference room located at 100 F Street, NE, Washington, DC 20549. Please call the SECat 1-800-SEC-0330 or access the SEC website atwww.sec.gov for further information on the public reference room.
9.6 Share ownership
Share capital
The details of the share capital for both BHP Billiton Limited and BHP Billiton Plc are presented in note 1917 ‘Share capital’ into the financial statements.Financial Statements of this Annual Report and remain current as at 21 August 2015.
Major shareholders
The tables in section 4.4.27 and the information set out in sections 7.195.17 and 7.205.18 of this Annual Report present information pertaining to the shares in BHP Billiton Limited and BHP Billiton Plc held by Directors and members of the Group Management Committee (GMC).
Neither BHP Billiton Limited nor BHP Billiton Plc is directly or indirectly controlled by another corporation or by any government. Other than as described in section 2.10.2,9.3.2 of this Annual Report, no major shareholder possesses voting rights that differ from those attaching to all of BHP Billiton Limited’sLimited and BHP Billiton Plc’s voting securities.
Substantial shareholders in BHP Billiton Limited
NoThe following table shows holdings of five per cent or more of voting rights in BHP Billiton Limited’s shares have beenas notified to BHP Billiton Limited under the Australian Corporations Act 2001, Section 671B. No single person beneficially owned more than five per cent of BHP Billiton Limited’s voting securities.671B as at 30 June 2015. (1)
| | | | | | | | | | | | | | | | | | | | | | | | | | |
Title of class | | Identity of person
or group | | Date of last notice | | | Percentage of
total voting rights (2) | |
| | | Date
received | | | Date of
change | | | Number owned | | | 2015 | | | 2014 | | | 2013 | |
Ordinary shares | | BlackRock Group | |
| 24 March
2015 |
| |
| 20 March
2015 |
| | | 163,140,603 | | | | 5.08 | % | | | <5.0 | % | | | 5.02 | % |
| (1) | No changes in the holdings of five per cent or more of the voting rights in BHP Billiton Limited’s shares have been notified to BHP Billiton Limited between 1 July 2015 and 21 August 2015. |
| (2) | The percentages quoted are based on the total voting rights conferred by ordinary shares in BHP Billiton Limited as at 21 August 2015 of 3,211,691,105. |
Substantial shareholders in BHP Billiton Plc
The following table shows holdings of three per cent or more of voting rights inconferred by BHP Billiton Plc’s ordinary shares as notified to BHP Billiton Plc under the UK Disclosure and Transparency Rule 5.5 as at 30 June 2015.(1)
| | | | | | | | | | | | | | | | | | | | | | |
Title of class | | Identity of person
or group | | Date of last notice | | Number owned | | | Percentage of
total voting rights (2) | |
| | | Date
received | | Date of
change | | | 2013 | | | 2012 | | | 2011 | |
Ordinary shares | | Norges Bank | | 6 February
2013 | | 5 February
2013 | | | 63,635,068 | | | | 3.01 | % | | | – | | | | – | |
Ordinary shares | | BlackRock, Inc. | | 3 December
2009 | | 1 December
2009 | | | 213,014,043 | | | | 10.08 | % | | | 10.08 | % | | | 10.08 | % |
| | | | | | | | | | | | | | | | | | | | | | | | | | |
Title of class | | Identity of person
or group | | Date of last notice | | | Percentage of
total voting rights (2) | |
| | | Date
received | | | Date of
change | | | Number owned | | | 2015 | | | 2014 | | | 2013 | |
Ordinary shares | | Aberdeen Asset Managers Limited | |
| 13 March
2015 |
| | | N/A | (3) | | | 127,971,161 | | | | 6.06 | % | | | 6.34 | % | | | <3.0 | % |
Ordinary shares | | BlackRock, Inc. | |
| 3 December
2009 |
| |
| 1 December
2009 |
| | | 213,014,043 | | | | 10.08 | % | | | 10.08 | % | | | 10.08 | % |
| (1) | Other than as disclosed to the relevant stock exchanges, there has been no changeNo changes in the holdings of three per cent or more of the voting rights in BHP Billiton Plc’s shares have been notified to BHP Billiton Plc as at the date of this Annual Report.between 1 July 2015 and 21 August 2015. |
| (2) | The percentages quoted are based on the total voting rights ofconferred by ordinary shares in BHP Billiton Plc as at the date21 August 2015 of the Annual Report each year of 2,112,071,796. |
The following table shows holdings of Directors and members of the GMC of BHP Billiton Plc who were in office as at 30 June 2013, as a group, of BHP Billiton Plc’s voting securities as at that date.(1)
| | | | | | | | | | |
Title of class | | Identity of person or group | | Number owned | | | Percentage of
total voting rights
at 30 June 2013 (2) | |
Ordinary shares | | Directors and Executives as a group | | | 379,354 | | | | 0.02 | % |
(1) | As at the date of this Annual Report, the Directors and members of the GMC who were in office at 30 June 2013 held 0.03 per cent of the total voting rights of BHP Billiton Plc (Number owned: 544,722). |
(2)(3) | The percentages quoted are based onThis was a clarification of the totalnumber of voting rights of BHP Billiton Plc of 2,112,071,796. Total voting rights represent issued fully paid shares less 24,113,658right shares held by BHP Billiton Plcthe Aberdeen Asset Management PLC Group, in its capacity as Treasury shares (which excludesdiscretionary asset manager. Previous notifications have been submitted on an all share capital basis (inclusive of shares held by Employee Share Ownership Plan trusts)without voting powers being delegated to Aberdeen Asset Management PLC Group). This notification did not reflect any changes in shareholdings, and was purely a clarification exercise to confirm the voting rights held. |
Twenty largest shareholders as at 2321 August 20132015 (as named on the Register of Shareholders) (1)
| | BHP Billiton Limited | BHP Billiton Limited | | Number of fully
paid shares | | % of issued
capital | | BHP Billiton Limited | | Number of fully
paid shares | | % of issued
capital | |
| 1. | | HSBC Custody Nominees (Australia) Limited | | | 557,644,450 | | | | 17.36 | | | HSBC Australia Nominees Pty Limited | | 609,196,602 | | | 18.97 | |
| 2. | | J P Morgan Nominees Australia Limited | | | 413,007,108 | | | | 12.86 | | | JP Morgan Nominees Australia Limited | | 442,160,195 | | | 13.77 | |
| 3. | | National Nominees Limited | | | 297,209,683 | | | | 9.25 | | | National Nominees Ltd | | 256,763,649 | | | 7.99 | |
| 4. | | Citicorp Nominees Pty Limited <BHP Billiton ADR Holders A/C> | | | 185,939,608 | | | | 5.79 | | | Citicorp Nominees Pty Ltd <BHP Billiton ADR holders A/C> | | 173,245,830 | | | 5.39 | |
| 5. | | Citicorp Nominees Pty Ltd | | | 114,783,866 | | | | 3.57 | | | Citicorp Nominees Pty Ltd | | 173,045,019 | | | 5.39 | |
| 6. | | J P Morgan Nominees Australia Limited <Cash Income A/C> | | | 80,266,537 | | | | 2.50 | | | BNP Paribas Noms Pty Ltd <DRP> | | 63,024,802 | | | 1.96 | |
| 7. | | BNP Paribas Noms Pty Ltd <DRP> | | | 69,417,969 | | | | 2.16 | | | Citicorp Nominees Pty Limited <Colonial First State Inv A/C> | | 32,011,884 | | | 1.00 | |
| 8. | | Citicorp Nominees Pty Limited <Colonial First State Inv A/C> | | | 45,204,517 | | | | 1.41 | | | Aust Mutual Prov Society | | 18,975,067 | | | 0.59 | |
| 9. | | AMP Life Limited | | | 26,515,189 | | | | 0.83 | | | HSBC Custody Nominees (Australia) Limited <NT-Comnwlth Super Corp A/C> | | 17,026,653 | | | 0.53 | |
| 10. | | HSBC Custody Nominees (Australia) Limited <NT-Comnwlth Super Corp A/C> | | | 15,014,678 | | | | 0.47 | | | Australian Foundation Investment Company Limited | | 13,990,941 | | | 0.44 | |
| 11. | | UBS Wealth Management Australia Nominees Pty Ltd | | | 14,723,344 | | | | 0.46 | | | UBS Wealth Management | | 11,788,417 | | | 0.37 | |
| 12. | | Australian Foundation Investment Company Limited | | | 13,990,941 | | | | 0.44 | | | Computershare Nominees CI Ltd <ASX Shareplus Control A/C> | | 10,798,351 | | | 0.34 | |
| 13. | | BNP Paribas Nominees Pty Ltd <Agency Lending DRP A/C> | | | 9,894,577 | | | | 0.31 | | | HSBC Custody Nominees (Australia) Limited-GSCO ECA | | 8,907,391 | | | 0.28 | |
| 14. | | RBC Investor Services Australia Nominees Pty Limited <PI Pooled A/C> | | | 8,225,003 | | | | 0.26 | | | BNP Paribas Nominees Pty Ltd <Agency Lending DRP A/C> | | 8,872,728 | | | 0.28 | |
| 15. | | ARGO Investments Limited | | | 8,065,004 | | | | 0.25 | | | Argo Investments Limited | | 8,265,004 | | | 0.26 | |
| 16. | | Computershare Nominees CI Ltd <ASX Shareplus Control A/C> | | | 7,616,844 | | | | 0.24 | | | RBC Investor Services Australia Nominees Pty Limited <BK Cust A/C> | | 7,027,804 | | | 0.22 | |
| 17. | | RBC Investor Services Australia Nominees Pty Limited <BKCUST A/C> | | | 5,552,630 | | | | 0.17 | | | RBC Investor Services Australia Nominees Pty Limited <PI Pooled A/C> | | 6,220,635 | | | 0.19 | |
| 18. | | Navigator Australia Ltd <MLC Investment Sett A/C> | | | 5,394,590 | | | | 0.17 | | | Navigator Australia Ltd <MLC Investment Settlement A/C> | | 5,887,759 | | | 0.18 | |
| 19. | | Custodial Services Limited <Beneficiaries Holdings A/C> | | | 3,931,568 | | | | 0.12 | | | Bond Street Custodians Limited | | 5,524,829 | | | 0.17 | |
| 20. | | Nulis Nominees (Australia) Limited <Navigator Mast Plan Sett A/C> | | | 3,404,783 | | | | 0.11 | | | Computershare Trustees Jey Ltd <RE 3000101 A/C> | | 4,138,531 | | | 0.13 | |
| | | | | | | | | | | | | | | | |
| | | | | 1,885,802,889 | | | | 58.73 | | | | | 1,876,872,091 | | | 58.44 | |
| | | | | | | | | | | | | | | | |
| | | BHP Billiton Plc | BHP Billiton Plc | | Number of fully
paid shares | | % of issued
capital | | BHP Billiton Plc | | Number of fully
paid shares | | % of issued
capital | |
| 1. | | PLC Nominees (Proprietary) Limited (1) | | | 416,109,898 | | | | 19.48 | | | PLC Nominees (Proprietary) Limited(2) | | 306,389,299 | | | 14.51 | |
| 2. | | Chase Nominees Limited | | | 93,394,653 | | | | 4.37 | | | Chase Nominees Limited | | 88,930,438 | | | 4.21 | |
| 3. | | Chase Nominees Limited <LEND> | | | 88,262,193 | | | | 4.13 | | | State Street Nominees Limited <OM02> | | 87,924,735 | | | 4.16 | |
| 4. | | State Street Nominees Limited <OM02> | | | 85,556,707 | | | | 4.00 | | | The Bank of New York (Nominees) Limited | | 85,677,001 | | | 4.06 | |
| 5. | | GEPF Equity | | | 73,333,979 | | | | 3.43 | | | National City Nominees Limited | | 82,282,683 | | | 3.90 | |
| 6. | | State Street Nominees Limited <OM04> | | | 61,579,469 | | | | 2.88 | | | State Street Nominees Limited <OM04> | | 76,558,072 | | | 3.62 | |
| 7. | | The Bank of New York (Nominees) Limited | | | 56,641,243 | | | | 2.65 | | | Government Employees Pension Fund | | 52,049,124 | | | 2.46 | |
| 8. | | National City Nominees Limited | | | 51,995,999 | | | | 2.43 | | | Nortrust Nominees Limited | | 49,927,964 | | | 2.36 | |
| 9. | | Nortrust Nominees Limited | | | 45,932,165 | | | | 2.15 | | | Lynchwood Nominees Limited <2006420> | | 49,763,639 | | | 2.36 | |
| 10. | | Vidacos Nominees Limited <CLRLUX2> | | | 42,471,262 | | | | 1.99 | | | Vidacos Nominees Limited <CLRLUX2> | | 47,909,286 | | | 2.27 | |
| 11. | | HSBC Global Custody Nominee (UK) Limited <357206> | | | 41,127,844 | | | | 1.93 | | | Vidacos Nominees Limited <13559> | | 43,668,225 | | | 2.07 | |
| 12. | | Lynchwood Nominees Limited <2006420> | | | 35,536,745 | | | | 1.66 | | | State Street Nominees Limited <OD64> | | 42,711,532 | | | 2.02 | |
| 13. | | State Street Nominees Limited <OD64> | | | 34,608,919 | | | | 1.62 | | | HSBC Global Custody Nominee (UK) Limited <357206> | | 33,846,871 | | | 1.60 | |
| 14. | | BNY Mellon Nominees Limited <BSDTGUSD> | | | 33,839,364 | | | | 1.58 | | | Industrial Development Corporation | | 33,804,582 | | | 1.60 | |
| 15. | | Industrial Development Corporation | | | 33,804,582 | | | | 1.58 | | | BNY Mellon Nominees Limited <BSDTGUSD> | | 29,927,404 | | | 1.42 | |
| 16. | | Nutraco Nominees Limited <781221> | | | 27,000,000 | | | | 1.26 | | | Nutraco Nominees Limited <492762> | | 24,846,195 | | | 1.18 | |
| 17. | | Nortrust Nominees Limited <SLEND> | | | 24,082,869 | | | | 1.13 | | | Vidacos Nominees Limited <FGN> | | 23,526,334 | | | 1.11 | |
| 18. | | Nutraco Nominees Limited <492762> | | | 24,036,899 | | | | 1.13 | | | Nutraco Nominees Limited <781221> | | 22,500,000 | | | 1.07 | |
| 19. | | BNY Mellon Nominees Limited <BSDTGABN> | | | 20,790,453 | | | | 0.97 | | | Euroclear Nominees Limited <EOC01> | | 21,448,827 | | | 1.02 | |
| 20. | | State Street Nominees Limited <GB01> | | | 18,688,842 | | | | 0.87 | | | The Bank of New York (Nominees) Limited <UKREITS> | | 21,437,964 | | | 1.02 | |
| | | | | | | | | | | | | | | | |
| | | | | 1,308,794,085 | | | | 61.24 | | | | | 1,225,130,175 | | | 58.02 | |
| | | | | | | | | | | | | | | | |
| (1) | Many of the 20 largest shareholders shown for BHP Billiton Limited and BHP Billiton Plc hold shares as a nominee or custodian. In accordance with the reporting requirements, the tables reflect the legal ownership of shares and not the details of the underlying beneficial holders. |
| (2) | The largest holder on the South African register of BHP Billiton Plc beingis the STRATEStrate nominee in which the majority of shares in South Africa (including some of the shareholders included in this list) are held in dematerialised form. |
United States share ownership as at 30 June 201321 August 2015
| | | | BHP Billiton Limited | | BHP Billiton Plc | | | BHP Billiton Limited | | BHP Billiton Plc | |
| | | Shareholders
Numbers | | % | | Shares
Numbers | | % | | Shareholders
Numbers | | % | | Shares
Numbers | | % | | | Number of
Shareholders | | % | | Number of
shares | | % | | Number of
Shareholders | | % | | Number of
shares | | % | |
Classification of holder | | | | | | | | | | | | | | | | | Classification of holder | | | | | | | | | | | | | | | |
Registered holders of voting securities | | | 1,751 | | | | 0.30 | | | | 5,937,654 | | | | 0.18 | | | | 65 | | | | 0.29 | | | | 189,749 | | | | 0.01 | | | 1,693 | | | 0.28 | | | 4,528,151 | | | 0.14 | | | 73 | | | 0.32 | | | 110,251 | | | 0.01 | |
ADR holders | | | 1,150 | | | | 0.20 | | | | 182,289,040 | (1) | | | 5.68 | | | | 188 | | | | 0.83 | | | | 52,245,708 | (2) | | | 2.45 | | | 1,279 | | | 0.21 | | | | 173,200,830 | (1) | | 5.39 | | | 238 | | | 1.02 | | | | 82,212,682 | (2) | | 3.89 | |
| (1) | These shares translate to 91,144,52086,600,415 ADRs. |
| (2) | These shares translate to 26,122,85441,106,341 ADRs. |
DistributionGeographical distribution of shareholders and shareholdings as at 2321 August 20132015
| | | | BHP Billiton Limited | | BHP Billiton Plc | | | BHP Billiton Limited | | BHP Billiton Plc | |
| | | Shareholders
Numbers | | % | | Shares
Numbers | | % | | Shareholders
Numbers | | % | | Shares
Numbers | | % | | | Number of
Shareholders | | % | | Number of
shares | | % | | Number of
Shareholders | | % | | Number of
shares | | % | |
Registered address | | | | | | | | | | | | | | | | | | | | | | | | | | | | | | | | |
Australia | | | 562,678 | | | | 96.21 | | | | 3,139,802,455 | | | | 97.76 | | | | 375 | | | | 1.63 | | | | 1,267,081 | | | | 0.06 | | | 578,952 | | | 96.54 | | | 3,142,288,795 | | | 97.84 | | | 565 | | | 2.43 | | | 1,335,621 | | | 0.06 | |
New Zealand | | | 13,623 | | | | 2.33 | | | | 36,035,647 | | | | 1.12 | | | | 42 | | | | 0.18 | | | | 114,277 | | | | 0.01 | | | 12,159 | | | 2.03 | | | | 31,731,801 | | | 0.99 | | | 35 | | | 0.15 | | | | 109,179 | | | 0.01 | |
United Kingdom | | | 3,113 | | | | 0.53 | | | | 9,635,917 | | | | 0.30 | | | | 19,872 | | | | 86.56 | | | | 1,696,879,659 | | | | 79.43 | | | 2,950 | | | 0.49 | | | 8,079,289 | | | 0.25 | | | 19,535 | | | 84.03 | | | 1,782,267,371 | | | 84.38 | |
United States | | | 1,758 | | | | 0.30 | | | | 5,619,147 | | | | 0.18 | | | | 71 | | | | 0.31 | | | | 277,159 | | | | 0.01 | | | 1,693 | | | 0.28 | | | | 4,528,151 | | | 0.14 | | | 73 | | | 0.32 | | | | 110,251 | | | 0.01 | |
South Africa | | | 138 | | | | 0.02 | | | | 283,390 | | | | 0.01 | | | | 1,380 | | | | 6.01 | | | | 434,197,050 | | | | 20.33 | | | 141 | | | 0.02 | | | 271,909 | | | 0.01 | | | 1,570 | | | 6.75 | | | 325,969,113 | | | 15.43 | |
Other | | | 3,559 | | | | 0.61 | | | | 20,314,549 | | | | 0.63 | | | | 1,219 | | | | 5.31 | | | | 3,450,228 | | | | 0.16 | | | 3,776 | | | 0.63 | | | | 24,791,160 | | | 0.77 | | | 1,470 | | | 6.32 | | | | 2,280,261 | | | 0.11 | |
| | | | | | | | | | | | | | | | | | | | | | | | | | | | | | | | | | | | | | | | | | | | | | | | |
Total | | | 584,869 | | | | 100.00 | | | | 3,211,691,105 | | | | 100.00 | | | | 22,959 | | | | 100.00 | | | | 2,136,185,454 | | | | 100.00 | | | 599,671 | | | 100.00 | | | 3,211,691,105 | | | 100.00 | | | 23,248 | | | 100.00 | | | 2,112,071,796 | | | 100.00 | |
| | | | | | | | | | | | | | | | | | | | | | | | | | | | | | | | | | | | | | | | | | | | | | | | |
Distribution of shareholdings by size as at 21 August 2015
| | | | BHP Billiton Limited | | BHP Billiton Plc | | | BHP Billiton Limited | | BHP Billiton Plc | |
| | | Shareholders
Numbers | | % | | Shares
Numbers(1) | | % | | Shareholders
Numbers | | % | | Shares
Numbers(1) | | % | | | Number of
Shareholders | | % | | Number of
shares (1) | | % | | Number of
Shareholders | | % | | Number of
shares (1) | | % | |
Size of holding | | | | | | | | | | | | | | | | | | | | | | | | | | | | | | | | |
1 – 500 (2) | | | 260,263 | | | | 44.50 | | | | 59,219,101 | | | | 1.84 | | | | 12,429 | | | | 54.14 | | | | 3,141,453 | | | | 0.15 | | | 263,477 | | | 43.94 | | | 60,117,311 | | | 1.87 | | | 12,401 | | | 53.34 | | | 3,070,258 | | | 0.14 | |
501 – 1,000 | | | 113,010 | | | | 19.32 | | | | 87,292,307 | | | | 2.72 | | | | 4,752 | | | | 20.70 | | | | 3,511,302 | | | | 0.16 | | | 117,596 | | | 19.61 | | | | 90,919,657 | | | 2.83 | | | 4,872 | | | 20.96 | | | | 3,595,497 | | | 0.17 | |
1,001 – 5,000 | | | 164,204 | | | | 28.08 | | | | 368,504,724 | | | | 11.47 | | | | 3,775 | | | | 16.44 | | | | 7,678,271 | | | | 0.36 | | | 170,667 | | | 28.46 | | | 383,245,394 | | | 11.93 | | | 3,997 | | | 17.19 | | | 7,971,008 | | | 0.38 | |
5,001 – 10,000 | | | 27,368 | | | | 4.68 | | | | 193,374,016 | | | | 6.02 | | | | 451 | | | | 1.96 | | | | 3,188,527 | | | | 0.15 | | | 27,974 | | | 4.66 | | | | 198,026,181 | | | 6.17 | | | 465 | | | 2.00 | | | | 3,330,386 | | | 0.16 | |
10,001 – 25,000 | | | 14,819 | | | | 2.53 | | | | 222,939,413 | | | | 6.94 | | | | 358 | | | | 1.56 | | | | 5,686,795 | | | | 0.27 | | | 14,915 | | | 2.49 | | | 224,665,307 | | | 7.00 | | | 355 | | | 1.53 | | | 5,627,817 | | | 0.27 | |
25,001 – 50,000 | | | 3,357 | | | | 0.57 | | | | 114,980,734 | | | | 3.58 | | | | 210 | | | | 0.91 | | | | 7,641,839 | | | | 0.36 | | | 3,275 | | | 0.54 | | | | 112,381,204 | | | 3.50 | | | 202 | | | 0.87 | | | | 7,330,685 | | | 0.35 | |
50,001 – 100,000 | | | 1,183 | | | | 0.20 | | | | 81,226,179 | | | | 2.53 | | | | 244 | | | | 1.06 | | | | 17,972,103 | | | | 0.84 | | | 1,129 | | | 0.19 | | | 77,441,091 | | | 2.41 | | | 220 | | | 0.95 | | | 15,906,721 | | | 0.75 | |
100,001 – 250,000 | | | 473 | | | | 0.08 | | | | 68,967,416 | | | | 2.15 | | | | 241 | | | | 1.05 | | | | 39,090,515 | | | | 1.83 | | | 465 | | | 0.08 | | | | 67,141,068 | | | 2.09 | | | 242 | | | 1.04 | | | | 38,763,268 | | | 1.83 | |
250,001 – 500,000 | | | 99 | | | | 0.02 | | | | 33,728,489 | | | | 1.05 | | | | 153 | | | | 0.67 | | | | 54,309,644 | | | | 2.54 | | | 86 | | | 0.01 | | | 28,239,563 | | | 0.88 | | | 151 | | | 0.65 | | | 54,730,393 | | | 2.59 | |
500,001 – 1,000,000 | | | 35 | | | | 0.01 | | | | 25,120,497 | | | | 0.78 | | | | 128 | | | | 0.56 | | | | 87,857,405 | | | | 4.11 | | | 36 | | | 0.01 | | | | 23,920,028 | | | 0.74 | | | 121 | | | 0.52 | | | | 86,132,163 | | | 4.08 | |
1,000,001 and over | | | 58 | | | | 0.01 | | | | 1,956,338,229 | | | | 60.92 | | | | 218 | | | | 0.95 | | | | 1,906,107,600 | | | | 89.23 | | | 51 | | | 0.01 | | | 1,945,594,301 | | | 60.58 | | | 222 | | | 0.95 | | | 1,885,613,600 | | | 89.28 | |
| | | | | | | | | | | | | | | | | | | | | | | | | | | | | | | | | | | | | | | | | | | | | | | | |
Total | | | 584,869 | | | | 100.00 | | | | 3,211,691,105 | | | | 100.00 | | | | 22,959 | | | | 100.00 | | | | 2,136,185,454 | | | | 100.00 | | | 599,671 | | | 100.00 | | | | 3,211,691,105 | | | 100.00 | | | 23,248 | | | 100.00 | | | | 2,112,071,796 | | | 100.00 | |
| | | | | | | | | | | | | | | | | | | | | | | | | | | | | | | | | | | | | | | | | | | | | | | | |
| (1) | One ordinary share entitles the holder to one vote. |
| (2) | Number of BHP Billiton Limited shareholders holding less than a marketable parcel (A$500) based on the market price of A$35.6424.10 as at 2321 August 20132015 was 5,388.11,523. |
| | | | | | | | | | | | | | | | | | | | | | | | | | | | | | | | |
| | | BHP Billiton Limited | | | BHP Billiton Plc | |
| | | Shareholders
Numbers | | | % | | | Shares
Numbers | | | % | | | Shareholders
Numbers | | | % | | | Shares
Numbers | | | % | |
Classification of holder | | | | | | | | | | | | | | | | | | | | | | | | | | | | | | | | |
Corporate | | | 146,387 | | | | 25.03 | | | | 2,264,906,968 | | | | 70.53 | | | | 13,174 | | | | 57.38 | | | | 2,122,652,977 | | | | 99.37 | |
Private | | | 438,482 | | | | 74.97 | | | | 946,484,137 | | | | 29.47 | | | | 9,785 | | | | 42.62 | | | | 13,532,477 | | | | 0.63 | |
| | | | | | | | | | | | | | | | | | | | | | | | | | | | | | | | |
Total | | | 584,869 | | | | 100.00 | | | | 3,211,691,105 | | | | 100.00 | | | | 22,959 | | | | 100.00 | | | | 2,136,185,454 | | | | 100.00 | |
| | | | | | | | | | | | | | | | | | | | | | | | | | | | | | | | |
| | | | | | | | | | | | | | | | | | | | | | | | | | | | | | | | |
| | | BHP Billiton Limited | | | BHP Billiton Plc | |
| | | Number of
Shareholders | | | % | | | Number of
shares | | | % | | | Number of
Shareholders | | | % | | | Number of
shares | | | % | |
Classification of holder | | | | | | | | | | | | | | | | | | | | | | | | | | | | | | | | |
Corporate | | | 168,459 | | | | 28.09 | | | | 2,404,676,029 | | | | 74.87 | | | | 13,611 | | | | 58.55 | | | | 2,101,006,271 | | | | 99.48 | |
Private | | | 431,212 | | | | 71.91 | | | | 807,015,076 | | | | 25.13 | | | | 9,637 | | | | 41.45 | | | | 11,065,525 | | | | 0.52 | |
| | | | | | | | | | | | | | | | | | | | | | | | | | | | | | | | |
Total | | | 599,671 | | | | 100.00 | | | | 3,211,691,105 | | | | 100.00 | | | | 23,248 | | | | 100.00 | | | | 2,112,071,796 | | | | 100.00 | |
| | | | | | | | | | | | | | | | | | | | | | | | | | | | | | | | |
11.39.7 Dividends
Policy
We have a progressive dividend policy that seeks to steadily increase or at least to maintain the dividend in US dollars at each half-yearly payment.
We declare our dividends and other distributions in US dollars as it is our main functional currency. BHP Billiton Limited pays its dividends in Australian dollars, UK pounds sterling, New Zealand dollars or US dollars, depending on the country of residence of the shareholder.dollars. BHP Billiton Plc pays its dividends in UK pounds sterling (or US dollars, if elected) to shareholders registered on its principal register in the United Kingdom and in South African rand to shareholders registered on its branch register in South Africa. If
Currency conversions will be based on the foreign currency exchange rates on the Record Date, except for the conversion into South African rand which will take place on the last day to trade (cum dividend) on the JSE.
Aligning the currency conversion date with the Record Date (for all currencies except the conversion into South African rand, which takes place on and is aligned to the last day to trade on the JSE as explained above) enables a high level of certainty around the currency required to pay the dividend and helps to eliminate the Group’s exposure to movements in exchange rates since the number of shares on which dividends are payable (and the elected currency) is final at close of business on the Record Date.
Aligning the final date to receive currency elections (currency election date) with the Record Date further simplifies the process.
Payments
BHP Billiton Limited shareholders may have their cash dividends paid directly into their bank account in Australian dollars, UK pounds sterling, New Zealand dollars or US dollars, provided that they have submitted direct credit details and if required, a valid currency election nominating a financial institution to the BHP Billiton Share Registrar in Australia no later than close of business on the Dividend Record Date. BHP Billiton Limited shareholders who do not provide their direct credit details will receive dividend payments by way of a cheque in Australian dollars.
BHP Billiton Plc shareholders on the United Kingdom register who wish to receive their dividends in US dollars they must complete the appropriate election form and return it to the BHP Billiton Share Registrar in the United Kingdom no later than close of business on the Dividend Record Date.
Payments
BHP Billiton Limited shareholders may have their cash dividends paid directly into a nominated bank, building society or credit union, depending on the shareholder’s country of residence as shown below.
| | |
Country where shareholder is resident
| | Financial institution
|
Australia
| | Bank, building society, credit union |
United Kingdom
| | Bank, building society |
New Zealand
| | Bank |
United States
| | Bank |
Shareholders from the abovementioned locations who do not provide their direct credit details and shareholders with registered addresses outside Australia, the United Kingdom, New Zealand and the United States will receive dividend payments by way of a cheque in Australian dollars.
BHP Billiton Plc shareholders may have their cash dividends paid directly into a bank or building society by completing a dividend mandate form, which is available from the BHP Billiton Share Registrar in the United Kingdom or South Africa.
11.49.8 Share price information
The following tables show the share prices for the period indicated for ordinary shares and ADSs for each of BHP Billiton Limited and BHP Billiton Plc. The share prices are the highest and lowest closing market quotations for ordinary shares reported on the Daily Official List of the ASX and LSE respectively, and the highest and lowest closing prices for ADSs quoted on the NYSE, adjusted to reflect stock dividends.
BHP Billiton Limited
| | | | | | | | | | | | | | | | | | |
| | | | | Ordinary shares | | | American Depositary Shares (1) | |
BHP Billiton Limited | | High A$ | | | Low A$ | | | High US$ | | | Low US$ | |
FY2008 | | | 49.55 | | | | 31.00 | | | | 95.00 | | | | 52.27 | |
FY2009 | | | 44.40 | | | | 21.10 | | | | 82.86 | | | | 24.62 | |
FY2010 | | | 44.63 | | | | 32.14 | | | | 82.86 | | | | 49.54 | |
FY2011 | | | 49.55 | | | | 36.98 | | | | 102.68 | | | | 62.42 | |
FY2012 | | First quarter | | | 44.95 | | | | 33.95 | | | | 96.80 | | | | 66.44 | |
| | Second quarter | | | 38.69 | | | | 33.86 | | | | 83.60 | | | | 64.42 | |
| | Third quarter | | | 38.21 | | | | 34.05 | | | | 82.15 | | | | 70.70 | |
| | Fourth quarter | | | 36.25 | | | | 30.60 | | | | 75.50 | | | | 60.87 | |
FY2013 | | First quarter | | | 34.22 | | | | 30.18 | | | | 72.28 | | | | 61.84 | |
| | Second quarter | | | 37.40 | | | | 32.93 | | | | 78.44 | | | | 67.78 | |
| | Third quarter | | | 39.00 | | | | 32.76 | | | | 80.46 | | | | 68.43 | |
| | Fourth quarter | | | 35.27 | | | | 30.65 | | | | 71.09 | | | | 57.38 | |
| | | |
| | | | | Ordinary shares | | | American Depositary Shares (1) | |
BHP Billiton Limited | | High A$ | | | Low A$ | | | High US$ | | | Low US$ | |
Month of January 2013 | | | 38.15 | | | | 36.25 | | | | 79.93 | | | | 76.40 | |
Month of February 2013 | | | 39.00 | | | | 36.35 | | | | 80.46 | | | | 74.41 | |
Month of March 2013 | | | 36.84 | | | | 32.76 | | | | 74.21 | | | | 68.43 | |
Month of April 2013 | | | 33.68 | | | | 30.65 | | | | 71.09 | | | | 64.05 | |
Month of May 2013 | | | 35.27 | | | | 31.79 | | | | 70.38 | | | | 65.32 | |
Month of June 2013 | | | 34.26 | | | | 30.81 | | | | 66.81 | | | | 57.38 | |
Month of July 2013 | | | 34.95 | | | | 30.94 | | | | 64.85 | | | | 56.32 | |
Month of August 2013 | | | 37.33 | | | | 34.80 | | | | 68.04 | | | | 62.82 | |
| | | | | | | | | | | | | | | | | | |
| | | | | Ordinary shares | | | American Depositary Shares(1) | |
BHP Billiton Limited | | High A$ | | | Low A$ | | | High US$ | | | Low US$ | |
FY2011 | | | 49.55 | | | | 36.98 | | | | 102.68 | | | | 62.42 | |
FY2012 | | | 44.95 | | | | 30.60 | | | | 96.80 | | | | 60.87 | |
FY2013 | | | 39.00 | | | | 30.18 | | | | 80.46 | | | | 57.38 | |
FY2014 | | First quarter | | | 37.33 | | | | 30.94 | | | | 70.02 | | | | 56.32 | |
| | Second quarter | | | 38.24 | | | | 34.62 | | | | 72.81 | | | | 63.73 | |
| | Third quarter | | | 39.38 | | | | 35.20 | | | | 70.82 | | | | 62.76 | |
| | Fourth quarter | | | 38.40 | | | | 35.28 | | | | 72.40 | | | | 66.38 | |
FY2015 | | First quarter | | | 39.68 | | | | 33.72 | | | | 73.50 | | | | 58.88 | |
| | Second quarter | | | 34.68 | | | | 27.42 | | | | 59.88 | | | | 45.15 | |
| | Third quarter | | | 34.12 | | | | 26.90 | | | | 52.55 | | | | 44.16 | |
| | Fourth quarter | | | 33.35 | | | | 26.95 | | | | 52.27 | | | | 40.71 | |
| | | | | | | | | | | | | | | | | | |
| | | | | Ordinary shares | | | American Depositary Shares(1) | |
BHP Billiton Limited | | High A$ | | | Low A$ | | | High US$ | | | Low US$ | |
Month of January 2015 | | | 29.54 | | | | 26.90 | | | | 47.54 | | | | 44.16 | |
Month of February 2015 | | | 33.65 | | | | 29.60 | | | | 52.55 | | | | 47.31 | |
Month of March 2015 | | | 34.12 | | | | 29.40 | | | | 52.30 | | | | 44.55 | |
Month of April 2015 | | | 32.57 | | | | 29.12 | | | | 52.27 | | | | 43.90 | |
Month of May 2015 | | | 33.35 | | | | 28.82 | | | | 52.16 | | | | 44.57 | |
Month of June 2015 | | | 29.19 | | | | 26.95 | | | | 45.04 | | | | 40.71 | |
Month of July 2015 | | | 27.10 | | | | 25.27 | | | | 41.29 | | | | 36.30 | |
Month of August 2015 | | | 26.69 | | | | 22.89 | | | | 39.72 | | | | 32.18 | |
| (1) | Each ADS represents the right to receive two BHP Billiton Limited ordinary shares. |
The total market capitalisation of BHP Billiton Limited at 30 June 201321 August 2015 was A$100.877.4 billion (US$93.056.8 billion equivalent), which represented approximately 7.675.06 per cent of the total market capitalisation of the ASX All Ordinaries Index. The closing price for BHP Billiton Limited ordinary shares on the ASX on that date was A$31.37.24.10.
BHP Billiton Plc
| | | | | | | | | | | | | | | | | | |
| | | | | Ordinary shares | | | American Depositary Shares (1) | |
BHP Billiton Plc | | High UK pence | | | Low UK pence | | | High US$ | | | Low US$ | |
FY2008 | | | 2,196.00 | | | | 1,183.00 | | | | 85.62 | | | | 47.83 | |
FY2009 | | | 1,841.00 | | | | 752.50 | | | | 74.18 | | | | 21.16 | |
FY2010 | | | 2,334.50 | | | | 1,287.50 | | | | 70.95 | | | | 41.88 | |
FY2011 | | | 2,631.50 | | | | 1,684.50 | | | | 85.47 | | | | 51.61 | |
FY2012 | | First quarter | | | 2,521.50 | | | | 1,731.50 | | | | 80.69 | | | | 53.08 | |
| | Second quarter | | | 2,109.00 | | | | 1,667.00 | | | | 67.98 | | | | 51.30 | |
| | Third quarter | | | 2,206.50 | | | | 1,877.50 | | | | 69.96 | | | | 59.99 | |
| | Fourth quarter | | | 2,039.00 | | | | 1,681.00 | | | | 65.55 | | | | 52.20 | |
FY2013 | | First quarter | | | 2,049.00 | | | | 1,751.00 | | | | 66.19 | | | | 54.76 | |
| | Second quarter | | | 2,156.50 | | | | 1,873.00 | | | | 70.37 | | | | 60.10 | |
| | Third quarter | | | 2,236.00 | | | | 1,915.00 | | | | 72.07 | | | | 58.06 | |
| | Fourth quarter | | | 2,001.00 | | | | 1,673.00 | | | | 60.15 | | | | 51.27 | |
| | | |
| | | | | Ordinary shares | | | American Depositary Shares (1) | |
BHP Billiton Plc | | High UK pence | | | Low UK pence | | | High US$ | | | Low US$ | |
Month of January 2013 | | | 2,208.50 | | | | 2,051.50 | | | | 72.07 | | | | 65.74 | |
Month of February 2013 | | | 2,236.00 | | | | 2,083.00 | | | | 69.79 | | | | 63.19 | |
Month of March 2013 | | | 2,135.00 | | | | 1,915.00 | | | | 63.49 | | | | 58.06 | |
Month of April 2013 | | | 1,951.00 | | | | 1,762.50 | | | | 60.15 | | | | 54.19 | |
Month of May 2013 | | | 2,001.00 | | | | 1,782.00 | | | | 60.04 | | | | 55.54 | |
Month of June 2013 | | | 1,903.00 | | | | 1,673.00 | | | | 58.77 | | | | 51.27 | |
Month of July 2013 | | | 1,913.00 | | | | 1,666.50 | | | | 58.98 | | | | 50.29 | |
Month of August 2013 | | | 1,994.50 | | | | 1844.50 | | | | 61.93 | | | | 57.25 | |
| | | | | | | | | | | | | | | | | | |
| | | | | Ordinary shares | | | American Depositary Shares(1) | |
BHP Billiton Plc | | High UK pence | | | Low UK pence | | | High US$ | | | Low US$ | |
FY2011 | | | 2,631.50 | | | | 1,684.50 | | | | 85.47 | | | | 51.61 | |
FY2012 | | | 2,521.50 | | | | 1,667.00 | | | | 80.69 | | | | 51.30 | |
FY2013 | | | 2,236.00 | | | | 1,673.00 | | | | 72.07 | | | | 51.27 | |
FY2014 | | First quarter | | | 1,994.50 | | | | 1,666.50 | | | | 62.80 | | | | 50.29 | |
| | Second quarter | | | 1,983.00 | | | | 1,754.50 | | | | 63.79 | | | | 56.84 | |
| | Third quarter | | | 1,979.00 | | | | 1,759.00 | | | | 65.78 | | | | 57.24 | |
| | Fourth quarter | | | 1,995.00 | | | | 1,850.00 | | | | 66.73 | | | | 62.35 | |
FY2015 | | First quarter | | | 2,096.00 | | | | 1,715.00 | | | | 71.02 | | | | 55.53 | |
| | Second quarter | | | 1,690.50 | | | | 1,276.00 | | | | 54.84 | | | | 39.88 | |
| | Third quarter | | | 1,643.50 | | | | 1,285.00 | | | | 51.13 | | | | 39.66 | |
| | Fourth quarter | | | 1,610.50 | | | | 1,249.00 | | | | 49.27 | | | | 39.56 | |
| | | |
| | | | | Ordinary shares | | | American Depositary Shares(1) | |
BHP Billiton Plc | | High UK pence | | | Low UK pence | | | High US$ | | | Low US$ | |
Month of January 2015 | | | 1,452.00 | | | | 1,285.00 | | | | 44.07 | | | | 39.66 | |
Month of February 2015 | | | 1,643.50 | | | | 1,473.50 | | | | 51.13 | | | | 45.07 | |
Month of March 2015 | | | 1,598.50 | | | | 1,389.50 | | | | 49.40 | | | | 41.64 | |
Month of April 2015 | | | 1,589.50 | | | | 1,416.00 | | | | 48.84 | | | | 41.32 | |
Month of May 2015 | | | 1,610.50 | | | | 1,375.00 | | | | 49.27 | | | | 42.31 | |
Month of June 2015 | | | 1,383.50 | | | | 1,249.00 | | | | 43.14 | | | | 39.56 | |
Month of July 2015 | | | 1,272.50 | | | | 1,123.50 | | | | 39.87 | | | | 34.93 | |
Month of August 2015 | | | 1,209.00 | | | | 967.50 | | | | 38.12 | | | | 30.50 | |
| (1) | Each ADS represents the right to receive two BHP Billiton Plc ordinary shares. |
The total market capitalisation of BHP Billiton Plc at 30 June 201321 August 2015 was £35.5£22.5 billion (US$54.135.3 billion equivalent), which represented approximately 1.871.1 per cent of the total market capitalisation of the FTSEAll-Share Index. The closing price for BHP Billiton Plc ordinary shares on the LSE on that date was £16.82.£10.655.
11.59.9 American Depositary Receipts fees and charges
We have American Depositary Receipts (ADR) programs for BHP Billiton Limited and BHP Billiton Plc.
Depositary fees
Citibank serves as the depositary bank for both of our ADR programs. ADR holders agree to the terms in the deposit agreement filed with the SEC for depositing ADSs or surrendering the ADSs for cancellation and for certain services as provided by Citibank. Holders are required to pay all fees for general depositary services provided by Citibank in each of our ADR programs, as set forth in the tables below.
Standard depositary fees:
| | |
Depositary service | | Fee payable by the ADR holders |
Issuance of ADSs upon deposit of shares | | Up to US$5.00 per 100 ADSs (or fraction thereof) issued |
Delivery of Deposited Securities against surrender of ADSs | | Up to US$5.00 per 100 ADSs (or fraction thereof) surrendered |
Distribution of Cash Distributions | | No fee |
Corporate actions depositary fees:
| | |
Depositary service | | Fee payable by the ADR holders |
Cash Distributions (i.e. sale of rights, other entitlements, return of capital) | | Up to US$2.00 per 100 ADSs (or fraction thereof) held |
| |
Distribution of ADSs pursuant to exercise of rights to purchase additional ADSs. Excludes stock dividends and stock splits | | Up to US$5.00 per 100 ADSs (or fraction thereof) held |
| |
Distribution of securities other than ADSs or rights to purchase additional ADSs (i.e. spin-off shares) | | Up to US$5.00 per 100 ADSs (or fraction thereof) held |
| |
Distribution of ADSs pursuant to an ADR ratio change in which shares are not distributed | | No fee |
Fees payable by the Depositary to the Issuer
Citibank has provided BHP Billiton net reimbursement of US$1.61.7 million in FY2013FY2015 for ADR program-related expenses for both of BHP Billiton’s ADR programs (FY2012(FY2014 US$1.61.4 million). ADR program-related expenses include legal and accounting fees, listing fees, expenses related to investor relations in the United States, fees payable to service providers for the distribution of material to ADR holders, expenses of Citibank as administrator of the ADS Direct Plan and expenses to remain in compliance with applicable laws.
Citibank has further agreed to waive other ADR program-related expenses for FY2013FY2015, amounting to less than US$0.03 million, which are associated with the administration of the ADR programs (FY2012(FY2014 less than US$0.020.03 million).
Our ADR programs trade on the NYSE under the stock tickers BHP and BBL for the BHP Billiton Limited and BHP Billiton Plc programs, respectively. As of 30 June 2013,21 August 2015, there were 91,144,52086,600,415 ADRs on issue and outstanding in the BHP Billiton Limited ADR program and 26,122,85441,106,341 ADRs on issue and outstanding in the BHP Billiton Plc ADR program. Both of the ADR programs have a 2:1 ordinary shares to ADR ratio.
11.69.10 Taxation
The taxation discussion below describes the material Australian, UK and US federal income tax consequences to a US holder of owning BHP Billiton Limited ordinary shares or ADSs or BHP Billiton Plc ordinary shares or ADSs. The discussion below also outlines the potential South African tax issues for US holders of BHP Billiton Plc shares that are listed on the JSE.
The following discussion is not relevant to non-US holders of BHP Billiton Limited ordinary shares or ADSs or BHP Billiton Plc ordinary shares or ADSs. By its nature, the commentary below is of a general nature and we recommend that holders of ordinary shares or ADSs consult their own tax advisers regarding the Australian, UK, South African and US federal, state and local tax and other tax consequences of owning and disposing of ordinary shares and ADSs in their particular circumstances.
For purposes of this commentary, a US holder is a beneficial owner of ordinary shares or ADSs who is, for US federal income tax purposes:
a citizen or resident alien of the US;
a corporation (or other entity treated as a corporation for US federal income tax purposes) that is created or organised under the laws of the US or any political subdivision thereof;
an estate, the income of which is subject to US federal income taxation regardless of its source; or
a trust:
| | a)(a) | if a court within the US is able to exercise primary supervision over its administration and one or more US persons have the authority to control all of its substantial decisions; or |
| | b)(b) | that has made a valid election to be treated as a US person for tax purposes. |
This discussion of material tax consequences for US holders is based on the Australian, UK, US and South African laws currently in effect, the published practice of tax authorities in those jurisdictions and the double taxation treaties and conventions currently in existence. These laws are subject to change, possibly on a retroactive basis.
US holders in BHP Billiton Limited
(a) Australian taxation
In this section, references to ‘resident’ and ‘non-resident’ refer to residence status for Australian income tax purposes.
Dividends
Dividends (including other distributions treated as dividends for Australian tax purposes) paid by BHP Billiton Limited to a US holder that is not an Australian resident US holder, or whose holding is effectively connected with:
a permanent establishment in Australia; or
a fixed base in Australia from which they perform personal services;
mayfor Australian tax purposes will generally not be subject to incomeAustralian withholding tax on an assessment basis. However, any franking credits attached to the dividends may be creditable against any such income tax liability. Broadly, an amount ofif they are fully franked (broadly, where a dividend is franked, tax paid by BHP Billiton Limited is imputed to the company flows throughshareholders).
Dividends paid to shareholders (as a franking credit) whensuch US holders, which are not fully franked, will generally be subject to 15 per cent Australian withholding tax only to the company pays aextent (if any) that the dividend which is frankedneither:
franked; nor
declared by BHP Billiton Limited to be conduit foreign income. (Broadly, this means that the company.relevant part of the dividend is declared to have been paid out of foreign source amounts received by BHP Billiton
| Limited that are not subject to tax in Australia, such as dividends remitted to Australia by foreign subsidiaries). |
UnderThe Australian withholding tax outcome described above applies to US holders who are eligible for benefits under the Tax Convention between Australia and the US as to the Avoidance of Double Taxation (the Australian Tax Treaty),. Otherwise, the rate of Australian withholding tax may be 30 per cent.
In contrast, dividends (including other distributions treated as dividends for Australian tax purposes) paid by BHP Billiton Limited to a non-resident US holder who or which is eligible for treaty benefits and whose holding:
is not effectively connected with a permanent establishmentmay instead be taxed by assessment in Australia; or
inAustralia if the case of a non-resident US holder who performs independent personal services from a ‘fixed base’ situated therein, is not connected with that ‘fixed base’;
may be subject to Australian withholding tax at a rate not exceeding 15 per cent of such gross dividend. For such a non-resident US holder:
where fully franked dividends are paid to non-residents they are not subject to withholding tax. The payment ofis an Australian incomeresident for Australian tax by BHP Billiton Limited generates a ‘franking credit’ forpurposes (although the company;
dividends paid to non-residents of Australia are also exempt from withholding tax to the extent to which such dividends are declared by BHP Billiton Limited to be conduit foreign income (CFI). CFI is made up of certain foreign income amounts that are earned by BHP Billiton Limited that are not subject to tax in Australia, such as dividends remitted to Australia by foreign subsidiaries; and
any part of a dividend paid to a US holder that is not ‘franked’ and is not CFI will generally be subjectlimited to Australian dividends withholding tax at 15 per cent unless a specific exemption applies.
Sale of ordinary shares and ADSs
An Australian resident US holder (other than dual residents under the Australian tax treaty and certain temporary residents) may be liable to Australian income tax on an assessment basis on any gain of an income nature on disposal of ordinary shares or ADSs or alternatively Australian capital gains tax on any gain on disposal of ordinary shares or ADSs acquired after 19 September 1985. The position of dual residents and temporary residents is more complex and they should seek advice that is specific to their circumstances.
A non-resident US holder may be liable to Australian income tax on an assessment basis on any gain of an income nature on disposal of ordinary shares or ADSs that is sourced in Australia. However, where the US holder is eligible for benefits under the Australian Tax Treaty the non-resident US holder is only liable to Australian tax if the gain constitutes one or moreas a treaty resident of the following:
US and any franking credits may be creditable against their Australian income tax liability); or
carries on business profits of an enterprise attributable tothrough a permanent establishment in Australia and the dividend is effectively connected with that permanent establishment (in which case any franking credits may be creditable against their Australian income tax liability); or
performs independent personal services from a ‘fixed base’ situated in Australia through whichand the enterprise carriesdividend is effectively connected with that ‘fixed base’.
Sale of ordinary shares and ADSs
Gains made by US holders on business in Australia;
income from the alienation of property that forms part of the business property of a permanent establishment of an enterprise in Australia, or pertains to a fixed base available to the US holder in Australia for the purpose of performing independent personal services; or
income derived from the disposition of shares in a company, the assets of which consist wholly or principally of real property (which includes rights to exploit or to explore for natural resources) situated in Australia, whether such assets are held directly, or indirectly through one or more interposed entities.
Where the gain of a non-resident US holder on disposalsale of ordinary shares or ADSs will generally not be taxed in Australia.
However, the precise Australian tax treatment of gains made by US holders on the sale of ordinary shares or ADSs generally depends on whether or not the gain is notan Australian sourced gain of an income nature (orfor Australian income tax purposes.
Where the gain is Australian sourced and of an income nature, but is sourced outside Australia), the non-residenta US holder maywill generally only be liable to Australian income tax on an assessment basis if(whether or not they are also an Australian resident for Australian tax purposes) if:
they are not eligible for benefits under the Australian Tax Treaty; or
they are eligible for benefits under the Australian Tax Treaty but the gain constitutes any of the following:
| – | | business profits of an enterprise attributable to a permanent establishment situated in Australia through which the enterprise carries on business in Australia; or |
| – | | income or gains from the alienation of property that form part of the business property of a permanent establishment of an enterprise that the US holder has in Australia, or pertain to a fixed base available to the US holder in Australia for the purpose of performing independent personal services; or |
| – | | income derived from the disposition of shares in a company, the assets of which consist wholly or principally of real property (which includes rights to exploit or to explore for natural resources) situated in Australia, whether such assets are held directly or indirectly through one or more interposed entities. |
Where the gain is either not Australian sourced or is not of an income nature, the US holder will generally only be liable to Australian capital gains tax applies. Australian capital gains tax will only generally applyon an assessment basis if they acquired (or are deemed to a disposal of the ordinaryhave acquired) their shares or ADSs by a non-resident US holder if the shares or ADSs have been acquired after 19 September 1985 and one or more of the following applies:
the US holder is an Australian resident for Australian tax purposes; or
the ordinary shares or ADSs have been used by the US holder in carrying on a trade or business through a permanent establishment in Australia; or
the US holder (together(either alone or together with associates) directly or indirectly owns or owned 10 per cent or more of the issued share capital of BHP Billiton Limited at the time of the disposal or throughout a12-month period
during the two years prior to the time of disposal and, at the time of the disposal, the sum of the market values of BHP Billiton Limited’s assets that are taxable Australian real property (held directly or through interposed entities) exceeds the sum of the market values of BHP Billiton Limited’s assets (held directly or through interposed entities) that are not taxable Australian real property at that time (which, for these purposes currently includes mining, quarrying or prospecting rights in respect of minerals, petroleum or quarry materials situated in Australia – and may be extended to associated information and goodwill); or | during the two years prior to the time of disposal and, at the time of the disposal, the sum of the market values of BHP Billiton Limited’s assets that are taxable Australian real property (held directly or through interposed entities) exceeds the sum of the market values of BHP Billiton Limited’s assets (held directly or through interposed entities) that are not taxable Australian real property at that time (real property, for these purposes, includes mining, quarrying or prospecting rights in respect of minerals, petroleum or quarry materials situated in Australia); or
|
the US holder is an individual who is not eligible for benefits under the Australian Tax Treaty as a treaty resident of the US and elected on becoming a non-resident of Australia to continue to have the ordinary shares or ADSs subject to Australian capital gains tax.
The comments above on the sale of ordinary shares and ADSs do not apply:
to temporary residents of Australia who should seek advice that is specific to their circumstances;
if the Investment Management Regime (IMR) applies to the US holder. In this regard, the Australian Government has announced proposalspassed legislation to exempt from Australian income tax and capital gains tax gains made on disposals by certain categories of non-resident funds – called Investment Management Regime (IMR) foreign fundsIMR entities – of (relevantly) portfolio interests in Australian public companies.companies (subject to a number of conditions). The IMR exemptions wouldbroadly apply to widely held IMR entities in relation to their direct investments and indirect investments made through an independent Australian fund manager. The exemptions apply to gains made by IMR foreign fundsentities that are treated as companies for Australian tax purposes as well as gains made by non-resident investors in IMR foreign fundsentities that are treated as trusts and partnerships for Australian tax purposes. These reforms are not yet lawThe IMR exemptions will apply for the 2015-16 income year and if enacted, their start date is uncertain.later income years (but an entity may choose for the provisions to apply to certain earlier income years).
Stamp duty, gift, estate and inheritance tax
Australia does not impose any stamp duty, gift, estate or inheritance taxes in relation to transfers or gifts of shares or ADSs or upon the death of a shareholder.
(b) US taxation
This section describes the material US federal income tax consequences to a US holder of owning ordinary shares or ADSs. It applies only to ordinary shares or ADSs that are held as capital assets for tax purposes. This section does not apply to a holder of ordinary shares or ADSs that is a member of a special class of holders subject to special rules, including a dealer in securities, a trader in securities that elects to use a mark-to-market method of accounting for its securities holdings, a tax-exempt organisation, a life insurance company, a person liable for alternative minimum tax, a person who actually or constructively owns 10 per cent or more of the voting stock of BHP Billiton Limited, a person that holds ordinary shares or ADSs as part of a straddle or a hedging or conversion transaction, a person that purchases or sells ordinary shares or ADSs as part of a wash sale for tax purposes, or a person whose functional currency is not the US dollar.
If a partnership holds the ordinary shares or ADSs, the US federal income tax treatment of a partner generally will depend on the status of the partner and the tax treatment of the partnership. A partner in a partnership holding the ordinary shares or ADSs should consult its tax adviser with regard to the US federal income tax treatment of an investment in the ordinary shares or ADSs.
This section is in part based on the representations of the Depositary and the assumption that each obligation in the deposit agreement and any related agreement will be performed in accordance with its terms.
In general, for US federal income tax purposes, a holder of ADSs will be treated as the owner of the ordinary shares represented by those ADSs. Exchanges of ordinary shares for ADSs, and ADSs for ordinary shares, generally will not be subject to US federal income tax.
Dividends
Under US federal income tax laws and subject to the passive foreign investment companyPassive Foreign Investment Company (PFIC) rules discussed below, a US holder must include in its gross income the amount of any dividend paid by BHP Billiton Limited out of its current or accumulated earnings and profits (as determined for US federal income tax purposes) plus any Australian tax withheld from the dividend payment even though the holder does not receive it. The dividend is taxable to the holder when the holder, in the case of ordinary shares, or the Depositary, in the case of ADSs, actually or constructively receives the dividend.
Dividends paid to a non-corporate US holder on shares or ADSs will be taxable at the ratepreferential rates applicable tolong-term capital gains provided that the US holder holds the shares or ADSs for more than 60 days during the 121-day period beginning 60 days before the ex-dividend date and does not enter into certain risk reduction transactions with respect to the shares or ADSs during the abovementioned holding period. In addition,However, anon-corporate US holder that elects to treat the dividend income as ‘investment income’ pursuant to Section 163(d)(4) of the US Internal Revenue Code will not be eligible for the reduced rate of taxation.such preferential rates. In the case of a corporate US holder, dividends on shares and ADSs are taxed as ordinary income and will not be eligible for the dividends received deduction generally allowed to US corporations in respect of dividends received from other US corporations.
Distributions in excess of current and accumulated earnings and profits, as determined for US federal income tax purposes, will be treated as a non-taxable return of capital to the extent of the holder’s tax basis, determined in US dollars, in the ordinary shares or ADSs and thereafter as a capital gain.
The amount of any cash distribution paid in any foreign currency will be equal to the US dollar value of such currency, calculated by reference to the spot rate in effect on the date such distribution is received by the US holder or, in the case of ADSs, by the Depositary, regardless of whether and when the foreign currency is in fact converted into US dollars. If the foreign currency is converted into US dollars on the date received, the US holder generally should not recognise foreign currency gain or loss on such conversion. If the foreign currency is not converted into US dollars on the date received, the US holder will have a basis in the foreign currency equal to its US dollar value on the date received, and generally will recognise foreign currency gain or loss on a subsequent conversion or other disposal of such currency. Such foreign currency gain or loss generally will be treated as US source ordinary income or loss.loss for foreign tax credit limitation purposes.
Subject to certain limitations, Australian tax withheld in accordance with the Australian Treaty and paid over to Australia will be creditable against an individual’s US federal income tax liability. Special rules apply in determining the foreign tax credit limitation with respect to dividends that are taxed at the preferential rates applicable to long-term capital gains rate.gains. To the extent a refund of the tax withheld is available to a US holder under Australian law or under the Australian Treaty, the amount of tax withheld that is refundable will not be eligible for credit against the holder’s US federal income tax liability. A US holder that does not elect to claim a US foreign tax credit may instead claim a deduction for Australian income tax withheld, but only for a taxable year in which the US holder elects to do so with respect to all foreign income taxes paid or accrued in such taxable year.
Dividends will be income from sources outside the US, and generally will be ‘passive category’ income or, for certain taxpayers, ‘general category’ income, which are treated separately from each other for the purpose of computing the foreign tax credit allowable to a US holder. In general, a taxpayer’s ability to use foreign tax credits may be limited and is dependent on the particular circumstances. US holders should consult their own tax advisers with respect to these matters.
Sale of ordinary shares and ADSs
Subject to the PFIC rules discussed below, a US holder who sells or otherwise disposes of ordinary shares or ADSs will recognise a capital gain or loss for US federal income tax purposes equal to the difference between the US dollar value of the amount realised and the holder’s tax basis, determined in US dollars, in those ordinary shares or ADSs. The gain or loss will generally be income or loss from sources within the US for foreign tax credit limitation purposes. The capital gain of a non-corporate US holder is generally taxed at preferential rates where the holder has a holding period greater than 12 months in the shares or ADSs sold. There are limitations on the deductibility of capital losses.
The US dollar value of any foreign currency received upon a sale or other disposition of ordinary shares or ADSs will be calculated by reference to the spot rate in effect on the date of sale or other disposal (or, in the case of a cash basis or electing accrual basis taxpayer, on the settlement date). A US holder will have a tax basis in the
foreign currency received equal to that US dollar amount, and generally will recognise foreign currency gain or loss on a subsequent conversion or other disposal of the foreign currency. This foreign currency gain or loss generally will be treated as US source ordinary income or loss.loss for foreign tax credit limitation purposes.
Passive Foreign Investment Company Rulesrules
We do not believe that the BHP Billiton Limited ordinary shares or ADSs will be treated as stock of a PFIC for US federal income tax purposes, but this conclusion is a factual determination that is made annually at the end of the year and thus may be subject to change. If BHP Billiton Limited were treated as a PFIC, any gain realised on the sale or other disposition of ordinary shares or ADSs would in general not be treated as a capital gain. Instead, a US holder would be treated as if it had realised such gain and certain ‘excess distributions’ ratably over its holding period for the ordinary shares or ADSs and would be taxed at the highest tax rate in effect for each such year to which the gain was allocated, together with an interest charge in respect of the tax attributable to each such year. In addition, dividends received with respect to ordinary shares or ADSs would not be eligible for the special tax rates applicable to qualified dividend income if BHP Billiton Limited were a PFIC either in the taxable year of the distribution or the preceding taxable year, but instead would be taxable at rates applicable to ordinary income. Assuming the shares or ADSs are ‘marketable stock’, a US holder may mitigate the adverse tax consequences described above by electing to be taxed annually on a mark-to-market basis with respect to such shares or ADSs.
US Holdersholders in BHP Billiton Plc
(a) UK taxation
Dividends
Under UK law, no UK tax is required to be withheld at source from dividends paid on ordinary shares or ADSs.
Sale of ordinary shares and ADSs
US holders will not be liable for UK tax on capital gains realised on disposal of ordinary shares or ADSs unless:
they are resident or ordinarily resident in the UK; or
they carry on a trade, profession or vocation in the UK through a branch or agency for the year in which the disposal occurs and the shares or ADSs have been used, held or acquired for the purposes of such trade (or profession or vocation), branch or agency. In the case of a trade, the term ‘branch’ includes a permanent establishment.
An individual who ceases to be a resident in the UK for tax purposes while owning shares or ADSs and then disposes of those shares or ADSs while not a UK resident may become subject to UK tax on capital gains if he/she she:
had sole UK residence in the UK tax year preceding his/her departure from the UK;
had sole UK residence at any time during at least four of the seven UK tax years preceding his/her year of departure from the UK; and
subsequently becomes treated as ahaving sole UK residentresidence again before five complete UK tax years of non-UK residence have elapsed from the date he/she left the UK.
In this situation US holders will generally be entitled to claim US tax paid on such a disposition as a credit against any corresponding UK tax payable.
UK inheritance tax
Under the current UK – UK–US Inheritance and Gift Tax Treaty, ordinary shares or ADSs held by a US holder who is domiciled for the purposes of the UK – UK–US Inheritance and Gift Tax Treaty in the US, and is not for the purposes of the UK – UK–US Inheritance and Gift Tax Treaty a national of the UK, will generally not be subject to UK inheritance tax on the individual’s death or on a chargeable gift of the ordinary shares or ADSs during the individual’s lifetime, provided that any applicable US federal gift or estate tax liability is paid, unless the ordinary shares or ADSs are part of the business property of a permanent establishment of the individual in the UK or, in the case of a shareholder who performs independent personal services, pertain to a fixed base situated
in the UK. Where the ordinary shares or ADSs have been placed in trust by a settlor who, at the time of settlement, was a US-residentUS resident shareholder, the ordinary shares or ADSs will generally not be subject to UK inheritance tax unless the settlor, at the time of settlement, was not domiciled in the US and was a UK national. In the exceptional case where the ordinary shares or ADSs are subject to both UK inheritance tax and US federal gift or estate tax, the UK – UK–US Inheritance and Gift Tax Treaty generally provides for double taxation to be relieved by means of credit relief.
UK stamp duty and stamp duty reserve tax
Under applicable legislation, UK stamp duty or stamp duty reserve tax (SDRT) is, subject to certain exemptions, payable on any issue or transfer of shares to the Depositary or their nominee where those shares are for inclusion in the ADR program at a rate of 1.5 per cent of their price (if issued), the amount of any consideration provided (if transferred on sale) or their value (if transferred for no consideration). However, from 1 October 2009, this 1.5 per cent charge has generally ceased to apply to issues of shares into EUEuropean Union (EU) depositary receipt systems and into EU clearance systems. Further, the First-tier Tribunal has held that the 1.5 per cent SDRT charge on a transfer of shares to an issuer of American Depositary ReceiptsADRs (as an integral part of a fresh capital raising) was incompatible with European UnionEU law. Her Majesty’s Revenue and Customs has confirmed that it will no longer seek to impose the 1.5 per cent SDRT charge on the issue of shares (or, where it is integral to the raising of new capital, the transfer of shares) to a depositary receipt issuer or a clearance service, outside the European Union.wherever located. The law in this area may still be susceptible to change. We recommend advice should be sought in relation to paying the 1.5 per cent SDRT or stamp duty charge in any circumstances.
No SDRT would be payable on the transfer of an ADS. No UK stamp duty should be payable on the transfer of an ADS provided that the instrument of transfer is executed and remains at all times outside the UK. Transfers of ordinary shares to persons other than the Depositary or their nominee will give rise to stamp duty or SDRT at the time of transfer. The relevant rate is currently 0.5 per cent of the amount payable for the shares. The purchaser normally pays the stamp duty or SDRT.
Special rules apply to transactions involving intermediates and stock lending.
(b) US taxation
This section describes the material US federal income tax consequences to a US holder of owning ordinary shares or ADSs. It applies only to ordinary shares or ADSs that are held as capital assets for tax purposes. This
section does not apply to a holder of ordinary shares or ADSs that is a member of a special class of holders subject to special rules, including a dealer in securities, a trader in securities who elects to use a mark-to-market method of accounting for its securities holdings, a tax-exempt organisation, a life insurance company, a person liable for alternative minimum tax, a person who actually or constructively owns 10 per cent or more of the voting stock of BHP Billiton Plc, a person that holds ordinary shares or ADSs as part of a straddle or a hedging or conversion transaction, a person that purchases or sells ordinary shares or ADSs as part of a wash sale for tax purposes, or a person whose functional currency is not the US dollar.
If a partnership holds the ordinary shares or ADSs, the US federal income tax treatment of a partner generally will depend on the status of the partner and the tax treatment of the partnership. A partner in a partnership holding the ordinary shares or ADSs should consult its tax adviser with regard to the US federal income tax treatment of an investment in the ordinary shares or ADSs.
This section is in part based on the representations of the Depositary and the assumption that each obligation in the deposit agreement and any related agreement will be performed in accordance with its terms.
In general, for US federal income tax purposes, a holder of ADSs will be treated as the owner of the ordinary shares represented by those ADSs. Exchanges of ordinary shares for ADSs, and ADSs for ordinary shares, generally will not be subject to US federal income tax.
Dividends
Under US federal income tax laws and subject to the PFIC rules discussed below, a US holder must include in its gross income the gross amount of any dividend paid by BHP Billiton Plc out of its current or accumulated earnings and profits (as determined for US federal income tax purposes). The dividend is taxable to the holder when the holder, in the case of ordinary shares, or the Depositary, in the case of ADSs, actually or constructively receives the dividend.
Dividends paid to a non-corporate US holder on shares or ADSs will be taxable at the ratepreferential rates applicable tolong-term capital gains provided that the US holder holds the shares or ADSs for more than 60 days during the 121-day period beginning 60 days before the ex-dividend date and does not enter into certain risk reduction transactions with respect to the shares or ADSs during the abovementioned holding period. In addition,However, anon-corporate US holder that elects to treat the dividend income as ‘investment income’ pursuant to Section 163(d)(4) of the US Internal Revenue Code will not be eligible for the reduced rate of taxation.such preferential rates. In the case of a corporate US holder, dividends on shares and ADSs are taxed as ordinary income and will not be eligible for the dividends received deduction generally allowed to US corporations in respect of dividends received from other US corporations.
Distributions in excess of current and accumulated earnings and profits, as determined for US federal income tax purposes, will be treated as a non-taxable return of capital to the extent of the holder’s tax basis, determined in US dollars, in the ordinary shares or ADSs and thereafter as a capital gain.
The amount of any cash distribution paid in any foreign currency will be equal to the US dollar value of such currency, calculated by reference to the spot rate in effect on the date such distribution is received by the US holder or, in the case of ADSs, by the Depositary, regardless of whether and when the foreign currency is in fact converted into US dollars. If the foreign currency is converted into US dollars on the date received, the US holder generally should not recognise foreign currency gain or loss on such conversion. If the foreign currency is not converted into US dollars on the date received, the US holder will have a basis in the foreign currency equal to its US dollar value on the date received, and generally will recognise foreign currency gain or loss on a subsequent conversion or other disposal of such currency. Such foreign currency gain or loss generally will be treated as US source ordinary income or loss.loss for foreign tax credit limitation purposes.
Dividends will be income from sources outside the US, and generally will be ‘passive category’ income or, for certain taxpayers, ‘general category’ income, which are treated separately from each other for the purpose of computing the foreign tax credit allowable to a US holder. In general, a taxpayer’s ability to use foreign tax credits may be limited and is dependent on the particular circumstances. US holders should consult their own tax advisers with respect to these matters.
Sale of ordinary shares and ADSs
Subject to the PFIC rules discussed below, a US holder who sells or otherwise disposes of ordinary shares or ADSs will recognise a capital gain or loss for US federal income tax purposes equal to the difference between the US dollar value of the amount realised and the holder’s tax basis, determined in US dollars, in those ordinary shares or ADSs. The gain or loss will generally be income or loss from sources within the US for foreign tax credit limitation purposes. The capital gain of a non-corporate US holder is generally taxed at preferential rates where the holder has a holding period greater than 12 months in the shares or ADSs sold. There are limitations on the deductibility of capital losses.
The US dollar value of any foreign currency received upon a sale or other disposition of ordinary shares or ADSs will be calculated by reference to the spot rate in effect on the date of sale or other disposal (or, in the case of a cash basis or electing accrual basis taxpayer, on the settlement date). A US holder will have a tax basis in the foreign currency received equal to that US dollar amount, and generally will recognise foreign currency gain or loss on a subsequent conversion or other disposal of the foreign currency. This foreign currency gain or loss generally will be treated as US source ordinary income or loss.loss for foreign tax credit limitation purposes.
Passive Foreign Investment Company Rulesrules
We do not believe that the BHP Billiton Plc ordinary shares or ADSs will be treated as stock of a PFIC for US federal income tax purposes, but this conclusion is a factual determination that is made annually at the end of the year and thus may be subject to change. If BHP Billiton Plc were treated as a PFIC, any gain realised on the sale or other disposition of ordinary shares or ADSs would in general not be treated as a capital gain. Instead, a US holder would be treated as if it had realised such gain and certain ‘excess distributions’ ratably over its holding period for the ordinary shares or ADSs and would be taxed at the highest tax rate in effect for each such year to which the gain was allocated, together with an interest charge in respect of the tax attributable to each such year. In addition, dividends received with respect to ordinary shares or ADSs would not be eligible for the special tax rates applicable to qualified dividend income if BHP Billiton Plc were a PFIC either in the taxable year of the distribution or the preceding taxable year, but instead would be taxable at rates applicable to ordinary income. Assuming the shares or ADSs are ‘marketable stock’, a US holder may mitigate the adverse tax consequences described above by electing to be taxed annually on a mark-to-market basis with respect to such shares or ADSs.
(c) South African taxation
Dividends
As from 1 April 2012, it is possible that US holders of BHP Billiton Plc shares or ADSs that remain South African residents may be subject to South African Dividends Tax, at a maximum rate of 15 per cent, on any dividends received from shares listed on the JSE. The South African Dividends Tax will be withheld from the gross amount of the dividend paid to the shareholder.
No South African Dividends Tax is required to be withheld from cash dividends provided the dividends are paid to, inter alia, non-South African tax resident shareholders or South African tax resident corporate shareholders (including South African pension, provident, retirement annuity and benefit funds). However, these dividends will only be exempt from South African Dividends Tax if these types of shareholders provide the requisite exempt declarations to the regulated intermediaries making the cash dividend payments.
Dividends Tax is nevertheless required to be withheld on dividends paid on ordinary shares and ADSs of BHP Billiton Plc listed on the JSE, where such dividends are paid to South African tax resident shareholders who are natural persons (individuals) or trusts, other than closure rehabilitation trusts.
Except for certain exclusions, generally speaking such dividends paid to South African tax resident natural persons or trusts are exempt from South African income tax and as such, the Dividends Tax may be considered as a final and non-creditable levy.
Sale of ordinary shares and ADSs
A US holder who or which is tax resident in South Africa would be liable for income tax on any profit on disposal of ordinary shares or ADSs, or capital gains tax on any gain on disposal of ordinary shares or ADSs, depending on whether the shares and ADSs are held on revenue or capital account.
Income tax is payable on any profit on disposal of ordinary shares or ADSs held by a non-resident US holder where the profit is of a revenue nature and sourced in South Africa. However,Africa unless relief is afforded under the Double Tax Agreement concluded between South Africa and the US. In such a case, the profit would only be regarded as being sourcedtaxed in South Africa if the ordinary shares or ADSs areit is attributable to a permanent establishment of that non-resident US holder situated in South Africa.
Where the ordinary shares or ADSs are not held on revenue account, non-resident US holders will not be liable for South African tax on capital gains realised on the disposal of ordinary shares or ADSs unless:
such US Holdersholders are tax resident in South Africa;
the shares or ADSs are held in a company, where 80 per cent or more of the market value of those shares or ADSs is attributable (at the time of disposal of those shares or ADSs) directly or indirectly to immovable property situated in South Africa, held otherwise than as trading stock; or
the US holder’s interest (the shares or ADSs in BHP Billiton Plc) is attributable to a permanent establishment which the US holder has in South Africa.
A US holder who holds ordinary shares or ADSs connected to a permanent establishment in South Africa will recognise a capital gain or loss for South African income tax purposes equal to the difference between the Rand value of the amount realised and the holder’s tax basis, determined in Rand, in those ordinary shares or ADSs. The holder’s tax basis will generally be equal to the cost that was incurred to acquire the shares, if such shares were acquired after 1 October 2001. The capital gain of a non-resident’s permanent establishment in South Africa will be taxed at an effective rate of 18.6 per cent.
Securities Transfer Tax
South African Securities Transfer Tax is levied at 0.25 per cent in respect of the transfer of ordinary shares or ADSs. The tax is levied on the amount of consideration at which the ordinary share or ADS is transferred or, where no value is declared, the closing price of the ordinary shares or ADSs. The tax is ultimately borne by the person to whom that ordinary share or ADS is transferred.
11.7 Ancillary information for our shareholders
Information forCertain US federal income tax consequences of the demerger of South32 to US holders in BHP Billiton Limited and BHP Billiton Plc
This section describes certain US federal income tax consequences of the demerger of South32 (the ‘demerger’) to US beneficial owners of BHP Billiton Limited and BHP Billiton Plc shares or ADSs who hold their shares or ADSs as capital assets for US federal income tax purposes, and who have as their functional currency the US dollar. This section does not apply to a holder of shares or ADSs that is a member of a special class of holders subject to special rules, including a dealer in securities, a trader in securities that elects to use a mark-to-market
method of accounting for its securities holdings, a tax-exempt organisation, a life insurance company, a person liable for alternative minimum tax, a person who actually or constructively owns 10 per cent or more of the voting stock of BHP Billiton Limited or BHP Billiton Plc, a person that holds shares or ADSs as part of a straddle or a hedging or conversion transaction, or a person that purchases or sells shares or ADSs as part of a wash sale for tax purposes. For additional information on the demerger, refer to sections 1.3.7, 1.6.4, 2.1.7, and note 29 ‘Discontinued operations’ to the Financial Statements of this Annual Report.
A US beneficial owner of BHP Billiton Limited or BHP Billiton Plc shares or ADSs who received a distribution of shares or ADSs of South32 pursuant to the demerger (a ‘Participating US holder’) will be treated as receiving a taxable distribution for an amount equal to the US dollar fair market value at the time of the distribution of the South32 shares or South32 ADSs distributed as part of the demerger. The distribution by BHP Billiton Limited and BHP Billiton Plc will be treated as a dividend for US federal income tax purposes to the extent of current or accumulated earnings and profits (as determined for US federal income tax purposes) of BHP Billiton Limited (in the case of BHP Billiton Limited shareholders and BHP Billiton Limited ADS holders) or of BHP Billiton Plc (in the case of BHP Billiton Plc shareholders and BHP Billiton Plc ADS holders). Any excess will be treated as a non-taxable return of capital to the extent of the Participating US holder’s tax basis in BHP Billiton shares or BHP Billiton ADSs and thereafter as capital gain. BHP Billiton Limited and BHP Billiton Plc do not maintain calculations of their earnings and profits in accordance with US federal income tax principles; therefore, Participating US holders should assume that the entire distribution will be taxed as a dividend.
Subject to certain exceptions for short-term and hedged positions, a non-corporate Participating US holder of shares in BHP Billiton Limited or BHP Billiton Plc (or their ADSs) will generally be subject to tax on the distribution at the rate applicable to long-term capital gains, provided that BHP Billiton Limited and BHP Billiton Plc (as applicable) are not PFICs in their current taxable year and were not PFICs for their most recently ended taxable year. Based on their audited annual Financial Statements, BHP Billiton Limited and BHP Billiton Plc do not believe they are PFICs or were PFICs for their most recently ended taxable years. However, this is provideda factual determination that is based upon regulations and guidance the interpretation of which is not entirely clear, and accordingly there can be no assurances in this regard.
In the case of a corporate Participating US holder, the distribution will not be eligible for the dividends received deduction generally available in receipt of dividends from US domestic corporations. If taxable as a dividend, the distribution will be income from sources outside the United States, and generally will be ‘passive category’ income under the rules for computing the foreign tax credit allowable to a Participating US holder.
A Participating US holder will have a tax basis in the South32 shares or South32 ADSs equal to the amount of dividend income recognised in respect of the distribution. The holding period for the South32 shares or South32 ADSs will begin on the day after the South32 shares or ADSs were distributed.
In general, dividends and payments of the proceeds from the sale, exchange or other disposition of shares, paid within the United States or through certain US-related financial intermediaries to a US person are subject to information reporting and may be subject to backup withholding unless the holder establishes that it is a corporation or other exempt recipient or, in the case of backup withholding, provides an accurate taxpayer identification number and certifies under penalty of perjury that it is a US person and that it is not subject to backup withholding. Backup withholding is not an additional tax. A holder generally may obtain a refund of any amounts withheld under the backup withholding rules in excess of such holder’s US federal income tax liability by filing a refund claim with the IRS.
9.11 Government regulations
Government regulations touch all aspects of our operations.
The ability to extract minerals, oil and natural gas is fundamental to BHP Billiton. In most jurisdictions, the rights to undeveloped mineral or petroleum deposits are owned by the state. In those jurisdictions, we rely upon
the rights granted to us by the government that owns the mineral, oil or natural gas. These rights usually take the form of a lease or licence, which gives us the right to access the land and extract the product. The terms of the lease or licence, including the time period for which it is effective, are specific to the laws of the relevant government. Generally, we own the product we extract and royalties or similar taxes are payable to the government. In certain jurisdictions in which we operate, such as Trinidad and Tobago, a production sharing contract (PSC) governs the relationship between the government and companies concerning how much of the oil and gas extracted from the country each will receive. In PSCs, the government awards rights for the execution of exploration, development and production activities to the company. The company bears the financial risk of the initiative and explores, develops and ultimately produces the field as required. When successful, the company is permitted to use the money from a certain set percentage of produced oil and gas to recover capital and operational expenditures, known as ‘cost oil’. The remaining production is known as ‘profit oil’ and is split between the government and the company at a rate determined by the government and set out in the PSC.
Related to the ability to extract is the ability to process the minerals, oil or natural gas. Again, we rely upon the relevant government to grant the rights necessary to transport and treat the extracted material in order to ready it for sale.
Underlying our business of extracting and processing natural resources is the ability to explore for those natural resources. Typically, the rights to explore for minerals, oil and natural gas are granted to us by the government that owns those natural resources that we wish to explore. Usually, the right to explore carries with it the obligation to spend a defined amount of money on the exploration or to undertake particular exploration activities.
Although onshore oil and gas rights in the United States can be derived from government (state and federal) mineral rights, they are primarily derived from private ownership of the rights, which is the case for our onshore oil and gas rights. Oil and gas rights primarily take the form of a lease, but also can be owned onshore outright in fee. If the rights granted are by lease, we are afforded the rights to access, explore, extract, produce and market the oil and gas for a period of years and then generally so long thereafter as there is oil or gas production or operations on the leased lands.
Governments also impose obligations on us in respect of environmental protection, land rehabilitation, occupational health and safety, and the rights and interests of Indigenous peoples with which we must comply in order to continue to enjoy the right to conduct our operations within that jurisdiction. These obligations often require us to make substantial expenditures to minimise or remediate the environmental impact of our operations, to ensure the safety of our employees and contractors and the like. Environmental protection, land rehabilitation and occupational health and safety onshore in the United States are principally regulated by the government and to a lesser degree, if applicable, by the lease contract with the landowner. For further information on these types of obligations, refer to section 1.14 of this Annual Report.
Of particular note are the following regulatory regimes:
9.11.1 Uranium production in Australia
To mine, process, transport and sell uranium from within Australia, we are required to hold possession and export permissions, which are also subject to regulation by the Australian Government or bodies that report to the Australian Government.
To possess nuclear material, such as uranium, in Australia, a Permit to Possess Nuclear Materials (Possession Permit) must be held pursuant to the Australian Nuclear Non-Proliferation (Safeguards) Act 1987 (Non-Proliferation Act). A Possession Permit is issued by the Australian Safeguards and Non-Proliferation Office, an office established under the Non-Proliferation Act, which administers Australia’s domestic nuclear safeguards requirements and reports to the Australian Government.
To export uranium from Australia, a Permit to Export Natural Uranium (Export Permit) must be held pursuant to the Australian Customs (Prohibited Exports) Regulations 1958. The Export Permit is issued by the Minister with responsibility for Resources and Energy.
A special permit to transport nuclear material is required under the Non-Proliferation Act by a party that transports nuclear material from one specified location to another specified location. As we engage service providers to transport uranium, each of those service providers is required to hold a permit to transport nuclear material issued by the Australian Safeguards and Non-Proliferation Office.
9.11.2 Exchange controls and shareholding limits
BHP Billiton Plc
There are no laws or regulations currently in force in the United Kingdom that restrict the export or import of capital or the remittance of dividends to non-resident holders of BHP Billiton Plc’s shares, although the Group does operate in some other jurisdictions where remittances of funds could be affected as they are subject to exchange control approvals. There are certain sanctions adopted by the UK Government that implement resolutions of the Security Council of the United Nations and sanctions imposed by the European Union (EU) against certain countries, entities and individuals and may restrict the export or import of capital or the remittance of dividends to certain non-resident holders of BHP Billiton Plc’s shares. Any enforcement of financial sanctions by the UK Government would be initiated by HM Treasury. Such sanctions may be in force from time to time and include those against: (i) certain entities and/or individuals associated with Afghanistan, Belarus, the Central African Republic, Cote d’Ivoire, the Democratic People’s Republic of Korea (North Korea), the Democratic Republic of Congo, Egypt, Eritrea, the Republic of Guinea, the Republic of Guinea-Bissau, Iran, Lebanon, Liberia, the Russian Federation, Somalia, South Sudan, Sudan, Syria, Tunisia, Ukraine, Yemen, Zimbabwe and the previous regimes of Iraq and Libya; (ii) entities and individuals linked with Al-Qaeda and other terrorist organisations.
There are no restrictions under BHP Billiton Plc’s Articles of Association or (subject to the effect of any sanctions) under English law that limit the right of non-resident or foreign owners to hold or vote BHP Billiton Plc’s shares.
There are certain restrictions on shareholding levels under BHP Billiton Plc’s Articles of Association described under the heading ‘BHP Billiton Limited’ below.
BHP Billiton Limited
From time to time, the United Nations Security Council and the Australian Government impose international sanctions on certain countries and organisations. The countries and organisations that are currently subject to United Nations sanctions are certain individuals or entities linked with the Taliban, Al-Qaeda and associated individuals and entities, other designated individuals and entities associated with terrorism, certain entities and individuals associated with the Central African Republic, the Democratic Republic of Congo, Cote d’Ivoire, the Democratic People’s Republic of Korea (North Korea), Eritrea, Guinea-Bissau, Iran, Iraq, Lebanon, Liberia, Libya, Sudan, Somalia and Yemen. The countries currently subject to the Australian Government’s autonomous sanctions are Myanmar, the Democratic People’s Republic of Korea (North Korea), the former Federal Republic of Yugoslavia, Iran, Libya, Syria, Russia, Crimea and Sevastopol, Ukraine and Zimbabwe. The controls impose certain approval and reporting requirements on transactions involving such countries, entities and individuals and/or assets controlled or owned by them. Certain transfers into or out of Australia of amounts greater than A$10,000 in any currency may also be subject to reporting requirements. In addition, under the Australian Banking (Foreign Exchange) Regulations 1959, the Reserve Bank of Australia may impose restrictions on certain financial transactions and require the consent of the Reserve Bank of Australia for the movement of funds into and out of Australia. No such restrictions are currently in place.
Remittances of any dividends, interest or other payments by BHP Billiton Limited to non-resident holders of BHP Billiton Limited’s securities are not restricted by exchange controls or other limitations, save that, in certain circumstances, BHP Billiton may be required to withhold Australian taxes.
There are no limitations, either under the laws of Australia or under the Constitution of BHP Billiton Limited, on the right of non-residents to hold or vote BHP Billiton Limited ordinary shares other than as set out below.
The Australian Foreign Acquisitions and Takeovers Act 1975 (the FATA) restricts certain acquisitions of interests in shares in BHP Billiton. Generally, under the FATA, the prior approval of the Australian Treasurer must be obtained for proposals by a foreign person (either alone or together with associates) to acquire control of 15 per cent or more of the voting power or issued shares in BHP Billiton Limited.
The FATA also empowers the Treasurer to make certain orders prohibiting acquisitions by foreign persons in BHP Billiton Limited (and requiring divestiture if the acquisition has occurred) where he considers the acquisition to be contrary to the national interest and the 15 per cent threshold referred to above would be exceeded as a result. Such orders may also be made in respect of acquisitions by foreign persons where two or more foreign persons (and their associates) in aggregate already control 40 per cent or more of the issued shares or voting power in BHP Billiton Limited.
There are certain other statutory restrictions, and restrictions under BHP Billiton Limited’s Constitution and BHP Billiton Plc’s Articles of Association, that apply generally to acquisitions of shares in BHP Billiton (i.e. the restrictions are not targeted at foreign persons only). These include restrictions on a person (and associates) breaching a voting power threshold of:
20 per cent in relation to BHP Billiton Limited on a ‘stand-alone’ basis (i.e. calculated as if there were no Special Voting Share and only counting BHP Billiton Limited’s ordinary shares);
30 per cent of BHP Billiton Plc. This is the threshold for a mandatory offer under Rule 9 of the UK takeover code and this threshold applies to all voting rights of BHP Billiton Plc (therefore including voting rights attached to the BHP Billiton Plc Special Voting Share);
30 per cent in relation to BHP Billiton Plc on a ‘stand-alone’ basis (i.e. calculated as if there were no Special Voting Share and only counting BHP Billiton Plc’s ordinary shares);
20 per cent in relation to the BHP Billiton Group, Annual Report 2013calculated having regard to all the voting power on a joint electorate basis (i.e. calculated on the aggregate of BHP Billiton Limited’s and BHP Billiton Plc’s ordinary shares).
Under BHP Billiton Limited’s Constitution and BHP Billiton Plc’s Articles of Association, sanctions for breach of any of these thresholds, other than by means of certain ‘permitted acquisitions’, include withholding of dividends, voting restrictions and compulsory divestment of shares to the Summary Review 2013.extent a shareholder and its associates exceed the relevant threshold.
9.12 Ancillary information for our shareholders
This Annual Report provides the detailed financial data and information on the BHP Billiton Group’s performance required to comply with the reporting regimes in Australia, the United Kingdom and the United States. There are no specific disclosure requirements for the Summary Review, which is published as a communication for shareholders.
Shareholders of BHP Billiton Limited and BHP Billiton Plc will receive a copy of the Annual Report or the Summary Review if they have requested a copy. Shareholders of BHP Billiton Plc will receive the Annual Report if they have requested a copy. ADR holders may view all documents online atwww.bhpbilliton.com or opt to receive a hard copy by application toaccessinghttp://pir.orderannualreports.com/v5/index.asp?cp_code=A548 or calling Citibank Shareholder Services during normal business hours using the details as listed on the inside back cover of thethis Annual Report.
Change of shareholder details and enquiries
Shareholders wishing to contact BHP Billiton on any matter relating to their shares or ADR holdings are invited to telephone the appropriate office of the BHP Billiton Share Registrar or Transfer Office listed on the inside back cover of thethis Annual Report.
Any change in shareholding details should be notified by the shareholder to the relevant Registrar in a timely manner.
Shareholders can also access their current shareholding details and change many of those details online atwww.bhpbilliton.com. The website requires shareholders to quote their Shareholder Reference Number (SRN) or Holder Identification Number (HIN) in order to access this information.
Alternative access to the Annual Report and Summary Review
We offer an alternative for all shareholders who wish to be advised of the availability of the Annual Report and Summary Review through our website via an email notification. By providing an email address through our website, shareholders will be notified by email when the Annual Report and Summary Review havehas been released. Shareholders will also receive notification of other major BHP Billiton announcements by email. Shareholders requiring further information or wishing to make use of this service should visit our websitewww.bhpbilliton.com.
ADR holders wishing to receive a hard copy of the Annual Report 20132015 can do so by accessingcitibank.ar.wilink.comhttp://pir.orderannualreports.com/v5/index.asp?cp_code=A548 or by calling Citibank Shareholder Services during normal business hours. ADR holders may also contact the adviser that administers their investments. Holders of BHP Billiton Plc shares dematerialised into STRATEStrate should liaise directly with their Central Securities Depository Participant (CSDP) or broker.
Key dates for shareholders
The following table sets out future dates in the next financial and calendar year of interest to our shareholders. If there are any changes to these dates, all relevant stock exchanges (see section 11.1)9.2 of this Annual Report) will be notified.
| | |
Date | | Event |
2529 September 20132015
| | Final Dividend Payment Date |
| |
2422 October 20132015
| | BHP Billiton Plc Annual General Meeting in London Venue: The Queen Elizabeth II Conference Centre Broad Sanctuary Westminster London SW1P 3EE UK United Kingdom Time: 11.00am (local time) Details of the business of the meeting are contained in the separate Notice of Meeting |
| |
2119 November 20132015
| | BHP Billiton Limited Annual General Meeting in Perth Venue: Perth Convention and Exhibition Centre 21 Mounts Bay Road Perth, Western Australia Time: 9.30am10.00am (local time) Details of the business of the meeting are contained in the separate Notice of Meeting |
| | |
11Date
| | Event |
23 February 20142016 | | Interim Results Announced |
| |
711 March 20142016
| | Interim Dividend Record Date |
| |
2631 March 20142016
| | Interim Dividend Payment Date |
| |
1916 August 20142016
| | Annual Results Announced |
Corporate Directory
BHP Billiton Group Registered Offices
BHP Billiton Limited
Australia
BHP Billiton Centre
171 Collins Street
Melbourne VIC 3000
Telephone 1300 554 757 (within Australia)
+61 3 9609 3333 (outside Australia)
Facsimile +61 3 9609 3015
BHP Billiton Plc
United Kingdom
Neathouse Place
London SW1V 1BH1LH
Telephone +44 20 7802 4000
Facsimile +44 20 7802 4111
Group Company Secretary
Jane McAloonMargaret Taylor
BHP Billiton Corporate Centres
South Africa
6 Hollard Street
Marshalltown
Johannesburg 2107
Telephone +27 11 376 9111
Facsimile +27 11 838 4716
Chile
Avenida Americo Vespucio Sur # 100Cerro El Plomo 6000
Piso 718
Las Condes 7569997560623
Santiago
Telephone +56 2 3302579 5000
Facsimile +56 2 207 65092207 6517
United States
Our agent for service in the United States is Maria Isabel Reuter at:
1360 Post Oak Boulevard, Suite 150
Houston, TX 77056-3020
Telephone +1 713 961 8500
Facsimile +1 713 961 8400
Marketing Offices
Singapore
10 Marina Boulevard,#50-01
Marina Bay Financial Centre, Tower 2
Singapore 018983
Telephone +65 6421 6000
Facsimile +65 6421 7000
Share Registrars and Transfer Offices
Australia
BHP Billiton Limited Registrar
Computershare Investor Services Pty Limited
Yarra Falls, 452 Johnston Street
Abbotsford VIC 3067
Postal Address – GPO Box 2975
Melbourne VIC 3001
Telephone 1300 656 780 (within Australia)
+61 3 9415 4020 (outside Australia)
Facsimile +61 3 9473 2460
Email enquiries:
www.investorcentre.com/bhp
United Kingdom
BHP Billiton Plc Registrar
Computershare Investor Services PLC
The Pavilions, Bridgwater Road
Bristol BS13 8AE
Postal Address (for general enquiries) –
The Pavilions, Bridgwater Road
Bristol BS99 6ZZ
Telephone +44 844 472 7001
Facsimile +44 870 703 6101
Email enquiries:
www.investorcentre.co.uk/contactus
South Africa
BHP Billiton Plc Branch Register
and Transfer Secretary
Computershare Investor Services
(Pty) Limited
70 Marshall Street
Johannesburg 2001
Postal Address – PO Box 61051
Marshalltown 2107
Telephone +27 11 373 0033
Facsimile +27 11 688 5217
Email enquiries:
web.queries@computershare.co.za
Holders of shares dematerialised
into STRATEStrate should contact their
CSDP or stockbroker.
New Zealand
Computershare Investor Services Limited
Level 2/159 Hurstmere Road
Takapuna North Shore CityAuckland 0622
Postal Address – Private Bag 92119
Auckland 1142
Telephone +64 9 488 8777
Facsimile +64 9 488 8787
United States
Computershare Trust Company N.A.
250 Royall Street
Canton, MA 02021
Postal Address – PO Box 43078
Providence, RI 02940-3078
Telephone +1 888 404 6340
(toll-free within US)
Facsimile +1 312 601 4331
ADR Depositary, Transfer Agent and Registrar
Citibank Shareholder Services
PO Box 43077
Providence, RI 02940-3077
Telephone +1 781 575 4555 (outside of US) +1 877 248 4237(+1-877-CITIADR)
(toll-free within US)
Facsimile +1 201 324 3284
Email enquiries:
citibank@shareholders-online.com
Website: www.citi.com/dr
BHP Billiton is a Dual Listed Company comprising BHP Billiton Limited and BHP Billiton Plc. The two entities continue to exist as separate companies but operate as a combined Group known as BHP Billiton.
The headquarters of BHP Billiton Limited and the global headquarters of the combined BHP Billiton Group are located in Melbourne, Australia. BHP Billiton Plc is located in London, UK. Both companies have identical Boards of Directors and are run by a unified management team. Throughout this Report, the Boards are referred to collectively as the Board. Shareholders in each company have equivalent economic and voting rights in the BHP Billiton Group as a whole.
Throughout this Annual Report, the terms BHP Billiton, the Company and the Group refer to the combined group, including both BHP Billiton Limited and subsidiary companies and BHP Billiton Plc and subsidiary companies.
1210 Exhibits
Exhibits marked “*” have been filed as exhibits to this Annual Reportannual report on Form20-F. Remaining exhibits have been incorporated by reference as indicated.
Exhibit 1 Constitution
| 1.1 | Constitution of BHP Billiton Limited(1) |
| 1.2 | Memorandum and Articles of Association of BHP Billiton Plc.Plc(1) |
Exhibit 4 Material Contracts
| 4.1 | DLC Structure Sharing Agreement, dated 29 June 2001, between BHP Limited and Billiton Plc.Plc(2) |
| 4.2 | SVC Special Voting Shares Deed, dated 29 June 2001, among BHP Limited, BHP SVC Pty Limited, Billiton Plc, Billiton SVC Limited and The Law Debenture Trust Corporation p.l.c.(2) |
| 4.3 | SVC Special Voting Shares Amendment Deed, dated 13 August 2001, among BHP Limited, BHP SVC Pty Limited, Billiton Plc, Billiton SVC Limited and The Law Debenture Trust Corporation p.l.c.(2) |
| 4.4 | Deed Poll Guarantee, dated 29 June 2001, of BHP Limited(2) |
| 4.5 | Deed Poll Guarantee, dated 29 June 2001, of Billiton Plc(2) |
*4.6 | Form of Service Agreement for Specified Executive (referred to in this Annual Report as the Key Management Personnel)(3) |
| 4.7 | BHP Billiton Ltd Group Incentive Scheme Rules 2004, dated August 2008(3)(4) |
| 4.8 | BHP Billiton Ltd Long Term Incentive Plan Rules, dated November 2010(1) |
| 4.9 | BHP Billiton Plc Group Incentive Scheme Rules 2004, dated August 2008(3)(4) |
| 4.10 | BHP Billiton Plc Long Term Incentive Plan Rules, dated November 2010(1) |
| 4.11 | Agreement and Plan of Merger by and among BHP Billiton Limited, BHP Billiton Petroleum (North America) Inc., North America Holdings II Inc. and Petrohawk Energy Corporation, dated 14 July 2011.2011 (4)(5) |
| *4.12 | Implementation Deed entered into on 17 March 2015 between BHP Billiton Ltd, BHP Billiton Plc and South32 Limited |
Exhibit 8 List of Subsidiaries
| *8.1 | List of subsidiaries of BHP Billiton Limited and BHP Billiton Plc |
Exhibit 12 Certifications (section 302)
| *12.1 | Certification by Chief Executive Officer, Mr Andrew Mackenzie, dated 2523 September 20132015 |
| *12.2 | Certification by Chief Financial Officer, Mr Graham Kerr,Peter Beaven, dated 2523 September 20132015 |
Exhibit 13 Certifications (section 906)
| *13.1 | Certification by Chief Executive Officer, Mr Andrew Mackenzie, dated 2523 September 20132015 |
| *13.2 | Certification by Chief Financial Officer, Mr Graham Kerr,Peter Beaven, dated 2523 September 20132015 |
Exhibit 15 Consent of Independent Registered Public Accounting Firm
| *15.1 | Consent of Independent Registered Public Accounting Firms KPMG and KPMG Audit Plc for incorporation by reference of audit reports in registration statements on Form F-3 and Form S-8 |
Exhibit 95 Mine Safety Health Administration
| *95.1 | Disclosure of Mine Safety and Health Administration (“MSHA”) Safety Data.Data |
Footnotes
| (1) | Previously filed as an exhibit to BHP Billiton’s annual report on Form 20-F for the year ended 30 June 2011 on 21 September 2011. |
| (2) | Previously filed as an exhibit to BHP Billiton’s annual report on Form 20-F for the year ended 30 June 2001 on 19 November 2001. |
| (3) | Previously filed as an exhibit to BHP Billiton’s annual report on Form 20-F for the year ended 30 June 2013 on 25 September 2013. |
| (4) | Previously filed as an exhibit to BHP Billiton’s annual report on Form 20-F for the year ended 30 June 2008 on 15 September 2008. |
(4)(5) | Previously filed as an exhibit to BHP Billiton Limited’s tender offer statement on schedule TO on 15 July 2011. |
SIGNATURE
The registrants hereby certify that they meet all of the requirements for filing on Form20-F and that they have duly caused and authorised the undersigned to sign this annual report on their behalf.
BHP Billiton Limited
BHP Billiton Plc
/s/ Graham KerrPeter Beaven
Graham KerrPeter Beaven
Chief Financial Officer
Date: 2523 September 20132015
97 Financial Statements
9.17.1 Consolidated Financial Statements
Comparative information for the years ended 30 June 2014 and 30 June 2013 has been restated for the effects of the application of IFRS 5/AASB 5 ‘Non-current Assets Held for Sale and Discontinued Operations’ following the demerger of South32. The Consolidated Statement of Comprehensive Income, the Consolidated Balance Sheet and the Consolidated Statement of Changes in Equity for these periods are not required to be restated.
9.1.17.1.1 Consolidated Income Statement for the year ended 30 June 20132015
| | | | Notes | | | 2013 | | 2012 | | 2011 | | | Notes | | 2015 | | 2014 | | 2013 | |
| | | | | | US$M | | US$M | | US$M | | | | | US$M | | US$M Restated | | US$M Restated | |
Continuing operations | | | | | | | | | |
Revenue | | | | | | | | | | | | | | | | |
Group production | | | | | 63,203 | | | | 68,747 | | | | 67,903 | | | | | | 43,457 | | | 55,045 | | | 52,637 | |
Third party products | | | 2 | | | | 2,765 | | | | 3,479 | | | | 3,836 | | | | 1 | | | | 1,179 | | | 1,717 | | | 1,223 | |
| | | | | | | | | | | | | | | | | | | | | | |
Revenue | | | 2 | | | | 65,968 | | | | 72,226 | | | | 71,739 | | | | 1 | | | | 44,636 | | | 56,762 | | | 53,860 | |
Other income | | | 4 | | | | 4,130 | | | | 906 | | | | 531 | | | | 5 | | | | 496 | | | 1,225 | | | 3,804 | |
Expenses excluding net finance costs | | | 5 | | | | (50,873 | ) | | | (49,380 | ) | | | (40,454 | ) | | | 3 | | | | (37,010 | ) | | (36,523 | ) | | (36,829 | ) |
Share of operating profit of equity accounted investments | | | | 31 | | | | 548 | | | 1,185 | | | 1,142 | |
| | | | | | | | | | | | | | | | | | | | | | |
Profit from operations | | | | | 19,225 | | | | 23,752 | | | | 31,816 | | | | | | 8,670 | | | 22,649 | | | 21,977 | |
| | | | | | | | | | | | | | | | | | | | | | |
Comprising: | | | | | | | | | | | | | | | | |
Group production | | | | | 19,104 | | | | 23,626 | | | | 31,718 | | | | | | 8,656 | | | 22,634 | | | 21,913 | |
Third party products | | | | | 121 | | | | 126 | | | | 98 | | | | | | 14 | | | 15 | | | 64 | |
| | | | | | | | | | | | | | | | | | | | | | |
| | | | | 19,225 | | | | 23,752 | | | | 31,816 | | | | | | 8,670 | | | 22,649 | | | 21,977 | |
| | | | | | | | | | | | | | | | | | | | | | |
Financial expenses | | | | | | (702 | ) | | (995 | ) | | (1,229 | ) |
Financial income | | | 6 | | | | 169 | | | | 225 | | | | 245 | | | | | | 88 | | | 81 | | | 80 | |
Financial expenses | | | 6 | | | | (1,522 | ) | | | (955 | ) | | | (806 | ) | |
| | | | | | | | | | | | | | | | | | | | | | |
Net finance costs | | | 6 | | | | (1,353 | ) | | | (730 | ) | | | (561 | ) | | | 16 | | | | (614 | ) | | (914 | ) | | (1,149 | ) |
| | | | | | | | | | | | | | | | | | | | | | |
Profit before taxation | | | | | 17,872 | | | | 23,022 | | | | 31,255 | | | | | | 8,056 | | | 21,735 | | | 20,828 | |
| | | | | | | | | | | | | | | | | | | | | | |
Income tax expense | | | 7 | | | | (5,641 | ) | | | (7,238 | ) | | | (6,481 | ) | | | | | (2,762 | ) | | (6,266 | ) | | (5,646 | ) |
Royalty-related taxation (net of income tax benefit) | | | 7 | | | | (1,156 | ) | | | (252 | ) | | | (828 | ) | | | | | (904 | ) | | (514 | ) | | (1,050 | ) |
| | | | | | | | | | | | | | | | | | | | | | |
Total taxation expense | | | 7 | | | | (6,797 | ) | | | (7,490 | ) | | | (7,309 | ) | | | 4 | | | | (3,666 | ) | | (6,780 | ) | | (6,696 | ) |
| | | | | | | | | | | | | | | | | | | | | | |
Profit after taxation | | | | | 11,075 | | | | 15,532 | | | | 23,946 | | |
Profit after taxation from Continuing operations | | | | | | 4,390 | | | 14,955 | | | 14,132 | |
| | | | | | | | | | | | |
Discontinued operations | | | | | | | | | |
(Loss)/profit after taxation from Discontinued operations | | | | 29 | | | | (1,512 | ) | | 269 | | | (1,312 | ) |
| | | | | | | | | | | | |
Profit after taxation from Continuing and Discontinued operations | | | | | | 2,878 | | | 15,224 | | | 12,820 | |
| | | | | | | | | | | | | | | | | | | | | | |
Attributable to non-controlling interests | | | | | 199 | | | | 115 | | | | 298 | | | | | | 968 | | | 1,392 | | | 1,597 | |
Attributable to members of BHP Billiton Group | | | | | 10,876 | | | | 15,417 | | | | 23,648 | | | | | | 1,910 | | | 13,832 | | | 11,223 | |
| | | | | | | | | | | | | | | | | | | | | | |
Earnings per ordinary share (basic) (US cents) | | | 8 | | | | 204.4 | | | | 289.6 | | | | 429.1 | | |
Earnings per ordinary share (diluted) (US cents) | | | 8 | | | | 203.7 | | | | 288.4 | | | | 426.9 | | |
Basic earnings from Continuing and Discontinued operations per ordinary share (cents) | | | | 6 | | | | 35.9 | | | 260.0 | | | 210.9 | |
Diluted earnings from Continuing and Discontinued operations per ordinary share (cents) | | | | 6 | | | | 35.8 | | | 259.1 | | | 210.2 | |
Basic earnings from Continuing operations per ordinary share (cents) | | | | 6 | | | | 65.5 | | | 256.5 | | | 238.6 | |
Diluted earnings from Continuing operations per ordinary share (cents) | | | | 6 | | | | 65.3 | | | 255.7 | | | 237.8 | |
| | | | | | | | | | | | | | | | | | | | | | |
Dividends per ordinary share – paid during the period (US cents) | | | 9 | | | | 114.0 | | | | 110.0 | | | | 91.0 | | |
Dividends per ordinary share – declared in respect of the period (US cents) | | | 9 | | | | 116.0 | | | | 112.0 | | | | 101.0 | | |
Dividends per ordinary share – paid during the period (cents) | | | | 19 | | | | 124.0 | | | 118.0 | | | 114.0 | |
Dividends per ordinary share – determined in respect of the period (cents) | | | | 19 | | | | 124.0 | | | 121.0 | | | 116.0 | |
| | | | | | | | | | | | | | | | | | | | | | |
The accompanying notes form part of these financial statements.
9.1.27.1.2 Consolidated Statement of Comprehensive Income for the year ended 30 June 20132015
| | | | Notes | | | 2013 | | 2012 | | 2011 | | | Notes | | | 2015 | | 2014 | | 2013 | |
| | | | | | US$M | | US$M | | US$M | | | | | | US$M | | US$M | | US$M | |
Profit after taxation | | | | | 11,075 | | | | 15,532 | | | | 23,946 | | |
Profit after taxation from Continuing and Discontinued operations | | | | | | 2,878 | | | 15,224 | | | 12,820 | |
Other comprehensive income | | | | | | | | | | | | | | | | |
Items that may be reclassified subsequently to the income statement: | | | | | | | | | | | | | | | | |
Available for sale investments: | | | | | | | | | | | | | | | | |
Net valuation losses taken to equity | | | | | (101 | ) | | | (32 | ) | | | (70 | ) | | | | | (21 | ) | | (15 | ) | | (101 | ) |
Net valuation gains transferred to the income statement | | | | | (1 | ) | | | (2 | ) | | | (47 | ) | | | | | (115 | ) | | (14 | ) | | (1 | ) |
Cash flow hedges: | | | | | | | | | | | | | | | | |
Gains/(losses) taken to equity | | | | | 223 | | | | (320 | ) | | | – | | |
Unrealised losses transferred to the income statement | | | | | 73 | | | | 205 | | | | – | | |
(Losses)/gains taken to equity | | | | | | (1,797 | ) | | 681 | | | 223 | |
Losses/(gains) transferred to the income statement | | | | | | 1,815 | | | (678 | ) | | 73 | |
Exchange fluctuations on translation of foreign operations taken to equity | | | | | 2 | | | | 19 | | | | 19 | | | | | | (2 | ) | | (1 | ) | | 2 | |
Tax recognised within other comprehensive income | | | 7 | | | | (76 | ) | | | 23 | | | | 37 | | | | 4 | | | | 29 | | | 3 | | | (76 | ) |
| | | | | | | | | | | | | | | | | | | | | | |
Total items that may be reclassified subsequently to the income statement | | | | | 120 | | | | (107 | ) | | | (61 | ) | | | | | (91 | ) | | (24 | ) | | 120 | |
| | | | | | | | | | | | | | | | | | | | | | |
Items that will not be reclassified to the income statement: | | | | | | | | | | | | | | | | |
Actuarial gains/(losses) on pension and medical schemes | | | | | 61 | | | | (250 | ) | | | (113 | ) | |
Remeasurement (losses)/gains on pension and medical schemes | | | | | | (28 | ) | | 57 | | | 61 | |
Tax recognised within other comprehensive income | | | 7 | | | | (16 | ) | | | 66 | | | | 83 | | | | 4 | | | | (17 | ) | | 12 | | | (16 | ) |
| | | | | | | | | | | | | | | | | | | | | | |
Total items that will not be reclassified to the income statement | | | | | 45 | | | | (184 | ) | | | (30 | ) | | | | | (45 | ) | | 69 | | | 45 | |
| | | | | | | | | | | | | | | | | | | | | | |
Total other comprehensive income/(loss) | | | | | 165 | | | | (291 | ) | | | (91 | ) | |
Total other comprehensive (loss)/income | | | | | | (136 | ) | | 45 | | | 165 | |
| | | | | | | | | | | | | | | | | | | | | | |
Total comprehensive income | | | | | 11,240 | | | | 15,241 | | | | 23,855 | | | | | | 2,742 | | | 15,269 | | | 12,985 | |
| | | | | | | | | | | | | | | | | | | | | | |
Attributable to non-controlling interests | | | | | 201 | | | | 117 | | | | 284 | | | | | | 973 | | | 1,392 | | | 1,599 | |
Attributable to members of BHP Billiton Group | | | | | 11,039 | | | | 15,124 | | | | 23,571 | | | | | | 1,769 | | | 13,877 | | | 11,386 | |
| | | | | | | | | | | | | | | | | | | | | | |
The accompanying notes form part of these financial statements.
9.1.37.1.3 Consolidated Balance Sheet as at 30 June 20132015
| | | | Notes | | | 2013 | | 2012 | | | Notes | | | 2015 | | 2014 | |
| | | | | | US$M | | US$M | | | | | | US$M | | US$M | |
ASSETS | | | | | | | | | | | | |
Current assets | | | | | | | | | | | | |
Cash and cash equivalents | | | 23 | | | | 6,060 | | | | 4,781 | | | | 7 | | | | 6,753 | | | 8,803 | |
Trade and other receivables | | | 10 | | | | 6,728 | | | | 7,704 | | | | 8 | | | | 4,321 | | | 6,741 | |
Other financial assets | | | 11 | | | | 159 | | | | 282 | | | | 21 | | | | 83 | | | 87 | |
Inventories | | | 12 | | | | 5,822 | | | | 6,233 | | | | 10 | | | | 4,292 | | | 6,013 | |
Assets held for sale | | | 25 | | | | 286 | | | | 848 | | |
Current tax assets | | | | | 327 | | | | 137 | | | | | | 658 | | | 318 | |
Other | | | | | 404 | | | | 466 | | | | | | 262 | | | 334 | |
| | | | | | | | | | | | | | | | |
Total current assets | | | | | 19,786 | | | | 20,451 | | | | | | 16,369 | | | 22,296 | |
| | | | | | | | | | | | | | | | |
Non-current assets | | | | | | | | | | | | |
Trade and other receivables | | | 10 | | | | 1,579 | | | | 1,475 | | | | 8 | | | | 1,499 | | | 1,867 | |
Other financial assets | | | 11 | | | | 1,698 | | | | 1,881 | | | | 21 | | | | 1,159 | | | 2,349 | |
Inventories | | | 12 | | | | 622 | | | | 424 | | | | 10 | | | | 466 | | | 463 | |
Property, plant and equipment | | | 13 | | | | 102,927 | | | | 95,247 | | | | 11 | | | | 94,072 | | | 108,787 | |
Intangible assets | | | 14 | | | | 5,226 | | | | 5,112 | | | | 12 | | | | 4,292 | | | 5,439 | |
Investments accounted for using the equity method | | | | 31 | | | | 3,712 | | | 3,664 | |
Deferred tax assets | | | 7 | | | | 6,136 | | | | 4,525 | | | | 13 | | | | 2,861 | | | 6,396 | |
Other | | | | | 135 | | | | 158 | | | | | | 150 | | | 152 | |
| | | | | | | | | | | | | | | | |
Total non-current assets | | | | | 118,323 | | | | 108,822 | | | | | | 108,211 | | | 129,117 | |
| | | | | | | | | | | | | | | | |
Total assets | | | | | 138,109 | | | | 129,273 | | | | | | 124,580 | | | 151,413 | |
| | | | | | | | | | | | | | | | |
LIABILITIES | | | | | | | | | | | | |
Current liabilities | | | | | | | | | | | | |
Trade and other payables | | | 15 | | | | 10,881 | | | | 12,024 | | | | 9 | | | | 7,389 | | | 10,145 | |
Interest bearing liabilities | | | 16 | | | | 5,303 | | | | 3,531 | | | | 15 | | | | 3,201 | | | 4,262 | |
Liabilities held for sale | | | 25 | | | | 220 | | | | 433 | | |
Other financial liabilities | | | 17 | | | | 217 | | | | 200 | | | | 22 | | | | 251 | | | 16 | |
Current tax payable | | | | | 1,148 | | | | 2,811 | | | | | | 207 | | | 919 | |
Provisions | | | 18 | | | | 2,395 | | | | 2,784 | | | | 14, 20, 26 | | | | 1,676 | | | 2,504 | |
Deferred income | | | | | 208 | | | | 251 | | | | | | 129 | | | 218 | |
| | | | | | | | | | | | | | | | |
Total current liabilities | | | | | 20,372 | | | | 22,034 | | | | | | 12,853 | | | 18,064 | |
| | | | | | | | | | | | | | | | |
Non-current liabilities | | | | | | | | | | | | |
Trade and other payables | | | 15 | | | | 293 | | | | 509 | | | | 9 | | | | 29 | | | 113 | |
Interest bearing liabilities | | | 16 | | | | 29,862 | | | | 24,799 | | | | 15 | | | | 27,969 | | | 30,327 | |
Other financial liabilities | | | 17 | | | | 582 | | | | 317 | | | | 22 | | | | 1,031 | | | 303 | |
Deferred tax liabilities | | | 7 | | | | 6,469 | | | | 5,287 | | | | 13 | | | | 4,542 | | | 7,066 | |
Provisions | | | 18 | | | | 8,237 | | | | 8,914 | | | | 14, 20, 26 | | | | 7,306 | | | 9,891 | |
Deferred income | | | | | 259 | | | | 328 | | | | | | 305 | | | 267 | |
| | | | | | | | | | | | | | | | |
Total non-current liabilities | | | | | 45,702 | | | | 40,154 | | | | | | 41,182 | | | 47,967 | |
| | | | | | | | | | | | | | | | |
Total liabilities | | | | | 66,074 | | | | 62,188 | | | | | | 54,035 | | | 66,031 | |
| | | | | | | | | | | | | | | | |
Net assets | | | | | 72,035 | | | | 67,085 | | | | | | 70,545 | | | 85,382 | |
| | | | | | | | | | | | | | | | |
EQUITY | | | | | | | | | | | | |
Share capital – BHP Billiton Limited | | | 19 | | | | 1,186 | | | | 1,186 | | | | 17 | | | | 1,186 | | | 1,186 | |
Share capital – BHP Billiton Plc | | | 19 | | | | 1,069 | | | | 1,069 | | | | 17 | | | | 1,057 | | | 1,069 | |
Treasury shares | | | 19 | | | | (540 | ) | | | (533 | ) | | | 17 | | | | (76 | ) | | (587 | ) |
Reserves | | | 20 | | | | 1,970 | | | | 1,912 | | | | 18 | | | | 2,557 | | | 2,927 | |
Retained earnings | | | 20 | | | | 66,979 | | | | 62,236 | | | | 18 | | | | 60,044 | | | 74,548 | |
| | | | | | | | | | | | | | | | |
Total equity attributable to members of BHP Billiton Group | | | | | 70,664 | | | | 65,870 | | | | | | 64,768 | | | 79,143 | |
Non-controlling interests | | | 20 | | | | 1,371 | | | | 1,215 | | | | 18 | | | | 5,777 | | | 6,239 | |
| | | | | | | | | | | | | | | | |
Total equity | | | | | 72,035 | | | | 67,085 | | | | | | 70,545 | | | 85,382 | |
| | | | | | | | | | | | | | | | |
The accompanying notes form part of these financial statements.
The financial statements were approved by the Board of Directors on 1210 September 20132015 and signed on its behalf by:
| | |
Jac Nasser AO | | Andrew Mackenzie |
Chairman | | Chief Executive Officer |
9.1.47.1.4 Consolidated Cash Flow Statement for the year ended 30 June 20132015
| | | | Notes | | | 2013 | | 2012 | | 2011 | | | Notes | | | 2015 | | 2014 | | 2013 | |
| | | | | | US$M | | US$M | | US$M | | | | | | US$M | | US$M Restated | | US$M
Restated | |
Operating activities | | | | | | | | | | | | | | | | |
Profit before taxation | | | | | 17,872 | | | 23,022 | | | 31,255 | | |
Profit before taxation from Continuing operations | | | | | | 8,056 | | | 21,735 | | | 20,828 | |
Adjustments for: | | | | | | | | | | | | | | | | |
Non-cash exceptional items | | | | | 1,867 | | | 3,417 | | | (150 | ) | |
Non-cash or non-operating exceptional items | | | | | | 3,196 | | | (551 | ) | | (331 | ) |
Depreciation and amortisation expense | | | | | 6,945 | | | 6,408 | | | 5,039 | | | | | | 9,158 | | | 7,716 | | | 6,067 | |
Net gain on sale of non-current assets | | | | | (46 | ) | | (116 | ) | | (41 | ) | | | | | (9 | ) | | (73 | ) | | (17 | ) |
Impairments of property, plant and equipment, financial assets and intangibles | | | | | 311 | | | 100 | | | 74 | | | | | | 828 | | | 478 | | | 344 | |
Employee share awards expense | | | | | 210 | | | 270 | | | 266 | | | | | | 247 | | | 247 | | | 210 | |
Financial income and expenses | | | | | 1,353 | | | 730 | | | 561 | | |
Net finance costs | | | | | | 614 | | | 914 | | | 1,149 | |
Share of operating profit of equity accounted investments | | | | | | (548 | ) | | (1,185 | ) | | (1,142 | ) |
Other | | | | | (344 | ) | | (481 | ) | | (384 | ) | | | | | 265 | | | (79 | ) | | 5 | |
Changes in assets and liabilities: | | | | | | | | | | | | | | | | |
Trade and other receivables | | | | | 780 | | | 1,464 | | | (1,960 | ) | | | | | 1,431 | | | (349 | ) | | 904 | |
Inventories | | | | | (47 | ) | | (208 | ) | | (792 | ) | | | | | 151 | | | (158 | ) | | (276 | ) |
Trade and other payables | | | | | (557 | ) | | (288 | ) | | 2,780 | | | | | | (990 | ) | | 238 | | | (239 | ) |
Net other financial assets and liabilities | | | | | 122 | | | (18 | ) | | 46 | | | | | | (8 | ) | | (90 | ) | | 89 | |
Provisions and other liabilities | | | | | (817 | ) | | (1,026 | ) | | 387 | | | | | | (771 | ) | | 475 | | | (565 | ) |
| | | | | | | | | | | | | | | | | | | | | | |
Cash generated from operations | | | | | 27,649 | | | 33,274 | | | 37,081 | | | | | | 21,620 | | | 29,318 | | | 27,026 | |
Dividends received | | | | | 13 | | | 25 | | | 12 | | | | | | 17 | | | 14 | | | 6 | |
Dividends received from equity accounted investments | | | | | | 723 | | | 1,250 | | | 710 | |
Interest received | | | | | 79 | | | 127 | | | 107 | | | | | | 86 | | | 120 | | | 112 | |
Interest paid | | | | | (963 | ) | | (715 | ) | | (562 | ) | | | | | (627 | ) | | (915 | ) | | (960 | ) |
Income tax refunded | | | | | – | | | 530 | | | 74 | | | | | | 348 | | | 848 | | | | – | |
Income tax paid | | | | | (7,589 | ) | | (7,842 | ) | | (6,025 | ) | | | | | (3,225 | ) | | (6,123 | ) | | (6,921 | ) |
Royalty-related taxation refunded | | | | | | – | | | 216 | | | | – | |
Royalty-related taxation paid | | | | | (937 | ) | | (1,015 | ) | | (607 | ) | | | | | (1,148 | ) | | (1,088 | ) | | (956 | ) |
| | | | | | | | | | | | |
Net operating cash flows from Continuing operations | | | | | | 17,794 | | | 23,640 | | | 19,017 | |
| | | | | | | | | | | | |
Net operating cash flows from Discontinued operations | | | | | | 1,502 | | | 1,724 | | | 1,137 | |
| | | | | | | | | | | | | | | | | | | | | | |
Net operating cash flows | | | | | 18,252 | | | 24,384 | | | 30,080 | | | | | | 19,296 | | | 25,364 | | | 20,154 | |
| | | | | | | | | | | | | | | | | | | | | | |
Investing activities | | | | | | | | | | | | | | | | |
Purchases of property, plant and equipment | | | | | (21,573 | ) | | (18,385 | ) | | (11,147 | ) | | | | | (11,947 | ) | | (15,224 | ) | | (21,104 | ) |
Exploration expenditure | | | | | (1,326 | ) | | (2,452 | ) | | (1,240 | ) | | | | | (816 | ) | | (986 | ) | | (1,321 | ) |
Exploration expenditure expensed and included in operating cash flows | | | | | 1,022 | | | 1,602 | | | 981 | | | | | | 670 | | | 698 | | | 1,026 | |
Purchase of intangibles | | | | | (400 | ) | | (220 | ) | | (211 | ) | | | | | (98 | ) | | (192 | ) | | (380 | ) |
Investment in financial assets | | | | | (338 | ) | | (341 | ) | | (238 | ) | | | | | (15 | ) | | (1,168 | ) | | (455 | ) |
Investment in subsidiaries, operations and jointly controlled entities, net of their cash | | | | | – | | | (12,556 | ) | | (4,807 | ) | |
Investment in equity accounted investments | | | | | | (71 | ) | | (44 | ) | | (84 | ) |
| | | | | | | | | | | | | | | | | | | | | | |
Cash outflows from investing activities | | | | | (22,615 | ) | | (32,352 | ) | | (16,662 | ) | | | | | (12,277 | ) | | (16,916 | ) | | (22,318 | ) |
Proceeds from sale of property, plant and equipment | | | | | 2,338 | | | 159 | | | 80 | | | | | | 66 | | | 66 | | | 2,274 | |
Proceeds from sale of intangibles | | | | | | 8 | | | | – | | | | – | |
Proceeds from financial assets | | | | | 204 | | | 151 | | | 118 | | | | | | 445 | | | 904 | | | 221 | |
Proceeds from divestment of subsidiaries, operations and jointly controlled entities, net of their cash | | | | | 2,202 | | | 6 | | | – | | |
Proceeds from divestment of subsidiaries, operations and joint operations, net of their cash | | | | | | 256 | | | 812 | | | 502 | |
Proceeds from sale or partial sale of equity accounted investments | | | | | | – | | | | – | | | 1,700 | |
| | | | | | | | | | | | |
Net investing cash flows from Continuing operations | | | | | | (11,502 | ) | | (15,134 | ) | | (17,621 | ) |
| | | | | | | | | | | | |
Net investing cash flows from Discontinued operations | | | | | | (1,066 | ) | | (700 | ) | | (1,105 | ) |
| | | | | | | | | | | | |
Cash disposed on demerger of South32 | | | | | | (586 | ) | | | – | | | | – | |
| | | | | | | | | | | | | | | | | | | | | | |
Net investing cash flows | | | | | (17,871 | ) | | (32,036 | ) | | (16,464 | ) | | | | | (13,154 | ) | | (15,834 | ) | | (18,726 | ) |
| | | | | | | | | | | | | | | | | | | | | | |
Financing activities | | | | | | | | | | | | | | | | |
Proceeds from interest bearing liabilities | | | | | 9,961 | | | 13,287 | | | 1,374 | | | | | | 3,440 | | | 6,000 | | | 9,143 | |
Proceeds/(settlements) from debt related instruments | | | | | 14 | | | (180 | ) | | 222 | | |
(Settlements)/proceeds from debt related instruments | | | | | | (33 | ) | | 37 | | | 14 | |
Repayment of interest bearing liabilities | | | | | (2,580 | ) | | (4,280 | ) | | (2,173 | ) | | | | | (4,135 | ) | | (7,048 | ) | | (1,902 | ) |
Proceeds from ordinary shares | | | | | 21 | | | 21 | | | 32 | | | | | | 9 | | | 14 | | | 12 | |
Contributions from non-controlling interests | | | | | 73 | | | 101 | | | – | | | | | | 53 | | | 1,435 | | | 73 | |
Purchase of shares by Employee Share Ownership Plan (ESOP) Trusts | | | | | (445 | ) | | (424 | ) | | (469 | ) | | | | | (355 | ) | | (368 | ) | | (445 | ) |
Share buy-back – BHP Billiton Limited | | | | | – | | | – | | | (6,265 | ) | |
Share buy-back – BHP Billiton Plc | | | | | – | | | (83 | ) | | (3,595 | ) | |
Dividends paid | | | | | (6,167 | ) | | (5,877 | ) | | (5,054 | ) | | | | | (6,498 | ) | | (6,387 | ) | | (6,167 | ) |
Dividends paid to non-controlling interests | | | | | (55 | ) | | (56 | ) | | (90 | ) | | | | | (554 | ) | | (119 | ) | | (778 | ) |
| | | | | | | | | | | | | | | | | | | | | | |
Net financing cash flows from Continuing operations | | | | | | (8,073 | ) | | (6,436 | ) | | (50 | ) |
| | | | | | | | | | | | |
Net financing cash flows from Discontinued operations | | | | | | (203 | ) | | (32 | ) | | (148 | ) |
| | | | | | | | | | | | |
Net financing cash flows | | | | | 822 | | | 2,509 | | | (16,018 | ) | | | | | (8,276 | ) | | (6,468 | ) | | (198 | ) |
| | | | | | | | | | | | | | | | | | | | | | |
Net increase/(decrease) in cash and cash equivalents | | | | | 1,203 | | | (5,143 | ) | | (2,402 | ) | |
Net (decrease)/increase in cash and cash equivalents from Continuing operations | | | | | | (1,781 | ) | | 2,070 | | | 1,346 | |
Net increase/(decrease) in cash and cash equivalents from Discontinued operations | | | | | | 233 | | | 992 | | | (116 | ) |
Cash and cash equivalents, net of overdrafts, at the beginning of the financial year | | | | | 4,881 | | | 10,080 | | | 12,455 | | | | | | 8,752 | | | 5,667 | | | 4,454 | |
Effect of foreign currency exchange rate changes on cash and cash equivalents | | | | | (34 | ) | | (56 | ) | | 27 | | |
Cash disposed on demerger of South32 | | | | | | (586 | ) | | | – | | | | – | |
Foreign currency exchange rate changes on cash and cash equivalents | | | | | | (5 | ) | | 23 | | | (17 | ) |
| | | | | | | | | | | | | | | | | | | | | | |
Cash and cash equivalents, net of overdrafts, at the end of the financial year | | | 23 | | | | 6,050 | | | 4,881 | | | 10,080 | | | | 7 | | | | 6,613 | | | 8,752 | | | 5,667 | |
| | | | | | | | | | | | | | | | | | | | | | |
The accompanying notes form part of these financial statements.
9.1.57.1.5 Consolidated Statement of Changes in Equity for the year ended 30 June 20132015
| | | | Attributable to members of the BHP Billiton Group | | | | | | | Attributable to members of BHP Billiton Group | |
| | | Share capital | | | | | | | | | | | | | | | Share capital | | Treasury
shares | | Reserves | | Retained
earnings | | Total equity
attributable
to members
of BHP
Billiton
Group | | Non-
controlling
interests | | Total
equity |
| | | BHP
Billiton
Limited | | BHP
Billiton
Plc | | Treasury
shares | | Reserves | | Retained
earnings | | Total | | Non-
controlling
interests | | Total
equity | | |
| | | US$M | | |
Balance as at 1 July 2012 | | | 1,186 | | | | 1,069 | | | | (533 | ) | | | 1,912 | | | | 62,236 | | | | 65,870 | | | | 1,215 | | | | 67,085 | | |
US$M | | | BHP
Billiton
Limited | | BHP
Billiton
Plc | | Treasury
shares | | Reserves | | Retained
earnings | | Total equity
attributable
to members
of BHP
Billiton
Group | | Non-
controlling
interests | | Total
equity |
Balance as at 1 July 2014 | | | 1,186 | | 1,069 | |
Total comprehensive income | | | – | | | | – | | | | – | | | | 77 | | | | 10,962 | | | | 11,039 | | | | 201 | | | | 11,240 | | | – | | – | | – | | (96) | | 1,865 | | 1,769 | | 973 | | 2,742 |
Transactions with owners: | | | | | | | | | | | | | | | | | | | | | | | | | | | | |
Shares cancelled | | | – | | (12) | | 501 | | 12 | | (501) | | – | | – | | – |
Purchase of shares by ESOP Trusts | | | – | | | | – | | | | (445 | ) | | | – | | | | – | | | | (445 | ) | | | – | | | | (445 | ) | | – | | – | | (355) | | – | | – | | (355) | | – | | (355) |
Employee share awards exercised net of employee contributions | | | – | | | | – | | | | 438 | | | | (243 | ) | | | (178 | ) | | | 17 | | | | – | | | | 17 | | |
Employee share awards exercised net of employee contributions and other adjustments | | | – | | – | | 363 | | (461) | | 101 | | 3 | | – | | 3 |
Employee share awards forfeited | | | – | | | | – | | | | – | | | | (17 | ) | | | 17 | | | | – | | | | – | | | | – | | | – | | – | | – | | (13) | | 13 | | – | | – | | – |
Accrued employee entitlement for unexercised awards | | | – | | | | – | | | | – | | | | 210 | | | | – | | | | 210 | | | | – | | | | 210 | | | – | | – | | – | | 247 | | – | | 247 | | – | | 247 |
Issue of share options tonon-controlling interests | | | – | | | | – | | | | – | | | | 49 | | | | – | | | | 49 | | | | – | | | | 49 | | |
Distribution to option holders | | | – | | – | | – | | (1) | | – | | (1) | | (1) | | (2) |
Dividends | | | – | | | | – | | | | – | | | | – | | | | (6,076 | ) | | | (6,076 | ) | | | (55 | ) | | | (6,131 | ) | | – | | – | | – | | – | | (6,596) | | (6,596) | | (639) | | (7,235) |
In-specie dividend on demerger – refer to note 29 ‘Discontinued operations’ | | | – | | – | | – | | – | | (9,445) | | (9,445) | | – | | (9,445) |
Equity contributed | | | – | | | | – | | | | – | | | | – | | | | – | | | | – | | | | 73 | | | | 73 | | | – | | – | | – | | 1 | | – | | 1 | | 52 | | 53 |
Divestment of jointly controlled entities | | | – | | | | – | | | | – | | | | (18 | ) | | | 18 | | | | – | | | | (63 | ) | | | (63 | ) | |
Transfers within equity on demerger | | | – | | – | | – | | (59) | | 59 | | – | | – | | – |
Conversion of controlled entities to equity accounted investments | | | – | | – | | 2 | | – | | – | | 2 | | (847) | | (845) |
| | | | | | | | | | | | | | | | | | | | | | | | | | | | | | | | | | | | | | | | |
Balance as at 30 June 2013 | | | 1,186 | | | | 1,069 | | | | (540 | ) | | | 1,970 | | | | 66,979 | | | | 70,664 | | | | 1,371 | | | | 72,035 | | |
Balance as at 30 June 2015 | | | 1,186 | | 1,057 | | (76) | | 2,557 | | 60,044 | | 64,768 | | 5,777 | | 70,545 |
| | | | | | | | | | | | | | | | | | | | | | | | | | | | | | | | | | | | | | | | |
Balance as at 1 July 2011 | | | 1,183 | | | | 1,070 | | | | (623 | ) | | | 2,001 | | | | 53,131 | | | | 56,762 | | | | 993 | | | | 57,755 | | |
Total comprehensive income | | | – | | | | – | | | | – | | | | (163 | ) | | | 15,287 | | | | 15,124 | | | | 117 | | | | 15,241 | | |
Transactions with owners: | | | | | | | | | | | | | | | | | |
Proceeds from the issue of shares | | | 3 | | | | – | | | | – | | | | – | | | | – | | | | 3 | | | | – | | | | 3 | | |
BHP Billiton Plc shares cancelled | | | – | | | | (1 | ) | | | 83 | | | | 1 | | | | (83 | ) | | | – | | | | – | | | | – | | |
Purchase of shares by ESOP Trusts | | | – | | | | – | | | | (424 | ) | | | – | | | | – | | | | (424 | ) | | | – | | | | (424 | ) | |
Employee share awards exercised net of employee contributions | | | – | | | | – | | | | 431 | | | | (189 | ) | | | (213 | ) | | | 29 | | | | – | | | | 29 | | |
Employee share awards forfeited | | | – | | | | – | | | | – | | | | (8 | ) | | | 8 | | | | – | | | | – | | | | – | | |
Accrued employee entitlement for unexercised awards | | | – | | | | – | | | | – | | | | 270 | | | | – | | | | 270 | | | | – | | | | 270 | | |
Dividends | | | – | | | | – | | | | – | | | | – | | | | (5,894 | ) | | | (5,894 | ) | | | (56 | ) | | | (5,950 | ) | |
Equity contributed | | | – | | | | – | | | | – | | | | – | | | | – | | | | – | | | | 161 | | | | 161 | | |
| �� | | | | | | | | | | | | | | | | | | | | | | | | |
Balance as at 30 June 2012 | | | 1,186 | | | | 1,069 | | | | (533 | ) | | | 1,912 | | | | 62,236 | | | | 65,870 | | | | 1,215 | | | | 67,085 | | |
| | | | | | | | | | | | | | | | | | | | | | | | | |
| | | | Attributable to members of the BHP Billiton Group | | | | | | | Attributable to members of BHP Billiton Group | |
| | | Share capital | | | | | | | | | | | | | | | Share capital | | Treasury
shares | | Reserves | | Retained
earnings | | Total equity
attributable
to members
of BHP
Billiton
Group | | Non-
controlling
interests | | Total
equity |
| | | BHP
Billiton
Limited | | BHP
Billiton
Plc | | Treasury
shares | | Reserves | | Retained
earnings | | Total | | Non-
controlling
interests | | Total
equity | | |
| | | US$M | | |
Balance as at 1 July 2010 | | | 1,227 | | | | 1,116 | | | | (525 | ) | | | 1,906 | | | | 44,801 | | | | 48,525 | | | | 804 | | | | 49,329 | | |
US$M | | | BHP
Billiton
Limited | | BHP
Billiton
Plc | | Treasury
shares | | Reserves | | Retained
earnings | | Total equity
attributable
to members
of BHP
Billiton
Group | | Non-
controlling
interests | | Total
equity |
Balance as at 1 July 2013 | | | 1,186 | | 1,069 | |
Total comprehensive income | | | – | | | | – | | | | – | | | | (66 | ) | | | 23,637 | | | | 23,571 | | | | 284 | | | | 23,855 | | | – | | – | | – | | (24) | | 13,901 | | 13,877 | | 1,392 | | 15,269 |
Transactions with owners: | | | | | | | | | | | | | | | | | | | | | | | | | | | | |
BHP Billiton Limited shares bought back and cancelled | | | (44 | ) | | | – | | | | – | | | | – | | | | (6,301 | ) | | | (6,345 | ) | | | – | | | | (6,345 | ) | |
BHP Billiton Plc shares bought back | | | – | | | | – | | | | (3,678 | ) | | | – | | | | – | | | | (3,678 | ) | | | – | | | | (3,678 | ) | |
BHP Billiton Plc shares cancelled | | | – | | | | (46 | ) | | | 3,595 | | | | 46 | | | | (3,595 | ) | | | – | | | | – | | | | – | | |
Purchase of shares by ESOP Trusts | | | – | | | | – | | | | (469 | ) | | | – | | | | – | | | | (469 | ) | | | – | | | | (469 | ) | | – | | – | | (368) | | – | | – | | (368) | | – | | (368) |
Employee share awards exercised net of employee contributions | | | – | | | | – | | | | 454 | | | | (121 | ) | | | (294 | ) | | | 39 | | | | – | | | | 39 | | | – | | – | | 321 | | (221) | | (91) | | 9 | | – | | 9 |
Employee share awards forfeited | | | – | | | | – | | | | – | | | | (9 | ) | | | 9 | | | | – | | | | – | | | | – | | | – | | – | | – | | (32) | | 32 | | – | | – | | – |
Accrued employee entitlement for unexercised awards | | | – | | | | – | | | | – | | | | 266 | | | | – | | | | 266 | | | | – | | | | 266 | | | – | | – | | – | | 247 | | – | | 247 | | – | | 247 |
Distribution to option holders | | | – | | | | – | | | | – | | | | (21 | ) | | | – | | | | (21 | ) | | | (17 | ) | | | (38 | ) | | – | | – | | – | | (2) | | – | | (2) | | (2) | | (4) |
Dividends | | | – | | | | – | | | | – | | | | – | | | | (5,126 | ) | | | (5,126 | ) | | | (90 | ) | | | (5,216 | ) | | – | | – | | – | | – | | (6,276) | | (6,276) | | (252) | | (6,528) |
Equity contributed | | | – | | | | – | | | | – | | | | – | | | | – | | | | – | | | | 12 | | | | 12 | | | – | | – | | – | | 989 | | – | | 989 | | 477 | | 1,466 |
| | | | | | | | | | | | | | | | | | | | | | | | | | | | | | | | | | | | | | | | |
Balance as at 30 June 2011 | | | 1,183 | | | | 1,070 | | | | (623 | ) | | | 2,001 | | | | 53,131 | | | | 56,762 | | | | 993 | | | | 57,755 | | |
Balance as at 30 June 2014 | | | 1,186 | | 1,069 | | (587) | | 2,927 | | 74,548 | | 79,143 | | 6,239 | | 85,382 |
| | | | | | | | | | | | | | | | | | | | | | | | | | | | | | | | | | | | | | | | |
| | | | | | | | | | | | | | | | | |
Balance as at 1 July 2012 | | | 1,186 | | 1,069 | | (533) | | 1,912 | | 61,892 | | 65,526 | | 3,789 | | 69,315 |
Total comprehensive income | | | – | | – | | – | | 77 | | 11,309 | | 11,386 | | 1,599 | | 12,985 |
Transactions with owners: | | | | | | | | | | | | | | | |
Purchase of shares by ESOP Trusts | | | – | | – | | (445) | | – | | – | | (445) | | – | | (445) |
Employee share awards exercised net of employee contributions | | | – | | – | | 438 | | (243) | | (178) | | 17 | | – | | 17 |
Employee share awards forfeited | | | – | | – | | – | | (17) | | 17 | | – | | – | | – |
Accrued employee entitlement for unexercised awards | | | – | | – | | – | | 210 | | – | | 210 | | – | | 210 |
Issue of share options to non-controlling interests | | | – | | – | | – | | 49 | | – | | 49 | | – | | 49 |
Dividends | | | – | | – | | – | | – | | (6,076) | | (6,076) | | (837) | | (6,913) |
Equity contributed | | | – | | – | | – | | – | | – | | – | | 73 | | 73 |
Divestment of equity accounted investment | | | – | | – | | – | | (18) | | 18 | | – | | – | | – |
| | | | | | | | | | | | | | | | | |
Balance as at 30 June 2013 | | | 1,186 | | 1,069 | | (540) | | 1,970 | | 66,982 | | 70,667 | | 4,624 | | 75,291 |
| | | | | | | | | | | | | | | | | |
The accompanying notes form part of these financial statements.
9.1.67.1.6 Notes to Financial Statements
1 Accounting policies
Dual Listed Companies’ structure and basis of preparation of financial statements
Merger terms
On 29 June 2001, BHP Billiton Limited (previously known as BHP Limited), an Australian listed company, and BHP Billiton Plc (previously known as Billiton Plc), a United Kingdom (UK) listed company, entered into a Dual Listed Company (DLC) merger. This was effected by contractual arrangements between the Companies and amendments to their constitutional documents.
The effect of the DLC merger is that BHP Billiton Limited and its subsidiaries (the BHP Billiton Limited Group) and BHP Billiton Plc and its subsidiaries (the BHP Billiton Plc Group) operate together as a single economic entity (the Group). Under the arrangements:
the shareholders of BHP Billiton Limited and BHP Billiton Plc have a common economic interest in both Groups;
the shareholders of BHP Billiton Limited and BHP Billiton Plc take key decisions, including the election of Directors, through a joint electoral procedure under which the shareholders of the two Companies effectively vote on a joint basis;
BHP Billiton Limited and BHP Billiton Plc have a common Board of Directors, a unified management structure and joint objectives;
dividends and capital distributions made by the two Companies are equalised;
BHP Billiton Limited and BHP Billiton Plc each executed a deed poll guarantee, guaranteeing (subject to certain exceptions) the contractual obligations (whether actual or contingent, primary or secondary) of the other incurred after 29 June 2001 together with specified obligations existing at that date.
If either BHP Billiton Limited or BHP Billiton Plc proposes to pay a dividend to its shareholders, then the other Company must pay a matching cash dividend of an equivalent amount per share to its shareholders. If either Company is prohibited by law or is otherwise unable to declare, pay or otherwise make all or any portion of such a matching dividend, then BHP Billiton Limited or BHP Billiton Plc will, so far as it is practicable to do so, enter into such transactions with each other as the Boards agree to be necessary or desirable so as to enable both Companies to pay dividends as nearly as practicable at the same time.
The DLC merger did not involve the change of legal ownership of any assets of BHP Billiton Limited or BHP Billiton Plc, any change of ownership of any existing shares or securities of BHP Billiton Limited or BHP Billiton Plc, the issue of any shares or securities or any payment by way of consideration, save for the issue by each Company of one special voting share to a trustee company which is the means by which the joint electoral procedure is operated.
Accounting for the DLC merger
The basis of accounting for the DLC merger was established under Australian and UK Generally Accepted Accounting Practice (GAAP), pursuant to the requirements of the Australian Securities and Investments Commission (ASIC) Practice Note 71 ‘Financial Reporting by Australian Entities in Dual Listed Company Arrangements’, an order issued by ASIC under section 340 of the Corporations Act 2001 on 2 September 2002, and in accordance with the UK Companies Act 1985. In accordance with the transitional provisions of IFRS 1/AASB 1 ‘First-time Adoption of International Financial Reporting Standards’, the same basis of accounting is
applied under International Financial Reporting Standards. Accordingly, these financial statements consolidate the Group as follows:
Assets and liabilities of the BHP Billiton Limited Group and the BHP Billiton Plc Group were consolidated at the date of the merger at their existing carrying amounts.
Results for the years ended 30 June 2013, 30 June 2012 and 30 June 2011 are of the consolidated entity comprising the BHP Billiton Limited Group and the BHP Billiton Plc Group.
Basis of preparationPerformance
This general purpose financial report for the year ended 30 June 2013 has been prepared on a going concern basis and in accordance with the requirements of the Australian Corporations Act 2001 and the UK Companies Act 2006 and with:
Australian Accounting Standards, being Australian equivalents to International Financial Reporting Standards and interpretations as issued by the Australian Accounting Standards Board (AASB) effective as of 30 June 2013;
International Financial Reporting Standards and interpretations as adopted by the European Union (EU) effective as of 30 June 2013;
International Financial Reporting Standards and interpretations as issued by the International Accounting Standards Board effective as of 30 June 2013.
The above accounting standards and interpretations are collectively referred to as ‘IFRS’ in this report.
There were no significant impacts arising from accounting standards or interpretations adopted for the first time in these financial statements.
The following new accounting standards and interpretation are not yet effective but will have an impact on the Group in financial years commencing from 1 July 2013:
IFRS 10/AASB 10 ‘Consolidated Financial Statements’ is a replacement of IAS 27/AASB 127 ‘Consolidated and Separate Financial Statements’. The revised standard introduces a modified single concept of control that applies to all entities. It changes the requirements for determining whether an entity is consolidated by revising the definition of control and adding further guiding principles.
A review of all entities and contractual arrangements in the Group which are less than 100 per cent owned, currently proportionately consolidated, or currently accounted for as joint operations or assets has been completed to assess the impact of IFRS 10 on the Group. That review determined that Minera Escondida Limitada (Escondida) will be controlled by the Group under IFRS 10 and consolidated into the results of the Group from 1 July 2013. Accordingly, the Group will no longer recognise its 57.5 per cent share of Escondida’s assets, liabilities, revenue, expenses and cash flows, but will recognise 100 per cent of Escondida’s revenue, expenses, assets, liabilities and cash flows and a 42.5 per cent non-controlling interest in Escondida’s profit and net assets. No other entities which are not currently consolidated under IAS 27 have been determined to be controlled under IFRS 10.
The Group is currently in the process of determining the adjustments to be recognised at the transition date of 1 July 2011 and to the comparative periods ended 30 June 2012 and 30 June 2013 upon consolidation of Escondida.
IFRS 11/AASB 11 ‘Joint Arrangements’ modifies the accounting for joint arrangements in two ways:
It changes the definition of joint control with reference to the definition of unanimous consent (the contractually agreed sharing of control of an arrangement with reference to voting on relevant
| activities). Arrangements which do not fall within this definition are beyond the scope of IFRS 11 and will be accounted for under other IFRS.
|
For those entities within the scope of IFRS 11, a distinction is made between joint ventures and joint operations based on the rights and obligations of the parties arising from the arrangement in the normal course of business. Entities for which it is determined the Group has rights only to the net assets of the arrangement are classified as ‘joint ventures’ and are equity accounted. Entities for which it is determined the Group has rights to the underlying assets and obligations for the liabilities of the arrangement are classified as ‘joint operations‘ and therefore the Group recognises its proportionate share of the jointly held assets and liabilities, revenue from the sale of its share of the output arising from the joint operation and from the sale of the output by the joint operation and its share of any expenses incurred jointly.
A review of all entities and contractual arrangements in the Group which are less than 100 per cent owned, currently proportionately consolidated, or currently accounted for as joint operations or assets has been completed to assess the impact of IFRS 11 on the Group.
That review determined for ongoing operations that:
Antamina, Cerrejón, Newcastle Infrastructure Group, Cleopatra Oil Pipeline and Caesar Oil Pipeline arrangements no longer meet the definition of unanimous consent and therefore will be equity accounted under the requirements of the revised IAS 28 ‘Investments in Associates and Joint Ventures’.
Samarco is classified as a joint venture under IFRS 11 and therefore will be equity accounted under the requirements of the revised IAS 28 ‘Investments in Associates and Joint Ventures’.
As a result, the Group will no longer recognise its proportionate share of the revenue, expenses, assets, liabilities and cash flows of each of the above operations. Commencing 1 July 2013, the Group will recognise its share of net assets on a single line in the Consolidated Balance Sheet, its share of net profit on a single line in the Consolidated Income Statement and cash flows from dividends in the Consolidated Cash Flow Statement.
The application of IAS 28 to the operations above will also result in changed financial outcomes to the Group in the following situations:
Where the Group’s share of losses of an associate or joint venture equal or exceed the carrying amount of its interest in the associate, the Group will discontinue recognising its share of losses, except to the extent the Group has incurred a legal or constructive obligation or made payments on behalf of the associate or joint venture. Shares of subsequent profits earned by loss making associates or joint ventures (for which the investment balance has been reduced to nil) will not be recognised in the Group’s results until the previously unrecognised losses have been recouped.
Where the Group’s investment in an associate or joint venture is nil (and there is no legal or constructive obligation or made payments on behalf of the associate or joint venture), dividends received from the associate or joint venture will be recognised in the Group’s result as a Profit from Associate for the period rather than being eliminated as a consolidation adjustment.
The following joint arrangements meet the definition of joint operations and as a result, the Group will continue to recognise its share of assets, liabilities, revenues, expenses and cash flows: Petroleum Joint Arrangements (including Onshore US), Alumar, Worsley, Central Queensland Coal Associates, Gregory, Guinea Alumina, Mozal and Phola Coal Processing.
The Western Australia Iron Ore (WAIO) contractual arrangement does not fall within the scope of either IFRS 10 or IFRS 11 and as a result, this operation will be accounted for under other IFRS. The Group will continue to recognise its share of revenues, expenses, assets, liabilities and cash flows on a line by line basis in the financial statements.
With respect to operations divested during the year ended 30 June 2013:
Richards Bay Minerals was determined to be a joint venture under IFRS 11 and therefore will be equity accounted in the comparative periods as described below;
EKATI was determined to be outside the scope of IFRS 11 and therefore will be accounted for under other IFRS in the comparative periods as described below.
The Group is currently in the process of determining the adjustments to be recognised at transition date of 1 July 2011 and to the comparative periods ended 30 June 2012 and 30 June 2013. As a result of the different treatment of associate losses required by IAS 28 described above, there will be some losses previously recognised in the Group result in the periods ended 30 June 2012 and 30 June 2013, which will not be recognised in the restated comparative amounts. Entities divested during the year ended 30 June 2013 will be taken into account up to the date of divestment when calculating the impact of IFRS 11 and the revised IAS 28 for the comparative periods.
IFRIC 20 ‘Stripping Costs in the Production Phase of a Surface Mine’ applies to waste removal (stripping) costs incurred during the production phase of a surface mine; it does not deal with stripping costs in the development phase of a surface mine nor stripping costs in an underground mine. IFRIC 20 modifies the accounting for production stripping as follows:
requires an entity to recognise a production stripping asset only if certain criteria are met;
mandates the depreciation method to be applied to resulting stripping activity assets; and
provides principles to follow in the determination of the adjustment on transition.
A review has been conducted of all assets in the Group which have surface mines to assess the impact of IFRIC 20. The review determined that IFRIC 20 will impact the ongoing accounting for production stripping at the following continuing operations: Escondida, WAIO and Nickel West.
At the Group’s transition date of 1 July 2011, the net book value of deferred stripping balances for all surface mines was US$1,600 million. Application of IFRIC 20 to ongoing operations will result in a transition adjustment to reduce this deferred stripping asset by US$1,139 million with a corresponding decrease to retained earnings of US$1,139 million (US$765 million after tax). Adjustments for ongoing operations for the comparative period ended 30 June 2012 will be an increase to the deferred stripping asset of US$458 million, a decrease to inventories of US$159 million, an increase to deferred tax liabilities of US$93 million and a corresponding increase to net profit after tax of US$207 million for the period. Adjustments for ongoing operations for the comparative period ended 30 June 2013 will be an increase to the deferred stripping asset of US$694 million, a decrease to inventories of US$68 million, an increase to deferred tax liabilities of US$192 million and a corresponding increase to net profit after tax of US$434 million for the period.
The Group is currently in the process of determining the adjustments to be recognised at transition date of 1 July 2011 and to the comparative periods ended 30 June 2012 and 30 June 2013 for the EKATI operation divested during the year. This adjustment is not expected to be material to the Group.
The following new accounting standards are not yet effective but may have an impact on the Group in financial years commencing from 1 July 2013:
IFRS 13/AASB 13 ‘Fair Value Measurement’ replaces fair value measurement guidance in individual IFRSs with a single source of fair value measurement guidance.
Amendments to IAS 19/AASB 119 ‘Employee Benefits’. These amendments require all actuarial gains and losses to be recognised immediately in other comprehensive income (consistent with current Group policy) and require the expected return on plan assets (recognised in the income statement) to be calculated based on the rate used to discount the defined benefit obligation.
The Group is currently in the process of determining the impact of the above standards.
The following new accounting standards and interpretation are not yet effective but may have an impact on the Group in financial years commencing from 1 July 2014 or later:
IFRS 9/AASB 9 ‘Financial Instruments’ modifies the classification and measurement of certain classes of financial assets and liabilities. The most significant change is to rationalise from four to two primary categories of financial assets.
Amendments to IAS 31/AASB 132 ‘Financial Instruments: Presentation’ clarify the criteria for offsetting financial assets and liabilities.
IFRIC 21 ‘Levies’ confirms that a liability to pay a levy is only recognised when the activity that triggers the payment occurs.
The Group is currently in the process of determining the potential impact of adopting the above standards and interpretation.
The above standards and interpretations are available for early adoption in the 30 June 2013 financial year as permitted by the Australian Corporations Act 2001 but have not been applied in the preparation of these financial statements. Except for IFRS 9 and IFRIC 21, all of the above standards and interpretations have been endorsed by the EU and hence are available for early adoption in the EU.
Basis of measurement
The financial statements are drawn up on the basis of historical cost principles, except for derivative financial instruments and certain other financial assets, which are carried at fair value.
Currency of presentation
All amounts are expressed in millions of US dollars, unless otherwise stated, consistent with the predominant functional currency of the Group’s operations.
Change in accounting policy
The accounting policies have been consistently applied by all entities included in the Group consolidated financial statements and are consistent with those applied in all prior years presented.
Principles of consolidation
The financial statements of the Group include the consolidation of BHP Billiton Limited, BHP Billiton Plc and their respective subsidiaries. Subsidiaries are entities controlled by either parent entity. Control exists where either parent entity has the power to govern the financial and operating policies of an entity so as to obtain benefits from its activities. Subsidiaries are included in the consolidated financial report from the date control commences until the date control ceases. Where the Group’s interest is less than 100 per cent, the interest attributable to outside shareholders is reflected in non-controlling interests. The effects of all transactions between entities within the Group have been eliminated.
Joint ventures
The Group undertakes a number of business activities through joint ventures. Joint ventures are established through contractual arrangements that require the unanimous consent of each of the venturers regarding the strategic, financial and operating policies of the venture (joint control). The Group’s joint ventures are of two types:
Jointly controlled entities1. Segment reporting
A jointly controlled entity is a corporation, partnership or other entity in which each participant holds an interest. A jointly controlled entity operates in the same way as other entities, controlling the assets of the joint venture, earning its own income and incurring its own liabilities and expenses. Interests in jointly controlled entities are accounted for using the proportionate consolidation method, whereby the Group’s proportionate interest in the assets, liabilities, revenues and expenses of jointly controlled entities are recognised within each applicable line item of the financial statements. The share of jointly controlled entities’ results is recognised in the Group’s financial statements from the date that joint control commences until the date on which it ceases.
Jointly controlled assets
The Group has certain contractual arrangements with other participants to engage in joint activities involving the joint ownership of assets dedicated to the purposes of each venture. These arrangements do not create a jointly controlled entity as the venturers directly derive the benefits of operation of their jointly owned assets, rather than deriving returns from an interest in a separate entity.
The financial statements of the Group include its share of the assets in such joint ventures, together with the liabilities, revenues and expenses arising jointly or otherwise from those operations. All such amounts are measured in accordance with the terms of each arrangement, which are usually in proportion to the Group’s interest in the jointly controlled assets.
Business combinations
Business combinations that occurred between 1 July 2004 and 30 June 2009 were accounted for by applying the purchase method of accounting, whereby the purchase consideration of the combination is allocated to the identifiable net assets acquired. Business combinations prior to 1 July 2004 have been accounted for in accordance with the Group’s previous policies under Australian GAAP and UK GAAP and have not been restated.
Business combinations undertaken from 1 July 2010 are accounted for by applying the acquisition method of accounting, whereby the identifiable assets, liabilities and contingent liabilities (identifiable net assets) are measured on the basis of fair value at the date of acquisition.
Goodwill
Where the fair value of consideration paid for a business combination exceeds the fair value of the Group’s share of the identifiable net assets acquired, the difference is treated as purchased goodwill. Where the fair value of the Group’s share of the identifiable net assets acquired exceeds the cost of acquisition, the difference is immediately recognised in the income statement. The recognition and measurement of goodwill attributable to a non-controlling interest in a business combination is determined on a transaction by transaction basis. Goodwill is not amortised, however, its carrying amount is assessed annually against its recoverable amount as explained below under ‘Impairment of non-current assets’. On the subsequent disposal or termination of a previously acquired business, any remaining balance of associated goodwill is included in the determination of the profit or loss on disposal or termination.
Intangible assets
Amounts paid for the acquisition of identifiable intangible assets, such as software and licences, are capitalised at the fair value of consideration paid and are recorded at cost less accumulated amortisation and impairment charges. Identifiable intangible assets with a finite life are amortised on a straight-line basis over their expected useful life, which is typically no greater than eight years. The Group has no identifiable intangible assets for which the expected useful life is indefinite.
Foreign currencies
The Group’s reporting currency and the functional currency of the majority of its operations is the US dollar as this is assessed to be the principal currency of the economic environments in which they operate.
Transactions denominated in foreign currencies (currencies other than the functional currency of an operation) are recorded using the exchange rate ruling at the date of the underlying transaction. Monetary assets and liabilities denominated in foreign currencies are translated using the rate of exchange prevailing at year-end and the gains or losses on retranslation are included in the income statement, with the exception of foreign exchange gains or losses on foreign currency provisions for site closure and rehabilitation, which are capitalised in property, plant and equipment for operating sites.
Exchange variations resulting from the retranslation at closing rate of the net investments in subsidiaries and joint ventures arising after 1 July 2004 are accounted for in accordance with the policy stated below. Exchange variations arising before this date were transferred to retained earnings at the date of transition to IFRS.
Subsidiaries and joint ventures that have functional currencies other than US dollars translate their income statement items to US dollars using the exchange rate prevailing at the date of each transaction. Assets and liabilities are translated using exchange rates prevailing at year-end. Exchange variations resulting from the retranslation at closing rate of the net investment in such subsidiaries and joint ventures, together with differences between their income statement items translated at actual and closing rates, are recognised in the foreign currency translation reserve. For the purpose of foreign currency translation, the net investment in a foreign operation is determined inclusive of foreign currency intercompany balances for which settlement is neither planned nor likely to occur in the foreseeable future. The balance of the foreign currency translation reserve relating to a foreign operation that is disposed of, or partially disposed of, is recognised in the income statement at the time of disposal.
Share-based payments
The fair value at grant date of equity-settled share awards granted on or after 8 November 2002 is charged to the income statement over the period for which the benefits of employee services are expected to be derived. The corresponding accrued employee entitlement is recorded in the employee share awards reserve. The fair value of awards is calculated using an option pricing model which considers the following factors:
expected life of the award;
current market price of the underlying shares;
market-based performance hurdles;
For equity-settled share awards granted on or before 7 November 2002 and that remained unvested at 1 July 2004, the estimated cost of share awards is charged to the income statement from grant date to the date of expected vesting. The estimated cost of awards is based on the market value of shares at the grant date or the intrinsic value of options awarded, adjusted to reflect the impact of performance conditions, where applicable.
Where awards are forfeited because non-market based vesting conditions are not satisfied, the expense previously recognised is proportionately reversed. Where shares in BHP Billiton Limited or BHP Billiton Plc are acquired by on-market purchases prior to settling vested entitlements, the cost of the acquired shares is carried as treasury shares and deducted from equity. When awards are satisfied by delivery of acquired shares, any difference between their acquisition cost and the remuneration expense recognised is charged directly to retained earnings. The tax effect of awards granted is recognised in income tax expense, except to the extent that the total tax deductions are expected to exceed the cumulative remuneration expense. In this situation, the excess of the associated current or deferred tax is recognised in other comprehensive income and forms part of the employee share awards reserve.
Sales revenue
Revenue from the sale of goods and disposal of other assets is recognised when persuasive evidence (usually in the form of an executed sales agreement) of an arrangement exists and;
there has been a transfer of risks and rewards to the customer;
no further work or processing is required by the Group;
the quantity and quality of the goods has been determined with reasonable accuracy;
the price is fixed or determinable;
collectability is reasonably assured.
Revenue is therefore generally recognised when title passes. In the majority of sales for most commodities, sales agreements specify that title passes on the bill of lading date, which is the date the commodity is delivered to the shipping agent. For these sales, revenue is recognised on the bill of lading date. For certain sales (principally coal sales to adjoining power stations and diamond sales), title passes and revenue is recognised when the goods have been delivered.
In cases where the terms of the executed sales agreement allow for an adjustment to the sales price based on a survey of the goods by the customer (for instance an assay for mineral content), recognition of the sales revenue is based on the most recently determined estimate of product specifications.
For certain commodities, the sales price is determined on a provisional basis at the date of sale; adjustments to the sales price subsequently occurs based on movements in quoted market or contractual prices up to the date of final pricing. The period between provisional invoicing and final pricing is typically between 60 and 120 days. Revenue on provisionally priced sales is recognised based on the estimated fair value of the total consideration receivable. The revenue adjustment mechanism embedded within provisionally priced sales arrangements has the character of a commodity derivative. Accordingly, the fair value of the final sales price adjustment is re-estimated continuously and changes in fair value are recognised as an adjustment to revenue. In all cases, fair value is estimated by reference to forward market prices.
Revenue is not reduced for royalties and other taxes payable from the Group’s production.
The Group separately discloses sales of Group production from sales of third party products because of the significant difference in profit margin earned on these sales.
Exploration and evaluation expenditure
Exploration and evaluation activity involves the search for mineral and petroleum resources, the determination of technical feasibility and the assessment of commercial viability of an identified resource. Exploration and evaluation activity includes:
researching and analysing historical exploration data;
gathering exploration data through topographical, geochemical and geophysical studies;
exploratory drilling, trenching and sampling;
determining and examining the volume and grade of the resource;
surveying transportation and infrastructure requirements;
conducting market and finance studies.
Administration costs that are not directly attributable to a specific exploration area are charged to the income statement. Licence costs paid in connection with a right to explore in an existing exploration area are capitalised and amortised over the term of the permit.
Exploration and evaluation expenditure (including amortisation of capitalised licence costs) is charged to the income statement as incurred except in the following circumstances, in which case the expenditure may be capitalised:
In respect of minerals activities:
the exploration and evaluation activity is within an area of interest which was previously acquired as an asset acquisition or in a business combination and measured at fair value on acquisition; or
the existence of a commercially viable mineral deposit has been established.
In respect of petroleum activities:
the exploration and evaluation activity is within an area of interest for which it is expected that the expenditure will be recouped by future exploitation or sale; or
exploration and evaluation activity has not reached a stage which permits a reasonable assessment of the existence of commercially recoverable reserves.
Capitalised exploration and evaluation expenditure considered to be a tangible asset is recorded as a component of property, plant and equipment at cost less impairment charges. Otherwise, it is recorded as an intangible asset (such as licences). As the capitalised exploration and evaluation expenditure asset is not available for use, it is not depreciated. All capitalised exploration and evaluation expenditure is monitored for indications of impairment. Where a potential impairment is indicated, assessment is performed for each area of interest in conjunction with the group of operating assets (representing a cash generating unit) to which the exploration is attributed. Exploration areas in which reserves have been discovered but require major capital expenditure before production can begin, are continually evaluated to ensure that commercial quantities of reserves exist or to ensure that additional exploration work is under way or planned. To the extent that capitalised expenditure is no longer expected to be recovered, it is charged to the income statement.
Development expenditure
When proved reserves are determined and development is sanctioned, capitalised exploration and evaluation expenditure is reclassified as assets under construction, and is disclosed as a component of property, plant and equipment. All subsequent development expenditure is capitalised and classified as assets under construction, provided commercial viability conditions continue to be satisfied. Development expenditure is net of proceeds from the sale of ore extracted during the development phase. On completion of development, all assets included in assets under construction are reclassified as either plant and equipment or other mineral assets.
Property, plant and equipment
Property, plant and equipment is recorded at cost less accumulated depreciation and impairment charges. Cost is the fair value of consideration given to acquire the asset at the time of its acquisition or construction and includes the direct cost of bringing the asset to the location and condition necessary for operation and the estimated future cost of closure and rehabilitation of the facility.
Other mineral assets
Other mineral assets comprise:
Capitalised exploration, evaluation and development expenditure (including development stripping) for properties now in production;
Mineral rights and petroleum interests acquired;
Capitalised production stripping (as described below in ‘Overburden removal costs’).
Depreciation of property, plant and equipment
The carrying amounts of property, plant and equipment (including initial and any subsequent capital expenditure) are depreciated to their estimated residual value over the estimated useful lives of the specific assets concerned, or the estimated life of the associated mine, field or lease, if shorter. Estimates of residual values and useful lives are reassessed annually and any change in estimate is taken into account in the determination of remaining depreciation charges. Depreciation commences on the date of commissioning. The major categories of property, plant and equipment are depreciated on a unit of production and/or straight-line basis using estimated lives indicated below. However, where assets are dedicated to a mine, field or lease and are not readily transferable, the below useful lives are subject to the lesser of the asset category’s useful life and the life of the mine, field or lease:
| | | | | | |
• Buildings
| | | – | | | 25 to 50 years |
| | |
• Land
| | | – | | | not depreciated |
| | |
• Plant and equipment
| | | – | | | 3 to 30 years straight-line |
| | |
• Mineral rights and Petroleum interests
| | | – | | | based on reserves on a unit of production basis |
| | |
• Capitalised exploration, evaluation and development expenditure
| | | – | | | based on reserves on a unit of production basis |
Leased assets
Assets held under leases, which result in the Group receiving substantially all the risks and rewards of ownership of the asset (finance leases), are capitalised at the lower of the fair value of the property, plant and equipment or the estimated present value of the minimum lease payments.
The corresponding finance lease obligation is included within interest bearing liabilities. The interest element is allocated to accounting periods during the lease term to reflect a constant rate of interest on the remaining balance of the obligation.
Operating lease assets are not capitalised and rental payments are included in the income statement on a straight-line basis over the lease term. Provision is made for the present value of future operating lease payments in relation to surplus lease space, when it is first determined that the space will be of no probable future benefit. Operating lease incentives are recognised as a liability when received and subsequently reduced by allocating lease payments between rental expense and reduction of the liability.
Impairment of non-current assets
Formal impairment tests are carried out annually for goodwill. In addition, formal impairment tests for all assets are performed when there is an indication of impairment. The Group conducts an internal review of asset values annually, which is used as a source of information to assess for any indications of impairment. External factors, such as changes in expected future prices, costs and other market factors, are also monitored to assess for indications of impairment. If any such indication exists, an estimate of the asset’s recoverable amount is calculated, being the higher of fair value less direct costs to sell and the asset’s value in use.
If the carrying amount of the asset exceeds its recoverable amount, the asset is impaired and an impairment loss is charged to the income statement so as to reduce the carrying amount in the balance sheet to its recoverable amount.
Fair value is determined as the amount that would be obtained from the sale of the asset in an arm’s length transaction between knowledgeable and willing parties. Fair value for mineral assets is generally determined as the present value of the estimated future cash flows expected to arise from the continued use of the asset, including any expansion prospects, and its eventual disposal, using assumptions that an independent market participant may take into account. These cash flows are discounted at an appropriate rate to arrive at a net present value of the asset.
Value in use is determined as the present value of the estimated future cash flows expected to arise from the continued use of the asset in its present form and its eventual disposal. Value in use is determined by applying assumptions specific to the Group’s continued use and cannot take into account future development. These assumptions are different to those used in calculating fair value and consequently the value in use calculation is likely to give a different result (usually lower) to a fair value calculation.
In testing for indications of impairment and performing impairment calculations, assets are considered as collective groups and referred to as cash generating units. Cash generating units are the smallest identifiable group of assets, liabilities and associated goodwill that generate cash inflows that are largely independent of the cash inflows from other assets or groups of assets.
The impairment assessments are based on a range of estimates and assumptions, including:
| | | | |
Estimates/assumptions: | | Basis: |
| | |
• Future production
| | • | | proved and probable reserves, resource estimates and, in certain cases, expansion projects |
| | |
• Commodity prices
| | • | | forward market and contract prices, and longer-term price protocol estimates |
| | |
• Exchange rates
| | • | | current (forward) market exchange rates |
| | |
• Discount rates
| | • | | cost of capital risk-adjusted appropriate to the resource |
Overburden removal costs
Overburden and other mine waste materials are often removed during the initial development of a mine site in order to access the mineral deposit. This activity is referred to as development stripping. The directly attributable costs (inclusive of an allocation of relevant overhead expenditure) are initially capitalised as assets under construction. Capitalisation of development stripping costs ceases at the time that saleable material begins to be extracted from the mine. On completion of development, all capitalised development stripping included in assets under construction is transferred to other mineral assets.
Production stripping commences at the time that saleable materials begin to be extracted from the mine and normally continues throughout the life of a mine. The costs of production stripping are charged to the income statement as operating costs, when the ratio of waste material to ore extracted for an area of interest is expected to be constant throughout its estimated life. When the ratio of waste to ore is not expected to be constant, production stripping costs are accounted for as follows:
All costs are initially charged to the income statement and classified as operating costs.
When the current ratio of waste to ore is greater than the estimated life-of-mine ratio, a portion of the stripping costs (inclusive of an allocation of relevant overhead expenditure) is capitalised to other mineral assets.
In subsequent years when the ratio of waste to ore is less than the estimated life-of-mine ratio, a portion of capitalised stripping costs is charged to the income statement as operating costs.
The amount of production stripping costs capitalised or charged in a financial year is determined so that the stripping expense for the financial year reflects the estimated life-of-mine ratio. Changes to the estimated life-of-mine ratio are accounted for prospectively from the date of the change.
Inventories
Inventories, including work in progress, are valued at the lower of cost and net realisable value. Cost is determined primarily on the basis of average costs. For processed inventories, cost is derived on an absorption costing basis. Cost comprises cost of purchasing raw materials and cost of production, including attributable mining and manufacturing overheads. In respect of minerals inventory, quantities are assessed primarily through surveys and assays. In respect of petroleum inventory, quantities are derived through flow rate or tank volume measurement; volume calculation and composition is derived via sample analysis.
Finance costs
Finance costs are generally expensed as incurred except where they relate to the financing of construction or development of qualifying assets requiring a substantial period of time to prepare for their intended future use. Finance costs are capitalised up to the date when the asset is ready for its intended use. The amount of finance costs capitalised (before the effects of income tax) for the period is determined by applying the interest rate applicable to appropriate borrowings outstanding during the period, to the average amount of capitalised expenditure for the qualifying assets during the period.
Taxation
Taxation on the profit or loss for the year comprises current and deferred tax. Taxation is recognised in the income statement except to the extent that it relates to items recognised directly in equity, in which case the tax is recognised in equity.
Current tax is the expected tax payable on the taxable income for the year using rates enacted or substantively enacted at the year-end, and includes any adjustment to tax payable in respect of previous years.
Deferred tax is provided using the balance sheet liability method, providing for the tax effect of temporary differences between the carrying amount of assets and liabilities for financial reporting purposes and the amounts used for tax assessment or deduction purposes. Where an asset has no deductible or depreciable amount for income tax purposes, but has a deductible amount on sale or abandonment for capital gains tax purposes, that amount is included in the determination of temporary differences. The tax effect of certain temporary differences is not recognised, principally with respect to: goodwill; temporary differences arising on the initial recognition of assets or liabilities (other than those arising in a business combination or in a manner that initially impacted
accounting or taxable profit); and temporary differences relating to investments in subsidiaries, jointly controlled entities and associates to the extent that the Group is able to control the reversal of the temporary difference and it is probable that the temporary difference will not reverse in the foreseeable future. The amount of deferred tax recognised is based on the expected manner and timing of realisation or settlement of the carrying amount of assets and liabilities, with the exception of items that have a tax base solely derived under capital gains tax legislation, using tax rates enacted or substantively enacted at period end. To the extent that an item’s tax base is solely derived from the amount deductible under capital gains tax legislation, deferred tax is determined as if such amounts are deductible in determining future assessable income.
A deferred tax asset is recognised only to the extent that it is probable that future taxable profits will be available against which the asset can be utilised. Deferred tax assets are reviewed at each balance sheet date and amended to the extent that it is no longer probable that the related tax benefit will be realised. Deferred tax assets and liabilities are offset when they relate to income taxes levied by the same taxation authority and the Group has both the right and the intention to settle its current tax assets and liabilities on a net or simultaneous basis.
Royalties and resource rent taxes are treated as taxation arrangements when they have the characteristics of a tax. This is considered to be the case when they are imposed under government authority and the amount payable is calculated by reference to revenue derived (net of any allowable deductions) after adjustment for temporary differences. For such arrangements, current and deferred tax is provided on the same basis as described above for other forms of taxation. Obligations arising from royalty arrangements that do not satisfy these criteria are recognised as current provisions and included in expenses.
Provision for employee benefits
Provision is made in the financial statements for all employee benefits, including on costs. In relation to industry-based long service leave funds, the Group’s liability, including obligations for funding shortfalls, is determined after deducting the fair value of dedicated assets of such funds.
Liabilities for unpaid wages and salaries are recognised in sundry creditors. Current entitlements to annual leave and accumulating sick leave accrued for services up to the reporting date are recognised in provision for employee benefits and are measured at the amounts expected to be paid. Entitlements to non-accumulating sick leave are recognised when the leave is taken.
The current liability for long service leave (for which settlement within 12 months of the reporting date cannot be deferred) is recognised in the current provision for employee benefits and is measured in accordance with annual leave described above. The non-current liability for long service leave is recognised in the non-current provision for employee benefits and measured as the present value of expected future payments to be made in respect of services provided by employees up to the reporting date. Consideration is given to expected future wage and salary levels, experience of employee departures and periods of service. Expected future payments are discounted using market yields at the reporting date on national government bonds with terms to maturity and currency that match, as closely as possible, the estimated future cash outflows.
Superannuation, pensions and other post-retirement benefitssegments
The Group operates or participates in a number of pension (including superannuation) schemes throughout the world. The funding of the schemes complies with local regulations. The assets of the schemes are generally held separately from those of the Group and are administered by trustees or management boards.
For defined contribution schemes or schemes operated on an industry-wide basis where it is not possible to identify assets attributable to the participation by the Group’s employees, the pension charge is calculated on the basis of contributions payable.
For defined benefit schemes, the cost of providing pensions is charged to the income statement so as to recognise current and past service costs, interest cost on defined benefit obligations, and the effect of any curtailments or settlements, net of expected returns on plan assets. Actuarial gains and losses are recognised directly in equity. An asset or liability is consequently recognised in the balance sheet based on the present value of defined benefit obligations, less any unrecognised past service costs and the fair value of plan assets, except that any such asset cannot exceed the total of unrecognised past service costs and the present value of expected refunds from and reductions in future contributions to the plan. Defined benefit obligations are estimated by discounting expected future payments using market yields at the reporting date on high-quality corporate bonds in countries that have developed corporate bond markets. However, where developed corporate bond markets do not exist, the discount rates are selected by reference to national government bonds. In both instances, the bonds are selected with terms to maturity and currency that match, as closely as possible, the estimated future cash flows.
Certain Group companies provide post-retirement medical benefits to qualifying retirees. In some cases the benefits are provided through medical care schemes to which the Group, the employees, the retirees and covered family members contribute. In some schemes there is no funding of the benefits before retirement. These schemes are recognised on the same basis as described above for defined benefit pension schemes.
Closure and rehabilitation
The mining, extraction and processing activities of the Group normally give rise to obligations for site closure or rehabilitation. Closure and rehabilitation works can include facility decommissioning and dismantling; removal or treatment of waste materials; site and land rehabilitation. The extent of work required and the associated costs are dependent on the requirements of relevant authorities and the Group’s environmental policies.
Provisions for the cost of each closure and rehabilitation program are recognised at the time that environmental disturbance occurs. When the extent of disturbance increases over the life of an operation, the provision is increased accordingly. Costs included in the provision encompass all closure and rehabilitation activity expected to occur progressively over the life of the operation and at the time of closure in connection with disturbances at the reporting date. Routine operating costs that may impact the ultimate closure and rehabilitation activities, such as waste material handling conducted as an integral part of a mining or production process, are not included in the provision. Costs arising from unforeseen circumstances, such as the contamination caused by unplanned discharges, are recognised as an expense and liability when the event gives rise to an obligation which is probable and capable of reliable estimation.
The timing of the actual closure and rehabilitation expenditure is dependent upon a number of factors such as the life and nature of the asset, the operating licence conditions, the principlesofOur BHP Billiton Charter and the environment in which the mine operates. Expenditure may occur before and after closure and can continue for an extended period of time dependent on closure and rehabilitation requirements. The majority of the expenditure is expected to be paid over periods of up to 50 years with some payments into perpetuity.
Closure and rehabilitation provisions are measured at the expected value of future cash flows, discounted to their present value and determined according to the probability of alternative estimates of cash flows occurring for each operation. Discount rates used are specific to the country in which the operation is located. Significant judgements and estimates are involved in forming expectations of future activities and the amount and timing of the associated cash flows. Those expectations are formed based on existing environmental and regulatory requirements or, if more stringent, Group environmental policies which give rise to a constructive obligation.
When provisions for closure and rehabilitation are initially recognised, the corresponding cost is capitalised as an asset, representing part of the cost of acquiring the future economic benefits of the operation. The capitalised cost of closure and rehabilitation activities is recognised in property, plant and equipment and depreciated accordingly. The value of the provision is progressively increased over time as the effect of discounting unwinds, creating an expense recognised in financial expenses.
Closure and rehabilitation provisions are also adjusted for changes in estimates. Those adjustments are accounted for as a change in the corresponding capitalised cost, except where a reduction in the provision is greater than the undepreciated capitalised cost of the related assets, in which case the capitalised cost is reduced to nil and the remaining adjustment is recognised in the income statement. In the case of closed sites, changes to estimated costs are recognised immediately in the income statement. Changes to the capitalised cost result in an adjustment to future depreciation. Adjustments to the estimated amount and timing of future closure and rehabilitation cash flows are a normal occurrence in light of the significant judgements and estimates involved. Factors influencing those changes include:
revisions to estimated reserves, resources and lives of operations;
developments in technology;
regulatory requirements and environmental management strategies;
changes in the estimated extent and costs of anticipated activities, including the effects of inflation and movements in foreign exchange rates;
movements in interest rates affecting the discount rate applied.
Financial instruments
All financial assets are initially recognised at the fair value of consideration paid. Subsequently, financial assets are carried at fair value or amortised cost less impairment. Where non-derivative financial assets are carried at fair value, gains and losses on remeasurement are recognised directly in equity unless the financial assets have been designated as being held at fair value through profit or loss, in which case the gains and losses are recognised directly in the income statement. Financial assets are designated as being held at fair value through profit or loss when this is necessary to reduce measurement inconsistencies for related assets and liabilities. All financial liabilities other than derivatives are initially recognised at fair value of consideration received net of transaction costs as appropriate (initial cost) and subsequently carried at amortised cost.
Derivatives, including those embedded in other contractual arrangements but separated for accounting purposes because they are not clearly and closely related to the host contract, are initially recognised at fair value on the date the contract is entered into and are subsequently remeasured at their fair value. The method of recognising the resulting gain or loss on remeasurement depends on whether the derivative is designated as a hedging instrument, and, if so, the nature of the item being hedged. The measurement of fair value is based on quoted market prices. Where no price information is available from a quoted market source, alternative market mechanisms or recent comparable transactions, fair value is estimated based on the Group’s views on relevant future prices, net of valuation allowances to accommodate liquidity, modelling and other risks implicit in such estimates.
Forward exchange contracts and interest rate swaps held for hedging purposes are accounted for as either cash flow or fair value hedges. Derivatives embedded within other contractual arrangements and the majority of commodity-based transactions executed through derivative contracts do not qualify for hedge accounting.
Fair value hedges
Changes in the fair value of derivatives that are designated and qualify as fair value hedges are recorded in the income statement, together with any changes in the fair value of the hedged asset or liability that are attributable to the hedged risk. Any difference between the change in fair value of the derivative and the hedged risk constitutes ineffectiveness of the hedge and is recognised immediately in the income statement.
Cash flow hedges
The effective portion of changes in the fair value of derivatives that are designated and qualify as cash flow hedges is recognised in equity in the hedging reserve. The gain or loss relating to the ineffective portion is recognised immediately in the income statement.
Amounts accumulated in equity are recycled to the income statement in the periods when the hedged item affects profit or loss. However, when the forecast transaction that is hedged results in the recognition of a non-financial asset (for example, plant and equipment purchases) or a non-financial liability, the gains and losses previously deferred in equity are transferred from equity and included in the measurement of the initial carrying amount of the asset or liability.
When a hedging instrument expires or is sold or terminated, or when a hedge no longer meets the criteria for hedge accounting, any cumulative gain or loss existing in equity at that time remains in equity and is recognised when the forecast transaction is ultimately recognised in the income statement. When a hedged forecast transaction is no longer expected to occur, the cumulative hedge gain or loss that was reported in equity is immediately transferred to the income statement.
Derivatives that do not qualify for hedge accounting
Certain derivative instruments do not qualify for hedge accounting. Changes in the fair value of any derivative instrument that does not qualify for hedge accounting are recognised immediately in the income statement.
Available for sale and trading investments
Available for sale and trading investments are measured at fair value. Gains and losses on the remeasurement of trading investments are recognised directly in the income statement. Gains and losses on the remeasurement of available for sale investments are recognised directly in equity and subsequently recognised in the income statement when realised by sale or redemption, or when a reduction in fair value is judged to represent an impairment.
Application of critical accounting policies and estimates
The preparation of the consolidated financial statements requires management to make judgements and estimates and form assumptions that affect the reported amounts of assets and liabilities and the disclosure of contingent liabilities at the date of the financial statements, and the reported revenue and expenses during the periods presented therein. On an ongoing basis, management evaluates its judgements and estimates in relation to assets, liabilities, contingent liabilities, revenue and expenses. Management bases its judgements and estimates on historical experience and on other factors it believes to be reasonable under the circumstances, the results of which form the basis of the carrying amounts of assets and liabilities that are not readily apparent from other sources. Actual results may differ from these estimates under different assumptions and conditions.
The Group has identified the following critical accounting policies under which significant judgements, estimates and assumptions are made and where actual results may differ from these estimates under different assumptions and conditions and may materially affect financial results or the financial position reported in future periods.
Further details of the nature of these assumptions and conditions may be found in the relevant notes to the financial statements.
Reserve estimates
Reserves are estimates of the amount of product that can be economically and legally extracted from the Group’s properties. In order to estimate reserves, estimates are required about a range of geological, technical
and economic factors, including quantities, grades, production techniques, recovery rates, production costs, transport costs, commodity demand, commodity prices and exchange rates.
Estimating the quantity and/or grade of reserves requires the size, shape and depth of ore bodies or fields to be determined by analysing geological data such as drilling samples. This process may require complex and difficult geological judgements to interpret the data.
The Group determines and reports ore reserves in Australia and the United Kingdom under the principles incorporated in the Australasian Code for Reporting Exploration Results of Mineral Resources and Ore Reserves December 2012 known as the JORC Code, and the Australian Securities Exchange (ASX) Listing Rules 2012 for minerals. The JORC Code requires the use of reasonable investment assumptions when reporting reserves. As a result, management will form a view of forecast sales prices, based on current and long-term historical average price trends. For example, if current prices remain above long-term historical averages for an extended period of time, management may assume that lower prices will prevail in the future and as a result, those lower prices are used to estimate reserves under the JORC Code. Lower price assumptions generally result in lower estimates of reserves.
Reserve reporting requirements for SEC (United States of America) filings are specified in Industry Guide 7, which requires economic assumptions to be based on current economic conditions (which may differ from assumptions based on reasonable investment assumptions). Accordingly, for SEC filings, we test our reserve estimates derived under JORC against assumed ‘current economic conditions’. ‘Current economic conditions’ are based on the three-year average of historical contract and market prices for commodities such as iron ore and coal, and the three-year average of historical market prices for commodities that are traded on the London Metal Exchange, such as copper and nickel. However, we only report a different reserve in the United States if, based on the United States SEC pricing assumptions test, the reserve will be lower than that reported under JORC in Australia and the United Kingdom.
Oil and gas reserves reported in Australia and the United Kingdom, and the United States for SEC filing purposes, are based on the average of prices prevailing on the first day of each month for the past 12 months as required under the SEC Rules ‘Modernisation of Oil & Gas Reporting’. Reserves reported in prior periods are based on the prices prevailing at the time of the estimates as previously required by Statement of Financial Accounting Standards No. 69 ‘Disclosures about Oil and Gas Producing Activities’, issued by the US Financial Accounting Standards Board.
Because the economic assumptions used to estimate reserves change from period to period, and because additional geological data is generated during the course of operations, estimates of reserves may change from period to period. Changes in reported reserves may affect the Group’s financial results and financial position in a number of ways, including the following:
Asset recoverable amounts may be affected due to changes in estimated future cash flows.
Depreciation, depletion and amortisation charged in the income statement may change where such charges are determined by the units of production basis, or where the useful economic lives of assets change.
Overburden removal costs recorded on the balance sheet or charged to the income statement may change due to changes in stripping ratios or the units of production basis of depreciation.
Decommissioning, site restoration and environmental provisions may change where changes in estimated reserves affect expectations about the timing or cost of these activities.
The carrying amount of deferred tax assets may change due to changes in estimates of the likely recovery of the tax benefits.
Exploration and evaluation expenditure
The Group’s accounting policy for exploration and evaluation expenditure results in certain items of expenditure being capitalised for an area of interest where it is considered likely to be recoverable by future exploitation or sale or where the activities have not reached a stage which permits a reasonable assessment of the existence of reserves. This policy requires management to make certain estimates and assumptions as to future events and circumstances, in particular whether an economically viable extraction operation can be established. Any such estimates and assumptions may change as new information becomes available. If, after having capitalised the expenditure under the policy, a judgement is made that recovery of the expenditure is unlikely, the relevant capitalised amount will be written off to the income statement.
Development expenditure
Development activities commence after project sanctioning by the appropriate level of management. Judgement is applied by management in determining when a project is economically viable. In exercising this judgement, management is required to make certain estimates and assumptions similar to those described above for capitalised exploration and evaluation expenditure. Any such estimates and assumptions may change as new information becomes available. If, after having commenced the development activity, a judgement is made that a development asset is impaired, the appropriate amount will be written off to the income statement.
Property, plant and equipment and Intangible assets – recoverable amount
In accordance with the Group’s accounting policy, each asset or cash generating unit is evaluated every reporting period to determine whether there are any indications of impairment. If any such indication exists, a formal estimate of recoverable amount is performed and an impairment loss recognised to the extent that carrying amount exceeds recoverable amount. The recoverable amount of an asset or cash generating group of assets is measured at the higher of fair value less costs to sell and value in use.
The determination of fair value and value in use requires management to make estimates and assumptions about expected production and sales volumes, commodity prices (considering current and historical prices, price trends and related factors), reserves (see ‘Reserve estimates’ above), operating costs, closure and rehabilitation costs and future capital expenditure. These estimates and assumptions are subject to risk and uncertainty; hence there is a possibility that changes in circumstances will alter these projections, which may impact the recoverable amount of the assets. In such circumstances, some or all of the carrying amount of the assets may be further impaired or the impairment charge reduced with the impact recorded in the income statement.
Defined benefit pension schemes
The Group’s accounting policy for defined benefit pension schemes requires management to make judgements as to the nature of benefits provided by each scheme and thereby determine the classification of each scheme. For defined benefit schemes, management is required to make annual estimates and assumptions about future returns on classes of scheme assets, future remuneration changes, employee attrition rates, administration costs, changes in benefits, inflation rates, exchange rates, life expectancy and expected remaining periods of service of employees. In making these estimates and assumptions, management considers advice provided by external advisers, such as actuaries. Where actual experience differs to these estimates, actuarial gains and losses are recognised directly in equity. Refer to note 30 Pension and other post-retirement obligations for details of the key assumptions.
Provision for closure and rehabilitation
The Group’s accounting policy for the recognition of closure and rehabilitation provisions requires significant estimates and assumptions such as: requirements of the relevant legal and regulatory framework; the magnitude
of possible contamination; and the timing, extent and costs of required closure and rehabilitation activity. These uncertainties may result in future actual expenditure differing from the amounts currently provided.
The provision recognised for each site is periodically reviewed and updated based on the facts and circumstances available at the time. Changes to the estimated future costs for operating sites are recognised in the balance sheet by adjusting both the closure and rehabilitation asset and provision. For closed sites, changes to estimated costs are recognised immediately in the income statement.
In addition to the uncertainties noted above, certain closure and rehabilitation activities are subject to legal disputes and depending on the ultimate resolution of these issues, the final liability for these matters could vary.
Taxation
The Group’s accounting policy for taxation, including royalty-related taxation, requires management’s judgement as to the types of arrangements considered to be a tax on income in contrast to an operating cost. Judgement is also required in assessing whether deferred tax assets and certain deferred tax liabilities are recognised on the balance sheet. Deferred tax assets, including those arising from unrecouped tax losses, capital losses, foreign tax credits and temporary differences, are recognised only where it is considered more likely than not that they will be recovered, which is dependent on the generation of sufficient future taxable profits. Deferred tax liabilities arising from temporary differences in investments, caused principally by retained earnings held in foreign tax jurisdictions, are recognised unless repatriation of retained earnings can be controlled and are not expected to occur in the foreseeable future.
Assumptions about the generation of future taxable profits and repatriation of retained earnings depend on management’s estimates of future cash flows. These depend on estimates of future production and sales volumes, commodity prices, reserves, operating costs, closure and rehabilitation costs, capital expenditure, dividends and other capital management transactions. Judgements are also required about the application of income tax legislation and its interaction with income tax accounting principles. These judgements and assumptions are subject to risk and uncertainty, hence there is a possibility that changes in circumstances will alter expectations, which may impact the amount of deferred tax assets and deferred tax liabilities recognised on the balance sheet and the amount of other tax losses and temporary differences not yet recognised. In such circumstances, some or all of the carrying amount of recognised deferred tax assets and liabilities may require adjustment, resulting in a corresponding credit or charge to the income statement.
Rounding of amounts
Amounts in these financial statements have, unless otherwise indicated, been rounded to the nearest million dollars.
Comparatives
Where applicable, comparatives have been adjusted to measure or present them on the same basis as current period figures.
Exchange rates
The following exchange rates relative to the US dollar have been applied in the financial statements:
| | | | | | | | | | | | | | | | | | | | | | | | |
| | | Average
year ended
30 June 2013 | | | Average
year ended
30 June 2012 | | | Average
year ended
30 June 2011 | | | As at
30 June 2013 | | | As at
30 June 2012 | | | As at
30 June 2011 | |
Australian dollar(a) | | | 1.03 | | | | 1.03 | | | | 0.99 | | | | 0.92 | | | | 1.00 | | | | 1.07 | |
Brazilian real | | | 2.04 | | | | 1.78 | | | | 1.68 | | | | 2.18 | | | | 2.08 | | | | 1.57 | |
Canadian dollar | | | 1.00 | | | | 1.00 | | | | 1.00 | | | | 1.05 | | | | 1.03 | | | | 0.97 | |
Chilean peso | | | 479 | | | | 492 | | | | 486 | | | | 504 | | | | 510 | | | | 470 | |
Colombian peso | | | 1,814 | | | | 1,825 | | | | 1,843 | | | | 1,923 | | | | 1,807 | | | | 1,779 | |
Euro | | | 0.77 | | | | 0.75 | | | | 0.73 | | | | 0.77 | | | | 0.80 | | | | 0.69 | |
South African rand | | | 8.84 | | | | 7.77 | | | | 7.01 | | | | 10.00 | | | | 8.41 | | | | 6.80 | |
UK pound sterling | | | 0.64 | | | | 0.63 | | | | 0.63 | | | | 0.66 | | | | 0.64 | | | | 0.62 | |
(a) | Displayed as US$ to A$1 based on common convention.
|
2 Segment reporting
Business segments
The Group operates fivefour Businesses aligned with the commodities which we extract and market, reflecting the structure used by the Group’s management to assess the performance of the Group.
During the financial year the Group completed the following changes:
Following the sale of its diamonds business and interests in Richards Bay Minerals, the Group has consolidated its Potash development activity with the Petroleum Customer Sector Group (CSG) to form the Petroleum and Potash Business. In view of the new management structure, this Business is now considered to be a single reportable segment. There were no inter-segment transactions between the Petroleum CSG and Potash Business and therefore the comparative amounts reported for the new Petroleum and Potash segment for the years ended 30 June 2012 and 30 June 2011 are an aggregation of Petroleum and Potash. The remaining amounts reported previously for the Diamonds and Specialty Products CSG have been included in Group and unallocated items.
The Base Metals CSG was renamed the Copper Business.
The consolidation of the Metallurgical Coal and Energy Coal CSGs to form the Coal Business. In view of the new management structure, this Business is now considered to be a single reportable segment. There were no inter-segment transactions between the Metallurgical Coal and Energy Coal CSGs and therefore the comparative amounts reported for the new Coal segment for the years ended 30 June 2012 and 30 June 2011 are an aggregation of previously reported amounts.
The consolidation of the Aluminium, Manganese and Stainless Steel Materials CSGs to form the Aluminium, Manganese and Nickel Business. In view of the new management structure, this Business is now considered to be a single reportable segment. There were no inter-segment transactions between the
| Stainless Steel Materials, Aluminium and Manganese CSGs and therefore the comparative amounts reported for the new Aluminium, Manganese and Nickel segment for the years ended 30 June 2012 and 30 June 2011 are an aggregation of previously reported amounts.
|
| | |
Reportable segment | | Principal activities |
| |
| Petroleum and Potash | | Exploration, development and production of oil and gas gas; Potash development pre-development |
| |
| Copper | | Mining of copper, silver, lead, zinc, molybdenum, uranium and gold |
| |
| Iron Ore | | Mining of iron ore |
| |
| Coal | | Mining of metallurgical coal and thermal (energy) coal |
| |
Aluminium, Manganese and Nickel | | Mining of bauxite, refining of bauxite into alumina and smelting of alumina into aluminium metal
|
Unless otherwise noted, the segment reporting information excludes Discontinued operations demerged with South32, being the Group’s former interests in its integrated Aluminium business, Energy Coal South Africa, Illawarra metallurgical coal, the Manganese business, the Cerro Matoso nickel operation and the Cannington silver-lead-zinc mine.
Mining of manganese ore and production of manganese metal and alloys
Mining and production of nickel products
Group and unallocated items representincludes Group centre functions,Functions, other unallocated operations including Nickel West (previously disclosed in the former Aluminium, Manganese and Nickel Business demerged with South32) and consolidation adjustments.
Exploration and technology activities are recognised within relevant segments.
It is the Group’s policy that inter-segment sales are made on a commercial basis.
| | | | Petroleum
and Potash | | Copper | | Iron Ore | | Coal | | Aluminium,
Manganese
and Nickel | | Group and
unallocated
items/
eliminations (f) | | BHP
Billiton
Group | | | Petroleum
and Potash | | Copper | | Iron Ore | | Coal | | Group and
unallocated
items/
eliminations (f) | | BHP
Billiton
Group | |
Year ended 30 June 2015 | | | | | | | | | | | | | |
| US$M | US$M | | | | | | | | | | | | | |
Year ended 30 June 2013 | | | | | | | | | | | | | | | |
Revenue | | | | | | | | | | | | | | | | | | | | | | | | | | |
Group production | | | 12,933 | | | 11,413 | | | 19,939 | | | 10,138 | | | 8,093 | | | 447 | | | 62,963 | | | | 10,912 | | | 10,500 | | | 14,438 | | | 5,878 | | | 1,395 | | | 43,123 | |
Third party products | | | 175 | | | 578 | | | 86 | | | 585 | | | 1,165 | | | 176 | | | 2,765 | | | | 69 | | | 953 | | | 76 | | | 7 | | | 74 | | | 1,179 | |
Rendering of services | | | 105 | | | – | | | 135 | | | – | | | – | | | – | | | 240 | | | | 199 | | | | – | | | 135 | | | | – | | | | – | | | 334 | |
Inter-segment revenue | | | – | | | – | | | 55 | | | – | | | 20 | | | (75 | ) | | – | | | | 267 | | | | – | | | 104 | | | | – | | | (371 | ) | | | – | |
| | | | | | | | | | | | | | | | | | | | | | | | | | | | | | | | | | | | | | | |
| Total revenue(a) | | | 13,213 | | | | 11,991 | | | | 20,215 | | | | 10,723 | | | | 9,278 | | | | 548 | | | | 65,968 | | | | 11,447 | | | | 11,453 | | | | 14,753 | | | | 5,885 | | | | 1,098 | | | | 44,636 | |
| | | | | | | | | | | | | | | | | | | | | | | | | | | | | | | | | | | | | | | |
Underlying EBITDA (b) | | | 8,928 | | | | 4,609 | | | | 12,186 | | | | 1,717 | | | | 919 | | | | 24 | | | | 28,383 | | | | 7,023 | | | | 5,205 | | | | 8,648 | | | | 1,242 | | | | (266 | ) | | | 21,852 | |
| | | | | | | | | | | | | | | | | | | | | | | | | | | | | | | | | | | | | | | |
Depreciation and amortisation | | | (3,071 | ) | | | (957 | ) | | | (978 | ) | | | (971 | ) | | | (770 | ) | | | (198 | ) | | | (6,945 | ) | | | (4,744 | ) | | (1,545 | ) | | (1,698 | ) | | (875 | ) | | (296 | ) | | (9,158 | ) |
Impairment (losses)/reversals | | | (206 | ) | | | (30 | ) | | | (87 | ) | | | – | | | | 15 | | | | (3 | ) | | | (311 | ) | |
Impairment losses | | | | (477 | ) | | (307 | ) | | (18 | ) | | (19 | ) | | (7 | ) | | (828 | ) |
| | | | | | | | | | | | | | | | | | | | | | | | | | | | | | | | | | | | | | | |
Underlying EBIT (b) | | | 5,651 | | | | 3,622 | | | | 11,121 | | | | 746 | | | | 164 | | | | (177 | ) | | | 21,127 | | | | 1,802 | | | | 3,353 | | | | 6,932 | | | | 348 | | | | (569 | ) | | | 11,866 | |
| | | | | | | | | | | | | | | | | | | | | | | | | | | | | | | | | | | | | | | |
Comprising: | | | | | | | | | | | | | | | | | | | | | | | | | | |
Group production | | | 5,640 | | | | 3,625 | | | | 11,090 | | | | 702 | | | | 126 | | | | (177 | ) | | | 21,006 | | | | 1,801 | | | 3,155 | | | 6,571 | | | 347 | | | (570 | ) | | 11,304 | |
Third party products | | | 11 | | | | (3 | ) | | | 31 | | | | 44 | | | | 38 | | | | – | | | | 121 | | | | 1 | | | 23 | | | (10 | ) | | | – | | | | – | | | 14 | |
Share of operating profit of equity accounted investments | | | | – | | | 175 | | | 371 | | | 1 | | | 1 | | | 548 | |
| | | | | | | | | | | | | | | | | | | | | | | | | | | | | | | | | | | | | | | |
Underlying EBIT (b) | | | 5,651 | | | | 3,622 | | | | 11,121 | | | | 746 | | | | 164 | | | | (177 | ) | | | 21,127 | | | | 1,802 | | | | 3,353 | | | | 6,932 | | | | 348 | | | | (569 | ) | | | 11,866 | |
| | | | | | | | | | | | | | | | | | | | | | | | | | | | | | | | | | | | | | | |
Net finance costs(c) | | | | | | | | | | | | | | | (1,353 | ) | | | | | | | | | | | | (614 | ) |
Exceptional items(d) | | | | | | | | | | | | | | | (1,902 | ) | | | | | | | | | | | | (3,196 | ) |
| | | | | | | | | | | | | | | | | | | | | | | | | | | | |
| Profit before taxation | | | | | | | | | | | | | | | 17,872 | | | | | | | | | | | | | | 8,056 | |
| | | | | | | | | | | | | | | | | | | | | | | | | | | | |
Capital expenditure | | | 7,730 | | | | 2,120 | | | | 6,255 | | | | 3,887 | | | | 758 | | | | 132 | | | | 20,882 | | | | 5,359 | | | | 3,822 | | | | 1,930 | | | | 729 | | | | 107 | | | | 11,947 | |
| | | | | | | | | | | | | | | | | | | | | | | | | | | | | | | | | | | | | | | |
Total assets | | | 44,330 | | | | 18,614 | | | | 27,742 | | | | 18,599 | | | | 12,093 | | | | 16,731 | | | | 138,109 | | |
Investments accounted for using the equity method (e) | | | | 287 | | | | 1,422 | | | | 1,044 | | | | 956 | | | | 3 | | | | 3,712 | |
| | | | | | | | | | | | | | | | | | | | | | | | | | | | | | | | | | | | | | | |
Total liabilities | | | 6,105 | | | | 3,009 | | | | 3,956 | | | | 4,549 | | | | 3,471 | | | | 44,984 | | | | 66,074 | | |
Total assets (e) | | | | 43,183 | | | | 26,340 | | | | 26,808 | | | | 14,182 | | | | 14,067 | | | | 124,580 | |
| | | | | | | | | | | | | | | | | | | | | | | | | | | | | | | | | | | | | | | |
Total liabilities (e) | | | | 6,896 | | | | 2,639 | | | | 2,854 | | | | 2,413 | | | | 39,233 | | | | 54,035 | |
| | | | | | | | | | | | | | | | | | | |
| | | | | | | | | | | | | | | | | | | | | | | | | | | | |
| | | Petroleum
and Potash | | | Copper | | | Iron Ore | | | Coal | | | Aluminium,
Manganese
and Nickel | | | Group and
unallocated
items/
eliminations (f) | | | BHP
Billiton
Group | |
| US$M | |
Year ended 30 June 2012 | | | | | | | | | | | | | | | | | | | | | | | | | | | | |
Revenue | | | | | | | | | | | | | | | | | | | | | | | | | | | | |
Group production | | | 12,616 | | | | 11,162 | | | | 22,156 | | | | 12,724 | | | | 8,334 | | | | 1,326 | | | | 68,318 | |
Third party products | | | 230 | | | | 434 | | | | 86 | | | | 856 | | | | 1,563 | | | | 310 | | | | 3,479 | |
Rendering of services | | | 91 | | | | – | | | | 320 | | | | 18 | | | | – | | | | – | | | | 429 | |
Inter-segment revenue | | | – | | | | – | | | | 39 | | | | – | | | | 14 | | | | (53 | ) | | | – | |
| | | | | | | | | | | | | | | | | | | | | | | | | | | | |
| | | | | | | |
Total revenue(a) | | | 12,937 | | | | 11,596 | | | | 22,601 | | | | 13,598 | | | | 9,911 | | | | 1,583 | | | | 72,226 | |
| | | | | | | | | | | | | | | | | | | | | | | | | | | | |
Underlying EBITDA(b) | | | 9,087 | | | | 4,687 | | | | 15,027 | | | | 3,592 | | | | 809 | | | | 544 | | | | 33,746 | |
| | | | | | | | | | | | | | | | | | | | | | | | | | | | |
Depreciation and amortisation | | | (2,916 | ) | | | (793 | ) | | | (826 | ) | | | (797 | ) | | | (811 | ) | | | (265 | ) | | | (6,408 | ) |
Impairment (losses)/reversals | | | (151 | ) | | | 71 | | | | – | | | | 2 | | | | (22 | ) | | | – | | | | (100 | ) |
| | | | | | | | | | | | | | | | | | | | | | | | | | | | |
Underlying EBIT(b) | | | 6,020 | | | | 3,965 | | | | 14,201 | | | | 2,797 | | | | (24 | ) | | | 279 | | | | 27,238 | |
| | | | | | | | | | | | | | | | | | | | | | | | | | | | |
Comprising: | | | | | | | | | | | | | | | | | | | | | | | | | | | | |
Group production | | | 6,017 | | | | 3,982 | | | | 14,170 | | | | 2,707 | | | | (43 | ) | | | 279 | | | | 27,112 | |
Third party products | | | 3 | | | | (17 | ) | | | 31 | | | | 90 | | | | 19 | | | | – | | | | 126 | |
| | | | | | | | | | | | | | | | | | | | | | | | | | | | |
Underlying EBIT(b) | | | 6,020 | | | | 3,965 | | | | 14,201 | | | | 2,797 | | | | (24 | ) | | | 279 | | | | 27,238 | |
| | | | | | | | | | | | | | | | | | | | | | | | | | | | |
Net finance costs(c) | | | | | | | | | | | | | | | | | | | | | | | | | | | (730 | ) |
Exceptional items(d) | | | | | | | | | | | | | | | | | | | | | | | | | | | (3,486 | ) |
| | | | | | | | | | | | | | | | | | | | | | | | | | | | |
| | | | | | | |
Profit before taxation | | | | | | | | | | | | | | | | | | | | | | | | | | | 23,022 | |
| | | | | | | | | | | | | | | | | | | | | | | | | | | | |
Capital expenditure | | | 6,290 | | | | 2,650 | | | | 5,634 | | | | 3,701 | | | | 1,783 | | | | 165 | | | | 20,223 | |
| | | | | | | | | | | | | | | | | | | | | | | | | | | | |
Total assets(e) | | | 39,920 | | | | 17,638 | | | | 22,726 | | | | 16,473 | | | | 16,759 | | | | 15,757 | | | | 129,273 | |
| | | | | | | | | | | | | | | | | | | | | | | | | | | | |
Total liabilities | | | 5,999 | | | | 3,627 | | | | 4,024 | | | | 5,197 | | | | 3,862 | | | | 39,479 | | | | 62,188 | |
| | | | | | | | | | | | | | | | | | | | | | | | | | | | |
| | | | | | | | | | | | | | | | | | | | | | | | |
| | | Petroleum
and Potash | | | Copper | | | Iron Ore | | | Coal | | | Group and
unallocated
items/
eliminations (f) | | | BHP
Billiton
Group | |
Year ended 30 June 2014 | | | | | | | | | | | | | | | | | | | | | | | | |
US$M | | | | | | | | | | | | | | | | | | | | | | | | |
Revenue | | | | | | | | | | | | | | | | | | | | | | | | |
Group production | | | 14,022 | | | | 11,759 | | | | 20,883 | | | | 6,536 | | | | 1,603 | | | | 54,803 | |
Third party products | | | 437 | | | | 1,030 | | | | 130 | | | | 27 | | | | 93 | | | | 1,717 | |
Rendering of services | | | 112 | | | | – | | | | 130 | | | | – | | | | – | | | | 242 | |
Inter-segment revenue | | | 262 | | | | – | | | | 213 | | | | – | | | | (475 | ) | | | – | |
| | | | | | | | | | | | | | | | | | | | | | | | |
| | | | | | |
Total revenue (a) | | | 14,833 | | | | 12,789 | | | | 21,356 | | | | 6,563 | | | | 1,221 | | | | 56,762 | |
| | | | | | | | | | | | | | | | | | | | | | | | |
Underlying EBITDA (b) | | | 9,615 | | | | 6,127 | | | | 13,531 | | | | 1,258 | | | | (239 | ) | | | 30,292 | |
| | | | | | | | | | | | | | | | | | | | | | | | |
Depreciation and amortisation | | | (3,951 | ) | | | (1,371 | ) | | | (1,464 | ) | | | (683 | ) | | | (247 | ) | | | (7,716 | ) |
Impairment (losses)/reversals | | | (377 | ) | | | (88 | ) | | | 35 | | | | – | | | | (48 | ) | | | (478 | ) |
| | | | | | | | | | | | | | | | | | | | | | | | |
Underlying EBIT (b) | | | 5,287 | | | | 4,668 | | | | 12,102 | | | | 575 | | | | (534 | ) | | | 22,098 | |
| | | | | | | | | | | | | | | | | | | | | | | | |
Comprising: | | | | | | | | | | | | | | | | | | | | | | | | |
Group production | | | 5,288 | | | | 4,222 | | | | 11,498 | | | | 435 | | | | (545 | ) | | | 20,898 | |
Third party products | | | 3 | | | | 8 | | | | (3) | | | | – | | | | 7 | | | | 15 | |
Share of operating profit of equity accounted investments | | | (4 | ) | | | 438 | | | | 607 | | | | 140 | | | | 4 | | | | 1,185 | |
| | | | | | | | | | | | | | | | | | | | | | | | |
Underlying EBIT (b) | | | 5,287 | | | | 4,668 | | | | 12,102 | | | | 575 | | | | (534 | ) | | | 22,098 | |
| | | | | | | | | | | | | | | | | | | | | | | | |
Net finance costs (c) | | | | | | | | | | | | | | | | | | | | | | | (914 | ) |
Exceptional items (d) | | | | | | | | | | | | | | | | | | | | | | | 551 | |
| | | | | | | | | | | | | | | | | | | | | | | | |
Profit before taxation | | | | | | | | | | | | | | | | | | | | | | | 21,735 | |
| | | | | | | | | | | | | | | | | | | | | | | | |
| | | | | | |
Capital expenditure | | | 6,423 | | | | 3,697 | | | | 2,949 | | | | 1,971 | | | | 184 | | | | 15,224 | |
| | | | | | | | | | | | | | | | | | | | | | | | |
Investments accounted for using the equity method (e) | | | 115 | | | | 1,386 | | | | 1,069 | | | | 1,079 | | | | 15 | | | | 3,664 | |
| | | | | | | | | | | | | | | | | | | | | | | | |
Total assets (e) | | | 47,046 | | | | 24,255 | | | | 27,412 | | | | 14,919 | | | | 37,781 | | | | 151,413 | |
| | | | | | | | | | | | | | | | | | | | | | | | |
Total liabilities (e) | | | 7,532 | | | | 2,258 | | | | 4,022 | | | | 3,010 | | | | 49,209 | | | | 66,031 | |
| | | | | | | | | | | | | | | | | | | | | | | | |
| | | | Petroleum
and Potash | | Copper | | Iron Ore | | Coal | | Aluminium,
Manganese
and Nickel | | Group and
unallocated
items/
eliminations (f) | | BHP
Billiton
Group | | | Petroleum
and Potash | | Copper | | Iron Ore | | Coal | | Group and
unallocated
items/
eliminations (f) | | BHP
Billiton
Group | |
Year ended 30 June 2013 | | | | | | | | | | | | | |
| US$M | US$M | | | | | | | | | | | | | |
Year ended 30 June 2011 | | | | | | | | | | | | | | | |
Revenue | | | | | | | | | | | | | | | | | | | | | | | | | | |
Group production | | | 10,603 | | | 13,550 | | | 20,182 | | | 12,216 | | | 9,722 | | | 1,517 | | | 67,790 | | | | 12,951 | | | 12,472 | | | 18,331 | | | 6,566 | | | 2,098 | | | 52,418 | |
Third party products | | | 127 | | | 602 | | | 93 | | | 851 | | | 1,778 | | | 385 | | | 3,836 | | | | 175 | | | 700 | | | 86 | | | 8 | | | 254 | | | 1,223 | |
Rendering of services | | | 2 | | | – | | | 98 | | | 13 | | | – | | | – | | | 113 | | | | 98 | | | | – | | | 121 | | | | – | | | | – | | | 219 | |
Inter-segment revenue | | | 5 | | | – | | | 39 | | | – | | | 5 | | | (49 | ) | | – | | | | – | | | | – | | | 55 | | | | – | | | (55 | ) | | | – | |
| | | | | | | | | | | | | | | | | | | | | | | | | | | | | | | | | | | | | | | |
| Total revenue(a) | | | 10,737 | | | | 14,152 | | | | 20,412 | | | | 13,080 | | | | 11,505 | | | | 1,853 | | | | 71,739 | | | | 13,224 | | | 13,172 | | | 18,593 | | | 6,574 | | | 2,297 | | | 53,860 | |
| | | | | | | | | | | | | | | | | | | | | | | | | | | | | | | | | | | | | | | |
Underlying EBITDA(b) | | | 8,190 | | | | 7,525 | | | | 13,946 | | | | 4,496 | | | | 2,366 | | | | 570 | | | | 37,093 | | | | 8,910 | | | 6,239 | | | 12,113 | | | 950 | | | (103 | ) | | 28,109 | |
| | | | | | | | | | | | | | | | | | | | | | | | | | | | | | | | | | | | | | | |
Depreciation and amortisation | | | (1,913 | ) | | | (735 | ) | | | (618 | ) | | | (697 | ) | | | (817 | ) | | | (259 | ) | | | (5,039 | ) | | | (3,068 | ) | | (1,157 | ) | | (917 | ) | | (526 | ) | | (399 | ) | | (6,067 | ) |
Impairment (losses)/reversals | | | (76 | ) | | | – | | | | – | | | | – | | | | 2 | | | | – | | | | (74 | ) | |
Impairment losses | | | | (206 | ) | | (49 | ) | | (87 | ) | | | – | | | (20 | ) | | (362 | ) |
| | | | | | | | | | | | | | | | | | | | | | | | | | | | | | | | | | | | | | | |
Underlying EBIT(b) | | | 6,201 | | | | 6,790 | | | | 13,328 | | | | 3,799 | | | | 1,551 | | | | 311 | | | | 31,980 | | | | 5,636 | | | 5,033 | | | 11,109 | | | 424 | | | (522 | ) | | 21,680 | |
| | | | | | | | | | | | | | | | | | | | | | | | | | | | | | | | | | | | | | | |
Comprising: | | | | | | | | | | | | | | | | | | | | | | | | | | |
Group production | | | 6,196 | | | | 6,796 | | | | 13,296 | | | | 3,728 | | | | 1,555 | | | | 311 | | | | 31,882 | | | | 5,616 | | | 4,575 | | | 10,565 | | | 281 | | | (563 | ) | | 20,474 | |
Third party products | | | 5 | | | | (6 | ) | | | 32 | | | | 71 | | | | (4 | ) | | | – | | | | 98 | | | | 11 | | | 3 | | | 31 | | | 2 | | | 17 | | | 64 | |
Share of operating profit of equity accounted investments | | | | 9 | | | 455 | | | 513 | | | 141 | | | 24 | | | 1,142 | |
| | | | | | | | | | | | | | | | | | | | | | | | | | | | | | | | | | | | | | | |
Underlying EBIT(b) | | | 6,201 | | | | 6,790 | | | | 13,328 | | | | 3,799 | | | | 1,551 | | | | 311 | | | | 31,980 | | | | 5,636 | | | 5,033 | | | 11,109 | | | 424 | | | (522 | ) | | 21,680 | |
| | | | | | | | | | | | | | | | | | | | | | | | | | | | | | | | | | | | | | | |
Net finance costs(c) | | | | | | | | | | | | | | | (561 | ) | | | | | | | | | | | | (1,149 | ) |
Exceptional items(d) | | | | | | | | | | | | | | | (164 | ) | | | | | | | | | | | | 297 | |
| | | | | | | | | | | | | | | | | | | | | | | | | | | | |
| Profit before taxation | | | | | | | | | | | | | | | 31,255 | | | | | | | | | | | | | 20,828 | |
| | | | | | | | | | | | | | | | | | | | | | | | | | | | |
Capital expenditure | | | 2,205 | | | | 1,404 | | | | 3,627 | | | | 1,926 | | | | 2,256 | | | | 192 | | | | 11,610 | | | | 7,675 | | | 3,891 | | | 5,979 | | | 3,136 | | | 423 | | | 21,104 | |
| | | | | | | | | | | | | | | | | | | | | | | | | | | | | | | | | | | | | | | |
Investments accounted for using the equity method (e) | | | | 130 | | | 1,351 | | | 1,044 | | | 1,150 | | | | – | | | 3,675 | |
| | | | | | | | | | | | | | | | | | | |
Total assets(e) | | | 19,591 | | | | 15,973 | | | | 17,585 | | | | 12,907 | | | | 16,953 | | | | 19,911 | | | | 102,920 | | | | 44,383 | | | 22,214 | | | 25,877 | | | 13,589 | | | 33,115 | | | 139,178 | |
| | | | | | | | | | | | | | | | | | | | | | | | | | | | | | | | | | | | | | | |
Total liabilities | | | 4,605 | | | | 3,118 | | | | 3,652 | | | | 4,474 | | | | 4,234 | | | | 25,082 | | | | 45,165 | | |
Total liabilities (e) | | | | 6,858 | | | 2,346 | | | 3,751 | | | 2,957 | | | 47,975 | | | 63,887 | |
| | | | | | | | | | | | | | | | | | | | | | | | | | | | | | | | | | | | | | | |
| (a) | Revenue not attributable to reportable segments comprises the sale of freight and fuel to third parties, as well as revenues from unallocated operations described in footnote (f). |
| (b) | Underlying EBIT is earnings before net finance costs, taxation expense, Discontinued operations and any exceptional items. Underlying EBIT is reported net of the Group’s share of net finance costs and taxation expense of equity accounted investments. Underlying EBITDA is Underlying EBIT before depreciation, amortisationimpairments and impairments.amortisation. |
| (c) | Refer to note 6 Net16 ‘Net finance costs.costs’. |
| (d) | Refer to note 3 Exceptional items.2 ‘Exceptional items’. |
| (e) | Total segment assets and liabilities of Businesses represents operating assets net of operating liabilities including the carrying amount of equity accounted investments and predominantly excludes cash balances, interest bearing liabilities and deferred tax balances. The carrying value of investments accounted for using the equity method represents the balance of the Group’s investment in Petroleumequity accounted investments, with no adjustment for any cash balances, interest bearing liabilities and Potash increased from US$19.6 billion at 30 June 2011 to US$39.9 billion at 30 June 2012, predominantly arising fromdeferred tax balances of the acquisition of Petrohawk Energy Corporation – refer to note 24 Business combinations.equity accounted investment. |
| (f) | Includes the Group’s diamonds business (divested effective 10 April 2013), interestother unallocated operations including Nickel West (previously disclosed in titanium minerals (divested effective 3 September 2012) and non-Potash corporate costs incurred by the former DiamondsAluminium, Manganese and Specialty Products business.Nickel Business) and consolidation adjustments. Total assets, total liabilities and investments accounted for using the equity method include Discontinued operation’s balances for the year ended 30 June 2014 and for the year ended 30 June 2013. |
Geographical information
| | | | Revenue by location of customer | | | Revenue by location of customer | |
| | | 2013 | | 2012 | | 2011 | | | 2015 | | | 2014 | | | 2013 | |
| | | US$M | | US$M | | US$M | | | US$M | | | US$M | | | US$M | |
Australia | | | 4,583 | | | | 5,318 | | | | 5,487 | | | | 2,205 | | | | 3,106 | | | | 3,556 | |
United Kingdom | | | 1,651 | | | | 956 | | | | 1,043 | | | | 230 | | | | 979 | | | | 1,244 | |
Rest of Europe | | | 6,317 | | | | 7,419 | | | | 8,370 | | | | 2,235 | | | | 2,457 | | | | 2,843 | |
China | | | 19,365 | | | | 21,617 | | | | 20,261 | | | | 16,337 | | | | 21,873 | | | | 18,759 | |
Japan | | | 7,783 | | | | 8,920 | | | | 9,002 | | | | 4,863 | | | | 6,305 | | | | 7,143 | |
India | | | | 1,680 | | | | 2,009 | | | | 1,692 | |
South Korea | | | | 2,688 | | | | 4,104 | | | | 3,751 | |
Rest of Asia | | | 13,642 | | | | 15,035 | | | | 15,805 | | | | 4,734 | | | | 3,816 | | | | 4,343 | |
North America | | | 8,417 | | | | 8,099 | | | | 6,167 | | | | 7,990 | | | | 9,607 | | | | 7,984 | |
South America | | | 1,782 | | | | 2,013 | | | | 2,592 | | | | 1,342 | | | | 1,994 | | | | 1,791 | |
Southern Africa | | | 1,316 | | | | 1,437 | | | | 1,548 | | | | 10 | | | | – | | | | 67 | |
Rest of world | | | 1,112 | | | | 1,412 | | | | 1,464 | | | | 322 | | | | 512 | | | | 687 | |
| | | | | | | | | | | | | | | | | | |
| | | 65,968 | | | | 72,226 | | | | 71,739 | | | | 44,636 | | | | 56,762 | | | | 53,860 | |
| | | | | | | | | | | | | | | | | | |
| | | | Non-current assets by location of assets | | |
| | | 2013 | | 2012 | | 2011 | | |
| | | US$M | | US$M | | US$M | | |
Australia | | | 56,785 | | | | 53,072 | | | | 42,723 | | |
United Kingdom | | | 332 | | | | 238 | | | | 229 | | |
North America | | | 33,861 | | | | 31,124 | | | | 11,748 | | |
South America | | | 13,682 | | | | 11,857 | | | | 10,125 | | |
Southern Africa | | | 5,081 | | | | 5,381 | | | | 5,944 | | |
Rest of world | | | 748 | | | | 744 | | | | 849 | | |
Unallocated assets(a) | | | 7,834 | | | | 6,406 | | | | 6,022 | | |
| | | | | | | | | | |
| | | 118,323 | | | | 108,822 | | | | 77,640 | | |
| | | | | | | | | | |
| | | | | | | | | | | | |
| | | Non-current assets by location of assets | |
| | | 2015 | | | 2014 | | | 2013 | |
| | | US$M | | | US$M | | | US$M | |
Australia | | | 52,109 | | | | 60,408 | | | | 56,173 | |
United Kingdom | | | 172 | | | | 516 | | | | 436 | |
North America | | | 33,091 | | | | 35,845 | | | | 33,844 | |
South America | | | 15,831 | | | | 15,926 | | | | 13,695 | |
Southern Africa | | | 11 | | | | 4,570 | | | | 5,081 | |
Rest of world | | | 2,977 | | | | 3,107 | | | | 3,208 | |
Unallocated assets(a) | | | 4,020 | | | | 8,745 | | | | 7,788 | |
| | | | | | | | | | | | |
| | | 108,211 | | | | 129,117 | | | | 120,225 | |
| | | | | | | | | | | | |
| (a) | Unallocated assets predominantly includecomprise deferred tax assets and other financial assets. |
Refer to note 43 ‘Significant accounting policies’ (d), (e), (g), (r), (x) and (y).
32. Exceptional items
Exceptional items are those items where their nature and amount is considered material to the financial statements. Such items included within the Group’s profit for the year from Continuing operations are detailed below. Exceptional items attributable to Discontinued operations are detailed in note 29 ‘Discontinued operations’.
| | | | | | | | | | | | |
Year ended 30 June 2013 | | Gross | | | Tax | | | Net | |
| | | US$M | | | US$M | | | US$M | |
Exceptional items by category | | | | | | | | | | | | |
Sale of Yeelirrie uranium deposit | | | 420 | | | | – | | | | 420 | |
Sale of Richards Bay Minerals | | | 1,373 | | | | (183 | ) | | | 1,190 | |
Sale of diamonds business | | | (232 | ) | | | (5 | ) | | | (237 | ) |
Sale of East and West Browse Joint Ventures | | | 1,539 | | | | (188 | ) | | | 1,351 | |
Impairment of Nickel West assets | | | (1,698 | ) | | | 454 | | | | (1,244 | ) |
Impairment of Worsley assets | | | (2,190 | ) | | | 559 | | | | (1,631 | ) |
Impairment of Permian Basin assets | | | (266 | ) | | | 99 | | | | (167 | ) |
Other impairments arising from capital project review | | | (1,006 | ) | | | 291 | | | | (715 | ) |
Newcastle steelworks rehabilitation | | | 158 | | | | (47 | ) | | | 111 | |
| | | | | | | | | | | | |
| | | (1,902 | ) | | | 980 | | | | (922 | ) |
| | | | | | | | | | | | |
| | | | | | | | | | | | |
Year ended 30 June 2015 | | Gross | | | Tax | | | Net | |
| | | US$M | | | US$M | | | US$M | |
Exceptional items by category | | | | | | | | | | | | |
Impairment of Onshore US assets | | | (2,787 | ) | | | 829 | | | | (1,958 | ) |
Impairment of Nickel West assets | | | (409 | ) | | | 119 | | | | (290 | ) |
Repeal of Minerals Resource Rent Tax legislation (a) | | | – | | | | (698 | ) | | | (698 | ) |
| | | | | | | | | | | | |
| | | (3,196 | ) | | | 250 | | | | (2,946 | ) |
| | | | | | | | | | | | |
| (a) | Includes amounts attributable to non-controlling interests of US$(12) million. |
Impairment of Onshore US assets
The Group recognised an impairment charge of US$1,958 million (after tax benefit) in relation to its Onshore US assets. The gas focused Hawkville field accounts for the substantial majority of this charge reflecting its geological complexity, product mix, acreage relinquishments and amended development plans. The remainder relates to the impairment of goodwill associated with the Petrohawk acquisition.
Impairment of Nickel West assets
On 12 November 2014, the Group announced that the review of its Nickel West business was complete and the preferred option, the sale of the business, was not achieved on an acceptable basis. As a result of operational decisions made subsequent to the conclusion of this process, an impairment charge of US$290 million (after tax benefit) was recognised in the year ended 30 June 2015.
Repeal of Minerals Resource Rent Tax legislation
The legislation to repeal the Minerals Resource Rent Tax (MRRT) in Australia took effect on 30 September 2014. As a result, the Group derecognised a MRRT deferred tax asset of US$809 million and corresponding taxation charges of US$698 million related to Continuing operations and US$111 million related to Discontinued operations were recognised in the year ended 30 June 2015.
| | | | | | | | | | | | |
Year ended 30 June 2014 | | Gross | | | Tax | | | Net | |
| | | US$M | | | US$M | | | US$M | |
Exceptional items by category | | | | | | | | | | | | |
Sale of Pinto Valley | | | 551 | | | | (166 | ) | | | 385 | |
| | | | | | | | | | | | |
| | | 551 | | | | (166 | ) | | | 385 | |
| | | | | | | | | | | | |
Sale of Pinto Valley
On 11 October 2013, the Group announced it had completed the sale of its Pinto Valley mining operation for cash consideration of US$653 million, after working capital adjustments. A gain on sale of US$385 million (after tax expense) was recognised in the year ended 30 June 2014.
| | | | | | | | | | | | |
Year ended 30 June 2013 | | Gross | | | Tax | | | Net | |
| | | US$M | | | US$M | | | US$M | |
Exceptional items by category | | | | | | | | | | | | |
Sale of Yeelirrie uranium deposit | | | 420 | | | | – | | | | 420 | |
Sale of Richards Bay Minerals | | | 1,212 | | | | (183 | ) | | | 1,029 | |
Sale of diamonds business | | | (97 | ) | | | (42 | ) | | | (139 | ) |
Sale of East and West Browse Joint Ventures | | | 1,539 | | | | (188 | ) | | | 1,351 | |
Impairment of Nickel West assets | | | (1,698 | ) | | | 454 | | | | (1,244 | ) |
Impairment of Permian Basin assets | | | (266 | ) | | | 99 | | | | (167 | ) |
Other impairments arising from capital project review | | | (971 | ) | | | 291 | | | | (680 | ) |
Newcastle steelworks rehabilitation | | | 158 | | | | (47 | ) | | | 111 | |
| | | | | | | | | | | | |
| | | 297 | | | | 384 | | | | 681 | |
| | | | | | | | | | | | |
Exceptional items are classified by nature as follows:
| Year ended 30 June 2013 | | Sale of
assets | | Impairment
of goodwill
and other
assets | | Restructuring
costs | | Closure and
rehabilitation
provisions
released | | Gross | | |
| | | US$M | | US$M | | US$M | | US$M | | US$M | | |
Year ended 30 June 2013 US$M | | | Sale of
assets | | Impairment
of goodwill
and other
assets | | Restructuring
costs | | Closure and
rehabilitation
provisions
released | | Gross | |
Sale of Yeelirrie uranium deposit | | | 420 | | | | – | | | | – | | | | – | | | | 420 | | | 420 | | | | – | | | | – | | | | – | | | 420 | |
Sale of Richards Bay Minerals | | | 1,373 | | | | – | | | | – | | | | – | | | | 1,373 | | | 1,212 | | | | – | | | | – | | | | – | | | 1,212 | |
Sale of diamonds business | | | – | | | | (232 | ) | | | – | | | | – | | | | (232 | ) | | | – | | | (97 | ) | | | – | | | | – | | | (97 | ) |
Sale of East and West Browse Joint Ventures | | | 1,539 | | | | – | | | | – | | | | – | | | | 1,539 | | | 1,539 | | | | – | | | | – | | | | – | | | 1,539 | |
Impairment of Nickel West assets | | | – | | | | (1,698 | ) | | | – | | | | – | | | | (1,698 | ) | | | – | | | (1,698 | ) | | | – | | | | – | | | (1,698 | ) |
Impairment of Worsley assets | | | – | | | | (2,190 | ) | | | – | | | | – | | | | (2,190 | ) | |
Impairment of Permian Basin assets | | | – | | | | (266 | ) | | | – | | | | – | | | | (266 | ) | | | – | | | (266 | ) | | | – | | | | – | | | (266 | ) |
Other impairments arising from capital project review | | | – | | | | (898 | ) | | | (108 | ) | | | – | | | | (1,006 | ) | | | – | | | (863 | ) | | (108 | ) | | | – | | | (971 | ) |
Newcastle steelworks rehabilitation | | | – | | | | – | | | | – | | | | 158 | | | | 158 | | | | – | | | | – | | | | – | | | 158 | | | 158 | |
| | | | | | | | | | | | | | | | | | | | | | | | | | | | | | |
| | | 3,332 | | | | (5,284 | ) | | | (108 | ) | | | 158 | | | | (1,902 | ) | | 3,171 | | | (2,924 | ) | | (108 | ) | | 158 | | | 297 | |
| | | | | | | | | | | | | | | | | | | | | | | | | | | | | | |
Sale of Yeelirrie uranium deposit:deposit
On 27 August 2012, the Group announced the sale of its wholly owned Yeelirrie uranium deposit and the transaction was completed on 19 December 2012. A gain on sale of US$420 million was recognised in the year ended 30 June 2013, while the associated tax expense was offset by the recognition of deferred tax benefits on available tax losses of US$126 million.
Sale of Richards Bay Minerals:Minerals
On 7 September 2012, the Group announced it had completed the sale of its 37.76 per cent effective interest in Richards Bay Minerals. A gain on sale of US$1,1901,029 million (after tax expense) was recognised in the year ended 30 June 2013.
Sale of diamonds business:business
On 13 November 2012, the Group announced the sale of its diamonds business, comprising its interests in the EKATI Diamond Mine and Diamond Marketing operations. The transaction was completed on 10 April 2013 for an aggregate cash consideration of US$553 million (after adjustments). An impairment charge of US$237139 million (after tax expense) was recognised based on the final consideration.
Sale of East and West Browse Joint Ventures:Ventures
On 12 December 2012, the Group signed a definitive agreement to sell its 8.33 per cent interest in the East Browse Joint Venture and 20 per cent interest in the West Browse Joint Venture. A gain on sale of US$1,539 million was recognised in the year ended 30 June 2013. The associated tax expense of US$462 million was partly offset by the recognition of deferred tax benefits on available tax losses of US$241 million and the derecognition of deferred tax liabilities of US$33 million. The transaction was completed on 7 June 2013.
Impairment of Nickel West assets:assets
As a result of expected continued strength in the Australian dollar and weak nickel prices, the Group recognised an impairment charge of US$1,244 million (after tax benefit) in the year ended 30 June 2013.
Impairment of Worsley assets:
The Group recognised an impairment of assets at Worsley as a result of expected continued strength in the Australian dollar and weak alumina prices. A total impairment charge of US$1,631 million (after tax benefit) was recognised in the year ended 30 June 2013.
Impairment of Permian Basin assets:assets
An impairment charge of US$167 million (after tax benefit) was recognised as the performance of specific evaluation wells in certain areas of the Permian Basin (US) do not support economic development.
Other impairments arising from capital project review:review
In the year ended 30 June 2013, WAIOWestern Australia Iron Ore (WAIO) refocused its attention on the capital efficientcapital-efficient expansion opportunity that exists within the Port Hedland inner harbour and all early works associated with the outer harbour development option were suspended. This revision to the WAIO development sequence and the change in status of other minor capital projects across the Group has resulted in the recognition of impairment charges of US$639604 million (after tax benefit) and other restructuring costs of US$76 million (after tax benefit) in the year ended 30 June 2013.
Newcastle steelworks rehabilitation:rehabilitation
The Group recognised a decrease of US$158 million (before tax expense) to its rehabilitation obligations in respect of former operations at the Newcastle steelworks (Australia). This followed the completion of the Hunter River Remediation Project and reaching agreement with the Environment Protection Authority in March 2013 regarding the necessary scope of work to repeal the Environmental Classification at Steel River.
| | | | | | | | | | | | |
Year ended 30 June 2012 | | Gross | | | Tax | | | Net | |
| | | US$M | | | US$M | | | US$M | |
Exceptional items by category | | | | | | | | | | | | |
Impairment of Fayetteville goodwill and other assets | | | (2,835 | ) | | | 996 | | | | (1,839 | ) |
Impairment of Nickel West goodwill and other assets | | | (449 | ) | | | 94 | | | | (355 | ) |
Suspension or early closure of operations and the change in status of specific projects (a) | | | (502 | ) | | | 108 | | | | (394 | ) |
Settlement of insurance claims(a) | | | 300 | | | | (90 | ) | | | 210 | |
Recognition of deferred tax assets on enactment of MRRT and PRRT extension legislation in Australia | | | – | | | | 637 | | | | 637 | |
| | | | | | | | | | | | |
| | | (3,486 | ) | | | 1,745 | | | | (1,741 | ) |
| | | | | | | | | | | | |
(a) | Includes gross amounts attributable to non-controlling interest of US$(34) million (US$7 million tax expense). |
Exceptional items are classified by nature as follows:
| | | | | | | | | | | | | | | | | | | | |
Year ended 30 June 2012 | | Impairment
of goodwill
and other
assets | | | Idle capacity
costs and
inventory
write-downs | | | Restructuring
costs | | | Insurance
recoveries | | | Gross | |
| | | US$M | | | US$M | | | US$M | | | US$M | | | US$M | |
Impairment of Fayetteville goodwill and other assets | | | (2,835 | ) | | | – | | | | – | | | | – | | | | (2,835 | ) |
Impairment of Nickel West goodwill and other assets | | | (406 | ) | | | (43 | ) | | | – | | | | – | | | | (449 | ) |
Suspension or early closure of operations and the change in status of specific projects | | | (422 | ) | | | (40 | ) | | | (40 | ) | | | – | | | | (502 | ) |
Settlement of insurance claims | | | – | | | | – | | | | – | | | | 300 | | | | 300 | |
| | | | | | | | | | | | | | | | | | | | |
| | | (3,663 | ) | | | (83 | ) | | | (40 | ) | | | 300 | | | | (3,486 | ) |
| | | | | | | | | | | | | | | | | | | | |
Impairment of Fayetteville goodwill and other assets:
As a result of the fall in United States domestic gas prices and the Company’s decision to adjust its development plans, the Group recognised impairments of goodwill and other assets in relation to its Fayetteville shale gas assets. A total impairment charge of US$1,839 million (after tax benefit) was recognised in the year ended 30 June 2012.
Impairment of Nickel West goodwill and other assets:
The Group recognised impairments of goodwill and other assets at Nickel West as a result of the continued downturn in the nickel price and margin deterioration. A total impairment charge of US$355 million (after tax benefit) was recognised in the year ended 30 June 2012.
Suspension or early closure of operations and the change in status of specific projects:
As part of our regular portfolio review, various operations and projects around the Group were either suspended, closed early or changed in status. These included: the change in status of the Olympic Dam expansion project; the temporary suspension of production at TEMCO and the permanent closure of the Metalloys South Plant in South Africa; the indefinite cessation of production at Norwich Park; and the suspension of other minor capital projects. As a result, impairment charges of US$338 million (after tax benefit), idle capacity costs and inventory write-down of US$28 million (after tax benefit) and other restructuring costs of US$28 million (after tax benefit) were recognised in the year ended 30 June 2012.
Settlement of insurance claims:
During 2008, extreme weather across the central Queensland coalfields affected production from the BHP Billiton Mitsubishi Alliance (BMA) and BHP Billiton Mitsui Coal (BMC) operations. The Group settled insurance claims in respect of the lost production and insurance claim income of US$210 million (after tax expense) was recognised in the year ended 30 June 2012.
Recognition of deferred tax assets on enactment of MRRT and PRRT extension legislation in Australia:
The Australian MRRT and PRRT extension legislation were enacted in March 2012. Under the legislation, the Group is entitled to a deduction against future Minerals Resource Rent Tax (MRRT) and Petroleum Resource
Rent Tax (PRRT) liabilities based on the market value of its coal, iron ore and petroleum assets. A deferred tax asset, and an associated net income tax benefit of US$637 million, was recognised in the year ended 30 June 2012 to reflect the future deductibility of these market values for MRRT and PRRT purposes, to the extent they were considered recoverable.
| | | | | | | | | | | | |
Year ended 30 June 2011 | | Gross | | | Tax | | | Net | |
| | | US$M | | | US$M | | | US$M | |
Exceptional items by category | | | | | | | | | | | | |
Withdrawn offer for PotashCorp | | | (314 | ) | | | – | | | | (314 | ) |
Newcastle steelworks rehabilitation | | | 150 | | | | (45 | ) | | | 105 | |
Release of income tax provisions | | | – | | | | 718 | | | | 718 | |
Reversal of deferred tax liabilities | | | – | | | | 1,455 | | | | 1,455 | |
| | | | | | | | | | | | |
| | | (164 | ) | | | 2,128 | | | | 1,964 | |
| | | | | | | | | | | | |
Exceptional items are classified by nature as follows:
| | | | | | | | | | | | |
Year ended 30 June 2011 | | External
services | | | Closure and
rehabilitation
provisions
released | | | Gross | |
| | | US$M | | | US$M | | | US$M | |
Withdrawn offer for PotashCorp | | | (314 | ) | | | – | | | | (314 | ) |
Newcastle steelworks rehabilitation | | | – | | | | 150 | | | | 150 | |
| | | | | | | | | | | | |
| | | (314 | ) | | | 150 | | | | (164 | ) |
| | | | | | | | | | | | |
Withdrawn offer for Potash Corporation of Saskatchewan Inc. (PotashCorp):
The Group withdrew its offer for PotashCorp on 15 November 2010 following the Board’s conclusion that the condition of the offer relating to receipt of a net benefit as determined by the Minister of Industry under the Investment Canada Act could not be satisfied. The Group incurred fees associated with the US$45 billion debt facility (US$240 million), investment bankers’, lawyers’ and accountants’ fees, printing expenses and other charges (US$74 million) in progressing this matter during the period up to the withdrawal of the offer, which were expensed as operating costs in the year ended 30 June 2011.
Newcastle steelworks rehabilitation:
The Group recognised a decrease of US$150 million (before tax expense) to its rehabilitation obligations in respect of former operations at the Newcastle steelworks (Australia) following a full review of the progress of the Hunter River Remediation Project and estimated costs to completion.
Release of income tax provisions:
The Australian Taxation Office (ATO) issued amended assessments in prior years denying bad debt deductions arising from the investments in Beenup and Boodarie Iron and the denial of capital allowance claims made on the Boodarie Iron project. The Group challenged the assessments and was successful on all counts before the Full Federal Court. The ATO obtained special leave in September 2010 to appeal to the High Court in respect of the denial of capital allowance claims made on the Boodarie Iron project. The Group’s position in respect of the capital allowance claims on the Boodarie Iron project was confirmed by the High Court in June 2011. As a result of these appeals, US$138 million was released from the Group’s income tax provision in September 2010 and US$580 million in June 2011.
Reversal of deferred tax liabilities:
Consistent with the functional currency of the Group’s operations, eligible Australian entities elected to adopt a US dollar tax functional currency from 1 July 2011. As a result, the deferred tax liability relating to certain US dollar denominated financial arrangements was derecognised, resulting in a credit to income tax expense of US$1,455 million.
4 Other income
| | | | | | | | | | | | |
| | | 2013 | | | 2012 | | | 2011 | |
| | | US$M | | | US$M | | | US$M | |
Dividend income | | | 19 | | | | 25 | | | | 12 | |
Royalties | | | 35 | | | | 28 | | | | 27 | |
Gains/(losses) on sale of property, plant and equipment(a) | | | 1,983 | | | | 99 | | | | (12 | ) |
Gains/(losses) on sale of investments | | | 10 | | | | (2 | ) | | | 53 | |
Gains on divestment of subsidiaries and operations(b) | | | 1,373 | | | | 19 | | | | – | |
Commission income | | | 93 | | | | 131 | | | | 142 | |
Insurance recoveries(c) | | | 16 | | | | 304 | | | | 10 | |
Other income | | | 601 | | | | 302 | | | | 299 | |
| | | | | | | | | | | | |
Total other income | | | 4,130 | | | | 906 | | | | 531 | |
| | | | | | | | | | | | |
(a) | Includes exceptional items of US$1,947 million (2012: US$ nil; 2011: US$ nil). Refer to note 3 Exceptional items. |
(b) | Includes exceptional item of US$1,373 million (2012: US$ nil; 2011: US$ nil). Refer to note 3 Exceptional items. |
(c) | Includes exceptional item of US$ nil (2012: US$300 million; 2011: US$ nil). Refer to note 3 Exceptional items. |
53. Expenses
| | | | 2013 | | 2012 | | 2011 | | | 2015 | | 2014 | | 2013 | |
| | | US$M | | US$M | | US$M | | | US$M | | US$M | | US$M | |
Changes in inventories of finished goods and work in progress | | | 193 | | | | 91 | | | | (394 | ) | | | 139 | | | (134 | ) | | (8 | ) |
Raw materials and consumables used | | | 9,445 | | | | 8,483 | | | | 8,148 | | | | 4,667 | | | 5,540 | | | 5,407 | |
Employee benefits expense | | | 7,432 | | | | 6,663 | | | | 5,299 | | | | 4,971 | | | 5,413 | | | 5,578 | |
External services (including transportation)(a) | | | 12,849 | | | | 14,716 | | | | 11,705 | | | | 8,928 | | | 9,899 | | | 10,202 | |
Third party commodity purchases | | | 2,642 | | | | 3,381 | | | | 3,758 | | | | 1,165 | | | 1,702 | | | 1,158 | |
Net foreign exchange (gains)/losses | | | (280 | ) | | | (519 | ) | | | 1,241 | | | | (469 | ) | | 168 | | | (187 | ) |
Research and development costs before crediting related grants | | | 64 | | | | 75 | | | | 74 | | | | 13 | | | 27 | | | 46 | |
Fair value change on derivatives(b) | | | 79 | | | | (143 | ) | | | (104 | ) | | | 124 | | | (122 | ) | | 63 | |
Impairment of available for sale financial assets | | | 1 | | | | 1 | | | | – | | | | 15 | | | 6 | | | 1 | |
Reversal of previously impaired financial assets | | | | (6 | ) | | | – | | | | – | |
Government royalties paid and payable | | | 2,679 | | | | 3,051 | | | | 2,887 | | | | 1,708 | | | 2,412 | | | 2,179 | |
Depreciation and amortisation expense | | | 6,945 | | | | 6,408 | | | | 5,039 | | | | 9,158 | | | 7,716 | | | 6,067 | |
Exploration and evaluation expenditure incurred and expensed in the current period | | | 1,022 | | | | 1,602 | | | | 981 | | | | 670 | | | 698 | | | 1,026 | |
Exploration and evaluation expenditure previously capitalised, written off as unsuccessful or abandoned(c) | | | 1,099 | | | | 144 | | | | 73 | | | | 48 | | | 167 | | | 1,099 | |
Reversal of previously written off capitalised exploration and evaluation expenditure | | | | (20 | ) | | (56 | ) | | | – | |
Impairment of property, plant and equipment(d) | | | 4,555 | | | | 3,114 | | | | 11 | | | | 3,449 | | | 344 | | | 2,246 | |
Reversal of previously impaired property, plant and equipment | | | (67 | ) | | | (71 | ) | | | (10 | ) | | | (4 | ) | | | – | | | (67 | ) |
Impairment of goodwill and other intangible assets(e) | | | 7 | | | | 575 | | | | – | | | | 542 | | | 17 | | | 7 | |
Operating lease rentals | | | 754 | | | | 635 | | | | 451 | | | | 636 | | | 665 | | | 679 | |
All other operating expenses(f) | | | 1,454 | | | | 1,174 | | | | 1,295 | | | | 1,276 | | | 2,061 | | | 1,333 | |
| | | | | | | | | | | | | | | | | | |
Total expenses | | | 50,873 | | | | 49,380 | | | | 40,454 | | | | 37,010 | | | 36,523 | | | 36,829 | |
| | | | | | | | | | | | | | | | | | |
| | | | 2013 | | 2012 | | 2011 | | | 2015 | | 2014 | | 2013 | |
| | | US$M | | US$M | | US$M | | | US$M | | US$M | | US$M | |
Aggregate employee benefits expense | | | | | | | | | | | | |
Wages, salaries and redundancies | | | 6,889 | | | | 6,191 | | | | 4,834 | | | | 4,537 | | | 4,799 | | | 5,195 | |
Employee share awards(g) | | | 212 | | | | 256 | | | | 199 | | | | 203 | | | 214 | | | 188 | |
Social security costs | | | 7 | | | | 12 | | | | 18 | | | | 2 | | | 3 | | | 2 | |
Pensions and other post-retirement obligations costs – refer to note 30 | | | 510 | | | | 456 | | | | 406 | | |
| | | | | | | | | | | | | | | | | | |
Pension and other post-retirement obligations | | | | 358 | | | 529 | | | 377 | |
| | | 7,618 | | | | 6,915 | | | | 5,457 | | | | | | | | | | |
| | | | | | | | | | | | 5,100 | | | 5,545 | | | 5,762 | |
Less employee benefits expense classified as exploration and evaluation expenditure above | | | 186 | | | | 252 | | | | 158 | | | | (129 | ) | | (132 | ) | | (184 | ) |
| | | | | | | | | | | | | | | | | | |
Employee benefits expense | | | 7,432 | | | | 6,663 | | | | 5,299 | | | | 4,971 | | | 5,413 | | | 5,578 | |
| | | | | | | | | | | | | | | | | | |
| (a) | Includes exceptional items of US$96 million (2012: nil (2014: US$ nil; 2011:2013: US$31496 million). Refer to note 3 Exceptional items.2 ‘Exceptional items’. |
| (b) | Fair value change on derivatives includesinclude realised gainslosses of US$56107 million (2012:(2014: US$12831 million realised losses; 2011:gains; 2013: US$12728 million realised gains) and unrealised losses of US$13517 million (2012:(2014: US$27192 million unrealised gains; 2011:gain; 2013: US$2392 million unrealised losses). |
| (c) | Includes exceptional items of US$832 million (2012: nil (2014: US$ nil; 2011:2013: US$ nil)797 million). Refer to note 3 Exceptional items.2 ‘Exceptional items’. |
| (d) | Includes exceptional items of US$4,4452,696 million (2012: US$3,088 million; 2011: US$ nil). Refer to note 3 Exceptional items. |
(e) | Includes exceptional items of US$7 million (2012: US$575 million; 2011: US$ nil). Refer to note 3 Exceptional items.
|
(f) | Includes exceptional items of US$158 million relating to the decrease in the rehabilitation obligations in respect of former operations at the Newcastle steelworks (2012:(2014: US$ nil; 2011: decrease of2013: US$1502,120 million). Refer to note 3 Exceptional items.
2 ‘Exceptional items’. |
(g) | Employee share awards expense is US$211.659 million (2012: US$256.117 million; 2011: US$199.140 million).
|
6 Net finance costs
| | | | | | | | | | | | |
| | | 2013 | | | 2012 | | | 2011 | |
| | | US$M | | | US$M | | | US$M | |
Financial expenses | | | | | | | | | | | | |
Interest on bank loans and overdrafts(a) | | | 9 | | | | 22 | | | | 19 | |
Interest on all other borrowings(a) (b) | | | 1,011 | | | | 696 | | | | 471 | |
Finance lease and hire purchase interest | | | 11 | | | | 37 | | | | 12 | |
Dividends on redeemable preference shares | | | – | | | | – | | | | – | |
Discounting on provisions and other liabilities | | | 473 | | | | 481 | | | | 411 | |
Discounting on post-retirement employee benefits | | | 111 | | | | 129 | | | | 128 | |
Interest capitalised(c) | | | (273 | ) | | | (314 | ) | | | (256 | ) |
Fair value change on hedged loans | | | (505 | ) | | | 345 | | | | (140 | ) |
Fair value change on hedging derivatives | | | 489 | | | | (365 | ) | | | 110 | |
Fair value change on non-hedging derivatives(b) | | | 183 | | | | (11 | ) | | | – | |
Exchange variations on net debt | | | 13 | | | | (65 | ) | | | 51 | |
| | | | | | | | | | | | |
| | | 1,522 | | | | 955 | | | | 806 | |
| | | | | | | | | | | | |
Financial income | | | | | | | | | | | | |
Interest income(d) | | | (77 | ) | | | (122 | ) | | | (141 | ) |
Expected return on pension scheme assets | | | (92 | ) | | | (103 | ) | | | (104 | ) |
| | | | | | | | | | | | |
| | | (169 | ) | | | (225 | ) | | | (245 | ) |
| | | | | | | | | | | | |
Net finance costs | | | 1,353 | | | | 730 | | | | 561 | |
| | | | | | | | | | | | |
(a) | Interest on bank loans and overdrafts, and other borrowings, relates to financial liabilities carried at amortised cost.
|
(b) | Interest on all other borrowings for the year ended 30 June 2013 included an amount of US$97 million of realised fair value changes on non-hedging derivatives used to manage interest rate exposure on debt securities. Fair value change on non-hedging derivatives for the year ended 30 June 2013 included unrealised fair value changes on similar instruments. The total changes in fair value of non-hedging derivatives amounted to US$280 million.
|
(c) | Interest has been capitalised at the rate of interest applicable to the specific borrowings financing the assets under construction or, where financed through general borrowings, at a capitalisation rate representing the average interest rate on such borrowings. For the year ended 30 June 2013, the capitalisation rate was 2.24 per cent (2012: 2.83 per cent; 2011: 2.87 per cent).
|
(d) | Interest income relates to financial assets carried at amortised cost.
|
7 Income tax and deferred tax
| | | | | | | | | | | | |
| | | 2013 | | | 2012 | | | 2011 | |
| | | US$M | | | US$M | | | US$M | |
Total taxation expense comprises: | | | | | | | | | | | | |
Current tax expense | | | 7,352 | | | | 8,303 | | | | 8,845 | |
Deferred tax benefit | | | (555 | ) | | | (813 | ) | | | (1,536 | ) |
| | | | | | | | | | | | |
| | | 6,797 | | | | 7,490 | | | | 7,309 | |
| | | | | | | | | | | | |
Total taxation expense attributed to geographical jurisdiction | | | | | | | | | | | | |
UK | | | 84 | | | | (21 | ) | | | 21 | |
Australia | | | 4,416 | | | | 6,043 | | | | 3,503 | |
Rest of world | | | 2,297 | | | | 1,468 | | | | 3,785 | |
| | | | | | | | | | | | |
| | | 6,797 | | | | 7,490 | | | | 7,309 | |
| | | | | | | | | | | | |
| | | | | | | | | | | | | | | | | | | | | | | | |
| | | 2013 | | | 2012 | | | 2011 | |
| | | % | | | US$M | | | % | | | US$M | | | % | | | US$M | |
Factors affecting income tax expense for the period | | | | | | | | | | | | | | | | | | | | | | | | |
Income tax expense differs to the standard rate of corporation tax as follows: | | | | | | | | | | | | | | | | | | | | | | | | |
Profit before taxation | | | | | | | 17,872 | | | | | | | | 23,022 | | | | | | | | 31,255 | |
| | | | | | | | | | | | | | | | | | | | | | | | |
Tax on profit at standard rate of 30 per cent | | | 30.0 | | | | 5,362 | | | | 30.0 | | | | 6,907 | | | | 30.0 | | | | 9,377 | |
| | | | | | | | | | | | | | | | | | | | | | | | |
Investment and development allowance | | | (1.5 | ) | | | (260 | ) | | | (1.2 | ) | | | (283 | ) | | | (1.0 | ) | | | (298 | ) |
Amounts (over)/under provided in prior years(a) | | | (0.3 | ) | | | (51 | ) | | | 0.3 | | | | 70 | | | | (1.3 | ) | | | (397 | ) |
Initial recognition of tax assets(b) | | | (2.1 | ) | | | (370 | ) | | | (0.6 | ) | | | (136 | ) | | | – | | | | (13 | ) |
Non-deductible depreciation, amortisation and exploration expenditure(c) | | | 1.2 | | | | 222 | | | | 0.7 | | | | 150 | | | | 0.4 | | | | 109 | |
Tax rate differential on foreign income | | | 0.4 | | | | 77 | | | | (1.0 | ) | | | (219 | ) | | | (0.1 | ) | | | (32 | ) |
Tax on remitted and unremitted foreign earnings | | | 0.6 | | | | 109 | | | | 0.8 | | | | 182 | | | | 0.8 | | | | 251 | |
Non-tax-effected operating losses and capital gains | | | (0.5 | ) | | | (91 | ) | | | 0.7 | | | | 168 | | | | 0.3 | | | | 108 | |
Exchange variations and other translation adjustments | | | 1.8 | | | | 315 | | | | 1.1 | | | | 250 | | | | (4.7 | ) | | | (1,473 | ) |
Tax rate changes | | | 0.3 | | | | 48 | | | | – | | | | – | | | | 0.1 | | | | 17 | |
Other(d) | | | 1.6 | | | | 280 | | | | 0.6 | | | | 149 | | | | (3.7 | ) | | | (1,168 | ) |
| | | | | | | | | | | | | | | | | | | | | | | | |
Income tax expense | | | 31.5 | | | | 5,641 | | | | 31.4 | | | | 7,238 | | | | 20.8 | | | | 6,481 | |
| | | | | | | | | | | | | | | | | | | | | | | | |
Royalty-related taxation (net of income tax benefit)(e) | | | 6.5 | | | | 1,156 | | | | 1.1 | | | | 252 | | | | 2.6 | | | | 828 | |
| | | | | | | | | | | | | | | | | | | | | | | | |
Total taxation expense | | | 38.0 | | | | 6,797 | | | | 32.5 | | | | 7,490 | | | | 23.4 | | | | 7,309 | |
| | | | | | | | | | | | | | | | | | | | | | | | |
(a) | Includes exceptional benefit of US$ nil (2012: US$ nil; 2011: US$718 million). Refer to note 3 Exceptional items.
|
(b) | Includes exceptional benefit of US$367 million (2012: US$ nil; 2011: US$ nil). Refer to note 3 Exceptional items.
|
(c) | Includes exceptional expense of US$152 million (2012: US$ nil; 2011: US$ nil). Refer to note 3 Exceptional items.
|
(d) | Includes exceptional benefit of US$ nil (2012: US$ nil; 2011: US$1,455 million). Refer to note 3 Exceptional items.
|
| (e) | Includes exceptional benefititems of US$33500 million (2012:(2014: US$637 million; 2011: nil; 2013: US$ nil)7 million). Refer to note 3 Exceptional items.2 ‘Exceptional items’. |
| (f) | Includes exceptional items of US$ nil (2014: US$ nil; 2013: decrease of US$158 million). Refer to note 2 ‘Exceptional items’. |
| (g) | Employee share awards expense is US$202.955 million (2014: US$213.841 million; 2013: US$188.413 million). |
Refer to notes 42 ‘Functional and presentation currency’ and 43 ‘Significant accounting policies’ (e), (f), (g), (h), (s), (t) and (v).
4. Income tax expense
| | | | | | | | | | | | |
| | | 2015 | | | 2014 | | | 2013 | |
| | | US$M | | | US$M | | | US$M | |
Total taxation expense comprises: | | | | | | | | | | | | |
Current tax expense | | | 3,168 | | | | 6,353 | | | | 6,816 | |
Deferred tax expense/(benefit) | | | 498 | | | | 427 | | | | (120 | ) |
| | | | | | | | | | | | |
| | | 3,666 | | | | 6,780 | | | | 6,696 | |
| | | | | | | | | | | | |
Total taxation (benefit)/expense attributed to geographical jurisdictions: | | | | | | | | | | | | |
United Kingdom | | | (38 | ) | | | (43 | ) | | | 83 | |
Australia | | | 3,548 | | | | 4,712 | | | | 4,394 | |
Rest of world | | | 156 | | | | 2,111 | | | | 2,219 | |
| | | | | | | | | | | | |
| | | 3,666 | | | | 6,780 | | | | 6,696 | |
| | | | | | | | | | | | |
| | | | | | | | | | | | | | | | | | | | | | | | |
| | | 2015 | | | 2014 | | | 2013 | |
| | | % | | | US$M | | | % | | | US$M | | | % | | | US$M | |
Factors affecting income tax expense for the period | | | | | | | | | | | | | | | | | | | | | | | | |
Income tax expense differs to the standard rate of corporation tax as follows: | | | | | | | | | | | | | | | | | | | | | | | | |
Profit before taxation | | | | | | | 8,056 | | | | | | | | 21,735 | | | | | | | | 20,828 | |
| | | | | | | | | | | | | | | | | | | | | | | | |
Tax on profit at standard rate of 30 per cent | | | 30.0 | | | | 2,417 | | | | 30.0 | | | | 6,521 | | | | 30.0 | | | | 6,248 | |
| | | | | | | | | | | | | | | | | | | | | | | | |
Tax on remitted and unremitted foreign earnings | | | 0.7 | | | | 58 | | | | 0.8 | | | | 169 | | | | 0.5 | | | | 102 | |
Non-deductible depreciation, amortisation and exploration expenditure(a) | | | 0.4 | | | | 34 | | | | 0.1 | | | | 46 | | | | 0.6 | | | | 117 | |
Non-tax-effected operating losses and capital gains | | | 1.8 | | | | 143 | | | | 0.1 | | | | 11 | | | | (1.1 | ) | | | (221 | ) |
Tax rate changes | | | 1.7 | | | | 137 | | | | 0.1 | | | | 20 | | | | 0.4 | | | | 90 | |
Tax rate differential on foreign income | | | (3.7 | ) | | | (301 | ) | | | 0.2 | | | | 49 | | | | (0.3 | ) | | | (56 | ) |
Exchange variations and other translation adjustments | | | 4.2 | | | | 339 | | | | (0.2 | ) | | | (34 | ) | | | 0.6 | | | | 134 | |
Initial recognition of tax assets(b) | | | (2.6 | ) | | | (212 | ) | | | (0.2 | ) | | | (45 | ) | | | (1.7 | ) | | | (370 | ) |
Amounts under/(over) provided in prior years | | | 1.7 | | | | 138 | | | | (0.7 | ) | | | (147 | ) | | | (0.1 | ) | | | (11 | ) |
Investment and development allowance | | | (2.4 | ) | | | (190 | ) | | | (1.0 | ) | | | (223 | ) | | | (1.2 | ) | | | (257 | ) |
Tax effect of share of profits of equity accounted investments (c) | | | (2.0 | ) | | | (164 | ) | | | (1.6 | ) | | | (356 | ) | | | (1.6 | ) | | | (342 | ) |
Other | | | 4.5 | | | | 363 | | | | 1.2 | | | | 255 | | | | 1.0 | | | | 212 | |
| | | | | | | | | | | | | | | | | | | | | | | | |
Income tax expense | | | 34.3 | | | | 2,762 | | | | 28.8 | | | | 6,266 | | | | 27.1 | | | | 5,646 | |
| | | | | | | | | | | | | | | | | | | | | | | | |
Royalty-related taxation (net of income tax benefit)(d) | | | 11.2 | | | | 904 | | | | 2.4 | | | | 514 | | | | 5.0 | | | | 1,050 | |
| | | | | | | | | | | | | | | | | | | | | | | | |
Total taxation expense | | | 45.5 | | | | 3,666 | | | | 31.2 | | | | 6,780 | | | | 32.1 | | | | 6,696 | |
| | | | | | | | | | | | | | | | | | | | | | | | |
| (a) | Includes exceptional expense of US$ nil (2014: US$ nil; 2013: US$55 million). Refer to note 2 ‘Exceptional items’. |
| (b) | Includes exceptional benefit of US$ nil (2014: US$ nil; 2013: US$367 million). Refer to note 2 ‘Exceptional items’. |
| (c) | The share of profits of equity accounted investments is net of income tax. This item removes the prima facie tax effect on such profits. |
| (d) | Includes exceptional expense of US$698 million (2014: US$ nil; 2013: benefit of US$33 million). Refer to note 2 ‘Exceptional items’. |
Income tax recognised in other comprehensive income is as follows:
| | | | 2013 | | 2012 | | 2011 | | | 2015 | | 2014 | | 2013 | |
| | | US$M | | US$M | | US$M | | | US$M | | US$M | | US$M | |
Income tax effect of: | | | | | | | | | | | | |
Items that may be reclassified subsequently to the income statement: | | | | | | | | | | | | |
Available for sale investments: | | | | | | | | | | | | |
Net valuation losses/gains taken to equity | | | 13 | | | | (12 | ) | | | 37 | | |
Net valuation losses taken to equity | | | | 1 | | | 2 | | | 13 | |
Net valuation gains transferred to the income statement | | | – | | | | – | | | | – | | | | 34 | | | 2 | | | | – | |
Cash flow hedges: | | | | | | | | | | | | |
Gains/losses taken to equity | | | (67 | ) | | | 96 | | | | – | | |
Unrealised losses transferred to the income statement | | | (22 | ) | | | (61 | ) | | | – | | |
Exchange fluctuations on translation of foreign operations taken to equity | | | – | | | | – | | | | – | | |
Losses/gains taken to equity | | | | 539 | | | (204 | ) | | (67 | ) |
Losses/gains transferred to the income statement | | | | (545 | ) | | 203 | | | (22 | ) |
| | | | | | | | | | | | | | | | | | |
Income tax (charge)/credit relating to items that may be reclassified subsequently to the income statement | | | (76 | ) | | | 23 | | | | 37 | | |
Income tax credit/(charge) relating to items that may be reclassified subsequently to the income statement | | | | 29 | | | 3 | | | (76 | ) |
| | | | | | | | | | | | | | | | | | |
Items that will not be reclassified to the income statement: | | | | | | | | | | | | |
Actuarial gains/losses on pension and medical schemes | | | (23 | ) | | | 76 | | | | 26 | | |
Remeasurement losses/gains on pension and medical schemes | | | | 14 | | | (6 | ) | | (23 | ) |
Employee share awards transferred to retained earnings on exercise | | | 49 | | | | 46 | | | | 70 | | | | (31 | ) | | 18 | | | 49 | |
Net accrued employee entitlement for share awards | | | (42 | ) | | | (56 | ) | | | (13 | ) | | | – | | | | – | | | (42 | ) |
| | | | | | | | | | | | | | | | | | |
Income tax (charge)/credit relating to items that will not be reclassified to the income statement | | | (16 | ) | | | 66 | | | | 83 | | | | (17 | ) | | 12 | | | (16 | ) |
| | | | | | | | | | | | | | | | | | |
Total income tax (charge)/credit relating to components of other comprehensive income(a) | | | (92 | ) | | | 89 | | | | 120 | | |
Total income tax credit/(charge) relating to components of other comprehensive income(a) | | | | 12 | | | 15 | | | (92 | ) |
| | | | | | | | | | | | | | | | | | |
| (a) | Included within total income tax relating to components of other comprehensive income is (US$139 million)US$43 million relating to deferred taxes, of which US$9 million relates to Continuing operations and US$4734 million relates to Discontinued operations, and US$(31) million relating to current taxes (2012:of Continuing operations (2014: US$43(1) million and US$4616 million; 2011:2013: US$47(139) million and US$7347 million). |
The movement for the year in the Group’s net deferred tax position is as follows:Refer to note 43 ‘Significant accounting policies’ (i).
5. Other income
| | | | | | | | | | | | |
| | | 2013 | | | 2012 | | | 2011 | |
| | | US$M | | | US$M | | | US$M | |
Net deferred tax (liability)/asset | | | | | | | | | | | | |
At the beginning of the financial year | | | (762 | ) | | | 1,310 | | | | (267 | ) |
Income tax credit recorded in the income statement | | | 555 | | | | 813 | | | | 1,536 | |
Income tax (charge)/credit recorded directly in equity | | | (139 | ) | | | 43 | | | | 47 | |
Acquisition and divestment of subsidiaries and operations | | | – | | | | (2,995 | ) | | | – | |
Transferred to liabilities held for sale | | | 60 | | | | 66 | | | | – | |
Exchange variations and other movements | | | (47 | ) | | | 1 | | | | (6 | ) |
| | | | | | | | | | | | |
At the end of the financial year | | | (333 | ) | | | (762 | ) | | | 1,310 | |
| | | | | | | | | | | | |
The composition of the Group’s net deferred tax asset and liability recognised in the balance sheet and the deferred tax expense (credited)/charged to the income statement is as follows:
| | | | | | | | | | | | |
| | | 2015 | | | 2014 | | | 2013 | |
| | | US$M | | | US$M | | | US$M | |
Dividend income | | | 17 | | | | 14 | | | | 4 | |
Royalties | | | 13 | | | | 18 | | | | 35 | |
(Losses)/gains on sale of property, plant and equipment(a) | | | (7 | ) | | | (55 | ) | | | 1,952 | |
Gains on sale of investments | | | 1 | | | | 6 | | | | 12 | |
Gains on divestment of equity accounted investments(b) | | | – | | | | – | | | | 1,212 | |
Gains on divestment of subsidiaries and operations(c) | | | 15 | | | | 673 | | | | – | |
Commission income | | | 54 | | | | 85 | | | | 93 | |
Insurance recoveries | | | – | | | | 41 | | | | 16 | |
Other income (d) | | | 403 | | | | 443 | | | | 480 | |
| | | | | | | | | | | | |
Total other income | | | 496 | | | | 1,225 | | | | 3,804 | |
| | | | | | | | | | | | |
| | | | | | | | | | | | | | | | | | | | | | | | | | | | |
| | | Deferred
tax assets | | | Deferred tax
liabilities | | | (Credited)/charged
to the income statement | |
| | | 2013 | | | 2012 | | | 2013 | | | 2012 | | | 2013 | | | 2012 | | | 2011 | |
| | | US$M | | | US$M | | | US$M | | | US$M | | | US$M | | | US$M | | | US$M | |
Type of temporary difference | | | | | | | | | | | | | | | | | | | | | | | | | | | | |
Depreciation | | | 277 | | | | (344 | ) | | | 7,020 | | | | 5,629 | | | | 861 | | | | (109 | ) | | | (1,364 | ) |
Exploration expenditure | | | 664 | | | | 633 | | | | (104 | ) | | | (125 | ) | | | (14 | ) | | | (101 | ) | | | (84 | ) |
Employee benefits | | | 355 | | | | 66 | | | | (174 | ) | | | (519 | ) | | | 27 | | | | 30 | | | | (59 | ) |
Closure and rehabilitation | | | 1,515 | | | | 544 | | | | (574 | ) | | | (1,561 | ) | | | (64 | ) | | | (28 | ) | | | (544 | ) |
Resource rent tax | | | 1,028 | | | | 984 | | | | 1,861 | | | | 1,377 | | | | 484 | | | | (335 | ) | | | 294 | |
Other provisions | | | 58 | | | | 79 | | | | (98 | ) | | | (97 | ) | | | 18 | | | | 47 | | | | (43 | ) |
Deferred income | | | (32 | ) | | | (22 | ) | | | (13 | ) | | | 71 | | | | (73 | ) | | | 179 | | | | 32 | |
Deferred charges | | | (545 | ) | | | (166 | ) | | | 245 | | | | 633 | | | | 27 | | | | 174 | | | | 169 | |
Investments, including foreign tax credits | | | 1,950 | | | | 1,774 | | | | 1,420 | | | | 1,092 | | | | 153 | | | | 152 | | | | 146 | |
Foreign exchange gains and losses | | | (396 | ) | | | (22 | ) | | | 64 | | | | 698 | | | | (262 | ) | | | (42 | ) | | | (234 | ) |
Non tax-depreciable fair value adjustments, revaluations and mineral rights | | | (11 | ) | | | (23 | ) | | | 76 | | | | 57 | | | | 42 | | | | (64 | ) | | | (51 | ) |
Tax-effected losses | | | 1,089 | | | | 878 | | | | (2,873 | ) | | | (1,517 | ) | | | (1,587 | ) | | | (764 | ) | | | 666 | |
Other | | | 184 | | | | 144 | | | | (381 | ) | | | (451 | ) | | | (167 | ) | | | 48 | | | | (464 | ) |
| | | | | | | | | | | | | | | | | | | | | | | | | | | | |
Total | | | 6,136 | | | | 4,525 | | | | 6,469 | | | | 5,287 | | | | (555 | ) | | | (813 | ) | | | (1,536 | ) |
| | | | | | | | | | | | | | | | | | | | | | | | | | | | |
| (a) | Includes exceptional items of US$ nil (2014: US$ nil; 2013: US$1,947 million). Refer to note 2 ‘Exceptional items’. |
The composition of the Group’s unrecognised deferred tax assets and liabilities is as follows:
| (b) | Includes exceptional items of US$ nil (2014: US$ nil; 2013: US$1,212 million). Refer to note 2 ‘Exceptional items’. |
| | | | | | | | |
| | | 2013 | | | 2012 | |
| | | US$M | | | US$M | |
Unrecognised deferred tax assets | | | | | | | | |
Tax losses and tax credits | | | 1,484 | | | | 1,545 | |
Investments in subsidiaries and jointly controlled entities | | | – | | | | 7 | |
Deductible temporary differences relating to MRRT and PRRT | | | 19,419 | | | | 19,338 | |
Other deductible temporary differences | | | 3,350 | | | | 3,185 | |
| | | | | | | | |
Total unrecognised deferred tax assets | | | 24,253 | | | | 24,075 | |
| | | | | | | | |
Unrecognised deferred tax liabilities | | | | | | | | |
Taxable temporary differences relating to unrecognised deferred tax asset for MRRT and PRRT | | | 5,826 | | | | 5,801 | |
Investments in subsidiaries and jointly controlled entities | | | 2,174 | | | | 1,997 | |
| | | | | | | | |
Total unrecognised deferred tax liabilities | | | 8,000 | | | | 7,798 | |
| | | | | | | | |
Tax losses
At 30 June 2013, the Group had income and capital tax losses with a tax benefit of US$1,021 million (2012: US$1,148 million) which are not recognised as deferred tax assets. The Group recognises the benefit of tax losses only to the extent of anticipated future taxable income or gains in relevant jurisdictions. The gross amount of tax losses carried forward that have not been tax effected expire as follows:
| (c) | Includes exceptional items of US$ nil (2014: US$551 million; 2013: US$ nil). Refer to note 2 ‘Exceptional items’. |
| | | | | | | | | | | | | | | | |
Year of expiry | | Australia | | | UK | | | Rest of
world | | | Total | |
| | | US$M | | | US$M | | | US$M | | | US$M | |
Income tax losses | | | | | | | | | | | | | | | | |
Not later than one year | | | – | | | | – | | | | 110 | | | | 110 | |
Later than one year and not later than two years | | | – | | | | – | | | | 14 | | | | 14 | |
Later than two years and not later than five years | | | – | | | | – | | | | 2,285 | | | | 2,285 | |
Later than five years and not later than ten years | | | – | | | | – | | | | 4 | | | | 4 | |
Later than ten years and not later than twenty years | | | – | | | | – | | | | 455 | | | | 455 | |
Unlimited | | | 4 | | | | 415 | | | | 21 | | | | 440 | |
| | | | | | | | | | | | | | | | |
| | | 4 | | | | 415 | | | | 2,889 | | | | 3,308 | |
| | | | | | | | | | | | | | | | |
Capital tax losses | | | | | | | | | | | | | | | | |
Later than two years and not later than five years | | | – | | | | – | | | | 245 | | | | 245 | |
Unlimited | | | 1,802 | | | | 25 | | | | 1 | | | | 1,828 | |
| | | | | | | | | | | | | | | | |
Gross amount of tax losses not recognised | | | 1,806 | | | | 440 | | | | 3,135 | | | | 5,381 | |
| | | | | | | | | | | | | | | | |
Tax effect of total losses not recognised | | | 542 | | | | 102 | | | | 377 | | | | 1,021 | |
| | | | | | | | | | | | | | | | |
| (d) | Other income is derived from transactions outside the course of the Group’s ordinary activities, such as management fees from non-controlling interests and joint venture arrangements. |
Tax credits
At 30 June 2013, the Group had US$463 million of tax credits that have not been recognised (2012: US$397 million). Of the US$463 million of tax credits, US$356 million expire later than five years and not later than ten years. The remainder of the tax credits do not have an expiration date.
Temporary differences relating to MRRT and PRRT
At 30 June 2013, the Group had US$19,419 million of unrecognised deductible temporary differences (2012: US$19,338 million) that arose due to the enactment of the Australian MRRT and PRRT extension legislation in March 2012. Recognition of a deferred tax asset for MRRT and PRRT depends on benefits expected to be obtained from deduction against MRRT and PRRT liabilities based on the 1 May 2010 market value of Australian coal, iron ore and petroleum assets. Recognition of a deferred tax asset associated with MRRT and PRRT of US$19,419 million (2012: US$19,338 million) would result in a corresponding additional deferred tax liability for income tax purposes of US$5,826 million (2012: US$5,801 million).
Other deductible temporary differences
At 30 June 2013, the Group had deductible temporary differences for which deferred tax assets of US$3,350 million (2012: US$3,192 million) have not been recognised because it is not probable that future taxable profits will be available against which the Group can utilise the benefits. The deductible temporary differences do not expire under current tax legislation.
Temporary differences associated with investments in subsidiaries and jointly controlled entities
At 30 June 2013, deferred tax liabilities of US$2,174 million (2012: US$1,997 million) associated with undistributed earnings of subsidiaries and jointly controlled entities have not been recognised because the Group is able to control the timing of the reversal of the temporary differences and it is not probable that such differences will reverse in the foreseeable future.
86. Earnings per share
| | | | | | | | | | | | |
| | | 2013 | | | 2012 | | | 2011 | |
Basic earnings per ordinary share (US cents) | | | 204.4 | | | | 289.6 | | | | 429.1 | |
Diluted earnings per ordinary share (US cents) | | | 203.7 | | | | 288.4 | | | | 426.9 | |
Basic earnings per American Depositary Share (US cents)(a) | | | 408.8 | | | | 579.2 | | | | 858.2 | |
Diluted earnings per American Depositary Share (US cents)(a) | | | 407.4 | | | | 576.8 | | | | 853.8 | |
Basic earnings (US$M) | | | 10,876 | | | | 15,417 | | | | 23,648 | |
Diluted earnings (US$M) | | | 10,876 | | | | 15,417 | | | | 23,648 | |
| | | | | | | | | | | | |
| | | 2015 | |
| | | Continuing
operations | | | Discontinued
operations | | | Total | |
Basic earnings/(losses) per ordinary share (US cents) | | | 65.5 | | | | (29.6 | ) | | | 35.9 | |
Diluted earnings/(losses) per ordinary share (US cents) | | | 65.3 | | | | (29.5 | ) | | | 35.8 | |
Basic earnings/(losses) per American Depositary Share (US cents)(a) | | | 131.0 | | | | (59.2 | ) | | | 71.8 | |
Diluted earnings/(losses) per American Depositary Share (US cents)(a) | | | 130.6 | | | | (59.0 | ) | | | 71.6 | |
Basic earnings/(losses) (US$M) | | | 3,483 | | | | (1,573 | ) | | | 1,910 | |
Diluted earnings/(losses) (US$M) | | | 3,483 | | | | (1,573 | ) | | | 1,910 | |
| | | | | | | | | | | | |
| | | 2014 | |
| | | Continuing
operations | | | Discontinued
operations | | | Total | |
Basic earnings per ordinary share (US cents) | | | 256.5 | | | | 3.5 | | | | 260.0 | |
Diluted earnings per ordinary share (US cents) | | | 255.7 | | | | 3.4 | | | | 259.1 | |
Basic earnings per American Depositary Share (US cents)(a) | | | 513.0 | | | | 7.0 | | | | 520.0 | |
Diluted earnings per American Depositary Share (US cents)(a) | | | 511.4 | | | | 6.8 | | | | 518.2 | |
Basic earnings (US$M) | | | 13,648 | | | | 184 | | | | 13,832 | |
Diluted earnings (US$M) | | | 13,648 | | | | 184 | | | | 13,832 | |
| | | | | | | | | | | | |
| | | 2013 | |
| | | Continuing
operations | | | Discontinued
operations | | | Total | |
Basic earnings/(losses) per ordinary share (US cents) | | | 238.6 | | | | (27.7 | ) | | | 210.9 | |
Diluted earnings/(losses) per ordinary share (US cents) | | | 237.8 | | | | (27.6 | ) | | | 210.2 | |
Basic earnings/(losses) per American Depositary Share (US cents) (a) | | | 477.2 | | | | (55.4 | ) | | | 421.8 | |
Diluted earnings/(losses) per American Depositary Share (US cents) (a) | | | 475.6 | | | | (55.2 | ) | | | 420.4 | |
Basic earnings/(losses) (US$M) | | | 12,698 | | | | (1,475 | ) | | | 11,223 | |
Diluted earnings/(losses) (US$M) | | | 12,698 | | | | (1,475 | ) | | | 11,223 | |
The weighted average number of shares used for the purposes of calculating diluted earnings per share reconciles to the number used to calculate basic earnings per share as follows:
| Weighted average number of shares | | 2013 | | | 2012 | | | 2011 | | | 2015 | | | 2014 | | | 2013 | |
| | | Million | | | Million | | | Million | | | Million | | | Million | | | Million | |
Basic earnings per ordinary share denominator | | | 5,322 | | | | 5,323 | | | | 5,511 | | | | 5,318 | | | | 5,321 | | | | 5,322 | |
Shares and options contingently issuable under employee share ownership plans (b)(c) | | | 18 | | | | 23 | | | | 29 | | | | 15 | | | | 17 | | | | 18 | |
| | | | | | | | | | | | | | | | | | |
Diluted earnings per ordinary share denominator (c)(d) | | | 5,340 | | | | 5,346 | | | | 5,540 | | | | 5,333 | | | | 5,338 | | | | 5,340 | |
| | | | | | | | | | | | | | | | | | |
| (a) | Each American Depositary Share (ADS) represents two ordinary shares. |
| (b) | The calculation of the number of ordinary shares used in the computation of basic earnings per share is the aggregate of the weighted average number of ordinary shares of BHP Billiton Limited and BHP Billiton Plc outstanding during the period after deduction of the number of shares held by the Billiton share repurchase scheme, the Billiton Employee Share Ownership Plan Trust and the BHP Bonus Equity Plan Trust and adjusting for the BHP Billiton Limited bonus share issue. Employee Equity Trust. |
| (c) | Included in the calculation of fully diluted earnings per share are shares contingentlysubject to certain conditions issuable under Employee Share Ownership Plans. |
(c)(d) | Diluted earnings per share calculation excludes 2,612,172160,116 of instruments (2012: 2,943,856; 2011: 2,210,433)(2014: 183,181; 2013: 357,498) which are considered antidilutive. |
9 DividendsWorking capital
7. Cash and cash equivalents
For the purpose of the consolidated cash flow statement, cash equivalents include highly liquid investments that are readily convertible to cash and with a maturity of less than 90 days, bank overdrafts and interest bearing liabilities at call.
| | | | | | | | | | | | |
| | | 2013 | | | 2012 | | | 2011 | |
| | | US$M | | | US$M | | | US$M | |
Dividends paid/payable during the period | | | | | | | | | | | | |
BHP Billiton Limited | | | 3,662 | | | | 3,559 | | | | 3,076 | |
BHP Billiton Plc – Ordinary shares | | | 2,404 | | | | 2,335 | | | | 2,003 | |
| – Preference shares(a) | | | – | | | | – | | | | – | |
| | | | | | | | | | | | |
| | | 6,066 | | | | 5,894 | | | | 5,079 | |
| | | | | | | | | | | | |
Dividends declared in respect of the period | | | | | | | | | | | | |
BHP Billiton Limited | | | 3,721 | | | | 3,621 | | | | 3,331 | |
BHP Billiton Plc – Ordinary shares | | | 2,446 | | | | 2,376 | | | | 2,183 | |
| – Preference shares(a) | | | – | | | | – | | | | – | |
| | | | | | | | | | | | |
| | | 6,167 | | | | 5,997 | | | | 5,514 | |
| | | | | | | | | | | | |
| | | |
| | | 2013 | | | 2012 | | | 2011 | |
| | | US cents | | | US cents | | | US cents | |
Dividends paid during the period (per share) | | | | | | | | | | | | |
Prior year final dividend | | | 57.0 | | | | 55.0 | | | | 45.0 | |
Interim dividend | | | 57.0 | | | | 55.0 | | | | 46.0 | |
| | | | | | | | | | | | |
| | | 114.0 | | | | 110.0 | | | | 91.0 | |
| | | | | | | | | | | | |
Dividends declared in respect of the period (per share) | | | | | | | | | | | | |
Interim dividend | | | 57.0 | | | | 55.0 | | | | 46.0 | |
Final dividend | | | 59.0 | | | | 57.0 | | | | 55.0 | |
| | | | | | | | | | | | |
| | | 116.0 | | | | 112.0 | | | | 101.0 | |
| | | | | | | | | | | | |
Dividends are declared after period end in the announcement of the results for the period. Interim dividends are declared in February and paid in March. Final dividends are declared in August and paid in September. Dividends declared are not recorded as a liability at the end of the period to which they relate. Subsequent to year-end, on 20 August 2013, BHP Billiton declared a final dividend of 59.0 US cents per share (US$3,147 million), which will be paid on 25 September 2013 (2012: 57.0 US cents per share – US$3,049 million; 2011: 55.0 US cents per share – US$2,943 million).
Each American Depositary Share (ADS) represents two ordinary shares of BHP Billiton Limited or BHP Billiton Plc. Dividends declared on each ADS represent twice the dividend declared on BHP Billiton ordinary shares.
BHP Billiton Limited dividends for all periods presented are, or will be, fully franked based on a tax rate of 30 per cent.
| | | | | | | | | | | | |
| | | 2013 | | | 2012 | | | 2011 | |
| | | US$M | | | US$M | | | US$M | |
Franking credits as at 30 June | | | 10,516 | | | | 7,494 | | | | 3,971 | |
Franking credits arising from the payment of current tax payable | | | 824 | | | | 2,547 | | | | 3,218 | |
| | | | | | | | | | | | |
Total franking credits available(b) | | | 11,340 | | | | 10,041 | | | | 7,189 | |
| | | | | | | | | | | | |
| | | | | | | | | | | | |
| | | 2015 | | | 2014 | | | 2013 | |
| | | US$M | | | US$M | | | US$M | |
Cash and cash equivalents comprise: | | | | | | | | | | | | |
Cash | | | 931 | | | | 1,726 | | | | 2,521 | |
Short-term deposits | | | 5,822 | | | | 7,077 | | | | 3,156 | |
| | | | | | | | | | | | |
Total cash and cash equivalents (a) (b) (c) | | | 6,753 | | | | 8,803 | | | | 5,677 | |
Bank overdrafts and short-term borrowings – refer to note 15 ‘Interest bearing liabilities’ | | | (140 | ) | | | (51 | ) | | | (10 | ) |
| | | | | | | | | | | | |
Total cash and cash equivalents, net of overdrafts | | | 6,613 | | | | 8,752 | | | | 5,667 | |
| | | | | | | | | | | | |
| (a) | 5.5 per cent dividend on 50,000 preference shares of £1 each declaredCash and paid annually (30 June 2012: 5.5 per cent; 30 June 2011: 5.5 per cent).cash equivalents include US$493 million (2014: US$738 million; 2013: US$674 million) which is restricted by legal or contractual arrangements. |
| (b) | The paymentCash and cash equivalents include US$50 million (2014: US$600 million; 2013: US$794 million), which is subject to restrictions imposed by governments where approval is required to repatriate cash out of the final 2013 dividend declared after 30 June 2013 will reduce the franking account balance by US$812 million.a country. |
| (c) | Cash and cash equivalents include US$6,553 million denominated in USD, US$58 million denominated in CAD, US$33 million denominated in GBP, US$17 million denominated in AUD and US$92 million denominated in other currencies (2014: US$8,360 million denominated in USD, US$48 million denominated in CAD, US$26 million denominated in GBP, US$100 million denominated in AUD and US$269 million denominated in other currencies; 2013: US$5,205 million denominated in USD, US$71 million denominated in CAD, US$18 million denominated in GBP, US$125 million denominated in AUD and US$258 million denominated in other currencies). |
108. Trade and other receivables
| | | | 2013 | | 2012 | | | 2015 | | 2014 | |
| | | US$M | | US$M | | | US$M | | US$M | |
Current | | | | | | | | |
Trade receivables | | | 4,674 | | | | 4,844 | | | | 2,988 | | | 4,735 | |
Provision for doubtful debts | | | (116 | ) | | | (121 | ) | | | (6 | ) | | (115 | ) |
| | | | | | | | | | | | |
Total trade receivables | | | 4,558 | | | | 4,723 | | | | 2,982 | | | 4,620 | |
Employee Share Plan loans(a) | | | 2 | | | | 3 | | | | – | | | 4 | |
Loans to equity accounted investments | | | | 104 | | | 284 | |
Interest bearing loans receivable | | | 64 | | | | 77 | | | | – | | | 3 | |
Other receivables | | | 2,104 | | | | 2,901 | | | | 1,235 | | | 1,830 | |
| | | | | | | | | | | | |
Total current receivables(b) | | | 6,728 | | | | 7,704 | | | | 4,321 | | | 6,741 | |
| | | | | | | | | | | | |
Non-current | | | | | | | | |
Employee Share Plan loans(a) | | | 9 | | | | 15 | | | | 1 | | | 2 | |
Loans to equity accounted investments | | | | 891 | | | 921 | |
Interest bearing loans receivable | | | 1,040 | | | | 937 | | | | – | | | 334 | |
Other receivables | | | 530 | | | | 523 | | | | 607 | | | 610 | |
| | | | | | | | | | | | |
Total non-current receivables(b) | | | 1,579 | | | | 1,475 | | | | 1,499 | | | 1,867 | |
| | | | | | | | | | | | |
| | | | 2013 | | 2012 | | | 2015 | | 2014 | |
| | | US$M | | US$M | | | US$M | | US$M | |
Movement in provision for doubtful debts | | | | | | | | |
At the beginning of the financial year | | | 121 | | | | 151 | | | | 115 | | | 116 | |
Charge/(credit) for the year: | | | | | |
Underlying charge to the income statement | | | 2 | | | | 43 | | |
Credit for the year: | | | | | |
Released to the income statement | | | – | | | | – | | | | – | | | (1 | ) |
Utilisation | | | (7 | ) | | | (73 | ) | | | (109 | ) | | | – | |
| | | | | | | | | | | | |
At the end of the financial year | | | 116 | | | | 121 | | | | 6 | | | 115 | |
| | | | | | | | | | | | |
| (a) | Under the terms of the BHP Billiton Limited Employee Share Plan, shares have been issued to employees for subscription at the weighted average market price less a discount not exceeding 5five per cent. Interest free employee loans are full recourse and are available to fund the purchase of such shares for a period of up to 20 years, repayable by application of dividends or an equivalent amount. Refer to note 33 Employee25 ‘Employee share ownership plans.plans’. |
| (b) | Disclosures relating to receivables from related parties are set out in note 32 Related33 ‘Related party transactions.transactions’. |
11 Other financial assets9. Trade and other payables
| | | | | | | | |
| | | 2013 | | | 2012 | |
| | | US$M | | | US$M | |
Current | | | | | | | | |
At fair value | | | | | | | | |
Cross currency and interest rate swaps | | | 63 | | | | 51 | |
Forward exchange contracts | | | 1 | | | | 14 | |
Commodity contracts | | | 29 | | | | 180 | |
Other derivative contracts | | | 29 | | | | 37 | |
Shares – available for sale | | | 37 | | | | – | |
| | | | | | | | |
Total current other financial assets | | | 159 | | | | 282 | |
| | | | | | | | |
Non-current | | | | | | | | |
At fair value | | | | | | | | |
Cross currency and interest rate swaps | | | 878 | | | | 808 | |
Commodity contracts | | | 18 | | | | 71 | |
Other derivative contracts | | | 166 | | | | 254 | |
Shares – available for sale | | | 497 | | | | 602 | |
Other investments – available for sale(a) | | | 139 | | | | 146 | |
| | | | | | | | |
Total non-current other financial assets | | | 1,698 | | | | 1,881 | |
| | | | | | | | |
| | | | | | | | |
| | | 2015 | | | 2014 | |
| | | US$M | | | US$M | |
Current | | | | | | | | |
Trade creditors | | | 4,857 | | | | 6,973 | |
Other creditors | | | 2,532 | | | | 3,172 | |
| | | | | | | | |
Total current payables | | | 7,389 | | | | 10,145 | |
| | | | | | | | |
Non-current | | | | | | | | |
Other creditors | | | 29 | | | | 113 | |
| | | | | | | | |
Total non-current payables | | | 29 | | | | 113 | |
| | | | | | | | |
10. Inventories
| | | | | | | | | | |
| | | | | 2015 | | | 2014 | |
| | | | | US$M | | | US$M | |
Current | | | | | | | | | | |
Raw materials and consumables | | – at net realisable value(a) | | | – | | | | 39 | |
| | – at cost | | | 1,453 | | | | 2,161 | |
| | | | | | | | | | |
| | | | | 1,453 | | | | 2,200 | |
| | | | | | | | | | |
Work in progress | | – at net realisable value(a) | | | 260 | | | | 185 | |
| | – at cost | | | 1,913 | | | | 2,269 | |
| | | | | | | | | | |
| | | | | 2,173 | | | | 2,454 | |
| | | | | | | | | | |
Finished goods | | – at net realisable value(a) | | | 29 | | | | 239 | |
| | – at cost | | | 637 | | | | 1,120 | |
| | | | | | | | | | |
| | | | | 666 | | | | 1,359 | |
| | | | | | | | | | |
Total current inventories | | | 4,292 | | | | 6,013 | |
| | | | | | | | | | |
Non-current | | | | | | | | | | |
Raw materials and consumables | | – at net realisable value(a) | | | – | | | | – | |
| | – at cost | | | 230 | | | | 225 | |
| | | | | | | | | | |
| | | | | 230 | | | | 225 | |
| | | | | | | | | | |
Work in progress | | – at net realisable value(a) | | | 6 | | | | 4 | |
| | – at cost | | | 118 | | | | 130 | |
| | | | | | | | | | |
| | | | | 124 | | | | 134 | |
| | | | | | | | | | |
Finished goods | | – at net realisable value(a) | | | 33 | | | | – | |
| | – at cost | | | 79 | | | | 104 | |
| | | | | | | | | | |
| | | | | 112 | | | | 104 | |
| | | | | | | | | | |
Total non-current inventories | | | 466 | | | | 463 | |
| | | | | | | | | | |
| (a) | Includes investments held by BHP Billiton Energy Coal South Africa Rehabilitation Trust Fund. The future realisation of this investment is intended to fund environmental obligations relating to the closure of the South African coal operations, and consequently this investment, while under the Group’s control, is not available for the general purposes of the Group. Any income from this investment is reinvested or applied to meet these obligations. The Group retains responsibility for these environmental obligations until such time as the former mine sites have been rehabilitated in accordance with the relevant environmental legislation. These obligations are therefore included under non-current provisions. Refer to note 18 Provisions.
|
12 Inventories
| | | | | | | | | | |
| | | | | 2013 | | | 2012 | |
| | | | | US$M | | | US$M | |
Current | | | | | | | | | | |
Raw materials and consumables | | – at net realisable value(a) | | | 5 | | | | 76 | |
| | – at cost | | | 2,009 | | | | 2,095 | |
| | | | | | | | | | |
| | | | | 2,014 | | | | 2,171 | |
| | | | | | | | | | |
Work in progress | | – at net realisable value(a) | | | 322 | | | | 301 | |
| | – at cost | | | 1,980 | | | | 2,094 | |
| | | | | | | | | | |
| | | | | 2,302 | | | | 2,395 | |
| | | | | | | | | | |
Finished goods | | – at net realisable value(a) | | | 220 | | | | 569 | |
| | – at cost | | | 1,286 | | | | 1,098 | |
| | | | | | | | | | |
| | | | | 1,506 | | | | 1,667 | |
| | | | | | | | | | |
Total current inventories | | | 5,822 | | | | 6,233 | |
| | | | | | | | | | |
Non-current | | | | | | | | | | |
Raw materials and consumables | | – at net realisable value(a) | | | 47 | | | | 33 | |
| | – at cost | | | 436 | | | | 234 | |
| | | | | | | | | | |
| | | | | 483 | | | | 267 | |
| | | | | | | | | | |
Work in progress | | – at net realisable value(a) | | | 7 | | | | 67 | |
| | – at cost | | | 112 | | | | 74 | |
| | | | | | | | | | |
| | | | | 119 | | | | 141 | |
| | | | | | | | | | |
Finished goods | | – at net realisable value(a) | | | – | | | | – | |
| | – at cost | | | 20 | | | | 16 | |
| | | | | | | | | | |
| | | | | 20 | | | | 16 | |
| | | | | | | | | | |
Total non-current inventories | | | 622 | | | | 424 | |
| | | | | | | | | | |
(a) | US$100182 million of inventory write-downs were recognised during the year (2012:(2014: US$13195 million; 2011:2013: US$2362 million). Inventory write-downs of US$5642 million made in previous periods were reversed during the year (2012:(2014: US$1969 million; 2011:2013: US$818 million). |
Refer to note 43 ‘Significant accounting policies’ (j).
13Resource assets
11. Property, plant and equipment
| Year ended 30 June 2013 | | Land and
buildings | | Plant and
equipment | | Other
mineral
assets | | Assets
under
construction | | Exploration
and
evaluation | | Total | | |
Year ended 30 June 2015 | | | Land and
buildings | | Plant and
equipment | | Other
mineral
assets | | Assets
under
construction | | Exploration
and
evaluation | | Total | |
| | | US$M | | US$M | | US$M | | US$M | | US$M | | US$M | | | US$M | | US$M | | US$M | | US$M | | US$M | | US$M | |
Cost | | | | | | | | | | | | | | | | | | | | | | | | |
At the beginning of the financial year | | | 9,289 | | | | 68,087 | | | | 34,199 | | | | 21,176 | | | | 3,082 | | | | 135,833 | | | | 13,660 | | | | 100,291 | | | | 32,822 | | | | 15,326 | | | | 2,819 | | | | 164,918 | |
Additions | | | 51 | | | | 220 | | | | 594 | | | | 20,177 | | | | 408 | | | | 21,450 | | | | – | | | | (563 | ) | | | 921 | | | | 10,788 | | | | 215 | | | | 11,361 | |
Acquisition of subsidiaries and operations | | | – | | | | – | | | | – | | | | – | | | | – | | | | – | | |
Disposals | | | (178 | ) | | | (737 | ) | | | (35 | ) | | | – | | | | (54 | ) | | | (1,004 | ) | | | (136 | ) | | | (1,520 | ) | | | (85 | ) | | | – | | | | (145 | ) | | | (1,886 | ) |
Divestment of subsidiaries and operations | | | – | | | | – | | | | – | | | | – | | | | – | | | | – | | |
Transferred to assets held for sale | | | (224 | ) | | | (1,416 | ) | | | (1,044 | ) | | | (175 | ) | | | (42 | ) | | | (2,901 | ) | |
| Divestment and demerger of subsidiaries and operations | | | | (2,811 | ) | | | (17,104 | ) | | | (3,172 | ) | | | (1,001 | ) | | | (40 | ) | | | (24,128 | ) |
Exchange variations taken to reserve | | | – | | | | (83 | ) | | | – | | | | 6 | | | | – | | | | (77 | ) | | | – | | | | (66 | ) | | | – | | | | – | | | | – | | | | (66 | ) |
Transfers and other movements | | | 2,008 | | | | 15,591 | | | | (1,209 | ) | | | (16,645 | ) | | | 204 | | | | (51 | ) | | | 976 | | | | 9,533 | | | | 328 | | | | (10,611 | ) | | | (219 | ) | | | 7 | |
| | | | | | | | | | | | | | | | | | | | | | | | | | | | | | | | | | | | |
At the end of the financial year | | | 10,946 | | | | 81,662 | | | | 32,505 | | | | 24,539 | | | | 3,598 | | | | 153,250 | | | | 11,689 | | | | 90,571 | | | | 30,814 | | | | 14,502 | | | | 2,630 | | | | 150,206 | |
| | | | | | | | | | | | | | | | | | | | | | | | | | | | | | | | | | | | |
Accumulated depreciation and impairments | | | | | | | | | | | | | | | | | | | | | | | | |
At the beginning of the financial year | | | 2,738 | | | | 29,197 | | | | 7,621 | | | | 58 | | | | 972 | | | | 40,586 | | | | 3,679 | | | | 42,865 | | | | 8,112 | | | | 15 | | | | 1,460 | | | | 56,131 | |
Charge for the year | | | 445 | | | | 4,381 | | | | 1,903 | | | | – | | | | 120 | | | | 6,849 | | | | 659 | | | | 7,443 | | | | 1,607 | | | | – | | | | 1 | | | | 9,710 | |
Impairments for the year | | | 356 | | | | 3,226 | | | | 973 | | | | – | | | | 1,099 | | | | 5,654 | | | | 76 | | | | 2,636 | | | | 1,328 | | | | – | | | | 20 | | | | 4,060 | |
Reversal of impairments | | | (12 | ) | | | (55 | ) | | | – | | | | – | | | | – | | | | (67 | ) | | | – | | | | (4 | ) | | | – | | | | – | | | | (20 | ) | | | (24 | ) |
Disposals | | | (156 | ) | | | (653 | ) | | | (28 | ) | | | – | | | | (4 | ) | | | (841 | ) | | | (126 | ) | | | (1,440 | ) | | | (85 | ) | | | – | | | | (144 | ) | | | (1,795 | ) |
Divestment of subsidiaries and operations | | | – | | | | – | | | | – | | | | – | | | | – | | | | – | | |
Transferred to assets held for sale | | | (193 | ) | | | (796 | ) | | | (845 | ) | | | – | | | | – | | | | (1,834 | ) | |
| Divestment and demerger of subsidiaries and operations | | | | (1,352 | ) | | | (9,401 | ) | | | (1,608 | ) | | | – | | | | – | | | | (12,361 | ) |
Exchange variations taken to reserve | | | – | | | | (68 | ) | | | – | | | | – | | | | – | | | | (68 | ) | | | – | | | | (58 | ) | | | – | | | | – | | | | – | | | | (58 | ) |
Transfers and other movements | | | 22 | | | | 1,410 | | | | (1,036 | ) | | | (58 | ) | | | (294 | ) | | | 44 | | | | (9 | ) | | | 169 | | | | 391 | | | | (15 | ) | | | (65 | ) | | | 471 | |
| | | | | | | | | | | | | | | | | | | | | | | | | | | | | | | | | | | | |
At the end of the financial year | | | 3,200 | | | | 36,642 | | | | 8,588 | | | | – | | | | 1,893 | | | | 50,323 | | | | 2,927 | | | | 42,210 | | | | 9,745 | | | | – | | | | 1,252 | | | | 56,134 | |
| | | | | | | | | | | | | | | | | | | | | | | | | | | | | | | | | | | | |
Net book value at 30 June 2013 | | | 7,746 | | | | 45,020 | | | | 23,917 | | | | 24,539 | | | | 1,705 | | | | 102,927 | | |
Total property, plant and equipment | | | | 8,762 | | | | 48,361 | | | | 21,069 | | | | 14,502 | | | | 1,378 | | | | 94,072 | |
| | | | | | | | | | | | | | | | | | | | | | | | | | | | | | | | | | | | |
| Year ended 30 June 2012 | | Land and
buildings | | Plant and
equipment | | Other
mineral
assets | | Assets
under
construction | | Exploration
and
evaluation | | Total | | |
Year ended 30 June 2014 | | | Land and
buildings | | Plant and
equipment | | Other
mineral
assets | | Assets
under
construction | | Exploration
and
evaluation | | Total | |
| | | US$M | | US$M | | US$M | | US$M | | US$M | | US$M | | | US$M | | US$M | | US$M | | US$M | | US$M | | US$M | |
Cost | | | | | | | | | | | | | | | | | | | | | | | | |
At the beginning of the financial year | | | 7,901 | | | | 59,661 | | | | 19,754 | | | | 12,521 | | | | 2,131 | | | | 101,968 | | | 10,446 | | | 81,304 | | | 32,117 | | | 23,560 | | | 2,823 | | | 150,250 | |
Additions | | | 142 | | | | 403 | | | | 722 | | | | 19,365 | | | | 968 | | | | 21,600 | | | 5 | | | 2,564 | | | 1,424 | | | 14,028 | | | 99 | | | 18,120 | |
Acquisition of subsidiaries and operations | | | 34 | | | | 811 | | | | 14,459 | | | | – | | | | 515 | | | | 15,819 | | |
Disposals | | | (88 | ) | | | (1,869 | ) | | | (482 | ) | | | (6 | ) | | | (84 | ) | | | (2,529 | ) | | (78 | ) | | (521 | ) | | (253 | ) | | | – | | | (80 | ) | | (932 | ) |
Divestment of subsidiaries and operations | | | – | | | | (106 | ) | | | (35 | ) | | | – | | | | – | | | | (141 | ) | | (9 | ) | | (1,882 | ) | | (247 | ) | | | – | | | | – | | | (2,138 | ) |
Transferred to assets held for sale | | | (25 | ) | | | (319 | ) | | | (31 | ) | | | (117 | ) | | | – | | | | (492 | ) | | (2 | ) | | (27 | ) | | | – | | | 24 | | | | – | | | (5 | ) |
Exchange variations taken to reserve | | | (1 | ) | | | (81 | ) | | | (15 | ) | | | – | | | | (1 | ) | | | (98 | ) | | | – | | | 4 | | | | – | | | 2 | | | | – | | | 6 | |
Transfers and other movements | | | 1,326 | | | | 9,587 | | | | (173 | ) | | | (10,587 | ) | | | (447 | ) | | | (294 | ) | | 3,298 | | | 18,849 | | | (219 | ) | | (22,288 | ) | | (23 | ) | | (383 | ) |
| | | | | | | | | | | | | | | | | | | | | | | | | | | | | | | | | | | | |
At the end of the financial year | | | 9,289 | | | | 68,087 | | | | 34,199 | | | | 21,176 | | | | 3,082 | | | | 135,833 | | | 13,660 | | | 100,291 | | | 32,822 | | | 15,326 | | | 2,819 | | | 164,918 | |
| | | | | | | | | | | | | | | | | | | | | | | | | | | | | | | | | | | | |
Accumulated depreciation and impairments | | | | | | | | | | | | | | | | | | | | | | | | |
At the beginning of the financial year | | | 2,274 | | | | 26,028 | | | | 5,033 | | | | – | | | | 688 | | | | 34,023 | | | 2,950 | | | 37,138 | | | 8,171 | | | | – | | | 1,426 | | | 49,685 | |
Charge for the year | | | 378 | | | | 4,104 | | | | 1,577 | | | | – | | | | 245 | | | | 6,304 | | | 584 | | | 6,653 | | | 1,203 | | | | – | | | 3 | | | 8,443 | |
Impairments for the year | | | 127 | | | | 1,269 | | | | 1,718 | | | | – | | | | 144 | | | | 3,258 | | | 153 | | | 397 | | | 73 | | | | – | | | 167 | | | 790 | |
Reversal of impairments | | | – | | | | (71 | ) | | | – | | | | – | | | | – | | | | (71 | ) | | | – | | | | – | | | | – | | | | – | | | (56 | ) | | (56 | ) |
Disposals | | | (83 | ) | | | (1,770 | ) | | | (481 | ) | | | – | | | | (49 | ) | | | (2,383 | ) | | (14 | ) | | (459 | ) | | (230 | ) | | | – | | | (80 | ) | | (783 | ) |
Divestment of subsidiaries and operations | | | – | | | | (105 | ) | | | (35 | ) | | | – | | | | – | | | | (140 | ) | | | – | | | (1,699 | ) | | �� | (215 | ) | | | – | | | | – | | | (1,914 | ) |
Transferred to assets held for sale | | | (6 | ) | | | (115 | ) | | | (2 | ) | | | – | | | | – | | | | (123 | ) | |
Exchange variations taken to reserve | | | – | | | | (70 | ) | | | (13 | ) | | | – | | | | – | | | | (83 | ) | | | – | | | 7 | | | | – | | | | – | | | | – | | | 7 | |
Transfers and other movements | | | 48 | | | | (73 | ) | | | (176 | ) | | | 58 | | | | (56 | ) | | | (199 | ) | | 6 | | | 828 | | | (890 | ) | | 15 | | | | – | | | (41 | ) |
| | | | | | | | | | | | | | | | | | | | | | | | | | | | | | | | | | | | |
At the end of the financial year | | | 2,738 | | | | 29,197 | | | | 7,621 | | | | 58 | | | | 972 | | | | 40,586 | | | 3,679 | | | 42,865 | | | 8,112 | | | 15 | | | 1,460 | | | 56,131 | |
| | | | | | | | | | | | | | | | | | | | | | | | | | | | | | | | | | | | |
Net book value at 30 June 2012 | | | 6,551 | | | | 38,890 | | | | 26,578 | | | | 21,118 | | | | 2,110 | | | | 95,247 | | |
Total property, plant and equipment | | | 9,981 | | | 57,426 | | | 24,710 | | | 15,311 | | | 1,359 | | | 108,787 | |
| | | | | | | | | | | | | | | | | | | | | | | | | | | | | | | | | | | | |
| (a) | Includes net foreign exchange gains/losses related to the closure and rehabilitation provisions. Refer to note 14 ‘Closure and rehabilitation provisions’. |
Refer to note 43 ‘Significant accounting policies’ (e), (f), (g), (h), (k), (l), (m) and (n).
1412. Intangible assets
| | | | 2013 | | 2012 | | | 2015 | | 2014 | |
| | | Goodwill | | Other
intangibles | | Total | | Goodwill | | Other
intangibles | | Total | | | Goodwill | | Other
intangibles | | Total | | Goodwill | | Other
intangibles | | Total | |
| | | US$M | | US$M | | US$M | | US$M | | US$M | | US$M | | | US$M | | US$M | | US$M | | US$M | | US$M | | US$M | |
Cost | | | | | | | | | | | | | | | | | | | | | | | | |
At the beginning of the financial year | | | 4,105 | | | | 1,327 | | | | 5,432 | | | | 922 | | | | 744 | | | | 1,666 | | | | 4,034 | | | | 2,517 | | | | 6,551 | | | 4,105 | | | 2,246 | | | 6,351 | |
Additions | | | – | | | | 207 | | | | 207 | | | | 3,778 | | | | 578 | | | | 4,356 | | | | – | | | | 82 | | | | 82 | | | | – | | | 291 | | | 291 | |
Disposals | | | – | | | | (13 | ) | | | (13 | ) | | | – | | | | (1 | ) | | | (1 | ) | | | – | | | | (123 | ) | | | (123 | ) | | | – | | | (3 | ) | | (3 | ) |
| Divestment and demerger of subsidiaries and operations | | | | (218 | ) | | | (312 | ) | | | (530 | ) | | (23 | ) | | | – | | | (23 | ) |
Impairments for the year | | | – | | | | – | | | | – | | | | (575 | ) | | | – | | | | (575 | ) | | | (542 | ) | | | – | | | | (542 | ) | | (48 | ) | | | – | | | (48 | ) |
Transferred to assets held for sale | | | – | | | | – | | | | – | | | | (20 | ) | | | – | | | | (20 | ) | |
Exchange variations taken to reserve | | | – | | | | – | | | | – | | | | – | | | | (1 | ) | | | (1 | ) | |
Transfers and other movements | | | – | | | | 10 | | | | 10 | | | | – | | | | 7 | | | | 7 | | | | – | | | | 98 | | | | 98 | | | | – | | | (17 | ) | | (17 | ) |
| | | | | | | | | | | | | | | | | | | | | | | | | | | | | | | | | | | | |
At the end of the financial year | | | 4,105 | | | | 1,531 | | | | 5,636 | | | | 4,105 | | | | 1,327 | | | | 5,432 | | | | 3,274 | | | | 2,262 | | | | 5,536 | | | 4,034 | | | 2,517 | | | 6,551 | |
| | | | | | | | | | | | | | | | | | | | | | | | | | | | | | | | | | | | |
Accumulated amortisation and impairments | | | | | | | | | | | | | | | | | | | | | | | | |
At the beginning of the financial year | | | – | | | | 320 | | | | 320 | | | | – | | | | 210 | | | | 210 | | | | – | | | | 1,112 | | | | 1,112 | | | | – | | | 855 | | | 855 | |
Disposals | | | – | | | | (13 | ) | | | (13 | ) | | | – | | | | (1 | ) | | | (1 | ) | | | – | | | | (115 | ) | | | (115 | ) | | | – | | | (3 | ) | | (3 | ) |
| Divestment and demerger of subsidiaries and operations | | | | – | | | | (122 | ) | | | (122 | ) | | | – | | | | – | | | | – | |
Charge for the year | | | – | | | | 96 | | | | 96 | | | | – | | | | 104 | | | | 104 | | | | – | | | | 243 | | | | 243 | | | | – | | | 258 | | | 258 | |
Impairments for the year | | | – | | | | 7 | | | | 7 | | | | – | | | | – | | | | – | | | | – | | | | 28 | | | | 28 | | | | – | | | 17 | | | 17 | |
Exchange variations taken to reserve | | | – | | | | – | | | | – | | | | – | | | | – | | | | – | | |
Transfers and other movements | | | – | | | | – | | | | – | | | | – | | | | 7 | | | | 7 | | | | – | | | | 98 | | | | 98 | | | | – | | | (15 | ) | | (15 | ) |
| | | | | | | | | | | | | | | | | | | | | | | | | | | | | | | | | | | | |
At the end of the financial year | | | – | | | | 410 | | | | 410 | | | | – | | | | 320 | | | | 320 | | | | – | | | | 1,244 | | | | 1,244 | | | | – | | | 1,112 | | | 1,112 | |
| | | | | | | | | | | | | | | | | | | | | | | | | | | | | | | | | | | | |
Total intangible assets | | | 4,105 | | | | 1,121 | | | | 5,226 | | | | 4,105 | | | | 1,007 | | | | 5,112 | | | | 3,274 | | | | 1,018 | | | | 4,292 | | | 4,034 | | | 1,405 | | | 5,439 | |
| | | | | | | | | | | | | | | | | | | | | | | | | | | | | | | | | | | | |
The carrying amount of goodwill has been allocated to the cash-generating units (CGUs), or groups of CGUs, as follows:
| Cash-generating units | | 2013 | | 2012 | | | 2015 | | | 2014 | |
| | | US$M | | US$M | | | US$M | | | US$M | |
Onshore US | | | 3,591 | | | | 3,591 | | | | 3,026 | | | | 3,568 | |
Fayetteville | | | – | | | | – | | |
Other | | | 514 | | | | 514 | | | | 248 | | | | 466 | |
| | | | | | | | | | | | |
| | | 4,105 | | | | 4,105 | | | | 3,274 | | | | 4,034 | |
| | | | | | | | | | | | |
Impairment testing of goodwill
For the purpose of impairment testing, goodwill has been allocated to CGUs, or groups of CGUs, that are expected to benefit from the synergies of theprevious business combinationcombinations and which represent the level at which management will monitor and manage the goodwill.
Onshore US
The recoverable amounts of the Onshore US group of CGUs (Onshore US) comprises the Permian, Haynesville, Fayetteville, Black Hawk and Hawkville CGUs. Onshore US comprises the natural gas and liquid reserves and resources, production wells and associated infrastructure including gathering systems and processing facilities in the Permian, Haynesville, Black Hawk and the Hawkville areas in Texas and Louisiana (US) and the Fayetteville CGU werearea in Arkansas (US). Onshore US is part of the Petroleum and Potash reportable segment.
The recoverable amount of Onshore US was determined based on fair value less costs to sell (FVLCS)of disposal (FVLCD). FVLCSFVLCD was determined as the present value of the estimated future cash flows (expressed in real terms) expected to arise from the continued use of the assets (life of asset), including any expansion prospects, and its eventual disposal, using assumptions that an independent market participant may take into account. These cash flows were discounted using a real after-taxpost-tax discount rate that reflected current market assessments of the time value of money and the risks specific to Onshore US. The fair value measurement is categorised as a Level 3 fair value based on the CGU.inputs used in the valuation (refer to note 23 ‘Financial risk management’ for explanation of the valuation hierarchy).
The determination of FVLCSFVLCD was most sensitive to the following assumptions:
Production volumes
Crude oil prices
Natural and natural gas prices
Discount rate
Production volumes – estimated production volumes were based on detailed data for the fields and took into account development plans for the fields established by management as part of the long-term planning process. Production volumes are dependent on variables, such as the recoverable quantities of hydrocarbons, the production profile of the hydrocarbons, the cost of the development of the infrastructure necessary to recover the hydrocarbons, the production costs and the contractual duration of the production leases and the selling price of the hydrocarbons produced.leases. As each producing field has specific reservoir characteristics and economic circumstances, the cash flows of the fields were computed using appropriate individual economic models and key assumptions established by management. The production profiles used were consistent with the resource volumes approved as part of the Group’s process for the estimation of proved reserves and total resources.
Crude oil and natural gas prices – key assumptions for oil and gas prices were derived from forward price curves and long-term views of global supply and demand, building upon past experience of the industry and consistent with external sources. These prices were adjusted to arrive at appropriate consistent price assumptions for different qualities of oil and gas, or where appropriate, contracted oil and gas prices were applied.
The long-term crude oil and natural gas prices used in the FVLCSFVLCD determinations were either lower or within the following range of prices published by market commentators:
| | | | 2013 | | 2012 | | | 2015 | | | 2014 | |
Crude oil price (US$/boe) | | | 71.00 – 125.00 | | | | 75.82 – 101.93 | | |
Crude oil price (a) (US$/bbl) | | | | 57.00 – 86.00 | | | | 88.00 – 107.79 | |
Natural gas price (US$/MMBtu) | | | 4.45 – 6.51 | | | | 2.74 – 6.21 | | | | 3.54 – 5.80 | | | | 3.84 – 5.84 | |
| (a) | West Texas Intermediate (WTI). |
Discount rate – in arriving at the FVLCS,FVLCD, a real post-tax discount rate of 5.95.5 per cent (2012: 5.9(2014: 6.0 per cent) was applied to the post-tax cash flows expressed in real terms. This discount rate was derived from the Group’s post-tax weighted average cost of capital (WACC), with appropriate adjustments made to reflect the risks specific to the CGU.
Year ended 30 June 2015
During the period the Group disposed of its interest in conventional petroleum assets in North Louisiana and unconventional gas assets in the Pecos field in the Delaware Basin resulting in an impairment to Onshore US
The goodwill of US$3,591 million that arose from42 million. At the acquisitiontime of Petrohawk Energy Corporation has been allocated tothe annual goodwill impairment test the Onshore US group of CGUs which comprises the Fayetteville, Eagle Ford, Haynesville and the Permian Basin CGUs. The goodwill was US$3,526 million (2014: US$3,568 million).
Onshore US group of CGUs comprises the natural gas and liquid reserves and resources, gas production wells and associated facilities, and gas gathering systems in the Eagle Ford, Haynesville and the Permian areas in Texas and Louisiana (US) and the Fayetteville area in Arkansas (US). The Onshore US group of CGUs is part of the Petroleum and Potash reportable segment. The Onshore US group of CGUs was tested for impairment after testing each of the individual CGUs that it comprises. With the exception of Hawkville, the impairment tests for the individual CGUs indicated that no impairments or reversal of prior impairments were required. In prior periods Black Hawk and Hawkville have been tested for impairment as a single CGU, Eagle Ford. As a result of structural, operational, and marketing changes completed in FY2015 management has determined that Black Hawk and Hawkville represent separate CGUs. An impairment of US$2,287 million has been recognised in relation to Hawkville and allocated to property, plant and equipment. Refer to note 2 ‘Exceptional items’ for further discussion.
The impairment test of Onshore US was performed after the Hawkville assets were written down to their recoverable amount. The recoverable amount of Onshore US was determined to be US$19,793 million and resulted in a goodwill impairment loss of US$500 million. Refer to note 2 ‘Exceptional items’ for further discussion.
Following the recognition of the goodwill impairment loss, the recoverable amount of Onshore US is equal to the carrying amount. Accordingly, any adverse movement in a key assumption would lead to further impairment.
Year ended 30 June 20132014
At the time of the annual goodwill impairment test the Onshore US goodwill was US$3,568 million.
Onshore US was tested for impairment after testing each of the individual CGUs that it comprises. The impairment tests for the Eagle Ford, Haynesville and Fayettevilleindividual CGUs indicated that no impairments or reversal of prior impairments were required. However, an impairment of US$266 million was recognised in relation to the Permian Basin. In the prior year the Permian Basin had been identified as one CGU. However, the current development plan identifies two distinct regions that would have to be developed independently: North Reeves/Pecos region (Delaware
Basin) and South Midland (Midland Basin) region. Management also noted that each region has a separate and distinctive basin; they are geographically distant; and they do not share common infrastructure. Accordingly, management determined that each region represents a separate CGU. The US$266 million impairment relates to the South Midland CGU and was recognised against property, plant and equipment, refer to note 3 Exceptional items for further discussion.
The impairment test of the Onshore US group of CGUs was therefore performed after the Permian assets were written down to their recoverable amount (which was based on FVLCS measured using discounted cash flow projections). The result indicated that the recoverable amount of the Onshore US group of CGUs exceeded its carrying amount including goodwill by US$4,104598 million and no further impairment was required.
The table below shows the key assumptions used in the FVLCS as well as the amount by which each key assumption must change in isolation in order for the estimated recoverable amount to be equal to the carrying amount of the Onshore group of CGUs, including goodwill. Owing to the complexity of the analysis caused by relationships between each key assumption, such that a change in one would cause a change in several other inputs to the calculation, the analysis below was performed for each assumption individually.
| | | | | | | | |
| | Assumptions used in
FVLCS | | | Change required for the carrying
amount to equal the recoverable
amount | |
Production volumes
| | | Management’s long-term plan | | | | decrease of 7 | % |
Crude oil prices (US$/boe)
| | | 82.50 – 91.54 | | | | decrease of 23 | % |
Natural gas prices (US$/MMBtu)
| | | 4.14 – 5.66 | | | | decrease of 18 | % |
Discount rate
| | | 5.9 | % | | | increase of 160 basis points | |
Year ended 30 June 2012
The impairment tests for the Eagle Ford, Haynesville and the Permian Basin CGUs indicated that no impairments were required. As indicated below, an impairment was recognised in relation to the Fayetteville CGU. The impairment test of the Onshore US group of CGUs was therefore performed after the Fayetteville assets were written down to their recoverable amount. The result indicated that the recoverable amount of the Onshore US group of CGUs exceeded its carrying amount and no further impairment was required.
With regard to the assessment of FVLCS for the Onshore US group of CGUs, management believes that no reasonably possible change in any of the above key assumptions would cause the carrying amount of the group of CGUs to exceed its recoverable amount.
Fayetteville
The goodwill of US$552 million that arose from the acquisition of the Fayetteville gas business in March 2011 was allocated to the Fayetteville CGU. The Fayetteville CGU comprises the Fayetteville natural gas reserves and resource; gas production wells and associated facilities; and the gas gathering system located in Arkansas, US.
Year ended 30 June 2013
Goodwill allocated to Fayetteville was fully impaired in the year ended 30 June 2012. Accordingly, a goodwill impairment test was not required to be performed in the year ended 30 June 2013.
Year ended 30 June 2012
For the interim period ended 31 December 2011, impairment testing indicated that the Fayetteville CGU was not impaired. However, during the second half of the year ended 30 June 2012 there was a significant fall in US
domestic gas prices, which prompted the Group to adjust its development plans. Consequently, a further impairment test was performed as at 30 June 2012 and resulted in a total impairment charge of US$2,835 million being recognised for the year ended 30 June 2012, including impairment of the Fayetteville goodwill of US$552 million and property, plant and equipment of US$2,283 million. The total impairment charge is included in ‘Expenses excluding net finance costs’ in the Consolidated Income Statement, refer to note 5 Expenses.
Other
Goodwill held by other CGUs is US$514248 million (2012:(2014: US$514466 million), representing. As a result of the South32 demerger US$218 million of goodwill relating to the South32 businesses was derecognised. The remaining goodwill represents less than one per cent of net assets at 30 June 2013 (2012:2015 (2014: less than one per cent). The goodwill has been allocated across a number of CGUs in different reportable segments, with no CGU accounting for more than US$200190 million of total goodwill.
Refer to note 43 ‘Significant accounting policies’ (e), (g), (o) and (p).
15 Trade13. Deferred tax balances
The movement for the year in the Group’s net deferred tax position is as follows:
| | | | | | | | | | | | |
| | | 2015 | | | 2014 | | | 2013 | |
| | | US$M | | | US$M | | | US$M | |
Net deferred tax liability | | | | | | | | | | | | |
At the beginning of the financial year | | | (670 | ) | | | (243 | ) | | | (611 | ) |
Income tax (charge)/credit recorded in the income statement | | | (864 | ) | | | (426 | ) | | | 493 | |
Income tax credit/(charge) recorded directly in equity | | | 9 | | | | (1 | ) | | | (139 | ) |
Transferred to liabilities held for sale | | | – | | | | – | | | | 60 | |
Exchange variations and other movements (a) | | | (156 | ) | | | – | | | | (46 | ) |
| | | | | | | | | | | | |
At the end of the financial year | | | (1,681 | ) | | | (670 | ) | | | (243 | ) |
| | | | | | | | | | | | |
| (a) | Includes deferred tax assets divested as part of the demerger of South32. Refer to note 29 ‘Discontinued operations’. |
The composition of the Group’s net deferred tax asset and other payablesliability recognised in the balance sheet and the deferred tax expense charged/(credited) to the income statement is as follows:
| | | | | | | | | | | | | | | | | | | | | | | | | | | | |
| | | Deferred tax
assets | | | Deferred tax
liabilities | | | Charged/(credited) to the
income statement | |
| | | 2015 | | | 2014 | | | 2015 | | | 2014 | | | 2015 | | | 2014 | | | 2013 | |
| | | US$M | | | US$M | | | US$M | | | US$M | | | US$M | | | US$M | | | US$M | |
Type of temporary difference | | | | | | | | | | | | | | | | | | | | | | | | | | | | |
Depreciation | | | (1,101 | ) | | | (514 | ) | | | 5,689 | | | | 6,375 | | | | 204 | | | | 495 | | | | 532 | |
Exploration expenditure | | | 563 | | | | 669 | | | | (91 | ) | | | (102 | ) | | | 117 | | | | (4 | ) | | | (14 | ) |
Employee benefits | | | 279 | | | | 389 | | | | (120 | ) | | | (173 | ) | | | 58 | | | | (32 | ) | | | 23 | |
Closure and rehabilitation | | | 1,383 | | | | 1,658 | | | | (584 | ) | | | (794 | ) | | | 41 | | | | (353 | ) | | | (72 | ) |
Resource rent tax relating to MRRT and PRRT | | | 679 | | | | 1,580 | | | | 1,931 | | | | 1,907 | | | | 925 | | | | (506 | ) | | | 484 | |
Other provisions | | | 143 | | | | 433 | | | | (12 | ) | | | (59 | ) | | | 103 | | | | (411 | ) | | | 34 | |
Deferred income | | | (51 | ) | | | (32 | ) | | | (13 | ) | | | (11 | ) | | | 17 | | | | 12 | | | | (74 | ) |
Deferred charges | | | (419 | ) | | | (575 | ) | | | 362 | | | | 307 | | | | 66 | | | | 226 | | | | 302 | |
Investments, including foreign tax credits | | | 838 | | | | 1,906 | | | | 639 | | | | 1,765 | | | | (58 | ) | | | 298 | | | | 133 | |
Foreign exchange gains and losses | | | (383 | ) | | | (261 | ) | | | 160 | | | | 76 | | | | 210 | | | | (158 | ) | | | (239 | ) |
Non-tax-depreciable fair value adjustments, revaluations and mineral rights | | | (13 | ) | | | (5 | ) | | | 4 | | | | 89 | | | | 277 | | | | 8 | | | | (25 | ) |
Tax-effected losses | | | 1,069 | | | | 1,159 | | | | (3,129 | ) | | | (2,192 | ) | | | (945 | ) | | | 605 | | | | (1,588 | ) |
Other | | | (126 | ) | | | (11 | ) | | | (294 | ) | | | (122 | ) | | | (151 | ) | | | 246 | | | | 11 | |
| | | | | | | | | | | | | | | | | | | | | | | | | | | | |
Total | | | 2,861 | | | | 6,396 | | | | 4,542 | | | | 7,066 | | | | 864 | | | | 426 | | | | (493 | ) |
| | | | | | | | | | | | | | | | | | | | | | | | | | | | |
The composition of the Group’s unrecognised deferred tax assets and liabilities is as follows:
| | | | | | | | |
| | | 2015 | | | 2014 | |
| | | US$M | | | US$M | |
Unrecognised deferred tax assets | | | | | | | | |
Tax losses and tax credits | | | 2,006 | | | | 1,572 | |
Investments in subsidiaries | | | 1,130 | | | | – | |
Deductible temporary differences relating to MRRT and PRRT | | | 2,014 | | | | 19,528 | |
Mineral rights | | | 1,958 | | | | 2,727 | |
Other deductible temporary differences | | | 373 | | | | 668 | |
| | | | | | | | |
Total unrecognised deferred tax assets | | | 7,481 | | | | 24,495 | |
| | | | | | | | |
Unrecognised deferred tax liabilities | | | | | | | | |
Taxable temporary differences relating to unrecognised deferred tax asset for MRRT and PRRT | | | 604 | | | | 5,858 | |
Investments in subsidiaries | | | 2,553 | | | | 2,153 | |
| | | | | | | | |
Total unrecognised deferred tax liabilities | | | 3,157 | | | | 8,011 | |
| | | | | | | | |
Tax losses
At 30 June 2015, the Group had income and capital tax losses with a tax benefit of US$1,501 million (2014: US$1,053 million) which are not recognised as deferred tax assets. The Group recognises the benefit of tax losses only to the extent of anticipated future taxable income or gains in relevant jurisdictions. The gross amount of tax losses carried forward that have not been tax effected expire as follows:
| | | | | | | | | | | | | | | | |
Year of expiry | | Australia | | | UK | | | Rest of
world | | | Total | |
| | | US$M | | | US$M | | | US$M | | | US$M | |
Income tax losses | | | | | | | | | | | | | | | | |
Later than one year and not later than two years | | | – | | | | – | | | | 4 | | | | 4 | |
Later than two years and not later than five years | | | – | | | | – | | | | 2,921 | | | | 2,921 | |
Later than five years and not later than ten years | | | – | | | | – | | | | 20 | | | | 20 | |
Later than ten years and not later than twenty years | | | – | | | | – | | | | 360 | | | | 360 | |
Unlimited | | | – | | | | 215 | | | | 410 | | | | 625 | |
| | | | | | | | | | | | | | | | |
| | | – | | | | 215 | | | | 3,715 | | | | 3,930 | |
| | | | | | | | | | | | | | | | |
Capital tax losses | | | | | | | | | | | | | | | | |
Later than two years and not later than five years | | | – | | | | – | | | | 246 | | | | 246 | |
Unlimited | | | 3,211 | | | | 26 | | | | 22 | | | | 3,259 | |
| | | | | | | | | | | | | | | | |
Gross amount of tax losses not recognised | | | 3,211 | | | | 241 | | | | 3,983 | | | | 7,435 | |
| | | | | | | | | | | | | | | | |
Tax effect of total losses not recognised | | | 963 | | | | 48 | | | | 490 | | | | 1,501 | |
| | | | | | | | | | | | | | | | |
Tax credits
At 30 June 2015, the Group had US$505 million of tax credits that have not been recognised (2014: US$519 million). Of the US$505 million of tax credits, US$371 million expires later than five years and not later than ten years, US$39 million expires later than ten years and not later than twenty years. The remainder of the tax credits do not have an expiration date.
Temporary differences associated with investments in subsidiaries
At 30 June 2015, deferred tax assets of US$1,130 million (2014: US$ nil) and deferred tax liabilities of US$2,553 million (2014: US$2,153 million) associated with undistributed earnings of subsidiaries have not been recognised because the Group is able to control the timing of the reversal of the temporary differences and it is not probable that such differences will reverse in the foreseeable future.
Temporary differences relating to MRRT and PRRT
At 30 June 2015, the Group had US$2,014 million of unrecognised deferred tax assets relating to Australian PRRT (2014: US$19,528 million relating to Australian PRRT and MRRT), with a corresponding unrecognised deferred tax liability for income tax purposes of US$604 million (2014: US$5,858 million). Recognition of a deferred tax asset for PRRT depends on benefits expected to be obtained from the deduction against PRRT liabilities. The MRRT legislation in Australia was repealed in September 2014.
Mineral rights
At 30 June 2015, the Group had deductible temporary differences relating to Mineral rights for which deferred tax assets of US$1,958 million (2014: US$2,727 million) have not been recognised because it is not probable that future capital gains will be available, against which the Group can utilise the benefits. The deductible temporary differences do not expire under current tax legislation.
Other deductible temporary differences
At 30 June 2015, the Group had deductible temporary differences for which deferred tax assets of US$373 million (2014: US$668 million) have not been recognised because it is not probable that future taxable profits will be available against which the Group can utilise the benefits. The deductible temporary differences do not expire under current tax legislation.
Refer to note 43 ‘Significant accounting policies’ (i).
14. Closure and rehabilitation provisions
| | | | | | | | |
| | | 2013 | | | 2012 | |
| | | US$M | | | US$M | |
Current | | | | | | | | |
Trade creditors | | | 7,605 | | | | 8,727 | |
Other creditors | | | 3,276 | | | | 3,297 | |
| | | | | | | | |
Total current payables | | | 10,881 | | | | 12,024 | |
| | | | | | | | |
Non-current | | | | | | | | |
Other creditors | | | 293 | | | | 509 | |
| | | | | | | | |
Total non-current payables | | | 293 | | | | 509 | |
| | | | | | | | |
| | | | | | | | |
| | | 2015 | | | 2014 | |
| | | US$M | | | US$M | |
Current | | | | | | | | |
Closure and rehabilitation(a) | | | 193 | | | | 368 | |
| | | | | | | | |
Total current provisions | | | 193 | | | | 368 | |
| | | | | | | | |
Non-current | | | | | | | | |
Closure and rehabilitation(a) | | | 6,508 | | | | 8,927 | |
| | | | | | | | |
Total non-current provisions | | | 6,508 | | | | 8,927 | |
| | | | | | | | |
| | | | | | | | |
| | | 2015 | | | 2014 | |
| | | US$M | | | US$M | |
Movement in closure and rehabilitation provisions | | | | | | | | |
At the beginning of the financial year | | | 9,295 | | | | 7,617 | |
Amounts capitalised (b) | | | (733 | ) | | | 1,194 | |
Charge/(credit) for the year: | | | | | | | | |
Underlying | | | 74 | | | | 413 | |
Discounting | | | 442 | | | | 465 | |
Exchange variations | | | (104 | ) | | | (17 | ) |
Released during the year | | | (93 | ) | | | (35 | ) |
Exchange variations taken to reserve | | | (7 | ) | | | 10 | |
Utilisation | | | (180 | ) | | | (219 | ) |
Divestment and demerger of subsidiaries and operations | | | (1,993 | ) | | | (145 | ) |
Transferred to liabilities held for sale | | | – | | | | (2 | ) |
Transfers and other movements | | | – | | | | 14 | |
| | | | | | | | |
At the end of the financial year | | | 6,701 | | | | 9,295 | |
| | | | | | | | |
| (a) | Total closure and rehabilitation provisions include provisions for closed sites of US$1,046 million (2014: US$1,514 million). |
| (b) | Includes net foreign exchange gains of US$1,009 million (2014: net foreign exchange losses of US$38 million) capitalised to property, plant and equipment. Refer to note 11 ‘Property, plant and equipment’. |
Refer to note 43 ‘Significant accounting policies’ (q).
16Capital structure
15. Interest bearing liabilities
| | | | | | | | |
| | | 2013 | | | 2012 | |
| | | US$M | | | US$M | |
Current | | | | | | | | |
Unsecured bank loans(a) | | | 188 | | | | 537 | |
Notes and debentures | | | 3,532 | | | | 1,645 | |
Commercial paper | | | 1,330 | | | | 995 | |
Secured bank loans(a) | | | 89 | | | | 122 | |
Finance leases | | | 64 | | | | 82 | |
Unsecured other | | | 90 | | | | 130 | |
Unsecured bank overdrafts and short-term borrowings | | | 10 | | | | 20 | |
| | | | | | | | |
Total current interest bearing liabilities | | | 5,303 | | | | 3,531 | |
| | | | | | | | |
Non-current | | | | | | | | |
Unsecured bank loans(a) | | | 629 | | | | 290 | |
Notes and debentures(a) | | | 27,343 | | | | 22,740 | |
Secured bank loans(a) | | | 821 | | | | 626 | |
Redeemable preference shares(b) | | | 15 | | | | 15 | |
Finance leases | | | 108 | | | | 155 | |
Unsecured other(a) | | | 381 | | | | 429 | |
Secured other(a) | | | 565 | | | | 544 | |
| | | | | | | | |
Total non-current interest bearing liabilities | | | 29,862 | | | | 24,799 | |
| | | | | | | | |
| | | | | | | | |
| | | 2015 | | | 2014 | |
| | | US$M | | | US$M | |
Current | | | | | | | | |
Bank loans(a) | | | 664 | | | | 81 | |
Notes and debentures(a) | | | 2,205 | | | | 4,002 | |
Finance leases | | | 94 | | | | 93 | |
Other | | | 98 | | | | 35 | |
Bank overdrafts and short-term borrowings | | | 140 | | | | 51 | |
| | | | | | | | |
Total current interest bearing liabilities(b) | | | 3,201 | | | | 4,262 | |
| | | | | | | | |
Non-current | | | | | | | | |
Bank loans(a) | | | 931 | | | | 1,381 | |
Notes and debentures(a) | | | 26,520 | | | | 27,245 | |
Finance leases | | | 344 | | | | 1,291 | |
Other(a) | | | 174 | | | | 410 | |
| | | | | | | | |
Total non-current interest bearing liabilities(b) | | | 27,969 | | | | 30,327 | |
| | | | | | | | |
| (a) | IncludesBalance for 2014 includes US$83675 million (2012: US$708 million) proportionate share of bank loans and other borrowings arranged by jointly controlled entitiesjoint operations to fundfinance the financing of joint venture partners.operations. While the Group
|
| chose to finance the joint venturesoperations directly and not to participate in the external borrowing programs arranged by the joint ventures, the Groupoperations, it recognises its share of those borrowings on proportionate consolidation ofin accordance with the assets and liabilitiesterms of each venture – referarrangement, which are usually in proportion to note 1 Accounting policies. |
| the Group’s interest in the joint operation. A corresponding amount ofis recognised in interest bearing loans receivable is recognised in other receivables – referreceivable. Refer to note 10 Trade8 ‘Trade and other receivables,receivables’, reflecting the direct funding of the Group’s contribution to each joint venture.operation. These arrangements were divested as part of the demerger of South32, hence there are no balances for 2015. |
| (b) | Total interest bearing liabilities include US$16,563 million denominated in USD, US$8,926 million denominated in EUR, US$2,011 million denominated in AUD and US$3,670 million denominated in other currencies (2014: US$33,013 million denominated in USD, US$ nil denominated in EUR, US$1,336 million denominated in AUD and US$240 million denominated in other currencies). All interest bearing liabilities, excluding finance leases, are unsecured. |
Refer to note 43 ‘Significant accounting policies’ (h) and (s).
16. Net finance costs
| | | | | | | | | | | | |
| | | 2015 | | | 2014 | | | 2013 | |
| | | US$M | | | US$M | | | US$M | |
Financial expenses | | | | | | | | | | | | |
Interest on bank loans and overdrafts | | | 9 | | | | 11 | | | | 12 | |
Interest on all other borrowings(a) | | | 517 | | | | 657 | | | | 954 | |
Finance lease and hire purchase interest | | | 25 | | | | 19 | | | | 7 | |
Discounting on provisions and other liabilities | | | 333 | | | | 338 | | | | 335 | |
Net interest expense on post-retirement employee benefits | | | 15 | | | | 11 | | | | 7 | |
Interest capitalised(b) | | | (148 | ) | | | (182 | ) | | | (290 | ) |
Fair value change on hedged loans | | | 372 | | | | 328 | | | | (505 | ) |
Fair value change on hedging derivatives | | | (358 | ) | | | (292 | ) | | | 489 | |
Fair value change on non-hedging derivatives(c) | | | – | | | | 101 | | | | 183 | |
Exchange variations on net debt (d) | | | (63 | ) | | | 4 | | | | 37 | |
| | | | | | | | | | | | |
| | | 702 | | | | 995 | | | | 1,229 | |
| | | | | | | | | | | | |
Financial income | | | | | | | | | | | | |
Interest income | | | (88 | ) | | | (81 | ) | | | (80 | ) |
| | | | | | | | | | | | |
| | | (88 | ) | | | (81 | ) | | | (80 | ) |
| | | | | | | | | | | | |
Net finance costs | | | 614 | | | | 914 | | | | 1,149 | |
| | | | | | | | | | | | |
| (a) | Interest on all other borrowings includes net interest income of US$67 million (2014: expense of US$116 million; 2013: expense of US$172 million) with respect to Petrohawk Senior Notes, which included gains of US$80 million on the early redemption of notes in August 2014 (2014: gains of US$24 million on the early redemption of notes in February 2014; 2013: US$ nil). |
| (b) | Interest has been capitalised at the rate of interest applicable to the specific borrowings financing the assets under construction or, where financed through general borrowings, at a capitalisation rate representing the average interest rate on such borrowings. For the year ended 30 June 2015, the capitalisation rate was 1.94 per cent (2014: 1.82 per cent; 2013: 2.24 per cent). Tax relief for capitalised interest is approximately US$42 million (2014: US$53 million; 2013: US$86 million). |
| (c) | Fair value change on non-hedging derivatives in the year ended 30 June 2014 includes unrealised fair value changes of US$101 million on non-hedging derivatives used to manage interest rate risk (2013: US$183 million). No such derivatives existed in the current period. |
| (d) | Exchange variations on net debt predominantly comprises revaluations of US$109 million on non-USD finance leases (2014: US$24 million; 2013: US$ nil). |
Refer to note 43 ‘Significant accounting policies’ (r).
17. Share capital
| | | | | | | | | | | | | | | | | | | | | | | | |
| | | BHP Billiton Limited | | | BHP Billiton Plc | |
| | | 2015 | | | 2014 | | | 2013 | | | 2015 | | | 2014 | | | 2013 | |
| | | US$M | | | US$M | | | US$M | | | US$M | | | US$M | | | US$M | |
Share capital | | | | | | | | | | | | | | | | | | | | | | | | |
At the beginning of the financial year | | | 1,186 | | | | 1,186 | | | | 1,186 | | | | 1,069 | | | | 1,069 | | | | 1,069 | |
Shares cancelled (a) | | | – | | | | – | | | | – | | | | (12 | ) | | | – | | | | – | |
| | | | | | | | | | | | | | | | | | | | | | | | |
At the end of the financial year | | | 1,186 | | | | 1,186 | | | | 1,186 | | | | 1,057 | | | | 1,069 | | | | 1,069 | |
| | | | | | | | | | | | | | | | | | | | | | | | |
Treasury shares | | | | | | | | | | | | | | | | | | | | | | | | |
At the beginning of the financial year | | | (51 | ) | | | (8 | ) | | | (8 | ) | | | (536 | ) | | | (532 | ) | | | (525 | ) |
Purchase of shares by ESOP Trusts | | | (232 | ) | | | (290 | ) | | | (330 | ) | | | (123 | ) | | | (78 | ) | | | (115 | ) |
Employee share awards exercised following vesting, net of employee contributions and other adjustments | | | 264 | | | | 247 | | | | 330 | | | | 99 | | | | 74 | | | | 108 | |
Shares cancelled (a) | | | – | | | | – | | | | – | | | | 501 | | | | – | | | | – | |
Conversion of controlled entity to equity accounted investment(b) | | | – | | | | – | | | | – | | | | 2 | | | | – | | | | – | |
| | | | | | | | | | | | | | | | | | | | | | | | |
At the end of the financial year | | | (19 | ) | | | (51 | ) | | | (8 | ) | | | (57 | ) | | | (536 | ) | | | (532 | ) |
| | | | | | | | | | | | | | | | | | | | | | | | |
| | |
| | | BHP Billiton Limited | | | BHP Billiton Plc(c) | |
| | | 2015
Shares(d) | | | 2014
Shares(d) | | | 2013
Shares (d) | | | 2015
Shares(d) | | | 2014
Shares(d) | | | 2013
Shares (d) | |
Share capital issued | | | | | | | | | | | | | | | | | | | | | | | | |
Ordinary shares fully paid | | | 3,211,691,105 | | | | 3,211,691,105 | | | | 3,211,691,105 | | | | 2,112,071,796 | | | | 2,136,185,454 | | | | 2,136,185,454 | |
Comprising: | | | | | | | | | | | | | | | | | | | | | | | | |
Shares held by the public | | | 3,210,852,008 | | | | 3,210,206,876 | | | | 3,211,448,985 | | | | 2,110,333,783 | | | | 2,110,945,784 | | | | 2,111,078,268 | |
Treasury shares | | | 839,097 | | | | 1,484,229 | | | | 242,120 | | | | 1,738,013 | | | | 25,239,670 | | | | 25,107,186 | |
Special Voting Share of no par value (e) | | | 1 | | | | 1 | | | | 1 | | | | – | | | | – | | | | – | |
5.5% Preference shares of £1 each(f) | | | – | | | | – | | | | – | | | | 50,000 | | | | 50,000 | | | | 50,000 | |
Special Voting Share of US$0.50 par value(e) | | | – | | | | – | | | | – | | | | 1 | | | | 1 | | | | 1 | |
| | |
| | | BHP Billiton Limited | | | BHP Billiton Plc | |
| | | 2015
Shares | | | 2014
Shares | | | 2013
Shares | | | 2015
Shares | | | 2014
Shares | | | 2013
Shares | |
Movement in shares held by the public | | | | | | | | | | | | | | | | | | | | | | | | |
Opening number of shares | | | 3,210,206,876 | | | | 3,211,448,985 | | | | 3,211,448,985 | | | | 2,110,945,784 | | | | 2,111,078,268 | | | | 2,111,273,967 | |
Purchase of shares by ESOP Trusts | | | (6,798,803 | ) | | | (8,621,160 | ) | | | (9,545,296 | ) | | | (3,623,582 | ) | | | (2,563,735 | ) | | | (3,761,193 | ) |
Employee share awards exercised following vesting | | | 7,443,935 | | | | 7,379,051 | | | | 9,545,296 | | | | 2,945,980 | | | | 2,431,251 | | | | 3,565,494 | |
Conversion of controlled entity to equity accounted investment (b) | | | – | | | | – | | | | – | | | | 65,601 | | | | – | | | | – | |
| | | | | | | | | | | | | | | | | | | | | | | | |
Closing number of shares (g) | | | 3,210,852,008 | | | | 3,210,206,876 | | | | 3,211,448,985 | | | | 2,110,333,783 | | | | 2,110,945,784 | | | | 2,111,078,268 | |
| | | | | | | | | | | | | | | | | | | | | | | | |
| | | | | | | | | | | | | | | | | | | | | | | | |
| | | BHP Billiton Limited | | | BHP Billiton Plc | |
| | | 2015
Shares | | | 2014
Shares | | | 2013
Shares | | | 2015
Shares | | | 2014
Shares | | | 2013
Shares | |
Movement in Treasury shares | | | | | | | | | | | | | | | | | | | | | | | | |
Opening number of shares | | | 1,484,229 | | | | 242,120 | | | | 242,120 | | | | 25,239,670 | | | | 25,107,186 | | | | 24,911,487 | |
Purchase of shares by ESOP Trusts | | | 6,798,803 | | | | 8,621,160 | | | | 9,545,296 | | | | 3,623,582 | | | | 2,563,735 | | | | 3,761,193 | |
Employee share awards exercised following vesting | | | (7,443,935 | ) | | | (7,379,051 | ) | | | (9,545,296 | ) | | | (2,945,980 | ) | | | (2,431,251 | ) | | | (3,565,494 | ) |
Shares cancelled (a) | | | – | | | | – | | | | – | | | | (24,113,658 | ) | | | – | | | | – | |
Conversion of controlled entity to equity accounted investment (b) | | | – | | | | – | | | | – | | | | (65,601 | ) | | | – | | | | – | |
| | | | | | | | | | | | | | | | | | | | | | | | |
Closing number of shares | | | 839,097 | | | | 1,484,229 | | | | 242,120 | | | | 1,738,013 | | | | 25,239,670 | | | | 25,107,186 | |
| | | | | | | | | | | | | | | | | | | | | | | | |
| (a) | On 28 August 2014, BHP Billiton Plc cancelled 24,113,658 ordinary shares of US$0.50 each held as Treasury shares. |
| (b) | Comprises 150 (2012: 150) Series A preferredDuring the year, subsidiaries holding treasury shares issued by BHP Billiton Foreign Holdings Inc. at US$100,000 each fully paid, cumulative and non-participating. The shares are redeemable at par at the option of BHP Billiton Foreign Holdings Inc. after 3 August 2013 and at the option of the holder of the shares after 3 February 2016. |
17 Other financial liabilities
| | | | | | | | |
| | | 2013 | | | 2012 | |
| | | US$M | | | US$M | |
Current | | | | | | | | |
Cross currency and interest rate swaps, and swaptions | | | 173 | | | | 6 | |
Forward exchange contracts | | | 1 | | | | 6 | |
Commodity contracts | | | 19 | | | | 154 | |
Other derivative contracts | | | 24 | | | | 34 | |
| | | | | | | | |
Total current other financial liabilities | | | 217 | | | | 200 | |
| | | | | | | | |
Non-current | | | | | | | | |
Cross currency and interest rate swaps | | | 553 | | | | 256 | |
Commodity contracts | | | 8 | | | | 24 | |
Other derivative contracts | | | 21 | | | | 37 | |
| | | | | | | | |
Total non-current other financial liabilities | | | 582 | | | | 317 | |
| | | | | | | | |
18 Provisions
| | | | | | | | |
| | | 2013 | | | 2012 | |
| | | US$M | | | US$M | |
Current | | | | | | | | |
Employee benefits(a) | | | 1,601 | | | | 1,592 | |
Restructuring(b) | | | 46 | | | | 100 | |
Closure and rehabilitation(c) | | | 372 | | | | 406 | |
Post-retirement employee benefits(d) | | | 6 | | | | 28 | |
Other | | | 370 | | | | 658 | |
| | | | | | | | |
Total current provisions | | | 2,395 | | | | 2,784 | |
| | | | | | | | |
Non-current | | | | | | | | |
Employee benefits(a) | | | 263 | | | | 208 | |
Restructuring(b) | | | 1 | | | | 12 | |
Closure and rehabilitation(c) | | | 7,235 | | | | 7,645 | |
Post-retirement employee benefits(d) | | | 548 | | | | 771 | |
Other | | | 190 | | | | 278 | |
| | | | | | | | |
Total non-current provisions | | | 8,237 | | | | 8,914 | |
| | | | | | | | |
(a) | The expenditure associated with total employee benefits will occur in a pattern consistent with when employees choose to exercise their entitlement to benefits. |
(b) | Total restructuring provisions include provision for business terminations and office closures. |
(c) | Total closure and rehabilitation provisions include provision for closed sites of US$1,075 million (2012: US$1,216 million). |
(d) | The provision for post-retirement employee benefits includes pension liabilities of US$139 million (2012: US$349 million) and post-retirement medical benefit liabilities of US$415 million (2012: US$450 million) – refer to note 30 Pension and other post-retirement obligations. The non-current provision includes Non-executive Directors’ retirement benefits of US$1 million (2012: US$1 million). |
| | | | | | | | | | | | | | | | | | | | | | | | |
| | | Employee
benefits | | | Restructuring | | | Closure and
rehabilitation | | | Post-retirement
employee
benefits | | | Other | | | Total | |
| | | US$M | | | US$M | | | US$M | | | US$M | | | US$M | | | US$M | |
At the beginning of the financial year | | | 1,800 | | | | 112 | | | | 8,051 | | | | 799 | | | | 936 | | | | 11,698 | |
Amounts capitalised | | | – | | | | – | | | | (73 | ) | | | – | | | | – | | | | (73 | ) |
Charge/(credit) for the year: | | | | | | | | | | | | | | | | | | | | | | | | |
Underlying | | | 1,808 | | | | 90 | | | | 148 | | | | 54 | | | | 280 | | | | 2,380 | |
Discounting | | | 7 | | | | 2 | | | | 454 | | | | 111 | | | | – | | | | 574 | |
Expected return on pension scheme assets | | | – | | | | – | | | | – | | | | (92 | ) | | | – | | | | (92 | ) |
Exchange variations | | | (124 | ) | | | – | | | | (63 | ) | | | (24 | ) | | | (7 | ) | | | (218 | ) |
Released during the year | | | (68 | ) | | | (15 | ) | | | (203 | ) | | | – | | | | (190 | ) | | | (476 | ) |
Actuarial loss taken to retained earnings | | | – | | | | – | | | | – | | | | (61 | ) | | | – | | | | (61 | ) |
Exchange variations taken to reserve | | | – | | | | – | | | | (10 | ) | | | 1 | | | | – | | | | (9 | ) |
Utilisation | | | (1,606 | ) | | | (132 | ) | | | (269 | ) | | | (212 | ) | | | (387 | ) | | | (2,606 | ) |
Transferred to liabilities held for sale | | | (15 | ) | | | – | | | | (448 | ) | | | (15 | ) | | | (4 | ) | | | (482 | ) |
Transfers and other movements | | | 62 | | | | (10 | ) | | | 20 | | | | (7 | ) | | | (68 | ) | | | (3 | ) |
| | | | | | | | | | | | | | | | | | | | | | | | |
At the end of the financial year | | | 1,864 | | | | 47 | | | | 7,607 | | | | 554 | | | | 560 | | | | 10,632 | |
| | | | | | | | | | | | | | | | | | | | | | | | |
19 Share capital
| | | | | | | | | | | | | | | | | | | | | | | | |
| | | BHP Billiton Limited | | | BHP Billiton Plc | |
| | | 2013 | | | 2012 | | | 2011 | | | 2013 | | | 2012 | | | 2011 | |
| | | US$M | | | US$M | | | US$M | | | US$M | | | US$M | | | US$M | |
Share capital | | | | | | | | | | | | | | | | | | | | | | | | |
At the beginning of the financial year | | | 1,186 | | | | 1,183 | | | | 1,227 | | | | 1,069 | | | | 1,070 | | | | 1,116 | |
Shares bought back and cancelled(a) | | | – | | | | – | | | | (44 | ) | | | – | | | | (1 | ) | | | (46 | ) |
Proceeds from the issue of shares | | | – | | | | 3 | | | | – | | | | – | | | | – | | | | – | |
| | | | | | | | | | | | | | | | | | | | | | | | |
At the end of the financial year | | | 1,186 | | | | 1,186 | | | | 1,183 | | | | 1,069 | | | | 1,069 | | | | 1,070 | |
| | | | | | | | | | | | | | | | | | | | | | | | |
Treasury shares | | | | | | | | | | | | | | | | | | | | | | | | |
At the beginning of the financial year | | | (8 | ) | | | (1 | ) | | | (1 | ) | | | (525 | ) | | | (622 | ) | | | (524 | ) |
Purchase of shares by ESOP Trusts | | | (330 | ) | | | (318 | ) | | | (351 | ) | | | (115 | ) | | | (106 | ) | | | (118 | ) |
Employee share awards exercised following vesting | | | 330 | | | | 311 | | | | 351 | | | | 108 | | | | 120 | | | | 103 | |
Shares bought back(a) | | | – | | | | – | | | | – | | | | – | | | | – | | | | (3,678 | ) |
Shares cancelled(a) | | | – | | | | – | | | | – | | | | – | | | | 83 | | | | 3,595 | |
| | | | | | | | | | | | | | | | | | | | | | | | |
At the end of the financial year(b) | | | (8 | ) | | | (8 | ) | | | (1 | ) | | | (532 | ) | | | (525 | ) | | | (622 | ) |
| | | | | | | | | | | | | | | | | | | | | | | | |
| | |
| | | BHP Billiton Limited | | | BHP Billiton Plc(c) | |
| | | 2013
Shares(d) | | | 2012
Shares(d) | | | 2011
Shares(d) | | | 2013
Shares(d) | | | 2012
Shares(d) | | | 2011
Shares(d) | |
Share capital issued | | | | | | | | | | | | | | | | | | | | | | | | |
Ordinary shares fully paid | | | 3,211,691,105 | | | | 3,211,691,105 | | | | 3,211,654,687 | | | | 2,136,185,454 | | | | 2,136,185,454 | | | | 2,138,367,191 | |
Comprising | | | | | | | | | | | | | | | | | | | | | | | | |
– Shares held by the public | | | 3,211,448,985 | | | | 3,211,448,985 | | | | 3,211,607,567 | | | | 2,111,078,268 | | | | 2,111,273,967 | | | | 2,110,963,849 | |
– Treasury shares | | | 242,120 | | | | 242,120 | | | | 47,120 | | | | 25,107,186 | | | | 24,911,487 | | | | 27,403,342 | |
Ordinary shares paid to A$1.36 | | | – | | | | – | | | | – | | | | | | | | | | | | | |
Special Voting Share of no par value(e) | | | 1 | | | | 1 | | | | 1 | | | | | | | | | | | | | |
5.5% Preference shares of £1 each(f) | | | | | | | | | | | | | | | 50,000 | | | | 50,000 | | | | 50,000 | |
Special Voting Share of US$0.50 par value(e) | | | | | | | | | | | | | | | 1 | | | | 1 | | | | 1 | |
| | | | | | | | | | | | | | | | | | | | | | | | |
| | | BHP Billiton Limited | | | BHP Billiton Plc | |
| | | 2013
Shares | | | 2012
Shares | | | 2011
Shares | | | 2013
Shares | | | 2012
Shares | | | 2011
Shares | |
Movement in shares held by the public | | | | | | | | | | | | | | | | | | | | | | | | |
Opening number of shares | | | 3,211,448,985 | | | | 3,211,607,567 | | | | 3,358,397,376 | | | | 2,111,273,967 | | | | 2,110,963,849 | | | | 2,206,076,344 | |
Shares issued on the exercise of Group Incentive Scheme awards | | | – | | | | 36,418 | | | | – | | | | – | | | | – | | | | – | |
Partly paid shares becoming fully paid(g) | | | – | | | | – | | | | 110,000 | | | | – | | | | – | | | | – | |
Purchase of shares by ESOP Trusts | | | (9,545,296 | ) | | | (8,077,647 | ) | | | (8,997,229 | ) | | | (3,761,193 | ) | | | (3,055,030 | ) | | | (3,664,620 | ) |
Employee share awards exercised following vesting | | | 9,545,296 | | | | 7,882,647 | | | | 8,997,229 | | | | 3,565,494 | | | | 3,365,148 | | | | 3,487,873 | |
Shares bought back(a) | | | – | | | | – | | | | (146,899,809 | ) | | | – | | | | – | | | | (94,935,748 | ) |
| | | | | | | | | | | | | | | | | | | | | | | | |
Closing number of shares (h) | | | 3,211,448,985 | | | | 3,211,448,985 | | | | 3,211,607,567 | | | | 2,111,078,268 | | | | 2,111,273,967 | | | | 2,110,963,849 | |
| | | | | | | | | | | | | | | | | | | | | | | | |
| | | | | | | | | | | | | | | | | | | | | | | | |
| | | BHP Billiton Limited | | | BHP Billiton Plc | |
| | | 2013
Shares | | | 2012
Shares | | | 2011
Shares | | | 2013
Shares | | | 2012
Shares | | | 2011
Shares | |
Movement in Treasury shares | | | | | | | | | | | | | | | | | | | | | | | | |
Opening number of shares | | | 242,120 | | | | 47,120 | | | | 47,120 | | | | 24,911,487 | | | | 27,403,342 | | | | 25,044,858 | |
Purchase of shares by ESOP Trusts | | | 9,545,296 | | | | 8,077,647 | | | | 8,997,229 | | | | 3,761,193 | | | | 3,055,030 | | | | 3,664,620 | |
Employee share awards exercised following vesting | | | (9,545,296 | ) | | | (7,882,647 | ) | | | (8,997,229 | ) | | | (3,565,494 | ) | | | (3,365,148 | ) | | | (3,487,873 | ) |
Shares bought back(a) | | | – | | | | – | | | | – | | | | – | | | | – | | | | 94,935,748 | |
Shares cancelled(a) | | | – | | | | – | �� | | | – | | | | – | | | | (2,181,737 | ) | | | (92,754,011 | ) |
| | | | | | | | | | | | | | | | | | | | | | | | |
Closing number of shares | | | 242,120 | | | | 242,120 | | | | 47,120 | | | | 25,107,186 | | | | 24,911,487 | | | | 27,403,342 | |
| | | | | | | | | | | | | | | | | | | | | | | | |
| | | | | | | | | | | | |
| | | BHP Billiton Limited | |
| | | 2013
Shares | | | 2012
Shares | | | 2011
Shares | |
Movement in shares partly paid to A$1.36 | | | | | | | | | | | | |
Opening number of shares | | | – | | | | – | | | | 110,000 | |
Partly paid shares becoming fully paid(g) | | | – | | | | – | | | | (110,000 | ) |
| | | | | | | | | | | | |
Closing number of shares | | | – | | | | – | | | | – | |
| | | | | | | | | | | | |
(a) | On 15 November 2010, BHP Billiton announced the reactivation of the remaining US$4.2 billion component of its previously suspended US$13 billion buy-back program and subsequently announced an expanded US$10 billion capital management program on 16 February 2011. This expanded program was completed on 29 June 2011 through a combination of on-market and off-market buy-backs. In accordance with the UK Companies Act 2006 and with the resolutions passed at the 2010 Annual General Meetings, BHP Billiton Limited purchased fully paid shares in BHP Billiton Plc on-market and then transferred those shares to BHP Billiton Plc for nil consideration and cancellation. BHP Billiton Plc shares bought back as part of this program but not cancelled at 30 June 2011 were accounted for as Treasury shares within the share capital of BHP Billiton Plc. An off-market tender buy-back of BHP Billiton Limited shares was completed on 11 April 2011. In accordance with the structure of the buy-back, US$44 million was allocated to the share capital of BHP Billiton Limited and US$6,301 million was allocated to retained earnings. These shares were then cancelled. Details of the purchases are shown in the table below. Cost per share represents the average cost per share for BHP Billiton Plc shares and final cost per share for BHP Billiton Limited shares. |
| | | | | | | | | | | | | | | | | | | | | | | | | | | | | | |
Year ended | | Shares purchased | | Number | | | Cost
per
share | | | Total cost
US$M | | | Purchased by: | |
| | | | | | BHP Billiton
Limited | | | BHP Billiton Plc | |
| | | | | | Shares | | | US$M | | | Shares | | | US$M | |
30 June 2011 | | BHP Billiton Plc | | | 94,935,748 | | | | £23.96 | (i) | | | 3,678 | | | | 94,935,748 | | | | 3,678 | | | | – | | | | – | |
| | BHP Billiton Limited | | | 146,899,809 | | | | A$40.85 | | | | 6,345 | | | | 146,899,809 | | | | 6,345 | | | | – | | | | – | |
| (i) | Cost per share represents the average cost per share paid on-market by BHP Billiton Limited for BHP Billiton Plc shares in 2011. Since the commencement of the buy-back in 2006 the average cost per share was £15.67. |
(b) | Treasury shares include US$ nil and US$12 million held by subsidiaries in respect of ESOP Trusts for BHP Billiton Limited and BHP Billiton Plc respectively (2012: US$ nil and US$ nil; 2011: US$ nil and US$ nil).were converted to equity accounted investments, resulting in a transfer of these shares from Treasury shares to shares held by the public. |
| (c) | An Equalisation Share (US$0.50 par value) has been authorised to be issued to enable a distribution to be made by BHP Billiton Plc Group to the BHP Billiton Limited Group should this be required under the terms of the DLC merger. The Directors have the ability to issue the Equalisation Share if required under those terms. The Constitution of BHP Billiton Limited allows the Directors of that Company to issue a similar Equalisation Share. There has been no movement in this class of share. |
| (d) | The total number of BHP Billiton Limited shares of all classes is 3,211,691,106 of which 99.99 per cent are ordinary shares fully paid (2012:(2014: 3,211,691,106, 99.99 per cent; 2011: 3,211,654,688,2013: 3,211,691,106, 99.99 per cent). The total number of BHP Billiton Plc shares of all classes is 2,136,235,4552,112,121,797 of which 99.99 per cent are ordinary shares of US$0.50 par value (2012:(2014: 2,136,235,455, 99.99 per cent; 2011: 2,138,417,192,2013: 2,136,235,455, 99.99 per cent). Any profit remaining after payment of preferred distributions is available for distribution to the holders of BHP Billiton Limited and BHP Billiton Plc ordinary shares in equal amounts per share. |
| (e) | Each of BHP Billiton Limited and BHP Billiton Plc issued one Special Voting Share to facilitate joint voting by shareholders of BHP Billiton Limited and BHP Billiton Plc on Joint Electorate Actions. There has been no movement in these shares. |
| (f) | Preference shares have the right to repayment of the amount paid up on the nominal value and any unpaid dividends in priority to the holders of any other class of shares in BHP Billiton Plc on a return of capital or winding up. The holders of preference shares have limited voting rights if payment of the preference dividends are six months or more in arrears or a resolution is passed changing the rights of the preference shareholders. There has been no movement in these shares, all of which are held by JP Morgan plc.Limited. |
| (g) | During the financial year ended 30 June 2011, 110,000 partly paid shares were paid up and became fully paid shares. 70,000 of these partly paid shares were also entitled to 79,928 bonus shares, which were satisfied via on-market purchase. |
(h) | During the period 1 July 20132015 to 1210 September 2013,2015, no fully paid ordinary shares in BHP Billiton were issued on the exercise of Group Incentive Scheme awards. |
2018. Other equity
| | | | 2013 | | 2012 | | 2011 | | | 2015 | | 2014 | | 2013 | |
| | | US$M | | US$M | | US$M | | | US$M | | US$M | | US$M | |
Reserves | | | | | | | | | | | | |
Share premium account (a) | | | | | | | | | | | | |
At the beginning of the financial year | | | 518 | | | | 518 | | | | 518 | | | | 518 | | | 518 | | | 518 | |
| | | | | | | | | | | | | | | | | | |
At the end of the financial year | | | 518 | | | | 518 | | | | 518 | | | | 518 | | | 518 | | | 518 | |
| | | | | | | | | | | | | | | | | | |
Foreign currency translation reserve (b) | | | | | | | | | | | | |
At the beginning of the financial year | | | 53 | | | | 34 | | | | 15 | | | | 54 | | | 55 | | | 53 | |
Exchange fluctuations on translation of foreign operations taken to equity | | | 2 | | | | 19 | | | | 19 | | | | (2 | ) | | (1 | ) | | 2 | |
| | | | | | | | | | | | | | | | | | |
Total other comprehensive income | | | 2 | | | | 19 | | | | 19 | | | | (2 | ) | | (1 | ) | | 2 | |
| | | | | | | | | | | | | | | | | | |
At the end of the financial year | | | 55 | | | | 53 | | | | 34 | | | | 52 | | | 54 | | | 55 | |
| | | | | | | | | | | | | | | | | | |
Employee share awards reserve (c) | | | | | | | | | | | | |
At the beginning of the financial year | | | 697 | | | | 680 | | | | 557 | | | | 599 | | | 605 | | | 697 | |
Net deferred tax arising on accrued employee entitlement for share awards | | | (42 | ) | | | (56 | ) | | | (13 | ) | | | – | | | | – | | | (42 | ) |
| | | | | | | | | | | | | | | | | | |
Total other comprehensive income | | | (42 | ) | | | (56 | ) | | | (13 | ) | | | – | | | | – | | | (42 | ) |
Employee share awards exercised net of employee contributions | | | (243 | ) | | | (189 | ) | | | (121 | ) | |
Employee share awards exercised net of employee contributions and other adjustments | | | | (461 | ) | | (221 | ) | | (243 | ) |
Employee share awards forfeited | | | (17 | ) | | | (8 | ) | | | (9 | ) | | | (13 | ) | | (32 | ) | | (17 | ) |
Accrued employee entitlement for unexercised awards | | | 210 | | | | 270 | | | | 266 | | | | 247 | | | 247 | | | 210 | |
| | | | | | | | | | | | | | | | | | |
At the end of the financial year | | | 605 | | | | 697 | | | | 680 | | | | 372 | | | 599 | | | 605 | |
| | | | | | | | | | | | | | | | | | |
Hedging reserve – cash flow hedges (d) | | | | | | | | | | | | |
At the beginning of the financial year | | | (80 | ) | | | – | | | | – | | | | 129 | | | 127 | | | (80 | ) |
Gains/(losses) on cash flow hedges taken to equity | | | 223 | | | | (320 | ) | | | – | | |
Unrealised losses on cash flow hedges transferred to the income statement | | | 73 | | | | 205 | | | | – | | |
(Losses)/gains taken to equity | | | | (1,797 | ) | | 681 | | | 223 | |
Losses/(gains) transferred to the income statement | | | | 1,815 | | | (678 | ) | | 73 | |
Deferred tax relating to cash flow hedges | | | (89 | ) | | | 35 | | | | – | | | | (6 | ) | | (1 | ) | | (89 | ) |
| | | | | | | | | | | | | | | | | | |
Total other comprehensive income | | | 207 | | | | (80 | ) | | | – | | | | 12 | | | 2 | | | 207 | |
| | | | | | | | | | | | | | | | | | |
At the end of the financial year | | | 127 | | | | (80 | ) | | | – | | | | 141 | | | 129 | | | 127 | |
| | | | | | | | | | | | | | | | | | |
Financial assets reserve (e) | | | | | | | | | | | | |
At the beginning of the financial year | | | 230 | | | | 276 | | | | 348 | | | | 115 | | | 140 | | | 230 | |
Net valuation losses on available for sale investments taken to equity | | | (103 | ) | | | (32 | ) | | | (71 | ) | | | (27 | ) | | (15 | ) | | (103 | ) |
Net valuation gains on available for sale investments transferred to the income statement | | | (1 | ) | | | (2 | ) | | | (38 | ) | | | (115 | ) | | (14 | ) | | (1 | ) |
Deferred tax relating to revaluations | | | 14 | | | | (12 | ) | | | 37 | | |
Deferred tax relating to revaluation gains and losses | | | | 36 | | | 4 | | | 14 | |
| | | | | | | | | | | | | | | | | | |
Total other comprehensive income | | | (90 | ) | | | (46 | ) | | | (72 | ) | | | (106 | ) | | (25 | ) | | (90 | ) |
| | | | | | | | | | | | | | | | | | |
At the end of the financial year | | | 140 | | | | 230 | | | | 276 | | | | 9 | | | 115 | | | 140 | |
| | | | | | | | | | | | | | | | | | |
Share buy-back reserve (f) | | | | | | | | | | | | |
At the beginning of the financial year | | | 165 | | | | 164 | | | | 118 | | | | 165 | | | 165 | | | 165 | |
BHP Billiton Plc shares cancelled | | | – | | | | 1 | | | | 46 | | | | 12 | | | | – | | | | – | |
| | | | | | | | | | | | | | | | | | |
At the end of the financial year | | | 165 | | | | 165 | | | | 164 | | | | 177 | | | 165 | | | 165 | |
| | | | | | | | | | | | | | | | | | |
Non-controlling interest contribution reserve (g) | | | | | | | | | | | | |
At the beginning of the financial year | | | 329 | | | | 329 | | | | 350 | | | | 1,347 | | | 360 | | | 329 | |
Issue of share options to non-controlling interests | | | 49 | | | | – | | | | – | | | | – | | | | – | | | 49 | |
Distribution to option holders | | | – | | | | – | | | | (21 | ) | | | (1 | ) | | (2 | ) | | | – | |
Divestment of jointly controlled entities | | | (18 | ) | | | – | | | | – | | |
Equity contributed | | | | 1 | | | 989 | | | | – | |
Divestment of equity accounted investments | | | | – | | | | – | | | (18 | ) |
Transfers within equity on demerger | | | | (59 | ) | | | – | | | | – | |
| | | | | | | | | | | | | | | | | | |
At the end of the financial year | | | 360 | | | | 329 | | | | 329 | | | | 1,288 | | | 1,347 | | | 360 | |
| | | | | | | | | | | | | | | | | | |
Total reserves | | | 1,970 | | | | 1,912 | | | | 2,001 | | | | 2,557 | | | 2,927 | | | 1,970 | |
| | | | | | | | | | | | | | | | | | |
| | | | 2013 | | 2012 | | 2011 | | | 2015 | | 2014 | | 2013 | |
| | | US$M | | US$M | | US$M | | | US$M | | US$M | | US$M | |
Retained earnings | | | | | | | | | | | | |
At the beginning of the financial year | | | 62,236 | | | | 53,131 | | | | 44,801 | | | | 74,548 | | | 66,982 | | | 61,892 | |
Profit after taxation | | | 10,876 | | | | 15,417 | | | | 23,648 | | | | 1,910 | | | 13,832 | | | 11,223 | |
Actuarial gains/(losses) on pension and medical schemes | | | 60 | | | | (253 | ) | | | (105 | ) | |
Remeasurement (losses)/gains on pension and medical schemes | | | | (28 | ) | | 57 | | | 60 | |
Tax recognised within other comprehensive income | | | 26 | | | | 123 | | | | 94 | | | | (17 | ) | | 12 | | | 26 | |
| | | | | | | | | | | | | | | | | | |
Total comprehensive income | | | 10,962 | | | | 15,287 | | | | 23,637 | | | | 1,865 | | | 13,901 | | | 11,309 | |
BHP Billiton Plc shares cancelled – refer to note 19 Share capital | | | – | | | | (83 | ) | | | (3,595 | ) | |
BHP Billiton Limited shares cancelled – refer to note 19 Share capital | | | – | | | | – | | | | (6,301 | ) | |
Employee share awards exercised, net of employee contributions and forfeitures | | | (161 | ) | | | (205 | ) | | | (285 | ) | |
BHP Billiton Plc shares cancelled – refer to note 17 ‘Share capital’ | | | | (501 | ) | | | – | | | | – | |
Employee share awards exercised, net of employee contributions, forfeitures and other adjustments | | | | 114 | | | (59 | ) | | (161 | ) |
Dividends | | | (6,076 | ) | | | (5,894 | ) | | | (5,126 | ) | | | (6,596 | ) | | (6,276 | ) | | (6,076 | ) |
Divestment of jointly controlled entities | | | 18 | | | | – | | | | – | | |
In-specie dividend on demerger – refer to note 29 ‘Discontinued operations’ | | | | (9,445 | ) | | | – | | | | – | |
Divestment of equity accounted investments | | | | – | | | | – | | | 18 | |
Transfers within equity on demerger | | | | 59 | | | | – | | | | – | |
| | | | | | | | | | | | | | | | | | |
At the end of the financial year | | | 66,979 | | | | 62,236 | | | | 53,131 | | | | 60,044 | | | 74,548 | | | 66,982 | |
| | | | | | | | | | | | | | | | | | |
| | | | 2013 | | 2012 | | 2011 | | | 2015 | | 2014 | | 2013 | |
| | | US$M | | US$M | | US$M | | | US$M | | US$M | | US$M | |
Non-controlling interests | | | | | | | | | | | | |
At the beginning of the financial year | | | 1,215 | | | | 993 | | | | 804 | | | | 6,239 | | | 4,624 | | | 3,789 | |
Profit after taxation | | | 199 | | | | 115 | | | | 298 | | | | 968 | | | 1,392 | | | 1,597 | |
Net valuation gains on available for sale investments taken to equity | | | 2 | | | | – | | | | 1 | | | | 6 | | | | – | | | 2 | |
Net valuation gains on available for sale investments transferred to the income statement | | | – | | | | – | | | | (9 | ) | |
Actuarial gains/(losses) on pension and medical schemes | | | 1 | | | | 3 | | | | (8 | ) | |
Remeasurement gains on pension and medical schemes | | | | – | | | | – | | | 1 | |
Tax recognised within other comprehensive income | | | (1 | ) | | | (1 | ) | | | 2 | | | | (1 | ) | | | – | | | (1 | ) |
| | | | | | | | | | | | | | | | | | |
Total comprehensive income | | | 201 | | | | 117 | | | | 284 | | | | 973 | | | 1,392 | | | 1,599 | |
Distribution to option holders | | | – | | | | – | | | | (17 | ) | | | (1 | ) | | (2 | ) | | | – | |
Dividends | | | (55 | ) | | | (56 | ) | | | (90 | ) | | | (639 | ) | | (252 | ) | | (837 | ) |
Equity contributed | | | 73 | | | | 161 | | | | 12 | | | | 52 | | | 477 | | | 73 | |
Divestment of jointly controlled entities | | | (63 | ) | | | – | | | | – | | |
Conversion of controlled entities to equity accounted investments | | | | (847 | ) | | | – | | | | – | |
| | | | | | | | | | | | | | | | | | |
At the end of the financial year | | | 1,371 | | | | 1,215 | | | | 993 | | | | 5,777 | | | 6,239 | | | 4,624 | |
| | | | | | | | | | | | | | | | | | |
| (a) | The share premium account represents the premium paid on the issue of BHP Billiton Plc shares recognised in accordance with the UK Companies Act 2006. |
| (b) | The foreign currency translation reserve represents exchange differences arising on the translation of non-US dollar functional currency operations within the Group into US dollars. |
| (c) | The employee share awards reserve represents the accrued employee entitlements to share awards that have been charged to the income statement and have not yet been exercised. |
| (d) | The hedging reserve represents hedging gains and losses recognised on the effective portion of cash flow hedges. The cumulative deferred gain or loss on the hedge is recognised in the income statement when the hedged transaction impacts the income statement, or is recognised as an adjustment to the cost of non-financial hedged items. |
| (e) | The financial assets reserve represents the revaluation of available for sale financial assets. Where a revalued financial asset is sold or impaired, the relevant portion of the reserve is transferred to the income statement. Net valuation gains transferred to the income statement in the current year of US$(115) million relate to Discontinued operations. |
| (f) | The share buy-back reserve represents the par value of BHP Billiton Plc shares which were purchased and subsequently cancelled. The cancellation of the shares creates a non-distributable reserve. |
| (g) | The non-controlling interest contribution reserve represents the excess of consideration received over the book value of net assets attributable to the equity instruments heldwhen acquired by non-controlling interests. |
Summarised financial information relating to each of the Group’s subsidiaries with non-controlling interests (NCI) that are material to the Group, before any intra-group eliminations is shown below:
| | | | | | | | | | | | | | | | | | | | |
2015 US$M | | BHP Iron
Ore
(Jimblebar)
Pty Ltd (a) | | | Minera
Escondida
Limitada | | | Other
individually
immaterial
subsidiaries | | | Intra-group
eliminations | | | Total | |
BHP Billiton share (per cent) | | | 85.0 | | | | 57.5 | | | | | | | | | | | | | |
| | | | | | | | | | | | | | | | | | | | |
Current assets(c) | | | 319 | | | | 2,542 | | | | | | | | | | | | | |
Non-current assets(c) | | | 3,893 | | | | 13,060 | | | | | | | | | | | | | |
Current liabilities | | | (199 | ) | | | (1,973 | ) | | | | | | | | | | | | |
Non-current liabilities | | | (1,316 | ) | | | (2,209 | ) | | | | | | | | | | | | |
| | | | | | | | | | | | | | | | | | | | |
Net assets | | | 2,697 | | | | 11,420 | | | | | | | | | | | | | |
| | | | | | | | | | | | | | | | | | | | |
Net assets attributable to NCI | | | 403 | | | | 4,854 | | | | 520 | | | | – | | | | 5,777 | |
| | | | | | | | | | | | | | | | | | | | |
Revenue | | | 914 | | | | 8,092 | | | | | | | | | | | | | |
Profit after taxation | | | 169 | | | | 2,194 | | | | | | | | | | | | | |
Other comprehensive income | | | – | | | | – | | | | | | | | | | | | | |
| | | | | | | | | | | | | | | | | | | | |
Total comprehensive income | | | 169 | | | | 2,194 | | | | | | | | | | | | | |
| | | | | | | | | | | | | | | | | | | | |
Profit after taxation attributable to NCI | | | 19 | | | | 932 | | | | 17 | | | | – | | | | 968 | |
Other comprehensive income attributable to NCI | | | – | | | | – | | | | 5 | | | | – | | | | 5 | |
Dividends paid to NCI | | | 4 | | | | 536 | | | | 99 | | | | – | | | | 639 | |
| | | | | | | | | | | | | | | | | | | | |
| | | | | | | | | | | | | | | | | | | | | | | | | | | | |
2014 US$M | | BHP Iron
Ore
(Jimblebar)
Pty Ltd (a) | | | Minera
Escondida
Limitada | | | Samancor
Holdings
(Proprietary)
Limited (b) | | | Groote
Eylandt
Mining
Company
Pty Ltd (b) | | | Other
individually
immaterial
subsidiaries | | | Intra-group
eliminations | | | Total | |
BHP Billiton share (per cent) | | | 85.0 | | | | 57.5 | | | | 60.0 | | | | 60.0 | | | | | | | | | | | | | |
| | | | | | | | | | | | | | | | | | | | | | | | | | | | |
Current assets(c) | | | 626 | | | | 2,793 | | | | 17 | | | | 154 | | | | | | | | | | | | | |
Non-current assets(c) | | | 4,006 | | | | 10,803 | | | | 1,175 | | | | 1,178 | | | | | | | | | | | | | |
Current liabilities | | | (495 | ) | | | (1,034 | ) | | | (7 | ) | | | (125 | ) | | | | | | | | | | | | |
Non-current liabilities | | | (1,481 | ) | | | (2,075 | ) | | | – | | | | (225 | ) | | | | | | | | | | | | |
| | | | | | | | | | | | | | | | | | | | | | | | | | | | |
Net assets | | | 2,656 | | | | 10,487 | | | | 1,185 | | | | 982 | | | | | | | | | | | | | |
| | | | | | | | | | | | | | | | | | | | | | | | | | | | |
Net assets attributable to NCI | | | 388 | | | | 4,457 | | | | 474 | | | | 393 | | | | 529 | | | | (2 | ) | | | 6,239 | |
| | | | | | | | | | | | | | | | | | | | | | | | | | | | |
Revenue | | | 994 | | | | 8,706 | | | | – | | | | 990 | | | | | | | | | | | | | |
Profit after taxation | | | 204 | | | | 3,007 | | | | (1 | ) | | | 261 | | | | | | | | | | | | | |
Other comprehensive income | | | – | | | | – | | | | – | | | | – | | | | | | | | | | | | | |
| | | | | | | | | | | | | | | | | | | | | | | | | | | | |
Total comprehensive income | | | 204 | | | | 3,007 | | | | (1 | ) | | | 261 | | | | | | | | | | | | | |
| | | | | | | | | | | | | | | | | | | | | | | | | | | | |
Profit after taxation attributable to NCI | | | 22 | | | | 1,278 | | | | – | | | | 104 | | | | (9 | ) | | | (3 | ) | | | 1,392 | |
Other comprehensive income attributable to NCI | | | – | | | | – | | | | – | | | | – | | | | – | | | | – | | | | – | |
Dividends paid to NCI | | | – | | | | 74 | | | | – | | | | 120 | | | | 58 | | | | – | | | | 252 | |
| | | | | | | | | | | | | | | | | | | | | | | | | | | | |
| | | | | | | | | | | | | | | | | | | | | | | | | | | | |
2013 US$M | | BHP Iron
Ore
(Jimblebar)
Pty Ltd (a) | | | Minera
Escondida
Limitada | | | Samancor
Holdings
(Proprietary)
Limited (b) | | | Groote
Eylandt
Mining
Company
Pty Ltd (b) | | | Other
individually
immaterial
subsidiaries | | | Intra-group
eliminations | | | Total | |
BHP Billiton share (per cent) | | | 100.0 | | | | 57.5 | | | | 60.0 | | | | 60.0 | | | | | | | | | | | | | |
| | | | | | | | | | | | | | | | | | | | | | | | | | | | |
Revenue | | | – | | | | 8,826 | | | | – | | | | 935 | | | | | | | | | | | | | |
Profit after taxation | | | – | | | | 3,309 | | | | (5 | ) | | | 349 | | | | | | | | | | | | | |
Other comprehensive income | | | – | | | | – | | | | – | | | | – | | | | | | | | | | | | | |
| | | | | | | | | | | | | | | | | | | | | | | | | | | | |
Total comprehensive income | | | – | | | | 3,309 | | | | (5 | ) | | | 349 | | | | | | | | | | | | | |
| | | | | | | | | | | | | | | | | | | | | | | | | | | | |
Profit after taxation attributable to NCI | | | – | | | | 1,406 | | | | (2 | ) | | | 108 | | | | 70 | | | | 15 | | | | 1,597 | |
Other comprehensive income attributable to NCI | | | – | | | | – | | | | – | | | | – | | | | 2 | | | | – | | | | 2 | |
Dividends paid to NCI | | | – | | | | 782 | | | | – | | | | 32 | | | | 23 | | | | – | | | | 837 | |
| | | | | | | | | | | | | | | | | | | | | | | | | | | | |
| (a) | The Group has an effective interest of 92.5 per cent in BHP Iron Ore (Jimblebar) Pty Ltd, however by virtue of the shareholder agreement with ITOCHU Minerals & Energy of Australia Pty Ltd and Mitsui & Co. Iron Ore Exploration & Mining Pty Ltd, the Group’s interest in the Jimblebar mining operation is 85 per cent which is consistent with the other respective contractual arrangements at Western Australia Iron Ore. |
| (b) | On 2 March 2015, BHP Billiton ceased consolidation of its 60 per cent interest in Samancor Holdings (Proprietary) Limited and Groote Eylandt Mining Company Pty Ltd and accounted for its 60 per cent interest in those entities as equity accounted joint ventures. Refer to note 29 ‘Discontinued operations’. |
| (c) | While the Group controls these subsidiaries, the non-controlling interests hold certain protective rights which restrict the Group’s ability to sell assets held by these subsidiaries, or use the assets in other subsidiaries and operations owned by the Group. These subsidiaries are also restricted from paying dividends without the approval of the non-controlling interests. |
Refer to note 42 ‘Functional and presentation currency’ and note 43 ‘Significant accounting policies’ (c), (s) and (t).
19. Dividends
| | | | | | | | | | | | |
| | | 2015 | | | 2014 | | | 2013 | |
| | | US$M | | | US$M | | | US$M | |
Dividends paid/payable during the period | | | | | | | | | | | | |
BHP Billiton Limited | | | 3,983 | | | | 3,793 | | | | 3,662 | |
BHP Billiton Plc – Ordinary shares | | | 2,613 | | | | 2,483 | | | | 2,404 | |
| – Preference shares(a) | | | – | | | | – | | | | – | |
| | | | | | | | | | | | |
| | | 6,596 | | | | 6,276 | | | | 6,066 | |
| | | | | | | | | | | | |
Dividends determined in respect of the period | | | | | | | | | | | | |
BHP Billiton Limited | | | 3,982 | | | | 3,887 | | | | 3,721 | |
BHP Billiton Plc – Ordinary shares | | | 2,617 | | | | 2,555 | | | | 2,446 | |
| – Preference shares(a) | | | – | | | | – | | | | – | |
| | | | | | | | | | | | |
| | | 6,599 | | | | 6,442 | | | | 6,167 | |
| | | | | | | | | | | | |
| | | | | | | | | | | | |
| | | 2015 | | | 2014 | | | 2013 | |
| | | US cents | | | US cents | | | US cents | |
Dividends paid during the period (per share) | | | | | | | | | | | | |
Prior year final dividend | | | 62.0 | | | | 59.0 | | | | 57.0 | |
Interim dividend | | | 62.0 | | | | 59.0 | | | | 57.0 | |
| | | | | | | | | | | | |
| | | 124.0 | | | | 118.0 | | | | 114.0 | |
| | | | | | | | | | | | |
Dividends determined in respect of the period (per share) | | | | | | | | | | | | |
Interim dividend | | | 62.0 | | | | 59.0 | | | | 57.0 | |
Final dividend | | | 62.0 | | | | 62.0 | | | | 59.0 | |
| | | | | | | | | | | | |
| | | 124.0 | | | | 121.0 | | | | 116.0 | |
| | | | | | | | | | | | |
Dividends are determined after period end in the announcement of the results for the period. Interim dividends are determined in February and paid in March. Final dividends are determined in August and paid in September. Dividends determined are not recorded as a liability at the end of the period to which they relate. Subsequent to year-end, on 25 August 2015, BHP Billiton determined a final dividend of 62.0 US cents per share (US$3,301 million), which will be paid on 29 September 2015 (30 June 2014: final dividend of 62.0 US cents per share – US$3,301 million; 30 June 2013: final dividend of 59.0 US cents per share – US$3,147 million).
Each American Depositary Share (ADS) represents two ordinary shares of BHP Billiton Limited or BHP Billiton Plc. Dividends determined on each ADS represent twice the dividend determined on BHP Billiton ordinary shares.
BHP Billiton Limited dividends for all periods presented are, or will be, fully franked based on a tax rate of 30 per cent.
| | | | | | | | | | | | |
| | | 2015 | | | 2014 | | | 2013 | |
| | | US$M | | | US$M | | | US$M | |
Franking credits as at 30 June | | | 11,295 | | | | 13,419 | | | | 10,516 | |
Franking (debits)/credits arising from the (refund)/payment of current tax | | | (428 | ) | | | (29 | ) | | | 824 | |
| | | | | | | | | | | | |
Total franking credits available(b) | | | 10,867 | | | | 13,390 | | | | 11,340 | |
| | | | | | | | | | | | |
| (a) | 5.5 per cent dividend on 50,000 preference shares of £1 each determined and paid annually (30 June 2014: 5.5 per cent; 30 June 2013: 5.5 per cent). |
| (b) | The payment of the final 2015 dividend determined after 30 June 2015 will reduce the franking account balance by US$853 million. |
20. Provision for dividends and other liabilities
| | | | | | | | |
| | | 2015 | | | 2014 | |
| | | US$M | | | US$M | |
Current | | | | | | | | |
Dividends and other liabilities | | | 159 | | | | 360 | |
| | | | | | | | |
Total current provision for dividends and other liabilities | | | 159 | | | | 360 | |
| | | | | | | | |
Non-current | | | | | | | | |
Other liabilities | | | 205 | | | | 198 | |
| | | | | | | | |
Total non-current provision for dividends and other liabilities | | | 205 | | | | 198 | |
| | | | | | | | |
| | | | | | | | |
| | | 2015 | | | 2014 | |
| | | US$M | | | US$M | |
Movement in provision for dividends and other liabilities | | | | | | | | |
At the beginning of the financial year | | | 558 | | | | 451 | |
Dividends determined during the year | | | 6,596 | | | | 6,276 | |
Charge/(credit) for the year: | | | | | | | | |
Underlying | | | 400 | | | | 388 | |
Discounting | | | 1 | | | | – | |
Exchange variations | | | (131 | ) | | | 77 | |
Released during the year | | | (138 | ) | | | (141 | ) |
Utilisation | | | (359 | ) | | | (85 | ) |
Divestment and demerger of subsidiaries and operations | | | (65 | ) | | | – | |
Dividends paid during the year | | | (6,498 | ) | | | (6,387 | ) |
Transfers and other movements | | | – | | | | (21 | ) |
| | | | | | | | |
At the end of the financial year | | | 364 | | | | 558 | |
| | | | | | | | |
Financial risk management
21. Other financial assets
| | | | | | | | |
| | | 2015 | | | 2014 | |
| | | US$M | | | US$M | |
Current | | | | | | | | |
At fair value | | | | | | | | |
Cross currency and interest rate swaps | | | 53 | | | | 12 | |
Forward exchange contracts | | | 1 | | | | – | |
Commodity contracts | | | 6 | | | | 18 | |
Other derivative contracts | | | 23 | | | | 57 | |
| | | | | | | | |
Total current other financial assets | | | 83 | | | | 87 | |
| | | | | | | | |
Non-current | | | | | | | | |
At fair value | | | | | | | | |
Cross currency and interest rate swaps | | | 939 | | | | 1,471 | |
Commodity contracts | | | – | | | | 7 | |
Other derivative contracts | | | 198 | | | | 214 | |
Shares – available for sale | | | 21 | | | | 512 | |
Other investments – available for sale(a) | | | 1 | | | | 145 | |
| | | | | | | | |
Total non-current other financial assets | | | 1,159 | | | | 2,349 | |
| | | | | | | | |
| (a) | Includes investments held by BHP Billiton Energy Coal South Africa Rehabilitation Trust Fund as at 30 June 2014. The future realisation of this investment is intended to fund environmental obligations relating to the closure of the South African coal operations, and consequently this investment, while under the Group’s control, is not available for the general purposes of the Group. Any income from this investment was reinvested or applied to meet these obligations. These investments were divested as part of the demerger of South32. Refer to note 29 ‘Discontinued operations’. |
Refer to note 43 ‘Significant accounting policies’ (s).
22. Other financial liabilities
| | | | | | | | |
| | | 2015 | | | 2014 | |
| | | US$M | | | US$M | |
Current | | | | | | | | |
Cross currency and interest rate swaps | | | 243 | | | | – | |
Commodity contracts | | | 3 | | | | – | |
Other derivative contracts | | | 5 | | | | 16 | |
| | | | | | | | |
Total current other financial liabilities | | | 251 | | | | 16 | |
| | | | | | | | |
Non-current | | | | | | | | |
Cross currency and interest rate swaps | | | 1,024 | | | | 273 | |
Commodity contracts | | | 1 | | | | 9 | |
Other derivative contracts | | | 6 | | | | 21 | |
| | | | | | | | |
Total non-current other financial liabilities | | | 1,031 | | | | 303 | |
| | | | | | | | |
Refer to note 43 ‘Significant accounting policies’ (s).
23. Financial risk management
Financial risk management strategy
The financial risks arising from the Group’s operations comprise market, liquidity and credit risk. These risks arise in the normal course of business, and the Group manages its exposure to them in accordance with the Group’s portfolio risk management strategy. The objective of the strategy is to support the delivery of the Group’s financial targets while protecting its future financial security and flexibility by taking advantage of the natural diversification provided by the scale, diversity and flexibility of the Group’s operations and activities.
A Cash Flow at Risk (CFaR) framework is used to measure the aggregate and diversified impact of financial risks upon the Group’s financial targets. The principal measurement of risk is CFaR measured on a portfolio basis, which is defined as the worst expected loss relative to projected business plan cash flows over a one-year horizon under normal market conditions at a confidence level of 90 per cent.
Market risk
The Group’s activities expose it to market risks associated with movements in interest rates, foreign currencies and commodity prices. Under the strategy outlined above, the Group seeks to achieve financing costs, currency impacts, input costs and commodity prices on a floating or index basis. This strategy gives rise to a risk of variability in earnings which is measured under the CFaR framework.
In executing the strategy, financial instruments are potentially employed in three distinct but related activities. The following table summarises these activities and the key risk management processes:
| | | | |
Activity | | Key risk management processes |
| | |
1 Risk mitigation | | | | |
| | |
| On an exception basis, hedging for the purposes of mitigating risk related to specific and significant expenditure on investments or capital projects will be executed if necessary to support the Group’s strategic objectives. | | • | | Execution of transactions within approved mandates. |
| | |
2 Economic hedging of commodity sales, operating costs and debt instruments | | | | |
| | |
Where Group commodity production is sold to customers on pricing terms that deviate from the relevant index target, and where a relevant derivatives market exists, financial instruments may be executed as an economic hedge to align the revenue price exposure with the index target. Where debt is issued in a currency other than the US dollar and/or at a fixed interest rate, fair value and cash flow hedges may be executed to align the debt exposure with the Group’s functional currency of US dollars and/or to swap to a floating interest rate. | | • • | | Measuring and reporting the exposure in customer commodity contracts and issued debt instruments. Executing hedging derivatives to align the total group exposure to the index target. |
| |
| | | |
| | |
3 Strategic financial transactions | | | | |
| | |
| Opportunistic transactions may be executed with financial instruments to capture value from perceived market over/under valuations. | | • | | Exposures managed within value at risk and stop loss limits. |
| | • | | Execution of transactions within approved mandates. |
Primary responsibility for identification and control of financial risks, including authorising and monitoring the use of financial instruments for the above activities and stipulating policy thereon, rests with the Financial Risk Management Committee under authority delegated by the Group Management Committee.
Interest rate risk
The Group is exposed to interest rate risk on its outstanding borrowings and investments from the possibility that changes in interest rates will affect future cash flows or the fair value of fixed interest rate financial instruments. Interest rate risk is managed as part of the portfolio risk management strategy.
The majority of the Group’s debt is issued at fixed interest rates. The Group has entered into interest rate swaps and cross currency interest rate swaps to convert most of its fixed interest rate exposure to floating US dollar interest rate exposure. As at 30 June 2015, 89 per cent of Group borrowings were exposed to floating interest rates inclusive of the effect of swaps (2014: 84 per cent). The Group’s earnings are sensitive to changes in interest rates on the floating interest rate component of the Group’s net borrowings.
The fair value of interest rate swaps and cross currency interest rate swaps in hedge relationships used to hedge both interest rate and foreign currency risks are shown in the fair values section of this note.
Based on the net debt position as at 30 June 2015, taking into account interest rate swaps and cross currency interest rate swaps, it is estimated that a one percentage point increase in the US LIBOR interest rate will decrease the Group’s equity and profit after taxation by US$149 million (2014: decrease of US$126 million). This assumes that the change in interest rates is effective from the beginning of the financial year and the fixed/floating mix and balances are constant over the year. However, interest rates and the net debt profile of the Group may not remain constant over the coming financial year and therefore such sensitivity analysis should be used with care.
Currency risk
The US dollar is the functional currency of most operations within the Group and as a result currency exposures arise from transactions and balances in currencies other than the US dollar. The Group’s potential currency exposures comprise:
translational exposure in respect of non-functional currency monetary items; and
transactional exposure in respect of non-functional currency expenditure and revenues.
The Group’s foreign currency risk is managed as part of the portfolio risk management strategy.
Translational exposure in respect of non-functional currency monetary items
Monetary items, including financial assets and liabilities, denominated in currencies other than the functional currency of an operation are periodically restated to US dollar equivalents, and the associated gain or loss is taken to the income statement. The exception is foreign exchange gains or losses on foreign currency denominated provisions for closure and rehabilitation at operating sites, which are capitalised in property, plant and equipment.
The following table shows the foreign currency risk arising from financial assets and liabilities, which are denominated in currencies other than the US dollar:
| | | | | | | | |
| Net financial (liabilities)/assets – by currency of denomination | | 2015 | | | 2014 | |
| | | US$M | | | US$M | |
Australian dollars | | | (2,239 | ) | | | (4,684 | ) |
Chilean peso | | | (665 | ) | | | (267 | ) |
Other | | | (5 | ) | | | 6 | |
| | | | | | | | |
Total | | | (2,909 | ) | | | (4,945 | ) |
| | | | | | | | |
The principal non-functional currencies to which the Group is exposed are the Australian dollar and Chilean peso. Based on the Group’s net financial assets and liabilities as at 30 June 2015, a weakening of the US dollar against these currencies as illustrated in the table below, with all other variables held constant, would (decrease)/increase profit after taxation and equity as follows:
| | | | | | | | | | | | | | | | |
| | | 2015 | | | 2014 | |
| | | US$M | | | US$M | |
Currency movement against US$ | | Profit
after taxation | | | Equity | | | Profit
after taxation | | | Equity | |
1 cent strengthening in Australian dollar | | | (12 | ) | | | (12 | ) | | | (31 | ) | | | (31 | ) |
10 pesos strengthening in Chilean peso | | | (7 | ) | | | (7 | ) | | | (3 | ) | | | (3 | ) |
The Group’s financial asset and liability profile may not remain constant and therefore these sensitivities should be used with care.
Transactional exposure in respect of non-functional currency expenditure and revenues
Certain operating and capital expenditure is incurred in currencies other than their functional currency. To a lesser extent, certain sales revenue is earned in currencies other than the functional currency of operations, and certain exchange control restrictions may require that funds be maintained in currencies other than the functional currency of the operation. These currency risks are managed as part of the portfolio risk management strategy. When required under this strategy the Group enters into forward exchange contracts.
The net fair value of forward exchange contracts outstanding to manage short-term foreign currency cash flows relating to operating activities is an asset of US$1 million and a liability of US$ nil (2014: an asset of US$ nil and a liability of US$ nil).
Commodity price risk
Contracts for the sale and physical delivery of commodities are executed whenever possible on a pricing basis intended to achieve a relevant index target. While the Group has succeeded in transitioning the majority of Group commodity production sales to market-based index pricing terms, derivative commodity contracts may from time-to-time be used to align realised prices with the relevant index. Contracts for the physical delivery of commodities are not typically financial instruments and are carried in the balance sheet at cost (typically at nil); they are therefore excluded from the fair value and sensitivity tables below. Accordingly, the financial instrument exposures set out in the tables below do not represent all of the commodity price risks managed according to the Group’s objectives. Movements in the fair value of contracts included in the tables below are offset by movements in the fair value of the physical contracts, however only the former movement is recognised in the Group’s income statement prior to settlement. The risk associated with commodity prices is managed as part of the portfolio risk management strategy.
Financial instruments with commodity price risk included in the following tables are primarily derivatives embedded in physical commodity purchase and sales contracts.
All such instruments are carried in the balance sheet at fair value.
Forward commodity and other derivative contracts
| | | | | | | | | | | | | | | | |
| | | 2015 | | | 2014 | |
| | | Fair value
of asset | | | Fair value
of liability | | | Fair value
of asset | | | Fair value
of liability | |
| | | US$M | | | US$M | | | US$M | | | US$M | |
Aluminium | | | – | | | | – | | | | 54 | | | | 7 | |
Copper | | | 22 | | | | 6 | | | | 7 | | | | 16 | |
Nickel | | | – | | | | – | | | | 17 | | | | 5 | |
Coal | | | – | | | | – | | | | – | | | | 1 | |
Petroleum | | | – | | | | – | | | | – | | | | 6 | |
Gas | | | 205 | | | | 9 | | | | 218 | | | | 11 | |
| | | | | | | | | | | | | | | | |
Total | | | 227 | | | | 15 | | | | 296 | | | | 46 | |
| | | | | | | | | | | | | | | | |
Comprising: | | | | | | | | | | | | | | | | |
Current | | | 29 | | | | 8 | | | | 75 | | | | 16 | |
Non-current | | | 198 | | | | 7 | | | | 221 | | | | 30 | |
| | | | | | | | | | | | | | | | |
Provisionally priced commodity sales and purchases contracts
Not included in the above table are provisionally priced sales or purchases volumes for which price finalisation, referenced to the relevant index, is outstanding at the reporting date. Provisional pricing mechanisms embedded
within these sales and purchases arrangements have the character of a commodity derivative and are carried at fair value through profit and loss as part of trade receivables or trade payables. The Group’s exposure at 30 June 2015 to the impact of movements in commodity prices upon provisionally invoiced sales and purchases volumes is set out in the following table:
| | | | | | | | | | | | | | | | | | |
| | | | | 2015 | | | 2014 | |
| | | Units of exposure | | Net exposure
(deliver)/
receive | | | Impact on equity
and profit after
taxation of 10%
increase in
market price
US$M | | | Net exposure
(deliver)/
receive | | | Impact on equity
and profit after
taxation of 10%
increase in
market price
US$M | |
Provisionally priced commodity sales contracts | | | | | | | | | | | | | |
Copper | | Tonnes (’000s) | | | (363 | ) | | | 173 | | | | (350 | ) | | | 246 | |
Zinc | | Tonnes (’000s) | | | (4 | ) | | | 1 | | | | (11 | ) | | | 2 | |
Lead | | Tonnes (’000s) | | | – | | | | – | | | | (29 | ) | | | 6 | |
Gold | | Ounces | | | (23,975 | ) | | | 2 | | | | (19,401 | ) | | | 2 | |
Silver | | Ounces (’000s) | | | (1,231 | ) | | | 2 | | | | (5,072 | ) | | | 10 | |
Nickel | | Tonnes (’000s) | | | (4 | ) | | | 4 | | | | (3 | ) | | | 5 | |
Iron Ore | | Tonnes (’000s) | | | (2,876 | ) | | | 14 | | | | (588 | ) | | | 5 | |
| | | | | | | | | | | | | | | | | | |
Provisionally priced commodity purchases contracts | | | | | | | | | | | | | |
Copper | | Tonnes (’000s) | | | 32 | | | | (18 | ) | | | 24 | | | | (17 | ) |
Zinc | | Tonnes (’000s) | | | 4 | | | | (1 | ) | | | 4 | | | | (1 | ) |
Silver | | Ounces (’000s) | | | 850 | | | | (1 | ) | | | 526 | | | | (1 | ) |
| | | | | | | | | | | | | | | | | | |
The sensitivities in the above tables have been determined as the absolute impact on fair value of a 10 per cent increase in commodity prices at each reporting date, while holding all other variables, including foreign currency and exchange rates, constant.
The relationship between commodity prices and foreign currencies is complex and movements in foreign exchange rates can impact commodity prices. The sensitivities should therefore be used with care.
Liquidity risk
The Group’s liquidity risk arises from the possibility that it may not be able to settle or meet its obligations as they fall due and is managed as part of the portfolio risk management strategy. Operational, capital and regulatory requirements are considered in the management of liquidity risk, in conjunction with short-term and long-term forecast information.
Additional liquidity risk arises on debt related derivatives due to the possibility that a market for derivatives might not exist in some circumstances. To counter this risk the Group only uses derivatives in highly liquid markets.
The Group’s strong credit profile, diversified funding sources and committed credit facilities ensure that sufficient liquid funds are maintained to meet its daily cash requirements. The Group’s policy on counterparty credit exposure ensures that only counterparties of an investment grade standing are used for the investment of any excess cash.
During the year ended 30 June 2015, Moody’s Investors Service made no change to the Group’s long-term credit rating of A1 (the short-term credit rating is P-1). Standard & Poor’s also affirmed the Group’s long-term credit rating of A+ (the short-term credit rating is A-1); however, revised their outlook from stable to negative.
There were no defaults on loans payable during the period.
Standby arrangements and unused credit facilities
Details of major standby and support arrangements are as follows:
| | | | | | | | | | | | | | | | | | | | | | | | |
| | | 2015 | | | 2014 | |
US$M | | Facility
available | | | Drawn | | | Undrawn | | | Facility
available | | | Drawn | | | Undrawn | |
Revolving credit facility (a) | | | 6,000 | | | | – | | | | 6,000 | | | | 6,000 | | | | – | | | | 6,000 | |
| | | | | | | | | | | | | | | | | | | | | | | | |
Total financing facilities | | | 6,000 | | | | – | | | | 6,000 | | | | 6,000 | | | | – | | | | 6,000 | |
| | | | | | | | | | | | | | | | | | | | | | | | |
| (a) | The Group’s committed US$6.0 billion revolving credit facility operates as a back-stop to the Group’s uncommitted commercial paper program. The combined amount drawn under the facility or as commercial paper will not exceed US$6.0 billion. As at 30 June 2015, US$ nil commercial paper was drawn (2014: US$ nil), therefore US$6.0 billion of committed facility was available to use (2014: US$6.0 billion). The revolving credit facility has a five-year maturity with one remaining one-year extension option. A commitment fee is payable on the undrawn balance and an interest rate comprising an interbank rate plus a margin applies to any drawn balance. The agreed margins are typical for a credit facility extended to a company with the Group’s credit rating. |
Maturity profile of financial liabilities
The maturity profile of the Group’s financial liabilities based on the contractual amounts, taking into account the derivatives related to debt, is as follows:
| | | | | | | | | | | | | | | | | | | | | | | | | | | | |
2015 US$M | | Bank loans,
debentures
and
other loans | | | Expected
future
interest
payments | | | Derivatives
related to
net debt | | | Other
derivatives | | | Obligations
under
finance
leases | | | Other | | | Total | |
Due for payment: | | | | | | | | | | | | | | | | | | | | | | | | | | | | |
In one year or less or on demand | | | 3,070 | | | | 664 | | | | 214 | | | | 8 | | | | 105 | | | | 6,807 | | | | 10,868 | |
In more than one year but not more than two years | | | 3,385 | | | | 865 | | | | 44 | | | | 3 | | | | 61 | | | | 20 | | | | 4,378 | |
In more than two years but not more than three years | | | 960 | | | | 781 | | | | 379 | | | | 1 | | | | 57 | | | | 2 | | | | 2,180 | |
In more than three years but not more than four years | | | 3,927 | | | | 760 | | | | 314 | | | | 1 | | | | 52 | | | | 2 | | | | 5,056 | |
In more than four years but not more than five years | | | 1,598 | | | | 608 | | | | 157 | | | | 1 | | | | 48 | | | | 3 | | | | 2,415 | |
In more than five years | | | 16,952 | | | | 7,092 | | | | 1,495 | | | | 1 | | | | 165 | | | | 2 | | | | 25,707 | |
| | | | | | | | | | | | | | | | | | | | | | | | | | | | |
Total | | | 29,892 | | | | 10,770 | | | | 2,603 | | | | 15 | | | | 488 | | | | 6,836 | | | | 50,604 | |
| | | | | | | | | | | | | | | | | | | | | | | | | | | | |
Carrying amount | | | 30,732 | | | | – | | | | 1,267 | | | | 15 | | | | 438 | | | | 6,836 | | | | 39,288 | |
| | | | | | | | | | | | | | | | | | | | | | | | | | | | |
| | | | | | | | | | | | | | | | | | | | | | | | | | | | |
2014 US$M | | Bank loans,
debentures
and
other loans | | | Expected
future
interest
payments | | | Derivatives
related to
net debt | | | Other
derivatives | | | Obligations
under
finance
leases | | | Other | | | Total | |
Due for payment: | | | | | | | | | | | | | | | | | | | | | | | | | | | | |
In one year or less or on demand | | | 4,165 | | | | 665 | | | | (180 | ) | | | 16 | | | | 167 | | | | 9,747 | | | | 14,580 | |
In more than one year but not more than two years | | | 3,107 | | | | 1,034 | | | | (122 | ) | | | 9 | | | | 164 | | | | 94 | | | | 4,286 | |
In more than two years but not more than three years | | | 3,390 | | | | 897 | | | | (32 | ) | | | 1 | | | | 164 | | | | 3 | | | | 4,423 | |
In more than three years but not more than four years | | | 1,066 | | | | 807 | | | | 128 | | | | 6 | | | | 151 | | | | 3 | | | | 2,161 | |
In more than four years but not more than five years | | | 4,169 | | | | 784 | | | | 70 | | | | 11 | | | | 152 | | | | 3 | | | | 5,189 | |
In more than five years | | | 16,857 | | | | 7,949 | | | | 485 | | | | 3 | | | | 1,708 | | | | 10 | | | | 27,012 | |
| | | | | | | | | | | | | | | | | | | | | | | | | | | | |
Total | | | 32,754 | | | | 12,136 | | | | 349 | | | | 46 | | | | 2,506 | | | | 9,860 | | | | 57,651 | |
| | | | | | | | | | | | | | | | | | | | | | | | | | | | |
Carrying amount | | | 33,205 | | | | – | | | | 273 | | | | 46 | | | | 1,384 | | | | 9,860 | | | | 44,768 | |
| | | | | | | | | | | | | | | | | | | | | | | | | | | | |
The amounts presented in the tables above comprise the contractual undiscounted cash flows, and therefore will not always agree with the amounts presented in the balance sheet. The Group holds derivatives related to net debt, commodities and currencies that are classified as other financial assets when they are expected to generate cash inflows. Refer to note 21 ‘Other financial assets’.
Credit risk
Credit risk can arise from the non-performance by counterparties of their contractual financial obligations towards the Group. To manage credit risk, the Group maintains Group-wide procedures covering the application for credit approvals, granting and renewal of counterparty limits, proactive monitoring of exposures against these limits and requirements triggering secured payment terms. As part of these processes, the credit exposures to all counterparties are regularly monitored and assessed on a timely basis. The maximum exposure to credit risk is limited to the total carrying amount of relevant financial assets on the balance sheet, as at the reporting date.
The Group’s credit risk exposures are categorised under the following headings:
Counterparties
The Group conducts transactions with the following major types of counterparties:
| • | | Receivables counterparties |
Approximately half of sales to the Group’s customers are made on open terms.
| • | | Secured payment counterparties |
Approximately half of sales to the Group’s customers occur via secured payment mechanisms.
| • | | Derivative counterparties |
Counterparties to derivative contracts consist of a diverse number of financial institutions and industrial counterparties in the relevant markets.
| • | | Cash investment counterparties |
As part of managing cash flow and liquidity, the Group holds short-term cash investments with a range of approved financial institutions.
The Group has no significant concentration of credit risk with any single counterparty.
Geographic
The Group trades in all major geographic regions. Countries in which the Group has significant revenue exposures include Australia, the United States, Europe, China, Japan, India and South Korea. Where appropriate, secured payment mechanisms and other risk mitigation instruments are used to protect revenues from credit risk losses.
Industry
In line with our asset portfolio, the Group sells into a diverse range of industries and customer sectors. This diversity means that the Group is not dominantly exposed to any individual industry or customer.
The following table shows the Group’s receivables at the reporting date that are exposed to credit risk and the ageing and impairment profile thereon:
| | | | | | | | | | | | | | | | | | | | | | | | | | | | |
2015 US$M | | Gross
amount | | | Receivables
past due and
impaired | | | Receivables
neither past
due nor
impaired | | | Receivables past due but not impaired | |
| | | | | Less than
30 days | | | 31 to 60
days | | | 61 to 90
days | | | Over
90 days | |
Trade receivables | | | 2,988 | | | | 6 | | | | 2,972 | | | | 8 | | | | 2 | | | | – | | | | – | |
Other receivables | | | 2,849 | | | | 11 | | | | 2,653 | | | | 66 | | | | 11 | | | | 30 | | | | 78 | |
| | | | | | | | | | | | | | | | | | | | | | | | | | | | |
Total | | | 5,837 | | | | 17 | | | | 5,625 | | | | 74 | | | | 13 | | | | 30 | | | | 78 | |
| | | | | | | | | | | | | | | | | | | | | | | | | | | | |
| | | | | | | | | | | | | | | | | | | | | | | | | | | | |
2014 US$M | | Gross
amount | | | Receivables
past due and
impaired | | | Receivables
neither past
due nor
impaired | | | Receivables past due but not impaired | |
| | | | | Less than
30 days | | | 31 to 60
days | | | 61 to 90
days | | | Over
90 days | |
Trade receivables | | | 4,735 | | | | 115 | | | | 4,562 | | | | 46 | | | | – | | | | – | | | | 12 | |
Other receivables | | | 4,005 | | | | 17 | | | | 3,761 | | | | 9 | | | | 26 | | | | 33 | | | | 159 | |
| | | | | | | | | | | | | | | | | | | | | | | | | | | | |
Total | | | 8,740 | | | | 132 | | | | 8,323 | | | | 55 | | | | 26 | | | | 33 | | | | 171 | |
| | | | | | | | | | | | | | | | | | | | | | | | | | | | |
Receivables are deemed to be past due or impaired with reference to the Group’s normal terms and conditions of business. These terms and conditions are determined on a case-by-case basis with reference to the customer’s credit quality and prevailing market conditions. Receivables that are classified as ‘past due’ in the above tables are those that have not been settled within the payments terms that have been agreed with that customer. For an analysis of movements in impaired trade receivables, refer to note 8 ‘Trade and other receivables’.
The credit quality of the Group’s customers is monitored on an ongoing basis and assessed for impairment where indicators of such impairment exist. The solvency of each debtor and their ability to repay the receivable is considered in assessing receivables for impairment. In certain circumstances the Group may seek collateral as security for the receivable. Where receivables have been impaired, the Group actively seeks to recover the amounts in question and enforce compliance with credit terms.
An impairment of US$15 million was recognised during the year ended 30 June 2015 (2014: US$ nil) relating to other financial assets, refer to note 3 ‘Expenses’.
Fair values
All financial assets and liabilities, other than derivatives, are initially recognised at the fair value of consideration paid or received, net of transaction costs as appropriate, and subsequently carried at fair value or amortised cost, as indicated in the tables below. Derivatives are initially recognised at fair value on the date the contract is entered into and are subsequently remeasured at their fair value.
The financial assets and liabilities are presented by class in the tables below at their carrying amounts, which generally approximate to fair value. In the case of US$3,321 million (2014: US$5,337 million) of fixed rate debt not swapped to floating rate, the fair value at 30 June 2015 was US$3,538 million (2014: US$5,665 million).
Financial assets and liabilities
| | | | | | | | | | | | | | | | | | | | | | | | | | | | |
2015 US$M | | Notes | | | Loans and
receivables | | | Available
for sale
securities | | | Held at
fair value
through
profit
or loss | | | Cash
flow
hedges | | | Other
financial
assets
and
liabilities
at
amortised
cost | | | Total | |
Financial assets | | | | | | | | | | | | | | | | | | | | | | | | | | | | |
Cash and cash equivalents | | | 7 | | | | 6,753 | | | | – | | | | – | | | | – | | | | – | | | | 6,753 | |
Trade and other receivables(a) | | | 8 | | | | 3,534 | | | | – | | | | 952 | | | | – | | | | – | | | | 4,486 | |
Cross currency and interest rate swaps | | | 21 | | | | – | | | | – | | | | 858 | | | | 134 | | | | – | | | | 992 | |
Forward exchange contracts | | | 21 | | | | – | | | | – | | | | 1 | | | | – | | | | – | | | | 1 | |
Commodity contracts | | | 21 | | | | – | | | | – | | | | 6 | | | | – | | | | – | | | | 6 | |
Other derivative contracts | | | 21 | | | | – | | | | – | | | | 221 | | | | – | | | | – | | | | 221 | |
Loans to equity accounted investments | | | 8 | | | | 995 | | | | – | | | | – | | | | – | | | | – | | | | 995 | |
Shares | | | 21 | | | | – | | | | 21 | | | | – | | | | – | | | | – | | | | 21 | |
Other investments | | | 21 | | | | – | | | | 1 | | | | – | | | | – | | | | – | | | | 1 | |
| | | | | | | | | | | | | | | | | | | | | | | | | | | | |
Total financial assets | | | | | | | 11,282 | | | | 22 | | | | 2,038 | | | | 134 | | | | – | | | | 13,476 | |
| | | | | | | | | | | | | | | | | | | | | | | | | | | | |
Non-financial assets | | | | | | | | | | | | | | | | | | | | | | | | | | | 111,104 | |
| | | | | | | | | | | | | | | | | | | | | | | | | | | | |
Total assets | | | | | | | | | | | | | | | | | | | | | | | | | | | 124,580 | |
| | | | | | | | | | | | | | | | | | | | | | | | | | | | |
Financial liabilities | | | | | | | | | | | | | | | | | | | | | | | | | | | | |
Trade and other payables(b) | | | 9 | | | | – | | | | – | | | | 176 | | | | – | | | | 6,660 | | | | 6,836 | |
Cross currency and interest rate swaps | | | 22 | | | | – | | | | – | | | | (62 | ) | | | 1,329 | | | | – | | | | 1,267 | |
Commodity contracts | | | 22 | | | | – | | | | – | | | | 4 | | | | – | | | | – | | | | 4 | |
Other derivative contracts | | | 22 | | | | – | | | | – | | | | 11 | | | | – | | | | – | | | | 11 | |
Bank overdrafts and short-term borrowings(c) | | | 15 | | | | – | | | | – | | | | – | | | | – | | | | 140 | | | | 140 | |
Bank loans(c) | | | 15 | | | | – | | | | – | | | | – | | | | – | | | | 1,595 | | | | 1,595 | |
Notes and debentures(c) | | | 15 | | | | – | | | | – | | | | – | | | | – | | | | 28,725 | | | | 28,725 | |
Finance leases(c) | | | 15 | | | | – | | | | – | | | | – | | | | – | | | | 438 | | | | 438 | |
Other(c) | | | 15 | | | | – | | | | – | | | | – | | | | – | | | | 272 | | | | 272 | |
| | | | | | | | | | | | | | | | | | | | | | | | | | | | |
Total financial liabilities | | | | | | | – | | | | – | | | | 129 | | | | 1,329 | | | | 37,830 | | | | 39,288 | |
| | | | | | | | | | | | | | | | | | | | | | | | | | | | |
Non-financial liabilities | | | | | | | | | | | | | | | | | | | | | | | | | | | 14,747 | |
| | | | | | | | | | | | | | | | | | | | | | | | | | | | |
Total liabilities | | | | | | | | | | | | | | | | | | | | | | | | | | | 54,035 | |
| | | | | | | | | | | | | | | | | | | | | | | | | | | | |
| | | | | | | | | | | | | | | | | | | | | | | | | | | | |
2014 US$M | | Notes | | | Loans and
receivables | | | Available
for sale
securities | | | Held at
fair value
through
profit
or loss | | | Cash
flow
hedges | | | Other
financial
assets and
liabilities
at
amortised
cost | | | Total | |
Financial assets | | | | | | | | | | | | | | | | | | | | | | | | | | | | |
Cash and cash equivalents | | | 7 | | | | 8,803 | | | | – | | | | – | | | | – | | | | – | | | | 8,803 | |
Trade and other receivables (a) | | | 8 | | | | 5,431 | | | | – | | | | 1,071 | | | | – | | | | – | | | | 6,502 | |
Cross currency and interest rate swaps | | | 21 | | | | – | | | | – | | | | 846 | | | | 637 | | | | – | | | | 1,483 | |
Commodity contracts | | | 21 | | | | – | | | | – | | | | 25 | | | | – | | | | – | | | | 25 | |
Other derivative contracts | | | 21 | | | | – | | | | – | | | | 271 | | | | – | | | | – | | | | 271 | |
Loans to equity accounted investments | | | 8 | | | | 1,205 | | | | – | | | | – | | | | – | | | | – | | | | 1,205 | |
Interest bearing loans receivable | | | 8 | | | | 337 | | | | – | | | | – | | | | – | | | | – | | | | 337 | |
Shares | | | 21 | | | | – | | | | 512 | | | | – | | | | – | | | | – | | | | 512 | |
Other investments | | | 21 | | | | – | | | | 145 | | | | – | | | | – | | | | – | | | | 145 | |
| | | | | | | | | | | | | | | | | | | | | | | | | | | | |
Total financial assets | | | | | | | 15,776 | | | | 657 | | | | 2,213 | | | | 637 | | | | – | | | | 19,283 | |
| | | | | | | | | | | | | | | | | | | | | | | | | | | | |
Non-financial assets | | | | | | | | | | | | | | | | | | | | | | | | | | | 132,130 | |
| | | | | | | | | | | | | | | | | | | | | | | | | | | | |
Total assets | | | | | | | | | | | | | | | | | | | | | | | | | | | 151,413 | |
| | | | | | | | | | | | | | | | | | | | | | | | | | | | |
Financial liabilities | | | | | | | | | | | | | | | | | | | | | | | | | | | | |
Trade and other payables (b) | | | 9 | | | | – | | | | – | | | | 300 | | | | – | | | | 9,560 | | | | 9,860 | |
Cross currency and interest rate swaps | | | 22 | | | | – | | | | – | | | | 221 | | | | 52 | | | | – | | | | 273 | |
Commodity contracts | | | 22 | | | | – | | | | – | | | | 9 | | | | – | | | | – | | | | 9 | |
Other derivative contracts | | | 22 | | | | – | | | | – | | | | 37 | | | | – | | | | – | | | | 37 | |
Bank overdrafts and short-term borrowings (c) | | | 15 | | | | – | | | | – | | | | – | | | | – | | | | 51 | | | | 51 | |
Bank loans(c) | | | 15 | | | | – | | | | – | | | | – | | | | – | | | | 1,462 | | | | 1,462 | |
Notes and debentures(c) | | | 15 | | | | – | | | | – | | | | – | | | | – | | | | 31,247 | | | | 31,247 | |
Finance leases(c) | | | 15 | | | | – | | | | – | | | | – | | | | – | | | | 1,384 | | | | 1,384 | |
Other(c) | | | 15 | | | | – | | | | – | | | | – | | | | – | | | | 445 | | | | 445 | |
| | | | | | | | | | | | | | | | | | | | | | | | | | | | |
Total financial liabilities | | | | | | | – | | | | – | | | | 567 | | | | 52 | | | | 44,149 | | | | 44,768 | |
| | | | | | | | | | | | | | | | | | | | | | | | | | | | |
Non-financial liabilities | | | | | | | | | | | | | | | | | | | | | | | | | | | 21,263 | |
| | | | | | | | | | | | | | | | | | | | | | | | | | | | |
Total liabilities | | | | | | | | | | | | | | | | | | | | | | | | | | | 66,031 | |
| | | | | | | | | | | | | | | | | | | | | | | | | | | | |
| (a) | Excludes input taxes of US$339 million (2014: US$564 million) included in other receivables. Refer to note 8 ‘Trade and other receivables’. |
| (b) | Excludes input taxes of US$582 million (2014: US$398 million) included in other payables. Refer to note 9 ‘Trade and other payables’. |
| (c) | All interest bearing liabilities, excluding finance leases are unsecured. |
Valuation hierarchy
The carrying amount of financial assets and liabilities measured at fair value is principally calculated with reference to quoted prices in active markets for identical assets or liabilities. Where no price information is available from a quoted market source, alternative market mechanisms or recent comparable transactions, fair value is estimated based on the Group’s views on relevant future prices, net of valuation allowances to accommodate liquidity, modelling and other risks implicit in such estimates. The inputs used in fair value calculations are determined by the relevant Group Function. Our Group Functions support the Businesses and operate under a defined set of accountabilities authorised by the Group Management Committee. Movements in the fair value of financial assets and liabilities may be recognised through the income statement or in other comprehensive income. The following table shows the Group’s financial assets and liabilities carried at fair value with reference to the nature of valuation inputs used:
| | | | | | | | | | | | | | | | |
2015 | | Level 1 (a) | | | Level 2 (b) | | | Level 3 (c) | | | Total | |
| | | US$M | | | US$M | | | US$M | | | US$M | |
Financial assets and liabilities | | | | | | | | | | | | | | | | |
Trade and other receivables | | | – | | | | 952 | | | | – | | | | 952 | |
Trade and other payables | | | – | | | | (176 | ) | | | – | | | | (176 | ) |
Cross currency and interest rate swaps | | | – | | | | (275 | ) | | | – | | | | (275 | ) |
Forward exchange contracts | | | – | | | | 1 | | | | – | | | | 1 | |
Commodity contracts | | | – | | | | 2 | | | | – | | | | 2 | |
Other derivative contracts | | | – | | | | 12 | | | | 198 | | | | 210 | |
Investments – available for sale | | | 1 | | | | – | | | | 21 | | | | 22 | |
| | | | | | | | | | | | | | | | |
Total | | | 1 | | | | 516 | | | | 219 | | | | 736 | |
| | | | | | | | | | | | | | | | |
| | | | | | | | | | | | | | | | |
2014 | | Level 1 (a) | | | Level 2 (b) | | | Level 3 (c) | | | Total | |
| | | US$M | | | US$M | | | US$M | | | US$M | |
Financial assets and liabilities | | | | | | | | | | | | | | | | |
Trade and other receivables | | | – | | | | 1,071 | | | | – | | | | 1,071 | |
Trade and other payables | | | – | | | | (300 | ) | | | – | | | | (300 | ) |
Cross currency and interest rate swaps | | | – | | | | 1,210 | | | | – | | | | 1,210 | |
Commodity contracts | | | – | | | | 16 | | | | – | | | | 16 | |
Other derivative contracts | | | – | | | | (13 | ) | | | 247 | | | | 234 | |
Investments – available for sale | | | 5 | | | | 145 | | | | 507 | | | | 657 | |
| | | | | | | | | | | | | | | | |
Total | | | 5 | | | | 2,129 | | | | 754 | | | | 2,888 | |
| | | | | | | | | | | | | | | | |
| (a) | Valuation is based on unadjusted quoted prices in active markets for identical financial assets and liabilities. |
| (b) | Valuation is based on inputs (other than quoted prices included in Level 1) that are observable for the financial asset or liability, either directly (i.e. as unquoted prices) or indirectly (i.e. derived from prices). |
| (c) | Valuation is based on inputs that are not based on observable market data. |
Level 3 financial assets and liabilities
The following table shows the movements in the Group’s level 3 financial assets and liabilities:
| | | | | | | | |
| | | 2015 | | | 2014 | |
| | | US$M | | | US$M | |
At the beginning of the financial year | | | 754 | | | | 690 | |
Additions | | | 16 | | | | 66 | |
Disposals | | | (407 | ) | | | (47 | ) |
Realised gains recognised in the income statement(a) | | | 9 | | | | 6 | |
Unrealised gains recognised in the income statement(a) | | | 33 | | | | 77 | |
Unrealised losses recognised in other comprehensive income(b) | | | (9 | ) | | | (19 | ) |
Impairment | | | (15 | ) | | | – | |
Transfers(c) | | | (162 | ) | | | (19 | ) |
| | | | | | | | |
At the end of the financial year | | | 219 | | | | 754 | |
| | | | | | | | |
| (a) | Realised and unrealised gains and losses recognised in the income statement are recorded in expenses. Refer to note 3 ‘Expenses’. |
| (b) | Unrealised gains and losses recognised in other comprehensive income are recorded in the financial assets reserve. Refer to note 18 ‘Other equity’. |
| (c) | Transfers comprise US$162 million relating to Marine Well Containment Company now classified as an equity accounted investment. |
Sensitivity of Level 3 financial assets and liabilities
The carrying amount of financial assets and liabilities that are valued using inputs other than observable market data are calculated using appropriate valuation models, including discounted cash flow modelling, with inputs such as commodity prices, foreign exchange rates and inflation. The potential effect of using reasonably possible alternative assumptions in these models, based on a change in the most significant input by 10 per cent while holding all other variables constant, is shown in the following table. Significant inputs are assessed individually for each financial asset and liability.
| | | | | | | | | | | | | | | | | | | | |
| | | | | | Profit after taxation | | | Equity | |
2015 US$M | | Carrying
amount | | | 10% increase
in input | | | 10% decrease
in input | | | 10% increase
in input | | | 10% decrease
in input | |
Financial assets and liabilities | | | | | | | | | | | | | | | | | | | | |
Other derivative contracts | | | 198 | | | | 45 | | | | (45 | ) | | | 45 | | | | (45 | ) |
Investments – available for sale | | | 21 | | | | – | | | | – | | | | 2 | | | | (2 | ) |
| | | | | | | | | | | | | | | | | | | | |
Total | | | 219 | | | | 45 | | | | (45 | ) | | | 47 | | | | (47 | ) |
| | | | | | | | | | | | | | | | | | | | |
| | | | | | | | | | | | | | | | | | | | |
| | | | | | Profit after taxation | | | Equity | |
2014 US$M | | Carrying
amount | | | 10% increase
in input | | | 10% decrease
in input | | | 10% increase
in input | | | 10% decrease
in input | |
Financial assets and liabilities | | | | | | | | | | | | | | | | | | | | |
Other derivative contracts | | | 247 | | | | 67 | | | | (67 | ) | | | 67 | | | | (67 | ) |
Investments – available for sale | | | 507 | | | | – | | | | – | | | | 72 | | | | (39 | ) |
| | | | | | | | | | | | | | | | | | | | |
Total | | | 754 | | | | 67 | | | | (67 | ) | | | 139 | | | | (106 | ) |
| | | | | | | | | | | | | | | | | | | | |
Offsetting financial assets and liabilities
Financial assets and liabilities are offset and the net amount reported in the balance sheet where the Group currently has a legally enforceable right to offset the recognised amounts, and there is an intention to settle on a net basis or realise the asset and settle the liability simultaneously. The Group also entered into master netting arrangements that do not meet the criteria for offsetting but allow for the related amounts to be set-off in certain circumstances, such as the event of default.
The following table presents the recognised financial instruments that are offset, or subject to enforceable master netting arrangements but not offset, as at 30 June 2015 and 30 June 2014. The column ‘Net amount’ shows the impact on the Group’s balance sheet if all set-off rights were exercised.
| | | | | | | | | | | | | | | | | | | | | | | | |
| | | | | | Effects of offsetting on the balance sheet | | | Related amounts not offset | |
2015 US$M | | Notes | | | Gross
amounts | | | Gross amounts
set-off in
the balance
sheet | | | Net amounts
presented in
the balance
sheet | | | Amounts
subject to
master netting
arrangements | | | Net amount | |
Financial assets | | | | | | | | | | | | | | | | | | | | | | | | |
Cash and cash equivalents (a) | | | 7 | | | | 6,753 | | | | – | | | | 6,753 | | | | (326 | ) | | | 6,427 | |
Trade receivables | | | 8 | | | | 2,949 | | | | 33 | | | | 2,982 | | | | – | | | | 2,982 | |
Cross currency and interest rate swaps(a) | | | 21 | | | | 992 | | | | – | | | | 992 | | | | (740 | ) | | | 252 | |
| | | | | | | | | | | | | | | | | | | | | | | | |
Total | | | | | | | 10,694 | | | | 33 | | | | 10,727 | | | | (1,066 | ) | | | 9,661 | |
| | | | | | | | | | | | | | | | | | | | | | | | |
Financial liabilities | | | | | | | | | | | | | | | | | | | | | | | | |
Trade creditors | | | 9 | | | | 4,890 | | | | (33 | ) | | | 4,857 | | | | – | | | | 4,857 | |
Cross currency and interest rate swaps(a) | | | 22 | | | | 1,267 | | | | – | | | | 1,267 | | | | (1,066 | ) | | | 201 | |
| | | | | | | | | | | | | | | | | | | | | | | | |
Total | | | | | | | 6,157 | | | | (33 | ) | | | 6,124 | | | | (1,066 | ) | | | 5,058 | |
| | | | | | | | | | | | | | | | | | | | | | | | |
| | | | | | |
2014 US$M | | | | | | | | | | | | | | | | | | |
Financial assets | | | | | | | | | | | | | | | | | | | | | | | | |
Cash and cash equivalents (a) | | | 7 | | | | 8,803 | | | | – | | | | 8,803 | | | | (59 | ) | | | 8,744 | |
Trade receivables | | | 8 | | | | 4,639 | | | | (19 | ) | | | 4,620 | | | | – | | | | 4,620 | |
Cross currency and interest rate swaps(a) | | | 21 | | | | 1,483 | | | | – | | | | 1,483 | | | | (214 | ) | | | 1,269 | |
| | | | | | | | | | | | | | | | | | | | | | | | |
Total | | | | | | | 14,925 | | | | (19 | ) | | | 14,906 | | | | (273 | ) | | | 14,633 | |
| | | | | | | | | | | | | | | | | | | | | | | | |
Financial liabilities | | | | | | | | | | | | | | | | | | | | | | | | |
Trade creditors | | | 9 | | | | 6,992 | | | | (19 | ) | | | 6,973 | | | | – | | | | 6,973 | |
Cross currency and interest rate swaps(a) | | | 22 | | | | 273 | | | | – | | | | 273 | | | | (273 | ) | | | – | |
| | | | | | | | | | | | | | | | | | | | | | | | |
Total | | | | | | | 7,265 | | | | (19 | ) | | | 7,246 | | | | (273 | ) | | | 6,973 | |
| | | | | | | | | | | | | | | | | | | | | | | | |
| (a) | The Group enters into money market deposits and derivative transactions under International Swaps and Derivatives Association (ISDA) master netting agreements. Under the terms of these arrangements, only |
| where certain events occur such as default, the net position owing/receivable to a single counterparty will be taken as owing and all the relevant arrangements terminated. As the Group does not presently have a legally enforceable right of set-off, these amounts have not been offset in the balance sheet, but have been presented separately in the table above. |
Capital management
The Group’s long-term strategy is to own and operate large, long-life, low-cost, expandable, upstream assets diversified by commodity, geography and market. The Group will invest capital in assets where they fit its strategy. The Group’s priorities for cash flow are underpinned by:
reinvestment in projects that carry attractive rates of return regardless of the economic climate;
seeking to maintain a solid ‘A’ credit rating; and
returning excess capital to shareholders firstly with its progressive dividend policy and thereafter via capital management initiatives (for example share buy-backs).
Further information relevant to the actions and outcomes of the Group’s capital management strategy is contained in section 7.1.4 Consolidated Cash Flow Statement, note 17 ‘Share capital’, note 18 ‘Other equity’ and note 19 ‘Dividends’.
The Group monitors capital using a gearing ratio, being the ratio of net debt to net debt plus net assets. Our policy is for net gearing to be a maximum of 40 per cent.
| | | | | | | | |
| | | 2015 | | | 2014 | |
| | | US$M | | | US$M | |
Cash and cash equivalents | | | (6,753 | ) | | | (8,803 | ) |
Current debt | | | 3,201 | | | | 4,262 | |
Non-current debt | | | 27,969 | | | | 30,327 | |
| | | | | | | | |
Net debt | | | 24,417 | | | | 25,786 | |
| | | | | | | | |
Net assets | | | 70,545 | | | | 85,382 | |
| | | | | | | | |
Gearing | | | 25.7 | % | | | 23.2 | % |
| | | | | | | | |
Refer to note 43 ‘Significant accounting policies’ (s).
Employee matters
24. Key management personnel
Key management personnel compensation comprises:
| | | | | | | | | | | | |
| | | 2015 | | | 2014 | | | 2013 | |
| | | US$ | | | US$ | | | US$ | |
Short-term employee benefits | | | 26,663,069 | | | | 29,302,029 | | | | 24,959,049 | |
Post-employment benefits | | | 2,920,007 | | | | 3,176,079 | | | | 3,446,910 | |
Share-based payments | | | 20,783,959 | | | | 21,300,632 | | | | 26,297,032 | |
| | | | | | | | | | | | |
Total | | | 50,367,035 | | | | 53,778,740 | | | | 54,702,991 | |
| | | | | | | | | | | | |
Transactions with key management personnel
During the financial year, there were no purchases by key management personnel from the Group (2014: US$ nil; 2013: US$ nil).
There are no amounts payable by key management personnel at 30 June 2015 (2014: US$ nil).
Loans with key management personnel
There are no loans receivable from or payable to key management personnel (2014: US$ nil).
Transactions with personally related entities
A number of Directors of the Group hold or have held positions in other companies, where it is considered they control or significantly influence the financial or operating policies of those entities. There have been no transactions with those entities and no amounts were owed by the Group to personally related entities (2014: US$ nil).
25. Employee share ownership plans
Awards were provided under the following employee share ownership plans for the year ended 30 June 2015: the Long Term Incentive Plan (LTIP), Short Term Incentive Plan (STIP), Management Award Plan (MAP), Group Short Term Incentive Plan (GSTIP), Transitional GMC awards and the all-employee share plan, Shareplus. In prior years, awards were also made under the Group Incentive Scheme (GIS) and the Kgatelo Pele Employee Share Ownership Plan.
These awards take the form of rights to receive ordinary shares in either BHP Billiton Limited or BHP Billiton Plc. Awards made are subject to performance conditions (LTIP and Transitional GMC) and service conditions (all plans). Subject to the performance conditions and service conditions being met and the extent to which they are met, the awards will vest and the participant will become entitled to the appropriate number of ordinary shares or, if relevant, entitled to exercise options over the relevant number of ordinary shares. Awards under the plans do not confer any rights to participate in a share issue; however, there is discretion under each of the plans to adjust the awards in response to a variation of BHP Billiton’s share capital.
As a result of the demerger of South32, adjustments were made to unvested awards to ensure that participants continue to be appropriately treated. At the time of the demerger, unvested awards under the LTIP, STIP, MAP, GSTIP, those provided as Transitional GMC awards and GIS were adjusted to reflect the reduction in the value of BHP Billiton after South32 demerged. During the year ended 30 June 2015, no new awards were granted under either of the GIS – deferred shares or Transitional GMC awards, except for the adjustments as described above. In relation to unvested awards under Shareplus, compensatory awards were granted to reflect the reduction in the value of BHP Billiton after South32 demerged. The new number of unvested awards for each participant (when taken together with the compensatory awards referred to above) equals the number of awards held before the demerger multiplied by ((BHP Billiton five-day volume weighted average price (VWAP) plus South32 five-day VWAP) divided by BHP Billiton five-day VWAP). Prices were based on the first five trading days following South32’s listing on the relevant exchanges on 18 May 2015.
All LTIP, STIP and GIS awards and all MAP and GSTIP awards granted prior to 1 July 2011 are eligible to receive a payment equal to the dividend amount that would have been earned on the underlying shares awarded to those participants (the Dividend Equivalent Payment or DEP). The DEP is provided to the participants once the underlying shares are allocated or transferred to them. No DEP is provided in respect of any awards that lapse. All Transitional GMC awards and awards granted after 1 July 2011 under GSTIP and MAP are not eligible for a DEP.
A description of these plans is as follows:
The STIP (which replaced GIS in FY2014) is a plan for the GMC and the GSTIP is a plan for senior management employees other than the GMC (being first introduced during the year ended 30 June 2009). The plans allow a portion of short-term incentive amounts (being a percentage of base salary) to be deferred. Half of the short-term incentive is paid in cash. The remaining half is provided in the form of STIP, GIS or GSTIP awards – being a grant of rights to receive BHP Billiton shares. The rights are subject to a two-year vesting period before they vest or can be exercised. If, during the vesting period, an individual resigns without the Remuneration Committee’s consent, or is dismissed for cause, their rights are forfeited. Awards in respect of the year ended 30 June 2015 will be granted during the year ending 30 June 2016.
The LTIP is a plan for the GMC, and awards are granted annually. The performance condition applicable to the awards requires the Group’s Total Shareholder Return (TSR) over a five-year performance period to be greater than the Peer Group TSR (being the weighted median TSR where the comparator group is a specified group of peer companies). For awards granted from December 2010 onwards, performance relative to this Peer Group TSR performance condition determines the vesting of 67 per cent of the LTIP awards, while performance relative to the Index TSR (being the index value where the comparator group is a market index such as the MSCI World) performance condition determines the vesting of 33 per cent of the LTIP awards. To the extent that the performance condition is not achieved, awards are forfeited. There is no retesting. For the awards to vest in full, the Group’s TSR must exceed the Peer Group TSR and Index TSR (if applicable) by a specified percentage per year, determined for each grant by the Remuneration Committee. Since the establishment of the LTIP in 2004, this percentage has been set at 5.5 per cent per year. The vesting scale is determined for each grant by the Committee. For awards granted prior to December 2013, vested awards were able to be exercised for up to five years following the date that vesting is determined, with an expiry date prior to the fifth anniversary of vesting. From December 2013 onwards, vested awards will be transferred to individuals as soon as practicable after the relevant vesting date.
The MAP is a plan for management employees other than the GMC. Under the MAP, participants receive an award of rights to receive BHP Billiton shares. The number of rights is determined by role, performance and organisational level. There are no performance conditions attached to the awards and awards will vest at the end of three years providing participants remain in employment over that time.
| (iii) | Transitional GMC awards |
The Remuneration Committee may determine that these awards are provided to new GMC members recruited from within BHP Billiton as a transitional measure to bridge the time-based gap between the vesting of MAP awards that were granted to these individuals in their non-GMC management positions (with a three-year service condition) and the LTIP awards provided to GMC members (with a five-year service and performance condition). Transitional GMC awards have two tranches. Tranche one has athree-year service and performance condition. Tranche two has a four-year service and performance condition. The Remuneration Committee has absolute discretion to determine if the performance condition has been met and whether any, all or part of the award will vest (or otherwise lapse), having regard to (but not limited to) BHP Billiton’s TSR over the three- or four-year performance period (respectively), the participant’s contribution to Group outcomes and the participant’s personal performance (with guidance on this assessment from the CEO).
Shareplus is an all-employee share purchase plan which commenced in April 2007. Employees may contribute up to US$5,000 to acquire shares (Acquired Shares) in any Plan year. On the third anniversary of the start of a Plan year, the Company will match the number of Acquired Shares held by the employee at that time with Matched Shares. The employees have no beneficial entitlement to the Matched Shares until they are awarded. Acquired Shares are purchased on a quarterly basis. Employees can sell their Acquired Shares at any time. If, prior to the third anniversary, an individual sells their Acquired Shares, resigns without the Remuneration Committee’s consent or is dismissed for cause, their entitlement to Matched Shares is forfeited.
The Kgatelo Pele ESOP commenced in June 2013 with a three-year vesting period. All eligible employees are entitled to awards to the value of ZAR8,667 each year. Beneficiaries must be permanently employed by Hotazel Manganese Mines (Pty) Ltd as at 1 May (effective date) of each year to qualify for the allocation for that particular year. Hotazel Manganese Mines (Pty) Ltd will contribute the necessary amount to the Kgatelo Pele Trust by way of donation to enable the purchase of shares, which will be held until the end of the vesting period. During this period, beneficiaries will be entitled to dividends declared by BHP Billiton. At the end of each vesting period, eligible employees will be given the opportunity to create a portfolio by having the shares transferred into their own names or to sell their entitlements and receive the cash benefit. In May 2015, BHP Billiton’s interest in Hotazel Manganese Mines (Pty) Ltd was divested as part of South32, and the Kgatelo Pele Trust is no longer part of the Group. The Group will not make future contributions to the Kgatelo Pele Trust.
Employee share awards – current plans
| | | | | | | | | | | | | | | | | | | | | | | | |
2015 | | Number
of awards
at the
beginning
of the
financial
year | | | Number
of
awards
issued
during
the year | | | Number
of
awards
vested
and
exercised | | | Number
of
awards
lapsed | | | Number
of awards
at the end
of the
financial
year | | | Number of
awards
vested and
exercisable
at the end
of the
financial
year | |
BHP Billiton Limited | | | | | | | | | | | | | | | | | | | | | | | | |
STIP awards | | | – | | | | 412,994 | | | | – | | | | – | | | | 412,994 | | | | – | |
GIS awards – deferred shares | | | 143,544 | | | | 4,846 | | | | 80,247 | | | | – | | | | 68,143 | | | | – | |
GSTIP awards – deferred shares | | | 2,178,334 | | | | 1,840,479 | | | | 1,328,634 | | | | 66,026 | | | | 2,624,153 | | | | 52,190 | |
GSTIP awards – options | | | 110,319 | | | | – | | | | 23,065 | | | | – | | | | 87,254 | | | | 87,254 | |
– weighted average exercise price – A$ | | | 41.08 | | | | – | | | | 38.41 | | | | – | | | | 41.78 | | | | 41.78 | |
– weighted average share price – A$ | | | | | | | | | | | 38.07 | | | | | | | | | | | | | |
LTIP awards | | | 4,346,180 | | | | 1,271,634 | | | | 1,131,593 | | | | 719,790 | | | | 3,766,431 | | | | 707,600 | |
Transitional GMC awards | | | 271,194 | | | | 15,636 | | | | – | | | | 66,850 | | | | 219,980 | | | | – | |
MAP awards | | | 7,706,995 | | | | 3,230,752 | | | | 2,885,862 | | | | 325,246 | | | | 7,726,639 | | | | 228,827 | |
Shareplus | | | 3,460,805 | | | | 2,888,178 | | | | 1,997,843 | | | | 322,748 | | | | 4,028,392 | | | | – | |
| | | | | | | | | | | | | | | | | | | | | | | | |
BHP Billiton Plc | | | | | | | | | | | | | | | | | | | | | | | | |
GIS awards – deferred shares | | | 35,081 | | | | – | | | | 35,081 | | | | – | | | | – | | | | – | |
GIS awards – options | | | 30,389 | | | | – | | | | – | | | | – | | | | 30,389 | | | | 30,389 | |
– weighted average exercise price – £ | | | 23.71 | | | | – | | | | – | | | | – | | | | 23.71 | | | | 23.71 | |
– weighted average share price – £ | | | | | | | | | | | – | | | | | | | | | | | | | |
GSTIP awards – deferred shares | | | 447,157 | | | | 285,418 | | | | 405,095 | | | | 5,872 | | | | 321,608 | | | | 18,132 | |
GSTIP awards – options | | | 42,473 | | | | – | | | | – | | | | – | | | | 42,473 | | | | 42,473 | |
– weighted average exercise price – £ | | | 22.08 | | | | – | | | | – | | | | – | | | | 22.08 | | | | 22.08 | |
– weighted average share price – £ | | | | | | | | | | | – | | | | | | | | | | | | | |
LTIP awards | | | 1,435,123 | | | | 42,454 | | | | 375,983 | | | | 97,380 | | | | 1,004,214 | | | | 281,857 | |
Transitional GMC awards | | | 39,860 | | | | 3,206 | | | | – | | | | – | | | | 43,066 | | | | – | |
MAP awards | | | 2,263,206 | | | | 671,375 | | | | 1,222,078 | | | | 140,420 | | | | 1,572,083 | | | | 162,851 | |
Shareplus | | | 757,466 | | | | 485,747 | | | | 929,771 | | | | 68,648 | | | | 244,794 | | | | – | |
| | | | | | | | | | | | | | | | | | | | | | | | |
Fair value and assumptions in the calculation of fair value for awards issued
| | | | | | | | | | | | | | | | | | | | | | | | |
2015 | | Weighted
average
fair value
of awards
granted
during
the year (a)
US$ | | | Risk-free
interest
rate (b) | | | Estimated
life of
awards | | | Share
price at
grant
date | | | Estimated
volatility
of share
price (c) | | | Dividend
yield | |
BHP Billiton Limited | | | | | | | | | | | | | | | | | | | | | | | | |
STIP awards | | | 30.16 | | | | n/a | | | | 3 years | | | | A$36.00 | | | | n/a | | | | 3.39 | % |
GSTIP awards – deferred shares | | | 28.15 | | | | n/a | | | | 3 years | | | | A$36.00 | | | | n/a | | | | 3.39 | % |
LTIP awards | | | 15.67 | | | | 1.70 | % | | | 5 years | | | | A$36.00 | | | | 27.0 | % | | | 3.39 | % |
MAP awards | | | 27.20 | | | | n/a | | | | 3 years | | | | A$36.00 | | | | n/a | | | | 3.39 | % |
Shareplus | | | 20.22 | | | | 2.27 | % | | | 3 years | | | | A$30.27 | | | | n/a | | | | 3.36 | % |
| | | | | | | | | | | | | | | | | | | | | | | | |
BHP Billiton Plc | | | | | | | | | | | | | | | | | | | | | | | | |
GSTIP awards – deferred shares | | | 28.20 | | | | n/a | | | | 3 years | | | | £19.45 | | | | n/a | | | | 4.00 | % |
LTIP awards | | | 15.90 | | | | 1.70 | % | | | 5 years | | | | £19.45 | | | | 27.0 | % | | | 4.00 | % |
MAP awards | | | 27.07 | | | | n/a | | | | 3 years | | | | £19.45 | | | | n/a | | | | 4.00 | % |
Shareplus | | | 23.49 | | | | 2.76 | % | | | 3 years | | | | £15.00 | | | | n/a | | | | 3.90 | % |
| | | | | | | | | | | | | | | | | | | | | | | | |
Employee share awards – current plans
| | | | | | | | | | | | | | | | | | | | | | | | |
2014 | | Number of
awards at the
beginning of
the financial
year | | | Number of
awards
issued
during the
year | | | Number of
awards
vested and
exercised | | | Number
of
awards
lapsed | | | Number of
awards
at the end
of the
financial
year | | | Number of
awards
vested and
exercisable
at the end
of the
financial
year | |
BHP Billiton Limited | | | | | | | | | | | | | | | | | | | | | | | | |
GIS awards – deferred shares | | | 244,868 | | | | 114,629 | | | | 215,953 | | | | – | | | | 143,544 | | | | – | |
GIS awards – options | | | 90,389 | | | | – | | | | 90,389 | | | | – | | | | – | | | | – | |
– weighted average exercise price – A$ | | | 29.15 | | | | – | | | | 29.15 | | | | – | | | | – | | | | – | |
– weighted average share price – A$ | | | | | | | | | | | 36.80 | | | | | | | | | | | | | |
GSTIP awards – deferred shares | | | 2,388,298 | | | | 1,256,041 | | | | 1,414,934 | | | | 51,071 | | | | 2,178,334 | | | | 46,839 | |
GSTIP awards – options | | | 284,636 | | | | – | | | | 116,876 | | | | 57,441 | | | | 110,319 | | | | 110,319 | |
– weighted average exercise price – A$ | | | 39.44 | | | | – | | | | 38.41 | | | | 38.41 | | | | 41.08 | | | | 41.08 | |
– weighted average share price – A$ | | | | | | | | | | | 36.82 | | | | | | | | | | | | | |
LTIP awards | | | 6,066,035 | | | | 1,298,015 | | | | 1,688,386 | | | | 1,329,484 | | | | 4,346,180 | | | | 1,512,567 | |
Transitional GMC awards | | | 35,834 | | | | 235,360 | | | | – | | | | – | | | | 271,194 | | | | – | |
MAP awards | | | 7,981,682 | | | | 2,921,588 | | | | 2,481,689 | | | | 714,586 | | | | 7,706,995 | | | | 486,850 | |
Shareplus | | | 3,092,062 | | | | 2,010,066 | | | | 1,339,097 | | | | 302,226 | | | | 3,460,805 | | | | – | |
| | | | | | | | | | | | | | | | | | | | | | | | |
BHP Billiton Plc | | | | | | | | | | | | | | | | | | | | | | | | |
GIS awards – deferred shares | | | 136,632 | | | | – | | | | 101,551 | | | | – | | | | 35,081 | | | | – | |
GIS awards – options | | | 109,792 | | | | – | | | | 79,403 | | | | – | | | | 30,389 | | | | 30,389 | |
– weighted average exercise price – £ | | | 15.58 | | | | – | | | | 12.47 | | | | – | | | | 23.71 | | | | 23.71 | |
– weighted average share price – £ | | | | | | | | | | | 19.31 | | | | | | | | | | | | | |
GSTIP awards – deferred shares | | | 700,770 | | | | 242,715 | | | | 485,820 | | | | 10,508 | | | | 447,157 | | | | 13,228 | |
GSTIP awards – options | | | 54,960 | | | | – | | | | 12,487 | | | | – | | | | 42,473 | | | | 42,473 | |
– weighted average exercise price – £ | | | 20.80 | | | | – | | | | 17.43 | | | | – | | | | 22.08 | | | | 22.08 | |
– weighted average share price – £ | | | | | | | | | | | 18.72 | | | | | | | | | | | | | |
LTIP awards | | | 2,638,166 | | | | – | | | | 726,863 | | | | 476,180 | | | | 1,435,123 | | | | 541,220 | |
Transitional GMC awards | | | 39,860 | | | | – | | | | – | | | | – | | | | 39,860 | | | | – | |
MAP awards | | | 2,418,076 | | | | 724,685 | | | | 728,298 | | | | 151,257 | | | | 2,263,206 | | | | 231,746 | |
Shareplus | | | 702,203 | | | | 434,461 | | | | 296,186 | | | | 83,012 | | | | 757,466 | | | | – | |
Kgatelo Pele ESOP | | | – | | | | 66,064 | | | | – | | | | – | | | | 66,064 | | | | – | |
| | | | | | | | | | | | | | | | | | | | | | | | |
Fair value and assumptions in the calculation of fair value for awards issued
| | | | | | | | | | | | | | | | | | | | | | | | |
2014 | | Weighted
average
fair value
of awards
granted
during
the year (a)
US$ | | | Risk-free
interest
rate(b) | | | Estimated
life of
awards | | | Share
price at
grant
date | | | Estimated
volatility
of share
price (c) | | | Dividend
yield | |
BHP Billiton Limited | | | | | | | | | | | | | | | | | | | | | | | | |
GIS awards – deferred shares | | | 29.24 | | | | n/a | | | | 3 years | | | | A$30.94 | | | | n/a | | | | 3.17 | % |
GSTIP awards – deferred shares | | | 26.62 | | | | n/a | | | | 3 years | | | | A$30.94 | | | | n/a | | | | 3.17 | % |
LTIP awards | | | 13.25 | | | | 1.42 | % | | | 5 years | | | | A$30.94 | | | | 31.0 | % | | | 3.17 | % |
Transitional GMC awards | | | 25.37 | | | | n/a | | | | 3-4 years | | | | A$30.94 | | | | n/a | | | | 3.17 | % |
MAP awards | | | 25.78 | | | | n/a | | | | 3 years | | | | A$30.94 | | | | n/a | | | | 3.17 | % |
Shareplus | | | 31.37 | | | | 2.55 | % | | | 3 years | | | | A$36.78 | | | | n/a | | | | 3.11 | % |
| | | | | | | | | | | | | | | | | | | | | | | | |
BHP Billiton Plc | | | | | | | | | | | | | | | | | | | | | | | | |
GSTIP awards – deferred shares | | | 24.24 | | | | n/a | | | | 3 years | | | | £17.15 | | | | n/a | | | | 3.65 | % |
MAP awards | | | 23.35 | | | | n/a | | | | 3 years | | | | £17.15 | | | | n/a | | | | 3.65 | % |
Shareplus | | | 28.61 | | | | 2.05 | % | | | 3 years | | | | £18.91 | | | | n/a | | | | 3.49 | % |
Kgatelo Pele ESOP | | | 30.14 | | | | n/a | | | | 3 years | | | | £18.91 | | | | n/a | | | | n/a | |
| | | | | | | | | | | | | | | | | | | | | | | | |
Employee share awards – current plans
| | | | | | | | | | | | | | | | | | | | | | | | |
2013 | | Number of
awards at
the
beginning
of the
financial
year | | | Number of
awards
issued
during the
year | | | Number of
awards
vested and
exercised | | | Number
of
awards
lapsed | | | Number of
awards at
the end of
the
financial
year | | | Number of
awards
vested and
exercisable
at the end
of the
financial
year | |
BHP Billiton Limited | | | | | | | | | | | | | | | | | | | | | | | | |
GIS awards – deferred shares | | | 614,335 | | | | 53,854 | | | | 407,847 | | | | 15,474 | | | | 244,868 | | | | 23,167 | |
GIS awards – options | | | 764,318 | | | | – | | | | 359,098 | | | | 314,831 | | | | 90,389 | | | | 90,389 | |
– weighted average exercise price – A$ | | | 34.44 | | | | – | | | | 29.15 | | | | 41.99 | | | | 29.15 | | | | 29.15 | |
– weighted average share price – A$ | | | | | | | | | | | 34.15 | | | | | | | | | | | | | |
GSTIP awards – deferred shares | | | 2,234,410 | | | | 1,248,794 | | | | 1,024,623 | | | | 70,283 | | | | 2,388,298 | | | | 194,382 | |
GSTIP awards – options | | | 335,160 | | | | – | | | | – | | | | 50,524 | | | | 284,636 | | | | 284,636 | |
– weighted average exercise price – A$ | | | 39.29 | | | | – | | | | – | | | | 38.41 | | | | 39.44 | | | | 39.44 | |
– weighted average share price – A$ | | | | | | | | | | | – | | | | | | | | | | | | | |
LTIP awards | | | 10,047,354 | | | | 693,628 | | | | 4,621,864 | | | | 53,083 | | | | 6,066,035 | | | | 2,367,453 | |
Transitional GMC awards | | | – | | | | 35,834 | | | | – | | | | – | | | | 35,834 | | | | – | |
MAP awards | | | 7,841,674 | | | | 3,142,398 | | | | 2,196,959 | | | | 805,431 | | | | 7,981,682 | | | | 687,175 | |
Shareplus | | | 2,436,201 | | | | 1,966,016 | | | | 1,015,575 | | | | 294,580 | | | | 3,092,062 | | | | – | |
| | | | | | | | | | | | | | | | | | | | | | | | |
BHP Billiton Plc | | | | | | | | | | | | | | | | | | | | | | | | |
GIS awards – deferred shares | | | 253,076 | | | | 54,268 | | | | 170,712 | | | | – | | | | 136,632 | | | | 4,195 | |
GIS awards – options | | | 297,042 | | | | – | | | | 172,704 | | | | 14,546 | | | | 109,792 | | | | 109,792 | |
– weighted average exercise price – £ | | | 12.94 | | | | – | | | | 10.96 | | | | 16.51 | | | | 15.58 | | | | 15.58 | |
– weighted average share price – £ | | | | | | | | | | | 19.29 | | | | | | | | | | | | | |
GSTIP awards – deferred shares | | | 890,553 | | | | 281,561 | | | | 412,558 | | | | 58,786 | | | | 700,770 | | | | 65,838 | |
GSTIP awards – options | | | 96,012 | | | | – | | | | 21,030 | | | | 20,022 | | | | 54,960 | | | | 54,960 | |
– weighted average exercise price – £ | | | 20.35 | | | | – | | | | 17.53 | | | | 22.08 | | | | 20.80 | | | | 20.80 | |
– weighted average share price – £ | | | | | | | | | | | 19.37 | | | | | | | | | | | | | |
LTIP awards | | | 3,941,270 | | | | 401,831 | | | | 1,684,852 | | | | 20,083 | | | | 2,638,166 | | | | 912,476 | |
Transitional GMC awards | | | – | | | | 39,860 | | | | – | | | | – | | | | 39,860 | | | | – | |
MAP awards | | | 2,837,040 | | | | 797,840 | | | | 860,119 | | | | 356,685 | | | | 2,418,076 | | | | 250,305 | |
Shareplus | | | 588,356 | | | | 439,800 | | | | 241,642 | | | | 84,311 | | | | 702,203 | | | | – | |
| | | | | | | | | | | | | | | | | | | | | | | | |
Fair value and assumptions in the calculation of fair value for awards issued
| | | | | | | | | | | | | | | | | | | | | | | | |
2013 | | Weighted
average
fair value
of awards
granted
during
the year (a)
US$ | | | Risk-free
interest
rate (b) | | | Estimated
life of
awards | | | Share
price at
grant
date | | | Estimated
volatility
of share
price (c) | | | Dividend
yield | |
BHP Billiton Limited | | | | | | | | | | | | | | | | | | | | | | | | |
GIS awards – deferred shares | | | 32.40 | | | | n/a | | | | 3 years | | | | A$31.45 | | | | n/a | | | | 2.78 | % |
GSTIP awards – deferred shares | | | 29.84 | | | | n/a | | | | 3 years | | | | A$31.45 | | | | n/a | | | | 2.78 | % |
LTIP awards | | | 16.41 | | | | 0.73 | % | | | 5 years | | | | A$31.45 | | | | 35.0 | % | | | 2.78 | % |
Transitional GMC awards | | | 28.61 | | | | n/a | | | | 3-4 years | | | | A$31.45 | | | | n/a | | | | 2.78 | % |
MAP awards | | | 29.01 | | | | n/a | | | | 3 years | | | | A$31.45 | | | | n/a | | | | 2.78 | % |
Shareplus | | | 32.55 | | | | 3.34 | % | | | 3 years | | | | A$33.74 | | | | n/a | | | | 2.50 | % |
| | | | | | | | | | | | | | | | | | | | | | | | |
BHP Billiton Plc | | | | | | | | | | | | | | | | | | | | | | | | |
GIS awards – deferred shares | | | 28.91 | | | | n/a | | | | 3 years | | | | £18.06 | | | | n/a | | | | 3.31 | % |
GSTIP awards – deferred shares | | | 26.22 | | | | n/a | | | | 3 years | | | | £18.06 | | | | n/a | | | | 3.31 | % |
LTIP awards | | | 14.59 | | | | 0.73 | % | | | 5 years | | | | £18.06 | | | | 35.0 | % | | | 3.31 | % |
Transitional GMC awards | | | 24.94 | | | | n/a | | | | 3-4 years | | | | £18.06 | | | | n/a | | | | 3.31 | % |
MAP awards | | | 25.37 | | | | n/a | | | | 3 years | | | | £18.06 | | | | n/a | | | | 3.31 | % |
Shareplus | | | 28.80 | | | | 2.24 | % | | | 3 years | | | | £19.49 | | | | n/a | | | | 2.89 | % |
| | | | | | | | | | | | | | | | | | | | | | | | |
Employee share awards – past plans
| | | | | | | | | | | | | | | | | | | | | | | | |
2015 | | Number
of awards
at the
beginning
of the
financial
year | | | Number
of
awards
issued | | | Number
of
awards
exercised | | | Number
of
awards
lapsed | | | Number of
awards
at the end
of the
financial
year | | | Number of
awards
exercisable
at the end
of the
financial
year | |
BHP Billiton Limited | | | | | | | | | | | | | | | | | | | | | | | | |
Employee Share Plan shares | | | 2,177,028 | | | | – | | | | 1,635,765 | | | | – | | | | 541,263 | | | | 541,263 | |
| | | | | | | | | | | | | | | | | | | | | | | | |
2014 | | Number
of awards
at the
beginning
of the
financial
year | | | Number
of
awards
issued | | | Number
of
awards
exercised | | | Number
of
awards
lapsed | | | Number of
awards
at the end
of the
financial
year | | | Number of
awards
exercisable
at the end
of the
financial
year | |
BHP Billiton Limited | | | | | | | | | | | | | | | | | | | | | | | | |
Employee Share Plan shares | | | 3,950,536 | | | | – | | | | 1,773,508 | | | | – | | | | 2,177,028 | | | | 2,177,028 | |
Employee share awards – past plans
| | | | | | | | | | | | | | | | | | | | | | | | |
2013 | | Number
of awards
at the
beginning
of the
financial
year | | | Number
of
awards
issued | | | Number
of
awards
exercised | | | Number
of
awards
lapsed | | | Number of
awards
at the end
of the
financial
year | | | Number of
awards
exercisable
at the end
of the
financial
year | |
BHP Billiton Limited | | | | | | | | | | | | | | | | | | | | | | | | |
Employee Share Plan shares | | | 5,447,321 | | | | – | | | | 1,496,785 | | | | – | | | | 3,950,536 | | | | 3,950,536 | |
Employee share awards – summary(e) (f)
| | | | | | | | | | | | | | | | |
| | | Awards outstanding at: | | | | | | | |
Month of issue | | 30 June 2015 | | | 10 September 2015 | | | Exercise price (d) | | | Exercise period/release date | |
BHP Billiton Limited | | | | | | | | | | | | | | | | |
Employee Share Plan shares | | | | | | | | | | | | | | | | |
October 1997 | | | 541,263 | | | | 541,263 | | | | – | | | | Oct 1997 – Oct 2017 | |
| | | | | | | | | | | | | | | | |
| | | 541,263 | | | | 541,263 | | | | | | | | | |
| | | | | | | | | | | | | | | | |
STIP awards | | | | | | | | | | | | | | | | |
December 2014 | | | 412,994 | | | | 412,994 | | | | – | | | | Aug 2016 | |
| | | | | | | | | | | | | | | | |
| | | 412,994 | | | | 412,994 | | | | | | | | | |
| | | | | | | | | | | | | | | | |
GIS awards | | | | | | | | | | | | | | | | |
Deferred shares | | | | | | | | | | | | | | | | |
December 2013 | | | 68,143 | | | | – | | | | – | | | | Aug 2015 | |
| | | | | | | | | | | | | | | | |
| | | 68,143 | | | | – | | | | | | | | | |
| | | | | | | | | | | | | | | | |
GSTIP awards | | | | | | | | | | | | | | | | |
Deferred shares | | | | | | | | | | | | | | | | |
November 2014 | | | 1,594,188 | | | | 1,512,185 | | | | – | | | | Aug 2016 | |
October 2013 | | | 1,029,965 | | | | – | | | | – | | | | Aug 2015 | |
Options | | | | | | | | | | | | | | | | |
October 2010 | | | 87,254 | | | | – | | | A$ | 41.78 | | | | Aug 2012 – Aug 2015 | |
| | | | | | | | | | | | | | | | |
| | | 2,711,407 | | | | 1,512,185 | | | | | | | | | |
| | | | | | | | | | | | | | | | |
LTIP awards | | | | | | | | | | | | | | | | |
December 2014 | | | 1,195,389 | | | | 1,195,389 | | | | – | | | | Aug 2019 | |
December 2013 | | | 1,096,117 | | | | 1,096,117 | | | | – | | | | Aug 2018 | |
December 2012 | | | 154,433 | | | | 154,433 | | | | – | | | | Aug 2017 – Aug 2022 | |
December 2011 | | | 255,721 | | | | 255,721 | | | | – | | | | Aug 2016 – Aug 2021 | |
December 2010 | | | 357,171 | | | | – | | | | – | | | | Aug 2015 – Aug 2020 | |
December 2009 | | | 4,137 | | | | – | | | | – | | | | Aug 2014 – Aug 2019 | |
December 2007 | | | 396,227 | | | | 396,227 | | | | – | | | | Aug 2012 – Aug 2017 | |
December 2006 | | | 288,027 | | | | 282,127 | | | | – | | | | Aug 2011 – Aug 2016 | |
December 2005 | | | 19,209 | | | | – | | | | – | | | | Aug 2010 – Aug 2015 | |
| | | | | | | | | | | | | | | | |
| | | 3,766,431 | | | | 3,380,014 | | | | | | | | | |
| | | | | | | | | | | | | | | | |
| | | | | | | | | | | | | | | | |
| | | Awards outstanding at: | | | | | | | |
Month of issue | | 30 June 2015 | | | 10 September 2015 | | | Exercise price (d) | | | Exercise period/release date | |
Transitional GMC awards | | | | | | | | | | | | | | | | |
December 2013 | | | 109,990 | | | | 109,990 | | | | – | �� | | | Aug 2017 | |
December 2013 | | | 109,990 | | | | 109,990 | | | | – | | | | Aug 2016 | |
| | | | | | | | | | | | | | | | |
| | | 219,980 | | | | 219,980 | | | | | | | | | |
| | | | | | | | | | | | | | | | |
MAP awards | | | | | | | | | | | | | | | | |
November 2014 and April 2015 | | | 2,853,667 | | | | 2,743,310 | | | | – | | | | Aug 2017 | |
October 2013 and April 2014 | | | 2,600,096 | | | | 2,467,410 | | | | – | | | | Aug 2016 | |
October 2012 and March 2013 | | | 2,141,153 | | | | – | | | | – | | | | Aug 2015 | |
October 2011 and March 2012 | | | 2,423 | | | | – | | | | – | | | | Aug 2014 – Aug 2015 | |
October 2010 and March 2011 | | | 124,300 | | | | 108,900 | | | | – | | | | Aug 2013 – Aug 2016 | |
October 2009 and March 2010 | | | 5,000 | | | | – | | | | – | | | | Aug 2012 – Aug 2015 | |
| | | | | | | | | | | | | | | | |
| | | 7,726,639 | | | | 5,319,620 | | | | | | | | | |
| | | | | | | | | | | | | | | | |
Shareplus | | | | | | | | | | | | | | | | |
September 2014 to June 2015 | | | 2,587,969 | | | | 2,480,019 | | | | – | | | | Apr 2017 | |
September 2013 to June 2014 | | | 1,440,423 | | | | 1,392,343 | | | | – | | | | Apr 2016 | |
| | | | | | | | | | | | | | | | |
| | | 4,028,392 | | | | 3,872,362 | | | | | | | | | |
| | | | | | | | | | | | | | | | |
BHP Billiton Plc | | | | | | | | | | | | | | | | |
GIS awards | | | | | | | | | | | | | | | | |
Options | | | | | | | | | | | | | | | | |
December 2010 | | | 30,389 | | | | 30,389 | | | £ | 23.71 | | | | Aug 2012 – Oct 2015 | |
| | | | | | | | | | | | | | | | |
| | | 30,389 | | | | 30,389 | | | | | | | | | |
| | | | | | | | | | | | | | | | |
GSTIP awards | | | | | | | | | | | | | | | | |
Deferred shares | | | | | | | | | | | | | | | | |
November 2014 | | | 227,687 | | | | 210,952 | | | | – | | | | Aug 2016 | |
October 2013 | | | 93,921 | | | | – | | | | – | | | | Aug 2015 | |
Options | | | | | | | | | | | | | | | | |
October 2010 | | | 42,473 | | | | – | | | £ | 22.08 | | | | Aug 2012 – Aug 2015 | |
| | | | | | | | | | | | | | | | |
| | | 364,081 | | | | 210,952 | | | | | | | | | |
| | | | | | | | | | | | | | | | |
LTIP awards | | | | | | | | | | | | | | | | |
December 2012 | | | 308,257 | | | | 308,257 | | | | – | | | | Aug 2017 – Aug 2022 | |
December 2011 | | | 214,452 | | | | 214,452 | | | | – | | | | Aug 2016 – Aug 2021 | |
December 2010 | | | 199,648 | | | | – | | | | – | | | | Aug 2015 – Aug 2020 | |
December 2007 | | | 146,376 | | | | 133,876 | | | | – | | | | Aug 2012 – Aug 2017 | |
December 2006 | | | 75,064 | | | | 63,064 | | | | – | | | | Aug 2011 – Aug 2016 | |
December 2005 | | | 60,417 | | | | – | | | | – | | | | Aug 2010 – Aug 2015 | |
| | | | | | | | | | | | | | | | |
| | | 1,004,214 | | | | 719,649 | | | | | | | | | |
| | | | | | | | | | | | | | | | |
Transitional GMC awards | | | | | | | | | | | | | | | | |
December 2012 | | | 21,533 | | | | 21,533 | | | | – | | | | Aug 2016 | |
December 2012 | | | 21,533 | | | | – | | | | – | | | | Aug 2015 | |
| | | | | | | | | | | | | | | | |
| | | 43,066 | | | | 21,533 | | | | | | | | | |
| | | | | | | | | | | | | | | | |
MAP awards | | | | | | | | | | | | | | | | |
November 2014 and April 2015 | | | 581,580 | | | | 537,694 | | | | – | | | | Aug 2017 | |
October 2013 and April 2014 | | | 591,489 | | | | 543,427 | | | | – | | | | Aug 2016 | |
| | | | | | | | | | | | | | | | |
| | | Awards outstanding at: | | | | | | | |
Month of issue | | 30 June 2015 | | | 10 September 2015 | | | Exercise price (d) | | | Exercise period/release date | |
October 2012 and March 2013 | | | 317,914 | | | | – | | | | – | | | | Aug 2015 | |
October 2010 and March 2011 | | | 68,100 | | | | 55,450 | | | | – | | | | Aug 2013 – Aug 2016 | |
October 2009 and March 2010 | | | 13,000 | | | | – | | | | – | | | | Aug 2012 – Aug 2015 | |
| | | | | | | | | | | | | | | | |
| | | 1,572,083 | | | | 1,136,571 | | | | | | | | | |
| | | | | | | | | | | | | | | | |
Shareplus | | | | | | | | | | | | | | | | |
September 2014 to June 2015 | | | 153,098 | | | | 146,998 | | | | – | | | | Apr 2017 | |
September 2013 to June 2014 | | | 91,696 | | | | 88,749 | | | | – | | | | Apr 2016 | |
| | | | | | | | | | | | | | | | |
| | | 244,794 | | | | 235,747 | | | | | | | | | |
| | | | | | | | | | | | | | | | |
| (a) | The fair value of awards as presented in the tables above represents the fair value at grant date. The fair values of awards granted were estimated using a Monte Carlo simulation methodology, Black-Scholes option pricing technique and net present value technique. |
| (b) | The risk-free interest rate used is an applicable government bond rate. |
| (c) | Historical volatility has been used to estimate the volatility of the share price. |
| (d) | Exercise price on awards issued is equal to the exercise price as per awards outstanding. |
| (e) | Shares issued on exercise of BHP Billiton’s employee share ownership plans include shares purchased on-market. |
| (f) | In respect of employee share awards, the Group utilises the following trusts: |
| (i) | The Billiton Employee Share Ownership Plan Trust is a discretionary trust for the benefit of all employees of BHP Billiton Plc and its subsidiaries. The trustee is an independent company, resident in Jersey. The Trust uses funds provided by BHP Billiton Plc and/or its subsidiaries as appropriate to acquire ordinary shares to enable awards to be made or satisfied under the LTIP, STIP, MAP, GIS, GSTIP, Shareplus and other employee share schemes operated by BHP Billiton Plc from time to time. The ordinary shares may be acquired by purchase in the market or by subscription at not less than nominal value. The Trust receives dividends on shares held to meet future awards under the plans. |
| (ii) | The BHP Billiton Employee Equity Trust is a discretionary trust for the benefit of all employees of BHP Billiton Limited and its subsidiaries. The trustee is an independent company, resident in Jersey. The Trust uses funds provided by BHP Billiton Limited and/or its subsidiaries as appropriate to acquire ordinary shares to enable awards to be made or satisfied under the LTIP, STIP, MAP, GIS, GSTIP, Shareplus and other employee share schemes operated by BHP Billiton Limited from time to time. The ordinary shares may be acquired by purchase in the market or by subscription at not less than nominal value. The Trust has waived its rights to dividends on shares held to meet future awards under the plans. |
Refer to note 43 ‘Significant accounting policies’ (t).
| 26. | Employee benefits, restructuring and post-retirement employee benefits provisions |
| | | | | | | | |
| | | 2015 | | | 2014 | |
| | | US$M | | | US$M | |
Current | | | | | | | | |
Employee benefits(a) | | | 1,185 | | | | 1,727 | |
Restructuring(b) | | | 104 | | | | 26 | |
Post-retirement employee benefits(c) | | | 35 | | | | 23 | |
| | | | | | | | |
Total current provisions | | | 1,324 | | | | 1,776 | |
| | | | | | | | |
Non-current | | | | | | | | |
Employee benefits(a) | | | 199 | | | | 247 | |
Post-retirement employee benefits(c) | | | 394 | | | | 519 | |
| | | | | | | | |
Total non-current provisions | | | 593 | | | | 766 | |
| | | | | | | | |
| | | | | | | | | | | | | | | | |
| | | Employee
benefits | | | Restructuring | | | Post-
retirement
employee
benefits | | | Total | |
| | | US$M | | | US$M | | | US$M | | | US$M | |
At the beginning of the financial year | | | 1,974 | | | | 26 | | | | 542 | | | | 2,542 | |
Charge/(credit) for the year: | | | | | | | | | | | | | | | | |
Underlying | | | 1,531 | | | | 277 | | | | 59 | | | | 1,867 | |
Discounting | | | 7 | | | | – | | | | – | | | | 7 | |
Net interest expense | | | – | | | | – | | | | 24 | | | | 24 | |
Exchange variations | | | (212 | ) | | | (2 | ) | | | (24 | ) | | | (238 | ) |
Released during the year | | | (37 | ) | | | (17 | ) | | | – | | | | (54 | ) |
Remeasurement losses taken to retained earnings | | | – | | | | – | | | | 28 | | | | 28 | |
Utilisation | | | (1,621 | ) | | | (174 | ) | | | (66 | ) | | | (1,861 | ) |
Divestment and demerger of subsidiaries and operations | | | (241 | ) | | | (7 | ) | | | (146 | ) | | | (394 | ) |
Transfers and other movements | | | (17 | ) | | | 1 | | | | 12 | | | | (4 | ) |
| | | | | | | | | | | | | | | | |
At the end of the financial year | | | 1,384 | | | | 104 | | | | 429 | | | | 1,917 | |
| | | | | | | | | | | | | | | | |
| (a) | The expenditure associated with total employee benefits will occur in a pattern consistent with when employees choose to exercise their entitlement to benefits. |
| (b) | Total restructuring provisions include provisions for business terminations and office closures. |
| (c) | The provision for post-retirement employee benefits includes pension liabilities of US$160 million (2014: US$117 million) and post-retirement medical benefit liabilities of US$269 million (2014: US$425 million). Refer to note 27 ‘Pension and other post-retirement obligations’. |
Refer to note 43 ‘Significant accounting policies’ (u) and (v).
27. Pension and other post-retirement obligations
The Group operates the following pension and post-retirement medical schemes:
Defined contribution pension schemes and multi-employer pension schemes
The Group contributed US$462 million (2014: US$467 million; 2013: US$456 million) to defined contribution plans and multi-employer defined contribution plans. These contributions are expensed as incurred.
Defined benefit pension schemes
The Group has closed all defined benefit schemes to new entrants. Defined benefit pension schemes remain operating in Australia, the US, Canada and Europe for existing members. During the 2015 financial year, as part of the demerger of South32, the Group transferred its defined benefit pension schemes in South Africa, South America and some schemes in Australia to South32. Full actuarial valuations are prepared and updated annually to 30 June by local actuaries for all schemes. The Group operates final salary schemes that provide final salary benefits only, non-salary related schemes that provide flat dollar benefits and mixed benefit schemes that consist of a final salary defined benefit portion and a defined contribution portion.
Defined benefit post-retirement medical schemes
The Group operates a number of post-retirement medical schemes in the US, Canada and Europe. During the 2015 financial year, as part of the demerger of South32, the Group transferred its defined benefit medical schemes in South Africa to South32. Full actuarial valuations are prepared by local actuaries for all schemes. All of the post-retirement medical schemes in the Group are unfunded.
Risk
The Group’s defined benefit pension schemes and post-retirement medical schemes expose the Group to a number of risks including asset value volatility, interest rate and inflation risk.
Recognising this, the Group has adopted an approach of moving away from providing defined benefit pensions. The majority of Group sponsored defined benefit pension schemes have been closed to new entrants for many years. Existing benefit schemes, and the terms of employee participation in these schemes, are reviewed on a regular basis.
Fund Assets
The Group follows a coordinated strategy for the funding and investment of its defined benefit pension schemes (subject to meeting all local requirements). The Group’s aim is for the value of defined benefit scheme assets to be maintained at close to the value of the corresponding benefit obligations, allowing for some short-term volatility.
Scheme assets are invested in a diversified range of asset classes, predominantly comprising bonds and equities.
The Group’s aim is to progressively shift defined benefit pension scheme assets towards investments that match the anticipated profile of the benefit obligations, as funding levels improve, and as benefit obligations mature. Over time, this is expected to result in a further reduction in the total exposure of pension scheme assets to equity markets. For pension schemes that pay lifetime benefits, the Group may consider and support the purchase of annuities to back these benefit obligations if it is commercially sensible to do so.
Net Liability recognised in the Consolidated Balance Sheet
The net liability recognised in the Consolidated Balance Sheet is as follows:
| | | | | | | | | | | | | | | | |
| | | Defined benefit pension
schemes | | | Post-retirement medical
schemes | |
| | | 2015 | | | 2014 | | | 2015 | | | 2014 | |
| | | US$M | | | US$M | | | US$M | | | US$M | |
Present value of funded defined benefit obligation | | | 868 | | | | 1,297 | | | | – | | | | – | |
Present value of unfunded defined benefit obligation | | | 113 | | | | 103 | | | | 269 | | | | 425 | |
Fair value of defined benefit scheme assets | | | (822 | ) | | | (1,319 | ) | | | – | | | | – | |
| | | | | | | | | | | | | | | | |
Scheme deficit | | | 159 | | | | 81 | | | | 269 | | | | 425 | |
| | | | | | | | | | | | | | | | |
Unrecognised surplus | | | – | | | | 33 | | | | – | | | | – | |
Unrecognised past service credits | | | – | | | | – | | | | – | | | | – | |
Adjustment for employer contributions tax | | | 1 | | | | 3 | | | | – | | | | – | |
| | | | | | | | | | | | | | | | |
Net liability recognised in the Consolidated Balance Sheet | | | 160 | | | | 117 | | | | 269 | | | | 425 | |
| | | | | | | | | | | | | | | | |
The Group has no legal obligation to settle these liabilities with any immediate contributions or additional one-off contributions. The Group intends to continue to contribute to each defined benefit pension and post-retirement medical scheme in accordance with the latest recommendations of each scheme actuary.
Refer to note 43 ‘Significant accounting policies’ (v).
28. Employees
| | | | | | | | | | | | |
| | | 2015 | | | 2014 | | | 2013 | |
Average number of employees(a) | | | | | | | | | | | | |
Petroleum and Potash | | | 4,224 | | | | 4,207 | | | | 4,449 | |
Copper | | | 9,138 | | | | 9,414 | | | | 9,765 | |
Iron Ore | | | 7,483 | | | | 8,035 | | | | 6,883 | |
Coal | | | 5,579 | | | | 6,160 | | | | 6,006 | |
Group and unallocated | | | 3,246 | | | | 3,687 | | | | 4,054 | |
| | | | | | | | | | | | |
Total average number of employees from Continuing operations | | | 29,670 | | | | 31,503 | | | | 31,157 | |
| | | | | | | | | | | | |
Total average number of employees from Discontinued operations | | | 13,159 | | | | 15,541 | | | | 15,735 | |
| | | | | | | | | | | | |
Total average number of employees | | | 42,829 | | | | 47,044 | | | | 46,892 | |
| | | | | | | | | | | | |
| (a) | Average employee numbers include the Executive Director, 100 per cent of employees of subsidiary companies and our share of employees of joint operations. Employees of equity accounted investments are not included. Part-time employees are included on a full-time equivalent basis. Employees of businesses acquired or disposed of during the year are included for the period of ownership. Contractors are not included. |
Group and related party information
29. Discontinued operations
On 25 May 2015, the Group announced that it completed the demerger of a selection of its aluminium, coal, manganese, nickel and silver-lead-zinc assets to create an independent metals and mining company, South32. This included the Group’s interests in its integrated Aluminium business, Energy Coal South Africa, Illawarra metallurgical coal, the Manganese business, the Cerro Matoso nickel operation and the Cannington silver-lead-zinc mine.
Significant subsidiaries, joint operations, equity accounted investments and investments that were divested as part of the demerger of South32 are listed below:
| | | | | | |
| | | | Effective interest | |
Significant subsidiaries, joint operations, equity accounted
investments and investments | | Country of incorporation | | At date of
demerger
% | |
Alumar (aluminium refining) | | Brazil | | | 36 | |
Alumar (aluminium smelting) | | Brazil | | | 40 | |
BHP Billiton Aluminium (RAA) Pty Ltd | | Australia | | | 100 | |
BHP Billiton Aluminium (Worsley) Pty Ltd | | Australia | | | 100 | |
BHP Billiton Cannington Pty Ltd | | Australia | | | 100 | |
BHP Billiton Energy Coal South Africa (Pty) Ltd | | South Africa | | | 100 | |
BHP Billiton Energy Coal South Africa Rehabilitation Trust | | South Africa | | | N/A | |
BHP Billiton Metais SA | | Brazil | | | 100 | |
BHP Billiton SA Investments Ltd | | United Kingdom | | | 100 | |
BHP Billiton SA Ltd | | South Africa | | | 100 | |
Billiton Aluminium SA (Pty) Ltd | | South Africa | | | 100 | |
Billiton Investment 12 BV | | The Netherlands | | | 100 | |
Cerro Matoso SA | | Colombia | | | 99.9 | |
Dendrobium Coal Pty Ltd | | Australia | | | 100 | |
Endeavour Coal Pty Ltd | | Australia | | | 100 | |
Groote Eylandt Mining Company Pty Ltd | | Australia | | | 60 | |
Hillside Aluminium (Pty) Ltd | | South Africa | | | 100 | |
Hotazel Manganese Mines (Pty) Ltd | | South Africa | | | 54.6 | |
Illawarra Coal Holdings Pty Ltd | | Australia | | | 100 | |
Illawarra Services Pty Ltd | | Australia | | | 100 | |
Mozal SARL | | Mozambique | | | 47.1 | |
Phola Coal Processing Plant (Pty) Ltd | | South Africa | | | 50 | |
Samancor AG | | Switzerland | | | 60 | |
Samancor Manganese (Pty) Ltd | | South Africa | | | 60 | |
South32 Limited | | Australia | | | 100 | |
Tasmanian Electro Metallurgical Company Pty Ltd | | Australia | | | 60 | |
Worsley | | Australia | | | 86 | |
The contribution of Discontinued operations included within the Group’s profit until the loss of control is detailed below:
Income statement – Discontinued operations
| | | | | | | | | | | | |
| | | 2015 | | | 2014 | | | 2013 | |
| | | US$M | | | US$M | | | US$M | |
Revenue | | | | | | | | | | | | |
Group production | | | 7,007 | | | | 9,182 | | | | 10,430 | |
Third party products | | | 624 | | | | 1,262 | | | | 1,663 | |
| | | | | | | | | | | | |
Revenue | | | 7,631 | | | | 10,444 | | | | 12,093 | |
Other income | | | 225 | | | | 299 | | | | 143 | |
Expenses excluding net finance costs | | | (6,582 | ) | | | (9,990 | ) | | | (13,211 | ) |
Share of operating profit of equity accounted investments | | | (24 | ) | | | 10 | | | | – | |
| | | | | | | | | | | | |
Profit/(loss) from operations | | | 1,250 | | | | 763 | | | | (975 | ) |
| | | | | | | | | | | | |
Comprising: | | | | | | | | | | | | |
Group production | | | 1,213 | | | | 734 | | | | (1,038 | ) |
Third party products | | | 37 | | | | 29 | | | | 63 | |
| | | | | | | | | | | | |
| | | 1,250 | | | | 763 | | | | (975 | ) |
| | | | | | | | | | | | |
Financial expenses | | | (74 | ) | | | (278 | ) | | | (155 | ) |
Financial income | | | 26 | | | | 16 | | | | 28 | |
| | | | | | | | | | | | |
Net finance costs | | | (48 | ) | | | (262 | ) | | | (127 | ) |
| | | | | | | | | | | | |
Profit/(loss) before taxation | | | 1,202 | | | | 501 | | | | (1,102 | ) |
| | | | | | | | | | | | |
Income tax expense | | | (464 | ) | | | (272 | ) | | | (68 | ) |
Royalty-related taxation (net of income tax benefit) | | | (96 | ) | | | 40 | | | | (142 | ) |
| | | | | | | | | | | | |
Total taxation expense | | | (560 | ) | | | (232 | ) | | | (210 | ) |
| | | | | | | | | | | | |
Profit/(loss) after taxation from operating activities | | | 642 | | | | 269 | | | | (1,312 | ) |
| | | | | | | | | | | | |
Net loss on demerger of South32 after taxation | | | (2,154 | ) | | | – | | | | – | |
| | | | | | | | | | | | |
(Loss)/profit after taxation | | | (1,512 | ) | | | 269 | | | | (1,312 | ) |
| | | | | | | | | | | | |
Attributable to non-controlling interests | | | 61 | | | | 85 | | | | 163 | |
Attributable to members of BHP Billiton Group | | | (1,573 | ) | | | 184 | | | | (1,475 | ) |
| | | | | | | | | | | | |
Basic (losses)/earnings per ordinary share (cents) | | | (29.6 | ) | | | 3.5 | | | | (27.7 | ) |
Diluted (losses)/earnings per ordinary share (cents) | | | (29.5 | ) | | | 3.4 | | | | (27.6 | ) |
| | | | | | | | | | | | |
The total comprehensive income attributable to members of BHP Billiton Group from Discontinued operations was a loss of US$1,685 million (2014: profit of US$164 million; 2013: loss of US$1,569 million).
Cash flows from Discontinued operations
| | | | | | | | | | | | |
| | | 2015 | | | 2014 | | | 2013 | |
| | | US$M | | | US$M | | | US$M | |
Net operating cash flows | | | 1,502 | | | | 1,724 | | | | 1,137 | |
Net investing cash flows | | | (1,066 | ) | | | (700 | ) | | | (1,105 | ) |
Net financing cash flows | | | (203 | ) | | | (32 | ) | | | (148 | ) |
| | | | | | | | | | | | |
| Net increase/(decrease) in cash and cash equivalents from Discontinued operations | | | 233 | | | | 992 | | | | (116 | ) |
| | | | | | | | | | | | |
Cash disposed on demerger of South32 | | | (586 | ) | | | – | | | | – | |
| | | | | | | | | | | | |
| Net (decrease)/increase in cash and cash equivalents from Discontinued operations | | | (353 | ) | | | 992 | | | | (116 | ) |
| | | | | | | | | | | | |
Loss on demerger of Discontinued operations
Details of the net loss on demerger are described below:
| | | | |
| | 2015 | |
| | US$M | |
Assets | | | | |
Cash and cash equivalents | | | 586 | |
Trade and other receivables | | | 1,198 | |
Other financial assets | | | 470 | |
Investments accounted for using the equity method | | | 1,643 | |
Inventories | | | 1,073 | |
Property, plant and equipment | | | 9,622 | |
Intangible assets | | | 328 | |
Deferred tax assets | | | 142 | |
Other | | | 66 | |
| | | | |
Total assets | | | 15,128 | |
| | | | |
Liabilities | | | | |
Trade and other payables | | | 811 | |
Interest bearing liabilities | | | 1,085 | |
Provisions | | | 1,916 | |
Other | | | 6 | |
| | | | |
Total liabilities | | | 3,818 | |
| | | | |
Net assets demerged | | | 11,310 | |
| | | | |
Less non-controlling interest share of net liabilities disposed | | | 1 | |
| | | | |
BHP Billiton share of net assets demerged | | | 11,311 | |
| | | | |
| | | | |
Fair value of South32 shares – in-specie dividend | | | 9,445 | |
| Reclassification of financial asset and foreign currency translation reserves of South32 to the income statement | | | 71 | |
| | | | |
Loss on demerger | | | (1,795 | ) |
Transaction costs | | | (586 | ) |
| | | | |
Loss on demerger net of transaction costs before taxation | | | (2,381 | ) |
Income tax benefit on transaction costs | | | 62 | |
| | | | |
Loss on demerger net of transaction costs after taxation | | | (2,319 | ) |
Gain on loss of control of Manganese business | | | 2,146 | |
Impairment of South32 assets upon classification as held for distribution (after tax benefit) | | | (1,749 | ) |
Derecognition of deferred tax assets | | | (232 | ) |
| | | | |
Net loss on demerger of South32 | | | (2,154 | ) |
| | | | |
Exceptional items – Discontinued operations
Exceptional items are those items where their nature and amount is considered material to the financial statements. Items related to Discontinued operations included within the Group’s profit are detailed below:
| | | | | | | | | | | | |
Year ended 30 June 2015 | | Gross | | | Tax | | | Net | |
| | | US$M | | | US$M | | | US$M | |
Gain on loss of control of Manganese business | | | 2,146 | | | | – | | | | 2,146 | |
Impairment of South32 assets upon classification as held for distribution | | | (1,897 | ) | | | 148 | | | | (1,749 | ) |
Loss on demerger net of transaction costs | | | (2,381 | ) | | | 62 | | | | (2,319 | ) |
Derecognition of deferred tax assets | | | – | | | | (232 | ) | | | (232 | ) |
Repeal of Minerals Resource Rent Tax legislation | | | – | | | | (111 | ) | | | (111 | ) |
| | | | | | | | | | | | |
| | | (2,132 | ) | | | (133 | ) | | | (2,265 | ) |
| | | | | | | | | | | | |
Gain on loss of control of Manganese business
In contemplation of the demerger, the Group and Anglo American agreed to make certain changes to the agreement which governs their interests in the Manganese business. The changes resulted in the Group and Anglo American agreeing to share joint control of the Manganese business. On 2 March 2015, the Group ceased consolidation of the Manganese business and accounted for its 60 per cent interest as an equity accounted joint venture. The remeasurement to fair value at that date gave rise to a gain of US$2,146 million. There were no tax consequences arising from the remeasurement of the Manganese business.
Impairment of South32 assets upon classification as held for distribution
As the fair value of South32 shares, determined by reference to the Australian Securities Exchange volume weighted average price over the first five days of trading, was less than the book value of the assets distributed, the Group considered whether any of the assets within South32 were impaired at the time they became held for distribution. The Group recognised an impairment of US$1,358 million (after tax benefit) for its Manganese business due to the fall in the price of manganese and an impairment of US$391 million (after tax benefit) at the Wolvekrans Middelburg complex within Energy Coal South Africa due to a decline in export prices and a new rail agreement negatively impacting volumes.
Loss on demerger net of transaction costs
The Group recognised the demerger in the financial statements as a dividend, reducing retained earnings by the fair value of South32’s shares. The US$1,795 million loss on demerger is the difference between the fair value of South32’s shares and the book value of the assets distributed and the reclassification of reserves relating to South32 to the income statement. Transaction costs of US$524 million (after tax benefit) comprised stamp duty, professional fees and separation and establishment costs.
Derecognition of deferred tax assets
The Group derecognised deferred tax assets as a result of internal structuring transactions of South32 assets into the demerged entity.
Repeal of Minerals Resource Rent Tax legislation
The legislation to repeal the Minerals Resource Rent Tax (MRRT) in Australia took effect on 30 September 2014. As a result, the Group derecognised an MRRT deferred tax asset (net of income tax consequences) of which US$111 million related to South32 assets. A corresponding taxation charge of US$111 million was recognised in the period.
There were no exceptional items related to Discontinued operations for the year ended 30 June 2014.
Items related to Discontinued operations included within the Group’s profit for the year ended 30 June 2013 are detailed below:
| | | | | | | | | | | | |
Year ended 30 June 2013 | | Gross | | | Tax | | | Net | |
| | | US$M | | | US$M | | | US$M | |
Impairment of Worsley assets | | | (2,190 | ) | | | 559 | | | | (1,631 | ) |
Other impairments | | | (35 | ) | | | – | | | | (35 | ) |
| | | | | | | | | | | | |
| | | (2,225 | ) | | | 559 | | | | (1,666 | ) |
| | | | | | | | | | | | |
Impairment of Worsley assets
The Group recognised an impairment of assets at Worsley as a result of expected continued strength in the Australian dollar and weak alumina prices. A total impairment charge of US$1,631 million (after tax benefit) was recognised in the year ended 30 June 2013.
Other impairments
The Group reviewed the status of a minor capital project at the Cerro Matoso nickel operation, which resulted in the recognition of impairment charges of US$35 million (after tax benefit) in the year ended 30 June 2013.
30. Subsidiaries
Significant subsidiaries of the Group, which are those with the most significant contribution to the Group’s net profit or net assets, are listed in the table below. Significant subsidiaries that were divested as part of the demerger of South32 are listed in note 29 ‘Discontinued operations’.
| | | | | | | | | | | | |
| | | | | | | Effective
interest | |
Significant subsidiaries (a) | | Country of
incorporation | | Principal activity | | 2015
% | | | 2014
% | |
BHP Billiton Canada Inc. | | Canada | | Potash development | | | 100 | | | | 100 | |
BHP Billiton Finance BV | | The
Netherlands | | Finance | | | 100 | | | | 100 | |
BHP Billiton Finance Limited | | Australia | | Finance | | | 100 | | | | 100 | |
BHP Billiton Finance (USA) Ltd (b) | | Australia | | Finance | | | 100 | | | | 100 | |
BHP Billiton Freight Singapore Pte Limited | | Singapore | | Freight Services | | | 100 | | | | 100 | |
BHP Billiton Group Operations Pty Ltd | | Australia | | Administrative services | | | 100 | | | | 100 | |
BHP Billiton Innovation Pty Ltd | | Australia | | Service company | | | 100 | | | | 100 | |
BHP Billiton International Services Ltd | | UK | | Service company | | | 100 | | | | 100 | |
BHP Billiton International Trading (Shanghai) Co. Ltd | | China | | Marketing and logistic services | | | 100 | | | | 100 | |
BHP Billiton Iron Ore Pty Ltd | | Australia | | Service company | | | 100 | | | | 100 | |
BHP Billiton Marketing AG | | Switzerland | | Marketing and trading | | | 100 | | | | 100 | |
BHP Billiton Marketing Asia Pte. Ltd | | Singapore | | Marketing support and services | | | 100 | | | | 100 | |
BHP Billiton Marketing Inc. | | US | | Marketing and trading | | | 100 | | | | 100 | |
BHP Billiton MetCoal Holdings Pty Ltd | | Australia | | Holding company | | | 100 | | | | 100 | |
BHP Billiton Minerals Pty Ltd | | Australia | | Iron ore, coal, silver, lead and zinc mining | | | 100 | | | | 100 | |
BHP Billiton Mitsui Coal Pty Ltd | | Australia | | Coal mining | | | 80 | | | | 80 | |
BHP Billiton New Mexico Coal Inc. | | US | | Holding company | | | 100 | | | | 100 | |
BHP Billiton Nickel West Pty Ltd | | Australia | | Nickel mining, smelting, refining and administrative services | | | 100 | | | | 100 | |
BHP Billiton Olympic Dam Corporation Pty Ltd | | Australia | | Copper and uranium mining | | | 100 | | | | 100 | |
| | | | | | | | | | | | |
| | | | | | | Effective
interest | |
Significant subsidiaries (a) | | Country of
incorporation | | Principal activity | | 2015
% | | | 2014
% | |
BHP Billiton Petroleum (Americas) Inc. | | US | | Hydrocarbons exploration and production | | | 100 | | | | 100 | |
BHP Billiton Petroleum (Arkansas) Inc. | | US | | Hydrocarbons production | | | 100 | | | | 100 | |
BHP Billiton Petroleum (Australia) Pty Ltd | | Australia | | Hydrocarbons production | | | 100 | | | | 100 | |
BHP Billiton Petroleum (Bass Strait) Pty Ltd | | Australia | | Hydrocarbons production | | | 100 | | | | 100 | |
BHP Billiton Petroleum (Deepwater) Inc. | | US | | Hydrocarbons exploration, development and production | | | 100 | | | | 100 | |
BHP Billiton Petroleum (Eagle Ford Gathering) LLC | | US | | Hydrocarbons exploration and production | | | 75 | | | | 75 | |
BHP Billiton Petroleum (Fayetteville) LLC | | US | | Hydrocarbons exploration and production | | | 100 | | | | 100 | |
BHP Billiton Petroleum (International Exploration) Pty Ltd | | Australia | | Hydrocarbons development and production | | | 100 | | | | 100 | |
BHP Billiton Petroleum (KCS Resources) LLC | | US | | Hydrocarbons exploration and production | | | 100 | | | | 100 | |
BHP Billiton Petroleum (New Ventures) Corporation | | Canada | | Hydrocarbons exploration and production | | | 100 | | | | 100 | |
BHP Billiton Petroleum (North West Shelf) Pty Ltd | | Australia | | Hydrocarbons production | | | 100 | | | | 100 | |
BHP Billiton Petroleum (Sabah) Corporation | | Canada | | Hydrocarbons exploration and production | | | 100 | | | | 100 | |
BHP Billiton Petroleum (Tx Gathering) LLC | | US | | Hydrocarbons exploration and production | | | 100 | | | | 100 | |
BHP Billiton Petroleum (Victoria) Pty Ltd | | Australia | | Hydrocarbons development | | | 100 | | | | 100 | |
BHP Billiton Petroleum Great Britain Limited | | UK | | Hydrocarbons production | | | 100 | | | | 100 | |
BHP Billiton Petroleum Properties (N.A.) LP | | US | | Hydrocarbons exploration and production | | | 100 | | | | 100 | |
BHP Billiton Petroleum Pty Ltd | | Australia | | Hydrocarbons exploration and production | | | 100 | | | | 100 | |
BHP Billiton Shared Services Malaysia Sdn Bhd | | Malaysia | | Service company | | | 100 | | | | 100 | |
BHP Billiton SSM Development Pty Ltd | | Australia | | Holding company | | | 100 | | | | 100 | |
BHP Billiton (Trinidad-2C) Ltd | | Canada | | Hydrocarbons development | | | 100 | | | | 100 | |
BHP Chile Inc. | | US | | Service company | | | 100 | | | | 100 | |
BHP Coal Pty Ltd | | Australia | | Holding company and coal mining | | | 100 | | | | 100 | |
BHP Copper Inc. | | US | | Copper mining, development and reclamation | | | 100 | | | | 100 | |
BHP Escondida Inc. | | US | | Holding company | | | 100 | | | | 100 | |
BHP Iron Ore (Jimblebar) Pty Ltd(c) | | Australia | | Iron ore mining | | | 85 | | | | 85 | |
BHP Navajo Coal Company(d) | | US | | Coal mining | | | – | | | | – | |
BHP Petroleum (Pakistan) Pty Ltd | | Australia | | Hydrocarbons production | | | 100 | | | | 100 | |
BHP Queensland Coal Investments Pty Ltd | | Australia | | Holding company and coal mining | | | 100 | | | | 100 | |
Broken Hill Proprietary (USA) Inc. | | US | | Service company | | | 100 | | | | 100 | |
Compania Minera Cerro Colorado Limitada | | Chile | | Copper mining | | | 100 | | | | 100 | |
Hunter Valley Energy Coal Pty Ltd | | Australia | | Coal mining | | | 100 | | | | 100 | |
Minera Escondida Limitada (e) | | Chile | | Copper mining | | | 57.5 | | | | 57.5 | |
Minera Spence SA | | Chile | | Copper mining | | | 100 | | | | 100 | |
Petrohawk Energy Corporation | | US | | Hydrocarbons exploration and production | | | 100 | | | | 100 | |
PT Lahai Coal | | Indonesia | | Coal exploration | | | 75 | | | | 75 | |
Rio Algom Limited | | Canada | | Holding Company | | | 100 | | | | 100 | |
San Juan Coal Company | | US | | Coal mining | | | 100 | | | | 100 | |
UMAL Consolidated Pty Ltd | | Australia | | Holding company and coal mining | | | 100 | | | | 100 | |
WMC Finance (USA) Limited | | Australia | | Finance | | | 100 | | | | 100 | |
| (a) | For a complete list of the Group’s subsidiaries refer to Exhibit 8 List of Subsidiaries. |
| (b) | BHP Billiton Finance (USA) Ltd is 100 per cent owned by BHP Billiton Limited. BHP Billiton Limited and BHP Billiton Plc have each fully and unconditionally guaranteed BHP Billiton Finance (USA) Ltd’s debt securities. |
| (c) | The Group has an effective interest of 92.5 per cent in BHP Iron Ore (Jimblebar) Pty Ltd, however by virtue of the shareholder agreement with ITOCHU Minerals & Energy of Australia Pty Ltd and Mitsui & Co. Iron Ore Exploration & Mining Pty Ltd, our interest in the Jimblebar mining operation is 85 per cent which is consistent with the other respective contractual arrangements at Western Australia Iron Ore. |
| (d) | The Group divested its 100 per cent effective interest in BHP Navajo Coal Company in October 2013 but will remain as the manager and operator of Navajo Mine through to 2016. As BHP Billiton will retain control of the mine until full consideration is received from the buyer, the financial results of the Navajo mine will continue to be consolidated by the Group. |
| (e) | As the Group has the ability to direct the relevant activities at Minera Escondida Limitada, it has control over the entity. The assessment of the most relevant activity in this contractual arrangement is subject to judgement. The Group establishes the mine plan and the operating budget and has the ability to appoint the key management personnel, demonstrating that the Group has the existing rights to direct the relevant activities of Minera Escondida Limitada. |
Refer to note 43 ‘Significant accounting policies’ (c).
31. Investments accounted for using the equity method
The Group’s interests in equity accounted investments with the most significant contribution to the Group’s net profit or net assets are listed below:
| | | | | | | | | | | | | | | | | | |
Shareholdings in
associates and joint
ventures(a) (b) | | Country of
incorporation /
principal place
of business | | Associate or joint venture | | Principal activity | | Reporting
date(c) | | | Ownership
interest(c) | |
| | | | | | 2015
% | | | 2014
% | |
Caesar Oil Pipeline Company LLC (Caesar) (d) | | US | | Associate | | Hydrocarbons transportation | | | 31 May | | | | 25 | | | | 25 | |
Cleopatra Gas Gathering Company LLC (Cleopatra) (d) | | US | | Associate | | Hydrocarbons transportation | | | 31 May | | | | 22 | | | | 22 | |
Compañía Minera Antamina SA (Antamina)(d) | | Peru | | Associate | | Copper and zinc mining | | | 31 December | | | | 33.75 | | | | 33.75 | |
Samarco Mineração SA (Samarco) | | Brazil | | Joint venture | | Iron ore mining | | | 31 December | | | | 50 | | | | 50 | |
Carbones del Cerrejón LLC (Cerrejón)(d) | | Anguilla/ Colombia | | Associate | | Coal mining in Colombia | | | 31 December | | | | 33.33 | | | | 33.33 | |
NCIG Holdings Pty Ltd(d) | | Australia | | Associate | | Coal export terminal | | | 30 June | | | | 35.5 | | | | 35.5 | |
| (a) | For a complete list of the Group’s interests in equity accounted investments refer to Exhibit 8 List of Subsidiaries. |
| (b) | The Group is restricted in its ability to make dividend payments from its investments in associates and joint ventures as any such payments require the approval of all investors in the associates and joint ventures. |
| (c) | The ownership interest at the Group’s and the associates’ or joint ventures’ reporting dates are the same. When the annual financial reporting date is different to the Group’s, financial information is obtained as at 30 June in order to report on an annual basis consistent with the Group’s reporting date. |
| (d) | Voting in relation to relevant activities, determined to be the approval of the operating and capital budgets, does not require unanimous consent of all participants to the arrangement, therefore joint control does not exist. Instead, because the Group has the power to participate in the financial and operating policies of the investee, these investments are accounted for as associates. |
| | | | | | | | | | | | |
Year ended 30 June 2015 US$M | | Investment in
associates | | | Investment in joint
ventures | | | Total equity accounted
investments | |
At the beginning of the financial year | | | 2,595 | | | | 1,069 | | | | 3,664 | |
Share of operating profit of equity accounted investments (a) | | | 179 | | | | 345 | | | | 524 | |
Investment in equity accounted investments (b) | | | 71 | | | | 3,357 | | | | 3,428 | |
Dividends received from equity accounted investments (c) | | | (327 | ) | | | (738 | ) | | | (1,065 | ) |
Impairments(d) | | | – | | | | (1,358 | ) | | | (1,358 | ) |
Divestment and demerger of equity accounted investments(e) | | | (12 | ) | | | (1,631 | ) | | | (1,643 | ) |
Other (f) | | | 162 | | | | – | | | | 162 | |
| | | | | | | | | | | | |
At the end of the financial year | | | 2,668 | | | | 1,044 | | | | 3,712 | |
| | | | | | | | | | | | |
| | | | | | | | | | | | |
Year ended 30 June 2014 US$M | | Investment in
associates | | | Investment in joint
ventures | | | Total equity accounted
investments | |
At the beginning of the financial year | | | 2,631 | | | | 1,044 | | | | 3,675 | |
Share of operating profit of equity accounted investments(a) | | | 588 | | | | 607 | | | | 1,195 | |
Investment in equity accounted investments | | | 44 | | | | – | | | | 44 | |
Dividends received from equity accounted investments (c) | | | (669 | ) | | | (581 | ) | | | (1,250 | ) |
Other | | | 1 | | | | (1 | ) | | | – | |
| | | | | | | | | | | | |
At the end of the financial year | | | 2,595 | | | | 1,069 | | | | 3,664 | |
| | | | | | | | | | | | |
| (a) | Includes share of operating losses of equity accounted investments from Discontinued operations of US$24 million (2014: operating profit of US$10 million; 2013 US$ nil). Refer to note 29 ‘Discontinued operations’. |
| (b) | Investment in joint ventures mainly relates to initial recognition at fair value of the Manganese business as an equity accounted investment upon loss of control. Refer to note 29 ‘Discontinued operations’. |
| (c) | Includes dividends received from equity accounted investments from Discontinued operations of US$342 million (2014: US$ nil). |
| (d) | Relates to impairment of the Manganese business upon classification of South32 as held for distribution. Refer to note 29 ‘Discontinued operations’. |
| (e) | Includes divestment of South32 assets as part of the South32 demerger. Refer to note 29 ‘Discontinued operations’. |
| (f) | Related to the reclassification of an investment which was previously accounted as an available for sale investment. |
The following table summarises the financial information relating to each of the Group’s significant equity accounted investments:
| | | | | | | | | | | | | | | | | | | | | | | | |
| | | Associates | | | Joint ventures | | | Total | |
2015 US$M | | Antamina | | | Cerrejón | | | Individually
immaterial | | | Samarco | | | Individually
immaterial | | |
Current assets | | | 958 | | | | 907 | | | | | | | | 1,256 | (a) | | | | | | | | |
Non-current assets | | | 4,245 | | | | 2,933 | | | | | | | | 6,102 | | | | | | | | | |
Current liabilities | | | (278 | ) | | | (192 | ) | | | | | | | (2,006 | ) (b) | | | | | | | | |
Non-current liabilities | | | (846 | ) | | | (1,082 | ) | | | | | | | (4,090 | ) (c) | | | | | | | | |
| | | | | | | | | | | | | | | | | | | | | | | | |
Net assets – 100% | | | 4,079 | | | | 2,566 | | | | | | | | 1,262 | | | | | | | | | |
| | | | | | | | | | | | | | | | | | | | | | | | |
Net assets – BHP Billiton share | | | 1,377 | | | | 855 | | | | | | | | 631 | | | | | | | | | |
Adjustments to net assets related to accounting policy adjustments | | | 2 | | | | 91 | | | | | | | | 413 | | | | | | | | | |
| | | | | | | | | | | | | | | | | | | | | | | | |
Carrying amount of investments accounted for using the equity method (e) | | | 1,379 | | | | 946 | | | | 343 | | | | 1,044 | | | | – | | | | 3,712 | |
| | | | | | | | | | | | | | | | | | | | | | | | |
Revenue – 100% | | | 2,530 | | | | 2,156 | | | | | | | | 2,810 | | | | | | | | | |
Profit/(loss) from operations – 100% | | | 765 | | | | (62 | ) | | | | | | | 1,283 | (d) | | | | | | | | |
| | | | | | | | | | | | | | | | | | | | | | | | |
Share of operating profit/(loss) of equity accounted investments(e) | | | 229 | | | | (20 | ) | | | (30 | ) | | | 371 | | | | (26 | ) | | | 524 | |
| | | | | | | | | | | | | | | | | | | | | | | | |
Comprehensive income – 100% | | | 765 | | | | (62 | ) | | | | | | | 1,283 | | | | | | | | | |
| | | | | | | | | | | | | | | | | | | | | | | | |
Share of comprehensive income/(loss) – BHP Billiton share in equity accounted investments | | | 229 | | | | (20 | ) | | | (30 | ) | | | 371 | | | | (26 | ) | | | 524 | |
| | | | | | | | | | | | | | | | | | | | | | | | |
Dividends received from equity accounted investments | | | 191 | | | | 99 | | | | 37 | | | | 396 | | | | 342 | | | | 1,065 | |
| | | | | | | | | | | | | | | | | | | | | | | | |
| | | | | | | | | | | | | | | | | | | | | | | | |
| | | Associates | | | Joint ventures | | | | |
2014 US$M | | Antamina | | | Cerrejón | | | Individually
immaterial | | | Samarco | | | Individually
immaterial | | | Total | |
Current assets | | | 953 | | | | 1,030 | | | | | | | | 1,216 | (a) | | | | | | | | |
Non-current assets | | | 4,060 | | | | 2,992 | | | | | | | | 5,937 | | | | | | | | | |
Current liabilities | | | (465 | ) | | | (268 | ) | | | | | | | (1,637 | ) (b) | | | | | | | | |
Non-current liabilities | | | (668 | ) | | | (812 | ) | | | | | | | (4,310 | ) (c) | | | | | | | | |
| | | | | | | | | | | | | | | | | | | | | | | | |
Net assets – 100% | | | 3,880 | | | | 2,942 | | | | | | | | 1,206 | | | | | | | | | |
| | | | | | | | | | | | | | | | | | | | | | | | |
Net assets – BHP Billiton share | | | 1,309 | | | | 981 | | | | | | | | 603 | | | | | | | | | |
Adjustments to net assets related to accounting policy adjustments | | | 32 | | | | 84 | | | | | | | | 466 | | | | | | | | | |
| | | | | | | | | | | | | | | | | | | | | | | | |
Carrying amount of investments accounted for using the equity method | | | 1,341 | | | | 1,065 | | | | 189 | | | | 1,069 | | | | – | | | | 3,664 | |
| | | | | | | | | | | | | | | | | | | | | | | | |
Revenue – 100% | | | 3,736 | | | | 2,444 | | | | | | | | 3,269 | | | | | | | | | |
Profit from operations – 100% | | | 1,414 | | | | 373 | | | | | | | | 1,337 | (d) | | | | | | | | |
| | | | | | | | | | | | | | | | | | | | | | | | |
Share of operating profit/(loss) of equity accounted investments(e) | | | 476 | | | | 115 | | | | (3 | ) | | | 607 | | | | – | | | | 1,195 | |
| | | | | | | | | | | | | | | | | | | | | | | | |
Comprehensive income – 100% | | | 1,414 | | | | 373 | | | | | | | | 1,337 | | | | | | | | | |
| | | | | | | | | | | | | | | | | | | | | | | | |
Share of comprehensive income/(loss) – BHP Billiton share in equity accounted investments | | | 476 | | | | 115 | | | | (3 | ) | | | 607 | | | | – | | | | 1,195 | |
| | | | | | | | | | | | | | | | | | | | | | | | |
Dividends received from equity accounted investments | | | 446 | | | | 187 | | | | 36 | | | | 581 | | | | – | | | | 1,250 | |
| | | | | | | | | | | | | | | | | | | | | | | | |
| | | |
| | | Associates | | | Joint ventures | | | | |
2013 US$M | | Antamina | | | Cerrejón | | | Individually
immaterial | | | Samarco | | | Individually
immaterial | | | Total | |
Revenue – 100% | | | 3,836 | | | | 2,482 | | | | | | | | 3,219 | | | | | | | | | |
Profit after tax from Continuing operations – 100% | | | 1,490 | | | | 378 | | | | | | | | 1,365 | (d) | | | | | | | | |
| | | | | | | | | | | | | | | | | | | | | | | | |
Share of operating profit/(loss) of equity accounted investments(e) | | | 531 | | | | 117 | | | | (32 | ) | | | 513 | | | | 13 | | | | 1,142 | |
| | | | | | | | | | | | | | | | | | | | | | | | |
Comprehensive income – 100% | | | 1,490 | | | | 378 | | | | | | | | 1,365 | | | | | | | | | |
| | | | | | | | | | | | | | | | | | | | | | | | |
Share of comprehensive income/(loss) – BHP Billiton share in equity accounted investments | | | 531 | | | | 117 | | | | (32 | ) | | | 513 | | | | 13 | | | | 1,142 | |
| | | | | | | | | | | | | | | | | | | | | | | | |
Dividends received from equity accounted investments | | | 261 | | | | 69 | | | | 33 | | | | 345 | | | | 2 | | | | 710 | |
| | | | | | | | | | | | | | | | | | | | | | | | |
| (a) | Includes cash and cash equivalents of US$711 million (2014: US$571 million). |
| (b) | Includes current financial liabilities (excluding trade and other payables and provisions) of US$993 million (2014: US$369 million). |
| (c) | Includes non-current financial liabilities (excluding trade and other payables and provisions) of US$3,844 million (2014: US$3,961 million). |
| (d) | Includes depreciation and amortisation of US$236 million (2014: US$113 million; 2013: US$121 million), interest income of US$86 million (2014: US$6 million; 2013: US$3 million), interest expense of US$227 million (2014: US$181 million; 2013: US$54 million) and income tax expense of US$275 million (2014: US$207 million; 2013: US$317 million). |
| (e) | The unrecognised share of profit for the period was US$5 million (2014: loss of US$66 million; 2013: profit of US$52 million) which decreased the cumulative losses to US$194 million (2014: increase to US$199 million; 2013: decrease to US$133 million). |
| | | | | | | | |
| | | Group share | |
| | | 2015 | | | 2014 | |
| | | US$M | | | US$M | |
Share of commitments relating to joint ventures | | | 1,272 | | | | 2,024 | |
Share of contingent liabilities relating to joint ventures | | | 1,201 | | | | 1,547 | |
Refer to note 43 ‘Significant accounting policies’ (x) and (y).
32. Interests in joint operations
Significant joint operations of the Group, which are those with the most significant contributions to the Group’s net profit or net assets, are listed in the below table. Significant joint operations that were divested as part of the South32 demerger are listed in note 29 ‘Discontinued operations’.
| | | | | | | | | | | | |
| | | | | | | Effective interest | |
Significant joint
operations(a) | | Country of
operation | | Principal activity | | 2015
% | | | 2014
% | |
Bass Strait | | Australia | | Hydrocarbons production | | | 50 | | | | 50 | |
Greater Angostura | | Trinidad and Tobago | | Hydrocarbons production | | | 45 | | | | 45 | |
Eagle Ford(b) | | US | | Hydrocarbons exploration and production | | | 2 – 100 | | | | 2 – 100 | |
Fayetteville(b) | | US | | Hydrocarbons exploration and production | | | <0.1 – 100 | | | | <0.1 – 100 | |
Gulf of Mexico | | US | | Hydrocarbons exploration and production | | | 23.9 – 44 | | | | 23.9 – 44 | |
Haynesville(b) | | US | | Hydrocarbons exploration and production | | | <0.1 – 100 | | | | <0.1 – 100 | |
Macedon(b) | | Australia | | Hydrocarbons exploration and production | | | 71.43 | | | | 71.43 | |
Minerva(b) | | Australia | | Hydrocarbons exploration and production | | | 90 | | | | 90 | |
North West Shelf | | Australia | | Hydrocarbons production | | | 8.33 – 16.67 | | | | 8.33 – 16.67 | |
Permian(b) | | US | | Hydrocarbons exploration and production | | | 37.5 – 100 | | | | 37.5 – 100 | |
Pyrenees(b) | | Australia | | Hydrocarbons exploration and production | | | 40 – 71.43 | | | | 40 – 71.43 | |
ROD Integrated Development | | Algeria | | Hydrocarbons exploration and production | | | 38 – 45 | | | | 38 – 45 | |
Stybarrow | | Australia | | Hydrocarbons exploration and production | | | 50 | | | | 50 | |
Zamzama | | Pakistan | | Hydrocarbons exploration and production | | | 38.5 | | | | 38.5 | |
Mt Goldsworthy(c) | | Australia | | Iron ore mining | | | 85 | | | | 85 | |
Mt Newman(c) | | Australia | | Iron ore mining | | | 85 | | | | 85 | |
Yandi(c) | | Australia | | Iron ore mining | | | 85 | | | | 85 | |
Central Queensland Coal Associates | | Australia | | Coal mining | | | 50 | | | | 50 | |
Gregory | | Australia | | Coal mining | | | 50 | | | | 50 | |
| (a) | For a complete list of the Group’s investments in joint operations refer to section Exhibit 8 List of Subsidiaries. |
| (b) | While the Group holds a greater than 50 per cent interest in these joint operations, all the participants in these joint operations approve the operating and capital budgets and therefore the Group has joint control over the relevant activities of these arrangements. |
| (c) | These contractual arrangements are controlled by the Group and do not meet the definition of joint operations. However, as they are formed by contractual arrangement and are not entities, the Group recognises its share of assets, liabilities, revenue and expenses arising from these arrangements. |
| (d) | Assets held in joint operations subject to significant restrictions are as follows: |
| | | | | | | | |
| | | Group share | |
| | | 2015 | | | 2014 | |
| | | US$M | | | US$M | |
Current assets | | | 6,039 | | | | 6,112 | |
Non-current assets | | | 64,896 | | | | 77,341 | |
| | | | | | | | |
Total assets(i) | | | 70,935 | | | | 83,453 | |
| | | | | | | | |
| (i) | While the Group is unrestricted in its ability to sell a share of its interest in these joint operations, it does not have the right to sell individual assets which are used in these joint operations without the unanimous consent of the other participants. The assets in these joint operations are also restricted to the extent that they are only available to be used by the joint operation itself and not by other operations of the Group. |
Refer to note 43 ‘Significant accounting policies’ (x).
33. Related party transactions
Subsidiaries
The percentage of ordinary shares held in significant subsidiaries is disclosed in note 30 ‘Subsidiaries’.
Joint operations
The percentage interest held in significant joint operations is disclosed in note 32 ‘Interests in joint operations’.
Joint ventures
The percentage interest held in significant joint ventures is disclosed in note 31 ‘Investments accounted for using the equity method’.
Associates
The percentage interest held in significant associates is disclosed in note 31 ‘Investments accounted for using the equity method’.
Key management personnel
Disclosures relating to key management personnel are set out in note 24 ‘Key management personnel’.
Transactions with related parties(a)
| | | | | | | | | | | | | | | | | | | | | | | | |
| | | Joint operations(b) | | | Joint ventures | | | Associates | |
| | | 2015 | | | 2014 | | | 2015 | | | 2014 | | | 2015 | | | 2014 | |
| | | US$M | | | US$M | | | US$M | | | US$M | | | US$M | | | US$M | |
Sales of goods/services | | | 198.341 | | | | 252.911 | | | | – | | | | – | | | | 6.666 | | | | 3.781 | |
Purchases of goods/services | | | 33.745 | | | | 37.782 | | | | – | | | | – | | | | 936.868 | | | | 978.186 | |
Interest income | | | 1.340 | | | | 1.753 | | | | 2.192 | | | | 5.405 | | | | 53.458 | | | | 65.039 | |
Interest expense | | | 0.004 | | | | 0.003 | | | | – | | | | – | | | | 0.148 | | | | – | |
Dividends received | | | – | | | | – | | | | 738.384 | | | | 581.086 | | | | 326.529 | | | | 668.880 | |
| Net (repayments from)/loans made to related parties | | | (69.198 | ) | | | (6.183 | ) | | | (150.101 | ) | | | (0.115 | ) | | | (30.899 | ) | | | 121.173 | |
| (a) | Includes transactions with related parties of Discontinued operations up to the date of demerger. There were no other related party transactions in the year ended 30 June 2015 (2014: US$ nil), other than those with post-employment benefit plans for the benefit of Group employees. These are shown in note 27 ‘Pension and other post-retirement obligations’. |
| (b) | Disclosures in respect of transactions with joint operations represent the amount for which legal right of set-off does not exist. |
Transactions between each parent company and its subsidiaries, which are related parties of that company, are eliminated on consolidation and are not disclosed in this note.
Outstanding balances with related parties(a)
| | | | | | | | | | | | | | | | | | | | | | | | |
| | | Joint operations(b) | | | Joint ventures | | | Associates | |
| | | 2015 | | | 2014 | | | 2015 | | | 2014 | | | 2015 | | | 2014 | |
| | | US$M | | | US$M | | | US$M | | | US$M | | | US$M | | | US$M | |
Trade amounts owing to related parties | | | – | | | | 13.329 | | | | – | | | | – | | | | 193.775 | | | | 117.672 | |
Loan amounts owing to related parties | | | 103.431 | | | | 44.298 | | | | – | | | | – | | | | 32.097 | | | | 41.427 | |
| Trade amounts owing from related parties | | | – | | | | 17.385 | | | | – | | | | – | | | | – | | | | – | |
Loan amounts owing from related parties | | | 13.945 | | | | 75.413 | | | | – | | | | 150.101 | | | | 1,015.300 | | | | 1,087.890 | |
| (a) | There were no other related party balances as at 30 June 2015 (2014: US$ nil). |
| (b) | Disclosures in respect of amounts owing to/from joint operations represent the amount owing to the joint operation entity or from the joint operation third party participants for which legal right of set-off does not exist. |
Terms and conditions
Sales to and purchases from related parties of goods and services are made in arm’s length transactions at normal market prices and on normal commercial terms.
Outstanding balances at year-end are unsecured and settlement occurs in cash.
Loan amounts owing from related parties represent secured loans made to joint operations, associates and joint ventures under co-funding arrangements. Such loans are made on an arm’s length basis with interest charged at market rates and are due to be repaid between 15 September 2015 and 31 August 2031.
No guarantees are provided or received for any related party receivables or payables.
No provision for doubtful debts has been recognised in relation to any outstanding balances and no expense has been recognised in respect of bad or doubtful debts due from related parties.
Unrecognised items and uncertain events
34. Commitments
| | | | | | | | |
| | | 2015 | | | 2014 | |
| | | US$M | | | US$M | |
Capital expenditure commitments | | | 2,276 | | | | 4,798 | |
| | | | | | | | |
Lease expenditure commitments | | | | | | | | |
Finance leases(a) | | | | | | | | |
Due not later than one year | | | 138 | | | | 203 | |
Due later than one year and not later than two years | | | 64 | | | | 195 | |
Due later than two years and not later than three years | | | 58 | | | | 193 | |
Due later than three years and not later than four years | | | 52 | | | | 163 | |
Due later than four years and not later than five years | | | 48 | | | | 153 | |
Due later than five years | | | 166 | | | | 1,709 | |
| | | | | | | | |
Total commitments under finance leases | | | 526 | | | | 2,616 | |
Future financing charges | | | (57 | ) | | | (1,174 | ) |
Right to reimbursement from joint operations partner | | | (31 | ) | | | (58 | ) |
| | | | | | | | |
Finance lease liability | | | 438 | | | | 1,384 | |
| | | | | | | | |
Operating leases(b) | | | | | | | | |
Due not later than one year | | | 606 | | | | 833 | |
Due later than one year and not later than two years | | | 366 | | | | 560 | |
Due later than two years and not later than three years | | | 201 | | | | 433 | |
Due later than three years and not later than four years | | | 160 | | | | 227 | |
Due later than four years and not later than five years | | | 137 | | | | 202 | |
Due later than five years | | | 898 | | | | 1,272 | |
| | | | | | | | |
Total commitments under operating leases | | | 2,368 | | | | 3,527 | |
| | | | | | | | |
| (a) | Finance leases include leases of power generation and transmission assets. Lease payments are subject to inflation escalation clauses on which contingent rentals are determined. The leases contain extension and renewal options. |
| (b) | Operating leases include leases of property, plant and equipment. Rental payments are generally fixed, but with inflation escalation clauses on which contingent rentals are determined. Certain leases contain extension and renewal options. |
35. Contingent liabilities
Contingent liabilities at balance date, not otherwise provided for in the financial statements, are categorised as arising from:
| | | | | | | | |
| | | 2013 | | | 2012 | |
| | | US$M | | | US$M | |
Jointly controlled entities | | | | | | | | |
Bank guarantees(a) | | | 1 | | | | 1 | |
Actual or potential litigation(b) | | | 1,394 | | | | 1,260 | |
Other | | | 20 | | | | 8 | |
| | | | | | | | |
Total jointly controlled entities | | | 1,415 | | | | 1,269 | |
| | | | | | | | |
Subsidiaries and jointly controlled assets (including guarantees) | | | | | | | | |
Bank guarantees(a) | | | 8 | | | | 30 | |
Actual or potential litigation(b) | | | 1,306 | | | | 836 | |
Other | | | 36 | | | | 3 | |
| | | | | | | | |
Total subsidiaries and jointly controlled assets (including guarantees) | | | 1,350 | | | | 869 | |
| | | | | | | | |
Total contingent liabilities | | | 2,765 | | | | 2,138 | |
| | | | | | | | |
| | | | | | | | |
| | | 2015 | | | 2014 | |
| | | US$M | | | US$M | |
Associates and joint ventures | | | | | | | | |
Tax and other matters(a) | | | 1,313 | | | | 1,662 | |
| | | | | | | | |
Total associates and joint ventures | | | 1,313 | | | | 1,662 | |
| | | | | | | | |
Subsidiaries and joint operations | | | | | | | | |
Bank guarantees(b) | | | 3 | | | | 23 | |
Tax and other matters(a) | | | 1,947 | | | | 1,691 | |
| | | | | | | | |
Total subsidiaries and joint operations | | | 1,950 | | | | 1,714 | |
| | | | | | | | |
Total contingent liabilities | | | 3,263 | | | | 3,376 | |
| | | | | | | | |
| (a) | The Group has entered into various counter-indemnities of bankTax and performance guarantees related to its own future performance in the normal course of business. |
(b) | Actualother matters include actual or potential litigation and tax-related amounts, relatepredominantly relating to a number of actions against the Group, none of which are individually significant and where the liability is not probable and therefore the Group has not provided for such amounts in these financial statements. Additionally, there are a number of legal claims or potential claims against the Group, the outcome of which cannot be foreseen at present, and for which no amounts have been included in the table above. |
In addition
| (b) | The Group has entered into various counter-indemnities of bank and performance guarantees related to its own future performance in the normal course of business. |
The Separation Deed between BHP Billiton Limited and BHP Billiton Plc and South32 Limited (South32) deals with certain commercial, transitional and legal issues arising from the separation of South32 from the Group. A key part of the Separation Deed is the agreement between the parties in relation to the ‘Demerger Principle’. The fundamental underlying principle of the demerger is that:
| (i) | South32 has the entire economic benefit, commercial risk and liabilities of the South32 Businesses (and former South32 Businesses) as if South32 and not the Group had owned those Businesses at all times; and |
| (ii) | the Group has the entire economic benefit, commercial risk and liabilities of the BHP Billiton Businesses (including the entire risk in former BHP Billiton Businesses), as if the Group and not South32 had owned those Businesses at all times. |
To give effect to the principle, subject to certain exceptions, BHP Billiton Limited indemnifies South32 against all claims and liabilities relating to the BHP Billiton Businesses and former BHP Billiton Businesses and South32 indemnifies the Group against all claims and liabilities relating to the South32 Businesses and former South32 Businesses. The Separation Deed also contains specific indemnities with respect to certain matters. No amounts reported above, following requestshave been claimed or provided for information in August 2009 fromas at 30 June 2015 pursuant to the Separation Deed.
In May 2015, the Group announced the resolution of the previously disclosed investigation by the US Securities and Exchange Commission (SEC), into potential breaches of the Group commenced an internal investigation and disclosed to relevant authorities including theUS Foreign Corrupt Practices Act (FCPA). The US Department of Justice (DOJ) evidence that it has uncovered regarding possible violations of applicable anti-corruption laws involving interactions with government officials.
As has been publicly reported, the Australian Federal Police has indicated that it has commenced an investigation. The Group is fully cooperating with the relevant authorities as it has since the US investigations commenced.
As part of the US process, the SEC and DOJ notified the Group in August 2013 of the issues they consider could form the basis of enforcement actions and discussions are continuing.also completed its investigation into BHP Billiton without taking any action.
The issues relateinvestigations related primarily to matters in connection with previously terminated minerals exploration and development efforts, as well as hospitality provided as part of the Company’s sponsorship ofby BHP Billiton at the 2008 Beijing Olympics.Olympic Games. The US investigations have now been concluded on all matters.
The matter was resolved with the SEC pursuant to an administrative order, which imposed a US$25 million civil penalty. The SEC order made no findings of corrupt intent or bribery by BHP Billiton.
As previously disclosed, an investigation by the Australian Federal Police (AFP) is ongoing and the Group continues to cooperate. In light of the continuing nature of the investigationsAFP investigation, it is not appropriate at this stage for BHP Billiton to predict outcomes, and therefore no amount has been included in the contingent liabilities above.outcomes.
22 Commitments36. Subsequent events
Other than the matters outlined elsewhere in this report, no matters or circumstances have arisen since the end of the financial year that have significantly affected, or may significantly affect, the operations, results of operations or state of affairs of the Group in subsequent accounting periods.
| | | | | | | | |
| | | 2013 | | | 2012 | |
| | | US$M | | | US$M | |
Capital expenditure commitments | | | 5,147 | | | | 10,364 | |
| | | | | | | | |
Lease expenditure commitments | | | | | | | | |
Finance leases | | | | | | | | |
Due not later than one year | | | 94 | | | | 113 | |
Due later than one year and not later than two years | | | 56 | | | | 64 | |
Due later than two years and not later than three years | | | 50 | | | | 65 | |
Due later than three years and not later than four years | | | 47 | | | | 49 | |
Due later than four years and not later than five years | | | 19 | | | | 76 | |
Due later than five years | | | 36 | | | | 32 | |
| | | | | | | | |
Total commitments under finance leases | | | 302 | | | | 399 | |
Future financing charges | | | (57 | ) | | | (76 | ) |
Right to reimbursement from joint venture partner | | | (73 | ) | | | (86 | ) |
| | | | | | | | |
Finance lease liability | | | 172 | | | | 237 | |
| | | | | | | | |
Operating leases (a) | | | | | | | | |
Due not later than one year | | | 970 | | | | 925 | |
Due later than one year and not later than two years | | | 775 | | | | 700 | |
Due later than two years and not later than three years | | | 565 | | | | 516 | |
Due later than three years and not later than four years | | | 409 | | | | 347 | |
Due later than four years and not later than five years | | | 216 | | | | 275 | |
Due later than five years | | | 1,563 | | | | 1,126 | |
| | | | | | | | |
Total commitments under operating leases | | | 4,498 | | | | 3,889 | |
| | | | | | | | |
(a) | Operating leases are entered into as a means of acquiring property, plant and equipment. Rental payments are generally fixed, but with inflation escalation clauses on which contingent rentals are determined. Certain leases contain extension and renewal options. |
23Other items
37. Notes to the consolidated cash flow statement
Cash and cash equivalents
For the purpose of the consolidated cash flow statement, cash equivalents include highly liquid investments that are readily convertible to cash and with a maturity of less than 90 days, bank overdrafts and interest bearing liabilities at call.
| | | | | | | | | | | | |
| | | 2013 | | | 2012 | | | 2011 | |
| | | US$M | | | US$M | | | US$M | |
Cash and cash equivalents comprise: | | | | | | | | | | | | |
Cash | | | 2,906 | | | | 1,521 | | | | 1,361 | |
Short-term deposits | | | 3,154 | | | | 3,260 | | | | 8,723 | |
| | | | | | | | | | | | |
Total cash and cash equivalents(a) | | | 6,060 | | | | 4,781 | | | | 10,084 | |
Bank overdrafts and short-term borrowings – refer to note 16 Interest bearing liabilities | | | (10 | ) | | | (20 | ) | | | (4 | ) |
Transferred to assets held for sale – refer to note 25 Assets and liabilities held for sale | | | – | | | | 120 | | | | – | |
| | | | | | | | | | | | |
Total cash and cash equivalents, net of overdrafts | | | 6,050 | | | | 4,881 | | | | 10,080 | |
| | | | | | | | | | | | |
(a) | Cash and cash equivalents include US$690 million (2012: US$327 million; 2011: US$317 million) which is restricted by legal or contractual arrangements. |
Significant non-cash investing and financing transactions
Property, plant and equipment of US$1710 million (2012:(2014: US$29501 million; 2011:2013: US$2 million) nil) was acquired under finance leases.
Property, plant and equipment of US$49 million (2012: nil (2014: US$ nil; 2011:2013: US$ nil)49 million) was acquired under vendor financing arrangements.
Divestment of subsidiaries, operations, joint operations and operationsequity accounted investments
TheExcluding those divested as part of the South32 demerger (refer to note 29 ‘Discontinued operations’), the Group disposed of the following subsidiaries, operations, joint operations and operationsequity accounted investments during the year ended:
30 June 2015
North Louisiana conventional onshore assets
Pecos field
30 June 2014
Pinto Valley and San Manuel Arizona Railroad Company
Liverpool Bay
South Midland (Onshore US – Midland Basin)
Kelar SA
30 June 2013
Richards Bay Minerals
EKATI
30 June 2012
Gulf of Mexico assets – West Cameron, Starlifter and Mustang
30 June 2011
There were no divestments of subsidiaries or operations.
Details of the divestment of subsidiaries, operations, joint operations and operationsequity accounted investments are as follows:
| | | | 2013 | | 2012 | | 2011 | | | 2015 | | 2014 | | 2013 | |
| | | US$M | | US$M | | US$M | | | US$M | | US$M | | US$M | |
Assets | | | | | | | | | | | | |
Cash and cash equivalents | | | 51 | | | | – | | | | – | | | | – | | | | – | | | 51 | |
Trade and other receivables | | | 196 | | | | – | | | | – | | | | 2 | | | 2 | | | 1 | |
Other financial assets | | | | – | | | 2 | | | | – | |
Inventories | | | 345 | | | | – | | | | – | | | | 15 | | | 74 | | | 209 | |
Property, plant and equipment | | | 1,049 | | | | 1 | | | | – | | | | 261 | | | 452 | | | 668 | |
Intangible assets | | | 21 | | | | – | | | | – | | | | – | | | 23 | | | | – | |
Deferred tax assets | | | 77 | | | | – | | | | – | | | | – | | | 3 | | | 77 | |
| | | | | | | | | | | | | | | | | | |
Total assets | | | 1,739 | | | | 1 | | | | – | | | | 278 | | | 556 | | | 1,006 | |
| | | | | | | | | | | | | | | | | | |
Liabilities | | | | | | | | | | | | |
Trade and other payables | | | (147 | ) | | | – | | | | – | | | | – | | | (62 | ) | | (10 | ) |
Interest bearing liabilities | | | (86 | ) | | | – | | | | – | | |
Current tax payable | | | (17 | ) | | | – | | | | – | | | | – | | | (2 | ) | | (3 | ) |
Provisions | | | (340 | ) | | | (14 | ) | | | – | | | | (37 | ) | | (320 | ) | | (302 | ) |
Deferred tax liabilities | | | (206 | ) | | | – | | | | – | | | | – | | | | – | | | (138 | ) |
Deferred income | | | | – | | | (27 | ) | | | – | |
| | | | | | | | | | | | | | | | | | |
Total liabilities | | | (796 | ) | | | (14 | ) | | | – | | | | (37 | ) | | (411 | ) | | (453 | ) |
| | | | | | | | | | | | | | | | | | |
Net assets/(liabilities) disposed(a) | | | 943 | | | | (13 | ) | | | – | | |
Net assets disposed | | | | 241 | | | 145 | | | 553 | |
| | | | | | | | | | | | | | | | | | |
Less non-controlling interest share of net assets disposed | | | (63 | ) | | | – | | | | – | | | | – | | | | – | | | | – | |
| | | | | | | | | | | | | | | | | | |
BHP Billiton share of net assets/(liabilities) disposed | | | 880 | | | | (13 | ) | | | – | | |
BHP Billiton share of net assets disposed | | | | 241 | | | 145 | | | 553 | |
| | | | | | | | | | | | | | | | | | |
Gross cash consideration | | | 2,253 | | | | 6 | | | | – | | | | 256 | | | 812 | | | 2,253 | |
Less cash and cash equivalents disposed | | | (51 | ) | | | – | | | | – | | | | – | | | | – | | | (51 | ) |
| | | | | | | | | | | | | | | | | | |
Net cash consideration received | | | 2,202 | | | | 6 | | | | – | | | | 256 | | | 812 | | | 2,202 | |
| | | | | | | | | | | | | | | | | | |
Gains on sale of subsidiaries and operations | | | 1,373 | | | | 19 | | | | – | | |
Less repayment of intercompany loan(a) | | | | – | | | | – | | | (488 | ) |
Add deferred consideration | | | | – | | | 6 | | | | – | |
| | | | | | | | | | | | | | | | | | |
Gains on sale of subsidiaries, operations, joint operations and equity accounted investments | | | | 15 | | | 673 | | | 1,212 | |
| | | | | | | | | | |
| (a) | Net assets disposed in the year ended 30 June 2013 included the following assets and liabilities that were classified as held for sale at 30 June 2012: trade and other receivablesRepayment of US$195 million, inventories of US$136 million, property, plant and equipment of US$381 million, intangible assets of US$21 million, trade and other payables of US$137 million, interest bearing liabilities of US$86 million, current tax payable of US$16 million, provisions of US$38 million and deferred tax liabilities of US$66 million.intercompany financing facilities which became external upon transition to IFRS 11 ‘Joint Arrangements’. |
AcquisitionSale of non-controlling interest in subsidiary
30 June 2015
There were no sales of interests in subsidiaries and operationsto non-controlling interests.
In addition to the business combinations described in note 24 Business combinations,30 June 2014
On 20 June 2013, the Group acquiredannounced an extension of its long-term WAIO contractual arrangement with ITOCHU Corporation (ITOCHU) and Mitsui & Co., Ltd. (Mitsui). The transaction was completed on 10 July 2013 and aligned interests across the following subsidiariesWAIO supply chain. Under the terms of the agreement, ITOCHU and operations duringMitsui purchased shares in BHP Iron Ore (Jimblebar) Pty Ltd providing them with an eight per cent and seven
per cent non-controlling interest (NCI), respectively, in the year ended:Jimblebar mining hub and resource. The equity proceeds of US$1,337 million are included in the ‘Contributions from non-controlling interests’ item of the Consolidated Cash Flow Statement. The difference of US$971 million between the equity proceeds and the initial measurement of NCI of US$366 million is included in the NCI contribution reserve.
30 June 2013
There were no acquisitionssales of interests in subsidiaries or operations.
30 June 2012
CEU Hawkville LLC
30 June 2011
There were no acquisitions of subsidiaries or operations.
Details of the acquisitions of subsidiaries and operations, excluding those acquired through business combinations – refer note 24 Business combinations, are as follows:
| | | | | | | | | | | | |
| | | 2013 | | | 2012 | | | 2011 | |
| | | US$M | | | US$M | | | US$M | |
Assets | | | | | | | | | | | | |
Trade and other receivables | | | – | | | | 3 | | | | – | |
Other current assets | | | – | | | | 3 | | | | – | |
Property, plant and equipment | | | – | | | | 89 | | | | – | |
| | | | | | | | | | | | |
Assets acquired | | | – | | | | 95 | | | | – | |
| | | | | | | | | | | | |
Cash consideration paid | | | – | | | | 95 | | | | – | |
| | | | | | | | | | | | |
24 Business combinations
Major business combinations completed during the year ended 30 June 2013
There were no major business combinations.
Major business combinations completed during the year ended 30 June 2012
Petrohawk Energy Corporation
On 14 July 2011, the Group announced it had entered into a definitive agreement to acquire Petrohawk Energy Corporation Inc. (Petrohawk) by means of an all-cash tender offer for all of the issued and outstanding shares of Petrohawk. The acquisition date of Petrohawk was 20 August 2011.
Petrohawk is an oil and natural gas company based in the United States. It owns a number of shale gas assets in Texas and Louisiana and associated midstream pipeline systems. This acquisition provides the Group with operated positions in the resource areas of the Eagle Ford shale, Haynesville shale and the Permian Basin.
Petrohawk was purchased for total consideration of US$12,005 million consisting of US$11,690 million for existing shares and US$315 million for settlement of outstanding options, restricted stock and stock appreciation rights (collectively referred to as employee awards). The vesting of the employee awards was accelerated at the acquisition date pursuant to a change of control clause in the original employee award plans. As a result, all of the consideration for settlement of such awards was included in purchase consideration. The terms of the acquisition agreement did not include any contingent consideration. The consideration paid was in excess of the fair value of the identifiable assets and liabilities and therefore goodwill of US$3,591 million has been recognised in respect of the acquisition. The goodwill is attributable to the expected synergies to be realised through managing the portfolio of both the acquired assets and the Group’s existing assets, and to the measurement of deferred income taxes based on nominal amounts rather than fair value.
Acquisition related costs of US$46 million have been expensed and included in other operating expenses in the Consolidated Income Statement.
HWE Mining
On 30 September 2011, the Group finalised the purchase of the HWE mining services business (HWE Mining), comprising three entities and other property, plant and equipment, which provide contract mining services to the
Group’s Western Australia Iron Ore (WAIO) joint ventures, from Leighton Holdings Limited (Leighton Holdings). The acquisition was funded by the Group’s available cash and control was obtained through the purchase of all the issued share capital of the acquired entities.
The acquisition relates to the mining equipment and related assets that serviced the Area C, Yandi and Orebody 23/25 operations and is consistent with the Group’s previously stated intention to move the WAIO business from contract mining to owner-operator mining.
Acquisition related costs of US$17 million have been expensed and included in other operating expenses in the Consolidated Income Statement.
The consideration paid was in excess of the fair value of the identifiable assets and liabilities and therefore goodwill of US$187 million has been recognised in respect of the acquisition. The goodwill is attributable to the skilled workforce and the expected synergies to result from an in-house mining workforce, improved safety and the management of costs.non-controlling interests.
25 Assets38. Auditor’s remuneration
| | | | | | | | | | | | |
| | | 2015 | | | 2014 | | | 2013 | |
| | | US$M | | | US$M | | | US$M | |
Fees payable to the Group’s auditor for assurance services | | | | | | | | | | | | |
Audit of the Group’s annual report(a) | | | 4.299 | | | | 4.093 | | | | 3.953 | |
Audit of subsidiaries, joint ventures and associates(b) | | | 11.185 | | | | 13.201 | | | | 15.197 | |
Audit-related assurance services(c) | | | 5.377 | | | | 5.635 | | | | 5.779 | |
Other assurance services (d) | | | 1.557 | | | | 2.133 | | | | 3.844 | |
| | | | | | | | | | | | |
Total assurance services | | | 22.418 | | | | 25.062 | | | | 28.773 | |
| | | | | | | | | | | | |
Fees payable to the Group’s auditor for other services | | | | | | | | | | | | |
Other services relating to corporate finance(e) | | | 6.871 | | | | 1.820 | | | | 0.393 | |
All other services(f) | | | 1.093 | | | | 1.573 | | | | 1.372 | |
| | | | | | | | | | | | |
Total other services | | | 7.964 | | | | 3.393 | | | | 1.765 | |
| | | | | | | | | | | | |
Total fees | | | 30.382 | | | | 28.455 | | | | 30.538 | |
| | | | | | | | | | | | |
All amounts were paid to KPMG or KPMG affiliated firms. Fees are determined in local currencies and liabilities held for sale
The Group classifiedare predominantly billed in US dollars based on the following subsidiaries and operations as held for sale duringexchange rate at the year ended:
30 June 2013
Pinto Valley
On 29 April 2013, the Group announced it had signed a definitive agreement to sell its Pinto Valley mining operation (Pinto Valley) and the associated San Manuel Arizona Railroad Company (SMARRCO) to Capstone Mining Corp. (Capstone) for an aggregate cash consideration of US$650 million. The transaction is subject to regulatory approval, and other customary conditions, and is expected to be completed in the second halfbeginning of the 2013 calendarrelevant financial year.
Diamonds business
On 13 November 2012, the Group announced the sale of its diamonds business, comprising its interests in the EKATI Diamond Mine and Diamond Marketing operations to Dominion Diamond Corporation (formerly Harry Winston Diamond Corporation). The sale completed on 10 April 2013 for a total amount paid of US$553 million, comprising of a purchase price of US$500 million plus purchase price adjustments of US$53 million.
East and West Browse Joint Ventures
On 12 December 2012, the Group signed a definitive agreement to sell its 8.33 per cent interest in the East Browse Joint Venture and 20 per cent interest in the West Browse Joint Venture to PetroChina International Investment (Australia) Pty Ltd. The sale completed on 7 June 2013 for a total cash consideration of US$1.70 billion, comprising of a purchase price of US$1.63 billion and purchase price adjustments of US$0.07 billion.
30 June 2012
Richards Bay Minerals
On 1 February 2012, the Group announced it had exercised an option to sell its 37.76 per cent non-operated effective interest in Richards Bay Minerals, South Africa, and would exit the titanium business. On 7 September 2012, the Group announced it had completed the sale to Rio Tinto. Pursuant to the prescribed valuation process, the Group has sold its entire interest for cash proceeds of US$1.7 billion.
30 June 2011
There were no assets or liabilities classified as held for sale.
The remaining assets and liabilities classified as current assets and liabilities held for sale are presented in the table below:
| | | | | | | | | | | | |
| | | 2013 | | | 2012 | | | 2011 | |
| | | US$M | | | US$M | | | US$M | |
Assets | | | | | | | | | | | | |
Cash and cash equivalents | | | – | | | | 120 | | | | – | |
Trade and other receivables | | | 17 | | | | 196 | | | | – | |
Inventories | | | 43 | | | | 128 | | | | – | |
Property, plant and equipment | | | 223 | | | | 369 | | | | – | |
Intangible assets | | | – | | | | 20 | | | | – | |
Deferred tax assets | | | 3 | | | | – | | | | – | |
Other | | | – | | | | 15 | | | | – | |
| | | | | | | | | | | | |
Total assets | | | 286 | | | | 848 | | | | – | |
| | | | | | | | | | | | |
Liabilities | | | | | | | | | | | | |
Trade and other payables | | | 41 | | | | 153 | | | | – | |
Interest bearing liabilities | | | – | | | | 178 | | | | – | |
Current tax payable | | | 2 | | | | 1 | | | | – | |
Deferred tax liabilities | | | – | | | | 66 | | | | – | |
Provisions | | | 177 | | | | 35 | | | | – | |
| | | | | | | | | | | | |
Total liabilities | | | 220 | | | | 433 | | | | – | |
| | | | | | | | | | | | |
Net assets | | | 66 | | | | 415 | | | | – | |
| | | | | | | | | | | | |
Amounts presented for 30 June 2013 represent the assets and liabilities of the Pinto Valley mining operation and the associated San Manuel Arizona Railroad Company. Amounts presented for 30 June 2012 represent the assets and liabilities of the Richards Bay Minerals joint venture.
26 Subsidiaries
Significant subsidiaries of the Group, which are those with the most significant contribution to the Group’s net profit or net assets, are as follows:
| | | | | | | | | | | | |
| | | | | | | Effective
interest | |
Name | | Country of
incorporation | | Principal activity | | 2013
% | | | 2012
% | |
BHP Billiton Aluminium Australia Pty Ltd | | Australia | | Bauxite mining and alumina refining | | | 100 | | | | 100 | |
BHP Billiton Aluminium (RAA) Pty Ltd | | Australia | | Bauxite mining and alumina refining | | | 100 | | | | 100 | |
BHP Billiton Aluminium (Worsley) Pty Ltd | | Australia | | Bauxite mining and alumina refining | | | 100 | | | | 100 | |
BHP Billiton Canada Inc. | | Canada | | Diamond mining and potash development | | | 100 | | | | 100 | |
BHP Billiton Direct Reduced Iron Pty Ltd | | Australia | | Hot briquette iron plant (closed) | | | 100 | | | | 100 | |
BHP Billiton Energy Coal Australia Pty Ltd | | Australia | | Holding company | | | 100 | | | | 100 | |
BHP Billiton Energy Coal South Africa Proprietary Limited(a) | | South Africa | | Coal mining | | | 100 | | | | 100 | |
BHP Billiton Finance BV | | Netherlands | | Finance | | | 100 | | | | 100 | |
BHP Billiton Finance Ltd | | Australia | | Finance | | | 100 | | | | 100 | |
BHP Billiton Finance (USA) Ltd(b) | | Australia | | Finance | | | 100 | | | | 100 | |
BHP Billiton Foreign Holdings Inc. | | US | | Holding company | | | 100 | | | | 100 | |
BHP Billiton Group Operations Pty Ltd | | Australia | | Administrative services | | | 100 | | | | 100 | |
BHP Billiton International Services Limited | | UK | | Service company | | | 100 | | | | 100 | |
BHP Billiton Iron Ore Pty Ltd | | Australia | | Service company | | | 100 | | | | 100 | |
BHP Billiton IO Mining Pty Ltd | | Australia | | Holding company | | | 100 | | | | 100 | |
BHP Billiton Marketing AG | | Switzerland | | Marketing and trading | | | 100 | | | | 100 | |
BHP Billiton Marketing Inc. | | US | | Marketing and trading | | | 100 | | | | 100 | |
BHP Billiton Metais SA | | Brazil | | Alumina refining and aluminium smelting | | | 100 | | | | 100 | |
BHP Billiton Metcoal Holdings Pty Ltd | | Australia | | Holding company | | | 100 | | | | 100 | |
BHP Billiton Minerals Pty Ltd | | Australia | | Iron ore, coal, silver, lead and zinc mining | | | 100 | | | | 100 | |
BHP Billiton Mitsui Coal Pty Ltd | | Australia | | Coal mining | | | 80 | | | | 80 | |
BHP Billiton New Mexico Coal Inc. | | Australia | | Coal mining | | | 100 | | | | 100 | |
BHP Billiton Nickel West Pty Ltd | | Australia | | Nickel mining, smelting, refining and administrative services | | | 100 | | | | 100 | |
BHP Billiton Olympic Dam Corporation Pty Ltd | | Australia | | Copper and uranium mining | | | 100 | | | | 100 | |
BHP Billiton Petroleum (Americas) Inc. | | US | | Hydrocarbons exploration and production | | | 100 | | | | 100 | |
BHP Billiton Petroleum (Arkansas) Inc. | | US | | Hydrocarbons production | | | 100 | | | | 100 | |
BHP Billiton Petroleum (Australia) Pty Ltd | | Australia | | Hydrocarbons production | | | 100 | | | | 100 | |
BHP Billiton Petroleum (Bass Strait) Pty Ltd | | Australia | | Hydrocarbons production | | | 100 | | | | 100 | |
BHP Billiton Petroleum (Colombia) Corporation | | Canada | | Hydrocarbons production | | | 100 | | | | 100 | |
BHP Billiton Petroleum (Deepwater) Inc. | | US | | Hydrocarbons exploration, development and production | | | 100 | | | | 100 | |
BHP Billiton Petroleum (Eagle Ford Gathering) LLC | | US | | Hydrocarbons exploration and production | | | 100 | | | | 100 | |
BHP Billiton Petroleum (Fayetteville) LLC | | US | | Hydrocarbons exploration and production | | | 100 | | | | 100 | |
BHP Billiton Petroleum (International Exploration) Pty Ltd | | Australia | | Hydrocarbons development and production | | | 100 | | | | 100 | |
BHP Billiton Petroleum (KCS Resources) LLC | | US | | Hydrocarbons exploration and production | | | 100 | | | | 100 | |
BHP Billiton Petroleum (New Ventures) Corporation | | Canada | | Hydrocarbons exploration and production | | | 100 | | | | 100 | |
BHP Billiton Petroleum (North West Shelf) Pty Ltd | | Australia | | Hydrocarbons production | | | 100 | | | | 100 | |
BHP Billiton Petroleum (Sabah) Corporation | | Canada | | Hydrocarbons exploration and production | | | 100 | | | | 100 | |
BHP Billiton Petroleum (South Africa) LLC | | Saint Kitts
and Nevis | | Hydrocarbons exploration | | | 100 | | | | 100 | |
| | | | | | | | | | | | |
| | | | | | | Effective
interest | |
Name | | Country of
incorporation | | Principal activity | | 2013
% | | | 2012
% | |
BHP Billiton Petroleum (Tx Gathering) LLC | | US | | Hydrocarbons exploration and production | | | 100 | | | | 100 | |
BHP Billiton Petroleum (Victoria) Pty Ltd | | Australia | | Hydrocarbons development | | | 100 | | | | 100 | |
BHP Billiton Petroleum Great Britain Limited | | UK | | Hydrocarbons production | | | 100 | | | | 100 | |
BHP Billiton Petroleum Pty Ltd | | Australia | | Hydrocarbons exploration and production | | | 100 | | | | 100 | |
BHP Billiton Petroleum Properties (N.A.) LP | | US | | Hydrocarbons exploration and production | | | 100 | | | | 100 | |
BHP Billiton SA Holdings Limited | | South Africa | | Holding company | | | 100 | | | | 100 | |
BHP Billiton SA Limited | | South Africa | | Holding and service company | | | 100 | | | | 100 | |
BHP Billiton Shared Services Malaysia Sdn. Bhd. | | Malaysia | | Service company | | | 100 | | | | 100 | |
BHP Billiton SSM Development Pty Ltd | | Australia | | Holding company | | | 100 | | | | 100 | |
BHP Billiton (Trinidad – 2c) Limited | | Canada | | Hydrocarbons development | | | 100 | | | | 100 | |
BHP Billiton World Exploration Inc. | | Canada | | Minerals exploration | | | 100 | | | | 100 | |
BHP Canadian Diamonds Company | | Canada | | Diamond mining | | | 100 | | | | 100 | |
BHP Chile Inc. | | US | | Service company | | | 100 | | | | 100 | |
BHP Coal Holdings Pty Ltd | | Australia | | Holding company | | | 100 | | | | 100 | |
BHP Coal Pty Ltd | | Australia | | Holding company and coal mining | | | 100 | | | | 100 | |
BHP Copper Inc. | | US | | Holding company and copper mining | | | 100 | | | | 100 | |
BHP Escondida Inc. | | US | | Holding company | | | 100 | | | | 100 | |
BHP Iron Ore (Jimblebar) Pty Ltd | | Australia | | Iron ore mining | | | 100 | | | | 100 | |
BHP Navajo Coal Company | | US | | Coal mining | | | 100 | | | | 100 | |
BHP Petroleum (Pakistan) Pty Ltd | | Australia | | Hydrocarbons production | | | 100 | | | | 100 | |
BHP Queensland Coal Investments Pty Ltd | | Australia | | Holding company and coal mining | | | 100 | | | | 100 | |
Billiton Aluminium SA (Pty) Limited | | South Africa | | Aluminium smelting | | | 100 | | | | 100 | |
Broken Hill Proprietary (USA) Inc. | | US | | Service company | | | 100 | | | | 100 | |
Cerro Matoso SA | | Colombia | | Nickel mining and ferro-nickel smelting | | | 99.9 | | | | 99.9 | |
Compañia Minera Cerro Colorado Limitada | | Chile | | Copper mining | | | 100 | | | | 100 | |
Dendrobium Coal Pty Ltd | | Australia | | Coal mining | | | 100 | | | | 100 | |
Endeavour Coal Pty Ltd | | Australia | | Coal mining | | | 100 | | | | 100 | |
Groote Eylandt Mining Company Pty Ltd | | Australia | | Manganese mining | | | 60 | | | | 60 | |
Hillside Aluminium (Pty) Limited | | South Africa | | Aluminium smelting | | | 100 | | | | 100 | |
Hotazel Manganese Mines (Proprietary) Limited(a) | | South Africa | | Manganese ore mining and processing | | | 54.6 | | | | 54.6 | |
Hunter Valley Energy Coal Pty Ltd | | Australia | | Coal mining | | | 100 | | | | 100 | |
Illawarra Coal Holdings Pty Ltd | | Australia | | Coal mining | | | 100 | | | | 100 | |
Illawarra Services Pty Ltd | | Australia | | Coal mining | | | 100 | | | | 100 | |
Minera Spence SA | | Chile | | Copper mining | | | 100 | | | | 100 | |
Petrohawk Energy Corporation | | US | | Hydrocarbons exploration and production | | | 100 | | | | 100 | |
PT Lahai Coal | | Indonesia | | Coal exploration | | | 75 | | | | 75 | |
PT Juloi Coal | | Indonesia | | Coal exploration | | | 75 | | | | 75 | |
Rio Algom Limited | | Canada | | Holding company | | | 100 | | | | 100 | |
Samancor AG | | Switzerland | | Marketing | | | 60 | | | | 60 | |
Samancor Manganese (Proprietary) Limited | | South Africa | | Manganese mining and manganese alloys | | | 60 | | | | 60 | |
San Juan Coal Company | | US | | Coal mining | | | 100 | | | | 100 | |
Tasmanian Electro Metallurgical Company Pty Ltd | | Australia | | Manganese alloys | | | 60 | | | | 60 | |
UMAL Consolidated Pty Ltd | | Australia | | Holding company and coal mining | | | 100 | | | | 100 | |
Winwell Resources LLC | | US | | Hydrocarbons exploration and production | | | 100 | | | | 100 | |
WMC Finance (USA) Limited | | Australia | | Finance | | | 100 | | | | 100 | |
| (a) | TheComprises the fee payable to the Group’s effective interest in BHP Billiton Energy Coal South Africa Proprietary Limited will reduce to 90 per cent and effective interest in Hotazel Manganese Mines (Proprietary) Limited will reduce to 44.4 per cent pursuant to Broad Based Black Economic Empowerment transactions in South Africa.auditors for the audit of the Group’s financial statements. |
| (b) | The BHP Billiton Finance (USA) Ltd is 100 per cent owned by BHP Billiton Limited. BHP Billiton LimitedComprises the audits of the Group’s subsidiaries, joint ventures and BHP Billiton Plc have each fully and unconditionally guaranteed BHP Billiton Finance (USA) Ltd’s debt securities.associates, as well as audit fees of US$ nil (2014: US$ nil; 2013: US$0.204 million) for pension funds. For UK purposes, fees for the audit of pension funds would be classified as a separate component of ‘other services’. |
| (c) | A complete listComprises review of half-year reports and audit work in relation to compliance with section 404 of the US Sarbanes-Oxley Act. |
| (d) | Comprises assurance in respect of the Group’s subsidiaries and jointly controlled entities will be attached to BHP Billiton Plc’s annual return made to the UK Registrar of Companies.sustainability reporting. |
| (e) | Comprises services in connection with acquisitions, divestments, the South32 demerger and debt raising transactions. |
| (f) | Comprises non-statutory assurance based procedures, advice on accounting matters, as well as tax compliance services of US$ nil (2014: US$0.008 million; 2013: US$ nil). |
27 Interests39. Not required for US reporting
Presentation and policies
40. Reporting entity
Dual Listed Companies’ structure
Merger terms
On 29 June 2001, BHP Billiton Limited (previously known as BHP Limited), an Australian-listed company, and BHP Billiton Plc (previously known as Billiton Plc), a United Kingdom (UK) listed company, entered into a Dual Listed Company (DLC) merger. This was effected by contractual arrangements between the Companies and amendments to their constitutional documents.
The effect of the DLC merger is that BHP Billiton Limited and its subsidiaries (the BHP Billiton Limited Group) and BHP Billiton Plc and its subsidiaries (the BHP Billiton Plc Group) operate together as a single for-profit economic entity (the Group). Under the arrangements:
the shareholders of BHP Billiton Limited and BHP Billiton Plc have a common economic interest in jointly controlled entitiesboth Groups;
the shareholders of BHP Billiton Limited and BHP Billiton Plc take key decisions, including the election of Directors, through a joint electoral procedure under which the shareholders of the two Companies effectively vote on a joint basis;
BHP Billiton Limited and BHP Billiton Plc have a common Board of Directors, a unified management structure and joint objectives;
dividends and capital distributions made by the two Companies are equalised;
BHP Billiton Limited and BHP Billiton Plc each executed a deed poll guarantee, guaranteeing (subject to certain exceptions) the contractual obligations (whether actual or contingent, primary or secondary) of the other incurred after 29 June 2001, together with specified obligations existing at that date.
If either BHP Billiton Limited or BHP Billiton Plc proposes to pay a dividend to its shareholders, then the other Company must pay a matching cash dividend of an equivalent amount per share to its shareholders. If either Company is prohibited by law or is otherwise unable to declare, pay or otherwise make all or any portion of such a matching dividend, then BHP Billiton Limited or BHP Billiton Plc will, so far as it is practicable to do so, enter into such transactions with each other as the Boards agree to be necessary or desirable, so as to enable both Companies to pay dividends as nearly as practicable at the same time.
The DLC merger did not involve the change of legal ownership of any assets of BHP Billiton Limited or BHP Billiton Plc, any change of ownership of any existing shares or securities of BHP Billiton Limited or BHP Billiton Plc, the issue of any shares or securities or any payment by way of consideration, save for the issue by each Company of one special voting share to a trustee company which is the means by which the joint electoral procedure is operated.
Accounting for the DLC merger
The basis of accounting for the DLC merger was established under Australian and UK Generally Accepted Accounting Practice (GAAP), pursuant to the requirements of the Australian Securities and Investments Commission (ASIC) Practice Note 71 ‘Financial Reporting by Australian Entities in Dual Listed Company Arrangements’, an order issued by ASIC under section 340 of the Corporations Act 2001 on 2 September 2002, and in accordance with the UK Companies Act 1985. In accordance with the transitional provisions of
IFRS 1/AASB 1 ‘First-time Adoption of International Financial Reporting Standards’, the same basis of accounting is applied under International Financial Reporting Standards. Accordingly, these financial statements consolidate the Group as follows:
Assets and liabilities of the BHP Billiton Limited Group and the BHP Billiton Plc Group were consolidated at the date of the merger at their existing carrying amounts.
Results for the years ended 30 June 2015, 30 June 2014 and 30 June 2013 are of the consolidated entity comprising the BHP Billiton Limited Group and the BHP Billiton Plc Group.
41. Basis of preparation and measurement
Basis of preparation
This general purpose financial report for the year ended 30 June 2015, has been prepared on a going concern basis and in accordance with the requirements of the Australian Corporations Act 2001, and the UK Companies Act 2006 and with:
Australian Accounting Standards, being Australian equivalents to International Financial Reporting Standards and interpretations as issued by the Australian Accounting Standards Board (AASB) effective for the year ended 30 June 2015;
International Financial Reporting Standards and interpretations as adopted by the European Union (EU) effective as of 30 June 2015;
International Financial Reporting Standards and interpretations as issued by the International Accounting Standards Board effective as of 30 June 2015.
The above accounting standards and interpretations are collectively referred to as ‘IFRS’ in this report.
Comparative information for the years ended 30 June 2014 and 30 June 2013 has been restated for the effects of the application of IFRS 5/AASB 5 ‘Non-current Assets Held for Sale and Discontinued Operations’ following the demerger of South32. The Consolidated Statement of Comprehensive Income, the Consolidated Balance Sheet and the Consolidated Statement of Changes in Equity for these periods are not required to be restated.
The principal accounting standards or interpretations that have been adopted for the first time in these financial statements are:
Amendments to IAS 32/AASB 132 ‘Financial Instruments: Presentation’ clarify the criteria for offsetting financial assets and liabilities; and
IFRIC 21 ‘Levies’ confirms that a liability to pay a levy is only recognised when the activity that triggers the payment occurs.
The adoption of IFRIC 21 and the amendments to IAS 32 did not have a material impact on the BHP Billiton Group and therefore no restatements have been made to the prior year financial statements related to these changes.
There are no new accounting standards or interpretations impacting the Group in the financial years commencing from 1 July 2015. The following new accounting standards are not yet effective, but may have an impact on the Group in financial years commencing from 1 July 2016 or later:
IFRS 15/AASB 15 ‘Revenue from Contracts with Customers’, which modifies the determination of when to recognise revenue and how much revenue to recognise. The core principle is that an entity recognises revenue to depict the transfer of promised goods and services to the customer of an amount that reflects the consideration to which the entity expects to be entitled in exchange for those goods or services.
IFRS 9/AASB 9 ‘Financial Instruments’ modifies the classification and measurement of financial assets. It includes a single, principles-based approach for the classification of financial assets, which is driven by cash flow characteristics and the business model in which an asset is held. It also introduces a new expected loss impairment model requiring expected losses to be recognised when financial instruments are first recognised. The new standard also modifies hedge accounting to align the accounting treatment with risk management practices of an entity.
The Group is currently in the process of determining the potential impact of adopting the above standards. These standards have not been applied in the preparation of these financial statements. IFRS 9 has not been endorsed by the EU and hence is not available for early adoption in the EU.
Basis of measurement
The financial statements are drawn up on the basis of historical cost principles, except for derivative financial instruments and certain other financial assets, which are carried at fair value. Any non-current assets or disposal groups which are classified as held- for-sale or held-for-distribution are measured at the lower of carrying amount and fair value less costs to sell.
Rounding of amounts
Amounts in these financial statements have, unless otherwise indicated, been rounded to the nearest million dollars.
42. Functional and presentation currency
Currency of presentation
All amounts are expressed in millions of US dollars, unless otherwise stated, consistent with the predominant functional currency of the Group’s operations.
Foreign currencies
The Group’s significant interestsreporting currency and the functional currency of the majority of its operations is the US dollar as this is assessed to be the principal currency of the economic environments in jointly controlled entities,which they operate.
Transactions denominated in foreign currencies (currencies other than the functional currency of an operation) are recorded using the exchange rate ruling at the date of the underlying transaction. Monetary assets and liabilities denominated in foreign currencies are translated using the rate of exchange prevailing at year-end and the gains or losses on retranslation are included in the income statement, with the exception of foreign exchange gains or losses on foreign currency provisions for site closure and rehabilitation, which are thosecapitalised in property, plant and equipment for operating sites.
Exchange variations resulting from the retranslation at closing rate of the net investment in each subsidiary, joint arrangement and associate, arising after 1 July 2004, are accounted for in accordance with the most significant contributionpolicy stated below. Exchange variations arising before this date were transferred to retained earnings on 1 July 2004, being the date of transition to IFRS.
Subsidiaries, joint arrangements and associates that have functional currencies other than US dollars are foreign operations and translate their income statement items to US dollars using the exchange rate prevailing at the date of each transaction. Assets and liabilities are translated using exchange rates prevailing at year-end. Exchange variations resulting from the retranslation at closing rate of the net investment in foreign operations, together with differences between their income statement items translated at actual and closing rates, are recognised in the
foreign currency translation reserve. For the purpose of foreign currency translation, the net investment in a foreign operation is determined inclusive of foreign currency intercompany balances for which settlement is neither planned nor likely to occur in the foreseeable future. The balance of the foreign currency translation reserve relating to a foreign operation that is disposed of, or partially disposed of, is recognised in the income statement at the time of disposal.
Exchange rates
The following exchange rates relative to the Group’s net profit or net assets, are listed below. All entities included below are subject to joint control as a result of governing contractual arrangements.US dollar have been applied in the financial statements:
| | | | | | | | | | | | | | |
| | | | | | | Ownership
interest(b) | |
Major shareholdings in
jointly controlled entities (a) | | Country of
incorporation | | Principal activity | | Reporting
date(b) | | 2013
% | | | 2012
% | |
| Caesar Oil Pipeline Company LLC | | US | | Hydrocarbons transportation | | 31 May | | | 25 | | | | 25 | |
| Cleopatra Gas Gathering Company LLC | | US | | Hydrocarbons transportation | | 31 May | | | 22 | | | | 22 | |
| Compañía Minera Antamina SA | | Peru | | Copper and zinc mining | | 30 June | | | 33.75 | | | | 33.75 | |
| Minera Escondida Limitada (c) | | Chile | | Copper mining | | 30 June | | | 57.5 | | | | 57.5 | |
| Samarco Mineração SA | | Brazil | | Iron ore mining | | 31 Dec | | | 50 | | | | 50 | |
| Carbones del Cerrejón LLC | | Anguilla | | Coal mining in Colombia | | 31 Dec | | | 33.33 | | | | 33.33 | |
| Newcastle Coal Infrastructure Group Pty Limited | | Australia | | Coal export terminal | | 30 June | | | 35.5 | | | | 35.5 | |
| Phola Coal Processing Plant (Pty) Ltd | | South Africa | | Coal handling and processing plant | | 30 June | | | 50 | | | | 50 | |
| Mozal SARL | | Mozambique | | Aluminium smelting | | 30 June | | | 47.1 | | | | 47.1 | |
| Richards Bay Minerals(d) | | South Africa | | Mineral sands mining and processing | | 31 Dec | | | – | | | | 37.76 | |
| | | | | | | | |
| | | Group share | |
| | | 2013 | | | 2012 | |
| | | US$M | | | US$M | |
Net assets of jointly controlled entities | | | | | | | | |
Current assets | | | 3,810 | | | | 4,718 | |
Non-current assets | | | 11,841 | | | | 10,259 | |
Current liabilities | | | (2,194 | ) | | | (3,188 | ) |
Non-current liabilities | | | (4,643 | ) | | | (3,534 | ) |
| | | | | | | | |
Net assets | | | 8,814 | | | | 8,255 | |
| | | | | | | | |
| | | | | | | | | | | | |
| | | Group share | |
| | | 2013 | | | 2012 | | | 2011 | |
| | | US$M | | | US$M | | | US$M | |
Share of jointly controlled entities’ profit | | | | | | | | | | | | |
Revenue | | | 9,873 | | | | 10,150 | | | | 11,600 | |
Net operating costs | | | (5,756 | ) | | | (5,742 | ) | | | (5,443 | ) |
| | | | | | | | | | | | |
Operating profit | | | 4,117 | | | | 4,408 | | | | 6,157 | |
Net finance costs | | | (110 | ) | | | (196 | ) | | | (368 | ) |
Income tax expense | | | (1,199 | ) | | | (949 | ) | | | (1,462 | ) |
| | | | | | | | | | | | |
Profit after taxation | | | 2,808 | | | | 3,263 | | | | 4,327 | |
| | | | | | | | | | | | |
| | | | | | | | |
| | | Group share | |
| | | 2013 | | | 2012 | |
| | | US$M | | | US$M | |
Share of contingent liabilities and capital expenditure commitments relating to jointly controlled entities | | | | | | | | |
Contingent liabilities(e) | | | 1,415 | | | | 1,269 | |
Capital expenditure commitments(e) | | | 1,157 | | | | 2,098 | |
| | | | | | | | | | | | | | | | | | | | | | | | |
| | | Average
year ended
30 June 2015 | | | Average
year ended
30 June 2014 | | | Average
year ended
30 June 2013 | | | As at
30 June 2015 | | | As at
30 June 2014 | | | As at
30 June 2013 | |
Australian dollar (a) | | | 0.84 | | | | 0.92 | | | | 1.03 | | | | 0.77 | | | | 0.94 | | | | 0.92 | |
Brazilian real | | | 2.68 | | | | 2.29 | | | | 2.04 | | | | 3.14 | | | | 2.20 | | | | 2.18 | |
Canadian dollar | | | 1.17 | | | | 1.07 | | | | 1.00 | | | | 1.24 | | | | 1.07 | | | | 1.05 | |
Chilean peso | | | 604 | | | | 532 | | | | 479 | | | | 635 | | | | 551 | | | | 504 | |
Colombian peso | | | 2,257 | | | | 1,935 | | | | 1,814 | | | | 2,585 | | | | 1,881 | | | | 1,923 | |
Euro | | | 0.84 | | | | 0.74 | | | | 0.77 | | | | 0.89 | | | | 0.73 | | | | 0.77 | |
South African rand | | | 11.45 | | | | 10.39 | | | | 8.84 | | | | 12.24 | | | | 10.60 | | | | 10.00 | |
UK pound sterling | | | 0.64 | | | | 0.62 | | | | 0.64 | | | | 0.64 | | | | 0.59 | | | | 0.66 | |
| (a) | A complete listDisplayed as US$ to A$1 based on common convention. |
43. Significant accounting policies
(a) Consistent application of accounting policies
The accounting policies have been consistently applied by all entities included in the Group consolidated financial statements and are consistent with those applied in all prior years presented.
(b) Comparatives
Where applicable, comparatives have been adjusted to measure or present them on the same basis as current period figures.
The financial statements for the years ended 30 June 2014 and 30 June 2013 have been restated for the effects of the application of IFRS 5/AASB 5 ‘Non-current Assets Held for Sale and Discontinued Operations’ following the demerger of South32. Refer to note 29 ‘Discontinued operations’. The nature of each change reflected in the restated financial statements is as follows:
All income and expense items relating to South32 have been removed from the individual line items in the income statement. The post-tax profit/(loss) of South32 is presented as a single amount in the line item entitled ‘(Loss)/profit after taxation from Discontinued operations’; and
All cash flows and other items relating to South32 have been removed from the individual line items in the cash flow statement. The net cash flows attributable to the operating, investing and financing activities of South32 are each disclosed in single amount in each section of the consolidated cash flow statement.
The balance sheet, the statement of comprehensive income and the statement of changes in equity for these periods are not required to be restated.
(c) Principles of consolidation
The financial statements of the Group include the consolidation of BHP Billiton Limited, BHP Billiton Plc and their respective subsidiaries. Subsidiaries are entities controlled by either parent entity. Control exists where either parent entity is exposed, or has rights to, variable returns from its involvement with the subsidiary and has the ability to affect those returns through its power over the subsidiary. A parent entity has power over the subsidiary, when it has existing rights to direct the relevant activities of the subsidiary. The relevant activities are those which significantly affect the subsidiary’s returns. The ability to approve the operating and capital budget of a subsidiary and the ability to appoint key management personnel are decisions that demonstrate that the Group has the existing rights to direct the relevant activities of a subsidiary. Subsidiaries are included in the consolidated financial report from the date control commences until the date control ceases. Where the Group’s interest is less than 100 per cent, the interest attributable to outside shareholders is reflected in non-controlling interests. The effects of all transactions between entities within the Group have been eliminated.
(d) Sales revenue
Revenue from the sale of goods and disposal of other assets is recognised when persuasive evidence (usually in the form of an executed sales agreement) of an arrangement exists and:
there has been a transfer of risks and rewards to the customer;
no further work or processing is required by the Group;
the quantity and quality of the goods has been determined with reasonable accuracy;
the price is fixed or determinable;
collectability is reasonably assured.
Revenue is therefore generally recognised when title passes. In the majority of sales for most commodities, sales agreements specify that title passes on the bill of lading date, which is the date the commodity is delivered to the shipping agent. For these sales, revenue is recognised on the bill of lading date. For certain sales (principally coal sales to adjoining power stations), title passes and revenue is recognised when the goods have been delivered.
In cases where the terms of the executed sales agreement allow for an adjustment to the sales price based on a survey of the goods by the customer (for instance an assay for mineral content), recognition of the sales revenue is based on the most recently determined estimate of product specifications.
For certain commodities, the sales price is determined on a provisional basis at the date of sale and adjustments to the sales price subsequently occurs based on movements in quoted market or contractual prices up to the date of final pricing. The period between provisional invoicing and final pricing is typically between 60 and 120 days. Revenue on provisionally priced sales is recognised based on the estimated fair value of the total consideration receivable. The revenue adjustment mechanism embedded within provisionally priced sales arrangements has the character of a commodity derivative. Accordingly, the fair value of the final sales price adjustment is re-estimated continuously and changes in fair value are recognised as an adjustment to revenue. In all cases, fair value is estimated by reference to forward market prices.
Revenue is not reduced for royalties and other taxes payable from the Group’s production.
The Group separately discloses sales of Group production from sales of third party products because of the significant difference in profit margin earned on these sales.
(e) Depreciation of property, plant and equipment
The carrying amounts of property, plant and equipment are depreciated to their estimated residual value over the estimated useful lives of the specific assets concerned, or the estimated life of the associated mine, field or lease, if shorter. Estimates of residual values and useful lives are reassessed annually and any change in estimate is
taken into account in the determination of remaining depreciation charges. Depreciation commences on the date of commissioning. The major categories of property, plant and equipment are depreciated on a unit of production and/or straight-line basis using estimated lives indicated below. However, where assets are dedicated to a mine, field or lease and are not readily transferable, the below useful lives are subject to the lesser of the asset category’s useful life and the life of the mine, field or lease:
| | | | | | |
• Buildings | | | – | | | 25 to 50 years |
| | |
• Land | | | – | | | not depreciated |
| | |
• Plant and equipment | | | – | | | 3 to 30 years straight-line |
| | |
• Mineral rights and petroleum interests | | | – | | | based on reserves on a unit of investmentsproduction basis |
| | |
• Capitalised exploration, evaluation and development expenditure | | | – | | | based on reserves on a unit of production basis |
(f) Exploration and evaluation expenditure
Exploration and evaluation activity involves the search for mineral and petroleum resources, the determination of technical feasibility and the assessment of commercial viability of an identified resource. Exploration and evaluation activity includes:
researching and analysing historical exploration data;
gathering exploration data through topographical, geochemical and geophysical studies;
exploratory drilling, trenching and sampling;
determining and examining the volume and grade of the resource;
surveying transportation and infrastructure requirements;
conducting market and finance studies.
Administration costs that are not directly attributable to a specific exploration area are charged to the income statement. Initial payments for the acquisition of intangible lease assets are capitalised and amortised over the term of the permit.
Exploration and evaluation expenditure (including amortisation of capitalised licence and lease costs) is charged to the income statement as incurred except in the following circumstances, in which case the expenditure may be capitalised:
In respect of minerals activities:
| – | | The exploration and evaluation activity is within an area of interest which was previously acquired as an asset acquisition or in subsidiariesa business combination and jointly controlled entities will be attached to BHP Billiton Plc’s annual return made to the UK Registrar of Companies.measured at fair value on acquisition; or |
(b) | – | | The ownershipexistence of a commercially viable mineral deposit has been established. |
In respect of petroleum activities:
| – | | The exploration and evaluation activity is within an area of interest atfor which it is expected that the Group’s and the jointly controlled entity’s reporting date are the same. When the annual financial reporting date is different to the Group’s, financial information is obtained as at 30 June in order to report on an annual basis consistent with the Group’s reporting date.expenditure will be recouped by future exploitation or sale; or |
(c) | While the Group holds– | | Exploration and evaluation activity has not reached a 57.5 per cent interest in Minera Escondida Limitada, the entity is subject to effective joint control due to participant and management agreementsstage which result in the operation of an Owners’ Council, whereby significant commercial and operational decisions are determined on aggregate voting interests of at least 75 per centpermits a reasonable assessment of the total ownership interest. Accordingly, the Group does not have the ability to unilaterally control, and therefore consolidate, the investment in accordance with IAS 27/AASB 127 ‘Consolidated and Separate Financial Statements’. Refer to note 1 Accounting policies for a descriptionexistence of the change in the basis of accounting for Minera Escondida Limitada from 1 July 2013 in accordance with IFRS 10/AASB 10 ‘Consolidated Financial Statements’.commercially recoverable reserves. |
Capitalised exploration and evaluation expenditure considered to be a tangible asset is recorded as a component of property, plant and equipment at cost less impairment charges. Otherwise, it is recorded as an intangible asset
(d) | Richards Bay Minerals comprises two legal entities, Richards Bay Mining (Proprietary) Limited and Richards Bay Titanium (Proprietary) Limited, in each of which the Group had a 50 per cent interest and which function as a single economic entity. After deducting non-controlling interests in subsidiaries of Richards Bay Minerals, the Group’s effective interest in the operations of Richards Bay Minerals was 37.76 per cent up to the date of its effective disposal on 3 September 2012. |
(e) | Included in contingent liabilities and capital expenditure commitments for the Group – refer to notes 21 Contingent liabilities and 22 Commitments respectively. |
28 Interests(such as certain licence and lease arrangements). In determining whether the purchase of an exploration licence or lease is an intangible asset or a component of property, plant and equipment, consideration is given to the substance of the item acquired not its legal form. Licences or leases purchased, which allow exploration over an extended period of time, meet the definition of an intangible exploration lease asset where they cannot be reasonably associated with a known resource (minerals) or reserves (petroleum). All capitalised exploration and evaluation expenditure is monitored for indications of impairment. When a potential impairment is indicated, assessment is performed for each area of interest in jointly controlledconjunction with the group of operating assets
The principal jointly controlled assets (representing a cash-generating unit) to which the exploration is attributed. Exploration areas in which reserves have been discovered but require major capital expenditure before production can begin, are continually evaluated to ensure that commercial quantities of reserves exist or to ensure that additional exploration work is under way or planned. To the extent that capitalised expenditure is no longer expected to be recovered, it is charged to the income statement.
(g) Impairment and reversal of impairment of non-current assets
Formal impairment tests are carried out annually for goodwill. In addition, formal impairment tests for all assets are performed when there is an indication of impairment. The Group hasconducts an interestinternal review of asset values annually, which is used as a source of information to assess for any indications of impairment or reversal of previously recognised impairment losses. External factors, such as changes in expected future prices, costs and whichother market factors, are proportionately consolidatedalso monitored to assess for indications of impairment or reversal of previously recognised impairment losses. If any such indication exists, an estimate of the asset’s recoverable amount is calculated, being the higher of fair value less direct costs of disposal and the asset’s value in use.
If the carrying amount of the asset exceeds its recoverable amount, the asset is impaired and an impairment loss is charged to the income statement so as to reduce the carrying amount in the financial statements arebalance sheet to its recoverable amount. A reversal of a previously recognised impairment loss is limited to the lesser of the amount that would not cause the carrying amount to exceed (a) its recoverable amount; or (b) the carrying amount that would have been determined (net of depreciation) had no impairment loss been recognised for the asset or cash-generating unit.
Fair value is determined as follows:
| | | | | | | | | | | | |
| | | | | | | Effective interest | |
Name | | Country of
operation | | Principal activity | | 2013
% | | | 2012
% | |
Atlantis | | US | | Hydrocarbons exploration and production | | | 44 | | | | 44 | |
Bass Strait | | Australia | | Hydrocarbons production | | | 50 | | | | 50 | |
Greater Angostura | | Trinidad and Tobago | | Hydrocarbons production | | | 45 | | | | 45 | |
Liverpool Bay | | UK | | Hydrocarbons production | | | 46.1 | | | | 46.1 | |
Macedon | | Australia | | Hydrocarbons exploration and production | | | 71.43 | | | | 71.43 | |
Mad Dog | | US | | Hydrocarbons exploration and production | | | 23.9 | | | | 23.9 | |
Minerva | | Australia | | Hydrocarbons exploration and production | | | 90 | | | | 90 | |
Neptune | | US | | Hydrocarbons exploration and production | | | 35 | | | | 35 | |
North West Shelf | | Australia | | Hydrocarbons production | | | 8.33 – 16.67 | | | | 8.33 – 16.67 | |
Ohanet (a) | | Algeria | | Hydrocarbons exploration and production | | | – | | | | – | |
Onshore US | | US | | Hydrocarbons exploration and production | | | <0.1 – 100 | | | | <0.1 – 100 | |
Pyrenees | | Australia | | Hydrocarbons exploration and production | | | 40 – 71.43 | | | | 40 – 71.43 | |
ROD Integrated Development | | Algeria | | Hydrocarbons exploration and production | | | 38 – 45 | | | | 38 – 45 | |
Shenzi | | US | | Hydrocarbons exploration and production | | | 44 | | | | 44 | |
Stybarrow | | Australia | | Hydrocarbons exploration and production | | | 50 | | | | 50 | |
Zamzama | | Pakistan | | Hydrocarbons exploration and production | | | 38.5 | | | | 38.5 | |
Mt Goldsworthy | | Australia | | Iron ore mining | | | 85 | | | | 85 | |
Mt Newman | | Australia | | Iron ore mining | | | 85 | | | | 85 | |
Yandi | | Australia | | Iron ore mining | | | 85 | | | | 85 | |
Central Queensland Coal Associates | | Australia | | Coal mining | | | 50 | | | | 50 | |
Gregory | | Australia | | Coal mining | | | 50 | | | | 50 | |
Alumar | | Brazil | | Alumina refining | | | 36 | | | | 36 | |
| | | | Aluminium smelting | | | 40 | | | | 40 | |
Worsley | | Australia | | Bauxite mining and alumina refining | | | 86 | | | | 86 | |
EKATI(b) | | Canada | | Diamond mining | | | – | | | | 80 | |
| | | | | | | | |
| | | 2013 | | | 2012 | |
| | | US$M | | | US$M | |
Share of contingent liabilities and capital expenditure commitments relating to jointly controlled assets | | | | | | | | |
Contingent liabilities(c) | | | 478 | | | | 283 | |
Capital expenditure commitments(c) | | | 3,502 | | | | 5,961 | |
(a) | The Group divested its effective 45 per cent interest in Ohanet wet gas development in October 2011. |
(b) | The Group divested its 80 per cent interest in EKATI effective 10 April 2013. |
(c) | Included in contingent liabilities and capital expenditure commitments for the Group – refer to notes 21 Contingent liabilities and 22 Commitments respectively. |
29 Financial risk management
Financial risk management strategy
The financial risks arisingthe amount that would be obtained from the Group’s operations comprisesale of the asset in an orderly transaction between market liquidityparticipants. Fair value for mineral assets is generally determined as the present value of the estimated future cash flows expected to arise from the continued use of the asset, including any expansion prospects, and credit risk.its eventual disposal, using assumptions that an independent market participant may take into account. These riskscash flows are discounted at an appropriate rate to arrive at a net present value of the asset.
Value in use is determined as the present value of the estimated future cash flows expected to arise from the continued use of the asset in the normal course of business,its present form and the Group manages its exposureeventual disposal. Value in use is determined by applying assumptions specific to them in accordance with the Group’s portfolio risk management strategy. The objectivecontinued use and cannot take into account future development. These assumptions are different to those used in calculating fair value and consequently the value in use calculation is likely to give a different result (usually lower) to a fair value calculation.
In testing for indications of impairment and performing impairment calculations, assets are considered as collective groups and referred to as cash-generating units. Cash-generating units are the smallest identifiable group of assets, liabilities and associated goodwill that generate cash inflows that are largely independent of the strategy is to support the deliverycash inflows from other assets or groups of the Group’s financial targets while protecting its future financial security and flexibility by taking advantage of the natural diversification provided by the scale, diversity and flexibility of the Group’s operations and activities.assets.
A Cash Flow at Risk (CFaR) framework is used to measure the aggregate and diversified impact of financial risks upon the Group’s financial targets.
The principal measurement of risk is CFaR measuredimpairment assessments are based on a portfolio basis, which is defined as the worst expected loss relative to projected business plan cash flows over a one-year horizon under normal market conditions at a confidence levelrange of 95 per cent.
Market risk
The Group’s activities expose it to market risks associated with movements in interest rates, foreign currenciesestimates and commodity prices. Under the strategy outlined above, the Group seeks to achieve financing costs, currency impacts, input costs and commodity prices on a floating or index basis. This strategy gives rise to a risk of variability in earnings which is measured under the CFaR framework.
In executing the strategy, financial instruments are potentially employed in three distinct but related activities. The following table summarises these activities and the key risk management processes.assumptions, including:
| | | | |
ActivityEstimates/assumptions:
| | Key risk management processes
Basis: |
| | |
1 Risk mitigation
On an exception basis, hedging for the purposes of mitigating risk related to specific and significant expenditure on investments or capital projects will be executed if necessary to support the Group’s strategic objectives.• Future production
| | •
– | | Execution of transactions within approved mandates.
proved and probable reserves, resource estimates and, in certain cases, expansion projects |
| | |
2 Economic hedging of commodity sales, operating costs and debt instruments• Commodity prices
| | – | | forward market and contract prices, and longer-term price protocol estimates |
| | |
Where Group commodity production is sold to customers on pricing terms that deviate from the relevant index target, and where a relevant derivatives market exists, financial instruments may be executed as an economic hedge to align the revenue price exposure with the index target.
• Exchange rates | | •
– | | Measuring and reporting the exposure in customer commodity contracts and issued debt instruments.
|
| •
| | Executing hedging derivatives to align the total group exposure to the index target.
|
Where debt is issued in a currency other than the US dollar and/or at a fixed interest rate, fair value and cash flow hedges may be executed to align the debt exposure with the Group’s functional currency of US dollars and/or to swap to a floating interest rate. As part of this strategy swaptions may also be used. | | | | current (forward) market exchange rates |
| | |
3 Strategic financial transactions• Discount rates
| | – | | |
| | |
Opportunistic transactions may be executed with financial instrumentscost of capital risk-adjusted appropriate to capture value from perceived market over/under valuations. | | •
| | Exposures managed within value at risk and stop loss limits.
|
| • | | Execution of transactions within approved mandates.the resource |
(h) Leased assets
Primary responsibility for identification and control of financial risks, including authorising and monitoring the use of financial instruments for the above activities and stipulating policy thereon, rests with the Financial Risk Management CommitteeAssets held under authority delegated bylease, which result in the Group Management Committee.
Interest rate risk
The Group is exposed to interest rate risk on its outstanding borrowingsreceiving substantially all the risks and investments fromrewards of ownership of the possibility that changes in interest rates will affect future cash flows orasset (finance leases), are capitalised at the lower of the fair value of fixedthe property, plant and equipment or the estimated present value of the minimum lease payments.
The corresponding finance lease obligation is included within interest bearing liabilities. The interest component is charged to financial expenses over the lease term to reflect a constant rate of interest on the remaining balance of the obligation.
Operating lease assets are not capitalised and rental payments are included in the income statement on a straight-line basis over the lease term. Provision is made for the present value of future operating lease payments in relation to surplus lease space, when it is first determined that the space will be of no probable future benefit. Operating lease incentives are recognised as a liability when received and subsequently reduced by allocating lease payments between rental expense and reduction of the liability.
(i) Taxation
Taxation on the profit or loss for the year comprises current and deferred tax. Taxation is recognised in the income statement except to the extent that it relates to items recognised directly in equity, in which case the tax is recognised in equity.
Current tax is the expected tax payable on the taxable income for the year using rates enacted or substantively enacted at period end, and includes any adjustment to tax payable in respect of previous years.
Deferred tax is provided using the balance sheet liability method, providing for the tax effect of temporary differences between the carrying amount of assets and liabilities for financial instruments. Interestreporting purposes and the amounts used for tax assessment or deduction purposes. Where an asset has no deductible or depreciable amount for income tax purposes, but has a deductible amount on sale or abandonment for capital gains tax purposes, that amount is included in the determination of temporary differences. The tax effect of certain temporary differences is not recognised, principally with respect to: goodwill; temporary differences arising on the initial recognition of assets or liabilities (other than those arising in a business combination or in a manner that initially impacted accounting or taxable profit); and temporary differences relating to investments in subsidiaries, joint ventures and associates to the extent that the Group is able to control the reversal of the temporary difference and it is probable that the temporary difference will not reverse in the foreseeable future. The amount of deferred tax recognised is based on the expected manner and timing of realisation or settlement of the carrying amount of assets and liabilities, with the exception of items that have a tax base solely derived under capital gains tax legislation, using tax rates enacted or substantively enacted at period end. To the extent that an item’s tax base is solely derived from the amount deductible under capital gains tax legislation, deferred tax is determined as if such amounts are deductible in determining future assessable income.
A deferred tax asset is recognised only to the extent that it is probable that future taxable profits will be available against which the asset can be utilised. Deferred tax assets are reviewed at each balance sheet date and amended to the extent that it is no longer probable that the related tax benefit will be realised. Deferred tax assets and liabilities are offset when they relate to income taxes levied by the same taxation authority and the Group has both the right and the intention to settle its current tax assets and liabilities on a net or simultaneous basis.
Royalties and resource rent taxes are treated as taxation arrangements when they have the characteristics of a tax. This is considered to be the case when they are imposed under government authority and the amount payable is calculated by reference to revenue derived (net of any allowable deductions) after adjustment for temporary differences. For such arrangements, current and deferred tax is provided on the same basis as described above for other forms of taxation. Obligations arising from royalty arrangements that do not satisfy these criteria are recognised as current provisions and included in expenses.
(j) Inventories
Inventories, including work in progress, are valued at the lower of cost and net realisable value. Cost is determined primarily on the basis of average costs. For processed inventories, cost is derived on an absorption costing basis. Cost comprises cost of purchasing raw materials and cost of production, including attributable mining and manufacturing overheads. In respect of minerals inventory, quantities are assessed primarily through surveys and assays. In respect of petroleum inventory, quantities are derived through flow rate riskor tank volume measurement; volume calculation and composition is managedderived via sample analysis.
(k) Property, plant and equipment
Property, plant and equipment is recorded at cost less accumulated depreciation and impairment charges. Cost is the fair value of consideration given to acquire the asset at the time of its acquisition or construction and includes the direct cost of bringing the asset to the location and condition necessary for operation and the estimated future cost of closure and rehabilitation of the facility.
(l) Other mineral assets
Other mineral assets comprise:
capitalised exploration, evaluation and development expenditure (including development stripping) for properties now in production;
mineral rights and petroleum interests acquired;
capitalised production stripping (as described below in ‘Overburden removal costs’).
(m) Overburden removal costs
The process of removing overburden and other mine waste materials to access mineral deposits is referred to as stripping. In open-pit mining, stripping costs are accounted for separately for each component of an ore body. A component is a specific section within an ore body that is made more accessible by the stripping activity. The identification of components is dependent on the mine plan and will often comprise a separate pushback or phase identified in the plan.
There are two types of stripping activity:
Development stripping is the initial overburden removal during the development phase to obtain access to a mineral deposit that will be commercially produced.
Production stripping is the interburden removal during the normal course of production activity. Production stripping commences after the first saleable minerals have been extracted from the component.
Development stripping costs are capitalised as a development stripping asset when:
It is probable that future economic benefits associated with the asset will flow to the entity; and
The costs can be measured reliably.
Production stripping can give rise to two benefits being the extraction of ore in the current period and improved access to the ore body component in future periods. To the extent that the benefit is the extraction of ore the stripping costs are recognised as an inventory cost. To the extent the benefit is improved access to future ore, the stripping costs are recognised as a production stripping asset if the following criteria are met:
It is probable that the future economic benefit (improved access to ore) will flow to the entity;
The component of the ore body for which access has been improved can be identified; and
The costs relating to the stripping activity can be measured reliably.
Production stripping costs are allocated between the inventory produced and the production stripping asset using a life-of-component waste to ore (or mineral contained) strip ratio. When the current strip ratio is greater than the life-of-component ratio a portion of the stripping costs is capitalised to the production stripping asset.
The development and production stripping assets are depreciated on a units of production basis based on the proven and probable reserves of the relevant components. Stripping assets are classified as other mineral assets in property, plant and equipment.
(n) Development expenditure
When proved reserves are determined and development is sanctioned, capitalised exploration and evaluation expenditure is reclassified as assets under construction, and is disclosed as a component of property, plant and equipment. All subsequent development expenditure is capitalised and classified as assets under construction, provided commercial viability conditions continue to be satisfied. Development expenditure is net of proceeds from the sale of ore extracted during the development phase. On completion of development, all assets included in assets under construction are reclassified as either plant and equipment or other mineral assets.
(o) Goodwill
Where the fair value of consideration paid for a business combination exceeds the fair value of the Group’s share of the identifiable net assets acquired, the difference is treated as purchased goodwill. Where the fair value of the Group’s share of the identifiable net assets acquired exceeds the cost of acquisition, the difference is immediately recognised in the income statement. The recognition and measurement of goodwill attributable to a non-controlling interest in a business combination is determined on a transaction by transaction basis. Goodwill is not amortised, however, its carrying amount is assessed annually against its recoverable amount as explained below under ‘Impairment and reversal of impairment of non-current assets’. On the subsequent disposal or termination of a previously acquired business, any remaining balance of associated goodwill is included in the determination of the profit or loss on disposal or termination.
(p) Intangible assets
Amounts paid for the acquisition of identifiable intangible assets, such as software and licences, are capitalised at the fair value of consideration paid and are recorded at cost less accumulated amortisation and impairment charges. Identifiable intangible assets with a finite life are amortised on a straight-line basis over their expected useful life, which is typically no greater than eight years. The Group has no identifiable intangible assets for which the expected useful life is indefinite.
(q) Closure and rehabilitation
The mining, extraction and processing activities of the Group normally give rise to obligations for site closure or rehabilitation. Closure and rehabilitation works can include facility decommissioning and dismantling; removal or treatment of waste materials and site and land rehabilitation. The extent of work required and the associated costs are dependent on the requirements of relevant authorities and the Group’s environmental policies.
Provisions for the cost of each closure and rehabilitation program are recognised at the time that environmental disturbance occurs. When the extent of disturbance increases over the life of an operation, the provision is increased accordingly. Costs included in the provision encompass all closure and rehabilitation activity expected to occur progressively over the life of the operation and at or after the time of closure, for disturbance existing at the reporting date. Routine operating costs that may impact the ultimate closure and rehabilitation activities, such as waste material handling conducted as an integral part of a mining or production process, are not included in the portfolio risk management strategy.provision. Costs arising from unforeseen circumstances, such as the contamination caused by unplanned discharges, are recognised as an expense and liability when the event gives rise to an obligation which is probable and capable of reliable estimation.
The timing of the actual closure and rehabilitation expenditure is dependent upon a number of factors such as the life and nature of the asset, the operating licence conditions, the principles ofOur BHP Billiton Charter and the environment in which the mine operates. Expenditure may occur before and after closure and can continue for an extended period of time dependent on closure and rehabilitation requirements. The majority of the Group’s debtexpenditure is raised under central borrowing programs. The Group has enteredexpected to be paid over periods of up to 50 years, with some payments into interest rate swapsperpetuity.
Closure and cross currency interest rate swapsrehabilitation provisions are measured at the expected value of future cash flows, discounted to convert mosttheir present value and determined according to the probability of alternative estimates of cash flows occurring for each operation. Discount rates used are specific to the country in which the operation is located. Significant judgements and estimates are involved in forming expectations of future activities and the amount and timing of the centrally managed debt into US dollar floating interest rate exposures. As at 30 June 2013, theassociated cash flows. Those expectations are formed based on existing environmental and regulatory requirements or, if more stringent, Group holds US$5,377 million (2012: US$4,317 million) of centrally managed fixed interest rate borrowings as well as US$4,412 million (2012: US$4,039 million) of other fixed interest rate borrowings that have not been swappedenvironmental policies which give rise to floating interest rates, arising from debt raised during the financial years ended 30 June 2013 and 30 June 2012, debt assumed as part of the acquisition of Petrohawk Energy Corporation and debt raised prior to the DLC merger. The Group’s earnings are sensitive to changes in interest rates on the floating interest rate component of the Group’s net borrowings.
a constructive obligation.The fair value of interest rate swaps and cross currency interest rate swaps in hedge relationships used to hedge both interest rate and foreign currency risks are as follows:
| | | | | | | | |
| | | Fair value | |
| | | 2013 | | | 2012 | |
| | | US$M | | | US$M | |
Interest rate swaps | | | | | | | | |
US dollar swaps | | | | | | | | |
Pay floating/receive fixed | | | | | | | | |
Not later than one year | | | 36 | | | | 51 | |
Later than one year but not later than two years | | | 14 | | | | 66 | |
Later than two years but not later than five years | | | 307 | | | | 428 | |
Later than five years | | | (56 | ) | | | 297 | |
US dollar swaps | | | | | | | | |
Pay fixed/receive floating | | | | | | | | |
Later than five years | | | 362 | | | | (31 | ) |
| | | | | | | | |
Cross currency interest rate swaps | | | | | | | | |
UK pound sterling to US dollar swaps | | | | | | | | |
Pay floating/receive fixed | | | | | | | | |
Later than five years | | | (136 | ) | | | – | |
UK pound sterling to US dollar swaps | | | | | | | | |
Pay fixed/receive fixed | | | | | | | | |
Later than five years | | | (22 | ) | | | – | |
Australian dollar to US dollar swaps | | | | | | | | |
Pay floating /receive fixed | | | | | | | | |
Later than two years but not later than five years | | | (117 | ) | | | – | |
Canadian dollar to US dollar swaps | | | | | | | | |
Pay fixed/receive fixed | | | | | | | | |
Later than five years | | | (31 | ) | | | – | |
Euro to US dollar swaps | | | | | | | | |
Pay floating/receive fixed | | | | | | | | |
Not later than one year | | | 27 | | | | – | |
Later than two years but not later than five years | | | – | | | | 17 | |
Later than five years | | | 33 | | | | (108 | ) |
Euro to US dollar swaps | | | | | | | | |
Pay fixed/receive fixed | | | | | | | | |
Later than two years but not later than five years | | | (45 | ) | | | (117 | ) |
Later than five years | | | 16 | | | | – | |
| | | | | | | | |
Swaptions | | | | | | | | |
Pay floating/receive fixed | | | | | | | | |
Not later than one year | | | (173 | ) | | | (6 | ) |
| | | | | | | | |
Total fair value of derivatives | | | 215 | | | | 597 | |
| | | | | | | | |
Based on the net debt position as at 30 June 2013, taking into account interest rate swaps, cross currency interest rate swaps and swaptions, it is estimated that a one percentage point increase in the US LIBOR interest rate will decrease the Group’s equity and profit after taxation by US$136 million (2012: decrease of US$103 million). This assumes that the change in interest rates is effective from the beginning of the financial year and the fixed/
floating mix and balances are constant over the year. However, interest rates and the net debt profile of the Group may not remain constant over the coming financial year and therefore such sensitivity analysis should be used with care.
Currency risk
The US dollar is the functional currency of most operations within the Group and as a result currency exposures arise from transactions and balances in currencies other than the US dollar. The Group’s potential currency exposures comprise:
translational exposure in respect of non-functional currency monetary items;
transactional exposure in respect of non-functional currency expenditure and revenues.
The Group’s foreign currency risk is managed as part of the portfolio risk management strategy.
Translational exposure in respect of non-functional currency monetary items
Monetary items, including financial assets and liabilities, denominated in currencies other than the functional currency of an operation are periodically restated to US dollar equivalents, and the associated gain or loss is taken to the income statement. The exception is foreign exchange gains or losses on foreign currency denominatedWhen provisions for closure and rehabilitation at operating sites, which are initially recognised, the corresponding cost is capitalised as an asset, representing part of the cost of acquiring the future economic benefits of the operation. The capitalised cost of closure and rehabilitation activities is recognised in property, plant and equipment.equipment and depreciated accordingly. The value of the provision is progressively increased over time as the effect of discounting unwinds, creating an expense recognised in financial expenses.
Closure and rehabilitation provisions are also adjusted for changes in estimates. Those adjustments are accounted for as a change in the corresponding capitalised cost, except where a reduction in the provision is greater than the undepreciated capitalised cost of the related assets, in which case the capitalised cost is reduced to nil and the remaining adjustment is recognised in the income statement. In the case of closed sites, changes to estimated costs are recognised immediately in the income statement. Changes to the capitalised cost result in an adjustment to future depreciation. Adjustments to the estimated amount and timing of future closure and rehabilitation cash flows are a normal occurrence in light of the significant judgements and estimates involved. Factors influencing those changes include:
revisions to estimated reserves, resources and lives of operations;
developments in technology;
regulatory requirements and environmental management strategies;
changes in the estimated extent and costs of anticipated activities, including the effects of inflation and movements in foreign exchange rates; and
movements in interest rates affecting the discount rate applied.
(r) Finance costs
Finance costs are expensed as incurred except where they relate to the financing of construction or development of qualifying assets requiring a substantial period of time to prepare for their intended future use, in which case finance costs are capitalised up to the date when the asset is ready for its intended use. The following table showsamount of finance costs capitalised (before the foreign currency risk arising fromeffects of income tax) for the period is determined by applying the interest rate applicable to appropriate borrowings outstanding during the period, to the average amount of capitalised expenditure for the qualifying assets during the period.
(s) Financial instruments
All financial assets and liabilities, which are denominated in currencies other than the US dollar.
| | | | | | | | |
Net financial (liabilities)/assets – by currency of denomination | | 2013 | | | 2012 | |
| | | US$M | | | US$M | |
Australian dollars | | | (4,144 | ) | | | (5,347 | ) |
South African rand | | | 251 | | | | 366 | |
UK pound sterling | | | 58 | | | | (11 | ) |
Other | | | 94 | | | | (113 | ) |
| | | | | | | | |
Total | | | (3,741 | ) | | | (5,105 | ) |
| | | | | | | | |
The principal non-functional currencies to which the Group is exposed are the Australian dollar, South African rand and UK pound sterling. Based on the Group’s net financial assets and liabilities asinitially recognised at 30 June 2013, a weakening of the US dollar against these currencies as illustrated in the table below, with all other variables held constant, would (decrease)/increase profit after taxation and equity as follows:
| | | | | | | | | | | | | | | | |
| | | 2013 US$M | | | 2012 US$M | |
Currency movement | | Profit
after taxation | | | Equity | | | Profit
after taxation | | | Equity | |
1 cent movement in Australian dollar | | | (31 | ) | | | (31 | ) | | | (38 | ) | | | (37 | ) |
0.2 rand movement in South African rand | | | (2 | ) | | | 4 | | | | (2 | ) | | | 6 | |
1 pence movement in UK pound sterling | | | 1 | | | | – | | | | – | | | | – | |
The Group’s financial asset and liability profile may not remain constant, and therefore these sensitivities should be used with care.
Transactional exposure in respect of non-functional currency expenditure and revenues
Certain operating and capital expenditure is incurred by some operations in currencies other than their functional currency. To a lesser extent, certain sales revenue is earned in currencies other than the functional currency of operations, and certain exchange control restrictions may require that funds be maintained in currencies other than the functional currency of the operation. These currency risks are managed as part of the portfolio risk management strategy. When required under this strategy the Group enters into forward exchange contracts.
The net fair value of forward exchange contracts outstanding to manage short-term foreign currency cash flows relating to operating activities is an asset of US$1 million and a liability of US$1 million (2012: an asset of US$14 million and a liability of US$6 million).
Commodity price risk
Contracts for the sale and physical delivery of commodities are executed whenever possible on a pricing basis intended to achieve a relevant index target. Where pricing terms deviate from the index, derivative commodity contracts may be used when available to return realised prices to the index. Contracts for the physical delivery of commodities are not typically financial instruments and are carried in the balance sheet at cost (typically at nil); they are therefore excluded from the fair value and sensitivity tables below. Accordingly, the financial instrument exposures set out in the tables below do not represent all of the commodity price risks managed according to the Group’s objectives. Movements in the fair value of contracts included in the tables below are offset by movements in the fair value of the physical contracts, however only the former movement is recognised in the Group’s income statement prior to settlement. The risk associated with commodity prices is managed as part of the portfolio risk management strategy.
Financial instruments with commodity price risk included in the following tables are those entered into for the following activities:
economic hedging of prices realised on commodity contracts as described above;
purchases and sales of physical contracts that can be cash-settled;
derivatives embedded within other supply contracts.
All such instruments are carried in the balance sheet at fair value.
Forward commodity and other derivative contracts
| | | | | | | | | | | | | | | | |
| | | 2013 | | | 2012 | |
| | | Fair value
of asset | | | Fair value
of liability | | | Fair value
of asset | | | Fair value
of liability | |
| | | US$M | | | US$M | | | US$M | | | US$M | |
Aluminium | | | 71 | | | | 6 | | | | 160 | | | | 62 | |
Copper | | | 12 | | | | 9 | | | | 57 | | | | 38 | |
Zinc | | | – | | | | 6 | | | | 3 | | | | 5 | |
Lead | | | – | | | | – | | | | 12 | | | | 9 | |
Silver | | | – | | | | 1 | | | | 24 | | | | 24 | |
Nickel | | | 17 | | | | 6 | | | | 32 | | | | 21 | |
Iron ore | | | – | | | | 9 | | | | – | | | | 2 | |
Energy coal | | | – | | | | 12 | | | | 4 | | | | 39 | |
Petroleum | | | – | | | | 17 | | | | – | | | | 27 | |
Gas | | | 142 | | | | – | | | | 228 | | | | 22 | |
Freight | | | – | | | | 6 | | | | 22 | | | | – | |
| | | | | | | | | | | | | | | | |
Total | | | 242 | | | | 72 | | | | 542 | | | | 249 | |
| | | | | | | | | | | | | | | | |
Comprising: | | | | | | | | | | | | | | | | |
Current | | | 58 | | | | 43 | | | | 217 | | | | 188 | |
Non-current | | | 184 | | | | 29 | | | | 325 | | | | 61 | |
The Group’s exposure at 30 June 2013 to the impact of movements in commodity prices upon theconsideration paid. Subsequently, financial instruments, other than those designated as embedded derivatives, is set out in the following table.
| | | | | | | | | | | | | | | | | | |
| | | | | 2013 | | | 2012 | |
| | | Units of exposure | | Net
exposure
receive/
(deliver) | | | Impact on
equity and
profit after
taxation of 10%
increase in
market price | | | Net
exposure
receive/
(deliver) | | | Impact on
equity and
profit after
taxation of 10%
increase in
market price | |
| | | | | | | | US$M | | | | | | US$M | |
Aluminium | | Tonnes (’000s) | | | 2 | | | | – | | | | (73 | ) | | | 15 | |
Copper | | Tonnes (’000s) | | | (12 | ) | | | 8 | | | | 20 | | | | (16 | ) |
Zinc | | Tonnes (’000s) | | | – | | | | – | | | | – | | | | – | |
Lead | | Tonnes (’000s) | | | (2 | ) | | | – | | | | (8 | ) | | | 2 | |
Silver | | Ounces (millions) | | | – | | | | – | | | | – | | | | 3 | |
Nickel | | Tonnes (’000s) | | | (1 | ) | | | 1 | | | | 2 | | | | (4 | ) |
Iron ore | | Tonnes (’000s) | | | (44 | ) | | | 1 | | | | 508 | | | | (7 | ) |
Energy coal | | Tonnes (’000s) | | | 255 | | | | (2 | ) | | | 2,045 | | | | (19 | ) |
Petroleum | | Barrels (’000s) | | | – | | | | – | | | | (1 | ) | | | – | |
Freight | | Time charter days | | | (4,863 | ) | | | 7 | | | | (5,388 | ) | | | 8 | |
Provisionally priced commodity sales contracts
Not included in the above tables are provisionally priced sales volumes for which price finalisation, referenced to the relevant index, is outstanding at balance date. Provisional pricing mechanisms embedded within these sales
arrangements have the character of a commodity derivative andassets are carried at fair value or amortised cost less impairment. Where non-derivative financial assets are carried at fair value, gains and losses on remeasurement are recognised directly in equity unless the financial assets have been designated as part of trade receivables. The Group’s exposurebeing held at 30 June 2013 tofair value through profit or loss, in which case the impact of movements in commodity prices upon provisionally invoiced sales volumes is set outgains and losses are recognised directly in the following table.
| | | | | | | | | | | | | | | | | | |
| | | | | 2013 | | | 2012 | |
| | | Units of exposure | | Net
exposure
(deliver)/
receive | | | Impact on
equity and
profit after
taxation of 10%
increase in
market price | | | Net
exposure
(deliver)/
receive | | | Impact on
equity and
profit after
taxation of 10%
increase in
market price | |
| | | | | | | | US$M | | | | | | US$M | |
Copper | | Tonnes (’000s) | | | (284 | ) | | | 135 | | | | (279 | ) | | | 150 | |
The sensitivities in the above tables have been determinedincome statement. Financial assets are designated as the absolute impact onbeing held at fair value of a 10 per cent increase in commodity prices at each reporting date, while holding all other variables, including foreign currencythrough profit or loss where this is necessary to reduce measurement inconsistencies for related assets and exchange rates, constant.
The relationship between commodity prices and foreign currencies is complex and movements in foreign exchange rates can impact commodity prices. The sensitivities should therefore be used with care.
Liquidity risk
The Group’s liquidity risk arises from the possibility that it may not be able to settle or meet its obligations as they fall due and is managed as part of the portfolio risk management strategy. Operational, capital and regulatory requirements are considered in the management of liquidity risk, in conjunction with short- and long-term forecast information.
Additional liquidity risk arises on debt related derivatives due to the possibility that a market for derivatives might not exist in some circumstances. To counter this risk the Group only uses derivatives in highly liquid markets.
The Group’s long-term credit rating from Moody’s Investor Services is currently A1 (the short-term rating is P-1), and from Standard & Poor’s is A+ (the short-term credit rating is A-1). The ratings outlook from both agencies has not changed during FY2013 or since 30 June 2013.
The Group’s strong credit profile, diversified funding sources and committed credit facilities ensure that sufficient liquid funds are maintained to meet its daily cash requirements. The Group’s policy on counterparty credit exposure ensures that only counterparties of a high credit standing are used for the investment of any excess cash.
There were no defaults on loans payable during the period.
Standby arrangements and unused credit facilities
Details of major standby and support arrangements are as follows:
| | | | | | | | | | | | | | | | | | | | | | | | |
| | | Facility
available
2013 | | | Used
2013 | | | Unused
2013 | | | Facility
available
2012 | | | Used
2012 | | | Unused
2012 | |
| | | US$M | | | US$M | | | US$M | | | US$M | | | US$M | | | US$M | |
Commercial paper program(a) | | | 6,000 | | | | (1,330 | ) | | | 4,670 | | | | 4,000 | | | | (995 | ) | | | 3,005 | |
Other facilities(b) | | | 59 | | | | – | | | | 59 | | | | 60 | | | | – | | | | 60 | |
| | | | | | | | | | | | | | | | | | | | | | | | |
Total financing facilities | | | 6,059 | | | | (1,330 | ) | | | 4,729 | | | | 4,060 | | | | (995 | ) | | | 3,065 | |
| | | | | | | | | | | | | | | | | | | | | | | | |
(a) | The Group has a US$6.0 billion commercial paper program backed by US$6.0 billion of revolving credit facilities. The multi-currency revolving credit facilities consist of US$5.0 billion expiring in December 2015 and US$1.0 billion expiring in December 2013 with the ability to extend to December 2014. These facilities are used for general corporate purposes and as backup for the commercial paper programs. The interest rates under these facilities are based on an interbank rate plus a margin. The applicable margin is typical for a credit facility extended to a company with the Group’s credit rating. The Group had US$1.3 billion outstanding in the US commercial paper market at the end of the financial year (2012: US$995 million). |
(b) | Other bank facilities are arranged with a number of banks with the general terms and conditions agreed on a periodic basis. |
Maturity profile of financial liabilities
The maturity profile of the Group’s financial liabilities based on the contractual amounts, taking into account the derivatives related to debt, is as follows:
| | | | | | | | | | | | | | | | | | | | | | | | | | | | |
2013 | | Bank
loans,
debentures
and
other
loans(a) | | | Expected
future
interest
payments | | | Derivatives
related to
net debt | | | Other
derivatives | | | Obligations
under
finance
leases | | | Other
financial
liabilities (a) | | | Total | |
| | | US$M | | | US$M | | | US$M | | | US$M | | | US$M | | | US$M | | | US$M | |
Due for payment: | | | | | | | | | | | | | | | | | | | | | | | | | | | | |
In one year or less or on demand | | | 5,196 | | | | 845 | | | | 13 | | | | 46 | | | | 71 | | | | 10,622 | | | | 16,793 | |
In more than one year but not more than two years | | | 2,858 | | | | 1,005 | | | | (138 | ) | | | 3 | | | | 46 | | | | 61 | | | | 3,835 | |
In more than two years but not more than three years | | | 3,671 | | | | 914 | | | | 9 | | | | 4 | | | | 28 | | | | 27 | | | | 4,653 | |
In more than three years but not more than four years | | | 3,430 | | | | 770 | | | | 73 | | | | 2 | | | | 24 | | | | 11 | | | | 4,310 | |
In more than four years but not more than five years | | | 1,031 | | | | 683 | | | | 266 | | | | 15 | | | | 9 | | | | 11 | | | | 2,015 | |
In more than five years | | | 18,653 | | | | 4,913 | | | | 1,233 | | | | 3 | | | | 25 | | | | 205 | | | | 25,032 | |
| | | | | | | | | | | | | | | | | | | | | | | | | | | | |
| | | 34,839 | | | | 9,130 | | | | 1,456 | | | | 73 | | | | 203 | | | | 10,937 | | | | 56,638 | |
| | | | | | | | | | | | | | | | | | | | | | | | | | | | |
Carrying amount | | | 34,978 | | | | – | | | | 726 | | | | 73 | | | | 172 | | | | 10,937 | | | | 46,886 | |
| | | | | | | | | | | | | | | | | | | | | | | | | | | | |
| | | | | | | | | | | | | | | | | | | | | | | | | | | | |
2012 | | Bank
loans,
debentures
and
other
loans(a) | | | Expected
future
interest
payments | | | Derivatives
related to
net debt | | | Other
derivatives | | | Obligations
under
finance
leases | | | Other
financial
liabilities (a) | | | Total | |
| | | US$M | | | US$M | | | US$M | | | US$M | | | US$M | | | US$M | | | US$M | |
Due for payment: | | | | | | | | | | | | | | | | | | | | | | | | | | | | |
In one year or less or on demand | | | 3,587 | | | | 977 | | | | 52 | | | | 168 | | | | 80 | | | | 11,855 | | | | 16,719 | |
In more than one year but not more than two years | | | 3,964 | | | | 894 | | | | 30 | | | | 22 | | | | 58 | | | | 170 | | | | 5,138 | |
In more than two years but not more than three years | | | 2,132 | | | | 725 | | | | 30 | | | | 5 | | | | 43 | | | | 37 | | | | 2,972 | |
In more than three years but not more than four years | | | 3,949 | | | | 632 | | | | 137 | | | | 8 | | | | 41 | | | | 3 | | | | 4,770 | |
In more than four years but not more than five years | | | 2,836 | | | | 496 | | | | 21 | | | | 8 | | | | 39 | | | | 32 | | | | 3,432 | |
In more than five years | | | 11,082 | | | | 2,409 | | | | 98 | | | | 44 | | | | 21 | | | | 332 | | | | 13,986 | |
| | | | | | | | | | | | | | | | | | | | | | | | | | | | |
| | | 27,550 | | | | 6,133 | | | | 368 | | | | 255 | | | | 282 | | | | 12,429 | | | | 47,017 | |
| | | | | | | | | | | | | | | | | | | | | | | | | | | | |
Carrying amount | | | 28,256 | | | | – | | | | 262 | | | | 255 | | | | 237 | | | | 12,429 | | | | 41,439 | |
| | | | | | | | | | | | | | | | | | | | | | | | | | | | |
(a) | Includes secured debt of US$ nil (2012: US$178 million) and trade and other payables of US$41 million (2012: US$153 million) included in liabilities held for sale – refer to note 25 Assets and liabilities held for sale. |
The amounts presented in the tables above comprise the contractual undiscounted cash flows, and therefore will not always agree with the amounts presented in the balance sheet. The Group holds derivatives related to net debt, commodities and currencies that are classified as other financial assets when they are expected to generate cash inflows – refer to note 11 Other financial assets.
Credit risk
Credit risk arises from the non-performance by counterparties of their contractual financial obligations towards the Group. To manage credit risk the Group maintains Group-wide procedures covering the application for credit approvals, granting and renewal of counterparty limits and daily monitoring of exposures against these limits. As part of these processes the financial viability of all counterparties is regularly monitored and assessed. The maximum exposure to credit risk is limited to the total carrying value of relevant financial assets on the balance sheet as at the reporting date.
The Group’s credit risk exposures are categorised under the following headings:
Counterparties
The Group conducts transactions with the following major types of counterparties:
• | | Receivables counterparties |
Approximately half of sales to the Group’s customers are made on open terms.
• | | Payment guarantee counterparties |
Approximately half of sales to the Group customers occur via secured payment mechanisms.
• | | Derivative counterparties |
Counterparties to derivative contracts consist of a diverse number of financial institutions and industrial counterparties in the relevant markets.
• | | Cash investment counterparties |
As part of managing cash flow and liquidity, the Group holds short-term cash investments with a range of approved financial institutions.
The Group has no significant concentration of credit risk with any single counterparty or group of counterparties.
Geographic
The Group trades in all major geographic regions. Countries in which the Group has a significant credit risk exposure include South Africa, Australia, the United States, Japan and China. Where appropriate, secured payment mechanisms and other risk mitigation instruments are used to protect revenues from credit risk losses.
Industry
In line with our asset portfolio, the Group sells into a diverse range of industries and customer sectors. This diversity means that the Group is not materially exposed to any individual industry or customer.
The following table shows the Group’s receivables at the reporting date that are exposed to credit risk and the ageing and impairment profile thereon.
| | | | | | | | | | | | | | | | | | | | | | | | | | | | |
2013 | | Gross
amount | | | Receivables
past due
and
impaired | | | Receivables
neither past
due nor
impaired | | | Receivables past due but not impaired | |
| | | | | Less than
30 days | | | 31 to 60
days | | | 61 to 90
days | | | Over
90 days | |
| | | US$M | | | US$M | | | US$M | | | US$M | | | US$M | | | US$M | | | US$M | |
Trade receivables | | | 4,674 | | | | 116 | | | | 4,497 | | | | 37 | | | | 1 | | | | – | | | | 23 | |
Other receivables | | | 3,759 | | | | 10 | | | | 3,323 | | | | 103 | | | | 34 | | | | 49 | | | | 240 | |
| | | | | | | | | | | | | | | | | | | | | | | | | | | | |
Total | | | 8,433 | | | | 126 | | | | 7,820 | | | | 140 | | | | 35 | | | | 49 | | | | 263 | |
| | | | | | | | | | | | | | | | | | | | | | | | | | | | |
| | | | | | | | | | | | | | | | | | | | | | | | | | | | |
2012 | | Gross
amount | | | Receivables
past due
and
impaired | | | Receivables
neither past
due nor
impaired | | | Receivables past due but not impaired | |
| | | | | Less than
30 days | | | 31 to 60
days | | | 61 to 90
days | | | Over 90
days | |
| | | US$M | | | US$M | | | US$M | | | US$M | | | US$M | | | US$M | | | US$M | |
Trade receivables | | | 4,844 | | | | 121 | | | | 4,603 | | | | 76 | | | | 3 | | | | – | | | | 41 | |
Other receivables | | | 4,501 | | | | 45 | | | | 3,713 | | | | 342 | | | | 85 | | | | 56 | | | | 260 | |
| | | | | | | | | | | | | | | | | | | | | | | | | | | | |
Total | | | 9,345 | | | | 166 | | | | 8,316 | | | | 418 | | | | 88 | | | | 56 | | | | 301 | |
| | | | | | | | | | | | | | | | | | | | | | | | | | | | |
Receivables are deemed to be past due or impaired with reference to the Group’s normal terms and conditions of business. These terms and conditions are determined on a case-by-case basis with reference to the customer’s credit quality and prevailing market conditions. Receivables that are classified as ‘past due’ in the above tables
are those that have not been settled within the terms and conditions that have been agreed with that customer. For an analysis of movements in impaired trade receivables, refer to note 10 Trade and other receivables.
The credit quality of the Group’s customers is monitored on an ongoing basis and assessed for impairment where indicators of such impairment exist. The solvency of each debtor and their ability to repay the receivable is considered in assessing receivables for impairment. In certain circumstances the Group may seek collateral as security for the receivable. Where receivables have been impaired, the Group actively seeks to recover the amounts in question and enforce compliance with credit terms.
No other financial assets were past due or impaired at 30 June 2013 (30 June 2012: nil).
Fair values
liabilities. All financial assets and financial liabilities other than derivatives are initially recognised at the fair value of consideration paid or received net of transaction costs as appropriate (initial cost) and, with the exception of financial liabilities which have been designated in fair value hedging relationships, are subsequently carried at fair value or amortised cost, as indicatedcost.
Derivatives, including those embedded in other contractual arrangements but separated for accounting purposes because they are not clearly and closely related to the tables below. Derivativeshost contract, are initially recognised at fair value on the date the contract is entered into and are subsequently remeasured at their fair value.
The financial assetsmethod of recognising the resulting gain or loss on remeasurement depends on whether the derivative is designated as a hedging instrument, and, liabilities are presented by class inif so, the tables below at their carrying values, which generally approximate tonature of the fair values. In the caseitem being hedged. The measurement of US$5,377 million (2012: US$4,317 million) of centrally managed fixed rate debt and other fixed interest borrowings of US$4,412 million (2012: US$4,039 million) not swapped to floating rate, the fair values at 30 June 2013 were US$5,164 million (2012: US$4,552 million) and US$4,280 million (2012: US$4,034 million) respectively.
Financial assets and liabilities
| | | | | | | | | | | | | | | | | | | | | | | | | | | | |
2013 | | Notes | | | Loans and
receivables | | | Available
for sale
securities | | | Held at
fair value
through
profit
or loss | | | Cash
flow
hedges | | | Other
financial
assets and
liabilities
at
amortised
cost | | | Total | |
| | | | | | US$M | | | US$M | | | US$M | | | US$M | | | US$M | | | US$M | |
Financial assets | | | | | | | | | | | | | | | | | | | | | | | | | | | | |
Cash and cash equivalents(a) | | | 23 | | | | 6,060 | | | | – | | | | – | | | | – | | | | – | | | | 6,060 | |
Trade and other receivables (b) (c) | | | 10 | | | | 5,754 | | | | – | | | | 957 | | | | – | | | | – | | | | 6,711 | |
Cross currency and interest rate swaps | | | 11 | | | | – | | | | – | | | | 858 | | | | 83 | | | | – | | | | 941 | |
Forward exchange contracts | | | 11 | | | | – | | | | – | | | | 1 | | | | – | | | | – | | | | 1 | |
Commodity contracts | | | 11 | | | | – | | | | – | | | | 47 | | | | – | | | | – | | | | 47 | |
Other derivative contracts | | | 11 | | | | – | | | | – | | | | 195 | | | | – | | | | – | | | | 195 | |
Interest bearing loans receivable | | | 10 | | | | 1,104 | | | | – | | | | – | | | | – | | | | – | | | | 1,104 | |
Shares | | | 11 | | | | – | | | | 534 | | | | – | | | | – | | | | – | | | | 534 | |
Other investments | | | 11 | | | | – | | | | 139 | | | | – | | | | – | | | | – | | | | 139 | |
| | | | | | | | | | | | | | | | | | | | | | | | | | | | |
Total financial assets | | | | | | | 12,918 | | | | 673 | | | | 2,058 | | | | 83 | | | | – | | | | 15,732 | |
| | | | | | | | | | | | | | | | | | | | | | | | | | | | |
Non-financial assets | | | | | | | | | | | | | | | | | | | | | | | | | | | 122,377 | |
| | | | | | | | | | | | | | | | | | | | | | | | | | | | |
Total assets | | | | | | | | | | | | | | | | | | | | | | | | | | | 138,109 | |
| | | | | | | | | | | | | | | | | | | | | | | | | | | | |
Financial liabilities | | | | | | | | | | | | | | | | | | | | | | | | | | | | |
Trade and other payables(d) (e) | | | 15 | | | | – | | | | – | | | | – | | | | – | | | | 10,922 | | | | 10,922 | |
Cross currency and interest rate swaps, and swaptions | | | 17 | | | | – | | | | – | | | | 555 | | | | 171 | | | | – | | | | 726 | |
Forward exchange contracts | | | 17 | | | | – | | | | – | | | | 1 | | | | – | | | | – | | | | 1 | |
Commodity contracts | | | 17 | | | | – | | | | – | | | | 27 | | | | – | | | | – | | | | 27 | |
Other derivative contracts | | | 17 | | | | – | | | | – | | | | 45 | | | | – | | | | – | | | | 45 | |
Unsecured bank overdrafts and short-term borrowings | | | 16 | | | | – | | | | – | | | | – | | | | – | | | | 10 | | | | 10 | |
Unsecured bank loans | | | 16 | | | | – | | | | – | | | | – | | | | – | | | | 817 | | | | 817 | |
Commercial paper | | | 16 | | | | – | | | | – | | | | – | | | | – | | | | 1,330 | | | | 1,330 | |
Notes and debentures(f) | | | 16 | | | | – | | | | – | | | | – | | | | – | | | | 30,875 | | | | 30,875 | |
Secured bank and other loans (g) | | | 16 | | | | – | | | | – | | | | – | | | | – | | | | 1,475 | | | | 1,475 | |
Redeemable preference shares | | | 16 | | | | – | | | | – | | | | – | | | | – | | | | 15 | | | | 15 | |
Finance leases | | | 16 | | | | – | | | | – | | | | – | | | | – | | | | 172 | | | | 172 | |
Unsecured other | | | 16 | | | | – | | | | – | | | | – | | | | – | | | | 471 | | | | 471 | |
| | | | | | | | | | | | | | | | | | | | | | | | | | | | |
Total financial liabilities | | | | | | | – | | | | – | | | | 628 | | | | 171 | | | | 46,087 | | | | 46,886 | |
| | | | | | | | | | | | | | | | | | | | | | | | | | | | |
Non-financial liabilities | | | | | | | | | | | | | | | | | | | | | | | | | | | 19,188 | |
| | | | | | | | | | | | | | | | | | | | | | | | | | | | |
Total liabilities | | | | | | | | | | | | | | | | | | | | | | | | | | | 66,074 | |
| | | | | | | | | | | | | | | | | | | | | | | | | | | | |
| | | | | | | | | | | | | | | | | | | | | | | | | | | | |
2012 | | Notes | | | Loans and
receivables | | | Available
for sale
securities | | | Held at
fair value
through
profit
or loss | | | Cash
flow
hedges | | | Other
financial
assets and
liabilities
at
amortised
cost | | | Total | |
| | | | | | US$M | | | US$M | | | US$M | | | US$M | | | US$M | | | US$M | |
Financial assets | | | | | | | | | | | | | | | | | | | | | | | | | | | | |
Cash and cash equivalents(a) | | | 23 | | | | 4,901 | | | | – | | | | – | | | | – | | | | – | | | | 4,901 | |
Trade and other receivables (b) (c) | | | 10 | | | | 6,503 | | | | – | | | | 1,228 | | | | – | | | | – | | | | 7,731 | |
Cross currency and interest rate swaps | | | 11 | | | | – | | | | – | | | | 859 | | | | – | | | | – | | | | 859 | |
Forward exchange contracts | | | 11 | | | | – | | | | – | | | | 14 | | | | – | | | | – | | | | 14 | |
Commodity contracts | | | 11 | | | | – | | | | – | | | | 251 | | | | – | | | | – | | | | 251 | |
Other derivative contracts | | | 11 | | | | – | | | | – | | | | 291 | | | | – | | | | – | | | | 291 | |
Interest bearing loans receivable | | | 10 | | | | 1,014 | | | | – | | | | – | | | | – | | | | – | | | | 1,014 | |
Shares | | | 11 | | | | – | | | | 602 | | | | – | | | | – | | | | – | | | | 602 | |
Other investments | | | 11 | | | | – | | | | 146 | | | | – | | | | – | | | | – | | | | 146 | |
| | | | | | | | | | | | | | | | | | | | | | | | | | | | |
Total financial assets | | | | | | | 12,418 | | | | 748 | | | | 2,643 | | | | – | | | | – | | | | 15,809 | |
| | | | | | | | | | | | | | | | | | | | | | | | | | | | |
Non-financial assets | | | | | | | | | | | | | | | | | | | | | | | | | | | 113,464 | |
| | | | | | | | | | | | | | | | | | | | | | | | | | | | |
Total assets | | | | | | | | | | | | | | | | | | | | | | | | | | | 129,273 | |
| | | | | | | | | | | | | | | | | | | | | | | | | | | | |
Financial liabilities | | | | | | | | | | | | | | | | | | | | | | | | | | | | |
Trade and other payables(d) (e) | | | 15 | | | | – | | | | – | | | | – | | | | – | | | | 12,414 | | | | 12,414 | |
Cross currency and interest rate swaps, and swaptions | | | 17 | | | | – | | | | – | | | | 107 | | | | 155 | | | | – | | | | 262 | |
Forward exchange contracts | | | 17 | | | | – | | | | – | | | | 6 | | | | – | | | | – | | | | 6 | |
Commodity contracts | | | 17 | | | | – | | | | – | | | | 178 | | | | – | | | | – | | | | 178 | |
Other derivative contracts | | | 17 | | | | – | | | | – | | | | 71 | | | | – | | | | – | | | | 71 | |
Unsecured bank overdrafts and short-term borrowings | | | 16 | | | | – | | | | – | | | | – | | | | – | | | | 20 | | | | 20 | |
Unsecured bank loans | | | 16 | | | | – | | | | – | | | | – | | | | – | | | | 827 | | | | 827 | |
Commercial paper | | | 16 | | | | – | | | | – | | | | – | | | | – | | | | 995 | | | | 995 | |
Notes and debentures(f) | | | 16 | | | | – | | | | – | | | | – | | | | – | | | | 24,385 | | | | 24,385 | |
Secured bank and other loans (g) | | | 16 | | | | – | | | | – | | | | – | | | | – | | | | 1,470 | | | | 1,470 | |
Redeemable preference shares | | | 16 | | | | – | | | | – | | | | – | | | | – | | | | 15 | | | | 15 | |
Finance leases | | | 16 | | | | – | | | | – | | | | – | | | | – | | | | 237 | | | | 237 | |
Unsecured other | | | 16 | | | | – | | | | – | | | | – | | | | – | | | | 559 | | | | 559 | |
| | | | | | | | | | | | | | | | | | | | | | | | | | | | |
Total financial liabilities | | | | | | | – | | | | – | | | | 362 | | | | 155 | | | | 40,922 | | | | 41,439 | |
| | | | | | | | | | | | | | | | | | | | | | | | | | | | |
Non-financial liabilities | | | | | | | | | | | | | | | | | | | | | | | | | | | 20,749 | |
| | | | | | | | | | | | | | | | | | | | | | | | | | | | |
Total liabilities | | | | | | | | | | | | | | | | | | | | | | | | | | | 62,188 | |
| | | | | | | | | | | | | | | | | | | | | | | | | | | | |
(a) | Includes cash and cash equivalents of US$ nil (2012: US$120 million) included in assets held for sale – refer to note 25 Assets and liabilities held for sale. |
(b) | Excludes input taxes of US$509 million (2012: US$630 million) included in other receivables – refer to note 10 Trade and other receivables. |
(c) | Includes trade and other receivables of US$17 million (2012: US$196 million) included in assets held for sale – refer to note 25 Assets and liabilities held for sale. |
(d) | Excludes input taxes of US$293 million (2012: US$272 million) included in other payables – refer to note 15 Trade and other payables. |
(e) | Includes trade and other payables of US$41 million (2012: US$153 million) included in liabilities held for sale – refer to note 25 Assets and liabilities held for sale. |
(f) | Includes US$5,992 million (2012: US$4,317 million) of fixed rate debt not swapped to floating rate, US$3,491 million (2012: US$3,569 million) of fixed rate debt assumed as part of the acquisition of Petrohawk Energy Corporation and US$21,392 million (2012: US$16,499 million) of other debt swapped to floating rate under fair value hedges that is consistently fair valued for interest rate risk. |
(g) | Includes secured debt of US$ nil (2012: US$178 million) included in liabilities held for sale – refer to note 25 Assets and liabilities held for sale. |
Valuation hierarchy
The carrying amount of financial assets and liabilities measured at fair value is principally calculated with reference tobased on quoted prices in active markets for identical assets or liabilities.market prices. Where no price information is available from a quoted market source, alternative market mechanisms or recent comparable transactions, fair value is estimated based on the Group’s views on relevant future prices, net of valuation allowances to accommodate liquidity, modelling credit and other risks implicit in such estimates. Movements
Forward exchange contracts and interest rate swaps held for hedging purposes are accounted for as either cash flow or fair value hedges. Derivatives embedded within other contractual arrangements and the majority of commodity-based transactions executed through derivative contracts do not qualify for hedge accounting.
Fair value hedges
Changes in the fair value of financial assetsderivatives that are designated and liabilities may be recognised throughqualify as fair value hedges are recorded in the income statement, together with any changes in the fair value of the hedged asset or liability that are attributable to the hedged risk. Any difference between the change in fair value of the derivative and the hedged risk constitutes ineffectiveness of the hedge and is recognised immediately in the income statement.
Cash flow hedges
The effective portion of changes in the fair value of derivatives that are designated and qualify as cash flow hedges is recognised in equity in the hedging reserve. The gain or loss relating to the ineffective portion is recognised immediately in the income statement.
Amounts accumulated in equity are recycled to the income statement in the periods when the hedged item affects profit or loss. However, when the forecast transaction that is hedged results in the recognition of a non-financial asset (for example, plant and equipment purchases) or a non-financial liability, the gains and losses previously deferred in equity are transferred from equity and included in the measurement of the initial carrying amount of the asset or liability.
When a hedging instrument expires or is sold or terminated, or when a hedge ceases to meet the criteria for hedge accounting, any cumulative gain or loss existing in equity at that time remains in equity and is recognised when the forecast transaction is ultimately recognised in the income statement. When a hedged forecast transaction is no longer expected to occur, the cumulative hedge gain or loss that was reported in equity is immediately transferred to the income statement.
Derivatives that do not qualify for hedge accounting
Certain derivative instruments do not qualify for hedge accounting. Changes in the fair value of any derivative instrument that does not qualify for hedge accounting are recognised immediately in the income statement.
Available for sale and trading investments
Available for sale and trading investments are measured at fair value. Gains and losses on the remeasurement of trading investments are recognised directly in the income statement. Gains and losses on the remeasurement of available for sale investments are recognised directly in equity and subsequently recognised in the income statement when realised by sale or redemption, or when a reduction in fair value is judged to represent an impairment.
(t) Share-based payments
The fair value at grant date of equity-settled share awards is charged to the income statement over the period for which the benefits of employee services are expected to be derived. The corresponding accrued employee entitlement is recorded in the employee share awards reserve. The fair value of awards is calculated using an option pricing model which considers the following factors:
exercise price;
expected life of the award;
current market price of the underlying shares;
expected volatility;
expected dividends;
risk-free interest rate;
market-based performance hurdles; and
non-vesting conditions.
Where awards are forfeited because non-market-based vesting conditions are not satisfied, the expense previously recognised is proportionately reversed. Where shares in BHP Billiton Limited or BHP Billiton Plc are acquired by on-market purchases prior to settling vested entitlements, the cost of the acquired shares is carried as treasury shares and deducted from equity. Where awards are satisfied by delivery of acquired shares, any difference between their acquisition cost and the remuneration expense recognised is charged directly to retained earnings. The tax effect of awards granted is recognised in income tax expense, except to the extent that the total tax deductions are expected to exceed the cumulative remuneration expense. In this situation, the excess of the associated current or deferred tax is recognised in other comprehensive income. The following table showsincome and forms part of the employee share awards reserve.
(u) Provision for employee benefits
Provision is made in the financial statements for all employee benefits, including on costs. In relation to industry-based long service leave funds, the Group’s financial assets and liabilities carried atliability, including obligations for funding shortfalls, is determined after deducting the fair value with referenceof dedicated assets of such funds.
Liabilities for unpaid wages and salaries are recognised in sundry creditors. Current entitlements to annual leave and accumulating sick leave accrued for services up to the nature of valuation inputs used.
| | | | | | | | | | | | | | | | |
2013 | | Level 1 (a) | | | Level 2 (b) | | | Level 3 (c) | | | Total | |
| | | US$M | | | US$M | | | US$M | | | US$M | |
Financial assets and liabilities | | | | | | | | | | | | | | | | |
Trade and other receivables | | | – | | | | 957 | | | | – | | | | 957 | |
Cross currency and interest rate swaps, and swaptions | | | – | | | | 215 | | | | – | | | | 215 | |
Forward exchange contracts | | | – | | | | – | | | | – | | | | – | |
Commodity contracts | | | – | | | | 20 | | | | – | | | | 20 | |
Other derivative contracts | | | – | | | | (13 | ) | | | 163 | | | | 150 | |
Investments – available for sale | | | 5 | | | | 141 | | | | 527 | | | | 673 | |
| | | | | | | | | | | | | | | | |
Total | | | 5 | | | | 1,320 | | | | 690 | | | | 2,015 | |
| | | | | | | | | | | | | | | | |
| | | | | | | | | | | | | | | | |
2012 | | Level 1 (a) | | | Level 2 (b) | | | Level 3 (c) | | | Total | |
| | | US$M | | | US$M | | | US$M | | | US$M | |
Financial assets and liabilities | | | | | | | | | | | | | | | | |
Trade and other receivables | | | – | | | | 1,228 | | | | – | | | | 1,228 | |
Cross currency and interest rate swaps, and swaptions | | | – | | | | 603 | | | | – | | | | 603 | |
Forward exchange contracts | | | – | | | | 8 | | | | – | | | | 8 | |
Commodity contracts | | | – | | | | 73 | | | | – | | | | 73 | |
Other derivative contracts | | | – | | | | (16 | ) | | | 230 | | | | 214 | |
Investments – available for sale | | | 7 | | | | 151 | | | | 590 | | | | 748 | |
| | | | | | | | | | | | | | | | |
Total | | | 7 | | | | 2,047 | | | | 820 | | | | 2,874 | |
| | | | | | | | | | | | | | | | |
(a) | Valuation is based on unadjusted quoted prices in active markets for identical financial assets and liabilities. |
(b) | Valuation is based on inputs (other than quoted prices included in Level 1) that are observable for the financial asset or liability, either directly (i.e. as unquoted prices) or indirectly (i.e. derived from prices). |
(c) | Valuation is based on inputs that are not based on observable market data. |
Level 3 financial assetsreporting date are recognised in provision for employee benefits and liabilitiesare measured at the amounts expected to be paid. Entitlements to non-accumulating sick leave are recognised when the leave is taken.
The following table showscurrent liability for long service leave (for which settlement within 12 months of the movementsreporting date cannot be deferred) is recognised in the Group’s level 3 financial assetscurrent provision for employee benefits and liabilities.
| | | | | | | | |
| | | 2013 | | | 2012 | |
| | | US$M | | | US$M | |
At the beginning of the financial year | | | 820 | | | | 602 | |
Additions | | | 36 | | | | 36 | |
Disposals | | | (8 | ) | | | – | |
Realised (losses)/gains recognised in the income statement(a) | | | (13 | ) | | | 33 | |
Unrealised (losses)/gains recognised in the income statement(a) | | | (54 | ) | | | 155 | |
Unrealised (losses)/gains recognised in other comprehensive income(b) | | | (91 | ) | | | (6 | ) |
| | | | | | | | |
At the end of the financial year | | | 690 | | | | 820 | |
| | | | | | | | |
(a) | Realised and unrealised gains and lossesis measured in accordance with annual leave described above. The non-current liability for long service leave is recognised in the income statement are recorded in expenses – refer to note 5 Expenses. |
(b) | Unrealised gains and losses recognised in other comprehensive income are recorded in the financial assets reserve – refer to note 20 Other equity. |
Sensitivity of Level 3 financial assets and liabilities
The carrying amount of financial assets and liabilities that are valued using inputs other than observable market data are calculated using appropriate valuation models, including discounted cash flow modelling, with inputs such as commodity prices, foreign exchange rates and inflation. The potential effect of using reasonably possible alternative assumptions in these models, based on a change in the most significant inputnon-current provision for employee benefits and measured as the present value of expected future payments to be made in respect of services provided by 10 per cent while holding all other variables constant, is shown in the following table. Significant inputs are assessed individually for each financial asset and liability.
| | | | | | | | | | | | | | | | | | | | |
| | | | | | Profit after taxation | | | Equity | |
2013 | | Carrying
value | | | 10% increase
in input | | | 10% decrease
in input | | | 10% increase
in input | | | 10% decrease
in input | |
| | | US$M | | | US$M | | | US$M | | | US$M | | | US$M | |
Financial assets and liabilities | | | | | | | | | | | | | | | | | | | | |
Other derivative contracts | | | 163 | | | | 42 | | | | (41 | ) | | | 42 | | | | (41 | ) |
Investments – available for sale | | | 527 | | | | – | | | | – | | | | 71 | | | | (67 | ) |
| | | | | | | | | | | | | | | | | | | | |
Total | | | 690 | | | | 42 | | | | (41 | ) | | | 113 | | | | (108 | ) |
| | | | | | | | | | | | | | | | | | | | |
| | | | | | | | | | | | | | | | | | | | |
| | | | | | Profit after taxation | | | Equity | |
2012 | | Carrying
value | | | 10% increase
in input | | | 10% decrease
in input | | | 10% increase
in input | | | 10% decrease
in input | |
| | | US$M | | | US$M | | | US$M | | | US$M | | | US$M | |
Financial assets and liabilities | | | | | | | | | | | | | | | | | | | | |
Other derivative contracts | | | 230 | | | | 15 | | | | (11 | ) | | | 15 | | | | (11 | ) |
Investments – available for sale | | | 590 | | | | – | | | | – | | | | 43 | | | | (49 | ) |
| | | | | | | | | | | | | | | | | | | | |
Total | | | 820 | | | | 15 | | | | (11 | ) | | | 58 | | | | (60 | ) |
| | | | | | | | | | | | | | | | | | | | |
Capital management
The Group’s strategy is to own and operate large, long-life, low-cost, expandable, upstream assets diversified by commodity, geography and market and the Group continually reviews its portfolio to identify assets which do not fit this strategy. The Group will invest capital in assets where they fit our strategy. The Group’s priorities for cash flow are:
reinvestment in projects that carry attractive rates of return regardless of the economic climate;
commitment to a solid ‘A’ credit rating; and
returning excess capital to shareholders firstly with its progressive dividends policy and thereafter via capital management initiatives (for example share buy-backs).
Further information relevantemployees up to the actionsreporting date. Consideration is given to expected future wage and outcomessalary levels, experience of employee departures and periods of service. Expected future payments are discounted using market yields at the Group’s capital management strategy is contained in section 9.1.4 Consolidated Cash Flow Statement, note 9 Dividends, note 19 Share capitalreporting date on national government bonds with terms to maturity and note 20 Other equity.currency that match, as closely as possible, the estimated future cash outflows.
The Group monitors capital using a gearing ratio, being the ratio of net debt to net debt plus net assets. Our policy is for net gearing to be a maximum of 40 per cent.
| | | | | | | | |
| | | 2013 | | | 2012 | |
| | | US$M | | | US$M | |
Cash and cash equivalents | | | (6,060 | ) | | | (4,901 | ) |
Current debt | | | 5,303 | | | | 3,546 | |
Non-current debt | | | 29,862 | | | | 24,962 | |
| | | | | | | | |
Net debt(a) | | | 29,105 | | | | 23,607 | |
| | | | | | | | |
Net assets | | | 72,035 | | | | 67,085 | |
| | | | | | | | |
Gearing | | | 28.8 | % | | | 26.0 | % |
| | | | | | | | |
(a) | Includes cash and cash equivalents of US$ nil (2012: US$120 million) and secured debt of US$ nil (2012: US$178 million) included in assets and liabilities held for sale – refer to note 25 Assets and liabilities held for sale. |
30 Pension(v) Superannuation, pensions and other post-retirement obligations
Defined contribution pension schemes and multi-employer pension schemes
The Group contributed US$456 million (2012: US$388 million; 2011: US$336 million) to defined contribution plans and multi-employer defined contribution plans. These contributions are expensed as incurred.
Defined benefit pension schemes
The Group has closed all defined benefit schemes to new entrants. Defined benefit pension schemes remain operating in Australia, the US, Canada, South America, Europe and South Africa for existing members. Full actuarial valuations are prepared and updated annually to 30 June by local actuaries for all schemes. The Projected Unit Credit valuation method is used. The Group operates final salary schemes that provide final salary benefits only, non-salary related schemes that provide flat dollar benefits and mixed benefit schemes that consist of a final salary defined benefit portion and a defined contribution portion.
Defined benefit post-retirement medical schemes
The Group operates or participates in a number of post-retirement medicalpension (including superannuation) schemes inthroughout the US, Canada, Europe and South Africa. Full actuarial valuations are prepared by local actuaries for all schemes. Allworld. The funding of the post-retirement medical schemes incomplies with local regulations. The assets of the schemes are generally held separately from those of the Group and are unfunded.administered by trustees or management boards.
The following tables set out details ofFor defined contribution schemes or schemes operated on an industry-wide basis where it is not possible to identify assets attributable to the participation by the Group’s employees, the pension charge is calculated on the basis of contributions payable.
For defined benefit pensionschemes, the cost of providing pensions is charged to the income statement so as to recognise current and post-retirement medical schemes.
Balance sheet disclosures
The amountspast service costs, interest cost on defined benefit obligations, and the effect of any curtailments or settlements, net of returns on plan assets. Remeasurement gains and losses are recognised directly in equity. An asset or liability is consequently recognised in the consolidated balance sheet are as follows:
| | | | | | | | | | | | | | | | |
| | | Defined benefit
pension schemes | | | Post-retirement
medical schemes | |
| | | 2013 | | | 2012 | | | 2013 | | | 2012 | |
| | | US$M | | | US$M | | | US$M | | | US$M | |
Present value of funded defined benefit obligation | | | 1,839 | | | | 2,103 | | | | – | | | | – | |
Present value of unfunded defined benefit obligation | | | 112 | | | | 112 | | | | 410 | | | | 446 | |
Fair value of defined benefit scheme assets | | | (1,891 | ) | | | (1,935 | ) | | | – | | | | – | |
| | | | | | | | | | | | | | | | |
Scheme deficit | | | 60 | | | | 280 | | | | 410 | | | | 446 | |
| | | | | | | | | | | | | | | | |
Unrecognised surplus | | | 70 | | | | 52 | | | | – | | | | – | |
Unrecognised past service credits | | | – | | | | – | | | | 5 | | | | 4 | |
Adjustment for employer contributions tax | | | 9 | | | | 17 | | | | – | | | | – | |
| | | | | | | | | | | | | | | | |
Net liability recognised in the consolidated balance sheet | | | 139 | | | | 349 | | | | 415 | | | | 450 | |
| | | | | | | | | | | | | | | | |
The Group has no legal obligation to settle these liabilities with any immediate contributions or additional one-off contributions. The Group intends to continue to contribute to each defined benefit pension and post-retirement medical scheme in accordance with the latest recommendations of each scheme actuary.
Income statement disclosures
The amounts recognised in the consolidated income statement are as follows:
| | | | | | | | | | | | | | | | | | | | | | | | |
| | | Defined benefit
pension schemes | | | Post-retirement
medical schemes | |
| | | 2013 | | | 2012 | | | 2011 | | | 2013 | | | 2012 | | | 2011 | |
| | | US$M | | | US$M | | | US$M | | | US$M | | | US$M | | | US$M | |
Current service cost | | | 62 | | | | 57 | | | | 62 | | | | 12 | | | | 8 | | | | 5 | |
Interest cost | | | 87 | | | | 104 | | | | 105 | | | | 24 | | | | 25 | | | | 23 | |
Expected return on pension scheme assets | | | (92 | ) | | | (103 | ) | | | (104 | ) | | | – | | | | – | | | | – | |
Past service costs | | | 2 | | | | – | | | | 1 | | | | (7 | ) | | | 7 | | | | 3 | |
Curtailment gains | | | (15 | ) | | | (4 | ) | | | (1 | ) | | | – | | | | – | | | | – | |
| | | | | | | | | | | | | | | | | | | | | | | | |
Total expense | | | 44 | | | | 54 | | | | 63 | | | | 29 | | | | 40 | | | | 31 | |
| | | | | | | | | | | | | | | | | | | | | | | | |
– Recognised in employee benefits expense | | | 49 | | | | 53 | | | | 62 | | | | 5 | | | | 15 | | | | 8 | |
– Recognised in net finance costs | | | (5 | ) | | | 1 | | | | 1 | | | | 24 | | | | 25 | | | | 23 | |
– Recognised in other income | | | – | | | | – | | | | – | | | | – | | | | – | | | | – | |
| | | | | | | | | | | | | | | | | | | | | | | | |
Statement of Comprehensive Income (SOCI) disclosures
The amounts recognised in the consolidated statement of comprehensive income are as follows:
| | | | | | | | | | | | | | | | | | | | | | | | |
| | | Defined benefit
pension schemes | | | Post-retirement
medical schemes | |
| | | 2013 | | | 2012 | | | 2011 | | | 2013 | | | 2012 | | | 2011 | |
| | | US$M | | | US$M | | | US$M | | | US$M | | | US$M | | | US$M | |
Actuarial (gains)/losses | | | (65 | ) | | | 221 | | | | 51 | | | | (14 | ) | | | 47 | | | | 68 | |
Limit on net assets and other adjustments | | | 18 | | | | (18 | ) | | | (6 | ) | | | – | | | | – | | | | – | |
| | | | | | | | | | | | | | | | | | | | | | | | |
Total amount recognised in the SOCI | | | (47 | ) | | | 203 | | | | 45 | | | | (14 | ) | | | 47 | | | | 68 | |
| | | | | | | | | | | | | | | | | | | | | | | | |
Total cumulative amount recognised in the SOCI(a) | | | 469 | | | | 516 | | | | 313 | | | | 153 | | | | 167 | | | | 120 | |
| | | | | | | | | | | | | | | | | | | | | | | | |
(a) | Cumulative amounts are calculated from the transition to IFRSbased on 1 July 2004. |
The actual return on assets for the defined benefit pension schemes is as follows:
| | | | | | | | | | | | |
| | | Defined benefit
pension schemes | |
| | | 2013 | | | 2012 | | | 2011 | |
| | | US$M | | | US$M | | | US$M | |
Actual return on assets | | | 130 | | | | 182 | | | | 136 | |
The changes in the present value of defined benefit obligations are as follows:
| | | | | | | | | | | | | | | | |
| | | Defined benefit
pension schemes | | | Post-retirement
medical schemes | |
| | | 2013 | | | 2012 | | | 2013 | | | 2012 | |
| | | US$M | | | US$M | | | US$M | | | US$M | |
Defined benefit obligation at the beginning of the financial year | | | 2,215 | | | | 2,043 | | | | 446 | | | | 437 | |
Current service cost | | | 62 | | | | 57 | | | | 12 | | | | 8 | |
Interest cost | | | 87 | | | | 104 | | | | 24 | | | | 25 | |
Contributions by scheme participants | | | 2 | | | | 3 | | | | – | | | | – | |
Actuarial (gains)/losses on benefit obligation | | | (27 | ) | | | 300 | | | | (14 | ) | | | 47 | |
Benefits paid to participants | | | (239 | ) | | | (154 | ) | | | (22 | ) | | | (22 | ) |
Past service costs | | | 2 | | | | – | | | | (7 | ) | | | 7 | |
Curtailment gains | | | (15 | ) | | | (4 | ) | | | – | | | | – | |
Exchange variations | | | (67 | ) | | | (129 | ) | | | (28 | ) | | | (43 | ) |
Transferred to liabilities held for sale | | | (69 | ) | | | – | | | | (1 | ) | | | (13 | ) |
Other adjustments | | | – | | | | (5 | ) | | | – | | | | – | |
| | | | | | | | | | | | | | | | |
Defined benefit obligation at the end of the financial year | | | 1,951 | | | | 2,215 | | | | 410 | | | | 446 | |
| | | | | | | | | | | | | | | | |
The changes inless the fair value of schemeplan assets, except that any such asset cannot exceed the present value of expected refunds from and reductions in future contributions to the plan. Defined benefit obligations are estimated by discounting expected future payments using market yields at the reporting date on high-quality corporate bonds in countries that have developed corporate bond markets. However, where developed corporate bond markets do not exist, the discount rates are selected by reference to national government bonds. In both instances, the bonds are selected with terms to maturity and currency that match, as closely as possible, the estimated future cash flows.
Certain Group companies provide post-retirement medical benefits to qualifying retirees. In some cases the benefits are provided through medical care schemes to which the Group, the employees, the retirees and covered family members contribute. In some schemes there is no funding of the benefits before retirement. These schemes are recognised on the same basis as described above for defined benefit pension schemesschemes.
(w) Business combinations
Business combinations that occurred between 1 July 2004 and 30 June 2009 were accounted for by applying the purchase method of accounting, whereby the purchase consideration of the combination is allocated to the identifiable net assets acquired. Business combinations prior to 1 July 2004 have been accounted for in accordance with the Group’s previous policies under Australian GAAP and UK GAAP and have not been restated.
Business combinations undertaken from 1 July 2010 are as follows:accounted for by applying the acquisition method of accounting, whereby the identifiable assets, liabilities and contingent liabilities (identifiable net assets) are measured on the basis of fair value at the date of acquisition.
(x) Joint arrangements
The Group undertakes a number of business activities through joint arrangements. Joint arrangements exist when two or more parties have joint control. Joint control is the contractually agreed sharing of control of an arrangement, which exists only when decisions about the relevant activities require the unanimous consent of the parties sharing control. The Group’s joint arrangements are of two types:
Joint operations
Joint operations are joint arrangements in which the parties with joint control have rights to the assets and obligations for the liabilities relating to the arrangement. The activities of a joint operation are primarily designed for the provision of output to the parties to the arrangement, indicating that:
| | | | | | | | |
| | | Defined benefit
pension schemes | |
| | | 2013 | | | 2012 | |
| | | US$M | | | US$M | |
Fair value of scheme assets at the beginning of the financial year | | | 1,935 | | | | 1,866 | |
Expected return on scheme assets | | | 92 | | | | 103 | |
Actuarial gains on scheme assets | | | 38 | | | | 79 | |
Employer contributions | | | 190 | | | | 171 | |
Contributions by scheme participants | | | 2 | | | | 3 | |
Benefits paid | | | (239 | ) | | | (154 | ) |
Exchange variations | | | (72 | ) | | | (121 | ) |
Transferred to liabilities held for sale | | | (55 | ) | | | – | |
Other adjustments | | | – | | | | (12 | ) |
| | | | | | | | |
Fair value of scheme assets at the end of the financial year | | | 1,891 | | | | 1,935 | |
| | | | | | | | |
the parties have the rights to substantially all the economic benefits of the assets of the arrangement; and
all liabilities are satisfied by the joint participants through their purchases of that output. This indicates that, in substance, the joint participants have an obligation for the liabilities of the arrangement.
The fair valuesfinancial statements of defined benefit pension schemethe Group include its share of the assets segregated by major asset class are as follows:
| | | | | | | | |
| | | Fair Value | |
| | | 2013 | | | 2012 | |
| | | US$M | | | US$M | |
Asset class | | | | | | | | |
Bonds | | | 1,154 | | | | 1,314 | |
Equities | | | 231 | | | | 337 | |
Property | | | 17 | | | | 20 | |
Cash and net current assets | | | 259 | | | | 56 | |
Insured annuities | | | 201 | | | | 188 | |
Other | | | 29 | | | | 20 | |
| | | | | | | | |
Total | | | 1,891 | | | | 1,935 | |
| | | | | | | | |
Scheme assets classified as ‘Other’ as at 30 June 2013 primarily comprise investments in private equity in Australia, commodities in Europejoint operations, together with its share of the liabilities, revenues and various asset-backed securitiesexpenses arising jointly or otherwise from those operations and derivatives in the US. The increase in cash and net current assets reflectsits revenue derived from the sale of its share of output from the Dutch pension fund assets,joint operation. All such amounts are measured in preparation foraccordance with the possible transferterms of each arrangement, which are usually in proportion to the Group’s interest in the joint operation.
Joint ventures
Joint ventures are joint arrangements in which the parties with joint control of the Dutch fundarrangement have rights to the net assets of the arrangement. A separate vehicle, not the parties, will have the rights to the assets and obligations to the liabilities, relating to the arrangement. More than an insurance company during FY2014.insignificant share of output from a joint venture is sold to third parties which indicates that the joint venture is not dependent on the parties to the arrangement for funding and that the parties to the arrangement have no obligation for the liabilities of the arrangement.
The fairJoint ventures are accounted for using the equity method. Under the equity method the joint venture is recorded initially at cost to the Group, including the value of scheme assets includes no amounts relating to any goodwill on acquisition. In subsequent periods, the carrying amount of the joint venture is adjusted to reflect the Group’s own financial instrumentsshare of its post-acquisition profit or anyloss and other comprehensive income. After application of the property occupied by or other assets used byequity method, including recognising the Group.
The investment strategy is determined by each plan’s fiduciary body in consultation withGroup’s share of the Group. In general,joint ventures’ results, the value of the investment strategywill be assessed for each planimpairment if there is set by reference to the duration and risk profileobjective evidence that an impairment of the plan,investment may have occurred. Where the Group’s investment in a joint venture is nil after having applied equity accounting principles (and the Group has no legal or constructive obligation to make further payments, nor has made payments on behalf of the joint venture), dividends received from the joint venture will be recognised in the Group’s result as well asa ‘Share of operating profit of equity accounted investments’.
(y) Associates
Associates are entities in which the plan’s solvency level.
Actuarial assumptions
The principal actuarial assumptions atGroup holds significant influence. Significant influence is the reporting date (expressed as weighted averages) for defined benefit pension schemes are as follows:
| | | | | | | | | | | | | | | | | | | | | | | | | | | | | | | | |
| | | Australia | | | Americas | | | Europe | | | South Africa | |
| | | 2013 | | | 2012 | | | 2013 | | | 2012 | | | 2013 | | | 2012 | | | 2013 | | | 2012 | |
| | | % | | | % | | | % | | | % | | | % | | | % | | | % | | | % | |
Discount rate | | | 3.0 | | | | 2.6 | | | | 4.3 | | | | 4.0 | | | | 4.4 | | | | 4.4 | | | | 8.6 | | | | 8.7 | |
Future salary increases | | | 4.0 | | | | 4.3 | | | | 4.6 | | | | 4.5 | | | | 5.1 | | | | 4.8 | | | | 8.3 | | | | 8.0 | |
Future pension increases | | | n/a | | | | n/a | | | | 5.2 | | | | 4.5 | | | | 2.5 | | | | 2.5 | | | | 6.8 | | | | 6.5 | |
Expected rate of return on pension scheme assets | | | 4.0 | | | | 5.0 | | | | 4.3 | | | | 4.1 | | | | 4.0 | | | | 4.5 | | | | 8.7 | | | | 8.7 | |
The principal actuarial assumptions atpower to participate in the reporting date (expressed as weighted averages) for post-retirement medical schemes are as follows:
| | | | | | | | | | | | | | | | |
| | | Americas | | | South Africa | |
| | | 2013 | | | 2012 | | | 2013 | | | 2012 | |
| | | % | | | % | | | % | | | % | |
Discount rate | | | 4.3 | | | | 3.8 | | | | 8.7 | | | | 9.0 | |
Medical cost trend rate (ultimate) | | | 4.4 | | | | 4.3 | | | | 7.9 | | | | 8.0 | |
Assumptions regarding future mortalityfinancial and operating policy decisions of an entity but is not control or joint control. If the Group holds 20 per cent or more of the voting power of an entity, it is presumed that the Group has significant influence, unless it can be material depending uponclearly demonstrated that this is not the sizecase. Significant influence can also arise when the Group has less than 20 per cent of voting power but it can be demonstrated that the Group has the power to participate in the financial and natureoperating policy decisions of the plan liabilities. Post-retirement mortality assumptionsassociate.
Investments in associates are accounted for using the Americas, Europeequity method as described above. The Group uses the term ‘equity accounted investments’ to refer to associates and South Africa are based on post-retirement mortality tables that are standard in these regions.joint ventures collectively.
For the main funds, these tables imply the following expected future lifetimes (in years) for employees aged 65 as at the balance sheet date: US males 19.8 (2012: 19.8), US females 21.6 (2012: 21.6); Canadian males 19.8 (2012: 19.7), Canadian females 22.2 (2012: 22.1); Netherlands males 22.2 (2012: 21.5), Netherlands females 24.0 (2012: 24.0); UK males 23.6 (2012: 23.3), UK females 26.2 (2012: 25.7); South African males 19.0 (2012: 18.8), South African females 23.4 (2012: 23.3).
The overall expected rate of return on assets is the weighted average of the expected rate of return on each applicable asset class and reflects the long-term target asset allocation as at the reporting date. For bonds, the expected rate of return reflects the redemption yields available on corporate and government bonds, as applicable, as at the reporting date. For all other asset classes, the expected rate of return reflects the rate of return expected over the long term.
The present value of defined benefit obligations, fair value of scheme assets and associated experience adjustments for the defined benefit pension and post-retirement medical schemes are shown for the current year and the previous four years as follows:
| | | | | | | | | | | | | | | | | | | | |
| | | Defined benefit pension schemes | |
| | | 2013 | | | 2012 | | | 2011 | | | 2010 | | | 2009 | |
| | | US$M | | | US$M | | | US$M | | | US$M | | | US$M | |
Present value of defined benefit obligation | | | 1,951 | | | | 2,215 | | | | 2,043 | | | | 1,762 | | | | 1,736 | |
Fair value of defined benefit scheme assets | | | (1,891 | ) | | | (1,935 | ) | | | (1,866 | ) | | | (1,547 | ) | | | (1,455 | ) |
| | | | | | | | | | | | | | | | | | | | |
Deficit in the schemes | | | 60 | | | | 280 | | | | 177 | | | | 215 | | | | 281 | |
| | | | | | | | | | | | | | | | | | | | |
Experience gain/(loss) adjustments to scheme liabilities | | | (3 | ) | | | (47 | ) | | | 1 | | | | 16 | | | | (2 | ) |
Experience gain/(loss) adjustments to scheme assets | | | 38 | | | | 79 | | | | 32 | | | | 77 | | | | (228 | ) |
| | | | | | | | | | | | | | | | | | | | |
| | | Post-retirement medical schemes | |
| | | 2013 | | | 2012 | | | 2011 | | | 2010 | | | 2009 | |
| | | US$M | | | US$M | | | US$M | | | US$M | | | US$M | |
Present value of defined benefit obligation | | | 410 | | | | 446 | | | | 437 | | | | 343 | | | | 310 | |
Experience gain/(loss) adjustments to scheme liabilities | | | – | | | | (4 | ) | | | (3 | ) | | | (7 | ) | | | 4 | |
Experience adjustments to scheme liabilities do not include the effect of changes in actuarial assumptions.
Estimated contributions for the defined benefit pension and post-retirement medical schemes are as follows:
| | | | | | | | |
| | | Defined benefit
pension schemes | | | Post-retirement
medical schemes | |
| | | US$M | | | US$M | |
Estimated employer contributions for the year ending 30 June 2014 | | | 31 | | | | 23 | |
Estimated contributions by scheme participants for the year ending 30 June 2014 | | | 2 | | | | – | |
The impact of a one percentage point variation in the medical cost trend rate (for the post-retirement medical schemes) on the Group’s results is as follows:
| | | | | | | | |
| | | 2013 | | | 2012 | |
| | | US$M | | | US$M | |
Effect of an increase in the medical cost trend of 1% point on: | | | | | | | | |
Total of current service and interest cost | | | 5 | | | | 5 | |
Defined benefit obligation | | | 47 | | | | 50 | |
| | | | | | | | |
Effect of a decrease in the medical cost trend of 1% point on: | | | | | | | | |
Total of current service and interest cost | | | (4 | ) | | | (4 | ) |
Defined benefit obligation | | | (39 | ) | | | (41 | ) |
31 Key Management Personnel44. Application of accounting estimates, assumptions and judgements
Key Management Personnel compensation comprises:Application of critical accounting policies and estimates
| | | | | | | | | | | | |
| | | 2013 | | | 2012 | | | 2011 | |
| | | US$ | | | US$ | | | US$ | |
Short-term employee benefits | | | 24,818,411 | | | | 19,889,528 | | | | 22,494,120 | |
Post-employment benefits | | | 3,446,910 | | | | 3,586,477 | | | | 3,270,906 | |
Share-based payments | | | 26,297,032 | | | | 26,645,312 | | | | 28,682,260 | |
| | | | | | | | | | | | |
Total | | | 54,562,353 | | | | 50,121,317 | | | | 54,447,286 | |
| | | | | | | | | | | | |
Equity instrument disclosures relating to Key Management Personnel
BHP Billiton Limited ordinary shares under award
| | | | | | | | | | | | | | | | | | | | | | | | | | | | | | | | | | | | | | | | | | | | | | | | | | | | | | |
| | | Scheme | | At 30 June
2011 (b) | | | Granted | | | Lapsed | | | Exercised/
Matched | | | At 30 June
2012 (b) | | | Granted | | | Lapsed (c) | | | Exercised/
Matched | | | At 30 June
2013 (b) | | | Vested during
the year ended
30 June 2012 (b) | | | Vested during
the year ended
30 June 2013 (b) | | | Vested at
30 June
2012 (a) (b) | | | Vested at
30 June
2013 (a) (b) | |
Marius Kloppers (d) | | LTIP Performance | | | 1,283,327 | | | | 226,721 | | | | – | | | | – | | | | 1,510,048 | | | | 240,603 | | | | – | | | | 245,000 | | | | 1,505,651 | | | | – | | | | 333,327 | | | | – | | | | 88,327 | |
| | GIS Deferred | | | 101,782 | | | | 64,705 | | | | – | | | | 46,951 | | | | 119,536 | | | | – | | | | – | | | | 54,831 | | | | 64,705 | | | | 46,951 | | | | 54,831 | | | | – | | | | – | |
| | Shareplus | | | 325 | | | | 149 | | | | – | | | | 194 | | | | 280 | | | | 36 | | | | – | | | | 131 | | | | 185 | | | | 194 | | | | 131 | | | | – | | | | – | |
| | | | | | | | | | | | | | | | | | | | | | | | | | | | | | | | | | | | | | | | | | | | | | | | | | | | | | |
Peter Beaven (e) | | MAP Restricted | | | | | | | | | | | | | | | | | | | 138,450 | | | | – | | | | – | | | | – | | | | 138,450 | | | | | | | | – | | | | 42,000 | | | | 42,000 | |
| | LTIP Performance | | | | | | | | | | | | | | | | | | | 160,000 | | | | – | | | | – | | | | – | | | | 160,000 | | | | | | | | – | | | | 160,000 | | | | 160,000 | |
| | GSTIP Deferred | | | | | | | | | | | | | | | | | | | 45,943 | | | | – | | | | – | | | | – | | | | 45,943 | | | | | | | | – | | | | 18,931 | | | | 18,931 | |
| | Shareplus | | | | | | | | | | | | | | | | | | | 236 | | | | – | | | | – | | | | – | | | | 236 | | | | | | | | – | | | | – | | | | – | |
| | | | | | | | | | | | | | | | | | | | | | | | | | | | | | | | | | | | | | | | | | | | | | | | | | | | | | |
Dean Dalla Valle (e) | | MAP Restricted | | | | | | | | | | | | | | | | | | | 71,500 | | | | – | | | | – | | | | – | | | | 71,500 | | | | | | | | – | | | | – | | | | – | |
| | GSTIP Deferred | | | | | | | | | | | | | | | | | | | 25,968 | | | | – | | | | – | | | | – | | | | 25,968 | | | | | | | | – | | | | – | | | | – | |
| | Shareplus | | | | | | | | | | | | | | | | | | | 262 | | | | – | | | | – | | | | – | | | | 262 | | | | | | | | – | | | | – | | | | – | |
| | | | | | | | | | | | | | | | | | | | | | | | | | | | | | | | | | | | | | | | | | | | | | | | | | | | | | |
Mike Henry(f) | | GSTIP Deferred | | | – | | | | – | | | | – | | | | – | | | | – | | | | 5,715 | | | | – | | | | – | | | | 5,715 | | | | – | | | | – | | | | – | | | | – | |
| | Shareplus | | | 69 | | | | 110 | | | | – | | | | – | | | | 179 | | | | – | | | | – | | | | – | | | | 179 | | | | – | | | | – | | | | – | | | | – | |
| | | | | | | | | | | | | | | | | | | | | | | | | | | | | | | | | | | | | | | | | | | | | | | | | | | | | | |
Graham Kerr(f) | | MAP Restricted | | | 91,500 | | | | – | | | | – | | | | – | | | | 91,500 | | | | – | | | | – | | | | 21,000 | | | | 70,500 | | | | – | | | | 21,000 | | | | 21,000 | | | | 21,000 | |
| | LTIP Performance | | | 60,000 | | | | – | | | | – | | | | – | | | | 60,000 | | | | 108,939 | | | | – | | | | 40,000 | | | | 128,939 | | | | – | | | | 40,000 | | | | 20,000 | | | | 20,000 | |
| | Transitional GMC grants | | | – | | | | – | | | | – | | | | – | | | | – | | | | 35,834 | | | | – | | | | – | | | | 35,834 | | | | – | | | | – | | | | – | | | | – | |
| | GIS Deferred | | | 15,169 | | | | – | | | | – | | | | – | | | | 15,169 | | | | 13,230 | | | | – | | | | 15,169 | | | | 13,230 | | | | – | | | | – | | | | 15,169 | | | | – | |
| | GSTIP Deferred | | | 26,941 | | | | – | | | | – | | | | – | | | | 26,941 | | | | 4,501 | | | | – | | | | 10,160 | | | | 21,282 | | | | – | | | | 10,160 | | | | 4,818 | | | | 4,818 | |
| | Shareplus | | | 33 | | | | 117 | | | | – | | | | – | | | | 150 | | | | 38 | | | | – | | | | – | | | | 188 | | | | – | | | | – | | | | – | | | | – | |
| | | | | | | | | | | | | | | | | | | | | | | | | | | | | | | | | | | | | | | | | | | | | | | | | | | | | | |
Jane McAloon (e) | | MAP Restricted | | | | | | | | | | | | | | | | | | | 45,500 | | | | – | | | | – | | | | – | | | | 45,500 | | | | | | | | – | | | | – | | | | – | |
| | GSTIP Deferred | | | | | | | | | | | | | | | | | | | 17,817 | | | | – | | | | – | | | | – | | | | 17,817 | | | | | | | | – | | | | – | | | | – | |
| | Shareplus | | | | | | | | | | | | | | | | | | | 241 | | | | – | | | | – | | | | – | | | | 241 | | | | | | | | – | | | | – | | | | – | |
| | | | | | | | | | | | | | | | | | | | | | | | | | | | | | | | | | | | | | | | | | | | | | | | | | | | | | |
Daniel Malchuk (e) | | MAP Restricted | | | | | | | | | | | | | | | | | | | 54,750 | | | | – | | | | – | | | | – | | | | 54,750 | | | | | | | | – | | | | 14,000 | | | | 14,000 | |
| | LTIP Performance | | | | | | | | | | | | | | | | | | | 17,500 | | | | – | | | | – | | | | – | | | | 17,500 | | | | | | | | – | | | | 17,500 | | | | 17,500 | |
| | GSTIP Deferred | | | | | | | | | | | | | | | | | | | 26,469 | | | | – | | | | – | | | | – | | | | 26,469 | | | | | | | | – | | | | 10,730 | | | | 10,730 | |
| | | | | | | | | | | | | | | | | | | | | | | | | | | | | | | | | | | | | | | | | | | | | | | | | | | | | | |
Marcus Randolph (g) | | LTIP Performance | | | 822,676 | | | | 119,603 | | | | – | | | | 175,000 | | | | 767,279 | | | | 126,926 | | | | – | | | | 197,676 | | | | 696,529 | | | | 175,000 | | | | 197,676 | | | | – | | | | – | |
| | GIS Deferred | | | 55,945 | | | | 36,824 | | | | – | | | | 25,126 | | | | 67,643 | | | | 24,939 | | | | – | | | | 30,819 | | | | 61,763 | | | | 25,126 | | | | 30,819 | | | | – | | | | – | |
| | Shareplus | | | 322 | | | | 150 | | | | – | | | | 190 | | | | 282 | | | | 38 | | | | – | | | | 132 | | | | 188 | | | | 190 | | | | 132 | | | | – | | | | – | |
| | | | | | | | | | | | | | | | | | | | | | | | | | | | | | | | | | | | | | | | | | | | | | | | | | | | | | |
BHP Billiton Limited ordinary shares under award (continued)
| | | | | | | | | | | | | | | | | | | | | | | | | | | | | | | | | | | | | | | | | | | | | | | | | | | | | | |
| | | Scheme | | At 30 June
2011 (b) | | | Granted | | | Lapsed | | | Exercised/
Matched | | | At 30 June
2012 (b) | | | Granted | | | Lapsed (c) | | | Exercised/
Matched | | | At 30 June
2013 (b) | | | Vested during
the year ended
30 June 2012 (b) | | | Vested during
the year ended
30 June 2013 (b) | | | Vested at
30 June
2012 (a) (b) | | | Vested at
30 June
2013 (a) (b) | |
| Alex Vanselow (h) | | LTIP Performance | | | 872,676 | | | | – | | | | 199,178 | | | | 225,000 | | | | 448,498 | | | | | | | | | | | | | | | | | | | | 225,000 | | | | | | | | – | | | | | |
| | GIS Deferred | | | 54,092 | | | | 32,448 | | | | – | | | | 27,727 | | | | 58,813 | | | | | | | | | | | | | | | | | | | | 27,727 | | | | | | | | – | | | | | |
| | Shareplus | | | 325 | | �� | | 71 | | | | – | | | | – | | | | 396 | | | | | | | | | | | | | | | | | | | | – | | | | | | | | – | | | | | |
| | | | | | | | | | | | | | | | | | | | | | | | | | | | | | | | | | | | | | | | | | | | | | | | | | | | | | |
Jimmy Wilson(e) | | MAP Restricted | | | | | | | | | | | | | | | | | | | 96,450 | | | | – | | | | – | | | | – | | | | 96,450 | | | | | | | | – | | | | – | | | | – | |
| | LTIP Performance | | | | | | | | | | | | | | | | | | | 160,000 | | | | – | | | | – | | | | – | | | | 160,000 | | | | | | | | – | | | | 160,000 | | | | 160,000 | |
| | GSTIP Deferred | | | | | | | | | | | | | | | | | | | 32,738 | | | | – | | | | – | | | | – | | | | 32,738 | | | | | | | | – | | | | – | | | | – | |
| | Shareplus | | | | | | | | | | | | | | | | | | | 256 | | | | – | | | | – | | | | – | | | | 256 | | | | | | | | – | | | | – | | | | – | |
| | | | | | | | | | | | | | | | | | | | | | | | | | | | | | | | | | | | | | | | | | | | | | | | | | | | | | |
Karen Wood | | LTIP Performance | | | 669,187 | | | | 85,027 | | | | – | | | | 175,000 | | | | 579,214 | | | | 90,234 | | | | – | | | | 90,000 | | | | 579,448 | | | | 175,000 | | | | 154,187 | | | | – | | | | 64,187 | |
| | GIS Deferred | | | 46,883 | | | | 28,539 | | | | – | | | | 23,686 | | | | 51,736 | | | | 15,685 | | | | – | | | | 23,197 | | | | 44,224 | | | | 23,686 | | | | 23,197 | | | | – | | | | – | |
| | Shareplus | | | 325 | | | | 149 | | | | – | | | | 193 | | | | 281 | | | | 39 | | | | – | | | | 132 | | | | 188 | | | | 193 | | | | 132 | | | | – | | | | – | |
| | | | | | | | | | | | | | | | | | | | | | | | | | | | | | | | | | | | | | | | | | | | | | | | | | | | | | |
J Michael Yeager(i) | | LTIP Performance | | | 862,702 | | | | 119,603 | | | | – | | | | 225,000 | | | | 757,305 | | | | 126,926 | | | | – | | | | 187,702 | | | | 696,529 | | | | 225,000 | | | | 187,702 | | | | – | | | | – | |
| | GIS Deferred | | | 61,319 | | | | 37,779 | | | | – | | | | 29,877 | | | | 69,221 | | | | – | | | | – | | | | 31,442 | | | | 37,779 | | | | 29,877 | | | | 31,442 | | | | – | | | | – | |
| | Shareplus | | | 246 | | | | 148 | | | | – | | | | 138 | | | | 256 | | | | 36 | | | | – | | | | 108 | | | | 184 | | | | 138 | | | | 108 | | | | – | | | | – | |
| | | | | | | | | | | | | | | | | | | | | | | | | | | | | | | | | | | | | | | | | | | | | | | | | | | | | | |
| | Total | | | 5,025,844 | | | | 752,143 | | | | 199,178 | | | | 954,082 | | | | 5,518,807 | | | | 793,719 | | | | – | | | | 947,499 | | | | 4,857,320 | | | | 954,082 | | | | 1,084,844 | | | | 484,148 | | | | 621,493 | |
| | | | | | | | | | | | | | | | | | | | | | | | | | | | | | | | | | | | | | | | | | | | | | | | | | | | | | |
BHP Billiton Limited ordinary shares under option
| | | | | | | | | | | | | | | | | | | | | | | | | | | | | | | | | | | | | | | | | | | | | | | | | | | | | | |
| | | Scheme | | At 30 June
2011 (b) | | | Granted | | | Lapsed | | | Exercised | | | At 30 June
2012 (b) | | | Granted | | | Lapsed | | | Exercised | | | At 30 June
2013 (b) | | | Vested during
the year ended
30 June 2012 (b) | | | Vested during
the year ended
30 June 2013 (b) | | | Vested at
30 June
2012 (a) (b) | | | Vested at
30 June
2013 (a) (b) | |
Peter Beaven (e) | | GSTIP Options | | | | | | | | | | | | | | | | | | | 10,002 | | | | – | | | | – | | | | – | | | | 10,002 | | | | | | | | – | | | | 10,002 | | | | 10,002 | |
| | | | | | | | | | | | | | | | | | | | | | | | | | | | | | | | | | | | | | | | | | | | | | | | | | | | | | |
Graham Kerr(f) | | GSTIP Options | | | 17,345 | | | | – | | | | – | | | | – | | | | 17,345 | | | | – | | | | – | | | | – | | | | 17,345 | | | | – | | | | – | | | | 17,345 | | | | 17,345 | |
| | | | | | | | | | | | | | | | | | | | | | | | | | | | | | | | | | | | | | | | | | | | | | | | | | | | | | |
| | Total | | | 17,345 | | | | – | | | | – | | | | – | | | | 27,347 | | | | – | | | | – | | | | – | | | | 27,347 | | | | – | | | | – | | | | 27,347 | | | | 27,347 | |
| | | | | | | | | | | | | | | | | | | | | | | | | | | | | | | | | | | | | | | | | | | | | | | | | | | | | | |
(a) | All awards and options that are vested are exercisable. |
(b) | Opening and closing balances represent the holding at year-end or the holding at date of appointment or resignation as a KMP. Amount vested during the year represents the amount vested during the financial year, or from their appointment date as a KMP until the end of the financial year, or from the beginning of the financial year until their resignation as a KMP. |
(c) | In August 2013, the Board exercised its discretion to reduce vesting of the 2008 LTIP by 35 per cent for all current and former participating GMC members even though the requisite performance hurdle for full vesting was met. |
(d) | Marius Kloppers’ balance as reported for 30 June 2013 reflects his holding at resignation date as a KMP, being 10 May 2013. The remaining unvested LTIP awards held by him will be pro-rated, in accordance with the Group’s usual practice, to reflect the percentage of the performance period that will elapse to 1 October 2013. |
(e) | Peter Beaven’s, Dean Dalla Valle’s, Jane McAloon’s, Daniel Malchuk’s and Jimmy Wilson’s balances as reported for 30 June 2012 reflect their holding at appointment date as a KMP, being 10 May 2013. |
(f) | Mike Henry’s and Graham Kerr’s balances as reported for 30 June 2011 reflect their holding at appointment date as a KMP, being 28 November 2011. |
(g) | Marcus Randolph’s balance as reported for 30 June 2013 reflects his holding at resignation date as a KMP, being 10 May 2013. The remaining unvested LTIP awards held by him were pro-rated, in accordance with the Group’s usual practice, to reflect the percentage of the performance period that has elapsed to 2 September 2013. |
(h) | Alex Vanselow’s balance as reported for 30 June 2012 reflects his holding at resignation date, being 28 February 2012. |
(i) | The unvested LTIP awards held by J Michael Yeager, who resigned as a KMP on 1 July 2013, were pro-rated, in accordance with the Group’s usual practice, to reflect the percentage of the performance period that has elapsed to 8 July 2013. |
BHP Billiton Plc ordinary shares under award
| | | | | | | | | | | | | | | | | | | | | | | | | | | | | | | | | | | | | | | | | | | | | | | | | | | | | | |
| | | Scheme | | At 30 June
2011 (b) | | | Granted | | | Lapsed | | | Exercised/
Matched | | | At 30 June
2012 (b) | | | Granted | | | Lapsed(c) | | | Exercised/
Matched | | | At 30 June
2013 (b) | | | Vested during
the year ended
30 June 2012 (b) | | | Vested during
the year ended
30 June 2013 (b) | | | Vested at
30 June
2012 (a) (b) | | | Vested at
30 June
2013 (a) (b) | |
Andrew Mackenzie | | LTIP Performance | | | 565,839 | | | | 146,510 | | | | – | | | | – | | | | 712,349 | | | | 140,326 | | | | – | | | | – | | | | 852,675 | | | | – | | | | – | | | | – | | | | – | |
| | GIS Deferred | | | 35,176 | | | | 39,230 | | | | – | | | | 12,476 | | | | 61,930 | | | | 20,023 | | | | – | | | | 22,700 | | | | 59,253 | | | | 12,476 | | | | 22,700 | | | | – | | | | – | |
| | Shareplus | | | 311 | | | | 170 | | | | – | | | | 175 | | | | 306 | | | | 41 | | | | – | | | | 136 | | | | 211 | | | | 175 | | | | 136 | | | | – | | | | – | |
| | | | | | | | | | | | | | | | | | | | | | | | | | | | | | | | | | | | | | | | | | | | | | | | | | | | | | |
| Marius Kloppers (d) | | LTIP Performance | | | 225,000 | | | | – | | | | – | | | | 225,000 | | | | – | | | | – | | | | – | | | | – | | | | – | | | | 225,000 | | | | – | | | | – | | | | – | |
| | | | | | | | | | | | | | | | | | | | | | | | | | | | | | | | | | | | | | | | | | | | | | | | | | | | | | |
Alberto Calderon (e) | | LTIP Performance | | | 756,993 | | | | 146,510 | | | | – | | | | 80,000 | | | | 823,503 | | | | 140,326 | | | | – | | | | 211,993 | | | | 751,836 | | | | 80,000 | | | | 211,993 | | | | – | | | | – | |
| | GIS Deferred | | | 63,838 | | | | 38,939 | | | | – | | | | 33,343 | | | | 69,434 | | | | 19,187 | | | | – | | | | 30,495 | | | | 58,126 | | | | 33,343 | | | | 30,495 | | | | – | | | | – | |
| | Shareplus | | | 342 | | | | 169 | | | | – | | | | 193 | | | | 318 | | | | 43 | | | | – | | | | 149 | | | | 212 | | | | 193 | | | | 149 | | | | – | | | | – | |
| | | | | | | | | | | | | | | | | | | | | | | | | | | | | | | | | | | | | | | | | | | | | | | | | | | | | | |
| Mike Henry(f) | | MAP Restricted | | | 66,900 | | | | – | | | | – | | | | – | | | | 66,900 | | | | – | | | | – | | | | 12,000 | | | | 54,900 | | | | – | | | | 12,000 | | | | – | | | | – | |
| | LTIP Performance | | | 20,000 | | | | – | | | | – | | | | – | | | | 20,000 | | | | 121,179 | | | | – | | | | 20,000 | | | | 121,179 | | | | – | | | | 20,000 | | | | – | | | | – | |
| | Transitional GMC grants | | | – | | | | – | | | | – | | | | – | | | | – | | | | 39,860 | | | | – | | | | – | | | | 39,860 | | | | – | | | | – | | | | – | | | | – | |
| | GIS Deferred | | | – | | | | – | | | | – | | | | – | | | | – | | | | 15,058 | | | | – | | | | – | | | | 15,058 | | | | – | | | | – | | | | – | | | | – | |
| | GSTIP Deferred | | | 24,825 | | | | – | | | | – | | | | – | | | | 24,825 | | | | – | | | | – | | | | 8,259 | | | | 16,566 | | | | – | | | | 8,259 | | | | – | | | | – | |
| | Shareplus | | | 326 | | | | – | | | | – | | | | 174 | | | | 152 | | | | 39 | | | | – | | | | 152 | | | | 39 | | | | 174 | | | | 152 | | | | – | | | | – | |
| | | | | | | | | | | | | | | | | | | | | | | | | | | | | | | | | | | | | | | | | | | | | | | | | | | | | | |
| Jimmy Wilson(g) | | LTIP Performance | | | | | | | | | | | | | | | | | | | 13,400 | | | | – | | | | – | | | | – | | | | 13,400 | | | | | | | | – | | | | 13,400 | | | | 13,400 | |
| | | | | | | | | | | | | | | | | | | | | | | | | | | | | | | | | | | | | | | | | | | | | | | | | | | | | | |
| | Total | | | 1,759,550 | | | | 371,528 | | | | – | | | | 351,361 | | | | 1,793,117 | | | | 496,082 | | | | – | | | | 305,884 | | | | 1,983,315 | | | | 351,361 | | | | 305,884 | | | | 13,400 | | | | 13,400 | |
| | | | | | | | | | | | | | | | | | | | | | | | | | | | | | | | | | | | | | | | | | | | | | | | | | | | | | |
BHP Billiton Plc ordinary shares under option
| | | | | | | | | | | | | | | | | | | | | | | | | | | | | | | | | | | | | | | | | | | | | | | | | | | | | | |
| | | Scheme | | At 30 June
2011 | | | Granted | | | Lapsed | | | Exercised | | | At 30 June
2012 | | | Granted | | | Lapsed | | | Exercised | | | At 30 June
2013 | | | Vested during
the year ended
30 June 2012 | | | Vested during
the year ended
30 June 2013 | | | Vested at
30 June
2012 (a) | | | Vested at
30 June
2013 (a) | |
Andrew Mackenzie | | GIS Options | | | 46,508 | | | | – | | | | – | | | | – | | | | 46,508 | | | | – | | | | – | | | | – | | | | 46,508 | | | | 16,119 | | | | 30,389 | | | | 16,119 | | | | 46,508 | |
| | | | | | | | | | | | | | | | | | | | | | | | | | | | | | | | | | | | | | | | | | | | | | | | | | | | | | |
| | Total | | | 46,508 | | | | – | | | | – | | | | – | | | | 46,508 | | | | – | | | | – | | | | – | | | | 46,508 | | | | 16,119 | | | | 30,389 | | | | 16,119 | | | | 46,508 | |
| | | | | | | | | | | | | | | | | | | | | | | | | | | | | | | | | | | | | | | | | | | | | | | | | | | | | | |
(a) | All awards and options that are vested are exercisable. |
(b) | Opening and closing balances represent the holding at year-end or the holding at date of appointment or resignation as a KMP. Amount vested during the year represents the amount vested during the financial year, or from their appointment date as a KMP until the end of the financial year, or from the beginning of the financial year until their resignation as a KMP. |
(c) | In August 2013, the Board exercised its discretion to reduce vesting of the 2008 LTIP by 35 per cent for all current and former participating GMC members even though the requisite performance hurdle for full vesting was met. |
(d) | Marius Kloppers’ balance as reported for 30 June 2013 reflects his holdings at resignation date as a KMP, being 10 May 2013. |
(e) | Alberto Calderon’s balance as reported for 30 June 2013 reflects his holdings at resignation date as a KMP, being 10 May 2013. The unvested LTIP awards held by him will be pro-rated to reflect the percentage of the performance period that has elapsed to 9 May 2013. |
(f) | Mike Henry’s balance as reported for 30 June 2011 reflects his holding at appointment date as a KMP, being 28 November 2011. |
(g) | Jimmy Wilson’s balance as reported for 30 June 2012 reflects his holding at appointment date as a KMP, being 10 May 2013. |
No options have been granted to Key Management Personnel since the endThe preparation of the Consolidated Financial Statements requires management to make judgements and estimates and form assumptions that affect the amounts of assets, liabilities, contingent liabilities, revenues and expenses reported in the financial year. Further informationstatements. On an ongoing basis, management evaluates its judgements and estimates in relation to assets, liabilities, contingent liabilities, revenue and expenses. Management bases its judgements and estimates on optionshistorical experience and rights, including grant dates and exercise dates regarding options grantedon other factors it believes to Key Management Personnelbe reasonable under the employee share ownership plan, is set out in note 33.
Equity holdingscircumstances, the results of which form the basis of the reported amounts that are not readily apparent from other sources. Actual results may differ from these estimates under different assumptions and transactionsconditions.
The movement duringGroup has identified the following critical accounting policies under which significant judgements, estimates and assumptions are made and where actual results may differ from these estimates under different assumptions and conditions and may materially affect financial results or the financial yearposition reported in the number of ordinary shares of the Group held directly, indirectly or beneficially, by each specified Key Management Personnel, including their personally related entities were as follows:future periods.
| | | | | | | | | | | | | | | | | | | | | | | | | | | | | | | | | | | | |
BHP Billiton Limited shares (a) | | Held at 30 June
2011(b) | | | Purchases | | | Received on
exercise/matching of
options or rights | | | Disposals | | | Held at 30 June
2012(b) | | | Purchases | | | Received on
exercise/matching of
options or rights | | | Disposals | | | Held at 30 June
2013(b) | |
Marius Kloppers (c) | | | 124,374 | | | | 149 | | | | 47,145 | | | | – | | | | 171,668 | | | | 36 | | | | 299,962 | | | | 98,000 | | | | 373,666 | |
Peter Beaven (d) | | | | | | | | | | | | | | | | | | | 73,533 | | | | – | | | | – | | | | – | | | | 73,533 | |
Dean Dalla Valle(d) | | | | | | | | | | | | | | | | | | | 109,663 | | | | – | | | | – | | | | – | | | | 109,663 | |
Geoff Healy(e) | | | | | | | | | | | | | | | | | | | 3,000 | | | | – | | | | – | | | | – | | | | 3,000 | |
Mike Henry(f) | | | 18,586 | | | | 110 | | | | – | | | | – | | | | 18,696 | | | | – | | | | – | | | | – | | | | 18,696 | |
Graham Kerr(f) | | | 5,305 | | | | 117 | | | | – | | | | – | | | | 5,422 | | | | 38 | | | | 86,329 | | | | 42,191 | | | | 49,598 | |
Jane McAloon (d) | | | | | | | | | | | | | | | | | | | 36,070 | | | | – | | | | – | | | | – | | | | 36,070 | |
Marcus Randolph(c) | | | 191,746 | | | | 150 | | | | 200,316 | | | | 70,000 | | | | 322,212 | | | | 38 | | | | 228,627 | | | | 235,000 | | | | 315,877 | |
Alex Vanselow (g) | | | 270,925 | | | | 71 | | | | 252,727 | | | | 81,766 | | | | 441,957 | | | | | | | | | | | | | | | | | |
Jimmy Wilson(d) | | | | | | | | | | | | | | | | | | | 1,552 | | | | – | | | | – | | | | – | | | | 1,552 | |
Karen Wood | | | 164,914 | | | | 149 | | | | 198,879 | | | | 94,297 | | | | 269,645 | | | | 39 | | | | 113,329 | | | | 70,000 | | | | 313,013 | |
J Michael Yeager | | | 264,506 | | | | 148 | | | | 255,015 | | | | 92,610 | | | | 427,059 | | | | 36 | | | | 219,252 | | | | 80,350 | | | | 565,997 | |
Alan Boeckmann | | | 4,330 | | | | | | | | | | | | | | | | | | | | | | | | | | | | | | | | | |
Malcolm Broomhead | | | 9,000 | | | | – | | | | – | | | | – | | | | 9,000 | | | | – | | | | – | | | | – | | | | 9,000 | |
Carlos Cordeiro | | | 6,550 | | | | – | | | | – | | | | – | | | | 6,550 | | | | – | | | | – | | | | – | | | | 6,550 | |
David Crawford | | | 33,127 | | | | – | | | | – | | | | – | | | | 33,127 | | | | – | | | | – | | | | – | | | | 33,127 | |
Carolyn Hewson | | | 3,500 | | | | 3,500 | | | | – | | | | – | | | | 7,000 | | | | – | | | | – | | | | – | | | | 7,000 | |
Lindsay Maxsted | | | – | | | | 3,000 | | | | – | | | | – | | | | 3,000 | | | | – | | | | – | | | | – | | | | 3,000 | |
Wayne Murdy | | | 4,030 | | | | 3,970 | | | | – | | | | – | | | | 8,000 | | | | – | | | | – | | | | – | | | | 8,000 | |
Jac Nasser | | | 5,600 | | | | 4,800 | | | | – | | | | – | | | | 10,400 | | | | – | | | | – | | | | – | | | | 10,400 | |
John Schubert | | | 23,675 | | | | – | | | | – | | | | – | | | | 23,675 | | | | – | | | | – | | | | – | | | | 23,675 | |
| | | | | | | | | | | | | | | | | | | | | | | | | | | | | | | | | | | | |
BHP Billiton Plc shares(a) | | Held at 30 June
2011 (b) | | | Purchases | | | Received on
exercise/matching of
options or rights | | | Disposals | | | Held at 30 June
2012 (b) | | | Purchases | | | Received on
exercise/matching of
options or rights | | | Disposals | | | Held at 30 June
2013 (b) | |
Andrew Mackenzie | | | 55,311 | | | | 170 | | | | 12,651 | | | | 6,572 | | | | 61,560 | | | | 41 | | | | 22,836 | | | | 11,818 | | | | 72,619 | |
Marius Kloppers (c) | | | 608,591 | | | | – | | | | 225,000 | | | | 144,696 | | | | 688,895 | | | | – | | | | – | | | | 59,913 | | | | 628,982 | |
Alberto Calderon(c) | | | 90,015 | | | | 25,222 | | | | 113,536 | | | | 52,800 | | | | 175,973 | | | | 43 | | | | 242,637 | | | | 116,027 | | | | 302,626 | |
Mike Henry(f) | | | 44,080 | | | | – | | | | 174 | | | | – | | | | 44,254 | | | | 39 | | | | 40,411 | | | | 9,140 | | | | 75,564 | |
Jimmy Wilson(d) | | | | | | | | | | | | | | | | | | | 59,301 | | | | – | | | | – | | | | – | | | | 59,301 | |
Alan Boeckmann | | | 5,880 | | | | | | | | | | | | | | | | | | | | | | | | | | | | | | | | | |
John Buchanan | | | 20,000 | | | | – | | | | – | | | | – | | | | 20,000 | | | | – | | | | – | | | | – | | | | 20,000 | |
David Crawford | | | 6,000 | | | | – | | | | – | | | | – | | | | 6,000 | | | | – | | | | – | | | | – | | | | 6,000 | |
Pat Davies(h) | | | 4,170 | | | | – | | | | – | | | | – | | | | 4,170 | | | | 23,000 | | | | – | | | | – | | | | 27,170 | |
Wayne Murdy | | | 3,512 | | | | 10,488 | | | | – | | | | – | | | | 14,000 | | | | – | | | | – | | | | – | | | | 14,000 | |
Jac Nasser | | | 40,000 | | | | 41,200 | | | | – | | | | – | | | | 81,200 | | | | – | | | | – | | | | – | | | | 81,200 | |
Keith Rumble | | | 12,200 | | | | 2,300 | | | | – | | | | – | | | | 14,500 | | | | – | | | | – | | | | – | | | | 14,500 | |
Baroness Shriti Vadera | | | 5,000 | | | | 4,000 | | | | – | | | | – | | | | 9,000 | | | | – | | | | – | | | | – | | | | 9,000 | |
(a) | All interests are beneficial and include holdings of American Depositary Shares and shares held in the name of the spouse, superannuation fund and/or nominee. |
(b) | Opening and closing balances represent the holding at year-end or the holding at date of appointment or resignation as a KMP. |
(c) | Marius Kloppers’, Alberto Calderon’s and Marcus Randolph’s balances as reported for 30 June 2013 reflect their holding at resignation date as a KMP, being 10 May 2013. |
(d) | Peter Beaven’s, Dean Dalla Valle’s, Jane McAloon’s and Jimmy Wilson’s balances as reported for 30 June 2012 reflect their holding at appointment date as a KMP, being 10 May 2013. |
(e) | Geoff Healy’s balance as reported for 30 June 2012 reflects his holding at appointment date as a KMP, being 3 June 2013. |
(f) | Mike Henry’s and Graham Kerr’s balances as reported for 30 June 2011 reflect their holding at appointment date as a KMP, being 28 November 2011. |
(g) | Alex Vanselow’s balance as reported for 30 June 2012 reflects his holding at resignation date, being 28 February 2012. |
(h) | Pat Davies’ balance as reported for 30 June 2011 reflects his holding at appointment date as a KMP, being 1 June 2012. |
Directors and their personally related entities receive the same dividends and bonus share entitlements as those available to other holders of the same class of shares.
Refer to note 33 forFurther details of the employee share ownership plans referred to above.
Transactions with Key Management Personnel
During the financial year, there were no purchases from the Group (2012: US$ nil; 2011: US$ nil).
There are no amounts payable at 30 June 2013 (2012: US$ nil).
Loans with Key Management Personnel
There are US$ nil loans (2012: US$ nil) with Key Management Personnel.
Transactions with personally related entities
A numbernature of Directors or former Directors of the Group hold or have held positions in other companies, where it is considered they control or significantly influence the financial or operating policies of those entities. One of those entities, Fluor Corporation, was considered tothese assumptions and conditions may be a personally related entity of Mr Alan Boeckmann until Mr Boeckmann’s resignation as an Executive Director of Fluor Corporation on 2 February 2011. During the period in which Fluor Corporation was considered a personally related entityfound in the financial year ended 30 June 2011, Fluor Corporation provided products and services to the Group totalling US$244.767 million. As at 30 June 2013, no amounts were owed by the Group to personally related entities (2012: US$ nil).
32 Related party transactions
Subsidiaries
The percentage of ordinary shares held in significant subsidiaries is disclosed in note 26relevant notes to the financial statements.
Jointly controlled entitiesReserve estimates
Reserves are estimates of the amount of product that can be economically and legally extracted from the Group’s properties. In order to estimate reserves, estimates are required about for a range of geological, technical and economic factors, including quantities, grades, production techniques, recovery rates, production costs, transport costs, commodity demand, commodity prices and exchange rates.
Estimating the quantity and/or grade of reserves requires the size, shape and depth of ore bodies or fields to be determined by analysing geological data such as drilling samples. This process may require complex and difficult geological judgements to interpret the data.
The Group determines and reports ore reserves in Australia and the United Kingdom under the principles incorporated in the Australasian Code for Reporting of Exploration Results, Mineral Resources and Ore Reserves December 2012 known as the JORC Code, and the Australian Securities Exchange (ASX) Listing Rules 2014 for minerals. The JORC Code requires the use of reasonable investment assumptions when reporting reserves. As a result, management will form a view of forecast sales prices, based on current and long-term historical average price trends. For example, if current prices remain above long-term historical averages for an extended period of time, management may assume that lower prices will prevail in the future and as a result, those lower prices are used to estimate reserves under the JORC Code. Lower price assumptions generally result in lower estimates of reserves.
Reserve reporting requirements for SEC (United States of America) filings are specified in Industry Guide 7, which requires economic assumptions to be based on current economic conditions (which may differ from assumptions based on reasonable investment assumptions). Accordingly, for SEC filings, we test our reserve estimates derived under JORC against assumed ‘current economic conditions’. ‘Current economic conditions’ are based on the three-year average of historical contract and market prices for commodities such as iron ore and coal, and the three-year average of historical market prices for commodities that are traded on the London Metal Exchange, such as copper and nickel. However, we only report a different reserve in the United States of America if, based on the United States SEC pricing assumptions test, the reserve will be lower than that reported under JORC in Australia and the United Kingdom.
Oil and gas reserves reported in Australia, the United Kingdom, and the United States of America for SEC filing purposes, are based on the average of prices prevailing on the first day of each month for the past 12 months as required under the SEC Rules ‘Modernisation of Oil & Gas Reporting’.
Because the economic assumptions used to estimate reserves change from period to period, and because additional geological data is generated during the course of operations, estimates of reserves may change from period to period. Changes in reported reserves may affect the Group’s financial results and financial position in a number of ways, including the following:
Asset recoverable amounts may be affected due to changes in estimated future cash flows.
Depreciation, depletion and amortisation charged in the income statement may change where such charges are determined on the units of production basis, or where the useful economic lives of assets change.
Overburden removal costs recorded on the balance sheet or charged to the income statement may change due to changes in stripping ratios or the units of production basis of depreciation.
Decommissioning, site restoration and environmental provisions may change where changes in estimated reserves affect expectations about the timing or cost of these activities.
The carrying amount of deferred tax assets may change due to changes in estimates of the likely recovery of the tax benefits.
Exploration and evaluation expenditure
The percentageGroup’s accounting policy for exploration and evaluation expenditure results in certain items of expenditure being capitalised for an area of interest where it is considered likely to be recoverable by future exploitation or sale or where the activities have not reached a stage which permits a reasonable assessment of the existence of reserves. This policy requires management to make certain estimates and assumptions as to future events and circumstances, in particular whether an economically viable extraction operation can be established. Any such estimates and assumptions may change as new information becomes available. If, after having capitalised the expenditure under the policy, a judgement is made that recovery of the expenditure is unlikely, the relevant capitalised amount will be written off to the income statement.
Development expenditure
Development activities commence after project sanctioning by the appropriate level of management. Judgement is applied by management in determining when a project is economically viable. In exercising this judgement, management is required to make certain estimates and assumptions similar to those described above for capitalised exploration and evaluation expenditure. Any such estimates and assumptions may change as new information becomes available. If, after having commenced the development activity, a judgement is made that a development asset is impaired, the appropriate amount will be written off to the income statement.
Taxation
The Group’s accounting policy for taxation, including royalty-related taxation, requires management’s judgement as to the types of arrangements considered to be a tax on income in contrast to an operating cost. Judgement is also required in assessing whether deferred tax assets and certain deferred tax liabilities are recognised on the balance sheet. Deferred tax assets, including those arising from unrecouped tax losses, capital losses, foreign tax credits and temporary differences, are recognised only where it is considered more likely than not that they will be recovered, which is dependent on the generation of sufficient future taxable profits. Deferred tax liabilities arising from temporary differences in investments, caused principally by retained earnings held in significant jointlyforeign tax jurisdictions, are recognised unless repatriation of retained earnings can be controlled entities is disclosed in note 27 to the financial statements.
Key Management Personnel
Disclosures relating to Key Management Personnel are set out in note 31 to the financial statements.
Transactions with related parties
| | | | | | | | | | | | | | | | |
| | | Jointly controlled entities (a) | | | Other related parties (b) | |
| | | 2013 | | | 2012 | | | 2013 | | | 2012 | |
| | | US$M | | | US$M | | | US$M | | | US$M | |
Sales of goods/services | | | 277.215 | | | | 273.755 | | | | – | | | | 1.375 | |
Purchases of goods/services | | | 721.360 | | | | 350.647 | | | | – | | | | – | |
Interest income | | | 28.262 | | | | 22.919 | | | | – | | | | – | |
Interest expense | | | 0.021 | | | | 0.002 | | | | – | | | | – | |
Loans made to related parties | | | 145.844 | | | | 230.948 | | | | – | | | | – | |
(a) | Disclosures in respect of transactions with jointly controlled entities represent the amount of such transactions which do not eliminate on proportionate consolidation. |
(b) | Excludes transactions with post-employment benefit plans for the benefit of Group employees. These are shown in note 30 Pension and other post-retirement obligations. |
Transactions between each parent company and its subsidiaries, which are related parties of that company, are eliminated on consolidation and are not disclosedexpected to occur in this note.the foreseeable future.
Outstanding balances with related parties
| | | | | | | | | | | | | | | | |
| | | Jointly controlled entities (a) | | | Other related parties | |
| | | 2013 | | | 2012 | | | 2013 | | | 2012 | |
| | | US$M | | | US$M | | | US$M | | | US$M | |
Trade amounts owing to related parties | | | 117.530 | | | | 56.280 | | | | – | | | | – | |
Other amounts owing to related parties | | | 19.213 | | | | 34.410 | | | | – | | | | – | |
Trade amounts owing from related parties | | | 121.721 | | | | 107.226 | | | | – | | | | – | |
Other amounts owing from related parties | | | 1,011.917 | | | | 881.270 | | | | – | | | | – | |
(a) | Disclosures in respect of amounts owing to/from jointly controlled entities represent those balances which do not eliminate upon proportionate consolidation. |
TermsAssumptions about the generation of future taxable profits and conditions
Sales torepatriation of retained earnings depend on management’s estimates of future cash flows. These depend on estimates of future production and purchases from related partiessales volumes, commodity prices, reserves, operating costs, closure and rehabilitation costs, capital expenditure, dividends and other capital management transactions. Judgements are also required about the application of goods and services are made in arm’s length transactions at normal market prices and on normal commercial terms.
Outstanding balances at year-end are unsecured and settlement occurs in cash.
Other amounts owing from related parties represent secured loans made to jointly controlled entities under co-funding arrangements. Such loans are made on an arm’s length basis with interest charged at market rates and are due to be repaid between 30 September 2013 and 31 August 2031.
No guarantees are provided or received for any related party receivables or payables.
No provision for doubtful debts has been recognised in relation to any outstanding balances and no expense has been recognised in respect of bad or doubtful debts due from related parties.income tax
33 Employee share ownership plans
Employee share awards – current plans
| | | | | | | | | | | | | | | | | | | | | | | | |
2013 | | Number
of awards
on issue
at the
beginning
of the
financial
year | | | Number
of
awards
issued
during
the year | | | Number
of
awards
vested
and
exercised | | | Number
of
awards
lapsed | | | Number
of awards
remaining
at the end
of the
financial
year | | | Number of
awards
vested and
exercisable
at the end
of the
financial
year | |
BHP Billiton Limited | | | | | | | | | | | | | | | | | | | | | | | | |
Group Incentive Scheme Deferred Shares (a) | | | 614,335 | | | | 53,854 | | | | 407,847 | | | | 15,474 | | | | 244,868 | | | | 23,167 | |
Group Incentive Scheme Options(a) | | | 764,318 | | | | – | | | | 359,098 | | | | 314,831 | | | | 90,389 | | | | 90,389 | |
– weighted average exercise price – A$ | | | 34.44 | | | | – | | | | 29.15 | | | | 41.99 | | | | 29.15 | | | | 29.15 | |
– weighted average share price – A$ | | | | | | | | | | | 34.15 | | | | | | | | | | | | | |
– weighted average contractual term for outstanding options – days | | | | | | | | | | | | | | | | | | | – | | | | | |
Group Short Term Incentive Plan Deferred Shares(a) | | | 2,234,410 | | | | 1,248,794 | | | | 1,024,623 | | | | 70,283 | | | | 2,388,298 | | | | 194,382 | |
Group Short Term Incentive Plan Options(a) | | | 335,160 | | | | – | | | | – | | | | 50,524 | | | | 284,636 | | | | 284,636 | |
– weighted average exercise price – A$ | | | 39.29 | | | | – | | | | – | | | | 38.41 | | | | 39.44 | | | | 39.44 | |
– weighted average share price – A$ | | | | | | | | | | | – | | | | | | | | | | | | | |
– weighted average contractual term for outstanding options – days | | | | | | | | | | | | | | | | | | | – | | | | | |
Long Term Incentive Plan Performance Shares(a) | | | 10,047,354 | | | | 693,628 | | | | 4,621,864 | | | | 53,083 | | | | 6,066,035 | | | | 2,367,453 | |
Transitional GMC Grants(a) | | | – | | | | 35,834 | | | | – | | | | – | | | | 35,834 | | | | – | |
Management Award Plan Restricted Shares (a) | | | 7,841,674 | | | | 3,142,398 | | | | 2,196,959 | | | | 805,431 | | | | 7,981,682 | | | | 687,175 | |
Shareplus Matched Shares(b) | | | 2,436,201 | | | | 1,966,016 | | | | 1,015,575 | | | | 294,580 | | | | 3,092,062 | | | | – | |
| | | | | | | | | | | | | | | | | | | | | | | | |
BHP Billiton Plc | | | | | | | | | | | | | | | | | | | | | | | | |
Group Incentive Scheme Deferred Shares | | | 253,076 | | | | 54,268 | | | | 170,712 | | | | – | | | | 136,632 | | | | 4,195 | |
Group Incentive Scheme Options | | | 297,042 | | | | – | | | | 172,704 | | | | 14,546 | | | | 109,792 | | | | 109,792 | |
– weighted average exercise price – £ | | | 12.94 | | | | – | | | | 10.96 | | | | 16.51 | | | | 15.58 | | | | 15.58 | |
– weighted average share price – £ | | | | | | | | | | | 19.29 | | | | | | | | | | | | | |
– weighted average contractual term for outstanding options – days | | | | | | | | | | | | | | | | | | | – | | | | | |
Group Short Term Incentive Plan Deferred Shares | | | 890,553 | | | | 281,561 | | | | 412,558 | | | | 58,786 | | | | 700,770 | | | | 65,838 | |
Group Short Term Incentive Plan Options | | | 96,012 | | | | – | | | | 21,030 | | | | 20,022 | | | | 54,960 | | | | 54,960 | |
– weighted average exercise price – £ | | | 20.35 | | | | – | | | | 17.53 | | | | 22.08 | | | | 20.80 | | | | 20.80 | |
– weighted average share price – £ | | | | | | | | | | | 19.37 | | | | | | | | | | | | | |
– weighted average contractual term for outstanding options – days | | | | | | | | | | | | | | | | | | | – | | | | | |
Long Term Incentive Plan Performance Shares | | | 3,941,270 | | | | 401,831 | | | | 1,684,852 | | | | 20,083 | | | | 2,638,166 | | | | 912,476 | |
Transitional GMC Grants | | | – | | | | 39,860 | | | | – | | | | – | | | | 39,860 | | | | – | |
Management Award Plan Restricted Shares | | | 2,837,040 | | | | 797,840 | | | | 860,119 | | | | 356,685 | | | | 2,418,076 | | | | 250,305 | |
Shareplus Matched Shares | | | 588,356 | | | �� | 439,800 | | | | 241,642 | | | | 84,311 | | | | 702,203 | | | | – | |
| | | | | | | | | | | | | | | | | | | | | | | | |
Fair valuelegislation and assumptions in the calculation of fair value for awards issued
| | | | | | | | | | | | | | | | | | | | | | | | |
2013 | | Weighted
average
fair value
of awards
granted
during
the year (c)
US$ | | | Risk-free
interest
rate(d) | | | Estimated
life of
awards | | | Share
price at
grant
date | | | Estimated
volatility
of share
price(e) | | | Dividend
yield | |
BHP Billiton Limited | | | | | | | | | | | | | | | | | | | | | | | | |
Group Incentive Scheme Deferred Shares | | | 32.40 | | | | n/a | | | | 3 years | | | | A$31.45 | | | | n/a | | | | 2.78 | % |
Group Incentive Scheme Options | | | – | | | | – | | | | – | | | | – | | | | – | | | | – | |
Group Short Term Incentive Plan Deferred Shares | | | 29.84 | | | | n/a | | | | 3 years | | | | A$31.45 | | | | n/a | | | | 2.78 | % |
Group Short Term Incentive Plan Options | | | – | | | | – | | | | – | | | | – | | | | – | | | | – | |
Long Term Incentive Plan Performance Shares | | | 16.41 | | | | 0.73 | % | | | 5 years | | | | A$31.45 | | | | 35.0 | % | | | 2.78 | % |
Transitional GMC Grants | | | 28.61 | | | | n/a | | | | 3-4 years | | | | A$31.45 | | | | n/a | | | | 2.78 | % |
Management Award Plan Restricted Shares | | | 29.01 | | | | n/a | | | | 3 years | | | | A$31.45 | | | | n/a | | | | 2.78 | % |
Shareplus Matched Shares | | | 32.55 | | | | 3.34 | % | | | 3 years | | | | A$33.74 | | | | n/a | | | | 2.50 | % |
| | | | | | | | | | | | | | | | | | | | | | | | |
BHP Billiton Plc | | | | | | | | | | | | | | | | | | | | | | | | |
Group Incentive Scheme Deferred Shares | | | 28.91 | | | | n/a | | | | 3 years | | | | £18.06 | | | | n/a | | | | 3.31 | % |
Group Incentive Scheme Options | | | – | | | | – | | | | – | | | | – | | | | – | | | | – | |
Group Short Term Incentive Plan Deferred Shares | | | 26.22 | | | | n/a | | | | 3 years | | | | £18.06 | | | | n/a | | | | 3.31 | % |
Group Short Term Incentive Plan Options | | | – | | | | – | | | | – | | | | – | | | | – | | | | – | |
Long Term Incentive Plan Performance Shares | | | 14.59 | | | | 0.73 | % | | | 5 years | | | | £18.06 | | | | 35.0 | % | | | 3.31 | % |
Transitional GMC Grants | | | 24.94 | | | | n/a | | | | 3-4 years | | | | £18.06 | | | | n/a | | | | 3.31 | % |
Management Award Plan Restricted Shares | | | 25.37 | | | | n/a | | | | 3 years | | | | £18.06 | | | | n/a | | | | 3.31 | % |
Shareplus Matched Shares | | | 28.80 | | | | 2.24 | % | | | 3 years | | | | £19.49 | | | | n/a | | | | 2.89 | % |
| | | | | | | | | | | | | | | | | | | | | | | | |
Employee share awards – current plans
| | | | | | | | | | | | | | | | | | | | | | | | |
2012 | | Number
of awards
on issue
at the
beginning
of the
financial
year | | | Number
of
awards
issued
during
the year | | | Number
of
awards
vested
and
exercised | | | Number
of
awards
lapsed | | | Number
of awards
remaining
at the end
of the
financial
year | | | Number of
awards
vested and
exercisable
at the end
of the
financial
year | |
BHP Billiton Limited | | | | | | | | | | | | | | | | | | | | | | | | |
Group Incentive Scheme Deferred Shares | | | 979,532 | | | | 200,295 | | | | 560,080 | | | | 5,412 | | | | 614,335 | | | | 306,199 | |
Group Incentive Scheme Options | | | 935,360 | | | | – | | | | 163,268 | | | | 7,774 | | | | 764,318 | | | | 764,318 | |
– weighted average exercise price – A$ | | | 33.47 | | | | – | | | | 29.10 | | | | 30.12 | | | | 34.44 | | | | 34.44 | |
– weighted average share price – A$ | | | | | | | | | | | 35.37 | | | | | | | | | | | | | |
– weighted average contractual term for outstanding options – days | | | | | | | | | | | | | | | | | | | – | | | | | |
Group Short Term Incentive Plan Deferred Shares | | | 1,649,522 | | | | 1,246,167 | | | | 600,778 | | | | 60,501 | | | | 2,234,410 | | | | 191,704 | |
Group Short Term Incentive Plan Options | | | 335,160 | | | | – | | | | – | | | | – | | | | 335,160 | | | | 247,906 | |
– weighted average exercise price – A$ | | | 39.29 | | | | – | | | | – | | | | – | | | | 39.29 | | | | 38.41 | |
– weighted average share price – A$ | | | | | | | | | | | – | | | | | | | | | | | | | |
– weighted average contractual term for outstanding options – days | | | | | | | | | | | | | | | | | | | 14 | | | | | |
Long Term Incentive Plan Performance Shares | | | 13,531,419 | | | | 550,954 | | | | 3,747,840 | | | | 287,179 | | | | 10,047,354 | | | | 2,250,843 | |
Management Award Plan Restricted Shares | | | 6,207,609 | | | | 3,287,253 | | | | 1,334,130 | | | | 319,058 | | | | 7,841,674 | | | | 554,150 | |
Shareplus Matched Shares | | | 2,154,184 | | | | 1,620,551 | | | | 1,113,270 | | | | 225,264 | | | | 2,436,201 | | | | – | |
| | | | | | | | | | | | | | | | | | | | | | | | |
BHP Billiton Plc | | | | | | | | | | | | | | | | | | | | | | | | |
Group Incentive Scheme Deferred Shares | | | 358,741 | | | | 78,169 | | | | 175,749 | | | | 8,085 | | | | 253,076 | | | | 121,712 | |
Group Incentive Scheme Options | | | 490,143 | | | | – | | | | 169,287 | | | | 23,814 | | | | 297,042 | | | | 266,653 | |
– weighted average exercise price – £ | | | 12.51 | | | | – | | | | 11.20 | | | | 16.51 | | | | 12.94 | | | | 11.71 | |
– weighted average share price – £ | | | | | | | | | | | 19.43 | | | | | | | | | | | | | |
– weighted average contractual term for outstanding options – days | | | | | | | | | | | | | | | | | | | 5 | | | | | |
Group Short Term Incentive Plan Deferred Shares | | | 715,310 | | | | 489,703 | | | | 309,737 | | | | 4,723 | | | | 890,553 | | | | 117,071 | |
Group Short Term Incentive Plan Options | | | 96,012 | | | | – | | | | – | | | | – | | | | 96,012 | | | | 29,457 | |
– weighted average exercise price – £ | | | 20.35 | | | | – | | | | – | | | | – | | | | 20.35 | | | | 16.44 | |
– weighted average share price – £ | | | | | | | | | | | – | | | | | | | | | | | | | |
– weighted average contractual term for outstanding options – days | | | | | | | | | | | | | | | | | | | 37 | | | | | |
Long Term Incentive Plan Performance Shares | | | 5,461,373 | | | | 293,020 | | | | 1,637,984 | | | | 175,139 | | | | 3,941,270 | | | | 859,016 | |
Management Award Plan Restricted Shares | | | 2,358,080 | | | | 1,084,015 | | | | 540,306 | | | | 64,749 | | | | 2,837,040 | | | | 257,500 | |
Shareplus Matched Shares | | | 516,791 | | | | 400,855 | | | | 259,884 | | | | 69,406 | | | | 588,356 | | | | – | |
| | | | | | | | | | | | | | | | | | | | | | | | |
Fair valueits interaction with income tax accounting principles. These judgements and assumptions in the calculation of fair value for awards issued
| | | | | | | | | | | | | | | | | | | | | | | | |
2012 | | Weighted
average
fair value
of awards
granted
during
the year (c)
US$ | | | Risk-free
interest
rate(d) | | | Estimated
life of
awards | | | Share
price at
grant
date | | | Estimated
volatility
of share
price(e) | | | Dividend
yield | |
BHP Billiton Limited | | | | | | | | | | | | | | | | | | | | | | | | |
Group Incentive Scheme Deferred Shares | | | 47.77 | | | | n/a | | | | 3 years | | | | A$43.77 | | | | n/a | | | | 2.19 | % |
Group Incentive Scheme Options | | | – | | | | – | | | | – | | | | – | | | | – | | | | – | |
Group Short Term Incentive Plan Deferred Shares | | | 44.77 | | | | n/a | | | | 3 years | | | | A$43.77 | | | | n/a | | | | 2.19 | % |
Group Short Term Incentive Plan Options | | | – | | | | – | | | | – | | | | – | | | | – | | | | – | |
Long Term Incentive Plan Performance Shares | | | 27.61 | | | | 1.82 | % | | | 5 years | | | | A$43.77 | | | | 33.0 | % | | | 2.19 | % |
Management Award Plan Restricted Shares | | | 43.79 | | | | n/a | | | | 3 years | | | | A$43.77 | | | | n/a | | | | 2.19 | % |
Shareplus Matched Shares | | | 30.47 | | | | 4.38 | % | | | 3 years | | | | A$33.80 | | | | n/a | | | | 2.25 | % |
| | | | | | | | | | | | | | | | | | | | | | | | |
BHP Billiton Plc | | | | | | | | | | | | | | | | | | | | | | | | |
Group Incentive Scheme Deferred Shares | | | 40.38 | | | | n/a | | | | 3 years | | | | £24.60 | | | | n/a | | | | 2.47 | % |
Group Incentive Scheme Options | | | – | | | | – | | | | – | | | | – | | | | – | | | | – | |
Group Short Term Incentive Plan Deferred Shares | | | 37.52 | | | | n/a | | | | 3 years | | | | £24.60 | | | | n/a | | | | 2.47 | % |
Group Short Term Incentive Plan Options | | | – | | | | – | | | | – | | | | – | | | | – | | | | – | |
Long Term Incentive Plan Performance Shares | | | 23.27 | | | | 1.82 | % | | | 5 years | | | | £24.60 | | | | 33.0 | % | | | 2.47 | % |
Management Award Plan Restricted Shares | | | 36.59 | | | | n/a | | | | 3 years | | | | £24.60 | | | | n/a | | | | 2.47 | % |
Shareplus Matched Shares | | | 25.57 | | | | 2.76 | % | | | 3 years | | | | £18.53 | | | | n/a | | | | 2.57 | % |
| | | | | | | | | | | | | | | | | | | | | | | | |
Employee share awards – current plans
| | | | | | | | | | | | | | | | | | | | | | | | |
2011 | | Number
of awards
on issue
at the
beginning
of the
financial
year | | | Number
of
awards
issued
during
the year | | | Number
of
awards
vested
and
exercised | | | Number
of
awards
lapsed | | | Number
of awards
remaining
at the end
of the
financial
year | | | Number of
awards
vested and
exercisable
at the end
of the
financial
year | |
BHP Billiton Limited | | | | | | | | | | | | | | | | | | | | | | | | |
Group Incentive Scheme Deferred Shares | | | 2,591,472 | | | | 166,654 | | | | 1,747,477 | | | | 31,117 | | | | 979,532 | | | | 659,511 | |
Group Incentive Scheme Options | | | 1,605,668 | | | | – | | | | 663,815 | | | | 6,493 | | | | 935,360 | | | | 935,360 | |
– weighted average exercise price – A$ | | | 31.51 | | | | – | | | | 28.77 | | | | 29.15 | | | | 33.47 | | | | 33.47 | |
– weighted average share price – A$ | | | | | | | | | | | 42.25 | | | | | | | | | | | | | |
– weighted average contractual term for outstanding options – days | | | | | | | | | | | | | | | | | | | – | | | | | |
Group Incentive Scheme Performance Shares | | | 3,541 | | | | – | | | | 3,541 | | | | – | | | | – | | | | – | |
Group Short Term Incentive Plan Deferred Shares | | | 867,717 | | | | 939,359 | | | | 118,628 | | | | 38,926 | | | | 1,649,522 | | | | – | |
Group Short Term Incentive Plan Options | | | 247,906 | | | | 87,254 | | | | – | | | | – | | | | 335,160 | | | | – | |
– weighted average exercise price – A$ | | | 38.41 | | | | 41.78 | | | | – | | | | – | | | | 39.29 | | | | – | |
– weighted average share price – A$ | | | | | | | | | | | – | | | | | | | | | | | | | |
– weighted average contractual term for outstanding options – days | | | | | | | | | | | | | | | | | | | 150 | | | | | |
Long Term Incentive Plan Performance Shares | | | 17,790,696 | | | | 590,000 | | | | 4,382,309 | | | | 466,968 | | | | 13,531,419 | | | | 1,223,312 | |
Management Award Plan Restricted Shares | | | 4,408,244 | | | | 2,452,996 | | | | 283,648 | | | | 369,983 | | | | 6,207,609 | | | | – | |
Shareplus Matched Shares | | | 2,432,760 | | | | 1,076,579 | | | | 1,095,254 | | | | 259,901 | | | | 2,154,184 | | | | – | |
| | | | | | | | | | | | | | | | | | | | | | | | |
BHP Billiton Plc | | | | | | | | | | | | | | | | | | | | | | | | |
Group Incentive Scheme Deferred Shares | | | 842,747 | | | | 53,195 | | | | 522,227 | | | | 14,974 | | | | 358,741 | | | | 259,727 | |
Group Incentive Scheme Options | | | 1,248,847 | | | | 30,389 | | | | 766,831 | | | | 22,262 | | | | 490,143 | | | | 443,635 | |
– weighted average exercise price – £ | | | 11.38 | | | | 23.71 | | | | 11.22 | | | | 8.82 | | | | 12.51 | | | | 11.52 | |
– weighted average share price – £ | | | | | | | | | | | 20.95 | | | | | | | | | | | | | |
– weighted average contractual term for outstanding options – days | | | | | | | | | | | | | | | | | | | 28 | | | | | |
Group Short Term Incentive Plan Deferred Shares | | | 420,997 | | | | 359,440 | | | | 58,953 | | | | 6,174 | | | | 715,310 | | | | – | |
Group Short Term Incentive Plan Options | | | 29,457 | | | | 66,555 | | | | – | | | | – | | | | 96,012 | | | | – | |
– weighted average exercise price – £ | | | 16.44 | | | | 22.08 | | | | – | | | | – | | | | 20.35 | | | | – | |
– weighted average share price – £ | | | | | | | | | | | – | | | | | | | | | | | | | |
– weighted average contractual term for outstanding options – days | | | | | | | | | | | | | | | | | | | 307 | | | | | |
Long Term Incentive Plan Performance Shares | | | 7,024,705 | | | | 240,000 | | | | 1,616,087 | | | | 187,245 | | | | 5,461,373 | | | | 712,042 | |
Management Award Plan Restricted Shares | | | 1,810,541 | | | | 848,950 | | | | 101,921 | | | | 199,490 | | | | 2,358,080 | | | | – | |
Shareplus Matched Shares | | | 607,931 | | | | 260,990 | | | | 285,382 | | | | 66,748 | | | | 516,791 | | | | – | |
| | | | | | | | | | | | | | | | | | | | | | | | |
Fair value and assumptions in the calculation of fair value for awards issued
| | | | | | | | | | | | | | | | | | | | | | | | |
2011 | | Weighted
average
fair value
of awards
granted
during
the year (c)
US$ | | | Risk-free
interest
rate(d) | | | Estimated
life of
awards | | | Share
price at
grant
date | | | Estimated
volatility
of share
price (e) | | | Dividend
yield | |
BHP Billiton Limited | | | | | | | | | | | | | | | | | | | | | | | | |
Group Incentive Scheme Deferred Shares | | | 31.71 | | | | n/a | | | | 3 years | | | | A$37.11 | | | | n/a | | | | 2.69 | % |
Group Incentive Scheme Options | | | – | | | | – | | | | – | | | | – | | | | – | | | | – | |
Group Short Term Incentive Plan Deferred Shares | | | 31.71 | | | | n/a | | | | 3 years | | | | A$37.11 | | | | n/a | | | | 2.69 | % |
Group Short Term Incentive Plan Options | | | 8.84 | | | | 4.80 | % | | | 3 years | | | | A$37.11 | | | | 30.0 | % | | | 2.69 | % |
Long Term Incentive Plan Performance Shares | | | 19.48 | | | | 1.85 | % | | | 5 years | | | | A$37.11 | | | | 33.0 | % | | | 2.69 | % |
Management Award Plan Restricted Shares | | | 30.84 | | | | n/a | | | | 3 years | | | | A$37.11 | | | | n/a | | | | 2.69 | % |
Shareplus Matched Shares | | | 39.02 | | | | 4.26 | % | | | 3 years | | | | A$43.16 | | | | n/a | | | | 2.87 | % |
| | | | | | | | | | | | | | | | | | | | | | | | |
BHP Billiton Plc | | | | | | | | | | | | | | | | | | | | | | | | |
Group Incentive Scheme Deferred Shares | | | 25.98 | | | | n/a | | | | 3 years | | | | £16.95 | | | | n/a | | | | 2.91 | % |
Group Incentive Scheme Options | | | 6.98 | | | | 2.23 | % | | | 3 years | | | | £16.95 | | | | 35.0 | % | | | 2.91 | % |
Group Short Term Incentive Plan Deferred Shares | | | 25.98 | | | | n/a | | | | 3 years | | | | £16.95 | | | | n/a | | | | 2.91 | % |
Group Short Term Incentive Plan Options | | | 6.98 | | | | 2.23 | % | | | 3 years | | | | £16.95 | | | | 35.0 | % | | | 2.91 | % |
Long Term Incentive Plan Performance Shares | | | 15.93 | | | | 1.85 | % | | | 5 years | | | | £16.95 | | | | 33.0 | % | | | 2.91 | % |
Management Award Plan Restricted Shares | | | 25.21 | | | | n/a | | | | 3 years | | | | £16.95 | | | | n/a | | | | 2.91 | % |
Shareplus Matched Shares | | | 35.45 | | | | 3.19 | % | | | 3 years | | | | £22.95 | | | | n/a | | | | 3.24 | % |
| | | | | | | | | | | | | | | | | | | | | | | | |
Employee share awards – past plans(f)
| | | | | | | | | | | | | | | | | | | | | | | | |
| | | | | | |
2013 | | Number
of awards
at the
beginning
of the
financial
year | | | Number
of
awards
issued | | | Number
of
awards
exercised | | | Number
of
awards
lapsed | | | Number
of awards
remaining
at the end
of the
financial
year | | | Number of
awards
exercisable
at the end
of the
financial
year | |
BHP Billiton Limited | | | | | | | | | | | | | | | | | | | | | | | | |
Employee Share Plan Options | | | – | | | | – | | | | – | | | | – | | | | – | | | | – | |
– weighted average exercise price A$ | | | – | | | | – | | | | – | | | | – | | | | – | | | | – | |
Employee Share Plan Shares | | | 5,447,321 | | | | – | �� | | | 1,496,785 | | | | – | | | | 3,950,536 | | | | 3,950,536 | |
Performance Share Plan Performance Rights | | | – | | | | – | | | | – | | | | – | | | | – | | | | – | |
| | | | | | | | | | | | | | | | | | | | | | | | |
BHP Billiton Plc | | | | | | | | | | | | | | | | | | | | | | | | |
Co-Investment Plan | | | – | | | | – | | | | – | | | | – | | | | – | | | | – | |
| | | | | | | | | | | | | | | | | | | | | | | | |
| | | | | | |
2012 | | Number
of awards
at the
beginning
of the
financial
year | | | Number
of
awards
issued | | | Number
of
awards
exercised | | | Number
of
awards
lapsed | | | Number
of awards
remaining
at the end
of the
financial
year | | | Number of
awards
exercisable
at the end
of the
financial
year | |
BHP Billiton Limited | | | | | | | | | | | | | | | | | | | | | | | | |
Employee Share Plan Options | | | 284,850 | | | | – | | | | 242,010 | | | | 42,840 | | | | – | | | | – | |
– weighted average exercise price A$ | | | 8.30 | | | | – | | | | 8.30 | | | | 8.30 | | | | – | | | | – | |
Employee Share Plan Shares | | | 6,960,419 | | | | – | | | | 1,513,098 | | | | – | | | | 5,447,321 | | | | 5,447,321 | |
Performance Share Plan Performance Rights | | | 58,563 | | | | – | | | | 58,563 | | | | – | | | | – | | | | – | |
| | | | | | | | | | | | | | | | | | | | | | | | |
BHP Billiton Plc | | | | | | | | | | | | | | | | | | | | | | | | |
Co-Investment Plan | | | 2,245 | | | | – | | | | 2,245 | | | | – | | | | – | | | | – | |
| | | | | | | | | | | | | | | | | | | | | | | | |
| | | | | | | | | | | | | | | | | | | | | | | | |
| | | | | | |
2011 | | Number
of awards
at the
beginning
of the
financial
year | | | Number
of
awards
issued | | | Number
of
awards
exercised | | | Number
of
awards
lapsed | | | Number
of awards
remaining
at the end
of the
financial
year | | | Number of
awards
exercisable
at the end
of the
financial
year | |
BHP Billiton Limited | | | | | | | | | | | | | | | | | | | | | | | | |
Employee Share Plan Options | | | 865,295 | | | | – | | | | 580,445 | | | | – | | | | 284,850 | | | | 284,850 | |
– weighted average exercise price A$ | | | 8.37 | | | | – | | | | 8.41 | | | | – | | | | 8.30 | | | | 8.30 | |
Employee Share Plan Shares | | | 8,210,218 | | | | – | | | | 1,249,799 | | | | – | | | | 6,960,419 | | | | 6,960,419 | |
Executive Share Scheme Partly Paid Shares | | | 189,918 | | | | – | | | | 189,918 | | | | – | | | | – | | | | – | |
Performance Share Plan Performance Rights | | | 58,563 | | | | – | | | | – | | | | – | | | | 58,563 | | | | 58,563 | |
| | | | | | | | | | | | | | | | | | | | | | | | |
BHP Billiton Plc | | | | | | | | | | | | | | | | | | | | | | | | |
Co-Investment Plan | | | 22,996 | | | | – | | | | 4,640 | | | | 16,111 | | | | 2,245 | | | | 2,245 | |
| | | | | | | | | | | | | | | | | | | | | | | | |
Employee share awards – summary (h) (i)
| | | | | | | | | | | | | | |
| | | Awards outstanding at: | | | Exercise price (g) | | | Exercise period/release date |
Month of issue | | 30 June 2013 | | | 12 September 2013 | | | |
BHP Billiton Limited | | | | | | | | | | | | | | |
Employee Share Plan Shares | | | | | | | | | | | | | | |
October 1997 | | | 1,049,897 | | | | 1,032,757 | | | | – | | | Oct 1997 – Oct 2017 |
May 1995 | | | 1,726,630 | | | | 1,519,707 | | | | – | | | May 1995 – May 2015 |
May 1994 | | | 1,174,009 | | | | 933,425 | | | | – | | | May 1994 – May 2014 |
| | | | | | | | | | | | | | |
| | | 3,950,536 | | | | 3,485,889 | | | | | | | |
| | | | | | | | | | | | | | |
Group Incentive Scheme | | | | | | | | | | | | | | |
Deferred Shares | | | | | | | | | | | | | | |
December 2012 | | | 53,854 | | | | 28,915 | | | | – | | | Aug 2014 – Aug 2017 |
December 2011 | | | 167,847 | | | | – | | | | – | | | Aug 2013 – Aug 2016 |
December 2008 | | | 23,167 | | | | – | | | | – | | | Aug 2010 – Aug 2013 |
Options | | | | | | | | | | | | | | |
December 2008 | | | 90,389 | | | | – | | | | A$29.15 | | | Aug 2010 – Aug 2013 |
| | | | | | | | | | | | | | |
| | | 335,257 | | | | 28,915 | | | | | | | |
| | | | | | | | | | | | | | |
Group Short Term Incentive Plan | | | | | | | | | | | | | | |
Deferred Shares | | | | | | | | | | | | | | |
October 2012 | | | 1,204,291 | | | | 1,048,514 | | | | – | | | Aug 2014 – Aug 2017 |
October 2011 | | | 989,625 | | | | – | | | | – | | | Aug 2013 – Aug 2016 |
October 2010 | | | 115,126 | | | | 82,691 | | | | – | | | Aug 2012 – Aug 2015 |
October 2009 | | | 79,256 | | | | 50,085 | | | | – | | | Aug 2011 – Aug 2014 |
Options | | | | | | | | | | | | | | |
October 2010 | | | 87,254 | | | | 87,254 | | | | A$41.78 | �� | | Aug 2012 – Aug 2015 |
October 2009 | | | 197,382 | | | | 139,941 | | | | A$38.41 | | | Aug 2011 – Aug 2014 |
| | | | | | | | | | | | | | |
| | | 2,672,934 | | | | 1,408,485 | | | | | | | |
| | | | | | | | | | | | | | |
| | | | | | | | | | | | | | |
| | | Awards outstanding at: | | | Exercise price (g) | | | Exercise period/release date |
Month of issue | | 30 June 2013 | | | 12 September 2013 | | | |
Long Term Incentive Plan Performance Shares | | | | | | | | | | | | | | |
December 2012 | | | 693,628 | | | | 592,633 | | | | – | | | Aug 2017 – Aug 2022 |
December 2011 | | | 550,954 | | | | 479,707 | | | | – | | | Aug 2016 – Aug 2021 |
December 2010 | | | 520,000 | | | | 478,452 | | | | – | | | Aug 2015 – Aug 2020 |
December 2009 | | | 644,000 | | | | 620,516 | | | | – | | | Aug 2014 – Aug 2019 |
December 2008 | | | 1,290,000 | | | | 216,264 | | | | – | | | Aug 2013 – Aug 2018 |
December 2007 | | | 1,038,294 | | | | 694,780 | | | | – | | | Aug 2012 – Aug 2017 |
December 2006 | | | 773,611 | | | | 539,090 | | | | – | | | Aug 2011 – Aug 2016 |
December 2005 | | | 395,608 | | | | 354,857 | | | | – | | | Aug 2010 – Aug 2015 |
December 2004 | | | 159,940 | | | | 115,856 | | | | – | | | Aug 2009 – Aug 2014 |
| | | | | | | | | | | | | | |
| | | 6,066,035 | | | | 4,092,155 | | | | | | | |
| | | | | | | | | | | | | | |
Transitional GMC Grants | | | | | | | | | | | | | | |
December 2012 | | | 17,917 | | | | 17,917 | | | | – | | | Aug 2015 |
December 2012 | | | 17,917 | | | | 17,917 | | | | – | | | Aug 2016 |
| | | | | | | | | | | | | | |
| | | 35,834 | | | | 35,834 | | | | | | | |
| | | | | | | | | | | | | | |
Management Award Plan | | | | | | | | | | | | | | |
October 2012 and March 2013 | | | 3,045,768 | | | | 2,745,374 | | | | – | | | Aug 2015 – Aug 2018 |
October 2011 and March 2012 | | | 2,457,034 | | | | 2,181,513 | | | | – | | | Aug 2014 – Aug 2017 |
October 2010 and March 2011 | | | 1,791,705 | | | | 705,896 | | | | – | | | Aug 2013 – Aug 2016 |
October 2009 and March 2010 | | | 401,275 | | | | 301,475 | | | | – | | | Aug 2012 – Aug 2015 |
November 2008 and March 2009 | | | 285,900 | | | | 192,000 | | | | – | | | Aug 2011 – Aug 2014 |
| | | | | | | | | | | | | | |
| | | 7,981,682 | | | | 6,126,258 | | | | | | | |
| | | | | | | | | | | | | | |
Shareplus | | | | | | | | | | | | | | |
September 2012 to June 2013 | | | 1,829,004 | | | | 1,785,978 | | | | – | | | Apr 2015 |
September 2011 to June 2012 | | | 1,263,058 | | | | 1,236,033 | | | | – | | | Apr 2014 |
| | | | | | | | | | | | | | |
| | | 3,092,062 | | | | 3,022,011 | | | | | | | |
| | | | | | | | | | | | | | |
| | | |
| | | Awards outstanding at: | | | Exercise price (g) | | | Exercise period/release date |
Month of issue | | 30 June 2013 | | | 12 September 2013 | | | |
BHP Billiton Plc | | | | | | | | | | | | | | |
Group Incentive Scheme | | | | | | | | | | | | | | |
Deferred Shares | | | | | | | | | | | | | | |
December 2012 | | | 54,268 | | | | 54,268 | | | | – | | | Aug 2014 – Aug 2017 |
December 2011 | | | 78,169 | | | | – | | | | – | | | Aug 2013 – Aug 2016 |
December 2008 | | | 4,195 | | | | – | | | | – | | | Aug 2010 – Aug 2013 |
Options | | | | | | | | | | | | | | |
December 2010 | | | 30,389 | | | | 30,389 | | | £ | 23.71 | | | Aug 2012 – Aug 2015 |
December 2009 | | | 16,119 | | | | – | | | £ | 18.68 | | | Aug 2011 – Aug 2014 |
December 2008 | | | 63,284 | | | | – | | | £ | 10.89 | | | Aug 2010 – Aug 2013 |
| | | | | | | | | | | | | | |
| | | 246,424 | | | | 84,657 | | | | | | | |
| | | | | | | | | | | | | | |
| | | | | | | | | | | | | | |
| | | Awards outstanding at: | | | Exercise price (g) | | | Exercise period/release date |
Month of issue | | 30 June 2013 | | | 12 September 2013 | | | |
Group Short Term Incentive Plan | | | | | | | | | | | | | | |
Deferred Shares | | | | | | | | | | | | | | |
October 2012 | | | 275,093 | | | | 275,093 | | | | – | | | Aug 2014 – Aug 2017 |
October 2011 | | | 359,839 | | | | – | | | | – | | | Aug 2013 – Aug 2016 |
October 2010 | | | 46,069 | | | | 29,664 | | | | – | | | Aug 2012 – Aug 2015 |
October 2009 | | | 19,769 | | | | 12,587 | | | | – | | | Aug 2011 – Aug 2014 |
Options | | | | | | | | | | | | | | |
October 2010 | | | 42,473 | | | | 42,473 | | | £ | 22.08 | | | Aug 2012 – Aug 2015 |
October 2009 | | | 12,487 | | | | 12,487 | | | £ | 16.44 | | | Aug 2011 – Aug 2014 |
| | | | | | | | | | | | | | |
| | | 755,730 | | | | 372,304 | | | | | | | |
| | | | | | | | | | | | | | |
Long Term Incentive Plan Performance Shares | | | | | | | | | | | | | | |
December 2012 | | | 401,831 | | | | 401,831 | | | | – | | | Aug 2017 – Aug 2022 |
December 2011 | | | 293,020 | | | | 293,020 | | | | – | | | Aug 2016 – Aug 2021 |
December 2010 | | | 240,000 | | | | 240,000 | | | | – | | | Aug 2015 – Aug 2020 |
December 2009 | | | 240,000 | | | | 240,000 | | | | – | | | Aug 2014 – Aug 2019 |
December 2008 | | | 550,839 | | | | – | | | | – | | | Aug 2013 – Aug 2018 |
December 2007 | | | 390,751 | | | | 303,744 | | | | – | | | Aug 2012 – Aug 2017 |
December 2006 | | | 259,784 | | | | 206,277 | | | | – | | | Aug 2011 – Aug 2016 |
December 2005 | | | 157,124 | | | | 149,624 | | | | – | | | Aug 2010 – Aug 2015 |
December 2004 | | | 104,817 | | | | 71,417 | | | | – | | | Aug 2009 – Aug 2014 |
| | | | | | | | | | | | | | |
| | | 2,638,166 | | | | 1,905,913 | | | | | | | |
| | | | | | | | | | | | | | |
Transitional GMC Grants | | | | | | | | | | | | | | |
December 2012 | | | 19,930 | | | | 19,930 | | | | – | | | Aug 2015 |
December 2012 | | | 19,930 | | | | 19,930 | | | | – | | | Aug 2016 |
| | | | | | | | | | | | | | |
| | | 39,860 | | | | 39,860 | | | | | | | |
| | | | | | | | | | | | | | |
Management Award Plan | | | | | | | | | | | | | | |
October 2012 and March 2013 | | | 773,380 | | | | 773,380 | | | | – | | | Aug 2015 – Aug 2018 |
October 2011 and March 2012 | | | 816,985 | | | | 784,490 | | | | – | | | Aug 2014 – Aug 2017 |
October 2010 and March 2011 | | | 577,406 | | | | 316,843 | | | | – | | | Aug 2013 – Aug 2016 |
October 2009 and March 2010 | | | 151,069 | | | | 124,500 | | | | – | | | Aug 2012 – Aug 2015 |
November 2008 and March 2009 | | | 99,236 | | | | 78,000 | | | | – | | | Aug 2011 – Aug 2014 |
| | | | | | | | | | | | | | |
| | | 2,418,076 | | | | 2,077,213 | | | | | | | |
| | | | | | | | | | | | | | |
Shareplus | | | | | | | | | | | | | | |
September 2012 to June 2013 | | | 408,436 | | | | 393,606 | | | | – | | | Apr 2015 |
September 2011 to June 2012 | | | 293,767 | | | | 285,012 | | | | – | | | Apr 2014 |
| | | | | | | | | | | | | | |
| | | 702,203 | | | | 678,618 | | | | | | | |
| | | | | | | | | | | | | | |
(a) | Awards were made to senior management under four active employee ownership plans in BHP Billiton for the year ended 30 June 2013: the Long Term Incentive Plan (LTIP), Group Incentive Scheme (GIS), Management Award Plan (MAP) and Group Short Term Incentive Plan (GSTIP). These awards take the form of Performance Shares, Deferred Shares and/or Options, and Restricted Shares in either BHP Billiton Limited or BHP Billiton Plc. Awards made are subject to performance hurdles (LTIP) and service conditions (all plans). Subject to the performance conditions and service conditions being met and the extent to which they are met, the awards will vest and the participant will become entitled to the appropriate number of ordinary shares or, if relevant, entitled to exercise options
|
| over the relevant number of ordinary shares. Awards under the plans do not confer any rights to participate in a share issue; however, there is discretion under each of the plans to adjust the awards in response to a variation of BHP Billiton’s share capital. A description of the plans follows: |
The GIS awards are split equally between a cash award (being a percentage of base salary) and a grant of Deferred Shares and/or Options. The GSTIP is a replacement plan to the GIS for certain employees below the GMC and was first introduced during the year ended 30 June 2009. Awards are split equally between a cash award (being a percentage of base salary) and a grant of Deferred Shares and/or Options. Deferred Shares and/or Options are subject to risk and uncertainty, hence there is a two-year vesting period before they can be exercised. If, duringpossibility that period, an individual resigns withoutchanges in circumstances will alter expectations, which may impact the Remuneration Committee’s consent,amount of deferred tax assets and deferred tax liabilities recognised on the balance sheet and the amount of other tax losses and temporary differences not yet recognised. In such circumstances, some or is dismissed for cause, their entitlement is forfeited. Deferred Shares and/or Options in respectall of the year ended 30 June 2013 will be awarded during the year ending 30 June 2014.
The LTIP awards arecarrying amount of recognised deferred tax assets and liabilities may require adjustment, resulting in the form of Performance Shares, and are awarded annually. The performance hurdle applicablea corresponding credit or charge to the awards granted requiresincome statement.
Property, plant and equipment and Intangible assets – recoverable amount
In accordance with the Group’s Total Shareholder Return (TSR) over a five-year performanceaccounting policy, each asset or cash-generating unit is evaluated every reporting period to be greater thandetermine whether there are any indications of impairment or reversal of previously recognised impairment losses. If any such indication exists, a combinationformal estimate of recoverable amount is performed. Where carrying amount exceeds recoverable amount an impairment loss is recognised. A reversal of previously recognised impairment loss is limited to the lesser of the weighted average TSR of a peer group of companies and ofamount that would not cause the Morgan Stanley Capital Index World. Toincreased carrying amount to exceed (a) its recoverable amount; or (b) the extent that the performance hurdle is not achieved, awards are forfeited. There is no retesting. For all Performance Shares to vest, the Group’s TSR must exceed the weighted average TSR of the Index by a specified percentage, determined each year by the Remuneration Committee. Since the establishment of the LTIP in 2004, this percentage has been set each year at 5.5 per cent. For performance between the weighted average TSR of the Index and 5.5 per cent per annum above the Index, vesting occurs on a sliding scale.
The MAP is a replacement plan to the LTIP for employees below the GMC. Under the MAP participants receive an Award of Restricted Shares, the number of which is determined by role, performance and organisational level. There are no performance conditions attached to the Award and all the shares that have been granted will vest at the end of three years providing participants remain in employment over that time.
| (iii) | Transitional GMC Grants |
These awards have two tranches. Tranche one has a three-year service and performance condition and may vest in 2015. Tranche two has a four-year service and performance condition and may vest in 2016. The Remuneration Committee has absolute discretion to determine if the performance condition has been met and whether any, all or some of the Restricted Shares will vest (or otherwise lapse), having regard to (but not limited to) BHP Billiton’s Total Shareholder Return over the three- or four-year performance period (respectively), the participant’s contribution to Group outcomes and the participant’s personal performance (with guidance on this assessment from the CEO). No Dividend Equivalent Payment is payable on these awards.
All awards issued prior to 1 July 2011 are eligible to receive a payment equal to the dividendcarrying amount that would have been earned ondetermined (net of depreciation) had no impairment loss been recognised for the underlying shares represented byasset or cash-generating unit. The recoverable amount of an asset or cash-generating group of assets is measured at the Deferred Shares, Options, Restricted Shareshigher of fair value less costs of disposal and Performance Shares awardedvalue in use.
The determination of fair value and value in use requires management to those participants (the Dividend Equivalent Payment). The Dividend Equivalent Paymentmake estimates and assumptions about expected production and sales volumes, commodity prices (considering current and historical prices, price trends and related factors), reserves (see ‘Reserve estimates’ above), operating costs, closure and rehabilitation costs and future capital expenditure. These estimates and assumptions are subject to risk and uncertainty; hence there is made toa possibility that changes in circumstances will alter these projections, which may impact the participants oncerecoverable amount of the underlying ordinary shares are issuedassets. In such circumstances, some or transferred to them. No Dividend Equivalent Payment is madeall of the carrying amount of the assets may be further impaired or the impairment charge reduced with the impact recorded in respect of Deferred Shares, Options, Restricted Sharesthe income statement.
Provision for closure and Performance Shares that lapse. Awards issued after 1 July 2011 under the GSTIP and MAP plans are no longer eligible to receive the Dividend Equivalent Payment.
(b) | Shareplus, an all-employee share purchase plan, commenced in April 2007. Employees may contribute up to US$5,000 to acquire shares (Acquired Shares) in any Plan year. On the third anniversary of the start of a Plan year, the Company will match the number of Acquired Shares held by the employee at that time with Matched Shares. The employees have no beneficial entitlement to the Matched Shares until they are awarded. Acquired Shares are purchased on a quarterly basis. Employees can sell their Acquired Shares at any time. If, prior to the third anniversary, an individual sells their Acquired Shares, resigns without the Remuneration Committee’s consent or is dismissed for cause, their entitlement to Matched Shares is forfeited. |
(c) | The fair value of awards as presented in the tables above represents the fair value at grant date. The fair values of awards granted were estimated using a Monte Carlo simulation methodology, Black-Scholes option pricing technique and net present value technique. |
(d) | The risk-free interest rate used is an applicable government bond rate. |
(e) | Historical volatility has been used to estimate the volatility of the share price. |
(f) | Awards issued under these plans occurred before 7 November 2002 and as such are exempt from the provisions of IFRS 2 ‘Share-based Payment’. Details of these plans have been provided for information purposes only. |
(g) | Exercise price on awards issued is equal to the exercise price as per awards outstanding. |
(h) | Shares issued on exercise of BHP Billiton’s employee share ownership plans include shares purchased on-market. |
(i) | In respect of employee share awards, the Group utilises the following trusts: |
| (i) | The Billiton Employee Share Ownership Plan Trust is a discretionary trust for the benefit of all employees of BHP Billiton Plc and its subsidiaries. The trustee is an independent company, resident in Jersey. The Trust uses funds provided by BHP Billiton Plc and/or its subsidiaries as appropriate to acquire ordinary shares to enable awards to be made or satisfied under the LTIP, MAP, GIS, GSTIP, CIP, Shareplus and other employee share schemes operated by BHP Billiton Plc from time to time. The ordinary shares may be acquired by purchase in the market or by subscription at not less than nominal value. The Trust has waived its rights to dividends on shares held to meet future awards under Shareplus. |
| (ii) | The BHP Performance Share Plan Trust is a discretionary trust established to distribute shares under selected BHP Billiton Limited employee share plan schemes. The trustee of the trust is BHP Billiton Employee Plan Pty Ltd, an Australian company. The Trust uses funds provided by BHP Billiton Limited and/or its subsidiaries to acquire shares on-market to satisfy exercises made under the LTIP, MAP, GIS, GSTIP and PSP. |
| (iii) | The BHP Billiton Limited Executive Incentive Scheme Trust is a discretionary trust established for the purposes of holding shares in BHP Billiton Limited to satisfy exercises made under the LTIP, MAP, GIS, GSTIP, Shareplus and other employee share schemes operated by BHP Billiton Limited from time to time. |
34 Employeesrehabilitation
| | | | | | | | | | | | |
| | | 2013
Number | | | 2012
Number | | | 2011
Number | |
Average number of employees (a) | | | | | | | | | | | | |
Petroleum and Potash | | | 3,838 | | | | 3,273 | | | | 2,430 | |
Copper | | | 9,648 | | | | 8,775 | | | | 7,602 | |
Iron Ore | | | 8,140 | | | | 5,784 | | | | 4,047 | |
Coal | | | 14,225 | | | | 13,512 | | | | 12,771 | |
Aluminium, Manganese and Nickel | | | 11,115 | | | | 11,388 | | | | 10,437 | |
Group and unallocated | | | 2,530 | | | | 3,638 | | | | 3,470 | |
| | | | | | | | | | | | |
| | | 49,496 | | | | 46,370 | | | | 40,757 | |
| | | | | | | | | | | | |
(a) | Average employee numbers include the Executive Director, 100 per cent of employees of subsidiary companies, and our share of proportionately consolidated entities and operations. Part-time employees are included on a full-time equivalent basis. Employees of businesses acquired or disposed of during the year are included for the period of ownership. People employed by contractors are not included. |
The Group’s accounting policy for the recognition of closure and rehabilitation provisions requires significant estimates and assumptions such as: requirements of the relevant legal and regulatory framework; the magnitude of possible contamination; and the timing, extent and costs of required closure and rehabilitation activity. These uncertainties may result in future actual expenditure differing from the amounts currently provided.35 Auditor’s remuneration
| | | | | | | | | | | | |
| | | 2013 | | | 2012 | | | 2011 | |
| | | US$M | | | US$M | | | US$M | |
Fees payable to the Group’s auditor for assurance services | | | | | | | | | | | | |
Audit of the Group’s annual report(a) | | | 3.756 | | | | 4.577 | | | | 4.216 | |
Audit of subsidiaries and associates(b) | | | 14.464 | | | | 17.927 | | | | 12.729 | |
Audit-related assurance services(c) | | | 5.779 | | | | 6.317 | | | | 4.764 | |
Other assurance services(d) | | | 3.844 | | | | 3.637 | | | | 2.270 | |
| | | | | | | | | | | | |
Total assurance services | | | 27.843 | | | | 32.458 | | | | 23.979 | |
| | | | | | | | | | | | |
Fees payable to the Group’s auditor for other services | | | | | | | | | | | | |
Other services relating to corporate finance(e) | | | 0.393 | | | | 2.378 | | | | 1.243 | |
All other services(f) | | | 1.372 | | | | 1.407 | | | | 1.104 | |
| | | | | | | | | | | | |
Total other services | | | 1.765 | | | | 3.785 | | | | 2.347 | |
| | | | | | | | | | | | |
Total fees | | | 29.608 | | | | 36.243 | | | | 26.326 | |
| | | | | | | | | | | | |
All amounts were paid to KPMG or KPMG affiliated firms. Fees are determined in local currenciesThe provision recognised for each site is periodically reviewed and are billed in US dollarsupdated based on the exchange ratefacts and circumstances available at the beginning oftime. Changes to the relevant financial year.
(a) | Comprises the fee payable to the Group’s auditors for the audit of the Group’s financial statements. |
(b) | Comprises the audits of the Group’s subsidiaries and associates, as well as audit fees of US$0.204 million (2012: US$0.051 million; 2011: US$0.045 million) for pension funds. For UK purposes fees for the audit of pension funds would be classified as a separate component of ‘other services’. |
(c) | Mainly comprises review of half-year reports and audit work in relation to compliance with section 404 of the US Sarbanes-Oxley Act. |
(d) | Mainly comprises assurance in respect of the Group’s sustainability reporting. |
(e) | Mainly comprises services in connection with acquisitions, divestments and debt raising transactions. |
(f) | Mainly comprises non-statutory assurance based procedures and advice on accounting matters. |
36 Subsequent events
On 20 June 2013, BHP Billiton announced an extension of its long-term WAIO joint venture relationship with ITOCHU Corporation (ITOCHU) and Mitsui & Co., Ltd. (Mitsui). This transaction was completed on 10 July 2013 and aligned interests across the WAIO supply chain. Under the terms of the agreement, ITOCHU and Mitsui invested approximately US$822 million and US$720 million, respectively, in shares and loans of BHP Iron Ore (Jimblebar) Pty Ltd, representing an eight per cent and seven per cent interestestimated future costs for operating sites are recognised in the Jimblebar mining hubbalance sheet by adjusting both the closure and resource. The consideration included a share of capitalrehabilitation asset and provision. For closed sites, changes to estimated costs associated withare recognised immediately in the Jimblebar Mine Expansion project.
On 25 July 2013, BHP Billiton announced an investment of US$2.0 billion (BHP Billiton share) to construct a desalination facility which will deliver sustainable water supply to Escondida over the long term.
On 20 August 2013, BHP Billiton announced an investment of US$2.6 billion to finish the excavation and lining of the Jansen Potash project production and service shafts, and to continue the installation of essential surface infrastructure and utilities. This investment will be spread over a number of years, with completion of both shafts expected during the 2016 calendar year, while the associated works program will extend into the 2017 calendar year.
On 18 September 2013, the Papua New Guinea (PNG) Parliament passed legislation which has altered the arrangements BHP Billiton reached with Papua New Guinea Sustainable Development Program Limited
(PNGSDP) and the PNG Government upon the transfer of its shareholding in Ok Tedi Mining Limited (OTML) to PNGSDP in February 2002. The consequences of this legislation will be as follows:
repeal of the section of a 2001 Act under which BHP Billiton parties were protected from environmental claims by the PNG Government;
cancellation of the shares which the PNGSDP holds in OTML and replacement with shares issued to the PNG Government;
the mortgage given by PNGSDP over its OTML shares to secure the BHP Billiton indemnity and other similar obligations is declared void and of no legal effect; and
any provision in an agreement which limits a person’s right to take proceedings against a BHP Billiton party is rendered null and void.
BHP Billiton is considering the impact of this legislation. BHP Billiton retains a broad indemnity from PNGSDP and has adequate security to back that indemnity. Based on currently available information, the legislation is unlikely to materially alter BHP Billiton’s exposure arising from its past ownership of the Ok Tedi mine.
These transactions or events have no impact on the financial statements for the year ended 30 June 2013. Other than the matters outlined above, no matters or circumstances have arisen since the end of the financial year that have significantly affected, or may significantly affect, the operations, results of operations or state of affairs of the Group in subsequent accounting periods.income statement.
9.27.2 Not required for US reporting
9.37.3 Directors’ declaration
In accordance with a resolution of the Directors of the BHP Billiton Group, the Directors declare that:
| (a) | in the Directors’ opinion and to the best of their knowledge the financial statements and notes, set out in sections 9.17.1 and 9.2,7.2, are in accordance with the UK Companies Act 2006 and the Australian Corporations Act 2001, including: |
| | (i) | Complying with the applicable Accounting Standards; and |
| | (ii) | Giving a true and fair view of the assets, liabilities, financial position and profit or loss of each of BHP Billiton Limited, BHP Billiton Plc, the BHP Billiton Group and the undertakings included in the consolidation taken as a whole as at 30 June 20132015 and of their performance for the year ended 30 June 2013;2015; |
| (b) | the financial report also complies with International Financial Reporting Standards, as disclosed in note 1;41 ‘Basis of preparation and measurement’; |
| (c) | to the best of the Directors’ knowledge, the management report (comprising the Strategic Report and Directors’ ReportReport) includes a fair review of the development and performance of the business and the financial position of the BHP Billiton Group and the undertakings included in the consolidation taken as a whole, together with a description of the principal risks and uncertainties that the Group faces; and |
| (d) | in the Directors’ opinion there are reasonable grounds to believe that each of the BHP Billiton Group, BHP Billiton Limited and BHP Billiton Plc will be able to pay its debts as and when they become due and payable. |
The Directors have been given the declarations required by Section 295A of the Australian Corporations Act 2001 from the Chief Executive Officer and Chief Financial Officer for the financial year ended 30 June 2013.2015.
Signed in accordance with a resolution of the Board of Directors.
Jac Nasser AO
Chairman
Andrew Mackenzie
Chief Executive Officer
Dated this 12th10th day of September 20132015
9.47.4 | Statement of Directors’ Responsibilities in respect of the Annual Report and the Financial Statements |
The Directors are responsible for preparing the Annual Report and the Group and parent company financial statements in accordance with applicable law and regulations. References to the ‘Group and parent company financial statements’ are made in relation to the Group and individual parent company financial statements of BHP Billiton Plc.
UK company law requires the Directors to prepare Group and parent company financial statements for each financial year. The Directors are required to prepare the Group financial statements in accordance with IFRS as adopted by the EU and applicable law and have elected to prepare the parent company financial statements in accordance with UK Accounting Standards and applicable law (UK Generally Accepted Accounting Practice).
The Group financial statements must, in accordance with IFRS as adopted by the EU and applicable law, present fairly the financial position and performance of the Group; references in the UK Companies Act 2006 to such financial statements giving a true and fair view are references to their achieving a fair presentation.
The parent company financial statements must, in accordance with UK Generally Accepted Accounting Practice, give a true and fair view of the state of affairs of the parent company at the end of the financial year and of the profit or loss of the parent company for the financial year.
In preparing each of the Group and parent company financial statements, the Directors are required to:
select suitable accounting policies and then apply them consistently;
make judgements and estimates that are reasonable and prudent;
for the Group financial statements, state whether they have been prepared in accordance with IFRS as adopted by the EU;
for the parent company financial statements, state whether applicable UK Accounting Standards have been followed, subject to any material departures disclosed and explained in the parent company financial statements; and
prepare the financial statements on the going concern basis unless it is inappropriate to presume that the Group and the parent company will continue in business.
The Directors are responsible for keeping proper accounting records that disclose with reasonable accuracy at any time the financial position of the parent company and enable them to ensure that its financial statements comply with the UK Companies Act 2006. They have general responsibility for taking such steps as are reasonably open to them to safeguard the assets of the Group and to prevent and detect fraud and other irregularities.
Under applicable law and regulations, the Directors are also responsible for preparing a Strategic Report, Directors’ Report, Directors’ Remuneration Report and Corporate Governance Statement that complies with that law and those regulations.
The Directors are responsible for the maintenance and integrity of the corporate and financial information included on the Company’s website. Legislation in the UK governing the preparation and dissemination of financial statements may differ from legislation in other jurisdictions.
9.5 Not required for US reporting
| 7.5 | Not required for US reporting |
9.67.6 Reports of Independent Registered Public Accounting Firms

Report of Independent Registered Public Accounting Firms
To the members of BHP Billiton Plc and BHP Billiton Limited:
We have audited the accompanying consolidated balance sheets of the BHP Billiton Group (comprising BHP Billiton Plc, BHP Billiton Limited and their respective subsidiaries) as of 30 June 2015 and 30 June 2014, and the related consolidated income statement, consolidated statement of comprehensive income, consolidated statement of changes in equity and consolidated cash flow statement for the years then ended. These consolidated financial statements are the responsibility of the BHP Billiton Group’s management. Our responsibility is to express an opinion on these consolidated financial statements based on our audits. The accompanying consolidated income statement, consolidated statement of comprehensive income, consolidated statement of changes in equity and consolidated cash flow statement for the year ended 30 June 2013 were audited by other auditors (KPMG Audit Plc) whose report thereon dated 25 September 2013, expressed an unqualified opinion on those statements, before the restatement described in note 43 to the consolidated financial statements.
We conducted our audits in accordance with the standards of the Public Company Accounting Oversight Board (United States). Those standards require that we plan and perform the audits to obtain reasonable assurance about whether the financial statements are free of material misstatement. An audit includes examining, on a test basis, evidence supporting the amounts and disclosures in the financial statements. An audit also includes assessing the accounting principles used and significant estimates made by management, as well as evaluating the overall financial statement presentation. We believe that our audits provide a reasonable basis for our opinion.
In our opinion, the consolidated financial statements referred to above present fairly, in all material respects, the financial position of the BHP Billiton Group as of 30 June 2015 and 2014, and the results of its operations and its cash flows for each of the years in thethree-year period ended 30 June 2015, in conformity with International Financial Reporting Standards as issued by the International Accounting Standards Board.
We also have audited the adjustments described in note 43 that were applied to restate the 2014 and 2013 consolidated financial statements. In our opinion, such adjustments are appropriate and have been properly applied. KPMG LLP was not engaged to audit, review, or apply any procedures to the 2013 consolidated financial statements of the BHP Billiton Group other than with respect to the adjustments and, accordingly, it does not express an opinion or any other form of assurance on the 2013 consolidated financial statements taken as a whole.
We also have audited, in accordance with the standards of the Public Company Accounting Oversight Board (United States), the BHP Billiton Group’s internal control over financial reporting as of 30 June 2015, based on criteria established in Internal Control – Integrated Framework (2013) issued by the Committee of Sponsoring Organizations of the Treadway Commission, and our report dated 23 September 2015 expressed an unqualified opinion on the effectiveness of the BHP Billiton Group’s internal control over financial reporting.
| | |
/s/ KPMG LLP KPMG LLP London, United Kingdom 23 September 2015 | | /s/ KPMG KPMG Melbourne, Australia 23 September 2015 |
| | |
| KPMG, an Australian partnership, and KPMG LLP, a UK limited liability partnership, are member firms of the KPMG network of independent member firms affiliated with KPMG International Cooperative (‘KPMG International’), a Swiss entity. | | KPMG Australia’s liability limited by a scheme approved under Professional Standards Legislation. |
Report of Independent Registered Public Accounting Firms
To the members of BHP Billiton Plc and BHP Billiton Limited:
We have audited, before the effects of the adjustments to retrospectively apply the changes in accounting described in note 43, and in note 37 of the 2014 financial statements, the accompanying consolidated income statement, consolidated statement of comprehensive income, consolidated statement of changes in equity and consolidated cash flow statement for the year ended 30 June 2013 of the BHP Billiton Group (comprising BHP Billiton Plc, BHP Billiton Limited and their respective subsidiaries) (‘the 2013 financial statements’). The 2013 financial statements before the effects of the adjustments discussed in note 43, and in note 37 of the 2014 financial statements are not presented herein. The 2013 consolidated financial statements are the responsibility of the BHP Billiton Group’s management. Our responsibility is to express an opinion on these consolidated financial statements based on our audit.
We conducted our audit in accordance with the standards of the Public Company Accounting Oversight Board (United States). Those standards require that we plan and perform the audits to obtain reasonable assurance about whether the financial statements are free of material misstatement. An audit includes examining, on a test basis, evidence supporting the amounts and disclosures in the financial statements. An audit also includes assessing the accounting principles used and significant estimates made by management, as well as evaluating the overall financial statement presentation. We believe that our audit provides a reasonable basis for our opinion.
In our opinion, the 2013 financial statements, before the effects of the adjustments to retrospectively apply the change in accounting described in note 43, and in note 37 of the 2014 financial statements, present fairly, in all material respects, the results of the operations and cash flows for the year ended 30 June 2013 of the BHP Billiton Group in conformity with International Financial Reporting Standards as issued by the International Accounting Standards Board.
KPMG Audit Plc was not engaged to audit, review, or apply any procedures to the adjustments to retrospectively apply the change in accounting described in note 43, and in note 37 of the 2014 financial statements, and accordingly, it does not express an opinion or any other form of assurance about whether such adjustments are appropriate and have been properly applied. Those adjustments were audited by a successor auditor.
| | |
/s/ KPMG Audit Plc KPMG Audit Plc London, United Kingdom 25 September 2013 | | /s/ KPMG KPMG Melbourne, Australia 25 September 2013 |
| | |
| KPMG, an Australian partnership, and KPMG Audit Plc, a UK entity, are member firms of the KPMG network of independent member firms affiliated with KPMG International Cooperative (‘KPMG International’), a Swiss entity | | KPMG Australia’s liability limited by a scheme approved under Professional Standards Legislation. |
Report of Independent Registered Public Accounting Firms
To the members of BHP Billiton Plc and BHP Billiton Limited:
We have audited the BHP Billiton Group’s (comprising BHP Billiton Plc, BHP Billiton Limited and their respective subsidiaries) internal control over financial reporting as of 30 June 2013,2015, based on criteria established in Internal Control – Integrated Framework (2013) issued by the Committee of Sponsoring Organizations of the Treadway Commission (COSO). The BHP Billiton Group’s management is responsible for maintaining effective internal control over financial reporting and for its assessment of the effectiveness of internal control over financial reporting, included in the accompanying section 5.13.13.14.1 Risk and Audit Committee Report. Our responsibility is to express an opinion on the BHP Billiton Group’s internal control over financial reporting based on our audit.
We conducted our audit in accordance with the standards of the Public Company Accounting Oversight Board (United States). Those standards require that we plan and perform the audit to obtain reasonable assurance about whether effective internal control over financial reporting was maintained in all material respects. Our audit included obtaining an understanding of internal control over financial reporting, assessing the risk that a material weakness exists, and testing and evaluating the design and operating effectiveness of internal control based on the assessed risk. Our audit also included performing such other procedures as we considered necessary in the circumstances. We believe that our audit provides a reasonable basis for our opinion.
A company’s internal control over financial reporting is a process designed to provide reasonable assurance regarding the reliability of financial reporting and the preparation of financial statements for external purposes in accordance with generally accepted accounting principles. A company’s internal control over financial reporting includes those policies and procedures that (1) pertain to the maintenance of records that, in reasonable detail, accurately and fairly reflect the transactions and dispositions of the assets of the company; (2) provide reasonable assurance that transactions are recorded as necessary to permit preparation of financial statements in accordance with generally accepted accounting principles, and that receipts and expenditures of the company are being made only in accordance with authorisations of management and directors of the company; and (3) provide reasonable assurance regarding prevention or timely detection of unauthorised acquisition, use, or disposition of the company’s assets that could have a material effect on the financial statements.
Because of its inherent limitations, internal control over financial reporting may not prevent or detect misstatements. Also, projections of any evaluation of effectiveness to future periods are subject to the risk that controls may become inadequate because of changes in conditions, or that the degree of compliance with the policies or procedures may deteriorate.
In our opinion, the BHP Billiton Group maintained, in all material respects, effective internal control over financial reporting as of 30 June 2013,2015, based on criteria established in Internal Control – Integrated Framework (2013) issued by the COSO.
We also have audited, in accordance with the standards of the Public Company Accounting Oversight Board (United States), the consolidated balance sheetsheets of the BHP Billiton Group as of 30 June 20132015 and 2012,30 June 2014, and the related consolidated income statement, consolidated statement of comprehensive income, consolidated statement of changes in equity and consolidated cash flow statement for each of the two years in the three-year periodthen ended, 30 June 2013, and our report dated 2523 September 20132015 expressed an unqualified opinion on those consolidated financial statements. We have also audited the adjustments described in note 43 that were applied to restate the 2014 and 2013 consolidated financial statements.
| | |
/s/ KPMG Audit PlcLLP KPMG Audit PlcLLP London, United Kingdom 2523 September 20132015
| | /s/ KPMG KPMG Melbourne, Australia 2523 September 20132015
|
Report of Independent Registered Public Accounting Firms
To the members of BHP Billiton Plc and BHP Billiton Limited:
We have audited the accompanying consolidated balance sheet of the BHP Billiton Group (comprising BHP Billiton Plc, BHP Billiton Limited and their respective subsidiaries) as of 30 June 2013 and 2012, and the related consolidated income statement, consolidated statement of comprehensive income, consolidated statement of changes in equity and consolidated cash flow statement for each of the years in the three-year period ended 30 June 2013. These consolidated financial statements are the responsibility of the BHP Billiton Group’s management. Our responsibility is to express an opinion on these consolidated financial statements based on our audits.
We conducted our audits in accordance with the standards of the Public Company Accounting Oversight Board (United States). Those standards require that we plan and perform the audit to obtain reasonable assurance about whether the financial statements are free of material misstatement. An audit includes examining, on a test basis, evidence supporting the amounts and disclosures in the financial statements. An audit also includes assessing the accounting principles used and significant estimates made by management, as well as evaluating the overall financial statement presentation. We believe that our audits provide a reasonable basis for our opinion.
In our opinion, the consolidated financial statements referred to above present fairly, in all material respects, the financial position of the BHP Billiton Group as of 30 June 2013 and 2012, and the results of its operations and its cash flows for each of the years in the three-year period ended 30 June 2013, in conformity with International Financial Reporting Standards as issued by the International Accounting Standards Board.
We also have audited, in accordance with the standards of the Public Company Accounting Oversight Board (United States), the BHP Billiton Group’s internal control over financial reporting as of 30 June 2013, based on criteria established in Internal Control – Integrated Framework issued by the Committee of Sponsoring Organizations of the Treadway Commission, and our report dated 25 September 2013 expressed an unqualified opinion on the effectiveness of BHP Billiton Group’s internal control over financial reporting.
| | |
/s/ KPMG, Audit Plc
an Australian partnership, and KPMG Audit Plc London, United Kingdom
25 September 2013
LLP, a UK limited liability partnership, are member firms of the KPMG network of independent member firms affiliated with KPMG International Cooperative (‘KPMG International’), a Swiss entity. | | /s/ KPMG
KPMG
Melbourne, Australia
25 September 2013
Australia’s liability limited by a scheme approved under Professional Standards Legislation. |
9.77.7 Supplementary oil and gas information – unaudited
In accordance with the requirements of the Financial Accounting Standards Board (FASB) Accounting Standard Codification ‘Extractive Activities-Oil and Gas’ (Topic 932) and SEC requirements set out in Subpart 1200 of Regulation S-K, the Group is presenting certain disclosures about its oil and gas activities. These disclosures are presented below as supplementary oil and gas information, in addition to information disclosed in section 2.2.11.12.2 ‘Petroleum and Potash Business’, section 2.3.12.1.1 ‘Petroleum and Potash Business’, section 2.2.1 ‘Production – Petroleum’ and section 2.13.12.3.1 ‘Petroleum reserves’.
The information set out in this section is referred to as unaudited as it is not included in the scope of the audit opinion of the independent auditor on the Consolidated Financial Statements, refer section 9.67.6 Reports of Independent Auditors’ report.Registered Public Accounting Firms.
Reserves and production
Proved oil and gas reserves and net crude oil and condensate, natural gas, LNG and NGL production information is included in section 2.3.12.2.1 ‘Production – Petroleum’ and section 2.13.12.3.1 ‘Petroleum reserves’ of this Annual Report.
Capitalised costs relating to oil and gas production activities
The following table shows the aggregate capitalised costs relating to oil and gas exploration and production activities and related accumulated depreciation, depletion, amortisation and valuation allowances.
| | | | Australia | | United States | | Other (a) | | Total | | | Australia | | United
States | | Other (b) | | Total | |
| | | US$M | | US$M | | US$M | | US$M | | | US$M | | US$M | | US$M | | US$M | |
Capitalised cost | | | | | | | | | | | | | | | | |
2013 | | | | | | | | | |
2015 | | | | | | | | | |
Unproved properties | | | 279 | | | | 7,875 | | | | 154 | | | | 8,308 | | | | 385 | | | | 8,117 | | | | 99 | | | | 8,601 | |
Proved properties | | | 13,870 | | | | 29,939 | | | | 3,871 | | | | 47,680 | | | | 15,125 | | | | 37,341 | | | | 2,443 | | | | 54,909 | |
| | | | | | | | | | | | | | | | | | | | | | | | |
Total costs | | | 14,149 | | | | 37,814 | | | | 4,025 | | | | 55,988 | | | | 15,510 | | | | 45,458 | | | | 2,542 | | | | 63,510 | |
Less: Accumulated depreciation, depletion, amortisation and valuation allowances | | | (6,512 | ) | | | (10,295 | ) | | | (3,314 | ) | | | (20,121 | ) | | | (7,727 | ) | | | (19,100 | ) | | | (2,094 | ) | | | (28,921 | ) |
| | | | | | | | | | | | | | | | | | | | | | | | |
Net capitalised costs | | | 7,637 | | | | 27,519 | | | | 711 | | | | 35,867 | | | | 7,783 | | | | 26,358 | | | | 448 | | | | 34,589 | |
| | | | | | | | | | | | | | | | | | | | | | | | |
2012 | | | | | | | | | |
2014 | | | | | | | | | |
Unproved properties | | | 363 | | | | 11,800 | | | | 155 | | | | 12,318 | | | 344 | | | 7,355 | | | 200 | | | 7,899 | |
Proved properties | | | 12,572 | | | | 20,008 | | | | 3,846 | | | | 36,426 | | | 14,801 | | | 34,963 | | | 2,388 | | | 52,152 | |
| | | | | | | | | | | | | | | | | | | | | | | | |
Total costs | | | 12,935 | | | | 31,808 | | | | 4,001 | | | | 48,744 | | | 15,145 | | | 42,318 | | | 2,588 | | | 60,051 | |
Less: Accumulated depreciation, depletion, amortisation and valuation allowances | | | (5,973 | ) | | | (7,447 | ) | | | (3,211 | ) | | | (16,631 | ) | | (7,135 | ) | | (13,269 | ) | | (2,021 | ) | | (22,425 | ) |
| | | | | | | | | | | | | | | | | | | | | | | | |
Net capitalised costs | | | 6,962 | | | | 24,361 | | | | 790 | | | | 32,113 | | | 8,010 | | | 29,049 | | | 567 | | | 37,626 | |
| | | | | | | | | | | | | | | | | | | | | | | | |
2011 | | | | | | | | | |
2013(a) | | | | | | | | | |
Unproved properties | | | 321 | | | | 3,143 | | | | 116 | | | | 3,580 | | | 279 | | | 7,875 | | | 154 | | | 8,308 | |
Proved properties | | | 10,935 | | | | 9,248 | | | | 4,304 | | | | 24,487 | | | 13,870 | | | 29,781 | | | 3,871 | | | 47,522 | |
| | | | | | | | | | | | | | | | | | | | | | | | |
Total costs | | | 11,256 | | | | 12,391 | | | | 4,420 | | | | 28,067 | | | 14,149 | | | 37,656 | | | 4,025 | | | 55,830 | |
Less: Accumulated depreciation, depletion, amortisation and valuation allowances | | | (5,285 | ) | | | (3,183 | ) | | | (3,601 | ) | | | (12,069 | ) | | (6,512 | ) | | (10,258 | ) | | (3,314 | ) | | (20,084 | ) |
| | | | | | | | | | | | | | | | | | | | | | | | |
Net capitalised costs | | | 5,971 | | | | 9,208 | | | | 819 | | | | 15,998 | | | 7,637 | | | 27,398 | | | 711 | | | 35,746 | |
| | | | | | | | | | | | | | | | | | | | | | | | |
| (a) | Comparative information for 2013 has been restated on account of adoption of IFRS 10 and 11. The impact to net capitalised costs was a reduction of US$121 million in 2013. |
| (b) | Other is primarily comprised of Algeria, Brazil, Pakistan, Trinidad and Tobago and the United Kingdom. |
Costs incurred relating to oil and gas property acquisition, exploration and development activities
The following table shows costs incurred relating to oil and gas property acquisition, exploration and development activities (whether charged to expense or capitalised). Amounts shown include interest capitalised.
| | | | Australia | | | United States | | | Other (c) | | | Total | | | Australia | | | United States | | | Other (c) | | | Total | |
| | | US$M | | | US$M | | | US$M | | | US$M | | | US$M | | | US$M | | | US$M | | | US$M | |
2013 | | | | | | | | | |
2015 | | | | | | | | | |
Acquisitions of proved property | | | – | | | | – | | | | – | | | | – | | | | – | | | | – | | | | – | | | | – | |
Acquisitions of unproved property | | | – | | | | 123 | | | | – | | | | 123 | | | | – | | | | 37 | | | | – | | | | 37 | |
Exploration(a) | | | 125 | | | | 373 | | | | 221 | | | | 719 | | | | 127 | | | | 281 | | | | 248 | | | | 656 | |
Development | | | 1,410 | | | | 5,698 | | | | 66 | | | | 7,174 | | | | 429 | | | | 4,036 | | | | 52 | | | | 4,517 | |
| | | | | | | | | | | | | | | | | | | | | | | | |
Total costs (b) | | | 1,535 | | | | 6,194 | | | | 287 | | | | 8,016 | | | | 556 | | | | 4,354 | | | | 300 | | | | 5,210 | |
| | | | | | | | | | | | | | | | | | | | | | | | |
2012 | | | | | | | | | |
2014 | | | | | | | | | |
Acquisitions of proved property | | | – | | | | 4,746 | | | | – | | | | 4,746 | | | | – | | | | – | | | | – | | | | – | |
Acquisitions of unproved property | | | 5 | | | | 10,366 | | | | – | | | | 10,371 | | | | 35 | | | | 217 | | | | 42 | | | | 294 | |
Exploration(a) | | | 251 | | | | 690 | | | | 331 | | | | 1,272 | | | | 185 | | | | 242 | | | | 97 | | | | 524 | |
Development | | | 1,663 | | | | 4,460 | | | | 102 | | | | 6,225 | | | | 949 | | | | 5,034 | | | | 75 | | | | 6,058 | |
| | | | | | | | | | | | | | | | | | | | | | | | |
Total costs(b) | | | 1,919 | | | | 20,262 | | | | 433 | | | | 22,614 | | | | 1,169 | | | | 5,493 | | | | 214 | | | | 6,876 | |
| | | | | | | | | | | | | | | | | | | | | | | | |
2011 | | | | | | | | | |
2013 (d) | | | | | | | | | |
Acquisitions of proved property | | | – | | | | 2,334 | | | | – | | | | 2,334 | | | | – | | | | – | | | | – | | | | – | |
Acquisitions of unproved property | | | 30 | | | | 2,469 | | | | 8 | | | | 2,507 | | | | – | | | | 123 | | | | – | | | | 123 | |
Exploration(a) | | | 187 | | | | 137 | | | | 351 | | | | 675 | | | | 125 | | | | 373 | | | | 221 | | | | 719 | |
Development | | | 1,454 | | | | 558 | | | | 127 | | | | 2,139 | | | | 1,410 | | | | 5,698 | | | | 66 | | | | 7,174 | |
| | | | | | | | | | | | | | | | | | | | | | | | |
Total costs(b) | | | 1,671 | | | | 5,498 | | | | 486 | | | | 7,655 | | | | 1,535 | | | | 6,194 | | | | 287 | | | | 8,016 | |
| | | | | | | | | | | | | | | | | | | | | | | | |
| (a) | Represents gross exploration expenditure.expenditure, including capitalised exploration expenditure, in addition to exploration and evaluation costs charged to income as incurred. |
| (b) | Total costs include US$7,3934,603 million (2012:(2014: US$6,9056,387 million; 2011:2013: US$7,0957,393 million) capitalised during the year. |
| (c) | Other is primarily comprised of Algeria, Pakistan, Trinidad and Tobago and the United Kingdom. |
| (d) | Comparative information for 2013 has been restated on account of adoption of IFRS 10 and 11. |
Results of operations from oil and gas producing activities
The following information is similar to the disclosures in note 2 Segment reporting to1 ‘Segment reporting’ of the BHP Billiton Group financial statements, but differs in several respects as to the level of detail and geographic information. Amounts shown in the following table exclude financial income, financial expenses, and general corporate overheads.
Income taxes were determined by applying the applicable statutory rates to pre-tax income with adjustments for permanent differences and tax credits.
Revenues include sales to affiliates but amounts are not significant.
| | | | | | | | | | | | | | | | |
| | | Australia | | | United States | | | Other (f) | | | Total | |
| | | US$M | | | US$M | | | US$M | | | US$M | |
2013 | | | | | | | | | | | | | | | | |
Oil and gas revenue | | | 5,794 | | | | 5,807 | | | | 1,332 | | | | 12,933 | |
Production costs | | | (753 | ) | | | (1,549 | ) | | | (256 | ) | | | (2,558 | ) |
Exploration expenses | | | (122 | ) | | | (278 | ) | | | (223 | ) | | | (623 | ) |
Depreciation, depletion, amortisation and valuation allowance (a) | | | (561 | ) | | | (2,812 | ) | | | (141 | ) | | | (3,514 | ) |
Production taxes(b) | | | (362 | ) | | | (139 | ) | | | 1 | | | | (500 | ) |
| | | | | | | | | | | | | | | | |
| | | 3,996 | | | | 1,029 | | | | 713 | | | | 5,738 | |
Income taxes | | | (1,265 | ) | | | (162 | ) | | | (637 | ) | | | (2,064 | ) |
Royalty-related taxes(c) | | | (822 | ) | | | – | | | | 8 | | | | (814 | ) |
| | | | | | | | | | | | | | | | |
Results of oil and gas producing activities(d) | | | 1,909 | | | | 867 | | | | 84 | | | | 2,860 | |
| | | | | | | | | | | | | | | | |
2012 | | | | | | | | | | | | | | | | |
Oil and gas revenue | | | 6,233 | | | | 4,894 | | | | 1,580 | | | | 12,707 | |
Production costs | | | (684 | ) | | | (1,186 | ) | | | (354 | ) | | | (2,224 | ) |
Exploration expenses | | | (156 | ) | | | (275 | ) | | | (304 | ) | | | (735 | ) |
Depreciation, depletion, amortisation and valuation allowance (a) | | | (707 | ) | | | (4,964 | ) | | | (218 | ) | | | (5,889 | ) |
Production taxes(b) (e) | | | (342 | ) | | | (41 | ) | | | (30 | ) | | | (413 | ) |
| | | | | | | | | | | | | | | | |
| | | 4,344 | | | | (1,572 | ) | | | 674 | | | | 3,446 | |
Income taxes | | | (1,332 | ) | | | 745 | | | | (534 | ) | | | (1,121 | ) |
Royalty-related taxes(c) | | | (641 | ) | | | – | | | | (3 | ) | | | (644 | ) |
| | | | | | | | | | | | | | | | |
Results of oil and gas producing activities(d) (e) | | | 2,371 | | | | (827 | ) | | | 137 | | | | 1,681 | |
| | | | | | | | | | | | | | | | |
2011 | | | | | | | | | | | | | | | | |
Oil and gas revenue | | | 6,370 | | | | 2,938 | | | | 1,302 | | | | 10,610 | |
Production costs | | | (590 | ) | | | (353 | ) | | | (231 | ) | | | (1,174 | ) |
Exploration expenses | | | (159 | ) | | | (104 | ) | | | (296 | ) | | | (559 | ) |
Depreciation, depletion, amortisation and valuation allowance (a) | | | (851 | ) | | | (893 | ) | | | (230 | ) | | | (1,974 | ) |
Production taxes(b) | | | (332 | ) | | | – | | | | (38 | ) | | | (370 | ) |
| | | | | | | | | | | | | | | | |
| | | 4,438 | | | | 1,588 | | | | 507 | | | | 6,533 | |
Income taxes | | | (1,068 | ) | | | (566 | ) | | | (452 | ) | | | (2,086 | ) |
Royalty-related taxes(c) | | | (734 | ) | | | – | | | | (9 | ) | | | (743 | ) |
| | | | | | | | | | | | | | | | |
Results of oil and gas producing activities(d) | | | 2,636 | | | | 1,022 | | | | 46 | | | | 3,704 | |
| | | | | | | | | | | | | | | | |
| | | | | | | | | | | | | | | | |
| | | Australia | | | United States | | | Other (g) | | | Total | |
| | | US$M | | | US$M | | | US$M | | | US$M | |
2015 | | | | | | | | | | | | | | | | |
Oil and gas revenue(a) | | | 4,184 | | | | 6,334 | | | | 661 | | | | 11,179 | |
Production costs | | | (662 | ) | | | (2,220 | ) | | | (168 | ) | | | (3,050 | ) |
Exploration expenses | | | (124 | ) | | | (242 | ) | | | (241 | ) | | | (607 | ) |
Depreciation, depletion, amortisation and valuation provision (b) | | | (651 | ) | | | (6,597 | ) | | | (170 | ) | | | (7,418 | ) |
Production taxes(c) | | | (232 | ) | | | – | | | | (8 | ) | | | (240 | ) |
| | | | | | | | | | | | | | | | |
| | | 2,515 | | | | (2,725 | ) | | | 74 | | | | (136 | ) |
Income taxes | | | (608 | ) | | | 1,080 | | | | (146 | ) | | | 326 | |
Royalty-related taxes(d) | | | (388 | ) | | | – | | | | 4 | | | | (384 | ) |
| | | | | | | | | | | | | | | | |
Results of oil and gas producing activities(e) | | | 1,519 | | | | (1,645 | ) | | | (68 | ) | | | (194 | ) |
| | | | | | | | | | | | | | | | |
2014 | | | | | | | | | | | | | | | | |
Oil and gas revenue(a) | | | 5,722 | | | | 7,517 | | | | 1,045 | | | | 14,284 | |
Production costs | | | (740 | ) | | | (2,129 | ) | | | (246 | ) | | | (3,115 | ) |
Exploration expenses | | | (157 | ) | | | (233 | ) | | | (99 | ) | | | (489 | ) |
Depreciation, depletion, amortisation and valuation provision (b) | | | (617 | ) | | | (3,465 | ) | | | (172 | ) | | | (4,254 | ) |
Production taxes(c) | | | (340 | ) | | | – | | | | (29 | ) | | | (369 | ) |
| | | | | | | | | | | | | | | | |
| | | 3,868 | | | | 1,690 | | | | 499 | | | | 6,057 | |
Income taxes | | | (1,025 | ) | | | (353 | ) | | | (413 | ) | | | (1,791 | ) |
Royalty-related taxes(d) | | | (662 | ) | | | – | | | | 8 | | | | (654 | ) |
| | | | | | | | | | | | | | | | |
Results of oil and gas producing activities(e) | | | 2,181 | | | | 1,337 | | | | 94 | | | | 3,612 | |
| | | | | | | | | | | | | | | | |
2013(f) | | | | | | | | | | | | | | | | |
Oil and gas revenue(a) | | | 5,794 | | | | 5,807 | | | | 1,332 | | | | 12,933 | |
Production costs | | | (753 | ) | | | (1,693 | ) | | | (256 | ) | | | (2,702 | ) |
Exploration expenses | | | (122 | ) | | | (278 | ) | | | (223 | ) | | | (623 | ) |
Depreciation, depletion, amortisation and valuation provision (b) | | | (561 | ) | | | (2,809 | ) | | | (141 | ) | | | (3,511 | ) |
Production taxes(c) | | | (362 | ) | | | – | | | | 1 | | | | (361 | ) |
| | | | | | | | | | | | | | | | |
| | | 3,996 | | | | 1,027 | | | | 713 | | | | 5,736 | |
Income taxes | | | (1,265 | ) | | | (162 | ) | | | (637 | ) | | | (2,064 | ) |
Royalty-related taxes(d) | | | (822 | ) | | | – | | | | 8 | | | | (814 | ) |
| | | | | | | | | | | | | | | | |
Results of oil and gas producing activities (e) | | | 1,909 | | | | 865 | | | | 84 | | | | 2,858 | |
| | | | | | | | | | | | | | | | |
| (a) | Includes valuation allowancesales to affiliated companies of US$447267 million (2012:(2014: US$2,986262 million; 2011:2013: US$76 million) nil). |
| (b) | Includes a valuation provision of US$2,681 million (2014: US$309 million; 2013: US$447 million). |
| (c) | Includes royalties and excise duty. |
(c)(d) | Includes petroleum resource rent tax and petroleum revenue tax where applicable. |
(d)(e) | Amounts shown exclude financial income, financial expenses and general corporate overheads and, accordingly, do not represent all of the operations attributable to the Petroleum and Potash segment presented in note 2 Segment reporting1 ‘Segment reporting’ to the financial statements. There are no non-controlling equity interests shown in the results of oil and gas producing activities. |
(e) | 2012 US and Total Production taxes and Results of oil and gas producing activities were adjusted to properly reflect an intercompany elimination. |
| (f) | Comparative information for 2013 has been restated on account of adoption of IFRS 10 and 11. The impact to net results of operations was negative US$2 million in 2013. |
| (g) | Other is primarily comprised of Algeria, Pakistan, Trinidad and Tobago and the United Kingdom. |
Standardised measure of discounted future net cash flows relating to proved oil and gas reserves (Standardised measure)
The purpose of this disclosure is to provide data with respect to the estimated future net cash flows from future production of proved developed and undeveloped reserves of crude oil, condensate, natural gas liquids and natural gas.
The Standardised measure is based on the Group’s estimated proved reserves (as presented in section 2.13.12.3.1 ‘Petroleum reserves’) and this data should be read in conjunction with that disclosure, which is hereby incorporated by reference into this section. The Standardised measure is prepared on a basis which presumes that year-end economic and operating conditions will continue over the periods in which year-end proved reserves would be produced. The effects of future inflation, future changes in exchange rates, expected future changes in technology, taxes, operating practices and any regulatory changes have not been included.
The Standardised measure is prepared by projecting the estimated future annual production of proved reserves owned at period end and pricing that future production to derive future cash inflows. Estimates of future cash flows for 2013, 20122015, 2014 and 20112013 are computed using the average first-day-of-the-monthfirst day of the month price during the 12-month period. Future price increases for all periods presented are considered only to the extent that they are provided by fixed and determinable contractual arrangements in effect at year-end and are not dependent upon future inflation or exchange rate changes.
Future cash inflows for all periods presented are then reduced by future costs of producing and developing the year-end proved reserves based on costs in effect at year-end without regard to future inflation or changes in technology or operating practices. Future development costs include the costs of drilling and equipping development wells and construction of platforms and production facilities to gain access to proved reserves owned at year-end. They also include future costs, net of residual salvage value, associated with the abandonment of wells, dismantling of production platforms and rehabilitation of drilling sites. Future cash inflows are further reduced by future income taxes based on tax rates in effect at year-end and after considering the future deductions and credits applicable to proved properties owned at year-end. The resultant annual future net cash flows (after deductions of operating costs including resource rent taxes, development costs and income taxes) are discounted at 10 per cent per annum to derive the Standardised measure.
Standardised measure of discounted future net cash flows relating to proved oil and gas reserves (Standardised measure)continued
There are many important variables, assumptions and imprecisions inherent in developing the Standardised measure, the most important of which are the level of proved reserves and the rate of production thereof. The Standardised measure is not an estimate of the fair market value of the Group’s oil and gas reserves. An estimate of fair value would also take into account, among other things, the expected recovery of reserves in excess of proved reserves, anticipated future changes in prices, costs and exchange rates, anticipated future changes in secondary tax and income tax rates and alternative discount factors representing the time value of money and adjustments for risks inherent in producing oil and gas.
| | | | Australia | | United States | | Other (b) | | Total | | | Australia | | United States | | Other (a) | | Total | |
| | | US$M | | US$M | | US$M | | US$M | | | US$M | | US$M | | US$M | | US$M | |
Standardised measure | | | | | | | | | | | | | | | | |
2013 | | | | | | | | | |
2015 | | | | | | | | | |
Future cash inflows | | | 48,862 | | | | 71,836 | | | | 5,194 | | | | 125,892 | | | | 35,660 | | | | 39,088 | | | | 2,668 | | | | 77,416 | |
Future production costs | | | (12,818 | ) | | | (19,194 | ) | | | (1,147 | ) | | | (33,159 | ) | | | (9,617 | ) | | | (15,303 | ) | | | (526 | ) | | | (25,446 | ) |
Future development costs | | | (6,801 | ) | | | (11,946 | ) | | | (473 | ) | | | (19,220 | ) | | | (5,952 | ) | | | (7,694 | ) | | | (413 | ) | | | (14,059 | ) |
Future income taxes(a) | | | (11,321 | ) | | | (12,185 | ) | | | (1,913 | ) | | | (25,419 | ) | |
Future income taxes | | | | (7,879 | ) | | | (3,009 | ) | | | (959 | ) | | | (11,847 | ) |
| | | | | | | | | | | | | | | | | | | | | | | | |
Future net cash flows | | | 17,922 | | | | 28,511 | | | | 1,661 | | | | 48,094 | | | | 12,212 | | | | 13,082 | | | | 770 | | | | 26,064 | |
Discount at 10 per cent per annum | | | (6,176 | ) | | | (12,785 | ) | | | (360 | ) | | | (19,321 | ) | | | (4,236 | ) | | | (4,384 | ) | | | (200 | ) | | | (8,820 | ) |
| | | | | | | | | | | | | | | | | | | | | | | | |
Standardised measure | | | 11,746 | | | | 15,726 | | | | 1,301 | | | | 28,773 | | | | 7,976 | | | | 8,698 | | | | 570 | | | | 17,244 | |
| | | | | | | | | | | | | | | | | | | | | | | | |
2012 | | | | | | | | | |
2014 | | | | | | | | | |
Future cash inflows | | | 52,777 | | | | 67,811 | | | | 6,293 | | | | 126,881 | | | | 47,633 | | | 70,958 | | | 3,820 | | | 122,411 | |
Future production costs | | | (12,646 | ) | | | (17,582 | ) | | | (1,339 | ) | | | (31,567 | ) | | | (11,355 | ) | | (19,732 | ) | | (717 | ) | | (31,804 | ) |
Future development costs | | | (8,612 | ) | | | (13,212 | ) | | | (450 | ) | | | (22,274 | ) | | | (5,772 | ) | | (12,953 | ) | | (516 | ) | | (19,241 | ) |
Future income taxes(a) | | | (11,882 | ) | | | (10,414 | ) | | | (2,345 | ) | | | (24,641 | ) | |
Future income taxes | | | | (12,240 | ) | | (10,527 | ) | | (1,394 | ) | | (24,161 | ) |
| | | | | | | | | | | | | | | | | | | | | | | | |
Future net cash flows | | | 19,637 | | | | 26,603 | | | | 2,159 | | | | 48,399 | | | | 18,266 | | | 27,746 | | | 1,193 | | | 47,205 | |
Discount at 10 per cent per annum | | | (7,363 | ) | | | (13,090 | ) | | | (469 | ) | | | (20,922 | ) | | | (6,880 | ) | | (10,866 | ) | | (295 | ) | | (18,041 | ) |
| | | | | | | | | | | | | | | | | | | | | | | | |
Standardised measure | | | 12,274 | | | | 13,513 | | | | 1,690 | | | | 27,477 | | | | 11,386 | | | 16,880 | | | 898 | | | 29,164 | |
| | | | | | | | | | | | | | | | | | | | | | | | |
2011 | | | | | | | | | |
2013 | | | | | | | | | |
Future cash inflows | | | 51,067 | | | | 35,004 | | | | 6,109 | | | | 92,180 | | | | 48,862 | | | 71,836 | | | 5,194 | | | 125,892 | |
Future production costs | | | (12,861 | ) | | | (8,757 | ) | | | (1,237 | ) | | | (22,855 | ) | | | (12,818 | ) | | (19,194 | ) | | (1,147 | ) | | (33,159 | ) |
Future development costs | | | (8,935 | ) | | | (6,909 | ) | | | (530 | ) | | | (16,374 | ) | | | (6,801 | ) | | (11,946 | ) | | (473 | ) | | (19,220 | ) |
Future income taxes(a) | | | (10,763 | ) | | | (4,699 | ) | | | (2,131 | ) | | | (17,593 | ) | |
Future income taxes | | | | (11,321 | ) | | (12,185 | ) | | (1,913 | ) | | (25,419 | ) |
| | | | | | | | | | | | | | | | | | | | | | | | |
Future net cash flows | | | 18,508 | | | | 14,639 | | | | 2,211 | | | | 35,358 | | | | 17,922 | | | 28,511 | | | 1,661 | | | 48,094 | |
Discount at 10 per cent per annum | | | (7,955 | ) | | | (6,937 | ) | | | (546 | ) | | | (15,438 | ) | | | (6,176 | ) | | (12,785 | ) | | (360 | ) | | (19,321 | ) |
| | | | | | | | | | | | | | | | | | | | | | | | |
Standardised measure | | | 10,553 | | | | 7,702 | | | | 1,665 | | | | 19,920 | | | | 11,746 | | | 15,726 | | | 1,301 | | | 28,773 | |
| | | | | | | | | | | | | | | | | | | | | | | | |
| (a) | Future income taxes for the current year include petroleum resource rent tax and petroleum revenue tax that were previously reported as part of the future production costs. Comparative information has been reclassified accordingly. |
(b) | Other is primarily comprised of Algeria, Pakistan, Trinidad and Tobago and the United Kingdom. |
Standardised measure of discounted future net cash flows relating to proved oil and gas reserves (Standardised measure)continued
Changes in the Standardised measure are presented in the following table. The beginning of the year and end of the year totals are shown after reduction for income taxes and these, together with the changes in income tax amounts, are shown as discounted amounts (at 10 per cent per annum). All other items of change represent discounted amounts before consideration of income tax effects.
| | | | 2013 | | 2012(b) | | 2011 (b) | | | 2015 | | 2014 | | 2013 | |
| | | US$M | | US$M | | US$M | | | US$M | | US$M | | US$M | |
Changes in the Standardised measure | | | | | | | | | | | | |
Standardised measure at the beginning of the year | | | 27,477 | | | | 19,920 | | | | 15,427 | | | | 29,164 | | | 28,773 | | | 27,477 | |
Revisions: | | | | | | | | | | | | |
Prices, net of production costs | | | 189 | | | | 4,132 | | | | 9,034 | | | | (15,186 | ) | | 4,366 | | | 189 | |
Changes in future development costs | | | 940 | | | | (987 | ) | | | (2,917 | ) | | | 3 | | | (841 | ) | | 940 | |
Revisions of quantity estimates(a) | | | (4,396 | ) | | | 5,265 | | | | 3,235 | | | | (5,996 | ) | | (3,871 | ) | | (4,396 | ) |
Accretion of discount | | | 4,323 | | | | 3,134 | | | | 2,543 | | | | 4,438 | | | 4,564 | | | 4,323 | |
Changes in production timing and other | | | 260 | | | | 426 | | | | (581 | ) | | | 761 | | | (1,170 | ) | | 260 | |
| | | | | | | | | | | | | | | | | | |
| | | 28,793 | | | | 31,890 | | | | 26,741 | | | | 13,184 | | | 31,821 | | | 28,793 | |
Sales of oil and gas, net of production costs | | | (9,876 | ) | | | (10,093 | ) | | | (9,118 | ) | | | (7,889 | ) | | (10,800 | ) | | (9,876 | ) |
Acquisitions of reserves-in-place | | | – | | | | 5,661 | | | | 1,079 | | | | – | | | | – | | | | – | |
Sales of reserves-in-place | | | – | | | | (16 | ) | | | – | | | | (83 | ) | | (107 | ) | | | – | |
Previously estimated development costs incurred | | | 3,710 | | | | 3,416 | | | | 1,794 | | | | 3,169 | | | 2,683 | | | 3,710 | |
Extensions, discoveries, and improved recoveries, net of future costs | | | 7,272 | | | | 946 | | | | 855 | | | | 1,877 | | | 3,946 | | | 7,272 | |
Changes in future income taxes | | | (1,126 | ) | | | (4,327 | ) | | | (1,431 | ) | | | 6,986 | | | 1,621 | | | (1,126 | ) |
| | | | | | | | | | | | | | | | | | |
Standardised measure at the end of the year | | | 28,773 | | | | 27,477 | | | | 19,920 | | | | 17,244 | | | 29,164 | | | 28,773 | |
| | | | | | | | | | | | | | | | | | |
| (a) | Changes in reserves quantities are shown in the Petroleum reserves tables in section 2.13.1. |
(b) | The presentation of information in this table has been modified to comply with the disclosure requirements for supplemental oil and gas information and comparative information has been reclassified as needed. This did not result in any change to the standardised measure as previously reported.2.3.1. |
Accounting for suspended exploratory well costs
Refer to Accounting Policies ‘Exploration and evaluation expenditure’note 43 ‘Significant accounting policies’ (f) of the BHP Billiton Group financial statements for a discussion of the accounting policy applied to the cost of exploratory wells. Suspended wells are also reviewed in this context.
The following tables providetable provides the changes to capitalised exploratory well costs that were pending the determination of proved reserves for the three years ended 30 June 2013,2015, 30 June 20122014 and 30 June 2011.2013.
| | | | 2013 | | 2012 | | 2011 | | | 2015 | | 2014 | | 2013 | |
| | | US$M | | US$M | | US$M | | | US$M | | US$M | | US$M | |
Movement in capitalised exploratory well costs | | | | | | | | | | | | |
At the beginning of the year | | | 702.7 | | | | 549.4 | | | | 482.3 | | | | 388 | | | 603 | | | 703 | |
Additions to capitalised exploratory well costs pending the determination of proved reserves | | | 97.2 | | | | 455.1 | | | | 114.2 | | | | 121 | | | 28 | | | 97 | |
Capitalised exploratory well costs charged to expense | | | (99.3 | ) | | | (144.1 | ) | | | (47.1 | ) | | | (21 | ) | | (194 | ) | | (99 | ) |
Capitalised exploratory well costs reclassified to wells, equipment, and facilities based on the determination of proved reserves | | | (55.6 | ) | | | (157.7 | ) | | | – | | | | (4 | ) | | (48 | ) | | (56 | ) |
Other(a) | | | (42.5 | ) | | | – | | | | – | | | | – | | | (1 | ) | | (42 | ) |
| | | | | | | | | | | | | | | | | | |
At the end of the year | | | 602.5 | | | | 702.7 | | | | 549.4 | | | | 484 | | | 388 | | | 603 | |
| | | | | | | | | | | | | | | | | | |
(a) | This primarily relates to sale of interests in the Browse Joint Venture. |
The following table provides an ageing of capitalised exploratory well costs, based on the date the drilling was completed, and the number of projects for which exploratory well costs hashave been capitalised for a period greater than one year since the completion of drilling.
| | | | | | | | | | | | |
| | | 2013 | | | 2012 | | | 2011 | |
| | | US$M | | | US$M | | | US$M | |
Ageing of capitalised exploratory well costs | | | | | | | | | | | | |
Exploratory well costs capitalised for a period of one year or less | | | 95.4 | | | | 339.6 | | | | 114.2 | |
Exploratory well costs capitalised for a period greater than one year | | | 507.1 | | | | 363.1 | | | | 435.2 | |
| | | | | | | | | | | | |
At the end of the year | | | 602.5 | | | | 702.7 | | | | 549.4 | |
| | | |
| | | | | | | | | | | | |
| | | 2013 | | | 2012 | | | 2011 | |
Number of projects that have been capitalised for a period greater than one year | | | 15 | | | | 10 | | | | 11 | |
| | | | | | | | | | | | |
| | | | | | | | | | | | |
| | | 2015 | | | 2014 | | | 2013 | |
| | | US$M | | | US$M | | | US$M | |
Ageing of capitalised exploratory well costs | | | | | | | | | | | | |
Exploratory well costs capitalised for a period of one year or less | | | 44 | | | | 31 | | | | 96 | |
Exploratory well costs capitalised for a period greater than one year | | | 440 | | | | 357 | | | | 507 | |
| | | | | | | | | | | | |
At the end of the year | | | 484 | | | | 388 | | | | 603 | |
| | | | | | | | | | | | |
| | | |
| | | 2015 | | | 2014 | | | 2013 | |
Number of projects that have been capitalised for a period greater than one year | | | 14 | | | | 17 | | | | 15 | |
| | | | | | | | | | | | |
Drilling and other exploratory and development activities
The number of crude oil and natural gas wells drilled and completed for each of the last three years was as follows:
| | | | Net Exploratory Wells | | | Net Development Wells | | | | | | Net Exploratory Wells | | | Net Development Wells | | | | |
| | | | Productive | | | Dry | | | Total | | | Productive | | | Dry | | | Total | | | Total | |
Year ended 30 June 2015 | | | | | | | | | | | | | | | |
Australia | | | | – | | | | – | | | | – | | | | 3 | | | | – | | | | 3 | | | | 3 | |
United States(a) | | | | – | | | | – | | | | – | | | | 304 | | | | 1 | | | | 305 | | | | 305 | |
Other(b) | | | | – | | | | – | | | | – | | | | – | | | | – | | | | – | | | | – | |
| | | | | | | | | | | | | | | | | | | | | | |
Total | | | | – | | | | – | | | | – | | | | 307 | | | | 1 | | | | 308 | | | | 308 | |
| | | | | | | | | | | | | | | | | | | | | | |
Year ended 30 June 2014 | | | | | | | | | | | | | | | |
Australia | | | | 1 | | | | 2 | | | | 3 | | | | 3 | | | | – | | | | 3 | | | | 6 | |
United States(a) | | | | – | | | | 2 | | | | 2 | | | | 401 | | | | 15 | | | | 416 | | | | 418 | |
Other(b) | | | | – | | | | – | | | | – | | | | 1 | | | | – | | | | 1 | | | | 1 | |
| | | | | | | | | | | | | | | | | | | | | | |
Total | | | | 1 | | | | 4 | | | | 5 | | | | 405 | | | | 15 | | | | 420 | | | | 425 | |
| | | Productive | | | Dry | | | Total | | | Productive | | | Dry | | | Total | | | Total | | | | | | | | | | | | | | | | | | | | | | |
Year ended 30 June 2013 | | | | | | | | | | | | | | | | | | | | | | | | | | | | |
Australia | | | – | | | | 1 | | | | 1 | | | | – | | | | – | | | | – | | | | 1 | | | | – | | | | 1 | | | | 1 | | | | – | | | | – | | | | – | | | | 1 | |
United States (a) | | | – | | | | 1 | | | | 1 | | | | 352 | | | | 16 | | | | 368 | | | | 369 | | | | – | | | | 1 | | | | 1 | | | | 352 | | | | 16 | | | | 368 | | | | 369 | |
Other(b) | | | – | | | | – | | | | – | | | | 2 | | | | – | | | | 2 | | | | 2 | | | | – | | | | – | | | | – | | | | 2 | | | | – | | | | 2 | | | | 2 | |
| | | | | | | | | | | | | | | | | | | | | | | | | | | | | | | | | | | | | | | | | | |
Total | | | – | | | | 2 | | | | 2 | | | | 354 | | | | 16 | | | | 370 | | | | 372 | | | | – | | | | 2 | | | | 2 | | | | 354 | | | | 16 | | | | 370 | | | | 372 | |
| | | | | | | | | | | | | | | | | | | | | | | | | | | | | | | | | | | | | | | | | | |
Year ended 30 June 2012 | | | | | | | | | | | | | | | |
Australia | | | – | | | | – | | | | – | | | | 1 | | | | – | | | | 1 | | | | 1 | | |
United States | | | 4 | | | | 3 | | | | 7 | | | | 190 | | | | 1 | | | | 191 | | | | 198 | | |
Other(b) | | | – | | | | 1 | | | | 1 | | | | 2 | | | | 1 | | | | 3 | | | | 4 | | |
| | | | | | | | | | | | | | | | | | | | | | |
Total | | | 4 | | | | 4 | | | | 8 | | | | 193 | | | | 2 | | | | 195 | | | | 203 | | |
| | | | | | | | | | | | | | | | | | | | | | |
Year ended 30 June 2011 | | | | | | | | | | | | | | | |
Australia | | | – | | | | 2 | | | | 2 | | | | 5 | | | | 1 | | | | 6 | | | | 8 | | |
United States | | | – | | | | – | | | | – | | | | 21 | | | | 1 | | | | 22 | | | | 22 | | |
Other(b) | | | – | | | | 1 | | | | 1 | | | | 1 | | | | – | | | | 1 | | | | 2 | | |
| | | | | | | | | | | | | | | | | | | | | | |
Total | | | – | | | | 3 | | | | 3 | | | | 27 | | | | 2 | | | | 29 | | | | 32 | | |
| | | | | | | | | | | | | | | | | | | | | | |
| (a) | Dry net development wells include nil net wells (2014: 4 net wells; 2013: 13 net wellswells) that encountered problems during drilling and/or completion and were not pursued further. |
| (b) | Other is primarily comprised of Algeria, Pakistan, Trinidad and Tobago and the United Kingdom. |
The number of wells drilled refers to the number of wells completed at any time during the respective year, regardless of when drilling was initiated. Completion refers to the installation of permanent equipment for production of oil or gas, or, in the case of a dry well, to reporting to the appropriate authority that the well has been abandoned.
An exploratory well is a well drilled to find oil or gas in a new field or to find a new reservoir in a field previously found to be productive of oil or gas in another reservoir. A development well is a well drilled within the limits of a known oil or gas reservoir to the depth of a stratigraphic horizon known to be productive.
A productive well is an exploratory, development or extension well that is not a dry well. A dry well (hole) is an exploratory, development, or extension well that proves to be incapable of producing either oil or gas in sufficient quantities to justify completion as an oil or gas well.
Oil and gas properties, wells, operations and acreage
The following tables show the number of gross and net productive crude oil and natural gas wells and total gross and net developed and undeveloped oil and natural gas acreage as at 30 June 2013.2015. A gross well or acre is one in which a working interest is owned, while a net well or acre exists when the sum of fractional working interests owned in gross wells or acres equals one. Productive wells are producing wells and wells mechanically capable of production. Developed acreage is comprised of leased acres that are within an area by or assignable to a productive well. Undeveloped acreage is comprised of leased acres on which wells have not been drilled or
completed to a point that would permit the production of economic quantities of oil and gas, regardless of whether such acres contain proved reserves.
The number of productive crude oil and natural gas wells in which we held an interest at 30 June 20132015 was as follows:
| | | | Crude Oil Wells | | | Natural Gas Wells | | | Total | | | Crude Oil Wells | | | Natural Gas Wells | | | Total | |
| | | Gross | | | Net | | | Gross | | | Net | | | Gross | | | Net | | | Gross | | | Net | | | Gross | | | Net | | | Gross | | | Net | |
Australia | | | 353 | | | | 174 | | | | 119 | | | | 43 | | | | 472 | | | | 217 | | | | 349 | | | | 175 | | | | 130 | | | | 48 | | | | 479 | | | | 223 | |
United States | | | 124 | | | | 62 | | | | 7,154 | | | | 2,275 | | | | 7,278 | | | | 2,337 | | | | 646 | | | | 370 | | | | 6,758 | | | | 2,029 | | | | 7,404 | | | | 2,399 | |
Other(a) | | | 72 | | | | 30 | | | | 59 | | | | 13 | | | | 131 | | | | 43 | | | | 55 | | | | 22 | | | | 46 | | | | 10 | | | | 101 | | | | 32 | |
| | | | | | | | | | | | | | | | | | | | | | | | | | | | | | | | | | | | |
Total | | | 549 | | | | 266 | | | | 7,332 | | | | 2,331 | | | | 7,881 | | | | 2,597 | | | | 1,050 | | | | 567 | | | | 6,934 | | | | 2,087 | | | | 7,984 | | | | 2,654 | |
| | | | | | | | | | | | | | | | | | | | | | | | | | | | | | | | | | | | |
| (a) | Other is primarily comprised of Algeria, Pakistan, Trinidad and Tobago and the United Kingdom. |
Of the productive crude oil and natural gas wells, 17 (Net: 7)29 (net: 11) operated wells had multiple completions.
Developed and undeveloped acreage (including both leases and concessions) held at 30 June 20132015 was as follows:
| | | | Developed Acreage | | | Undeveloped Acreage | | | Developed Acreage | | | Undeveloped Acreage | |
Thousands of acres | | Gross | | | Net | | | Gross | | | Net | | | Gross | | | Net | | | Gross | | | Net | |
Australia | | | 2,072 | | | | 806 | | | | 4,503 | | | | 3,037 | | | | 2,092 | | | | 814 | | | | 5,900 | | | | 3,363 | |
United States | | | 1,200 | | | | 703 | | | | 2,957 | | | | 1,982 | | | | 1,130 | | | | 655 | | | | 1,635 | | | | 1,142 | |
Other(a) | | | 349 | | | | 135 | | | | 32,719 | | | | 20,906 | | | | 307 | | | | 115 | | | | 12,480 | | | | 9,325 | |
| | | | | | | | | | | | | | | | | | | | | | | | |
Total(b) | | | 3,621 | | | | 1,644 | | | | 40,179 | | | | 25,925 | | | | 3,529 | | | | 1,584 | | | | 20,015 | | | | 13,830 | |
| | | | | | | | | | | | | | | | | | | | | | | | |
| (a) | UndevelopedOther is undeveloped acreage primarily consistsconsisting of acreage in South Africa, Colombia, Philippines, Malaysia,Brazil, India, Trinidad and Tobago, South Africa and India.Malaysia. |
| (b) | Approximately 16,623,9241,474,774 gross acres (12,192,178(1,004,045 net acres), 4,608,8965,173,015 gross acres (3,136,169(4,885,193 net acres) and 4,202,9333,142,520 gross acres (3,047,980(1,796,237 net acres) of undeveloped acreage will expire in 2014, 2015the years ending 30 June 2016, 2017 and 2016,2018 respectively, if the Company does not establish production or take any other action to extend the terms of the licenceslicenses and concessions. |
F-130F-122