As filed with the Securities and Exchange Commission on February 25, 201423, 2016
UNITED STATES
SECURITIES AND EXCHANGE COMMISSION
WASHINGTON, D.C. 20549
Form 20-F
(Mark one)
| ¨ | REGISTRATION STATEMENT PURSUANT TO SECTION 12(b) OR (g) OF THE SECURITIES EXCHANGE ACT OF 1934 |
OR
| x | ANNUAL REPORT PURSUANT TO SECTION 13 OR 15(d) OF THE SECURITIES EXCHANGE ACT OF 1934 |
For the fiscal year ended December 31, 20132015
OR
| ¨ | TRANSITION REPORT PURSUANT TO SECTION 13 OR 15(d) OF THE SECURITIES EXCHANGE ACT OF 1934 |
OR
| ¨ | SHELL COMPANY REPORT PURSUANT TO SECTION 13 OR 15(d) OF THE SECURITIES EXCHANGE ACT OF 1934 |
Commission file number 001-05146-01
KONINKLIJKE PHILIPS N.V.
(Exact name of Registrant as specified in charter)
ROYAL PHILIPS
(Translation of Registrant’s name into English)
The Netherlands
(Jurisdiction of incorporation or organization)
BreitnerPhilips Center, Amstelplein 2, 1096 BC Amsterdam, The Netherlands
(Address of principal executive office)
Eric Coutinho,Marnix van Ginneken, Chief Legal Officer & Secretary to the Board of Management
+31 20 59 77232, eric.coutinho@philips.com, Breitnermarnix.van.ginneken@philips.com, Philips Center, Amstelplein 2, 1096 BC Amsterdam, The Netherlands
(Name, Telephone, E-mail and/or Facsimile number and Address of Company Contact Person)
Securities registered or to be registered pursuant to Section 12(b) of the Act:
| | | | |
| Title of each class | | | | Name of each exchange on which registered |
| Common Shares – par value | | | | New York Stock Exchange |
| | |
| Euro (EUR) 0.20 per share | | | | |
Securities registered or to be registered pursuant to Section 12(g) of the Act:
None
Securities for which there is a reporting obligation pursuant to Section 15(d) of the Act:
None
(Title of class)
Indicate the number of outstanding shares of each of the issuer’s classes of capital or common stock as of the close of the period covered by the annual report:
| | |
| Class | | Outstanding at December 31, 20132015 |
| Koninklijke Philips N.V. | | 937,845,789931,130,387 shares, including |
| Common Shares par value EUR 0.20 per share | | 24,508,02214,026,801 treasury shares
|
Indicate by check mark if the registrant is a well-known seasoned issuer, as defined in Rule 405 of the Securities Act. x Yes No¨ No
If this report is an annual or transition report, indicate by check mark if the registrant is not required to file reports pursuant to section 13 or 15(d) of the Securities Exchange Act of 1934. ¨ Yes x No
Note-Checking the box above will not relieve any registrant required to file reports pursuant to Section 13 or 15(d) of the Securities Exchange Act of 1934 from their obligations under those Sections.
Indicate by check mark whether the registrant (1) has filed all reports required to be filed by Section 13 or 15(d) of the Securities Exchange Act of 1934 during the preceding 12 months (or for such shorter period that the registrant was required to file such reports), and (2) has been subject to such filing requirements for the past 90 days. x Yes ¨ No
Indicate by check mark whether the registrant has submitted electronically and posted on its corporate Web site, if any, every Interactive Data File required to be submitted and posted pursuant to Rule 405 of Regulation S-T (§232.405 of this chapter) during the preceding 12 months (or for such shorter period that the registrant was required to submit and post such files). ¨ Yes ¨ No
Indicate by check mark whether the registrant is a large accelerated filer, an accelerated filer, or a non-accelerated filer. See definition of “accelerated filer and large accelerated filer” in Rule 12b-2 of the Exchange Act. (Check one):
Large accelerated filer x Accelerated filer ¨ Non-accelerated filer ¨
Indicate by check mark which basis of accounting the registrant has used to prepare the financial statements included in this filing:
| | | | |
U.S. GAAP ¨ | | International Financial Reporting Standards as issued by by the International Accounting Standards Board x | | Other ¨ |
If “Other” has been checked in response to the previous question, indicate by check mark which financial statement item the registrant has elected to follow. ¨ Item 17 ¨ Item 18
If this is an annual report, indicate by check mark whether the registrant is a shell company (as defined in Rule 12b-2 of the Exchange Act). ¨ Yes x No
IFRS basis of presentation
The financial information included in this document is based on IFRS, as explained in note 1, Significant accounting policies, of this report, unless otherwise indicated.
Dutch Financial Markets Supervision Act
This document comprises regulated information within the meaning of the Dutch Financial Markets Supervision Act (Wet op het Financieel Toezicht).
Statutory financial statements and management report
The chapters Group financial statements and Company financial statements contain the statutory financial statements of the Company. The introduction to the chapter Group financial statements sets out which parts of this Annual Report form the Management report within the meaning of Section 2:391 of the Dutch Civil Code (and related Decrees).
Significant developments
In September 2014, Philips announced its plan to sharpen its strategic focus by establishing two stand-alone companies focused on the HealthTech and Lighting opportunities respectively. We have established a stand-alone structure for Philips Lighting within the Philips Group effective February 1, 2016. We expect to be able to announce the separation of the Lighting business in the first half of 2016, subject to market conditions and other relevant circumstances. As previously stated, we are reviewing all strategic options for Philips Lighting, including an initial public offering and a private sale.
It should however be noted that the completion of the separation could take more time than originally planned or anticipated and that there is no certainty as to the method or timing of the separation of the Lighting business, which may expose Philips to risks of additional cost and other adverse consequences. For further information on specific risks involved in the separation please refer to chapter 7, Risk management, of this report.
The separation impacts all businesses and markets as well as all supporting functions and all assets and liabilities of the Group. With effect from Q1 2016 onwards Philips plans to report and discuss its financial performance on the basis of different reportable segments than the sectors currently presented and discussed in this Annual Report. For more details on the new segment reporting in 2016 and onwards, please refer to the introduction of chapter 6, Sector performance, of this report.
As announced on January 22, 2016, the agreement pursuant to which the consortium led by GO Scale Capital would acquire an 80.1% interest in the combined businesses of Lumileds and Automotive, has been terminated. Philips is now actively engaging with other parties that have expressed an interest in the businesses and will continue to report the Lumileds and Automotive businesses as discontinued operations (see note 3, Discontinued operations and other assets classified as held for sale).
Further updates will be provided in the course of 2016.
| | |
 | | Philips ArenaVision LED is the world’s first LED pitch lighting to meet the stringent requirements of international television broadcasters and sports federations, ensuring a fantastic match experience, both for the fans in the stadium and those watching at home. Increasingly, Philips is teaming up with hospital and health systems to understand their needs, provide integrated solutions, and engage in multi-year cooperation to drive improvements in terms of patient outcomes, quality of care delivery and cost productivity. |
Contents
2 Annual Report 20132015
Annual Report 20132015 3
| | | | | | |
| 18.9 | | Exhibit 15 (a) | | | 292 | |
| 18.10 | | Exhibit 15 (b) | | | 293 | |
| | | | | | |
| | |
| 19 | | Exhibits | | | 272 | |
19.1 | | Index of exhibits | | | 272 | |
19.2 | | Signatures | | | 273 | |
19.3 | | Exhibits | | | 274 | |
19.4 | | Exhibit 1 English translation of the Articles of Association of the Company | | | 275 | |
19.5 | | Exhibit 4 (a) Services contract between the Company and Mr F.A. van Houten | | | 289 | |
19.6 | | Exhibit 4 (b) Services contract between the Company and Mr A. Bhattacharya | | | 294 | |
19.7 | | Exhibit 4 (c) Services contract between the Company and Mr P.A.J. Nota | | | 299 | |
19.8 | | Exhibit 7 | | | 304 | |
19.9 | | Exhibit 8 List of subsidiaries | | | 305 | |
19.10 | | Exhibit 12 (a) Certification | | | 314 | |
19.11 | | Exhibit 12 (b) Certification | | | 315 | |
19.12 | | Exhibit 13 (a) | | | 316 | |
19.13 | | Exhibit 13 (b) | | | 317 | |
19.14 | | Exhibit 15 (a) | | | 318 | |
19.15 | | Exhibit 15 (b) Letter of KPMG relating to disclosure under Item 16F | | | 319 | |
19.16 | | Exhibit 15 (c) | | | 320 | |
4 Annual Report 20132015
Introduction
Introduction
This document contains information required for the annual reportAnnual Report on Form 20-F for the year ended December 31, 20132015 of Koninklijke Philips N.V. (the 20132015 Form 20-F). Reference is made to the Form 20-F cross reference table herein. Only (i) the information in this document that is referenced in the Form 20-F cross reference table, (ii) this introduction, the cautionary statement “forward-looking statements” and explanation on “use of non-GAAP information” on the next three pages and (iii) the Exhibits shall be deemed to be filed with the Securities and Exchange Commission for any purpose. Any additional information in this document which is not referenced in the Form 20-F cross reference table, or the Exhibits themselves, shall not be deemed to be so incorporated by reference, shall not be part of the 20132015 Form 20-F and is furnished to the Securities and Exchange Commission for information only.
The terms “Philips”, the “Company”, “Group”, “we”, “our” and “us” refer to Koninklijke (Royal) Philips N.V. and as applicable to its subsidiaries and and/or its interest in joint ventures and associates.
IFRS based information
The audited consolidated financial statements as of December 31, 20132015 and 2012,2014, and for each of the years in the three-year period ended December 31, 2013,2015, included in the 20132015 Form 20-F have been prepared in accordance with International Financial Reporting Standards (IFRS) as endorsed by the European Union (EU). All standards and interpretations issued by the International Accounting Standards Board (IASB) and the IFRS Interpretations Committee effective year-end 20132015 have been endorsed by the EU, except that the EU did not adopt certain paragraphs of IAS 39 applicable to certain hedge transactions. Philips has no hedge transactions to which these paragraphs are applicable. Consequently, the accounting policies applied by Philips also comply fully with IFRS as issued by the IASB.
Non-GAAP information
In presenting and discussing the Philips Group’s financial position, operating results and cash flows, management uses certain non-GAAP financial measures such as: comparable growth; adjusted income from operations; net operating capital; net debt; cash flow before financing activities; net capital expenditures and free cash flow. These non-GAAP financial measures should not be viewed in isolation as alternatives to the equivalent IFRS measure and should be used in conjunction with the most directly comparable IFRS measure(s). Reference is made to the section titled “Use of non-GAAP information” for further information.
Third-party market share data
Statements regarding market share, contained in this document, including those regarding Philips’ competitive position, are based on outside sources such as specialized research institutes, industry and dealer panels in combination with management estimates. Where full year information regarding 20132015 is not yet available to Philips, market share statements may also be based on estimates and projections prepared by outside sources or management. Rankings are based on sales unless otherwise stated.
Fair value information
In presenting the Philips Group’s financial position, fair values are used for the measurement of various items in accordance with the applicable accounting standards. These fair values are based on market prices, where available, and are obtained from sources that are deemed to be reliable. Readers are cautioned that these values are subject to changes over time and are only valid at the balance sheet date. When quoted prices or observable market values do not exist, fair values are estimated using valuation models, which we believe are appropriate for their purpose. They require management to make significant assumptions with respect to future developments which are inherently uncertain and may therefore deviate from actual developments. Critical assumptions used are disclosed in the financial statements. In certain cases, independent valuations are obtained to support management’s determination of fair values.
Documents on display
It is possible to read and copy documents referred to in the 20132015 Form 20-F that have been filed with the SEC at the SEC’s public reference room located at 100 F Street, N.E., Room 1580, Washington, D.C. 20549. Please call the SEC at 1-800-SEC-0330 for further information on the public reference rooms and their copy charges. Philips SEC filings are also publicly available through the SEC’s website atwww.sec.gov.
Annual Report 2013 5
Introduction
For definitions and abbreviations reference is made to chapter 17,18, Definitions and abbreviations, of this report.
Annual Report 2015 5
Introduction
Forward-looking statements
Pursuant to provisions of the United States Private Securities Litigation Reform Act of 1995, Philips is providing the following cautionary statement.
This document, including the information referred to in the Form 20-F cross reference table, contains certain forward lookingforward-looking statements with respect to the financial condition, results of operations and business of Philips and certain of the plans and objectives of Philips with respect to these items, in particular, among other statements, certain statements in Item 4 “Information on the Company” with regard to management objectives, market trends, market standing, product volumes, business risks, the implementation of our Accelerate! program, the statements in Item 8 “Financial Information” relating to legal proceedings, the statements in Itemitem 5 “Operating and financial review and prospects” with regardregards to trends in results of operations, margins overall market trends, risk management, exchange rates, the statements in Item 8 “Financial Information” relating to legal proceedings and goodwill and statements in Item 11 “Quantitative and qualitative disclosures about market risks” relating to risk caused by derivative positions, interest rate fluctuations and other financial exposure are forward-looking in nature. Forward-looking statements can be identified generally as those containing words such as “anticipates”, “assumes”, “believes”, “estimates”, “expects”, “should”, “will”, “will likely result”, “forecast”, “outlook”, “projects”, “may” or similar expressions. By their nature, forward-looking statements involve risk and uncertainty, because they relate to events that depend on circumstances that will occur in the future. There are a number of factors that could cause actual results and developments to differ materially from those expressed or implied by these forward-looking statements.
These factors include, but are not limited to, domestic and global economic and business conditions, developments within the euro zone, the successful implementation of our strategy and our ability to realize the benefits of this strategy, our ability to develop and market new products, changes in legislation, legal claims, changes in exchange and interest rates, changes in tax rates, pension costs and actuarial assumptions, raw materials and employee costs, our ability to identify and complete successful acquisitions and to integrate those acquisitions into our business,
6 Annual Report 2013
Introduction
our ability to successfully exit certain businesses or restructure our operations, the rate of technological changes, political, economic and other developments in countries where Philips operates, industry consolidation and competition.competition and the state of international capital markets as they may affect the timing and nature of the disposition by Philips of its interests in the Lighting business and the Lumileds and Automotive business.
As a result, Philips’ actual future results may differ materially from the plans, goals and expectations set forth in such forward-looking statements. For a discussion of factors that could cause future results to differ from such forward-looking statements, reference is made to the information in Item 3D “Risk Factors”.
6 Annual Report 2015
Introduction
Use of non-GAAP information
Koninklijke Philips N.V. (the ‘Company’) believes that an understanding of sales performance is enhanced when the effects of currency movements and acquisitions and divestments (changes in consolidation) are excluded. Accordingly, in addition to presenting ‘nominal growth’, ‘comparable growth’nominal sales growth, comparable sales growth is provided.
Comparable sales exclude the effects of currency movements and changes in consolidation. As indicated in the note 1, Significant accounting policies, sales and income are translated from foreign currencies into the Company’s reporting currency, the euro, at the exchange rate on transaction dates during the respective years. As a result of significant currency movements during the years presented, the effects of translating foreign currency sales amounts into euros could have a material impact on our sales figures.impact. Therefore, these impacts have been excluded in arriving at the comparable sales in euros. Currency effects have been calculated by translating previous years’ foreign currency sales amounts into euros at the following year’s exchange rates in comparison with the sales in euros as historically reported. The years under review were characterized by a number of acquisitions and divestments, as a result of which activities were consolidated or deconsolidated. The effect of consolidation changes has also been excluded in arriving at the comparable sales. For the purpose of calculating comparable sales, growth, when a previously consolidated entity is sold or contributed to a venture that is not consolidated by the Company, relevant sales are excluded from impacted prior-year periods. Similarly, when an entity is acquired, relevant sales are excluded from impacted periods.
Philips discusses “adjusted income from operations” in the 20132015 Form 20-F. Adjusted income from operations represents income from operations before amortization and impairment of intangible assets generated in acquisitions (excluding software and capitalized development expenses).
Annual Report 2013 7
Introduction
The Company uses the term “adjusted income from operations” to evaluate the performance of the Philips Group and its sectors. Referencing “adjusted income from operations” is considered appropriate in light of the following:
Philips has announced that one of its strategic drivers is to increase profitability through re-allocation of its resources towards opportunities offering more consistent and higher returns. Moreover, Philips intends to redeploy capital through value-creating acquisitions. Since 2006, management has used the “adjusted income from operations” measurement internally to monitor performance of the businesses on a comparable basis. As of 2007, Philips has also set external performance targets based on this measurement as it will not be distorted by the unpredictable effects of future, unidentified acquisitions.
Non US investors are advised that such presentation is different from the terms used in Philips’ results announcements and 2013 Annual Report. Philips believes that an understanding of the Group’s financial condition is enhanced by the disclosure of net operating capital (NOC), as this figure is used by Philips’ management to evaluate the capital efficiency of the Philips Group and its operating sectors. NOC is defined as: total assets excluding assets from discontinued operationsclassified as held for saleless: (a) cash and cash equivalents, (b) deferred tax assets, (c) other (non)-currentnon-current financial assets and current financial assets, (d) investments in associates, and after deduction of: (e) provisions, (f) accounts and notes payable, (g) accrued liabilities, (h) current/noncurrentother non-current liabilities and other current liabilities.
Net debt is defined as the sum of long- and short-term debt minus cash and cash equivalents. The net debt position as a percentage of the sum of group equity (shareholders’ equity and non-controlling interests) and net debt is presented to express the financial strength of the Company. This measure is widely used by management and investment analysts and is therefore included in the disclosure.
Cash flows before financing activities, being the sum total of net cash from operating activities and net cash from investing activities, and free cash flow, being net cash from operating activities minus net capital expenditures, are presented separately to facilitate the reader’s understanding of the Company’s funding requirements.
Net capital expenditures comprise of purchase of intangible assets, proceeds from sale of intangible assets, expenditures on development assets, capital expenditures on property, plant and equipment and proceeds from disposals of property, plant and equipment. This measure is widely used by management to calculate free cash flow.
8 Annual Report 20132015 7
Form 20-F cross reference table
Form 20-F cross reference table
Only (i) the information in this document that is referenced in the Form 20-F cross reference table, (ii) the Introduction, the cautionary statements concerning Forward-looking statements and explanation on use of non-GAAP information, of this report on pages 5-8,5-7, and (iii) the Exhibits shall be deemed to be filed with the Securities and Exchange Commission for any purpose. The content of Philips’ websites and other websites referenced herein should not be considered to be a part of or incorporated into the 20132015 Form 20-F. Any additional information which is not referenced in the Form 20-F cross reference table or the Exhibits themselves shall not be deemed to be so incorporated by reference, shall not be part of the 20132015 Form 20-F and is furnished to the Securities and Exchange Commission for information only.
The table below sets out the location in this document of the information required by SEC Form 20-F. The exact location is included in the column ‘Location in this document’. The column ‘Page’ includes the starting page of the section/paragraph for reference only.
8 Annual Report 2013 92015
Form 20-F cross reference table
| | | | | | | | |
| Item | | Form 20-F caption | | Location in this document | | Page | |
| Part 1 | | | | | | | | |
1 | | Identity of directors, senior management and advisors | | Not applicable | | | | |
2 | | Offer statistics and expected timetable | | Not applicable | | | | |
3 | | Key information | | | | | | |
| | | |
| | A Selected financial data | | 15.16.1. Five-year overview (condensed) | | | 256255 | |
| | | | 16.1.17.1. Key financials and dividend policy - Proposed distribution | | | 257 | |
| | | | 16.1.17.1. Key financials and dividend policy - Information for US investors in New York Registry shares program | | | 257 | |
| | | |
| | B Capitalization and indebtedness | | Not applicable | | | | |
| | | |
| | C Reason for the offer and use of proceeds | | Not applicable | | | | |
| | | |
| | D Risk factors | | 6.2.7.2. Risk categories and factors -Second paragraph | | | 11991 | |
| | | | 6.3.7.3. Strategic risks | | | 12092 | |
| | | | 6.4.7.4. Operational risks | | | 12193 | |
| | | | 6.5.7.5. Compliance risks | | | 12395 | |
| | | | 7.6. Financial risks | | | 96 | |
| | | | | 6.6. Financial risks7.7. Separation risk | | | 12597 | |
4 | | Information on the Company | | | | | | |
| | | |
| | A History and development of the company | | 2.1. Our rich heritageContents - Significant developments | | | 332 | |
| | | | 4.1.11. Discontinued operations5.1.6. Restructuring and impairment charges | | | 6040 | |
| | | | 4.1.13. Acquisitions and divestments5.1.11. Discontinued operations | | | 6143 | |
| | | | 4.1.15.5.1.13. Acquisitions and divestments | | | 43 | |
| | | | 5.1.15. Cash flows provided by continuing operations | | | 6245 | |
| | | | 5.6. Sector performance - Our structure in 2015 & 2016 and beyond | | | 9166 | |
| | | | 10.11. Corporate governance - Corporate governance of the Philips groupGroup - Introduction | | | 142114 | |
| | | | 11.5. Investor Relations - Corporate seat and head office | | | 126 | |
| | | | Note 73 Discontinued operations and other assets classified as held for sale | | | 180154 | |
| | | | Note 94 Acquisitions and divestments | | | 182155 | |
| | | | Note 3632 Subsequent events | | | 213199 | |
| | | | 16.5. Philips’ acquisitions | | | 265 | |
| | | | 16.7.17.6. Investor contact - How to reach us | | | 266264 | |
| | | |
| | B Business Overview | | Introduction - Third-party market share data | | | 5 | |
| | | | 4.1.5.1. Financial performance- from 4.1.15.1.1 to 4.1.25.1.2 and from 4.1.45.1.4 to 4.1.145.1.14 | | | 5033 | |
| | | | 4.1.24. Supply management5.1.24. Procurement | | | 51 | |
| | | | 5.2.10. Addressing issues deeper in the supply chain | | | 57 | |
| | | | 6. Sector performance - Our structure in 2015 | | | 66 | |
| | | | 6.1.2. About Healthcare in 2015 | | | 68 | |
| | | | 6.1.4. 2015 financial performance | | | 70 | |
| | | | 4.2.11. Conflict minerals: issues further down the chain6.2.2. About Consumer Lifestyle in 2015 | | | 8074 | |
| | | | 5. Sector6.2.4. 2015 financial performance - Our structure | | | 9175 | |
| | | | 5.1.2.6.3.2. About Philips HealthcareLighting in 2015 | | | 9478 | |
| | | | 5.1.4. 20136.3.4. 2015 financial performance | | | 9679 | |
| | | | 5.2.2.6.4.1. About Philips Consumer LifestyleInnovation, Group & Services in 2015 | | | 10083 | |
| | | | 5.2.4. 20136.4.2. 2015 financial performance | | | 10186 | |
| | | | 5.3.2. About Philips Lighting | | | 106 | |
| | | | 5.3.4. 2013 financial performance | | | 107 | |
| | | | 5.4.1. About Innovation, Group & Services | | | 111 | |
| | | | 5.4.2. 2013 financial performance | | | 114 | |
| | | | 6.1.7.1. Our approach to risk management and business control | | | 11688 | |
| | | | 6.4. Operational risks -7.3. Strategic risks-ThirdLast paragraph | | | 12192 | |
| | | | Note 36 Subsequent events7.4. Operational risks -Third & fourth paragraph | | | 21393 | |
| | | | 13.2.2. Supplier indicators -Issues further down the chain7.5. Compliance risks | | | 22895 | |
| | | | 17. Definitions and abbreviations11. Corporate governance- Corporate governance of the Philips Group - Introduction | | | 274 | |
| | | |
| | C Organizational structure | | 5. Sector performance - Our structure | | | 91114 | |
| | | | Note 2 Information by sector and main country | | | 171152 | |
| | | | Note 6 Interests14.2.8. Supplier indicators - Responsible Sourcing of Minerals: Addressing issues deeper in entitiesthe supply chain | | | 179225 | |
| | | | 18.4. Exhibit 8 List of subsidiaries18. Definitions and abbreviations | | | 281270 | |
10 Annual Report 2013
Form 20-F cross reference table
| | | | | | | | |
Item | | Form 20-F captionC Organizational structure | | Location6. Sector performance - Our structure in this document2015 | | Page | 66 | |
| | D Property, plant and equipment | | Note 2 Information by sector and main country | | | 171 | |
| | | | Note 10 Property, plant and equipment | | | 184 | |
| | | | Note 21 Provisions | | | 192 | |
| | | | Note 25 Contractual obligations | | | 194 | |
| | | | Note 26 Contingent assets and liabilities -Environmental remediation
| | | 195 | |
4A | | Unresolved staff comments | | Not applicable | | | | |
5 | | Operating and financial review and prospects | | | | | | |
| | A Operating results | | Use of non-GAAP information | | | 7 | |
| | | | 4.1. Financial performance - Management summary | | | 50 | |
| | | | 4.1. Financial performance - from 4.1.1 to 4.1.2 and from 4.1.4 to 4.1.14 | | | 50 | |
| | | | 5.1.2. About Philips Healthcare - Regulatory requirements | | | 94 | |
| | | | 5.1.4. 2013 financial performance | | | 96 | |
| | | | 5.2.2. About Philips Consumer Lifestyle - Regulatory requirements | | | 100 | |
| | | | 5.2.4. 2013 financial performance | | | 101 | |
| | | | 5.3.2. About Philips Lighting - Regulatory requirements | | | 106 | |
| | | | 5.3.4. 2013 financial performance | | | 107 | |
| | | | 5.4.2. 2013 financial performance | | | 114 | |
| | | | 4.6. Critical accounting policies | | | 87 | |
| | | | Note 4 Financial income and expenses | | | 175 | |
| | | | Note 7 Discontinued operations and other assets classified as held for sale | | | 180 | |
| | | | Note 9 Acquisitions and divestments | | | 182 | |
| | | | Note 11 Goodwill | | | 185 | |
| | | | Note 12 Intangible assets excluding goodwill | | | 186 | |
| | | | Note 35 Details of treasury / other financial risks | | | 210 | |
| | | | 6.3. Strategic risks | | | 120 | |
| | | | 6.5. Compliance risks | | | 123 | |
| | | | 6.6. Financial risks | | | 125 | |
| | | | 14. Reconciliation of non-GAAP information | | | 251 | |
| | | |
| | B Liquidity and capital resources | | 4.1. Financial performance - from 4.1.15 to 4.1.23 | | | 50 | |
| | | | Note 20 Long-term debt and short-term debt | | | 191 | |
| | | | Note 25 Contractual obligations | | | 194 | |
| | | | Note 19 Equity | | | 189 | |
| | | | Note 35 Details of treasury / other financial risks | | | 210 | |
| | | |
| | C Research and development, patents and licenses, etc. | | 4.1.4. Research and development | | | 55 | |
| | | | 5.4.1. About Innovation, Group & Services | | | 111 | |
| | | |
| | D Trend information | | 4.5. Outlook | | | 87 | |
| | | |
| | E Off-balance sheet arrangements | | 4.1.23. Cash obligations | | | 69 | |
| | | | Note 25 Contractual obligations | | | 194 | |
| | | | Note 26 Contingent assets and liabilities | | | 195 | |
| | | | Note 35 Details of treasury / other financial risks | | | 210 | |
| | | |
| | F Tabular disclosure of contractual obligations | | 4.1.23. Cash obligations | | | 69 | |
| | | | Note 25 Contractual obligations | | | 194 | |
| | | |
| | G Safe Harbor | | Forward-looking statements | | | 6 | |
6 | | Directors, senior management and employees | | | | | | |
| | | |
| | A Directors and senior management | | 7. Management | | | 127 | |
| | | | 8. Supervisory Board | | | 129152 | |
Annual Report 2013 112015 9
Form 20-F cross reference table
| | | | | | |
| Item | | Form 20-F caption | | Location in this document | | Page |
| | | | 10.1.Note 5 Interests in entities | | 156 |
| | | | 19.9. Exhibit 8 List of subsidiaries | | 305 |
| | | |
| | D Property, plant and equipment | | Note 2 Information by sector and main country | | 152 |
| | | | Note 10 Property, plant and equipment | | 164 |
| | | | Note 19 Provisions - Environmental provisions | | 173 |
| | | | Note 25 Contractual obligations | | 182 |
| | | | Note 26 Contingent assets and liabilities - Contingent liabilities - Environmental remediation | | 183 |
4A | | Unresolved staff comments | | Not applicable | | |
5 | | Operating and financial review and prospects | | | | |
| | A Operating results | | Use of non-GAAP information | | 7 |
| | | | 5.1. Financial performance- Management summary | | 33 |
| | | | 5.1. Financial performance - from 5.1.1 to 5.1.2 and from 5.1.4 to 5.1.14 | | 33 |
| | | | 6.1.2. About Healthcare in 2015 - Regulatory requirements | | 68 |
| | | | 6.1.4. 2015 financial performance | | 70 |
| | | | 6.2.2. About Consumer Lifestyle in 2015 - Regulatory requirements | | 74 |
| | | | 6.2.4. 2015 financial performance | | 75 |
| | | | 6.3.2. About Lighting in 2015 - Regulatory requirements | | 78 |
| | | | 6.3.4. 2015 financial performance | | 79 |
| | | | 6.4.2. 2015 financial performance | | 86 |
| | | | 5.6. Critical accounting policies | | 64 |
| | | | Note 3 Discontinued operations and other assets classified as held for sale | | 154 |
| | | | Note 4 Acquisitions and divestments | | 155 |
| | | | Note 6 Income from operations | | 157 |
| | | | Note 7 Financial income and expenses | | 159 |
| | | | Note 11 Goodwill | | 165 |
| | | | Note 12 Intangible assets excluding goodwill | | 167 |
| | | | Note 31 Details of treasury / other financial risks | | 195 |
| | | | 7.3. Strategic risks | | 92 |
| | | | 7.4. Operational risks | | 93 |
| | | | 7.5. Compliance risks | | 95 |
| | | | 7.6. Financial risks | | 96 |
| | | | 7.7. Separation risk | | 97 |
| | | | 15. Reconciliation of non-GAAP information | | 249 |
| | | |
| | B Liquidity and capital resources | | 5.1. Financial performance - from 5.1.15 to 5.1.23 | | 33 |
| | | | Note 17 Equity | | 169 |
| | | | Note 18 Debt | | 172 |
| | | | Note 25 Contractual obligations | | 182 |
| | | | Note 31 Details of treasury / other financial risks | | 195 |
| | | |
| | C Research and development, patents and licenses, etc. | | 5.1.4. Research and development | | 39 |
| | | | 6.4.1. About Innovation, Group & Services in 2015 | | 83 |
| | | |
| | D Trend information | | 5.5. Outlook | | 63 |
| | | |
| | E Off-balance sheet arrangements | | 5.1.23. Cash obligations | | 50 |
| | | | Note 25 Contractual obligations | | 182 |
| | | | Note 26 Contingent assets and liabilities | | 183 |
| | | | Note 31 Details of treasury / other financial risks | | 195 |
| | | |
| | F Tabular disclosure of contractual obligations | | 5.1.23. Cash obligations | | 50 |
| | | | Note 25 Contractual obligations | | 182 |
| | | |
| | G Safe Harbor | | Forward-looking statements | | 6 |
10 Annual Report 2015
Form 20-F cross reference table
| | | | | | | | |
| Item | | Form 20-F caption | | Location in this document | | Page | |
6 | | Directors, senior management and employees | | | | | | |
| | | |
| | A Directors and senior management | | 8. Management | | | 99 | |
| | | | 9. Supervisory Board | | | 101 | |
| | | | 11.1. Board of Management - Introduction | | 142 | 114 | |
| | | | 10.1.11.1. Board of Management - (Term of) Appointment and conflicts of interest | | 142 | 114 | |
| | | | 10.2.11.2. Supervisory Board - (Term of) Appointment, individual data and conflicts of interests | | 144 | 118 | |
| | | |
| | B Compensation | | Note 3020 Post-employment benefits | | 197 | 176 | |
| | | | Note 3128 Share-based compensation | | 200 | 186 | |
| | | | Note 3329 Information on remuneration | | 204 | 189 | |
| | | | 9.2.10.2. Report of the Remuneration Committee | | 135 | 107 | |
| | | |
| | C Board practices | | 7.8. Management | | 127 |
| 99 | | | | 8. Supervisory Board | | 129 |
| | | | 9. Supervisory Board report | | 131 | 101 | |
| | | | 10.1.10. Supervisory Board of Managementreport | | 142 | 103 | |
| | | | 10.2. Supervisory11.1. Board of Management | | 144 | 114 | |
| | | | 10.4. Logistics of the General11.2. Supervisory Board | | | 118 | |
| | | | 11.4. Meeting of Shareholderslogistics and provision ofother information - Internal controls and disclosure policies | | 147 | 123 | |
| | | | 10.4. Logistics of the General11.4. Meeting of Shareholderslogistics and provision ofother information - Auditor information | | 147 | 123 | |
| | | |
| | D Employees | | 4.2.4.5.2.4. Employment | | 73 | 54 | |
| | | | Note 36 Income from operations - Employees | | 174 | 157 | |
| | | |
| | E Share ownership | | 10.1.11.1. Board of Management- Amount and composition of the remuneration of the Board of Management | | 142 | 114 | |
| | | | Note 20 Long-term debt and short-term debt - Short-term debt17 Equity | | 191 | 169 | |
| | | | Note 19 Equity | | 189 |
| | | | Note 3128 Share-based compensation | | 200 | 186 | |
| | | | | Note 3329 Information on remuneration | | 204 | 189 | |
7 | | Major shareholders and related party transactions | | | | | | |
| | | |
| | A Major shareholders | | 10.5.11.5. Investor Relations - Major shareholders and other information for shareholders | | 149 | 126 | |
| | | | 10.6.11.6. Additional information- Major shareholders as filed with SECinformation - Articles of association | | 149 | 127 | |
| | | | 17.2. Share information | | | 259 | |
| | | |
| | B Related party transactions | | 10.1.11.1. Board of Management | | 142 | 114 | |
| | | | Note 65 Interests in entities | | 179 | 156 | |
| | | | Note 3227 Related-party transactions | | 204 |
| 186 | | | | Note 36 Subsequent events | | 213 |
| | | |
| | | C Interests of experts and counsel | | Not applicable | | | | |
8 | | Financial information | | | | | | |
| | | |
| | A Consolidated statements and other financial information | | 11.12. Group financial statements - from 12.4 to 12.9 | | 154 | 131 | |
| | | | 16.1.17.1. Key financials and dividend policy - Dividend policy | | | 257 | |
| | | |
| | | B Significant changes | | Note 3632 Subsequent events | | 213 | 199 | |
9 | | The offer and listing | | | | | | |
| | | |
| | A Offer and listing details | | 10.4. Logistics of the General Meeting of Shareholders and provision of information - Preference shares and the Stichting Preferente Aandelen Philips | | 147 |
| | | | 10.5. Investor Relations - Major shareholders and other information for shareholders | | 149 |
| | | | 10.6. Additional information | | 149 |
| | | | Note 19 Equity | | 189 |
| | | | 16.4.17.4. Performance in relation to market indices | | 262 | 261 | |
12 Annual Report 2013
Form 20-F cross reference table
| | | | | | |
Item | | Form 20-F caption | | Location in this document | | Page |
| | B Plan of distribution | | Not applicable | | | | |
| | | |
| | C Markets | | 16.4.17.4. Performance in relation to market indices | | 262 | 261 | |
| | | |
| | D Selling shareholders | | Not applicable | | | | |
Annual Report 2015 11
Form 20-F cross reference table
| | | | | | |
| Item | | Form 20-F caption | | Location in this document | | Page |
| | E Dilution | | Not applicable | | |
| | | |
| | | F Expense of the issue | | Not applicable | | |
10 | | Additional information | | | | |
| | | |
| | A Share capital | | Not applicable | | |
| | | |
| | B Memorandum and articles of association | | 10.1.11.1. Board of Management - (Term of) Appointment and conflicts of interest | | 142114 |
| | | | 10.2.11.2. Supervisory Board - (Term of) Appointment, individual data and conflicts of interest | | 144118 |
| | | | 10.3.11.3. General Meeting of Shareholders - Main powers of the General Meeting of Shareholders | | 146122 |
| | | | 10.6. Additional11.4. Meeting logistics and other information | | 149123 |
| | | | 18.1. Index11.6. Additional information - Articles of exhibits Exhibit 1association | | 277127 |
| | | | 10.4. Logistics19.1. Index of the General Meeting of Shareholders and provision of informationexhibits - Exhibit 1 | | 147272 |
| | | |
| | C Material contracts | | 9.2.2.10.2.2. Contracts for the provision of services | | 135107 |
| | | | 18.3. Exhibits19.1. Index of exhibits - Exhibit 4 (a), (b) and (c) | | 280272 |
| | | |
| | D Exchange controls | | 10.6.11.6. Additional information- Exchange controls | | 149127 |
| | | |
| | E Taxation | | 16.8.17.7. Taxation | | 268266 |
| | | |
| | F Dividends and paying agents | | Not applicable | | |
| | | |
| | G Statements by experts | | Not applicable | | |
| | | |
| | H Documents on display | | Introduction - Documents on display | | 5 |
| | | |
| | | I Subsidiary information | | Not applicable | | |
11 | | Quantitative and qualitative disclosure about market risk | | | | |
| | | |
| | A Quantitative information about market risk | | Note 3531 Details of treasury / other financial risks | | 210195 |
| | | |
| | B Qualitative information about market risk | | Note 3531 Details of treasury / other financial risks | | 210195 |
| | | |
| | C Interim periods | | Not applicable | | |
| | | |
| | D Safe harbor | | Note 3531 Details of treasury / other financial risks Forward-looking statements
| | 210
195 |
| | | | Forward-looking statements | | 6 |
| | | |
| | | E Small business issuers | | Not applicable | | |
12 | | Description of securities other than equity securities | | | | |
| | | |
| | A Debt securities | | Not applicable | | |
| | | |
| | B Warranty and rights | | Not applicable | | |
| | | |
| | C Other securities | | Not applicable | | |
| | | |
| | D American depository shares | | 17.8. New York Registry Shares | | 269 |
| | | |
Part 2 | | | | | | |
13 | | Defaults, dividend arrearages and delinquencies | | Not applicable | | |
12 Annual Report 2013 132015
Form 20-F cross reference table
| | Item | | Form 20-F caption | | Location in this document | | Page | | Form 20-F caption | | Location in this document | | Page |
| | | B Warranty and rights | | Not applicable | | | |
| | | C Other securities | | Not applicable | | | |
| | | | D American depository shares | | 16.9. New York Registry Shares | | 272 | |
| | Part 2 | | | | | | | |
| 13 | | Defaults, dividend arrearages and delinquencies | | Not applicable | | | |
| 14 | | Material modifications to the rights of security holders and use of proceeds | | Not applicable | | | | Material modifications to the rights of security holders and use of proceeds | | Not applicable | | |
| 15 | | Controls and procedures | | | | | | Controls and procedures | | | | |
| | | A Disclosure controls and procedures | | 11.1.1. Disclosure controls and procedures | | 154 | | A Disclosure controls and procedures | | 12.1.1. Disclosure controls and procedures | | 132 |
| | | B Management annual report on internal control over financial reporting | | 11.1. Management’s report on internal control | | 154 | | B Management Annual Report on internal control over financial reporting | | 12.1. Management’s report on internal control | | 132 |
| | | C Attestation report of the registered public accounting firm | | 11.3. Auditor’s report on internal control over financial reporting | | 155 | | C Attestation report of the registered public accounting firm | | 12.3.2. Independent auditors’ report on internal control over financial reporting | | 134 |
| | | | D Changes in internal control over financial reporting | | 11.1.2. Changes in internal control over financial reporting | | 154 | | D Changes in internal control over financial reporting | | 12.1.2. Changes in internal control over financial reporting | | 132 |
| 16A | | Audit Committee Financial Expert | | 10.2. Supervisory Board - The Audit Committee | | 144 | | Audit Committee Financial Expert | | 11.2. Supervisory Board - The Audit Committee | | 118 |
| 16B | | Code of Ethics | | 6.1. Our approach to risk management and business control - Financial Code of Ethics | | 116 | | Code of Ethics | | 7.1. Our approach to risk management and business control - Financial Code of Ethics | | 88 |
| 16C | | Principal Accountant Fees and Services | | 9.3. Report of the Audit Committee | | 140 | | Principal Accountant Fees and Services | | 10.3. Report of the Audit Committee | | 112 |
| | | | 10.4. Logistics of the General Meeting of Shareholders and provision of information - Auditor policy | | 147 | | | | 11.4. Meeting logistics and other information - Auditor policy | | 123 |
| | | | | | Note 3 Income from operations - Audit fees | | 174 | | | | Note 6 Income from operations - Audit fees | | 157 |
| 16D | | Exemptions from the Listing Standards for Audit Committees | | Not applicable | | | | Exemptions from the Listing Standards for Audit Committees | | Not applicable | | |
| 16E | | Purchases of Equity Securities by the Issuer and Affiliated Purchasers | | Note 19 Equity - Treasury shares | | 189 | | Purchases of Equity Securities by the Issuer and Affiliated Purchasers | | 11.3. General Meeting of Shareholders - Repurchase and issue of (rights to) own shares | | 122 |
| | | | 10.3. General Meeting of Shareholders - Repurchase and issue of (rights to) own shares | | 146 | | | | 17.2. Share information - Share repurchase programs for capital reduction purposes | | 259 |
| | | | | 16.2. Share information - Share repurchase programs for capital reduction purposes | | 259 | |
| 16F | | Change in Registrant’s Certifying Accountant | | Not applicable | | | | Change in Registrant’s Certifying Accountant | | 11.6. Additional information - Change in Registrant’s Certifying Accountant | | 127 |
| 16G | | Corporate Governance | | 9. Supervisory Board report | | 131 | | Corporate Governance | | 11. Corporate governance - Corporate governance of the Philips Group - Introduction | | 114 |
| | | | | 10. Corporate governance | | 142 | | | | 11.6. Additional information - General | | 128 |
| | | | | 11.6. Additional information - Board structure | | 128 |
| | | | | 11.6. Additional information - Independence of members of our Supervisory Board | | 128 |
| | | | | 11.6. Additional information - Committees of our Supervisory Board | | 128 |
| | | | | 11.6. Additional information - Equity compensation plans | | 129 |
| | | | | | 11.6. Additional information - Code of business conduct | | 129 |
16H | | | Mine Safety Disclosure | | Not applicable | | |
| Part 3 | | | | | | | | | | | | |
| 17 | | Financial statements | | Not applicable | | | | Financial statements | | Not applicable | | |
| 18 | | Financial statements | | 11. Group financial statements | | 154 | | Financial statements | | 12. Group financial statements - from 12.4 to 12.9 | | 131 |
| 19 | | Exhibits | | 18.1. Index of exhibits | | 277 | | Exhibits | | 19.1. Index of exhibits | | 272 |
14 Annual Report 20132015 13
Performance highlights 1
1 Performance highlights
Prior-period financial statements and related information have been restated for the treatment of Audio, Video, Multimedia and Accessories as discontinued operations (see note 7, Discontinued operations and other assets classified as held for sale) and the adoption of IAS 19R, which mainly relates to accounting for pensions (see note 30, Post-employment benefits). For a reconciliation to the most directly comparable GAAP measures, seeReconciliation of non-GAAP information.Philips Group
Financial table
all amounts Key datain millions of eurosEUR unless otherwise stated
2014 - 2015
| | | | | | |
| | | | | | | | 2014 | | 2015 | |
| | | 2011 | | 2012 | | 2013 | | | | | |
Sales | | | 20,992 | | | | 23,457 | | | | 23,329 | | | | 21,391 | | | | 24,244 | |
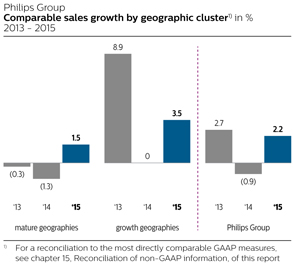
| Comparable sales growth | | | | (1 | )% | | | 2 | % |
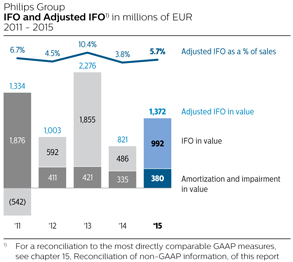
| Adjusted IFO | | | 1,435 | | | | 1,106 | | | | 2,451 | | | | 821 | | | | 1,372 | |
as a % of sales | | | 6.8 | | | | 4.7 | | | | 10.5 | | | | 3.8 | % | | | 5.7 | % |
| IFO | | | (479 | ) | | | 648 | | | | 1,991 | | | | 486 | | | | 992 | |
as a % of sales | | | (2.3 | ) | | | 2.8 | | | | 8.5 | | | | 2.3 | % | | | 4.1 | % |
| Net income (loss) | | | (1,456 | ) | | | (30 | ) | | | 1,172 | | |
Net income | | | | 411 | | | | 659 | |
| Net income attributable to shareholders per common share in euro: | | | | | | | |
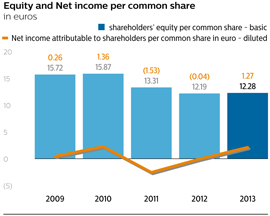
- basic | | | (1.53 | ) | | | (0.04 | ) | | | 1.28 | | |
- diluted | | | (1.53 | ) | | | (0.04 | ) | | | 1.27 | | |
Net income attributable to shareholders per common share in EUR: | | | | | |
basic | | | | 0.45 | | | | 0.70 | |
diluted | | | | 0.45 | | | | 0.70 | |
| Net operating capital | | | 10,382 | | | | 9,316 | | | | 10,238 | | | | 8,838 | | | | 11,096 | |
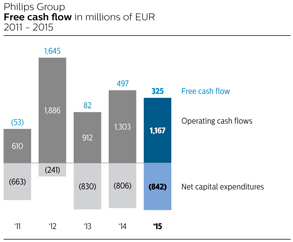
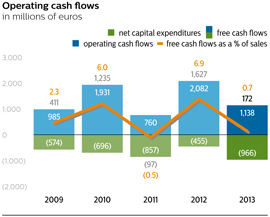
| Free cash flows | | | (97 | ) | | | 1,627 | | | | 172 | | |
Free cash flow | | | | 497 | | | | 325 | |
| Shareholders’ equity | | | 12,328 | | | | 11,151 | | | | 11,214 | | | | 10,867 | | | | 11,662 | |
| Employees at December 31 | | | 125,240 | | | | 118,087 | | | | 116,681 | | | | 113,678 | | | | 112,959 | |
of which discontinued operations | | | 5,645 | | | | 2,005 | | | | 1,992 | | |
continuing operations | | | | 105,365 | | | | 104,204 | |
discontinued operations | | | | 8,313 | | | | 8,755 | |
| | | | | |
Performancein millions of EUR unless otherwise stated
2014 - 2015
| | | | | | | | | | | | | | | | | | | | | | | | | | | | | | | | | | | | | | | | | | | | | | | | |
| | | | |
| | | Group | | | Healthcare | | | Consumer Lifestyle | | | Lighting | |
| | | 2014 | | | 2015 | | | | | | 2014 | | | 2015 | | | | | | 2014 | | | 2015 | | | | | | 2014 | | | 2015 | | | | |
| | | | |
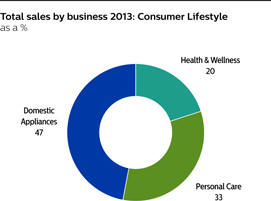
Sales | | | 21,391 | | | | 24,244 | | | | 13% | | | | 9,186 | | | | 10,912 | | | | 19% | | | | 4,731 | | | | 5,347 | | | | 13% | | | | 6,869 | | | | 7,411 | | | | 8% | |
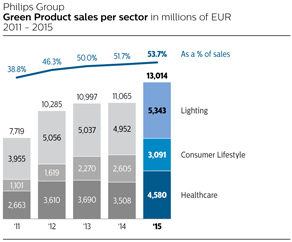
Green Product sales | | | 11,065 | | | | 13,014 | | | | 18% | | | | 3,508 | | | | 4,580 | | | | 31% | | | | 2,605 | | | | 3,091 | | | | 19% | | | | 4,952 | | | | 5,343 | | | | 8% | |
Sales in mature geographies1) | | | 14,004 | | | | 15,836 | | | | 13% | | | | 6,890 | | | | 8,207 | | | | 19% | | | | 2,508 | | | | 2,784 | | | | 11% | | | | 4,182 | | | | 4,425 | | | | 6% | |
Sales in growth geographies1) | | | 7,387 | | | | 8,408 | | | | 14% | | | | 2,296 | | | | 2,705 | | | | 18% | | | | 2,223 | | | | 2,563 | | | | 15% | | | | 2,687 | | | | 2,986 | | | | 11% | |
Adjusted IFO | | | 821 | | | | 1,372 | | | | 67% | | | | 616 | | | | 1,024 | | | | 66% | | | | 573 | | | | 673 | | | | 17% | | | | 293 | | | | 594 | | | | 103% | |
Net operating capital | | | 8,838 | | | | 11,096 | | | | 26% | | | | 7,565 | | | | 9,212 | | | | 22% | | | | 1,353 | | | | 1,453 | | | | 7% | | | | 3,638 | | | | 3,813 | | | | 5% | |
| | | | |
| 1) | Mid-term financial targets |
2) | Including restructuring and acquisitions |
3) | Excluding Mergers & Acquisitions impact |
4) | Based on the results of 60 “pulse surveys” as there was no full-scope Employee Engagement Survey in 2012 |
5) | For a definition of of mature and growth geographies see chapter 17,18, Definitions and abbreviations, of this report |
6) | As measured by Interbrand |
Financial performance 2013
| | | | | | | | |
| | Target1) | | | Actual | |
CAGR 2012 - 2013 %
| | | 4-6 | % | | | 4.5 | % |
Adjusted IFO as % of sales2)
| | | 10-12 | % | | | 10.5 | % |
ROIC %3)
| | | 12-14 | % | | | 15.3 | % |

Performance highlights 1
Annual Report 20132015 15
Performance highlightsMessage from the CEO 2
Performance
in millions of euros
| | | | | | | | | | | | | | | | | | | | | | | | | | | | | | | | | | | | | | | | | | | | | | | | |
| | | Group | | | Healthcare | | | Consumer Lifestyle | | | Lighting | |
| | | 2012 | | | 2013 | | | | | | 2012 | | | 2013 | | | | | | 2012 | | | 2013 | | | | | | 2012 | | | 2013 | | | | |
Sales | | | 23,457 | | | | 23,329 | | | | 1% | | | | 9,983 | | | | 9,575 | | | | 4% | | | | 4,139 | | | | 4,605 | | | | 7% | | | | 8,442 | | | | 8,413 | | | | 0% | |
Green product sales | | | 10,981 | | | | 11,815 | | | | 8% | | | | 3,610 | | | | 3,690 | | | | 2% | | | | 1,619 | | | | 2,270 | | | | 40% | | | | 5,572 | | | | 5,855 | | | | 2% | |
Sales in mature geographies5) | | | 15,407 | | | | 14,825 | | | | 4% | | | | 7,615 | | | | 7,154 | | | | 6% | | | | 2,365 | | | | 2,418 | | | | 2% | | | | 5,010 | | | | 4,758 | | | | 5% | |
Sales in growth geographies5) | | | 8,050 | | | | 8,504 | | | | 6% | | | | 2,368 | | | | 2,421 | | | | 2% | | | | 1,954 | | | | 2,187 | | | | 12% | | | | 3,432 | | | | 3,655 | | | | 6% | |
Adjusted IFO | | | 1,106 | | | | 2,451 | | | | 122% | | | | 1,226 | | | | 1,512 | | | | 23% | | | | 456 | | | | 483 | | | | 6% | | | | 128 | | | | 695 | | | | 443% | |
Net operating capital | | | 9,316 | | | | 10,238 | | | | 10% | | | | 7,976 | | | | 7,437 | | | | 7% | | | | 1,205 | | | | 1,261 | | | | 5% | | | | 4,635 | | | | 4,462 | | | | 4% | |

“ After separating, Philips will focus on driving higher growth and higher value from its core activities in the field of health technology, and Lighting will have a great future as a stand-alone company.” Frans van Houten, CEO Royal Philips
2015 was a crucial year for Philips as we restored growth and improved productivity. We also took the decisive next step in our Accelerate! transformation – separating out our Lighting business and moving away from a diversified holding structure to create two stand-alone companies, each with their own clearly defined strategic direction and focus. We believe this is the best way to create lasting value for our customers and shareholders and a bright future for our employees.
Two companies with a bright future
Philips will focus on the exciting opportunities in the area of health technology, delivering meaningful innovation to improve people’s lives across the health continuum – through new, more integrated forms of care delivery.
With an expanding and aging population, the rise of chronic diseases, and global resource constraints, health systems all over the world are under tremendous pressure. At the same time, more and more people are keen to take an active role in managing their own health. And digital technology, whilst bringing vast new opportunities, is shifting value from devices to software and services. All of this is driving the convergence of professional healthcare and consumer end-markets.
By leveraging our advanced technology, deep clinical and consumer insights, long-standing customer relationships, our new HealthSuite digital cloud platform, and integrated solutions portfolio, we can improve people’s health and enable better outcomes at lower cost across the health continuum.
16 Annual Report 20132015
Message from the CEO 2
Message fromIn the CEOfield of lighting, the industry is undergoing a radical transformation. Population growth and urbanization are increasing demand for light, specifically energy-efficient light. At the same time, the rapid rise of LED and the mass adoption of digital technology are driving a shift towards connected lighting. With connected lighting, the lighting fixtures not only provide high-quality illumination, but are also fitted with sensors and connected to the building’s IT network infrastructure, forming an ‘information pathway’. This is opening up new applications where we can deliver extraordinary value beyond illumination, also via new service-based business models.
As a more agile, stand-alone company with direct access to capital markets, we believe that our Lighting business will be better able to strengthen its position as the world leader in lighting solutions, boost scale and capture growth.
2015 a year of solid progress
Amidst all this transformation, it was vital that we improved our performance in 2015, giving our customers the product and service innovation they expect.
Overall, 2015 was a solid year for Philips, in which we recorded consistent performance improvements in the face of challenging economic conditions. Sales were up 2% on a comparable basis, driven by 4.5% growth in our HealthTech portfolio. Profitability also increased thanks to the improved operational performance, overhead cost savings, a reduction in cost of goods sold and process optimization, partly offset by the significant impact of currency headwinds, higher investments in R&D, settlement costs for pension de-risking, and ongoing investments to improve our quality management systems.
We reinvigorated our Healthcare business in North America and gained momentum in winning large-scale multi-year healthcare enterprise deals, e.g. with Westchester Medical Center (USA) and Mackenzie Health (Canada). And at our Imaging Systems facility in Cleveland we saw a gradual ramp-up of production in the course of the year. In February 2015 we completed the acquisition of Volcano, improving our position in the growing image-guided therapy market and strengthening our ability to deliver the benefits of minimally invasive therapies, such as faster recovery and shorter hospital stays. Post-merger integration is making good progress.
We also continued to deliver impressive growth and strong earnings across the majority of our Consumer Lifestyle portfolio. Our Health & Wellness and Personal Care businesses performed very well, delivering another year of high growth and margin expansion. Expanding our offering to help consumers make healthier choices, we launched the first in a series of personal health apps at the IFA trade fair in Berlin. Built on our Philips HealthSuite digital platform, these personal health programs represent a new era in connected care, as healthcare continues to move outside the hospital and into our homes and everyday lives.

“Our The power of our connected lighting propositions, based on IoT (Internet of Things) technology, was underscored by the opening of the world’s most sustainable office building, The Edge in Amsterdam, which features Philips’ smart connected lighting solution, with Power over Ethernet. In the US, Los Angeles remotely manages more than 100,000 street lights with our CityTouch lighting management system to create a more livable and safe city. And in the home, our Hue connected lighting platform continues to be a resounding success. Towards the end of the year, we teamed up with Cisco and SAP to address the opportunities in the office and street lighting markets respectively.
The termination of the planned sale of Lumileds to a consortium led by GO Scale Capital was of course a disappointing outcome, but we are actively engaging with other parties that have expressed an interest in the Lumileds business.
Accelerate! initiativesdriving performance improvement
In 2015, our multi-year Accelerate! program again helped us to achieve our mid-term 2013 targets. We are implementingstep up growth and increase margins, despite deteriorating macro-economic conditions in a number of markets. Through Accelerate! and the implementation of the Philips Business System (PBS) we continue to drive improvements across the companyorganization. The PBS is helping us to improve customerfurther tighten our focus on quality and operational excellence and enhance productivity through continuous improvement methodologies, while embedding new capabilities and making us more agile, entrepreneurial and customer-centric, with a culture of higher performance. This is evidenced by the many large-scale multi-year hospital deals we won in 2015 and our improving growth and margins despite the difficult economic times.
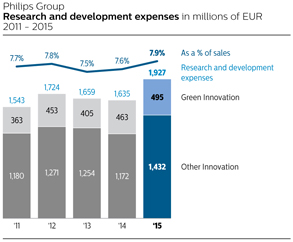
The PBS is also helping to reduce time-to-market for our innovations through Lean transformations of our customer value chains. And it is supporting our drive to become a digital company, both in how we work and in what we offer to the market, e.g. our businesses systematically to global leadership performance. With our mission to deliver meaningful innovation to make the world healthierPhilips HealthSuite digital platform and more sustainable, we are well positionedconnected LED lighting. Last but not least, it is driving overhead cost and productivity savings, offsetting headwinds and enabling us to improve our growth rate.” Frans van Houten, CEO
Dear stakeholder,
In 2013 we passed a major milestone onoperating results over the year, notwithstanding an increase in our Accelerate! transformation journeyResearch & Development expenses to unlock Philips’ full potential. Despite economic headwinds, especially in Europe and the United States, our Accelerate! initiatives helped us to achieve our mid-term 2013 targets. I am delighted with this result, as it underlines yet again that Philips is, above all, a case7.9% of self-help.
Accelerate! is helping us get closer to our customers, as illustrated by our landmark alliance with Georgia Regents Medical Center. And the transformation of our value chains is speeding up the introduction of locally relevant innovations in key markets around the world. Innovations like our EPIQ ultrasound imaging system, our Smart Air Purifier and Airfryer home appliances, and our energy-efficient CityTouch lighting management system.sales.
Annual Report 20132015 17
Message from the CEO 2
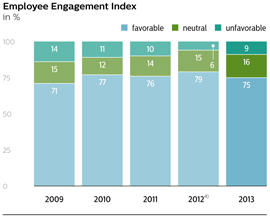
We are also seeing the steady development ofInnovating for a growth and performance culture characterized by strong employee engagement, teamwork, the drive for operational excellence and accountability for results. This is making ushealthier, more agile, entrepreneurial and innovative.
Financial performance
The economic environment in 2013 was challenging. Full-year sales declined by 1% in nominal terms, but increased by 3% on a comparable basis. Closing the year with strong 7% top-line growth in the fourth quarter, we delivered a compound annual growth rate for comparable sales over the period 2012-2013 of 4.5%, compared to our target of 4-6%. In regional terms, our growth geographies delivered 11% comparable sales growth in 2013 and now make up 36% of total sales.
Profitability improved significantly on the back of increased gross margins and productivity gains from our Accelerate! program. This resulted in a reported Adjusted IFO of 10.5%, within the target bandwidth of 10-12%. And our return on invested capital was 15.3%, above the targeted range of 12-14%.
Our Healthcare business increased operational earnings despite a virtually flat top line. With the issues surrounding health care reform in the US and budget constraints in key markets, we are increasingly focusing on becoming the technology solutions partner of choice to major hospitals as a way to unlock new growth. Reflecting the success of its innovative propositions for personal health and well-being, Consumer Lifestyle posted strong growth and good earnings, while Lighting recorded higher sales, driven by a 38% increase in LED-based sales, and improved operational earnings.
In 2013 we also completed the execution of our EUR 2 billion share buy-back program, thereby improving the efficiency of our balance sheet, and announced a new EUR 1.5 billion program to be concluded over the next 2-3 years. By the end of 2013 we had completed 7% of this new program.
Other 2013 highlightssustainable world
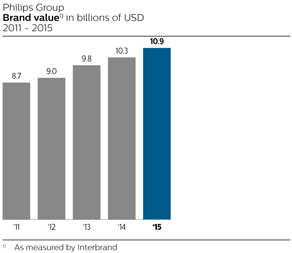
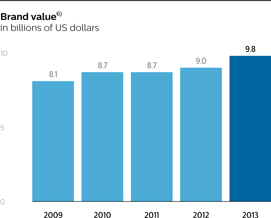
In 2013 we rose to # 40 on Interbrand’s annual ranking of the top-100 global brands, with2015, our brand value increasing by 8% to close to USD 10 billion. And in November we unveiled our new brand positioninginnovative solutions and brand line – “innovation and you” – and our redesigned shield, which enjoyed an enthusiastic reception from customers, employees and other stakeholders.
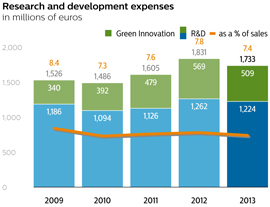
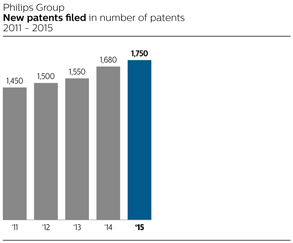
In 2014 we celebrate 100 years of Philips Research, and over the past year we underlined our commitment to innovation by investing EUR 1.7 billion in research and development. We filed over 1,500 patent applications in 2013. Other innovation highlights included the increasing adoption of our Digital Pathology solution and the development of the 200 lm/W TLED prototype to replace fluorescent tube lighting.
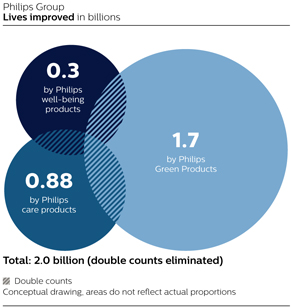
We also continued to deliver on our EcoVision sustainability commitments in 2013, improvingservices improved the lives of 1.82 billion people around the globeworld. Underlining our strength in the creation and hittingprotection of intellectual property we filed 1,750 new patents during the year and were named the world’s second-largest patent applicant for patents filed at the European Patent Office.
We also entered into a five-year research alliance with Massachusetts Institute of Technology (MIT) to develop breakthrough innovations in health technology and connected lighting. And our North American research organization moved to the Cambridge, Mass. area to facilitate collaboration with MIT, academic hospitals, and business partners.
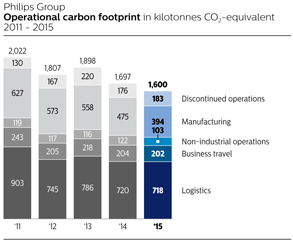
In 2015, we again delivered on our sustainability commitments, with Green Product sales target of 50%Products accounting for 54% of total sales two years ahead of schedule. In Buenos Aires we were awarded the order to renovate most of the city’s 125,000 street lights with our CityTouch system, and in Dubai we were selected to transform over 260 Municipality buildings with intelligent LED solutions – both projects reducing energy consumption by some 50%. Our efforts to createsales. Philips was recognized as a healthier and more sustainable world received recognitionleader for corporate action on climate change, achieving a perfect score (100A) in the form ofCarbon Disclosure Project (CDP) Climate Change survey for the 3rd year in a riserow, and being named Leader in the Industrial Conglomerates category in the Dow Jones Sustainability Index. Keeping up the momentum, we committed to 23rd place in Interbrand’s ranking ofmaking Philips’ operations carbon-neutral by 2020 at the top 50 Best Global Green Brands,2015 Paris climate conference.
Underlining the importance we attach to ‘doing good while doing well’, the Philips Foundation entered into global innovation partnerships with the Red Cross and UNICEF, as well as supporting a top rating fromhost of innovation projects designed to make a difference in the Carbon Disclosure Project.
Of course, no year is entirely freecommunities and lives of disappointment, andthose most in 2013 we had to contend with the termination of the deal with Funai for our Audio, Video, Multimedia and Accessories business. We also faced compliance issues relating to our General Business Principles, which we are refining and strengthening.
Looking ahead – our Path to Value by 2016
Philips is a diversified technology company with a portfolio of some 40 businesses across various strategic domains. Over half of these businesses hold global leadership positions. Our portfolio is underpinned by strong assets: deep market insights; world-class innovation capabilities – technology, know-how and strong IP positions; our global footprint; our talented, engaged people; and the Philips brand.
The significant changes we have made to our portfolio in recent years have created a better growth platform with higher profit potential. And with the transformation of our business model architecture, we are increasingly becoming a technology solutions partner, with recurring revenue streams accounting for over 25% of sales.need.
Meeting the needs of a changing worldStrategic priorities for 2016
In light of the mega-trendsglobal trends and challengesopportunities outlined above and the world is facing,innovative competencies we can bring to bear, both our health technology and lighting businesses are confident inwell placed to thrive as markets drive greater demand for our chosen strategic direction. With its focus on healthsolutions and sustainability, ourservices.
18 Annual Report 2013
Message from the CEO
vision to improve the lives of 3 billion people a year by 2025 helps to differentiate us from the competition, have a closer relationship with our customers, create IP and ultimately create more value.
We see the shift from a linear to a circular economy as a further opportunity to create value. In a linear economy, productsBoth companies are used briefly and then discarded as waste. In a circular economy, products are designed so they become part of a value network where re-use and refurbishment ensure continuous re-exploitation of resources.
We are redesigning our products in order to capture their residual value. And we are shifting from transactions to relationships via service and solution business models. A good example is the 10-year performance contract we were awarded to install, monitor and maintain 13,000 connected lighting fixtures and energy management controls for parking garages in Washington, DC. Because we are ensuring light levels and delivering the solutions as a service that is paid for by the energy savings, Washington gets brighter, safer LED lighting for its garages with none of the up-front cost, thereby removing one of the main barriers to the adoption of energy-efficient technology.
Driving productivity improvement
Over the coming years we will continue to drive operational excellence and invest in innovation and sales development. We will also continue to focus on improving profitability, e.g. by further reducing overhead costs and driving value engineering through our Design for Excellence (DfX) program. Altogether we see significant potential to improve productivity over the next few years. We also have scope for value-creating bolt-on acquisitions, but will remain prudent with our capital allocation. Most of our growth opportunities are organic.
In 2014 we will roll out a new IT landscape to make Philips a truly real-time company, and we will further embed the Philips Business System (PBS). The PBS is the way we run our company to ensure business success is repeatable. This year will also see our new brand positioning being activated across the globe.
New growth initiatives
I am pleased to say that Philips has multiple new growth opportunities in the making. Within our Healthcare sector we have established the Healthcare Informatics Solutions & Services business group, which is focusing on a digital connected healthcare delivery platform, advanced informatics and big data analytics, and world-class integration and consulting services. At Consumer Lifestyle we have a new business initiative on Personal Health. And in our Innovation, Group & Services sector we have several highly promising start-ups, although it will be a few years before they are margin-accretive because of the necessary investments. Examples of these exciting new business areas include point-of-care diagnostics as well as horticultural and city farming technology.
Confident in the future
While remaining cautious about the short-term macro- economic outlook, we aredeeply committed to delivering on their strategic opportunities. For Philips, serving the health technology markets, this means building strong consultative customer relationships, selling value-added solutions and winning more large-scale, multi-year projects with healthcare providers. It also means delivering growth from innovation investments, establishing the Philips HealthSuite digital platform as a leading cloud-based enabling solution, and boosting scale in its existing businesses.
For Lighting, as a stand-alone company, it means: optimizing returns from conventional products to fund innovation in LED, to outpace the market; leading the shift to LED systems, building the largest IoT connected installed base; capturing adjacent value through new Services business models; and being its customers’ best business partner locally, leveraging its global scale.
Both companies will remain strongly committed to improve performance and capture higher growth, focusing ever more closely on customers’ needs, driving new ways to innovate and leveraging partnerships, embracing digital technology in their ways of working, and relentlessly driving a mindset of continuous improvement and operational excellence.
It is my deepest conviction that both Philips and Lighting stand to benefit from the separation, as it will enable greater focus on their respective attractive markets and allow them to capture higher growth and deliver higher profitability.
In conclusion
For 2016, we continue to expect modest comparable sales growth and we will build on our 2016 financial2015 operational performance targets. As a signimprovement. Taking into account ongoing macro-economic headwinds and the phasing of our confidencecosts and sales, we expect improvements in Philips’ future, wethe year to be back-end loaded.
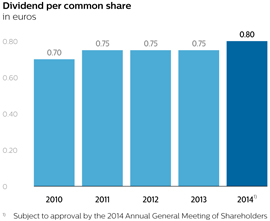
We are proposing to the upcoming Annual General Meeting of Shareholders to increasemaintain this year’s dividend todistribution at EUR 0.80 per common share, in cash or stock.shares.
On behalf of my colleagues on the Executive Committee, I wish to thank all our employees for embracing Accelerate!, helping to build a great company fit for the demands of the 21st century, and delivering innovations that matter to people the world over. And 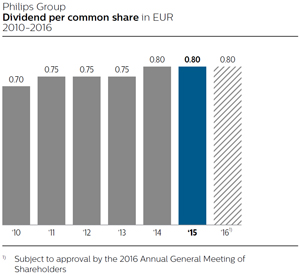
I would like to thank our customers, shareholders and other stakeholders for their continued trustsupport. I also want to thank all our employees for their dedication and support.effort this past year.
In 2016, Philips celebrates 125 years in business. That’s a tremendous feat for an innovation company, especially in such a fast-changing world. And I’m convinced that there is much more to come, as we continue to improve people’s lives through meaningful innovation.


Frans van Houten
Chief Executive Officer
18 Annual Report 2013 192015
1. Our transformation3 Philips in 2015 at a glance
Driving change and improvement
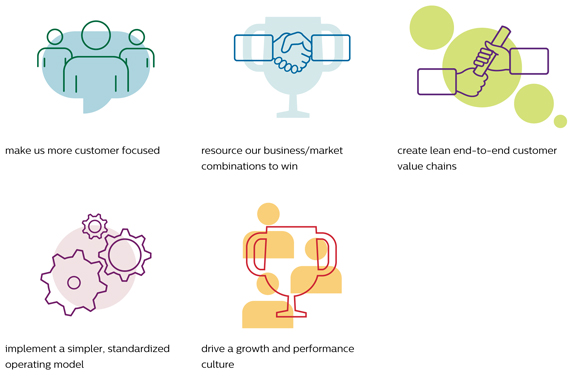
Now in its third year, Accelerate! is making Philips a more agile and entrepreneurial innovator. The program, which is set to run through 2017, is made up of five streams designed to:
Annual Report 2013 212015 19
2. Business Impact
Accelerated! in action

224 Our strategic focus
4.1 Addressing global challenges
Guided by our passion to improve people’s lives, Philips has been a leader in building and shaping markets with meaningful innovations for 125 years. With the world facing the challenge of tackling climate change and energy constraints, as well as providing effective and affordable healthcare to a growing global population, we see compelling opportunities in the health technology and lighting markets.
Determined to win in both, we are separating out our Lighting activities as a stand-alone company. This will create more focus, giving Lighting the opportunity to grow and capture the vast opportunities in energy-efficient, digital lighting products, systems and services, and Philips the enhanced focus to expand its core business to address the opportunities in the health technology market.
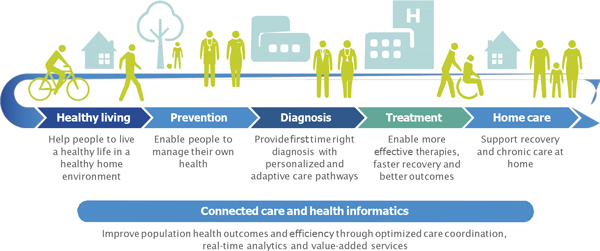
We see a growing need for better health and better care at lower cost
Global resource constraints on health systems are driving a shift to value-based healthcare to reduce cost, increase access and improve outcomes. At the same time, aging populations across the globe and the rise of chronic conditions are driving a shift of care to lower-cost settings and the home.
In parallel, more and more people are looking for new ways to proactively monitor and manage their health. And the digitalization of healthcare is shifting value from devices to software and services.
These challenges can only be met through new, more integrated forms of care delivery across the health continuum, with a shift away from today’s focus on acute care and late-stage interventions.
In an increasingly connected world, the convergence of Philips’ consumer technologies that facilitate healthy living, medical technologies that help clinicians to deliver better diagnosis and treatment, and cloud-based technologies that enable data sharing and analysis, will be a key enabler of more effective, lower-cost integrated health solutions. This fits very well with our core strengths in professional healthcare and in consumer health and well-being.
20 Annual Report 20132015

In a total addressable market estimated at over EUR 140 billion, we are well positioned to leverage advanced technology and our deep clinical and consumer insights to deliver integrated solutions that improve people’s health and enable better outcomes across the health continuum.

We have defined five priority areas: personal health, definitive diagnosis, minimally invasive guided therapy, population health management, and connected care delivery. And our focus on cardiology, oncology, respiratory care, and fertility, pregnancy and parenting already gives us a broad-based opportunity to expand our integrated solutions capabilities.
More and more, we are teaming up with hospital and health systems to understand their needs, provide integrated solutions, and engage in multi-year cooperation to drive improvements in terms of patient outcomes, quality of care delivery and cost productivity.
Going forward, we will further drive the benefits of scale in our current businesses while delivering additional growth from continuing investments in innovation. And establishing the Philips HealthSuite digital platform as a leading cloud solution to connect consumers, patients and providers will allow us to introduce value propositions with recurring revenue streams.
We see increasing demand for energy-efficient and connected digital lighting
The lighting industry is undergoing a radical transformation, driven by the market’s transition to LED and digital technology. Three mega-trends present a huge opportunity.

The rapid rise in the world’s population and in new lighting applications is driving up global demand for light. At the same time, with lighting accounting for 19% of global electricity consumption, the world needs that light to be energy-efficient. And with the integration of LED technology, lighting controls and software opening up new functionality and services, the world will benefit from the compelling new applications that connected digital lighting can offer, delivering value beyond illumination.
As a stand-alone company, our Lighting business is well positioned to capture the value that is shifting from individual products to connected LED lighting systems and services, more than offsetting the decline of conventional lighting. Its total addressable market is estimated at over EUR 65 billion.
Annual Report 2013 232015 21

With the help of patient advisors like Alice Reece, Philips and Georgia Regents Medical Center are working to redefine patient and family care.
“When I think about the future of healthcare we have to re-think everything: every square foot, every person, every dollar, every resource. And that forces real dynamic change in a way that this industry hasn’t seen in years.”
David Hefner
Executive Vice President
Georgia Regents Medical Center

“Providing care requires us to be innovative, requires us to think differently. The partnership that we now have with Philips really stresses a better outcome for our patients.”
Dr Ricardo Azziz
CEO
Georgia Regents Health System

24 Annual Report 2013

Around the world, we are working together with our partners and customers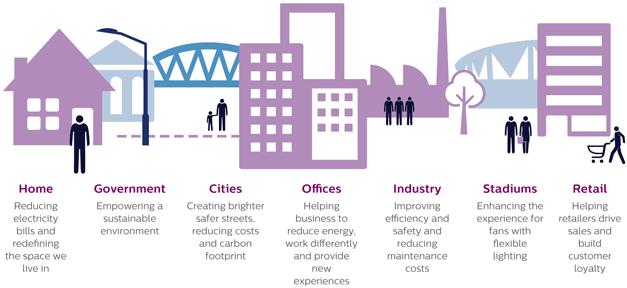
Optimizing returns from its conventional products to optimize every step in the value chain. This end-to-end approachfund growth, Philips Lighting is enabling uscommitted to innovate in LED to outpace the market. It will continue to lead the shift to Systems, building the industry’s largest connected installed base and execute faster and more efficiently.
Driving growth in oral healthcare
In Germany, we are building on our professional recommendation strategy and driving conversion of manual toothbrush userscapturing value through new Services business models with recurring revenue streams, e.g. Light as a Service. And, leveraging its global scale, it will continue to electric tooth brushing through innovation leadership, portfolio expansion and distribution via new channels. This end-to-end approach resulted in a market share improvement of over 7%.
With only a third of German households owning a rechargeable toothbrush, there is a significant opportunity to expand our leadership in the sonic toothbrush segment. Taking an end-to-end perspective, we identified three key drivers for expansion: driving and communicating innovation leadership with superior propositions; creating a Philips Sonicare proposition at a price-point accessible for a broader audience; and making that proposition available to consumers in channels like drugstores and hypermarkets.
Philips Sonicare is already leading in the German market, with consumers responding to superior propositions like Flexcare Platinum and DiamondClean. In 2013, our leadership position was further supported through celebrity endorsement, which is driving awareness and conversion.
To present current manual toothbrush users with more alternatives from Philips Sonicare, driving growth in the mid-segment, we created a more accessibly priced proposition, the Philips Sonicare PowerUp. This product features similar brushing movements to manual and is gentle and effective. Research showed that over 90% of consumers surveyed preferred the Sonicare PowerUp over their manual toothbrush.
The majority of electric toothbrushes and replacement brush heads are sold in drugstores and hypermarkets. To leverage this opportunity, Sonicare PowerUp launched in DM and Budni drugstores, as well as Kaufland and Marktkauf hypermarkets, adding 2,000 stores to our distribution. We optimized our supply chain to work with these partners, designing bespoke packaging, significantly reducing time-to-market and improving transparency.
In less than a year our end-to-end strategy resulted in strong market share gains and double-digit growth in brush head sales. Consumer satisfaction increased, with patients advised by their dentist to switch to electric brushing conveniently able to purchase a Philips Sonicare and replacement brush heads at their local drugstore.
Annual Report 2013 25
LED façade lighting faster to market
Through our end-to-end transformation program, we have identified and driven improvements along the entire LED value chain in China. This has resulted in a broad range of competitively priced façade lighting solutions for the mid-tier market segment in China, with a 40% reduction in time-to-market for new product introductions and a significant increase in on-time delivery.
In 2012, market intelligence showed that we were missing out on the LED façade lighting segment in China – a segment predicted to reach € 520 million by 2015, 70% of which will be taken by mid-range solutions. The problem was that in China we only offered top-range LED façade solutions. Clearly, something hadstrive to be done.
An end-to-end transformation program was immediately initiated, and a cross-functional team representing both theits customers’ best business and our market organization was assembled to address all opportunities along the value chain. The team took ownership of the common goal to achieve ambitious cost targets. It invested in market research and started with market sizing and customer segmentation, before developing imaginative strategies for product positioning, go-to-market and time-to-market. From the outset, everyone knew that the new product line had to be conceived, developed and fine-tuned extremely quickly.
The result was a new range of competitive LED façade lighting solutions specially designed for the mid-range market in China. And all in just under 28 weeks – a massive reduction compared to the 12 months it previously took to bring a new product line to market. Another benefit of this end-to-end collaboration is that achievement of the delivery time target of 25 days has increased from 43% to 66%, with a further rise to 95% expected by 2015.partner locally.

26 Annual Report 2013

In 2013 we continued to drive structural change throughUnderstanding and meeting people’s needs
Building upon our multi-year transformation program Accelerate! We are seeing the steady emergence of a growth and performance culture that is making us more agile, entrepreneurial and innovative.
With our Accelerate! behaviors – Eager to win, Take ownership and Team up to excel – firmly embedded in the organization, we are rolling out a wide range of initiatives designed to harness the talents, viewpoints and experience of our employees and so build a winning culture. A culture anchored by our General Business Principles.
Transformation and change
To date, over 1,350 of our leading executives have taken part in our Accelerate! Leadership Program (ALP). This immersive program is designed to strengthen our leaders’ transformational capabilities so they can drive change in the organization. Complementing the ALP, the Accelerate! Team Performance (ATP) is a transformational session designed to reinforce behaviors that enhance team effectiveness. By year-end, more than 200 teams and 3,650 participants had been through the program, which also touched more than 2,000 employees via viral events.
The transformation drive is being embraced across the organization. In Healthcare, to name just one example, a group of over 160 employee advocates or “Culture Champions” is now in place, role-modeling and instilling the new culture from the middle of the organization outwards. They are providing invaluable insights and helping to drive changes in day-to-day activities and behaviors.
Capability building
ALP and ATP are also an integral part of our capability-building efforts. In 2013 we took the next steps in becoming a learning organization by completing the organizational design of Philips University. This involved a fundamental shift to align our learning activities with the organizational development priorities we have set to enable us to deliver on our business strategy. New flagship learning programs will be introduced early in 2014, and a move to one single learning management system is scheduled for the second half of the year.
Employee engagement
In October 2013 we launched our renewed bi-annual Employee Engagement Survey (EES), emphasizing the dimensions of employee behavior that affect performance, including change agility, alignment, and engagement. The overall engagement index shows a positive score of 75% – 3 percentage points above the chosen global external high-performance benchmark.
Annual Report 2013 27
Bringing our brand to life
Reflecting this culture of engagement, our employees also play a crucial role as ambassadors of our brand. In May 2013 our Employee Brand Jam focused on engaging employees around our new brand promise. They were asked to share, via a dedicated dashboard, their stories about how Philips delivers innovation to them. This campaign won a European Excellence Award in the Internal Communications category.
In the lead-up to brand launch day, 13 November, we invited the world to uncover our redesigned shield through a mosaic launched via social media. Over 14,000 individuals took part in the 48 hours ahead of the reveal. On the day itself, over 60 sites around the world hosted simultaneous events linked to a live feed of the unveiling at our head office in Amsterdam. In this way, a highly engaged workforce was brought together to celebrate a landmark event in thelong history of the company.
Diversity and inclusion
Having an inclusive culture where differences are honored, respected and encouraged andinnovation, we take a diverse workforce that mirrors the markets we’re active in, enables ussystematic approach to deliver innovation that matters to our customers and consumers and thus to create value for Philips and its stakeholders. Our new Diversity & Inclusion Policy defines our global standards and the role all employees need to play to create a diverse and inclusive workplace.

28 Annual Report 2013

In 2011, Philips embarked on a comprehensive program to significantly increase the efficiency of its overhead structure: those activities which take place mainly above the level of operational businesses and market organizations. Since then, real progress has been made – with more work to be done over the coming years.
The Accelerate! productivity program looked first to benchmarks – to what was currently industry best-in-class – and subsequently leveraged this insight to re-engineer the company’s overhead activities such as IT, Finance, Human Resources and Real Estate. The objective was to deliver improved service levels to internal customers in a faster, simpler, easier-to-experience way – at lower cost.
The focus of the program was on the operating model – how the function was set up to deliver its services. These ‘smarter functions’ looked to pool services into Centers of Expertise which then provide high-quality, 24/7 support to a wide range of businesses and geographies from a single hub. Equally impactful was the increased use of ‘output-based delivery’, swapping contract workers brought into Philips to support initiatives for clear output-based contracts with the 3rd-party suppliers. Last, but by no means least, was the reduction in managerial layers and subsequent increase in span of control of individual managers; this has led to less bureaucracy and faster decision making across the company.
Finance is a good example. Traditionally, finance professionals were spread widely across Philips, each supporting business management in everything from basic bookkeeping to analysis of upcoming Asian competition. As of 2013, we have re-engineered the operating model of our Finance activity, pooling knowledge into efficient, dedicated Centers of Expertise – one focused on fundamental bookkeeping and internal control, another on financial planning and analysis of business performance, yet another on expert company-wide advice on specific topics ranging from foreign exchange to pensions. This has led to a simpler, leaner, more effective operating model which, critically, is able to deliver faster, better services to its internal customers. Similar transformations in the other functions – and indeed more broadly in business management – have, collectively, allowed us to substantially improve the efficiency and effectiveness of our overhead structure and – in the process – report a gross cost reduction of over EUR 1 billion through the end of 2013.
Annual Report 2013 29
3. Fast facts
Our 2013 results
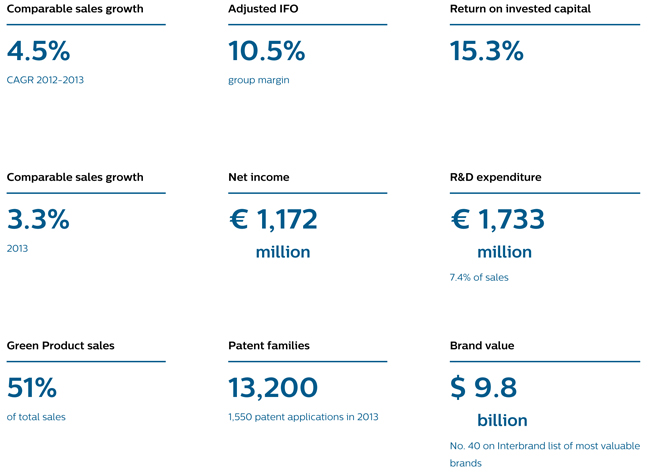
30 Annual Report 2013
4. Next phase
The journey continues
First milestone passed
Accelerate! is working and driving our transformation. We are pleased to have achieved the first major milestone on our Accelerate! journey – our mid-term 2013 financial targets. However, we still have a way to go before we have delivered Philips’ full potential.
New targets on Path to Value
That’s why we have set ourselves challenging new targets, to be realized by the end of 2016. These indicate the value we create, as measured by sales growth, profitability and our use of capital:
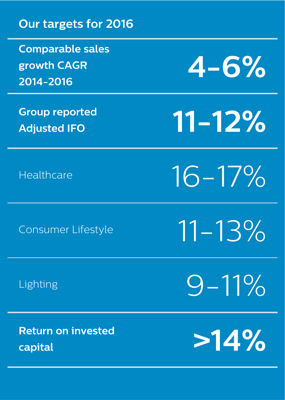
Annual Report 2013 31

1. Our rich heritage
A born innovator
Philips was founded in Eindhoven, Netherlands, in 1891 by Frederik and Gerard Philips – later joined by Gerard’s brother Anton – to “manufacture incandescent lamps and other electrical products”. For the 120-plus years since then, we have been improving people’s lives with a steady flow of ground-breaking innovations.
Today, we are building upon this rich heritage as we touch billions of lives each year with our innovative healthcare and lighting solutions and our personal health and well-being products.
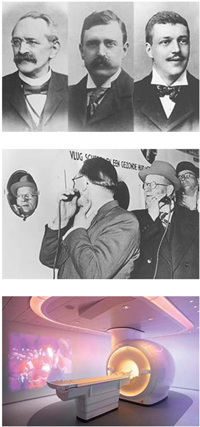
2. Our vision
Whatweaspireto
At Philips, we strive to make the world healthier and more sustainable through innovation.
Our goal is to improve the lives of 3 billion people a year by 2025.
We will be the best place to work for people who share our passion.
Together we will deliver superior value for our customers and shareholders.
Annual Report 2013 33
3. Market opportunities
Responding to global challenges
With our understanding of many of the longer-term challenges our world faces, we see major opportunities to apply our innovative competencies and create value for our stakeholders.

34 Annual Report 2013

4. Our business system
Ensuring success is repeatable
The Philips Business System is the way we run our company to deliver on our mission and vision. It is designed to ensure that success is repeatable, i.e. that we create value for our stakeholders time after time.
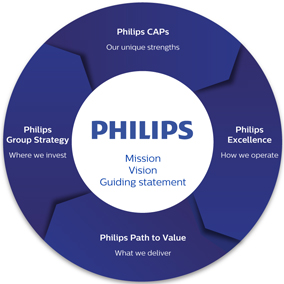
Group Strategy: We manage our portfolio with clearly defined strategies and allocate resources to maximize value creation.
CAPs: We strengthen and leverage our core Capabilities, Assets and Positions as they create differential value: deep customer insight, technology innovation, our brand, global footprint, and our people.
Excellence: We are a learning organization that applies common operating principles Our starting point is always to deliver Philips Excellence.
Path to Value: We define and execute business plans that deliver sustainable results along a credible Path to Value.
5. Our people
Engaged employees crucial for success
We need all our people collaborating effectively – in a diverse and inclusive environment, where they can grow and fulfill their ambitions. Engagement supports our culture of growth and performance improvement, reinforcing our goal of beingunderstand the best place to work for people who share our passion.
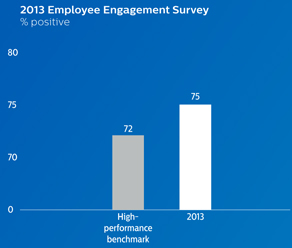
36 Annual Report 2013
Global presence
Find out more about the scale and location of our activities throughout the world.
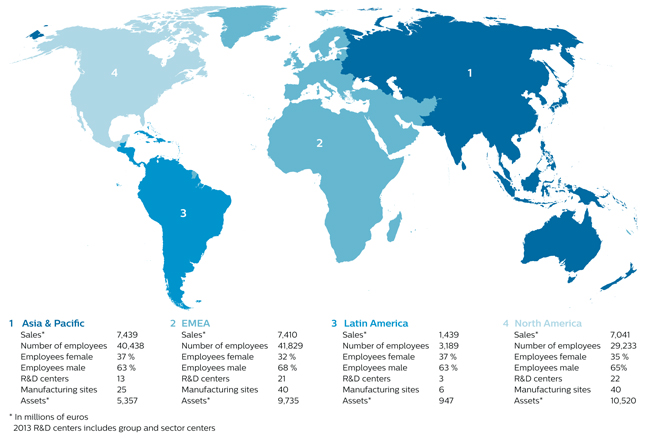
Annual Report 2013 37

1. Knowing our customers
Who do we mean by ‘you’?
Philips delivers innovation that matters to you.
But just who is ‘you’? And what matters to you? To get ever closer to our customers, these are questions we ask every day.
With our global presence – we have customer-facing staff in over 100 countries – and our trusted brand, we are uniquely placed to capture local customer insights.
By understanding thespecific challenges local people face – whether they be a doctor, a real estate developer, a hospital director, a city planner, a doctor or a consumer, – we ensure that their actual needs and aspirations drive our innovation efforts. So we can deliver what really matters to them.etc.

Annual Report 2013 39
2. Understanding people’s needs
What matters to you?

40 Annual Report 2013

Annual Report 2013 41
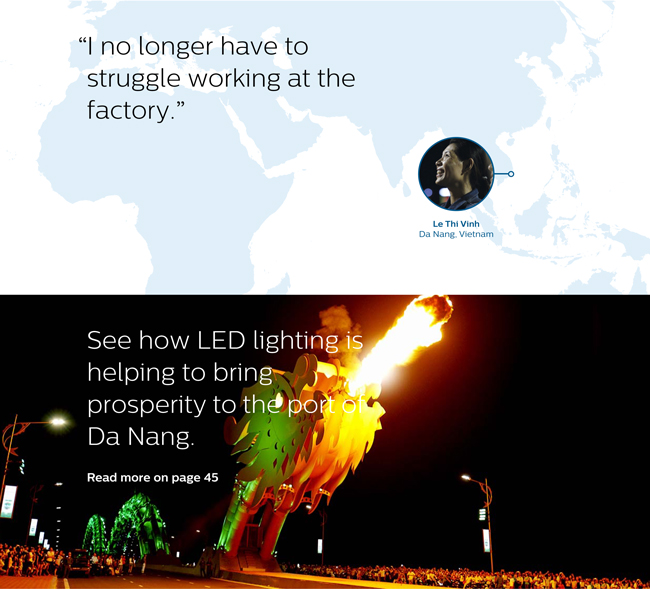
42 Annual Report 2013

Ralph and Helen McCurdy, a loving husband and wife who can live together at home and receive high-quality health care, thanks to an innovative and efficient telemedicine program from Philips and Banner Health.
“Without communication, Ralph and I could have never survived the 64 years. To be able to talk to a doctor on a video and we don’t have to wait two or three days for a doctor appointment, it’s fabulous.”
Helen McCurdy


This is the future. It’s really an amazing model of care that doesn’t exist anywhere else… yet. When I have a team of people, augmented by a lot of Philips technology, I can catch things earlier, treat things earlier, and intervene in a way that allows me to accomplish what I set out to do as a geriatrician, and ultimately to do some good inHaving gained these patient’s lives.”
Edward Perrin, MD
Geriatric Care Specialist & Medical Director
Banner Hospice
Annual Report 2013 43

The Philips Airfryer lets Dable Kwan prepare spring rolls and other delicious fried foods with much less oil. Who knew innovation could be so good for you, and taste so good too?
“My name is Dable and I live in Hong Kong. I’m a housewife and I love to cook. I really started to cook seriously about 10 years ago.
My husband loves fried food. Back then I would tell him, ‘No, there’s too much oil and grease, and it’s not good for your health.’ But since getting the Philips Airfryer, ah, what a happy man.”


“It really makes cooking much easier, much healthier, and much more fun. Now, I’m using less oil, less salt, less everything else. We just had our check-ups and our cholesterol, blood sugar and everything else are at very healthy levels.”
44 Annual Report 2013

The port of Da Nang has grown in prosperity since Philips LEDs began lighting up the Dragon Bridge. See how the lives of fisherman Le Van Khe and his daughter Le Thi Vinh are improving.
“The lights make the structure more vibrant and interesting for people who come to marvel at it… The bridge has been central to our overall growth. This year we’re hoping to receive around 3 million tourists.”
Tran Chi Cuong
Deputy Director
Danang Department of Culture, Sports and Tourism

“I have my own sugarcane juice cart near the Dragon Bridge. When the bridge opened I saw a lot of tourists arrive and figured that selling sugarcane to them would be better than working at the factory. My father is very happy that I no longer have to struggle working at the factory.

On a Saturday and Sunday it’s so much fun to see the show. The bridge is very important to my family and me. My life lit up because the bridge lit up. It has changed our lives for the better.”
Le Thi Vinh
Annual Report 2013 45
3. Behind the scenes
How we innovate for you
Armed with deep insights, into local customer needs, we then bring togetherapply our R&Dinnovative competencies, strong brand, global footprint and design expertise and our local business-creation capabilities to address these needs.
The locally relevant solutions we developtalented, engaged people – often in collaboration withvalue-adding partnerships – to deliver solutions that meet these needs. Making the world healthier and more sustainable.
To measure the impact our customers – do not always involve ‘new technology’. Instead, they may mean a new application or a unique customer proposition brought about by an innovative partnership.
Discover overleaf how we applied our innovation and design capability to help women breastfeed for longer.
46 Annual Report 2013

Almost 25% of mothers stop breastfeeding within the first three months because it becomes too painful. A further 40% stop because of a decreased milk supply. Discover how the Philips AVENT Natural range addresses these problems.
Using a breast pump to express milk can make it easier for mothers to continue breastfeeding. People researchers at Philips discovered that moms thought pumps were too cold and mechanical, and forced them to lean forward to make sure the milk flows down into the bottle.
Around the same time, a clinical study by Philips confirmed that comfort is physiologically essential to helping mothers produce lots of milk. Pain, stress or discomfort hampers the release of oxytocin, the hormone responsible for triggering milk production.
Philips AVENT Comfort breast pump
Therefore we took comfort as the starting point of the design and reshaped the pump to make it possible for moms to sit back in a more relaxing position to express milk. Using ultrasound and MRI scanners, we studied how babies actually suckle. To mimic that, we added five oval petals that gently massage the areassolutions are having around the nipple to stimulate more milk. We changed the texture of the cushioned silicone funnel that cups the breast, giving it a silky feel that is warm and gentle against the skin.
Philips AVENT Natural bottle
We used the same insights to create a new baby bottle, designed to tackle two things: teat acceptance (also known as ‘latch on’) and colic. When babies suckle at the breast, they cause the nipple to elongate in a rhythmic way, soworld, we created a teat to stretch in the same way. To create a more natural breast-like shape, the designers made the teat much wider at the base. And to prevent babies swallowing too much air when they are feeding, we added an ‘anti-colic’ twin-valve system that allows air to vent into the bottle rather than the baby’s stomach.
Both the bottle and the breast pump have received several awards for outstanding design.
Annual Report 2013 47
developed our independently verified Lives improved
Improved model. We take a two-dimensional approach –social– social and ecological – to improving people’s lives. Products and solutions that directly support the curative (care) or preventive (well-being) side of people’s health, determine the contribution to the social dimension.
The contribution to the ecological dimension is determined by means of our Green productProduct portfolio, such as our energy-efficient lighting.
Our business system
With its four interlocking elements, the Philips Business System (PBS) is designed to help us deliver on our mission and vision – and to ensure that success is repeatable. As we execute our strategy and invest in the best opportunities, leverage our unique strengths and become operationally excellent, we will be able to consistently deliver value to our customers, consumers and other stakeholders.
Group strategy: We manage our portfolio with clearly defined strategies and allocate resources to maximize value creation.
CAPs: We strengthen and leverage our core Capabilities, Assets and Positions – our deep customer insights, technological innovation, global footprint, our people, and the trusted Philips brand – as they create differential value.
Excellence: We are a learning organization that applies common operating principles and practices to deliver to our customers with excellence.
Path to Value:We define and execute business plans that deliver sustainable results along a credible Path to Value.
The ‘Creating value for our stakeholders’ diagram, based on the International Integrated Reporting Council framework, shows how – with the Philips Business System at the heart of our endeavors – we use six different forms of capital to drive value in the short, medium and long term.
22 Annual Report 2015
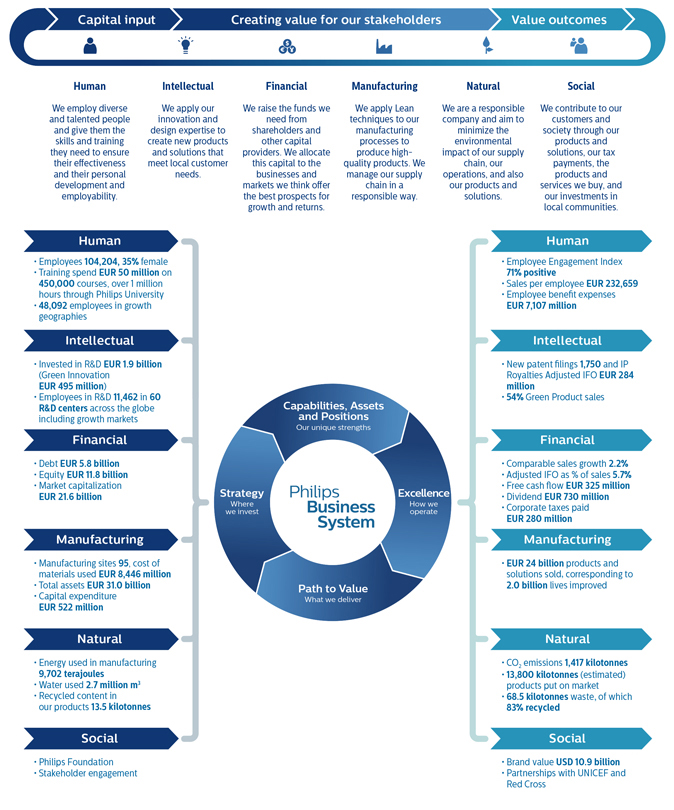
Our strategic focus 4.2
4.3 Accelerate! journey continues
In 2011 we set out on our Accelerate! journey of change and performance improvement. Designed to transform Philips into an agile and entrepreneurial company, Accelerate! is all about delivering meaningful innovation to our customers in local markets – and doing so in a fast and efficient way.
The program has three main thrusts:
| • | | transform to address underperformance |
| • | | expand global leadership positions |
| • | | initiate new growth engines |
We are now in the fifth year of this transformation process, and our Path to Value is clearly mapped out:
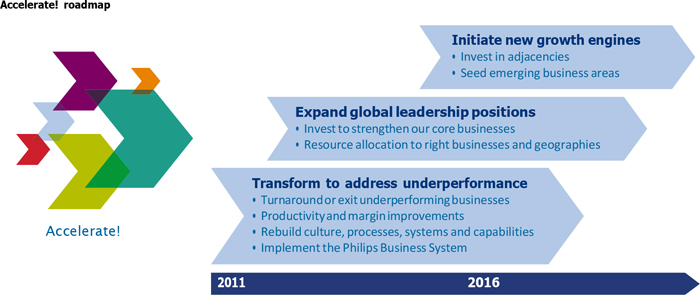
For additional information, please visit2016, we continue to expect modest comparable sales growth and we will build on our 2015 operational performance improvement. Taking into account ongoing macro-economic headwinds and the phasing of costs and sales, we expect improvements in the year to be back-end loaded.
24 Annual Report 2015
Our strategic focus 4.4
www.philips.com/sustainability.4.4 Lives improved
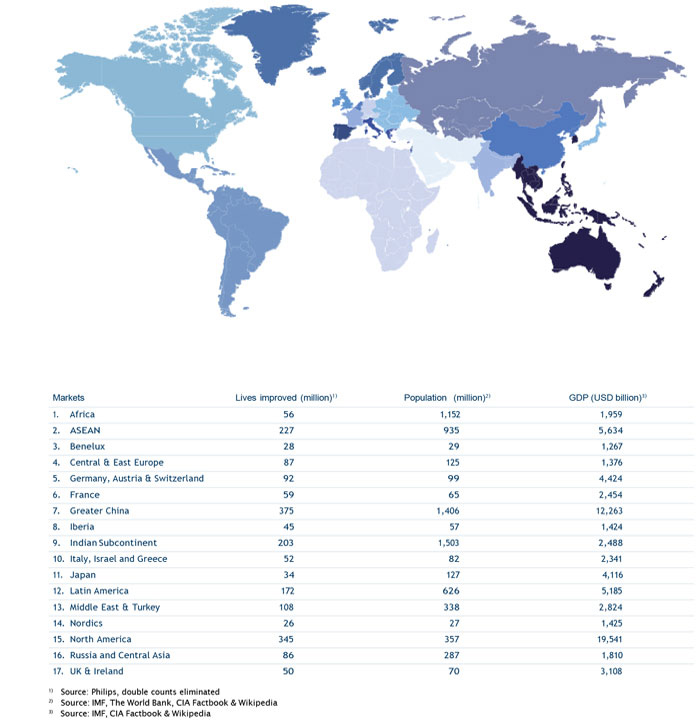
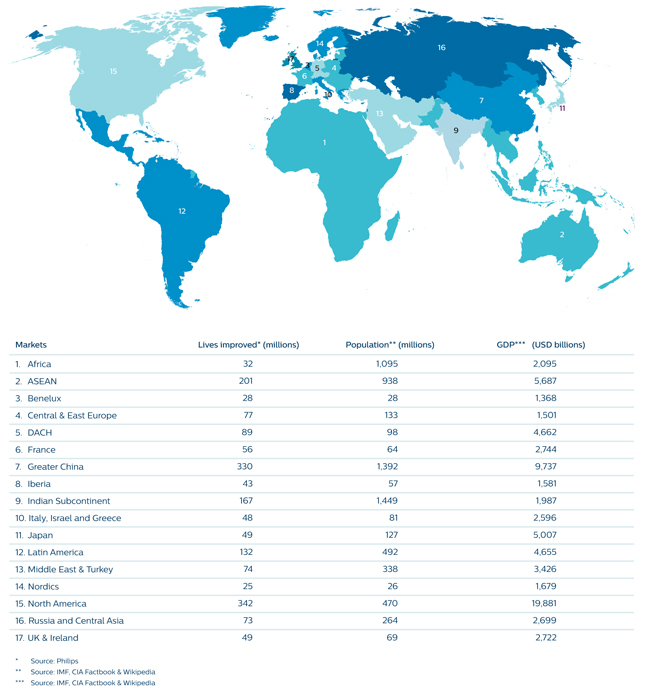
| | | | | | | | | | | | | | | | | | | | | | | | | | | | |
| Regions | | Sales in millions of EUR | | | Number of employees | | | Employees female | | | Employees male | | | R&D centers | | | Manufacturing sites | | | Tangible and intangible assets in millions of EUR | |
Asia & Pacific | | | 6,990 | | | | 32,533 | | | | 32 | % | | | 68 | % | | | 9 | | | | 20 | | | | 2,023 | |
EMEA | | | 7,948 | | | | 39,903 | | | | 34 | % | | | 66 | % | | | 28 | | | | 35 | | | | 2,959 | |
Latin America | | | 1,211 | | | | 8,154 | | | | 46 | % | | | 54 | % | | | 3 | | | | 11 | | | | 136 | |
North America | | | 8,095 | | | | 23,614 | | | | 36 | % | | | 64 | % | | | 20 | | | | 29 | | | | 9,420 | |
Annual Report 2015 25
Our strategic focus 4.6
484.6 Our strategy in action

Training tomorrow’s lifesavers
At Philips, we build relationships to ensure that our products and solutions are addressing people’s needs in the right way. And that means supplying help as well as hardware.
In a technologically advanced world, it’s no good simply investing in pioneering products such as high-tech radiology devices, MRI scanners and other medical imaging tools: doctors need to know how to use them to improve patient care. Which is where Philips comes in, not only providing the technology, but expert developmental medical training too, by partnering with key stakeholders.
At the American University of Beirut, students and professionals from all over the Middle East join colleagues from Lebanon – along with private companies such as Philips – to develop essential lifesaving skills that they can take back to their home countries, and to learn how they can make a difference through digital innovations. The medical training is a collaboration that not only teaches new skills, but is spreading the finest medical care through some of the world’s most vulnerable populations.

26 Annual Report 20132015
4 Group performance 4 - 4Our strategic focus 4.6
4 Group performance


“2013 wasIn Africa, we are partnering with local governments to develop Community Life Centers with the aim of not only improving primary healthcare but also promoting community development.
In most countries in Sub-Saharan Africa, healthcare systems are having to contend with serious challenges. Primary health facilities in particular are facing difficulties in offering quality basic services to local communities and playing the role of gatekeeper to the rest of the healthcare system.
At Philips we believe that the strengthening of health systems has to start at the primary level. That’s why, in partnership with local government, we have installed a significant step forward onCommunity Life Center at Langata in Kiambu County, Kenya. Community Life Centers are a total solution for primary healthcare facilities, combining an integrated set of appropriate technologies with design, implementation and support services.
Since the opening of the Langata Community Life Center the number of children treated has doubled and Ante Natal Care visits have increased 12-fold, supporting our Pathcommitment to Value. Despite stronger headwinds than initially anticipated, we succeeded in achieving our mid-term 2013 financial targets. We delivered a compound annual growth rate for comparable sales over the period 2012-2013 of 4.5%, compared to our target of 4-6%. We achieved a reported Adjusted IFO of 10.5% of sales, within our target bandwidth of 10-12%. And our return on invested capital reached 15.3% at year-end, above the targeted range of 12-14%.”UN’s ‘Every Woman, Every Child’ initiative.
Ron Wirahadiraksa, CFO

Annual Report 2013 492015 27
4 Our strategic focus 4.6

Change your health for life
In 2015, Philips announced the first in a series of personal health programs – including connected health measurement devices, app-based personalized programs and cloud-based data analysis – to help consumers take greater control of their health.
Philips personal health programs represent a new era in connected care for consumers, patients and health providers, as healthcare continues to move outside the hospital, and into our homes and everyday lives. They are built on the Philips HealthSuite digital platform, an open and secure, cloud-based platform that collects and analyzes health and other data from multiple devices and sources.

“Consumers are increasingly engaged in their personal health and they want solutions that empower them to stay healthy and prevent illness,” says Pieter Nota (CEO Philips Consumer Lifestyle in 2015). “Philips personal health programs will help consumers develop healthier habits for life.”
Leveraging Philips’ deep healthcare and consumer expertise, the personal health programs enable individuals to measure vital signs to understand how lifestyle choices affect their body, to set goals and monitor their progress, and to stay motivated with intelligent programs, developed with leading doctors and psychologists, that respond to individual progress and make personalized recommendations.
The Philips personal health programs and health measurement devices are not currently available for sale in the USA.
28 Annual Report 2015
Our strategic focus 4.6

Offering new parents peace of mind
We believe that every baby deserves the best possible start in life. With the Philips Avent uGrow digital platform, parents can track progress, relish milestones and learn about their baby’s development and needs.
Philips Avent uGrow is an innovative digital parenting platform in the form of a mobile application, plus connected digital products, which provides new parents with personalized advice and insights to help them understand and support each stage of their baby’s development.
Based on professional guidance and pertinent localized content, and with a timeline that incorporates data ranging from how much baby has eaten to sleep patterns, uGrow gives new parents peace of mind in their baby’s development. Interactive photos and virtual stickers can be used to mark occasions and celebrate milestones on baby’s timeline. And the app remembers key dates in order to provide bespoke guidance, e.g. on baby’s developing weight, or on weaning as baby grows.
“Being a parent is a life-changing experience, during which we often rely on our intuition,” says Aliette van der Wal, Business Leader Mother & Childcare, Health & Wellness. “At Philips Avent we’re harnessing the power of connected technology to empower parents with additional information, tailored to individual needs, which will help them make the best decisions for their baby.”
Annual Report 2015 29
Our strategic focus 4.6

Connected lighting delivering value beyond illumination
With Philips CityTouch, Los Angeles remotely manages more than 100,000 street lights to create a more livable city.
In 2015, Los Angeles became the first city in the world to control its street lighting through an advanced Philips management system that uses mobile and cloud-based technologies.
With Philips CityTouch, the LA Bureau of Street Lighting can remotely control street lighting fixtures, as well as monitor energy use and the status of each light. Using mobile chip technology embedded into each fixture, the street lights are able to identify themselves and network instantly.
This smart plug-and-play approach not only reduces the cost of programming each fixture, it also reduces the time required for commissioning from days to minutes and eliminates on-site commissioning completely. Furthermore, CityTouch offers system managers a real-time, map-based view of all connected light points via any standard web browser.

“I call it priceless,” says Ed Ebrahimian, Director of the LA Bureau of Street Lighting, “because if we can save one life by finding out if a light is out and fixing it right away, we’ve done our job.”
30 Annual Report 2015
Our strategic focus 4.6

Creating a sustainable office environment
Opened in 2015, innovative office building The Edge in Amsterdam received the highest-ever BREEAM score – the leading assessment method for sustainable buildings. A key aspect of the design is a connected lighting system from Philips.
The Edge’s connected lighting system uses nearly 6,500 LED luminaires over the building’s 15 stories. These fixtures are connected to the building’s IT network by Power over Ethernet (PoE) technology. With PoE, Ethernet cables transmit both power and data, eliminating the need for separate power cabling and creating a sort of ‘information pathway’.
With integrated sensors in 3,000 of these luminaires, the connected lighting system captures anonymous data on room occupancy. The LED fixtures interface with other building systems such as heating and ventilation to provide facility managers with an integrated view of a building’s occupancy patterns and energy usage. This enables more informed decision making, with unprecedented levels of energy and operational efficiency.
Supporting workplace productivity, employees at The Edge are also able to set the lighting and temperature to suit their personal preferences via an app on their smartphone.

Annual Report 2015 31
Our strategic focus 4.6
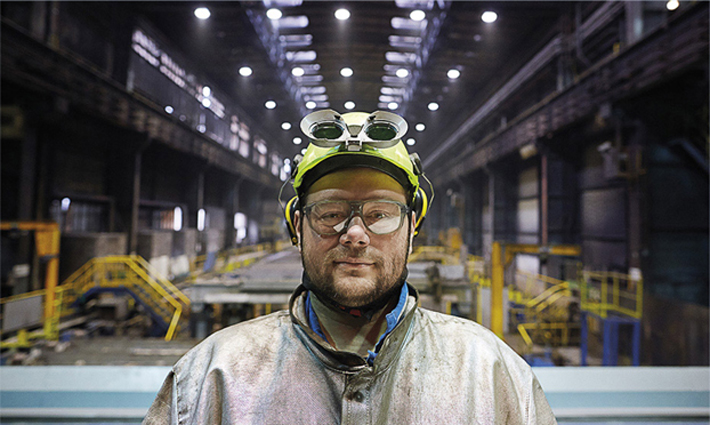
Lighting the steel heart
Innovative lighting can help improve health and safety at work. Nowhere is this more apparent than in Ostrava, where Philips has helped to transform ArcelorMittal’s steel plant with a new lighting system.
A steel plant can be a hazardous workplace. When employees work with molten steel, with loads exceeding 350 tons in weight and temperatures exceeding 1,500 degrees, it is important to have good lighting. At its steel plant in Ostrava, the steel heart of the Czech Republic, ArcelorMittal needed a lighting partner who understood their needs, could offer a suitable solution, and, of course, deliver that solution with a minimum of disruption.
With the steel plant in full operation, Philips implemented a complete modernization of the lighting. It was a complex project but ArcelorMittal and Philips worked closely together for the duration of the renovation. “There has been a substantial improvement in health, safety, as well as productivity and energy benefits,” says Anoop Nair, Chief Operating Officer, ArcelorMittal, Ostrava. “This gave kind of an explosive or meteoric effect to the employees. And I think it was thanks to Philips.”
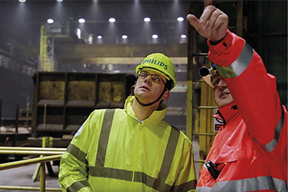
32 Annual Report 2015
Group performance 4.1 - 4.15
4.15 Group performance

“2015 saw Philips returning to growth and improving profitability in challenging macro-economic conditions as our Accelerate! program continued to deliver results.” Abhijit Bhattacharya, CFO Royal Philips
5.1 Financial performance
Prior-period financial statements have been restated for the treatment of Audio, Video, Multimedia and Accessories as discontinued operations (see note 7, Discontinued operations and other assets classified as held for sale) and the adoption of IAS 19R, which mainly relates to accounting for pensions (see note 30, Post-employment benefits).
Management summary
The year 2015
Comparable sales rose 4.5% in our HealthTech portfolio, which combines our Healthcare and Consumer Lifestyle businesses. This illustrates the progress we are making in capturing opportunities in this large and growing market. Overall, comparable sales for the Group increased by 2% to EUR 24.2 billion.
Our Healthcare business recorded 4% growth. More significantly, our order intake was up 5% for the year. This performance was supported by strong growth in North America and Western Europe – and a substantial rebound in China in Q4.
Our Consumer Lifestyle business achieved a comparable sales increase of 6% year-on-year, driven by double-digit growth at Health & Wellness and high-single-digit growth at Personal Care.
Lighting recorded another year of operational improvements, resulting in a substantial increase in profitability. We strongly improved the performance of our LED business, which grew by 25% on a comparable basis and significantly improved profitability. On a full-year basis LED now accounts for 43% of total Lighting sales. In the conventional lamps business we continued to gain market share in a declining market and improved profitability combined with a solid cash flow. The expected decline in conventional lighting led to a comparable sales decrease of 3% for our Lighting business overall.
In line with our mission to improve people’s lives, we have embedded sustainability at the heart of our business processes, and Green Product sales increased to 54% of total revenues in 2015. In recognition of our sustainability achievements, Philips was named industry leader in the Industrial Conglomerates category in the 2015 Dow Jones Sustainability Index.
Annual Report 2015 33
Group performance 5.1
Adjusted IFO totaled EUR 1.4 billion, compared to EUR 821 million a year earlier. Our three cost savings programs all delivered ahead of plan in 2015. We achieved EUR 290 million of gross savings in overhead costs, EUR 379 million of gross savings in procurement, and our End2End process improvement program delivered productivity savings of EUR 187 million.
Net income amounted to EUR 659 million, a 60% increase from EUR 411 million in 2014.
Free cash flow amounted to EUR 325 million in 2015, which was EUR 172 million lower than in 2014, mainly due to CRT litigation claims, higher outflows related to pension de-risking settlements, and net capital expenditures, partly offset by higher earnings.
By the end of the year we had also completed 74% of the EUR 1.5 billion- share buy-back program.
Philips Group
Key data
in millions of eurosEUR unless otherwise stated
2013 - 2015
| | | | 2011 | | 2012 | | 2013 | | | | | |
| | | | 2013 | | 2014 | | 2015 | |
| | | | | |
Condensed statement of income | | | | | | | |
Sales | | | 20,992 | | | | 23,457 | | | | 23,329 | | | | 21,990 | | | | 21,391 | | | | 24,244 | |
Adjusted IFO1) | | | 1,435 | | | | 1,106 | | | | 2,451 | | | | 2,276 | | | | 821 | | | | 1,372 | |
as a % of sales | | | 6.8 | | | | 4.7 | | | | 10.5 | | | | 10.4 | % | | | 3.8 | % | | | 5.7 | % |
IFO | | | (479 | ) | | | 648 | | | | 1,991 | | | | 1,855 | | | | 486 | | | | 992 | |
as a % of sales | | | (2.3 | ) | | | 2.8 | | | | 8.5 | | | | 8.4 | % | | | 2.3 | % | | | 4.1 | % |
Financial income and expenses | | | (331 | ) | | | (329 | ) | | | (330 | ) | | | (330 | ) | | | (301 | ) | | | (369 | ) |
Income tax expense | | | (251 | ) | | | (185 | ) | | | (466 | ) | | | (466 | ) | | | (26 | ) | | | (239 | ) |
Results of investments in associates | | | 15 | | | | (211 | ) | | | (25 | ) | | | (25 | ) | | | 62 | | | | 30 | |
| | | | | | | | |
Income (loss) from continuing operations | | | (1,046 | ) | | | (77 | ) | | | 1,170 | | |
Income (loss) from discontinued operations - net of income tax | | | (410 | ) | | | 47 | | | | 2 | | |
Income from continuing operations | | | | 1,034 | | | | 221 | | | | 414 | |
Income from discontinued operations - net of income tax | | | | 138 | | | | 190 | | | | 245 | |
| | | | | | | | |
Net income (loss) | | | (1,456 | ) | | | (30 | ) | | | 1,172 | | |
Net income | | | | 1,172 | | | | 411 | | | | 659 | |
| Net income attributable to shareholders per common share in euros: | | | | | | | |
—basic | | | (1.53 | ) | | | (0.04 | ) | | | 1.28 | | |
—diluted | | | (1.53 | ) | | | (0.04 | ) | | | 1.27 | | |
Other indicators | | | | | | | |
Net income attributable to shareholders per common share in EUR: | | | | | | | |
basic | | | | 1.28 | | | | 0.45 | | | | 0.70 | |
diluted | | | | 1.27 | | | | 0.45 | | | | 0.70 | |
Net operating capital (NOC)1) | | | | 10,238 | | | | 8,838 | | | | 11,096 | |
Free cash flow1) | | | | 82 | | | | 497 | | | | 325 | |
Employees (FTEs) | | | | 116,082 | | | | 113,678 | | | | 112,959 | |
continuing operations | | | | 105,637 | | | | 105,365 | | | | 104,204 | |
discontinued operations | | | | 10,445 | | | | 8,313 | | | | 8,755 | |
| | | | | |
Net operating capital (NOC)1) | | | 10,382 | | | | 9,316 | | | | 10,238 | | |
Cash flows before financing activities1) | | | (515 | ) | | | 1,157 | | | | 141 | | |
Employees (FTEs) | | | 125,240 | | | | 118,087 | | | | 116,681 | | |
of which discontinued operations | | | 5,645 | | | | 2,005 | | | | 1,992 | | |
| 1) | For a reconciliation to the most directly comparable GAAP measures, see chapter 14,15, Reconciliation of non-GAAP information, of this report |
The year 20132014
In 20132014, we continued to make good progressimprove operational performance in a challenging economic environment, particularlymost businesses, yet saw significant headwinds - ranging from geo-political crises and exchange rate fluctuations, to legal matters and the voluntary suspension of production at the Cleveland facility. In 2014, the voluntary suspension of production at our Cleveland facility and the jury verdict in the United StatesMasimo litigation strongly impacted our 2014 performance.
At our Healthcare facility in Cleveland, Ohio, certain issues in the general area of manufacturing process controls were identified during an ongoing US Food and Western Europe. We recorded 3% comparableDrug Administration (FDA) inspection. To address these issues, on January 10, 2014 we started a voluntary, temporary suspension of new production at the facility, primarily to strengthen manufacturing process controls. The suspension negatively impacted Healthcare’s sales growth (1% nominal decline)and Adjusted IFO in 2014.
On October 3, 2014 Philips announced that it is appealing the jury verdict in the patent infringement lawsuit by Masimo Corporation (Masimo), within which Masimo was awarded compensation of USD 467 million (EUR 366 million). The jury verdict is part of extensive litigation, which started in 2009, between Masimo and Philips involving several claims and counterclaims related to a strong contribution from growth geographies. The profitability improved substantially, with all sectors delivering solid earnings. large number of patents.
Net income for the year amounted to EUR 1,172411 million, mainly drivenas lower operational earnings were partly offset by strong operational performance, including significant gross margin improvementlower income tax expense and productivity gains cominghigher results from the Accelerate! program.investments in associates and discontinued operations.
Sales amounted to EUR 23.3 billion,21,391 million, a 1%3% nominal decline for the year. Excluding unfavorable currency effects, comparable sales were 3% above 2012, driven1% below the level of 2013, due to Healthcare and Lighting. Healthcare comparable sales declined by all three operating sectors. Healthcare sales grew 1%2%, mainly driven by Customer Services.due to Imaging Systems. Lighting comparable sales were 3% above 2012, driven by Lumiledsbelow the level of 2013, as declines at Light Sources & Electronics and Automotive, partlyConsumer Luminaires were tempered by agrowth at Professional Lighting Solutions. Comparable sales decline at Consumer Luminaires. Sales at Consumer Lifestyle were 10%6% above 2012, withthe level of 2013, mainly driven by double-digit growth at Domestic Appliances and high-single-digit growth at Personal Care and Health & Wellness.
OurComparable sales in growth geographies achieved 11% comparable growth,were in line with 2013, while mature geographies declined by 1%, as a result of the overall macroeconomic developments, including the continued weakness of the Western European markets and the continued economic uncertainty in North America.developments. In 2013,2014, growth geographies accounted for 36%35% of total sales, compared to 34% in 2012.sales.
In 2014, IFO amounted to EUR 1,991486 million, or 8.5%2.3% of sales, compared to EUR 6481,855 million, or 2.8%8.4% of sales, in 2012.2013. IFO improvement was seendeclines at all sectors, but was mainly driven byHealthcare, Lighting and Healthcare.IG&S were partly offset by an improvement at Consumer Lifestyle.
In 2013 weOperating activities generated cash flows of EUR 1,1381,303 million, of cash flow from operating activities, which was EUR 944391 million lowerhigher than in 2012.2013. The decrease isincrease was mainly a result ofdue to higher cash inflows and working capital reductions in 2014, as well as the payment of the European Commission fine in Q1 2013, increased working capital requirements and the payout of restructuring provisions in 2013. Our cashCash flows before financing activities were EUR 1,016269 million lowerhigher than in 2012, due to a decrease in cash flows from operating activities and proceeds from divestments, partly offset by lower outflows related to acquisitions of new businesses.2013, as an
34 Annual Report 2015
Group performance 5.1.1
| �� | increase in cash flows from operating activities was partly offset by higher outflows related to acquisitions of new businesses. |
In 2013 we completed the execution of our EUR 2 billion share buy-back program, thereby improving the efficiency of our balance sheet, and announced a new EUR 1.5 billion program to be concluded over the next 2-3 years. By the end of the year we2014, Philips had completed 7%41% of thisthe EUR 1.5 billion share buy-back program.
The year 2012
Despite strong economic headwinds, we continued on our steady path of improvement driven by our multi-year change and performance program, Accelerate!. We recorded 6% comparable sales growth (12% nominal growth), with a strong contribution from growth geographies. Healthcare and Consumer Lifestyle delivered solid earnings,
50 Annual Report 2013
4 Group performance 4.1.1 - 4.1.1
| while Lighting gained momentum in its turnaround. Net income for the year amounted to a net loss of EUR 30 million, and was impacted by substantial restructuring charges as well as the European Commission fine related to alleged violation of competition rules in the Cathode-Ray Tube (CRT) industry.
|
Sales amounted to EUR 23.5 billion, a 12% nominal increase for the year. Excluding favorable currency effects and portfolio changes, comparable sales were 6% above 2011, driven by all three operating sectors. Healthcare sales grew 6%, with solid growth in all businesses. Lighting sales were 4% above 2011, with strong growth coming from Light Sources & Electronics, mainly fueled by market demand for LED, and Automotive, partly tempered by a sales decline at Lumileds. Sales at Consumer Lifestyle were 9% above 2011, with double-digit growth at Domestic Appliances and Health & Wellness and mid-single-digit growth at Personal Care.
Our growth geographies achieved 13% comparable growth, while mature geographies grew by a modest 2%, as a result of the overall macroeconomic developments and the continued weakness of the Western European markets, particularly Southern Europe. In 2012, growth geographies accounted for 34% of total sales, compared to 32% in 2011.
IFO amounted to EUR 648 million, or 2.8% of sales, compared to a loss of EUR 479 million, or negative 2.3% of sales, in 2011. Excluding impairment charges of EUR 1,355 million in 2011, significant IFO improvement was seen at Consumer Lifestyle and Healthcare, while Lighting was impacted by charges related to restructuring activities.
In 2012, we completed the divestment of our Television business to TP Vision and extended our partnership in Senseo with Sara Lee. Additionally, we completed the acquisition of Indal, strengthening our position in outdoor lighting.
In 2012 we generated EUR 2,082 million of cash flow from operating activities, which was EUR 1,322 million higher than in 2011. The increase was largely a result of lower working capital requirements and higher cash earnings. Our cash flows before financing activities were EUR 1,672 million above the level of 2011, due to higher cash flow from operating activities, higher proceeds from divestments, and lower outflows related to acquisitions of new businesses.
4.1.15.1.1 Sales
The year 20132015
The composition of sales growth in percentage terms in 2013,2015, compared to 2012,2014, is presented in the table below.
Philips Group
Sales growth composition 2013in %
2015 versus 2012
in %2014
| | | | | | | | | | | | | | | | |
| | | comparable
growth | | | currency
effects | | | consolidation
changes | | | nominal
growth | |
Healthcare | | | 0.8 | | | | (4.6 | ) | | | (0.3 | ) | | | (4.1 | ) |
Consumer Lifestyle | | | 10.0 | | | | (3.4 | ) | | | 0.0 | | | | 6.6 | |
Lighting | | | 3.2 | | | | (3.5 | ) | | | 0.0 | | | | (0.3 | ) |
IG&S1) | | | (2.0 | ) | | | (0.5 | ) | | | 5.7 | | | | 3.2 | |
| | | | |
Philips Group | | | 3.3 | | | | (3.9 | ) | | | 0.1 | | | | (0.5 | ) |
1) | Innovation, Group & Services |
| | | | | | | | | | | | | | | | |
| | | | |
| | | comparable
growth | | | currency
effects | | | consolidation
changes | | | nominal
growth | |
| | | | |
Healthcare | | | 3.8 | | | | 11.7 | | | | 3.3 | | | | 18.8 | |
Consumer Lifestyle | | | 5.8 | | | | 7.2 | | | | 0.0 | | | | 13.0 | |
Lighting | | | (2.8 | ) | | | 8.5 | | | | 2.2 | | | | 7.9 | |
Innovation, Group & Services | | | 5.4 | | | | 1.7 | | | | (12.2 | ) | | | (5.1 | ) |
| | | | |
Philips Group | | | 2.2 | | | | 9.4 | | | | 1.7 | | | | 13.3 | |
| | | | |
Group sales amounted to EUR 23,32924,244 million in 2013,2015, which represents a 1%13% nominal declinegrowth compared to 2012.2014.
AdjustingAdjusted for a 4% negative9% positive currency effect and 2% consolidation impact, comparable sales were 3%2% above 2012. Comparable sales were up 10% at Consumer Lifestyle, while Lighting was 3% higher and Healthcare 1% higher than the previous year.2014.
Healthcare sales amounted to EUR 9,57510,912 million, which was EUR 4081,726 million lowerhigher than in 2012, but 1%2014 or 4% higher on a comparable basis. Higher comparable sales were driven byImaging Systems achieved high-single-digit growth, Healthcare Informatics, Solutions & Services posted mid-single-digit growth, at Customer Services reported low-single-digit growth, while Home Healthcare Solutions and Patient Care & Clinical InformaticsMonitoring Solutions was in line with 2014. From a geographical perspective, comparable sales in growth geographies showed high-single-digit growth, and mature geographies recorded low-single-digit growth. This was partly offset by a mid-single-digit decline at Imaging Systems. Increases in growth geographies were tempered by a decline in North America and Western Europe.
Consumer Lifestyle reported sales of EUR 4,6055,347 million, which was EUR 286616 million higher than in 2012,2014, or 10%6% higher on a comparable basis. WeHealth & Wellness achieved double-digit growth, atPersonal Care reported high-single-digit growth, while Domestic Appliances andwas in line with 2014. From a geographical perspective, growth geographies achieved high-single-digit growth at Health & Wellness and Personal Care.mature geographies registered low-single-digit growth.
Lighting sales amounted to EUR 8,4137,411 million, which was EUR 29542 million lowerhigher than in 2012, but2014 and 3% higherlower on a comparable basis. Growth was largely driven by double-digit growth at Automotive and Lumileds and low-single-digit growth atBoth Light Sources & Electronics. This was tempered byElectronics and Consumer Luminaires recorded a low-single-digitmid-single-digit decline, at Consumer Luminaires. while Professional Lighting Solutions wasremained flat year-on-year.
Annual Report 2013 51
4 Group performance 4.1.2 - 4.1.2
From a geographical perspective, comparable sales showed a mid-single-digit decline in growth geographies and a low-single-digit decline in mature geographies.
IG&S reported sales of EUR 736574 million, which was EUR 2331 million higherlower than in 2012, due to2014. A decline in revenues as a result of the OEM remote controls divestment, was partly offset by higher royalty income.sales from emerging business areas.
The year 20122014
The composition of sales growth in percentage terms in 2012,2014, compared to 2011,2013, is presented in the table below.
Philips Group
Sales growth composition 2012in %
2014 versus 2011
in %2013
| | | | | | |
| | | | | | | | | | comparable
growth | | | currency
effects | | | consolidation
changes | | | nominal
growth | |
| | | comparable
growth | | | currency effects | | | consolidation
changes | | nominal
growth | | | | | |
Healthcare | | | 6.4 | | | | 6.4 | | | | 0.0 | | | | 12.8 | | | | (2.0 | ) | | | (1.6 | ) | | | (0.5 | ) | | | (4.1 | ) |
Consumer Lifestyle | | | 8.7 | | | | 4.4 | | | | 1.4 | | | | 14.5 | | | | 5.8 | | | | (3.1 | ) | | | 0.0 | | | | 2.7 | |
Lighting | | | 3.8 | | | | 4.6 | | | | 2.1 | | | | 10.5 | | | | (2.6 | ) | | | (2.3 | ) | | | 1.0 | | | | (3.9 | ) |
IG&S | | | 0.3 | | | | 1.7 | | | | (4.4 | ) | | | (2.5 | ) | |
Innovation, Group & Services | | | | (11.8 | ) | | | (0.1 | ) | | | 2.9 | | | | (9.0 | ) |
| | | | | | | | |
Philips Group | | | 5.7 | | | | 5.2 | | | | 0.8 | | | | 11.7 | | | | (0.9 | ) | | | (2.0 | ) | | | 0.2 | | | | (2.7 | ) |
| | | | | |
Group sales amounted to EUR 23,45721,391 million in 2012,2014, which represents 12%a 3% nominal growthdecline compared to 2011.2013.
AdjustingAdjusted for a 5% favorable2% negative currency effect and a 1% favorable portfolio effect, comparable sales were 6% above 2011.1% below the level of 2013. Comparable sales were up 9%6% at Consumer Lifestyle, whileLifestyle. Healthcare was 6% higher and Lighting 4% higher than the previous year.saw comparable sales decline by 2% and 3% respectively.
Healthcare sales amounted to EUR 9,9839,186 million, which was EUR 1,131389 million lower than in 2013. Mid-single-digit growth at Customer Services and low-single-digit growth at Patient Care & Monitoring Solutions were offset by a double-digit decline at Imaging Systems. Healthcare Informatics, Solutions & Services sales were in line with 2013. Mature geographies recorded a low-single-digit decline, mainly due to North America and Western Europe. Growth geographies also recorded a low-single-digit decline, with solid growth in Latin America and Middle East & Turkey offset by a double-digit decline in China.
Consumer Lifestyle reported sales of EUR 4,731 million, which was EUR 126 million higher than in 2011,2013, or 6% higher on a comparable basis. High-single-digit comparable sales growth was achieved by Imaging Systems, Home Healthcare Solutions and Patient CareHealth & Clinical Informatics, while Customer Services showed low-single-digit growth
Consumer Lifestyle reported sales of EUR 4,319 million, which was EUR 548 million higher than in 2011, or 9% higher on a comparable basis. WeWellness achieved double-digit growth atand Domestic Appliances high-single-digit growth, while Personal Care recorded low-single-digit growth. Growth geographies achieved high-single-digit growth, driven by strong growth in China, India and HealthMiddle East & Wellness andTurkey. Mature geographies recorded low-single-digit growth, with mid-single-digit growth at Personal Care.in Western Europe and other mature geographies and low-single-digit growth in North America.
Annual Report 2015 35
Group performance 5.1.2
Lighting sales amounted to EUR 8,4426,869 million, which was EUR 804276 million higherlower than in 2011,2013, or 4% higher3% lower on a comparable basis. Growth was largely driven byA high-single-digit growthdecline at AutomotiveConsumer Luminaires and mid-single-digit growthdecline at Light Sources & Electronics. This wasElectronics were tempered by low-single-digit growth at Professional Lighting SolutionsSolutions. A low-single-digit decline was seen in mature geographies, largely due to Western Europe and Consumer Luminaires andNorth America. Growth geographies recorded a salesmid-single-digit decline, at Lumileds.mainly driven by China.
IG&S reported sales of EUR 713605 million, which was EUR 1860 million lower than in 2011,2013, mainly due to the divestment of Assembléon in the prior year.lower royalty income.
4.1.25.1.2 Earnings
The year 20132015
In 2013,2015, Philips’ gross margin was EUR 9,6889,856 million, or 41.5%40.7% of sales, compared to EUR 8,9918,206 million, or 38.3%38.4% of sales, in 2012.2014. Gross margin in 20132015 included EUR 52176 million of restructuring and acquisition-related charges, whereas 20122014 included EUR 289249 million of restructuring and acquisition-related charges. Higher2015 also included charges of EUR 35 million related to the devaluation of the Argentine peso, a EUR 28 million currency revaluation of the provision for the Masimo litigation and EUR 3 million related to the separation of the Lighting business. Gross margin in 2014 included charges of EUR 366 million related to the provision for the Masimo litigation, EUR 68 million of impairment and other charges related to industrial assets at Lighting, EUR 46 million of mainly inventory write-downs related to the voluntary suspension of production at the Cleveland facility, and a past-service pension cost gain of EUR 17 million. Excluding these items, gross margin percentages were seenas a % of sales was broadly in all sectors.line with 2014.
Selling expenses decreasedincreased from EUR 5,3345,124 million in 20122014 to EUR 5,0755,815 million in 2013. 20132015. Selling expenses as a % of total sales remained in line with 2014 at 24.0%. 2015 included EUR 4562 million of restructuring and acquisition-related charges, compared to EUR 184128 million of restructuring charges in 2012.2014. Selling expenses in 2015 included charges of EUR 31 million related to a legal provision and EUR 69 million related to the separation of the Lighting business, while 2014 included a past-service pension cost gain of EUR 20 million. Excluding these items, selling expenses as a % of sales were in line with 2014.
Research and development costs increased from EUR 1,635 million in 2014 to EUR 1,927 million in 2015. Research and development costs in 2015 included EUR 16 million of restructuring and acquisition-related charges, compared to EUR 34 million in 2014. Research and development costs 2014 also included a past-service pension gain of EUR 22 million and charges of EUR 3 million of mainly write-downs related to the voluntary suspension of production at the Cleveland facility. The year-on-year decreaseincrease was mainly attributabledue to lower restructuring activitiescurrency impact and overhead reductions in our commercial organizations. In relation to sales, selling expenses decreased from 22.7% to 21.8%. Selling expenses ashigher spend at Healthcare and IG&S. As a percentage of sales, were lowerresearch and development costs increased from 7.6% in all sectors.2014 to 7.9% in 2015.
General and administrative expenses amounted to EUR 9491,209 million, or 5.0% of sales, in 2013,2015, compared to EUR 845747 million, in 2012. As a percentageor 3.5% of sales, costs increased from 3.6% in 2012 to 4.1%. 20132014. 2015 included EUR 530 million of restructuring and acquisition related-charges, compared to EUR 3123 million in 2012. The 2012 figure2014. 2015 also included acharges of EUR 25345 million mainly related to settlements for pension de-risking and EUR 111 million related to the separation of the Lighting business, while 2014 included a past-service pension cost gain from a change in a medical retiree plan, while 2013 included a pension settlement loss of EUR 318 million.
Research and development costs decreased from EUR 1,831 million in 2012 to EUR 1,733 million in 2013. Research and development costs in 2013 included EUR 15 million of restructuring and acquisition-related charges, compared to EUR 57 million in 2012. The Excluding these items, the year-on-year decrease was largely attributable to lower restructuring charges and currency effects. As a percentage of sales, research and development costs decreased from 7.8%driven by reductions in 2012 to 7.4% in 2013.all operating sectors.
The overview below shows sales, IFO and Adjusted IFO according to the 20132015 sector classifications.
52 Annual Report 2013
4Philips Group performance 4.1.2 - 4.1.2
Sales, IFO and Adjusted IFO
in millions of eurosEUR unless otherwise stated
2014 - 2015
| | | | | | | | | | | | | | | | | | | | |
| | | sales | | | IFO | | | % | | | Adjusted
IFO1) | | | % | |
2013 | | | | | | | | | | | | | | | | | | | | |
Healthcare | | | 9,575 | | | | 1,315 | | | | 13.7 | | | | 1,512 | | | | 15.8 | |
Consumer Lifestyle | | | 4,605 | | | | 429 | | | | 9.3 | | | | 483 | | | | 10.5 | |
Lighting | | | 8,413 | | | | 489 | | | | 5.8 | | | | 695 | | | | 8.3 | |
IG&S | | | 736 | | | | (242 | ) | | | — | | | | (239 | ) | | | — | |
| | | | |
Philips Group | | | 23,329 | | | | 1,991 | | | | 8.5 | | | | 2,451 | | | | 10.5 | |
| | | | | |
2012 | | | | | | | | | | | | | | | | | | | | |
Healthcare | | | 9,983 | | | | 1,026 | | | | 10.3 | | | | 1,226 | | | | 12.3 | |
Consumer Lifestyle | | | 4,319 | | | | 400 | | | | 9.3 | | | | 456 | | | | 10.6 | |
Lighting | | | 8,442 | | | | (66 | ) | | | (0.8 | ) | | | 128 | | | | 1.5 | |
IG&S | | | 713 | | | | (712 | ) | | | — | | | | (704 | ) | | | — | |
| | | | |
Philips Group | | | 23,457 | | | | 648 | | | | 2.8 | | | | 1,106 | | | | 4.7 | |
| | | | | | | | | | | | | | | | | | | | |
| | | | |
| | | Sales | | | IFO | | | % | | | Adjusted
IFO1) | | | % | |
| | | | |
2015 | | | | | | | | | | | | | | | | | | | | |
Healthcare | | | 10,912 | | | | 819 | | | | 7.5 | % | | | 1,024 | | | | 9.4 | % |
Consumer Lifestyle | | | 5,347 | | | | 621 | | | | 11.6 | % | | | 673 | | | | 12.6 | % |
Lighting | | | 7,411 | | | | 486 | | | | 6.6 | % | | | 594 | | | | 8.0 | % |
Innovation, Group & Services | | | 574 | | | | (934 | ) | | | — | | | | (919 | ) | | | — | |
| | | | |
Philips Group | | | 24,244 | | | | 992 | | | | 4.1 | % | | | 1,372 | | | | 5.7 | % |
| | | | |
| | | | | |
2014 | | | | | | | | | | | | | | | | | | | | |
Healthcare | | | 9,186 | | | | 456 | | | | 5.0 | % | | | 616 | | | | 6.7 | % |
Consumer Lifestyle | | | 4,731 | | | | 520 | | | | 11.0 | % | | | 573 | | | | 12.1 | % |
Lighting | | | 6,869 | | | | 185 | | | | 2.7 | % | | | 293 | | | | 4.3 | % |
Innovation, Group & Services | | | 605 | | | | (675 | ) | | | — | | | | (661 | ) | | | — | |
| | | | |
Philips Group | | | 21,391 | | | | 486 | | | | 2.3 | % | | | 821 | | | | 3.8 | % |
| | | | |
| 1) | For a reconciliation to the most directly comparable GAAP measures, see chapter 14,15, Reconciliation of non-GAAP information, of this report |
In 2013,2015, IFO increased by EUR 1,343506 million year-on-year to EUR 1,991992 million, or 8.5%4.1% of sales. Restructuring and acquisition-related charges amounted to EUR 283 million, which included the Volcano acquisition, compared to EUR 434 million in 2014. 2015 IFO also included charges of EUR 345 million mainly related to settlements for pension de-risking, EUR 183 million relating to the separation of the Lighting business, EUR 35 million related to the devaluation of the Argentine peso, EUR 31 million relating to legal provisions, EUR 28 million related to the currency revaluation of the provision for the Masimo litigation, and a EUR 37 million gain related to the sale of real estate assets. IFO in 2014 included charges of EUR 366 million related to the provision for the Masimo litigation, EUR 244 million related to the CRT antitrust litigation, EUR 68 million of impairment and other charges related to industrial
36 Annual Report 2015
Group performance 5.1.2
assets at Lighting, EUR 49 million of mainly inventory write-downs related to the Cleveland facility, and a EUR 67 million past-service pension cost gain.
Amortization and impairment of intangibles, excluding software and capitalized product development costs, amounted to EUR 380 million in 2015, compared to EUR 332 million in 2014. In 2015, goodwill impairment charges amounted to nil, while 2014 included charges of EUR 3 million consisting of impairments on divested businesses in Healthcare and Lighting, see note 11, Goodwill.
Adjusted IFO increased from EUR 821 million, or 3.8% of sales, in 2014 to EUR 1,372 million, or 5.7% of sales, in 2015. Adjusted IFO showed a year-on-year increase at all sectors except IG&S.
Healthcare
Adjusted IFO amounted to EUR 1,024 million, or 9.4% of sales, compared to EUR 616 million, or 6.7% of sales, in 2014. Adjusted IFO in 2015 included restructuring and acquisition-related charges of EUR 168 million, which included the Volcano acquisition, compared to EUR 70 million in 2014. 2015 Adjusted IFO also included charges of EUR 28 million related to the currency revaluation of the provision for the Masimo litigation, EUR 8 million related to the devaluation of the Argentine peso, and a EUR 31 million legal provision. Adjusted IFO in 2014 included charges of EUR 366 million related to the provision for the Masimo litigation, charges of EUR 49 million of mainly inventory write-downs related to Cleveland, and a EUR 16 million past-service pension cost gain. Excluding these items, the increase was largely driven by higher volumes, partly offset by an increase in Quality & Regulatory spend and higher planned expenditure for growth initiatives.
Consumer Lifestyle
Adjusted IFO amounted to EUR 673 million, or 12.6% of sales, a year-on-year increase of EUR 100 million. 2015 Adjusted IFO included restructuring and acquisition-related charges of EUR 36 million and charges related to the devaluation of the Argentine peso of EUR 13 million. 2014 Adjusted IFO included restructuring and acquisition- related charges of EUR 9 million and a EUR 11 million past-service pension cost gain. The year-on-year increase was largely driven by cost productivity, higher volumes, and product mix, partly offset by higher restructuring and acquisition-related charges.
Lighting
Adjusted IFO amounted to EUR 594 million, or 8.0% of sales, a year-on-year increase of EUR 301 million. 2015 Adjusted IFO included EUR 99 million of restructuring and acquisition-related charges and EUR 14 million of charges related to the devaluation of the Argentine peso. 2014 Adjusted IFO included EUR 245 million of restructuring and acquisition-related charges, EUR 68 million of impairment and other charges related to industrial assets, and a EUR 13 million past-service pension cost gain. The increase in Adjusted IFO was largely driven by cost productivity, improved LED margins and lower restructuring and acquisition-related charges.
Innovation, Group & Services
Adjusted IFO amounted to a net cost of EUR 919 million, compared to EUR 661 million in 2014. Adjusted IFO in 2015 included a EUR 20 million net release of restructuring charges, compared to EUR 113 million restructuring charges in 2014. Adjusted IFO in 2015 also included charges of EUR 183 million related to the separation of the Lighting business, EUR 345 million mainly related to settlements for pension de-risking, and a EUR 37 million gain related to the sale of real estate assets. Adjusted IFO in Q4 2014 also included EUR 244 million of charges related to the CRT antitrust litigation and a EUR 27 million past-service pension cost gain. Excluding these items, the decrease in Adjusted IFO was largely driven by higher Group and Regional Costs, mainly related to information security and Quality & Regulatory spend, investments in emerging business areas, and lower licensing revenue in IP Royalties.
The year 2014
In 2014, Philips’ gross margin was EUR 8,206 million, or 38.4% of sales, compared to EUR 9,337 million, or 42.5% of sales, in 2013. Gross margin in 2014 included EUR 249 million of restructuring and acquisition-related charges, whereas 2013 included EUR 11748 million of restructuring and acquisition-related charges. 2014 also included charges of EUR 366 million related to the jury verdict in the Masimo litigation, EUR 68 million of impairment and other charges, EUR 46 million of mainly inventory write-downs related to the voluntary suspension of production at the Cleveland facility and a past service pension cost gain of EUR 17 million. 2013 also included a past service pension cost gain of EUR 38 million. Excluding these items, the year-on-year decline was mainly driven by operational decline at Healthcare and Lighting as well as negative currency impacts.
Selling expenses increased from EUR 5,057 million in 2013 to EUR 5,124 million in 2014. 2014 included EUR 128 million of restructuring and acquisition-related charges, and a past service pension cost gain of EUR 20 million, while 2013 included EUR 45 million of restructuring charges and a past service pension cost gain of EUR 28 million. The year-on-year increase was mainly attributable to higher restructuring activities. Selling expenses increased from 23.0% of sales to 24.0%.
Research and development costs decreased from EUR 1,659 million in 2013 to EUR 1,635 million in 2014. Research and development costs in 2014 included EUR 34 million of restructuring and acquisition-related charges, EUR 3 million of charges related to mainly inventory write-downs at the Cleveland facility, and a EUR 22 million past-service pension cost gain, compared to EUR 2 million of restructuring and acquisition-related charges and a EUR 11 million past-service pension cost gain in 2013. The year-on-year
Annual Report 2015 37
Group performance 5.1.2
decrease was mainly due to lower spend at IG&S, partly offset by higher restructuring costs in all sectors. As a percentage of sales, research and development costs increased from 7.5% in 2013 to 7.6% in 2014.
General and administrative expenses amounted to EUR 747 million in 2014, compared to EUR 825 million in 2013. As a percentage of sales, costs decreased from 3.8% in 2013 to 3.5% in 2014. 2014 included EUR 23 million of restructuring and acquisition related-charges, compared to EUR 5 million in 2013. 2014 also included a EUR 8 million net past-service pension cost gain in the Netherlands, while 2013 included a pension settlement loss of EUR 30 million.
The overview below shows sales, IFO and Adjusted IFO according to the 2014 sector classifications.
Philips Group
Sales, IFO and Adjusted IFOin millions of EUR
2013
| | | | | | | | | | | | | | | | | | | | |
| | | | |
| | | Sales | | | IFO | | | % | | | Adjusted
IFO1) | | | % | |
| | | | |
Healthcare | | | 9,575 | | | | 1,315 | | | | 13.7 | % | | | 1,512 | | | | 15.8 | % |
Consumer Lifestyle | | | 4,605 | | | | 429 | | | | 9.3 | % | | | 483 | | | | 10.5 | % |
Lighting | | | 7,145 | | | | 413 | | | | 5.8 | % | | | 580 | | | | 8.1 | % |
IG&S | | | 665 | | | | (302 | ) | | | 0.0 | % | | | (299 | ) | | | 0.0 | % |
| | | | |
Philips Group | | | 21,990 | | | | 1,855 | | | | 8.4 | % | | | 2,276 | | | | 10.4 | % |
| | | | |
| 1) | For reconciliation to the most directly comparable GAAP measures, see chapter 15, Reconciliation of non-GAAP information, of this report. |
In 2014, IFO decreased by EUR 1,369 million year-on-year to EUR 486 million, or 2.3% of sales. 2014 included EUR 434 million of restructuring and acquisition-related charges, compared to EUR 561100 million in 2012.2013. 2014 included EUR 366 million related to the jury verdict in the Masimo litigation, EUR 49 million mainly related to inventory write-downs in the Cleveland facility, charges of EUR 244 million related to legal matters, EUR 68 million of impairment and other charges related to industrial assets at Lighting, and a EUR 67 million past-service pension cost gain in the Netherlands. 2013 IFO was also impacted by a net gain of EUR 47 million from a past-service pension cost gain and related settlement loss in the US, as well as a EUR 21 million gain on the sale of a business in Healthcare. 2012 IFO included a EUR 313 million impact of the European Commission fine related to the alleged violation of competition rules in the Cathode-Ray Tube (CRT) industry, EUR 132 million of provisions related to various legal matters, a net gain on EUR 197 million on the sale of assets, mainly for the Senseo and High Tech Campus transactions, and a EUR 81 million loss on the sale of industrial assets at Lighting. In addition, 2012 IFO also included a past-service cost gain of EUR 25 million related to a retiree medical plan.
Amortization and impairment of intangibles, excluding software and capitalized product development costs, amounted to EUR 432332 million in 2013,2014, compared to EUR 458393 million in 2012. Additionally,2013. In 2014, goodwill impairment charges amount to EUR 3 million consisting of impairments on divested businesses in Healthcare and Lighting. In 2013, goodwill impairment charges amounted to EUR 28 million, including EUR 26 million were taken in the fourth quarter of 2013 mainly as a result of reduced growth expectations atin Consumer Luminaires.Luminaires, see note 11, Goodwill.
Adjusted IFO improveddeclined from EUR 1,1062,276 million, or 4.7%10.4% of sales, in 20122013 to EUR 2,451821 million, or 10.5%3.8% of sales, in 2013.2014. Adjusted IFO showed a year-on-year increasedecrease at all Sectors.sectors except Consumer Lifestyle.
Healthcare
Adjusted IFO improveddecreased from EUR 1,226 million, or 12.3% of sales, in 2012 to EUR 1,512 million, or 15.8% of sales, in 2013. Adjusted IFO improvements were realized across all businesses, due2013 to higherEUR 616 million, or 6.7% of sales, and reduced expenses resulting from cost-saving programs.in 2014. Restructuring and acquisition-related charges in 2013 were close to zero, compared to EUR 13470 million in 2012.2014. 2014 included EUR 366 million related to the jury verdict in the Masimo litigation, EUR 49 million mainly related to inventory write-downs in the Cleveland facility, and a EUR 16 million past-service pension cost gain in the Netherlands. 2013 included a past-service pension cost gain of EUR 61 million and a gain on the sale of a business of EUR 21 million. The decline in Adjusted IFO was largely due to operational losses related to the voluntary suspension of production at the Cleveland facility and negative currency impacts.
Consumer Lifestyle
Adjusted IFO improved from EUR 456 million, or 10.6% of sales, in 2012 to EUR 483 million, or 10.5% of sales, in 2013. Restructuring2013 to EUR 573 million, or 12.1% of sales, in 2014. 2014 included restructuring and acquisition-related charges amounted toof EUR 9 million and a EUR 11 million past-service pension cost gain in the Netherlands. 2013 included restructuring and acquisition-related charges of EUR 14 million in 2013, compared to EUR 56 million in 2012. 2012 Adjusted IFO included a EUR 160 million gain on the Senseo transaction, while 2013 Adjusted IFO includedand a past-service pension cost gain of EUR 1 million.million in the US. The increase was largely driven by higher sales and operational improvements.
Lighting
Adjusted IFO improveddeclined from EUR 128580 million, or 1.5%8.1% of sales, in 20122013 to EUR 695293 million, or 8.3%4.3% of sales, in 2013.2014. Restructuring and acquisition-related charges amounted to EUR 100245 million in 2013,2014, compared to EUR 31583 million in 2012. 20122013. 2014 Adjusted IFO included EUR 8168 million of lossesimpairment and other charges related to the sale of industrial assets and a EUR 13 million past-service pension cost gain in the Netherlands, while 2013 Adjusted IFO included a past-service pension cost gain of EUR 10 million. Excluding these impacts,million in the increaseUS. The decrease in Adjusted IFO was mainly attributable tolargely driven by higher operational performance.restructuring charges and lower sales volume.
Innovation, Group & Services
Adjusted IFO improveddeclined from a loss of EUR 704299 million in 20122013 to a loss of EUR 239661 million in 2013. Restructuring2014. 2014 Adjusted IFO included restructuring and acquisition-related charges amountedof EUR 113 million, provisions of EUR 244 million related to legal matters and a EUR 327 million in 2013, compared to EUR 56 million in 2012. 2013 Adjusted IFO included a net EUR 25 million lossgain from a past-service pension cost gain and related settlement loss. 2012 Adjusted IFOin the Netherlands. 2013 included a EUR 313 million impact of the European Commission fine, EUR 132 million of provisions related to various legal matters, a EUR 37 million gain on the sale of the High Tech Campus, and a EUR 25 million past-service cost gain related to a medical retiree plan.
For further information regarding the performance of the sectors, see chapter 5, Sector performance, of this report.
Annual Report 2013 53
4 Group performance 4.1.2 - 4.1.2
The year 2012
In 2012, Philips’ gross margin was EUR 8,991 million, or 38.3% of sales, compared to EUR 8,260 million, or 39.3% of sales, in 2011. Gross margin in 2012 included EUR 289 million of restructuring and acquisition-related charges whereas 2011 includedof EUR 523 million and a pension settlement loss of restructuring and acquisition-related charges. Compared with 2011,EUR 25 million. Excluding these items, the gross margin percentage was higher at Healthcare, but lower at Lighting and Consumer Lifestyle.
Selling expenses increased from EUR 5,025 million in 2011 to EUR 5,334 million in 2012. 2012 included EUR 184 million of restructuring and acquisition-related charges, compared to EUR 53 million of restructuring charges in 2011. The year-on-year increaseAdjusted IFO decline was mainly attributable to restructuring activities and higher expenses aimed at supporting a higher level of sales. In relation to sales, selling expenses decreased from 23.9% to 22.7%. Selling expenses as a percentage of sales were lower in all sectors.
General and administrative expenses amounted to EUR 845 million in 2012, compared to EUR 802 million in 2011. As a percentage of sales, costs decreased from 3.8% in 2011 to 3.6%.
Research and development costs increased from EUR 1,605 million in 2011 to EUR 1,831 million in 2012. The year-on-year increase was largely attributable todriven by higher investments in growthemerging business areas and innovation. As a percentage of sales, research and development costs increased from 7.6% in 2011 to 7.8% in 2012.
Sales, IFO and Adjusted IFO
in millions of euros, unless otherwise stated
| | | | | | | | | | | | | | | | | | | | |
| | | sales | | | IFO | | | % | | | Adjusted
IFO1) | | | % | |
2011 | | | | | | | | | | | | | | | | | | | | |
Healthcare | | | 8,852 | | | | 27 | | | | 0.3 | | | | 1,080 | | | | 12.2 | |
Consumer Lifestyle | | | 3,771 | | | | 109 | | | | 2.9 | | | | 153 | | | | 4.1 | |
Lighting | | | 7,638 | | | | (408 | ) | | | (5.3 | ) | | | 399 | | | | 5.2 | |
IG&S | | | 731 | | | | (207 | ) | | | — | | | | (197 | ) | | | — | |
| | | | |
Philips Group | | | 20,992 | | | | (479 | ) | | | (2.3 | ) | | | 1,435 | | | | 6.8 | |
1) | For reconciliation to the most directly comparable GAAP measures, see chapter 14, Reconciliation of non-GAAP information, of this report |
In 2012, IFO increased by EUR 1,127 million year-on-year, to EUR 648 million, or 2.8% of sales. 2012 included EUR 561 million of restructuring and acquisition-related charges, compared to EUR 159 million in 2011. The year-on-year increase was mainly attributable to goodwill impairments of EUR 1,355 million in 2011 and higher gross margin percentages in Healthcare and Consumer Lifestyle, but was partly offset by the EUR 313 million impact of the European Commission fine.
Amortization of intangibles, excluding software and capitalized product development costs, amounted to EUR 458 million in 2012, compared to EUR 559 million in 2011.
Adjusted IFO decreased from EUR 1,435 million, or 6.8% of sales, in 2011 to EUR 1,106 million, or 4.7% of sales, in 2012. Adjusted IFO showed a year-on-year increase at Consumer Lifestyle and Healthcare, but was lower at Lighting.
Healthcare
Adjusted IFO increased from EUR 1,080 million, or 12.2% of sales, in 2011 to EUR 1,226 million, or 12.3% of sales, in 2012. Adjusted IFO improvements were realized across Patient Care & Clinical Informatics, Home Healthcare Solutions and Imaging Systems, mainly due to higher sales and reduced expenses as a result of cost-saving programs. Restructuring and acquisition-related charges totaled EUR 134 million, compared to EUR 21 million in 2011.
Consumer Lifestyle
Adjusted IFO increased from EUR 153 million, or 4.1% of sales, in 2011 to EUR 456 million, or 10.6% of sales, in 2012. Restructuring and acquisition-related charges amounted to EUR 56 million in 2012, compared to EUR 49 million in 2011. 2012 results included a EUR 160 million one-time gain from the extension of our partnership with Sara Lee, including the transfer of our 50% ownership rights to the Senseo trademark. Excluding this one-time gain, the year- on-year Adjusted IFO increase was driven by higher sales across all growth businesses as well as lower net costs formerly reported as part of the Television business.
Lighting
Adjusted IFO decreased from EUR 399 million, or 5.2% of sales, in 2011 to EUR 128 million, or 1.5% of sales, in 2012. Restructuring and acquisition-related charges amounted to EUR 315 million, compared to EUR 66 million in 2011. The decrease in Adjusted IFO was mainly attributable to higher restructuring and acquisition- related charges, as well as losses on the sale of industrial assets amounting to EUR 81 million, partly offset by higher sales. Compared to 2011, Adjusted IFO declined in all businesses except Automotive.IP income.
5438 Annual Report 20132015
4 Group performance 4.1.3 - 4.1.45.1.3
Innovation, Group & Services
Adjusted IFO decreased from a loss of EUR 197 million in 2011 to a loss of EUR 704 million in 2012. Results in 2012 were negatively impacted by a charge of EUR 313 million related to the European Commission fine5.1.3 Advertising and provisions related to various legal matters totaling EUR 132 million. Adjusted IFO in 2012 also included a EUR 25 million gain from a change in a medical retiree benefit plan and a EUR 37 million gain on the sale of the High Tech Campus, while 2011 included a EUR 21 million gain related to a change in a pension plan.
Restructuring and acquisition-related charges amounted to EUR 56 million in 2012, compared to EUR 23 million in 2011.
For further information regarding the performance of the sectors, see chapter 5, Sector performance, of this report.
4.1.3 Advertising & Promotionpromotion
The year 20132015
Philips’ total advertising and promotion expenses were EUR 8821,000 million in 2013,2015, an increase of 5%10% compared to 2012.2014. The increase was mainly due to the launch of our new brand positioning as well as higher investments in key growth geographies, such as China. As in 2012,China and India, and mature geographies such as the Company allocated a higher proportion of its total advertisingUnited States and promotion spend to growth geographies and strategic markets. Accordingly, the advertising and promotion spend in key growth geographies increased by 4% compared to 2012.Japan. The total advertising and promotion investment as a percentage of sales was 3.8%4.1% in 2013,2015, compared to 3.6%4.3% in 2012.2014.
Philips brand value increased by 6% to over USD 10.9 billion as measured by Interbrand. In the 2015 listing, Philips is ranked the 47th most valuable brand in the world.
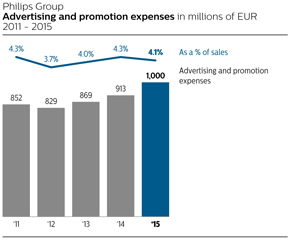
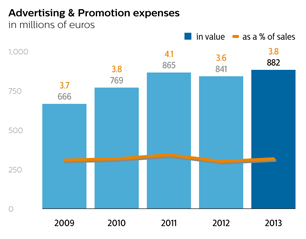
Philips’ total advertising and promotion expenses were EUR 913 million in 2014, an increase of 5% compared to 2013. The increase was mainly due to investments in mature markets, such as the Netherlands, Germany and United States. The advertising and promotion spend in key growth geographies decreased by 5% compared to 2013, largely due to lower spend in China. The total advertising and promotion investment as a percentage of sales was 4.3% in 2014, compared to 4.0% in 2013.
Philips increased its brand value by 8% in 20135% to over USD 9.810.3 billion in the 2014 ranking of the world’s 100 most valuable brands, as measured by Interbrand. In the 20132014 listing, Philips moved up one position tois now ranked the 40th42nd most valuable brand in the world.
The year 2012
Philips’ total advertising and promotion expenses approximated EUR 841 million in 2012, a decrease of 3% compared to 2011, mainly due to decreased investments in Western Europe.
Consistent with 2011, the Company allocated a higher proportion of its total advertising and promotion spend towards growth geographies and strategic markets, priority areas for the Company’s growth strategy. Accordingly, the Company increased its advertising and promotion spend in key growth geographies by 5% compared to 2011. Total advertising and promotion investment as a percentage of sales 3.6% in 2012, compared to 4.1% in 2011.
4.1.45.1.4 Research and development
The year 20132015
Research and development costs decreasedincreased from EUR 1,8311,635 million in 20122014 to EUR 1,7331,927 million in 2013. 20132015. 2015 included EUR 1516 million of restructuring and acquisition-related charges, compared to EUR 5734 million in 2012. As2014. 2014 also included a percentagepast-service pension gain of sales, researchEUR 22 million and development costs decreased from 7.8% in 2012charges of EUR 3 million of mainly inventory write-downs related to 7.4%. The year-on-year decrease was largely attributable to currency effects and lower restructuring charges.
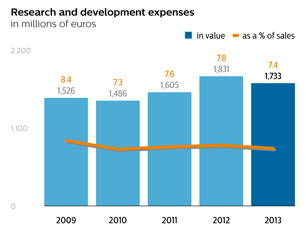
Research and development costs within Healthcare decreased by EUR 43 million, mainly due to lower restructuring activities at Imaging Systems and Patient Care and Clinical Informatics. At Lighting, research and development costs decreased by EUR 21 million,
Annual Report 2013 55
4 Group performance 4.1.5 - 4.1.5
primarily in the conventional businesses within Light Sources & Electronics. At Consumer Lifestyle, research and development spending was EUR 10 million higher than in 2012, mainly in Health & Wellness. In Innovation, Group & Services, research and development expenses decreased by EUR 44 million, due to lower restructuring, productivity savings as well as lower costs at Intellectual Property & Standards.
Research and development expenses per sector
in millions of euros
| | | | | | | | | | | | |
| | | 2011 | | | 2012 | | | 2013 | |
Healthcare | | | 754 | | | | 823 | | | | 780 | |
Consumer Lifestyle | | | 249 | | | | 251 | | | | 261 | |
Lighting | | | 416 | | | | 462 | | | | 441 | |
Innovation, Group & Services | | | 186 | | | | 295 | | | | 251 | |
| | | | |
Philips Group | | | 1,605 | | | | 1,831 | | | | 1,733 | |
The year 2012
Research and development costs increased from EUR 1,605 million in 2011 to EUR 1,831 million in 2012.Cleveland. The year-on-year increase was largely attributablemainly due to currency impact and higher investments in growthspend at Healthcare and innovation, including an increased focus on new value spaces.IG&S. As a percentage of sales, research and development costs increased from 7.6% in 20112014 to 7.8%7.9%.
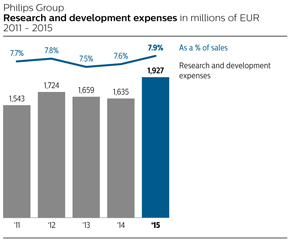
Philips Group
Research and development expenses in millions of EUR
2013 - 2015
| | | | | | | | | | | | |
| | | | |
| | | 2013 | | | 2014 | | | 2015 | |
| | | | |
Healthcare | | | 810 | | | | 822 | | | | 1,073 | |
Consumer Lifestyle | | | 268 | | | | 263 | | | | 301 | |
Lighting | | | 313 | | | | 330 | | | | 315 | |
Innovation, Group & Services | | | 268 | | | | 220 | | | | 238 | |
| | | | |
Philips Group | | | 1,659 | | | | 1,635 | | | | 1,927 | |
| | | | |
The year 2014
Research and development costs withindecreased from EUR 1,659 million in 2013 to EUR 1,635 million in 2014. 2014 included EUR 34 million of restructuring and acquisition-related charges, compared to EUR 2 million in 2013. 2014 also included a past-service pension gain of EUR 22 million and charges of EUR 3 million of mainly inventory write-downs related to Cleveland, compared to a past-service pension gain of EUR 11 million reported in 2013. The year-on-year decrease was driven by IG&S, partly offset by increases at Healthcare increased by EUR 69 million, mainly at Imaging Systems and Home Healthcare Solutions. At Lighting,Lighting. As a percentage of sales, research and development costs increased by EUR 46 million, primarily at Lumileds and our Controls business within Professional Lighting Solutions. At Consumer Lifestyle, research and development spending was EUR 2 million higher thanfrom 7.5% in 2011. In Innovation, Group & Services, R&D expenses increased by EUR 109 million, driven by investments in new value spaces as well as innovation and design initiatives.2013 to 7.6%.
4.1.55.1.5 Pensions
The year 20132015
In 2013,2015, the total costs of post-employment benefits amounted to EUR 294559 million for defined-benefitdefined benefit plans and EUR 139293 million for defined-contributiondefined contribution plans, compared to EUR 289241 million and EUR 139144 million respectively in 2012.2014. Excluding 2015 pension de-risking cost and the 2014 past service cost gain, defined benefit costs decreased by EUR 92 million compared to 2014.
Annual Report 2015 39
Group performance 5.1.6
The above costs are reported in operatingOperating expenses except for the included net interest cost component which is reported in financialFinancial income and expense. The net interest cost for defined benefit plans was EUR 72 million in 2015 (2014: EUR 59 million).
2015 included settlement costs of EUR 329 million mainly related to the settlement of the UK plan, results of other de-risking actions in the UK prior to the settlement and the settlement of parts of the US pension plan. Past-service costs of EUR 14 million were recognized related to de-risking actions taken in the UK prior to the settlement of the plan, including a past-service cost for GMP Equalization in the same UK plan. Some smaller plan changes in other countries resulted in a small past service cost gain. Due to the above, and the change to defined contribution accounting for the Dutch pension plan, which is explained in the pension note, the Company’s Defined Benefit Obligation in 2015 decreased from EUR 27 billion to EUR 4.5 billion at the end of 2015.
2014 included past-service cost gains in the Netherlands of EUR 67 million, which were mainly related to the mandatory plan change in the Netherlands, where a salary cap of EUR 100,000 must be applied to the pension salary with effect from January 1, 2015. This change lowers the Company’s Defined Benefit Obligation, which is recognized as a past-service cost gain. Compensatory measures are given in wages for employees impacted.
The overall funded status in 2015 decreased as the surpluses of the Netherlands and the UK plan are no longer included due to their settlements in 2015. The pension deficits recognized in our balance sheet decreased mainly due to the above mentioned de-risking actions in the US. The surpluses of the Netherlands and the UK plan were not recognized in the balance sheet due to the asset ceiling test and therefore their settlement does not impact the pension balances as per the Company’s accounting policy.
For further information, refer to note 20, Post-employment benefits.
The year 2014
In 2014, the total costs of post-employment benefits amounted to EUR 241 million for defined-benefit plans and EUR 144 million for defined-contribution plans, compared to EUR 291 million and EUR 134 million respectively in 2013.
The above costs are reported in Operating expenses except for the net interest cost component which is reported in Financial income and expense. The net interest cost for defined-benefit plans was EUR 7159 million in 2013 (2012:2014 (2013: EUR 8571 million).
2014 included past-service cost gains in the Netherlands of EUR 67 million, which were mainly related to the mandatory plan change in the Netherlands, where a salary cap of EUR 100,000 must be applied to the pension salary with effect from January 1, 2015. This change lowers the Company’s Defined Benefit Obligation which is recognized as a past-service cost gain. Compensatory measures are given in wages for employees impacted.
2013 included past-service cost gains of EUR 81 million, which included EUR 78 million related to the announced freeze of accrual after December 31, 2015 for salaried workers in the Company’s US defined-benefit pension plan. In the same US plan a settlement loss of EUR 31 million was recognized in 2013 following a lump-sum offering to terminated vested employees.
This offering resulted in settling the pension obligations towards these employees. The past-service cost gain is allocated to the respective sectors of the US employees involved, whereas the settlement loss is allocated fully to Pensions in IG&S as it related to inactive employees.
In 2012, past-service cost gains of EUR 31 million were recognized of which EUR 25 million in the Dutch pension plan due to a restructuring. In one of the Company’s defined-benefit retiree medical plans, a past-service cost gain of EUR 25 million was recognized due to a benefit change.
The overall funded status of our defined-benefit pension plans in 2014 decreased compared to 2013 was comparabledue to that of 2012.a decrease in discount rates used to measure the defined benefit obligation. The deficits recognized on our balance sheet decreasedincreased by approximately EUR 400393 million due to a higherlower discount raterates in the US cash contributions and the US events described above. The surpluses of the plansGermany and a new adopted mortality table in the Netherlands and UK decreased, but as Philips does not recognize a surplus in these countries, the net balance sheet position was not impacted.US.
In 2013, major2014, further progress was made in managing the financial exposure to defined-benefit plans such as the changes in the funding of the Dutch pension plan, the changes in the US plan as described above, and a buy-inby two further buy-ins in the UK plan.
For further information, refer to note 30,20, Post-employment benefits.
The year 2012
In 2012, the total costs of post-employment benefits amounted to EUR 289 million for defined benefit plans and EUR 139 million for defined contribution plans, compared to EUR 248 million and EUR 117 million respectively in 2011.
56 Annual Report 2013
4 Group performance 4.1.6 - 4.1.6
The funded status of our defined-benefit plans improved in 2012, in spite of decreasing discount rates and improved life expectancy assumptions in the Netherlands and UK plans. The surpluses of the plans in the Netherlands and UK increased, but Philips does not recognize the surplus in these countries, the net balance sheet position was not impacted.
In 2012, past-service cost gains of EUR 31 million were recognized of which 25 million in the Dutch pension plan due to a restructuring. In one of the Company’s defined-benefit retiree medical plans, a past service cost gain of EUR 25 million was recognized due to a benefit change.
In 2011, the company recognized a past-service cost gain of EUR 40 million, including a EUR 19 million curtailment gain.
For further information, refer to note 29, Post-employment benefits
4.1.65.1.6 Restructuring and impairment charges
The year 20132015
In 2013,2015, IFO included net charges totaling EUR 101171 million for restructuring. In addition to the annual goodwill-impairment tests for Philips, trigger-based impairment tests were performed during the year, resulting in a goodwill impairment of nil.
2014 included EUR 414 million of restructuring charges and a goodwill impairment of EUR 2 million at Lighting and EUR 1 million at Healthcare.
For further information on sensitivity analysis, please refer to note 11, Goodwill.
In 2015, the most significant restructuring projects related to Lighting and Healthcare and were driven by industrial footprint rationalization and the overhead cost reduction program. Restructuring projects at Lighting centered on the declining conventional lamps industry and Professional Lighting Solutions, the largest of which took place in France and Indonesia. Restructuring projects at Healthcare mainly took place in the US and France. Consumer Lifestyle restructuring projects were mainly related to Italy.
40 Annual Report 2015
Group performance 5.1.7
In 2014, the most significant restructuring projects related to Lighting and IG&S and were driven by industrial footprint rationalization and the Accelerate! transformation program. Restructuring projects at Lighting centered on Light Sources & Electronics and Professional Lighting Solutions, the largest of which took place in Belgium, the Netherlands and France. Innovation, Group & Services restructuring projects were mainly related to IT and group and country overheads and centered primarily on the Netherlands, the US and Belgium. Restructuring projects at Healthcare mainly took place in the US and the Netherlands. Consumer Lifestyle restructuring projects were mainly in the Netherlands.
For further information on restructuring, refer to note 19, Provisions.
Philips Group
Restructuring and related charges in millions of EUR
2013 - 2015
| | | | | | | | | | | | |
| | | | |
| | | 2013 | | | 2014 | | | 2015 | |
| | | | |
Restructuring and related charges per sector: | | | | | | | | | | | | |
Healthcare | | | (6 | ) | | | 68 | | | | 61 | |
Consumer Lifestyle | | | 10 | | | | 8 | | | | 37 | |
Lighting | | | 77 | | | | 225 | | | | 93 | |
Innovation, Group & Services | | | 3 | | | | 113 | | | | (20 | ) |
| | | | |
Continuing operations | | | 84 | | | | 414 | | | | 171 | |
Discontinued operations | | | 33 | | | | 18 | | | | 5 | |
| | | |
Cost breakdown of restructuring and related charges: | | | | | | | | | | | | |
Personnel lay-off costs | | | 95 | | | | 354 | | | | 194 | |
Release of provision | | | (62 | ) | | | (36 | ) | | | (88 | ) |
Restructuring-related asset impairment | | | 25 | | | | 57 | | | | 46 | |
Other restructuring-related costs | | | 26 | | | | 39 | | | | 19 | |
| | | | |
Continuing operations | | | 84 | | | | 414 | | | | 171 | |
Discontinued operations | | | 33 | | | | 18 | | | | 5 | |
| | | | |
The year 2014
In 2014, IFO included net charges totaling EUR 414 million for restructuring. In addition to the annual goodwill-impairment tests for Philips, trigger-based impairment tests were performed during the year, resulting in a goodwill impairment of EUR 1 million at Healthcare and EUR 2 million at Lighting.
2013 included EUR 84 million of restructuring charges and a goodwill impairment of EUR 2 million at Healthcare and EUR 26 million at Consumer Luminaires, mainly as a consequence of reduced growth rates resulting from a slower-than-anticipated recovery of certain markets, as well as delays in the introduction of new product ranges.
2012 included EUR 511 million of restructuring charges.
For further information on sensitivity analysis, please refer to note 11, Goodwill.
Restructuring and related charges
in millions of euros
| | | | | | | | | | | | |
| | | 2011 | | | 2012 | | | 2013 | |
Restructuring and related charges per sector: | | | | | | | | | | | | |
Healthcare | | | 3 | | | | 116 | | | | (6 | ) |
Consumer Lifestyle | | | 5 | | | | 38 | | | | 10 | |
Lighting | | | 54 | | | | 301 | | | | 94 | |
Innovation, Group & Services | | | 23 | | | | 56 | | | | 3 | |
| | | | |
Continuing operations | | | 85 | | | | 511 | | | | 101 | |
Discontinued operations | | | 18 | | | | 29 | | | | 16 | |
| | | |
Cost breakdown of restructuring and related charges: | | | | | | | | | | | | |
Personnel lay-off costs | | | 105 | | | | 423 | | | | 103 | |
Release of provision | | | (44 | ) | | | (35 | ) | | | (64 | ) |
Restructuring-related asset impairment | | | 10 | | | | 66 | | | | 36 | |
Other restructuring-related costs | | | 14 | | | | 57 | | | | 26 | |
| | | | |
Continuing operations | | | 85 | | | | 511 | | | | 101 | |
Discontinued operations | | | 18 | | | | 29 | | | | 16 | |
In 2013, the most significant restructuring projects related to Lighting and were driven by the industrial footprint rationalization. Restructuring projects at Lighting centered on Luminaires businesses and Light Sources & Electronics, the largest of which took place in the United States, France and Belgium. Innovation, Group & Services restructuring projects mainly focused on the Financial Operations Service Unit, primarily in Italy, France and the United States. Consumer Lifestyle restructuring charges mainly related to Personal Care (primarily in the Netherlands and Austria) and Coffee (mainly Italy).
In 2012, the most significant restructuring projects related to Lighting and Healthcare and were driven by Accelerate! transformation program. Restructuring projects at Lighting centered on Luminaires businesses and Light Sources & Electronics, the largest of which took place in the Netherlands, Germany and various locations in the United States. In Healthcare, the largest projects were undertaken at Imaging Systems and Patient Care & Clinical Informatics, in various locations in the United States, to reduce operating costs and simplify the organization. Innovation, Group & Services restructuring projects focused on the IT and Financial Operations Service Units (primarily in the Netherlands), Group & Regional Overheads (mainly in the Netherlands and Italy) and Philips Innovation Services (in the Netherlands and Belgium). Consumer Lifestyle restructuring charges mainly related to Coffee (mainly Italy) and Health & Wellness (in the United States).
Annual Report 2013 57
4 Group performance 4.1.7 - 4.1.7
For further information on restructuring, refer to note 21, Provisions.
The year 2012
2012 included EUR 511 million of restructuring. In addition to the annual goodwill impairment tests for Philips, trigger-based impairment tests were performed during the year, resulting in no goodwill impairment.
For further information on sensitivity analysis, please refer to note 11, Goodwill.
In 2012,2014, the most significant restructuring projects related to Lighting and HealthcareIG&S and were driven by industrial footprint rationalization and the Accelerate! transformation program. Restructuring projects at Lighting centered on Luminaires businesses and Light Sources & Electronics and Professional Lighting Solutions, the largest of which took place in the Belgium, Netherlands Germany and various locations in the US. In Healthcare, the largest projects were undertaken at Imaging Systems and Patient Care & Clinical Informatics, in various locations, in the United States to reduce operating costs and simplify the organization.France. Innovation, Group & Services restructuring projects focusedmainly were related to IT and group and country overheads and centered primarily on the ITNetherlands, US and Financial Operations Service Units (primarilyBelgium. Restructuring projects at Healthcare mainly took place in the Netherlands), Group & Regional Overheads (mainly inUS and the Netherlands and Italy) and Philips Innovation Services (in the Netherlands and Belgium).Netherlands. Consumer Lifestyle restructuring chargesprojects were mainly related to Coffee (mainly Italy) and Health & Wellness (inin the United States).Netherlands.
In 2011,2013, the mostmore significant restructuring projects were related to Lighting and Innovation, Group & Services andindustrial footprint rationalization at Lighting. The largest projects were mainly driven by Accelerate! transformation program. Restructuring projectscentered at Lighting centered onConsumer Luminaires businesses and Light Sources & Electronics, the largest of which took placemainly in the Netherlands, BrazilUnites States, France and in the United States.Belgium. Innovation Group & Services restructuring projects were largely focused on the GlobalFinancial Operations Service Units, (primarilyprimarily in Italy, France and the Netherlands), Corporate and Country Overheads (mainlyUnited States. Restructuring projects at Consumer Lifestyle were mainly seen at Personal Care in the Netherlands Brazil and Italy)Austria and Philips Design (the Netherlands). At Healthcare, the largest projects were undertaken at Imaging Systems, Home Healthcare Solutions and Patient Care & Clinical Informatics,Coffee in various locations in the United StatesItaly.
For further information on restructuring, refer to reduce operating costs and simplify the organization. Consumer Lifestyle restructuring charges mainly related to the remaining Television operations in Europe.note 19, Provisions.
4.1.75.1.7 Financial income and expenses
The year 20132015
A breakdown of Financial income and expenses is presented in the table below.
Philips Group
Financial income and expenses
in millions of eurosEUR
2013 - 2015
| | | | | | |
| | | | | | | | 2013 | | | 2014 | | | 2015 | |
| | | 2011 | | 2012 | | 2013 | | | | | |
Interest expense (net) | | | (302 | ) | | | (325 | ) | | | (268 | ) | | | (269 | ) | | | (251 | ) | | | (302 | ) |
Sale of securities | | | 51 | | | | 1 | | | | — | | | | — | | | | 60 | | | | 20 | |
Impairments | | | (34 | ) | | | (8 | ) | | | (10 | ) | | | (10 | ) | | | (17 | ) | | | (46 | ) |
Other | | | (46 | ) | | | 3 | | | | (52 | ) | | | (51 | ) | | | (93 | ) | | | (41 | ) |
| | | | | | | | |
Financial income and expenses | | | | (330 | ) | | | (301 | ) | | | (369 | ) |
| | | (331 | ) | | | (329 | ) | | | (330 | ) | | | | |
Net interest expense in 2015 was EUR 51 million higher than in 2014, mainly due to a weaker euro against the US dollar in relation to interest expenses on USD bonds.
The gain from the sale of stakes in 2015 amounted to EUR 20 million, mainly from Assembléon Technologies B.V., Silicon & Software Systems and other equity interest.
Impairments amounted to EUR 46 million mainly due to valuation allowances.
Other financial expense amounted to EUR 41 million in 2015, primarily consisting of interest expense related to the jury verdict in the Masimo litigation, and accretion expense associated with other discounted provisions.
For further information, refer to note 7, Financial income and expenses.
Annual Report 2015 41
Group performance 5.1.8
The year 2014
The net interest expense in 20132014 was EUR 5718 million lower than in 2012,2013, mainly as a result of lower average outstanding debt and interest related to pensions in 2013.2014.
The gain from the sale of stakes in 2014 amounted to EUR 60 million, mainly from Neusoft, Chimei Innolux, Gilde III and Sapiens.
Other financial expense was a EUR 93 million in 2014, primarily consisting of interest expense related to the jury verdict in the Masimo litigation, and accretion expense associated with other discounted provisions and uncertain tax positions.
Other financial income was a EUR 5251 million loss in 2013, primarily consisting of a EUR 25 million accretion expense (mainly associated with discounted provisions) and EUR 24 million of other financing charges.
Other financialFor further information, refer to note 7, Financial income was a EUR 3 million gain in 2012, primarily consisting of a EUR 46 million gain related to a change in estimate on the valuation of long-term derivative contracts and remaining other financial income of EUR 20 million. This was offset by a EUR 22 million accretion expense (mainly associated with discounted provisions) and EUR 41 million other financing charges.expenses.
Impairments5.1.8 Income taxes
in millions of eurosThe year 2015
| | | | | | | | | | | | |
| | | 2011 | | | 2012 | | | 2013 | |
TPV | | | (25 | ) | | | — | | | | — | |
Chi-Mei Innolux | | | (4 | ) | | | (1 | ) | | | (1 | ) |
BG Medicine | | | (2 | ) | | | (1 | ) | | | (1 | ) |
Prime Technology | | | (1 | ) | | | — | | | | — | |
Tendris | | | — | | | | (5 | ) | | | (1 | ) |
Gilde III | | | — | | | | (1 | ) | | | (2 | ) |
Lighting Science Group | | | — | | | | — | | | | (3 | ) |
Other | | | (2 | ) | | | — | | | | (2 | ) |
| | | | |
| | | (34 | ) | | | (8 | ) | | | (10 | ) |
58 Annual Report 2013
4 Group performance 4.1.8 - 4.1.9
Impairment charges in 2013Income taxes amounted to EUR 10239 million, mainly from shareholdings in Lighting Science Group and Gilde III. In 2012, impairment charges amountedcompared to EUR 826 million in 2014. The effective income tax rate in 2015 was 38.4%, compared to 14.1% in 2014. The increase was mainly from shareholdingsdue to a significant change in Tendris.the geographical mix of actual profits and the absence of various items that reduced the charge in the prior year, in particular favorable tax regulations relating to R&D investments in 2014.
For 2016, we expect our effective tax rate to be in the 30% to 35% range. However, the actual rate will depend on the geographical mix of actual profits.
For further information, refer to note 4, Financial income and expenses.8, Income taxes.
The year 2012
The net interest expense in 2012 was EUR 23 million higher than in 2011, mainly as a result of higher average outstanding debt.
In 2012 there was a EUR 1 million gain on the sale of securities. In 2011, income from the sale of securities totaled EUR 51 million, including a EUR 44 million gain on the sale of the remaining shares in TCL and a EUR 6 million gain on the sale of shares of Digimarc.
Impairment charges in 2012 amounted to EUR 8 million, mainly from shareholdings in Tendris. In 2011, impairment charges amounted to EUR 34 million, mainly from shareholdings in TPV Technologies Ltd.
Other financial income was a EUR 3 million gain in 2012, primarily consisting of a EUR 46 million gain related to a change in estimate on the valuation of long-term derivative contracts and remaining other financial income of EUR 20 million. This was offset by a EUR 22 million accretion expense (mainly associated with discounted provisions) and EUR 41 million other financing charges.
Other financial expenses in 2011 primarily consisted of a EUR 34 million other financing charge and a EUR 33 million accretion expense (mainly associated with discounted provisions) offset by EUR 11 million dividend income and other financial income, including a net gain of EUR 6 million mostly from the revaluation impact of the option related to NXP.
For further information, refer to note 4, Financial income and expenses.
4.1.8 Income taxes
The year 20132014
Income taxes amounted to EUR 46626 million, compared to EUR 185466 million in 2012.2013. The effective income tax rate was 28.1%, compared to 58.0% in 2012. Excluding the non-tax-deductible European Commission fine and charges related to various legal matters in 2012, the effective tax rate in 2012 was 25.5%14.1%. The 2.6 percentage points increasedecrease in 20132014 was mainly related to a higher weighted average statutory income tax rate in 2013 due to a change in the country mixlower income before tax and application of profit and loss, which was partly offset by lower valuation allowances.
For 2014, the effectivefavorable tax rate excluding incidental non-taxable items is expectedregulations relating to be between 30% and 32%.
For further information, refer to note 5, Income taxes.
R&D investments. The year 2012
Income taxes amounted to EUR 185 million, compared to EUR 251 million in 2011. The year-on-year decrease was largely attributable to lower incidental tax expenses.
The tax burden in 2012 corresponded to ancomparable effective income tax rate of 58.0%, compared to negative 31.0% in 2011. In 2011, the negative effective income tax ratefor 2013 was attributable to goodwill impairment losses of EUR 1,355 million, which were largely non-tax-deductible. The effective income tax rate in 2012 included the impact of the non-tax-deductible charge of EUR 509 million arising from the European Commission fine. Excluding the European Commission fine and charges related to various legal matters in 2012, the effective tax rate in 2012 was 25.5%30.6%.
For further information, refer to note 5, Income taxes.
4.1.95.1.9 Results of investments in associates
The year 2015
Philips Group
Results of investments in associatesin millions of EUR
2013 - 2015
| | | | | | | | | | | | |
| | | | |
| | | 2013 | | | 2014 | | | 2015 | |
| | | | |
Company’s participation in income | | | 5 | | | | 30 | | | | 10 | |
Investment impairment and other items | | | (30 | ) | | | — | | | | 19 | |
Dilution gain | | | — | | | | 32 | | | | 1 | |
| | | | |
Results of Investments in associates | | | (25 | ) | | | 62 | | | | 30 | |
| | | | |
Results related to investments in associates decreased from a gain of EUR 62 million in 2014 to a gain of EUR 30 million in 2015. 2015 included proceeds from the sale of Assembléon Technologies B.V., while 2014 included a EUR 32 million dilution gain related to Philips’ stake in Corindus Vascular Robotics.
The Company’s participation in income decreased from EUR 30 million in 2014 to EUR 10 million in 2015. The gain in 2015 was mainly attributable to the results of Philips Medical Capital.
For further information, refer to note 5, Interests in entities.
The year 2014
The results related to investments in associates improved from a loss of EUR 211 million in 2012 to a loss of EUR 25 million in 2013 largely attributable to a chargegain of EUR 19662 million in 2014. 2014 included a EUR 32 million dilution gain related to Philips’ stake in Corindus Vascular Robotics, while 2013 included a provision for the net impact of expected payments related to the former LG.Philips Displays joint venture in 2012.
The European Commission imposed fines in relation to alleged violationsagreed transfer of competition rulesthe remaining 30% stake in the Cathode-Ray Tube industry. Philips recorded a total charge of EUR 509 million, of which EUR 313 million was directly related to Philips and therefore recorded in Income from operations, while EUR 196 million related to LG.Philips Displays and was therefore recorded in Results of investments in associates.TP Vision joint venture.
Annual Report 2013 59
4 Group performance 4.1.10 - 4.1.11
Results of investments in associates
in millions of euros
| | | | | | | | | | | | |
| | | 2011 | | | 2012 | | | 2013 | |
Company’s participation in income | | | 18 | | | | (5 | ) | | | 5 | |
Investment impairment and other charges | | | (3 | ) | | | (206 | ) | | | (30 | ) |
| | | | |
| | | 15 | | | | (211 | ) | | | (25 | ) |
The Company’s participation in income increased from a loss of EUR 5 million in 20122013 to a gain of EUR 530 million in 2013.2014. The gain in 2013 was mainly attributable to the results of Philips Medical Capital, while the loss in 2012 was mainly due to the results of EMGO.Capital.
For further information, refer to note 6,5, Interests in entities.
The year 2012
The results related to investments in associates declined from income of EUR 15 million in 2011 to a loss of EUR 211 million in 2012, largely attributable to a charge of EUR 196 million related to the former LG.Philips Displays joint venture.
The European Commission imposed fines in relation to alleged violations of competition rules in the Cathode-Ray Tube industry. Philips recorded a total charge of EUR 509 million, of which EUR 313 million was directly related to Philips and therefore recorded in Income from operations, while EUR 196 million related to LG.Philips Displays and was therefore recorded in Results of investments in associates.
The Company’s participation in income decreased from EUR 18 million in 2011 to negative EUR 5 million in 2012. The loss in 2012 was mainly attributable to the results of EMGO, while the income in 2011 was mainly due to the results of Intertrust.
For further information, refer to note 6, Interests in entities.
4.1.105.1.10 Non-controlling interests
The year 20132015
Net income attributable to non-controlling interests amounted to a gain of EUR 314 million in 2013,2015, compared to a loss of EUR 54 million in 2012.2014.
The year 20122014
Net income attributable to non-controlling interests amounted to EUR 5 million in 2012, compared toa loss of EUR 4 million in 2011.2014, compared to a gain of EUR 3 million in 2013.
42 Annual Report 2015
Group performance 5.1.11
4.1.115.1.11 Discontinued operations
The year 20132015
Discontinued operations consist primarily of the combined businesses of Lumileds and Automotive, the Audio, Video, Multimedia and& Accessories (AVM&A) business, and the Television business and certain divestments formerly reported as discontinued operations.business. The results related to these businesses are reported under Discontinued operations in the Consolidated statements of income and Consolidated statements of cash flows.
In 2014, Philips had reachedannounced the start of the process to combine the Lumileds and Automotive Lighting businesses into a stand-alone company and explore strategic options to attract capital from third-party investors for this combined business.
As announced on January 22, 2016, Philips and GO Scale Capital have withdrawn their filing with the Committee of Foreign Investment in the United States (CFIUS) and terminated the agreement pursuant to which the consortium led by GO Scale Capital would acquire an agreement to transfer the AVM&A business to Funai Electric Co. Ltd in Q1 2013. This agreement was terminated on October 25, 2013. Since then, Philips has received expressions of80.1% interest in the business from various partiescombined businesses of Lumileds and Automotive. Despite the parties’ extensive efforts to mitigate CFIUS’ concern, regulatory clearance has not been granted for this particular transaction. Philips is actively discussing the sale of the business with potential buyers. Inbuyers and expects a transaction to be completed in the meantime,year 2016.
Income from discontinued operations increased by EUR 55 million to EUR 245 million in 2015. The year-on-year increase was mainly due to the positive impact from the treatment of depreciation and amortization of assets held for sale. Income from discontinued operations mainly consisted of net income of EUR 246 million related to the combined businesses of Lumileds and Automotive and a net loss of EUR 1 million, mainly related to the Audio, Video, Multimedia & Accessories and Television business.
For further information, refer to note 3, Discontinued operations and other assets classified as held for sale.
The year 2014
Discontinued operations consist primarily of the combined businesses of Lumileds and Automotive, the Audio, Video, Multimedia and Accessories (AVM&A) business, and the Television business. The results related to these businesses are reported under Discontinued operations in the Consolidated statements of income and Consolidated statements of cash flows.
On June 30, 2014, Philips announced the start of the process to combine the Lumileds and Automotive Lighting businesses into a stand-alone company and explore strategic options to attract capital from third-party investors for this combined business.
The AVM&A business, operatesalso known as a standalone entity named WOOX Innovations.
WooX Innovations, was divested to Gibson Brands Inc. in June 2014. The Television business was divested as part of a strategic partnership agreement with TPV Technology Ltd (TPV) that was signed on April 1, 2012. Philips retained a 30% interest in TP Vision Holdings BV (TP Vision venture). On January 20, and on May 29, 2014 Philips announced that it has signed a term sheet to transfertransferred the remaining 30% stake in TP Vision to TPV.
After completion, TPV will fully ownowns TP Vision, which will enable further integration with TPV’s TV business.
Income from discontinued operations decreasedincreased by EUR 4552 million to EUR 2190 million in 2013.2014. The decreaseyear-on-year increase was mainly attributabledue to lower operational results and higher disentanglement costs ina net gain related to the AVM&Adivestment of our Television business. In 2012, incomeIncome from discontinued operations of EUR 47 million was composed of EUR 78 millionmainly consisted of net income of EUR 141 million related to the combined businesses of Lumileds and Automotive, EUR 18 million related to AVM&A, and EUR 31 million mainly related to other discontinued operations mainly net income on the Television business, partly offset by a EUR 31 million net loss related to the Television business.European Commission’s Smartcard fine.
For further information, refer to note 7,3, Discontinued operations and other assets classified as held for sale.
5.1.12 Net income
The year 20122015
Discontinued operations consistNet income increased from EUR 411 million in 2014 to EUR 659 million in 2015. The increase was largely due to higher IFO of the Audio, Video, MultimediaEUR 506 million and Accessories (AVM&A) business, the Television business and certain divestments formerly reported as discontinued operations. The results related to these businesses are reported under Discontinued operations in the Consolidated statements of income and Consolidated statements of cash flows.
60 Annual Report 2013
4 Group performance 4.1.12 - 4.1.13
In 2012,net income from discontinued operations of EUR 4755 million, included EUR 78 million of net income related to AVM&A, partly offset by a EUR 31 million net loss related to the Television business. In 2011, income from discontinued operations amounted to a loss of EUR 410 million and was primarily composed of EUR 78 million of net income related to AVM&A, offset by a EUR 515 million net loss related to the Television business. The net loss in the Television business was composed of a EUR 353 million transaction loss recorded on the sale of the business, as well as net operational losses of EUR 162 million.
For further information, refer to note 7, Discontinued operations and other assets classified as held for sale.
4.1.12 Net income
The year 2013
Net income increased from a net loss of EUR 30 million in 2012 to a net profit of EUR 1,172 million in 2013. The increase was largely due to EUR 1,343 million higher IFO and better results relating to investments in associates of EUR 186 million, offset by higher income tax charges of EUR 281213 million and lower results from investments in associates of EUR 32 million.
Basic earnings per common share from net income attributable to shareholders increased from negative EUR 0.040.45 per common share in 20122014 to EUR 1.280.70 per common share in 2013.2015.
The year 20122014
Net income increaseddecreased from a loss of EUR 1,4561,172 million in 20112013 to a loss of EUR 30411 million in 2012.2014. The increasedecrease was largely due to EUR 1,127 million higherlower IFO EUR 457 million lower costs related to discontinued operations and lower income tax of EUR 661,369 million, partly offset by lower income tax charges of EUR 440 million and higher results relating to investmentsfrom investment in associates of EUR 22687 million.
Basic earnings per common share from net income increasedattributable to shareholders decreased from negative EUR 1.531.28 per common share in 20112013 to negative EUR 0.040.45 per common share in 2012.2014.
4.1.135.1.13 Acquisitions and divestments
Acquisitions
In 2015, Philips completed four acquisitions, the largest were Volcano Corporation, an image-guided therapy company based in the United States, and Blue Jay Consulting, a leading provider of hospital emergency
Annual Report 2015 43
Group performance 5.1.13
room consulting services. Acquisitions in 2015 and prior years led to post-merger integration charges of EUR 107 million in Healthcare and EUR 5 million in Lighting.
In 2014, Philips acquired Unisensor, a Danish healthcare company, and a 51% interest in General Lighting Company (GLC) based in the Kingdom of Saudi Arabia. Philips also purchased some minor magnetic resonance imaging (MRI) activities from Hologic, a US healthcare company. Acquisitions in 2014 and prior years led to post-merger integration charges of EUR 1 million in Healthcare, EUR 1 million in Consumer Lifestyle and EUR 19 million in Lighting.
In 2013, there were four minor acquisitions. Acquisitions in 2013 and previousprior years led to post-merger integration charges totaling EUR 16 million in 2013: Healthcareof EUR 6 million in Healthcare, EUR 4 million in Consumer Lifestyle EUR, 4 million, and Lighting EUR 6 million.
In 2012, Philips completed the acquisition of Indal within Lighting. Acquisitions in 2012 and previous years led to post-merger integration charges totaling EUR 50 million in 2012: Healthcare EUR 18 million, Consumer Lifestyle EUR 18 million, and Lighting EUR 14 million.
In 2011, we completed six acquisitions. Healthcare acquisitions included Sectra, AllParts Medical and Dameca. Within Consumer Lifestyle, Philips completed the acquisition of Preethi and Povos. Within Lighting, Philips acquired Optimum Lighting. Acquisitions in 2011 and previous years led to post-merger integration charges totaling EUR 74 million in 2011: Healthcare EUR 17 million, Consumer Lifestyle EUR 45 million, and Lighting EUR 12 million.
Divestments
DuringIn 2015, Philips completed seven divestments, which include, the sale of Assembléon Holding B.V., OEM Remote Controls, Axsun Technologies LLC, and several small businesses within Healthcare and Lighting.
In 2014, Philips completed the divestment of its Lifestyle Entertainment activities to Gibson Brands Inc. Philips also completed two other divestments of business activities which related to Healthcare and Lighting activities.
In 2013, Philips completed several divestments of business activities, mainly related to certain Healthcare activities.
During 2012, Philips completed several divestments of business activities, namely the Television business (for further information see note 7, Discontinued operations and other assets classified as held for sale), certain Lighting manufacturing activities, Speech Processing activities and certain Healthcare service activities. The Speech Processing activities were sold to Invest AG, in line with our strategy.
In 2012, Philips agreed to extend its partnership with Sara Lee Corp (Sara Lee) to drive growth in the global coffee market. Under a new exclusive partnership framework, which will run through to 2020, Philips will be the exclusive Senseo consumer appliance manufacturer and distributor for the duration of the agreement. As part of the agreement, Philips divested its 50% ownership right in the Senseo trademark to Sara Lee.
In 2011, Philips completed several divestments, of which Assembléon was the most significant. Philips sold 80% of the shares in Assembléon to H2 Equity Partners, an Amsterdam-based private equity firm, for a consideration of EUR 14 million.
For details, please refer to note 9,4, Acquisitions and divestments.
Annual Report 2013 61
4 Group performance 4.1.14 - 4.1.15
4.1.145.1.14 Performance by geographic cluster
The year 20132015
In 2013,2015, sales grew 3%increased 13% nominally, largely due to favorable foreign exchange impacts, and 2% on a comparable basis, (-1% nominally), driven by growth atHealthcare and Consumer Lifestyle, notably in growth geographies.
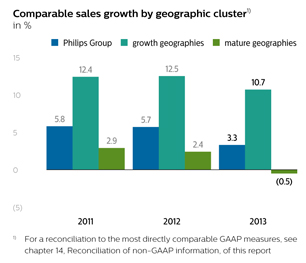
Sales in mature geographies were EUR 5821,832 million higher than in 2014, or 1% higher on a comparable basis. Sales in Western Europe were 1% higher than in 2014, with growth at Healthcare and Consumer Lifestyle partly offset by a decline at Lighting. Sales in North America increased by EUR 1,417 million, or 1% on a comparable basis. Comparable sales in other mature geographies showed a 3% increase, with growth at Healthcare and Consumer Lifestyle, while Lighting was in line with 2014.
In growth geographies, sales increased by EUR 1,021 million, or 4% on a comparable basis, with high-single-digit growth at Consumer Lifestyle and Healthcare, partly offset by a mid-single digit decline at Lighting.
Double-digit growth in Central & Eastern Europe and high-single-digit growth in Asia Pacific and India were partly offset by flat growth year-on-year in China.
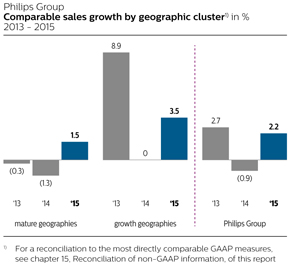
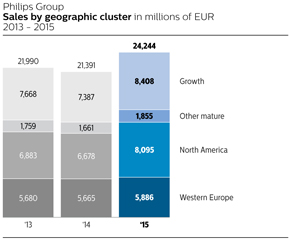
The year 2014
In 2014, sales declined 1% on a comparable basis (-3% nominally largely due to unfavorable foreign exchange impacts) mainly driven by Healthcare and Lighting.
Sales in mature geographies were EUR 318 million lower than in 2012,2013, or 1% lower on a comparable basis. Sales in Western Europe were impacted by macroeconomic developments1% lower than in 2013, with declines at Healthcare and were flat on a comparable basis. Growth at Lighting and Consumer Lifestyle waspartly offset by a declinegrowth at Healthcare.Consumer Lifestyle. Sales in North America declined by EUR 429205 million, or 2% lower on a comparable basis, mainly due to declines at Healthcare and Lighting. Both nominal and comparable sales in other mature geographies showed strong growth.basis. Comparable sales in other mature geographies showed mid-single-digita 1% decline, with growth mainly driven by strong performance at Healthcare and Consumer Lifestyle offset by a decline at Lighting and Healthcare.IG&S.
In growth geographies, sales grewdeclined by EUR 454281 million or 11%mainly due to unfavorable foreign exchange impacts and were flat on a comparable basis, driven by double-digitwith high-single-digit growth at Consumer Lifestyle and Lighting. In China and Latin America, we achieved solid double-digit nominal and comparable growth.offset by a
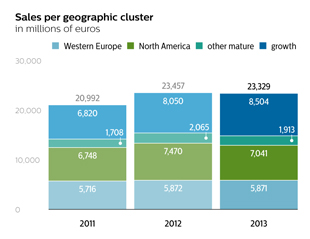
The year 201244 Annual Report 2015
In 2012, sales grew 6% on a comparable basis (12% nominally), driven by growth at Consumer Lifestyle and Healthcare, notably in growth geographies.
Group performance 5.1.15
Sales in mature geographies were EUR 1,235 million higher than in 2011, or 2% higher on a comparable basis. Sales in Western Europe were impacted by macroeconomic developments, resulting in a 1% decline in comparable sales, attributable to Lighting and Healthcare. On a nominal basis, sales in Western Europe were EUR 156 million higher than in 2011, driven by the acquisition of Indal in Lighting. Sales in North America were EUR 722 million higher, or 3% higher on a comparable basis, driven by single-digit growth in all sectors. Both nominal and comparable sales in other mature geographies showed strong growth. Comparable sales in other mature geographies showed double-digit growth at Consumer Lifestyle and Lighting, while Healthcare recorded high-single-digit growth.
In growth geographies, sales grew by EUR 1,230 million, or 13% on a comparable basis, driven by double-digit growthdecline at Healthcare and Consumer Lifestyle. InLighting. Strong growth was achieved in India and Middle East & Turkey, while decline was seen in China all Sectors recorded solid double-digit nominal and comparable growth. Sales in Russia & Central Asia also showed double-digit comparable sales growth, attributable to strong sales performance at Consumer Lifestyle and Healthcare.Asia.
4.1.155.1.15 Cash flows provided by continuing operations
The year 20132015
Cash flows from operating activities
Net cash flowflows from operating activities amounted to EUR 1,1381,167 million in 2013,2015, which iswas EUR 944136 million lower than in 2012. The decrease is2014, mainly a result of thedue to pension settlement costs and CRT litigation claims, partly offset by higher earnings.
62 Annual Report 2013
4 Group performance 4.1.15 - 4.1.15
payment of the European Commission fine, increased working capital usage and the payout of restructuring charges in 2013.
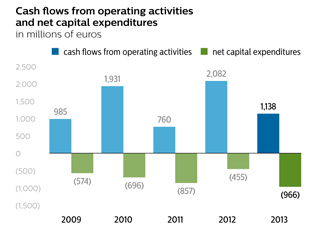
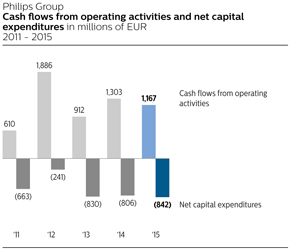
Condensed consolidated statements of cash flows for the years ended December 31, 2011, 20122013, 2014 and 20132015 are presented below:
Philips Group
Condensed consolidated cash flow statements1)
in millions of eurosEUR
2013 - 2015
| | | | 2011 | | 2012 | | 2013 | | | | | |
Cash flows from operating activities: | | | | | | | |
Net income (loss) | | | (1,456 | ) | | | (30 | ) | | | 1,172 | | |
| | | | 2013 | | | 2014 | | | 2015 | |
| | | | | |
Net income | | | | 1,172 | | | | 411 | | | | 659 | |
Adjustments to reconcile net income to net cash provided by operating activities | | | 2,216 | | | | 2,112 | | | | (34 | ) | | | (260 | ) | | | 892 | | | | 508 | |
| | | | | | | | |
Net cash provided by operating activities | | | 760 | | | | 2,082 | | | | 1,138 | | | | 912 | | | | 1,303 | | | | 1,167 | |
Net cash (used for) provided by investing activities | | | (1,275 | ) | | | (925 | ) | | | (997 | ) | |
Net cash used for investing activities | | | | (862 | ) | | | (984 | ) | | | (1,941 | ) |
| | | | | | | | |
Cash flows before financing activities2) | | | (515 | ) | | | 1,157 | | | | 141 | | | | 50 | | | | 319 | | | | (774 | ) |
Net cash used for financing activities | | | (1,790 | ) | | | (293 | ) | | | (1,241 | ) | | | (1,241 | ) | | | (1,189 | ) | | | 508 | |
| | | | | | | | |
Cash (used for) provided by continuing operations | | | (2,305 | ) | | | 864 | | | | (1,100 | ) | |
Net cash (used for) discontinued operations | | | (374 | ) | | | (126 | ) | | | (206 | ) | |
Cash used for continuing operations | | | | (1,191 | ) | | | (870 | ) | | | (266 | ) |
Net cash (used for) provided by discontinued operations | | | | (115 | ) | | | 193 | | | | 79 | |
Effect of changes in exchange rates on cash and cash equivalents | | | (7 | ) | | | (51 | ) | | | (63 | ) | | | (63 | ) | | | 85 | | | | 80 | |
| | | | | | | | |
Total change in cash and cash equivalents | | | (2,686 | ) | | | 687 | | | | (1,369 | ) | | | (1,369 | ) | | | (592 | ) | | | (107 | ) |
Cash and cash equivalents at the beginning of year | | | 5,833 | | | | 3,147 | | | | 3,834 | | | | 3,834 | | | | 2,465 | | | | 1,873 | |
| | | | | | | | |
Cash and cash equivalents at the end of year | | | 3,147 | | | | 3,834 | | | | 2,465 | | | | 2,465 | | | | 1,873 | | | | 1,766 | |
| | | | | |
| 1) | Please refer to section 11.7,12.7, Consolidated statements of cash flows, of this report |
| 2) | Please refer to chapter 14,15, Reconciliation of non-GAAP information, of this report |
Cash flows from investing activities
In 2015, cash flows from investing activities resulted in a net outflow of EUR 1,941 million. This was attributable to EUR 1,137 million used for acquisitions of businesses and non-current financial assets, EUR 842 million cash used for net capital expenditures, and EUR 72 million used for derivatives and current financial assets, partly offset by EUR 110 million of net proceeds from non-current financial assets and divestments.
In 2014, cash flows from investing activities resulted in a net outflow of EUR 984 million. This was attributable to EUR 806 million cash used for net capital expenditures, EUR 258 million used for acquisitions of businesses and non-current financial assets, and EUR 7 million used for derivatives and current financial assets, partly offset by EUR 87 million of net proceeds from non-current financial assets and divestments.
Net capital expenditures
Net capital expenditures amounted to a cash outflow of EUR 842 million, compared to an outflow of EUR 806 million in 2014. The year-on-year increase was mainly due to higher investments at Healthcare and Lighting.
Annual Report 2015 45
Group performance 5.1.15
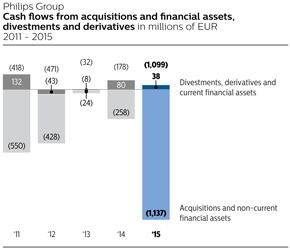
Acquisitions and non-current financial assets
The net cash impact of acquisitions of businesses and non-current financial assets in 2015 was a total of EUR 1,137 million. There was a EUR 1,116 million outflow for acquisitions of businesses, mainly related to the acquisition of Volcano and a EUR 21 million outflow for non-current financial assets.
The net cash impact of acquisitions of businesses and non-current financial assets in 2014, was a total of EUR 258 million. There was a EUR 177 million outflow for acquisitions of businesses mainly related to the acquisition of a 51% interest in the General Lighting Company (GLC) in the Kingdom of Saudi Arabia, and a EUR 81 million outflow for non-current financial assets, mainly in the form of a EUR 60 million loan to TPV Technology Limited.
Divestments, derivatives and current financial assets
Cash proceeds of EUR 110 million were received, mainly from the divestment of the Assembléon Holding B.V., the OEM remote control business and Axsun Technologies LLC. Cash flows from derivatives and current financial assets led to a net cash outflow of EUR 72 million.
In 2014, cash proceeds of EUR 87 million were received, mainly from the divestment of the Shakespeare business and the sale of shares in Neusoft. Cash flows from derivatives and current financial assets led to a net cash outflow of EUR 7 million.
Cash flows from financing activities
Net cash provided by financing activities in 2015 was EUR 508 million. Philips’ shareholders were given EUR 730 million in the form of a dividend, of which the cash portion of the dividend amounted to EUR 298 million. The net impact of changes in debt was an increase of EUR 1,231 million. Additionally, net cash outflows for share buy-back and share delivery totaled EUR 425 million.
Net cash used for financing activities in 2014 was EUR 1,189 million. Philips’ shareholders were given EUR 729 million in the form of a dividend, of which the cash portion of the dividend amounted to EUR 292 million. The net impact of changes in debt was a decrease of EUR 301 million. Additionally, net cash outflows for share buy-back and share delivery totaled EUR 596 million.
The year 2014
Cash flows from operating activities
Net cash flow from operating activities amounted to EUR 1,303 million in 2014, which was EUR 391 million higher than in 2013, mainly due to higher inflows from working capital reductions.
Cash flows from investing activities
In 2014, cash flow from investing activities resulted in a net outflow of EUR 984 million. This was attributable to EUR 806 million cash used for net capital expenditures, EUR 258 million used for acquisitions of businesses and non-current financial assets, and EUR 7 million used for derivatives and current financial assets, partly offset by EUR 87 million of net proceeds from non-current financial assets and divestments.
In 2013, cash flows from investing activities resulted in a net outflow of EUR 997862 million. This was attributable to EUR 966830 million cash used for net capital expenditures, EUR 101 million cash used for derivatives and current financial assets, as well as a EUR 24 million used for acquisitions of businesses and non-current financial assets, partly offset by EUR 9493 million of net proceeds from divestments.
In 2012, cash flows from investing activities resulted in a net outflow of EUR 925 million. This was attributable to EUR 455 million cash used for net capital expenditures, EUR 261 million used for acquisitions, as well as a EUR 167 million outflow for financial assets, mainly due to loans provided to TPV and the TP Vision venture in connection with the divestment of the Television business (EUR 151 million in aggregate).divestment.
Net capital expenditures
Net capital expenditures totaled EUR 966 million, which was EUR 511 million higher than in 2012, mainly reflecting the impact of proceeds received in 2012 from the sale of the High Tech Campusamounted to a cash outflow of EUR 425806 million, and the 2012 divestmentcompared to an outflow of Philips’ 50% ownership rightEUR 830 million in the Senseo trademark to Sara Lee for EUR 170 million. Excluding these impacts in 2012, net capital expenditures were EUR 84 million lower than in 2012,2013. The year-on-year decrease was mainly due to lower investments at Healthcare and Lighting.
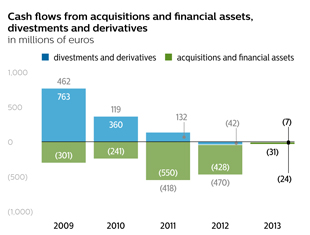
Acquisitions and non-current financial assets
The net cash impact of acquisitions of businesses and non-current financial assets in 2014 was a total of EUR 258 million. There was a EUR 177 million outflow for acquisitions of businesses, mainly related to the acquisition of a 51% interest in the General Lighting Company (GLC) in The Kingdom of Saudi Arabia (KSA), and a EUR 81 million outflow for non-current financial assets, mainly in the form of a EUR 60 million loan to TPV Technology Limited.
The net cash impact of acquisitions of businesses and non-current financial assets in 2013 was a total of EUR 24 million. There was a EUR 11 million outflow for acquisitions of businesses and a EUR 13 million outflow for non-current financial assets.
The net cash impact of acquisitions of businesses and financial assets in 2012 was a total of EUR 428 million, mainly related to the acquisition of Indal. The EUR 167
46 Annual Report 2013 632015
4 Group performance 4.1.15 - 4.1.155.1.16
million outflow forDivestments, derivatives and current financial assets mainly related to loans provided to TPV and the TP Vision venture in connection with the divestment of the Television business (EUR 151 million in aggregate).
Divestments and derivatives
Cash proceeds of EUR 9487 million were received from divestment of the Shakespeare business and the sale of shares in Neusoft. Cash flows from derivatives and current financial assets led to a net cash outflow of EUR 7 million.
In 2013, cash proceeds of EUR 93 million were received from divestments, mainly of non-strategic businesses within Healthcare. Cash flows from derivatives and current financial assets led to a net cash outflow of EUR 101 million.
In 2012, cash proceeds of EUR 4 million were received from divestments. Cash flows from derivatives and securities led to a net cash outflow of EUR 46 million.
Cash flows from financing activities
Net cash used for financing activities in 2014 was EUR 1,189 million. Philips’ shareholders were given EUR 729 million in the form of a dividend, of which the cash portion of the dividend amounted to EUR 292 million. The net impact of changes in debt was a decrease of EUR 301 million. Additionally, net cash outflows for share buy-back and share delivery totaled EUR 596 million.
Net cash used for financing activities in 2013 was EUR 1,241 million. Philips’ shareholders were given EUR 678 million in the form of a dividend, of which the cash portion of the dividend amounted to EUR 272 million. The net impact of changes in debt was a decrease of EUR 407 million, including the redemption of a USD 143 million bond. Additionally, net cash outflows for share buybackbuy-back and share delivery totaled EUR 562 million.
Net cash used for financing activities in 2012 was EUR 293 million. Philips’ shareholders were given EUR 687 million in the form of a dividend, of which the cash portion of the dividend amounted to EUR 255 million. The net impact of changes in debt was an increase of EUR 730 million, including the issuance of USD 1.5 billion in bonds, partially offset by the early redemption of a USD 500 million bond. Additionally, net cash outflows for share buy-back and share delivery totaled EUR 768 million.
The year 2012
Cash flows from operating activities
Net cash flow from operating activities amounted to EUR 2,082 million in 2012, compared to EUR 760 million in 2011. The year-on-year improvement was largely attributable to lower working capital outflows, mainly related to accounts payable, as well as higher cash earnings. The increase in other current liabilities included a payable of EUR 509 million related to the European Commission fine. Excluding the fine payable, the increase in accounts payable and accrued and other current liabilities was attributable to increased volume from higher sales, while the outflow in 2011 was attributable to a tightening of vendor payments in the operating sectors.
Cash flows from investing activities
2012 cash flows from investing activities resulted in a net outflow of EUR 925 million. This was attributable to EUR 455 million cash used for net capital expenditures, EUR 261 million used for acquisitions, as well as a EUR 167 million outflow for financial assets, mainly due to loans provided to TPV and the TP Vision venture in connection with the divestment of the Television business (EUR 151 million in aggregate).
In 2011, cash flows from investing activities resulted in a net outflow of EUR 1,275 million. This was attributable to EUR 857 million cash used for net capital expenditures and EUR 550 million used for acquisitions, mainly for Povos, Preethi and Sectra. This was partly offset by EUR 106 million proceeds from the sale of financial assets and divestments, mainly TCL and Digimarc shares.
Net capital expenditures
Net capital expenditures totaled EUR 455 million, which was EUR 402 million lower than in 2011, mainly reflecting the impact of proceeds received from the sale of the High Tech Campus of EUR 425 million (consisting of a EUR 373 million cash transaction and an amount of EUR 52 million that will be received in future years) and the divestment of Philips’ 50% ownership right in the Senseo trademark to Sara Lee for EUR 170 million. Excluding these impacts, higher investments were visible in all sectors, notably additional growth-focused investments at Lighting.
Acquisitions and financial assets
The net cash impact of acquisitions of businesses and financial assets in 2012 was a total of EUR 428 million, mainly related to the acquisition of Indal. The EUR 167 million outflow for financial assets mainly related to loans provided to TPV and the TP Vision venture in connection with the divestment of the Television business (EUR 151 million in aggregate).
The net cash impact of acquisitions of businesses and financial assets in 2011 was a total of EUR 550 million, mainly related to the acquisitions of Povos, Preethi and Sectra.
Divestments and derivatives
In 2012, cash proceeds of EUR 4 million were received from divestments. Cash flows from derivatives and securities led to a net cash outflow of EUR 46 million.
In 2011, cash proceeds of EUR 106 million were received from divestments, including EUR 69 million from the sale of remaining shares in TCL, as well as divestments
64 Annual Report 2013
4 Group performance 4.1.16 - 4.1.18
of non- strategic businesses within Consumer Lifestyle and Healthcare. Cash flows from derivatives and securities led to a net cash inflow of EUR 26 million.
Cash flows from financing activities
Net cash used for financing activities in 2012 was EUR 293 million. Philips’ shareholders were given EUR 687 million in the form of a dividend of which the cash portion of the dividend amounted to EUR 255 million. The net impact of changes in debt was an increase of EUR 730 million, including the issuance of USD 1.5 billion in bonds, partially offset by the early redemption of a USD 500 million bond. Additionally, net cash outflows for share buyback and share delivery totaled EUR 768 million.
Net cash used for financing activities in 2011 was EUR 1,790 million. Philips’ shareholders were given EUR 711 million in the form of a dividend of which the cash portion of the dividend amounted to EUR 259 million. The net impact of changes in debt was a decrease of EUR 860 million, including the redemption of a EUR 750 million bond, a USD 350 million bond and other debts totaling EUR 1,314 million, partially offset by the drawdown of a EUR 200 million committed facility and other new long-term borrowing totaling EUR 454 million. Additionally, net cash outflows for share buyback and share delivery totaled EUR 671 million.
4.1.165.1.16 Cash flows from discontinued operations
The year 20132015
In 2013,2015, cash inflow from discontinued operations as reported within operating activities amounted to EUR 20679 million, mainly attributable to a cash inflow of EUR 115 million from the Automotive and Lumileds businesses, offset by a cash outflow from the Audio, Video, Multimedia & Accessories business of EUR 37 million.
In 2014, cash inflow from discontinued operations amounted to EUR 193 million. Cash flows from the businesses reported in operating activities amounted to a EUR 105 million cash inflow, mainly attributable to a cash inflow from the Automotive and Lumileds businesses of EUR 240 million, offset by cash outflow from the Audio, Video, Multimedia & Accessories business of EUR 107 million. The cash consideration received for the sale of Audio, Video, Multimedia & Accessories business amounted to EUR 88 million and was used byreported as cash flow from investing activities.
The year 2014
In 2014, cash from discontinued operations.operations amounted to an inflow of EUR 193 million. The combined Automotive and Lumileds businesses had a cash inflow of EUR 240 million attributable to operating activities. The Television business used net cash of EUR 138,8, attributable to cash outflows of EUR 91 million for operating activities and EUR 47 million for investing activities. The Audio, Video Multimedia and Accessories business used net cash of EUR 6819 million, attributable towith cash outflows from operating activities.
In 2012, EUR 126 million cash was used by discontinued operations. The Television business used net cashactivities of EUR 256 million, attributable to operating cash outflows of EUR 296107 million, partly offset by EUR 88 million of cash inflows from investing activitiesactivities.
In 2013, cash from discontinued operations amounted to an outflow of EUR 40115 million. TheCash flows from the businesses reported in operating activities caused by a cash outflow of EUR 68 million, mainly due to cash outflows of the Television business of EUR 91 million, and of the Audio, Video, Multimedia and Accessories business generatedof EUR 72 million offset by a cash inflow of EUR 130 million attributable to operating activities.
The year 2012
In 2012, EUR 126 million cash was used by the discontinued operations. The Television business used net cash of EUR 256 million, attributable to operating cash outflows of EUR 296 million partly offset by cash inflows from investing activities of EUR 40 million. The Audio, Video MultimediaAutomotive and Accessories business generated a cash inflow of EUR 130 million attributable to operating activities.
In 2011, EUR 374 million cash was used by the discontinued operations of the Television and Audio, Video Multimedia and Accessories businesses. The Television business used net cash of EUR 364 million, attributable to operating cash outflows of EUR 270 million and cash outflows to investing activitiesLumileds businesses of EUR 94 million. The Audio, Video Multimedia and AccessoriesA cash outflow of EUR 47 million related to the divestment of the Television business used EUR 10 million of netreported in cash attributable to operatingflow from investing activities.
4.1.175.1.17 Financing
The year 20132015
Condensed consolidated balance sheets for the years 2011, 20122013, 2014 and 20132015 are presented below:
Philips Group
Condensed consolidated balance sheet information1)
in millions of eurosEUR
2013 - 2015
| | | | | | |
| | | | | | | | 2013 | | | 2014 | | | 2015 | |
| | | 2011 | | 2012 | | 2013 | | | | | |
| Intangible assets | | | 11,012 | | | | 10,679 | | | | 9,766 | | | | 9,766 | | | | 10,526 | | | | 12,216 | |
Property, plant and equipment | | | 3,014 | | | | 2,959 | | | | 2,780 | | | | 2,780 | | | | 2,095 | | | | 2,322 | |
Inventories | | | 3,625 | | | | 3,495 | | | | 3,240 | | | | 3,240 | | | | 3,314 | | | | 3,463 | |
Receivables | | | 5,117 | | | | 4,858 | | | | 4,892 | | | | 4,892 | | | | 5,040 | | | | 5,287 | |
Assets held for sale | | | 551 | | | | 43 | | | | 507 | | | | 507 | | | | 1,613 | | | | 1,809 | |
Other assets | | | 2,931 | | | | 3,213 | | | | 2,909 | | | | 2,909 | | | | 3,891 | | | | 4,113 | |
Payables | | | (6,563 | ) | | | (6,210 | ) | | | (5,435 | ) | | | (5,435 | ) | | | (5,293 | ) | | | (5,652 | ) |
Provisions | | | (2,680 | ) | | | (2,956 | ) | | | (2,554 | ) | | | (2,554 | ) | | | (3,445 | ) | | | (3,225 | ) |
Liabilities directly associated with assets held for sale | | | (61 | ) | | | (27 | ) | | | (348 | ) | | | (348 | ) | | | (349 | ) | | | (407 | ) |
Other liabilities | | | (3,871 | ) | | | (4,169 | ) | | | (3,094 | ) | | | (3,094 | ) | | | (4,193 | ) | | | (4,152 | ) |
| | | | | | | | |
| | | 13,075 | | | | 11,885 | | | | 12,663 | | |
Net asset employed | | | | 12,663 | | | | 13,199 | | | | 15,774 | |
Cash and cash equivalents | | | 3,147 | | | | 3,834 | | | | 2,465 | | | | 2,465 | | | | 1,873 | | | | 1,766 | |
Debt | | | (3,860 | ) | | | (4,534 | ) | | | (3,901 | ) | | | (3,901 | ) | | | (4,104 | ) | | | (5,760 | ) |
| | | | | | | | |
Net cash (debt) | | | (713 | ) | | | (700 | ) | | | (1,436 | ) | |
Net debt | | | | (1,436 | ) | | | (2,231 | ) | | | (3,994 | ) |
Non-controlling interests | | | (34 | ) | | | (34 | ) | | | (13 | ) | | | (13 | ) | | | (101 | ) | | | (118 | ) |
Shareholders’ equity | | | (12,328 | ) | | | (11,151 | ) | | | (11,214 | ) | | | (11,214 | ) | | | (10,867 | ) | | | (11,662 | ) |
| | | | | | | | |
Financing | | | | (12,663 | ) | | | (13,199 | ) | | | (15,774 | ) |
| | | (13,075 | ) | | | (11,885 | ) | | | (12,663 | ) | | | | |
| 1) | Please refer to section 11.6,12.6, Consolidated balance sheets, of this report |
Philips expects the financing in 2016 to be broadly in line with 2015.
4.1.185.1.18 Cash and cash equivalents
The year 20132015
In 2015, cash and cash equivalents decreased by EUR 107 million to EUR 1,766 million at year-end. The decrease was mainly attributable to an outflow of EUR 1,137 on acquisitions mainly related to Volcano, cash outflows for treasury share transactions of EUR 425 million, and a cash dividend payout of EUR 298 million. This was partly offset by EUR 1,231 million from increases in debt, EUR 325 million free cash flow and EUR 110 million related to divestments.
Annual Report 2015 47
Group performance 5.1.19
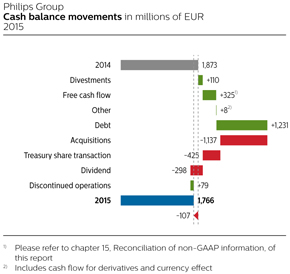
The year 2014
In 2014, cash and cash equivalents decreased by EUR 592 million to EUR 1,873 million at year-end. The decrease was mainly attributable to an outflow on cash outflows for treasury share transactions of EUR 596 million, cash dividend payout of EUR 292 million, EUR 301 million from decreases in debt and a EUR 258 million outflow related to acquisitions. This was partly offset by a EUR 497 million free cash flow.
In 2013, cash and cash equivalents decreased by EUR 1,369 million to EUR 2,465 million at year-end. The decrease was mainly attributable to an outflow on net capital expenditures of EUR 966830 million, cash outflows
Annual Report 2013 65
4 Group performance 4.1.19 - 4.1.19
outflow for treasury share transactions of EUR 562 million, cash dividend payout of EUR 272 million, EUR 407 million from decreases in debt and a EUR 206115 million outflow related to discontinued operations. This was partly offset by a EUR 1,138912 million inflow from operations.
In 2012, cash and cash equivalents increased by EUR 687 million to EUR 3,834 million at year-end. The increase was mainly attributable to cash inflows from operations amounting to EUR 2,082 million and EUR 730 million from increases in debt. This was partly offset by a EUR 768 million outflow for treasury share transactions, an outflow on net capital expenditures of EUR 455 million, a EUR 428 million outflow for acquisitions of businesses and financial assets, a EUR 255 million outflow for the cash dividend payout, and a EUR 126 million outflow related to discontinued operations.
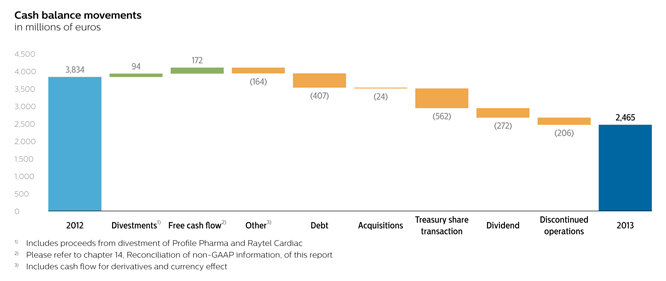
The year 2012
In 2012, cash and cash equivalents increased by EUR 687 million to EUR 3,834 million at year-end. The increase was mainly attributable to cash inflows from operations amounting to EUR 2,082 million and EUR 730 million from increases in debt. This was partly offset by a EUR 768 million outflow for treasury share transactions, an outflow on net capital expenditures of EUR 455 million, a EUR 428 million outflow for acquisitions of businesses and financial assets, a EUR 255 million outflow for the cash dividend payout, and a EUR 126 million outflow related to discontinued operations.
In 2011, cash and cash equivalents decreased by EUR 2,686 million to EUR 3,147 million at year-end. The decrease was mainly attributable to an outflow on net capital expenditures of EUR 857 million, a EUR 860 million decrease in debt, a EUR 671 million outflow for treasury share transactions, a EUR 550 million outflow for acquisitions of businesses and financial assets, and a EUR 259 million outflow for the cash dividend payout. This was partly offset by cash inflows from operations amounting to EUR 760 million, EUR 106 million in proceeds from divestments, and a EUR 374 million outflow related to discontinued operations.
4.1.195.1.19 Debt position
The year 20132015
Total debt outstanding at the end of 20132015 was EUR 3,9015,760 million, compared with EUR 4,5344,104 million at the end of 2012.2014.
Philips Group
Changes in debt
in millions of eurosEUR
| | | | | | | | | | | | |
| | | 2011 | | | 2012 | | | 2013 | |
New borrowings | | | (454 | ) | | | (1,361 | ) | | | (64 | ) |
Repayments | | | 1,314 | | | | 631 | | | | 471 | |
Consolidation and currency effects | | | (62 | ) | | | 56 | | | | 226 | |
| | | | |
Total changes in debt | | | 798 | | | | (674 | ) | | | 633 | |
2013 - 2015
| | | | | | | | | | | | |
| | | | |
| | | 2013 | | | 2014 | | | 2015 | |
| | | | |
New borrowings | | | (64 | ) | | | (69 | ) | | | (1,335 | ) |
Repayments | | | 471 | | | | 370 | | | | 104 | |
Currency effects and consolidation changes | | | 226 | | | | (504 | ) | | | (425 | ) |
| | | | |
Changes in debt | | | 633 | | | | (203 | ) | | | (1,656 | ) |
| | | | |
In 2015, total debt increased by EUR 1,656 million. New borrowings of EUR 1,335 million were mainly due to a short-term bridging loan with low interest rate used for the Volcano acquisition, while repayments amounted to EUR 104 million. Other changes resulting from consolidation and currency effects led to an increase of EUR 425 million.
In 2014, total debt increased by EUR 203 million. New borrowings of EUR 69 million consisted mainly of replacements to lease contracts. Repayment of EUR 370 million included a EUR 250 million repayment of a five-year loan. Other changes resulting from consolidation and currency effects led to an increase of EUR 504 million.
At the end of 2015, long-term debt as a proportion of the total debt stood at 71% with an average remaining term of 10.7 years, compared to 90% and 11.6 years at the end of 2014.
For further information, please refer to note 18, Debt.
The year 2014
Total debt outstanding at the end of 2014 was EUR 4,104 million, compared with EUR 3,901 million at the end of 2013.
In 2014, total debt increased by EUR 203 million. New borrowings of EUR 69 million consisted mainly of replacements to lease contracts. Repayment of EUR 370 million included a EUR 250 million repayment of a five year loan. Other changes resulting from consolidation and currency effects led to an increase of EUR 504 million.
In 2013, total debt decreased by EUR 633 million. New borrowings of EUR 64 million consisted mainly of replacements to lease contracts. Repayment of EUR 471 million included a USD 143 million redemption on USD bonds as well as payments on short-term debt. Other changes resulting from consolidation and currency effects led to a decrease of EUR 226 million.
In 2012, total debt increased by EUR 674 million. New borrowings of EUR 1,361 million included the issuance of USD 1.5 billion in bonds. Repayment of EUR 631
66 Annual Report 2013
4 Group performance 4.1.20 - 4.1.21
million included early redemption of a USD 500 million bond. Other changes resulting from consolidation and currency effects led to a decrease of EUR 56 million.
Long-term debt as a proportion of the total debt stood at 85%90% at the end of 20132014 with an average remaining term of 12.811.6 years, compared to 82%85% and 12.712.8 years at the end of 2012.2013.
For further information, please refer to note 20, Long-term debt and short-term debt.18, Debt.
5.1.20 Shareholders’ equity
The year 20122015
Total debtShareholders’ equity increased by EUR 795 million in 2015 to EUR 11,662 million at December 31, 2015. The increase was mainly a result of EUR 645 million net income and EUR 791 million of other comprehensive income, partially offset by EUR 507 million related to the purchase of shares for the share buy-back program. The dividend payment to shareholders in 2015 reduced equity by EUR 298 million including tax and service charges, while the delivery of treasury shares increased equity by EUR 82 million and net share-based compensation plans increased equity by EUR 82 million.
48 Annual Report 2015
Group performance 5.1.21
The number of outstanding common shares of Royal Philips at December 31, 2015 was 917 million (2014: 914 million). At the end of 2015, the Company held 11.8 million shares in treasury to cover the future delivery of shares (2014: 17.1 million shares). This was in connection with the 39.1 million rights outstanding at the end of 2012 was EUR 4,5342015 (2014: 40.8 million compared with EUR 3,860 million atrights) under the Company’s long-term incentive plans. At the end of 2011.2015, the Company held 2.2 million shares for cancellation (2014: 3.3 million shares).
In 2012, total debt increased by EUR 674 million. New borrowings of EUR 1,361 million included the issuance of USD 1.5 billion in bonds. Repayment of EUR 631 million included early redemption of a USD 500 million bond. Other changes resulting from consolidation and currency effects led to a decrease of EUR 56 million.The year 2014
In 2011, total debtShareholders’ equity decreased by EUR 798 million.347 million in 2014 to EUR 10,867 million at December 31, 2014. The repaymentdecrease was mainly a result of EUR 1,314714 million included redemptionrelated to purchase shares for the share buy-back program and coverage for the LTI program, partially offset by EUR 415 million net income and EUR 50 million of aother comprehensive income. The dividend payment to shareholders in 2014 reduced equity by EUR 750293 million bond, a USD 350including tax and service charges, while the delivery of treasury shares increased equity by EUR 116 million bond, and ashare-based compensation plans increased equity by EUR 217 million repayment of short-term debt. New borrowing and finance leases amounted to EUR 45488 million. Other changes resulting from consolidation and currency effects led to an increase of EUR 62 million.
Long-term debt as a proportion of the total debt stood at 82% at the end of 2012 with an average remaining term of 12.7 years, compared to 85% and 10.4 years at the end of 2011.
For further information, please refer to note 20, Long-term debt and short-term debt.
4.1.20 Net debt to group equity
The year 2013
Philips ended 2013 in a net debt position (cash and cash equivalents, net of debt) of EUR 1,436 million, compared to a net debt position of EUR 700 million at the end of 2012.
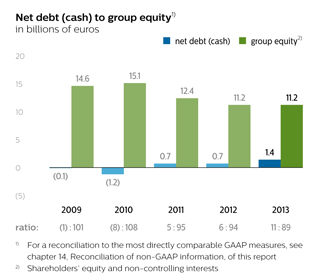
The year 2012
Philips ended 2012 in a net debt position (cash and cash equivalents, net of debt) of EUR 700 million, compared to a net debt position of EUR 713 million at the end of 2011.
4.1.21 Shareholders’ equity
The year 2013
Shareholders’ equity increased by EUR 63 million in 2013 to EUR 11,214 million at December 31, 2013. The increase was mainly a result of EUR 1,169 million net income, partially offset by EUR 476 million of currency translation losses and a EUR 669 million related to the purchase of treasury shares. The dividend payment to shareholders in 2013 reduced equity by EUR 272 million, while the delivery of treasury shares increased equity by EUR 118 million and the share premium due to share-based compensation plans increased equity by EUR 105 million.
Shareholders’ equity decreased by EUR 1,177 million in 2012 to EUR 11,151 million at December 31, 2012. The decrease was mainly as a result of EUR 816 million related to the purchase of treasury shares, EUR 100 million of currency translation losses and a EUR 35 million net loss. The dividend payment to shareholders in 2012 reduced equity by EUR 259 million. The decrease was partially offset by a EUR 50 million increase related to the delivery of treasury shares and a EUR 84 million increase in share premium due to share-based compensation plans.
The number of outstanding common shares of Royal Philips at December 31, 20132014 was 914 million (2013: 913 million (2012: 915 million).
Annual Report 2013 67
4 Group performance 4.1.22 - 4.1.22
At the end of 2013,2014, the Company held 20.717.1 million shares in treasury to cover the future delivery of shares (2012: 28.7(2013: 20.7 million shares). This was in connection with the 44.340.8 million rights outstanding at the end of 2013 (2012: 52.32014 (2013: 44.3 million rights) under the Company’s long-term incentive plans. At the end of 2013,2014, the Company held 3.93.3 million shares for cancellation (2012: 13.8(2013: 3.9 million shares).
5.1.21 Net debt to group equity
The year 20122015
Shareholders’ equity decreased by EUR 1,177 millionPhilips ended 2015 in 2012 to EUR 11,151 million at December 31, 2012. The decrease was mainly as a resultnet debt position (total debt less cash and cash equivalents) of EUR 8163,994 million, relatedcompared to the purchasea net debt position of treasury shares, EUR 1002,231 million of currency translation losses and a EUR 35 million of net loss. The dividend payment to shareholders in 2012 reduced equity by EUR 259 million. The decrease was partially offset by a EUR 50 million increase related to the delivery of treasury shares and a EUR 84 million increase in share premium due to share-based compensation plans.
Shareholders’ equity decreased by EUR 2,693 million in 2011 to EUR 12,328 million at December 31, 2011. The decrease was mainly as a result of a EUR 1,460 million net loss as well as EUR 751 million related to the purchase of treasury shares. The dividend payment to shareholders in 2011 reduced equity by EUR 263 million. The decrease was partially offset by a EUR 46 million increase related to the delivery of treasury shares and a EUR 56 million increase in share premium due to share-based compensation plans.
The number of outstanding common shares of Royal Philips at December 31, 2012 was 915 million (2011: 926 million).
At the end of 2012, the Company held 28.7 million shares in treasury to cover the future delivery of shares (2011: 33.6 million shares). This was in connection with the 52.3 million rights outstanding at the end of 2012 (2011: 47.12014.
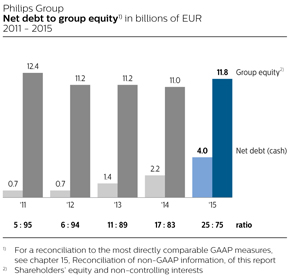
The year 2014
Philips ended 2014 in a net debt position (total debt less cash and cash equivalents) of EUR 2,231 million, rights) under the Company’s long-term incentive plan and convertible personnel debentures. Atcompared to a net debt position of EUR 1,436 million at the end of 2012, the Company held 13.8 million shares for cancellation (2011: 49.3 million shares).2013.
4.1.225.1.22 Liquidity position
The year 2015
Including the Company’s net debt (cash)cash position (cash and cash equivalents, net of debt)equivalents), listed available-for-sale financial assets, as well as its EUR 1.8 billion committed revolving credit facility, the Company had access to net available liquid resourcesliquidity of EUR 4293,566 million vs. Gross Debt (including short and long-term) of EUR 5,760 million as of December 31, 2013, compared2015.
Including the Company’s cash position (cash and cash equivalents), as well as its EUR 1.8 billion committed revolving credit facility, the Company had access to available liquidity of EUR 1,2203,673 million one year earlier.vs. Gross Debt (including short and long-term) of EUR 4,104 million as of December 31, 2014.
Philips Group
Liquidity position
in millions of eurosEUR
2013 - 2015
| | | | | | | | | | | | |
| | | 2011 | | | 2012 | | | 2013 | |
Cash and cash equivalents | | | 3,147 | | | | 3,834 | | | | 2,465 | |
Committed revolving credit facility/CP program/Bilateral loan | | | 3,200 | | | | 1,800 | | | | 1,800 | |
| | | | |
Liquidity | | | 6,347 | | | | 5,634 | | | | 4,265 | |
Available-for-sale financial assets at fair value | | | 110 | | | | 120 | | | | 65 | |
Short-term debt | | | (582 | ) | | | (809 | ) | | | (592 | ) |
Long-term debt | | | (3,278 | ) | | | (3,725 | ) | | | (3,309 | ) |
| | | | |
Net available liquidity resources | | | 2,597 | | | | 1,220 | | | | 429 | |
The fair value of the Company’s available-for-sale financial assets amounted to EUR 65 million.
| | | | | | | | | | | | |
| | | | |
| | | 2013 | | | 2014 | | | 2015 | |
| | | | |
Cash and cash equivalents | | | 2,465 | | | | 1,873 | | | | 1,766 | |
Committed revolving credit facility/CP program/Bilateral loan | | | 1,800 | | | | 1,800 | | | | 1,800 | |
| | | | |
Liquidity | | | 4,265 | | | | 3,673 | | | | 3,566 | |
Available-for-sale financial assets at fair value | | | 65 | | | | 75 | | | | 75 | |
Short-term debt | | | (592 | ) | | | (392 | ) | | | (1,665 | ) |
Long-term debt | | | (3,309 | ) | | | (3,712 | ) | | | (4,095 | ) |
| | | | |
Net available liquidity resources | | | 429 | | | | (356 | ) | | | (2,119 | ) |
| | | | |
Philips has a EUR 1.8 billion committed revolving credit facility that can be used for general corporategroup purposes and as a backstop of its commercial paper program. In January 2013, the EUR 1.8 billion facility was extended by 2 years untilprogram and will mature in February 2018. The commercial paper program amounts to USD 2.5 billion, under which Philips can issue commercial paper up to 364 days in
Annual Report 2015 49
Group performance 5.1.22
tenor, both in the US and in Europe, in any major freely convertible currency. There is a panel of banks, in Europe and in the US, which service the program. The interest is at market rates prevailing at the time of issuance of the commercial paper. There is no collateral requirement in the commercial paper program. Also, there are no limitations on Philips’ use of funds from the program. As at December 31, 2013,2015, Philips did not have any loans outstanding under these facilities.
Philips’ existing long-term debt is rated A3Baa1 (with stable outlook) by Moody’s and A-BBB+ (with stable outlook) by Standard & Poor’s. ItOur net debt position is Philips’ objectivemanaged in such a way that we expect to manage its financial ratiosretain a strong investment grade credit rating. Furthermore, the Group’s aim when managing the net debt position is dividend stability and a pay-out ratio of 40% to be in line50% of continuing net income. Following the intended separation of the Lighting business, the dividend pay-out ratio with an A3/A- rating. There is no assurance that Philips willrespect to future years could be able to achieve this goal. Ratings are subject to change at any time. Outstandingchange. The Company’s outstanding long-term bondsdebt and credit facilities do not have a repetitive material adverse change clause,contain financial covenants or credit-rating-related acceleration possibilities.cross-acceleration provisions that are based on adverse changes in ratings or on material adverse change.
As at December 31, 2013,2015, Philips had total cash and cash equivalents of EUR 2,4651,766 million. Philips pools cash from subsidiaries to the extent legally and economically feasible. Cash not pooled remains
68 Annual Report 2013
4 Group performance 4.1.22 - 4.1.23
available for local operational or investment needs. Philips had a total gross debt position of EUR 3,901 million at year-end 2013.
Philips believes its current workingliquidity and direct access to capital markets is sufficient to meet its present working capital requirements.
4.1.23The year 2014
Including the Company’s cash position (cash and cash equivalents), as well as its EUR 1.8 billion committed revolving credit facility, the Company had access to available liquid resources of EUR 3,673 million vs Gross Debt (including short and long term) of EUR 4,104 million as of December 31, 2014.
5.1.23 Cash obligations
Contractual cash obligations
Presented below is a summary of the Group’s contractual cash obligations and commitments at December 31, 2013.2015.
Philips Group
Contractual cash obligations at December 31, 2013
1)in millions of eurosEUR1)
2015
| | | | payments due by period | | | | | |
| | | | | | less | | | | | | | | | | | | | | | Payments due by period | |
| | | | | | than 1 | | | 1-3 | | | 3-5 | | | after 5 | | | | | | | |
| | | total | | | year | | | years | | | years | | | years | | | | | | less | | | | | | | | | | |
| | | | | | than 1 | | | 1-3 | | | 3-5 | | | after 5 | |
Long-term debt2) | | | 3,472 | | | | 308 | | | | 2 | | | | 900 | | | | 2,262 | | |
| | | | total | | | year | | | years | | | years | | | years | |
| | | | | |
| Long-term debt2) | | | | 4,034 | | | | 84 | | | | 1,152 | | | | 1 | | | | 2,797 | |
Finance lease obligations | | | 241 | | | | 61 | | | | 78 | | | | 34 | | | | 68 | | | | 242 | | | | 72 | | | | 92 | | | | 36 | | | | 42 | |
Short-term debt | | | 230 | | | | 230 | | | | — | | | | — | | | | — | | | | 1,515 | | | | 1,515 | | | | — | | | | — | | | | — | |
Operating leases | | | 1,017 | | | | 237 | | | | 316 | | | | 182 | | | | 282 | | | | 952 | | | | 243 | | | | 280 | | | | 162 | | | | 267 | |
Derivative liabilities | | | 337 | | | | 112 | | | | 93 | | | | 92 | | | | 40 | | | | 995 | | | | 253 | | | | 383 | | | | 156 | | | | 203 | |
Interest on debt3) | | | 2,421 | | | | 185 | | | | 346 | | | | 315 | | | | 1,575 | | |
Purchase obligations4) | | | 184 | | | | 81 | | | | 76 | | | | 26 | | | | 1 | | |
Interest on debt3) | | | | 2,767 | | | | 221 | | | | 438 | | | | 334 | | | | 1,774 | |
Purchase obligations4) | | | | 175 | | | | 68 | | | | 69 | | | | 30 | | | | 8 | |
Trade and other payables | | | 2,462 | | | | 2,462 | | | | — | | | | — | | | | — | | | | 2,673 | | | | 2,673 | | | | — | | | | — | | | | — | |
| | | | | | | | |
Contractual cash obligations | | | | 13,353 | | | | 5,129 | | | | 2,414 | | | | 719 | | | | 5,091 | |
| | | 10,364 | | | | 3,676 | | | | 911 | | | | 1,549 | | | | 4,228 | | | | | |
| 1) | DataObligations in this table are undiscounted
|
| 2) | Long-term debt includes short-term portion of long-term debt and excludes finance lease obligations |
| 3) | Approximately 20%32% of the debt bears interest at a floating rate. The majority of the interest payments on variable interest rate loans in the table above reflect market forward interest rates at the period end and these amounts may change as the market interest rate changes |
| 4) | Philips has commitments related to the ordinary course of business which in general relate to contracts and purchase order commitments for less than 12 months. In the table, only the commitments for multiple years are presented, including their short-term portion |
Philips has no material commitments for capital expenditures.
Additionally, Philips has a number of commercial agreements, such as supply agreements, which provide that certain penalties may be charged to the Company if it does not fulfill its commitments.
Certain Philips suppliers factor their trade receivables from Philips with third parties through supplier finance arrangements. At December 31, 20132015 approximately EUR 343395 million of the Philips accounts payablespayable were known to have been sold onward under such arrangements whereby Philips confirms invoices. Philips continues to recognize these liabilities as trade payables and will settle the liabilities in line with the original payment terms of the related invoices.
Other cash commitments
The Company and its subsidiaries sponsor post-employment benefit plans in many countries in accordance with legal requirements, customs and the local situation in the countries involved. For a discussion of the plans and expected cash outflows, please refer to note 30,20, Post-employment benefits.
The Company had EUR 203297 million restructuring-related provisions by the end of 2013,2015, of which EUR 128228 million is expected to result in cash outflows in 2014.2016. Refer to note 21,19, Provisions for details of restructuring provisions and potential cash flow impact for 2014 and further.provisions.
50 Annual Report 2015
Group performance 5.1.23
A proposal will be submitted to the upcoming Annual General Meeting of Shareholders to declare a distributiondividend of EUR 0.80 per common share (up to EUR 740 million), in cash or shares at the option of the shareholder, against the net income for 2013.2015 and retained earnings. Further details will be given in the agenda for the Annual General Meeting of Shareholders, to be held on May 1, 2014.12, 2016.
Guarantees
Philips’ policy is to provide guarantees and other letters of support only in writing. Philips does not provide other forms of support. At the end of 2013,2015, the total fair value of guarantees recognized by Philips in other non-current liabilitieson the balance sheet amounted to less than EUR 1 million. The following table outlines the total outstanding off- balance sheetnil million (December 31, 2014: EUR nil million). Remaining off-balance-sheet business and credit-related guarantees and business-related guarantees provided by Philips for the benefiton behalf of unconsolidated companies and third parties as at Decemberand associates increased by EUR 16 million during 2015 to EUR 37 million (December 31, 2012 and 2013.
Annual Report 2013 69
4 Group performance 4.1.23 - 4.1.24
2014: EUR 21 million).
Expiration per period
in millions of euros
| | | | | | | | | | | | | | | | |
| | | total
amounts
committed | | | less than 1
year | | | 1-5 years | | | after 5 years | |
2013 | | | | | | | | | | | | | | | | |
Business-related guarantees | | | 292 | | | | 107 | | | | 117 | | | | 68 | |
Credit-related guarantees | | | 41 | | | | 19 | | | | 7 | | | | 15 | |
| | | | |
| | | 333 | | | | 126 | | | | 124 | | | | 83 | |
2012 | | | | | | | | | | | | | | | | |
Business-related guarantees | | | 295 | | | | 113 | | | | 114 | | | | 68 | |
Credit-related guarantees | | | 27 | | | | 11 | | | | — | | | | 16 | |
| | | | |
| | | 322 | | | | 124 | | | | 114 | | | | 84 | |
4.1.24 Supply management5.1.24 Procurement
The year 20132015
Global growth remained moderate during 2015. While the advanced economies showed a modest recovery, the emerging markets showed further declines in their growth rates. Main themes in 2015 were further signs of weakening economic growth in emerging markets, especially in China, strongly declining oil prices, commodity prices trending down slightly, and currency volatility.
Growth within the US, Europe and Japan was supported by declining oil and material prices, monetary policies and, in the case of Europe, the euro currency depreciation – the euro fell approximately 15% against the US dollar. The emerging market currencies more generally saw sharp depreciation and volatility during 2015, and the Chinese renminbi devalued as well.
Commodity prices continued to weaken in 2015. After increasing in the spring from their January lows, oil prices declined sharply, reflecting a combination of weaker global demand and steady supply growth, both from conventional oil fields as well as from shale production. The supply outlook was even larger following the nuclear deal with the Republic of Iran, resulting in additional supply from Iran on the global market.
Metal prices also fell on weaker global demand, especially due to the slowdown in manufacturing activity in China, but also because of increases in inventories and supply following the past mining investments.
Market prices for steel continued to fall. Current price levels are in some cases below levels seen during the lows of 2009. No change is foreseen in the short-term as demand remains steady but weak, supply remains excessive and the cost of the raw materials iron ore and coking coal are low.
The lower commodity market prices created a tailwind for Philips Procurement in 2015. Depending on economic conditions this may remain so in 2016. On the other hand, the current low level of raw material and energy prices also creates the risk of new headwind once the supply/demand situation reverses.
Concerning shortages, neon gas supply was tight globally, leading to a price peak in the course of 2015. This situation has normalized in the meantime. The helium tightness is not over yet, but supply continuity is not at risk for Philips.
The rapid progress of the Procurement transformation has led to a continued improvement in overall Procurement results. This has had a major positive and structural impact on overall cost levels in all Philips businesses.
The year 2014
Throughout 2013 the average2014, market prices for energy and raw materials whichshowed diverse trends. These commodities represent approximately 15% of our direct and indirect spend, remained fairly stable compared tospend. Within the average for 2012. The potential impact of improving economic conditions in mature economiesmetals commodity group, copper prices declined in the second halfcourse of the year, was offset by a simultaneous slow-down of demandwhereas others, e.g. aluminum, showed an upward trend. Also, in growth geographies, especially in China. Steelsteel and other metalsresins, differences were seen between grades and regions. In general, annual average market prices were stable at a historically low level, while oilaround 2013 levels. The global slowdown in the economy, and plastics stabilized at a higher level. Given the economic circumstances it was remarkable that packagingmore specifically slow growth in China, did not yet lead to lower commodity market prices increased in 2013.the first quarters of 2014. From Q4, prices for raw materials, and especially oil, started to significantly decline as a consequence of the continuing macroeconomic weakness, resulting in oversupplied markets.
Rare earth element prices continued to slide, and this has contributed to realizing higher savings levels in 2013.2014. Contingency measures are in place to delay and mitigate the impact of a possible new hike in the price of rare earths in the future. The major successestight availability ofEco-Halogen xenon for halogen lamps has relaxed, and similar products inalso the market have fueledprice level has started to come down. This is partly caused by lower demand for Xenon, which is used as a filler gashalogen lamps in these lamps. Since global production has not increased, this has led to tight supply and a price peak. Therefore a major effort was made resulting in replacement of Xenon by an alternative gas for a large part of the portfolio by the end of 2013.end-markets. The availability and price of helium remainscontinues to be a constant concern, though acute shortages have not occured. Technicalbut measures have been taken to almost completely prevent loss of helium in our operations.
Thanks to a rigid procurement focus on organizational set-up and performance drivers,mitigate the overall procurement performance improved substantially in 2013 in accordance with the plan to save an additional EUR 1 billion. This is supporting the competitiveness of our business propositions. All parts of the new Procurement organization have contributed to this improvement.
The year 2012
In the course of 2012, the market prices of energy and raw materials, which together represent 15% of our purchasing spend, showed diverse trends in a very volatile market. Prices of most metals dropped from their high levels in 2011 largely as a consequence of the slowdown of the global economy, and especially due to slower Chinese consumption growth. In spite of the economic slowdown, energy prices kept their high price levels in 2012, mainly due to market fears and uncertainty from turbulence in various oil-producing countries in 2012.
70 Annual Report 2013
4 Group performance 4.2 - 4.2.2
impact.
4.25.2 Social performance
Our businesses provide innovative solutions that address major trends affecting the world – the demand for affordable healthcare, the need for greater energy efficiency, resource scarcity, and the desire for personal well-being.
In 2013,
Annual Report 2015 51
Group performance 5.2
Philips further strengthened its focus on sustainability. Thissustainability in 2015 through a number of initiatives described in the Social and Environmental performance sections, including the introduction of new products and solutions and partnerships with the Red Cross and UNICEF through the Philips Foundation.
Our people
At Philips, a key element of our vision is rooted into offer the best place to work for people who share our long-standingpassion. Our people are one of our unique strengths, and each one of our employees is instrumental to Philips’ success. Our strategy is based on the belief that sustainabilityevery employee at Philips has talent and can grow and contribute with increasing impact, so we support all individuals in driving their development. We believe that the best place to work is a key enableran inclusive place to work, and we celebrate and foster an inclusive culture where everyone feels valued, respected, and where all of value creationour people can thrive.
Our company people strategy is directly linked to our business strategy. In 2015, we continued on our path to creating two winning stand-alone companies, including ensuring the timely allocation of our employees to either Royal Philips or to Philips Lighting. We also continued to drive our Accelerate! transformation through our growth and offersperformance culture, where we take ownership, we are eager to win, we team up to excel, and we always act with integrity. Alongside these behaviors, we focus on nurturing six competences which accelerate our transformation, and we offer related learning and development opportunities to innovateall employees through our way out ofPhilips University.
“Philips people share a passion for improving people’s lives through meaningful innovation, and this passion has kept us all working together towards our common mission and vision during the challenging economic circumstances. Therefore, sustainability is an integralpast year. Throughout 2015, our people have demonstrated that we are one Philips family, even if we know that we will ultimately be part of Philips’ visionRoyal Philips or of Philips Lighting. As CHRO, I am proud to belong to Philips, and strategy.proud to be one of our Philips people.”
4.2.1Denise Haylor
Chief Human Resources Officer
5.2.1 Improving people’s lives
At Philips, we strive to make the world healthier and more sustainable through innovation. Our goal is to improve the lives of 3 billion people a year by 2025. To guide our efforts and measure our progress, we take a two-dimensional approach – social and ecological – to improving people’s lives. Products and solutions from our portfolio that directly support the curative (care) or preventive (well-being) side of people’s health determine the contribution to the social dimension. As healthy ecosystems are also needed for people to live a healthy life, the contribution to the ecological dimension is determined by means of our steadily growing Green Product portfolio, such as our energy-efficient lighting.
Through Philips products and solutions that directly support the curative or preventive side of people’s health, we improved the lives of 630881 million people in 2013,2015, driven by our Healthcare sector. Additionally, our well-being products that help people live a healthy life improved the lives of 304 million, and our Green Products that contribute to a healthy ecosystem improved the lives of 290 million and 1.491.7 billion people respectively.people. After the elimination of double counts - people–people touched multiple times -– we arrived at 1.82.0 billion lives. This is an increase of 100around 140 million compared to our total baseline of 1.7 billion people a year, established2014, mainly driven by Healthcare in 2012. Greater China and North America, Consumer Lifestyle in Greater China, ASEAN and North America, and Lighting in North America and the Indian subcontinent.
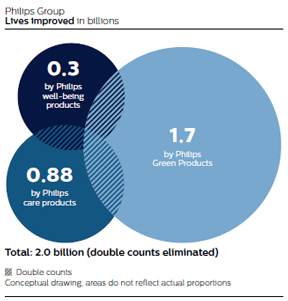
More information on this metric can be found in chapter 13, Sustainability statements, of this report.
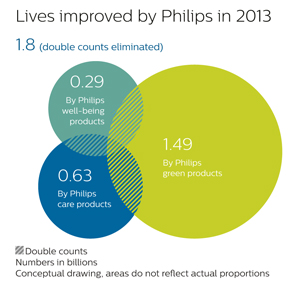
4.2.25.2.2 Employee engagement
Employee engagement is key to our competitive performance.performance and at the heart of our vision, promoting the best place to work for people who share our passion. Engaged employees are emotionally committed to and proud of our company, they help us meet our business goals, and they contribute to making our workplace the best it can be. We can only truly offer an environment in which all our people can thrive when we maintain a dialogue with our people to understand their needs. Our employees take the time for this dialogue, directly shaping the work environment and our inclusive culture. As a result, high engagement levels not only help make Philips to grow, but also help us to understand our employees’ needs in depth and respond to these in turn.
52 Annual Report 2015
Group performance 5.2.2
Given that employee feedback and input is so critical, we actively track it via quarterly surveys with a greatset of targeted questions. In 2014, we implemented a complementary, team-focused survey called My Accelerate! Survey (MAS) with accompanying promotion of Team Performance Dialogues with People Managers and their teams. This proved to be a positive driver of employee action to increase team effectiveness, and, as a result, we ran MAS in each quarter of 2015 as our way of monitoring engagement.
In 2015, MAS had an average employee response rate of 50% across all four quarters, and we recorded an overall engagement score of 71% favorable across the Philips population. This was in line with 2014 results, and we were pleased to see a significant downward trend in the unfavorable score (decreasing from 17% in 2014 to 7% in 2015).
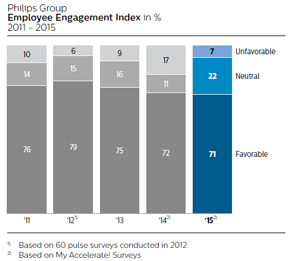
For more information on MAS, please refer to subsection 14.2.1, Engaging our employees, of this report.
5.2.3 Inclusion
At Philips, we believe that the best place to work is an inclusive place to work. This means celebrating and fostering a work environment in which all of our people’s ideas, knowledge, perspectives, experiences and styles are valued. It also means that all individuals are treated fairly and respectfully, have equal access to opportunities and resources, and can contribute fully to Philips’ success. In this report we publish data on international, gender and age diversity, as proxies for the wider inclusion we promote.
Philips is a global company, and our executives originate from more than 35 countries. We have used employee engagement surveys for overembrace a decade to gather feedbackglobal mindset and focus areasactively promote and have seen tangible results alongbuild capability in this area. The composition of our journey.
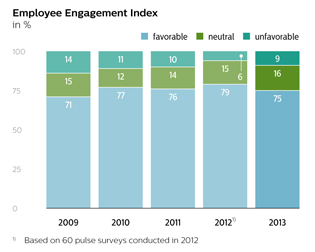
In 2012,terms of gender diversity, we announced our intention to move from an annual measurement of Employee Engagement Survey data to a bi-annual basis in order to allow more time for teams to analyze results and implement improvement actions. We also used this as an opportunity to review the way we approach engagement, with the aim of improving the link between the high levels of employee engagement that we achieve and improved business results.
In 2013 we applied a more contemporary model relevant for the next steps in our journey. While our employee survey using the refreshed methodology is not directly comparable to our historical metric, we see
Annual Report 2013 71
4 Group performance 4.2.2 - 4.2.3
that 75% of our employees provided a favorable response to our new engagement index, 3 points above the external high-performing benchmark. This is a very encouraging result; especially given the speed and scale of our current transformation.
The survey results indicate the following areas as strengths:
Clarity of strategic direction provided by senior leadership
Adopting good ideas from all over the company
Making good use of skills and abilities
Providing opportunities for employees to grow and develop
Senior leaders’ belief in the future of Philips
There are also improvement areas:
Making the changes necessary to compete effectively and applying these changes in a consistent manner
Ability as an organization to fix problems so they don’t happen again
Senior leaders have to do more to ensure we drive collaboration, execution and improvement across organizational boundaries
Focus on customers must continue to strengthen
Need to create a diverse workforce and inclusive culture where people of all backgrounds can succeed in Philips
Engagement is now an integral part of how we build our culture and is an ingredient in a broader portfolio of initiatives and measurement tools. For example, in our end-to-end transformations, we use surveys to ensure forward progress while creating opportunities for team dialogues. We will use shorter, targeted surveys and dialogue platforms to maintain focus on key areas until the next full-census employee survey in 2015.
4.2.3 Diversity and inclusion
We set measurable objectives for achieving diversity and inclusion within Philips. Measuring performance against defined metrics twice annually, Executive Committee members hold their organizations accountable for progress and review actions and outcomes as part of business reviews.
With the roll-out of a revised Diversity and Inclusion (D&I) strategy and the launch of a new global D&I policy in 2013, Philips has taken major steps to clearly anchor diversity and inclusion as priorities and to engage all employees and leaders in contributing to an inclusive work environment. This policy prescribes:
Championing workforce diversity. We embrace unique individuals regardless of race, color, age, gender, gender identity or expression, sexual orientation, language, religion, political or other opinion, disability, national or social origin or birth.
Valuing diverse perspectives. We leverage the diverse thinking, skills, experience and working styles of everyone in our company.
Building a flexible organization. We provide opportunities for work arrangements that accommodate the diverse needs of people at different career and life stages.
Respecting stakeholder diversity. We develop strong and sustainable relationships with diverse stakeholders including customers, communities, governments, suppliers and shareholders.
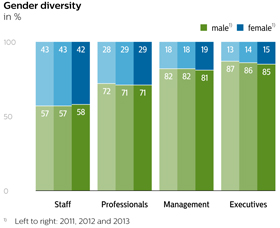
Progress has been made in ensuring a better representation of women in leadership roles: women now constitute 15% of Philips’ executive population,recorded an increase of 1 percentage point year-on-year. Also, we have been appointing more local leaders: at year-end 2013, over 75% of senior leaders in countries were of local origin.
Going forward, driving D&I remains a priority for Philips. While female representation has also increased at professional and management level, Philips has made this an attention point for the coming year as well, recognizing that this is necessary in order to strengthen the leadership pipeline and create a strong basis for sustainable change. Therefore, a commitment has been made to increase the share of women in corporate grades 70 – 90 (refer to professionals and management category in the graphs) by 5 percentage points (per
72 Annual Report 2013
4 Group performance 4.2.3 - 4.2.4.1
grade) by 2016 compared to the 2012 baseline. Over the same period, the share of female executives to 19% at year-end 2015 – up from 18% in 2014. We are well on track to achieve our aspiration of 20% female executives by year-end 2016. This is to increase to 20%driven both by our active engagement of senior female leaders globally, and also by the total executive population.
fact that our inclusion culture is embedded in our people practices, policies and processes. Overall, 35% of Philips employees in 2015 were female. Philips has two women on its7 persons in the Executive Committee (1 female) and two female members of9 in the Supervisory Board. Philips executives come from more than 30 countries.Board (3 females), which means that 4 out of 16 positions (or 25%) are held by women.
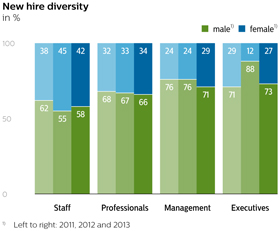

Our comprehensive approach to succession planning for all executives and other key positions ensures we remain on track in terms of our gender targets, and also in terms of our broader inclusion aspirations. This approach drives development and career planning for all individuals, and ensures we build an inclusive work environment not only for today but also for the future. In 2013, Philips employed 35% females, aterms of promotions in 2015, 10% of new Executives promoted internally were women, and women represented 24% of all external Executive hires. The decrease in female Management and Executive new hires compared with 2014 did not impact our overall gender diversity in these categories, as this was mainly offset by the relatively smaller proportion of 1 percentage pointfemale Management and Executive exits. Indeed, compared to 2012.the percentage of women employed by Philips in 2014, we see a relatively higher outflow of women in the staff categories and a lower outflow of female managers and executives. Overall, gender diversity either increased or was stable across all categories, and we will continue to drive gender-inclusive practices in terms of talent attraction, engagement, development and retention in 2016.
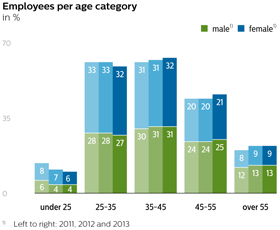
Group performance 5.2.3
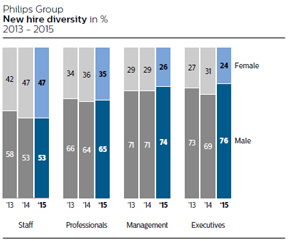
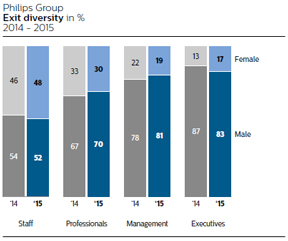
In 2013, employee turnover amounted2015, our age diversity was similar to 16% (15% in non-manufacturing sites; 20% in manufacturing locations), an increase compared to 2012 caused by the changing industrial footprint, divestments at Healthcare, the company’s overhead reduction program and high turnoverthat of manufacturing staff in our factories, mainly2014, with relatively larger shifts taking place in the growth markets.
Employee turnover
categories of women under 25, between 45 and 55, and over 55. We will continue to monitor age diversity as part of our inclusive culture in %2016.
| | | | | | | | | | | | |
| | | 2011 | | | 2012 | | | 2013 | |
Female | | | 13 | | | | 14 | | | | 18 | |
Male | | | 10 | | | | 13 | | | | 15 | |
| | | | |
Philips Group | | | 11 | | | | 14 | | | | 16 | |
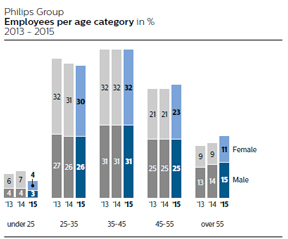
Employee turnover: manufacturing vs non-manufacturing sites
in %
| | | | | | | | |
| | | 2012 | | | 2013 | |
Manufacturing staff | | | 17 | | | | 20 | |
Non-manufacturing staff | | | 12 | | | | 15 | |
| | | | |
Group | | | 14 | | | | 16 | |
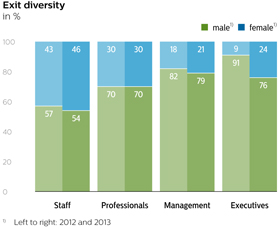
4.2.45.2.4 Employment
The year 20132015
The total number of Philips Group employees (Continued(continuing operations) was 114,689104,204 at the end of 2013,2015, compared to 116,082105,365 at the end of 2012.2014. Approximately 41%38% were employed in the Healthcare sector, 32% in the Lighting sector and 16% in the Consumer Lifestyle sector.
Philips Group
Employees per sectorin FTEs at year-end
2013 - 2015
| | | | | | | | | | | | |
| | | | |
| | | 2013 | | | 2014 | | | 2015 | |
| | | | |
Healthcare | | | 37,008 | | | | 37,065 | | | | 40,099 | |
Consumer Lifestyle | | | 17,255 | | | | 16,639 | | | | 16,254 | |
Lighting | | | 38,671 | | | | 37,808 | | | | 33,618 | |
Innovation, Group & Services | | | 12,703 | | | | 13,853 | | | | 14,233 | |
| | | | |
Continuing operations | | | 105,637 | | | | 105,365 | | | | 104,204 | |
Discontinued operations | | | 10,445 | | | | 8,313 | | | | 8,755 | |
| | | | |
Philips Group | | | 116,082 | | | | 113,678 | | | | 112,959 | |
| | | | |
Compared to 2014, the number of employees in continuing operations decreased by 1,161. The decrease reflects industrial footprint rationalization at Lighting and a reduction in third-party workers at Consumer Lifestyle, partly offset by the consolidation of the Volcano acquisition at Healthcare.
Approximately 54% of the Philips workforce was located in mature geographies, and about 46% in growth geographies. In 2015, the number of employees in mature geographies increased by 1,081, mainly due to the Volcano acquisition at Healthcare. The number of employees in growth geographies decreased by 2,242 largely driven by footprint rationalization at Lighting.
Philips Group
Employees per geographic clusterin FTEs at year-end
2013 - 2015
| | | | | | | | | | | | |
| | | | |
| | | 2013 | | | 2014 | | | 2015 | |
| | | | |
Western Europe | | | 28,944 | | | | 29,105 | | | | 28,590 | |
North America | | | 24,401 | | | | 22,283 | | | | 23,614 | |
Other mature geographies | | | 3,419 | | | | 3,643 | | | | 3,908 | |
| | | | |
Mature geographies | | | 56,764 | | | | 55,031 | | | | 56,112 | |
Growth geographies | | | 48,873 | | | | 50,334 | | | | 48,092 | |
| | | | |
Continuing operations | | | 105,637 | | | | 105,365 | | | | 104,204 | |
Discontinued operations | | | 10,445 | | | | 8,313 | | | | 8,755 | |
| | | | |
Philips Group | | | 116,082 | | | | 113,678 | | | | 112,959 | |
| | | | |
Philips Group
Employmentin FTEs at year-end
2013 - 2015
| | | | | | | | | | | | |
| | | | |
| | | 2013 | | | 2014 | | | 2015 | |
| | | | |
Balance as of January 1 | | | 118,087 | | | | 116,082 | | | | 113,678 | |
Consolidation changes: | | | | | | | | | | | | |
Acquisitions | | | — | | | | 1,506 | | | | 1,865 | |
Divestments | | | (705 | ) | | | (247 | ) | | | (300 | ) |
Changes in discontinued operations | | | (186 | ) | | | (2,132 | ) | | | 442 | |
Other changes | | | (1,114 | ) | | | (1,531 | ) | | | (2,726 | ) |
| | | | |
Balance as of December 31 | | | 116,082 | | | | 113,678 | | | | 112,959 | |
| | | | |
54 Annual Report 2015
Group performance 5.2.5
In 2016, the number of employees is expected to be below the levels of 2015.
In 2015, employee turnover amounted to 16.6% (of which 9.7% was voluntary) compared to 14.9% (6.4% voluntary) in 2014. 2015 turnover was mainly due to the changing industrial footprint and our overhead reduction program.
Philips Group
Employee turnoverin %
2015
| | | | | | | | | | | | | | | | | | | | |
| | | | |
| | | Staff | | | Professionals | | | Management | | | Executives | | | Total | |
| | | | |
Female | | | 20.0 | | | | 12.4 | | | | 11.3 | | | | 13.9 | | | | 16.6 | |
Male | | | 24.0 | | | | 11.3 | | | | 10.2 | | | | 15.2 | | | | 16.6 | |
| | | | |
Philips Group | | | 22.3 | | | | 11.6 | | | | 10.4 | | | | 14.9 | | | | 16.6 | |
| | | | |
Philips Group
Voluntary turnoverin %
2015
| | | | | | | | | | | | | | | | | | | | |
| | | | |
| | | Staff | | | Professionals | | | Management | | | Executives | | | Total | |
| | | | |
Female | | | 11.4 | | | | 7.7 | | | | 5.8 | | | | 8.3 | | | | 9.7 | |
Male | | | 13.9 | | | | 6.8 | | | | 5.1 | | | | 5.9 | | | | 9.7 | |
| | | | |
Philips Group | | | 12.9 | | | | 7.1 | | | | 5.3 | | | | 6.4 | | | | 9.7 | |
| | | | |
The year 2014
The total number of Philips Group employees (continuing operations) was 105,365 at the end of 2014, compared to 105,637 at the end of 2013. Approximately 36% were employed in the Lighting sector, due to the continued vertical integration in this business. Some 32% were employed35% in the Healthcare sector and approximately 16% in the Consumer Lifestyle sector.
Annual Report 2013 73
4 Group performance 4.2.4.1 - 4.2.4.1
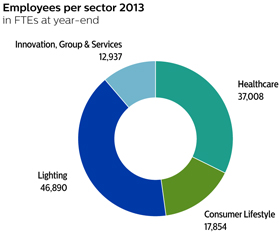
Compared to 2012,2013, the number of employees in continuing operations decreased by 1,393. This272. The decrease reflects a reduction of 688 employees, mainly related to the industrial footprint rationalization at Lighting. It also reflectsLighting, divestments at Healthcare, and a reduction in third-party workers at Consumer Lifestyle, partly offset by the departureconsolidation of 705 employees due to divestmentsthe General Lighting Company (GLC) acquisition at Lighting and an increase in Healthcare.temporary workers in the IT Service Units at IG&S.
Approximately 52% of the Philips workforce was located in mature geographies, and about 48% in growth geographies. In 2013,2014, the number of employees in mature geographies decreased by 1,614,1,733, mainly attributable to reductions relatingdue to the company’s overhead reduction program and the industrial footprint reduction inat Lighting. Growth geographies headcount increased by 221, primarily1,461, largely driven by the GLC acquisition in the growth businesses in Consumer Lifestyle.The Kingdom of Saudi Arabia (KSA).
Employees per sector
in FTEs at year-end
| | | | | | | | | | | | |
| | | 2011 | | | 2012 | | | 2013 | |
Healthcare | | | 37,955 | | | | 37,460 | | | | 37,008 | |
Consumer Lifestyle | | | 15,471 | | | | 16,542 | | | | 17,854 | |
Lighting | | | 53,168 | | | | 50,224 | | | | 46,890 | |
Innovation, Group & Services | | | 13,001 | | | | 11,856 | | | | 12,937 | |
| | | | |
Continuing operations | | | 119,595 | | | | 116,082 | | | | 114,689 | |
Discontinued operations | | | 5,645 | | | | 2,005 | | | | 1,992 | |
| | | | |
| | | 125,240 | | | | 118,087 | | | | 116,681 | |
Employees per geographic cluster
in FTEs at year-end
| | | | | | | | | | | | |
| | | 2011 | | | 2012 | | | 2013 | |
Western Europe | | | 32,901 | | | | 31,126 | | | | 30,514 | |
North America | | | 28,129 | | | | 26,134 | | | | 25,080 | |
Other mature geographies | | | 3,232 | | | | 3,359 | | | | 3,478 | |
| | | | |
Total mature geographies | | | 64,262 | | | | 60,619 | | | | 59,072 | |
Growth geographies | | | 55,333 | | | | 55,463 | | | | 55,617 | |
| | | | |
Continuing operations | | | 119,595 | | | | 116,082 | | | | 114,689 | |
Discontinued operations | | | 5,645 | | | | 2,005 | | | | 1,992 | |
| | | | |
| | | 125,240 | | | | 118,087 | | | | 116,681 | |
Employment
in FTEs
| | | | | | | | | | | | |
| | | 2011 | | | 2012 | | | 2013 | |
Position at beginning of year | | | 119,775 | | | | 125,240 | | | | 118,087 | |
Consolidation changes: | | | | | | | | | | | | |
acquisitions | | | 4,759 | | | | 909 | | | | — | |
divestments | | | (479 | ) | | | (1,024 | ) | | | (705 | ) |
comparable changes | | | (850 | ) | | | (3,398 | ) | | | (688 | ) |
Divestment and other changes in discontinued operations | | | 2,035 | | | | (3,640 | ) | | | (13 | ) |
| | | | |
Position at year-end | | | 125,240 | | | | 118,087 | | | | 116,681 | |
of which: | | | | | | | | | | | | |
continuing operations | | | 119,595 | | | | 116,082 | | | | 114,689 | |
discontinued operations | | | 5,645 | | | | 2,005 | | | | 1,992 | |
The year 2012
The total number of Philips Group employees was 116,082 at the end of 2012, compared to 119,595 at the end of 2011. Approximately 43% were employed in the Lighting sector, due to the continued vertical integration in this business. Some 32% were employed in the Healthcare sector and approximately 14% in the Consumer Lifestyle sector.
Compared to 2011, the number of employees decreased by 3,513. This decrease reflects a reduction of 3,398 employees, mainly related to the company’s overhead reduction program, primarily at Lighting and IG&S. It also reflects the departure of 1,024 employees, mainly due to the industrial footprint reduction at Lighting, and the addition of 909 employees from acquisitions (mainly Indal).
Approximately 52% of the Philips workforce was located in mature geographies, and about 48% in growth geographies. In 2012, the number of employees in mature geographies decreased by 5,036, as the additional headcount from acquisitions was more than offset by reductions relating to the company’s
74 Annual Report 2013
4 Group performance 4.2.5 - 4.2.6
overhead reduction program and the industrial footprint reduction in Lighting. Growth geographies headcount increased by 1,523, primarily in the growth businesses in Consumer Lifestyle.
4.2.55.2.5 Developing our people
Philips’ vision statement includes the following affirmation: “We will be the best place to work for people who sharePhilips University was launched in Q4 2014, and our passion. Together we will deliver superior value for our customersfocus on leader-led learning and shareholders.”
Asbuilding a learning organization as part of our drivegrowth and performance culture continued in 2015. We believe that continuous learning maximizes the potential of all employees –and consequently Philips’ potential to builddeliver for customers and consumers. Philips University embraces a philosophy of learning organization, learners at Philips are supported by a personalized University Portal accessible through all media, which facilitates individualthat balances learning journeys according to the 70 (on-the-job experience): 20 (coaching): 10 (classroom) model.
Our key 2013 objective in terms of leadership development was the creation of a Leadership Academy, based on a strategic framework that differentiates the learning needs of leaders at every level in the organization: Transformation, Transition and Accelerate.
The Academy flagship leadership development programs (including the market programShaping Marketsand the first-time manager programLeading People@Philips) are being co-created in collaboration with leading suppliers and business schools, with a strong emphasis on helping people to developcarried out on the job, and through external coaching and mentoring.
In 2013mentoring, and formal learning methods such as classroom teaching and e-learnings. Presently, we also startedare exploring new learning channels to improve capability building a stronger, more focused and cost-effective approach to assessment for development. We introduced two new assessment tools – Manager Ready, a powerful virtual manager readiness assessment solution which was piloted infocus on business-critical topics and key markets (China, India, ASEAN, Central Europe, Benelux, Middle East & Turkey, androles that will increase the US) and the renewed 360 program based on the new Leadership Competencies and Philips behaviors.
Enrollment in functional curricula programs, including Marketing, Finance, IT, Sales, HR, Procurement and Innovation, decreased to 19,000 from 24,000 in 2012. Oneimpact of the reasons for this reduction is that many functional curriculaUniversity.
More than one million hours in total were reviewed and content rationalizedspent on training through Philips University in 2013, allowing us to redeploy the investment into development of new content.
number of enrollments
| | | | | | | | | | | | | | | | | | | | |
| | | 2009 | | | 2010 | | | 2011 | | | 2012 | | | 2013 | |
Core Curriculum programs | | | 5,500 | | | | 20,000 | | | | 39,500 | | | | 43,000 | | | | 32,500 | |
The Legal curriculum hit the record of 63,000 enrollments, largely driven by the global roll-out of mandatory Compliance programs. In 2013, we also introduced local market programs with specific training modules for our staff in various geographies, including China, India and Africa.
We recorded 1,000 enrollments for the new Philips Excellence curriculum and around 2,500 registrations for the End2End curriculum programs.
Other programs
Philips has played a pioneering role in the Netherlands with its national Vocational Qualification Program (CV) and the Philips Employment Scheme (WGP). The CV project has been running since 2004 and targets employees who know their trade well, but do not have a diploma to prove it. CV provides a solution by awarding these people a recognized qualification. To date, some 1,800 participants have obtained a qualification that will help them in their future careers.
Via WGP, we offer vulnerable groups of external jobseekers a work experience placement, usually combined with some kind of training. The program started in 1983 and over 12,500 people have participated since. After participating in the program, about 70% find a job. In 2013, Philips employed some 150 persons via the WGP program, including young people with autism who are training to become a test engineer. Of the previous group of 10 autistic persons, eight found a job, one proceeded with a course of study, and the other is applying for jobs.2015.
Training spend
Our external training spend in 20132015 amounted to EUR 47.350.4 million, up from EUR 44.7 million in line with EUR 46.9 million2014. This reflects an increase in 2012.the number of courses offered through the Philips University, supporting the transformation process at Philips, as well as a strong increase in courses attended.
For more information on our people’s development, please refer to sub-section 14.2.2, People development, of this report.
4.2.65.2.6 Health and Safety
Philips strives for an injury-free and illness-free work environment, with a sharp focus on decreasingreducing the number of injuries and process improvements. Thisimproving processes. The Lost Workday Injury Cases (LWIC) rate is defined as a KPI, on which we set yearly targets for the company, and our individual sectors.
Annual Report 2013 75
4 Group performance 4.2.6 - 4.2.7
We regret to report three fatalities in 2013, all involving contractors. In Pakistansectors and Colombia, two contractors died while working on a Lighting project. In Poland a contractor died while working on a reconstruction at one of our factories.Business Groups.
In 2013,2015, we recorded 307 Lost Workday Injuries cases,213 LWIC, i.e. occupational injury cases where the injured person is unable to work one or more days after the injury,injury. This represents a significant decrease compared with 345227 in 2012.2014, and continues the downward trend since 2010. The LWIC rate decreased to 0.21 per 100 FTEs, compared with 0.23 in 2014. The number of Lost Workdays caused by these injuries amounteddecreased by 1,087 days (some 12%) to 9,603 days down from 12,6307,981 days in 2012. The rate of Lost Workday Injuries decreased2015.
For more information on Health and Safety, please refer to 0.28 per 100 FTEs compared with 0.31 in 2012.
Lost Workday Injuries
per 100 FTEs
| | | | | | | | | | | | | | | | | | | | |
| | | 2009 | | | 2010 | | | 2011 | | | 2012 | | | 2013 | |
Healthcare | | | 0.20 | | | | 0.25 | | | | 0.20 | | | | 0.22 | | | | 0.19 | |
Consumer Lifestyle | | | 0.26 | | | | 0.26 | | | | 0.23 | | | | 0.25 | | | | 0.24 | |
Lighting | | | 0.76 | | | | 0.80 | | | | 0.64 | | | | 0.45 | | | | 0.41 | |
Innovation, Group & Services | | | 0.07 | | | | 0.13 | | | | 0.04 | | | | 0.05 | | | | 0.04 | |
| | | | |
Philips Group | | | 0.44 | | | | 0.50 | | | | 0.38 | | | | 0.31 | | | | 0.28 | |
All sectors showed a decrease in the Lost Workday Injury rate. At Lighting, a dedicated action program, “Safety First”, was launched five years ago to drive down injury levels. In 2012, various regionalsub-section 14.2.4, Health & Safety improvement programs and peer audit programs were started and further expanded in 2013. Since 2010, Lighting achieved a strong decline in reported accident rates mainly attributed to active management involvement, launch of a new policy on machine safety improvements and further strengthening of management systems at major sites implementing the “Safety First” program. Lighting initiated a work stream to address Health & Safety management in Turnkey projects, headed by the Lighting market leaders. In efforts to further reduce injury rates, Lighting will also roll-out a Behavior Based Safety program in 2014.
The Health & Safety performance, of Healthcare improved significantly in 2013. The Lost Workday Cases (LWC) decreased from 80 to 70 while the LWC Rate decreased from 0.22 to 0.19 compared to 2012 figures.
Healthcare targeted Health & Safety performance improvement actions within their Field Service Organization (FSO) to include organizational ownership and program management among other items. The FSO overall impact on the Sector Health & Safety performance decreased in 2013 compared to 2012. FSO Lost Workday Cases decreased from 46% to 38% of the Sector total while the number of Lost Workdays decreased from 49% to 38% of the Sector total compared to 2012. While the total number of Lost Workday Cases decreased in 2013, the number of Lost Workdays increased primarily due to isolated incidents with extended healing times.
Consumer Lifestyle continued to have low injury case levels. A new governance structure was launched in the Consumer Lifestyle organization to embed Health & Safety performance review and ownership in the businesses. The acquisitions Preethi and Povos started reporting their performance in 2013.this report.
4.2.75.2.7 General Business Principles
The Philips General Business Principles (GBP) govern Philips’ business decisions and actions throughout the world, applying equally to corporate actions and the behavior of individual employees. They incorporate the fundamental principles withinfor all Philips business. They set the standard for doing business.
The GBPbusiness conduct for both individual employees and for the company itself. They also provide a reference for the business conduct we expect from our business partners and suppliers. Translations are available in most of32 languages, allowing almost every employee to read the local languages and areGBP in their native language. The GBP form an integral part of the labor contracts in virtually all countries whereevery country in which Philips has business activities. Responsibility for compliance with the principles rests primarily with the managementoperates. In addition, there are separate Codes of each business. Every country organization and each main production site has a compliance officer. Confirmation of compliance with the GBP is an integral part of the annual Statement on Business ControlsEthics that has to be issued by the management of each business unit. The GBP incorporate a whistleblower policy, standardized complaint reporting and a formal escalation procedure. The whistleblower policy is intended to supplement more specific local grievance or complaint procedures. If employees wish to raise an issue for which there is a more specific procedure or grievance channel available, they are free to use this, e.g. use the applicable human resources procedures for employment issues. However, in case of concerns of suspected violations of applicable laws or regulations employees are urged to always report these to either their GBP Compliance Officer or the Philips Ethics Line.
The global implementation of the Philips Ethics hotline seeks to ensure that alleged violations are registered and dealt with consistently within one company-wide system.
76 Annual Report 2013
4 Group performance 4.2.7 - 4.2.8
To drive the practical deployment of the GBP, a set of directives has been published, which are applicable to all employees. There are also separate directives which apply to employees working in specific categoriesareas of employees, e.g.our business, i.e. the Supply ManagementProcurement Code of Ethics and the Financial Code of Ethics. Details can be found atwww.philips.com/gbp.gbp.
Annual Report 2015 55
Group performance 5.2.7
Employees are actively encouraged to engage in dialogue with their colleagues about what constitutes ‘acting with integrity’ in a given business situation and to speak up if they have any concerns. They can turn to either their manager or a GBP Compliance Officer for advice and support.
The Philips Ethics Line operates globally, allowing employees to dial a toll-free hotline number to report a concern in their local language or to raise a concern online via a web intake form. Since May 2015, third parties have access to the Philips Ethics Line so they can raise any concerns they might have in relation to Philips business. In 2013, we introduced2015, 39 parties, among which former employees and contractors, used this option.
The types of concerns filed by external parties follow the overall trends, with most concerns relating to ‘Treatment of employees’ followed by ‘Business integrity’. A standard for investigation is in place to promote consistency and due care in the way concerns are investigated.
For a mandatory sign-off ondescription of GBP for all executives.processes and policies, please refer to section 7.1, Our approach to risk management and business control, of this report.
Business Integrity Survey
In 2013 the first survey was held among our employees to measure the effectiveness of GBP deployment. In June 2013,2015 a business integrityfollow-up survey has beenwas rolled out to all employees in eightthe ten most relevant languages to get their input on the effectiveness of our GBP program. The survey provides input on a number of aspects that are recognized to influence responsible business conduct. The insights that were derived from this survey were used to further enhance the effectiveness of the current compliance activities as well as the compliance road map.
check status. The overall conclusion that could be drawn from the survey is that the Philips culture providescontinues to provide a sound basis to build upon, and that leaders are well positioned to manage integrity even more actively so as to support an environment in which employees feel comfortable to discussfor any GBP- or report potential issues and dilemmas.compliance-related program.
Ongoing trainingRole of management
The business integrity survey providedPhilips Executive Committee constantly reinforces the kickoff of a global GBP communications campaign, culminatingmessage that acting in a global event called the ‘GBP dialogue week’ held in October 2013, in which managers were invited to hold sessions with their teams to discuss GBP in relation to their function or business. In their feedback, participating managers indicated they experienced this week as very meaningful and worth repeating.
The mandatory web-based GBP training, which is designed to reinforce awareness of the need for complianceline with the GBP is availablenot something that is optional, but something that is vital to our business success. Managers at all levels are specifically given the responsibility to engage in 23 languages. Every quarter,dialogue with their teams on what responsible business conduct means for their daily practice. Management is supported in this by a network of GBP Compliance Officers who operate on different levels in the organization.
Training and awareness
In October of this year all new hires getemployees with an invitation to take this training in their local language. In addition, targeted audiences have beenemail account were invited to take a web-basedthe updated GBP e-learning. This training on specific topics, including anti-bribery, antitrust, privacy and export controls.course will be made available in the 22 most relevant languages. At the end of the course employees are asked to confirm that they are committed to acting in line with the GBP. The series of face-to-face training courses for GBP Compliance Officers that was started in 2014 was continued.
More information on the Philips GBP can be found in chapter 6,7, Risk management, of this report. ResultsThe results of the monitoring measures in place are providedgiven in the chapter 13, Sustainability statements,subsection 14.2.5, General Business Principles, of this report.
4.2.8 Stakeholder engagement5.2.8 Working with stakeholders
In organizing ourselves around customers and markets, we create dialogues with our stakeholders in order to explore common grounds inground for addressing societal challenges, buildbuilding partnerships and jointly developdeveloping supporting ecosystems for our innovations.innovations around the world. Working with partners is crucial in delivering on our vision to make the world healthier and more sustainable through innovation. An overview of stakeholders and topics discussed is provided in chapter 13,14, Sustainability statements, of this report.
For more information on our stakeholder engagement activities in 2015, please refer to sub-section 14.2.7, Stakeholder Engagement, of this report.
Strategic Partner5.2.9 Supplier sustainability
Philips has a direct business relationship with approximately 10,000 product and component suppliers and 30,000 service providers. In many cases the sustainability issues deeper in our supply chain require us to intervene beyond tier 1 of the World Economic Forumchain.
Supplier sustainability programs
In 2013, Philips entered into a strategic partnership with the World Economic Forum. The Forum’s mission of ‘Improving the state of the world’ closely matches our own and the Forum engages business, political, academic and other leaders of society to shape global, regional and industry agendas in an informal, action focused way.
During the first year of our partnership, Philips contributed significantly to the Forum’s agenda, with active participation in three industry groups, numerous speaking roles at the various meetings and a co-chairmanship of Frans van Houten at the World Economic Forum on Africa summit in Cape Town. Furthermore, Deborah DiSanzo, CEO Healthcare, has accepted to chair a thought leadership initiative that will explore Health Systems Leapfrogging in Emerging Markets.
The Philips Center for Health and Well-being
Over the last 5 years, Philips has run The Philips Center for Health and Well-being as a knowledge-sharing forum that raised the level of dialogue on key societal questions that matter most to citizens and communities. In 2013, the Aging Well think tank, one of the initiatives of the Center, actively participated inWe have developed a number of events, such as the Aging in America conference of the American Society on Aging, the International Congress on Telehealth and Telecare of the King’s Fund in the UK, and a well-attended expert roundtable to explore next-generation technologies for aging well. As of 2014, the activities of the Center will be merged with our other stakeholder engagement platforms and initiatives across the businesses and markets.
Partnering to improve healthcare in Africa
In November 2013, Philips and AMREF Flying Doctors announced that they will work together in a partnership to structurally improve healthcare infrastructure and provision in Africa. Both parties will leverage their respective strengthsstrategic programs to help tackle inadequatelyour suppliers improve their sustainability performance. These programs cover the assessment of supplier sustainability performance (audits), management of regulated substances, conflict minerals and other responsible sourcing initiatives. More detailed information about our programs is availablewww.philips.com/suppliers.
Supplier sustainability policies
Annual Report 2013 77The Philips Supplier Sustainability policy consists of two core documents: Supplier Sustainability Declaration (SSD) and Regulated Substances List (RSL). Both these documents are an integral part of our supplier contracts.
4 Group performance 4.2.8 - 4.2.9
equipped medical facilities and inadequately trained staff as a way to better address the growing incidenceThe list of non-communicable diseases across the continent. AMREF and Philips will also work with local stakeholders to develop and implement large-scale projects to make healthcare more accessible to the local population.
We sought similar partnerships in our ‘Fabric of Africa’ campaign launched in 2013. The campaign’s primary intent is to enter into public/private partnerships with local and international stakeholders to improve healthcare delivery in the areas of non-communicable diseases, maternal and child health, healthcare infrastructure, technology and clinical training. Philips has developed innovative, low-resource setting health technologies and e-Health solutions to address the challenges in the African market. More information on this campaignother applicable policies can be found at www.philips.com/FabricofAfrica.
suppliersWorking on global issues.
In 2013,Regulated Substances List
All suppliers and brand licensees must ensure that all products or parts and product packaging delivered to Philips, participated in a number of international conferences and events focused on sustainable development and climate change. These included the Climate Week in New York City (organized by The Climate Group), co-launching the ‘Cities & Aging’ policy snapshot with the Global Cities Indicator Facility in Toronto, as well as the United Nations Climate Change Conference in Warsaw, Poland. Most notably we were invited as the only private sector companysome manufacturing processes used to join the UN Secretary General’s Chief Executives Board, with Ban Ki Moonmake Philips parts and part of his UN leadership team. Here we highlighted that energy efficient and intelligent LED solutions will result in a 30% reduction of electricity consumption by the global lighting market in 2020 compared to 2006. This equates to a reduction of 515 megaton CO2 emissions, while also significantly reducing energy bills by around EUR 100 billion in 2020.
Innovation event
In November, Philips Research organized an Innovation Event at the High Tech Campus with external guest speakers, to share best practices, share Philips corporate ambition for more sustainable product solutions; initiate new innovative concepts to radically improve access to healthcare; newbrand license products, that decrease food waste and help meet world food security goals; and to identify new approaches to the circular economy, focusing on concepts such as “design for reuse” and improved recycling efficiency. We believe these global challenges can only be addressed through Open Innovation and regional partnerships with all stakeholders involved. We collaborate with academics, universities through direct partnerships, Open Innovation initiatives and government driven initiatives, like FP7 and Horizon 2020, two European Union research programs.
4.2.9 Social Investment Programs
In 2013, we continued to develop and localize our global social investment program, SimplyHealthy@Schools. In Brazil, 230 employees from Philips offices and factories registered to volunteer inFal@ndo em Bem-Estar, the local adaptation of SimplyHealthy@Schools. The program aims to empower kids from 8 to 12 to change their habits, health and environment and educates teenagers about safe sex and sexual transferable diseases prevention, a critical national issue.
Philips Brazil also rolled-out a new initiative in 2013 with an important Healthcare partner, Fleury. Based on the same topics and questions explored in ourFal@ndo em Bem-Estar,the project consists of a giant interactive board game, developed to be used in schools throughout the entire country by Fleury and Philips employees.
In North America, the Philips Cares program provides ways for employees to work together to improve people’s lives by creating healthy, sustainable communities that contribute to the success and well- being of future generations. This can take many forms: from helping a child to excel in math, to providing safety and energy efficient home improvements to the disadvantaged, to raising awareness about the importance of cardiac health. In 2013 alone, more than 5,000 employees participated in volunteer opportunities that suited their needs, schedules, and passions in partnerships with organizations such as American heart Association, March of Dimes, and Rebuilding Together.
At the end of 2012 we signed a three year partnership agreementcomply with the Royal Dutch Football Association (KNVB) to support their WorldCoaches program by installing more than 100 solar lighting ‘Light Centers’applicable requirements in rural communities throughout Africa and South America. Working together with local communities and the KNVB, the Light Centers will provide safe and functional space for sports and other community activities after dark.this list.
Throughout 2014, Philips will roll out a new three pillar social investment strategy, comprising of a disaster relief program, a local community investment programSupplier Sustainability Declaration
78 Annual Report 2013
4 Group performance 4.2.9 - 4.2.10
and a signature social innovation program. The main focus will be on access to healthcare, access to light and healthy futures.
4.2.10 Supplier sustainability
Many of our products are being created and manufactured in close cooperation with a wide range of business partners, both in the electronics industry and other industries. Philips needs suppliers to share our commitment to sustainability, and not just in the development and manufacturing of products but also in the way they conduct their business. We require suppliers to provide a safe working environment for their workers, to treat workers with respect, and to work in an environmentally sound way. Our programs are designed to engage and support our suppliers on a shared journey towards continuous improvement in supply chain sustainability.
As a leading company in sustainability, Philips will act as a catalyst and support our suppliers in their pursuit of continuous improvement of social and environmental performance. We recognize that thisDeclaration is a huge challenge requiring an industry-wide effort in collaboration with other societal stakeholders. Therefore, we remain active, together with peers in the industry, inderived from the Electronic Industry Citizenship Coalition (EICC) Code of Conduct and encourage our strategic suppliers to joinsets out the EICC too. We will also continue to seek active cooperationstandards and dialogue with other societal stakeholders including governments and civil society organizations, either directly or through institutions like the EICC, the multi- stakeholder programs of the Sustainable Trade Initiative IDH, and the OECD.
Supplier Sustainability Involvement Program
The Philips Supplier Sustainability Involvement Program is our overarching program to help improve the sustainability performance of our suppliers. We create commitmentbehaviors we require from our
56 Annual Report 2015
Group performance 5.2.9
suppliers by requiring them to comply with our Regulated Substances List and the Philips Supplier Sustainability Declaration, which we include in all purchasing contracts. The Declaration is based on the EICC code of conduct and we added requirements on Freedom of Association and Collective Bargaining. The topics covered in the Declaration are listed below.their suppliers. We monitor supplier compliance with the Declaration through a system of regular audits.
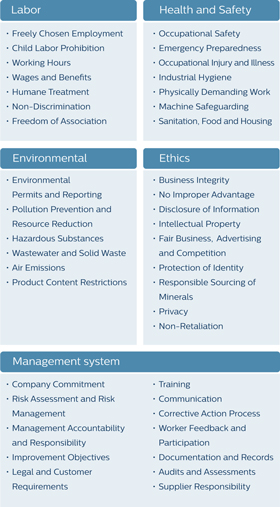
2013 supplier auditsSupplier Sustainability Audit Program in risk countries2015
In 2013, Philips conducted 200 full-scope2015, we audited 195 of our current risk suppliers, including 120 continued conformance audits including four jointwith suppliers that we had already audited in 2012. This represented some one third of the number of risk suppliers. On top of the audits conducted on behalf of Philips and other EICC member companies. Additionally, 59 audits ofwith current risk suppliers, we also audited 26 potential suppliers were performed. Potential suppliers are audited as part ofduring the supplier approval process, and theyselection process. These potential suppliers need to close any zero-tolerance issues before they can start delivering to Philips. In our new audit approach,Below we place more focusreport on capacity building programs to realize structural improvements leading to better audit results.the findings at existing suppliers only; findings at potential suppliers are not included in this report.
As in previous years, the majority of the audits in 2013 were done in China. The totalAdditionally, audits were performed in Brazil, India and Mexico. A smaller number of full-scope audits carried out since we startedtook place also in Belarus, Dominican Republic, Indonesia, Philippines, Russia and Ukraine. These audits directly or indirectly relate to the program in 2005 is 2,162. This number includes repeated audits (131 in 2013), since we execute a full-scope auditworking conditions of almost 116,000 workers at our risk suppliers every three years. The audit program covers 90% of our spend with risk suppliers.the production sites that were audited.
Annual Report 2013 79
4 Group performance 4.2.10 - 4.2.11
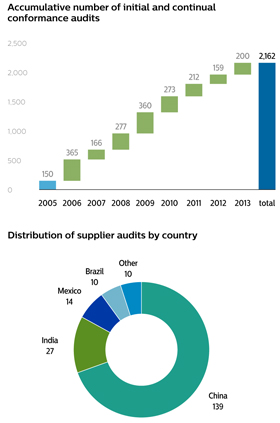
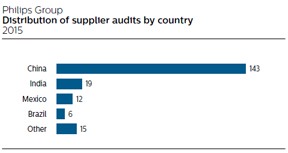
Audit findings
We believe it is important to be transparent about the issues we observe during the audits. Therefore we have published a detailed list of identified major non-compliances in our annual report since 2010.
To track improvements, Philips measures the ‘compliance rate’ for the identified risk suppliers, beingi.e. the percentage of risk suppliers that waswere audited within the last 3three years and do not have any – or have resolved all – major non-compliance.non-compliances. During 20132015 we achieved a compliance rate of 77% (2012: 75%86% (2014: 86%).
Please refer to sub-section 13.2.2,14.2.8, Supplier indicators, of this report for the detailed findings of 2013.2015.
Supplier development and capacity building
Based on many years of experience with the audit program, we know that a combination of audits, capacity building, consequence management and structural attention from management is crucial to realize structural and lasting changes at supplier production sites. In 20132015, we continued our focus on capacity buildingcapacity-building initiatives which are offered to help suppliers improve their practices. Our supplier sustainability experts in China India and Brazil organized trainings,training, visited suppliers for on-site consultancy, conducted pre-audit checks and helped suppliers to train their own employees on topics like occupational health and safety, emergency preparedness and chemicals management.employees.
We also teamed up with peers5.2.10 Addressing issues deeper in the industry and civil innovative multi-stakeholder initiative sponsored bysupply chain
Philips’ shares the Sustainable Trade Initiative (Initiatief Duurzame Handel). The goal is to improve working conditions for more than 500,000 employeesconcern about issues in the mining of minerals that are used in electronics sector. Two years ago the program was kicked-off in China’s Pearl River Delta, and now expanded to also cover supplier factories in the Yangtze River Delta area. A totalindustry products. Areas of 15 Philips suppliers are now participating in the program.
4.2.11 Conflict minerals: issues further down the chain
In line with Philips’ commitment to supply chain sustainability, we feel obliged to implement measures in our chain to ensure that our products are not directly or indirectly funding human atrocities in the Democratic Republic of the Congo (DRC). We are concerned aboutconcern include the situation in eastern DRC (Democratic Republic of the Congo), where proceeds from the extractivesmining sector are used to finance rebel conflicts in the region. Philips is committedregion, environmental and safety concerns in tin mining in Indonesia, the wide array of issues related to address this issue through the meansgold mining, and influencing mechanisms available to us, even though child labor in mining in general.
Philips does not source the minerals directly source minerals fromand the DRC and mines are typically seven or more tiers removedaway from our direct suppliers.
Although this region has a rich supply of minerals, its economy has collapsed due to decades of ongoing conflict. In an effort to prevent minerals from financing war, many companies worldwide have shied away from purchasing minerals from the DRC, creating a de facto embargo in a region where mining is often the only source of income for local communities. We decided that this was not the right approach and instead of avoiding the DRC, we took the more difficult road, supporting conflict-free sourcing from the DRC. To promote cooperation and economic growth in the region outside the control of the rebels, we launched the Conflict-Free Tin Initiative. This initiative introduces a tightly controlled conflict-free supply chain of tin from a mine in the DRC all the way down to an end-product. Philips iswere one of the industry partners brought together by the Dutch government that initiated the program in 2012. To underlinefirst companies to survey our commitmentsuppliers to conflict-free sourcing, we joined a delegation in February 2013 to visit the mine and engage with different local stakeholdersidentify smelters used in the DRC. At the end of 2013 we reached
80 Annual Report 2013
4 Group performance 4.2.11 - 4.3.1
an important milestone when the first end-user products containing this conflict-free tin were made in our Philips Lighting factory.
During 2013 we continued our work with 349 priority suppliers to raise awareness and conduct supply chain investigations to determinethat produce the originmetals of concern, and one of the metals infew companies to have our products. This resulted in the identification of 191 smelters in our supply chain involved to process these metals. We publish this smelter list on our website, creating transparency at deeper levels in our supply chain of those actors that we believe hold the key towards effectively addressing the concerns around conflict minerals. Philips encourages all smelters in our supply chain to join the Conflict Free Smelter program and demonstrate their conflict-free status via independent third party assessments. 29% of the smelters identified by our suppliers have now successfully passed the Conflict Free Smelter assessment. As sufficient conflict-free smelters for all four metals (Tin, Tantalum, Tungsten and Gold) will become available, Philips plans to direct its supply chain towards these smelters.
We believe that industry collaboration and stakeholder dialogue are important to create impact at these deeper levels of our supply chain. Therefore Philips continued its active contribution to the Conflict Free Sourcing Initiative, a joint effort of the EICC and GeSI and others to positively influence the social and environmental conditions in the metals extractives supply chain. To assist in developing a due diligence standard for conflict minerals, we continued our participation in the multi-stakeholder OECD-hosted program for the implementation of the “OECD Due Diligence Guidance for Responsible Supply Chains of Minerals from Conflict-Affected and High-Risk Areas”. We also continued our engagement with relevant stakeholders including the European Parliament, other industry organizations and local as well as international NGOs in Europe and the U.S. to see how we can resolve the issue.
In line with the US Dodd-Frank Act, we started preparations for publishing a PhilipsSEC Conflict Minerals Report including an audit of the Conflict Minerals Report as required by the Act.audited in 2014 and 2015.
For more details and resultresults of our supplier sustainability program, please refer to sub-section 13.2.2,14.2.8, Supplier indicators, of this report.
4.35.3 Environmental performance
EcoVision
Philips has a long sustainability history stretching all the way back to our founding fathers. In 1994, we launched our first program and set sustainability targets for our own operations. Next, we launched our first EcoVisionsecond program in 1998, which focused on the environmental dimension of our operations and products. We also started to focus on sustainability in our supply chain in 2003. We extended our scope further in 2010 by including the social dimension of products and solutions, which is now reflected in our renewed company vision stating that wevision:
We strive to make the world healthier and more sustainable through innovation. Our goal is to improve the lives of 3 billion people a year by 2025.
Philips publishes every year a full Integrated Annual Report with the highest (reasonable) assurance level on the financial, social and environmental performance. With that overall reasonable assurance level Philips is a frontrunner in this field. KPMG has provided reasonable assurance on whether the information in chapter 14, Sustainability statements, of this report, section 5.2, Social performance, of this report and section 5.3, Environmental performance, of this report presents fairly, in all material respects, the sustainability performance in accordance with the reporting criteria. Please refer to section 14.4, Independent Auditor’s Assurance Report, of this report.
The main elements of the EcoVision program are:
Green Innovation, including Circular Economy
Annual Report 2015 57
Group performance 5.3
In 2015, our fifth EcoVision program ended. In this environmentalEnvironmental performance section an overview is given of the most important environmental parameters of the program. Improving people’s lives, Health &and Safety, and Supplier Sustainability are addressed in the Social performance section. Details of the EcoVision parameters can be found in the chapter 13,14, Sustainability statements, of this report. We plan to launch the next 5-year program in the second quarter of 2016.
4.3.15.3.1 Green Innovation
Green Innovation is the Research & Development spend related to the development of new generations of Green Products and Green Technologies. We announced in 2010 our plan to invest a cumulative EUR 2 billion in Green Innovation during the comingnext 5 years. In 20132014, Philips already achieved this EUR 2 billion target a year ahead of schedule. In 2015, we invested some EUR 509495 million in Green Innovation, withexcluding Lumileds and Automotive. Lighting continued to be the strongest contribution from Lightinglargest contributor, mainly stemming fromas a result of investments in LED. The impact of Lumileds and Automotive on Green Innovation is significant at EUR 93 million in 2015 and EUR 105 million in 2014.
Annual Report 2013 81
4 Group performance 4.3.1 - 4.3.1
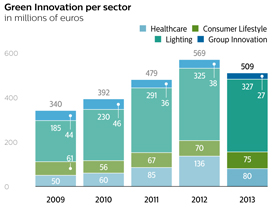
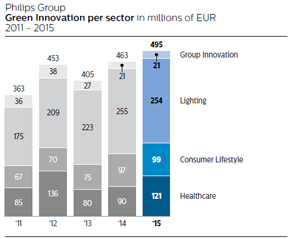
Healthcare
Philips Healthcare develops innovative solutions across the continuum of care in collaboratingclose collaboration with clinicians and customers, to improve patient outcomes, provide better value, and expandhelp secure access to high-quality care. While doing so, we take into account allHealthcare investments in Green Innovation in 2015 amounted to EUR 121 million, a EUR 31 million increase compared to 2014. All Philips Green Focal Areas andare taken into account while we aim to reduce environmental impact over the total lifecycle, with alifecycle. Energy efficiency is an area of focus, on energy efficiency and dose reduction. Healthcare investments in Green Innovation in 2013 amountedespecially for our large imaging systems such as MRI. In 2015, we started to EUR 80 million, a significant decrease compared with 2012. This can be attributedadd an energy-efficient CryoCompressor to a number of significant Healthcare projects which were completed in 2012. Other areas covered include increased levels of recycled content in our products, remote servicing and closingMRI systems. Closing the materials loop e.g. throughis another area, where our focus on developing upgrading strategies, parts harvestingpathways has enabled extended product life and refurbishing programs as well as reducing environmentally relevant substances from our products. Philipstherefore reduced materials use and lower cost. Healthcare actively supports a voluntary industry initiative (COCIR) for improvingto improve the energy efficiency of medical imaging equipment. Moreover, we are actively partnering with multiple leading care providers to look together for innovative ways to reduce the environmental impact of healthcare, for example by optimizing energy efficientmaximizing energy-efficient use of medical equipment.equipment and optimizing lifecycle value.
Consumer Lifestyle
Green InnovationContinuous high R&D investments at Consumer Lifestyle are also reflected in Green Innovation spend, which amounted to EUR 7599 million comparedin 2015, comparable to EUR 7097 million in 2012 and2014. The continued green investments resulted in an increase inhigh Green Product sales in all Business Groups. The sector continued its work on improving the energy efficiency of its products, closing the materials loop (e.g. by using recycled materials in products and packaging) and the voluntary phase-out of polyvinyl chloride (PVC), brominated flame retardants (BFR) and, Bisphenol A (BPA) and phthalates from, among others, food contact products. In particular, more than 80% of the shaving, grooming and groomingoral healthcare products are completely PVC/BFR-free. Green investments during the course of 2015 in Personal Health Solutions are expected to result in the launch of the first Green Products in this product segment in early 2016.
Lighting
At Lighting, we strive to make the world healthier and more sustainable through energy-efficient lighting solutions. In 2013systems. With a 2015 investment of EUR 254 million in Green Innovation (excluding Lumileds and Automotive), Lighting invested EUR 327 milliona similar amount as in line with EUR 325 million2014. Increasing investments in 2012digital lighting solutions and cloud computing have led to develop products and solutions that address environmental and social challenges. Investments are made to advance the LED revolution, which can substantially reduce carbon dioxide emissions (by switching from inefficient to energy-efficient lighting). Recent examples include the TLED and the Philips LUXEON Altilon product familyfurther improvements in the Mercedes S-class Intelligent Lighting System, making thisarea of energy efficiency. In 2015, Los Angeles became the first carcity in which allthe world to control its street lighting functions are LED. Furthermore, Lighting has developed solutions for water purification, solar LEDs for ruralthrough an advanced Philips management system that uses mobile and urban locations,cloud-based technologies. Beyond significant energy efficiency benefits, this new Philips CityTouch gives citizens safer lit streets and LED solutions for agricultural applications supporting biodiversity.reports faults and reduces commissioning time to minutes. This system also supports the transition to a more circular economy as the wireless plug-and-play connector nodes protect a city’s existing investment by networking streetlights from any vendor.
Philips Group Innovation
Philips Group Innovation invested EUR 2721 million in Green Innovations, spread over projects focused on global challenges related to water, air, waste, energy, food, Circular Economy, and access to affordable healthcare. The Research organization within Group Innovation deployedused the Sustainable Innovations Assessment tool, in which innovation projects are mapped, categorizedevaluated and scored along the environmental and social dimensiondimensions, in order to identify those innovation projects that most strongly drive sustainable innovation. One exampleAs of 2015, transfers of innovation projects include a Lives Improved calculation to assess what the project’s contribution will be to Philips’ vision to improve the lives of 3 billion people a year by 2025.
58 Annual Report 2015
Group performance 5.3.1
Philips Green Patent portfolio
At the end of 2015, Philips’ IP portfolio consisted of 6.7% green patent families. All families are labeled with at least one Green Focal Area. In 2015, 6% of our total new patent filings were flagged as green patent family. Energy efficiency is still the most frequently occurring Green Focal Area throughout the portfolio. As IP is an extension of Philips’ innovation efforts, the portfolio percentage related to green patents is multiplied by our annual patent portfolio costs to determine Philips’ yearly investment in Green IP.
While a product can be classified as green by incorporating an environmentally friendly technology, such technology cannot always be protected in a patent because of a Group Innovation projectlack of patentability over the state-of-the-art technology. Therefore, there is related to low cost solar-powered LED lighting.
When the sun setsnot necessarily a correlation between green patents and Green Technologies in Africa, over 600 million people on the continent rely on kerosene and candles to see in the dark. For most of the population who are at the Base of the Pyramid (BoP) these lighting solutions remain costly, give only low illumination and are highly non-sustainable. The BoP comprises four billion people living in our world today, and in the poorest socio-economic group. We engaged directly with BoP consumers in some of the poorest areas of Africa to understand their needs for lighting and energy and how they wish to use that light. The insights derived from these studies have resulted in a re-design of our entire portfolio of solar lighting for the consumer. At the same time the new products take advantage of the very latest developments in LED, solar panels and battery technology, resulting in a portfolio that is flexible in use-case, has a high performance, is robust and long lasting. All this is provided at price-points that match the spending power of the target consumers with a payback time within 3-6 months.
82 Annual Report 2013
4 Group performance 4.3.1 - 4.3.2
Green Products.
Energy efficiency of products
Energy efficiency is a key Green Focal Area for our Green Products. AboutAccording to our analysis, about 97% of the energy consumed during the use phase of our products is attributable to Lighting products, according to our analysis.products. The remaining 3% is split over Consumer Lifestyle and Healthcare. Therefore, we focus on the energy efficiency of our Lighting products in the calculation. The annual energy consumption per product category is calculated by multiplying the power consumption of a product by the average annual operating hours and the annual pieces sold and then dividing the light output (lumens) by the energy consumed (watts). The average energy efficiency of our total product portfolio improved some 2%increased significantly in 2013 (19%2015 to 44.5 lumen per watt, or 10% compared to 2009).2014. The exclusion of Lumileds and Automotive had a limited upward effect on the energy efficiency of the portfolio.
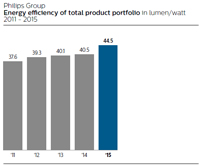
In 20132015, LED sales continued to advanceadvanced well, butas demand for conventional lighting remained fairly stable duedeclined. Compared to 2009, the challenging economic environment. Sincebaseline year of our measurement, the numberaverage energy efficiency of traditional lamps sold is significantly higher than LEDs,our portfolio increased by 33%. We expect the energy efficiency improvement ofto improve further in the total Lighting portfolio in 2013 was limited. Ascoming years as the traditional incandescent lamp will beis banned in more countries, we expect the energy efficiency improvement to advance in the coming years.countries. Our target for 2015 iswas a 50% improvement compared to the 2009 baseline. In this target setting, assumptions were made onabout the speed of the regulatory developments in this area, which stayed behindfell short of expectations. Therefore, in 2015 the target of 50% improvement will probably not yet be achieved.
Further details on this parameter and the methodology can be found in the document ‘Energyhere:
Improving energy efficiency of Philips products’ at www.philips.com/sustainability.products.
Circular economyEconomy
For a sustainable world, theThe transition from a linear to a circular economy is essential to create a necessary boundary condition.sustainable world. A circular economy aims to decouple economic growth from the use of natural resources and ecosystems by using thosethese resources more effectively. It is a driver forof innovation in the areas of material-, component-material, component and product reuse,re-use, as well as new business models such as system solutions and services. In a circular economy, the more effective (re)use of materials enables to createthe creation of more value, both by means of cost savings and by developing new markets or growing existing ones.
In 2013, Philips started its circular economy approach. Key characteristics are customer access over ownership (pay for performance e.g. pay per lux or pay per scan), business model innovations (from transactionsFor more information on our Circular Economy activities, please refer to relationships via service and solution models), reverse cycles (including partners outside current value chains e.g. upstream-downstream integration and co-creation) and logistics, innovations for material-, component-, and product reuse, products designed for disassembly and serviceability. In 2013, Philips became a global partnersub-section 14.3.1, EcoVision, of the Ellen McArthur Foundation, the leading organization on the concept of circular economy.this report.
Closing the materialmaterials loop
In 2013 we restated the 2009 baselineThe amount of collection and recycling for 2014 (reported in 2015) was calculated at 28,500 tonnes, a 10% decrease compared to 31,500 tonnes reported in 2014, driven by lower weight of products and components in all sectors. Our target was to double global collection and recycling amounts atby 2015 compared to 2009, when the baseline was set around 22,500 tonnes, (excluding TV and AVM&A), based on the data retrieved from the WEEEWaste Electrical and Electronic Equipment (WEEE) collection schemes and from our own recycling and refurbishment services (mainly Healthcare). The amount of collection and recycling for 2012 (reported in 2013) was calculated at 31,000 tonnes, excluding AVM&A (which was calculated at 9,000 tonnes). A small improvement compared to the amount for 2011 due to an increase in recycled products in Healthcare.
Recycled materials
We calculated the amount of recycled materials used in our products in 20132015 at some 14,00013,500 tonnes (2012: 15,000(2014: 13,000 tonnes), by focusing on the material streams plastics (Consumer Lifestyle), aluminum (Lighting), refurbished products, and spare parts harvesting (Healthcare) depending on thetheir relevance in each sector.
Our target iswas to double the global collection and recycling and the amount of recycled materials in our products by 2015 compared to 2009. 2009, when the baseline was set at 7,500 tonnes.
Further details on this parameter and the methodology can be found inhere:Closing the document ‘Closing the material loop’ at www.philips.com/sustainability.materials loop.
4.3.25.3.2 Green Product sales
Green Products offer a significant environmental improvement in one or more Green Focal Areas: Energy efficiency, Packaging, Hazardous substances, Weight, Recycling and disposal, and Lifetime reliability. Sales from Green Products, increased from EUR 11.0 billion in 2012 to EUR 11.8 billion in 2013, or 51% of sales, thereby reachingexcluding the target of 50% we set ourselves for 2015.
All sectors contributed to the growth in Green Product sales, but Consumer Lifestyle achieved the highest Green Product nominal sales growth, followed by HealthcareLumileds and Lighting. The exclusion of AVM&A had a 10% positive impact in 2013 on the Green Product sales percentage of Consumer Lifestyle (2013: 49%).
Annual Report 2013 832015 59
4 Group performance 4.3.2 - 4.3.35.3.2
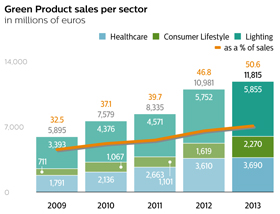
New Green Products from each sector includeThe exclusion of Lumileds and Automotive had a 1% negative impact on the following examples.
Healthcare
During 2013, Healthcare expanded thetotal Green Product portfolio with 13 new products to improve patient outcomes, provide better value, and expand access to care, while reducing environmental impact. Philips’ new EPIQ platform for example, delivers high-quality ultrasound imaging to every setting where echocardiography is used and at the same time reduces both energy use and product weight by almost 30% compared to the predecessor model. The energy consumption for each of Philips MRI models is lower than the market average according to COCIR. Other examples are new X-ray systems such as DuraDiagnost systems and a new Certeray X-ray generator, with significantly lower energy use and product weight versus predecessor models. Green Products from Patient Care & Clinical Informatics include MX400/450 and MX 500 patient monitors, for which product weight is significantly reduced (up to 27%) as well as energy consumption (up to 23%) when compared to their predecessor models.sales percentage.
Consumer Lifestyle
Consumer Lifestyle is focusing on the avoidance of substances of concern, the application of recycled materials and the energy efficiency of the products. In 2013, in China, Consumer Lifestyle introduced energy efficient living room Air purifiers. The products have an energy efficient motor, and score the highest grade (A) on the China energy label for Air purifiers.
Lighting
An example of a new Green Product introduced in 2013 is the Pacific LED Green Parking system covered parking solution. It ensures safety, whilst offering outstanding energy savings, low maintenance and long lifetimes. Through a mix of LED luminaires, wireless controls and presence detection, it can save up to 80% in running costs whilst typically delivering back the return on investment in under 3 years. As the solution is wireless, it is an easy retrofit solution that will match the lumen output of traditional fluorescents.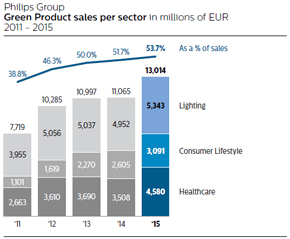
We aim to create products that have significantly less impact on the environment during their whole lifecycle through our EcoDesign process. Overall, the most significant improvements have been realized in our energy efficiency Green Focal Area, an important objective of our EcoVision program, although there was also growing attention for hazardous substances and recyclability in all sectors in 2013,2015, the latter driven by our Circular Economy initiatives.
New Green Products from each sector include the following examples.
4.3.3Healthcare
In 2015, Healthcare expanded the Green Product portfolio with 11 new products and redesigned various current Green Products with environmental improvements. These products improve patient outcomes, provide better value, and help secure access to high-quality care, while reducing environmental impact. Examples include a new packaging system for our PCMS medical supplies business, which has enabled a 90% reduction in air space in packaging and a 24% reduction in packaging material weight to support our customers in reducing their waste streams. Another example is our Home Monitoring business which operates by a performance-based service business model that enables 76% re-use of products and parts while maintaining the embedded labor and energy. The Efficia is a new Green Product in our value range of patient monitoring, which is an example of how we aim to support expanded access to care in under-resourced regions while lowering environmental impact as well. We started to add an energy-efficient CryoCompressor to our MRI systems, with energy savings in the various non-scanning modes of 30-40%. Both material (30%) and energy (20%) savings are achieved in our new Access CT system, a compact-designed CT for the value segment market. Sleep and Respiratory Care (SRC) launched the V680 ventilator which includes, besides better performance in uninterrupted invasive or noninvasive ventilation, a product and packaging material weight reduction of 60% and 75% respectively and a reduction in energy usage of 80%. Other new Green Products came from SRC (lightweight masks and sleep therapy devices), MCS group (lightweight battery chargers) and X-Ray systems for the Brazilian market without lead counter ballasts.
Consumer Lifestyle
Consumer Lifestyle focuses on Green Products which meet or exceed our minimum requirements in the areas of energy consumption, packaging, and substances of concern. The sales of Green Products in 2015 surpassed 58% of total sales. All our Green Products with rechargeable batteries (like toothbrushes, shavers, and grooming products) exceed the stringent California energy efficiency norm by at least 10%. We are making steady progress in developing PVC/BFR-free products. More than 65% of sales consist of PVC/BFR-free products, with the exception of the power cords, for which there are not yet economical viable alternatives available. In the remaining 35% of product sales, PVC/BFR has already been phased out to a significant extent, but the products are not yet completely free of these substances.
In 2015, more kitchen appliances, vacuum cleaners, coffee machines and irons were launched with parts made of recycled plastics. In total we have applied some 900 tons of recycled plastics in our products. An example is the new Perfect Care Eco Aqua Steam Generator, with more than 50% recycled plastics.
Lighting
Green Product sales within Philips Lighting increased to 72% in 2015. Connected lighting systems contributed to Green Product sales with solutions in more applications and market segments. In August 2015 the new installation of the connected Philips LED lighting system in the Allianz Arena made it Germany’s first and Europe’s largest stadium to feature a dynamic and colorful light display on its entire façade. This new energy-efficient lighting system also saves approximately 60% on electricity and 362 tons of CO2 per year. The maintenance and operating costs are also lower due to the cloud-based Philips ActiveSite platform. The LEDs have an average lifetime of 80,000 operating hours and the system is extremely robust, even under extreme weather conditions.
5.3.3 Green Operations
The Green Operations program focuses on the main contributors to climate change, recycling of waste, reduction of water consumption, and reduction of emissions of restricted and hazardous substances.
Full details can be found in chapter 13,14, Sustainability statements, of this report.
60 Annual Report 2015
Group performance 5.3.3
Carbon footprint and energy efficiency
After achieving our EcoVision4 carbon emissions reduction target in 2012, (25% operational CO2 emissions reduction compared to 2007, the baseline year) we continued our energy efficiency improvement programs across different disciplinesdisciplines. This year we have achieved our 2015 emission reduction target that was set at a 40% decrease in 2013. Examples are Work Place Innovation, partneringCO2 reductions compared to our 2007 base year. Our carbon footprint decreased by 7% compared to 2014, resulting in the KLM BioFuel program and Green Logistics. However, in 2013 our Carbon Footprint increased by 2% to 1,654a total of 1,417 kilotonnes CO2 as, a result41% decrease compared to 2007. This was mainly achieved by emissions reductions of increased carbon17% compared to 2014 in our manufacturing facilities, resulting from operational changes and decreased energy usage due to lower load at energy intensive Lighting factories. Additionally the energy intensity for our non-industrial operations decreased resulting in emission reductions of 16%. Business travel emissions from air transport (to mitigate supply shortages), the increased useshowed a slight reduction of SF6 (a substance with high Global Warming Potential impact) and increased1% compared to 2014. In order to further decrease our business travel due to our increasing focus on emerging markets. These were, however, partly offset by decreasing emissions resulting from reduced office space (Work Place Innovation), consolidation of warehouses, the changing industrial footprint, and the increase in purchased electricity from renewable sources.
In 2013, CO2 emissions from non-industrial sites decreased 20%, in large part attributable to our Work Place Innovation program which enables flex-working and thus reduces the floor space in our portfolio. But also our continuing focus on buildings’ energy efficiency and the increased share of purchased electricity from renewable sources have helped achieve this.
84 Annual Report 2013
4 Group performance 4.3.3 - 4.3.3
After a decrease in 2012, total emissions from business travel increased 5% in 2013 as reduced emissions from our lease car fleet were off-set by increased air travel. Wewe will continue to promote video conferencing as an alternative to travel. In 2013, logistics CO2travel in 2016. These reductions were, however, offset by a 23% increase in emissions increased 5% in comparison with 2012. These werefrom air transport over the course of 2015, mainly caused by increased air shipmentsat Healthcare to mitigate supply shortages in our Lighting sector.meet demand.
Our operational energy efficiency decreased 5%improved by 18%, from 1.151.29 terajoules per million euro sales in 20122014 to 1.211.06 terajoules per million euro sales in 20132015 as a result of intensifiedenergy efficiency programs in our industrial sites.
During 2015, the applied emission factors used to calculate our operational carbon footprint have been updated from the previously used DEFRA (UK Department for Environment, Food & Rural Affairs) 2007 and bespoke emission factors to the applicable DEFRA 2015 emission factors for each year respectively. This update affected all historical data and resulted in an overall average increase of our carbon emissions by 11% for all years. We implemented these new emission factors to ensure improved carbon disclosure. The emission factor update did not affect our performance against the base year.
From this year onward our scope 2 emissions reporting will include both the market based method as well as the location based method. Both methods are adopted according to the new Corporate Standard of the Greenhouse Gas (GHG) Protocol as further described in chapter 14, Sustainability statements, of this report. The market based method will serve as reference for calculating our total operational carbon footprint. As explained in chapter 14, the market based method includes reduction of our emissions resulting from purchasing renewable energy. In 2015, we procured 54% of our electricity from renewable sources. Approximately 60% of our renewable energy is standardly contracted via our energy providers. The remaining 40% was mainly sourced in the United States through procurement of renewable energy certificates.
The impact of the exclusion of Lumileds and Automotive is displayed as discontinued operations in the next graph; the size of which varies over the years, but averages around 10% over the past 5 years. Emissions from discontinued operations in our industrial activities increasedhave been identified exactly. Emissions from our non-industrial facilities and business travel and increasedhave been estimated based on FTE data. For our logistics activities.emissions the part of discontinued operations has been estimated using revenue share as a proxy where applicable.
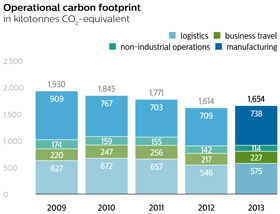
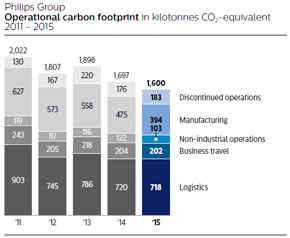
Philips Group
Ratios relating to carbon emissions and energy use
| | | | | | | | | | | | | | | | | | | | |
| | | 2009 | | | 2010 | | | 2011 | | | 2012 | | | 2013 | |
Operational CO2 emissions in kilotonnes CO2-equivalent | | | 1,930 | | | | 1,845 | | | | 1,771 | | | | 1,614 | | | | 1,654 | |
Operational CO2 efficiency in tonnes CO2-equivalent per million euro sales | | | 83 | | | | 73 | | | | 70 | | | | 65 | | | | 71 | |
Operational energy use in terajoules | | | 31,145 | | | | 32,766 | | | | 31,402 | | | | 28,405 | | | | 28,162 | |
Operational energy efficiency in terajoules per million euro sales | | | 1.34 | | | | 1.29 | | | | 1.24 | | | | 1.15 | | | | 1.21 | |
Operational carbon footprint by Greenhouse Gas Protocol scopes
in kilotonnes CO2-equivalent
2011 - 2015
| | | | | | | | | | | | | | | | | | | | |
| | | 2009 | | | 2010 | | | 2011 | | | 2012 | | | 2013 | |
Scope 1 | | | 447 | | | | 441 | | | | 431 | | | | 443 | | | | 465 | |
Scope 2 | | | 636 | | | | 485 | | | | 427 | | | | 409 | | | | 387 | |
Scope 3 | | | 847 | | | | 919 | | | | 913 | | | | 762 | | | | 802 | |
| | | | |
Philips Group | | | 1,930 | | | | 1,845 | | | | 1,771 | | | | 1,614 | | | | 1,654 | |
| | | | | | | | | | | | | | | | | | | | |
| | | | |
| | | 2011 | | | 2012 | | | 2013 | | | 2014 | | | 2015 | |
| | | | |
Scope 1 | | | 381 | | | | 355 | | | | 361 | | | | 320 | | | | 261 | |
Scope 2 (market based) | | | 365 | | | | 335 | | | | 313 | | | | 277 | | | | 236 | |
Scope 3 | | | 1,146 | | | | 950 | | | | 1,004 | | | | 924 | | | | 920 | |
| | | | |
Philips Group | | | 1,892 | | | | 1,640 | | | | 1,678 | | | | 1,521 | | | | 1,417 | |
Scope 2 (location based) | | | 579 | | | | 584 | | | | 583 | | | | 546 | | | | 496 | |
| | | | |
Water
Total water intake in 20132015 was 5.02.7 million m3, about 4% higher12% lower than in 2012.2014. This increasedecrease was mainly due to a new acquisition in China that started to report in 2013, which accountedlower production volumes at multiple Lighting sites where water is used for 6% of group water consumption in 2013 as well as increased water usecooling purposes, operational changes and water-saving actions at two Lighting Lumileds sites, mitigated by water conservation activities across all sectors.various sites.
Lighting represents around 79%64% of total water usage. In this sector, water is used in manufacturing as well as for domestic purpose.purposes. The other sectors use water mainly for domestic purposes. The exclusion of Lumileds and
Annual Report 2015 61
Group performance 5.3.3
Automotive has a significant downward impact on the water consumption of Philips. In 2015, Lumileds and Automotive accounted for 1.7 million m3 of water.
Philips Group
Water intake
in thousands of m3
2011 - 2015
| | | | | | | | | | | | | | | | | | | | |
| | | 2009 | | | 2010 | | | 2011 | | | 2012 | | | 2013 | |
Healthcare | | | 363 | | | | 256 | | | | 308 | | | | 421 | | | | 454 | |
Consumer Lifestyle | | | 315 | | | | 351 | | | | 338 | | | | 303 | | | | 586 | |
Lighting | | | 3,531 | | | | 3,604 | | | | 3,682 | | | | 4,133 | | | | 4,004 | |
Innovation, Group & Services | | | 7 | | | | 7 | | | | — | | | | — | | | | — | |
| | | | |
Philips Group | | | 4,216 | | | | 4,218 | | | | 4,328 | | | | 4,857 | | | | 5,044 | |
| | | | | | | | | | | | | | | | | | | | |
| | | | |
| | | 2011 | | | 2012 | | | 2013 | | | 2014 | | | 2015 | |
| | | | |
Healthcare | | | 308 | | | | 421 | | | | 454 | | | | 514 | | | | 439 | |
Consumer Lifestyle | | | 338 | | | | 303 | | | | 586 | | | | 537 | | | | 537 | |
Lighting | | | 2,249 | | | | 2,413 | | | | 2,249 | | | | 2,052 | | | | 1,751 | |
Innovation, Group & Services | | | — | | | | — | | | | — | | | | — | | | | — | |
| | | | |
Continuing operations | | | 2,895 | | | | 3,137 | | | | 3,289 | | | | 3,103 | | | | 2,727 | |
Discontinued operations | | | 1,433 | | | | 1,720 | | | | 1,755 | | | | 1,700 | | | | 1,684 | |
| | | | |
Philips Group | | | 4,328 | | | | 4,857 | | | | 5,044 | | | | 4,803 | | | | 4,411 | |
| | | | |
In 2013, 82%2015, 72% of water was purchased and 18%28% was extracted from groundwater wells.
Waste
TotalIn 2015, total waste increased 5%decreased by some 9% compared to 922014 to 68.5 kilotonnes, in 2013 from 88 kilotonnes in 2012. Lighting (77%) and Consumer Lifestyle (12%) account for 89% of our total waste. The increase was mainly due to one-time demolition scrapoperational changes, lower production volumes and less packing waste at a Lighting site in the Netherlands (10 kilotonnes)sites. Lighting contributed 66% of total waste, Consumer Lifestyle 17% and a new acquisition in China, mitigated by theHealthcare 17%. The exclusion of the AVM&A business in CLLumileds and waste reduction programs in all sectors.Automotive had a 9% downward impact on total waste.
Philips Group
Total wastein kilotonnes
in kilotonnes2011 - 2015
| | | | | | |
| | | | | | | | | | | | 2011 | | | 2012 | | | 2013 | | | 2014 | | | 2015 | |
| | | 2009 | | | 2010 | | | 2011 | | | 2012 | | | 2013 | | | | | |
Healthcare | | | 8.2 | | | | 11.2 | | | | 9.3 | | | | 10.4 | | | | 9.6 | | | | 9.3 | | | | 10.4 | | | | 9.6 | | | | 9.8 | | | | 11.6 | |
Consumer Lifestyle | | | 20.1 | | | | 23.2 | | | | 19.6 | | | | 12.7 | | | | 11.4 | | | | 19.6 | | | | 12.7 | | | | 11.4 | | | | 11.3 | | | | 11.6 | |
Lighting | | | 69.3 | | | | 70.1 | | | | 65.1 | | | | 64.5 | | | | 71.0 | | | | 58.1 | | | | 57.5 | | | | 54.9 | | | | 53.9 | | | | 45.3 | |
Innovation, Group & Services | | | 0.1 | | | | 0.1 | | | | 0.0 | | | | 0.0 | | | | 0.0 | | | | — | | | | — | | | | — | | | | — | | | | — | |
| | | | | | | | |
Continuing operations | | | | 87.0 | | | | 80.6 | | | | 75.9 | | | | 75.0 | | | | 68.5 | |
Discontinued operations | | | | 7.0 | | | | 7.0 | | | | 16.1 | | | | 5.4 | | | | 6.4 | |
| | | | | |
Philips Group | | | 97.7 | | | | 104.6 | | | | 94.0 | | | | 87.6 | | | | 92.0 | | | | 94.0 | | | | 87.6 | | | | 92.0 | | | | 80.4 | | | | 74.9 | |
| | | | | |
Total waste consists of waste that is delivered for landfill, incineration or recycling. Materials delivered for recycling via an external contractor comprised 7457 kilotonnes, which equated to 81%,equals 83% of total waste, an improvement compared to 77%80% in 2012,2014, as our manufacturing sites
Annual Report 2013 85
4 Group performance 4.3.3 - 4.4
implemented continued their recycling programs.
Of the 17% remaining waste, 14%72% comprised non-hazardous waste and 5%28% hazardous waste.waste; 8.2 kilotonnes of waste was sent to landfill.
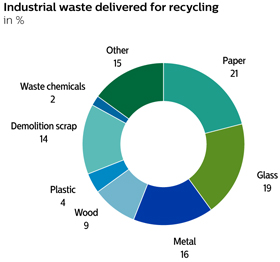
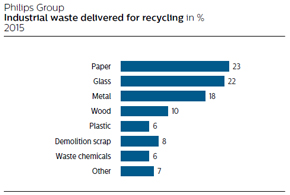
Emissions
Emissions of restricted substances totaled 926 kilos in 2013,2015, mainly caused by one site in China reporting a significant decrease compared to 55 kilosthinner containing benzene. For the third year in 2012, due to a continued reduction inrow, mercury emissions at Lighting and more accurate measurements.were as low as reasonably achievable, according to our assessment. The level of emissions of hazardous substances decreased from 28,310 kilos to 25,101 kilos (-11%), driven by some 40% from 70,093a reduction in xylene emissions at Consumer Lifestyle, due to 40,451 kilos, mainlylower production of products where these specific lacquers and thinners are used as a result ofwell as a decrease in total styrene emissions at two Lighting sites. Lighting and more accurate measurements mitigated by an increase in xylene emissions in CL. All sectorsConsumer Lifestyle have reduction programs for the restricted and hazardous substances.
Philips Group
Ratios relating to carbon emissions and energy use
2011 - 2015
| | | | | | | | | | | | | | | | | | | | |
| | | | |
| | | 2011 | | | 2012 | | | 2013 | | | 2014 | | | 2015 | |
| | | | |
Operational CO2 emissions in kilotonnes CO2-equivalent | | | 1,892 | | | | 1,640 | | | | 1,678 | | | | 1,521 | | | | 1,417 | |
Operational CO2 efficiency in tonnes CO2-equivalent per million EUR sales | | | 95 | | | | 74 | | | | 76 | | | | 71 | | | | 58 | |
Operational energy use in terajoules | | | 31,682 | | | | 28,886 | | | | 29,586 | | | | 27,579 | | | | 25,614 | |
Operational energy efficiency in terajoules per million EUR sales | | | 1.59 | | | | 1.30 | | | | 1.35 | | | | 1.29 | | | | 1.06 | |
| | | | |
Philips Group
Restricted and hazardous substancesin kilos
in kilos2011 - 2015
| | | | | | |
| | | | | | | | | | | | 2011 | | | 2012 | | 2013 | | 2014 | | 2015 | |
| | | 2009 | | | 2010 | | | 2011 | | | 2012 | | | 2013 | | | | | |
Restricted substances | | | 272 | | | | 188 | | | | 111 | | | | 55 | | | | 9 | | | | 111 | | | | 67 | 1) | | | 37 | 1) | | | 29 | 1) | | | 26 | |
Hazardous substances | | | 32,869 | | | | 61,795 | | | | 65,477 | | | | 70,093 | | | | 40,451 | | | | 63,604 | | | | 67,530 | | | | 35,118 | | | | 28,310 | | | | 25,101 | |
| | | | | |
| 1) | Numbers have been restated |
For more details on restricted and hazardous substances, please refer to sub-section 13.3.3,14.3.3, Green Operations, of this report.
4.45.4 Proposed distribution to shareholders
Pursuant to article 34 of the articles of association of Royal Philips, a dividend will first be declared on preference shares out of net income. The remainder of the net income, after reservations made with the
62 Annual Report 2015
Group performance 5.4
approval of the Supervisory Board, shall be available for distribution to holders of common shares subject to shareholder approval after year-end. As of December 31, 2013,2015, the issued share capital consists only of common shares; no preference shares have been issued. Article 33 of the articles of association of Royal Philips gives the Board of Management the power to determine what portion of the net income shall be retained by way of reserve, subject to the approval of the Supervisory Board.
A proposal will be submitted to the 2014upcoming Annual General Meeting of Shareholders to declare a dividend of EUR 0.80 per common share (up to EUR 740 million), in cash or in shares at the option of the shareholder, against the net income for 2013.2015 and retained earnings.
Shareholders will be given the opportunity to make their choice between cash and shares between May 8, 201418, 2016 and May 30, 2014.June 10, 2016. If no choice is made during this election period the dividend will be paid in shares. On May 30, 2014June 10, 2016 after close of trading, the number of share dividend rights entitled to one new common share will be determined based on the volume weighted average price of all traded common shares Koninklijke Philips N.V. at NYSE Euronext Amsterdam on 28, 29June 8, 9 and 30 May 2014.10, 2016. The Company will calculate the number of share dividend rights entitled to one new common share (the ‘ratio’), such that the gross dividend in shares will be approximately equal to the gross dividend in cash. On June 3, 201414, 2016 the ratio and the number of shares to be issued will be announced. Payment of the dividend and delivery of new common shares, with settlement of fractions in cash, if required, will take place from June 4, 2014.15, 2016. The distribution of dividend in cash to holders of New York registryRegistry shares will be made in USD at the USD/EUR rate fixed by the European Central Bank on June 2, 2014.
86 Annual Report 2013
4 Group performance 4.4 - 4.6
13, 2016.
Dividend in cash is in principle subject to 15% Dutch dividend withholding tax, which will be deducted from the dividend in cash paid to the shareholders. Dividend in shares paid out of net income and retained earnings is subject to 15% dividend withholding tax, but only in respect of the par value of the shares (EUR 0.20 per share).
In 2013,2015, a dividend of EUR 0.750.80 per common share was paid in cash or shares, at the option of the shareholder. Approximately 59.8%For 59.2% of the shares, the shareholders elected for a share dividend resulting in the issue of 18,491,33717,671,990 new common shares, leading to a 2.1% percent1.9% dilution. EUR 271,991,204298 million was paid in cash. For additional information, see chapter 16,17, Investor Relations, of this report.
The balance sheet presented in this report, as part of the Company financial statements for the period ended December 31, 2013,2015, is before appropriation of the result for the financial year 2013.2015.
5.5 Outlook
For 2016, we continue to expect modest comparable sales growth and we will build on our 2015 operational performance improvement. Taking into account ongoing macro-economic headwinds and the phasing of costs and sales, we expect improvements in the year to be back-end loaded.
Annual Report 2015 63
Group performance 5.6
4.5 Outlook
Achieving the 2013 financial targets was an important milestone and we have now set our sights on reaching our 2016 targets. We are confident in our ability to further improve our performance by continuing the strong focus on our Accelerate! transformation program. Looking at 2014, we remain cautious because of the ongoing macro-economic uncertainties, currency headwinds and softer order intake in Q4 2013. Therefore, we expect that 2014 will be a modest step towards our 2016 targets, also taking into account restructuring to drive the new productivity targets and investments in additional growth initiatives.
4.65.6 Critical accounting policies
Critical accounting policies
The preparation of Philips’ financial statements requires us to make estimates and judgments that affect the reported amounts of assets and liabilities at the date of our financial statements. The policies that management considers both to be most important to the presentation of Philips’ financial condition and results of operations and to make the most significant demands on management’s judgments and estimates about matters that are inherently uncertain, are discussed below. Management cautions that future events often vary from forecasts and that estimates routinely require adjustment. A more detailed description of Philips’ accounting policies appears in the note 1, Significant accounting policies section.
Accounting for pensions and other postretirement benefits
Retirement benefits represent obligations that will be settled in the future and require assumptions to project benefit obligations and fair values of plan assets. Retirement benefit accounting is intended to reflect the recognition of future benefit costs over the employee’s approximate service period, based on the terms of the plans and the investment and funding decisions made. The accounting requires management to make assumptions regarding variables such as discount rate, rate of compensation increase, mortality rate and future healthcare costs. Pension assumptions are set centrally by management in consultation with its local, regional or country management and locally appointed actuaries at least once a year. For the Company’s major plans, a full discount rate curve of high quality corporate bonds (using Towers Watson RATE:Link data) is used to determine the defined benefit obligation whereas for other plans a single point discount rate is used based on the plan’s maturity. Plans in countries without a deep corporate bond market, use a discount rate based on the local sovereign curve and the plan’s maturity. Relevant data regarding various local swap curves, sovereign bond curves and/or corporate AA bonds are set by local actuaries. Changes in the key assumptions can have a significant impact on the projected benefit obligations, funding requirements and periodic cost incurred.
Annual Report 2013 87
4 Group performance 4.6 - 4.6
For a discussion of the current funded status, a sensitivity analysis with respect to pension plan assumptions, a summary of the changes in the accumulated postretirement benefit obligations and a reconciliation of the obligations to the amounts recognized in the consolidated balance sheet, please refer to note 30, Post-employment benefits.
Accounting for income taxes
As part of the process of preparing consolidated financial statements, the Company is required to estimate income taxes in each of the jurisdictions in which it conducts business. This process involves estimating actual current tax expense and temporary differences between tax and financial reporting. Temporary differences result in deferred tax assets and liabilities, which are included in the consolidated balance sheet. The Company regularly reviews the deferred tax assets for recoverability and will only recognize these if it is believed that sufficient future taxable profit is available, including income from forecasted operating earnings, the reversal of existing taxable temporary differences and established tax planning relating to the same taxation authority and the same taxable entity. For a discussion of the fiscal uncertainties, please refer to the information under the heading “Tax risks” in note 5,8, Income taxes.
Multi-element sales transactions
From time to time the Company is engaged in complex sales transactions relating to multi-element deliveries (for example a single sales transaction that combines of the delivery of goods and rendering of services). The process of revenue recognition of such multi-element sales transactions involves the identification of the different sales components, the allocation of revenue to these different components and the timing of revenue recognition per component. Each of these process steps can be complex and requires judgment. In order to identify different components in a single sales contract, the Company verifies if a component has a stand-alone value to the customer and whether the fair value of the component can be measured reliably. Allocation of revenue to the different components is performed based on either a relative fair value approach or by means of a residual or fair value method, depending on which method is deemed most appropriate to the transaction. Eventually, revenue for each component is recognisedrecognized when meeting the revenue recognition criteria in accordance with IAS 18 or IAS 11.
Provisions and Contingent liabilities
The Company and certain of its group companies and former group companies are involved as a party in legal proceedings, including regulatory and other governmental proceedings, and discussions on potential remedial actions, relating to such matters as antitrust laws, competition issues, commercial transactions, product liabilities, participations and environmental pollution. Since the ultimate disposition of asserted claims and proceedings and investigations cannot be predicted with certainty, an adverse outcome could have a material adverse effect on the Company’s Consolidated financial statements.
The Company recognizes a liability when it is probable that an outflow of resources embodying economic benefits will result from the settlement of a present obligation and the amount at which the settlementoutflow will take place can be measured reliably. If the likelihood of the outcome is less than probable and more than remote or a reliable estimate is not determinable, the matter is disclosed as a contingent liability if management concludes that it is material.
In determining the provision for losses associated with environmental remediation obligations, significant professional judgments are necessary. The Company utilizes experts in the estimation process. The Company accrues for losses associated with environmental obligations when such losses are probable and can be estimated reliably. The provisions are adjusted as new information becomes available and they are remeasured at the end of each period using the current discount rate.
Provisions on restructuring represents estimated costs of initiated reorganizations, the most significant of which have been approved by the Board of Management. A liability is recognized for those costs only when the Company has a detailed formal plan for the restructuring and has raised a valid expectation with those affected that it will carry out the restructuring by starting to implement that plan or announcing its main features to those affected by it.
Provisions on onerous contracts represent the lesser of the unavoidable costs of either fulfilling or exiting the related contract, and in which the costs to fulfill the contract exceed the benefits expected to be received under such contract. In determining the cost of fulfilling the contract, the payments due in the period in which the contract cannot be cancelled are considered, unless there is a lesser amount of penalty to exit the
88 Annual Report 2013
4 Group performance 4.6 - 4.6
contract. Generally, unavoidable costs only include incremental costs related to the contract and exclude allocated or shared costs. Before a provision is established, the Company recognizes any impairment loss on the assets associated with that contract.
The Company provides for warranty costs based on historical trends in product return rates and the expected material and labor costs to provide warranty services. The provision is based on historical warranty data and a weighing of possible outcomes against their associated probabilities.
Accounting for obsolete inventories
The Company records its inventories at cost and accounts for the risk of obsolescence using the lower of cost and net realizable value principle. The expected future use of inventory is based on estimates about future demand and past experience with similar inventories and their usage.
Accounting for bad debt
The risk of uncollectability of accounts receivable is primarily estimated based on prior experience with, and the past due status of, doubtful debtors, while large accounts are assessed individually based on factors that include ability to pay, bankruptcy and payment history. In addition, debtors in certain countries are subject to a higher collectability risk, which is taken into account when assessing the risk of uncollectability. Should the outcome differ from the assumptions and estimates, revisions to the estimated valuation allowances would be required.
Impairment of non-financial assets
Goodwill is not amortized, but tested for impairment annually and whenever impairment indicators require so. The Company reviews non-financial assets, other than goodwill for impairment, when events or circumstances indicate that carrying amounts may not be recoverable.
In determining impairments of non-current assets like intangible assets, property, plant and equipment, investments in associates and goodwill, management
64 Annual Report 2015
Group performance 5.6
must make significant judgments and estimates to determine whether the recoverable amount is lower than the carrying value. Changes in assumptions and estimates included within the impairment reviews and tests could result in significantly different results than those recorded in the consolidated financial statements.
The recoverable amount is the higher of the asset’s value in use and its fair value less costs to sell, the determination of which involves significant judgment and estimates from management.
Goodwill is allocated to the cash generating units. The basis of the recoverable amount used in the annual impairment test (performed in Q2) and trigger-based impairment tests is generally the value in use. Key assumptions used in the impairment tests were sales growth rates, income from operations and the rates used for discounting the projected cash flows. These cash flow projections were determined using management’s internal forecasts that cover an initial period from 20132015 to 20172019 that matches the period used for our strategic review. Projections were extrapolated with stable or declining growth rates for a period of five years, after which a terminal value was calculated. For terminal value calculation, growth rates were capped at a historical long term average growth rate.
Annual Report 2013 89
4 Group performance 4.6 - 4.6
The sales growth rates and margins used to estimate cash flows are based on past performance, external market growth assumptions and industry long-term growth averages. Income from operations in all units is expected to increase over the projection period as a result of volume growth and cost efficiencies. Please refer to note 11, Goodwill.
Discontinued operations and non-current assets held for sale
Non-current assets (disposal groups comprising assets and liabilities), that are expected to be recovered primarily through sale rather than through continuing use, are classified as held for sale. A discontinued operation is a component of an entity that either has been disposed of, or that is classified as held for sale, and (a) represents a separate major line of business or geographical area of operations; and (b) is a part of a single coordinated plan to dispose of a separate major line of business or geographical area of operations; or (c) is a subsidiary acquired exclusively with a view to sell. Non-current assets held for sale and discontinued operations are carried at the lower of carrying amount or fair value less costs to sell.
Determining whether a non-current asset will be primarily recovered through sale rather than through continuing use requires judgment. The Company assesses whether such asset is available for immediate sale in its present condition subject only to terms that are usual and customary for sales of such assets or disposal groups, and its sale is assessed to be highly probably. Furthermore, in order to determine if that component qualifies as a discontinued operations, judgment is required when the Company assesses whether a component of an entity represents a major line of business or geographical area compared to the whole of the Company and whether the sale is a part of a single coordinated plan.
New Accounting StandardsPhilips Group Innovation
ForPhilips Group Innovation invested EUR 21 million in Green Innovations, spread over projects focused on global challenges related to water, air, energy, food, Circular Economy, and access to affordable healthcare. The Research organization within Group Innovation used the Sustainable Innovations Assessment tool, in which innovation projects are evaluated and scored along the environmental and social dimensions, in order to identify those projects that most strongly drive sustainable innovation. As of 2015, transfers of innovation projects include a descriptionLives Improved calculation to assess what the project’s contribution will be to Philips’ vision to improve the lives of the new pronouncements, please refer to the information under the heading “IFRS accounting standard adopted as from 2013” in note 1, Significant accounting policies.
Off-balance sheet arrangements
Please refer to the information under the heading “Guarantees” in sub-section 4.1.23, Cash obligations, of this report and in note 26, Contingent assets and liabilities.3 billion people a year by 2025.
90
58 Annual Report 20132015
5 SectorGroup performance 5 - 55.3.1
5 Sector performance

Innovation, Group & Services
Group Innovation • Design • New Venture Integration • Group and Regional Overheads • Pensions and Global Service Units
Our structure
Koninklijke Philips N.V. (the ‘Company’) is the parent company of the Philips Group (‘Philips’ or the ‘Group’). The Company is managed by the members of the Board of Management and Executive Committee under the supervision of the Supervisory Board. The Executive Committee operates under the chairmanship of the Chief Executive Officer and shares responsibility for the deployment of Philips’ strategy and policies, and the achievement of its objectives and results.
Philips’ activities in the field of health and well-being are organized on a sector basis, with each operating sector – Healthcare, Consumer Lifestyle and Lighting – being responsible for the management of its businesses worldwide.
The Innovation, Group & Services sector includes the activities of Group Innovation, through which Philips invests in projects that are currently not part of the operating sectors, but which could lead to additional organic growth or create value through future spin-offs. Furthermore, Group and regional management organizations support the creation of value, connecting Philips with key stakeholders, especially our employees, customers, government and society. Additionally, the global shared business services for procurement, finance, human resources, IT and real estate are reported in this sector, as well as certain pension costs.
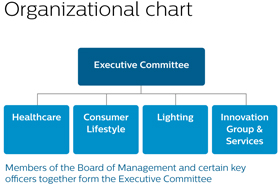
At the end of 2013,2015, Philips’ IP portfolio consisted of 6.7% green patent families. All families are labeled with at least one Green Focal Area. In 2015, 6% of our total new patent filings were flagged as green patent family. Energy efficiency is still the most frequently occurring Green Focal Area throughout the portfolio. As IP is an extension of Philips’ innovation efforts, the portfolio percentage related to green patents is multiplied by our annual patent portfolio costs to determine Philips’ yearly investment in Green IP.
While a product can be classified as green by incorporating an environmentally friendly technology, such technology cannot always be protected in a patent because of a lack of patentability over the state-of-the-art technology. Therefore, there is not necessarily a correlation between green patents and Green Technologies in Green Products.
Energy efficiency of products
Energy efficiency is a key Green Focal Area for our Green Products. According to our analysis, about 97% of the energy consumed during the use phase of our products is attributable to Lighting products. The remaining 3% is split over Consumer Lifestyle and Healthcare. Therefore, we focus on the energy efficiency of our Lighting products in the calculation. The annual energy consumption per product category is calculated by multiplying the power consumption of a product by the average annual operating hours and the annual pieces sold and then dividing the light output (lumens) by the energy consumed (watts). The average energy efficiency of our total product portfolio increased significantly in 2015 to 44.5 lumen per watt, or 10% compared to 2014. The exclusion of Lumileds and Automotive had a limited upward effect on the energy efficiency of the portfolio.
In 2015, LED sales advanced well, as demand for conventional lighting declined. Compared to 2009, the baseline year of our measurement, the average energy efficiency of our portfolio increased by 33%. We expect the energy efficiency to improve further in the coming years as the traditional incandescent lamp is banned in more countries. Our target for 2015 was a 50% improvement compared to the 2009 baseline. In this target setting, assumptions were made about the speed of the regulatory developments in this area, which fell short of expectations.
Further details on this parameter and the methodology can be found here:
Improving energy efficiency of Philips had 111 production sitesproducts.
Circular Economy
The transition from a linear to a circular economy is essential to create a sustainable world. A circular economy aims to decouple economic growth from the use of natural resources and ecosystems by using these resources more effectively. It is a driver of innovation in 28 countries,the areas of material, component and product re-use, as well as new business models such as system solutions and services. In a circular economy, more effective (re)use of materials enables the creation of more value, both by means of cost savings and by developing new markets or growing existing ones.
For more information on our Circular Economy activities, please refer to sub-section 14.3.1, EcoVision, of this report.
Closing the materials loop
The amount of collection and recycling for 2014 (reported in 2015) was calculated at 28,500 tonnes, a 10% decrease compared to 31,500 tonnes reported in 2014, driven by lower weight of products and components in all sectors. Our target was to double global collection and recycling by 2015 compared to 2009, when the baseline was set around 22,500 tonnes, based on the data retrieved from the Waste Electrical and Electronic Equipment (WEEE) collection schemes and from our own recycling and refurbishment services (mainly Healthcare).
Recycled materials
We calculated the amount of recycled materials used in our products in 2015 at some 13,500 tonnes (2014: 13,000 tonnes) by focusing on the material streams plastics (Consumer Lifestyle), aluminum (Lighting), refurbished products, and spare parts harvesting (Healthcare) depending on their relevance in each sector.
Our target was to double the amount of recycled materials in our products by 2015 compared to 2009, when the baseline was set at 7,500 tonnes.
Further details on this parameter and the methodology can be found here:Closing the materials loop.
5.3.2 Green Product sales
Green Products offer a significant environmental improvement in one or more Green Focal Areas: Energy efficiency, Packaging, Hazardous substances, Weight, Recycling and service outlets in approximately 100 countries,disposal, and 114,689 employees.Lifetime reliability. Sales from Green Products, excluding the Lumileds and
Annual Report 2013 912015 59
5 SectorGroup performance 5 - 55.3.2
Automotive business, increased to EUR 13.0 billion in 2015, or 54% of sales (52% in 2014), thereby reaching a record level for Philips.
Sales, IFOThe exclusion of Lumileds and Adjusted IFO 2013
in millions of euros unless otherwise stated
| | | | | | | | | | | | | | | | | | | | |
| | | sales | | | IFO | | | % | | | Adjusted IFO1) | | | % | |
Healthcare | | | 9,575 | | | | 1,315 | | | | 13.7 | | | | 1,512 | | | | 15.8 | |
Consumer Lifestyle | | | 4,605 | | | | 429 | | | | 9.3 | | | | 483 | | | | 10.5 | |
Lighting | | | 8,413 | | | | 489 | | | | 5.8 | | | | 695 | | | | 8.3 | |
Innovation, Group & Services | | | 736 | | | | (242 | ) | | | — | | | | (239 | ) | | | — | |
| | | | |
Philips Group | | | 23,329 | | | | 1,991 | | | | 8.5 | | | | 2,451 | | | | 10.5 | |
1) | For a reconciliation to the most directly comparable GAAP measures, see chapter 14, Reconciliation of non-GAAP information, of this report
|
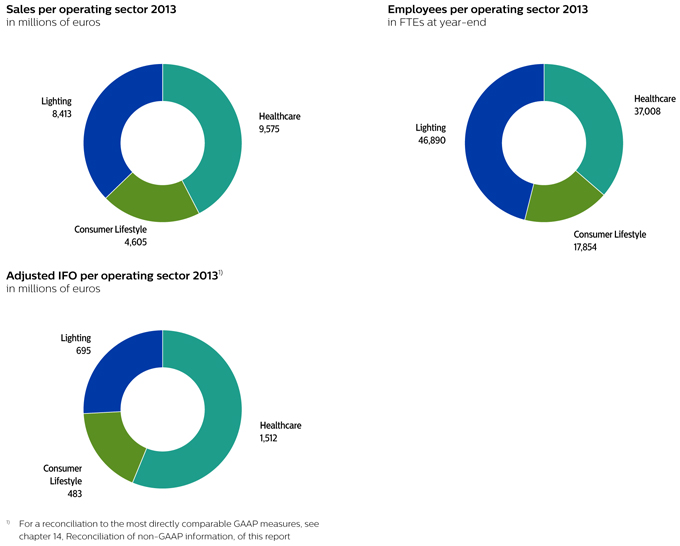
92 Annual Report 2013
5 Sector performance 5.1 - 5.1
We aim to create products that have significantly less impact on the environment during their whole lifecycle through our EcoDesign process. Overall, the most significant improvements have been realized in our energy efficiency Green Focal Area, an important objective of our EcoVision program, although there was also growing attention for hazardous substances and recyclability in all sectors in 2015, the latter driven by our Circular Economy initiatives.New Green Products from each sector include the following examples.
5.1 Healthcare

“As health systems aroundIn 2015, Healthcare expanded the world address the complexities of care delivery at their core, Philips Healthcare is responding to the global call for transformation through meaningfulGreen Product portfolio with 11 new products and intelligent innovation. Across our businesses, we are collaboratingredesigned various current Green Products with customers to consistently provide better care at lower cost to more patients. Through our Accelerate! program, we are delivering on this commitment to our customers faster and more effectively than ever before.”Deborah DiSanzo, CEO Philips Healthcare
By focusing on innovations in key areas across the continuum of care and aligning our resources with customers and clinicians, we continue to provide solutions that offer more value while helping lower the cost of care.
The ongoing implementation of Accelerate! has been enhancing our ability to move quickly and efficiently in delivering the innovation that matters most to our customers.
We continue to drive profitable growth and deliver on our commitments, despite challenging economic headwinds, for instance in North America and Europe.
Annual Report 2013 93
5 Sector performance 5.1.1 - 5.1.2
5.1.1 Health care landscape
Health systems in mature, developing and underserved markets around the world continue to press for new solutions that can help them provide accessible, affordable, quality care to diverse patient populations.
Increasingly, they are abandoning the notion that incremental improvements can resolve the overwhelming economic, demographic and logistic issues standing in the way of the care that is needed. Instead, they are pursuing new opportunities to approach the delivery of care differently.
This broader, deeper and bolder way of thinking is opening the door to a world of transformational solutions with far-reaching implications, ranging from cutting-edge technology platforms and protocols to innovative new business models and initiatives that are redefining the clinical experience across the continuum of care.
The demand for more effective care delivery is intensifying and unrelenting, as people live longer, suffer increasingly from chronic disease, and become bigger consumers of constrained healthcare resources. The burden that this places on health systems is unsustainable – and driving the need for industry-defining solutions.
5.1.2 About Philips Healthcare
At Philips, we are dedicated to delivering innovation that matters to our customers and the patients they serve. We do this by developing innovative solutions across the continuum of care in partnership with clinicians and our customers toenvironmental improvements. These products improve patient outcomes, provide more and better value, and expandhelp secure access to care.
Philipshigh-quality care, while reducing environmental impact. Examples include a new packaging system for our PCMS medical supplies business, which has enabled a 90% reduction in air space in packaging and a 24% reduction in packaging material weight to support our customers in reducing their waste streams. Another example is oneour Home Monitoring business which operates by a performance-based service business model that enables 76% re-use of products and parts while maintaining the world’s leading healthcare companies (based on sales) along with General Electricembedded labor and Siemens.energy. The United States,Efficia is a new Green Product in our largest market, represented 40%value range of Healthcare’s global sales in 2013, followed by China, Japan and Germany. Growth geographies accounted for 25% of Healthcare sales. Philips Healthcare has approximately 37,000 employees worldwide.
In 2013 our Healthcare business was organized around four strategic business groups*:
Imaging Systems: Integrated clinical solutions that include radiation oncology, clinical applications and platforms, and portfolio management; advanced diagnostic imaging, including computed tomography (CT), magnetic resonance imaging (MRI) and molecular imaging (MI); diagnostic X-ray, including digital X-ray and mammography; interventional X-ray, encompassing cardiology, radiology, surgery and other areas; and ultrasound, a modality with diverse customers and broad clinical presence.
Patient Care & Clinical Informatics: Enterprise-wide patient monitoring, solutions, from value solutionswhich is an example of how we aim to sophisticated connected solutions, for real-time clinical information at the patient’s bedside; cardiology informatics and enterprise imaging informatics, including picture archiving and communication systems and other clinical information systems; patient monitoring and clinical informatics; mother and child care, including products and solutions for pregnancy, labor and delivery, newborn and neonatal intensive care and the transition home; and therapeutic care, including cardiac resuscitation, emergency care solutions, therapeutic temperature management, anesthesia care, hospital respiratory systems and ventilation.
Home Healthcare Solutions: Sleep management, respiratory care and non-invasive ventilation; medical alert and medication dispensing services for independent living; and remote patient monitoring.
Customer Services: Equipment services and support including service contracts, installation, equipment maintenance, remote proactive monitoring and multi-vendor services; managed services, including equipment financing and asset management; and professional services, including consulting, site planning and project management, education and design.
* | In January 2014 the Healthcare Informatics Solutions & Services business group was established. This business group is focusing on a common digital healthcare platform, advanced informatics and big data analytics, and world-class integration and consulting services. |
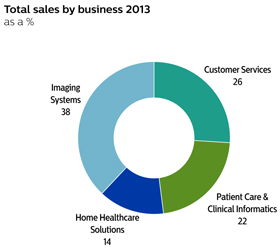
94 Annual Report 2013
5 Sector performance 5.1.2 - 5.1.3
Sales at Healthcare are generally higher in the second half of the year largely due to the timing of new product availability and customer spending patterns.
Regulatory requirements
Philips Healthcare is subject to extensive regulation. We are committed to compliance with regulatory product approval and quality system requirements in every market we serve by addressing specific terms and conditions of local and national regulatory authorities, including the US FDA, the SFDA in China, and other comparable foreign agencies. Obtaining regulatory approval is costly and time-consuming, but a prerequisite for market introduction.
In our Healthcare facility in Cleveland, Ohio, certain issues in the general area of manufacturing process controls were identified during an ongoing US Food and Drug Administration (FDA) inspection. To address these issues, on January 10, 2014, we started a voluntary, temporary suspension of new production at the facility, primarily to strengthen manufacturing process controls. Currently, there is no indication of product safety issues. Please refer to note 36, Subsequent events for further details.
With regard to sourcing, please refer to sub-section 13.2.2, Supplier indicators, of this report.
5.1.3 2013 highlights
In 2013, as healthcare systems continued to move forward with fundamental changes, we remained focused on delivering innovative solutions and investing in strategic alliances that help enable this transformation:
Addressing the world’s most prevalent diseases starts with the clinician’s ability to visualize clearly and accurately within the human body. By integrating imaging and information in meaningful ways – and drawing on our expertise in cardiology, oncology and other critical areas – we expanded our solutions offering with the launch of the EPIQ ultrasound system, advancements in image-guided interventional therapy and other innovations to improve diagnosis, treatment and management of disease.
Achieving the best possible patient outcomes depends on the clinician’s ability to access relevant information, anywhere and anytime. Through innovative devices and strategic collaboration, such as our work with Mayo Clinic on developing cloud-based solutions for the intensive care unit (ICU), we helped providers manage massive amounts of patient data for more confident diagnosis and treatment. Our solutions also helped optimize workflows in an increasingly connected care environment.
The delivery of continuous, quality care to patients living with chronic conditions requires a thoughtful, coordinated approach. New solutions combining advanced functionality and patient-centric design, including the Wisp minimal contact nasal mask for sleep and respiratory therapy, were introduced to help patients adhere to a health regimen for more independent living.
The complexities of healthcare delivery call for comprehensive solutions to address staggering costs, clinician shortages and demanding patient populations. Through customized models and programs, as demonstrated by our multi-year alliance with Georgia Regents Medical Center to facilitate innovative and affordable patient-centered care, we continued to help visionary health systems address these challenges today while moving toward a sustainable future.
Optimizing resources to cost-effectively meet the needs of resource-intensive patient populations requires integrated solutions. By leveraging our leadership in telehealth technology and care coordination, we implemented new Hospital to Home programs with Banner Health in the US and opened eICUs with Guy’s and St Thomas’ Hospitals in the UK.
2013 also marked the third year of our Accelerate! journey of change and performance improvement. We made significant progress driving customer centricity deep into our organization, embracing operational excellence through programs like Design for X (where X can be cost, quality, manufacturing, refurbishment, etc.) and fostering a growth and performance culture across our businesses. One of the key outcomes has been faster alignment across Philips Healthcare in delivering locally relevant innovations and making these solutions more cost-effective through efficiencies in product development.
Annual Report 2013 95
5 Sector performance 5.1.4 - 5.1.4
5.1.4 2013 financial performance
| | | | | | | | | | | | |
| Key data | | | | | | | | | |
| in millions of euros unless otherwise stated | | | | | | | | | | | | |
| | | 2011 | | | 2012 | | | 2013 | |
Sales | | | 8,852 | | | | 9,983 | | | | 9,575 | |
Sales growth | | | | | | | | | | | | |
% increase, nominal | | | 3 | | | | 13 | | | | (4 | ) |
% increase, comparable1) | | | 5 | | | | 6 | | | | 1 | |
Adjusted IFO1) | | | 1,080 | | | | 1,226 | | | | 1,512 | |
as a % of sales | | | 12.2 | | | | 12.3 | | | | 15.8 | |
IFO | | | 27 | | | | 1,026 | | | | 1,315 | |
as a % of sales | | | 0.3 | | | | 10.3 | | | | 13.7 | |
Net operating capital (NOC)1) | | | 8,418 | | | | 7,976 | | | | 7,437 | |
Cash flows before financing activities1) | | | 707 | | | | 1,298 | | | | 1,292 | |
Employees (FTEs) | | | 37,955 | | | | 37,460 | | | | 37,008 | |
1) | For a reconciliation to the most directly comparable GAAP measures, see chapter 14, Reconciliation of non-GAAP information, of this report
|
In 2013, sales amounted to EUR 9,575 million, 4% lower than in 2012 on a nominal basis. Excluding a 5% negative currency effect, comparable sales increased by 1%. Customer Services achieved solid mid-single-digit growth. Home Healthcare Solutions and Patient Care & Clinical Informatics both posted low-single-digit growth, while Imaging Systems recorded a mid-single-digit decline. Green Product sales amounted to EUR 3,690 million, or 39% of sector sales.
Geographically, comparable sales in growth geographies showed high-single digit growth, largely driven by strong double-digit growth in China and Latin America, partly offset by a decline in Russia & Central Asia. In mature geographies, comparable sales declined by 1%. The year-on-year sales decrease was largely attributable to North America and Western Europe, as sales in other mature geographies showed a high-single-digit increase, led mainly by Japan.
Adjusted IFO increased from EUR 1,226 million, or 12.3% of sales, in 2012 to EUR 1,512 million, or 15.8% of sales, in 2013. All businesses delivered improved Adjusted IFO, largely as a result of cost-saving programs related to overhead reduction. Restructuring and acquisition-related charges were close to zero, compared with EUR 134 million in 2012. Adjusted IFO in 2013 also included EUR 61 million from a past-service pension gain and a EUR 21 million gain on the sale of a business.
IFO amounted to EUR 1,315 million, or 13.7% of sales, and included EUR 197 million of charges related to intangible assets.
Net operating capital decreased by EUR 539 million to EUR 7.4 billion, mainly due to currency effects and lower fixed assets.
Cash flows before financing activities decreased slightly from EUR 1,298 million in 2012 to EUR 1,292 million, as higher earnings were more than offset by higher outflows from working capital and provisions.
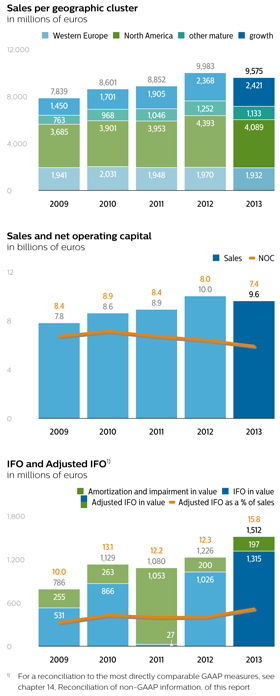
96 Annual Report 2013
5 Sector performance 5.1.5 - 5.1.6
2012 financial performance
In 2012, sales amounted to EUR 9,983 million, 13% higher than in 2011 on a nominal basis, driven by higher sales in all businesses. Excluding a 7% favorable impact of currency effects, comparable sales increased by 6%. High-single-digit comparable sales growth was achieved by Imaging Systems, Home Healthcare Solutions and Patient Care & Clinical Informatics. Green Product sales amounted to EUR 3,610 million, a 36% increase year-on-year.
Geographically, comparable sales in mature geographies were higher than in 2011 in all businesses. The year-on-year sales increase was largely attributable to North America and other mature markets, as sales in Western Europe were in line with 2011. In growth geographies, we achieved 20% growth, largely driven by strong, double-digit growth in China, Brazil, India and Russia.
Adjusted IFO increased from EUR 1,080 million, or 12.2% of sales, in 2011 to EUR 1,226 million, or 12.3% of sales, in 2012. All businesses recorded an improvement in Adjusted IFO, largely as a result of higher sales and cost-saving programs. Restructuring and acquisition-related charges amounted to EUR 134 million, compared with EUR 20 million in 2011.
IFO amounted to EUR 1,026 million, or 10.3% of sales, and included EUR 200 million of charges related to amortization of intangible assets.
Net operating capital in 2012 decreased by EUR 442 million to EUR 8.0 billion, mainly due to currency effects and an increase in provisions related to restructuring charges. All businesses showed improved efficiency in inventory usage year-over-year.
Cash flows before financing activities increased from EUR 707 million in 2011 to EUR 1,298 million, mainly due to higher earnings and lower working capital requirements.
5.1.5 Delivering on EcoVision sustainability commitments
The increasing population and rising levels of human development worldwide pose a number of challenges, such as scarcity of natural resources, pollution, and stressed health care systems. Philips Healthcare continues to help increase the number of lives improved annually around the globe by developing solutions that improve access to care in under-resourced regions while atlowering environmental impact as well. We started to add an energy-efficient CryoCompressor to our MRI systems, with energy savings in the same time respectingvarious non-scanning modes of 30-40%. Both material (30%) and energy (20%) savings are achieved in our new Access CT system, a compact-designed CT for the boundariesvalue segment market. Sleep and Respiratory Care (SRC) launched the V680 ventilator which includes, besides better performance in uninterrupted invasive or noninvasive ventilation, a product and packaging material weight reduction of natural resources. In 2013 we introduced 1360% and 75% respectively and a reduction in energy usage of 80%. Other new Green Products to support energy efficiency, materials reductioncame from SRC (lightweight masks and other sustainability goals. We are also actively collaborating with care providers to looksleep therapy devices), MCS group (lightweight battery chargers) and X-Ray systems for innovative ways to reduce the environmental impact of health care, for example by improving the energy efficiency of medical equipment.Brazilian market without lead counter ballasts.
5.1.6 Delivering innovation that matters to you
Annual Report 2013 97

With image-guided High Intensity Focused Ultrasound from Philips, doctors at the University Hospital in Utrecht are researching ways of providing cancer therapy with fewer side effects and reducing the need for surgery.1)
“Up to 70% of patients with cancer will be facing bone metastases… The patients we see are in a lot of pain. The problems they have are in their daily activities such as sleeping, walking. This pain can be really debilitating.”
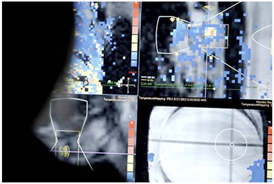
“No instruments whatsoever will go into the patient’s body. Without touching the patient we can treat the patient… By managing their pain we restore patients’ quality of life.”
Dr Merel Huisman
Department of Radiology
UMC Utrecht
“If we have patients with cancer that don’t need to be treated anymore with the surgical scalpel and leave a day after treatment in a good clinical condition, that would be a really major shift in health care and cancer treatment.”
Dr Maurice van den Bosch
Interventional Radiologist
UMC Utrecht

1) | This device is not available for sale in the USA: its use is limited to approved investigations only.
|
98 Annual Report 2013
5 Sector performance 5.2 - 5.2
5.2 Consumer Lifestyle

“Across the world people are increasingly motivated to look and feel their best, seeking solutions that are truly meaningful, solutions that fit their daily lives. At Philips Consumer Lifestyle we are driving profitable growth, by taking global innovations and bringing them to market in a way that is highly locally relevant. We are empowering millions of consumers to make healthier choices every day, in areas such as oral healthcare, nutrition and healthy air.”Pieter Nota, CEO Philips Consumer Lifestyle
We are executing our strategy with rigor, delivering strong growth and improving profitability through locally relevant innovation.
Future growth drivers are clearly set: grow the core businesses through local and global innovation, and geographical expansion of proven propositions; further expand in the domain of personal health and well-being by exploring new business adjacencies and new business areas.
Accelerate! has transformed the sector into a market-driven organization, by changing our operating model, performance culture and end-to-end approach.
Annual Report 2013 99
5 Sector performance 5.2.1 - 5.2.2
5.2.1 Lifestyle retail landscape
Across the world, consumers are looking for solutions that help them to be healthy, live well and enjoy life. They want to be in control of their own health and well-being and to care for their family and friends. They want to look and feel good.
In a connected, digital world, consumers are looking for smart, personalized solutions. Purchase decisions are increasingly made or influenced online; this is as true of consumers in growth geographies such as China, as it is in developed markets such as Western Europe.
The rise of the middle class in growth geographies is another trend impacting the retail landscape. This rapidly expanding group is experiencing greater spending power.
In 2013, economic headwinds caused continued pressure on consumer spending in some markets. However, living a healthy life remained a high priority for consumers.
5.2.2 About Philips Consumer Lifestyle
At Consumer Lifestyle we aim to make a difference to people’s lives by making it easier for them to achieve a healthier and better lifestyle. The sector is focused on value creation through category leadership and operational excellence. We are increasing the quality and local relevance of product innovation, the speed with which we innovate, and expanding our distribution to capture increasing spending power in growth geographies.
Accelerate! is fully embedded in Consumer Lifestyle and delivering strong results. Having moved from a functional, centrally-led organization to an organization built around businesses and markets, we are now able to direct investments to where the growth is, addressing locally relevant consumer needs. This approach enables us to take locally developed platforms and adapt them for other markets or on a global scale.
Our end-to-end approach is accelerating our specialist capability development in mature markets, to enable effective partnerships with customers and consumers, and in growth geographies, to enable development of go-to-market strategies. Additionally, an extensive change program has instilled an organizational performance culture with a strong focus on accountability.
In 2013 the Consumer Lifestyle sector consisted of the following areas of business*:
Health & Wellness: mother and childcare, oral healthcare, pain management
Personal Care: male grooming, beauty
Domestic Appliances: kitchen appliances, coffee, garment care, floor care, air purification
* | Philips had reached an agreement to transfer the Audio, Video, Multimedia and Accessories (AVM&A) business to Funai Electric Co. Ltd in Q1 2013. This agreement has been terminated as of October 25. Since then, Philips has received expressions of interest in the business from various parties and has been actively discussing the sale of the business with potential buyers. In the meantime, the AVM&A business operates as a stand-alone entity named WOOX Innovations. Consequently, the AVM&A business is reported as discontinued operations throughout 2013. |
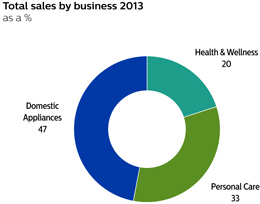
We offer a broad range of products from high to low price/value quartiles, necessitating a diverse distribution model. We continue to expand our portfolio to increase its accessibility, particularly for lower-tier cities in growth geographies. We have implemented innovative approaches in online and social media to build our brand and drive sales.
Under normal economic conditions, the Consumer Lifestyle sector experiences seasonality, with higher sales in the fourth quarter.
Consumer Lifestyle employs approximately 17,900 people worldwide. Our global sales and service organization covers more than 50 developed and growth geographies. In addition, we operate manufacturing and business creation organizations in Austria, Brazil, China, India, Indonesia, Italy, the Netherlands, Romania, the UK and the US.
100 Annual Report 2013
5 Sector performance 5.2.2 - 5.2.4
A new innovation site in Shanghai is fully equipped to target specific market needs. Innovating directly in the market allows us to increase the annual number of locally relevant introductions and to implement product and packaging updates faster.
Regulatory requirements
Consumer Lifestyle is subject to significant regulatory requirements in the markets where it operates. This includes the European Union’s Waste from Electrical and Electronic Equipment (WEEE), Restriction of Hazardous Substances (RoHS), Registration, Evaluation, Authorization and Restriction of Chemicals (REACH), Energy-use offocuses on Green Products (EuP) requirements and Product Safety Regulations. Consumer Lifestyle has a growing portfolio of medically regulated products in its Health & Wellness and Personal Care businesses. For these products we are subject to the applicable requirements of the US FDA, the European Medical Device Directive, the SFDA in China, the regulations stipulated by Health Authorities in India and comparable regulations in other countries. Through our growing beauty, oral healthcare and mother and childcare product portfolio the range of applicable regulations has been extended to include requirements relating to cosmetics and, on a very small scale, pharmaceuticals.
With regard to sourcing, please refer to sub-section 13.2.2, Supplier indicators, of this report.
5.2.3 2013 highlights
Building our leadership in digital innovation, we unveiled a range of connected consumer propositions at this year’s IFA trade show in Berlin. Highlights included a smart air purifier, baby monitor and a digital grooming guide.
The extended Philips AVENT Natural infant feeding range was showcased at the Kind + Jugend fair in Germany. The Natural baby bottle is proven to be more easily accepted by babies, thanks to its unique teat design.
Further strengthening our global leadership, the latest introductions in Oral Healthcare, including the Philips Sonicare PowerUp and Sonicare FlexCare Platinum, have been well received by consumers and are driving strong growth in North America and China.
Continuing the geographical expansion and localization of proven product innovations, we introduced the Airfryer in Japan and the SoupMaker in markets across Europe, the Middle East and Latin America. Additionally, following major success in Russia, the MultiCooker was launched in several European markets, with initial market response exceeding expectations.
Innovative, precision tools are driving market share and brand preference in male grooming. Following the successful launch of the Click & Style range, we further expanded our portfolio with the introduction of the world’s first laser-guided beard trimmer: the Philips Beard Trimmer 9000.
Demonstrating our ability to respond quickly to local market opportunities, we recorded strong sales growth in our air purifier business in China on the back of heightened awareness of outdoor air quality in the country.
5.2.4 2013 financial performance
Key data
in millions of euros unless otherwise stated
| | | | | | | | | | | | |
| | | 2011 | | | 2012 | | | 2013 | |
Sales | | | 3,771 | | | | 4,319 | | | | 4,605 | |
Sales growth | | | | | | | | | | | | |
% increase (decrease), nominal | | | 14 | | | | 15 | | | | 7 | |
% increase (decrease), comparable1) | | | 11 | | | | 9 | | | | 10 | |
Adjusted IFO1) | | | 153 | | | | 456 | | | | 483 | |
as a % of sales | | | 4.1 | | | | 10.6 | | | | 10.5 | |
IFO | | | 109 | | | | 400 | | | | 429 | |
as a % of sales | | | 2.9 | | | | 9.3 | | | | 9.3 | |
Net operating capital (NOC)1) | | | 874 | | | | 1,205 | | | | 1,261 | |
Cash flows before financing activities1) | | | (271 | ) | | | 422 | | | | 472 | |
Employees (FTEs) | | | 15,471 | | | | 16,542 | | | | 17,854 | |
1) | For a reconciliation to the most directly comparable GAAP measures, see chapter 14, Reconciliation of non-GAAP information, of this report
|
Sales amounted to EUR 4,605 million, a nominal increase of 7% compared to 2012. Excluding a 3% negative currency impact, comparable sales were 10% higher year-on-year. Domestic Appliances achieved strong double-digit growth, while Health & Wellness and Personal Care recorded high-single-digit growth.
From a geographical perspective, comparable sales showed a 17% increase in growth geographies and 4% growth in mature geographies. In growth geographies, the year-on-year sales increase was driven by Russia and China, primarily in our Domestic Appliances and Personal Care businesses. Growth geographies’ share of sector sales increased from 45% in 2012 to 47% in 2013.
Adjusted IFO increased from EUR 456 million, or 10.6% of sales, in 2012 to EUR 483 million, or 10.5% of sales, in 2013. Restructuring and acquisition-related charges
Annual Report 2013 101
5 Sector performance 5.2.4 - 5.2.4
amounted to EUR 14 million in 2013, compared to EUR 56 million in 2012. Adjusted IFO in 2012 included a EUR 160 million one-time gain from the extension of our partnership with Sara Lee, including the transfer of our 50% ownership right to the Senseo trademark. Excluding this one-time gain, the year-on-year Adjusted IFO increase was driven by improved earnings in all businesses.
IFO amounted to EUR 429 million, or 9.3% of sales, which included EUR 54 million of amortization charges, mainly related to intangible assets at Health & Wellness and Domestic Appliances.
Net operating capital increased from EUR 1,205 million in 2012 to EUR 1,261 million in 2013, due to higher working capital and lower provisions.
Cash flows before financing activities increased from EUR 422 million in 2012 to EUR 472 million in 2013. Excluding the cash proceeds of EUR 170 million received in 2012 from the Senseo transaction, cash flows before financing activities increased by EUR 120 million mainly attributable to higher cash earnings.
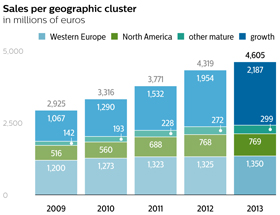
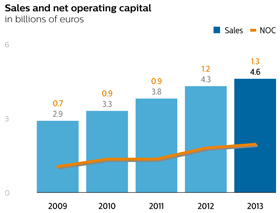
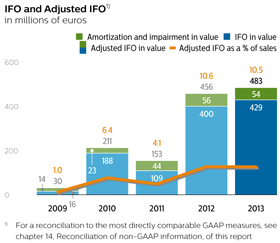
2012 financial performance
Sales amounted to EUR 4,319 million, a nominal increase of 15% compared to 2011, mainly driven by double-digit growth in our Health & Wellness and Domestic Appliances businesses. Excluding a 4% favorable currency impact and a 2% impact from portfolio changes, comparable sales were 9% year-on-year.
From a geographical perspective, comparable sales showed a 7% increase in growth geographies, which was partly offset by a 2% decline in mature geographies, mainly in Western Europe. In growth geographies, the year-on-year sales increase was driven by Russia and China, primarily in our Domestic Appliances and Personal Care businesses. Growth geographies’ share of sector sales increased from 41% in 2011 to 45% in 2012.
Adjusted IFO increased from EUR 153 million, or 4.1% of sales, in 2011 to EUR 456 million, or 10.6% of sales, in 2012. Restructuring and acquisition-related charges amounted to EUR 56 million in 2012, compared to EUR 49 million in 2011. 2012 results included a EUR 160 million one-time gain from the extension of our partnership with Sara Lee, including the transfer of our 50% ownership right to the Senseo trademark. Excluding this one-time gain, the year-on-year Adjusted IFO increase was driven by higher sales as well as lower net costs formerly reported as part of the Television business. Compared to 2011, Adjusted IFO improvements were seen in all businesses.
IFO amounted to EUR 400 million, or 9.3% of sales, which included EUR 56 million of amortization charges, mainly related to intangible assets at Health & Wellness and Domestic Appliances.
102 Annual Report 2013
5 Sector performance 5.2.5 - 5.2.6
Net operating capital increased from EUR 874 million in 2011 to EUR 1,205 million in 2012, primarily due to a reduction in the accounts payable balance related to the former Television business in Consumer Lifestyle.
Cash flows before financing activities increased from a cash outflow of EUR 271 million in 2011 to a cash inflow of EUR 422 million. The increase was attributable to higher cash earnings, lower cash outflows for acquisitions as well as cash proceeds of EUR 170 million from the Senseo transaction.
5.2.5 Delivering on EcoVision sustainability commitments
Sustainability plays an important role at Consumer Lifestyle, with the main focus on optimizing the sustainability performance of our products and operations. Green products, which meet or exceed our minimum requirements in the areas of energy consumption, packaging, and substances of concern, accounted for 49%concern. The sales of Green Products in 2015 surpassed 58% of total sales in 2013. And more than 80% ofsales. All our shavingGreen Products with rechargeable batteries (like toothbrushes, shavers, and grooming products) exceed the stringent California energy efficiency norm by at least 10%. We are making steady progress in developing PVC/BFR-free products. More than 65% of sales consist of PVC/BFR-free products, with the exception of the power cords, for which there are not yet economical viable alternatives available. In the remaining 35% of product sales, PVC/BFR has already been phased out to a significant extent, but the products are not yet completely PVC/BFR-free.free of these substances.
In 2013 we continued to increase the use2015, more kitchen appliances, vacuum cleaners, coffee machines and irons were launched with parts made of recycled materials in our products. Over 330plastics. In total we have applied some 900 tons of recycled plastics in our products. An example is the new Perfect Care Eco Aqua Steam Generator, with more than 50% recycled plastics.
Lighting
Green Product sales within Philips Lighting increased to 72% in 2015. Connected lighting systems contributed to Green Product sales with solutions in more applications and market segments. In August 2015 the new installation of the connected Philips LED lighting system in the Allianz Arena made it Germany’s first and Europe’s largest stadium to feature a dynamic and colorful light display on its entire façade. This new energy-efficient lighting system also saves approximately 60% on electricity and 362 tons of CO2 per year. The maintenance and operating costs are also lower due to the cloud-based Philips ActiveSite platform. The LEDs have an average lifetime of 80,000 operating hours and the system is extremely robust, even under extreme weather conditions.
5.3.3 Green Operations
The Green Operations program focuses on the main contributors to climate change, recycling of waste, reduction of water consumption, and reduction of emissions of restricted and hazardous substances. Full details can be found in chapter 14, Sustainability statements, of this report.
60 Annual Report 2015
Group performance 5.3.3
Carbon footprint and energy efficiency
After achieving our EcoVision4 carbon emissions reduction target in 2012, we continued our energy efficiency improvement programs across different disciplines. This year we have achieved our 2015 emission reduction target that was set at a 40% decrease in CO2 reductions compared to our 2007 base year. Our carbon footprint decreased by 7% compared to 2014, resulting in a total of 1,417 kilotonnes CO2, a 41% decrease compared to 2007. This was mainly achieved by emissions reductions of 17% compared to 2014 in our manufacturing facilities, resulting from operational changes and decreased energy usage due to lower load at energy intensive Lighting factories. Additionally the energy intensity for our non-industrial operations decreased resulting in emission reductions of 16%. Business travel emissions showed a slight reduction of 1% compared to 2014. In order to further decrease our business travel emissions we will continue to promote video conferencing as an alternative to travel in 2016. These reductions were, however, offset by a 23% increase in emissions from air transport over the course of 2015, mainly at Healthcare to meet demand.
Our operational energy efficiency improved by 18%, from 1.29 terajoules per million euro sales in 2014 to 1.06 terajoules per million euro sales in 2015 as a result of energy efficiency programs in our industrial sites.
During 2015, the applied emission factors used to calculate our operational carbon footprint have been updated from the previously used DEFRA (UK Department for Environment, Food & Rural Affairs) 2007 and bespoke emission factors to the applicable DEFRA 2015 emission factors for each year respectively. This update affected all historical data and resulted in an overall average increase of our carbon emissions by 11% for all years. We implemented these new emission factors to ensure improved carbon disclosure. The emission factor update did not affect our performance against the base year.
From this year onward our scope 2 emissions reporting will include both the market based method as well as the location based method. Both methods are adopted according to the new Corporate Standard of the Greenhouse Gas (GHG) Protocol as further described in chapter 14, Sustainability statements, of this report. The market based method will serve as reference for calculating our total operational carbon footprint. As explained in chapter 14, the market based method includes reduction of our emissions resulting from purchasing renewable energy. In 2015, we procured 54% of our electricity from renewable sources. Approximately 60% of our renewable energy is standardly contracted via our energy providers. The remaining 40% was mainly sourced in the United States through procurement of renewable energy certificates.
The impact of the exclusion of Lumileds and Automotive is displayed as discontinued operations in the next graph; the size of which varies over the years, but averages around 10% over the past 5 years. Emissions from discontinued operations in our industrial activities have been identified exactly. Emissions from our non-industrial facilities and business travel have been estimated based on FTE data. For our logistics emissions the part of discontinued operations has been estimated using revenue share as a proxy where applicable.
Philips Group
Operational carbon footprint by Greenhouse Gas Protocol scopesin kilotonnes CO2-equivalent
2011 - 2015
| | | | | | | | | | | | | | | | | | | | |
| | | | |
| | | 2011 | | | 2012 | | | 2013 | | | 2014 | | | 2015 | |
| | | | |
Scope 1 | | | 381 | | | | 355 | | | | 361 | | | | 320 | | | | 261 | |
Scope 2 (market based) | | | 365 | | | | 335 | | | | 313 | | | | 277 | | | | 236 | |
Scope 3 | | | 1,146 | | | | 950 | | | | 1,004 | | | | 924 | | | | 920 | |
| | | | |
Philips Group | | | 1,892 | | | | 1,640 | | | | 1,678 | | | | 1,521 | | | | 1,417 | |
Scope 2 (location based) | | | 579 | | | | 584 | | | | 583 | | | | 546 | | | | 496 | |
| | | | |
Water
Total water intake in 2015 was 2.7 million m3, about 12% lower than in 2014. This decrease was mainly due to lower production volumes at multiple Lighting sites where water is used for cooling purposes, operational changes and water-saving actions at various sites.
Lighting represents around 64% of total water usage. In this sector, water is used in vacuum cleanersmanufacturing as well as for domestic purposes. The other sectors use water mainly for domestic purposes. The exclusion of Lumileds and almost 250 tons in irons. In our operations we continue to use more energy from renewable sources, with the ultimate aim of having CO2-neutral production sites. In 2013 we improved the recycling percentage of our industrial waste to almost 80%.
5.2.6 Delivering innovation that matters to you
Annual Report 2013 1032015 61

Jialing Jin’s family means the world to him. And he wants them to know it. When he shaves with a Philips SensoTouch 3D, he feels more confident and his family feels the difference.
“I think having a clean-cut and neat appearance can boost a man’s confidence. In the past I used a standard razor, but it irritated my skin.”


“Since I began using the new Philips SensoTouch 3D razor, my shaving experience has noticeably improved. My skin is even smoother and my daughter loves to touch my face. She tells me my skin is so smooth! Having a clean-cut and tidy appearance increases my confidence, and with that I am able to enjoy a full life.”
104 Annual Report 2013
5 SectorGroup performance 5.3 - 5.3.15.3.3
5.3Automotive has a significant downward impact on the water consumption of Philips. In 2015, Lumileds and Automotive accounted for 1.7 million m3 of water.
Philips Group
Water intakein thousands of m3
2011 - 2015
| | | | | | | | | | | | | | | | | | | | |
| | | | |
| | | 2011 | | | 2012 | | | 2013 | | | 2014 | | | 2015 | |
| | | | |
Healthcare | | | 308 | | | | 421 | | | | 454 | | | | 514 | | | | 439 | |
Consumer Lifestyle | | | 338 | | | | 303 | | | | 586 | | | | 537 | | | | 537 | |
Lighting | | | 2,249 | | | | 2,413 | | | | 2,249 | | | | 2,052 | | | | 1,751 | |
Innovation, Group & Services | | | — | | | | — | | | | — | | | | — | | | | — | |
| | | | |
Continuing operations | | | 2,895 | | | | 3,137 | | | | 3,289 | | | | 3,103 | | | | 2,727 | |
Discontinued operations | | | 1,433 | | | | 1,720 | | | | 1,755 | | | | 1,700 | | | | 1,684 | |
| | | | |
Philips Group | | | 4,328 | | | | 4,857 | | | | 5,044 | | | | 4,803 | | | | 4,411 | |
| | | | |
In 2015, 72% of water was purchased and 28% was extracted from groundwater wells.
Waste
In 2015, total waste decreased by some 9% compared to 2014 to 68.5 kilotonnes, mainly due to operational changes, lower production volumes and less packing waste at Lighting sites. Lighting contributed 66% of total waste, Consumer Lifestyle 17% and Healthcare 17%. The exclusion of Lumileds and Automotive had a 9% downward impact on total waste.
Philips Group
Total wastein kilotonnes
2011 - 2015
| | | | | | | | | | | | | | | | | | | | |
| | | | |
| | | 2011 | | | 2012 | | | 2013 | | | 2014 | | | 2015 | |
| | | | |
Healthcare | | | 9.3 | | | | 10.4 | | | | 9.6 | | | | 9.8 | | | | 11.6 | |
Consumer Lifestyle | | | 19.6 | | | | 12.7 | | | | 11.4 | | | | 11.3 | | | | 11.6 | |
Lighting | | | 58.1 | | | | 57.5 | | | | 54.9 | | | | 53.9 | | | | 45.3 | |
Innovation, Group & Services | | | — | | | | — | | | | — | | | | — | | | | — | |
| | | | |
Continuing operations | | | 87.0 | | | | 80.6 | | | | 75.9 | | | | 75.0 | | | | 68.5 | |
Discontinued operations | | | 7.0 | | | | 7.0 | | | | 16.1 | | | | 5.4 | | | | 6.4 | |
| | | | |
Philips Group | | | 94.0 | | | | 87.6 | | | | 92.0 | | | | 80.4 | | | | 74.9 | |
| | | | |
Total waste consists of waste that is delivered for landfill, incineration or recycling. Materials delivered for recycling via an external contractor comprised 57 kilotonnes, which equals 83% of total waste, an improvement compared to 80% in 2014, as our manufacturing sites continued their recycling programs.
Of the 17% remaining waste, 72% comprised non-hazardous waste and 28% hazardous waste; 8.2 kilotonnes of waste was sent to landfill.

“In 2013Emissions
Emissions of restricted substances totaled 26 kilos in 2015, mainly caused by one site in China reporting a thinner containing benzene. For the third year in a row, mercury emissions at Lighting were as low as reasonably achievable, according to our industry experienced a huge transformation as the shiftassessment. The level of emissions of hazardous substances decreased from 28,310 kilos to LED lighting gathered pace. We delivered value by improving our profitability and achieved a leading position in LED lighting solutions. Going forward, we will accelerate the drive to LED and help our customers to realize the benefits of intelligent connected lighting, serving both consumers and the growing professional market for integrated systems and services.”Eric Rondolat25,101 kilos (-11%), CEO Philips Lighting
The lighting industry is undergoing a radical transformation.
The lighting market is being driven by the transitiona reduction in xylene emissions at Consumer Lifestyle, due to LEDlower production of products where these specific lacquers and digital applications.
Our four-pillar strategy will enable us to improve performance, maximize growth and strengthen our position as a global leader in the lighting market.
5.3.1 Lighting business landscape
Wethinners are witnessing a number of trends and transitions that are affecting the lighting industry and changing the way people use and experience light.
We serve a large and attractive market that is driven by the need for more light, energy-efficient lighting, and digital lighting. Over half the world’s population currently lives in urban areas: a figure that is expected to rise to over 70% by 2050. That means 3 billion extra city
Annual Report 2013 105
5 Sector performance 5.3.1 - 5.3.2
dwellers. These people will all need light. In addition, the world needs energy-efficient light in the face of rising energy prices and climate change. At the same time, the lighting industry is moving from conventional to LED lighting, which is changing the way people use, experience and interact with light. LED technology, when combined with controls and software and linked into a network, is allowing light points to achieve a degree of intelligence. This is opening up the possibility of new functionalities and services based on the transmission and analysis of data.
The lighting market is expected to grow by 4-6% on a compound annual basis between 2013 and 2016. The majority of this growth will be driven by LED-based solutions and applications – heading towards a 45% share by 2015 – and growth geographies.
5.3.2 About Philips Lighting
Philips Lighting is a global market leader with recognized expertise in the development, manufacture and application of innovative, energy-efficient lighting products, systems and services that improve people’s lives. We have pioneered many of the key breakthroughs in lighting over the past 122 years, laying the basis for our current strength and ensuring we are well-placed to be a leader in the digital transformation.
We have a firm strategy in place to deliver even greater value for our customers. This strategy is based upon four pillars:
Lead the technological revolution – strengthen our leadership position through continued innovation in high-quality, efficient and connected LED systems.
Win in the consumer market – build on our strengths in lamps by meeting consumers’ needs and delivering innovative products, such as the Hue personal wireless lighting system that can be controlled by a smart phone or tablet. At the same time we are addressing costs so that consumers can quickly enjoy the advantages of new LED innovations in lamps, luminaires and systems. In addition, we are developing new channels to market.
Drive innovation in professional lighting systems and services – providing integrated offerings for this market, which is an early adopter of energy-efficient LED and now intelligent connected lighting technologies.
Accelerate! – strengthen our capabilities and improve the way we work so that we reduce our costs, are more productive, and fully satisfy our customers’ expectations.
We aim to further strengthen our position in the digital market through added investment in LED leadership while at the same time capitalizing on our broad portfolio, distribution and brand in conventional lighting – seizing the significant opportunity to grow market share and optimize profits in conventional lamps and drivers by flexibly anticipating the slower or faster phase-out of conventional products.
We address people’s lighting needs across a full range of market segments. Indoors, we offer lighting solutions for homes, shops, offices, schools, hotels, factories and hospitals. Outdoors, we offer solutions for roads (street lighting and car lights) and for public spaces, residential areas and sports arenas,used as well as solar-powered LED off-grid lighting. In addition, we address the desirea decrease in styrene emissions at two Lighting sites. Lighting and Consumer Lifestyle have reduction programs for light-inspired experiences through architectural projects. Finally, we offer specific applications of lighting in specialized areas, such as horticulturerestricted and water purification.hazardous substances.
Philips Lighting spans the entire lighting value chain – from light sources, luminaires, electronicsGroup
Ratios relating to carbon emissions and controls to application-specific systems and services – through the following businesses:energy use
2011 - 2015
| | | | | | | | | | | | | | | | | | | | |
| | | | |
| | | 2011 | | | 2012 | | | 2013 | | | 2014 | | | 2015 | |
| | | | |
Operational CO2 emissions in kilotonnes CO2-equivalent | | | 1,892 | | | | 1,640 | | | | 1,678 | | | | 1,521 | | | | 1,417 | |
Operational CO2 efficiency in tonnes CO2-equivalent per million EUR sales | | | 95 | | | | 74 | | | | 76 | | | | 71 | | | | 58 | |
Operational energy use in terajoules | | | 31,682 | | | | 28,886 | | | | 29,586 | | | | 27,579 | | | | 25,614 | |
Operational energy efficiency in terajoules per million EUR sales | | | 1.59 | | | | 1.30 | | | | 1.35 | | | | 1.29 | | | | 1.06 | |
| | | | |
Light Sources & Electronics: LED, eco-halogen, (compact) fluorescent, high-intensity dischargePhilips Group
Restricted and incandescent light sources, plus electronic and electromagnetic gear, modules and drivers
Consumer Luminaires: functional, decorative, lifestyle, scene-setting luminaires
Professional Lighting Solutions: controls and luminaires for city beautification, road lighting, sports lighting, office lighting, shop/hospitality lighting, industry lighting
Automotive Lighting: car headlights and signaling
The Light Sources & Electronics business conducts its sales and marketing activities through the professional, OEM and consumer channels, the latter also being used by our Consumer Luminaires business. Professional Lighting Solutions is organized hazardous substancesin a trade business (commodity products) and a project solutions business (project luminaires, systems and services). Automotive Lighting is organized in two businesses: OEM and Aftermarket.kilos
The conventional lamps industry is highly consolidated, with GE and Osram as key competitors. The LED lighting market, on the other hand, is very dynamic. We face new competition from Asia and new players from the2011 - 2015
106 Annual Report 2013
5 Sector performance 5.3.2 - 5.3.4
semiconductor and building management sectors. The luminaires industry is fragmented, with our competition varying per region and per market segment.
Under normal economic conditions, Lighting’s sales are generally not materially affected by seasonality.
Philips Lighting has manufacturing facilities in some 25 countries in all regions of the world, and sales organizations in more than 60 countries. Commercial activities in other countries are handled via distributors working with our International Sales organization. Lighting has approximately 46,900 employees worldwide.
Regulatory requirements
Lighting is subject to significant regulatory requirements in the markets where it operates. These include the European Union’s Waste from Electrical and Electronic Equipment (WEEE), Restriction of Hazardous Substances (RoHS), Registration, Evaluation, Authorization and Restriction of Chemicals (REACH), Energy-using Products (EuP) and Energy Performance of Buildings (EPBD) directives.
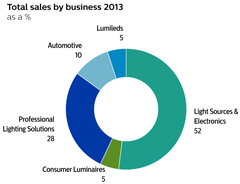
5.3.3 2013 highlights
In 2013, our lighting innovations underlined our four-pillar strategy aimed at delivering even greater value for our customers and shareholders.
Leading the technological revolution in lighting, we delivered a number of groundbreaking innovations. Lumileds set the standard in high and mid-power LEDs, improving efficacy and light quality. In our drive to continuously reduce energy consumption, Philips was the first to show a prototype TLED providing 200 lumens per watt, which is twice as efficient as current LED-based solutions. We also continued to pioneer innovations in connected lighting, in segments such as home and city lighting.
Our smart and connected CityTouch lighting system was installed in a number of cities around the world. This intelligent lighting system enables cities to control light points in a dynamic and flexible way to deliver light where and when needed, saving energy and maintenance costs.
Our innovations in architectural lighting were used to rejuvenate some of the best-known landmarks in the world, such as the Bay Bridge in San Francisco, and to create new city icons such as the fire and water-breathing Dragon Bridge in Da Nang, Vietnam. Underlining our expertise in integrated solutions, we collaborated with the Rijksmuseum, Amsterdam to develop a customized LED lighting solution for the museum’s entire exhibition area, bringing the color and detail of masterpieces such as Rembrandt’s Night Watch to life as never before.
The latest innovation in Philips Hue, our groundbreaking connected lighting system for the home, connects to internet services, making the system even more intelligent, with new functionality to enjoy. We also launched ‘Friends of Hue’ – lamp fittings and luminaires such as LivingColors Bloom and LightStrips which enable consumers to create even richer lighting experiences. Resulting from our partnership with Disney, StoryLight Mickey is another addition to the Friends of Hue portfolio. It transforms bedtime stories into a unique experience. The Philips-Disney partnership combines Philips’ innovation in lighting with the magic of Disney characters and storytelling to transform a child’s bedroom into a more imaginative place for them to read, play and fall asleep.
5.3.4 2013 financial performance
| | | | | | | | | | | | |
| Key data | | | | | | | | | |
| in millions of euros unless otherwise stated | | | | | | | | | | | | |
| | | 2011 | | | 2012 | | | 2013 | |
Sales | | | 7,638 | | | | 8,442 | | | | 8,413 | |
Sales growth | | | | | | | | | | | | |
% increase, nominal | | | 1 | | | | 11 | | | | 0 | |
% increase, comparable1) | | | 6 | | | | 4 | | | | 3 | |
Adjusted IFO1) | | | 399 | | | | 128 | | | | 695 | |
as a % of sales | | | 5.2 | | | | 1.5 | | | | 8.3 | |
IFO | | | (408 | ) | | | (66 | ) | | | 489 | |
as a % of sales | | | (5.3 | ) | | | (0.8 | ) | | | 5.8 | |
Net operating capital (NOC)1) | | | 4,965 | | | | 4,635 | | | | 4,462 | |
Cash flows before financing activities1) | | | 208 | | | | 279 | | | | 478 | |
Employees (FTEs) | | | 53,168 | | | | 50,224 | | | | 46,890 | |
| | | | | | | | | | | | | | | | | | | | |
| | | | |
| | | 2011 | | | 2012 | | | 2013 | | | 2014 | | | 2015 | |
| | | | |
Restricted substances | | | 111 | | | | 67 | 1) | | | 37 | 1) | | | 29 | 1) | | | 26 | |
Hazardous substances | | | 63,604 | | | | 67,530 | | | | 35,118 | | | | 28,310 | | | | 25,101 | |
| | | | |
| 1) | For a reconciliation to the most directly comparable GAAP measures, see chapter 14, Reconciliation of non-GAAP information, of this reportNumbers have been restated
|
For more details on restricted and hazardous substances, please refer to sub-section 14.3.3, Green Operations, of this report.
5.4 Proposed distribution to shareholders
Pursuant to article 34 of the articles of association of Royal Philips, a dividend will first be declared on preference shares out of net income. The remainder of the net income, after reservations made with the
62 Annual Report 2013 1072015
5 SectorGroup performance 5.3.4 - 5.3.45.4
In 2013, sales amountedapproval of the Supervisory Board, shall be available for distribution to holders of common shares subject to shareholder approval after year-end. As of December 31, 2015, the issued share capital consists only of common shares; no preference shares have been issued. Article 33 of the articles of association of Royal Philips gives the Board of Management the power to determine what portion of the net income shall be retained by way of reserve, subject to the approval of the Supervisory Board.
A proposal will be submitted to the upcoming Annual General Meeting of Shareholders to declare a dividend of EUR 0.80 per common share (up to EUR 8,413740 million), in cash or in shares at the option of the shareholder, against the net income for 2015 and retained earnings.
Shareholders will be given the opportunity to make their choice between cash and shares between May 18, 2016 and June 10, 2016. If no choice is made during this election period the dividend will be paid in shares. On June 10, 2016 after close of trading, the number of share dividend rights entitled to one new common share will be determined based on the volume weighted average price of all traded common shares Koninklijke Philips N.V. at Euronext Amsterdam on June 8, 9 and 10, 2016. The Company will calculate the number of share dividend rights entitled to one new common share (the ‘ratio’), such that the gross dividend in shares will be approximately equal to the gross dividend in cash. On June 14, 2016 the ratio and the number of shares to be issued will be announced. Payment of the dividend and delivery of new common shares, with settlement of fractions in cash, if required, will take place from June 15, 2016. The distribution of dividend in cash to holders of New York Registry shares will be made in USD at the USD/EUR rate fixed by the European Central Bank on June 13, 2016.
Dividend in cash is in principle subject to 15% Dutch dividend withholding tax, which will be deducted from the dividend in cash paid to the shareholders. Dividend in shares paid out of net income and retained earnings is subject to 15% dividend withholding tax, but only in respect of the par value of the shares (EUR 0.20 per share).
In 2015, a dividend of EUR 0.80 per common share was paid in cash or shares, at the option of the shareholder. For 59.2% of the shares, the shareholders elected for a share dividend resulting in the issue of 17,671,990 new common shares, leading to a 1.9% dilution. EUR 298 million was paid in line with 2012 on a nominal basis. Excluding a 3% negative currency effect, comparable sales increased by 3%. Double-digitcash. For additional information, see chapter 17, Investor Relations, of this report.
The balance sheet presented in this report, as part of the Company financial statements for the period ended December 31, 2015, is before appropriation of the result for the financial year 2015.
5.5 Outlook
For 2016, we continue to expect modest comparable sales growth was achieved by Lumileds and Automotive. Light Sources & Electronics recorded low-single-digit growth, while comparablewe will build on our 2015 operational performance improvement. Taking into account ongoing macro-economic headwinds and the phasing of costs and sales, at Professional Lighting Solutions were in line with 2012. Consumer Luminaires showed a low-single-digit decline.
The year-on-year comparable sales increase was substantially driven by growth geographies, which grew 12% on a comparable basis. As a proportion of total sales, sales in growth geographies increased to 43% of total Lighting sales, driven by double-digit growth in China and Indonesia, compared to 41% in 2012. In mature geographies, sales showed a low-single-digit decline, largely due to lower demand in North America and Western Europe, particularly at Professional Lighting Solutions and Consumer Luminaires.
Sales of LED-based products grew to 29% of total sales, up from 22% in 2012, driven by Light Sources & Electronics and Professional Lighting Solutions. Sales of energy-efficient Green Products exceeded EUR 5,855 million, or 70% of sector sales.
Adjusted IFO amounted to EUR 695 million, or 8.3% of sales, compared to EUR 128 million, or 1.5% of sales, in 2012. Restructuring and acquisition-related charges amounted to EUR 100 million in 2013, compared to EUR 315 million in 2012. The increase in Adjusted IFO was mainly attributable to higher operational earnings, as well as lower restructuring and acquisition-related charges. Additionally, 2012 included losses on the sale of industrial assets amounting to EUR 81 million.
IFO amounted to EUR 489 million, or 5.8% of sales, which included EUR 180 million of amortization charges, mainly related to intangible assets at Professional Lighting Solutions, and an impairment of EUR 32 million related to customer relationships at Consumer Luminaires. Additionally, a goodwill impairment charge of EUR 26 million was takenwe expect improvements in the fourth quarter of 2013 due to reduced growth expectations.
Net operating capital decreased by EUR 173 million to EUR 4.5 billion, primarily due to currency effects, partly offset by a reduction in restructuring provisions.
Cash flows before financing activities increased from EUR 279 million in 2012 to EUR 478 million, mainly due to higher cash earnings and lower net capital expenditures, partly offset by higher outflows for working capital.
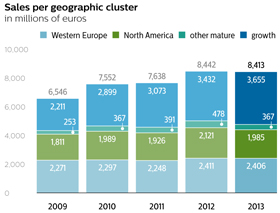
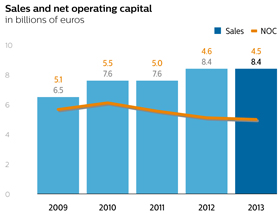
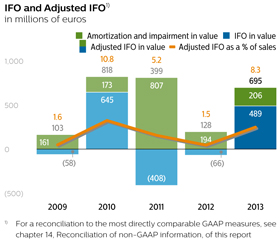
2012 financial performance
Sales amounted to EUR 8,442 million, a nominal increase of 11% compared to 2011, mainly driven by growth at Light Sources & Electronics and Professional
108 Annual Report 2013
5 Sector performance 5.3.5 - 5.3.6
Lighting Solutions, partly offset by a sales decline at Lumileds. Excluding a 5% favorable currency impact and a 2% positive effect from portfolio changes, comparable sales increased by 4%.
The year-on-year sales increase was substantially driven by growth geographies, which grew 7% on a comparable basis. Sales in growth geographies increased to 41% of total Lighting sales, driven by double-digit growth in China and India, compared to 40% in 2011. In mature geographies, sales growth was limited to low single digits due to lower demand in North America and Western Europe, particularly at Professional Lighting Solutions and Consumer Luminaires.
Sales of LED-based products grew to over 22% of total sales, up from 16% in 2011, driven by Light Sources & Electronics and Professional Lighting Solutions. Sales of energy-efficient Green Products exceeded EUR 5,752 million, or 68% of sector sales.
Adjusted IFO amounted to EUR 128 million, or 1.5% of sales, compared to EUR 399 million, or 5.2 of sales, in 2011. Restructuring and acquisition-related charges amounted to EUR 315 million in 2012, compared to EUR 66 million in 2011. The decrease in Adjusted IFO was mainly attributable to higher restructuring and acquisition-related charges, as well as losses on the sale of industrial assets amounting to EUR 81 million, partly offset by higher sales.
IFO amounted to a loss of EUR 66 million, or negative 0.8% of sales, which included EUR 194 million of amortization charges, mainly related to intangible assets at Professional Lighting Solutions.
Net operating capital decreased by EUR 330 million to EUR 4.6 billion, primarily due to an increase in provisions related to restructuring, lower inventories and currency effects, partly offset by the consolidation of Indal.
Cash flows before financing activities increased from EUR 208 million in 2011 to EUR 279 million, mainly due to lower working capital outflows, partly offset by higher outflows for acquisitions.
5.3.5 Delivering on EcoVision sustainability commitments
In 2013, Philips Lighting invested EUR 327 million in Green Innovation, compared to EUR 325 million in 2012. Investments continueyear to be made in energy-saving technologies such as LED, OLED and lighting controls and in the reduction of regulated substances in our product portfolio. In April, Philips announced that it had created the first LED lamp prototype delivering 200 lumens per watt of high-quality light, halving energy use compared to current LED lamps. The energy efficiency of our total product portfolio improved from 37.9 to 38.5 lumens per watt in 2013. Within the Green Operations 2015 program, we are on track to meet our commitments to reduce Lighting’s environmental footprint. By using energy from renewable sources and implementing energy-saving programs in our major operational sites, we have reduced our carbon footprint from energy by approximately 15% since the baseline year of 2009. In 2013, 83% of our total waste was re-used as a result of recycling.
5.3.6 Delivering innovation that matters to youback-end loaded.
Annual Report 2013 1092015 63

Meet a London couple who use Philips Hue lighting to create a happy and inspiring environment for their daughter, Elena.
“Being a parent is not easy, I think anyone can understand that. And I think it’s about trying to find the small things that just help you through the day a bit better.”


“We also find during play especially, it’s a great way to interact with her. Painting itself is great fun, but when you can kind of paint the colors with the light bulb, that’s even better. Or dancing is great fun, but when you can dance and the lights change, it just brings a whole new element to the experience. It makes for a much more engaging and fun day for us and for her.”
110 Annual Report 2013
5 SectorGroup performance 5.4 - 5.4.15.6
5.4 Innovation, Group & Services5.6 Critical accounting policies
Critical accounting policies
The preparation of Philips’ financial statements requires us to make estimates and judgments that affect the reported amounts of assets and liabilities at the date of our financial statements. The policies that management considers both to be most important to the presentation of Philips’ financial condition and results of operations and to make the most significant demands on management’s judgments and estimates about matters that are inherently uncertain, are discussed below. Management cautions that future events often vary from forecasts and that estimates routinely require adjustment. A more detailed description of Philips’ accounting policies appears in the note 1, Significant accounting policies section.
Accounting for income taxes
As part of the process of preparing consolidated financial statements, the Company is required to estimate income taxes in each of the jurisdictions in which it conducts business. This process involves estimating actual current tax expense and temporary differences between tax and financial reporting. Temporary differences result in deferred tax assets and liabilities, which are included in the consolidated balance sheet. The Company regularly reviews the deferred tax assets for recoverability and will only recognize these if it is believed that sufficient future taxable profit is available, including income from forecasted operating earnings, the reversal of existing taxable temporary differences and established tax planning relating to the same taxation authority and the same taxable entity. For a discussion of the fiscal uncertainties, please refer to the information under the heading “Tax risks” in note 8, Income taxes.
Multi-element sales transactions
From time to time the Company is engaged in complex sales transactions relating to multi-element deliveries (for example a single sales transaction that combines the delivery of goods and rendering of services). The process of revenue recognition of such multi-element sales transactions involves the identification of the different sales components, the allocation of revenue to these different components and the timing of revenue recognition per component. Each of these process steps can be complex and requires judgment. In order to identify different components in a single sales contract, the Company verifies if a component has a stand-alone value to the customer and whether the fair value of the component can be measured reliably. Allocation of revenue to the different components is performed based on either a relative fair value approach or by means of a residual or fair value method, depending on which method is deemed most appropriate to the transaction. Eventually, revenue for each component is recognized when meeting the revenue recognition criteria in accordance with IAS 18 or IAS 11.
Provisions and Contingent liabilities
The Company and certain of its group companies and former group companies are involved as a party in legal proceedings, including regulatory and other governmental proceedings, and discussions on potential remedial actions, relating to such matters as antitrust laws, competition issues, commercial transactions, product liabilities, participations and environmental pollution. Since the ultimate disposition of asserted claims and proceedings and investigations cannot be predicted with certainty, an adverse outcome could have a material adverse effect on the Company’s Consolidated financial statements.
The Company recognizes a liability when it is probable that an outflow of resources embodying economic benefits will result from the settlement of a present obligation and the amount at which the outflow will take place can be measured reliably. If the likelihood of the outcome is less than probable and more than remote or a reliable estimate is not determinable, the matter is disclosed as a contingent liability if management concludes that it is material.
In determining the provision for losses associated with environmental remediation obligations, significant judgments are necessary. The Company utilizes experts in the estimation process. The Company accrues for losses associated with environmental obligations when such losses are probable and can be estimated reliably. The provisions are adjusted as new information becomes available and they are remeasured at the end of each period using the current discount rate.
Provisions on restructuring represents estimated costs of initiated reorganizations, the most significant of which have been approved by the Board of Management. A liability is recognized for those costs only when the Company has a detailed formal plan for the restructuring and has raised a valid expectation with those affected that it will carry out the restructuring by starting to implement that plan or announcing its main features to those affected by it.
The Company provides for warranty costs based on historical trends in product return rates and the expected material and labor costs to provide warranty services. The provision is based on historical warranty data and a weighing of possible outcomes against their associated probabilities.
Impairment of non-financial assets
Goodwill is not amortized, but tested for impairment annually and whenever impairment indicators require so. The Company reviews non-financial assets, other than goodwill for impairment, when events or circumstances indicate that carrying amounts may not be recoverable.
In determining impairments of non-current assets like intangible assets, property, plant and equipment, investments in associates and goodwill, management

“In 2013, we continued
Group performance 5.6
must make significant judgments and estimates to better align our innovation strategies with our business strategies. We are making real progress improving our ability to innovate end-to-end, alldetermine whether the way from gaining a deep understanding of local customer needs to actual impactrecoverable amount is lower than the carrying value. Changes in assumptions and estimates included within the impairment reviews and tests could result in significantly different results than those recorded in the marketplace. Our innovation processconsolidated financial statements.
Goodwill is becoming more effective, efficientallocated to the cash generating units. The basis of the recoverable amount used in the annual impairment test (performed in Q2) and faster, allowing ustrigger-based impairment tests is generally the value in use. Key assumptions used in the impairment tests were sales growth rates, income from operations and the rates used for discounting the projected cash flows. These cash flow projections were determined using management’s internal forecasts that cover an initial period from 2015 to better deliver solutions2019 that really mattermatches the period used for our strategic review. Projections were extrapolated with stable or declining growth rates for a period of five years, after which a terminal value was calculated. For terminal value calculation, growth rates were capped at a historical long term average growth rate.
The sales growth rates and margins used to people.”Jim Andrew, Chief Innovation & Strategy Officerestimate cash flows are based on past performance, external market growth assumptions and industry long-term growth averages. Income from operations in all units is expected to increase over the projection period as a result of volume growth and cost efficiencies. Please refer to note 11, Goodwill.
Discontinued operations and non-current assets held for sale
IntroductionNon-current assets (disposal groups comprising assets and liabilities), that are expected to be recovered primarily through sale rather than through continuing use, are classified as held for sale. A discontinued operation is a component of an entity that either has been disposed of, or that is classified as held for sale, and (a) represents a separate major line of business or geographical area of operations; and (b) is a part of a single coordinated plan to dispose of a separate major line of business or geographical area of operations; or (c) is a subsidiary acquired exclusively with a view to sell. Non-current assets held for sale and discontinued operations are carried at the lower of carrying amount or fair value less costs to sell.
Innovation, Group & Services comprisesDetermining whether a non-current asset will be primarily recovered through sale rather than through continuing use requires judgment. The Company assesses whether such asset is available for immediate sale in its present condition subject only to terms that are usual and customary for sales of such assets or disposal groups, and its sale is assessed to be highly probably. Furthermore, in order to determine if that component qualifies as a discontinued operations, judgment is required when the activitiesCompany assesses whether a component of Group Innovation, Group headquarters, including countryan entity represents a major line of business or geographical area compared to the whole of the Company and regional management, and certain costswhether the sale is a part of pension and other post-retirement benefit plans. Additionally, the global shared business services for procurement, finance, human resources, IT and real estate are reported in this sector.a single coordinated plan.
5.4.1 About Innovation, Group & Services
Philips Group Innovation
Philips Group Innovation invested EUR 21 million in Green Innovations, spread over projects focused on global challenges related to water, air, energy, food, Circular Economy, and access to affordable healthcare. The Research organization within Group Innovation used the Sustainable Innovations Assessment tool, in which innovation projects are evaluated and scored along the environmental and social dimensions, in order to identify those projects that most strongly drive sustainable innovation. As of 2015, transfers of innovation projects include a Lives Improved calculation to assess what the project’s contribution will be to Philips’ vision to improve the lives of 3 billion people a year by 2025.
58 Annual Report 2015
Group performance 5.3.1
Philips Green Patent portfolio
At the end of 2015, Philips’ IP portfolio consisted of 6.7% green patent families. All families are labeled with at least one Green Focal Area. In 2015, 6% of our total new patent filings were flagged as green patent family. Energy efficiency is still the most frequently occurring Green Focal Area throughout the portfolio. As IP is an extension of Philips’ innovation efforts, the portfolio percentage related to green patents is multiplied by our annual patent portfolio costs to determine Philips’ yearly investment in Green IP.
While a product can be classified as green by incorporating an environmentally friendly technology, such technology cannot always be protected in a patent because of a lack of patentability over the state-of-the-art technology. Therefore, there is not necessarily a correlation between green patents and Green Technologies in Green Products.
Energy efficiency of products
Energy efficiency is a key Green Focal Area for our Green Products. According to our analysis, about 97% of the energy consumed during the use phase of our products is attributable to Lighting products. The remaining 3% is split over Consumer Lifestyle and Healthcare. Therefore, we focus on the energy efficiency of our Lighting products in the calculation. The annual energy consumption per product category is calculated by multiplying the power consumption of a product by the average annual operating hours and the annual pieces sold and then dividing the light output (lumens) by the energy consumed (watts). The average energy efficiency of our total product portfolio increased significantly in 2015 to 44.5 lumen per watt, or 10% compared to 2014. The exclusion of Lumileds and Automotive had a limited upward effect on the energy efficiency of the portfolio.
In 2015, LED sales advanced well, as demand for conventional lighting declined. Compared to 2009, the baseline year of our measurement, the average energy efficiency of our portfolio increased by 33%. We expect the energy efficiency to improve further in the coming years as the traditional incandescent lamp is banned in more countries. Our target for 2015 was a 50% improvement compared to the 2009 baseline. In this target setting, assumptions were made about the speed of the regulatory developments in this area, which fell short of expectations.
Further details on this parameter and the methodology can be found here:
Improving energy efficiency of Philips products.
Circular Economy
The transition from a linear to a circular economy is essential to create a sustainable world. A circular economy aims to decouple economic growth from the use of natural resources and ecosystems by using these resources more effectively. It is a driver of innovation in the areas of material, component and product re-use, as well as new business models such as system solutions and services. In a circular economy, more effective (re)use of materials enables the creation of more value, both by means of cost savings and by developing new markets or growing existing ones.
For more information on our Circular Economy activities, please refer to sub-section 14.3.1, EcoVision, of this report.
Closing the materials loop
The amount of collection and recycling for 2014 (reported in 2015) was calculated at 28,500 tonnes, a 10% decrease compared to 31,500 tonnes reported in 2014, driven by lower weight of products and components in all sectors. Our target was to double global collection and recycling by 2015 compared to 2009, when the baseline was set around 22,500 tonnes, based on the data retrieved from the Waste Electrical and Electronic Equipment (WEEE) collection schemes and from our own recycling and refurbishment services (mainly Healthcare).
Recycled materials
We calculated the amount of recycled materials used in our products in 2015 at some 13,500 tonnes (2014: 13,000 tonnes) by focusing on the material streams plastics (Consumer Lifestyle), aluminum (Lighting), refurbished products, and spare parts harvesting (Healthcare) depending on their relevance in each sector.
Our target was to double the amount of recycled materials in our products by 2015 compared to 2009, when the baseline was set at 7,500 tonnes.
Further details on this parameter and the methodology can be found here:Closing the materials loop.
5.3.2 Green Product sales
Green Products offer a significant environmental improvement in one or more Green Focal Areas: Energy efficiency, Packaging, Hazardous substances, Weight, Recycling and disposal, and Lifetime reliability. Sales from Green Products, excluding the Lumileds and
Annual Report 2015 59
Group performance 5.3.2
Automotive business, increased to EUR 13.0 billion in 2015, or 54% of sales (52% in 2014), thereby reaching a record level for Philips.
The exclusion of Lumileds and Automotive had a 1% negative impact on the total Green Product sales percentage.
We aim to create products that have significantly less impact on the environment during their whole lifecycle through our EcoDesign process. Overall, the most significant improvements have been realized in our energy efficiency Green Focal Area, an important objective of our EcoVision program, although there was also growing attention for hazardous substances and recyclability in all sectors in 2015, the latter driven by our Circular Economy initiatives.
New Green Products from each sector include the following examples.
Healthcare
In 2015, Healthcare expanded the Green Product portfolio with 11 new products and redesigned various current Green Products with environmental improvements. These products improve patient outcomes, provide better value, and help secure access to high-quality care, while reducing environmental impact. Examples include a new packaging system for our PCMS medical supplies business, which has enabled a 90% reduction in air space in packaging and a 24% reduction in packaging material weight to support our customers in reducing their waste streams. Another example is our Home Monitoring business which operates by a performance-based service business model that enables 76% re-use of products and parts while maintaining the embedded labor and energy. The Efficia is a new Green Product in our value range of patient monitoring, which is an example of how we aim to support expanded access to care in under-resourced regions while lowering environmental impact as well. We started to add an energy-efficient CryoCompressor to our MRI systems, with energy savings in the various non-scanning modes of 30-40%. Both material (30%) and energy (20%) savings are achieved in our new Access CT system, a compact-designed CT for the value segment market. Sleep and Respiratory Care (SRC) launched the V680 ventilator which includes, besides better performance in uninterrupted invasive or noninvasive ventilation, a product and packaging material weight reduction of 60% and 75% respectively and a reduction in energy usage of 80%. Other new Green Products came from SRC (lightweight masks and sleep therapy devices), MCS group (lightweight battery chargers) and X-Ray systems for the Brazilian market without lead counter ballasts.
Consumer Lifestyle
Consumer Lifestyle focuses on Green Products which meet or exceed our minimum requirements in the areas of energy consumption, packaging, and substances of concern. The sales of Green Products in 2015 surpassed 58% of total sales. All our Green Products with rechargeable batteries (like toothbrushes, shavers, and grooming products) exceed the stringent California energy efficiency norm by at least 10%. We are making steady progress in developing PVC/BFR-free products. More than 65% of sales consist of PVC/BFR-free products, with the exception of the power cords, for which there are not yet economical viable alternatives available. In the remaining 35% of product sales, PVC/BFR has already been phased out to a significant extent, but the products are not yet completely free of these substances.
In 2015, more kitchen appliances, vacuum cleaners, coffee machines and irons were launched with parts made of recycled plastics. In total we have applied some 900 tons of recycled plastics in our products. An example is the new Perfect Care Eco Aqua Steam Generator, with more than 50% recycled plastics.
Lighting
Green Product sales within Philips Lighting increased to 72% in 2015. Connected lighting systems contributed to Green Product sales with solutions in more applications and market segments. In August 2015 the new installation of the connected Philips LED lighting system in the Allianz Arena made it Germany’s first and Europe’s largest stadium to feature a dynamic and colorful light display on its entire façade. This new energy-efficient lighting system also saves approximately 60% on electricity and 362 tons of CO2 per year. The maintenance and operating costs are also lower due to the cloud-based Philips ActiveSite platform. The LEDs have an average lifetime of 80,000 operating hours and the system is extremely robust, even under extreme weather conditions.
5.3.3 Green Operations
The Green Operations program focuses on the main contributors to climate change, recycling of waste, reduction of water consumption, and reduction of emissions of restricted and hazardous substances. Full details can be found in chapter 14, Sustainability statements, of this report.
60 Annual Report 2015
Group performance 5.3.3
Carbon footprint and energy efficiency
After achieving our EcoVision4 carbon emissions reduction target in 2012, we continued our energy efficiency improvement programs across different disciplines. This year we have achieved our 2015 emission reduction target that was set at a 40% decrease in CO2 reductions compared to our 2007 base year. Our carbon footprint decreased by 7% compared to 2014, resulting in a total of 1,417 kilotonnes CO2, a 41% decrease compared to 2007. This was mainly achieved by emissions reductions of 17% compared to 2014 in our manufacturing facilities, resulting from operational changes and decreased energy usage due to lower load at energy intensive Lighting factories. Additionally the energy intensity for our non-industrial operations decreased resulting in emission reductions of 16%. Business travel emissions showed a slight reduction of 1% compared to 2014. In order to further decrease our business travel emissions we will continue to promote video conferencing as an alternative to travel in 2016. These reductions were, however, offset by a 23% increase in emissions from air transport over the course of 2015, mainly at Healthcare to meet demand.
Our operational energy efficiency improved by 18%, from 1.29 terajoules per million euro sales in 2014 to 1.06 terajoules per million euro sales in 2015 as a result of energy efficiency programs in our industrial sites.
During 2015, the applied emission factors used to calculate our operational carbon footprint have been updated from the previously used DEFRA (UK Department for Environment, Food & Rural Affairs) 2007 and bespoke emission factors to the applicable DEFRA 2015 emission factors for each year respectively. This update affected all historical data and resulted in an overall average increase of our carbon emissions by 11% for all years. We implemented these new emission factors to ensure improved carbon disclosure. The emission factor update did not affect our performance against the base year.
From this year onward our scope 2 emissions reporting will include both the market based method as well as the location based method. Both methods are adopted according to the new Corporate Standard of the Greenhouse Gas (GHG) Protocol as further described in chapter 14, Sustainability statements, of this report. The market based method will serve as reference for calculating our total operational carbon footprint. As explained in chapter 14, the market based method includes reduction of our emissions resulting from purchasing renewable energy. In 2015, we procured 54% of our electricity from renewable sources. Approximately 60% of our renewable energy is standardly contracted via our energy providers. The remaining 40% was mainly sourced in the United States through procurement of renewable energy certificates.
The impact of the exclusion of Lumileds and Automotive is displayed as discontinued operations in the next graph; the size of which varies over the years, but averages around 10% over the past 5 years. Emissions from discontinued operations in our industrial activities have been identified exactly. Emissions from our non-industrial facilities and business travel have been estimated based on FTE data. For our logistics emissions the part of discontinued operations has been estimated using revenue share as a proxy where applicable.
Philips Group
Operational carbon footprint by Greenhouse Gas Protocol scopesin kilotonnes CO2-equivalent
2011 - 2015
| | | | | | | | | | | | | | | | | | | | |
| | | | |
| | | 2011 | | | 2012 | | | 2013 | | | 2014 | | | 2015 | |
| | | | |
Scope 1 | | | 381 | | | | 355 | | | | 361 | | | | 320 | | | | 261 | |
Scope 2 (market based) | | | 365 | | | | 335 | | | | 313 | | | | 277 | | | | 236 | |
Scope 3 | | | 1,146 | | | | 950 | | | | 1,004 | | | | 924 | | | | 920 | |
| | | | |
Philips Group | | | 1,892 | | | | 1,640 | | | | 1,678 | | | | 1,521 | | | | 1,417 | |
Scope 2 (location based) | | | 579 | | | | 584 | | | | 583 | | | | 546 | | | | 496 | |
| | | | |
Water
Total water intake in 2015 was 2.7 million m3, about 12% lower than in 2014. This decrease was mainly due to lower production volumes at multiple Lighting sites where water is used for cooling purposes, operational changes and water-saving actions at various sites.
Lighting represents around 64% of total water usage. In this sector, water is used in manufacturing as well as for domestic purposes. The other sectors use water mainly for domestic purposes. The exclusion of Lumileds and
Annual Report 2015 61
Group performance 5.3.3
Automotive has a significant downward impact on the water consumption of Philips. In 2015, Lumileds and Automotive accounted for 1.7 million m3 of water.
Philips Group
Water intakein thousands of m3
2011 - 2015
| | | | | | | | | | | | | | | | | | | | |
| | | | |
| | | 2011 | | | 2012 | | | 2013 | | | 2014 | | | 2015 | |
| | | | |
Healthcare | | | 308 | | | | 421 | | | | 454 | | | | 514 | | | | 439 | |
Consumer Lifestyle | | | 338 | | | | 303 | | | | 586 | | | | 537 | | | | 537 | |
Lighting | | | 2,249 | | | | 2,413 | | | | 2,249 | | | | 2,052 | | | | 1,751 | |
Innovation, Group & Services | | | — | | | | — | | | | — | | | | — | | | | — | |
| | | | |
Continuing operations | | | 2,895 | | | | 3,137 | | | | 3,289 | | | | 3,103 | | | | 2,727 | |
Discontinued operations | | | 1,433 | | | | 1,720 | | | | 1,755 | | | | 1,700 | | | | 1,684 | |
| | | | |
Philips Group | | | 4,328 | | | | 4,857 | | | | 5,044 | | | | 4,803 | | | | 4,411 | |
| | | | |
In 2015, 72% of water was purchased and 28% was extracted from groundwater wells.
Waste
In 2015, total waste decreased by some 9% compared to 2014 to 68.5 kilotonnes, mainly due to operational changes, lower production volumes and less packing waste at Lighting sites. Lighting contributed 66% of total waste, Consumer Lifestyle 17% and Healthcare 17%. The exclusion of Lumileds and Automotive had a 9% downward impact on total waste.
Philips Group
Total wastein kilotonnes
2011 - 2015
| | | | | | | | | | | | | | | | | | | | |
| | | | |
| | | 2011 | | | 2012 | | | 2013 | | | 2014 | | | 2015 | |
| | | | |
Healthcare | | | 9.3 | | | | 10.4 | | | | 9.6 | | | | 9.8 | | | | 11.6 | |
Consumer Lifestyle | | | 19.6 | | | | 12.7 | | | | 11.4 | | | | 11.3 | | | | 11.6 | |
Lighting | | | 58.1 | | | | 57.5 | | | | 54.9 | | | | 53.9 | | | | 45.3 | |
Innovation, Group & Services | | | — | | | | — | | | | — | | | | — | | | | — | |
| | | | |
Continuing operations | | | 87.0 | | | | 80.6 | | | | 75.9 | | | | 75.0 | | | | 68.5 | |
Discontinued operations | | | 7.0 | | | | 7.0 | | | | 16.1 | | | | 5.4 | | | | 6.4 | |
| | | | |
Philips Group | | | 94.0 | | | | 87.6 | | | | 92.0 | | | | 80.4 | | | | 74.9 | |
| | | | |
Total waste consists of waste that is delivered for landfill, incineration or recycling. Materials delivered for recycling via an external contractor comprised 57 kilotonnes, which equals 83% of total waste, an improvement compared to 80% in 2014, as our manufacturing sites continued their recycling programs.
Of the 17% remaining waste, 72% comprised non-hazardous waste and 28% hazardous waste; 8.2 kilotonnes of waste was sent to landfill.
Emissions
Emissions of restricted substances totaled 26 kilos in 2015, mainly caused by one site in China reporting a thinner containing benzene. For the third year in a row, mercury emissions at Lighting were as low as reasonably achievable, according to our assessment. The level of emissions of hazardous substances decreased from 28,310 kilos to 25,101 kilos (-11%), driven by a reduction in xylene emissions at Consumer Lifestyle, due to lower production of products where these specific lacquers and thinners are used as well as a decrease in styrene emissions at two Lighting sites. Lighting and Consumer Lifestyle have reduction programs for restricted and hazardous substances.
Philips Group
Ratios relating to carbon emissions and energy use
2011 - 2015
| | | | | | | | | | | | | | | | | | | | |
| | | | |
| | | 2011 | | | 2012 | | | 2013 | | | 2014 | | | 2015 | |
| | | | |
Operational CO2 emissions in kilotonnes CO2-equivalent | | | 1,892 | | | | 1,640 | | | | 1,678 | | | | 1,521 | | | | 1,417 | |
Operational CO2 efficiency in tonnes CO2-equivalent per million EUR sales | | | 95 | | | | 74 | | | | 76 | | | | 71 | | | | 58 | |
Operational energy use in terajoules | | | 31,682 | | | | 28,886 | | | | 29,586 | | | | 27,579 | | | | 25,614 | |
Operational energy efficiency in terajoules per million EUR sales | | | 1.59 | | | | 1.30 | | | | 1.35 | | | | 1.29 | | | | 1.06 | |
| | | | |
Philips Group
Restricted and hazardous substancesin kilos
2011 - 2015
| | | | | | | | | | | | | | | | | | | | |
| | | | |
| | | 2011 | | | 2012 | | | 2013 | | | 2014 | | | 2015 | |
| | | | |
Restricted substances | | | 111 | | | | 67 | 1) | | | 37 | 1) | | | 29 | 1) | | | 26 | |
Hazardous substances | | | 63,604 | | | | 67,530 | | | | 35,118 | | | | 28,310 | | | | 25,101 | |
| | | | |
| 1) | Numbers have been restated |
For more details on restricted and hazardous substances, please refer to sub-section 14.3.3, Green Operations, of this report.
5.4 Proposed distribution to shareholders
Pursuant to article 34 of the articles of association of Royal Philips, a dividend will first be declared on preference shares out of net income. The remainder of the net income, after reservations made with the
62 Annual Report 2015
Group performance 5.4
approval of the Supervisory Board, shall be available for distribution to holders of common shares subject to shareholder approval after year-end. As of December 31, 2015, the issued share capital consists only of common shares; no preference shares have been issued. Article 33 of the articles of association of Royal Philips gives the Board of Management the power to determine what portion of the net income shall be retained by way of reserve, subject to the approval of the Supervisory Board.
A proposal will be submitted to the upcoming Annual General Meeting of Shareholders to declare a dividend of EUR 0.80 per common share (up to EUR 740 million), in cash or in shares at the option of the shareholder, against the net income for 2015 and retained earnings.
Shareholders will be given the opportunity to make their choice between cash and shares between May 18, 2016 and June 10, 2016. If no choice is made during this election period the dividend will be paid in shares. On June 10, 2016 after close of trading, the number of share dividend rights entitled to one new common share will be determined based on the volume weighted average price of all traded common shares Koninklijke Philips N.V. at Euronext Amsterdam on June 8, 9 and 10, 2016. The Company will calculate the number of share dividend rights entitled to one new common share (the ‘ratio’), such that the gross dividend in shares will be approximately equal to the gross dividend in cash. On June 14, 2016 the ratio and the number of shares to be issued will be announced. Payment of the dividend and delivery of new common shares, with settlement of fractions in cash, if required, will take place from June 15, 2016. The distribution of dividend in cash to holders of New York Registry shares will be made in USD at the USD/EUR rate fixed by the European Central Bank on June 13, 2016.
Dividend in cash is in principle subject to 15% Dutch dividend withholding tax, which will be deducted from the dividend in cash paid to the shareholders. Dividend in shares paid out of net income and retained earnings is subject to 15% dividend withholding tax, but only in respect of the par value of the shares (EUR 0.20 per share).
In 2015, a dividend of EUR 0.80 per common share was paid in cash or shares, at the option of the shareholder. For 59.2% of the shares, the shareholders elected for a share dividend resulting in the issue of 17,671,990 new common shares, leading to a 1.9% dilution. EUR 298 million was paid in cash. For additional information, see chapter 17, Investor Relations, of this report.
The balance sheet presented in this report, as part of the Company financial statements for the period ended December 31, 2015, is before appropriation of the result for the financial year 2015.
5.5 Outlook
For 2016, we continue to expect modest comparable sales growth and we will build on our 2015 operational performance improvement. Taking into account ongoing macro-economic headwinds and the phasing of costs and sales, we expect improvements in the year to be back-end loaded.
Annual Report 2015 63
Group performance 5.6
5.6 Critical accounting policies
Critical accounting policies
The preparation of Philips’ financial statements requires us to make estimates and judgments that affect the reported amounts of assets and liabilities at the date of our financial statements. The policies that management considers both to be most important to the presentation of Philips’ financial condition and results of operations and to make the most significant demands on management’s judgments and estimates about matters that are inherently uncertain, are discussed below. Management cautions that future events often vary from forecasts and that estimates routinely require adjustment. A more detailed description of Philips’ accounting policies appears in the note 1, Significant accounting policies section.
Accounting for income taxes
As part of the process of preparing consolidated financial statements, the Company is required to estimate income taxes in each of the jurisdictions in which it conducts business. This process involves estimating actual current tax expense and temporary differences between tax and financial reporting. Temporary differences result in deferred tax assets and liabilities, which are included in the consolidated balance sheet. The Company regularly reviews the deferred tax assets for recoverability and will only recognize these if it is believed that sufficient future taxable profit is available, including income from forecasted operating earnings, the reversal of existing taxable temporary differences and established tax planning relating to the same taxation authority and the same taxable entity. For a discussion of the fiscal uncertainties, please refer to the information under the heading “Tax risks” in note 8, Income taxes.
Multi-element sales transactions
From time to time the Company is engaged in complex sales transactions relating to multi-element deliveries (for example a single sales transaction that combines the delivery of goods and rendering of services). The process of revenue recognition of such multi-element sales transactions involves the identification of the different sales components, the allocation of revenue to these different components and the timing of revenue recognition per component. Each of these process steps can be complex and requires judgment. In order to identify different components in a single sales contract, the Company verifies if a component has a stand-alone value to the customer and whether the fair value of the component can be measured reliably. Allocation of revenue to the different components is performed based on either a relative fair value approach or by means of a residual or fair value method, depending on which method is deemed most appropriate to the transaction. Eventually, revenue for each component is recognized when meeting the revenue recognition criteria in accordance with IAS 18 or IAS 11.
Provisions and Contingent liabilities
The Company and certain of its group companies and former group companies are involved as a party in legal proceedings, including regulatory and other governmental proceedings, and discussions on potential remedial actions, relating to such matters as antitrust laws, competition issues, commercial transactions, product liabilities, participations and environmental pollution. Since the ultimate disposition of asserted claims and proceedings and investigations cannot be predicted with certainty, an adverse outcome could have a material adverse effect on the Company’s Consolidated financial statements.
The Company recognizes a liability when it is probable that an outflow of resources embodying economic benefits will result from the settlement of a present obligation and the amount at which the outflow will take place can be measured reliably. If the likelihood of the outcome is less than probable and more than remote or a reliable estimate is not determinable, the matter is disclosed as a contingent liability if management concludes that it is material.
In determining the provision for losses associated with environmental remediation obligations, significant judgments are necessary. The Company utilizes experts in the estimation process. The Company accrues for losses associated with environmental obligations when such losses are probable and can be estimated reliably. The provisions are adjusted as new information becomes available and they are remeasured at the end of each period using the current discount rate.
Provisions on restructuring represents estimated costs of initiated reorganizations, the most significant of which have been approved by the Board of Management. A liability is recognized for those costs only when the Company has a detailed formal plan for the restructuring and has raised a valid expectation with those affected that it will carry out the restructuring by starting to implement that plan or announcing its main features to those affected by it.
The Company provides for warranty costs based on historical trends in product return rates and the expected material and labor costs to provide warranty services. The provision is based on historical warranty data and a weighing of possible outcomes against their associated probabilities.
Impairment of non-financial assets
Goodwill is not amortized, but tested for impairment annually and whenever impairment indicators require so. The Company reviews non-financial assets, other than goodwill for impairment, when events or circumstances indicate that carrying amounts may not be recoverable.
In determining impairments of non-current assets like intangible assets, property, plant and equipment, investments in associates and goodwill, management
64 Annual Report 2015
Group performance 5.6
must make significant judgments and estimates to determine whether the recoverable amount is lower than the carrying value. Changes in assumptions and estimates included within the impairment reviews and tests could result in significantly different results than those recorded in the consolidated financial statements.
Goodwill is allocated to the cash generating units. The basis of the recoverable amount used in the annual impairment test (performed in Q2) and trigger-based impairment tests is generally the value in use. Key assumptions used in the impairment tests were sales growth rates, income from operations and the rates used for discounting the projected cash flows. These cash flow projections were determined using management’s internal forecasts that cover an initial period from 2015 to 2019 that matches the period used for our strategic review. Projections were extrapolated with stable or declining growth rates for a period of five years, after which a terminal value was calculated. For terminal value calculation, growth rates were capped at a historical long term average growth rate.
The sales growth rates and margins used to estimate cash flows are based on past performance, external market growth assumptions and industry long-term growth averages. Income from operations in all units is expected to increase over the projection period as a result of volume growth and cost efficiencies. Please refer to note 11, Goodwill.
Discontinued operations and non-current assets held for sale
Non-current assets (disposal groups comprising assets and liabilities), that are expected to be recovered primarily through sale rather than through continuing use, are classified as held for sale. A discontinued operation is a component of an entity that either has been disposed of, or that is classified as held for sale, and (a) represents a separate major line of business or geographical area of operations; and (b) is a part of a single coordinated plan to dispose of a separate major line of business or geographical area of operations; or (c) is a subsidiary acquired exclusively with a view to sell. Non-current assets held for sale and discontinued operations are carried at the lower of carrying amount or fair value less costs to sell.
Determining whether a non-current asset will be primarily recovered through sale rather than through continuing use requires judgment. The Company assesses whether such asset is available for immediate sale in its present condition subject only to terms that are usual and customary for sales of such assets or disposal groups, and its sale is assessed to be highly probably. Furthermore, in order to determine if that component qualifies as a discontinued operations, judgment is required when the Company assesses whether a component of an entity represents a major line of business or geographical area compared to the whole of the Company and whether the sale is a part of a single coordinated plan.
New Accounting Standards
For a description of the new pronouncements, please refer to the information under the heading “IFRS accounting standard adopted as from 2015” in note 1, Significant accounting policies.
Off-balance sheet arrangements
Please refer to the information under the heading “Guarantees” in sub-section 5.1.23, Cash obligations, of this report and in note 26, Contingent assets and liabilities.
Annual Report 2015 65
Sector performance6
6 Sector performance
Our structure in 2015
Koninklijke Philips N.V. (Royal Philips or the ‘Company’) is the parent company of the Philips Group (‘Philips’ or the ‘Group’). The Company is managed by the members of the Board of Management and Executive Committee under the supervision of the Supervisory Board. The Executive Committee operates under the chairmanship of the Chief Executive Officer and shares responsibility for the deployment of Philips’ strategy and policies, and the achievement of its objectives and results.
In 2015, Philips’ activities in the field of health and well-being were organized on a sector basis, with each operating sector – Healthcare, Consumer Lifestyle and Lighting – being responsible for the management of its businesses worldwide.
The Innovation, Group & Services sector includes the activities of Group Innovation and Group and regional management organizations. Additionally, the global shared business services for procurement, finance, human resources, IT and real estate are reported in this sector, as well as certain pension costs.
At the end of 2015, Philips had 95 production sites in 25 countries, sales and service outlets in approximately 100 countries, and 112,959 employees.
2016 and beyond
In September 2014, Philips announced its plan to sharpen its strategic focus by establishing two stand-alone companies focused on the HealthTech and Lighting opportunities respectively. We have established a stand-alone structure for Philips Lighting within the Philips Group, effective February 1, 2016. We expect to be able to announce the separation of the Lighting business in the first half of 2016, subject to market conditions and other relevant circumstances. Accordingly, Innovation, Group & Services will be split and allocated to Philips and Philips Lighting.
In light of its focus on health technology, Philips has eliminated the Healthcare and Consumer Lifestyle sector layers in order to drive the convergence of consumer health and professional healthcare as well as to reduce overhead costs. We plan to change the reporting of Philips’ health technology activities to three segments (Personal Health, Diagnosis & Treatment, Connected Care & Health Informatics) with effect from Q1 2016.
Further updates will be provided in the course of 2016.
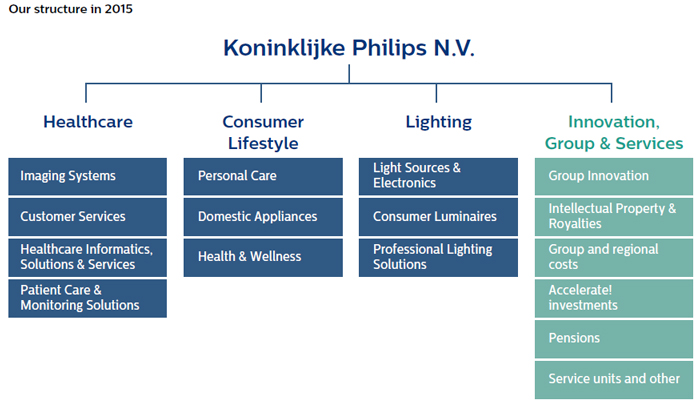
66 Annual Report 2015
Sector performance 6.1
6.1 Healthcare

“By leveraging our world-class innovation capability, deep clinical and consumer insights, long-standing customer relationships with healthcare providers, and our integrated solutions portfolio, we provide greater value while helping lower the cost of care across the health continuum.” Frans van Houten, CEO Royal Philips
We are gaining momentum in delivering large-scale end-to-end healthcare solutions globally with clients like Westchester Medical Center (USA), Mackenzie Health (Canada) and the Kenyan Ministry of Health.
Our Accelerate! program continues to drive improvements in healthcare, resulting in enhanced customer centricity and service levels, faster time-to-market for our innovations, strengthened quality and compliance systems, and better cost productivity. We increased our investments in, among others, healthcare informatics, personal health solutions and our quality systems. We also strengthened our ability to offer integrated solutions in the growing image-guided therapy market through the acquisition of Volcano.
We continue to expand the capabilities of Philips’ HealthSuite digital platform, which enables connected health propositions to improve the delivery of care at lower cost, which allow us to build recurring revenue streams.
6.1.1 Healthcare landscape
Healthcare systems around the world are under increasing economic pressure. More people are living longer, and more are living with chronic conditions –driving healthcare spending to unsustainable levels. Shortages of healthcare professionals are also adding to the relentless challenge of delivering better care at lower cost to growing patient populations.
Fundamental transformative changes are already taking place in the healthcare industry to enable the provision of affordable, quality care to those who need it. A shift is under way towards value-based healthcare, which places greater emphasis on results, driving the reduction of waste and inefficiency, increasing access and improving outcomes, while at the same time reducing costs.
Consumers are becoming increasingly engaged in managing their own health, with greater attention being focused on the benefits of healthy living and home care. Mobile and digital technologies are significant enablers of this trend, leading to new care delivery models –
Annual Report 2015 67
Sector performance 6.1.1
founded upon integrated care, real-time analytics and value-added solutions and services – that give patients greater control over and responsibility for their health.
6.1.2 About Healthcare in 2015
At Philips, we deliver innovative, integral technology solutions designed to create value by improving the quality and delivery of care while lowering cost. Our broad and deep clinical expertise and technology leadership across the health continuum and commitment to customer collaboration are core to our business and truly differentiate us.
Philips is one of the world’s leading healthcare companies (based on sales) along with General Electric and Siemens. The competitive landscape in the healthcare industry is evolving with the emergence of a considerable number of new market players. The United States, our largest market, represented 43% of Healthcare’s global sales in 2015, followed by China, Japan and Germany. Growth geographies accounted for 25% of Healthcare sales. In 2015, Philips Healthcare had approximately 40,000 employees worldwide.
In 2015, our Healthcare business (which was organized in six business groups) reported on four segments:
Imaging (comprising the business groups Diagnostic Imaging, Image-Guided Therapy, Ultrasound): Diagnostic imaging solutions, including computed tomography (CT), magnetic resonance imaging (MRI), advanced molecular imaging (AMI) and diagnostic X-ray, which includes digital X-ray and mammography; integrated clinical solutions, which include radiation oncology planning, disease specific oncology solutions and X-Ray dose management; image-guided therapy solutions including interventional X-ray systems, encompassing cardiology, radiology and surgery, and interventional imaging and therapy devices that include Intravascular Ultrasound (IVUS), Fractional Flow Reserve (FFR) and atherectomy; and ultrasound, a modality with diverse customers and broad clinical presence.
Patient Care & Monitoring Solutions: Enterprise-wide patient monitoring solutions, from value solutions to sophisticated connected solutions, for real-time clinical information at the patient’s bedside; patient analytics, patient monitoring and clinical decision support systems; therapeutic care, including cardiac resuscitation, emergency care solutions, invasive and non-invasive ventilators for acute and sub-acute hospital environments, and respiratory monitoring devices; consumables across the patient monitoring and therapeutic care businesses; and customer service, including clinical, IT, technical, and remote customer propositions.
Customer Services:Product and solution services and support, including clinical support and performance services; education and value-added services; installation; remote proactive monitoring; and customer service agreements.
Healthcare Informatics, Solutions & Services: Advanced Healthcare IT, clinical and imaging informatics for radiology and cardiology departments, Picture Archiving and Communication systems (PACS) and fully integrated Electronic Medical Record (EMR) systems; technology-enabled services including telehealth, remote patient monitoring, care coordination to make aging and chronic condition experiences better; a professional services business (Healthcare Transformation Services) spanning consulting, education, clinical and business performance improvement, program management, system integration services. All solutions and software businesses will be supported by the Philips HealthSuite digital platform to enable interoperability, Big Data analytics, optimized workflows and care pathways, rapid application development, enhanced patient centricity and engagement.
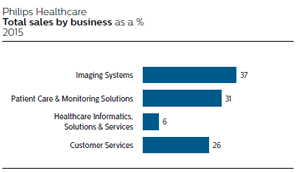
Sales at Philips’ health systems businesses are generally higher in the second half of the year, largely due to the timing of new product availability and customer spending patterns.
Commitment to quality
The implementation of the Philips Business System is embedding a fundamental commitment to quality across all our processes, products, systems and services. This commitment is of vital importance in the extensively regulated health equipment and system business. We are committed to compliance with regulatory product approval and quality system requirements in every market we serve, by addressing specific terms and conditions of local and national regulatory authorities including the US FDA, the CFDA in China and comparable agencies in other countries. Obtaining regulatory approval is costly and time-consuming, but a prerequisite for market introduction.
Further progress was made in 2015 in the remediation of the quality management systems at our Healthcare facility in Cleveland, Ohio, with the ramp-up of production and shipments continuing through the year.
68 Annual Report 2015
Sector performance 6.1.2
With regard to sourcing, please refer to sub-section 14.2.8, Supplier indicators, of this report.
Annual Report 2015 69
Sector performance 6.1.3
6.1.3 2015 business highlights
Leveraging our portfolio, insights and capabilities across the health continuum, Philips Healthcare continued to create value for healthcare providers and consumers around the world in 2015, with a strong focus on collaborative innovation, including large-scale partnerships, co-created solutions, and strategic alliances.
We strengthened our leadership position in the fast-growing image-guided therapy market by completing the acquisition of Volcano Corporation, a global leader in catheter-based imaging and measurement solutions for cardiovascular applications. Volcano’s complementary portfolio and expertise will create opportunities to accelerate revenue growth for our image-guided therapy business.
Philips and Westchester Medical Center entered into a multi-year, USD 500 million managed services partnership to transform and improve healthcare for 3 million patients. The agreement includes consulting services, medical technologies and clinical informatics solutions, and aims to improve all care areas, including radiology, cardiology, neurology, oncology and pediatrics.
We introduced our Lumify app-based ultrasound solution in the US. Combining a dedicated Philips ultrasound transducer, a compatible smart device and app, and secure cloud-enabled services, Lumify has been designed to enable faster diagnosis, improve patient satisfaction and reduce costs, while generating recurring revenues.
With more than 800,000 patient monitors installed and 275 million patients tracked every year, we are leveraging our installed base for expansion of our services and efficient roll-out of our innovations. For example, CareEvent, an enterprise event management solution, which includes a mobile application to send informative alerts directly to a caregiver’s smartphone for informed decision making and timely interventions when required.
Philips acquired Blue Jay Consulting, a leading provider of consulting services to hospital emergency departments in the US. Blue Jay’s offering complements Philips’ enterprise-wide consulting services to help improve clinical care and operational effectiveness across the health continuum.
We expanded the capabilities of our HealthSuite digital platform, a secure cloud infrastructure for health data and devices, and strengthened the associated ecosystem through our collaborations with Amazon Web Services, Radboud University Medical Center and Salesforce.
In 2015, we entered the fifth year of our Accelerate! journey, which continued to drive improvements in operational performance, as we focused on strengthening our innovation pipeline while making progress on cost savings.
6.1.4 2015 financial performance
| | | | | | | | | | | | |
| Philips Healthcare | | | | | | | | | | | | |
| Key data in millions of EUR unless otherwise stated | | | | | | | | | | | | |
| 2013 - 2015 | | | | | | | | | | | | |
| | | | |
| | | 2013 | | | 2014 | | | 2015 | |
| | | | |
Sales | | | 9,575 | | | | 9,186 | | | | 10,912 | |
Sales growth | | | | | | | | | | | | |
% increase (decrease), nominal | | | (4 | )% | | | (4 | )% | | | 19 | % |
% increase (decrease), comparable1) | | | 1 | % | | | (2 | )% | | | 4 | % |
Adjusted IFO1) | | | 1,512 | | | | 616 | | | | 1,024 | |
as a % of sales | | | 15.8 | % | | | 6.7 | % | | | 9.4 | % |
IFO | | | 1,315 | | | | 456 | | | | 819 | |
as a % of sales | | | 13.7 | % | | | 5.0 | % | | | 7.5 | % |
Net operating capital (NOC)1) | | | 7,437 | | | | 7,565 | | | | 9,212 | |
Cash flows before financing activities1) | | | 1,292 | | | | 910 | | | | 81 | |
Employees (in FTEs) | | | 37,008 | | | | 37,065 | | | | 40,099 | |
| | | | |
| 1) | For a reconciliation to the most directly comparable GAAP measures, see chapter 15, Reconciliation of non-GAAP information, of this report |
In 2015, sales amounted to EUR 10,912 million, 19% higher than in 2014 on a nominal basis. Excluding a 12% positive currency effect and a 3% positive effect from portfolio changes, mainly related to Volcano, comparable sales increased by 4%. Healthcare Informatics, Solutions & Services achieved mid-single-digit growth, Imaging Systems posted high-single-digit growth, Customer Services reported low-single-digit growth, while Patient Care & Monitoring Solutions was in line with 2014. Green Product sales amounted to EUR 4,580 million, or 42% of sector sales.
From a geographical perspective, comparable sales in growth geographies showed high-single-digit growth, and mature geographies recorded low-single-digit growth.
Adjusted IFO amounted to EUR 1,024 million, or 9.4% of sales, compared to EUR 616 million, or 6.7% of sales, in 2014. Adjusted IFO in 2015 included restructuring and acquisition-related charges of EUR 168 million, which included the Volcano acquisition, compared to EUR 70 million in 2014. 2015 Adjusted IFO also included charges of EUR 28 million related to the currency revaluation of the provision for the Masimo litigation, EUR 8 million related to the devaluation of the Argentine peso, and a EUR 31 million legal provision.
Adjusted IFO in 2014 included charges of EUR 366 million related to the provision for the Masimo litigation, charges of EUR 49 million of mainly inventory write-downs related to Cleveland and a EUR 16 million past-service pension cost gain.
IFO amounted to EUR 819 million, or 7.5% of sales, and included EUR 205 million of charges related to acquired intangible assets.
Net operating capital increased by EUR 1,647 million to EUR 9,212 million, mainly driven by the Volcano acquisition and currency impacts.
70 Annual Report 2015
Sector performance 6.1.4
Cash flows before financing activities decreased from EUR 910 million in 2014 to EUR 81 million in 2015, largely due to higher cash outflows for investments at Imaging Systems.
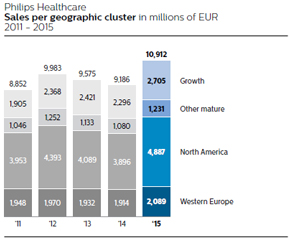
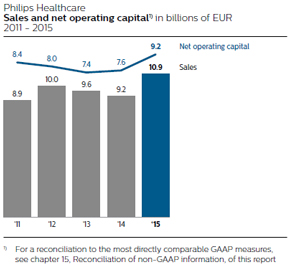
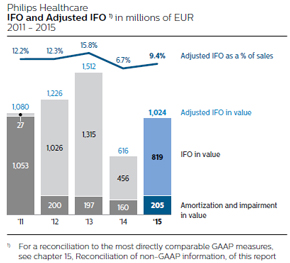
2014 financial performance
In 2014, sales amounted to EUR 9,186 million, 4% lower than in 2013 on a nominal basis. Excluding a 2% negative currency effect, comparable sales decreased by 2%. Customer Services achieved mid-single-digit growth and Patient Care & Monitoring Solutions posted low-single-digit growth, while HealthCare Informatics, Services & Solutions sales were in line with 2013. Imaging Systems recorded a double-digit decline. Green Product sales amounted to EUR 3,508 million, or 38% of sector sales.
Geographically, comparable sales in growth geographies showed a low-single-digit decline, with strong growth in Latin America and Middle East & Turkey offset by a double-digit decline in China. In mature geographies, comparable sales also showed a low-single-digit decline. The year-on-year sales decrease was largely attributable to North America and Western Europe, as sales in other mature geographies showed a low-single-digit increase, led mainly by Japan.
Adjusted IFO decreased from EUR 1,512 million, or 15.8% of sales, in 2013 to EUR 616 million, or 6.7% of sales, in 2014. Restructuring and acquisition-related charges amounted to EUR 70 million in 2014, while in 2013 they were close to zero. 2014 Adjusted IFO included charges of EUR 366 million related to the jury verdict in the Masimo litigation, EUR 49 million of mainly inventory write-downs related to the Cleveland facility, and a EUR 16 million past-service pension cost gain in the Netherlands.
In 2014, the voluntary suspension of production at our Cleveland facility and the jury verdict in the Masimo litigation strongly impacted our 2014 performance. At our Healthcare facility in Cleveland, Ohio, certain issues in the general area of manufacturing process controls were identified during an ongoing US Food and Drug Administration (FDA) inspection. To address these issues, on January 10, 2014 we started a voluntary, temporary suspension of new production at the facility, primarily to strengthen manufacturing process controls. The suspension negatively impacted Healthcare’s sales and Adjusted IFO in 2014.
On October 3, 2014 Philips announced that it would appeal the jury verdict in the patent infringement lawsuit by Masimo Corporation (Masimo), in which Masimo was awarded compensation of USD 467 million (EUR 366 million). The jury verdict is part of extensive litigation, which started in 2009, between Masimo and Philips involving several claims and counterclaims related to a large number of patents.
Adjusted IFO in 2013 also included EUR 61 million from a past-service pension gain and a EUR 21 million gain on the sale of a business excluding these items. The decrease in Adjusted IFO was mainly driven by
Annual Report 2015 71
Sector performance 6.1.5
operational losses related to the voluntary suspension of production at the Cleveland facility and negative currency impacts.
IFO amounted to EUR 456 million, or 5.0% of sales, and included EUR 159 million of charges related to intangible assets.
Net operating capital increased by EUR 128 million to EUR 7,565 million. Higher provisions and lower fixed assets were offset by currency impacts.
Cash flows before financing activities decreased from EUR 1,292 million in 2013 to EUR 910 million in 2014, largely due to lower earnings.
6.1.5 Delivering on EcoVision sustainability commitments
A growing and aging population, the rise of chronic and lifestyle-related diseases and global resource constraints pose a number of challenges, including pollution and stressed healthcare systems. Philips continues to improve lives around the globe by developing solutions that help secure access to care, while at the same time respecting the boundaries of natural resources.
In 2015, Green Product sales in Healthcare amounted to EUR 4,580 million and we introduced 11 new Green Products to support energy efficiency, materials reduction and other sustainability goals. We also actively collaborate with care providers around the globe to look for ways to minimize the environmental impact of healthcare, for example by reducing the energy use of medical equipment. Supporting the transition to a circular economy, we have continued to focus on expanding the Diamond Select refurbishment program and also the SmartPath upgrading program.
Philips was presented with the ‘Champion for Change’ Award by Practice Greenhealth for the second consecutive year. This award honors businesses that go beyond taking steps to improve their own green practices, but also help their clients and associates to expand their sustainable practices.
6.1.6 2016 and beyond
In September 2014, Philips announced its plan to sharpen its strategic focus by establishing two stand-alone companies focused on the HealthTech and Lighting opportunities respectively. Philips has transferred its Lighting business into a stand-alone structure effective February 1, 2016 and has moved from a holding company model to an operating company model.
In light of its focus on health technology, Philips has eliminated the Healthcare and Consumer Lifestyle sector layers in order to drive the convergence of consumer health and professional healthcare as well as to reduce overhead costs. We plan to change the reporting of Philips’ health technology activities to three segments (Personal Health, Diagnosis & Treatment, Connected Care & Health Informatics) with effect from Q1 2016. For more details on the new segment reporting in 2016 and onwards, please refer to the introduction of Sector performance.
Further updates will be provided in the course of 2016.
72 Annual Report 2015
Sector performance6.2
6.2 Consumer Lifestyle

“Across the world people are increasingly engaged in their personal health and are looking for solutions to stay healthy and prevent illness. We are leveraging our deep consumer expertise and extensive healthcare know-how to drive the consumerization of health. We’re supporting people to live a healthy life in a healthy home environment; enabling them to proactively manage their own health.” Pieter Nota, CEO Philips Consumer Lifestyle
We are executing our strategy, with locally relevant innovation delivering strong growth and driving profitability.
Future growth drivers are clearly set: grow the core businesses through local and global innovation platforms, and geographical expansion of proven propositions; further expand in the domain of personal health by exploring new business adjacencies and new business areas; leverage connectivity as a further growth driver.
In 2015, Consumer Lifestyle made further strong progress to reposition towards healthy living and prevention across the health continuum in more attractive markets, with better margins.
Our multi-year Accelerate! program has transformed the sector into a market-driven organization, by changing our operating model and instilling a strong performance culture and end-to-end approach.
6.2.1 Consumer landscape
Across the world, consumers are looking for solutions that help them to be healthy, live well and enjoy life. They are increasingly tracking their personal health through a combination of hardware and software devices and services, which they expect will deliver insights that are real-time, highly personal and direct them towards better health.
In a connected, digital world, consumers are looking for smart, personalized solutions. Purchase decisions are increasingly made or influenced online. In 2015, economic headwinds, especially in growth markets, created pressure on consumer spending. However, living a healthy life remained a high priority for consumers.
Annual Report 2015 73
Sector performance 6.2.2
6.2.2 About Consumer Lifestyle in 2015
Through our various businesses, we aim to make a difference to people’s lives by enabling them to make healthy choices every day based on locally relevant innovation. In recent years we have been responding to the need and desire of consumers to take charge of their personal health journey. We service our customers across the health continuum, delivering innovation in healthy living and disease prevention. In doing so, we target more attractive markets with better margins.
We are focused on value creation through category leadership and operational excellence, driving global leadership positions. We are increasing the quality and local relevance of product innovation, the speed with which we innovate, and expanding our distribution to capture increasing spending power in growth geographies.
Through 2015, Consumer Lifestyle has been built around businesses and markets, enabling us to direct investments to where the growth is, addressing locally relevant consumer needs. We create global platforms that can be adapted for local relevance.
Our end-to-end approach is accelerating specialist capability development in mature markets, to enable effective partnerships with customers and consumers, and in growth geographies, to enable development of go-to-market strategies.
In 2015, the Consumer Lifestyle sector consisted of the following areas of business:
Health & Wellness: mother and child care, oral healthcare, pain management
Personal Care: male grooming, beauty
Domestic Appliances: kitchen appliances, coffee, air purification, garment care, floor care
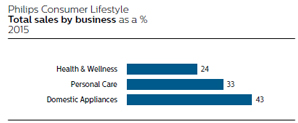
Through our personal health businesses, we offer a broad range of products from high to low price/value quartiles, necessitating a diverse distribution model. We continue to expand our portfolio and increase its accessibility, particularly in lower-tier cities in growth geographies. We are well positioned to increasingly capture growth in online sales and are building our digital and e-commerce capabilities across the company. We are adapting our web functionality to offer consumers a better user experience via smaller screens, driving improvements from conversion to sales.
We are leveraging connectivity to engage consumers in new and impactful ways through social media and digital innovation. For example, in 2015 we launched Philips Avent uGrow, a new digital parenting platform which supports the healthy development of babies, and also the latest Philips Sonicare for Kids Connected toothbrush.
Under normal economic conditions, Philips’ personal health businesses experience seasonality, with higher sales in the fourth quarter.
In 2015, Consumer Lifestyle employed approximately 16,000 people worldwide. The global sales and service organization covered more than 50 developed and growth geographies. In addition, we operated manufacturing and business creation organizations in Argentina, Austria, Brazil, China, India, Indonesia, Italy, the Netherlands, Romania, the UK and the US.
Commitment to quality
The implementation of the Philips Business System is embedding a fundamental commitment to quality across all our processes, products, systems and services. Philips’ personal health businesses are subject to regulatory requirements in the markets where it operates. This includes the European Union’s Waste from Electrical and Electronic Equipment (WEEE), Restriction of Hazardous Substances (RoHS), Registration, Evaluation, Authorization and Restriction of Chemicals (REACH), Energy-use of Products (EuP) requirements and Product Safety Regulations. We have a growing portfolio of medically regulated products in our Health & Wellness and Personal Care businesses. For these products we are subject to the applicable requirements of the US FDA, the European Medical Device Directive, the CFDA in China and comparable regulations in other countries. Through our growing beauty, oral healthcare and mother and child care product portfolio the range of applicable regulations has been extended to include requirements relating to cosmetics and, on a very small scale, pharmaceuticals.
With regard to sourcing, please refer to sub-section 14.2.8, Supplier indicators, of this report.
6.2.3 2015 business highlights
The success of established propositions like the Philips Sonicare DiamondClean and the Philips Sonicare AirFloss Ultra, along with new innovations like Philips Sonicare for Kids Connected, drove continued growth across the world, in particular in China, Japan, Germany and North America.
Continuing the geographical expansion of Philips product innovations, we reached the milestone of 5 million Philips Airfryers sold. Philips is the market leader in the world’s low-fat fryer market.
Delivering on its male grooming growth strategy to drive loyalty and create more value among existing users, Philips launched the Philips Smart Shaver Series 7000.
74 Annual Report 2015
Sector performance 6.2.3
The new Philips Smart Air Purifier 8000i series is a high-performing air purifier that helps to quickly improve indoor air quality – even in larger rooms.
At Kind + Jugend, the leading international baby and toddler trade fair in Germany, Philips reinforced its industry leadership, showcasing the Philips Avent uGrow Platform, a new digital parenting platform which supports the healthy development of babies.
Empowering consumers to take greater control of their health, Philips personal health programs were announced at IFA Berlin, one of the world’s leading trade shows for home appliances. Built upon the Philips HealthSuite digital platform, each program compromises connected health measurement devices, an app-based personalized program with coaching, and secure, cloud-based data analysis.
6.2.4 2015 financial performance
Philips Consumer Lifestyle
Key datain millions of EUR unless otherwise stated
2013 - 2015
| | | | | | | | | | | | |
| | | | |
| | | 2013 | | | 2014 | | | 2015 | |
| | | | |
Sales | | | 4,605 | | | | 4,731 | | | | 5,347 | |
Sales growth | | | | | | | | | | | | |
% increase, nominal | | | 7 | % | | | 3 | % | | | 13 | % |
% increase, comparable1) | | | 10 | % | | | 6 | % | | | 6 | % |
Adjusted IFO1) | | | 483 | | | | 573 | | | | 673 | |
as a % of sales | | | 10.5 | % | | | 12.1 | % | | | 12.6 | % |
IFO | | | 429 | | | | 520 | | | | 621 | |
as a % of sales | | | 9.3 | % | | | 11.0 | % | | | 11.6 | % |
Net operating capital (NOC)1) | | | 1,261 | | | | 1,353 | | | | 1,453 | |
Cash flows before financing activities1) | | | 480 | | | | 553 | | | | 589 | |
Employees (in FTEs) | | | 17,255 | | | | 16,639 | | | | 16,254 | |
| | | | |
| 1) | For a reconciliation to the most directly comparable GAAP measures, see chapter 15, Reconciliation of non-GAAP information, of this report |
Sales amounted to EUR 5,347 million, a nominal increase of 13% compared to 2014. Excluding a 7% positive currency impact, comparable sales were 6% higher year-on-year. Health & Wellness achieved double-digit growth, Personal Care reported high-single-digit growth, while Domestic Appliances was in line with 2014. Green Product sales amounted to EUR 3,091 million, or 58% of total sector sales.
From a geographical perspective, growth geographies achieved high-single-digit growth and mature geographies registered low-single-digit growth. In growth geographies, the increase was mainly driven by Central & Eastern Europe, Asia Pacific and India, primarily in the Health & Wellness and Personal Care businesses. Growth geographies’ share of sector sales was 48%, compared to 47% in 2014.
Adjusted IFO increased from EUR 573 million, or 12.1% of sales, in 2014 to EUR 673 million, or 12.6% of sales, in 2015. Restructuring and acquisition-related charges amounted to EUR 36 million in 2015, compared to EUR 9 million in 2014. Adjusted IFO in 2015 also included charges related to the devaluation of the Argentine peso of EUR 13 million. Adjusted IFO in 2014 also included a EUR 11 million past-service pension cost gain. The year-on-year Adjusted IFO increase was mainly driven by improved earnings at Health & Wellness and Personal Care.
IFO amounted to EUR 621 million, or 11.6% of sales, which included EUR 52 million of amortization charges, mainly related to acquired intangible assets at Health & Wellness and Domestic Appliances.
Net operating capital increased from EUR 1,353 million in 2014 to EUR 1,453 million in 2015, due to higher working capital, partly offset by a reduction in intangible fixed assets.
Cash flows before financing activities increased from EUR 553 million in 2014 to EUR 589 million in 2015, mainly due to higher earnings.
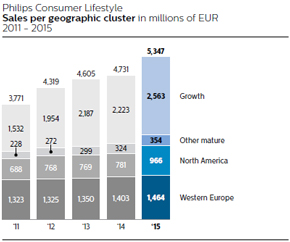
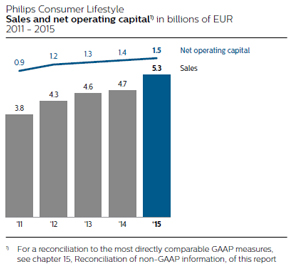
Annual Report 2015 75
Sector performance 6.2.4
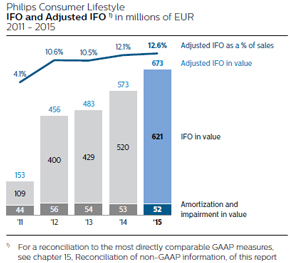
2014 financial performance
Sales amounted to EUR 4,731 million, a nominal increase of 3% compared to 2013. Excluding a 3% negative currency impact, comparable sales were 6% higher year-on-year. Health & Wellness achieved double-digit-growth and Domestic Appliances recorded high-single-digit growth, while Personal Care recorded low-single-digit growth. Green Product sales amounted to EUR 2,605 million, or 55% of total sector sales.
From a geographical perspective, comparable sales showed an 8% increase in growth geographies and 3% growth in mature geographies. In growth geographies, increase was mainly driven by China and Middle East & Turkey, primarily in the Health & Wellness and Domestic Appliances businesses. Growth geographies’ share of sector sales was in line with 2013 at 47%.
Adjusted IFO increased from EUR 483 million, or 10.5% of sales, in 2013 to EUR 573 million, or 12.1% of sales, in 2014. Restructuring and acquisition-related charges amounted to EUR 9 million in 2014, compared to EUR 14 million in 2013. Adjusted IFO also included a post-service pension cost gain of 11��million in 2014, comparted to EUR 1 million in 2013. The year-on-year Adjusted IFO increase was driven by improved earnings in all businesses and more than offset currency headwinds.
IFO amounted to EUR 520 million, or 11.0% of sales, which included EUR 53 million of amortization charges, mainly related to intangible assets at Health & Wellness and Domestic Appliances.
Net operating capital increased from EUR 1,261 million in 2013 to EUR 1,353 million in 2014, due to higher working capital and a reduction in provisions.
Cash flows before financing activities increased from EUR 480 million in 2013 to EUR 553 million in 2014, mainly attributable to higher earnings.
6.2.5 Delivering on EcoVision sustainability commitments
Sustainability continued to play an important role at Consumer Lifestyle in 2015, with the main focus on optimizing the sustainability performance of our products and operations. Green Products, which meet or exceed our minimum requirements in the area of energy consumption, packaging and/or substances of concern, accounted for 58% of total sales in 2015. All Green Products with rechargeable batteries exceed the stringent California energy efficiency standard by at least 10%. And over 65% of total sales are PVC- and/or BFR-free products (excluding power cords). In 2015, we continued to increase the use of recycled materials in our products. Over 900 tons of recycled plastics were used in kitchen appliances, vacuum cleaners, irons and coffee machines, compared to 625 tons in 2014.
As concrete examples of our commitment to sustainability we launched the new Perfect Care Eco Aqua Steam Generator, of which the plastic parts consist of 50% recycled material, and the Performer Expert vacuum cleaner, which is free of PVC/BFR, has an A-class energy label and contains 50% recycled plastics.
In our operations we continue to use most of our electricity from renewable sources, with the ultimate aim of having CO2-neutral production sites by 2020. In 2015, 65% of the electricity used in manufacturing sites came from renewable sources and 82% of the industrial waste was recycled.
6.2.6 2016 and beyond
In September 2014, Philips announced its plan to sharpen its strategic focus by establishing two stand-alone companies focused on the HealthTech and Lighting opportunities respectively. Philips has transferred its Lighting business into a stand-alone structure effective February 1, 2016 and has moved from a holding company model to an operating company model.
In light of its focus on health technology, Philips has eliminated the Healthcare and Consumer Lifestyle sector layers in order to drive the convergence of consumer health and professional healthcare as well as to reduce overhead costs. We plan to change the reporting of Philips’ health technology activities to three segments (Personal Health, Diagnosis & Treatment, Connected Care & Health Informatics) with effect from Q1 2016. For more details on the new segment reporting in 2016 and onwards, please refer to the introduction of Sector performance.
Further updates will be provided in the course of 2016.
76 Annual Report 2015
Sector performance 6.3
6.3 Lighting

“We are successfully leading the industry transformation from conventional lighting to innovative LED and connected lighting systems that unlock new value and experiences for our customers and partners. Embedding lighting into the Internet of Things, we will capture growth opportunities and adjacent value from new services-based business models. Our leadership positions, innovations and strong brand present a catalyst for value creation, growth and a solid foundation on which to become a stand-alone lighting company.” Eric Rondolat, CEO Philips Lighting
The lighting industry is undergoing a radical transformation.
The lighting market is being driven by the transition to LED and connected lighting applications.
Recognizing that the growth and profit pool will shift to digitally connected lighting products, systems and services, our goal is to become a lighting solutions company capturing superior growth and profitability.
We continue on our Accelerate! journey to achieve operational excellence across our businesses.
The separation process is fully under way and is expected to be completed in the first half of 2016.
6.3.1 Lighting landscape
We are witnessing a number of trends and transitions that are affecting the lighting industry and changing the way people use and experience light.
We serve a large and attractive market that is driven by the need for more light, the need for energy-efficient lighting, and the need for digital and connected lighting. The world’s population is forecast to grow from 7 billion today to over 9 billion by 2050. At the same time, we are witnessing rapid urbanization, with over 70% of the world’s population expected to live in urban areas by 2050. These trends will increase demand for light. In addition, in the face of resource constraints and climate change, the world needs that light to be energy-
Annual Report 2015 77
Sector performance 6.3.1
efficient. At the same time, the lighting industry is moving from conventional to LED lighting, which is changing the way people use, experience and interact with light. Digital technologies enable connectivity and seamless integration in software architectures, systems and services. Connected lighting allows light points to be used as information pathways opening up new functionalities and services based on the transmission and analysis of data.
The lighting market is expected to grow by 2-4% per annum between 2015 and 2019 (source: BCG). The majority of this growth will be driven by LED-based solutions and applications – heading towards a 60-65% share by 2018.
6.3.2 About Lighting in 2015
Philips Lighting is a global market leader with recognized expertise in the development, manufacture and application of innovative, energy-efficient lighting products, systems and services that improve people’s lives. We have pioneered many of the key breakthroughs in lighting over the past 125 years, laying the basis for our current strength and leading position in the digital transformation.
We have a firm strategy which is based upon six priorities:
Optimize value from conventional products to support growth
Innovate in LED products commercially and technologically to outgrow the market
Lead the shift to systems, building the largest connected installed base
Capture adjacent value through new services business models
Be our customers’ best business partner locally, leveraging our global scale
Use our Accelerate! program to improve our operational excellence
We aim to further invest to support our leadership in LED and connected lighting systems and services while at the same time capitalizing on our broad portfolio, distribution and brand in conventional lighting by flexibly anticipating and managing the phase-out and declining sales of conventional products.
We address people’s lighting needs across a full range of market segments. Indoors, we offer lighting products, systems and services for homes, shops, offices, schools, hotels, factories and hospitals. Outdoors, we offer products, systems and services for roads, streets, public spaces, residential areas and sports arenas, as well as solar-powered LED off-grid lighting. In addition, we address the desire for light-inspired experiences through architectural projects. Finally, we offer specific applications of lighting in specialized areas, such as entertainment, horticulture, and water purification.
In 2015, Philips Lighting spanned a full-service lighting value chain – from lamps, luminaires, electronics and controls to connected and application-specific systems and services – through the following businesses:
Light Sources & Electronics: LED, eco-halogen, (compact) fluorescent, high-intensity discharge and incandescent light sources, plus electronic and electromagnetic gear, modules and drivers
Consumer Luminaires: functional, decorative, lifestyle, scene-setting luminaires
Professional Lighting Solutions: controls and luminaires for city beautification, road lighting, sports lighting, office lighting, shop/hospitality lighting, industry lighting
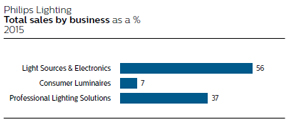
In 2015, the Light Sources & Electronics business conducted its sales and marketing activities through the professional, OEM and consumer channels, the latter also being used by our Consumer Luminaires business. Professional Lighting Solutions was organized in a project solutions business (project luminaires, systems and services).
The conventional lamps industry has been highly consolidated, with GE and Osram as main key competitors. The LED lighting market, on the other hand, is very dynamic. We face new competition from Asia and new players from the semiconductor and building management sectors. The luminaires industry is fragmented, with our competition varying per region and per market segment.
Under normal economic conditions, Lighting’s sales are generally not materially affected by seasonality.
Philips Lighting has manufacturing facilities in some 25 countries in all major regions of the world, and sales organizations in more than 60 countries. Commercial activities in other countries are handled via distributors working with our International Sales organization. Lighting has approximately 34,000 employees worldwide.
Commitment to quality
The implementation of the Philips Business System is embedding a fundamental commitment to quality across all our processes, products, systems and services. Lighting is subject to significant regulatory requirements in the markets where it operates. These include the European Union’s Waste from Electrical and Electronic Equipment (WEEE), Restriction of
78 Annual Report 2015
Sector performance 6.3.2
Hazardous Substances (RoHS), Registration, Evaluation, Authorization and Restriction of Chemicals (REACH), Energy-using Products (EuP) and Energy Performance of Buildings (EPBD) directives.
With regard to sourcing, please refer to sub-section 14.2.8, Supplier indicators, of this report.
6.3.3 2015 business highlights
In 2015, our lighting innovations supported our six strategic priorities aimed at delivering even greater value for our customers and other stakeholders. These highlights showcase our leading innovations in connected lighting, systems and services, our aspiration to bethe lighting company for the Internet of Things for both professional and consumer markets.
Philips expanded its portfolio of connected lighting products for the home by introducing Philips Hue Phoenix, a luminaire providing tunable white light, Philips Hue Go, a portable wireless luminaire, Philips Lightstrip Plus, a flexible LED light strip, and a new bridge enabling Philips Hue to interact with other Apple HomeKit devices and become voice-controlled.
Philips and Cisco formed a global strategic alliance that will help enable facilities managers, building owners and office workers to reap the benefits of the Internet of Things in offices. The alliance combines Philips’ connected office lighting system with Cisco’s highly secure network technology, to increase energy efficiency, provide data to optimize user comfort and improve the office environment.
Philips made further inroads with its Philips CityTouch lighting system, with Los Angeles adopting an advanced Philips management system that uses wireless and cloud-based technologies to control its street lighting. Philips’ CityTouch connected lighting management system is now used in more than 262 projects in over 30 countries across the world.
In Lille, France, Carrefour installed 2.5 kilometers of Philips LED lighting that uses light to transmit a location signal to a shopper’s smartphone, triggering an app to provide location-based services. This enables Carrefour to provide new services to its shoppers, such as helping them to navigate and find promotions across the 7,800 m2 shop floor. It is the world’s largest connected lighting indoor positioning system for retail and has reduced the total lighting-based electricity consumption of the hypermarket by 50%.
Philips provided a connected LED lighting system for the New NY Bridge in New York. It will combine roadway and architectural lighting, an industry first, on what will be the most technologically advanced bridge in North America. The system will feature remotely programmed lights that produce dynamic colorful effects and use Philips ActiveSite and Philips CityTouch cloud-based monitoring and management systems.
Philips continues to light up iconic buildings around the world with colorful and dynamic connected LED lighting. New illuminations in 2015 include Europe’s largest mosque located in Moscow, Le Meurice hotel in Paris, the Cairo Opera House, the Accra Theater in Ghana, the Big Four Bridge in Louisville, US, the Nanjing Tower in China, and the Edirne Bridge and Butterfly Valley in Turkey.
Philips launched LifeLight, a solar-powered LED lighting range for homes in Kenya and other African countries. The range eliminates the need to use kerosene lamps, with their harmful fumes, in homes in off-grid areas, and also increases productivity and community life by enabling activities to continue after dark.
6.3.4 2015 financial performance
| | | | | | | | | | | | |
| Philips Lighting | | | | | | | | | | | | |
| Key data in millions of EUR unless otherwise stated | | | | | | | | | | | | |
| 2013 - 2015 | | | | | | | | | | | | |
| | | | |
| | | 2013 | | | 2014 | | | 2015 | |
| | | | |
Sales | | | 7,145 | | | | 6,869 | | | | 7,411 | |
Sales growth | | | | | | | | | | | | |
% increase (decrease), nominal | | | (2 | )% | | | (4 | )% | | | 8 | % |
% increase (decrease), comparable1) | | | 1 | % | | | (3 | )% | | | (3 | )% |
Adjusted IFO1) | | | 580 | | | | 293 | | | | 594 | |
as a % of sales | | | 8.1 | % | | | 4.3 | % | | | 8.0 | % |
IFO | | | 413 | | | | 185 | | | | 486 | |
as a % of sales | | | 5.8 | % | | | 2.7 | % | | | 6.6 | % |
Net operating capital (NOC)1) | | | 4,462 | | | | 3,638 | | | | 3,813 | |
Cash flows before financing activities1) | | | 418 | | | | 442 | | | | 642 | |
Employees (in FTEs) | | | 38,671 | | | | 37,808 | | | | 33,618 | |
| | | | |
| 1) | For a reconciliation to the most directly comparable GAAP measures, see chapter 15, Reconciliation of non-GAAP information, of this report |
In 2015, sales amounted to EUR 7,411 million, 8% higher on a nominal basis. Excluding a 9% positive currency effect and a 2% positive effect from portfolio changes, comparable sales decreased by 3%. Both Light Sources & Electronics and Consumer Luminaires recorded a mid-single-digit decline, partly due to the anticipated decline in conventional lighting, while Professional Lighting Solutions remained flat year-on-year.
From a geographical perspective, comparable sales in growth geographies showed a mid-single-digit decrease, largely driven by declines across all businesses in China and at Light Sources & Electronics and Professional Lighting in Middle East & Turkey. Sales in growth geographies increased from 39% of total sales in 2014 to 40% in 2015. Comparable sales in mature geographies showed a low-single-digit decline, with Western Europe and North America recording a low-single-digit decline and other mature geographies remaining flat year-on-year.
Annual Report 2015 79
Sector performance 6.3.4
Sales of LED-based products grew to 43% of total sales, up from 34% in 2014, driven by Light Sources & Electronics and Professional Lighting Solutions. Sales of energy-efficient Green Products exceeded EUR 5,343 million, or 72% of sector sales.
Adjusted IFO increased from EUR 293 million, or 4.3% of sales, in 2014 to EUR 594 million, or 8.0% of sales in 2015. Restructuring and acquisition-related charges amounted to EUR 99 million in 2015, compared to EUR 245 million in 2014. Adjusted IFO in 2015 also included EUR 14 million of charges related to the devaluation of the Argentine peso, while 2014 included a EUR 13 million past-service pension cost gain and EUR 68 million of impairment and other charges related to industrial assets. The increase in Adjusted IFO was mainly attributable to lower restructuring and acquisition-related charges, cost productivity and improved LED gross margins.
IFO amounted to EUR 486 million, or 6.6% of sales, which included EUR 108 million of amortization charges, mainly related to acquired intangible assets at Professional Lighting Solutions.
Net operating capital increased by EUR 175 million to EUR 3.8 billion. The current-year increase was mainly due to currency translation effects.
Cash flows before financing activities increased from EUR 442 million in 2014 to EUR 642 million due to higher earnings and a decrease in working capital.
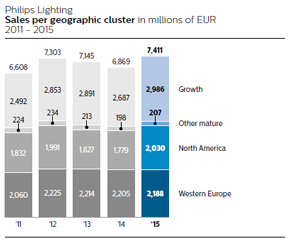
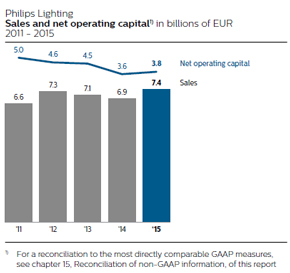
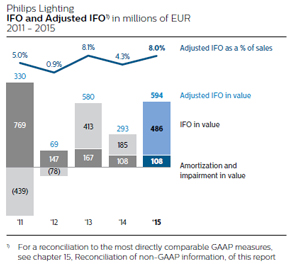
2014 financial performance
In 2014, sales amounted to EUR 6,869 million, 4% lower on a nominal basis. Excluding a 1% negative currency effect, comparable sales decreased by 3%. Light Sources & Electronics recorded mid-single-digit growth and Consumer Luminaires posted a high-single-digit decline, while Professional Lighting Solutions recorded low-single-digit growth.
From a geographical perspective, comparable sales in growth geographies showed a mid-single-digit decline, largely driven by decline across all businesses in China. As a result, sales in growth geographies decreased from 40% of total sales in 2013 to 39% in 2014. Comparable sales in mature geographies showed a low-single-digit decline, with Western Europe and North America recording a low-single-digit decline and other mature geographies registering a mid-single-digit decline.
Sales of LED-based products grew to 34% of total sales, up from 25% in 2013, driven by Light Sources & Electronics and Professional Lighting Solutions. Sales of energy-efficient Green Products exceeded EUR 4,952 million, or 72% of sector sales.
80 Annual Report 2015
Sector performance 6.3.5
Adjusted IFO declined from EUR 580 million, or 8.1% of sales, in 2013 to EUR 293 million, or 4.3% of sales in 2014. Restructuring and acquisition-related charges amounted to EUR 245 million in 2014, compared to EUR 83 million in 2013. 2014 also included a EUR 13 million past-service pension cost gain in the Netherlands and EUR 68 million of impairment and other charges related to industrial assets, while 2013 included a EUR 10 million past-service pension cost gain. The decrease in Adjusted IFO was mainly attributable to higher restructuring and acquisition-related charges and lower sales volume.
IFO amounted to EUR 185 million, or 2.7% of sales, which included EUR 106 million of amortization charges, mainly related to intangible assets at Professional Lighting Solutions.
Net operating capital decreased by EUR 824 million to EUR 3.6 billion. The decrease was mainly due to the reclassification of Lumileds and Automotive as assets held for sale in 2014, partly offset by positive currency impacts.
Cash flows before financing activities increased from EUR 418 million in 2013 to EUR 442 million, as lower earnings were partly offset by a reduction in working capital.
6.3.5 Delivering on EcoVision sustainability commitments
Early in 2015, Philips Lighting engaged in a ‘Light as a Service’ business arrangement with Amsterdam Airport Schiphol. Under the terms of this agreement Philips will retain ownership of the lighting equipment and Schiphol will pay for the light used. The project will utilize LED-based products that will deliver 50% energy savings relative to legacy lighting. Light as a Service is starting to gain traction in the market as a new business model, because it offers state-of-the-art lighting hassle-free, does not require any customer investment, provides energy efficiency (lower CO2 emissions), and supports the circular economy (less waste to landfill).
Annual Report 2015 81
Sector performance 6.3.5
Within the framework of the Green Operations 2015 program, Philips Lighting has reduced its carbon footprint in manufacturing (scope 1 and 2 emissions) by approximately 58% since the baseline year of 2007. In 2015, 85% of our total industrial waste was re-used as a result of recycling. In December 2015, while speaking at COP 21 in Paris, Eric Rondolat announced Philips’ commitment to making its operations carbon-neutral by 2020, both for Royal Philips and for Philips Lighting.
6.3.6 2016 and beyond
In September 2014, Philips announced its plan to sharpen its strategic focus by establishing two stand-alone companies focused on the HealthTech and Lighting opportunities respectively. We have established a stand-alone structure for Philips Lighting within the Philips Group, effective February 1, 2016. We expect to be able to announce the separation of the Lighting business in the first half of 2016, subject to market conditions and other relevant circumstances. As previously stated, we are reviewing all strategic options for Philips Lighting, including an initial public offering and a private sale.
From an external financial reporting perspective, it should be noted that Royal Philips will introduce new segment reporting, from Q1 2016 onwards. The Lighting segment will represent the Philips Lighting businesses and include the relevant allocation of the current Innovation, Group & Services. For more details on the new segment reporting in 2016 and onwards, please refer to the introduction of Sector performance.
Further updates will be provided in the course of 2016.
82 Annual Report 2015
Sector performance 6.4
6.4 Innovation, Group & Services
Philips moved its North American Research organization to the Cambridge, Mass. area to benefit from the vibrant innovation ecosystem and to facilitate collaboration with Massachusetts Institute of Technology (MIT), academic hospitals, and business partners. Also the new site will be truly interdisciplinary, co-locating various functions like upstream marketing, strategy, design, digital accelerator, and early-stage ventures.
Philips became the second-largest patent applicant in the world for patents filed at the European Patent Office (EPO).
Philips Design celebrated 90 years of design legacy with a record-breaking 156 design awards.
Introduction
In 2015, Innovation, Group & Services comprised the activities of Philips Group Innovation, Group headquarters, including country and regional management, and certain costs of pension and other post-retirement benefit plans. Additionally, the global shared business services for procurement, finance, human resources, IT and real estate are reported in this sector.
6.4.1 About Innovation, Group & Services in 2015
Philips Group Innovation
At Philips, our innovation efforts are closely aligned with our business strategy. Philips Group Innovation (PGI) feeds the innovation pipeline, enabling its business partners – the Philips operating businesses – to–to create new business options through new technologies, new business creation, and intellectual property management and development. Focused research and development improvement activities drive time-to-market efficiency and increased innovation effectiveness.
Annual Report 2013 111
5 Sector performance 5.4.1 - 5.4.1
effectiveness.PGI boosts innovation from idea to product as co-creator and strategic partner for the Philips businesses and complementary Open Innovation ecosystem partners. It does so through cooperation between research, design, marketing, strategy and businesses in interdisciplinary teams along the innovation chain, from front-end to first-of-a-kind product development. In addition, PGI opens up new value spaces beyond the direct scope of current business scope or focusbusinesses (Emerging Business Areas), manages the Emerging-Business-Areas-relatedCompany-funded R&D portfolio, and creates synergysynergies for cross-sector initiatives.
PGI encompasses Philips Research, Philips Innovation Services, the Philips Innovation Campus in Bangalore, the Philips Innovation Center Shanghai, the Philips Innovation Labs in Cambridge (USA), the Philips Africa Innovation Hub, Philips Design, the Philips HealthcareHealthTech Incubator, as well asand the Emerging Business Areas. In total, PGI employs some 4,9005,000 professionals around the globe.
PGI actively participates in ‘Open Innovation’Open Innovation through relationships with academic and industrial partners, as well as via European and regional projects, in order to improve innovation effectiveness and efficiency, capture and effectiveness, generate new ideas, enhance technology partnering capabilities, and share the related financial exposure. The High Tech Campus in Eindhoven (Netherlands), the Philips Innovation Campus in Bangalore (India), and the Philips Innovation Center in Shanghai (China) and the Philips Cambridge Innovation Labs (USA) are prime examples of environments enabling Open Innovation.
Through Open Innovation, Philips also seeks to ensure proximityapply new thinking to solving major societal issues. A great example is the five-year alliance between Philips Research and Massachusetts Institute of innovation activities to growth geographies. For example, in 2013, Philips and Dubai Economic Council signed a memorandum of understanding to develop a series of strategic initiatives to encourage the adoption of Open Innovation strategies between businesses and government in the United Arab Emirates.
A joint initiative between PGI, IT and multiple Philips businesses aimsTechnology (MIT) aimed at speeding up advancements in health technology solutions to help address society’s most pressing challenges in healthcare, as well as digital innovationconnected lighting systems to create personalized solutions that matteraddress the need to people. Onemake cities more livable and sustainable. With a total budget of the results in 2013 was that Philips, together with Accenture, simulated the first proof-of-conceptUSD 25 million for the seamless transfer of patient vital signs into Google Glass. Atfive-year term, this is the IFAlargest research alliance undertaken by the company in Berlin,the region. Philips also demonstrated apps that add smart personalized functionalities to consumer products, such as a facial hair style app, an air purification app,researchers will be collaborating intensely with MIT faculty and a coffee experience app.PhD students on jointly defined research programs and Open Innovation projects.
Philips Research
Philips Research is the main partner of Philips’ operating businesses for technology-enabled innovation. It creates new technologies and the related intellectual property, (IP), which enables Philips to grow in businesses and markets. Together with the businesses and the markets, Philips Research co-creates innovations to strengthen the core businesses as well as to open up new opportunities in adjacent business areas. Research’s innovation pipeline is aligned with ourPhilips’ vision and strategy and inspired by unmet customer needs as well as major societal challenges.
In 2013, Philips Research created the world’s most energy-efficient warm-white LED lamp.area of Healthcare, we continue to engage with customers in novel ways to discover unmet needs and co-create solutions with our partners. The Digital Accelerator and the recently opened HealthSuite Lab at the High Tech Campus in Eindhoven, for example, enable us to fast-track the development and execution of new TLED prototype, designedcare models and solutions, together with partners and customers such as hospital networks, supported by the latest digital technologies and rapid prototyping. Through research partnerships, such as our agreements with Stockholm County Council and Karolinska University Hospital, researchers from different industries, hospitals and academia are brought together to replace fluorescent tube lighting, delivers 200 lumens per wattfacilitate closer links between the delivery of high-quality light, halving energy use compared to current LED lamps.care and clinical research.
Annual Report 2015 83
Sector performance 6.4.1
In the area of Healthcare,Lighting, we remain highly focused on offering solutions across the lighting value chain, including software, controls, luminaires, light sources and modules. We are shifting our lighting portfolio from individual products towards connected LED lighting systems and services, LED luminaires and LED lamps for the professional and consumer markets. In close collaboration with the US Department of Defense/US Army Base Fort Sill (Oklahoma) in North America, Philips Research co-created innovative imaging solutionsdemonstrated how the use of advanced LED light sources and smart lighting controls can result in substantial energy and cost savings while improving the quality of light in terms of color rendering and brightness. The initiative was honored with improved ultrasound, MRIthe ESTCP (Environmental Security Technology Certification Program) 2015 ‘Project of the Year Award’ for Energy and X-ray results. In the case of X-ray, the Philips AlluraClarity system provides industry-leading visibility for live image guidance at low X-ray dose levels.
The new EPIQ premium ultrasound platform received outstanding feedback from key opinion leaders about the exceptional image quality delivered by multiline beam forming (nSight Imaging) and Anatomical Intelligence.Water.
Philips Innovation Services
Philips Innovation Services offers a wide range of advanced innovationexpert services expertise and high-tech facilities across the entire innovation activity chain. Services extend from concept creation, productin development, prototyping and small series production, industrialization, quality and reliability, to sustainability and industrialrealization & consulting. Innovation Services’ skills are leveraged by the Philips businessesBusinesses, Markets and Philips Group Innovation acrossin all regions, onregions.
Together with Research and a wide range of innovation projects.
Examples of recent innovations supported bynew dedicated Connected Digital Proposition team, Innovation Services includehas helped realize various connected products as part of personal health programs launched at IFA in Berlin – the Hue personal wireless lighting, intelligent catheters suchhealth watch, blood pressure monitor, body analysis scale and ear thermometer – as well as the EchoNavigator live image-guidance tool, OLEDrecently announced cooperation with Charité – Universitätsmedizin Berlin on preventing delirium in critical care with lighting Green Hospital energy-saving services for medical institutions, and the Smart Air Purifier.acoustics concepts.
Philips Innovation Services also supportssupported projects such as Philips LifeLight, the new zero-energy, solar-powered LED lighting range designed for homes in off-grid rural and semi-urban communities, as part of Philips’ drive to deliver innovations that are locally relevant. This year the organization opened a new Service Center at the Philips innovation site in Shanghai. Staffed by experts in electronics design, electromagnetic compatibility, reliability and mechatronics, the Service Center provides locally relevant services meeting Philips’ innovation needs in China.
112 Annual Report 2013
5 Sector performance 5.4.1 - 5.4.1
Philips Innovation Campus Bangalore
Philips Innovation Campus Bangalore (PIC) hosts activities from most of our operating businesses, Philips Research, Design, IP&S, and IT. Healthcare is the largest R&D organization at PIC, with activities in Imaging Systems, and Patient Care & Clinical Informatics.Monitoring Solutions, and Healthcare Informatics, Solutions & Services. While PIC originally started as a software center, it has since developed into a broad product development center (including mechanical, electronics, and supply chain capabilities). Several Healthcare businesses have also located business organizations focusing on growth geographies at PIC.
Philips Innovation Center Shanghai
Philips Research China is Philips’ second-largest research lab globally. The organization currently has over 170 staff working in the Healthcare, Consumer Lifestyle and Lighting programs and cooperates extensively with Philips labs across the world. Research China anchors our broader commitment to our Shanghai R&D campus as an innovation hub.
Philips Cambridge Innovation Labs (USA)
The new Philips Cambridge Innovation Labs that opened in October 2015 are situated in the hub of the Cambridge/Boston ecosystem. The labs are the new home to approximately 100 Philips Research North America employees and another 150 Philips employees from other innovation functions and ventures. Being within close proximity to the MIT campus allows researchers to collaborate easily with MIT faculties and PhD students on jointly defined research programs, as well as to participate in Open Innovation projects. The joint teams are working on advancements in healthcare and connected lighting systems
Philips Africa Innovation Hub
The Philips Africa Innovation Hub in Nairobi, Kenya, creates locally relevant innovations ‘in Africa, for Africa’, with particular focus on improving access to lighting and affordable healthcare. The Africa Innovation Hub is a collaboration between Philips Group Innovation and Philips’ Africa market organization.
Philips Design
Celebrating its 90th anniversary in 2015, Philips Design is the global design function for the company, ensuring that innovations are meaningful, people-focused and locally relevant. The Design group is also tasked with ensuring that the Philips brand experience is differentiating, consistently expressed and drives customer preference.
Philips Design partners with the Philips businesses, Group Innovation and functions, to ensurechampioning a multidisciplinary co-create approach that our innovations are people-focused, meaningful and locally relevant, and that the Philips brand experience is differentiating, consistent and drives customer preference across all its touch-points.
Philips Design is a global function within the company, comprised of a Group Design team that leads the function and develops new competencies, and fully integrated sector Designbrings teams ensuring close alignment with the Philips businesses. The organization is made up of designers across various disciplines, as well as psychologists, ergonomists, sociologists and anthropologists – all working together to understand people’s needs and desires and to translate these into relevant solutions and experiencesthe different factors that create value for people and business. Design’s forward-looking exploration projects deliver vital insights for new business development.
In the area of emergency care, for example, the Design team has been instrumental in developinginfluence how a new user interaction concept for the next generation of automatic external defibrillation (AED). Based on newproduct or solution will appear, perform and deeper insights from onsite research into stakeholder requirements, protocols, routines and behavior in emergency settings in firehouses and police stations, it improves the ease of use for first responders, resulting in faster deployment. The Philips HeartStart FR3 AED won a red dot design award in 2013.
behave. Philips Design is widely recognized as a world leader in people-centric design. In 2013, it won over 100 keydesign and in 2015 alone received 156 design awards, including an unprecedented 39 iFthe IDSA silver award for the Connected NICU (Neo-Natal Intensive Care Unit), a concept aimed at supporting family-centered and developmental care, improved parental experience, long-term development and quality of life for pre-term babies.
Increasingly we are leveraging our design awardscapabilities and processes to work directly with our customers and our customer-facing teams. For example, the long-term deals announced in 2015 with Mackenzie Health in Canada and Westchester Medical Center include innovation and design consulting. Innovating directly with our customers enables Philips Design to deliver people-focused improvements that optimize the areaspatient experience and overall performance of product, communication and innovation design, 22 red dot design awards, eight Successful Design Awards China, seven Dutch Good Industrial Design Recognition prizes, and four Australian International Design Awards.their healthcare systems across the health continuum.
84 Annual Report 2015
Sector performance 6.4.1
Philips Healthcare Incubator
The Philips Healthcare Incubator is a corporate organization within Philips Group Innovationgroup dedicated to identifying, developing and bringing breakthrough products and services to market that will drive the future of healthcare. One of the ventures is Digital Pathology Solutions, which empowers pathologists with a complete connected digital pathology solution that is designed to optimize productivity and workflow, and ultimately to improve the quality of diagnosis.
Another venture is Handheld Diagnostics, with its Minicare proposition, which provides direct diagnostic information at the patients’ bedside, enabling physicians to make medical decisions on the spot. Based on innovative technologies, we have designed easy-to-use, patient-centric IVD (in-vitro diagnostics)-enabled solutions and connected services that have the potential to revolutionize health management and improve existing workflows. The Home Clinical Monitoring venture performs remote monitoring to support patients during chemotherapy. Finally, the acquisition of the Danish medical technology company Unisensor led to the establishment of Philips Biocell, which has released the oCelloScope System, an analytical instrument that is, among other applications, used within microbiological studies on a research application basis.
Philips Emerging Business Areas
Philips Emerging Business Areas identify, create and grow new activities that are outside the scope of the current operating businesses. The portfolio is managed on a venturing basis. The opportunities and business models identified by the individual new business creation. Its missionactivities determine the approach to commercial partnerships, sourcing of technology, and platforms to reach customers. Current examples of successful new solution businesses or enablers for these include Horticulture LED Solutions*, Light for Health, Photonics, Wearable Sensing Technologies, Elder Care Solutions and Mental Vitality.
Philips Horticulture LED Solutions stands for solutions that improve growers’ business performance. With customized ‘light recipes’ we can help optimize crop yield and quality. We combine crop growth knowledge and technology, and value long-term partnerships in business and research. Hundreds of projects have been realized in different regions in different segments. In July 2015, Philips CEO Frans van Houten opened the state-of-the-art GrowWise Center at the High Tech Campus in Eindhoven, the Netherlands. Research being conducted by Philips will provide tailor-made LED light recipes, making it possible for producers to increase their yields and grow tasty and healthy food indoors all year round, while reducing waste, limiting food miles and using practically no land or water.
Leveraging its advanced understanding of the biological effects of light, a team of Philips Light for Health researchers, collaborating with leading research institutions and hospitals, has developed a number of products like Philips BlueControl, which feature LED light and offer proven medical benefits.
Philips Photonics is a global leader in VCSEL technology and designs, manufactures, markets and sells VCSEL-based solutions for data communications, consumer and industrial applications. VCSELs are LED-like lasers enabling applications like gesture control, environmental sensing, precise scene illumination for surveillance cameras, and ultra-fast data communication. Philips Photonics has enabled the introduction of laser-based PC mice and high-bit-rate active optical cables, as well as introducing VCSEL-based solutions for industrial processing of plastic materials.
* Philips Horticulture LED Solutions will move to identify novel business opportunities addressing unmet needs of patients, payors and care providers through ground-breaking innovation, and to transform these into successful businesses. The ultimate goal is to create new, sizeable business categories for Philips Lighting in health care.2016.
Philips Intellectual Property & Standards
Philips IP&S proactively pursues the creation of new intellectual propertyIntellectual Property (IP) in close co-operation with Philips’ operating businesses and Philips Group Innovation. IP&S is a leading industrial IP organization providing world-class IP solutions to Philips’ businesses to support their growth, competitiveness and profitability.
Philips’ IP portfolio currently consists of approximately 13,20076,000 patent families, 2,680 trademark families, 3,930rights, 47,000 trademarks, 91,000 design families,rights and 2,1505,000 domain name families.names. Philips filed approximately 1,550 patent applications1,750 patents in 2013,2015, with a strong focus on the growth areas in health and well-being.
IP&S participates in the setting of standards to create new business opportunities for the Healthcare, Consumer Lifestyle and Lighting sectors.Philips operating businesses. A substantial portion of revenue and costs is allocated to the operating sectors.businesses. Philips believes its business as a whole is not materially dependent on any particular patent or license, or any particular group of patents and licenses.
Annual Report 2015 85
Sector performance 6.4.1
Group and Regional Costs
Group and Regional organizations support the creation of value, connecting Philips with key stakeholders, especially our employees, customers, governmentgovernments and society. These organizations include the Executive Committee, Brand Management, Sustainability, New Venture Integration, the Group functions related to strategy, human resources, legal and finance, as well as country and regional management.
Annual Report 2013 113
5 Sector performance 5.4.1 - 5.4.2
Accelerate! Investmentsinvestments
Innovation, Group & Services plays an important role in the Accelerate! program, notably by helping to improve the end-to-end value chain. The End-to-EndEnd2End approach consists of three core processes: Idea-to-Market, Market-to-Order, and Order-to-Cash. Innovation, Group & Services supports a more efficient and effective Idea-to-Market process in five focal areas: speeding up time-to-market, portfolio optimization, driving breakthrough innovation, improving innovation competencies, and strengthening the position of Philips as an innovation leader. Based on deeper customer insights,
Pensions
Pensions manage and enhanced capabilityoversee post-employment benefits of all Philips employees.
Service Units and competency building, we are driving value more effectively.Other
Service Units and Other provide shared functional services to businesses in areas such as IT, Real Estate and Accounting, thereby helping to drive global cost efficiencies.
5.4.2 20136.4.2 2015 financial performance
| | Key data | | | | | | | |
in millions of euros unless otherwise stated | | | | | | | |
Philips Innovation, Group & Services | | | | | | | |
Key datain millions of EUR unless otherwise stated | | | | | | | |
2013 - 2015 | | | | | | | |
| | | | | |
| | | | 2013 | | 2014 | | 2015 | |
| | | 2011 | | 2012 | | 2013 | | | | | |
Sales | | | 731 | | | | 713 | | | | 736 | | | | 665 | | | | 605 | | | | 574 | |
Sales growth | | | | | | | | | | | | |
% increase (decrease), nominal | | | (23 | ) | | | (2 | ) | | | 3 | | | | 6 | % | | | (9 | )% | | | (5 | )% |
% increase (decrease), comparable1) | | | (13 | ) | | | — | | | | (2 | ) | | | 0 | % | | | (12 | )% | | | 5 | % |
Adjusted IFO of: | | | | | | | | | | | | |
Group Innovation | | | (78 | ) | | | (149 | ) | | | (134 | ) | | | (134 | ) | | | (197 | ) | | | (222 | ) |
IP Royalties | | | 262 | | | | 253 | | | | 312 | | | | 312 | | | | 299 | | | | 284 | |
Group and Regional costs | | | (140 | ) | | | (161 | ) | | | (175 | ) | |
Group and regional costs | | | | (175 | ) | | | (205 | ) | | | (569 | ) |
Accelerate! investment | | | (28 | ) | | | (128 | ) | | | (137 | ) | | | (137 | ) | | | (131 | ) | | | (113 | ) |
Pensions | | | 22 | | | | 24 | | | | (41 | ) | | | (41 | ) | | | (12 | ) | | | (355 | ) |
Service Units and other | | | (235 | ) | | | (543 | ) | | | (64 | ) | |
Service units and other | | | | (124 | ) | | | (415 | ) | | | 56 | |
| | | | | | | | |
Adjusted IFO1) | | | (197 | ) | | | (704 | ) | | | (239 | ) | | | (299 | ) | | | (661 | ) | | | (919 | ) |
IFO | | | (207 | ) | | | (712 | ) | | | (242 | ) | | | (302 | ) | | | (675 | ) | | | (934 | ) |
Net operating capital (NOC)1) | | | (3,875 | ) | | | (4,500 | ) | | | (2,922 | ) | | | (2,922 | ) | | | (3,718 | ) | | | (3,382 | ) |
Cash flows before financing activities1) | | | (1,159 | ) | | | (842 | ) | | | (2,101 | ) | | | (2,140 | ) | | | (1,586 | ) | | | (2,086 | ) |
Employees (FTEs) | | | 13,001 | | | | 11,856 | | | | 12,937 | | |
Employees (in FTEs) | | | | 12,703 | | | | 13,853 | | | | 14,233 | |
| | | | | |
| 1) | For a reconciliation to the most directly comparable GAAP measures, see chapter 14,15, Reconciliation of non-GAAP information, of this report |
In 2013,2015, sales amounted to EUR 736574 million, and were mainly related to IP Royalties. Sales were EUR 2331 million higherlower than in 2012,2014, mainly due to the divestment of the OEM remote control business, partly offset by higher royalty income.sales at Philips’ emerging businesses such as Digital Pathology and Photonics.
Adjusted IFO in 2013 amounted to a lossnet cost of EUR 239919 million, compared to a loss of EUR 704661 million in 2012. In 2012,2014. Adjusted IFO in 2015 included thea EUR 31320 million impactnet release of the European Commission fine and provisions related to various legal matters totaling EUR 132 million. Restructuring and acquisition-relatedrestructuring charges, amounted to EUR 3 million in 2013, compared to EUR 56113 million restructuring charges in 2012. 20132014. Adjusted IFO in 2015 also included charges of EUR 183 million related to the separation of the Lighting business, EUR 345 million mainly related to settlements for pension de-risking, and a EUR 37 million gain related to the sale of real estate assets. Adjusted IFO in 2014 included EUR 244 million of charges related to the CRT settlement and a EUR 27 million past-service pension cost gain of EUR 6 million, which was recorded across Group Innovation, IP Royalties, Group and Regional Overheads and Service Units and Others.gain.
Adjusted IFO at Group Innovation was a EUR 1525 million lowerhigher net cost than in 2012,2014, mainly due to lower restructuring charges.higher investments in emerging business areas.
Adjusted IFO at Group &and Regional Overhead costs were EUR 14364 million higherlower than in 2012, mainly due to increased costs2014, reflecting EUR 183 million related to our new brand positioning.the separation of the Lighting business and higher charges mainly related to information security and Quality & Regulatory.
Accelerate! investments amounted to EUR 137113 million in 2015 and included investments in IT infrastructure, internal departments and external consultancy dedicated to the Accelerate! program.
Adjusted IFO at Pensions amounted to a net cost of EUR 355 million and represents costs related to deferred pensioners covered by company plans. 2015 included charges of EUR 345 million related to pension de-risking settlements.
Adjusted IFO at Service Units and Other increased from a loss of EUR 415 million in 2014 to a gain of EUR 56 million in 2015. The increase of EUR 471 million was largely due to lower restructuring costs and CRT antitrust litigation charges reported in 2014.
Net operating capital improved to negative EUR 3.4 billion, mainly due to a decrease in provisions.
Cash flows before financing activities decreased from an outflow of EUR 1,586 million in 2014 to an outflow of EUR 2,086 million.
2014 financial performance
In 2014, sales amounted to EUR 605 million, and were mainly related to IP Royalty income and our OEM Remote Control business. Sales were EUR 60 million lower than in 2013, mainly due to lower income from Group Innovation and IP Royalties.
Adjusted IFO amounted to a loss of EUR 661 million, compared to a loss of EUR 299 million in 2013. In 2014, Adjusted IFO included EUR 113 million of restructuring and acquisition-related charges, EUR 244
86 Annual Report 2015
Sector performance 6.4.3
million of provisions related to various legal matters and a EUR 27 million past-service pension gain in the Netherlands. 2013 Adjusted IFO included EUR 3 million of restructuring and acquisition-related charges and a pension settlement loss of EUR 25 million.
Adjusted IFO at Group Innovation was a EUR 63 million higher net cost than in 2013, mainly due to higher restructuring charges and higher investments in emerging business areas.
Adjusted IFO at Group and Regional Overhead costs were EUR 30 million lower than in 2013, mainly due to higher restructuring costs.
Accelerate! investments amounted to EUR 131 million in 2014, and include investments in IT infrastructure, internal departments and external consultancy dedicated to the Accelerate! program.
Adjusted IFO at Pensions amounted to a net cost of EUR 4112 million, and represent costs related to deferred pensioners covered by company plans. In 2013, Adjusted IFOPensions amounted to a net cost of EUR 41 million and was impacted by a EUR 31 million settlement loss arising from a lump-sum offering to terminated vested employees in our US pension plan. In 2012, Adjusted IFO was positively impacted by a EUR 25 million gain from a change in a medical retiree plan.
Adjusted IFO at Service Units and Other increased from a loss of EUR 543 million in 2012 to a loss of EUR 64 million. In 2012, Adjusted IFO included the EUR 313 million impact of the European Commission fine and provisions related to various legal matters totaling EUR 132 million, as well as a gain on the sale of the High Tech Campus of EUR 37 million. Excluding these impacts, the increase in Adjusted IFO in 2013 was mainly due to lower restructuring costs as well as releases of environmental provisions.
Net operating capital decreased to negative EUR 2.9 billion, primarily related to the payment of the European Commission fine, a decrease in pension liabilities, an increase in the value of currency hedges as well as a reclassification of real estate assets from the sectors to the Service Units.
Cash flows before financing activities decreased from an outflow of EUR 842 million in 2012 to an outflow of EUR 2,101 million, mainly due to the payment of the European Commission fine and lower cash inflows from the sale of fixed assets.
2012 financial performance
In 2012, sales amounted to EUR 713 million, EUR 18 million lower than in 2011, reflecting the divestment of Assembléon in 2011.
114 Annual Report 2013
5 Sector performance 5.4.2 - 5.4.2
Adjusted IFO in 2012 amounted to a loss of EUR 704 million, compared to a loss of EUR 197 million in 2011. The year-on-year decrease in Adjusted IFO was largely attributable to a EUR 313 million impact of European Commission fine and provisions related to various legal matters totaling EUR 132 million. Restructuring and acquisition-related charges amounted to EUR 56 million in 2012, compared to EUR 23 million in 2011.
Adjusted IFO at Group Innovation was EUR 71 million lower than in 2011, due to new innovation and design initiatives, as well as higher investments in new value spaces.
Group & Regional Overhead costs were EUR 21 million higher than in 2011, mainly due to increased costs related to strengthening the market access and growth initiatives.
Accelerate! investments amounted to EUR 128 million in 2012, and include investments in IT infrastructure, internal departments and external consultancy dedicated to the Accelerate! program.
Adjusted IFO at Pensions was EUR 2 million higher than in 2011. 2011 was positively impacted by a EUR 21 million gain due to a plan change in one of our major plans, while 2012 was positively impacted by a EUR 25 million gain from a change in a medical retiree plan.
Adjusted IFO at Service Units and Other decreased from a loss of EUR 235124 million in 20112013 to a loss of EUR 543 million.415 million in 2014. The decrease was largely attributable to thedriven by EUR 313243 million impact of the European Commission fine and provisionscharges related to various legal matters totaling EUR 132 million, partly offset by a gain on the sale of High Tech Campus of EUR 37 million and lower stranded costs from the divestment of our Television business.matters.
Net operating capital decreased to negative EUR 4.53.7 billion, primarily relatedmainly due to an increase in payables and provisions due to legal and environmental matters.working capital.
Cash flows before financing activities improved from an outflow of EUR 1,1592,140 million in 20112013 to an outflow of EUR 842 million, mainly due1,586 million.
6.4.3 2016 and beyond
From an external financial reporting perspective, it should be noted that Royal Philips will introduce new segment reporting from Q1 2016 onwards. The current Innovation, Group & Services will be split and allocated to higher cash inflows from the salesegments of fixed assets.Royal Philips and Philips Lighting. The remaining unallocated corporate items will contain certain legacy items and separation costs. For more details on the new segment reporting in 2016 and onwards, please refer to the introduction of chapter 6, Sector performance, of this report.
Further updates will be provided in the course of 2016.
Annual Report 2013 1152015 87
6 Risk management 6 - 6.17
67 Risk management
6.17.1 Our approach to risk management and business control
The following section presents an overview of Philips’ approach to risk management and business controls and a description of the nature and the extent of its exposure to risks. Philips’ risk management focuses on the following risk categories: Strategic, Operational, Compliance and Financial risks. These categories are further described in section 6.2,7.2, Risk categories and factors, of this report. The risk overview highlights the main risks known to Philips, which could hinder it in achieving its strategic and financial business objectives. The risk overview may, however, not include all the risks that may ultimately affect Philips. Some risks not yet known to Philips, or currently believed not to be material, could ultimately have a major impact on Philips’ businesses, objectives, revenues, income, assets, liquidity or capital resources.
All oral and written forward-looking statements made on or after the date of this Annual Report and attributable to Philips are expressly qualified in their entirety by the factors described in the cautionary statement included in Forward-looking statements, of this report and the overview of risk factors described in section 6.2,7.2, Risk categories and factors, of this report.
Risk management and controls forms an integral part of the business planning and review cycle. The company’s risk and control policy is designed to provide reasonable assurance that objectives are met by integrating management control into the daily operations, by ensuring compliance with legal requirements and by safeguarding the integrity of the company’s financial reporting and its related disclosures. It makes management responsible for identifying the critical business risks and for the implementation of fit-for-purpose risk responses. Philips’ risk management approach is embedded in the areas of corporate governance, Philips Business Control Framework and Philips General Business Principles.
Corporate governance
Corporate governance is the system by which a company is directed and controlled. Philips believes that good corporate governance is a critical factor in achieving business success. Good corporate governance derives from, amongstamong other things, solid internal controls and high ethical standards.
The quality of Philips’ systems of business controls and the findings of internal and external audits are reported to and discussed by the Audit Committee of the Supervisory Board. Internal auditors monitor the quality of the business controls through risk-based operational audits, inspections of financial reporting controls and compliance audits. Audit & Risk committees at group level (Group, Finance Innovation and IT), at Global Market level and at SectorBusiness Group, Market and Function level (Healthcare, Lighting, Consumer Lifestyle) meet quarterly to address weaknesses in the business controls infrastructure as reported by internal and external auditors or revealed by self-assessment of management, and to take corrective action where necessary. These auditAudit & Risk committees are also involved in determining the desired company-wide internal audit planning as approved by the Audit Committee of the Supervisory Board. Whilst recognizing the responsibilities of the Audit Committee, the Supervisory Board also established the Quality and Regulatory Committee in 2015. The Q&R Committee assist the Supervisory Board in fulfilling its oversight responsibilities particularly in respect of the quality of the Company’s products, systems, services and software and the development, testing, manufacturing, marketing and servicing thereof, and regulatory requirements relating thereto. As such, the establishment of the Q&R Committee supports the Company’s risk management in the relevant risk areas. An in-depth description of Philips’ corporate governance structure can be found in chapter 10,11, Corporate governance, of this report.
Philips Business Control Framework
The Philips Business Control Framework (BCF) sets the standard for risk management and business control in Philips. The objectives of the BCF are to maintain integrated management control of the company’s operations, in order to ensure the integrity of the financial reporting, as well as compliance with laws and regulations. Philips is usinghas designed its BCF based on the “Internal Control-Integrated Framework (2013)” established by the Committee of Sponsoring Organizations of the Treadway Commission (COSO) framework on internal control (1992) as a basis for the BCF.. Philips continuously evaluates and improves BCF to align with business dynamics and good practice.
As part of the BCF, Philips has implemented a global standard for internal control over financial reporting (ICS). The ICS, together with Philips’ established accounting procedures, is designed to provide reasonable assurance that assets are safeguarded, that the books and records properly reflect transactions necessary to permit preparation of financial statements, that policies and procedures are carried out
116 Annual Report 2013
6 Risk management 6.1 - 6.1
by qualified personnel and that published financial statements are properly prepared and do not contain any material misstatements. ICS has been deployed in all mainmaterial reporting units, where business process owners perform an extensive number of controls, document the results each quarter, and take corrective action where necessary. ICS supports sectorbusiness and functional management in a quarterly cycle of assessment and monitoring of its control environment.
88 Annual Report 2015
Risk management 7.1
The findings of management’s evaluation are reported to the Executive Committee and the Supervisory Board quarterly.
As part of the Annual Report process, management’s accountability for business controls is enforced through the formal issuance of a Statement on Business Controls and a Letter of Representation by sectorBusiness Group, Market and functionalFunctional management to the Executive Committee. Any deficiencies noted in the design and operating effectiveness of controls over financial reporting which were not completely remediated are evaluated at year-end by the Executive Committee.Board of Management. The Executive Committee’sBoard of Management’s report, including its conclusions regarding the effectiveness of internal control over financial reporting, can be found in section 11.1,12.1, Management’s report on internal control, of this report.
Philips General Business Principles
The Philips General Business Principles (GBP) govern Philips’ business decisions and actions throughout the world, applying to corporate actions and the behavior of individual employees. They incorporate the fundamental principles withinfor all Philips businesses. They set the standard for doing business. The intention ofbusiness conduct, both for individual employees and for the company itself. They also provide a reference for the business conduct we expect from our business partners and suppliers. Translations are available in 32 languages, allowing almost every employee to read the GBP in their native language. Detailed underlying policies, manuals, training and tools are in place to give employees practical guidance on how to apply the GBP in their day-to-day work.
In addition, there are separate Codes of Ethics that apply to employees working in specific areas of our business, i.e. the Procurement Code of Ethics and the Financial Code of Ethics. Details can be found at: www.philips.com/gbp.
In a continued effort to raise GBP awareness and create engagement, every year a GBP communications and training plan is deployed. In 2015, over the course of several communication waves, employees were informed about a variety of GBP topics, the Philips Ethics Line, the Business Integrity Survey, and the deployment of e-learnings on the GBP and related legal compliance topics. The mandatory GBP e-learning, which was launched in October, has been sent to ensure complianceall employees with laws and regulations, as well as with Philips’ norms and values.a Philips e-mail account.
The GBP are available in most of the local languages and areform an integral part of the labor contracts in virtually all countries whereevery country in which Philips has business activities. Responsibility for compliance withoperates. It is the principles rests primarily with the managementresponsibility of each business. Every country organizationemployee to live up to our GBP, and each main production site has a compliance officer. All compliance officers operate under the supervision ofemployees are requested to state their commitment after having completed the GBP Review Committee. Confirmation of compliance withe-training. In addition, each year the GBP is an integral part ofrelevant employees are asked to sign off on the annual Statement on Business Controls that has to be issued by the management of each business unit. The GBP incorporate a whistleblower policy, standardized complaint reportingFinancial and a formal escalation procedure.
The Philips Ethics hotline seeks to ensure that alleged violations are registered and dealt with consistently within a company-wide system. To drive the practical deployment of the GBP, a set of directives has been published, which are applicable to all employees. There are also separate directives which apply to specific categories of employees (e.g. the Supply Management CodeCodes of Ethics, and Financial Code of Ethics, referall executives are asked to www.philips.com/gbp).
To seek to ensure compliance with the highest standards of transparency and accountability by all employees performing important financial functions, the Financial Code of Ethics contains, amongst other things, standards to promote honest and ethical conduct, as well as full, accurate and timely disclosure procedures in order to avoid conflicts of interest.
Both the Finance and Supply Management Code of Ethics are signedsign off on an annual basis by the relevant employees,General Business Principles to confirm their awareness of and compliance with the respective codes.
The GBP Review Committee is responsible for the effective deployment of the GBP. The GBP Review Committee is a virtual body chaired by the Chief Legal Officer, and its members include the Chief HR Officer, the Chief Market Leader and the Chief Financial Officer. They are supported by a secretariat and a network of GBP compliance Officers in all countries and at all major sites where Philips has operations. Related roles and responsibilities are laid down in the Charter of the GBP Review Committee. In December 2015 the GBP Review Committee adopted a revised charter. These revisions were deemed necessary in view of the external regulatory developments in business ethics and compliance and they have an impact on the composition of the GBP Review Committee, the roles and responsibilities of its members as well as the composition, roles and responsibilities of the GBP Compliance function. Deployment of this revised charter will follow in 2016.
The GBP are supported by mechanisms that ensure standardized reporting and escalation of concerns. These mechanisms are based on the GBP Reporting policy that urges employees to report any concerns they may have regarding business conduct in relation to the GBP either through a GBP Compliance Officer or through the Philips Ethics Line. The Philips Ethics Line enables employees and, as of March 2015, also third parties to report a concern either by telephone or online via a web intake form. All concerns raised are registered consistently in a single database and are investigated in accordance with standardized investigation procedures.
As part of the Philips Business Control Framework, a GBP self-assessment process is fully embedded in an automated workflow application, (ICS) supporting Sector, Market and functionalwhich helps management in monitoringto monitor the internal controls, as described undercontrols. With the Philips Business Control Framework. Embedding GBP self-assessments inself-assessment forming part of ICS, seeks to ensure that GBP compliance is nownecessarily forms part of Sector, Market and functional management’s quarterly ICS/SOx (Sarbanes-Oxley) monitoring process,process. Management of each business unit signs off on compliance with the GBP, with this confirmation forming part of the annual Statement on Business Controls. Non-compliance issues are highlighted and, that GBP non-compliance issues, if significant, they are reported to the Board of Management/Executive Committee viathrough the Quarterly Certification Statement process.
In June 2013, as part ofThe results from the global GBP communications campaign, a business integrity survey was rolled out to all employees to obtain their input on the effectiveness of our GBP program. The insightsmonitoring facilities that were derived from this survey were used to further enhance the effectiveness of the current compliance activities as well as the compliance road map. The business integrity survey also provided the kickoff for a global GBP communications campaign, culminatingare in a global event called the ‘GBP dialogue week’ held in October 2013, in which managers were invited to hold sessions with their teams to discuss GBP in relation to their function or business.
Mandatory web-based GBP training, which is designed to reinforce awareness of the need for compliance with the GBP, is available in 23 languages. Every quarter, all new employeesplace are invited to take this training in their
Annual Report 2013 117
6 Risk management 6.1 - 6.1
local language. In 2013, targeted audiences participated in a web-based training focusing on specific topics, including anti-bribery, antitrust, privacy and export controls.
In 2013, we introduced a mandatory sign-off on GBP for all executives.
For further details, please refer to the General Business Principles paragraphgiven in chapter 13,14, Sustainability statements, of this report.
Financial Code of Ethics
The Company recognizes that its businesses have responsibilities within the communities in which they operate. The Company has a Financial Code of Ethics which applies to the CEO (the principal executive officer) and CFO (the principal financial and principal accounting officer), and to the heads ofsenior management in the Group Control, Group Treasury, Group Fiscal and Group Internal AuditPhilips Finance Leadership Team who head the Finance departments of the Company. The Company
Annual Report 2015 89
Risk management 7.1
has published its Financial Code of Ethics within the investor section of its website located at www.philips.com. No changes were considered necessary and no changes have been made to the Financial Code of Ethics since its adoption and no waivers have been granted therefrom to the officers mentioned above in 2013.2015.
For more information, please refer to sub-section 5.2.7, General Business Principles, of this report.
11890 Annual Report 20132015
6 Risk management 6.2 - 6.27.2
6.27.2 Risk categories and factors
Risks categories
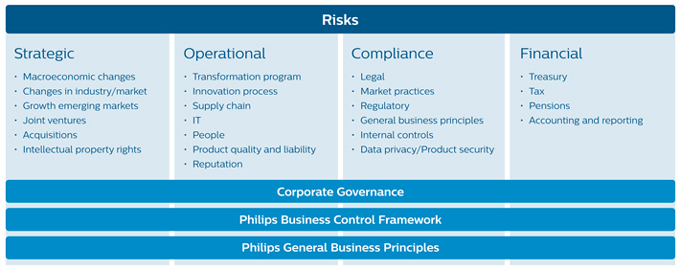
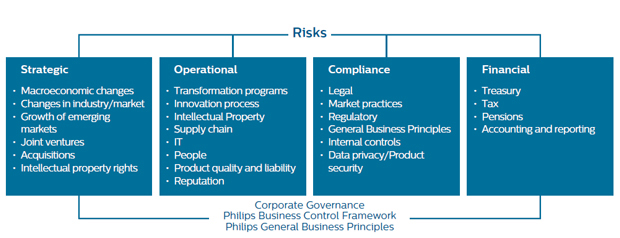
Taking risks is an inherent part of entrepreneurial behavior. A structured risk management process allows management to take risks in a controlled manner. In order to provide a comprehensive view of Philips’ business activities, risks and opportunities are identified in a structured way combining elements of a top-down and bottom-up approach. Risks are reported on a regular basis as part of the ‘Business Performance Management’ process. All relevant risks and opportunities are prioritized in terms of impact and likelihood, considering quantitative and/or qualitative aspects. The bottom-up identification and prioritization process is supported by workshops with the respective management at Sector,Business, Market and Group Function level. During 2015, several risk management workshops were held. The top-down element allows potential new risks and opportunities to be discussed at management level and included in the subsequent reporting process, if found to be applicable. Reported risks and opportunities are analyzed for potential cumulative effects and are aggregated at Sector,Business, Market and Group level. In line with the above, amongst others, the following actions were performed during 2015:
In 2015 the Supervisory Board established the Quality and Regulatory Committee. The establishment of the Q&R Committee further strengthens Philips’ risk management efforts in respect of the quality of Philips’ products, systems, services and software and the development, testing, manufacturing, marketing and servicing thereof.
As per February 2015, Philips acquired 100% of US-based Volcano Corporation. Similarly, in the second half of 2014 the Philips acquired 51% of Saudi-based General Lighting Company (GLC). Philips successfully integrated Volcano and GLC into the Philips Business Control Framework in the course of 2015.
As a next phase in the Accelerate! program, Philips announced in 2014 its plan to establish two stand-alone companies focused on the HealthTech and the Lighting opportunities respectively. The separation risk was described as from 2014 (refer to section 7.7, Separation risk, of this report) and in 2015 we have paid particular attention to risks related to the separation as this is a very complex process.
Philips had substantial defined benefit pension plans which carry financial risk. During 2015 the Company further de-risked pension exposure by means of settling the Dutch, UK and (partly) US defined benefit pension plans.
The challenging global economic developments had an impact on our results. Even though the managing of risks related to these developments did not change compared to 2014, we continuously monitor the impact on our risk profile.
Philips has a structured risk management process to address different risk categories: Strategic, Operational, Compliance and Financial risks. Risk appetite is different for the various risk categories:
Strategic risks and opportunities may affect Philips’ strategic ambitions. Strategic risks include economic and political developments and anticipating and timely responding to market circumstances. Philips is prepared to take considerable strategic risks given the necessity to invest in research & development and manage the portfolio of businesses, including acquisitions and divestments, in a highly uncertain global political and economic environment.
Operational risks include adverse unexpected developments resulting from internal processes, people and systems, or from external events that are linked to the actual running of each business (examples are solution and product creation, and supply chain management). Philips aims to minimize downside risks due to the need for high quality of its products and services, reliable IT systems and sustainability commitments.
Compliance risks cover unanticipated failures to implement, or comply with, appropriate laws, regulations, policies and procedures. Philips has a zero tolerance policy towards non-compliance in relation to breaches of its GBP.
Within the area of Financial risks, Philips identifies risks related to Treasury, Accounting and reporting, Pensions and Tax. Philips does not classify these risk categories in order of importance. Separation risk is
Annual Report 2015 91
Risk management 7.2
| covered in section 7.7, Separation risk, of this report. Philips is prudent with regard to financial risks and the risk appetite is embedded in various chapters of this annual report, including note 31, Details of treasury / other financial risks. |
Philips describes the risk factors within each risk category in order of Philips’ current view of expected significance, to give stakeholders an insight into which risks and opportunities it considers more prominent than others at present. The risk overview highlights the main risks and opportunities known to Philips, which could hinder it in achieving its strategic and financial business objectives. The risk overview may, however, not include all the risks that may ultimately affect Philips. Describing risk factors in their order of expected significance within each risk category does not mean that a lower listed risk factor may not have a material and adverse impact on Philips’ business, strategic objectives, revenues, income, assets, liquidity, capital resources or achievement of Philips’ 2016 goals. Furthermore, a risk factor described after other risk factors may ultimately prove to have more significant adverse consequences than those other risk factors. Over time Philips may change its view as to the relative significance of each risk factor.
Annual Report 2013 119
6 Risk management 6.3 - 6.3
6.37.3 Strategic risks
As Philips’ business is global, its operations are exposed to economic and political developments in countries across the world that could adversely impact its revenues and income.
Philips’ business environment is influenced by political and economic conditions in the domestic and global economies. Continued concerns aboutmarkets. Philips experienced the macroeconomic environment has shown its impact on global markets during 2013. Towards the end of 2013 the macroeconomic environment seemed to tilt towards a more positive outlook, however with substantial differences between geographical areas. Anticipatedfrom changes in US monetary policymacro-economic development in various geographies during 20132015 in particular in China where economic growth was at the lowest level in the last 25 years. This has triggered interventions by the Chinese government on the official exchange rate of the Chinese Renminbi. Also the economic growth of countries highly dependent on revenues from energy, raw materials and commodities has been adversely affected by the slowdown of growth in China, most strongly in emerging market countries. Monetary interventions by the European Central Bank have not yet resulted in a significant negative impact on foreign currency ratesan increase of inflation nor in a number of emerging markets, highlighting fiscal problems and otherstronger economic vulnerabilitiesgrowth in these countries.the European Union. The disparate macroeconomic outlook for the main geographies, political conflicts and the potentialunknown impact of further changes in fiscal andEurozone monetary policy continues to provide uncertainty on the levels of capital expenditures in general, unemployment levels and consumer and business confidence, which could adversely affect demand for products and services offered by Philips. Political developments, such as healthcare reformsThese economic conditions may have an adverse effect on financial markets which could affect the ability of Philips to sell off strategic divestments at reasonable price levels or within a reasonable period of time.
The general global political environment remains unfavorable for the business environment due to a rise in various countries may impose additional uncertainties by redistributing sector spending, changing reimbursement modelspolitical conflicts and fiscal changes.
terrorism. Numerous other factors, such as the fluctuationsustained lower levels of energy and raw material prices, regional political conflicts in the Middle East, Russia and Ukraine and other regions, as well as global political conflicts in North Africa, the Middle Eastlarge-scale (in)voluntary migration and other regions,profound social instability could continue to impact macroeconomic factors and the international capital and credit markets. Economic growth and the business environment in the European Union may be adversely affected by potential exits from the Eurozone (Greece), exits from the European Union (Great Britain) or secession of regions from European countries (e.g. Cataluña and Scotland). Economic and political uncertainty may have a material adverse impact on Philips’ financial condition or results of operations and can also make it more difficult for Philips to budget and forecast accurately. Philips may encounter difficulty in planning and managing operations due to the lack of adequate infrastructure and unfavorable political factors, including unexpected legal or regulatory changes such as foreign exchange import or export controls, increased healthcare regulation, nationalization of assets or restrictions on the repatriation of returns from foreign investments. Given that growth geographies are becoming increasingly important in Philips’ operations, the above-mentioned risks are also expected to grow and could have a material adverse effect on Philips’ financial condition and operating results.
Philips may be unable to adapt swiftly to changes in industry or market circumstances, which could have a material adverse impact on its financial condition and results.
Fundamental shifts in the industry, like the transition from traditional lighting to LED lighting, may drastically change the business environment. If Philips is unable to recognize these changes in good time, is late in adjusting its business models, or if circumstances arise such as pricing actions by competitors, then this could have a material adverse effect on Philips’ growth ambitions, financial condition and operating result.
Philips’ overall performance in the coming years is dependent on realizing its growth ambitions in growth geographies.
Growth geographies are becoming increasingly important in the global market. In addition, Asia is an important production, sourcing and design center for Philips. Philips faces strong competition to attract the best talent in tight labor markets and intense competition from local companies as well as other global players for market share in growth geographies. Philips needs to maintain and grow its position in growth geographies, invest in local talents, understand developments in end-user preferences and localize the portfolio in order to stay competitive. If Philips fails to achieve this, then this could have a material adverse effect on growth ambitions, financial condition and operating result.
92 Annual Report 2015
Risk management 7.3
The growth ambitions of Philips may be adversely affected by economic volatility inherent in growth geographies and the impact of changes in macroeconomic circumstances on growth economies.
Philips may not control joint ventures or associated companies in which it invests, which could limit the ability of Philips to identify and manage risks.
Philips has invested or will invest in joint ventures orand associated companies in which Philips will have a non-controlling interest. In these cases, , Philips has limited influence over, and limited or no control of, the governance, performance and cost of operations of joint ventures orand associated companies. Some of these joint ventures orand associated companies may represent significant investments. The joint ventures and associated companies that Philips does not control may make business, financial or investment decisions contrary to Philips’ interests or decisions different from those, which Philips itself may have made. Additionally, Philips partners or members of a joint venture or associated company may not be able to meet their financial or other obligations, which could
120 Annual Report 2013
6 Risk management 6.3 - 6.4
expose Philips to additional financial or other obligations, as well as have a material adverse effect on the value of its investments in those entities or potentially subject Philips to additional claims.
Acquisitions could expose Philips to integration risks and challenge management in continuing to reduce the complexity of the company.
Philips’ acquisitions may continue to expose Philips in the future to integration risks in areas such as sales and service force integration, logistics, regulatory compliance, information technology and finance. Integration difficulties and complexity may adversely impact the realization of an increased contribution from acquisitions. Philips may incur significant acquisition, administrative and other costs in connection with these transactions, including costs related to the integration of acquired businesses.
Furthermore, organizational simplification and resulting cost savings may be difficult to achieve. Acquisitions may also lead to a substantial increase in long-lived assets, including goodwill. Write-downs of these assets due to unforeseen business developments may have a material adverse effect on Philips’ earnings, particularly in Healthcare and Lighting, which have significant amounts of goodwill (see also note 11, Goodwill).
Philips’ inability to secure and retain intellectual property rights for products, whilst maintaining overall competitiveness, could have a material adverse effect on its results.
Philips is dependent on its ability to obtain and retain licenses and other intellectual property (IP) rights covering its products and its design and manufacturing processes. The IP portfolio is the result of an extensive patenting process that could be influenced by a number of factors, including innovation. The value of the IP portfolio is dependent on the successful promotion and market acceptance of standards developed or co-developed by Philips. This is particularly applicable to Consumer Lifestyle where third-party licenses are important and a loss or impairment could have a material adverse impact on Philips’ financial condition and operating results.
6.47.4 Operational risks
Failure to deliver on the objectives of the transformation programs.Transformation programs
In 2011 Philips started a very extensive transformation program (Accelerate!) to unlock Philips’ full potential. Accelerate! spans a time period of several years. In 2014 as a next phase in the Accelerate! transformation program Philips announced its plan to sharpen its strategic focus by establishing two stand-alone companies focused on the HealthTech and Lighting opportunities respectively. Failure to achieve the objectives of the transformation programs may have a material adverse effect on the midmid-term and long termlong-term financial targets.
In addition, the transformation program of the Finance function may expose Philips to adverse changes in the quality of its systems of internal control.
Failure to achieve improvements in Philips’ solution and product creation process and/or increased speed in innovation-to-market could hamper Philips’ profitable growth ambitions.
Further improvements in Philips’ solution and product creation process, ensuring timely delivery of new solutions and products at lower cost and upgrading of customer service levels to create sustainable competitive advantage, are important in realizing Philips’ profitable growth ambitions. The emergence of new low-cost competitors, particularly in Asia, further underlines the importance of improvements in the product creation process. The success of new solution and product creation, however, depends on a number of factors, including timely and successful completion of development efforts, market acceptance, Philips’ ability to manage the risks associated with new products and production ramp-up issues, the ability of Philips to attract and retain employees with the appropriate skills, the availability of products in the right quantities and at appropriate costs to meet anticipated demand and the risk that new products and services may have quality or other defects in the early stages of introduction. Accordingly, Philips cannot determine in advance the ultimate effect that new solutions and product creations will have on its financial condition and operating results. If Philips fails to accelerate its innovation-to-market processes and fails to ensure that end-user insights are fully captured and translated into solution and product creations that improve product mix and consequently contribution, it
Annual Report 2015 93
Risk management 7.4
may face an erosion of its market share and competitiveness, which could have a material adverse effect on its financial condition and operating results.
Risk of unauthorized use of intellectual property rights
Annual Report 2013 121
6 Risk management 6.4 - 6.4
Philips produces and sells products and services which incorporates technology protected by intellectual property rights. Philips develops and acquires intellectual property rights on regular basis. Philips is exposed to the risk that intellectual property rights on technology applied in its products and services is claimed to be owned by third parties, who, in case their claims of infringement of such intellectual property rights are awarded, would be entitled to damages and fines.
If Philips is unable to ensure effective supply chain management, e.g. facing an interruption of its supply chain, including the inability of third parties to deliver parts, components and services on time, and if it is subject to rising raw material prices, it may be unable to sustain its competitiveness in its markets.
Philips is continuing the process of creating a leaner supply base with fewer suppliers, while maintaining dual / multiple sourcing strategies where possible. This strategy very much requires close cooperation with suppliers to enhance, amongstamong other things, time to market and quality. In addition, Philips is continuing its initiatives to reduce assets through outsourcing. These processes may result in increased dependency on external suppliers and providers. Although Philips works closely with its suppliers to avoid supply-related problems, there can be no assurance that it will not encounter supply problems in the future or that it will be able to timely replace a supplier that is not able to meet its demand.
Shortages or delays could materially harm its business.
Most of Philips’ activities are conducted outside of the Netherlands, and international operations bring challenges. For example, production and procurement of products and parts in Asian countries are increasing, and this creates a risk that production and shipping of products and parts could be interrupted by regional conflicts or a natural disaster, such as occurred in Japan in 2011.disaster. A general shortage of materials, components or subcomponents as a result of natural disasters also bears the risk of unforeseeable fluctuations in prices and demand, which could have a material adverse effect on its financial condition and operating results.
SectorsBusinesses purchase raw materials including so-calledso called rare earth metals, copper, steel, aluminum, noble gases and oil,oil-related products, which exposes them to fluctuations in energy and raw material prices. In recent times, commodities have been subject to volatile markets and such volatility is expected to continue. If we arePhilips is not able to compensate for our increased costs or pass them on to customers, price increases could have a material adverse impact on Philips’ results. In contrast, in times of falling commodity prices, Philips may not fully profitbenefit from such price decreases as Philips attempts to reduce the risk of rising commodity prices by several means, such as including long-term contracting or physical and financial hedging. In addition to the price pressure that Philips may face from our customers expecting to benefit from falling commodity prices or adverse market conditions, this could also adversely affect its financial condition and operating results.
Diversity in information technology (IT) could result in ineffective or inefficient business management. IT outsourcing and off-shoring strategies could result in complexities in service delivery and contract management.
Philips is engaged in a continuous drive to create a more open, standardized and consequently, more cost-effective IT landscape. This is leading to an approach involving further outsourcing, off-shoring, commoditization and ongoing reduction in the number of IT systems. This could introduce additional risk with regard to the delivery of IT services, the availability of IT systems and the scope and nature of the functionality offered by IT systems.
Philips observes a global increase in IT security threats and higher levels of sophistication in computer crime, posing a risk to the confidentiality, availability and integrity of data and information.
The global increase in security threats and higher levels of professionalism in computer crime have increased the importance of effective IT security measures, including proper identity management processes to protect against unauthorized systems access. Nevertheless, Philips’ systems, networks, products, solutions and services remain potentially vulnerable to attacks, which could potentially lead to the leakage of confidential information, improper use of its systems and networks or defective products, which could in turn materially adversely affect Philips’ financial condition and operating results. In recent years, the risks that we and other companies face from cyber-attacks have increased significantly. The objectives of these cyber-attacks vary widely and may include, among things, disruptions of operations including provision of services to customers or theft of intellectual property or other sensitive information belonging to us or other business partners. Successful cyber-attacks may result in substantial costs and other negative consequences, which may include, but are not limited to, lost revenues, reputational damage, remediation costs, and other
94 Annual Report 2015
Risk management 7.4
liabilities to customers and partners. Furthermore, enhanced protection measures can involve significant costs. Although we have experienced cyber-attacks but to date have not incurred any significant damage as a result and did not incur significant monetary cost in taking corrective action, there can be no assurance that in the future Philips will be as successful in avoiding damages from cyber-attacks. Additionally, the integration of new companies and successful outsourcing of business processes are highly dependent on secure and well controlled IT systems.
122 Annual Report 2013
6 Risk management 6.4 - 6.5
Due to the fact that Philips is dependent on its personnel for leadership and specialized skills, the loss of its ability to attract and retain such personnel would have an adverse effect on its business.
The attraction and retention of talented employees in sales and marketing, research and development, finance and general management, as well as of highly specialized technical personnel, especially in transferring technologies to low-cost countries, is critical to Philips’ success. This is particularly valid in times of economic recovery. The loss of specialized skills could also result in business interruptions. There can be no assurance that Philips will continue to be successful in attracting and retaining all the highly qualified employees and key personnel needed in the future.
Warranty and product liability claims against Philips could cause Philips to incur significant costs and affect Philips’ results as well as its reputation and relationships with key customers.
Philips is from time to time subject to warranty and product liability claims with regard to product performance and effects. Philips could incur product liability losses as a result of repair and replacement costs in response to customer complaints or in connection with the resolution of contemplated or actual legal proceedings relating to such claims. In addition to potential losses arising from claims and related legal proceedings, product liability claims could affect Philips’ reputation and its relationships with key customers (both customers for end products and customers that use Philips’ products in their production process). As a result, product liability claims could materially impact Philips’ financial condition and operating results.
Any damage to Philips’ reputation could have an adverse effect on its businesses.
Philips is exposed to developments which could affect its reputation. Such developments could be of an environmental or social nature, or connected to the behavior of individual employees or suppliers and could relate to adherence to regulations related to labor, health and safety, environmental and chemical management. Reputational damage could materially impact Philips’ financial condition and operating results.
6.57.5 Compliance risks
Legal proceedings covering a range of matters are pending in various jurisdictions against Philips and its current and former group companies. Due to the uncertainty inherent in legal proceedings, it is difficult to predict the final outcome.
Philips, including a certain number of its current and former group companies, is involved in legal proceedings relating to such matters as competition issues, commercial transactions, product liability, participations and environmental pollution. Since the ultimate outcome of asserted claims and proceedings, or the impact of any claims that may be asserted in the future, cannot be predicted with certainty, Philips’ financial position and results of operations could be affected materially by adverse outcomes.
Please refer to note 26, Contingent assets and liabilities, for additional disclosure relating to specific legal proceedings.
Philips is exposed to governmental investigations and legal proceedings with regard to possible anti-competitive market practices.
Philips is facing increased scrutiny by national and European authorities of possible anti-competitive market practices. For example, Philips is one of the companies that were inspected by officials of the European Commission in December 2013. The European Commission is looking into potential restrictions on online sales of consumer electronic products and small domestic appliances. Philips is fully cooperating with the European Commission. Philips’ financial position and results could be materially affected by an adverse final outcome of governmental investigations and litigation, as well as any potential related claims.
Philips’ global presence exposes the company to regional and local regulatory rules, changes to which may affect the realization of business opportunities and investments in the countries in which Philips operates.
Philips has established subsidiaries in over 80 countries. These subsidiaries are exposed to changes in governmental regulations and unfavorable political developments, which may affect the realization of business opportunities or impair Philips’ local investments. Philips’ increased focus on the healthcare sector increases its exposure to highly regulated markets, where obtaining clearances or approvals for new products is of great importance, and where there is
Annual Report 2013 123
6 Risk management 6.5 - 6.5
a dependency on the available funding for healthcare systems. In addition, changes in reimbursement policies may affect spending on healthcare.
Philips is exposed to non-compliance with General Business Principles.
Philips’ attempts to realize its growth ambitions could expose it to the risk of non-compliance with the Philips General Business Principles, such as anti-bribery provisions. This risk is heightened in growth geographies as the legal and regulatory environment is less developed in growth geographies compared to mature geographies.
Annual Report 2015 95
Risk management 7.5
Examples include commission payments to third parties, remuneration payments to agents, distributors, consultants and the like, and the acceptance of gifts, which may be considered in some markets to be normal local business practice.practice (See also note 26, Contingent assets and liabilities.)liabilities).
Defective internal controls would adversely affect our financial reporting and management process.
The reliability of reporting is important in ensuring that management decisions for steering the businesses and managing both top-line and bottom-line growth are based on top-quality data. Flaws in internal control systems could adversely affect the financial position and results and hamper expected growth.
The correctness of disclosures provides investors and other market professionals with significant information for a better understanding of Philips’ businesses. Imperfections or lack of clarity in the disclosures could create market uncertainty regarding the reliability of the data presented and could have a negative impact on the Philips share price.
The reliability of revenue and expenditure data is key for steering the business and for managing top-line and bottom-line growth. The long lifecycle of healthcare sales, from order acceptance to accepted installation, together with the complexity of the accounting rules for when revenue can be recognized in the accounts, presents a challenge in terms of ensuring there is consistency of application of the accounting rules throughout Philips Healthcare’s global business.
Philips is exposed to non-compliance with data privacy and product safety laws.
Philips’ brand image and reputation would be adversely impacted by non-compliance with various data protection and product securitysafety laws. In light of PhilipsPhilips’ digital strategy, data privacy laws are increasingly important. Also, Philips Healthcare is subject to various (patient) data protection and safety laws. In Philips Healthcare, privacy and product safety and security issues may arise, especially with respect to remote access or monitoring of patient data or loss of data on our customers’ systems. Philips is exposed to the risk that its products, including components or materials procured from suppliers, may prove to be not compliant with safety laws, e.g. chemical safety regulations. Such non-compliance could result in a ban on the sale or use of these products.
Philips operates in a highly regulated product safety and quality environment. Philips’ products are subject to regulation by various government agencies, including the FDA (US) and comparable foreign agencies. Obtaining their approval is costly and time consuming, but a prerequisite for market introduction. A delay or inability to obtain the necessary regulatory approvals for new products could have a material adverse effect on business. The risk exists that product safety incidents or user concerns could trigger FDA business reviews which, if failed, could lead to business interruption which in turn could adversely affect Philips’ financial condition and operating results. E.g. the voluntary, temporary suspension in 2014 of new production at our Healthcare facility in Cleveland, Ohio targetstargeted to further strengthen manufacturing process controls after certain issues in this area were identified during an ongoing FDA inspection.
124 Annual Report 2013
6 Risk management 6.6 - 6.6
6.67.6 Financial risks
Philips is exposed to a variety of treasury risks and other financial risks including liquidity risk, currency risk, interest rate risk, commodity price risk, credit risk, country risk and other insurable risk.
Negative developments impacting the global liquidity markets could affect the ability of Philips to raise or re-financerefinance debt in the capital markets or could lead to significant increases in the cost of such borrowing in the future. If the markets expect a downgrade or downgrades by the rating agencies or if such a downgrade has actually taken place, it could increase the cost of borrowing, reduce our potential investor base and adversely affect our business.
Philips isoperates in approximately 100 countries and its earnings are therefore inevitably exposed to fluctuations in exchange rates especially betweenof foreign currencies against the euro. Philips’ sales are sensitive in particular to movements in the US dollar, Japanese yen and the euro. A high percentage of its business volume is conducted in the US but based on exports from Europe, whilst, a considerable amount of US dollar—denominated imports is also sold in Europe. A weakening of the US dollar versus the euro would have an adverse effect on reported earnings of the company. In addition, Philips is exposed to the fluctuation in exchange rateswide range of other currencies from developed and emerging markets. However, Philips’ sourcing and manufacturing spend is concentrated in the Eurozone, United States and China. Therefore the net (revenues less spend) sensitivity of Income from Operations to US dollar and Chinese renminbi is relatively small. Income from Operations is sensitive to movements in currencies from countries where the Group has none or small manufacturing/sourcing activity such as the Japanese yenJapan and currenciesa range of growth geographiesemerging markets such as China,Russia, Korea, Indonesia, India and Brazil.
The credit risk of financial and non-financial counterparties with outstanding payment obligations creates exposures for Philips, particularly in relation to accounts receivable with customers and liquid assets and fair values of derivatives and insurance receivables contracts with financial counterparties. A default by counterparties in such transactions can have a material adverse effect on Philips’ financial condition and operating results.
Philips’ supply chain is exposed to fluctuations in energy and raw material prices. Commodities such as oil are subject to volatile markets and significant price increases from time to time. If Philips is not able to compensate for, or timely pass on, its increased costs to customers, such price increases could have an adverse impact on its financial condition and operating results.
96 Annual Report 2015
Risk management 7.6
Philips is exposed to interest rate risk, particularly in relation to its long-term debt position; this risk can take the form of either fair value or cash flow risk. Failure to effectively hedge this risk can impact Philips’ financial condition and operating results.
For further analysis, please refer to note 35,31, Details of treasury / other financial risks.
Philips is exposed to a number of different fiscal uncertainties which could have a significant impact on local tax results.
Philips is exposed to a number of different tax uncertainties which could result in double taxation, penalties and interest payments. These include transfer pricing uncertainties on internal cross-border deliveries of goods and services, tax uncertainties related to acquisitions and divestments, tax uncertainties related to the use of tax credits and permanent establishments, tax uncertainties due to losses carried forward and tax credits carried forward and potential changes in tax law that could result in higher tax expense and payments. Those uncertainties may have a significant impact on local tax, results which in turn could adversely affect Philips’ financial condition and operating results.
The value of the losses carried forward is subject to having sufficient taxable income available within the loss-carried-forwardloss-carry-forward period, but also to having sufficient taxable income within the foreseeable future in the case of losses carried forward with an indefinite carry-forward period. The ultimate realization of the Company’s deferred tax assets, including tax losses and credits carried forward, is dependent upon the generation of future taxable income in the countries where the temporary differences, unused tax losses and unused tax credits were incurred and during the periods in which the deferred tax assets become deductible. Additionally, in certain instances, realization of such deferred tax assets is dependent upon the successful execution of tax planning strategies. Accordingly, there can be no absolute assurance that all (net) tax losses and credits carried forward will be realized.
For further details, please refer to the fiscaltax risks paragraph in note 5,8, Income taxes.
Philips is exposed to uncertainty on the timing and proceeds of a sale of Lumileds.
On January 22, 2016 Philips announced the termination of its agreement with GO Scale Capital to sell a stake of 80.1% in Lumileds due to the inability to mitigate regulatory concerns in the US. Philips is engaging with other parties that have expressed an interest in the Lumileds business. Adverse market conditions during the bidding and sale process and regulatory restrictions may have an adverse effect on the timing of a sale transaction and the potential proceeds from such a transaction. Prolonged adverse conditions could trigger a requirement to no longer classify Lumileds as being held for sale and being reported as discontinued operations. This would have a material impact on the balance sheet and Adjusted IFO as reported by Royal Philips.
Philips has defined-benefit pension plans and other post-retirement plans in a number of countries. The funded status and the cost of maintaining these plans are influenced by movements in financial market and demographic developments, creating volatility in Philips’ financials.
A significant proportion of (former) employees in Europe and North and Latin America is covered by defined-benefit pension plans and other post-retirement plans. The accounting for defined-benefit pensionsuch plans requires management to make estimates on assumptions such as discount rates, inflation, longevity, expected cost of medical care and expected rates of compensation. Movements (e.g. due to the movements of financial markets) in these assumptions
Annual Report 2013 125
6 Risk management 6.6 - 6.6
can have a significant impact on the Defined Benefit Obligation and pensionnet interest cost. A negative performance of the financial markets could have a material impact on cash funding requirements and pension costsnet interest cost and also affect the value of certain financial assets and liabilities of the company.
For further details, please see note 30, Post-employment benefits and note 36, Subsequent events.
Philips is exposed to a number of reporting risks.
A risk rating is assigned for each risk identified, based on the likelihood of occurrence and the potential impact of the risk on the financial statements and related disclosures. In determining the probability that a risk will result in a misstatement of a more than inconsequential amount or material nature, the following factors are considered to be critical: complexity of the associated accounting activity or transaction process, history of accounting and reporting errors, likelihood of significant (contingent) liabilities arising from activities, exposure to losses, existence of a related party transaction, volume of activity and homogeneity of the individual transactions processed and changes to the prior period in accounting characteristics compared to the previous period.
ImportantFor important critical reporting risk areas identified within Philips followingwe refer to the “Use of estimates” section in note 1, Significant accounting policies, as the Company assessed that reporting risk assessment are:is closely related to the use of estimates and application of judgment.
7.7 Separation risk
Philips is exposed to risks associated with the separation of its Lighting business.
In September 2014 Philips announced its plan to sharpen its strategic focus by establishing two stand-alone companies focused on HealthTech and Lighting opportunities respectively. This is a complex process which involves certain risks to Philips. Although a stand-alone structure for Philips Lighting was established on February 1, 2016, there are still a number of important
complex accountingAnnual Report 2015 97
Risk management 7.7
milestones to be completed in the separation process. Philips is reviewing all strategic options for sales-related accruals, warranty provisions, taxPhilips Lighting, including public offerings of ownership stakes and a private sale. The completion could take more time than originally planned or anticipated. There is no certainty as to the method or timing of the separation, which may expose Philips to risks regarding the proceeds from a sale of Philips Lighting, additional costs and other adverse consequences.
The separation into Royal Philips and Philips Lighting is unlike divestments or carve out transactions that Philips has implemented in the past, which affected very specific parts of the business of Philips. The separation impacts all businesses and markets as well as all supporting functions and all assets and liabilities pension benefits,of the Group and will continue to require complex and time consuming disentanglement efforts.
The design and execution of the separation requires the devotion of substantial time and attention from management and staff. Although Philips has set-up a dedicated senior project team to work on a successful separation, the separation efforts could distract from and have an adverse effect on the conduct of normal business combinations
complex sales transactions relating to multi-element deliveries (combinationand our strategy. The separation could increase the likelihood of goodsoccurrence and/or potential impact of the risks as described in section 7.2, Risk categories and services)
valuation procedures with respect to assets (including goodwill and inventories)
significant (contingent) liabilitiesfactors, of this report, such as environmental claimsstrategic risks (e.g. insufficient integration of acquisitions), operational risks (e.g. delays in innovation-to-market), compliance risk (e.g. ineffective internal controls) and financial risks (e.g. reporting risks).
The design and execution of the separation will involve and depend on support from external legal, tax, financial and other litigation
outsourcingprofessional consultants and as a result Philips will incur substantial cost. The separation could take more time than originally anticipated, which may expose Philips to risks of high volume/homogeneous transactional financeadditional cost and IT operationsother adverse consequences.
The separation of businesses, assets, liabilities, contractual or contingent rights and obligations and legal entities may require Philips to third-party service providersrecognize expenses and/or incur financial payments, which otherwise would not have been incurred.
employee post-retirementWhile it is the firm intention to complete the separation, Philips has reserved the right not to proceed with the separation if it determines that it would be in the Company’s interest not to do so. If it does proceed with the separation, no assurances can be given that the separation will ultimately lead to the increased benefits (as described separately)contemplated by Philips currently.
12698 Annual Report 20132015
7 Management 7 - 78
78 Management
Koninklijke Philips N.V. is managed by an Executive Committee which comprises the members of the Board of Management and certain key officers from functions, businesses and markets.
The Executive Committee operates under the chairmanship of the Chief Executive Officer and shares responsibility for the deployment of Philips’ strategy and policies, and the achievement of its objectives and results.
In September 2014 Philips announced its plan to sharpen its strategic focus by establishing two stand-alone companies focused on the HealthTech and Lighting opportunities respectively. Early 2016, a stand-alone structure for Philips Lighting was established, within the Royal Philips Group. Until the right strategic option for its future is identified and executed, the Royal Philips Executive Committee will, under the supervision of the Supervisory Board, continue to oversee the Philips Lighting business.
Under Dutch Law, the Board of Management is accountable for the actions and decisions of the Executive Committee and has ultimate responsibility for the management and external reporting of Koninklijke Philips N.V. and is answerable to shareholders at the Annual General Meeting of Shareholders. Pursuant to the two-tier corporate structure, the Board of Management is accountable for its performance to a separate and independent Supervisory Board.
The Rules of Procedure of the Board of Management and Executive Committee are published on the Company’s website ((www.philips.com/investor)investor).
Corporate governance
A full description of the Company’s corporate governance structure is published in chapter 10,11, Corporate governance, of this report.

Frans van Houten
Born 1960, Dutch
President/Chief Executive Officer (CEO)
Chairman of the Board of Management since April 2011
CorporateGroup responsibilities: Chairman of the Executive Committee,
Health Systems, Internal
Audit, Information Technology,
Supply Management, MarketingInnovation &
Communication, Strategy, Sustainability, Accelerate! -
Overall transformation, End2End, Quality and Regulatory Compliance

Abhijit Bhattacharya
Born 1960, Dutch
Eric Coutinho
Executive Vice President, General Secretary & Chief Legal Officer
Corporate responsibilities: Legal, General Business Principles
Born 1951, Dutch
Ronald de Jong1961, Indian
Executive Vice President & Chief Market Leader
Corporate responsibilities: Markets, Areas & Countries (except Greater
China), Accelerate! - Customer Centricity
Born 1967, Dutch
Pieter Nota
Executive Vice President & Chief Executive Officer of Philips Consumer Lifestyle
Member of the Board of Management since April 2011
Corporate responsibilities: Sector Consumer Lifestyle, Accelerate! -
Resource to Win
Born 1964, Dutch
Carole Wainaina
Executive Vice President & Chief Human Resources Officer
Corporate responsibilities: Human Resource Management, Accelerate! -
Culture and change management
Born 1966, Kenyan
Jim Andrew
Executive Vice President & Chief Strategy and Innovation Officer
Corporate responsibilities: Strategy, Innovation, Design, Sustainability
Born 1962, American
Deborah DiSanzo
Executive Vice President & Chief Executive Officer of Philips Healthcare
Corporate responsibilities: Sector Healthcare
Born 1960, American
Patrick Kung
Executive Vice President & Chief Executive Officer Philips Greater China
Corporate responsibilities: Philips Greater China
Born 1951, American
Eric Rondolat
Executive Vice President & Chief Executive Officer Philips Lighting
Corporate responsibilities: Sector Lighting
Born 1966, Italian/French
Ron Wirahadiraksa
Executive Vice President & Chief Financial Officer (CFO)
Member of the Board of Management since April 2011December 2015
CorporateGroup responsibilities: Finance, Capital structure, Mergers & Acquisitions,
Investor Relations, Accelerate! -
Operating Model

Marnix van Ginneken
Born 1960, Dutch1973, Dutch/American
Executive Vice President & Chief Legal Officer
Group responsibilities: Legal and General Secretary
Annual Report 2013 1272015 99
7 Management 7 - 78

128
Denise Haylor
Born 1964, British/American
Executive Vice President & Chief Human Resources Officer
Group responsibilities: Human Resources, Accelerate! - Culture

Ronald de Jong
Born 1967, Dutch
Executive Vice President &
Chief Market Leader
Group responsibilities: Markets, Countries (all except
Greater China & North America), Government Affairs, Accelerate! - Customer centricity

Pieter Nota
Born 1964, Dutch
Executive Vice President & Chief Executive Officer of Personal Health,
Chief Marketing Officer, Member of the Board of Management since April 2011
Group responsibilities: Sector Consumer Lifestyle, Accelerate! - Resource to
Win, Marketing

Eric Rondolat
Born 1966, Italian/French
Executive Vice President &
Chief Executive Officer Philips Lighting
Group responsibilities: Philips Lighting
100 Annual Report 20132015
8 Supervisory Board 8 - 89
89 Supervisory Board
The Supervisory Board supervises the policies of the executive management and the general course of affairs of Koninklijke Philips N.V. and advises the executive management thereon. The Supervisory Board, in the two-tier corporate structure under Dutch law, is a separate and independent corporate body.
The Rules of Procedure of the Supervisory Board are published on the Company’s website. For details on the activities of the Supervisory Board, see chapter 9,10, Supervisory Board report, of this report and section 10.2,11.2, Supervisory Board, of this report.
| 1) | member of the Audit Committee |
| 2) | member of the Remuneration Committee |
| 3) | member of the Corporate Governance and Nomination & Selection Committee |
| 4) | member of the Quality & Regulatory Committee |
| 5) | member of the Separation Committee |

Jeroen van der Veer
Born 1947, Dutch2),3),5)
Chairman
Chairman of the Corporate Governance and Nomination & Selection Committee
Member of the Supervisory Board since 2009; second term expires in 2017
Former Chief Executive and Non-executive Director of Royal Dutch Shell and currently Chairman of the Supervisory Board of ING Group. Member of the Supervisory Board of Concertgebouw N.V. and Royal Boskalis Westminster N.V.

Neelam Dhawan
Born 1947, Dutch** ***
Kees van Lede1959, Indian1)
Member of the Supervisory Board since 2003; third2012; first term expires in 20152016
Former ChairmanCurrently Managing Director of the Board of Management of Akzo Nobel and currently Chairman of the Supervisory Board of Royal Imtech N.V. Member of the Supervisory Boards of AirFrance/KLM, Air Liquide and Senior Advisor JP Morgan Plc.Hewlett-Packard Enterprise India

Orit Gadiesh
Born 1942, Dutch*
Heino von Prondzynski1951, Israeli/American1)
Member of the Supervisory Board since 2007; second term expires in 2015
Former member of the Corporate Executive Committee of the F. Hofmann-La Roche Group and former CEO of Roche Diagnostics, currently Chairman of the Supervisory Board of HTL Strefa and Epigenomics AG. Member of the Supervisory Board of Hospira
Born 1949, German*
Jackson Tai
Chairman of Audit Committee
Member of the Supervisory Board since 2011;2014; first term expires in 20152018
Former Vice-Chairman and CEO of DBS Group and DBS Bank Ltd and former Managing Director at J.P. Morgan &Co. Incorporated. Currently a member of the Supervisory Boards of The Bank of China Limited, Singapore Airlines, MasterCard Incorporated and Eli Lilly and Company. Also Non-Executive Director of privately-held Russell Reynolds Associates and of Vapor Stream
Born 1950, American*
James Schiro
Vice-Chairman and Secretary; Chairman of Bain & Company and the Remuneration Committee
International Business Leaders’ Advisory Council for the Mayor of Shanghai (IBLAC). Member of the SupervisoryFoundation Board since 2005; third term expires in 2017
Former CEO of Zurich Financial Services and Chairman of the Group Management Board.World Economic Forum (WEF). Also serves on various boards of private and listed companies including Goldman Sachs as Lead Director and member of the audit committee, PepsiCo as member ofAdvisory Board for the British-American Business council
Annual Report 2015 101
Supervisory Board and Reva Medical as member of the Supervisory Board. Senior Advisor CVC Capital Partners Ltd.9
Born 1946, American** ***

Ewald Kist
Born 1944, Dutch2)
Member of the Supervisory Board since 2004; third term expires in 2016
Former Chairman of the Executive Board of ING Group and currently member of the Supervisory Boards of the Dutch Central Bank, DSM and Moody’s Investor Service

Kees van Lede
Born 1942, Dutch 5)
Chairman of the Separation Committee Member of the Supervisory Board since 2003; fourth term expires in 2017
Former Chairman of the Board of Management of Akzo Nobel. Currently member of the Supervisory Boards of AirFrance/KLM and Stage EntertainmentSenior Advisor JP Morgan Plc.
Born 1944, Dutch**

Christine Poon
Born 1952, American2),3),4)
Vice-chairman and Secretary
Chairman of the Quality & Regulatory Committee Member of the Supervisory Board since 2009; second term expires in 2017
Former Vice-Chairman of Johnson & Johnson’s Board of Directors and Worldwide Chairman of the Pharmaceuticals Group. CurrentlyGroup and former dean of Ohio State University’s Fisher College of Business andBusiness. Currently member of the Board of Directors of Prudential and Regeneron

Heino von Prondzynski
Born 1952, American** ***1949, Swiss/German2),3),4)
Neelam DhawanChairman of the Remuneration Committee Member of the Supervisory Board since 2007; third term expires in 2019
Former member of the Corporate Executive Committee of the F. Hofmann- La Roche Group and former CEO of Roche Diagnostics, currently Chairman of the Supervisory Boards of HTL Strefa and Epigenomics AG. Member of the Supervisory Board of Quotient Ltd.

David Pyott
Born 1953, British1),4)
Member of the Supervisory Board since 2012;2015; first term expires in 20162019
Former Chairman and Chief Executive Officer of Allergan, Inc. (since 2001 and 1998, respectively, until 2015). Currently Director of Avery Dennison Corporation and its Lead Independent Director (since 1999 and 2010, respectively). Member of the Board of Directors of Alnylam Pharmaceuticals Inc. and of BioMarin Pharmaceutical Inc. Also member of the Board of Trustees of Chapman University, member of the Governing Board of the London Business School, President of the International Council of Ophthalmology Foundation and member of the Advisory Board of the Foundation of the American Academy of Ophthalmology.

Jackson Tai
Born 1950, American1),4),5)
Chairman of Audit Committee
Member of the Supervisory Board since 2011; second term expires in 2019
Former Vice-Chairman and CEO of DBS Group and DBS Bank Ltd and former Managing Director at J.P. Morgan &Co. Incorporated. Currently a member of Hewlett-Packard India
Born 1959, Indian*
* | member of the Audit Committee |
** | member of the Remuneration Committee |
*** | member of the Corporate Governance and Nomination & Selection Committee |
Annual Report 2013 129
8 Supervisory Board 8 - 8
the Boards of Directors of The Bank of China Limited, MasterCard Incorporated and Eli Lilly and Company, Also Non-Executive Director of privately-held Russell Reynolds Associates and of Vaporstream

130102 Annual Report 20132015
9 Supervisory Board report 9 - 910
910 Supervisory Board report
Introduction
We as members of the Supervisory Board are fully committed to our role and responsibility in respect of the proper functioning of the corporate governance of Philips. The Supervisory Board supervises and advises the Board of Management and Executive Committee in performing their management tasks and setting the direction of the business of the Philips group.Group. The Supervisory Board acts, and we as individual members of the Board act, in the interests of Koninklijke Philips N.V., its business and all its stakeholders. This report includes a more specific description of the Supervisory Board’s activities during the financial year 20132015 and other relevant information on its functioning.
Activities of the Supervisory Board
The full scope and details of the discussions within the Supervisory Board are confidential, (inter alia) given the business sensitive nature of the matters discussed. Nevertheless, the overview below indicates a number of matters that we discussed during meetings throughout 2013:2015:
Philips’ performanceEstablishing Philips Lighting as a stand-alone company, and financial headroomreviewing the strategic options for its separation. Please also refer to the activities of the Separation Committee, as included below in this Supervisory Board report;
Philips’ strategyDeveloping the strategic direction for Philips to capture higher growth in the health technology market opportunities, and the new mid-term targets that were announced during the Capital Markets Day in September 2013. In particular, the Supervisory Board focused on the naturefor Lighting to transition from conventional lighting to LED applications;
Performance of the Philips Group the portfolio of approximately 40and its underlying businesses across various strategic domains, the company’s geographic footprint and the roadmap to unlock the company’s full potential over the coming years with emphasis on the Philips Business Systemfinancial headroom;
Philips’ annual management commitment and annual operating plan for 20132016;
The reviewCapital allocation, including the dividend policy and continuance of the integration of large acquisitionsshare buyback program;
The changeQuality and regulatory systems and processes, including the interactions with the United States Food and Drug Administration and the remedial efforts in (the funding of)Cleveland and other sites. Please also refer to the pension obligationsdescription below in this Supervisory Board report of the Netherlandsactivities of the Quality & Regulatory Committee that was established in 2015;
Philips’ progression towards becomingSignificant mergers, acquisitions and divestments, notably the extensive efforts to obtain regulatory clearance for the sale of the Lumileds and Automotive business to a more digital companyconsortium led by GO Scale Capital which was terminated in January 2016;
The enterpriseCustomers and new business models, including the increasing importance of large scale and managed equipment projects in both the HealthTech and Lighting business areas;
Business transformation and the progress being made in the Accelerate! Program;
Enterprise risk management (which included thean annual risk assessment and discussion of the changing nature of the risks faced by Philips and the possible impact of such risks). For instance,Such risks included the Supervisory Board discussedchallenges of an increasingly digital environment, information security, including product security, new business models in the impactcontext of changing macro-economic conditionspublic policies and the risks posed by information securityexecution risk associated with the separation of the Company;
QualityThe Company’s program to de-risk its future pension liabilities, and regulatory matters,the implications thereof;
Changes in the composition of the Executive Committee and the Board of Management, including the appointment of a new Chief Financial Officer;
Significant civil litigation claims and public investigations against or into the Company; and
The divestmentA review of the Audio, Video, MultimediaCompany’s sustainability programs and Accessories business (including the termination of the Funai agreement).goals.
The Supervisory Board conducted so-called “deep dives” on a range of topics such as: the strategy of Consumer Lifestyle; the operations of the Lighting Sector in North America and reviews of the company’s activities in Latin America.including:
The Supervisory Board also conducted a number of reviews of the company’s operations in markets, including in China, Middle-East and Turkey, and Africa. Moreover, the North American Market, (includingwhich included the activitiesrecovery of the Sectors and key functions in that geography) was discussed byDiagnostic Imaging business, the Supervisory Board and we provided feedback on the new brand identity, which was launched in November 2013. Additionally, we received updates on sustainabilityscaling of solutions businesses and the share buy-back program andimportance of unlocking the impact of currency headwinds.
On multiple occasions, we were briefed on the various aspectspotential of the Accelerate! program, This includedProfessional Lighting business; and
The strategy for the transformation of the FinanceLighting business and IT functions and also the progress made in transforming the culture within Philips and simplifying its operating model.translation to an equity story for potential investors.
The Supervisory Board also reviewed Philips’ annual and interim financial statements, including non-financial information, prior to publication thereof.
Supervisory Board meetings and attendance
In 2013,2015, the Supervisory Board convened for seven regular meetings.meetings and one extraordinary meeting. Moreover, we collectively and individually interacted with members of the Executive Committee and with senior management outside the formal Supervisory Board meetings. The Chairman of the Supervisory Board and the CEO met regularly for bilateral discussions about the progress of the companyCompany on a variety of matters. The Supervisory Board also held bilateral meetings with several members of the Executive Committee to discuss a range of topics.
The Supervisory Board meetings were well attended in 2013.2015. The attendance percentage ofat the meetings - including the committee meetings - was again high (in excess of 95%90%). The Supervisory Board visited the Company’s site in Somerset, the United States, and toured its Lighting Application Center, to view demonstrations of its innovations in the Lighting market and meet with employees. The Supervisory Board also visited the Company’s site in Best, the Netherlands, where we reviewed, among other things, the quality system of the Image Guided Therapy business group. The Supervisory Board committees also convened regularly (see the separate reports of the committees below) and all of the committees regularly reported back on their activities to the full Supervisory Board. In
Annual Report 2013 1312015 103
9 Supervisory Board report 9 - 910
Board.addition to the formal meetings of the Board and its Committees, the Board members also held private meetings. We as members of the Board devoted sufficient time to engage (proactively if the circumstances so required) in our supervisory responsibilities.
Composition, diversity and self-evaluation by the Supervisory Board
The Supervisory Board is a separate corporate body that is independent of the Board of Management (and the Executive Committee). Its independence is also reflected in the requirement that membersa member of the Supervisory Board can neithercannot be a member of the Board of Management, member of the Executive Committee noror an employee of Philips. The Supervisory Board furthermore considers all its members to be independent pursuant to the Dutch Corporate Governance Code. We will continue to pay close attention to applicable independence criteria.
The Supervisory Board currently consists of eight members. nine members, after the appointment of Mr David Pyott at the 2015 Annual General Meeting.
The agenda for the upcoming 20142016 Annual General Meeting of Shareholders includes thewill include a proposal to appoint Ms. Orit Gadiesh as an additional memberreappoint Mrs Neelam Dhawan to the Supervisory Board bringingfor an additional term of four years. The current term of appointment of Mr Ewald Kist will expire at the totalend of such meeting, after serving three consecutive terms on the Board. We are grateful to nine members.Ewald for his years of service, which included him being Chairman of the Audit Committee, for his dedication and the wisdom that he brought to Supervisory Board discussions and decisions.
In 2015, there were also a number of changes to the chairmanships and memberships within the Board. David Pyott was appointed as member of the Supervisory Board and became a member of the Audit Committee. Jackson Tai, Heino von Prondzynski and Kees van Lede were re-appointed as members of the Supervisory Board. Kees van Lede and Heino von Prondzynski stepped down from the Audit Committee. In 2015, we also established two new Supervisory Board Committees: the Separation Committee and the Quality & Regulatory Committee. Please refer to the description of the activities of such committees below in this Supervisory Board report.
The profile of the Supervisory Board aims for an appropriate combination of knowledge and experience among its members, encompassing marketing, manufacturing, technology, financial, economic, social, quality & regulatory and legal aspects of international business, government and public administration in relation to the global and multi-productmulti- product character of Philips’ businesses. The Supervisory Board pays great value to diversity in its composition. More particular it aims for having members with anboth European and a non- European backgroundbackgrounds (nationality, working experience or otherwise) and one or more members withwho have held an executive or similar position in business or society no longer than five years ago.society.
In addition, we support the Philips’ policy to appoint a well-balanced mix of women and men to its Board of Management, Executive Committee and Supervisory Board. New Dutch legislation, effective per January 1, 2013, requires companies to pursue aBoard, including the policy of having at least 30% of the seats on the Board of Management and the Supervisory Board held by women and at least 30% of the seats held by men.
We believe we are making good progress in implementing this policy. The appointment of Orit Gadiesh, as currently proposed to the General Meeting of Shareholders, will bringCurrently, the Supervisory Board’s gender diversity is within the statutory criteria. There were no other vacancies to fulfil in 2013. In addition, weWe note that there may be various other pragmatic reasons – such as the other relevant selection criteria and the availability of suitable candidates within Philips – that could play a complicating role in fully achieving the gender targets in the short term.achievement of our diversity targets.
In 2013,2015, the members of the Supervisory Board again completed a questionnaire to verify compliance in 20132015 with applicable corporate governance rules and its Rules of Procedure. The outcome of this survey was satisfactory.
In addition, we each submitted to the Chairman responses to a questionnaire designed to self-evaluate the functioning of the Supervisory Board. TheAs in previous years, the questionnaire covered topics such as the composition and competence of the Supervisory Board (for example, the Board’s size and the education and training requirements of its members), access to information, the frequency and quality of the meetings, quality and timeliness of the meeting materials, the nature of the topics discussed during meetings and the functioning of the Supervisory Board’s committees.
The responses to the questionnaire were aggregated into a report, which was discussed by the Supervisory Board in a private meeting. Certain areas were identified that could be improved and it was decided that the Chairman would follow-up with individual members to address specific issues. Summarizing,This resulted in a number of suggestions to improve the quality of the discussion in Board meetings, which will be implemented in 2016. All members of the Supervisory Board had a ‘one to one’ discussion with the Chairman, and the Chairman was evaluated by the Vice-Chairman. The responses provided by the Supervisory Board members indicated that the Board iscontinues to be a well-functioning team and we believe a diversity of experience and skills is presentedrepresented on the Board. The Board has spent time throughout 2015 considering its composition and it will continue to devote attention to this topic during 2016. The functioning of the Supervisory Board committees was considered to be commendable (or better) and specific feedback will bewas addressed by the chairmanChairman of each committee with its members. The evaluation lead to certain practical steps to improve the accessibility of the large quantity of materials provided to Supervisory Board members.
In 2013, theThe use of an external evaluator to measure the functioning of the Supervisory Board was considered; however, it was decided to continue self-evaluation formay be considered in the time being. We will reconsider the use of an external evaluator as circumstances require.future.
104 Annual Report 2015
Supervisory Board report 10
Supervisory Board committees
The Supervisory Board has assigned certain of its tasks to the three permanent committees:long-standing committees, also referred to in the Dutch Corporate Governance Code: the Corporate Governance and Nomination & Selection Committee, the Remuneration Committee and the Audit
132 Annual Report 2013
9 Committee. The separate reports of these committees are part of this Supervisory Board report 9 - 9
Committee.and are published below. As explained below, the Supervisory Board additionally established the Separation Committee and the Quality & Regulatory Committee in 2015. The function of all of the Board’s committees is to prepare the decision-making of the full Supervisory Board, and the committees currently have no independent or assigned powers. The full Board retains overall responsibility for the activities of its committees.
Separation Committee
We have established the Separation Committee following the Company’s decision to establish two standalone companies focused on the HealthTech and Lighting opportunities respectively. The separate reportsSeparation Committee assists the Supervisory Board in its oversight responsibilities relating to the implementation of this decision. Its members are Jeroen van der Veer and Jackson Tai, chaired by Kees van Lede. The Separation Committee met 5 times in 2015. The Separation Committee reviewed the details of the committees are partseparation across all Lighting businesses and Markets, and discussed the separation of thisitems including intellectual property (including use of the Philips brand), information technology infrastructure, real estate and legacy liabilities. The allocation of employees between Royal Philips and Philips Lighting was also reviewed. The Separation Committee reported to the full Supervisory Board reportthat it was impressed by the high standard of professionalism and efficiency displayed by the Management throughout the year and commends the Company on a well planned and executed separation.
Quality & Regulatory Committee
We have established the Quality and Regulatory Committee in view of the continued relevance of the quality of the Company’s products, systems, services and software and the development, testing, manufacturing, marketing and servicing thereof, and regulatory requirements relating thereto. The Q&R Committee assists the Supervisory Board in fulfilling its oversight responsibilities in this area, whilst recognizing that the Audit Committee assists the Supervisory Board in the oversight of other areas of regulatory, compliance and legal matters. Its members are published below.Heino von Prondzynski, David Pyott and Jackson Tai, chaired by Christine Poon. The Q&R Committee met 5 times in 2015. In each meeting, the Q&R Committee reviewed material developments, the quality and regulatory dashboards, which display key performance indicators for business groups and markets, the status of ongoing internal and external audits and any remediation actions underway or completed. In addition, the Q&R Committee reviewed the roadmap to simplify the Company’s supplier base, the talent and succession planning in the Quality & Regulatory function and the training and education efforts around Quality & Regulatory matters being implemented in the Company. Members of the Q&R Committee visited sites and reviewed quality systems in the United States and the Netherlands.
Supervisory Board remuneration
The agenda for the upcoming 2016 Annual General Meeting of Shareholders will include a proposal to determine the remuneration of the members of the Quality & Regulatory Committee of the Supervisory Board which will be in line with the remuneration of the members of the Separation Committee as approved at the 2015 Annual General Meeting.
Financial Statements 20132015
The financial statements of the company for 2013,2015, as presented by the Board of Management, have been audited by KPMG Accountants N.V. as independent external auditor appointed by the General Meeting of Shareholders. Its reports have been included in the section Group financial statements; section 11.10,13.5, Independent auditor’s report, - Group and the section Company financial statement; section 12.5, Independent auditor’s report - Company, of this report. We have approved these financial statements, and all individual members of the Supervisory Board (together with the members of the Board of Management) have signed these documents.
We recommend to shareholders that they adopt the 20132015 financial statements. We likewise recommend to shareholders that they adopt the proposal of the Board of Management to make a distribution of EUR 0.80 per common share (up to EUR 740 million), in cash or in shares at the option of the shareholder, against the net income for 2013.2015 and retained earnings.
Finally, we would like to express our thanks to the members of the Executive Committee and all other employees for their continued contribution during the year. In particular, we would like to express our sincere appreciation to Eric Coutinho, our Chief Legal Officer and General Secretary, who will retire in 2014. We wish him all the best for the future.
February 25, 201423, 2016
The Supervisory Board
Jeroen van der Veer
Christine Poon
Neelam Dhawan
Orit Gadiesh
Ewald Kist
Kees van Lede
David Pyott
Heino von Prondzynski
Jackson Tai
James Schiro
Ewald Kist
Christine Poon
Neelam Dhawan
Further information
ForTo gain a better understanding of the responsibilities of the Supervisory Board and forthe internal regulations and procedures governing for its functioning and that of its
Annual Report 2015 105
Supervisory Board report 10
committees, please refer to chapter 10,11, Corporate governance, of this report and to the following documents published on the company’s website:
Rules of Procedure Supervisory Board, including the Charters of the Board committees
Rules of Conduct with respect to Inside Information
Changes and re-appointments Supervisory Board and committees 20132015
Christine Poon, James SchiroJackson Tai, Heino von Prondzynski and JeroenKees van der Veer have been reappointedLede were re-appointed as members of the Supervisory Board.
David Pyott was appointed as member of the Supervisory Board and was appointed as a member of the Supervisory Board.Audit Committee.
The Quality & Regulatory Committee, Chaired by Christine Poon, and the Separation Committee, Chaired by Kees van Lede, were established.
Changes and reappointmentsre-appointments Supervisory Board 20142016
It is proposed to appoint Orit Gadieshre-appoint Neelam Dhawan as a member of the Supervisory Board.* The term of appointment of Ewald Kist will expire at the end of the 2016 AGM.
* | Subject to approval of appointment by the General Meeting of Shareholders. |
Changes Management 20142015
Eric Coutinho,Frans van Houten and Pieter Nota were re-appointed as Chief LegalExecutive Officer and General Secretary will retire on April 30, 2014. He will be succeeded by Marnix van Ginneken (currently Philips’ Headmember of Group Legal).the Board of Management, respectively.
Annual Report 2013 133
9 SupervisoryAbhijit Bhattacharya was appointed as a member of the Board report 9.1 - 9.1of Management and Chief Financial Officer.
Ron Wirahadiraksa and Jim Andrew left the company, Patrick Kung retired.
9.110.1 Report of the Corporate Governance and Nomination & Selection Committee
The Corporate Governance and Nomination & Selection Committee is chaired by Jeroen van der Veer and its other members are James SchiroChristine Poon and Christine Poon.Heino von Prondzynski.
The Committee is responsible for the review of selection criteria and appointment procedures for the Board of Management, the Executive Committee, certain other key management positions, as well as the Supervisory Board.
In 2013,2015, the Committee consulted with the CEOmet five times and other members of the Board of Managementdevoted time on the appointment or reappointment of candidates to fill current and future vacancies on the Board of Management, Executive Committee and Supervisory Board. In particular, the Committee discussed the outcome of comprehensive third-party reviews of the management of the Royal Philips and Lighting businesses, which included an analysis of competencies and succession planning. The Committee consulted with the CEO and other members of the Board of Management. Following whichthose consultations it prepared decisions and advised the Supervisory Board on the candidates for appointment.
The Committee devoted specific attention to identifying a suitable candidate matching the profileThis resulted in Abhijit Bhattacharya succeeding Ron Wirahadiraksa as CFO, including Abhijit’s appointment as member of the Supervisory Board. Subsequently,Board of Management at the Nomination & Selection Committee reviewed and approvedExtraordinary General Meeting of Shareholders held on December 18, 2015.
This also resulted in the nominationproposed re-appointment at the upcoming 2016 Annual General Meeting of Orit GadieshShareholders of Neelam Dhawan as a member of the Supervisory Board, who was selected from a shortlistas well as the appointment of suitable candidates. TheChristine Poon as Vice-Chairman of the Supervisory Board. As it does each year, the Committee also devoted specific attention todiscussed succession planning for Executive Committee members. The Committee furthermore discussed the resignation of Jim Andrew and reviewed candidates for his successor, leading to the appointment of Jean Botti as Philips’ new Chief Innovation & Strategy Officer in January 2016, as well as the retirement of Patrick Kung and his succession by Andy Ho.
The Committee spent considerable time, also in consultation with the Separation Committee Chairman, reviewing the implications of the separation of the Company into two companies for governance, succession and talent development.
As indicated in its report above, the Supervisory Board believes it is making good progress in implementing a policy of gender diversity. The Committee strives to continue this trend and give appropriate weight to the diversity policy in the nomination and appointment process on future vacancies, while taking into account the overall profile and selection criteria for appointments of suitable candidates to the Board of Management, Executive Committee and Supervisory Board.
Under its responsibility for the selection criteria and appointment procedures for Philips’ senior management, the Committee reviewed the succession plans for top 70 positions and emergency candidates for key roles in the company.Company. In 2015, there was special
106 Annual Report 2015
Supervisory Board report 10.1
focus on the management teams of the two operating committees responsible for the day-to-day management of the businesses addressing the HealthTech and Lighting opportunities.
With respect to corporate governance matters, the Committee discussed relevant developments and legislative changes.changes during two meetings. The Committee notesreviewed the corporate governance of Royal Philips and considered options for governance models for Philips Lighting should it become a number of important legislative changes to Dutch corporate law came into effect in 2013 and 2014. In addition there were changes to Dutch accountancy law, new rules on inquiry proceedings and an amendment to the European Transparency Directive. These legislative developments and other developments were discussed bycompany listed at a stock exchange. Given this possibility, the Committee as well as theiralso reviewed potential impact on the company’s governance. Finally, the Committee discussed possible agenda itemscandidates for the upcoming 2014 Annual General Meetinga supervisory board of Shareholders.
134 Annual Report 2013
9 Supervisory Board report 9.2 - 9.2.2
Philips Lighting.
9.210.2 Report of the Remuneration Committee
Introduction
The Remuneration Committee is chaired by James Schiro and itsHeino von Prondzynski. Its other members are Jeroen van der Veer, Ewald Kist and Christine Poon. The Committee is responsible for preparing decisions of the Supervisory Board on the remuneration of individual members of the Board of Management and the Executive Committee. In performing its duties and responsibilities the Remuneration Committee is assisted by an external consultant and in-house remuneration expert acting on the basis of a protocol which ensures that he acts on the instructions of the Remuneration Committee. Currently, no member of the Remuneration Committee is a member of the management board of another listed company. In line with applicable statutory and other regulations, this report focuses on the employmentterms of engagement and remuneration of the members of the Board of Management. The Committee met six times in 2015.
9.2.110.2.1 Remuneration policy
The objective of the remuneration policy for members of the Board of Management, as adopted by the General Meetinggeneral meeting of Shareholders,shareholders, is in line with that for executives throughout the Philips Group:Group. That is, to attract, motivate and retain qualified senior executives of the highest caliber with an international mindset and the background essential for the successful leadership and effective management of a large global company. The Board of Management remuneration policy is benchmarked regularly against companies in the general industry and aims at the median market position.
One of the goals behind the policy is to focus on improving the performance of the company and enhancingto enhance the value of the Philips Group. Consequently, the remuneration package includes a variable part in the form of an annual cash incentive and a long-term incentive consisting of performance shares. The policy does not encourage inappropriate risk-taking.
The performance targets for the members of the Board of Management are determined annually at the beginning of the year. The Supervisory Board determines whether performance conditions have been met and can adjust the pay-outpayout of the annual cash incentive and the long-term incentive grant upward or downward if the predetermined performance criteria were to produce an inappropriate result in extraordinary circumstances. The authority for such adjustments exists on the basis of contractual ultimum remedium-ultimum-remedium and claw backclaw-back clauses. In addition, pursuant to new Dutch legislation effective January 1, 2014, incentives may, under certain circumstances, be amended or clawed back pursuant to statutory powers. For more information please refer to chapter 10,11, Corporate governance, of this report. Further information on the performance targets is given in the chapters on the Annual Incentive (see sub-section 10.2.6, Annual Incentive, of this report) and the Long-Term Incentive Plan (see sub-section 10.2.7, Long-Term Incentive Plan, of this report) respectively.
9.2.2 ContractsKey features of our Executive Committee Compensation Program
The list below highlights Philips’ approach to remuneration, in particular taking into account Corporate Governance practices in the Netherlands.
What we do
We conduct scenario analyses
We have robust stock ownership guidelines
We have claw-back policies incorporated into our incentive plans
We have a simple and transparent remuneration structure in place
What we do not do
We do not pay dividend equivalents on stock options, or restricted share units and performance share units that do not vest
We do not offer executive contracts with longer than 12 months’ separation payments
We do not have a remuneration policy in place that encourages our Board of Management to take any inappropriate risks or to act in their own interests
We do not reward failing members of the Board of Management upon termination of contract
We do not grant loans or give guarantees to the Board of Management
10.2.2 Contracts for the provision of services
Below, the main elements of the contracts for the provision of services of the members of the Board of Management are made public no later than the date of the notice convening the General Meeting of Shareholders at which the appointment of the member of the Board of Management will be proposed.included.
Term of appointment
The members of the Board of Management are appointedengaged for a period of 4 years.years, it being understood that this period expires no later than at the end of the following AGM held in the fourth year after the year of appointment.
Annual Report 2015 107
Supervisory Board report 10.2.2
Philips Group
Contract terms for current members
| | | | |
| | | | |
| | end of term | |
| | | | |
| |
F.A. van Houten | | | March 31, 2015AGM 2019 | |
| |
R.H. WirahadiraksaA. Bhattacharya
| | | March 31, 2015AGM 2019 | |
| |
P.A.J. Nota | | | March 31, 2015AGM 2019 | |
| | | | |
Notice period
Termination of the contract by a memberfor the provision of the Board of Managementservices is subject to threesix months’ notice. A notice period of six months will be applicable in the case of termination by the Company.for both parties.
Severance payment
The severance payment is set at a maximum of one year’s salary.base compensation.
Share ownership
Simultaneously with the introduction of the new LTIcurrent Long-Term Incentive Plan (LTI) in 2013, the guideline for members of the Board of Management to hold a certain number of shares in the company has beenCompany was increased to the level of at least
Annual Report 2013 135
9 Supervisory Board report 9.2.2 - 9.2.6
200% of base pay (the CEO 300%)(300% for the CEO). Until this level has been reached the members of the Board of Management are required to retain all after-tax shares derived from any long-term incentive plan.
Pieter Nota has reached the required share ownership level, the CEO has increased his ownership significantly throughout the year to currently 81% of his target and Abhijit Bhattacharya is at 53% of his target.
9.2.310.2.3 Scenario analysis
The Remuneration Committee annually conducts a scenario analysis.analysis annually. This includes the calculation of remuneration under different scenarios, whereby different Philips performance assumptions and corporate actions are looked at.examined. The Supervisory Board concluded that the current policy has proven to function well in terms of a relationship between the strategic objectives and the chosen performance criteria and believebelieves that newthe Annual and Long-Term Incentive Plan has further improvedPlans support this relationship.
9.2.410.2.4 Remuneration costs
The table below gives an overview of the costs incurred by the Company in the financial year in relation to the remuneration of the Board of Management. Costs related to performance shares, stock option and restricted share right grants are taken by the Company over a number of years. As a consequence, the costs mentioned below in the columnsperformance shares, stock options and restricted share rights columns are the accounting cost of multi- yearmulti-year Long-Term Incentive grants given to members of the Board of Management during their board membership.Management.
Philips Group
Remuneration Board of Management 20131)in EUR
in euros2015
| | | | | | |
| | | | | | | | | | | | | | | | | | | | Costs in the year | |
| | | | | | | | | | | | Costs in the year2) | | | | | | | | | | | | | | | | |
| | | annual | | | | | | realized | | | performance | | | stock | | | restricted | | | pension | | | other | | | annual
base
compensation2) | | base
compensation | | realized
annual incentive | | performance
shares | | stock
options | | restricted share rights | | pension
allowances | | pension
scheme
costs | | other
compensation | |
| | | base salary3) | | | base salary | | | annual incentive | | | shares | | | options | | | share rights | | | costs | | | compensation | | | | | |
F.A. van Houten | | | 1,100,000 | | | | 1,100,000 | | | | 1,081,520 | | | | 402,275 | | | | 218,682 | | | | 190,441 | | | | 468,407 | | | | 75,906 | | | | 1,175,000 | | | | 1,168,750 | | | | 768,920 | | | | 1,273,940 | | | | 17,713 | | | | 28,279 | | | | 529,387 | | | | 25,241 | | | | 78,035 | |
R.H. Wirahadiraksa | | | 675,000 | | | | 656,250 | | | | 497,745 | | | | 205,713 | | | | 137,926 | | | | 128,856 | | | | 263,451 | | | | 35,732 | | |
A. Bhattacharya | | | | 650,000 | | | | 23,551 | | | | 11,937 | | | | 8,968 | | | | — | | | | 183 | | | | 7,315 | | | | 886 | | | | 998 | |
P.A.J. Nota | | | 625,000 | | | | 618,750 | | | | 561,713 | | | | 190,473 | | | | 182,835 | | | | 146,626 | | | | 253,605 | | | | 68,206 | | | | 680,000 | | | | 672,500 | | | | 383,112 | | | | 605,749 | | | | 12,045 | | | | 21,964 | | | | 270,529 | | | | 26,302 | | | | 104,918 | |
| | | | | |
| | | | | | 1,864,801 | | | | 1,163,969 | | | | 1,888,657 | | | | 29,758 | | | | 50,426 | | | | 807,231 | | | | 52,429 | | | | 183,951 | |
| | | | | |
| 1) | Reference date for board membership is December 31, 20132015 |
| 2) | A crisis tax levy of 16% as imposed by the Dutch government amounts to EUR 681,596 in total. This crisis tax levy is payable by the employer and is charged over income of employees exceeding a EUR 150,000 threshold in 2013. These expenses do not form part of the remuneration costs mentioned. The costs for the once-only Accelerate! Grant are not included in the table above. See the table below
|
3) | SalaryBase compensation as of April 1, 20132015 and for Mr Bhattacharya as of date of appointment as a member of the Board of Management
|
The performance shares granted in 2013, 2014 and 2015 to Mr R.H. Wirahadiraksa have lapsed per November 30, 2015. The same applies to the premium shares awarded as a result of restricted share right releases in the past.
No more restricted share rights were outstanding on November 30, 2015. Vested stock options may be exercised up to May 30, 2016, and July 29, 2016, respectively. All in accordance with the terms and conditions of the applicable Long-Term Incentive plans.
For further details on the pension allowances and pension costs see sub-section 10.2.8, Pensions, of this report.
Accelerate! Grant10.2.5 Annual base compensation
The members of the Board of Management received a special once-only performance grant related to the realization of the Accelerate! program and the mid- term targets of the company (CSG CAGR, Adjusted IFO and ROIC). This grant consists of performance shares and performance options. The costs related to the Accelerate! Grant to the members of the Board of Management have been fully taken in the financial year 2013. Around 450 other key employees received a similar performance grant.
Accelerate! Grant
| | | | | | | | | | | | |
| | | number of | | | number of | | | | |
| | | performance | | | performance | | | Costs in | |
| | | shares | | | stock options | | | euros | |
F.A. van Houten | | | 55,000 | | | | 55,000 | | | | 1,434,933 | |
R.H. Wirahadiraksa | | | 38,500 | | | | 38,500 | | | | 1,004,453 | |
P.A.J. Nota | | | 38,500 | | | | 38,500 | | | | 1,004,453 | |
9.2.5 Base salary
The base salariesannual compensation of the members of the Board of Management havehas been reviewed in April 20132015 as part of the regular remuneration review. The salaryannual compensation of Frans van Houten has not been increased per April 1, 2013 and remained at2015, from EUR 1,100,000.1,150,000 to EUR 1,175,000. The salaryannual compensation of Pieter Nota has been increased from EUR 600,000650,000 to EUR 625,000 and the salary680,000.
Both increases were made to move base compensation levels closer to market levels. The annual compensation of the CFO, Ron Wirahadiraksa,Abhijit Bhattacharya, has been increased fromdetermined per appointment as CFO at EUR 600,000 to EUR 675,000 to bring it closer to market level.650,000.
9.2.610.2.6 Annual Incentive
Each year, a variable cash incentive (Annual Incentive) can be earned, based on the achievement of specific and challenging targets. The Annual Incentive criteria are made up for 80% of the financial indicators of the Company and for 20% of the team targets comprising, among others, sustainability targets as part of our EcoVisionsustainability program.
The on-target Annual Incentive percentage is set at 80% of the annual base compensation for the CEO and at 60% of the annual base salarycompensation for other members of the Board of Management. The maximum Annual Incentive achievable is 160% of the annual base compensation for the CEO and 120% of the annual base compensation for members of the Board of Management and 80% of the base salary for the CEO, and the maximum Annual Incentive achievable is 120% of the annual base salary for members of the Board of Management and for the CEO it is 160% of the annual base salary.Management.
136108 Annual Report 20132015
9 Supervisory Board report 9.2.6 - 9.2.710.2.6
To support the performance culture, the Annual Incentive plan is based on (financial) targets at ‘own level’ and ‘group’ level results (line-of-sight). The 2013 realization is a reflection of above target performance on Adjusted IFO, ROIC and Team Targets and a below target realization on CSG, resulting in the pay-out as presented2015 payouts, shown in the table below.below, reflect the at or above threshold performance of CSG, Adjusted IFO and Working Capital at the Group level.
Philips Group
Annual Incentive realization 2013 (pay-out in 2014)EUR
2015 (payout in euros2016)
| | | | | | | | | |
| | | realized annual | | | as a % of base | | | realized annual incentive | | | as a % of base
compensation (2015) | |
| | | incentive | | | salary (2013) | | | | | |
F.A. van Houten | | | 1,081,520 | | | | 98.3 | % | | | 768,920 | | | | 65.4 | % |
R.H. Wirahadiraksa | | | 497,745 | | | | 73.7 | % | |
A. Bhattacharya1) | | | | 11,937 | | | | 50.7 | % |
P.A.J. Nota | | | 561,713 | | | | 89.9 | % | | | 383,112 | | | | 56.3 | % |
| | | | | |
| 1) | Pay-out related to board membership period only |
9.2.710.2.7 Long-Term Incentive Plan
In 2013 a newGrants made under the 2015 LTI Plan has been introduced. The new plan consistsconsist of performance shares only.
Grant size
The annual grant size is set by reference to a multiple of base salary.compensation. For the CEO the annual grant size is set at 120% of base salarycompensation and for the other members of the Board of Management at 100% of base salary.compensation. This is broadly at a mid-market level against leading European listed companies. The actual number of performance shares to be awarded is determined by reference to the average of the closing price of the Philips share on the day of publication of the first quarterly results and the four subsequent dealing days.
Vesting schedule
Dependent upon the achievement of the performance conditions, cliff-vesting applies three years after the date of grant. During the vesting period, the value of dividends will be added to the performance shares in the form of shares. These dividend equivalentdividend-equivalent shares will only be delivered to the extent that the award actually vests.
Performance conditions
Vesting of the performance shares is based on two equally weighted performance conditions:
50% Adjusted Earnings per Share growth (“EPS”) and
50% Relative Total Shareholder Return (“TSR”)
EPS
EPS growth is calculated by applying the simple point-to-point method at year end. Earnings are the income from continued operations attributable to shareholders, as reported in the Annual Report.
The following performance incentive-zoneperformance-incentive zone applies for EPS:
Philips Group
Performance incentive-zonePerformance-incentive zone for EPSin %
| | | | | | | | | | | | | | | | |
| | | Below | | | | | | | | | | |
| | | threshold | | | Threshold | | | Target | | | Maximum | |
Pay-out in % | | | 0 | | | | 40 | | | | 100 | | | | 200 | |
| | | | | | | | | | | | | | | | |
| | | | |
| | | Below
threshold | | | Threshold | | | Target | | | Maximum | |
| | | | |
Payout | | | 0 | | | | 40 | | | | 100 | | | | 200 | |
| | | | |
The EPS targets are set annually set by the Supervisory Board. Given the fact that these targets are considered to be company sensitive, disclosure will take place retrospectively at the end of the performance period. EPS targets and the achieved performance are published in the annual reportAnnual Report after the relevant performance period. For realizaton of the 2013 grant, see the table on vesting 2013 awards at the end of this section.
TSR
The TSR peer group for the new planLTI Plan consists of the following 21 companies:
Philips Group
TSR peer group
| | | | |
| ABB | | Hitachi | | Panasonic |
| Covidien | | Honeywell Int. | | Procter & Gamble |
| Danaher | | Johnson Controls | | Schneider Electric |
| Eaton | | Johnson & Johnson | | Siemens |
| Electrolux | | Legrand | | ToshibaSmiths Group |
| Emerson Electric | | LG Electronics | | Smiths GroupToshiba |
| General Electric | | Medtronic | | 3M |
A ranking approach to TSR applies with Philips itself excluded from the peer group to permit interpolation.
On January 26, 2015, Medtronic completed the acquisition of Covidien. To address the delisting of Covidien the Supervisory Board adopted the approach of recognizing Covidien’s performance through the delisting date and as a proxy for future performance, assumed reinvestment in an index of the remaining 20 peer companies, therefore, effectively retaining a peer group of 21 companies.
The performance incentive-zone is outlined in the table below:
Philips Group
Performance incentive-zonePerformance-incentive zone for TSRin %
| | | | | | | | | | | | | | | | | | | | | | | |
Position | | ³14
-21 | | | ³13 | | | ³12 | | | ³11 | | | ³10 | | | ³9 | | | ³8 | | | ³7 | | | ³6
-1 | | | ³21 -14 | | | ³13 | | | ³12 | | | ³11 | | | ³10 | | | ³9 | | | ³8 | | | ³7 | | | ³6 -1 | |
Pay-out in % | | | 0 | | | | 60 | | | | 60 | | | | 100 | | | | 120 | | | | 140 | | | | 160 | | | | 180 | | | | 200 | | |
| | | | | |
Payout | | | | 0 | | | | 60 | | | | 60 | | | | 100 | | | | 120 | | | | 140 | | | | 160 | | | | 180 | | | | 200 | |
| | | | | |
Under the new LTI Plan members of the Board of Management were granted 124,17193,018 performance shares in 2013.2015.
The following tables provide an overview at end December 2015 of granted but not yet vested (locked up) stock option grants, an overview of performance shares granted but not yet vested and an overview of restricted share rights granted but not yet released.grants and performance share grants. The reference date for board membership is December 31, 2013. The Accelerate! Grant is reported separately under sub-section 9.2.4, Remuneration costs, of this report.2015.
Annual Report 2013 1372015 109
9 Supervisory Board report 9.2.7 - 9.2.810.2.7
Performance shares1)
in euros
| | | | | | | | | | | | | | | | | | | | | | | | |
| | | grant date | | | originally granted
number of performance
shares | | | value at grant date | | | end of
vesting period | | | number of performance
shares vested in 2013 | | | value at vesting date
in 2013 | |
F.A. van Houten | | | 2013 | | | | 62,559 | | | | 1,320,000 | | | | 2016 | | | | n.a. | | | | n.a. | |
R.H. Wirahadiraksa | | | 2013 | | | | 31,991 | | | | 675,000 | | | | 2016 | | | | n.a. | | | | n.a. | |
P.A.J. Nota | | | 2013 | | | | 29,621 | | | | 625,000 | | | | 2016 | | | | n.a. | | | | n.a. | |
1) Accelerate! Grant reported separately. Dividend performance shares resulting from the new LTI Plan not included
Stock options2)
in euros
| | | | | | | | | | | | | | | | | | | | |
| | | grant date | | | number of stock options | | | value at grant date | | | end of lock up period | | | value at end of lock up period3) | |
F.A. van Houten | | | 2010 | | | | 20,400 | 1) | | | 103,428 | | | | 2013 | | | | 86,429 | |
| | | 2011 | | | | 75,000 | | | | 366,000 | | | | 2014 | | | | n.a. | |
| | | 2012 | | | | 75,000 | | | | 212,550 | | | | 2015 | | | | n.a. | |
R.H. Wirahadiraksa | | | 2010 | | | | 16,500 | 1) | | | 81,675 | | | | 2013 | | | | 36,290 | |
| | | 2011 | | | | 51,000 | | | | 248,880 | | | | 2014 | | | | n.a. | |
| | | 2012 | | | | 51,000 | | | | 144,534 | | | | 2015 | | | | n.a. | |
P.A.J. Nota | | | 2010 | | | | 40,800 | 1) | | | 206,856 | | | | 2013 | | | | 172,857 | |
| | | 2011 | | | | 51,000 | | | | 248,880 | | | | 2014 | | | | n.a. | |
| | | 2012 | | | | 51,000 | | | | 144,534 | | | | 2015 | | | | n.a. | |
1) Awarded before date of appointment as a member of the Board of Management
2) Accelerate! Grant reported separately
3) Value at end of lock up period based on Black & Scholes value
Restricted share rights
in euros
| | | | | | | | | | | | | | | | | | | | |
| | | grant date | | | originally granted
number of restricted
share rights | | | value at grant date | | | number of restricted
share rights released
in 2013 | | | value at release date
in 2013 | |
F.A. van Houten | | | 2010 | | | | 5,100 | 1) | | | 116,688 | | | | 1,700 | | | | 41,497 | |
| | | 2011 | | | | 20,001 | | | | 418,021 | | | | 6,667 | | | | 145,607 | |
| | | 2012 | | | | 20,001 | | | | 296,415 | | | | 6,667 | | | | 136,807 | |
R.H. Wirahadiraksa | | | 2010 | | | | 4,125 | 1) | | | 102,713 | | | | 1,375 | | | | 30,113 | |
| | | 2011 | | | | 13,602 | | | | 284,282 | | | | 4,534 | | | | 99,023 | |
| | | 2012 | | | | 13,602 | | | | 201,582 | | | | 4,534 | | | | 93,038 | |
P.A.J. Nota | | | 2010 | | | | 10,200 | 1) | | | 233,376 | | | | 3,400 | | | | 82,994 | |
| | | 2011 | | | | 13,602 | | | | 284,282 | | | | 4,534 | | | | 99,023 | |
| | | 2012 | | | | 13,602 | | | | 201,582 | | | | 4,534 | | | | 93,038 | |
1) Awarded before date of appointment as a member of the Board of Management
For more details of the LTI Plan see note 31,28, Share-based compensation.
9.2.8Realization of 2013 performance share grant
The 3-year performance period of the 2013 performance share grant ended on December 31, 2015. The payout results are explained below.
TSR (50% weighting)
The TSR achieved by Philips during the performance period was 34.15%. This positioned Philips between the 12th and 13th ranked company in the peer group shown in the table below, resulting in a payout of 60%.
TSR results Philips LTI Plan 2013 grants Koninklijke Philips:
34.15%
| | | | | | | | |
| | | | |
Total Shareholder Return ranking per December 31, 2015 | | | | | | | | |
Start date: December 2012 | | | | | | | | |
End date: December 2015 | | | | | | | | |
| | | | |
| Company | | total return | | | rank number | |
| | | | |
Panasonic | | | 202.52 | % | | | 1 | |
Covidien | | | 99.10 | % | | | 2 | |
Medtronic | | | 88.74 | % | | | 3 | |
Legrand | | | 82.06 | % | | | 4 | |
3M | | | 81.03 | % | | | 5 | |
Honeywell International | | | 76.37 | % | | | 6 | |
Danaher | | | 74.71 | % | | | 7 | |
Johnson Controls | | | 68.72 | % | | | 8 | |
Hitachi | | | 65.40 | % | | | 9 | |
Johnson & Johnson | | | 56.87 | % | | | 10 | |
Electrolux | | | 53.12 | % | | | 11 | |
General Electric | | | 52.78 | % | | | 12 | |
| | | | |
Siemens | | | 29.97 | % | | | 13 | |
Procter & Gamble | | | 22.03 | % | | | 14 | |
Eaton | | | 19.13 | % | | | 15 | |
Schneider Electric | | | 16.17 | % | | | 16 | |
ABB | | | 12.96 | % | | | 17 | |
Toshiba | | | 11.35 | % | | | 18 | |
Emerson Electric | | | 4.24 | % | | | 19 | |
Smiths Group | | | 3.43 | % | | | 20 | |
LG Electronics | | | (30.08 | )% | | | 21 | |
| | | | |
Philips Group
Stock options
| | | | | | | | | | | | | | | | | | | | |
| | | | |
| | | grant date | | | number of stock
options | | | value at grant date1) | | | end of lock-up period | | | value at end of lock-
up period1) | |
| | | | |
F.A. van Houten | | | 2012 | | | | 75,000 | | | | 212,550 | | | | 2015 | | | | 732,368 | |
| | | 2013 | 2) | | | 55,000 | | | | 242,534 | | | | 2016 | | | | n.a. | |
A. Bhattacharya | | | 2012 | | | | 16,500 | | | | 46,761 | | | | 2015 | | | | 161,121 | |
P.A.J. Nota | | | 2012 | | | | 51,000 | | | | 144,534 | | | | 2015 | | | | 498,010 | |
| | | 2013 | 2) | | | 38,500 | | | | 169,773 | | | | 2016 | | | | n.a. | |
| | | | |
1) Value based on Black & Scholes value
2) Accelerate! Grant
Philips Group
Restricted share rights
| | | | | | | | | | | | | | | | | | | | |
| | | | |
| | | grant date | | | number of
restricted share
rights originally
granted | | | value at grant date | | | number of restricted
share rights released
in 2015 | | | value at release date
in 2015 | |
| | | | |
F.A. van Houten | | | 2012 | | | | 20,001 | | | | 296,415 | | | | 6,667 | | | | 181,209 | |
A. Bhattacharya | | | 2012 | | | | 4,401 | | | | 65,223 | | | | 1,467 | | | | 39,873 | |
P.A.J. Nota | | | 2012 | | | | 13,602 | | | | 201,582 | | | | 4,534 | | | | 123,234 | |
| | | | |
110 Annual Report 2015
Supervisory Board report 10.2.7
Adjusted EPS growth (50% weighting)
The EPS payouts and targets set at the beginning of the performance period were as follows:
| | | | | | | | | | | | | | | | |
| | | | |
| | | below | | | | | | | | | | |
| | | threshold | | | threshold | | | target | | | maximum | |
| | | | |
EPS (euro) | | | <1.30 | | | | 1.30 | | | | 1.50 | | | | 1.80 | |
Payout | | | 0 | % | | | 40 | % | | | 100 | % | | | 200 | % |
| | | | |
EPS is based on the underlying income from continuing operations attributable to shareholders, as included in the Annual Report, adjusted for changes in accounting principles. Furthermore, the Supervisory Board has also deemed it appropriate to make adjustments relating to certain other items that were not contemplated when the targets were set in 2012. These relate to costs associated with M&A activity, earnings from acquired companies, charges relating to the recent pension de-risking, and impact of foreign exchange variations versus plan. In addition, we have added back in earnings from Lumileds, even though classed as discontinued operations, since planned earnings from this business were included in the original EPS targets.
The resulting EPS achievement was determined by the Supervisory Board as 110%, resulting in a payout of 55%.
In view of the above, the following performance achievement and vesting levels have been determined by the Supervisory Board in respect of the 2013 grant of performance shares:
| | | | | | | | | | | | |
| | | | |
| metric | | achievement | | | weighting | | | vesting level | |
| | | | |
TSR | | | 60 | % | | | 50 | % | | | 30 | % |
EPS | | | 110 | % | | | 50 | % | | | 55 | % |
total | | | | | | | | | | | 85 | % |
| | | | |
The original grant in 2013 has been downward adjusted by 15% to reflect the performance. The 2013 grant shown in the table headed ‘Philips Group -Performance Shares’ in this section does not reflect this adjustment.
10.2.8 Pensions
MembersDue to legislative changes in the Netherlands, effective January 1, 2015 a new pension arrangement applies to the Board of Management, the other members of the Executive Committee and the Executives working under a Dutch contract.
As of this date pension plans which allow pension accrual based on a pensionable salary exceeding an amount of EUR 100,000 are, for fiscal purposes, considered to be non-qualifying schemes. For this reason the Executive Pension Plan in the Netherlands has been terminated.
The following pension arrangement is in place for the members of the Board of Management participate in the Executiveswith effect from January 1, 2015:
Flex Pension Plan in the Netherlands, consistingwhich is a Collective Defined Contribution plan with a fixed contribution of 26.2% up to the maximum pensionable salary of EUR 100,000. The Flex Plan has a combination of a defined-benefit (career average) and defined-contribution plan. The target
138 Annual Report 2013
9 Supervisory Board report 9.2.8 - 9.2.11
retirement age of 67 and a target accrual rate of 1.85%;
A gross Pension Allowance equal to 25% of the base compensation exceeding EUR 100,000;
A temporary gross Transition Allowance, for a maximum period of 8 years (first 5 years in full; year 6: 75%; year 7: 50%, year 8: 25%) for members of the Board who were participants of the former Executive Pension Plan. The level of the allowance is based on the age and salary of the Board member on December 31, 2014.
The total pension cost of the Company related to this new pension arrangement (including the temporary Transition Allowance for the remaining 7 years) is at a comparable level over a period of time to the pension cost under the plan is 62.5. The plan does not require employee contributions. For more details, see note 33, Information on remuneration.former Executive Pension Plan.
9.2.910.2.9 Additional arrangements
In addition to the main conditions as stipulated in the contracts for the provision of employment,services, a number of additional arrangements apply to members of the Board of Management. These additional arrangements, such as expense and relocation allowances, medical
Philips Group
Performance shares1)
| | | | | | | | | | | | | | | | | | | | | | | | |
| | | | |
| | | grant date | | | number of performance
shares originally granted | | | value at grant date | | | end of
vesting
period | | | number of performance
shares vested in 2015 | | | value at vesting date
in 2015 | |
| | | | |
F.A. van Houten | | | 2013 | | | | 62,559 | | | | 1,320,000 | | | | 2016 | | | | n.a. | | | | n.a. | |
| | | 2014 | | | | 59,075 | | | | 1,380,000 | | | | 2017 | | | | n.a. | | | | n.a. | |
| | | 2015 | | | | 54,877 | | | | 1,410,000 | | | | 2018 | | | | n.a. | | | | n.a. | |
A. Bhattacharya | | | 2013 | | | | 11,848 | | | | 250,000 | | | | 2016 | | | | n.a. | | | | n.a. | |
| | | 2014 | | | | 10,702 | | | | 250,000 | | | | 2017 | | | | n.a. | | | | n.a. | |
| | | 2015 | | | | 11,676 | | | | 300,000 | | | | 2018 | | | | n.a. | | | | n.a. | |
P.A.J. Nota | | | 2013 | | | | 29,621 | | | | 625,000 | | | | 2016 | | | | n.a. | | | | n.a. | |
| | | 2014 | | | | 27,825 | | | | 650,000 | | | | 2017 | | | | n.a. | | | | n.a. | |
| | | 2015 | | | | 26,465 | | | | 680,000 | | | | 2018 | | | | n.a. | | | | n.a. | |
| | | | |
1) Dividend performance shares not included
Annual Report 2015 111
Supervisory Board report 10.2.9
insurance, accident insurance and company car arrangements, are in line with those for Philips executives in the Netherlands. In the event of disablement, members of the Board of Management are entitled to benefits in line with those for other Philips executives in the Netherlands.
Unless the law provides otherwise, the members of the Board of Management and of the Supervisory Board shall be reimbursed by the Company for various costs and expenses, like reasonable costs of defending claims, as formalized in the articlesArticles of association.Association. Under certain circumstances, described in the articlesArticles of association,Association, such as an actaction or failure to act by a member of the Board of Management or a member of the Supervisory Board that can be characterized as intentional (“opzettelijk”), intentionally reckless (“bewust roekeloos”) or seriously culpable (“ernstig verwijtbaar”), there will be no entitlement to this reimbursement. The Company has also taken out liability insurance (D&O—Directors & Officers) for the persons concerned.
9.2.1010.2.10 Remuneration of the Supervisory Board
As the base fee for the members of the Supervisory Board had not changed since 2008, and in view of the increased activities and responsibilities of the Supervisory Board, a revised remuneration structure was proposed and approved by the 2015 General Shareholders’ Meeting. The table below gives an overview of thethis new remuneration structure, which has remained unchanged since 2008.structure.
Philips Group
Remuneration 2013Supervisory Board1)1)in EUR
in euros per year2015
| | | | | | | | | | | |
| | | | | | Chairman | | | Vice
Chairman | | | Member | |
| | | Chairman | | | Member | | | | | | | | | | |
Supervisory Board | | | 110,000 | | | | 65,000 | | | | 135,000 | | | | 90,000 | | | | 80,000 | |
| Audit Committee | | | 15,000 | | | | 10,000 | | | | 22,500 | | | | n.a. | | | | 13,000 | |
| Remuneration Committee | | | 12,500 | | | | 8,000 | | | | 15,000 | | | | n.a. | | | | 10,000 | |
| Corporate Governance and Nomination & Selection Committee | | | 12,500 | | | | 6,000 | | | | 15,000 | | | | n.a. | | | | 7,500 | |
| Fee for intercontinental traveling per trip | | | 3,000 | | | | 3,000 | | |
Separation Committee | | | | 15,000 | | | | n.a. | | | | 10,000 | |
| Entitlement Philips product arrangement | | | 2,000 | | | | 2,000 | | |
Attendance fee per inter-European trip | | | | 2,500 | | | | 2,500 | | | | 2,500 | |
| Attendance fee per intercontinental trip | | | | 5,000 | | | | 5,000 | | | | 5,000 | |
| Entitlement to Philips product arrangement | | | | 2,000 | | | | 2,000 | | | | 2,000 | |
| | | | | | | | | | |
1) For more details, see note 33,29, Information on remuneration
9.2.1110.2.11 Year 20142016
Accelerate! Grant
Based2016 will be a momentous year for Philips with the planned separation into two world-class companies focused on the 2013 financial performance on CSG CAGR, Adjusted IFOHealthTech and ROIC, the Supervisory Board concluded in her January 2014 meeting that all the performance conditions exceed the mid-term targets as announced in 2011.Lighting opportunities. As a consequenceresult of this separation, during 2016 we will review the total numberremuneration and long-term incentive policies that apply to both companies and submit whatever is required by the financial and regulatory authorities and request shareholder approvals, as appropriate.
In respect of shares and options under the Accelerate! Grant, as these were originally grantedHealthTech business we expect minimal changes in January 2013, became unconditional. On January 28, 2014 the shares (after tax) have been deliveredtarget levels of remuneration that will apply to the members of the Board of Management. With respect to these shares a holding period until January 29, 2018 applies. The options can be exercised during the period January 29, 2016 - January 29, 2023.Management in 2016.
Pensions
In view of upcoming legislation in the Netherlands, the pension arrangements will be reviewed in the course of 2014.
Annual Report 2013 139
9 Supervisory Board report 9.3 - 9.3
9.310.3 Report of the Audit Committee
The Audit Committee is chaired by Jackson Tai, and its other members are Neelam Dhawan, KeesOrit Gadiesh and David Pyott. Jeroen van Lede and Heino von Prondzynski.der Veer also regularly participated in Audit Committee meetings. The Committee assists the Supervisory Board in fulfilling its supervisory responsibilities for (inter alia) ensuring the integrity of the company’sCompany’s financial statements.statements and reviewing the Company’s internal controls.
The Audit Committee met for four quarterly meetings and two education and training sessionsfive times during 20132015, including at the conclusion of each quarter, and reported its findings to the plenary Supervisory Board. The CEO, the CFO, the Chief Legal Officer, the Head of Internal Audit, the Group Controller and the external auditor (KPMG Accountants N.V.) attended all regular meetings.
As decided by the 2015 Annual General Meeting of Shareholders, Ernst & Young Accountants LLP were appointed as the company’s new external auditor effective January 1, 2016. To ensure a smooth transition between KPMG Accountants N.V. and Ernst & Young Accountants LLP, the Audit Committee also invited the lead partner from Ernst & Young Accountants LLP to attend Audit Committee meetings during the second half of 2015. KMPG Accountants N.V. and Ernst & Young Accountants LLP each reported that the transition between auditors was proceeding well and the Audit Committee has confidence that Ernst & Young Accountants LLP will assume its auditor duties without interruption.
Furthermore, for each meeting, the Committee met each quarter separately with each of the CEO, the CFO, the Chief Legal Officer, the Head of Internal Audit and the external auditor as well as on an ad hoc basis with other company employees, such as the Group Treasurer, the Group ControllerAccountant, the Head of Mergers, Acquisitions and Divestments and the Head of Financial Risk and Pensions Management.
The overview below indicates certainsome of the matters that were discussed during meetings throughout 2013:2015:
The company’s 2013Company’s 2015 annual and interim financial statements, including non-financial information, prior to publication thereof. ItThe Committee also assessed in its quarterly meetings the adequacy and appropriateness of internal control policies and internal audit programs and their findings.
Matters relating to accounting policies, financial risks and compliance with accounting standards. Compliance with statutory and legal requirements and regulations, particularly in the financial domain, was also reviewed. Important findings, Philips’ major areas of risk (including the internal auditor’s reporting thereon, and the General Counsel’s review of litigation and other claims) and follow-up action and appropriate measures were examined thoroughly.
Specifically, the Committee reviewed the company’s pension liabilities and its program to de-risk future pension liabilities and related economic, accounting and legal implications. The Committee reviewed the company’s cash flow generation, liquidity and headroom throughout the year to undertake its financial commitments, including the company’s share repurchase program and payment of dividends, The Committee also reviewed the goodwill impairment test performed in the second quarter, risk management, tax issues, IT strategy and transformation (including information security) and remediation of IT related internal control findings, the company’s finance transformation,
112 Annual Report 2015
Supervisory Board report 10.3
| areas of risk (including the internal auditor’s reporting thereon, and the Chief Legal Officer’s review of litigation and other claims) and follow-up actions and appropriate measures were examined thoroughly. The Committee again reviewed the Company’s pension liabilities and its program to de-risk future pension liabilities and related employee, economic, financial accounting and reporting implications, as well as the implementation of that program. Each quarter, the Committee reviewed the Company’s cash flow generation, liquidity and headroom, capital structure throughout the year and the implications for the Company’s credit ratings and its ability to undertake its financial commitments, including the Company’s share repurchase program and payment of dividends. The Committee also reviewed the goodwill impairment test performed in the second quarter, risk management, tax issues, information security, developments in regulatory investigations as well as legal proceedings including antitrust investigations and related provisions and environmental exposures. |
Specific finance topics included the implications to the Company’s capital structure following the proposed sale of Lumileds and Automotive (including its classification as discontinued operations), the Volcano acquisition and the accounting therefore, the intended separation of the Lighting business and its potential impact on the 2015 financial statements, as well as legal proceedings including antitrust investigationstaxation, the activities of Philips Capital, the Company’s currency hedging practices and related provisions, environmental exposures and financing and performancethe impact of financial holdings and recent acquisitions and new Dutch legislation on mandatory auditor rotation and prohibition on non-audit services.certain potential acquisitions.
With regard to the internal audit, the Committee reviewed, and if required approved, the internal audit charter, audit plan, audit scope and its coverage in relation to the scope of the external audit, as well as the staffing, independence and organizational structure of the internal audit function. The Committee also reviewed and approved the appointment of a new Head of Internal Audit following the rotational reassignmentseparation of the previous incumbent.audit function for Royal Philips and Philips Lighting, including staffing capabilities and its management succession, was also discussed.
With regard to the external audit, the Committee reviewed the proposed audit scope, approach and fees, the independence of the external auditor, non-audit services provided by the external auditor in conformity with the Philips Auditor Policy, as well as any changes to this policy. The Committee also reviewed the External Auditor’s independence as well as its professional fitness and good standing.standing of the external auditor and its engagement partners. For information on the fees of KPMG Accountants N.V., please refer to the table ‘Fees KPMG’ in note 3,6, Income from operations.
The company’sCompany’s policy on business controls, the General Business Principles including the deployment thereof and amendments thereto. The Committee was informed on, and it discussed and monitored closely the company’sCompany’s internal control certification processes, in particular compliance with section 404 of the US Sarbanes-Oxley Act and its requirements regarding assessment, review and monitoring of internal controls. It also discussed on a regular basis the developments in and findings resulting from investigations into alleged violations of the General Business Principles and, if required, any measures taken.
On January 1, 2016, the new legislation on mandatory auditor rotation will become effective, which has also been reflected in the Auditor Policy amended as per January 1, 2013 (please refer to chapter 10, Corporate governance, of this report for more information). Under the new rotation rules, Philips must engage a new audit
140 Annual Report 2013
9 Supervisory Board report 9.3 - 9.3
firm for its statutory audit for the financial year starting January 1, 2016. The Committee has been involved in the process of selecting a new auditor and will continue to be involved in the final selection in 2014 of such future auditor, subject to appointment by the 2015 Annual General Meeting of Shareholders.
During each Audit Committee meeting, the Committee reviewed the report from the external auditor in which the auditor set forth its findings and attention points during the relevant period. The Committee also assessesassessed the overall performance of the external auditor, as required by the Auditor Policy. Please refer to the agenda and explanatory notes thereto for the upcoming 2014 Annual General Meeting of Shareholders for more information on the proposed re-appointment, for one additional year, of the external auditor.
Finally, the AuditThe Committee also participated in a number of education sessions during 2013, including education on pensionsreviewed its own Charter and proposed changes to the IFRS accounting standards.concluded that it was satisfactory.
Annual Report 2013 1412015 113
10 Corporate governance 10 - 10.1
11
1011 Corporate governance
Corporate governance of the Philips groupGroup - Introduction
Koninklijke Philips N.V., a company organized under Dutch law, (the ‘Company’), is the parent company of the Philips Group (‘Philips’ or the ‘Group’).Group. The Company, which started as a limited partnership with the name Philips & Co in Eindhoven, the Netherlands, in 1891, was converted into the company with limited liability N.V. Philips’ Gloeilampenfabrieken on September 11, 1912. The Company’s name was changed to Philips Electronics N.V. on May 6, 1994, to Koninklijke Philips Electronics N.V. on April 1, 1998, and to Koninklijke Philips N.V. on May 3,15, 2013. Its shares have been listed on the Amsterdam Stock Exchange, Euronext Amsterdam, since 1912. The shares have been traded in the United States since 1962 and have been listed on the New York Stock Exchange since 1987.
Over the last decades the Company has pursued a consistent policy to improve its corporate governance in line with Dutch, US and international (codes of) best practices. The Company has incorporated a fair disclosure practice in its investor relations policy, has strengthened the accountability of its executive management and its independent supervisory directors, and has increased the rights and powers of shareholders and the communication with investors. The Company is required to comply with, inter alia, Dutch Corporate Governancecorporate governance rules, the US Sarbanes-Oxley Act, other US securities laws and related regulations (including applicable stock exchange rules), insofar as applicable to the Company. A summary of significant differences between the Company’s corporate governance practice and the New York Stock Exchange corporate governance standards is published on the Company’s website (www.philips.com/investor)(www.philips.com/investor).
In this report, the Company addresses its overall corporate governance structure and states to what extent and how it applies the principles and best practice provisions of the Dutch Corporate Governance Code (as revised on December 10, 2008; the ‘Dutch Corporate Governance Code’). This report also includes the information which the Company is required to disclose pursuant to the Dutch governmental decreeDecree on Article 10 Takeover Directive and the governmental decreeDecree on Corporate Governance. Deviations from aspects of the corporate governance structure of the Company, when deemed necessary in the interests of the Company, will be disclosed in the Annual Report. Substantial changes in the Company’s corporate governance structure and in the Company’s compliance with the Dutch Corporate Governance Code, if any, will be submitted to the General Meeting of Shareholders for discussion under a separate agenda item. The Supervisory Board and the Board of Management, which are responsible for the corporate governance structure of the Company, are of the opinion that the principles and best practice provisions of the Dutch Corporate Governance Code that are addressed to the Board of Management and the Supervisory Board, interpreted and implemented in line with the best practices followed by the Company, are being applied.
10.111.1 Board of Management
Introduction
The Board of Management is entrusted with the management of the Company. Certain key officers have been appointed to manage the Company together with the Board of Management. The members of the Board of Management and these key officers together constitute the Executive Committee (the ‘Executive Committee’).Committee. Under the chairmanship of the President/Chief Executive Officer (‘CEO’)(CEO), the members of the Executive Committee share responsibility for the deployment of its strategy and policies, and the achievement of its objectives and results. The Executive Committee has, for practical purposes, adopted a division of responsibilities indicating the functional and business areas monitored and reviewed by the individual members. For the purpose of this document,corporate governance report, where the Executive Committee is mentioned this also includes the Board of Management unless the context requires otherwise.
The Board of Management remains accountable for the actions and decisions of the Executive Committee and has ultimate responsibility for the Company’s management and the external reporting and is answerable to shareholders of the Company at the Annual General Meeting of Shareholders.
All resolutions of the Executive Committee are adopted by majority vote comprising the majority of the members of the Board of Management present or represented, such majority comprising the vote of the CEO. The Board of Management retains the authority to, at all times and in all circumstances, adopt resolutions without the participation of the other members of the Executive Committee. In discharging its duties, the Executive Committee shall be guided by the interests of the Company and its affiliated enterprise, taking into consideration the interests of the Company’s stakeholders.
The Executive Committee is supervised by the Supervisory Board and provides the latter with all information the Supervisory Board needs to fulfill its own responsibilities. Major decisions of the Board of Management and Executive Committee require the approval of the Supervisory Board; these include decisions concerning (a) the operational and financial objectives of the Company, (b) the strategy designed to
114 Annual Report 2015
Corporate governance 11.1
achieve the objectives, (c) if necessary, the parameters to be applied in relation to the strategy and (d) corporate social responsibility issues that are relevant to the Company.
The Executive Committee follows the Rules of Procedure of the Board of Management and Executive Committee, which set forth procedures for meetings, resolutions and minutes. These Rules of Procedure are published on the Company’s website.
(Term of) Appointment and conflicts of interests
Members of the Board of Management as well as the CEO are appointed by the General Meeting of Shareholders upon a binding recommendation drawn up by the Supervisory Board after consultation with the CEO. This binding recommendation may be overruled by a resolution of the General Meeting of Shareholders adopted by a simple majority of the votes cast and representing at least one-third of the issued share capital. If a simple majority of the votes cast is in favor of the resolution to overrule the binding recommendation, but such majority does not represent at least one-third of the issued share capital, a new meeting may be convened at which the resolution may be passed by a simple majority of the votes cast, regardless of the portion of the issued share capital represented by such majority. In the event a binding recommendation has been overruled, a new binding recommendation shall be submitted to the General Meeting of Shareholders. If such second binding recommendation has been overruled, the General Meeting of Shareholders shall be free to appoint a board member.
Members of the Board of Management and the CEO are appointed for a term of four years, it being understood that this term expires at the end of the General Meeting of Shareholders to be held in the fourth year after the year of their appointment. Reappointment is possible for consecutive terms of four years or, if applicable, until a later retirement date or other contractual termination date in the fourth year, unless the General Meeting of Shareholders resolves otherwise. Members may be suspended by the Supervisory Board and by the General Meeting of Shareholders and dismissed by the latter. Individual data on the members of the Board of Management and Executive Committee are published in chapter 7,8, Management, of this report.
The other members of the Executive Committee are appointed, suspended and dismissed by the CEO, subject to approval by the Supervisory Board.
The acceptance by a member of the Board of Management of a position as a member of a supervisory board or a position of non-executive director in a one-tier board (a ‘Non-Executive Directorship’)(Non-Executive Directorship) at another company requires the approval of the Supervisory Board. The Supervisory Board is required to be notified of other important positions (to be) held by a member of the Board of Management. Under the Dutch Corporate Governance Code, no member of the Board of Management shall hold more than two Non-Executive Directorships at listed companies, or is a chairman of a supervisory board or one-tier board, other than of a Group company or participating interest of the Company. New Dutch legislation effective January 1, 2013, provides for further limitations on the Non-Executive Directorships. No member of the Board of Management shall hold more than two Non-Executive Directorships at ‘large’ companies (naamloze(naamloze vennootschappen orbesloten vennootschappen)vennootschappen) or ‘large’ foundations (stichtingen)(stichtingen) as defined under Dutch law and no member of
142 Annual Report 2013
10 Corporate governance 10.1 - 10.1
the Board of Management shall hold the position of chairman of another one-tier board or the position of chairman of another supervisory board. In order for a company or foundation to be regarded as large, it must meet at least two of the following criteria: (i) the value of the assets according to the balance sheet with explanatory notes, considering the acquisition or manufacturing price, exceeds EUR 17.520 million; (ii) the net turnover exceeds EUR 3540 million; or (iii) the average number of employees equals or exceeds 250. During the financial year 20132015 all members of the Board of Management complied with the limitations on Non-Executive Directorships described above.
Pursuant to newSince 2013, Dutch legislation on board diversity effective January 1, 2013,provided that the Company must pursue a policy of having at least 30% of the seats on the Board of Management held by men and at least 30% of the seats held by women. The relevant rule will ceaseceased to have effect on January 1, 2016.2016, but a bill aimed at reintroducing the rule was announced in November 2015. For more details on board diversity please be referred to thesection 10.1, Report of the Corporate Governance and Nomination & Selection Committee, inof this Annual Report.report.
New Dutch legislation on conflicts of interests effective January 1, 2013, provides that a member of the Board of Management may not participate in the adoption of resolutions if he or she has a direct or indirect personal conflict of interest with the Company or related enterprise. If all members of the Board of Management have a conflict, the resolution concerned will be adopted by the Supervisory Board. The Company’s corporate governance includes rules to specify situations in which a (potential) conflict may exist, to avoid (potential) conflicts of interests as much as possible, and to deal with such conflicts should they arise. The rules on conflicts of interests apply to the other members of the Executive Committee correspondingly.
Relevant matters relating to conflicts of interests, if any, shall be mentioned in the Annual Report for the financial year in question. No such matters have occurred during the financial year 2013.2015.
Annual Report 2015 115
Corporate governance 11.1
Amount and composition of the remuneration of the Board of Management
The remuneration of the individual members of the Board of Management is determined by the Supervisory Board on the proposal of the Remuneration Committee of the Supervisory Board, and must be consistent with the policy thereon as adopted by the General Meeting of Shareholders. The current remuneration policy applicable to the Board of Management was adopted by the 2013 Annual General Meeting of Shareholders, and is published on the Company’s website. A full and detailed description of the composition of the remuneration of the individual members of the Board of Management is included in chapter 9, Supervisory Board report,section 10.2, Report of the Remuneration Committee, of this report.
Pursuant to new Dutch legislation, effective January 1, 2014,the implementation of the remuneration ofpolicy during the members of the Board of Management and the Supervisory Boardfinancial year must be included as a separate agenda item in the convening notice for a general meetingGeneral Meeting of shareholdersShareholders and must be dealt with before the meeting can proceed to consider and adopt the Annual Accounts.
The remuneration structure of the Company, including severance pay, is such that it promotes the interests of the Company in the medium and long-term, does not encourage members of the Board of Management to act in their own interests and neglect the interests of the Company, and does not reward failing members of the Board of Management upon termination of their employment. The level and structure of remuneration shall be determined in the light of factors such as the results, the share price performance and other developments relevant to the Company. Deviations on elements of the remuneration policy in extraordinary circumstances, when deemed necessary in the interests of the Company, will be disclosed in the Annual Report or, in case of an appointment, in good time prior to the appointment of the person concerned.
The main elementsAll current members of the contractBoard of employmentManagement are engaged by means of a newservices agreement (overeenkomst van opdracht), as Dutch legislation prohibits a member of the Board of Management—Management to be employed by means of a contract of employment. In case of the appointment or re-appointment of a member of the Board of Management, the main elements of the services agreement - including the amount of the fixed base salary,compensation, the structure and amount of the variable remunerationcompensation component, any severance plan, pension arrangements and the general performance criteria - shall be made public no later than at the time of issuance of the notice convening the General Meeting of Shareholders in which a proposal for (re-)appointment of that member of the Board of Management has been placed on the agenda. In compliance with the Dutch Corporate Governance Code, the term of contractthe services agreement of the members of the Board of Management is set at four years and, in case of termination, severance payment is limited to a maximum of one year’s base salary; if the maximum of one-year’s salary would be manifestly unreasonable for a member of the Board of Management who is dismissed during his first term of office, the member of the Board of Management shall be eligible for a severance payment not exceeding twice the annual salary.
All current members of the Board of Management are employed by means of a contract of employment. Pursuant to new Dutch legislation, effective January 1, 2013, new members of the Board of Management will be employed by means of a services agreement (overeenkomst van opdracht).compensation.
From 2003 until 2013, Philips maintained a Long-Term Incentive Plan (‘LTI Plan’)(LTI Plan) consisting of a mix of restricted shares rights and stock options for members of the Board of Management, Philips executives and other key employees. A fully revisedSince the full revision in 2013 of the LTI Plan applicable to members of the Board of Management, was approved by the 2013 General Meeting of Shareholders. The revised plan consists of performance shares only, with a three year post-grant performance measurement. For more details please be referred to the section 9.2,10.2, Report of the Remuneration Committee, of this report.
The so-called ultimum remediumultimum-remedium clause and claw-back clause of best practice provisions II.2.10 and II.2.11 of the Dutch Corporate Governance Code are applicable to Annual Incentive payments and LTI grants for the year 2009 onwards to all members of the Board of Management. In respect of the LTI grants, the ultimum remedium clause can be applied to the performance-related actual number of stock options, restricted share rights and/or performance shares that is granted. In addition, pursuant to newly adopted Dutch legislation effective(effective January 1, 2014,2014), the Supervisory Board will beis authorized to change unpaid bonuses awarded to members of the Board of Management if payment or delivery of the bonus would be unacceptable according to the principles of reasonableness and fairness. The Company, which in this respect may also be represented by the Supervisory Board or a special representative appointed for this purpose by the General Meeting of Shareholders, may also claim repayment of bonuses paid or delivered (after December 31, 2013) insofar as these have been granted on the basis of incorrect information on the fulfillment of the relevant performance criteria or other conditions. Bonuses are broadly defined as ‘non-fixed’ remuneration, either in cash or in the form of share-based compensation, that is conditional in whole or in part on the achievement of certain targets or the occurrence of certain circumstances. The explanatory notes to the balance sheet shall report on any moderation and/or claim for repayment of board remuneration. The newly adoptedNo such moderation or claim for repayment has occurred during the financial year 2015.
Dutch legislation also introducesprovides for an obligation for the Company to reduce the remuneration of a member of the Board of Management, if and to the extent the value of such member’s share-based remuneration would have increased as a result of the announcement of a large transaction (requiring shareholder approval) or a public offer for the Company.
Members of the Board of Management hold shares in the Company for the purpose of long-term investment and are required to refrain from short-term transactions in Philips securities. According to the Philips Rules of Conduct on Inside Information, members of the Board of Management are only allowed to trade in Philips securities (including the exercise
116 Annual Report 2015
Corporate governance 11.1
of stock options) during ‘windows’ of twenty business days following the publication of annual and quarterly results (provided the person involved has no ‘inside information’ regarding Philips at that time unless an exemption is available). Furthermore, the Rules of Procedure of the Board of Management and Executive Committee contain provisions concerning ownership of and transactions in non-Philips securities by members of the Board of Management. Members of the Board of Management are prohibited from trading, directly or indirectly, in securities of any of the companies belonging to the peer group, during one week preceding the disclosure of Philips’ annual or quarterly results. TheseThe rules referred to above in this paragraph apply to members of the Executive Committee correspondingly. Transactions in shares in the Company carried out by members of the Board of Management or members of the Supervisory Board and other Insiders (if applicable) are notified to the Netherlands Authority for the Financial Markets (AFM) in accordance with Dutch law and, if necessary, to other relevant authorities.
Indemnification of members of the Board of Management and Supervisory Board
Unless the law provides otherwise, the members of the Board of Management and of the Supervisory Board shall be reimbursed by the Company for various costs and expenses, such as the reasonable costs of defending claims, as formalized in the Articles of Association. Under certain circumstances, described in the Articles of Association, such as an act or failure to act by a member of the Board of Management or a member of the Supervisory Board that can be characterized as intentional (‘opzettelijk’(opzettelijk), intentionally reckless (‘(bewust roekeloos’roekeloos) or seriously
Annual Report 2013 143
10 Corporate governance 10.1 - 10.2
culpable (‘(ernstig verwijtbaar’verwijtbaar), there will be no entitlement to this reimbursement unless the law or the principles of reasonableness and fairness require otherwise. The Company has also taken out liability insurance (D&O - Directors&O-Directors & Officers) for the persons concerned.
In line with regulatory requirements, the Company’s policy forbids personal loans to and guarantees on behalf of members of the Board of Management or the Supervisory Board, and no loans and guarantees have been granted and issued, respectively, to such members in 2013,2015, nor are any loans or guarantees outstanding as of December 31, 2013.2015.
The aggregate share ownership of the members of the Board of Management and the Supervisory Board represents less than 1% of the outstanding ordinary shares in the Company.
Risk management approach
Within Philips, risk management forms an integral part of business management. The Company has implemented a risk management and internal control system that is designed to provide reasonable assurance that strategic objectives are met by creating focus, by integrating management control over the Company’s operations, by ensuring compliance with applicable laws and regulations and by safeguarding the reliability of the financial reporting and its disclosures. The Executive Committee reports on and accounts for internal risk management and control systems to the Supervisory Board and its Audit Committee. The Company has designed its internal control system in accordance withbased on the recommendations of“Internal Control-Integrated Framework (2013)” established by the Committee of Sponsoring Organizations of the Treadway Commission (COSO).
The Company’s risk management approach is embedded in the periodic business planning and review cycle and forms an integral part of business management. On the basis of risk assessments, management determines the risks and appropriate risk responses related to the achievement of business objectives and critical business processes. Risk factors and the risk management approach, as well as the sensitivity of the Company’s results to external factors and variables, are described in more detail in [Risk management].chapter 7, Risk management, of this report. Significant changes and improvements in the Company’s risk management and internal control system have been discussed with the Supervisory Board’s Audit Committee and the external auditor and are disclosed in that section as well.
With respect to financial reporting a structured self-assessment and monitoring process is used company-wide to assess, document, review and monitor compliance with internal control over financial reporting. Internal representations received from management, regular management reviews, reviews of the design and effectiveness of internal controls and reviews in corporategroup and divisional auditBusiness Group, Market and Function Audit & Risk committees are integral parts of the Company’s risk management approach. On the basis thereof, the Board of Management confirms that internal controls over financial reporting provide a reasonable level of assurance that the financial reporting does not contain any material inaccuracies, and confirms that these controls have properly functioned in 2013.2015. The financial statements fairly represent the financial condition and result of operations of the Company and provide the required disclosures.
It should be noted that the above does not imply that these systems and procedures provide certainty as to the realization of operational and financial business objectives, nor can they prevent all misstatements, inaccuracies, errors, fraud and non-compliances with rules and regulations.
In view of the above the Board of Management believes that it is in compliance with the requirements of recommendation II.1.4. of the Dutch Corporate Governance Code. The above statement on internal controls should not be construed as a statement in response to the requirements of section 404 of the US Sarbanes-Oxley Act. The statement as to compliance with section 404 is set forth in the section 12.1, Management’s report on internal control, over financial reporting of this report.
Annual Report.Report 2015 117
Corporate governance 11.1
Next to the Philips General Business Principles (GBP), the Company has a financial codeFinancial Code of ethicsEthics which additionally applies to certaindesignated senior officers,executives, including the CEO and the CFO, and to employees performing an accounting or financial function (the financial codeworking in the Finance and Accounting departments. The GBP and the Financial Code of ethics hasEthics have been published on the Company’s website). website.
The Company, through the Supervisory Board’s Audit Committee, also has appropriate procedures in place for the receipt, retention and treatment of complaints received by the Company regarding accounting, internal accounting controls or auditing matters and the confidential, anonymous submission by employees of concerns regarding questionable accounting or auditing matters. Internal ‘whistleblowers’ have the opportunity, without jeopardizing their position,The Company’s whistleblower mechanisms furthermore allow employees and, since May 2015, external parties to confidentially and anonymously report on irregularities of a general, operational or financial nature and to report complaints about members of the Executive Committeegrievances to the ChairmanCompany, also on other topics than those that relate to questionable accounting or auditing matters. The Company does not tolerate retaliation against (internal) whistleblowers that report a concern in good faith. More information on GBP governance and our whistleblower procedures can be found in chapter 14, Sustainability statements, of the Supervisory Board.this report and chapter 7, Risk management, of this report.
In view of the requirements under the US Securities Exchange Act, procedures are in place to enable the CEO and the CFO to provide certifications with respect to the Annual Report on Form 20-F.
A Disclosure Committee is in place, which advises the various officers and departments involved, including the CEO and the CFO, on the timely review, publication and filing of periodic and current (financial) reports. In addition to the certification by the CEO and the CFO under US law, each individual member of the Supervisory Board of Management and the Supervisory Board of Management must under Dutch law, sign the Group and Company financial statements being disclosed and submitted to the General Meeting of Shareholders for adoption. If one or more of their signatures is missing, this shall be stated, and the reasons given for this. The members of the Board of Management issue the responsibility statement with regardas referred to in chapter 11,12, Group financial statements, of this report, as required by applicable Dutch company law and securities law.
10.211.2 Supervisory Board
Introduction
The Supervisory Board supervises the policies of the Board of Management and Executive Committee and the general course of affairs of Philips and advises the executive management thereon. The Supervisory Board, in the two-tier corporate structure under Dutch law, is a separate body that is independent of the Board of Management. Its independent character is also reflected in the requirement that members of the Supervisory Board can be neither a member of the Board of Management nor an employee of the Company. The Supervisory Board considers all its members to be independent pursuant to the Dutch Corporate Governance Code and under the applicable US Securities and Exchange Commission standards.
The Supervisory Board, acting in the interests of the Company and the Group and taking into account the relevant interest of the Company’s stakeholders, supervises and advises the Board of Management and Executive Committee in performing its management tasks and setting the direction of the Group’s business, including (a) the Philips group’sGroup’s performance, (b) the Philips group’sGroup’s general strategy and the risks connected to its business activities, (c) the operational and financial objectives, (d) the parameters to be approved in relation to the strategy, (e) corporate social responsibility issues (f) the structure and management of the systems of internal business controls, (g) the financial reporting process, (h) the compliance with applicable laws and regulations, (i) the company-shareholders relationship, and (j) the corporate governance structure of the Company. The Group’s strategy and major management decisions are discussed with and approved by the Supervisory Board. For a description of further responsibilities and tasks of the Supervisory Board please refer to the Supervisory Board’s Rules of Procedure which isare published on the Company’s website.
In its report, the Supervisory Board describes the composition and functioning of the Supervisory Board and its committees, the activities of the board and its committees in the financial year 2015, the number of committee meetings and the main items discussed.
Rules of Procedure of the Supervisory Board
The Supervisory Board’s Rules of Procedure set forth its own governance rules (including meetings, items to be discussed, resolutions, appointment and re-election, committees, conflicts of interests, trading in securities, profile of the Supervisory Board). Its composition follows the profile, which aims for an appropriate combination of knowledge and experience among its members encompassing marketing, technological, manufacturing, financial, economic, social and legal aspects of international business and government and public administration in relation to the global and multi- product character of the Group’s businesses. The Supervisory Board attaches great importance to diversity in its composition. More particularly, it aims at having members with a European and a non- Europeannon-European background (nationality, working experience or otherwise) and one or more members with an executive or similar position in business or society no longer than 5 years ago.
Pursuant to newSince 2013, Dutch legislation on board diversity effective January 1, 2013,provided that the Company shallmust pursue a policy of having at least 30% of the seats on the Supervisory
118 Annual Report 2015
Corporate governance 11.2
Board held by men and at least 30% of the seats held by women. The relevant rule will ceaseceased to have effect on January 1, 2016.2016, but a bill aimed at reintroducing the rule was announced in November 2015. For more
144 Annual Report 2013
10 Corporate governance 10.2 - 10.2
details on board diversity please be referred to section 9.1,10.1, Report of the Corporate Governance and Nomination & Selection Committee, of this report.
The Rules of Procedure of the Supervisory Board are published on the Company’s website. They include the charters of its committees as mentioned in the Dutch Corporate Governance Code, to which the plenary Supervisory Board, while retaining overall responsibility, has assigned certain tasks: the Corporate Governance and Nomination & Selection Committee, the Audit Committee and the Remuneration Committee. Each committee reports, and submits its minutes for information, to the Supervisory Board.
In 2015, the Supervisory Board additionally established the Separation Committee and the Quality & Regulatory Committee. Please refer to chapter 10, Supervisory Board report, of this report for more information on the composition and activities of these committees.
In line with US and Dutch best practices, the Chairman of the Supervisory Board must be independent pursuant to the Dutch Corporate Governance Code and under the applicable US standards. Furthermore, the Dutch Corporate Governance Code allows a maximum of one member of each Supervisory Board committee not to be independent (as defined by the Code). As mentioned in the introduction of this section 10.211.2 above, the Supervisory Board considers all its members to be independent.
The Supervisory Board is assisted by the General Secretary of the Company. The General Secretary sees to it that correct procedures are followed and that the Supervisory Board acts in accordance with its statutory obligations and its obligations under the Articles of Association. Furthermore the General Secretary assists the Chairman of the Supervisory Board in the actual organization of the affairs of the Supervisory Board (information, agenda, evaluation, introductory program) and is the contact person for interested parties who want to make concerns known to the Supervisory Board. The General Secretary shall, either on the recommendation of the Supervisory Board or otherwise, be appointed and may be dismissed by the Board of Management, after the approval of the Supervisory Board has been obtained.
(Term of) Appointment, individual data and conflicts of interests
The Supervisory Board consists of at least five members (currently eight)nine), including a Chairman, Vice-Chairman and Secretary. The Dutch ‘structure‘large company regime’ does not apply to the Company itself. Members are currently electedappointed by the General Meeting of Shareholders for fixed terms of four years, upon a binding recommendation from the Supervisory Board.
According to the Company’s Articles of Association, this binding recommendation may be overruled by a resolution of the General Meeting of Shareholders adopted by a simple majority of the votes cast and representing at least one-third of the issued share capital. If a simple majority of the votes cast is in favor of the resolution to overrule the binding recommendation, but such majority does not represent at least one-third of the issued share capital, a new meeting may be convened at which the resolution may be passed by a simple majority of the votes cast, regardless of the portion of the issued share capital represented by such majority. In the event a binding recommendation has been overruled, a new binding recommendation shall be submitted to the General Meeting of Shareholders. If such second binding recommendation has been overruled, the General Meeting of Shareholders shall be free to appoint a board member.
There is no age limit applicable, and members may be re-elected twice.are eligible for re-election twice (unless the Supervisory Board resolves to deviate in a specific case). The date of expiration of the terms of Supervisory Board members is published on the Company’s website.
Individual data on the members of the Supervisory Board are published in the Annual Report, and updated on the Company’s website. Members may be suspended and dismissed by the General Meeting of Shareholders. In the event of inadequate performance, structural incompatibility of interests, and in other instances in which resignation is deemed necessary in the opinion of the Supervisory Board, the Supervisory Board shall submit to the General Meeting of Shareholders a proposal to dismiss the respective member of the Supervisory Board.
After their appointment, all members of the Supervisory Board shall follow an introductory program, which covers general financial and legal affairs, financial reporting by the Company, any specific aspects that are unique to the Company and its business activities, and the responsibilities of a Supervisory Board member.
Any need for further training or education of members will be reviewed annually, also on the basis of an annual evaluation survey.
Under the Dutch Corporate Governance Code, no member of the Supervisory Board shall hold more than five supervisory board memberships of Dutch listed companies, the chairmanship of a supervisory board counting as two regular memberships. In addition, new Dutch legislation effective January 1, 2013, provides that no member of the Supervisory Board shall hold more than five Non-Executive Directorships at ‘large’ companies or foundations as defined under Dutch law (see section 10.1,
Annual Report 2015 119
Corporate governance 11.2
11.1, Board of Management, of this report), with a position as chairman counting for two. During the financial year 20132015 all members of the Supervisory Board complied with the limitations on Non-Executive Directorships described above.
New Dutch legislation on conflicts of interests effective January 1, 2013, provides that a member of the Supervisory Board may not participate in the adoption of resolutions if he or she has a direct or indirect personal conflict of interest with the Company or related enterprise. If all members of the Supervisory Board have a conflict, the resolution concerned will be adopted by the General Meeting of Shareholders. The Company’s corporate governance includes rules to specify situations in which a (potential) conflict may exist, to avoid (potential) conflicts of interests as much as possible, and to deal with such conflicts should they arise.
Relevant matters relating to conflicts of interests, if any, shall be mentioned in the Annual Report for the financial year in question. No decisions to enter into material transactions in which there are conflicts of interest with members of the Supervisory Board were taken during the financial year 2013.2015.
Meetings of the Supervisory Board
The Supervisory Board meets at least six times per year, including a meeting on strategy. The Supervisory Board, on the advice of its Audit Committee, also discusses, in any event at least once a year, the main risks of the business, and the result of the assessment of the structure and operation of the internal risk management and control systems, as well as any significant changes thereto. The members of the Executive Committee attend meetings of the Supervisory Board except in matters such as the desired profile, composition and competence of the Supervisory Board and the Executive Committee, as well as the remuneration and performance of individual members of the Executive Committee and the conclusions that must be drawn on the basis thereof. In addition to these items, the Supervisory Board, being responsible for the quality of its own performance, discusses, at least once a year on its own, without the members of the Executive Committee being present, (i) both its own functioning and that of the individual members, and the conclusions that must be drawn on the basis thereof, as well as (ii) both the functioning of the Board of Management and that of the individual members, and the conclusions that must be drawn on the basis thereof. The President/CEO and other members of the Executive Committee have regular contacts with the Chairman and other members of the Supervisory Board. The Executive Committee is required to keep the Supervisory Board informed of all facts and developments concerning Philips that the Supervisory Board may need in order to function as required and to properly carry out its duties, to consult it on important matters and to submit certain important decisions to it for its prior approval. The Supervisory Board and its individual members each have their own responsibility to request from the Executive Committee and the external auditor all information that the Supervisory Board needs in order to be able to carry out its duties properly as a supervisory body. If the Supervisory Board considers it necessary, it may obtain information from officers and external advisers of the Company. The Company provides the necessary means for this purpose. The Supervisory Board may also require that certain officers and external advisers attend its meetings.
The Chairman of the Supervisory Board
The Supervisory Board’s Chairman will see to it that: (a) the members of the Supervisory Board follow their introductory program, (b) the members of the Supervisory Board receive in good time all information which is necessary for the proper performance of their duties, (c) there is sufficient time for consultation and decision-making by the Supervisory Board, (d) the committees of the Supervisory Board function properly, (e) the performance of the Executive Committee members and Supervisory Board members is assessed at least once a year, and (f) the Supervisory Board elects a Vice-Chairman. The Vice-Chairman of the Supervisory Board shall deputize for the Chairman when the occasion arises. The Vice- ChairmanVice-Chairman shall act as contact of individual members of the Supervisory Board or the Board of Management concerning the functioning of the Chairman of the Supervisory Board.
Remuneration of the Supervisory Board and share ownership
The remuneration of the individual members of the Supervisory Board, as well as the additional remuneration for its Chairman and the members of its committees is determined by the General Meeting of Shareholders. The remuneration of a Supervisory Board member is not dependent on the results of the Company. Further details are published in the Supervisory Board report.
Annual Report 2013 145
10 Corporate governance 10.2 - 10.3
Shares or rights to shares shall not be granted to a Supervisory Board member. In accordance with the Rules of Procedure of the Supervisory Board, any shares in the Company held by a Supervisory Board member are long-term investments. The Supervisory Board has adopted a policy on ownership of and transactions in non-Philips securities by members of the Supervisory Board. This policy is included in the Rules of Procedure of the Supervisory Board.
The Corporate Governance and Nomination & Selection Committee
The Corporate Governance and Nomination & Selection Committee consists of at least the Chairman and Vice-ChairmanVice- Chairman of the Supervisory Board. The Committee reviews the corporate governance principles applicable to the Company at least once a year, and advises the Supervisory Board on any changes to these principles as it deems appropriate. It also (a) draws up selection criteria and appointment procedures for members of the Supervisory Board, the Board of Management and
120 Annual Report 2015
Corporate governance11.2
the Executive Committee; (b) periodically assesses the size and composition of the Supervisory Board, the Board of Management and the Executive Committee, and makes the proposals for a composition profile of the Supervisory Board, if appropriate; (c) periodically assesses the functioning of individual members of the Supervisory Board, the Board of Management and the Executive Committee, and reports on this to the Supervisory Board. The Committee also consults with the President/CEO and the Executive Committee on candidates to fill vacancies on the Supervisory Board, the Board of Management and the Executive Committee, and advises the Supervisory Board on the candidates for appointment. It further supervises the policy of the Executive Committee on the selection criteria and appointment procedures for Philips Executives.
The Remuneration Committee
The Remuneration Committee meets at least twice a year and is responsible for preparing decisions of the Supervisory Board on the remuneration of individual members of the Board of Management and the Executive Committee.
The Remuneration Committee prepares an annual remuneration report. The remuneration report contains an account of the manner in which the remuneration policy has been implemented in the past financial year, as well as an overview of the implementation of the remuneration policy planned by the Supervisory Board for the next year(s). The Supervisory Board aims to have appropriate experience available within the Remuneration Committee. No more than one member of the Remuneration Committee shall be an executive board member of another Dutch listed company.
In performing its duties and responsibilities the Remuneration Committee is assisted by an external consultant and an in-house remuneration expert acting on the basis of a protocol ensuring that the expert acts on the instructions of the Remuneration Committee and on an independent basis in which conflicts of interests are avoided.
The Audit Committee
The Audit Committee meets at least four times a year, before the publication of the annual, semi-annual and quarterly results. All of the members of the Audit Committee are considered to be independent under the applicable US Securities and Exchange Commission rules and at least one of the members of the Audit Committee, which currently consists of four members of the Supervisory Board, is a financial expert as set out in the Dutch Corporate Governance Code and each member is financially literate. In accordance with this code, a financial expert has relevant knowledge and experience of financial administration and accounting at the company in question. None of the members of the Audit Committee is designated as an Audit Committee financial expert as defined under the regulations of the US Securities and Exchange Commission. The Supervisory Board considers the fact of being compliant with the Dutch Corporate Governance Code, in combination with the knowledgeexpertise and experience available in the Audit Committee as well as the possibility to take advice from internal and external experts and advisors, to be sufficient for the fulfillment of the tasks and responsibilities of the Audit Committee. None of the members of the Audit Committee is an Audit Committee financial expert as defined under the regulations of the US Securities and Exchange Commission. The Audit Committee may not be chaired by the Chairman of the Supervisory Board or by a (former) member of the Board of Management.
All members of the Audit Committee are independent
The tasks and functions of the Audit Committee, as described in its charter, which is published on the Company’s website as part of the Rules of Procedure of the Supervisory Board, include the duties recommended in the Dutch Corporate Governance Code. More specifically, the Audit Committee assists the Supervisory Board in fulfilling its oversight responsibilities for the integrity of the Company’s financial statements, the financial reporting process, the system of internal business controls and risk management, the internal and external audit process, the internal and external auditor’s qualifications, its independence and its performance, as well as the Company’s process for monitoring compliance with laws and regulations and the General Business Principles (GBP). It reviews the Company’s annual and interim financial statements, including non-financial information, prior to publication and advises the Supervisory Board on the adequacy and appropriateness of internal control policies and internal audit programs and their findings.
In reviewing the Company’s annual and interim statements, including non-financial information, and advising the Supervisory Board on internal control policies and internal audit programs, the Audit Committee reviews matters relating to accounting policies and compliance with accounting standards, compliance with statutory and legal requirements and regulations, particularly in the financial domain.
Important findings and identified risks are examined thoroughly by the Audit Committee in order to allow appropriate measures to be taken. With regard to the internal audit, the Audit Committee, in cooperation with the external auditor, reviews the internal audit charter, audit plan, audit scope and its coverage in relation to the scope of the external audit, staffing, independence and organizational structure of the internal audit function.
With regard to the external audit, the Audit Committee reviews the proposed audit scope, approach and fees, the independence of the external auditor, its performance and its (re-)appointment, audit and permitted non-audit services provided by the external auditor in conformity with the Philips Policy on Auditor Independence, as well as any changes to this policy. The Audit Committee also considers the report of the external auditor and its report with respect to the annual financial statements. According to the procedures, the Audit Committee acts as the principal
Annual Report 2015 121
Corporate governance11.2
contact for the external auditor if the auditor discovers irregularities in the content of the financial reports. It also advises on the Supervisory Board’s statement to shareholders in the annual accounts. The Audit Committee periodically discusses the Company’s policy on business controls, the GBP including the deployment thereof, overviews on tax, IT, litigation and legal proceedings, environmental exposures, financial exposures in the area of treasury, real estate, pensions, and the Group’s major areas of risk. The Company’s external auditor, in general, attends all Audit Committee meetings and the Audit Committee meets separately at least on a quarterly basis with each of the President/CEO, the CFO, the internal auditor and the external auditor.
10.311.3 General Meeting of Shareholders
Introduction
A General Meeting of Shareholders is held at least once a year to discuss the Annual Report, including the report of the Board of Management, the annual financial statements with explanatory notes thereto and additional information required by law, and the Supervisory Board report, any proposal concerning dividends or other distributions, the appointment of members of the Board of Management and Supervisory Board (if any), important management decisions as required by Dutch law, and any other matters proposed by the Supervisory Board, the Board of Management or shareholders in accordance with the provisions of the Company’s Articles of Association. The Annual Report, the financial statements and other regulated information such as defined in the Dutch Act on Financial Supervision (Wet(Wet op het Financieel Toezicht)Toezicht), will solely be published in English. As a separate agenda item and in application of Dutch law, the General Meeting of Shareholders discusses the discharge of the members of the Board of Management and the Supervisory Board from responsibility for the performance of their respective duties in the preceding financial year. However, this discharge only covers matters that are known to the Company and the General Meeting of Shareholders when the resolution is adopted. The General Meeting of Shareholders is held in Eindhoven, Amsterdam, Rotterdam, The Hague, Utrecht or Haarlemmermeer (Schiphol Airport) no later than six months after the end of the financial year.
Meetings are convened by public notice, via the Company’s website or other electronic means of communication and to registered shareholders by letter or by the use of electronic means of communication, at least 42 days prior to the (Extraordinary) General Meeting of Shareholders. Extraordinary General Meetings of Shareholders may be convened by the Supervisory Board or the Board of Management if deemed necessary and must be held if shareholders jointly representing at least 10% of the outstanding share capital make a written request to that effect to the Supervisory Board and the Board of Management, specifying in detail the business to be dealt with. The agenda of a General Meeting of Shareholders shall contain such business as may be placed thereon by the Board of Management or the Supervisory Board, and agenda items will be explained where necessary in writing. The agenda shall list which items are for discussion and which items are to be voted upon. Material
146 Annual Report 2013
10 Corporate governance 10.3 - 10.4
Material amendments to the Articles of Association and resolutions for the appointment of members of the Board of Management and Supervisory Board shall be submitted separately to the General Meeting of Shareholders, it being understood that amendments and other proposals that are connected in the context of a proposed (part of the) governance structure may be submitted as one proposal. In accordance with the Articles of Association and Dutch law, requests from shareholders for items to be included on the agenda will generally be honored, subject to the Company’s rights to refuse to include the requested agenda item under Dutch law, and the Dutch Corporate Governance Code, provided that such requests are made in writing at least 60 days before a General Meeting of Shareholders to the Board of Management and the Supervisory Board by shareholders representing at least 1% of the Company’s outstanding capital or, according to the official price list of NYSE Euronext Amsterdam, representing a value of at least EUR 50 million. Written requests may be submitted electronically and shall comply with the procedure stipulated by the Board of Management, which procedure is posted on the Company’s website.
Pursuant to newDutch legislation, effective July 1, 2013, shareholders requesting an item to be included on the agenda, have an obligation to disclose their full economic interest (i.e. long position and short position) to the Company. The Company has the obligation to publish such disclosures on its website.
Main powers of the General Meeting of Shareholders
All outstanding shares carry voting rights. The main powers of the General Meeting of Shareholders are to appoint, suspend and dismiss members of the Board of Management and of the Supervisory Board, to adopt the annual accounts, declare dividends and to discharge the Board of Management and the Supervisory Board from responsibility for the performance of their respective duties for the previous financial year, to appoint the external auditor as required by Dutch law, to adopt amendments to the Articles of Association and proposals to dissolve or liquidate the Company, to issue shares or rights to shares, to restrict or exclude pre-emptive rights of shareholders and to repurchase or cancel outstanding shares. Following common corporate practice in the Netherlands, the Company each year requests limited authorization to issue (rights to) shares, to restrict or exclude pre-emptive rights and to repurchase shares. In compliance with Dutch law, decisions of the Board of Management that are so far-reaching that they would greatly change the identity or nature of the Company or the business require the approval of the General Meeting of Shareholders. This includes resolutions to
122 Annual Report 2015
Corporate governance 11.3
(a) transfer the business of the Company, or almost the entire business of the Company, to a third partythird-party (b) enter into or discontinue long-term cooperation by the Company or a subsidiary with another legal entity or company or as a fully liable partner in a limited partnership or ordinary partnership, if this cooperation or its discontinuation is of material significance to the Company or (c) acquire or dispose of a participating interest in the capital of a company to the value of at least one-third of the amount of the assets according to the balance sheet and notes thereto or, if the Company prepares a consolidated balance sheet, according to the consolidated balance sheet and notes thereto as published in the last adopted annual accounts of the Company, by the Company or one of its subsidiaries. Thus the Company applies principle IV.1 of the Dutch Corporate Governance Code within the framework of the Articles of Association and Dutch law and in the manner as described in this corporate governance report.
The Board of Management and Supervisory Board are also accountable, at the Annual General Meeting of Shareholders, for the policy on the additions to reserves and dividends (the level and purpose of the additions to reserves, the amount of the dividend and the type of dividend). This subject is dealt with and explained as a separate agenda item at the Annual General Meeting of Shareholders. Philips aims for a sustainable and stable dividend distribution to shareholders in the long term. A resolution to pay a dividend is dealt with as a separate agenda item at the General Meeting of Shareholders.
The Board of Management and the Supervisory Board are required to provide the General Meeting of Shareholders with all requested information, unless this would be prejudicial to an overriding interest of the Company. If the Board of Management and the Supervisory Board invoke an overriding interest in refusing to provide information, reasons must be given. If a serious private bid is made for a business unit or a participating interest and the value of the bid exceeds a certain threshold (currently one-third of the amount of the assets according to the balance sheet and notes thereto or, if the Company prepares a consolidated balance sheet, according to the consolidated balance sheet and notes thereto as published in the last adopted annual accounts of the Company), and such bid is made public, the Board of Management shall, at its earliest convenience, make public its position on the bid and the reasons for this position.
A resolution to dissolve the Company or change its Articles of Association can be adopted at thea General Meeting of Shareholders by at least three- fourthsthree-fourths of the votes cast, at which meeting more than half of the issued share capital is represented. If the requisite share capital is not represented, a further meeting shall be convened, to be held within eight weeks of the first meeting, to which no quorum requirement applies. Furthermore, the resolution requires the approval of the Supervisory Board. If the resolution is proposed by the Board of Management, the adoption needs an absolute majority of votes and no quorum requirement applies to the meeting.
Repurchase and issue of (rights to) own shares
The 2013At the 2015 Annual General Meeting of Shareholders hasit was resolved to authorize the Board of Management, subject to the approval of the Supervisory Board, to acquire shares in the Company within the limits of the Articles of Association and within a certain price range up to and including November 2, 2014.6, 2016. The maximum number of shares the company may hold, will not exceed 10% of the issued share capital as of May 3, 2013,7, 2015, which number may be increased by 10% of the issued capital as of that same date in connection with the execution of share repurchase programs for capital reduction programs.
In addition, at the 20132015 Annual General Meeting of Shareholders it was resolved to authorize the Board of Management, subject to the approval of the Supervisory Board, to issue shares or grant rights to acquire shares in the Company as well as to restrict or exclude the pre-emption right accruing to shareholders up to and including November 2, 2014.6, 2016. This authorization is limited to a maximum of 10% of the number of shares issued as of May 3, 20137, 2015 plus 10% of the issued capital in connection with or on the occasion of mergers, and acquisitions.acquisitions and/or strategic alliances.
10.4 Logistics of the General11.4 Meeting of Shareholderslogistics and provision ofother information
Introduction
Pursuant to Dutch law, the record date for the exercise of the voting rights and the rights relating to General Meetings of Shareholders is set at the 28th day prior to the day of the meeting. Shareholders registered at such date are entitled to attend the meeting and to exercise the other shareholder rights (in the meeting in question) notwithstanding subsequent sale of their shares thereafter. This date will be published in advance of every General Meeting of Shareholders.
Information which is required to be published or deposited pursuant to the provisions of company law and securities law applicable to the Company and which is relevant to the shareholders, is placed and updated on the Company’s website, or hyperlinks are established. The Board of Management and Supervisory Board shall ensure that the General Meeting of Shareholders is informed of facts and circumstances relevant to proposed resolutions in explanatory notes to the agenda and, if deemed appropriate, by means of a ‘shareholders circular’ published on the Company’s website.
Resolutions adopted at a General Meeting of Shareholders shall be recorded by a civil law notary and co-signed by the chairman of the meeting; such
Annual Report 2015 123
Corporate governance 11.4
resolutions shall also be published on the Company’s website within 15 days after the meeting. A draft summary of the discussions during the General Meeting of Shareholders, in the language of the meeting, is made available to shareholders, on request, no later than three months after the meeting. Shareholders shall have the opportunity to respond to this summary for three months, after which a final summary is adopted by the chairman of the meeting in question. Such final summary shall be made available on the Company’s website.
Registration, attending meetings and proxy voting
Holders of common shares who wish to exercise the rights attached to their shares in respect of a General Meeting of Shareholders, are required to register for such meeting. Shareholders may attend a General Meeting of Shareholders in person, or may grant a power of attorney to a third partythird-party to attend the meeting and to vote on their behalf. TheHolders of common shares in bearer form will also be able to give voting instructions via Internet (assuming the agenda for such meeting includes voting items). In addition, the Company will also distribute a voting instruction form for a General Meeting of Shareholders (assumingShareholders. By giving voting instructions via Internet or by returning the agenda for such meeting includes voting items). By returning this form, shareholders grant power to an independent proxy holder who will vote according to the instructions expressly given on the voting instruction form. Also other persons entitled to vote shall be given the possibility to give voting proxies or instructions to an independent third partythird-party prior to the meeting. Details on the registration for meetings, attending and proxy voting will be included in the notice convening a General Meeting of Shareholders. The Dutch Shareholders Communication Channel decided to terminate its activities as per the end
Annual Report 2013 147
10 Corporate governance 10.4 - 10.4
of 2013. Their decision follows the entry into force of new legislation on July 1, 2013 which provides a legal basis in Dutch law for shareholder communication.
Preference shares and the Stichting Preferente Aandelen Philips
As a means to protect the Company and its stakeholders against an unsolicited attempt to obtain (de facto) control of the Company, the General Meeting of Shareholders in 1989 adopted amendments to the Company’s Articles of Association that allow the Board of Management and the Supervisory Board to issue (rights to) preference shares to a third party.third-party. As a result, the Stichting Preferente Aandelen Philips (the ‘Foundation’)Foundation) was created, which was granted the right to acquire preference shares in the Company. The mere notification that the Foundation wishes to exercise its rights, should a third partythird-party ever seem likely in the judgment of the Foundation to obtain (de facto) control of the Company, will result in the preference shares being effectively issued. The Foundation may exercise this right for as many preference shares as there are ordinary shares in the Company outstanding at that time. No preference shares have been issued as of December 31, 2013.2015. In addition, the Foundation has the right to file a petition with the Enterprise Chamber of the Amsterdam Court of Appeal to commence an inquiry procedure within the meaning of section 2:344 Dutch Civil Code.
The object of the Foundation is to represent the interests of the Company, the enterprises maintained by the Company and its affiliated companies within the Group, in such a way that the interests of Philips, those enterprises and all parties involved with them are safeguarded as effectively as possible, and that they are afforded maximum protection against influences which, in conflict with those interests, may undermine the autonomy and identity of Philips and those enterprises, and also to do anything related to the above ends or conducive to them. In the event of (an attempt at) a hostile takeover or other attempt to obtain (de facto) control of the Company this arrangement will allow the Company and its Board of Management and Supervisory Board to determine its position in relation to the third partythird-party and its plans, seek alternatives and defend Philips’ interests and those of its stakeholders from a position of strength. The members of the self-electingself- electing Board of the Foundation are Messrs S.D. de Bree, F.J.G.M. Cremers andP.A.F.W. Elverding, M.W. den Boogert.Boogert and F.J.G.M. Cremers. No Philips board members or officers are represented on the board of the Foundation.
The Company does not have any other anti-takeover measures in the sense of other measures which exclusively or almost exclusively have the purpose of frustrating future public bids for the shares in the capital of the Company in case no agreement is reached with the Board of Management on such public bid.
Furthermore, the Company does not have measures which specifically have the purpose of preventing a bidder who has acquired 75% of the shares in the capital of the Company from appointing or dismissing members of the Board of Management and subsequently amending the Articles of Association of the Company. It should be noted that also in the event of (an attempt at) a hostile takeover or other attempt to obtain (de facto) control of the Company, the Board of Management and the Supervisory Board are authorized to exercise in the interests of Philips all powers vested in them.
Audit of theAnnual financial reporting and the position of the external auditorstatements
The annual financial statements are prepared by the Board of Management and reviewed by the Supervisory Board upon the advice of its Audit Committee and taking into account the report of the external auditor. Upon approval by the Supervisory Board, the accounts are signed by all members of both the Board of Management and the Supervisory Board and are published together with the final opinion of the external auditor. The Board of Management is responsible, under the supervision of the Supervisory Board, for the quality and completeness of such publicly disclosed financial reports. The annual financial statements are presented for discussion and adoption toat the Annual General Meeting of Shareholders, to be convened subsequently. The Company, under US securities regulations, separately
124 Annual Report 2015
Corporate governance 11.4
files its Annual Report on Form 20-F, incorporating major parts of the Annual Report as prepared under the requirements of Dutch law.
Internal controls and disclosure policies
Comprehensive internal procedures, compliance with which is supervised by the Supervisory Board, are in place for the preparation and publication of the Annual Report, the annual accounts, the quarterly figures and ad hoc financial information. As from 2003, the internal assurance process for business risk assessment has been strengthened and the review frequency has been upgraded to a quarterly review cycle, in line with best practices in this area.
As part of these procedures, a Disclosure Committee has been appointed by the Board of Management to oversee the Company’s disclosure activities and to assist the Executive Committee in fulfilling its responsibilities in this respect. The Committee’s purpose is to ensure that the Company implements and maintains internal procedures for the timely collection, evaluation and disclosure, as appropriate, of information potentially subject to public disclosure under the legal, regulatory and stock exchange requirements to which the Company is subject. Such procedures are designed to capture information that is relevant to an assessment of the need to disclose developments and risks that pertain to the Company’s various businesses, and their effectiveness for this purpose will be reviewed periodically.
Auditor information
In accordance with the procedures laid down in the Philips Auditor Policy and as mandatorily required by Dutch law, the external auditor of the Company is appointed by the General Meeting of Shareholders on the proposal of the Supervisory Board, after the latter has been advised by the Audit Committee and the Board of Management. Under this Auditor Policy, as updated in 2013, the Supervisory Board and the Audit Committee assessesassess the functioning of the external auditor. The main conclusions of this assessment shall be communicated to the General Meeting of Shareholders for the purposes of assessing the nomination for the appointment of the external auditor.
The current auditor of the Company, KPMG Accountants N.V., was appointed by the 1995 General Meeting of Shareholders. In 2002, when the Auditor Policy was adopted, the appointment of KPMG Accountants N.V. was confirmed by the Supervisory Board for an additional three years. The 2008, 2011 and 20112014 General MeetingMeetings of Shareholders resolved to re-appoint KPMG Accountants N.V. as auditor.auditor, at the latest meeting up to and including the financial year 2015. Mr J.F.C. van EverdingenE.H.W. Weusten is the current partner of KPMG Accountants N.V. in charge of the audit duties for Philips.
The external auditor shall attend the2015 Annual General Meeting of Shareholders. Questions may be put to him atShareholders appointed Ernst & Young Accountants LLP as the meeting about his report. The BoardCompany’s new auditor as of Management andJanuary 1, 2016. Mr C.B. Boogaart is the Audit Committeecurrent partner of Ernst & Young Accountants LLP N.V. in charge of the Supervisory Board shall report on their dealings with the external auditor to the Supervisory Board on an annual basis, particularly with regard to the auditor’s independence. The Supervisory Board shall take this into account when deciding upon its nominationaudit duties for the appointment of an external auditor. New Dutch legislation on mandatory auditor rotation will become effective January 1, 2016, meaning the Company must engage a new audit firm for its statutory audit starting per January 1, 2016.Philips.
The external auditor attends, in principle, all meetings of the Audit Committee. The findings of the external auditor, the audit approach and the risk analysis are also discussed at these meetings. The external auditor attends the meeting of the Supervisory Board at which the report of the external auditor with respect to the audit of the annual accounts is discussed, and at which the annual accounts are approved. In its audit report on the annual accounts to the Board of Management and the Supervisory Board, the external auditor refers to the financial reporting risks and issues that were identified during the audit, internal control matters, and any other matters, as appropriate, requiring communication under the auditing and other standards generally accepted in the Netherlands and the US.
The external auditor shall attend the Annual General Meeting of Shareholders. Questions may be put to him at the meeting about his report. The Board of Management and the Audit Committee of the Supervisory Board shall report on their dealings with the external auditor to the Supervisory Board on an annual basis, particularly with regard to the auditor’s independence. The Supervisory Board shall take this into account when deciding upon its nomination for the appointment of an external auditor.
Auditor policy
New Dutch legislation, effective January 1, 2013, has been adopted onlaw requires the separation of audit and non-audit services, meaning the Company’s external auditor is no longer allowed to provide non-audit services, with an exception for non-audit service arrangements already in place on December 31, 2012.services. In light of this new Dutch legislation, the Auditor Policy was updated in 2013. The policy is published on the Company’s website. The policy is also in line with US Securities and Exchange Commission rules under which the appointed external auditor must be independent of the Company both in fact and appearance.
The Auditor Policy includes rules for the pre-approval by the Audit Committee of all services to be provided by the external auditor. Proposed services may be pre-approved at the beginning of the year by the Audit Committee (annual pre-approval) or may be pre-approved during the year by the Audit Committee in respect of a particular engagement (specific pre-approval). The annual pre-approval is based on a detailed, itemized list of services to be provided, designed to ensure that there is no management discretion in determining whether a service has been approved and to ensure the Audit Committee is informed of each services it is pre-approving. Unless pre-approval with respect to a specific service has been given at the beginning of the year, each proposed service requires specific pre-approval during the year. Any annually pre- approvedpre-approved services where the fee for
Annual Report 2015 125
Corporate governance 11.4
the engagement is expected to exceed pre-approved cost levels or budgeted amounts will also require specific pre-approval. The term of any annual pre-approval is 12 months
148 Annual Report 2013
10 Corporate governance 10.4 - 10.6
from the date of the pre-approval unless the Audit Committee states otherwise. During 2013,2015, there were no services provided to the Company by the external auditor which were not pre-approved by the Audit Committee.
10.511.5 Investor Relations
Introduction
The Company is continually striving to improve relations with its shareholders. In addition to communication with its shareholders at the Annual General Meeting of Shareholders, Philips elaborates its financial results during (public) conference calls, which are broadly accessible. It publishes informative annual, semi-annual and quarterly reports and press releases, and informs investors via its extensive website. The Company is strict in its compliance with applicable rules and regulations on fair and non-selective disclosure and equal treatment of shareholders.
Each yearFrom time to time the Company organizes Philipscommunicates with investors via road shows, broker conferences and a Capital Market Days and participates in several broker conferences,Markets Day, announced in advance on the Company’s website and by means of press releases.website. Shareholders can follow in real time, by means of webcasting or telephone lines, the meetings and presentations organized by the Company. Thus the Company applies recommendation IV.3.1 of the Dutch Corporate Governance Code, which in its perception and in view of market practice does not extend to less important analyst meetings and presentations. It is Philips’ policy to post presentations to analysts and shareholders on the Company’s website. These meetings and presentations will not take place shortly before the publication of annual, semi-annual and quarterly financial information.
Furthermore, the Company engages in bilateral communications with investors. These communications either take place either at the initiative of the Company or at the initiative of individual investors. During these communications theThe Company is generally represented by its Investor Relations department. However,department during these interactions, however, on a limited number of occasions the Investor Relations department is accompanied by one or more members of the Board of Management.senior management. The subject matter of the bilateral communications ranges from singleindividual queries from investors to more elaborate discussions on the back offollowing disclosures that the Company has made, such as its annual and quarterly reports. Also here, the Company is strict in its compliance with applicable rules and regulations on fair and non-selective disclosure and equal treatment of shareholders.
The Company shall not, in advance, assess, comment upon or correct, other than factually, any analyst’s reports and valuations. No fee(s) will be paid by the Company to parties for the carrying-out of research for analysts’ reports or for the production or publication of analysts’ reports, with the exception of credit-rating agencies.
Major shareholders and other information for shareholders
The Dutch Act on Financial Supervision imposes an obligation on persons holding certain interests to disclose (inter alia) percentage holdings in the capital and/or voting rights in the Company when such holdings reach, exceed or fall below 3, 5, 10, 15, 20, 25, 30, 40, 50, 60, 75 and 95 percent (as a result of an acquisition or disposal by a person, or as a result of a change in the company’s total number of voting rights or capital issued). Certain cash settled derivatives are also taken into account when calculating the capital interest. Pursuant to new legislation, effective July 1, 2013, theThe statutory obligation to disclose capital interest does not only relate to gross long positions, but also to gross short positions. Required disclosures must be made to the Netherlands Authority for the Financial Markets (AFM) without delay. The AFM then notifies such disclosures to the Company and includes them in a register which is published on the AFM’s website. Furthermore, an obligation to disclose (net) short positions is set out in the EU Regulation on Short Selling.
On July 1, 2013June 23, 2015 the Company received notification from the AFM that it had received disclosuresdisclosure under the Dutch Act on Financial Supervision of a substantial holding4.97% of 4.3%the voting rights by Dodge & Cox International Stock Fund.Cox. On August 14, 2013July 24, 2015 the Company received notification from the AFM that it had received disclosuresdisclosure under the Dutchsuch Act on Financial Supervision of a total shareholdingsubstantial holding of 3.01%4.06%, and 3.45%of 5% of the voting rights by BlackRockBlackrock, Inc. On January 3, 20147, 2016 the Company received notification from the AFM that it had received disclosuresdisclosure under the Dutchsuch Act on Financial Supervision of a substantial holding (and voting rights) of 3.08%4.99% by Norges Bank.Harris Associates L.P. As per December 31, 2013,2015, approximately 91% of the common shares were held in bearer form and approximately 9% of the common shares were represented by registered shares of New York Registry issued in the name of approximately 1,2181,124 holders of record, including Cede & Co. Cede & Co acts as nominee for the Depository Trust Company holding the shares (indirectly) for individual investors as beneficiaries. Citibank, N.A., 388 Greenwich Street, New York, New York 10013 is the transfer agent and registrar.
Only bearer shares are traded on the stock market of Euronext Amsterdam. Only shares of New York Registry are traded on the New York Stock Exchange. Bearer shares and registered shares may be exchanged for each other. Since certain shares are held by brokers and other nominees, these numbers may not be representative of the actual number of United States beneficial holders or the number of Shares of New York Registry beneficially held by US residents.
The provisions applicable to all corporate bonds that have been issued by the Company in March 2008 and 2012 contain a ‘Change of Control Triggering Event’. This
126 Annual Report 2015
Corporate governance 11.5
means that if the Company experienced such an event with respect to a series of corporate bonds the Company might be required to offer to purchase the bonds of that series at a purchase price equal to 101% of their principal amount, plus accrued and unpaid interest, if any.
Corporate seat and head office
The statutory seat of the Company is Eindhoven, the Netherlands, and the statutory list of all subsidiaries and affiliated companies, prepared in accordance with the relevant legal requirements (Dutch Civil Code, Book 2, Sections 379 and 414), forms part of the notes to the consolidated financial statements and is deposited at the office of the Commercial Register in Eindhoven, the Netherlands (file no. 17001910).
The executive offices of the Company are located at the BreitnerPhilips Center, Amstelplein 2, 1096 BC Amsterdam, the Netherlands, telephone 0031 (0)20 59 77 777.
Compliance with the Dutch Corporate Governance Code
In accordance with the governmental decreeDecree of December 10, 2009, the Company fully complies with the Dutch Corporate Governance Code and applies all its principles and best practice provisions that are addressed to the Board of Management or the Supervisory Board. The full text of the Dutch Corporate Governance Code can be found at the website of the Monitoring Commission Corporate Governance Code (www.commissiecorporategovernance.nl)(www.commissiecorporategovernance.nl).
February 25, 201423, 2016
10.611.6 Additional information
Set forth below is a summary of certain provisions of the Articles of Association of the Company, applicable Dutch law and related Company policies. This summary does not constitute legal advice regarding those matters and should not be regarded as such.
Articles of association
Object and purpose
The objects of the Company are to establish, participate in, administer and finance legal entities, companies and other legal forms for the purpose of the manufacture and trading of electrical, electronic, mechanical or chemical products, the development and exploitation of technical and other expertise, including software, or for the purpose of other activities, and to do everything pertaining thereto or connected therewith, including the provision of security in particular for commitments of business undertakings which belong to its group, all this in the widest sense, as may also be conducive to the proper continuity of the collectivity of business undertakings, in the Netherlands and abroad, which are carried on by the Company and the companies in which it directly or indirectly participates.
Share Capital
As of December 31, 2013,2015, the issued share capital consists only of common shares; no preference shares have been issued.
Voting rights
Each common share and each preference share is entitled to one vote. All common shares vote together on all voting matters presented at a General Meeting of Shareholders. Major shareholders do not have different voting rights than other shareholders.
Dividends
A dividend will first be declared on preference shares out of net income. The remainder of the net income, after reservations made with the approval of the Supervisory Board, shall be available for distribution to holders of common shares subject to shareholder approval after year-
Annual Report 2013 149
10 Corporate governance 10.6 - 10.6
end. The Board of Management has the power to determine what portion of the net income shall be retained by way of reserve, subject to the approval of the Supervisory Board. The remainder of the net income, after reservations made, shall be available for distribution to holders of common shares subject to shareholder approval after year-end.
Liquidation rights
In the event of the dissolution and liquidation of the Company, the assets remaining after payment of all debts and liquidation expenses are to be distributed in the following order of priority: to the holders of preference shares, the amount paid thereon; and the remainder to the holders of the common shares.
Preemptive rights
Shareholders have a pro rata preferential right of subscription to any common share issuance unless the right is restricted or excluded. If designated by the General Meeting of Shareholders, the Board of Management has the power to restrict or exclude the preferential subscription rights. A designation of the Board of Management will be effective for a specified period of up to five years and may be renewed. Currently, the Board of Management has been granted the power to restrict or exclude the preferential right of subscription up to and including November 2, 2014.6, 2016. If the Board of Management has not been designated, the General Meeting of Shareholders has the power to restrict or exclude such rights, upon the proposal of the Board of Management, which proposal must be approved by the Supervisory Board. Resolutions by the General Meeting of Shareholders referred to in this paragraph require approval of at least two-thirds of the votes cast if less than half of the issued share capital is represented at the meeting.
The foregoing provisions also apply to the issuance of rights to subscribe for shares.
General Meeting of Shareholders
The ordinaryAnnual General Meeting of Shareholders shall be held each year not later than the thirtieth day of June and, at the Board of Management’s option, in Eindhoven, Amsterdam, The Hague, Rotterdam,
Annual Report 2015 127
Corporate governance11.6
Utrecht or Haarlemmermeer (including Schiphol airport); the notice convening the meeting shall inform the shareholders accordingly.
Without prejudice to applicable laws and regulations, the Board of Management may resolve to give notice to holders of bearer shares via the Company’s website and/or by other electronic means representing a public announcement, which announcement remains directly and permanently accessible until the general meeting.General Meeting of shareholders. Holders of registered shares shall be notified by letter, unless the Board of Management resolves to give notice to holders of registered shares by electronic means of communication by sending a legible and reproducible message to the address indicated by the shareholder to the Company for such purpose provided the relevant shareholder has agreed hereto.
In principle all shareholders are entitled to attend the General Meeting of Shareholders, to address the meeting and to vote, except for shares held in treasury by the Company. They may exercise the aforementioned rights at a meeting only for the common shares which on the record date are registered in their name. The record date is published in the above announcement. Holders of registered shares must advise the Company in writing of their intention to attend the General Meeting of Shareholders. Holders of bearer shares who either in person or by proxy wish to attend the General Meeting of Shareholders, should notify ABN AMRO Bank N.V. acting as agent for the Company. They must submit a confirmation by a participating institution, in which administration they are registered as holders of the shares, that such shares are registered and will remain registered in its administration up to and including the record date, whereupon the holder will receive an admission ticket for the General Meeting of Shareholders. Holders of shares who wish to attend by proxy have to submit the proxy at the same time. A participating institution is a bank or broker which according to the Dutch Securities Depository Act (‘Wet giraal effectenverkeer’) is a participating institution (‘aangesloten instelling’) of Nederlands Centraal Instituut voor Giraal Effectenverkeer B.V. (Euroclear Nederland).
In connection with the General Meeting of Shareholders, the Company doesn’t solicit proxies within the United States.
The Articles of Association of the Company provide that there are no quorum requirements to hold a general meetingGeneral Meeting of Shareholders and, unless specified otherwise in the articles of association of the Company, resolutions of the General Meeting of Shareholders shall be adopted by a simple majority of votes. Certain shareholder actions and certain resolutions may require a quorum.
Limitations on right to hold or vote Common Shares
There are no limitations imposed by Dutch law or by the Articles of Association on the right of non-resident owners to hold or vote the Common Shares.
Exchange controls
Cash dividends payable in Euros on Netherlands registered shares and bearer shares may be officially transferred from the Netherlands and converted into any other currency without Dutch legal restrictions, except that for statistical purposes such payments and transactions must be reported to the Dutch Central Bank, and furthermore, no payments, including dividend payments, may be made to jurisdictions subject to sanctions adopted by the government of the Netherlands and implementing resolutions of the Security Council of the United Nations.
The Articles of Association of the Company provide that cash distributions on Shares of New York Registry shall be paid in US dollars, converted at the rate of exchange on the stock market of Euronext Amsterdam at the close of business on the day fixed and announced for that purpose by the Board of Management.
General
The corporate governance rules introduced by the New York Stock Exchange (“NYSE”) allow foreign private issuers, like the Company, to follow home country practices on most corporate governance matters instead of those that apply to US domestic issuers, provided that they disclose any significant ways in which their corporate governance practices differ from those applying to listed domestic US companies under the NYSE listing standards. A summary of significant differences between certain Dutch practices on corporate governance matters and the corporate governance provisions applicable to US companies under the NYSE listing standards appears below.
Dutch corporate governance provisions
The Company is a company organized under Dutch law, with its Common Shares listed on Euronext Amsterdam, and is subject to the Dutch Corporate Governance Code of December 10, 2008 (the ‘Dutch Corporate Governance Code’). Philip’s New York Registry Shares, representing Common Shares of the Company, are listed on the NYSE.
Board structure
The NYSE listing standards prescribe regularly scheduled executive sessions of non-executive directors. As a Dutch company, theThe Company has a two-tier corporate structure consisting of a Board of Management consisting of executive directors under the supervision of a Supervisory Board consisting exclusively of non-executive directors. Members of the Board of Management and other officers and employees cannot simultaneously act as member of the Supervisory Board. The Supervisory Board must approve specified decisions of the Board of Management.
128 Annual Report 2015
Corporate governance 11.6
Independence of members of our Supervisory Board
Under the Dutch Corporate Governance Code all members of the Supervisory Board with the exception of not more than one person, must be independent. The present members of our Supervisory Board are all independent within the meaning of the Dutch Corporate Governance Code. The definitions of independence under the Dutch Corporate Governance Code, however, differ in their details from the definitions of independence under the NYSE listing standards. In some cases the Dutch requirements are stricter than the NYSE listing standards and in other cases the NYSE listing standards are the stricter of the two.
Committees of our Supervisory Board
The Company has established an Audit Committee, a Remuneration Committee and a Corporate Governance and Nomination & Selection Committee, consisting of members of the Supervisory Board only. The roles, responsibilities and composition of these committees reflect the requirements of the Dutch Corporate Governance Code, the company’s Articles of Association and Dutch law, which differ from the NYSE listing standards in these respects. In 2015, the Supervisory Board additionally established the Separation Committee and Quality & Regulatory Committee. The role of each committee is to advise the Supervisory Board and to prepare the decision-making of the Supervisory Board. In principle, the entire Supervisory Board remains responsible for its decisions even if they were prepared by one of the Supervisory Board’s committees.
The NYSE requires that, when an audit committee member of a U.S.US domestic listed company serves on four or more audit committees of public companies, the listed company should disclose (either on its website or in its annual reportAnnual Report on Form 10-K) that the board of directors has determined that this simultaneous service would not impair the director’s service to the listed company. Dutch law does not require the Company to make such a determination.
150 Annual Report 2013
10 Corporate governance 10.6 - 10.6
In accordance with the procedures laid down in the Philips Auditor Policy and as mandatorily required by Dutch law, the external auditor of the Company is appointed by the General Meeting of Shareholders on the proposal of the Supervisory Board, after the latter has been advised by the Audit Committee and the Board of Management.
Major shareholders as filed with SEC
On February 22, 2010, Southeastern Asset Management, Inc. filed a Schedule 13G with the SEC indicating that it beneficially owned 4.9% (representing 47,838,028 shares) of the Company’s common shares. On February 6, 2012, Southeastern Asset Management Inc. filed a Schedule 13G with the SEC indicating that it beneficially owned 7.1% (representing 72,051,468 shares) of the Company’s common shares. On February 10, 2012, Dodge & Cox filed a Schedule 13G with the SEC indicating that it beneficially owned 5.3% (representing 53,180,318 shares) of the Company’s common shares. On January 30, 2013, BlackRock Inc. filed a Schedule 13G with the SEC indicating that it beneficially owned 5.09% (48,728,999 shares) of the Company’s common shares. On February 13, 2013, Dodge and& Cox filed a Schedule 13G with the SEC indicating that it beneficially owned 6.7% (63,848,817 shares) of the Company’s common shares. On February 14, 2013, Southeastern Asset Management Inc. filed a Schedule 13G with the SEC indicating that it beneficially owned 6.5% (62,001,965 shares) of the Company’s common shares. On March 11, 2013, BlackRock Inc. filed a Schedule 13G with the SEC indicating that it beneficially owned 4.73% (45,264,486 shares) of the Company’s common shares. On August 9, 2013, Southeastern Asset Management Inc. filed a Schedule 13G with the SEC indicating that beneficially owned 4.93% (48,050,0713 shares) of the Company’s common shares. On February 13, 2014, Dodge & Cox filed a Schedule 13G with the SEC indicating that it beneficially owned 5.7% (53,107,793 shares) of the Company’s common shares. On February 13, 2015, Southeastern Asset Management Inc. filed a Schedule 13G with the SEC indicating that it beneficially owned 5.4% (50,880,362 shares) of the Company’s common shares. On February 13, 2015, Dodge & Cox filed a Schedule 13G with the SEC indicating that it beneficially owned 6.3% (59,366,413 shares) of the Company’s common shares. On July 10, 2015, Southeastern Asset Management Inc. filed a Schedule 13G with the SEC indicating that it beneficially owned 4.6% (44,012,103 shares) of the Company’s common shares. On January 22, 2016, BlackRock Inc. filed a Schedule 13G with the SEC indicating that it beneficially owned 6.0% (55,645,648 shares) of the Company’s common shares. On February 12, 2016, Dodge & Cox filed a Schedule 13G with the SEC indicating that it beneficially owned 3.4% (31,421,723 shares) of the Company’s common shares. Please also refer to ‘Major shareholders and other information for shareholders’ in section 11.5, Investor Relations, of this report.
Equity compensation plans
The Company complies with Dutch legal requirements regarding shareholder approval of equity compensation plans. Dutch law does not require shareholder approval of certain equity compensation plans for which the NYSE listing standards would require such approval. The Company is subject to a requirement to seek shareholder approval for equity compensation-plans for its members of the Board of Management.
Code of business conduct
The listing standards of the NYSE prescribe certain parameters for listed company codes of business conduct and ethics. The Company has implemented the Philips General Business Principles applicable to all employees and a Financial Code of Ethics applicable to all employees performing an accounting or financial function. Waivers granted to Senior (Financial) Officers (as defined in our Financial Code of Ethics) will be disclosed. In 20132015 the Company did not grant any waivers of the Financial Code of Ethics.
KPMG
Annual Report 2013 151
Performance Statements
152 Annual Report 2013
Notes overview
From June 2014 to October 2015, KPMG Accountants N.V. (KPMG), the Company’s independent registered public accounting firm, had a Chief Executive Officer who was the Chief Financial Officer of Philips in the period 1997-2005. The former KPMG CEO receives a monthly pension payment, which is immaterial to his net worth, from the Philips Pension Fund. The Philips
Annual Report 2013 1532015 129
11 GroupCorporate governance 11.6
Pension Fund is a separate and financially independent entity with an independent Board of Trustees who are legally responsible to safeguard the retirement benefits of the participants of the Philips Pension Fund. Royal Philips is not liable for any financial deficits of the Philips Pension Fund and Royal Philips has no discretion over the level and payments of benefits to participants. The Philips Pension Fund is considered an affiliate of Philips under SEC independence rules, which are applicable to KPMG audit of Philips, and accordingly, the financial relationship violates the US Securities and Exchange Commission’s regulations. KPMG is not the independent auditor of the Philips Pension Fund. KPMG has put in place a process whereby the KPMG CEO is not in the chain of command with respect to the Philips’ audit or the ratings or compensation of partners who work on the Philips’ audit. KPMG has advised Philips’ management and its audit committee that this situation, considering the actions taken by the firm, does not impact the firm’s ability to apply objective and impartial judgment on all matters encompassed within their annual audits of Philips. Philips’ audit committee concurs that this financial relationship does not impact the firm’s ability to apply objective and impartial judgment on all matters encompassed within the annual audits of Philips.
Change in Registrant’s Certifying Accountant
The 2015 Annual General Meeting of Shareholders appointed Ernst & Young Accountants LLP (“EY”) as the Company’s new auditor as of January 1, 2016. Under Dutch legislation on mandatory auditor rotation (in effect at the time of the 2015 AGM), the Company was required to engage a new audit firm for its statutory audit for the financial year starting January 1, 2016. The Audit Committee, jointly with management, conducted a comprehensive tender and selection process for a new external auditor (incorporating an interim period of one year with the current external auditor) and resolved to recommend to the Supervisory Board the appointment of a new auditor. This resulted in the Supervisory Board proposing and recommending the appointment of EY as the company’s new auditor at the 2015 Annual General Meeting of Shareholders, which was held on May 7, 2015.
KPMG Accountants N.V.(“KPMG”) was previously the Company’s auditor and, following the Dutch legislation on mandatory auditor rotation, declined to stand for re-election. During the years ended 31 December 2014 and 2013 (1) KPMG has not issued any reports on the financial statements 11 - 11.1.2of the Company or on the effectiveness of internal control over financial reporting that contained an adverse opinion or a disclaimer of opinion, nor were the auditors’ reports of KPMG qualified or modified as to uncertainty, audit scope, or accounting principles, and (2) there has not been any disagreement over any matter of accounting principles or practices, financial statement disclosure, or auditing scope or procedures, which disagreement if not resolved to KPMG’s satisfaction would have caused it to make reference to the subject matter of the disagreement in connection with its auditors’ reports, or any “reportable event” as described in Item 16F(a)(1)(v) of Form 20-F.
The Company has provided KPMG with a copy of the foregoing disclosure and has requested that KPMG furnish the Company with a letter addressed to the SEC stating whether it agrees with such disclosure and, if not, stating the respects in which it does not agree. A copy of the letter, dated 23 February 2016, in which KPMG states that they agree with such disclosure, is filed herewith as Exhibit 15 (b).
130 Annual Report 2015
Groupfinancial statements 12
1112 Group financial statements
Introduction
This section of the Annual Report contains the audited consolidated financial statements including the notes thereon that have been prepared in accordance with International Financial Reporting Standards (IFRS) as endorsed by the European Union (EU) and with the statutory provisions of Part 9, Book 2 of the Dutch Civil Code. All standards and interpretations issued by the International Accounting Standards Board (IASB) and the IFRS Interpretations Committee effective year-end 20132015 have been endorsed by the EU, except that the EU did not adopt some paragraphs of IAS 39 applicable to certain hedge transactions. Philips has no hedge transactions to which these paragraphs are applicable. Consequently, the accounting policies applied by Philips also comply fully with IFRS as issued by the IASB.
Together with the section Company financial statements, this section contains the statutory financial statements of the Company.
The following sections and chapters:
chapter 1, Accelerate!,4, Our strategic focus, of this report
chapter 2, Building a great company, of this report
chapter 3, Delivering innovation that matters to you, of this report
chapter 4,5, Group performance, of this report
chapter 5,6, Sector performance, of this report
chapter 6,7, Risk management, of this report
chapter 10, Supervisory Board report, of this report
section 9.1,10.1, Report of the Corporate Governance and Nomination & Selection Committee, of this report
section 9.2,10.2, Report of the Remuneration Committee, of this report
chapter 10,11, Corporate governance, of this report
Forward-looking statements, of this report
form the Management report within the meaning of section 2:391 of the Dutch Civil Code (and related Decrees).
The sections Group performance and Sector performance provide an extensive analysis of the developments during the financial year 20132015 and the results. The term EBIT has the same meaning as Income from operations (IFO), and is used to evaluate the performance of the business. These sections also provide information on the business outlook, investments, financing, personnel and research and development activities.
The Statement of income included in the section Company financial statements has been prepared in accordance with section 2:402 of the Dutch Civil Code, which allows a simplified Statement of income in the Company financial statements in the event that a comprehensive Statement of income is included in the consolidated Group financial statements.
For ‘Additional information’ within the meaning of section 2:392 of the Dutch Civil Code, please refer to section 13.5, Independent auditor’s report, - Group on the Group financial statements, section 12.5, Independent auditor’s report - Company, of this report, on the Company financial statements, section 4.4,5.4, Proposed distribution to shareholders, of this report, and note 36,32, Subsequent events.
Please refer to Forward-looking statements, of this report for more information about forward-looking statements, third-party market share data, fair value information, and revisions and reclassifications.
The Board of Management of the Company hereby declares that, to the best of our knowledge, the Group financial statements and Company financial statements give a true and fair view of the assets, liabilities, financial position and profit or loss of the Company and the undertakings included in the consolidation taken as a whole and that the management report referred to above gives a true and fair view concerning the position as per the balance sheet date, the development and performance of the business during the financial year of the Company and the undertakings included in the consolidation taken as a whole, together with a description of the principal risks that they face.
Board of Management
Frans van Houten
Ron WirahadiraksaAbhijit Bhattacharya
Pieter Nota
February 25, 201423, 2016
Annual Report 2015 131
Group financial statements12.1
11.112.1 Management’s report on internal control
Management’s report on internal control over financial reporting pursuant to section 404 of the US Sarbanes-Oxley Act
The Board of Management of Koninklijke Philips N.V. (the Company) is responsible for establishing and maintaining an adequate system of internal control over financial reporting (as such term is defined in Rule 13a-15(f) under the US Securities Exchange Act). Internal control over financial reporting is a process to provide reasonable assurance regarding the reliability of our financial reporting for external purposes in accordance with IFRS as issued by the IASB.
Internal control over financial reporting includes maintaining records that, in reasonable detail, accurately and fairly reflect our transactions; providing reasonable assurance that transactions are recorded as necessary for preparation of our financial statements; providing reasonable assurance that receipts and expenditures of company assets are made in accordance with management authorization; and providing reasonable assurance that unauthorized acquisition, use or disposition of company assets that could have a material effect on our financial statements would be prevented or detected on a timely basis. Because of its inherent limitations, internal control over financial reporting is not intended to provide absolute assurance that a misstatement of our financial statements would be prevented or detected. Also, projections of any evaluation of the effectiveness of internal control over financial reporting to future periods are subject to the risk that the controls may become inadequate because of changes in conditions, or that the degree of compliance with the policies or procedures may deteriorate.
The Board of Management conducted an assessment of the Company’s internal control over financial reporting based on the “Internal Control-Integrated Framework (1992)(2013)” established by the Committee of Sponsoring Organizations of the Treadway Commission (COSO). Based on that assessment, the Board of Management concluded that, as of December 31, 2013,2015, the Company’s internal control over Group financial reporting is considered effective.
The effectiveness of the Company’s internal control over financial reporting as of December 31, 2013,2015, as included in this section Group financial statements, has been audited by KPMG Accountants N.V., an independent registered public accounting firm, as stated in their report which follows hereafter.
Board of Management
Frans van Houten
Ron WirahadiraksaAbhijit Bhattacharya
Pieter Nota
February 25, 201423, 2016
11.1.112.1.1 Disclosure controls and procedures
The Company’s Chief Executive Officer and Chief Financial Officer have evaluated the effectiveness of the design and operation of the Company’s disclosure controls and procedures (as defined in Rules 13a-15(e) and 15d-15(e) under the Securities Exchange Act of 1934) as of the end of the period covered by the Annual Report. Based on that evaluation, the Chief Executive Officer and Chief Financial Officer have concluded that these disclosure controls and procedures are effective as of December 31, 2013.2015.
11.1.212.1.2 Changes in internal control over financial reporting
During the year ended December 31, 2013,2015, there have been no changes in our internal control over financial reporting that have materially affected, or are reasonably likely to materially affect, our internal control over financial reporting.
154 Annual Report 2013
11 Group financial statements 11.2 - 11.3
11.2 Reports12.2 Report of the independent auditor
Management’s report on internal control over financial reporting is set out in section 12.1, Management’s report on internal control, of this report. The report set out belowin sub-section 12.3.2, Independent auditors’ report on internal control over financial reporting, of this report, is provided in compliance with auditing standards of the Public Company Accounting Oversight Board in the US and includes an opinion on the effectiveness of internal control over financial reporting as at December 31, 2013. Management’s report on internal control over financial reporting is set out in section 11.1, Management’s report on internal control, of this Annual Report. 2015.
KPMG Accountants N.V. has also issued a report on the consolidated financial statements in accordance with the standards of the Public Company Accounting Oversight Board in the US, which is set out in 11.10,sub-section 12.3.1, Independent auditors’report - Group,auditors’ report on the consolidated financial statements, of this Annual Report. report.
KPMG Accountants N.V. has also issued reportsa report on the consolidated financial statements and the Company financial statements, in accordance with Dutch law, including the Dutch standards on auditing, and on the Company Financial Statements of Koninklijke Philips N.V., which is set out in section 13.5, Independent auditor’s report, of this report.
132 Annual Report 2015
Group financial statements 12.3
11.3 Auditor’s report12.3 Independent auditors’ reports on the consolidated financial statements and on internal control over financial reporting
12.3.1 Independent auditors’ report on the consolidated financial statements
Report of Independent Registered Public Accounting Firm
To theTo: The Supervisory Board and Shareholders of Koninklijke Philips N.V.:
We have audited the accompanying consolidated balance sheets of Koninklijke Philips N.V. and subsidiaries’subsidiaries as of December 31, 2015 and 2014, and the related consolidated statements of income, comprehensive income, cash flows, and changes in equity for each of the years in the three-year period ended December 31, 2015. These consolidated financial statements are the responsibility of the Koninklijke Philips N.V.’s management. Our responsibility is to express an opinion on these consolidated financial statements based on our audits.
We conducted our audits in accordance with the standards of the Public Company Accounting Oversight Board (United States). Those standards require that we plan and perform the audit to obtain reasonable assurance about whether the financial statements are free of material misstatement. An audit includes examining, on a test basis, evidence supporting the amounts and disclosures in the financial statements. An audit also includes assessing the accounting principles used and significant estimates made by management, as well as evaluating the overall financial statement presentation. We believe that our audits provide a reasonable basis for our opinion.
In our opinion, the consolidated financial statements referred to above present fairly, in all material respects, the financial position of Koninklijke Philips N.V. and subsidiaries as of December 31, 2015 and 2014, and the results of their operations and their cash flows for each of the years in the three-year period ended December 31, 2015, in conformity with International Financial Reporting Standards as issued by the International Accounting Standards Board.
We also have audited, in accordance with the standards of the Public Company Accounting Oversight Board (United States), Koninklijke Philips N.V.’s internal control over financial reporting as of December 31, 2013,2015, based on criteria established in Internal Control — Integrated Framework (1992)(2013) issued by the Committee of Sponsoring Organizations of the Treadway Commission (COSO), and our report dated February 23, 2016, expressed an unqualified opinion on the effectiveness of the Koninklijke Philips N.V.’s internal control over financial reporting.
Amsterdam, The Netherlands
February 23, 2016
/s/ KPMG Accountants N.V.
Note that the report set out above is included for the purpose of Koninklijke Philips N.V.’s Annual Report on Form 20-F for 2015 only and does not form part of Koninklijke Philips N.V.’s Annual Report for 2015.
Annual Report 2015 133
Group financial statements 12.3.2
12.3.2 Independent auditors’ report on internal control over financial reporting
Report of Independent Registered Public Accounting Firm
To: The Supervisory Board and Shareholders of Koninklijke Philips N.V.
We have audited Koninklijke Philips N.V.’s internal control over financial reporting as of December 31, 2015, based on criteria established in Internal Control — Integrated Framework (2013) issued by the Committee of Sponsoring Organizations of the Treadway Commission (COSO). Koninklijke Philips N.V.’s Board of Managementmanagement is responsible for maintaining effective internal control over financial reporting and for its assessment of the effectiveness of internal control over financial reporting, included in the accompanying section 11.1,12.1, “ “Management’sManagement’s report on internal control”control”, of this Form 20-F. Our responsibility is to express an opinion on the Company’s internal control over financial reporting based on our audit.
We conducted our audit in accordance with the standards of the Public Company Accounting Oversight Board (United States). Those standards require that we plan and perform the audit to obtain reasonable assurance about whether effective internal control over financial reporting was maintained in all material respects. Our audit included obtaining an understanding of internal control over financial reporting, assessing the risk that a material weakness exists, and testing and evaluating the design and operating effectiveness of internal control based on the assessed risk. Our audit also included performing such other procedures as we considered necessary in the circumstances. We believe that our audit provides a reasonable basis for our opinion.
A company’s internal control over financial reporting is a process designed to provide reasonable assurance regarding the reliability of financial reporting and the preparation of financial statements for external purposes in accordance with generally accepted accounting principles. A company’s internal control over financial reporting includes those policies and procedures that (1) pertain to the maintenance of records that, in reasonable detail, accurately and fairly reflect the transactions and dispositions of the assets of the company; (2) provide reasonable assurance that transactions are recorded as necessary to permit preparation of financial statements in accordance with generally accepted accounting principles, and that receipts and expenditures of the company are being made only in accordance with authorizations of management and directors of the company; and (3) provide reasonable assurance regarding prevention or timely detection of unauthorized acquisition, use, or disposition of the company’s assets that could have a material effect on the financial statements.
Because of its inherent limitations, internal control over financial reporting may not prevent or detect misstatements. Also, projections of any evaluation of effectiveness to future periods are subject to the risk that controls may become inadequate because of changes in conditions, or that the degree of compliance with the policies or procedures may deteriorate.
In our opinion, Koninklijke Philips N.V. and subsidiaries maintained, in all material respects, effective internal control over financial reporting as of December 31, 2013,2015, based on criteria established in Internal Control — Integrated Framework (1992)(2013) issued by the Committee of Sponsoring Organizations of the Treadway Commission (COSO).
We also have audited, in accordance with the standards of the Public Company Accounting Oversight Board (United States), the consolidated balance sheets of Koninklijke Philips N.V. and subsidiaries as of December 31, 20132015 and 2012,2014, and the related consolidated statements of income, comprehensive income, cash flows, and changes in equity for each of the years in the three-year period ended December 31, 2013,2015, and our report dated February 25, 2014,23, 2016, expressed an unqualified opinion on those consolidated financial statements.
KPMG Accountants N.V.
Amsterdam, The Netherlands
February 25, 201423, 2016
/s/ KPMG Accountants N.V.
134 Annual Report 2013 1552015
11 Group financial statements 11.4 - 11.412.4
11.412.4 Consolidated statements of income
in millions of euros unless otherwise stated
| | | | | | | | | | | | | | |
| | Philips Group | | | | | | | | | | | | |
| | | Consolidated statements of incomein millions of EUR unless otherwise stated For the years ended December 31 | | | | |
| | | | | | |
| | | | | 2013 | | | 2014 | | | 2015 | |
| | | | | | |
| | Sales | | | 21,990 | | | | 21,391 | | | | 24,244 | |
| | Cost of sales | | | (12,653 | ) | | | (13,185 | ) | | | (14,388 | ) |
| | | | | | |
| | | | |
| | Gross margin | | | 9,337 | | | | 8,206 | | | | 9,856 | |
| | | | |
| | Selling expenses | | | (5,057 | ) | | | (5,124 | ) | | | (5,815 | ) |
| | Research and development expenses | | | (1,659 | ) | | | (1,635 | ) | | | (1,927 | ) |
| | General and administrative expenses | | | (825 | ) | | | (747 | ) | | | (1,209 | ) |
| | Impairment of goodwill | | | (28 | ) | | | (3 | ) | | | — | |
| | Other business income | | | 122 | | | | 63 | | | | 137 | |
| | Other business expenses | | | (35 | ) | | | (274 | ) | | | (50 | ) |
| | | | | | |
| | | | |
 | | Income from operations | | | 1,855 | | | | 486 | | | | 992 | |
| | | | |
 | | Financial income | | | 70 | | | | 114 | | | | 98 | |
| | | Financial expenses | | | (400 | ) | | | (415 | ) | | | (467 | ) |
| | | | | | |
| | | | |
| | Income before taxes | | | 1,525 | | | | 185 | | | | 623 | |
| | | | |
 | | Income tax expense | | | (466 | ) | | | (26 | ) | | | (239 | ) |
| | | | | | |
| | | | |
| | Income after taxes | | | 1,059 | | | | 159 | | | | 384 | |
 | | Results relating to investments in associates: | | | | | | | | | | | | |
| | Company’s participation in income | | | 5 | | | | 30 | | | | 10 | |
| | Other results | | | (30 | ) | | | 32 | | | | 20 | |
| | | | | | |
| | | | |
| | Income from continuing operations | | | 1,034 | | | | 221 | | | | 414 | |
| | | | |
 | | Discontinued operations - net of income tax | | | 138 | | | | 190 | | | | 245 | |
| | | | | | |
| | | | |
| | Net income | | | 1,172 | | | | 411 | | | | 659 | |
| | | | |
| | Attribution of net income (loss) | | | | | | | | | | | | |
| | Net income attributable to Koninklijke Philips N.V. shareholders | | | 1,169 | | | | 415 | | | | 645 | |
| | Net income attributable to non-controlling interests | | | 3 | | | | (4 | ) | | | 14 | |
| | | | | | |
| | | | |
| | Philips Group | | | | | | | | | | | | |
| | | Earnings per common share attributable to shareholders1)in EUR unless otherwise stated For the years ended December 31 | | | | |
| | | | | | |
| | | | | 2013 | | | | 2014 | | | | 2015 | |
| | | | | | |
| | Basic earnings per common share in EUR | | | | | | | | | | | | |
 | | Income from continuing operations attributable to shareholders | | | 1.13 | | | | 0.25 | | | | 0.44 | |
| | | Net income attributable to shareholders | | | 1.28 | | | | 0.45 | | | | 0.70 | |
| | | | |
| | Diluted earnings per common share in EUR | | | | | | | | | | | | |
| | | Income from continuing operations attributable to shareholders | | | 1.12 | | | | 0.24 | | | | 0.43 | |
| | | Net income attributable to shareholders | | | 1.27 | | | | 0.45 | | | | 0.70 | |
| | | | | | |
| | | | | | | | | | | | | | |
| | | Consolidated statements of income of the Philips Group for the years ended December 31 | | | | |
| | | | | 2011 | | | 2012 | | | 2013 | |
| | Sales | | | 20,992 | | | | 23,457 | | | | 23,329 | |
| | Cost of sales | | | (12,732 | ) | | | (14,466 | ) | | | (13,641 | ) |
| | | | | | |
| | | | |
| | Gross margin | | | 8,260 | | | | 8,991 | | | | 9,688 | |
| | | | |
| | Selling expenses | | | (5,025 | ) | | | (5,334 | ) | | | (5,075 | ) |
| | General and administrative expenses | | | (802 | ) | | | (845 | ) | | | (949 | ) |
| | Research and development expenses | | | (1,605 | ) | | | (1,831 | ) | | | (1,733 | ) |
 | | Impairment of goodwill | | | (1,355 | ) | | | — | | | | (28 | ) |
| | Other business income | | | 124 | | | | 275 | | | | 123 | |
| | Other business expenses | | | (76 | ) | | | (608 | ) | | | (35 | ) |
| | | | | | |
| | | | |
 | | Income from operations | | | (479 | ) | | | 648 | | | | 1,991 | |
| | | | |
 | | Financial income | | | 113 | | | | 106 | | | | 70 | |
| | | Financial expenses | | | (444 | ) | | | (435 | ) | | | (400 | ) |
| | | | | | |
| | | | |
| | Income before taxes | | | (810 | ) | | | 319 | | | | 1,661 | |
| | | | |
 | | Income tax expense | | | (251 | ) | | | (185 | ) | | | (466 | ) |
| | | | | | |
| | | | |
| | Income (loss) after taxes | | | (1,061 | ) | | | 134 | | | | 1,195 | |
 | | Results relating to investments in associates: | | | | | | | | | | | | |
| | - Company’s participation in income | | | 18 | | | | (5 | ) | | | 5 | |
| | - Other results | | | (3 | ) | | | (206 | ) | | | (30 | ) |
| | | | | | |
| | | | |
| | Income (loss) from continuing operations | | | (1,046 | ) | | | (77 | ) | | | 1,170 | |
| | | | |
 | | Discontinued operations - net of income tax | | | (410 | ) | | | 47 | | | | 2 | |
| | | | | | |
| | | | |
| | Net income (loss) | | | (1,456 | ) | | | (30 | ) | | | 1,172 | |
| | | | |
| | Attribution of net income (loss) | | | | | | | | | | | | |
| | Net income (loss) attributable to shareholders | | | (1,460 | ) | | | (35 | ) | | | 1,169 | |
| | Net income (loss) attributable to non-controlling interests | | | 4 | | | | 5 | | | | 3 | |
| | | | |
| | Earnings per common share attributable to shareholders | | | | | | | | | | | | |
| | | | | 2011 | | | | 2012 | | | | 2013 | |
| | Basic earnings per common share in euros | | | | | | | | | | | | |
 | | Income (loss) from continuing operations attributable to shareholders | | | (1.10 | ) | | | (0.09 | ) | | | 1.28 | |
| | | Net income (loss) attributable to shareholders | | | (1.53 | ) | | | (0.04 | ) | | | 1.28 | |
| | | | |
| | Diluted earnings per common share in euros1) | | | | | | | | | | | | |
| | | Income (loss) from continuing operations attributable to shareholders | | | (1.10 | ) | | | (0.09 | ) | | | 1.27 | |
| | | Net income (loss) attributable to shareholders | | | (1.53 | ) | | | (0.04 | ) | | | 1.27 | |
Prior-period financial statements have been restated for the treatment of Audio, Video, Multimedia and Accessories as discontinued operations (see note 7, Discontinued operations and other assets classified as held for sale) and the adoption of IAS 19R, which mainly relates to accounting for pensions (see note 30, Post-employment benefits). The accompanying notes are an integral part of these consolidated financial statements.
| 1) | The Dilutive potential common shares are not taken into accountShareholders in the periods for which there is a loss, as the effect would be antidilutivethis table refer to shareholders of Koninklijke Philips N.V.
|
156 Annual Report 20132015 135
11 Group financial statements 11.5 - 11.512.5
11.512.5 Consolidated statements of comprehensive income
in millions of euros unless otherwise stated
| | Consolidated statements of comprehensive income of the Philips Group for the years ended December 31 | | | | |
| Philips Group | | Philips Group | | | |
Consolidated statements of comprehensive incomein millions of EUR unless otherwise stated For the years ended December 31 | | Consolidated statements of comprehensive incomein millions of EUR unless otherwise stated For the years ended December 31 | | | |
| | | | | |
| | | 2011 | | 2012 | | 2013 | | | 2013 | | 2014 | | 2015 | |
| Net income (loss) for the period | | | (1,456 | ) | | | (30 | ) | | | 1,172 | | |
| Other comprehensive income items that will not be reclassified to profit or loss: | | | | | | | |
| | | | | |
| Net income for the period | | | | 1,172 | | | | 411 | | | | 659 | |
| Pensions and other post-employment plans: | | | | | | | | | | | | |
Remeasurements | | | (404 | ) | | | (206 | ) | | | 139 | | | | 139 | | | | (972 | ) | | | (101 | ) |
Income tax effect on remeasurements | | | 120 | | | | 60 | | | | (77 | ) | | | (77 | ) | | | 289 | | | | 9 | |
| Revaluation reserve: | | | | | | | | | | | | |
Release revaluation reserve | | | (16 | ) | | | (16 | ) | | | (31 | ) | | | (31 | ) | | | (10 | ) | | | (9 | ) |
Reclassification directly into retained earnings | | | 16 | | | | 16 | | | | 31 | | | | 31 | | | | 10 | | | | 9 | |
| | | | | | | | |
| Total of items that will not be reclassified to profit or loss | | | (284 | ) | | | (146 | ) | | | 62 | | | | 62 | | | | (683 | ) | | | (92 | ) |
| | Other comprehensive income items that are or may be reclassified to profit or loss: | | | | | | | |
| Currency translation differences: | | | | | | | | | | | | |
Net current period change, before tax | | | 71 | | | | (99 | ) | | | (427 | ) | | | (427 | ) | | | 600 | | | | 643 | |
Income tax effect | | | (2 | ) | | | — | | | | (35 | ) | | | (35 | ) | | | 203 | | | | 187 | |
Reclassification adjustment for gain (loss) realized | | | 3 | | | | (1 | ) | | | (14 | ) | |
Reclassification adjustment for gain realized | | | | (14 | ) | | | (5 | ) | | | (1 | ) |
| Available-for-sale financial assets: | | | | | | | | | | | | |
Net current period change, before tax | | | (87 | ) | | | 8 | | | | (5 | ) | | | (5 | ) | | | 30 | | | | 33 | |
Income tax effect | | | 19 | | | | (2 | ) | | | — | | | | — | | | | (4 | ) | | | — | |
Reclassification adjustment for (loss) gain realized | | | (26 | ) | | | 3 | | | | 6 | | |
Reclassification adjustment for loss (gain) realized | | | | 6 | | | | (54 | ) | | | (4 | ) |
| Cash flow hedges: | | | | | | | | | | | | |
Net current period change, before tax | | | (31 | ) | | | 23 | | | | 68 | | | | 68 | | | | (40 | ) | | | (38 | ) |
Income tax effect | | | — | | | | (8 | ) | | | (2 | ) | | | (2 | ) | | | 10 | | | | — | |
Reclassification adjustment for (loss) gain realized | | | 27 | | | | 14 | | | | (62 | ) | |
Reclassification adjustment for loss (gain) realized | | | | (62 | ) | | | (7 | ) | | | 63 | |
| | | | | | | | |
| Total of items that are or may be reclassified to profit or loss | | | (26 | ) | | | (62 | ) | | | (471 | ) | | | (471 | ) | | | 733 | | | | 883 | |
| | | | | |
| | Other comprehensive (loss) income for period | | | (310 | ) | | | (208 | ) | | | (409 | ) | | | (409 | ) | | | 50 | | | | 791 | |
| | | | | |
| Total comprehensive income (loss) for the period | | | (1,766 | ) | | | (238 | ) | | | 763 | | |
| | Total comprehensive income (loss) attributable to: | | | | | | | |
Shareholders | | | (1,770 | ) | | | (243 | ) | | | 760 | | |
| Total comprehensive income for the period | | | | 763 | | | | 461 | | | | 1,450 | |
| | Total comprehensive income attributable to: | | | | | | | |
Shareholders of Koninklijke Philips N.V. | | | | 760 | | | | 465 | | | | 1,436 | |
Non-controlling interests | | | 4 | | | | 5 | | | | 3 | | | | 3 | | | | (4 | ) | | | 14 | |
| | | | | |
The Consolidated statements of comprehensive income have been restated for the adoption of IAS 19R, which mainly relates to pension reporting (see note 30, Post-employment benefits). The accompanying notes are an integral part of these consolidated financial statements.
136 Annual Report 2013 1572015
11 Group financial statements 11.6 - 11.612.6
11.612.6 Consolidated balance sheets
in millions of euros unless otherwise stated
| | | | | | | | | | | | | | | | | | | | |
| | | | | Consolidated balance sheets of the Philips Group as of December 31 | | | | | | | |
| | | | | | |
| | | | | Assets | | | | | | | | | | | | |
| | | | | | | | | | 2012 | | | | | | 2013 | |
| | | | | | |
| | | | Non-current assets | | | | | | | | | | | | | | | | |

| |  | | Property, plant and equipment: | | | | | | | | | | | | | | | | |
| | | | - At cost | | | 7,880 | | | | | | | | 7,692 | | | | | |
| | | | - Less accumulated depreciation | | | (4,921 | ) | | | | | | | (4,912 | ) | | | | |
| | | | | | | | | | | 2,959 | | | | | | | | 2,780 | |
| |
| | Goodwill | | | | | | | 6,948 | | | | | | | | 6,504 | |
| | 
| | Intangible assets excluding goodwill: | | | | | | | | | | | | | | | | |
| | | | - At cost | | | 7,821 | | | | | | | | 7,638 | | | | | |
| | | | - Less accumulated amortization | | | (4,090 | ) | | | | | | | (4,376 | ) | | | | |
| | | | | | | | | | | 3,731 | | | | | | | | 3,262 | |
| |  | | Non-current receivables | | | | | | | 176 | | | | | | | | 144 | |
| |
| | Investments in associates | | | | | | | 177 | | | | | | | | 161 | |
| | 
| | Other non-current financial assets | | | | | | | 549 | | | | | | | | 496 | |
| |
| | Deferred tax assets | | | | | | | 1,919 | | | | | | | | 1,675 | |
| | 
| | Other non-current assets | | | | | | | 94 | | | | | | | | 63 | |
| | | | | | | | |
| | | | | | |
| | | | Total non-current assets | | | | | | | 16,553 | | | | | | | | 15,085 | |
| | | | Current assets | | | | | | | | | | | | | | | | |
| | 
| | Inventories - net | | | | | | | 3,495 | | | | | | | | 3,240 | |
| | | | Current financial assets | | | | | | | — | | | | | | | | 10 | |
| | 
| | Other current assets | | | | | | | 337 | | | | | | | | 354 | |
| | 
| | Derivative financial assets | | | | | | | 137 | | | | | | | | 150 | |
| | | | Income tax receivable | | | | | | | 97 | | | | | | | | 70 | |

| |  | | Receivables: | | | | | | | | | | | | | | | | |
| | | | - Accounts receivable - net | | | 4,334 | | | | | | | | 4,420 | | | | | |
| | | | - Accounts receivable from related parties | | | 13 | | | | | | | | 39 | | | | | |
| | | | - Other current receivables | | | 238 | | | | | | | | 219 | | | | | |
| | | | | | | | | | | 4,585 | | | | | | | | 4,678 | |
| |
| | Assets classified as held for sale | | | | | | | 43 | | | | | | | | 507 | |
| | 
| | Cash and cash equivalents | | | | | | | 3,834 | | | | | | | | 2,465 | |
| | | | | | | | |
| | | | Total current assets | | | | | | | 12,528 | | | | | | | | 11,474 | |
| | 
| | Contingent assets | | | | | | | | | | | | | | | | |
| | | | | | | | |
| | | | Total assets | | | | | | | 29,081 | | | | | | | | 26,559 | |
| | | | | | | | | | | | | | | | | | | | | | |
| | | | | | Philips Group | | | | | | | | | | | | | | | | |
| | | | | | Consolidated balance sheetsin millions of EUR unless otherwise stated As of December 31 | | | | | | | | | |
| | | | | | | | | | |
| | | | | | | | | 2014 | | | 2015 | |
| | | | | | | | | | |
| | | | | | | |
| | | | | | Non-current assets | | | | | | | | | | | | | | | | |
 | |  | |  | | Property, plant and equipment: | | | | | | | | | | | | | | | | |
| | | | | | - At cost | | | 6,844 | | | | | | | | 7,217 | | | | | |
| | | | | | - Less accumulated depreciation | | | (4,749 | ) | | | | | | | (4,895 | ) | | | | |
| | | | | | | | | | | | | | | | | | | | | | |
| | | | | | | | | | | | | 2,095 | | | | | | | | 2,322 | |
| |
| | 
| | Goodwill | | | | | | | 7,158 | | | | | | | | 8,523 | |
| |
| | 
| | Intangible assets excluding goodwill: | | | | | | | | | | | | | | | | |
| | | | | | - At cost | | | 8,020 | | | | | | | | 9,251 | | | | | |
| | | | | | - Less accumulated amortization | | | (4,652 | ) | | | | | | | (5,558 | ) | | | | |
| | | | | | | | | | | | | | | | | | | | | | |
| | | | | | | | | | | | | 3,368 | | | | | | | | 3,693 | |
| | | | 
| | Non-current receivables | | | | | | | 177 | | | | | | | | 191 | |
| | | |
| | Investments in associates | | | | | | | 157 | | | | | | | | 181 | |
| | | | 
| | Other non-current financial assets | | | | | | | 462 | | | | | | | | 489 | |
| | | | 
| | Non-current derivative financial assets | | | | | | | 15 | | | | | | | | 58 | |
| | | |
| | Deferred tax assets | | | | | | | 2,460 | | | | | | | | 2,758 | |
| | | | 
| | Other non-current assets | | | | | | | 69 | | | | | | | | 68 | |
| | | | | | | | | | |
| | | | | | | |
| | | | | | Total non-current assets | | | | | | | 15,961 | | | | | | | | 18,283 | |
| | | | | | Current assets | | | | | | | | | | | | | | | | |
| | | | 
| | Inventories | | | | | | | 3,314 | | | | | | | | 3,463 | |
| | | |
| | Current financial assets | | | | | | | 125 | | | | | | | | 12 | |
| | | |
| | Other current assets | | | | | | | 411 | | | | | | | | 444 | |
| | | |
| | Current derivative financial assets | | | | | | | 192 | | | | | | | | 103 | |
| | | |
| | Income tax receivable | | | | | | | 140 | | | | | | | | 114 | |
| |
| | 
| | Receivables: | | | | | | | | | | | | | | | | |
| | | | | | - Accounts receivable | | | 4,476 | | | | | | | | 4,727 | | | | | |
| | | | | | - Accounts receivable from related parties | | | 14 | | | | | | | | 16 | | | | | |
| | | | | | - Other current receivables | | | 233 | | | | | | | | 239 | | | | | |
| | | | | | | | | | | | | | | | | | | | | | |
| | | | | | | | | | | | | 4,723 | | | | | | | | 4,982 | |
| | | |
| | Assets classified as held for sale | | | | | | | 1,613 | | | | | | | | 1,809 | |
| | | | 
| | Cash and cash equivalents | | | | | | | 1,873 | | | | | | | | 1,766 | |
| | | | | | | | | | |
| | | | | | Total current assets | | | | | | | 12,391 | | | | | | | | 12,693 | |
| | | | | | | | | | |
| | | | | | Total assets | | | | | | | 28,352 | | | | | | | | 30,976 | |
| | | | | | | | | | |
158 Annual Report 20132015 137
11 Group financial statements 11.6 - 11.612.6
| | | | | | | | | | | | | | | | | | | | | | |
| | | | | | | Equity and liabilities | | | | | | | | | | | | |
| | | | | | | | | | | | 2012 | | | | | | 2013 | |
| | | | | | Equity | | | | | | | | | | | | | | | | |
| | | | | | | |
| | | | 
| | Shareholders’ equity: | | | | | | | | | | | | | | | | |
| | | | | | Preference shares, par value EUR 0.20 per share: | | | | | | | | | | | | | | | | |
| | | | | | - Authorized: 2,000,000,000 shares (2012: 2,000,000,000 shares), issued none | | | | | | | | | | | | | | | | |
| | | | | | Common shares, par value EUR 0.20 per share: | | | | | | | | | | | | | | | | |
| | | | | | - Authorized: 2,000,000,000 shares (2012: 2,000,000,000 shares) | | | | | | | | | | | | | | | | |
| | | | | | - Issued and fully paid: 937,845,789 shares (2012: 957,132,962 shares) | | | 191 | | | | | | | | 188 | | | | | |
| | | | | | Capital in excess of par value | | | 1,304 | | | | | | | | 1,796 | | | | | |
| | | | | | Retained earnings | | | 10,724 | | | | | | | | 10,415 | | | | | |
| | | | | | Revaluation reserve | | | 54 | | | | | | | | 23 | | | | | |
| | | | | | Currency translation differences | | | (93 | ) | | | | | | | (569 | ) | | | | |
| | | | | | Available-for-sale financial assets | | | 54 | | | | | | | | 55 | | | | | |
| | | | | | Cash flow hedges | | | 20 | | | | | | | | 24 | | | | | |
| | | | | | Treasury shares, at cost 24,508,022 shares (2012: 42,541,687 shares) | | | (1,103 | ) | | | | | | | (718 | ) | | | | |
| | | | | | | | | | | | | 11,151 | | | | | | | | 11,214 | |
| | | | | | | |
| | | |
| | Non-controlling interests | | | | | | | 34 | | | | | | | | 13 | |
| | | | | | | | | | |
| | | | | | Group equity | | | | | | | 11,185 | | | | | | | | 11,227 | |
| | | | | | Non-current liabilities | | | | | | | | | | | | | | | | |
| | 
| |
| | Long-term debt | | | | | | | 3,725 | | | | | | | | 3,309 | |

| |
| | 
| | Long-term provisions | | | | | | | 2,119 | | | | | | | | 1,903 | |
| | | |
| | Deferred tax liabilities | | | | | | | 92 | | | | | | | | 76 | |
| | | | 
| | Other non-current liabilities | | | | | | | 2,005 | | | | | | | | 1,568 | |
| | | | | | | | | | |
| | | | | | Total non-current liabilities | | | | | | | 7,941 | | | | | | | | 6,856 | |
| | | | | | | |
| | | | | | Current liabilities | | | | | | | | | | | | | | | | |
| |
| |
| | Short-term debt | | | | | | | 809 | | | | | | | | 592 | |
| | | |
| | Derivative financial liabilities | | | | | | | 517 | | | | | | | | 368 | |
| | | |
| | Income tax payable | | | | | | | 200 | | | | | | | | 143 | |
| |
| |
| | Accounts and notes payable: | | | | | | | | | | | | | | | | |
| | | | | | - Trade creditors | | | 2,835 | | | | | | | | 2,458 | | | | | |
| | | | | | - Accounts payable to related parties | | | 4 | | | | | | | | 4 | | | | | |
| | | | | | | | | | | | | 2,839 | | | | | | | | 2,462 | |
| | | | 
| | Accrued liabilities | | | | | | | 3,171 | | | | | | | | 2,830 | |
| |
| |
| | Short-term provisions | | | | | | | 837 | | | | | | | | 651 | |
| | | |
| | Liabilities directly associated with assets held for sale | | | | | | | 27 | | | | | | | | 348 | |
| | | | 
| | Other current liabilities | | | | | | | 1,555 | | | | | | | | 1,082 | |
| | | | | | | | | | |
| | | | | | Total current liabilities | | | | | | | 9,955 | | | | | | | | 8,476 | |
| |
| |
| | Contractual obligations and contingent liabilities | | | | | | | | | | | | | | | | |
| | | | | | | | | | |
| | | | | | Total liabilities and group equity | | | | | | | 29,081 | | | | | | | | 26,559 | |
| | | | | | | | | | | | | | | | | | | | |
| | | | | | | | |
| | | | | | 2014 | | | 2015 | |
| | | | | | | | |
| | | | Equity | | | | | | | | | | | | | | | | |
| | | | | | |
| | 
| | Shareholders’ equity: | | | | | | | | | | | | | | | | |
| | | | Preference shares, par value EUR 0.20 per share: | | | | | | | | | | | | | | | | |
| | | | - Authorized: 2,000,000,000 shares (2014: 2,000,000,000 shares), issued none | | | | | | | | | | | | | | | | |
| | | | Common shares, par value EUR 0.20 per share: | | | | | | | | | | | | | | | | |
| | | | - Authorized: 2,000,000,000 shares (2014: 2,000,000,000 shares) | | | | | | | | | | | | | | | | |
| | | | - Issued and fully paid: 931,130,387 shares (2014: 934,819,413 shares) | | | 187 | | | | | | | | 186 | | | | | |
| | | | Capital in excess of par value | | | 2,181 | | | | | | | | 2,669 | | | | | |
| | | | Retained earnings | | | 8,790 | | | | | | | | 8,040 | | | | | |
| | | | Revaluation reserve | | | 13 | | | | | | | | 4 | | | | | |
| | | | Currency translation differences | | | 229 | | | | | | | | 1,058 | | | | | |
| | | | Available-for-sale financial assets | | | 27 | | | | | | | | 56 | | | | | |
| | | | Cash flow hedges | | | (13 | ) | | | | | | | 12 | | | | | |
| | | | Treasury shares, at cost 14,026,801 shares (2014: 20,430,544 shares) | | | (547 | ) | | | | | | | (363 | ) | | | | |
| | | | | | | | | | | | | | | | | | | | |
| | | | | | | | | | | 10,867 | | | | | | | | 11,662 | |
| | | | | | |
| |
| | Non-controlling interests | | | | | | | 101 | | | | | | | | 118 | |
| | | | | | | | |
| | | | Group equity | | | | | | | 10,968 | | | | | | | | 11,780 | |
| | | | Non-current liabilities | | | | | | | | | | | | | | | | |

| |
| | Long-term debt | | | | | | | 3,712 | | | | | | | | 4,095 | |
| |
| | Non-current derivative financial liabilities | | | | | | | 551 | | | | | | | | 695 | |

| | 
| | Long-term provisions | | | | | | | 2,500 | | | | | | | | 2,392 | |
| |
| | Deferred tax liabilities | | | | | | | 107 | | | | | | | | 164 | |
| | 
| | Other non-current liabilities | | | | | | | 1,838 | | | | | | | | 1,782 | |
| | | | | | | | |
| | | | Total non-current liabilities | | | | | | | 8,708 | | | | | | | | 9,128 | |
| | | | | | |
| | | | Current liabilities | | | | | | | | | | | | | | | | |
| |
| | Short-term debt | | | | | | | 392 | | | | | | | | 1,665 | |
| |
| | Derivative financial liabilities | | | | | | | 306 | | | | | | | | 238 | |
| |
| | Income tax payable | | | | | | | 102 | | | | | | | | 116 | |
| |
| | Accounts and notes payable: | | | | | | | | | | | | | | | | |
| | | | - Trade creditors | | | 2,495 | | | | | | | | 2,669 | | | | | |
| | | | - Accounts payable to related parties | | | 4 | | | | | | | | 4 | | | | | |
| | | | | | | | | | | | | | | | | | | | |
| | | | | | | | | | | 2,499 | | | | | | | | 2,673 | |
| | 
| | Accrued liabilities | | | | | | | 2,692 | | | | | | | | 2,863 | |
| |
| | Short-term provisions | | | | | | | 945 | | | | | | | | 833 | |
| �� |
| | Liabilities directly associated with assets held for sale | | | | | | | 349 | | | | | | | | 407 | |
| |
| | Other current liabilities | | | | | | | 1,391 | | | | | | | | 1,273 | |
| | | | | | | | |
| | | | Total current liabilities | | | | | | | 8,676 | | | | | | | | 10,068 | |
| | | | | | | | |
| | | | Total liabilities and group equity | | | | | | | 28,352 | | | | | | | | 30,976 | |
| | | | | | | | |
Prior-period financial statements have been restated for the treatment of Audio, Video, Multimedia and Accessories as discontinued operations (see note 7, Discontinued operations and other assets classified as held for sale) and the adoption of IAS 19R, which mainly relates to accounting for pensions (see note 30, Post-employment benefits). The accompanying notes are an integral part of these consolidated financial statements.
138 Annual Report 2013 1592015
11 Group financial statements 11.7 - 11.712.7
11.712.7 Consolidated statements of cash flows
in millions of euros
| | | | | | | | | | | | | | |
| | | Philips Group | | | | | | | | | |
| | Consolidated statements of cash flowsin millions of EUR unless otherwise stated For the years ended December 31 | |
| | | | | | |
| | | | | 2013 | | | 2014 | | | 2015 | |
| | | | | | |
| | Cash flows from operating activities | | | | | | | | | | | | |
| | Net income | | | 1,172 | | | | 411 | | | | 659 | |
| | Result of discontinued operations - net of income tax | | | (138 | ) | | | (190 | ) | | | (245 | ) |
| | Adjustments to reconcile net income (loss) to net cash provided by operating activities: | | | | | | | | | | | | |
| | Depreciation, amortization, and impairments of fixed assets | | | 1,177 | | | | 1,187 | | | | 1,281 | |
| | Impairment of goodwill and other non-current financial assets | | | 38 | | | | 21 | | | | 48 | |
| | Net gain on sale of assets | | | (54 | ) | | | (83 | ) | | | (110 | ) |
| | Interest income | | | (54 | ) | | | (39 | ) | | | (48 | ) |
| | Interest expense on debt, borrowings and other liabilities | | | 258 | | | | 231 | | | | 278 | |
| | Income taxes | | | 466 | | | | 26 | | | | 239 | |
| | Results from investments in associates | | | 25 | | | | (62 | ) | | | (10 | ) |
| | Decrease (Increase) in working capital | | | (1,167 | ) | | | 312 | | | | 67 | |
| | Decrease (Increase) in receivables and other current assets | | | (486 | ) | | | (75 | ) | | | 161 | |
| | Decrease (Increase) in inventories | | | (165 | ) | | | (77 | ) | | | 22 | |
| | (Decrease) increase in accounts payable, accrued and other current liabilities | | | (516 | ) | | | 464 | | | | (116 | ) |
| | Increase in non-current receivables, other assets and other liabilities | | | (264 | ) | | | (412 | ) | | | (135 | ) |
| | (Decrease) increase in provisions | | | (194 | ) | | | 640 | | | | (278 | ) |
| | Other items | | | 299 | | | | (242 | ) | | | (99 | ) |
| | Interest paid | | | (267 | ) | | | (232 | ) | | | (265 | ) |
| | Interest received | | | 52 | | | | 38 | | | | 48 | |
| | Dividends received from investments in associates | | | 6 | | | | 41 | | | | 17 | |
| | Dividends paid to non-controlling interests | | | (7 | ) | | | — | | | | — | |
| | Income taxes paid | | | (436 | ) | | | (344 | ) | | | (280 | ) |
| | | | | | |
| | Net cash provided by operating activities | | | 912 | | | | 1,303 | | | | 1,167 | |
| | | | |
| | Cash flows from investing activities | | | | | | | | | | | | |
| | Net capital expenditures | | | (830 | ) | | | (806 | ) | | | (842 | ) |
| | Purchase of intangible assets | | | (49 | ) | | | (114 | ) | | | (121 | ) |
| | Expenditures on development assets | | | (326 | ) | | | (295 | ) | | | (314 | ) |
| | Capital expenditures on property, plant and equipment | | | (482 | ) | | | (437 | ) | | | (522 | ) |
| | Proceeds from sales of property, plant and equipment | | | 27 | | | | 40 | | | | 115 | |
 | | Cash used for derivatives and current financial assets | | | (101 | ) | | | (7 | ) | | | (72 | ) |
 | | Purchase of other non-current financial assets | | | (13 | ) | | | (81 | ) | | | (21 | ) |
| | | Proceeds from other non-current financial assets | | | 14 | | | | 107 | | | | 53 | |
| | Purchase of businesses, net of cash acquired | | | (11 | ) | | | (177 | ) | | | (1,116 | ) |
| | Proceeds from sale of interests in businesses, net of cash disposed of | | | 79 | | | | (20 | ) | | | 57 | |
| | | | | | |
| | Net cash used for investing activities | | | (862 | ) | | | (984 | ) | | | (1,941 | ) |
| | | | |
| | Cash flows from financing activities | | | | | | | | | | | | |
| | Proceeds from issuance (payments) of short-term debt | | | (285 | ) | | | (37 | ) | | | 1,241 | |
| | Principal payments on long-term debt | | | (186 | ) | | | (333 | ) | | | (104 | ) |
| | Proceeds from issuance of long-term debt | | | 64 | | | | 69 | | | | 94 | |
| | Re-issuance of treasury shares | | | 107 | | | | 117 | | | | 81 | |
| | Purchase of treasury shares | | | (669 | ) | | | (713 | ) | | | (506 | ) |
| | Dividends paid | | | (272 | ) | | | (292 | ) | | | (298 | ) |
| | | | | | |
| | Net cash provided by (used for) financing activities | | | (1,241 | ) | | | (1,189 | ) | | | 508 | |
| | | | | | |
| | | | |
| | Net cash used for continuing operations | | | (1,191 | ) | | | (870 | ) | | | (266 | ) |
| | | | |
| | Cash flows from discontinued operations | | | | | | | | | | | | |
| | Net cash provided by (used for) operating activities | | | (68 | ) | | | 105 | | | | 79 | |
| | Net cash provided by (used for) investing activities | | | (47 | ) | | | 88 | | | | — | |
| | | | | | |
| | Net cash (used for) provided by discontinued operations | | | (115 | ) | | | 193 | | | | 79 | |
| | | | | | |
| | | | |
| | Net cash used for continuing and discontinued operations | | | (1,306 | ) | | | (677 | ) | | | (187 | ) |
| | Effect of changes in exchange rates on cash and cash equivalents | | | (63 | ) | | | 85 | | | | 80 | |
| | Cash and cash equivalents at the beginning of the year | | | 3,834 | | | | 2,465 | | | | 1,873 | |
| | | | | | |
| | Cash and cash equivalents at the end of the year | | | 2,465 | | | | 1,873 | | | | 1,766 | |
| | | | | | |
| | | | | | | | | | | | | | |
| | | Consolidated statements of cash flows of the Philips Group for the years ended December 31 | |
| | | | | 2011 | | | 2012 | | | 2013 | |
| | Cash flows from operating activities | | | | | | | | | | | | |
| | Net income (loss) | | | (1,456 | ) | | | (30 | ) | | | 1,172 | |
| | Result of discontinued operations - net of income tax | | | 410 | | | | (47 | ) | | | (2 | ) |
| | Adjustments to reconcile net income (loss) to net cash provided by operating activities: | | | | | | | | | | | | |
| | Depreciation, amortization, and impairments of fixed assets | | | 1,400 | | | | 1,398 | | | | 1,349 | |
| | Impairment of goodwill and other non-current financial assets | | | 1,387 | | | | 14 | | | | 38 | |
| | Net gain on sale of assets | | | (88 | ) | | | (141 | ) | | | (54 | ) |
| | Loss (income) from investments in associates | | | (14 | ) | | | 5 | | | | 25 | |
| | Dividends received from investments in associates | | | 44 | | | | 15 | | | | 6 | |
| | Dividends paid to non-controlling interests | | | (4 | ) | | | (4 | ) | | | (7 | ) |
| | (Increase) decrease in working capital | | | (622 | ) | | | 546 | | | | (1,417 | ) |
| | Increase in receivables and other current assets | | | (363 | ) | | | (191 | ) | | | (530 | ) |
| | Increase in inventories | | | (216 | ) | | | (32 | ) | | | (165 | ) |
| | (Decrease) increase in accounts payable, accrued and other current liabilities | | | (43 | ) | | | 769 | | | | (722 | ) |
| | Increase in non-current receivables, other assets and other liabilities | | | (425 | ) | | | (327 | ) | | | (76 | ) |
| | (Decrease) increase in provisions | | | 15 | | | | 429 | | | | (194 | ) |
| | Other items | | | 113 | | | | 224 | | | | 298 | |
| | | | | | |
| | Net cash provided by operating activities | | | 760 | | | | 2,082 | | | | 1,138 | |
| | | | |
| | Cash flows from investing activities | | | | | | | | | | | | |
| | Purchase of intangible assets | | | (69 | ) | | | (34 | ) | | | (49 | ) |
| | Proceeds from sale of intangible assets | | | — | | | | 160 | | | | — | |
| | Expenditures on development assets | | | (276 | ) | | | (345 | ) | | | (357 | ) |
| | Capital expenditures on property, plant and equipment | | | (640 | ) | | | (661 | ) | | | (587 | ) |
| | Proceeds from sales of property, plant and equipment | | | 128 | | | | 425 | | | | 27 | |
 | | Cash from (used for) derivatives and current financial assets | | | 26 | | | | (46 | ) | | | (101 | ) |
| | Purchase of other non-current financial assets | | | (43 | ) | | | (167 | ) | | | (13 | ) |
 | | Proceeds from other non-current financial assets | | | 87 | | | | 3 | | | | 15 | |
| | Purchase of businesses, net of cash acquired | | | (507 | ) | | | (261 | ) | | | (11 | ) |
| | Proceeds from sale of interests in businesses, net of cash disposed of | | | 19 | | | | 1 | | | | 79 | |
| | | | | | |
| | Net cash used for investing activities | | | (1,275 | ) | | | (925 | ) | | | (997 | ) |
| | | | |
| | Cash flows from financing activities | | | | | | | | | | | | |
| | Proceeds from issuance (payments) of short-term debt | | | (217 | ) | | | 133 | | | | (285 | ) |
| | Principal payments of long-term debt | | | (1,097 | ) | | | (631 | ) | | | (186 | ) |
| | Proceeds from issuance of long-term debt | | | 454 | | | | 1,228 | | | | 64 | |
| | Treasury shares transactions | | | (671 | ) | | | (768 | ) | | | (562 | ) |
| | Dividends paid | | | (259 | ) | | | (255 | ) | | | (272 | ) |
| | | | | | |
| | Net cash used for financing activities | | | (1,790 | ) | | | (293 | ) | | | (1,241 | ) |
| | | | | | |
| | | | |
| | Net cash (used for) provided by continuing operations | | | (2,305 | ) | | | 864 | | | | (1,100 | ) |
160 Annual Report 2013
11 Group financial statements 11.7 - 11.7
| | | | | | | | | | | | | | |
| | | | | 2011 | | | 2012 | | | 2013 | |
| | Cash flows from discontinued operations | | | | | | | | | | | | |
| | Net cash (used for) provided by operating activities | | | (280 | ) | | | (166 | ) | | | (159 | ) |
| | Net cash (used for) provided by investing activities | | | (94 | ) | | | 40 | | | | (47 | ) |
| | | | | | |
| | Net cash used for discontinued operations | | | (374 | ) | | | (126 | ) | | | (206 | ) |
| | | | | | |
| | | | |
| | Net cash (used for) provided by continuing and discontinued operations | | | (2,679 | ) | | | 738 | | | | (1,306 | ) |
| | | | |
| | Effect of changes in exchange rates on cash and cash equivalents | | | (7 | ) | | | (51 | ) | | | (63 | ) |
| | Cash and cash equivalents at the beginning of the year | | | 5,833 | | | | 3,147 | | | | 3,834 | |
| | | | | | |
| | Cash and cash equivalents at the end of the year | | | 3,147 | | | | 3,834 | | | | 2,465 | |
| | | | | | | | | | | | | | |
| | | |
| Supplemental disclosures to the Consolidated statements of cash flows | | | | | | | | | | | | |
| | | | | 2011 | | | 2012 | | | 2013 | |
| | Cash flows from: | | | | | | | | | | | | |
| | Interest paid | | | (269 | ) | | | (273 | ) | | | (267 | ) |
| | Interest received | | | 38 | | | | 34 | | | | 52 | |
| | Pensions | | | (639 | ) | | | (610 | ) | | | (679 | ) |
| | Income taxes | | | (582 | ) | | | (359 | ) | | | (454 | ) |
| | Net gain on sale of assets: | | | | | | | | | | | | |
| | Cash proceeds from the sale of assets | | | 234 | | | | 589 | | | | 121 | |
| | Book value of these assets | | | (164 | ) | | | (473 | ) | | | (63 | ) |
| | Deferred results on sale and leaseback transactions | | | — | | | | 25 | | | | (4 | ) |
| | Non-cash proceeds | | | 18 | | | | — | | | | — | |
| | | | | | |
| | | | | 88 | | | | 141 | | | | 54 | |
| | Non-cash investing and financing information | | | | | | | | | | | | |
 | | Assets in lieu of cash from the sale of businesses: | | | | | | | | | | | | |
| | Shares/share options/convertible bonds (continuing operations) | | | 18 | | | | — | | | | — | |
| | Shares/share options/convertible bonds (discontinued operations) | | | — | | | | 17 | | | | — | |
| | Conversion of convertible personnel debentures | | | — | | | | 4 | | | | 7 | |
| | Treasury shares transactions: | | | | | | | | | | | | |
| | Shares acquired | | | (751 | ) | | | (816 | ) | | | (669 | ) |
| | Exercise of stock options | | | 80 | | | | 48 | | | | 107 | |
Prior-period financial statements have been restated for the treatment of Audio, Video, Multimedia and Accessories as discontinued operations (see note 7, Discontinued operations and other assets classified as held for sale) and the adoption of IAS 19R, which mainly relates to accounting for pensions (see note 30, Post-employment benefits). The accompanying notes are an integral part of these consolidated financial statements.
For a number of reasons, principally the effects of translation differences and consolidation changes, certain items in the statements of cash flows do not correspond to the differences between the balance sheet amounts for the respective items.
Annual Report 2013 1612015 139
11 Group financial statements 11.8 - 11.812.8
11.812.8 Consolidated statements of changes in equity
in millions of euros unless otherwise statedPhilips Group
Consolidated statements of changes in equityin millions of EUR unless otherwise stated
For the Philips Groupyear ended December 31
| | | | common
share | | capital in
excess of
par value | | retained
earnings | | revaluation
reserve | | currency
translation
differences | | available- for-sale
financial
assets | | cash flow
hedges | | treasury
shares at
cost | | total
shareholders’
equity | | non-controlling
interests | | total
equity | | | | | |
Balance as of Jan. 1, 2011 | | | 197 | | | | 354 | | | | 15,391 | | | | 86 | | | | (65 | ) | | | 139 | | | | (5 | ) | | | (1,076 | ) | | | 15,021 | | | | 46 | | | | 15,067 | | |
| | | | common
shares | | capital in
excess of
par value | | retained
earnings | | revaluation
reserve | | currency
translation
differences | | available-
for-sale
financial
assets | | cash
flow
hedges | | treasury
shares at
cost | | total
shareholders’
equity | | non-controlling
interests | | Group equity | |
| | | | | |
Balance as of Jan. 1, 2013 | | | | 191 | | | | 1,304 | | | | 10,724 | | | | 54 | | | | (93 | ) | | | 54 | | | | 20 | | | | (1,103 | ) | | | 11,151 | | | | 34 | | | | 11,185 | |
Total comprehensive income (loss) | | | | | | | (1,728 | ) | | | (16 | ) | | | 72 | | | | (94 | ) | | | (4 | ) | | | — | | | | (1,770 | ) | | | 4 | | | | (1,766 | ) | | | | | | | 1,262 | | | | (31 | ) | | | (476 | ) | | | 1 | | | | 4 | | | | — | | | | 760 | | | | 3 | | | | 763 | |
Dividend distributed | | | 5 | | | | 443 | | | | (711 | ) | | | | | | | | | | | | | (263 | ) | | | | | (263 | ) | | | 4 | | | | 402 | | | | (678 | ) | | | | | | | | | | | | | (272 | ) | | | | | (272 | ) |
Movement in non-controlling interests | | | | | | | (5 | ) | | | | | | | | | | | | | (5 | ) | | | (16 | ) | | | (21 | ) | | | | | | | — | | | | | | | | | | | | | | — | | | | (24 | ) | | | (24 | ) |
Cancellation of treasury shares | | | — | | | | — | | | | — | | | | | | | | | | | | — | | | | — | | | | | | — | | | | (7 | ) | | | | | (780 | ) | | | | | | | | | | | 787 | | | | — | | | | | | — | |
Purchase of treasury shares | | | | | — | | | | (51 | ) | | | | | | | | | | | (700 | ) | | | (751 | ) | | | | | (751 | ) | | | | | | | (38 | ) | | | | | | | | | | | (631 | ) | | | (669 | ) | | | | | (669 | ) |
Re-issuance of treasury shares | | | | | (34 | ) | | | (6 | ) | | | | | | | | | | | 86 | | | | 46 | | | | | | 46 | | | | | | (36 | ) | | | (75 | ) | | | | | | | | | | | 229 | | | | 118 | | | | | | 118 | |
Share-based compensation plans | | | | | 56 | | | | — | | | | | | | | | | | | | | 56 | | | | | | 56 | | | | | | 105 | | | | | | | | | | | | | | | | 105 | | | | | | 105 | |
Income tax share-based compensation plans | | | | | (6 | ) | | | — | | | | | | | | | | | | | | (6 | ) | | | | | (6 | ) | | | | | 21 | | | | | | | | | | | | | | | | 21 | | | | | | 21 | |
Balance as of Dec. 31, 2011 | | | 202 | | | | 813 | | | | 12,890 | | | | 70 | | | | 7 | | | | 45 | | | | (9 | ) | | | (1,690 | ) | | | 12,328 | | | | 34 | | | | 12,362 | | |
| | | | | |
Balance as of Dec. 31, 2013 | | | | 188 | | | | 1,796 | | | | 10,415 | | | | 23 | | | | (569 | ) | | | 55 | | | | 24 | | | | (718 | ) | | | 11,214 | | | | 13 | | | | 11,227 | |
Total comprehensive income (loss) | | | | | | | (165 | ) | | | (16 | ) | | | (100 | ) | | | 9 | | | | 29 | | | | — | | | | (243 | ) | | | 5 | | | | (238 | ) | | | | | | | (258 | ) | | | (10 | ) | | | 798 | | | | (28 | ) | | | (37 | ) | | | — | | | | 465 | | | | (4 | ) | | | 461 | |
Dividend distributed | | | 6 | | | | 422 | | | | (687 | ) | | | | | | | | | | | | | (259 | ) | | | | | (259 | ) | | | 3 | | | | 433 | | | | (729 | ) | | | | | | | | | | | | | (293 | ) | | | | | (293 | ) |
Movement in non-controlling interests | | | | | | | — | | | | | | | | | | | | | | — | | | | (5 | ) | | | (5 | ) | | | | | | | — | | | | | | | | | | | | | | — | | | | 92 | | | | 92 | |
Cancellation of treasury shares | | | (17 | ) | | | — | | | | (1,221 | ) | | | | | | | | | | | 1,238 | | | | — | | | | | | — | | | | (4 | ) | | | | | (529 | ) | | | | | | | | | | | 533 | | | | — | | | | | | — | |
Purchase of treasury shares | | | | | — | | | | (47 | ) | | | | | | | | | | | (769 | ) | | | (816 | ) | | | | | (816 | ) | | | | | | | (26 | ) | | | | | | | | | | | (688 | ) | | | (714 | ) | | | | | (714 | ) |
Re-issuance of treasury shares | | | | | (22 | ) | | | (46 | ) | | | | | | | | | | | 118 | | | | 50 | | | | | | 50 | | | | | | (127 | ) | | | (83 | ) | | | | | | | | | | | 326 | | | | 116 | | | | | | 116 | |
Share-based compensation plans | | | | | 84 | | | | — | | | | | | | | | | | | | | 84 | | | | | | 84 | | | | | | 88 | | | | | | | | | | | | | | | | 88 | | | | | | 88 | |
Income tax share-based compensation plans | | | | | 7 | | | | — | | | | | | | | | | | | | | 7 | | | | | | 7 | | | | | | (9 | ) | | | | | | | | | | | | | | | (9 | ) | | | | | (9 | ) |
Balance as of Dec. 31, 2012 | | | 191 | | | | 1,304 | | | | 10,724 | | | | 54 | | | | (93 | ) | | | 54 | | | | 20 | | | | (1,103 | ) | | | 11,151 | | | | 34 | | | | 11,185 | | |
| | | | | |
Balance as of Dec. 31, 2014 | | | | 187 | | | | 2,181 | | | | 8,790 | | | | 13 | | | | 229 | | | | 27 | | | | (13 | ) | | | (547 | ) | | | 10,867 | | | | 101 | | | | 10,968 | |
Total comprehensive income (loss) | | | | | | | 1,262 | | | | (31 | ) | | | (476 | ) | | | 1 | | | | 4 | | | | — | | | | 760 | | | | 3 | | | | 763 | | | | | | | | 562 | | | | (9 | ) | | | 829 | | | | 29 | | | | 25 | | | | — | | | | 1,436 | | | | 14 | | | | 1,450 | |
Dividend distributed | | | 4 | | | | 402 | | | | (678 | ) | | | | | | | | | | | | | (272 | ) | | | | | (272 | ) | | | 3 | | | | 429 | | | | (730 | ) | | | | | | | | | | | | | (298 | ) | | | | | (298 | ) |
Movement in non-controlling interests | | | | | | | — | | | | | | | | | | | | | | — | | | | (24 | ) | | | (24 | ) | | | | | | | | | | | | | | | | | | | | | 3 | | | | 3 | |
Cancellation of treasury shares | | | (7 | ) | | | | | (780 | ) | | | | | | | | | | | 787 | | | | — | | | | | | — | | | | (4 | ) | | | | | (513 | ) | | | | | | | | | | | 517 | | | | — | | | | | | — | |
Purchase of treasury shares | | | | | | | (38 | ) | | | | | | | | | | | (631 | ) | | | (669 | ) | | | | | (669 | ) | | | | | | | (12 | ) | | | | | | | | | | | (495 | ) | | | (507 | ) | | | | | (507 | ) |
Re-issuance of treasury shares | | | | | (36 | ) | | | (75 | ) | | | | | | | | | | | 229 | | | | 118 | | | | | | 118 | | | | | | (23 | ) | | | (57 | ) | | | | | | | | | | | 162 | | | | 82 | | | | | | 82 | |
Share-based compensation plans | | | | | 105 | | | | | | | | | | | | | | | | 105 | | | | | | 105 | | | | | | 101 | | | | | | | | | | | | | | | | 101 | | | | | | 101 | |
Income tax share-based compensation plans | | | | | 21 | | | | | | | | | | | | | | | | 21 | | | | | | 21 | | | | | | (19 | ) | | | | | | | | | | | | | | | (19 | ) | | | | | (19 | ) |
Balance as of Dec. 31, 2013 | | | 188 | | | | 1,796 | | | | 10,415 | | | | 23 | | | | (569 | ) | | | 55 | | | | 24 | | | | (718 | ) | | | 11,214 | | | | 13 | | | | 11,227 | | |
| | | | | |
Balance as of Dec. 31, 2015 | | | | 186 | | | | 2,669 | | | | 8,040 | | | | 4 | | | | 1,058 | | | | 56 | | | | 12 | | | | (363 | ) | | | 11,662 | | | | 118 | | | | 11,780 | |
| | | | | |
The Consolidated statements of changes in equity have been restated for the adoption of IAS 19R, which mainly relates to pension reporting (see note 30, Post-employment benefits). The accompanying notes are an integral part of these consolidated financial statements.
162140 Annual Report 20132015
11 Group financial statements
 11.8 - 11.9
12.9
11.912.9 Notes
all amounts in millions of euros unless otherwise stated
Prior-period financial statements have been restated for the treatment of Audio, Video, Multimedia and Accessories as discontinued operations (see note 7, Discontinued operations and other assets classified as held for sale) and the adoption of IAS 19R, which mainly relates to accounting for pensions (see note 30, Post-employment benefits).
Notes to the Consolidated financial statements of the Philips Group
The Consolidated financial statements in thisthe Group financial statements section have been prepared in accordance with International Financial Reporting Standards (IFRS) as endorsed by the European Union (EU) and with the statutory provisions of Part 9, Book 2 of the Dutch Civil Code. All standards and interpretations issued by the International Accounting Standards Board (IASB) and the IFRS Interpretations Committee effective year-end 20132015 have been endorsed by the EU, except that the EU did not adopt some of the paragraphs of IAS 39 applicable to certain hedge transactions. Koninklijke Philips N.V. (hereafter: the ‘Company’ or ‘Philips’) has no hedge transactions to which these paragraphs are applicable. Consequently, the accounting policies applied by Philips also comply fully with IFRS as issued by the IASB. These accounting policies have been applied by group entities.
The Consolidated financial statements have been prepared under the historical cost convention, unless otherwise indicated.
The Consolidated financial statements are presented in euros,euro, which is the Company’s presentation currency.
On February 25, 2014,23, 2016, the Board of Management authorized the Consolidated financial statements for issue. The Consolidated financial statements as presented in this report are subject to the adoption by the Annual General Meeting of Shareholders, to be held on May 1, 2014.12, 2016.
Use of estimates
The preparation of the Consolidated financial statements in conformity with IFRS requires management to make judgments, estimates and assumptions that affect the application of accounting policies and the reported amounts of assets, liabilities, income and expenses. These estimates inherently contain certaina degree of uncertainty. Actual results may differ from these estimates under different assumptions or conditions.
These estimates and assumptions affect the reported amounts of assets and liabilities, the disclosure of contingent liabilities at the date of the Consolidated financial statements, and the reported amounts of revenues and expenses during the reporting period. We evaluateThe Company evaluates these estimates and judgments on an ongoing basis and base our estimates on historical experience, current and expected future outcomes, third-party evaluations and various other assumptions that we believe are reasonable under the circumstances. The results of these estimates form the basis for making judgments about the carrying values of assets and liabilities as well as identifying and assessing the accounting treatment with respect to commitments and contingencies. We reviseThe Company revises material estimates if changes occur in the circumstances or there is new information or experience on which an estimate was or can be based.
Estimates significantly impactThe areas where the most significant judgments and estimates are made are goodwill, and other intangibles acquired,deferred tax on activities disposed,asset recoverability, impairments, financial instruments, the accounting for an arrangement containing a lease, revenue recognition (multiple element arrangements), assets and liabilities from employee benefit plans, other provisions, anduncertain tax positions and other contingencies, classification of assets and liabilities held for sale and the presentation of items of profit and loss and cash flows as continued or discontinued. Thediscontinued, as well as when determining the fair values of acquired identifiable intangible assets are based on an assessment of future cash flows. Impairment analyses
Further judgment is applied when analyzing impairments of goodwill and intangible assets not yet ready for use and indefinite-lived intangible assetsthat are performed annually and whenever a triggering event has occurred to determine whether the carrying value exceeds the recoverable amount. These analyses generally are based on estimates of future cash flows.
The fair value of financial instruments that are not traded in an active market is determined by using valuation techniques. The Furthermore, the Company uses itsapplies judgment to select from a variety of common valuation methods including the discounted cash flow method and option valuation models and to make assumptions that are mainly based on market conditions existing at each balance sheet date.
Actuarialwhen actuarial assumptions are established to anticipate future events and are used in calculating post-employment benefit expenses and liabilities. These factors include assumptions with respect to interest rates, rates of increase in health carehealthcare costs, rates of future compensation increases, turnover rates and life expectancy.
Changes in accounting policies
The accounting policies set out in this section have been applied consistently for all periods presented in these Consolidated financial statements.
Prior-year information
The presentation of certain prior-year information hasdisclosures have been reclassifiedadjusted to conform toalign with the current year presentation, including the 2011 presentationdisclosures.
Specific choices within IFRS
Sometimes IFRS allows alternative accounting treatments for measurement and/or disclosure. The most important of adjustments to the results of prior year’s divestments reported as discontinued operations as a consequence of the resolution of uncertainties that arose from the relevant sales agreements. As a result,these alternative treatments are mentioned below.
Tangible and intangible fixed assets
Under IFRS, an income tax benefit of EUR 30 million was retrospectively reclassified in the 2011 comparative figures from income tax expense of continuing operations to income tax from discontinued operations.
Basis of consolidation
The Consolidated financial statements include the accounts of Koninklijke Philips N.V. (‘the Company’) and all subsidiaries that the Company controls, i.e. when it is exposed, or has rights, to variable returns from its involvement with the investee and has the ability to affect those returns through its power over the investee. The existence and effect of potential voting rights are considered when assessing whether the Company controls another entity. Subsidiaries are fully consolidated from the date that control commences until the date that control ceases. All intercompany balances and transactions have been eliminated in the Consolidated financial statements. Unrealized losses are eliminated in the same way as unrealized gains, but only to the extent that there is no evidence of impairment.
Business combinations
Business combinations are accounted for using the acquisition method. Under the acquisition method, the identifiable assets acquired, liabilities assumed and any non-controlling interest in the acquiree are recognized at the acquisition date, which is the date on which control is transferred to the Company.
For acquisitions on or after January 1, 2010, the Company measures goodwill at the acquisition date as:
the fair value of the consideration transferred; plus
the recognized amount of any non-controlling interest in the acquiree; plus
if the business combination is achieved in stages, the fair value of the existing equity interest in the acquiree; less
the net recognized amount (generally fair value) of the identifiable assets acquired and liabilities assumed.
When the excess is negative, a bargain purchase gain is recognized immediately in profit or loss (hereafter referred to as the Statement of income).
The consideration transferred does not include amounts related to the settlement of pre-existing relationships. Such amounts are generally recognized in the Statement of income.
Costs related to the acquisition, other than those associated with the issue of debt or equity securities, that the Company incurs in connection with a business combination are expensed as incurred.
Any contingent consideration payable is recognized at fair value at the acquisition date and initially is presented as Long-term provisions. When timing and amount of the consideration become more certain, it is reclassified to Accrued liabilities. If the contingent consideration is classified as equity, it is not remeasured and settlement is accounted for within equity. Otherwise, subsequent changes to the fair value of the contingent consideration are recognized in the Statement of income.
Acquisitions between January 1, 2004 and January 1, 2010
For acquisitions between January 1, 2004 and January 1, 2010, goodwill represents the excess ofentity shall choose either the cost of the acquisition over the Company’s interest in the recognized amount (generally fair value) of the identifiable assets, liabilities and contingent liabilities of the acquiree. Transaction costs, other than those associated with the issue of debt or equity securities, that the Company incurred in connection with business combinations were capitalized as part of the cost of the acquisition.
Annual Report 2013 163
11 Group financial statements 11.9 - 11.9
Acquisitions of and adjustments to non-controlling interests
Acquisitions of non-controlling interests are accounted for as transactions with owners in their capacity as owners and therefore no goodwill is recognized. Adjustments to non-controlling interests arising from transactions that do not involve the loss of control are based on a proportionate amount of the net assets of the subsidiary.
For changes to non-controlling interest without the loss of control, the difference between such change and any consideration paid or received is recognized directly in equity.
Loss of control
Upon the loss of control, the Company derecognizes the assets and liabilities of the subsidiary, any non-controlling interests and the other components of equity related to the subsidiary. Any surplus or deficit arising on the loss of control is recognized in the Statement of income. If the Company retains any interest in the previous subsidiary, then such interest is measured at fair value at the date the control is lost. Subsequently it is accounted for as an equity-accounted investee or as an available-for-sale financial asset depending on the level of influence retained.
Investments in associates (equity-accounted investees)
Associates are all entities over which the Company has significant influence, but not control. Significant influence is presumed with a shareholding of between 20% and 50% of the voting rights. Investments in associates are accounted for using the equity method of accounting and are initially recognized at cost. The group’s investment in associates includes goodwill identified on acquisition, net of any accumulated impairment loss.
The Company’s share of the net income of these companies is included in results relating to associates in the Statement of income, after adjustments to align the accounting policies with those of the Company, from the date that significant influence commences until the date that significant influence ceases. When the Company’s share of losses exceeds its interest in an associate, the carrying amount of that interest (including any long-term loans) is reduced to zero and recognition of further losses is discontinued except to the extent that the Company has incurred legal or constructive obligations or made payments on behalf of the associate. Unrealized gains on transactions between the Company and its associates are eliminated to the extent of the Company’s interest in the associates. Unrealized losses are also eliminated unless the transaction provides evidence of an impairment of the asset transferred. Remeasurement differences of equity stake resulting from gaining control over the investee previously recorded as associate are recorded under Results related to investments in associates.
Investments in associates include loans from the Company to these investees.
Accounting for capital transactions of a consolidated subsidiary or an associate
The Company recognizes dilution gains or losses arising from the sale or issuance of stock by a consolidated subsidiary or an associate in the Statement of income, unless the Companymodel or the subsidiary either has reacquired or plans to reacquire such shares. In such instances, the result of the transaction is recorded directly in equity.
Dilution gainsrevaluation model as its accounting for tangible and losses arising in investments in associates are recognized in the Consolidated statements of income under Results relating to investments in associates.
Foreign currencies
Foreign currency transactions
The financial statements of all group entities are measured using the currency of the primary economic environment in which the entity operates (functional currency). The euro (EUR) is the functional and presentation currency of the Company. Foreign currency transactions are translated into the functional currency using the exchange rates prevailing at the dates of the transactions or valuation where items are remeasured. Foreign exchange gains and losses resulting from the settlement of such transactions and from the translation at year-end exchange rates of monetary assets and liabilities denominated in foreign currencies are recognized in the Statement of income, except when deferred in Other comprehensive income as qualifying cash flow hedges and qualifying net investment hedges.
Foreign currency differences arising from translation are recognized in profit or loss, except for available-for-sale equity investments (except on impairment in which case foreign currency differences that have been recognized in Other comprehensive income are reclassified to profit and loss), which are recognized in Other comprehensive income.
All exchange difference items are presented as part of Cost of sales, with the exception of tax items and financial income and expense, which are recognized in the same line item as they relate in the Statement of income.
Non-monetary assets and liabilities denominated in foreign currencies that are measured at fair value are retranslated to the functional currency using the exchange rate at the date the fair value was determined. Non-monetary items in a foreign currency that are measured based on historical cost are translated using the exchange rate at the date of transaction.
Foreign operations
The assets and liabilities of foreign operations, including goodwill and fair value adjustments arising on acquisition, are translated to euro at exchange rates at the reporting date. The income and expenses of foreign operations are translated to euro at exchange rates at the dates of the transactions.
Foreign currency differences arising on translation of foreign operations into the Group’s presentation currency are recognized in Other comprehensive income, and presented as part of Currency translation differences in equity. However, if the operation is a non-wholly owned subsidiary, then the relevant proportionate share of the translation difference is allocated to the non-controlling interests.
When a foreign operation is disposed of such that control, significant influence or joint control is lost, the cumulative amount in the translation reserve related to the foreign operation is reclassified to the Statement of income as part of the gain or loss on disposal. When the Company disposes of only part of its interest in a subsidiary that includes a foreign operation while retaining control, the relevant proportion of the cumulative amount is reattributed to Non-controlling interests. When the Company disposes of only part of its investment in an associate or joint venture that includes a foreign operation while retaining significant influence or joint control, the relevant proportion of the cumulative amount is reclassified to the Statement of income.
Financial instruments
Non-derivative financial instruments
Non-derivative financial instruments are recognized initially at fair value when the Company becomes a party to the contractual provisions of the instrument.
Regular way purchases and sales of financial instruments are accounted for at the trade date. Dividend and interest income are recognized when earned. Gains or losses, if any, are recorded in Financial income and expense.
Non-derivative financial instruments comprise cash and cash equivalents, receivables, other non-current financial assets and debt and other financial liabilities that are not designated as hedges.
Cash and cash equivalents
Cash and cash equivalents include all cash balances and short-term highly liquid investments with an original maturity of three months or less that are readily convertible into known amounts of cash.
Receivables
Receivables are carried at the lower of amortized cost or the present value of estimated future cash flows, taking into account discounts given or agreed. The present value of estimated future cash flows is determined through the use of value adjustments for uncollectible amounts. As soon as individual trade accounts receivable can no longer be collected in the normal way and are expected to result in a loss, they are designated as doubtful trade accounts receivable and valued at the expected collectible amounts. They are written off when they are deemed to be uncollectible because of bankruptcy or other forms of receivership of the debtors. The allowance for the risk of non-collection of trade accounts receivable takes into account credit-risk concentration, collective debt risk based on average historical losses, and specific circumstances such as serious adverse economic conditions in a specific country or region.
164 Annual Report 2013
11 Group financial statements 11.9 - 11.9
In the event of sale of receivables and factoring, the Company derecognizes receivables when the Company has given up control or continuing involvement, which is deemed to have occurred when:
the Company has transferred its rights to receive cash flows from the receivables or has assumed an obligation to pay the received cash flows in full without any material delay to a third party under a ‘pass-through’ arrangement; and
either (a) the Company has transferred substantially all of the risks and rewards of the ownership of the receivables, or (b) the Company has neither transferred nor retained substantially all of the risks and rewards, but has transferred control of the assets.
However, in case the Company neither transfers nor retains substantially all the risks and rewards of ownership of the receivables nor transfers control of the receivables, the receivable is recognized to the extent of the Company’s continuing involvement in theintangible fixed assets. In this case, the Company also recognizes an associated liability. The transferred receivable and associated liability are measured on a basis that reflects the rights and obligations that the Company has retained.
Other non-current financial assets
Other non-current financial assets include held-to-maturity investments, loans and available-for-sale financial assets and financial assets at fair value through profit or loss.
Held-to-maturity investments are those debt securities which the Company has the ability and intent to hold until maturity. Held-to-maturity debt investments are recorded at amortized cost, adjusted for the amortization or accretion of premiums or discounts using the effective interest method.
Loans receivable are stated at amortized cost, less impairment.
Available-for-sale financial assets are non-derivative financial assets that are designated as available-for-sale and that are not classified in any of the other categories of financial assets. Subsequent to initial recognition, they are measured at fair value and changes therein, other than impairment losses and foreign currency differences on available for sale-debt instruments are recognized in Other comprehensive income and presented in the fair value reserve in equity. When an investment is derecognized, the gain or loss accumulated in equity is reclassified to the Statement of income.
Available-for-sale financial assets including investments in privately-held companies that are not associates, and do not have a quoted market price in an active market and whose fair value could not be reliably determined, are carried at cost.
A financial asset is classified as fair value through profit or loss if it is classified as held for trading or is designated as such upon initial recognition. Financial assets are designated as fair value through profit or loss if the Company manages such investments and makes purchase and sale decisions based on their fair value in accordance with the Company-documented risk management or investment strategy. Attributable transaction costs are recognized in the Statement of income as incurred. Financial assets at fair value through profit or loss are measured at fair value, and changes therein are recognized in profit or loss.
Equity
Common shares are classified as equity. Incremental costs directly attributable to the issuance of shares are recognized as a deduction from equity. Where the Company purchases the Company’s equity share capital (treasury shares), the consideration paid, including any directly attributable incremental costs (net of income taxes) is deducted from equity attributable to the Company’s equity holders until the shares are cancelled or reissued. Where such ordinary shares are subsequently reissued, any consideration received, net of any directly attributable incremental transaction costs and the related income tax effects, is included in equity attributable to the Company’s equity holders.
Dividends are recognized as a liability in the period in which they are declared. The income tax consequences of dividends are recognized when a liability to pay the dividend is recognized.
Debt and other liabilities
Debt and liabilities other than provisions are stated at amortized cost. However, loans that are hedged under a fair value hedge are remeasured for the changes in the fair value that are attributable to the risk that is being hedged.
Derivative financial instruments, including hedge accounting
The Company uses derivative financial instruments principally to manage its foreign currency risks and, to a more limited extent, for managing interest rate and commodity price risks. All derivative financial instruments are classified as current assets or liabilities and are accounted for at the trade date. Embedded derivatives are separated from the host contract and accounted for separately if the economic characteristics and risks of the host contract and the embedded derivative are not closely related. The Company measures all derivative financial instruments at fair value derived from market prices of the instruments, or calculated as the present value of the estimated future cash flows based on observable interest yield curves, basis spread, credit spreads and foreign exchange rates, or from option pricing models, as appropriate. Gains or losses arising from changes in fair value of derivatives are recognized in the Statement of income, except for derivatives that are highly effective and qualify for cash flow or net investment hedge accounting.
Changes in the fair value of derivatives that are designated and qualify as fair value hedges are recorded in the Statement of income, together with any changes in the fair value of the hedged asset or liability that are attributable to the hedged risk. For interest rate swaps designated as a fair value hedge of an interest bearing asset or liability that are unwound, the amount of the fair value adjustment to the asset or liability for the risk being hedged is released to the Statement of income over the remaining life of the asset or liability based on the recalculated effective yield.
Changes in the fair value of a derivative that is highly effective and that is designated and qualifies as a cash flow hedge, are recorded in Other comprehensive income, until the Statement of income is affected by the variability in cash flows of the designated hedged item. To the extent that the hedge is ineffective, changes in the fair value are recognized in the Statement of income.
The Company formally assesses, both at the hedge’s inception and on an ongoing basis, whether the derivatives that are used in hedging transactions are highly effective in offsetting changes in fair values or cash flows of hedged items. When it is established that a derivative is not highly effective as a hedge or that it has ceased to be a highly effective hedge, the Company discontinues hedge accounting prospectively. When hedge accounting is discontinued because it is expected that a forecasted transaction will not occur, the Company continues to carry the derivative on the Balance sheet at its fair value, and gains and losses that were accumulated in equity are recognized immediately in the Statement of income. If there is a delay and it is expected that the transaction will still occur, the amount in equity remains there until the forecasted transaction affects income. In all other situations in which hedge accounting is discontinued, the Company continues to carry the derivative at its fair value on the Balance sheet, and recognizes any changes in its fair value in the Statement of income.
Foreign currency differences arising on the retranslation of financial instruments designated as a hedge of a net investment in a foreign operation are recognized directly as a separate component of equity through Other comprehensive income, to the extent that the hedge is effective. To the extent that the hedge is ineffective, such differences are recognized in the Statement of income.
Offsetting and master netting agreements
The Company presents financial assets and financial liabilities on a gross basis as separate linerespect, items in the Consolidated balance sheet.
Master netting agreements may be entered into when the Company undertakes a number of financial instrument transactions with a single counterparty. Such an agreement provides for a net settlement of all financial instruments covered by the agreement in the event of default or certain termination events on any of the transactions. A master netting agreement may create a right of offset that becomes enforceable and affects the realization or settlement of individual financial assets and financial liabilities only following a specified termination event. However, if this contractual right is subject to certain limitations then it does not necessarily provide a basis for offsetting unless both of the offsetting criteria are met, i.e. there is a legally enforceable right and an intention to settle net or simultaneously.
Property, plant and equipment
Items of property, plant and equipment are measured at cost less accumulated depreciation and accumulated impairment losses. The useful lives and residual values are evaluated annually. Furthermore, the Company chose to apply the cost model meaning that costs relating to product development,
Annual Report 2013 1652015 141
11 Group financial statements 11.9 - 11.912.9
Assets manufactured by the Company include direct manufacturing costs, production overheads and interest charges incurred for qualifying assets during the construction period. Government grants are deducted from the cost of the related asset. Depreciation is calculated using the straight-line method over the useful life of the asset. Depreciation of special tooling is generally also based on the straight-line method. Gains and losses on the sale of property, plant and equipment are included in Other business income. Costs related to repair and maintenance activities are expensed in the period in which they are incurred unless leading to an extension of the original lifetime or capacity.
Plant and equipment under finance leases and leasehold improvements are amortized using the straight-line method over the shorter of the lease term or the estimated useful life of the asset. The gain realized on sale and operating leaseback transactions that are concluded based upon market conditions is recognized at the time of the sale.
The Company capitalizes interest as part of the cost of assets that take a substantial period of time to become ready for use, which is defined by the Company as a period of more than 6 months.
Goodwill
Measurement of goodwill at initial recognition is described under ‘Basis of consolidation’. Goodwill is subsequently measured at cost less accumulated impairment losses. In respect of investment in associates, the carrying amount of goodwill is included in the carrying amount of investment, and an impairment loss on such investment is not allocated to any asset, including goodwill, that forms part of the carrying amount of investment in associates.
Intangible assets other than goodwill
Acquired finite-lived intangible assets are amortized using the straight-line method over their estimated useful life. The useful lives are evaluated annually. Patents and trademarks with a finite useful life acquired from third parties either separately or as part of the business combination are capitalized at cost and amortized over their remaining useful lives. Intangible assets acquired as part of a business combination are capitalized at their acquisition-date fair value.
The Company expenses all research costs as incurred. Expenditure on development activities, whereby research findings are applied to a plan or design for the production of new or substantially improved products and processes, is capitalized as an intangible asset if the product or process is technically and commercially feasible and the Company has sufficient resources and the intention to complete development.
The development expenditure capitalized comprises of all directly attributable costs (including the cost of materials and direct labor). Other development expenditures and expenditures on research activities are recognized in the Statement of income. Capitalized development expenditure is stated at cost less accumulated amortization and impairment losses. Amortization of capitalized development expenditure is charged to the Statement of income on a straight-line basis over the estimated useful lives of the intangible assets.
Costs relating to the development and purchase of software for both internal use and software intended to be soldother intangible assets are capitalized and subsequently amortized over the estimated useful life.
Leased assetsEmployee benefit accounting
Leases in which the Company is the lesseeIFRS does not specify how an entity should present its service costs related to pensions and has substantially all the risks and rewards of ownership are classified as finance leases. Finance leases are capitalized at the commencement of the lease at the lower of the fair value of the leased assets and the present value of the minimum lease payments. Each lease payment is allocated between the liability and finance charges. The interest element of the finance cost is charged to the Statement of income over the lease period so as to produce a constant periodic rate ofnet interest on the remaining balance of thenet defined benefit liability for each period. The corresponding rental obligations, net of finance charges, are included in other short-term and other non-current liabilities. The property, plant and equipment acquired under finance leases is depreciated over the shorter of the useful life of the assets and the lease term.
Leases in which substantially all risks and rewards of ownership are retained by the lessor are classified as operating leases. Payments made under operating leases (net of any incentives received from the lessor) are recognized in the Statement of income on a straight-line basis over the term of the lease.
Inventories
Inventories are stated at the lower of cost or net realizable value. The cost of inventories comprises all costs of purchase, costs of conversion and other costs incurred in bringing the inventories to their present location and condition. The costs of conversion of inventories include direct labor and fixed and variable production overheads, taking into account the stage of completion and the normal capacity of production facilities. Costs of idle facility and abnormal waste are expensed. The cost of inventories is determined using the first-in, first-out (FIFO) method. Inventory is reduced for the estimated losses due to obsolescence. This reduction is determined for groups of products based on purchases in the recent past and/or expected future demand.
Provisions
Provisions are recognized if, as a result of a past event, the Company has a present legal or constructive obligation that can be estimated reliably, and it is probable that an outflow of economic benefits will be required to settle the obligation. Provisions are measured at the present value of the expenditures expected to be required to settle the obligation using a pre-tax discount rate that reflects current market assessments of the time value of money and the risks specific to the obligation. The increase in the provision due to passage of time is recognized as interest expense.
A provision for warranties is recognized when the underlying products or services are sold. The provision is based on historical warranty data and a weighing of possible outcomes against their associated probabilities.
The Company accrues for losses associated with environmental obligations when such losses are probable and can be estimated reliably. Measurement of liabilities is based on current legal and constructive requirements. Liabilities and expected insurance recoveries, if any, are recorded separately. The carrying amount of liabilities is regularly reviewed and adjusted for new facts and changes in law.
The provision for restructuring relates to the estimated costs of initiated reorganizations, the most significant of which have been approved by the Board of Management, and which generally involve the realignment of certain parts of the industrial and commercial organization. When such reorganizations require discontinuance and/or closure of lines of activities, the anticipated costs of closure or discontinuance are included in restructuring provisions. A liability is recognized for those costs only when the Company has a detailed formal plan for the restructuring and has raised a valid expectation with those affected that it will carry out the restructuring by starting to implement that plan or announcing its main features to those affected by it. Before a provision is established, the Company recognizes any impairment loss on the assets associated with the restructuring.
The Company provides for onerous contracts, based on the lower of the expected cost of fulfilling the contract and the expected net cost of terminating the contract. Before a provision is established, the Company recognizes any impairment loss on the assets associated with that contract.
The Company records a provision for decommissioning costs of certain facilities. Decommissioning costs are provided at the present value of expected costs to settle the obligation using estimated cash flows and are recognized as part of the cost of the particular asset. The cash flows are discounted at a current pre-tax rate that reflects the risks specific to the decommissioning liability. The unwinding of the discount is expensed as incurred and recognized in the Statement of income as a Financial expense. The estimated future costs of decommissioning are reviewed annually and adjusted as appropriate. Changes in the estimated future costs or in the discount rate applied are added to or deducted from the cost of the asset.
The Company is a provider of electrical equipment that falls under the EU Directive on Waste Electrical and Electronic Equipment (WEEE). The directive distinguishes between waste management of equipment sold to private households prior to a date as determined by each EU Member State (historical waste) and waste management of equipment sold to private households after that date (new waste). A provision for the expected costs of management of historical waste is recognized when the Company participates in the market during the measurement period as determined by each Member State, and the costs can be reliably measured. These costs are recognized as Other business expenses(asset) in the Statement of income. With respectregards to new waste, a provision forthese elements, the expected costs is recognized when products that fall within the directive are sold and the disposal costs can be reliably measured. Derecognition takes place when the obligation expires, is settled or is transferred. These costs are recognized as part of Costs of sales. With respect to equipment
166 Annual Report 2013
11 Group financial statements 11.9 - 11.9
sold to entities other than private households, a provision is recognized when the Company becomes responsible for the costs of this waste management, with the costs recognized as Other business expenses or Cost of sales as appropriate.
Impairment
Value in use is measured as the present value of future cash flows expected to be generated by the asset. If the carrying amount of an asset is deemed not recoverable, an impairment charge is recognized in the amount by which the carrying amount of the asset exceeds the recoverable amount.
Impairment of goodwill, intangible assets not yet ready for use and indefinite-lived intangible assets
Goodwill, intangible assets not yet ready for use and indefinite-lived intangible assets are not amortized but tested for impairment annually and whenever impairment indicators require. In most cases the Company identified its cash generating units as one level below that of an operating segment. Cash flows at this level are substantially independent from other cash flows and this is the lowest level at which goodwill is monitored by the Executive Committee. The Company performed and completed annual impairment tests in the same quarter of all years presented in the Consolidated Statements of income. An impairment loss is recognized in the Statement of income whenever and to the extent that the carrying amount of a cash-generating unit exceeds the unit’s recoverable amount, which is the greater of its value in use and fair value less cost to sell. An impairment loss on an investment in associates is not allocated to any asset, including goodwill, that forms part of the carrying amount of the investment in associates.
Impairment of non-financial assets other than goodwill, intangible assets not yet ready for use, indefinite-lived intangible assets, inventories and deferred tax assets
Non-financial assets other than goodwill, intangible assets not yet ready for use, indefinite-lived intangible assets, inventories and deferred tax assets are reviewed for impairment whenever events or changes in circumstances indicate that the carrying amount of an asset may not be recoverable. Recoverability of assets to be held and used is recognized and measured by a comparison of the carrying amount of an asset with the greater of its value in use and fair value less cost to sell. Value in use is measured as the present value of future cash flows expected to be generated by the asset. If the carrying amount of an asset is deemed not recoverable, an impairment charge is recognized in the amount by which the carrying amount of the asset exceeds the recoverable amount. The review for impairment is carried out at the level where discrete cash flows occur that are independent of other cash flows.
Impairment losses recognized in prior periods are assessed at each reporting date for any indications that the loss has decreased or no longer exists. An impairment loss is reversed if and to the extent there has been a change in the estimates used to determine the recoverable amount. The loss is reversed only to the extent that the asset’s carrying amount does not exceed the carrying amount that would have been determined, net of depreciation or amortization, if no impairment loss had been recognized. Reversals of impairment are recognized in the Statement of income.
Impairment of financial assets
A financial asset is considered to be impaired if objective evidence indicates that one or more events have had a negative effect on the estimated future cash flows of that asset. In case of available-for-sale financial assets, a significant or prolonged decline in the fair value of the financial assets below its cost is considered an indicator that the financial assets are impaired. If any such evidence exists for available-for-sale financial assets, the cumulative loss - measured as the difference between the acquisition cost and the current fair value, less any impairment loss on that financial asset previously recognized in the Statement of income - is reclassified from the fair value reserve in equity (through Other comprehensive income) to the Statement of income.
If objective evidence indicates that financial assets that are carried at cost need to be tested for impairment, calculations are based on information derived from business plans and other information available for estimating their fair value. Any impairment loss is charged to the Statement of income.
An impairment loss related to financial assets is reversed if in a subsequent period, the fair value increases and the increase can be related objectively to an event occurring after the impairment loss was recognized. The loss is reversed only to the extent that the asset’s carrying amount does not exceed the carrying amount that would have been determined if no impairment loss had been recognized. Reversals of impairment are recognized in the Statement of income except for reversals of impairment of available-for-sale equity securities, which are recognized in Other comprehensive income.
Employee benefit accounting
A defined contribution plan is a post-employment benefit plan under which an entity pays fixed contributions into a separate entity and will have no legal or constructive obligation to pay further amounts. Obligations for contributions to defined contribution pension plans are recognized as an employee benefit expense in the Statement of income in the periods during which services are rendered by employees.
A defined benefit plan is a post-employment benefit plan other than a defined contribution plan. The net pension asset or liability recognized in the Consolidated balance sheet in respect of defined benefit post-employment plans is the fair value of plan assets less the present value of the projected defined benefit obligation (DBO) at the balance sheet date. The projected defined benefit obligation is calculated annually by qualified actuaries using the projected unit credit method. Recognized assets are limited to the present value of any reductions in future contributions or any future refunds.
For the Company’s major plans, a full discount rate curve of high-quality corporate bonds (based on Towers Watson RATE:Link data) is used to determine the defined benefit obligation, whereas for the other plans a single-point discount rate is used based on the plan’s maturity. Plans in countries without a deep corporate bond market use a discount rate based on the local sovereign curve and the plan’s maturity.
Pension costs in respect of defined benefit post-employment plans primarily represent the increase of the actuarial present value of the obligation for post-employment benefits based on employee service during the year and the interest on the net recognized asset or liability in respect of employee service in previous years. The Company presents service costs in Income from operations and the net interest expenses related to defined benefit plans in Financial expense.
RemeasurementsCash flow statements
Under IFRS, an entity shall report cash flows from operating activities using either the direct method (whereby major classes of gross cash receipts and gross cash payments are disclosed) or the net defined benefit liability comprise actuarial gainsindirect method (whereby profit or loss is adjusted for the effects of transactions of a non-cash nature, any deferrals or accruals of past or future operating cash receipts or payments, and losses,items of income or expense associated with investing or financing cash flows). In this respect, the return on plan assets (excluding interest) andCompany chose to prepare the effectcash flow statements using the indirect method.
Furthermore, interest cash flows are presented in cash flows from operating activities rather than financing or investing cash flows, because they enter into the determination of the asset ceiling (excluding interest).profit or loss. The Company immediately recognizes all remeasurementschose to present dividends paid to shareholders of Koninklijke Philips N.V. as a component of cash flows from financing activities, rather than to present such dividends as operating cash flows which is an allowed alternative under IFRS.
Policies that are more critical in Other comprehensive income.
The Company recognizes gains and losses on the settlement of a defined benefit plan when the settlement occurs. The gain or loss on settlement comprises any resulting change in the fair value of plan assets and change in the present value of defined benefit obligation. Past service costs following from the introduction of a change to the benefit payable under a plan or a significant reduction of the number of employees covered by a plan, are recognized in full in the Statement of income.
Short-term employee benefit obligations are measured on an undiscounted basis and are expensed as the related service is provided. The Company recognizes a liability and an expense for bonuses and profit-sharing, based on a formula that takes into consideration the profit attributable to the Company’s shareholders after certain adjustments. The Company recognizes a provision where contractually obliged or where there is a past practice that has created a constructive obligation and the obligation can be measured reliably.
The Company’s net obligation in respect of long-term employee benefits is the amount of future benefit that employees have earned in return for their service in the current and prior periods, such as jubilee entitlements. That benefit is discounted to determine its present value. Remeasurements are recognized in the income statement in the period in which they arise.
Share-based paymentnature
The grant-date fair value of equity-settled share-based payment awards granted to employees is recognized as personnel expense, with a corresponding increase in equity, over the vesting period of the award. The Company uses the Black-Scholes option-pricing model and Monte Carlo sampling to determine the fair value of the awards, depending on the type of instruments granted and certain vesting conditions.
Revenue recognition
Revenue from the sale of goods in the course of the ordinary activities is measured at the fair value of the consideration received or receivable, net of returns, trade discounts and volume rebates. Revenue for sale of goods is recognized when the significant risks and rewards of ownership have been transferred to the buyer, recovery of the consideration is probable, the associated costs and possible return of the goods can be estimated
Annual Report 2013 167
11 Group financial statements 11.9 - 11.9
reliably, there is no continuing involvement with goods, and the amount of revenue can be measured reliably. If it is probable that discounts will be granted and the amount can be measured reliably, then the discount is recognized as a reduction of revenue as the sales are recognized.
Transfer of risks and rewards varies depending on the individual terms of the contract of sale. For consumer-type products in the sectors Lighting and Consumer Lifestyle these criteria are met at the time the product is shipped and delivered to the customer and depending on the delivery conditions, title and risk have passed to the customer (depending on the delivery conditions) and acceptance of the product when contractually required, has been obtained, or, in cases where such acceptance is not contractually required, when management has established that all aforementioned conditions for revenue recognition have been met.obtained. Examples of the above-mentioned delivery conditions are ‘Free on Board point of delivery’ and ‘Costs, Insurance Paid point of delivery’, where the point of delivery may be the shipping warehouse or any other point of destination as agreed in the contract with the customer and where title and risk for the goods pass to the customer.
Revenues of transactions that have separately identifiable components are recognized based on their relative fair values. These transactions mainly occur in the Healthcare sector and include arrangements that require subsequent installation and training activities in order to become operable for the customer. However, since payment for the equipment is contingent upon the completion of the installation process, revenue recognition is generally deferred until the installation has been completed and the product is ready to be used by the customer in the way contractually agreed.
Revenues are recorded net of sales taxes, customer discounts, rebates and similar charges. For products for which a right of return exists during a defined period, revenue recognition is determined based on the historical pattern of actual returns, or in cases where such information is not available, revenue recognition is postponed until the return period has lapsed. Return policies are typically based on customary return arrangements in local markets.
For products for which a residual value guarantee has been granted or a buy-back arrangement has been concluded, revenue recognition takes place when significant risks and rewards of ownership are transferred to the customer. The following are the principal factors that the Company considers in determining that the Company has transferred significant risks and rewards:
the period from the sale to the repurchase represents the major (normally at least 75%) part of the economic life of the asset;
the proceeds received on the initial transfer and the amount of any residual value or repurchase price, measured on a present value basis, is equal to substantially all (normally at least 90%) of the fair value of the asset at the sale date;
insurance risk is borne by the customer; however, if the customer bears the insurance risk but the Company bears the remaining risks, then risks and rewards have not been transferred to the customer; and
the repurchase price is equal to the market value at the time of the buy-back.
In case of loss under a sales agreement, the loss is recognized immediately.
Shipping and handling billed to customers is recognized as revenues. Expenses incurred for shipping and handling of internal movements of goods are recorded as cost of sales. Shipping and handling related to sales to third parties are recorded as selling expenses. When shipping and handling is part of a project and billed to the customer, then the related expenses are recorded as cost or sales. Service revenue related to repair and maintenance activities for goods sold is recognized ratably over the service period or as services are rendered.
A provision for product warranty is made at the time of revenue recognition and reflects the estimated costs of replacement and free-of-charge services that will be incurred by the Company with respect to the products. For certain products, the customer has the option to purchase an extension of the warranty, which is subsequently billed to the customer. Revenue recognition occurs on a straight-line basis over the extended warranty contract period.
Revenue from services is recognized when the Company can reliably measure the amount of revenue and the associated cost related to the stage of completion of a contract or transaction, and the recovery of the consideration is considered probable.
Royalty income, which is generally earned based upon
142 Annual Report 2015
Group financial statements 12.9
a percentage of sales or a fixed amount per product sold, is recognized on an accrual basis.basis based on actual or reliably estimated sales made by the licensees.
Grants from the government are recognized at their fair value where there is a reasonable assurance that the grant will be received and the Company will comply with all attached conditions. Government grants relating to costs are deferred and recognized in the Statement of income over the period necessary to match them with the costs that they are intended to compensate.
Financial income and expenses
Financial income comprises interest income on funds invested (including available-for-sale financial assets) and recognized surpluses for post-employment benefit plans, dividend income, net gains on the disposal of available-for-sale financial assets, net fair value gains on financial assets at fair value through profit or loss, net gains on the remeasurement to fair value of any pre-existing available-for-sale interest in an acquiree, and net gains on hedging instruments that are recognized in the Statement of income. Interest income is recognized on accrual basis in the Statement of income, using the effective interest method. Dividend income is recognized in the Statement of income on the date that the Company’s right to receive payment is established, which in the case of quoted securities is normally the ex-dividend date.
Financial expenses comprise interest expense on borrowings and recognized deficits for post-employment benefit plans, unwinding of the discount on provisions and contingent consideration, losses on disposal of available-for-sale financial assets, net fair value losses on financial assets at fair value through profit or loss, impairment losses recognized on financial assets (other than trade receivables), net interest expenses related to defined benefit plans and net losses on hedging instruments that are recognized in the Statement of income.
Borrowing costs that are not directly attributable to the acquisition, construction or production of a qualifying asset are recognized in the Statement of income using the effective interest method.
Foreign currency gains and losses are reported on a net basis as either financial income or financial cost depending on whether foreign currency movements are in a net gain or net loss position.
Income tax
Income tax comprises current and deferred tax. Income tax is recognized in the Statement of income except to the extent that it relates to items recognized directly within equity or in other comprehensive income. Current tax is the expected tax payable on the taxable income for the year, using tax rates enacted or substantially-enacted at the reporting date, and any adjustment to tax payable in respect of previous years.
Deferred tax assets and liabilities are recognized, using the balance sheet method, for the expected tax consequences of temporary differences between the carrying amounts of assets and liabilities and the amounts used for taxation purposes. Deferred tax is not recognized for the following temporary differences: the initial recognition of goodwill, the initial recognition of assets and liabilities in a transaction that is not a business combination and that affects neither accounting nor taxable profit, and differences relating to investments in subsidiaries to the extent that they probably will not reverse in the foreseeable future. Deferred tax is measured at the tax rates that are expected to be applied to temporary differences when they reverse, based on the laws that have been enacted or substantially-enacted by the reporting date. Deferred tax assets and liabilities are offset if there is a legally-enforceable right to offset current tax liabilities and assets, and they relate to income taxes levied by the same tax authority on the same taxable entity or on different tax entities, but they intend to settle current tax liabilities and assets on a net basis or their tax assets and liabilities will be realized simultaneously.
A deferred tax asset is recognized for unused tax losses, tax credits and deductible temporary differences, to the extent that it is probable that future taxable profits will be available against which they can be utilized. The ultimate realization of deferred tax assets is dependent upon the generation of future taxable income in the countries where the deferred tax assets originated and during the periods when the deferred tax assets become deductible. Management considers the scheduled reversal of deferred tax liabilities, projected future taxable income and tax planning strategies in making this assessment.
Deferred tax liabilities for withholding taxes are recognized for subsidiaries in situations where the income is to be paid out as dividend in the foreseeable future and for undistributed earnings of unconsolidated companies to the extent that these withholding taxes are not expected to
168 Annual Report 2013
11 Group financial statements 11.9 - 11.9
be refundable or deductible. Changes in tax rates are reflected in the period when the change has been enacted or substantially-enacted by the reporting date.
Provisions
Provisions are recognized if, as a result of a past event, the Company has a present legal or constructive obligation that can be estimated reliably, and it is probable that an outflow of economic benefits will be required to settle the obligation. Provisions are measured at the present value of the expenditures expected to be required to settle the obligation using a pre-tax discount rate that reflects current market assessments of the time value of money. The increase in the provision due to passage of time is recognized as interest expense. The accounting and presentation for some of the Company’s provisions is as follows:
Product warranty – A provision for warranties is recognized when the underlying products or services are sold. The provision is based on historical warranty data and a weighing of possible outcomes against their associated probabilities.
Environmental provisions – Measurement of liabilities associated with environmental obligations, is based on current legal and constructive requirements. Liabilities and expected insurance recoveries, if any, are recorded separately. The carrying amount of environmental liabilities is regularly reviewed and adjusted for new facts and changes in law.
Restructuring-related provisions – The provision for restructuring relates to the estimated costs of initiated restructurings, the most significant of which have been approved by the Executive Committee, and which generally involve the realignment of certain parts of the industrial and commercial organization. When such restructurings require discontinuance and/or closure of lines of activities, the anticipated costs of closure or discontinuance are included in restructuring provisions. A liability is recognized for those costs only when the Company has a detailed formal plan for the restructuring and has raised a valid expectation with those affected that it will carry out the restructuring by starting to implement that plan or announcing its main features to those affected by it. Before a provision is established, the Company recognizes any impairment loss on the assets associated with the restructuring.
Litigation provisions – In relation to legal claim provisions and settlements, the relevant balances are transferred to Other liabilities at the point the amount and timing of cash outflows are no longer uncertain.
Annual Report 2015 143
Group financial statements 12.9
| Settlements which are agreed for amounts in excess of existing provisions are reflected as increases of Other liabilities. |
Goodwill
The measurement of goodwill at initial recognition is described under Basis of consolidation below. Goodwill is subsequently measured at cost less accumulated impairment losses. In respect of investments in associates, the carrying amount of goodwill is included in the carrying amount of investment, and an impairment loss on such investment is allocated to the investment as a whole.
Intangible assets other than goodwill
Acquired finite-lived intangible assets are amortized using the straight-line method over their estimated useful life. The useful lives are evaluated annually. Patents and trademarks with a finite useful life acquired from third parties either separately or as part of a business combination are capitalized at cost and amortized over their remaining useful lives. Intangible assets acquired as part of a business combination are capitalized at their acquisition-date fair value.
The Company expenses all research costs as incurred. Expenditure on development activities, whereby research findings are applied to a plan or design for the production of new or substantially improved products and processes, is capitalized as an intangible asset if the product or process is technically and commercially feasible and the Company has sufficient resources and the intention to complete development.
The development expenditure capitalized comprises of all directly attributable costs (including the cost of materials and direct labor). Other development expenditures and expenditures on research activities are recognized in the Statement of income. Capitalized development expenditure is stated at cost less accumulated amortization and impairment losses. Amortization of capitalized development expenditure is charged to the Statement of income on a straight-line basis over the estimated useful lives of the intangible assets.
Discontinued operations and non-current assets held for sale
Non-current assets (disposal groups comprising assets and liabilities) that are expected to be recovered primarily through sale rather than through continuing use are classified as held for sale.
A discontinued operation is a component of an entity that either has been disposed of, or that is classified as held for sale, and (a) represents a separate major line of business or geographical area of operations; and (b) is a part of a single coordinated plan to dispose of a separate major line of business or geographical area of operations; or (c) is a subsidiary acquired exclusively with a view to sell. A component that previously was held for use will have one or more cash-generating units. Generally, the disposal of a business that previously was part of a single cash-generating unit does not qualify as a component of an entity and therefore shall not be classified as a discontinued operation if disposed of.
Non-current assets held for sale and discontinued operations are carried at the lower of carrying amount or fair value less costscost to sell. Any gain or loss from disposal, of a business, together with the results of these operations until the date of disposal, is reported separately as discontinued operations. The financial information of discontinued operations is excluded from the respective captions in the Consolidated financial statements and related notes for all periods presented. Comparatives in the balance sheet are not re-presented when a non-current asset or disposal group is classified as held for sale. Comparatives are restatedre-presented for presentation of discontinued operations in the Statement of cash flow and Statement of income.
Upon classification of a disposal group as held for sale the Company may agree with the buyer to retain certain assets and liabilities, in which case such items are not presented as part of assets/liabilities held for sale, even though the associated item in the Statement of income would be presented as part of discontinued operations. The presentation of cash flows relating to such items in that case mirrors the classification in the Statement of income, i.e. as cash flows from discontinued operations.
Adjustments in the current period to amounts previously presented in discontinued operations that are directly related to the disposal of a discontinued operation in a prior period are classified separately in discontinued operations. Circumstances to which these adjustments may relate include resolution of uncertainties that arise from the terms of the disposal transaction, such as the resolution of a purchase price adjustments and indemnifications, resolution of uncertainties that arise from and are directly related to the operations of the component before its disposal, such as environmental and product warranty obligations retained by the Company, or the settlement of employee benefit plan obligations provided that the settlement is directly related to the disposal transaction.
SegmentsImpairment
Operating segmentsImpairment of goodwill and intangible assets not yet ready for use
Goodwill and intangible assets not yet ready for use are componentsnot amortized but tested for impairment annually and whenever impairment indicators require. In most cases the Company identified its cash generating units for goodwill at one level below that of an operating segment. Cash flows at this level are substantially independent from other cash flows and this is the lowest level at which goodwill is monitored by the Executive Committee. The Company performed and completed annual impairment tests in the same quarter of all years presented in the Statements of income. An impairment loss is recognized in the Statement of income whenever and to the extent that the carrying amount of a cash-generating unit exceeds the unit’s recoverable amount, which is the greater of its value in use and fair value less cost to sell. Value in use is measured as the present value of future cash flows expected to be generated by the asset.
Impairment of non-financial assets other than goodwill, intangible assets not yet ready for use, inventories and deferred tax assets
Non-financial assets other than goodwill, intangible assets not yet ready for use, inventories and deferred tax assets are reviewed for impairment whenever events or changes in circumstances indicate that the
144 Annual Report 2015
Group financial statements 12.9
carrying amount of an asset may not be recoverable. Recoverability of assets to be held and used is recognized and measured by a comparison of the Company’s business activities about which separate financial informationcarrying amount of an asset with the greater of its value in use and fair value less cost to sell. Value in use is available that is evaluated regularlymeasured as the present value of future cash flows expected to be generated by the chief operating decision maker (the Boardasset. If the carrying amount of Managementan asset is deemed not recoverable, an impairment charge is recognized in the amount by which the carrying amount of the Company).asset exceeds the recoverable amount. The Boardreview for impairment is carried out at the level where cash flows occur that are independent of Management decides howother cash flows.
Impairment losses recognized in prior periods are assessed at each reporting date for any indications that the loss has decreased or no longer exists. An impairment loss is reversed if and to allocate resourcesthe extent there has been a change in the estimates used to determine the recoverable amount. The loss is reversed only to the extent that the asset’s carrying amount does not exceed the carrying amount that would have been determined, net of depreciation or amortization, if no impairment loss had been recognized. Reversals of impairment are recognized in the Statement of income.
Impairment of financial assets
A financial asset is considered to be impaired if objective evidence indicates that one or more events have had a negative effect on the estimated future cash flows of that asset. In case of available-for-sale financial assets, a significant or prolonged decline in the fair value of the financial assets below its cost is considered an indicator that the financial assets are impaired. If any such evidence exists for available-for-sale financial assets, the cumulative loss - measured as the difference between the acquisition cost and assesses performance. Reportable segmentsthe current fair value, less any impairment loss on that financial asset previously recognized in the Statement of income - is reclassified from the fair value reserve in equity (through Other comprehensive income) to the Statement of income.
If objective evidence indicates that financial assets that are carried at cost need to be tested for impairment, calculations are based on information derived from business plans and other information available for estimating their fair value, which is based on estimated future cash flows discounted at the asset’s original effective interest rate. Any impairment loss is charged to the Statement of income.
An impairment loss related to financial assets is reversed if in a subsequent period, the fair value increases and the increase can be related objectively to an event occurring after the impairment loss was recognized. The loss is reversed only to the extent that the asset’s carrying amount does not exceed the carrying amount that would have been determined if no impairment loss had been recognized. Reversals of impairment are recognized in the Statement of income except for reversals of impairment of available-for-sale equity securities, which are recognized in Other comprehensive income.
Other policies
Basis of consolidation
The Consolidated financial statements comprise the operating sectors Healthcare, Consumer Lifestylefinancial statements of Koninklijke Philips N.V. and Lighting. Innovation, Group & Services (IG&S)all subsidiaries that the Company controls, i.e. when it is a sector but not a separate reportable segmentexposed, or has rights, to variable returns from its involvement with the investee and holds, amongst others, headquarters, overheadhas the ability to affect those returns through its power over the investee. The existence and regional/country organization expenses. Segment accounting policieseffect of potential voting rights are considered when assessing whether the Company controls another entity. Subsidiaries are fully consolidated from the date that control commences until the date that control ceases. All intercompany balances and transactions have been eliminated in the Consolidated financial statements. Unrealized losses are eliminated in the same way as the accounting policies as appliedunrealized gains, but only to the Group.extent that there is no evidence of impairment.
Cash flow statementsBusiness combinations
Cash flow statementsBusiness combinations are preparedaccounted for using the indirectacquisition method. Cash flowsUnder the acquisition method, the identifiable assets acquired, liabilities assumed and any non-controlling interest in foreign currencies have been translated into euros using the weighted average ratesacquiree are recognized at the acquisition date, which is the date on which control is transferred to the Company.
The Company measures goodwill at the acquisition date as:
the fair value of exchangethe consideration transferred; plus
the recognized amount of any non-controlling interest in the acquiree; plus
if the business combination is achieved in stages, the fair value of the existing equity interest in the acquiree; less
the net recognized amount (generally fair value) of the identifiable assets acquired and liabilities assumed.
Costs related to the acquisition, other than those associated with the issue of debt or equity securities, that the Company incurs are expensed as incurred.
Any contingent consideration payable is recognized at fair value at the acquisition date and initially is presented as Long-term provisions. When the timing and amount of the consideration become more certain, it is reclassified to Accrued liabilities. If the contingent consideration that meets the definition of a financial instrument is classified as equity, it is not remeasured and settlement is accounted for within equity. Otherwise, subsequent changes to the periods involved. Cash flows from derivative instruments thatfair value of the contingent consideration are recognized in the Statement of income.
Annual Report 2015 145
Group financial statements 12.9
Non-controlling interests are measured at their proportionate share of the acquiree’s identifiable net assets at the date of acquisition.
Acquisitions of and adjustments to non-controlling interests
Acquisitions of non-controlling interests are accounted for as transactions with owners in their capacity as owners and therefore no goodwill is recognized. Adjustments to non-controlling interests arising from transactions that do not involve the loss of control are based on a proportionate amount of the net assets of the subsidiary.
Loss of control
Upon the loss of control, the Company derecognizes the assets and liabilities of the subsidiary, any non-controlling interests and the other components of equity related to the subsidiary. Any surplus or deficit arising on the loss of control is recognized in the Statement of income. If the Company retains any interest in the previous subsidiary, then such interest is measured at fair value hedgesat the date the control is lost. Subsequently it is accounted for as either an equity-accounted investee (associate) or as an available-for-sale financial asset, depending on the level of influence retained.
Investments in associates (equity-accounted investees)
Associates are all entities over which the Company has significant influence, but does not control. Significant influence is presumed with a shareholding of between 20% and 50% of the voting rights. Investments in associates are accounted for using the equity method of accounting and are initially recognized at cost. The Company’s investments in associates includes goodwill identified on acquisition, net of any accumulated impairment loss.
The Company’s share of the net income of these companies is included in Results relating to investments in associates in the Statement of income, after adjustments to align the accounting policies with those of the Company, from the date that significant influence commences until the date that significant influence ceases. Dilution gains and losses arising from investments in associates are recognized in the Statement of income as part of Other results relating to investments in associates. When the Company’s share of losses exceeds its interest in an associate, the carrying amount of that interest (including any long-term loans) is reduced to zero and recognition of further losses is discontinued except to the extent that the Company has incurred legal or constructive obligations or made payments on behalf of the associate. Unrealized gains on transactions between the Company and its associates are eliminated to the extent of the Company’s interest in the associates. Unrealized losses are also eliminated unless the transaction provides evidence of an impairment of the asset transferred. Remeasurement differences of an equity stake resulting from gaining control over the investee previously recorded as associate are recorded under Results relating to investments in associates.
Foreign currencies
Foreign currency transactions
The financial statements of all group entities are measured using the currency of the primary economic environment in which the entity operates (functional currency). The euro (EUR) is the functional currency of the Company and presentation currency of the Group financial statements. Foreign currency transactions are translated into the functional currency using the exchange rates prevailing at the dates of the transactions or valuation where items are remeasured. Foreign exchange gains and losses resulting from the settlement of such transactions and from the translation at year-end exchange rates of monetary assets and liabilities denominated in foreign currencies are recognized in the Statement of income, except when deferred in Other comprehensive income as qualifying cash flow hedges and qualifying net investment hedges.
Foreign currency differences arising from translation are classifiedrecognized in the Statement of income, except for available-for-sale equity investments which are recognized in Other comprehensive income, unless regarding an impairment in which case foreign currency differences that have been recognized in Other comprehensive income are reclassified to the Statement of income.
All exchange difference items are presented as part of Cost of sales, with the exception of tax items and financial income and expense, which are recognized in the same categoryline item as they relate in the cash flows fromStatement of income.
Non-monetary assets and liabilities denominated in foreign currencies that are measured at fair value are retranslated to the hedged items. Cash flows from other derivativefunctional currency using the exchange rate at the date the fair value was determined. Non-monetary items in a foreign currency that are measured based on historical cost are translated using the exchange rate at the transaction date.
Foreign operations
The assets and liabilities of foreign operations, including goodwill and fair value adjustments arising on acquisition, are translated to euro at exchange rates at the reporting date. The income and expenses of foreign operations are translated to euro at exchange rates at the dates of the transactions.
Foreign currency differences arising on translation of foreign operations into euro are recognized in Other comprehensive income, and presented as part of Currency translation differences in Equity. However, if
146 Annual Report 2015
Group financial statements 12.9
the operation is a non-wholly owned subsidiary, then the relevant proportionate share of the translation difference is allocated to Non-controlling interests.
When a foreign operation is disposed of such that control, significant influence or joint control is lost, the cumulative amount in the Currency translation differences related to the foreign operation is reclassified to the Statement of income as part of the gain or loss on disposal. When the Company disposes of only part of its interest in a subsidiary that includes a foreign operation while retaining control, the respective proportion of the cumulative amount is reattributed to Non-controlling interests. When the Company disposes of only part of its investment in an associate or joint venture that includes a foreign operation while retaining significant influence or joint control, the relevant proportion of the cumulative amount is reclassified to the Statement of income.
Financial instruments
Non-derivative financial instruments
Non-derivative financial instruments are classified consistent withrecognized initially at fair value when the natureCompany becomes a party to the contractual provisions of the instrument.
Earnings perRegular way purchases and sales of financial assets are accounted for at the trade date. Dividend and interest income are recognized when earned. Gains or losses, if any, are recorded in Financial income and expense.
Non-derivative financial instruments comprise cash and cash equivalents, receivables, other non-current financial assets, debt and other financial liabilities that are not designated as hedges.
Cash and cash equivalents
Cash and cash equivalents include all cash balances and short-term highly liquid investments with an original maturity of three months or less that are readily convertible into known amounts of cash.
Receivables
Receivables are carried at the lower of amortized cost or the present value of estimated future cash flows, taking into account discounts given or agreed. The present value of estimated future cash flows is determined through the use of value adjustments for uncollectible amounts. As soon as individual trade accounts receivable can no longer be collected in the normal way and are expected to result in a loss, they are designated as doubtful trade accounts receivable and valued at the expected collectible amounts. They are written off when they are deemed to be uncollectible because of bankruptcy or other forms of receivership of the debtors. The allowance for the risk of non-collection of trade accounts receivable takes into account credit-risk concentration, collective debt risk based on average historical losses, and specific circumstances such as serious adverse economic conditions in a specific country or region.
Other non-current financial assets
Other non-current financial assets include held-to-maturity investments, loans receivable and available-for-sale financial assets and financial assets at fair value through profit or loss.
Held-to-maturity investments are those debt securities which the Company has the ability and intent to hold until maturity. Held-to-maturity debt investments are recorded at amortized cost, adjusted for the amortization or accretion of premiums or discounts using the effective interest method.
Loans receivable are stated at amortized cost, less impairment.
Available-for-sale financial assets are non-derivative financial assets that are designated as available-for-sale and that are not classified in any of the other categories of financial assets. Subsequent to initial recognition, they are measured at fair value and changes therein, other than impairment losses and foreign currency differences on available for sale-debt instruments are recognized in Other comprehensive income and presented in the fair value reserve in equity. When an investment is derecognized, the gain or loss accumulated in equity is reclassified to the Statement of income.
Available-for-sale financial assets including investments in privately-held companies that are not associates, and do not have a quoted market price in an active market and whose fair value could not be reliably determined, are carried at cost.
A financial asset is classified as fair value through profit or loss if it is classified as held for trading or is designated as such upon initial recognition. Financial assets are designated as fair value through profit or loss if the Company manages such investments and makes purchase and sale decisions based on their fair value in accordance with the Company’s documented risk management or investment strategy. Financial assets at fair value through profit or loss are measured at fair value, and changes therein are recognized in the Statement of income. Attributable transaction costs are recognized in the Statement of income as incurred.
Equity
Common shares are classified as equity. Incremental costs directly attributable to the issuance of shares are recognized as a deduction from equity. Where the Company purchases the Company’s equity share capital (treasury shares), the consideration paid, including any directly attributable incremental transaction costs (net of income taxes), is deducted from equity attributable to the Company’s equity holders until the shares are cancelled or reissued. Where such ordinary shares are subsequently reissued, any consideration received, net of any directly
Annual Report 2015 147
Group financial statements 12.9
attributable incremental transaction costs and the related income tax effects, is included in equity attributable to the Company’s equity holders.
Dividends are recognized as a liability in the period in which they are declared. The income tax consequences of dividends are recognized when a liability to pay the dividend is recognized.
Debt and other liabilities
Debt and liabilities other than provisions are stated at amortized cost.
Derivative financial instruments, including hedge accounting
The Company uses derivative financial instruments principally to manage its foreign currency risks and, to a more limited extent, for managing interest rate and commodity price risks. All derivative financial instruments are accounted for at the trade date and classified as current or non-current assets or liabilities based on the maturity date or the earlier termination date. Embedded derivatives are separated from the host contract and accounted for separately if the economic characteristics and risks of the host contract and the embedded derivative are not closely related. The Company measures all derivative financial instruments at fair value derived from market prices of the instruments, or calculated as the present value of the estimated future cash flows based on observable interest yield curves, basis spread, credit spreads and foreign exchange rates, or from option pricing models, as appropriate. Gains or losses arising from changes in fair value of derivatives are recognized in the Statement of income, except for derivatives that are highly effective and qualify for cash flow or net investment hedge accounting.
Changes in the fair value of a derivative that is highly effective and that is designated and qualifies as a cash flow hedge, are recorded in Other comprehensive income, until the Statement of income is affected by the variability in cash flows of the designated hedged item. To the extent that the hedge is ineffective, changes in the fair value are recognized in the Statement of income.
The Company formally assesses, both at the hedge’s inception and on an ongoing basis, whether the derivatives that are used in hedging transactions are highly effective in offsetting changes in fair values or cash flows of hedged items. When it is established that a derivative is not highly effective as a hedge or that it has ceased to be a highly effective hedge, the Company discontinues hedge accounting prospectively. When hedge accounting is discontinued because it is expected that a forecasted transaction will not occur, the Company continues to carry the derivative on the Balance sheet at its fair value, and gains and losses that were accumulated in equity are recognized immediately in the Statement of income.
Foreign currency differences arising on the retranslation of financial instruments designated as a hedge of a net investment in a foreign operation are recognized directly as a separate component of equity through Other comprehensive income, to the extent that the hedge is effective. To the extent that the hedge is ineffective, such differences are recognized in the Statement of income.
Offsetting and master netting agreements
The Company presents basicfinancial assets and diluted earnings per share (EPS) datafinancial liabilities on a gross basis as separate line items in the Consolidated balance sheet.
Master netting agreements may be entered into when the Company undertakes a number of financial instrument transactions with a single counterparty. Such an agreement provides for its common shares. Basic EPS is calculateda net settlement of all financial instruments covered by dividing the net income attributable to shareholdersagreement in the event of default or certain termination events on any of the Company bytransactions. A master netting agreement may create a right of offset that becomes enforceable and affects the weighted average numberrealization or settlement of common shares outstanding duringindividual financial assets and financial liabilities only following a specified termination event. However, if this contractual right is subject to certain limitations then it does not necessarily provide a basis for offsetting unless both of the offsetting criteria are met, i.e. there is a legally enforceable right and an intention to settle net or simultaneously.
Property, plant and equipment
The costs of Property, plant and equipment comprises of all directly attributable costs (including the cost of material and direct labor). Government grants for assets are deducted from the cost of the related asset.
Depreciation is generally calculated using the straight-line method over the useful life of the asset. Gains and losses on the sale of property, plant and equipment are included in Other business income. Costs related to repair and maintenance activities are expensed in the period adjusted for own shares held. Diluted EPSin which they are incurred unless leading to an extension of the original lifetime or capacity.
Plant and equipment under finance leases and leasehold improvements are amortized using the straight-line method over the shorter of the lease term or the estimated useful life of the asset. The gain realized on sale and operating leaseback transactions that are concluded based upon market conditions is determined by adjustingrecognized at the time of the sale.
Leased assets
Leases in which the Company is the lessee and has substantially all the risks and rewards of ownership are classified as finance leases. Finance leases are capitalized at the commencement of the lease at the lower of the fair value of the leased assets and the present value of the minimum lease payments. Each lease payment is allocated between the liability and finance charges. The interest element of the finance
148 Annual Report 2015
Group financial statements 12.9
cost is charged to the Statement of income over the lease period so as to produce a constant periodic rate of interest on the remaining balance of the liability for each period. The corresponding rental obligations, net of finance charges, are included in other short-term and other non-current liabilities. The property, plant and equipment acquired under finance leases is depreciated over the shorter of the useful life of the assets and the lease term.
Leases in which the Company is the lessee and in which substantially all risks and rewards of ownership are retained by the lessor are classified as operating leases. Payments made under operating leases (net of any incentives received from the lessor) are recognized in the Statement of income on a straight-line basis over the term of the lease.
Inventories
Inventories are stated at the lower of cost or net realizable value. The cost of inventories comprises all costs of purchase, costs of conversion and other costs incurred in bringing the inventories to their present location and condition. The costs of conversion of inventories include direct labor and fixed and variable production overheads, taking into account the stage of completion and the normal capacity of production facilities. Costs of idle facility and abnormal waste are expensed. The cost of inventories is determined using the first-in, first-out (FIFO) method. Inventory is reduced for the estimated losses due to obsolescence. This reduction is determined for groups of products based on purchases in the recent past and/or expected future demand.
Employee benefit accounting
A defined contribution plan is a post-employment benefit plan under which an entity pays fixed contributions into a separate entity and will have no legal or constructive obligation to pay further amounts. Obligations for contributions to defined contribution pension plans are recognized as an employee benefit expense in the Statement of income in the periods during which services are rendered by employees.
A defined benefit plan is a post-employment benefit plan other than a defined contribution plan. Plans for which the Company has no legal or constructive obligation to pay further amounts, however for which contributions paid by the Company are not fixed, are also treated as defined benefit plan. The net pension asset or liability recognized in the Consolidated balance sheets in respect of defined benefit post-employment plans is the fair value of plan assets less the present value of the projected defined benefit obligation (DBO) at the balance sheet date. The projected defined benefit obligation is calculated annually by qualified actuaries using the projected unit credit method. Recognized assets are limited to the present value of any reductions in future contributions or any future refunds.
For the Company’s major plans, a full discount rate curve of high-quality corporate bonds is used to determine the defined benefit obligation. The curves are based on Towers Watson’s RATE:Link methodology which uses data of corporate bonds rated AA or equivalent. For the other plans a single point discount rate is used based on corporate bonds for which there is a deep market and the plan’s maturity. Plans in countries without a deep corporate bond market use a discount rate based on the local sovereign curve and the plan’s maturity.
Pension costs in respect of defined benefit post-employment plans primarily represent the increase of the actuarial present value of the obligation for post-employment benefits based on employee service during the year and the interest on the net recognized asset or liability in respect of employee service in previous years.
Remeasurements of the net defined benefit liability comprise actuarial gains and losses, the return on plan assets (excluding interest) and the effect of the asset ceiling (excluding interest). The Company recognizes all remeasurements in Other comprehensive income.
The Company recognizes gains and losses on the settlement of a defined benefit plan when the settlement occurs. The gain or loss on settlement is the difference between the present value of the defined benefit obligation being settled, as determined on the date of settlement, and the settlement price, including any plan assets transferred and any payments made directly by the Company in connection with the settlement. In this respect, the amount of the plan assets transferred is adjusted for the effect of the asset ceiling. Past service costs following from the introduction of a change to the benefit payable under a plan or a significant reduction of the number of employees covered by a plan (curtailment), are recognized in full in the Statement of income.
Short-term employee benefit obligations are measured on an undiscounted basis and are expensed as the related service is provided. The Company recognizes a liability and an expense for bonuses and incentives based on a formula that takes into consideration the profit attributable to the Company’s shareholders after certain adjustments.
The Company’s net obligation in respect of long-term employee benefits is the amount of future benefit that employees have earned in return for their service in the current and prior periods, such as jubilee entitlements. That benefit is discounted to determine its present value. Remeasurements are recognized in the weighted average numberStatement of common shares outstanding, adjusted for own shares held, forincome in the effectsperiod in which they arise.
Share-based payment
The grant-date fair value of all dilutive potential common shares, which comprise convertible personnel debentures, restricted shares, performance shares and share optionsequity-settled share-based payment awards granted to employees.employees is recognized as personnel expense, with a
Annual Report 2015 149
Group financial statements 12.9
corresponding increase in equity, over the vesting period of the award. The Company uses the Black-Scholes option-pricing model and Monte Carlo sampling to determine the fair value of the awards, depending on the type of instruments granted and certain vesting conditions.
Financial income and expenses
Financial income comprises interest income on funds invested (including available-for-sale financial assets), dividend income, net gains on the disposal of available-for-sale financial assets, net fair value gains on financial assets at fair value through profit or loss, net gains on the remeasurement to fair value of any preexisting available-for-sale interest in an acquiree, and net gains on foreign exchange impacts that are recognized in the Statement of income.
Interest income is recognized on accrual basis in the Statement of income, using the effective interest method. Dividend income is recognized in the Statement of income on the date that the Company’s right to receive payment is established, which in the case of quoted securities is normally the ex-dividend date.
Financial expenses comprise interest expenses on borrowings, unwinding of the discount on provisions and contingent consideration, losses on disposal of available-for-sale financial assets, net fair value losses on financial assets at fair value through profit or loss, impairment losses recognized on financial assets (other than trade receivables), net interest expenses related to defined benefit plans and net losses on foreign exchange impacts that are recognized in the Statement of income.
Financial guarantees
The Company recognizes a liability at the fair value of the obligation at the inception of a financial guarantee contract. The guarantee is subsequently measured at the higher of the best estimate of the obligation or the amount initially recognized.
Cash flow statements
Cash flows arising from transactions in a foreign currency are translated in the Company’s functional currency using the exchange rate at the date of the cash flow. Cash flows from derivative instruments that are accounted for as cash flow hedges are classified in the same category as the cash flows from the hedged items. Cash flows from other derivative instruments are classified as investing cash flow.
Segment information
Operating segments are components of the Company’s business activities about which separate financial information is available that is evaluated regularly by the chief operating decision maker (the Executive Committee of the Company). The Executive Committee decides how to allocate resources and assesses performance. Reportable segments comprise the operating sectors Healthcare, Consumer Lifestyle and Lighting. Innovation, Group & Services (IG&S) is a sector but not a separate reportable segment and holds, among others, headquarters, overhead and regional/ country organization expenses. Segment accounting policies are the same as the accounting policies applied by the Company.
Earnings per Share
The Company presents basic and diluted earnings per share (EPS) data for its common shares. Basic EPS is calculated by dividing the Net income (loss) attributable to shareholders by the weighted average number of common shares outstanding during the period, adjusted for own shares held. Diluted EPS is determined by adjusting the Net income (loss) attributable to shareholders and the weighted average number of common shares outstanding during the period, adjusted for own shares held, for the effects of all dilutive potential common shares, which comprises of restricted shares, performance shares and share options granted to employees.
New standards and interpretations
IFRS accounting standards adopted as from 20132015
The Company has adopted the following amended standard as of January 1, 2015:
Defined Benefit Plans: Employee Contributions (Amendments to IAS 19)
The amendment introduces a relief regarding the accounting for contributions from employees related to defined benefit plans that involve such contributions. The relief is that when certain conditions are met, a company is permitted (but not required) to recognize the employee contributions as a reduction of the service cost in the period in which the related service is rendered. The amendments apply retrospectively for annual periods beginning on or after July 1, 2014.
Philips traditionally deducted employee contributions from service cost as per the above, that became formal guidance with the issuance of this amendment. As such, there was no retrospective impact of the implementation of this amendment.
Changes to other policies, set out abovefollowing from amendments to standards, interpretations and the annual improvement cycles, did not have been applied consistently to all periods presented in these Consolidateda material impact on the Group financial statements except as explained below which addresses changes in accounting policies.statements. In case of the absence of explicit transition requirements for new accounting pronouncements, the Company accounts for any change in accounting principlepolicies retrospectively.
The Company has adopted the following new and amended IFRSs as of January 1, 2013.
Disclosures - Offsetting Financial Assets and Liabilities (Amendments to IFRS 7)
As a result of the amendments to IFRS 7, the Company has expanded its disclosures about the offsetting of financial assets and liabilities. See note 34, Fair value of financial assets and liabilities.
IFRS 10 Consolidated Financial Statements
IFRS 10 introduces a single control model to determine whether an investee should be consolidated. The new standard includes guidance on control with less than half of the voting rights (‘de facto’ control), participating and protective voting rights and agent/principal relationships. Based on a reassessment of the control conclusion for the investees at January 1, 2013, the adoption of IFRS 10 did not have a material impact on the Company’s Consolidated financial statements.
IFRS 11 Joint Arrangements
Under IFRS 11, the structure of the joint arrangement, although still an important consideration, is no longer the main factor in determining the type of joint arrangement and therefore the subsequent accounting. Instead:
The Company’s interest in a joint operation, which is an arrangement in which the parties have rights to the assets and obligations for the liabilities, will be accounted for on the basis of the Company’s interest in those assets and liabilities.
The Company’s interest in a joint venture, which is an arrangement in which the parties have rights to the net assets, are equity-accounted.
Prior to 2012 the Company accounted for jointly controlled entities using the equity method. The adoption therefore does not have a material impact on the Company’s Consolidated financial statements.
IFRS 12 Disclosure of Interests in Other Entities
This standard contains the disclosure requirements for interests in subsidiaries, joint ventures, associates and other unconsolidated interests. As a result of IFRS 12, the Company has expanded its disclosures on interests in other entities. See note 6, Interests in entities.
IFRS 13 Fair Value Measurement
IFRS 13 establishes a single framework for measuring fair value and making disclosures about fair value measurements, when such measurements are required or permitted by other IFRSs. More specifically, the definition of fair value was clarified to be the price at which an orderly transaction to sell an asset or to transfer a liability would take place between market participants at the measurement date. The standard also replaces and expands disclosure requirements about fair value measurements in other IFRSs, of which some of these are required in interim financial statements related to financial instruments. The Company therefore has included additional disclosures in note 34, Fair value of financial assets and liabilities. IFRS 13 has no material impact on the measurements of the Company’s assets and liabilities.
Presentation of Items of Other Comprehensive Income (Amendments to IAS 1)
The new amendment requires separation of items presented in Other comprehensive income into two groups, based on whether or not they can be recycled into the Statement of income in the future. Items that will not be recycled in the future are presented separately from items that may be
Annual Report 2013 169
11 Group financial statements 11.9 - 11.9
recycled in the future. The application of this amendment impacts presentation and disclosures only. Comparative information has been re-presented.
IAS 19 Employee Benefits (2011)
As a result of the introduction of IAS 19 (2011) - or IAS 19R/Revised - the Company has changed its accounting policy with regard to the accounting of defined benefit pension plans. The main change impacts the basis of determining the income or expense for the period related to these pension plans. Under the new standard the Company determines a net interest expense (income) by applying the discount rate used to measure the defined benefit obligation (DBO) at the beginning of the annual period to the net defined benefit liability (asset) at the beginning of the annual period, taking into account any changes in the net defined benefit liability (asset) during the period as a result of contributions and benefit payments. As a result, this net interest now comprises:
interest cost on the DBO;
interest income on plan assets; and
interest on the effect of the asset ceiling.
Previously, the Company determined interest income on plan assets based on their long-term rate of expected return. Furthermore, as from January 1, 2013 the Company presents net interest expenses related to defined benefits in Financial income and expense rather than Income from operations.
The new standard no longer allows for accrual of future pension administration costs as part of the DBO. Such costs should be expensed as incurred. Previously, for the Dutch pension plan the Company accrued a surcharge for pension administration costs as part of the service costs into the DBO. With the adoption of the new standard this accrual was eliminated, resulting in an exclusion of EUR 216 million from the DBO per January 1, 2013, thereby improving the funded status. This funded status improvement is offset by the impact of the asset ceiling test regarding the Dutch pension plan’s surplus, and hence there is no further impact on the Company’s balance sheet figures other than the direct recognition of previously unrecognized past service cost.
The impact on Equity from the IAS 19 (2011) accounting policy change is as follows:
| | | | |
| | December 31, | |
| | 2012 | |
| |
Decrease in the net defined benefit obligation (non-current, after asset ceiling restriction)
| | | 13 | |
Increase in deferred tax assets (non-current)
| | | (2 | ) |
| | | | |
Net increase on equity
| | | 11 | |
Split to:
| | | | |
| |
Equity holders of the parent
| | | 11 | |
| |
Non-controlling interest
| | | — | |
The limited impact on the balance sheet mainly relates to some unrecognized past service cost gains and losses which must be recognized immediately under IAS 19 (2011). The limited impact is explained by the fact that the Company already applied immediate recognition of actuarial gains and losses in Other comprehensive income.
The negative impact of IAS 19 (2011) for post-employment defined benefit plans on Income from operations, Income before taxes and Basic and Diluted earnings per share is as follows:
| | | | | | | | |
| | | 2011 | | | 2012 | |
| | |
Income from operations | | | (124 | ) | | | (260 | ) |
Financial income and expenses | | | (92 | ) | | | (85 | ) |
| | | | |
Income before taxes | | | (216 | ) | | | (345 | ) |
| | |
Basic earnings per share | | | (0.17 | ) | | | (0.28 | ) |
Diluted earnings per share | | | (0.17 | ) | | | (0.28 | ) |
Recoverable Amount Disclosures for Non-Financial Assets (Amendments to IAS 36) (2013)
The amendment to IAS 36 Impairment of Assets was introduced following the introduction of IFRS 13 Fair Value Measurement, to reduce the circumstances in which the recoverable amount of assets or cash-generating units is required to be disclosed, clarify the disclosures required, and to introduce an explicit requirement to disclose the discount rate used in determining impairment (or reversals) where recoverable amount (based on fair value less costs of disposal) is determined using a present value technique. As the amendment is basically to avoid unintended disclosure requirements from the introduction of IFRS 13, it was early adopted by the Company. The amendment has no material impact.
Defined Benefit Plans: Employee Contributions (Amendments to IAS 19)
Initially the abovementioned IAS 19 (2011) adjustments required that employee contributions basically would have to be incorporated in the measurement of the defined benefit obligation. This amendment allows a practical expedient to continue to recognize employee contributions in the Statement of income when certain conditions are met. The Company early adopted this amendment and as a result there is no change in the way how employee contributions are currently treated compared to the treatment prior to the IAS 19 (2011) adoption. Up to 2013 the Company has very limited employee contributions in their pension plans.
IFRS accounting standards to be adopted as from 20142016 and onwards
A number of new standards and amendments to existing standards have been published and are mandatory for the Company beginning on or after January 1, 20142016 or later periods, and the Company has not yet early adopted them. Those which may be the most
150 Annual Report 2015
Group financial statements 12.9
relevant to the Company are set out below.
IFRIC 21 Levies
IFRIC 21 provides guidance on the accounting for certain outflows imposed on entities by governments in accordance with laws and/or regulations (levies). The Interpretation identifies the obligating event for the recognition of a liability as the activity that triggers the payment of the levy in accordance with the relevant legislation. This Interpretation does not have a material impact on the financial statements.
Changes to other standards, following from Amendmentsamendments and the Annual Improvement Cycles, doannual improvement cycles, are not expected to have a material impact on the Company’s financial statements.
IFRS 9 Financial Instruments
170 IFRS 9 Financial Instruments brings together the classification and measurement, impairment and hedge accounting phases of the IASB’s project to replace IAS 39 Financial Instruments: Recognition and Measurement.
IFRS 9 adds a new expected loss impairment model and amendments to classification and measurement for financial assets. The impairment model is based on the concept of providing for expected losses at inception of a contract, except in the case of purchased or originated credit-impaired financial assets, where expected credit losses are incorporated into the effective interest rate.
The standard supersedes all previous versions of IFRS 9 and is effective for periods beginning on or after January 1, 2018. It is not yet endorsed by the EU. The Company is currently in the process of assessing the impact of the new Standard.
IFRS 15 Revenue from Contracts with Customers
IFRS 15 specifies how and when revenue is recognized as well as describes more informative and relevant disclosures. The standard supersedes IAS 18 Revenue, IAS 11 Construction Contracts and a number of revenue-related interpretations.
The new standard provides a single, principles based five-step model to be applied to all contracts with customers. Furthermore, it provides new guidance on whether revenue should be recognized at a point in time or over time. The standard also introduces new guidance on costs of fulfilling and obtaining a contract, specifying the circumstances in which such costs should be capitalized. Costs that do not meet the criteria must be expensed when incurred.
IFRS 15 must be applied for periods beginning on or after January 1, 2018. It is not yet endorsed by the EU. The Company is currently assessing the impact of the new standard.
IFRS 16 Leases
For lessees, IFRS 16 (issued on January 13, 2016) requires most leases to be recognized on-balance (under a single model), eliminating the distinction between operating and finance leases. Lessor accounting however remains largely unchanged and the distinction between operating and finance leases is retained. IFRS 16 supersedes IAS 17 Leases and related interpretations.
Under IFRS 16 a lessee recognizes a right-of-use asset and a lease liability. The right-of-use asset is treated similarly to other non-financial assets and is depreciated accordingly. The lease liability is initially measured at the present value of the lease payments payable over the lease term, discounted at the rate implicit in the lease if that can be readily determined, and the liability accrues interest. As with current IAS 17, under IFRS 16 lessors classify leases as operating or finance in nature.
IFRS 16 must be applied for periods beginning on or after January 1, 2019, with earlier adoption permitted if abovementioned IFRS 15 has also been applied. IFRS 16 is not yet endorsed by the EU. The Company is currently assessing the impact of the new standard.
Annual Report 20132015 151
11 Group financial statements 11.9 - 11.9
12.9
Philips Group
Information on income statement and cash flow by sectorin millions of euros
Information by sector and main countryEUR unless otherwise stated
Sectors2013 - 2015
| | | | sales | | | sales including
intercompany | | research and
development
expenses | | income from
operations | | income from
operations as a % of
sales | | cash flow before
financing
activities | | | | | |
| | | | sales | | | sales including
intercompany | | research and
development
expenses | | income from
operations | | income from
operations as a % of
sales | | cash flow before
financing
activities | |
| | | | | |
| 2015 | | | | | | | | | | | | | |
Healthcare | | | | 10,912 | | | | 10,933 | | | | (1,073 | ) | | | 819 | | | | 7.5 | % | | | 81 | |
Consumer Lifestyle | | | | 5,347 | | | | 5,360 | | | | (301 | ) | | | 621 | | | | 11.6 | % | | | 589 | |
Lighting | | | | 7,411 | | | | 7,454 | | | | (315 | ) | | | 486 | | | | 6.6 | % | | | 642 | |
Innovation, Group & Services | | | | 574 | | | | 777 | | | | (238 | ) | | | (934 | ) | | | — | | | | (2,086 | ) |
Inter-sector eliminations | | | | | | (280 | ) | | | | | | | | |
| | | | | |
Philips Group | | | | 24,244 | | | | 24,244 | | | | (1,927 | ) | | | 992 | | | | 4.1 | % | | | (774 | ) |
| 2014 | | | | | | | | | | | | | |
Healthcare | | | | 9,186 | | | | 9,209 | | | | (822 | ) | | | 456 | | | | 5.0 | % | | | 910 | |
Consumer Lifestyle | | | | 4,731 | | | | 4,739 | | | | (263 | ) | | | 520 | | | | 11.0 | % | | | 553 | |
Lighting | | | | 6,869 | | | | 6,927 | | | | (330 | ) | | | 185 | | | | 2.7 | % | | | 442 | |
Innovation, Group & Services | | | | 605 | | | | 934 | | | | (220 | ) | | | (675 | ) | | | — | | | | (1,586 | ) |
Inter-sector eliminations | | | | | | (418 | ) | | | | | | | | |
| | | | | |
Philips Group | | | | 21,391 | | | | 21,391 | | | | (1,635 | ) | | | 486 | | | | 2.3 | % | | | 319 | |
| 2013 | | | | | | | | | | | | | | | | | | | | | | | | |
Healthcare | | | 9,575 | | | | 9,600 | | | | (780 | ) | | | 1,315 | | | | 13.7 | | | | 1,292 | | | | 9,575 | | | | 9,600 | | | | (810 | ) | | | 1,315 | | | | 13.7 | % | | | 1,292 | |
Consumer Lifestyle | | | 4,605 | | | | 4,622 | | | | (261 | ) | | | 429 | | | | 9.3 | | | | 472 | | | | 4,605 | | | | 4,622 | | | | (268 | ) | | | 429 | | | | 9.3 | % | | | 480 | |
Lighting | | | 8,413 | | | | 8,433 | | | | (441 | ) | | | 489 | | | | 5.8 | | | | 478 | | | | 7,145 | | | | 7,211 | | | | (313 | ) | | | 413 | | | | 5.8 | % | | | 418 | |
Innovation, Group & Services | | | 736 | | | | 1,049 | | | | (251 | ) | | | (242 | ) | | | — | | | | (2,101 | ) | | | 665 | | | | 977 | | | | (268 | ) | | | (302 | ) | | | — | | | | (2,140 | ) |
Inter-sector eliminations | | | | | (375 | ) | | | | | | | | | | | | | (420 | ) | | | | | | | | |
| | | | | | | | |
Philips Group | | | | 21,990 | | | | 21,990 | | | | (1,659 | ) | | | 1,855 | | | | 8.4 | % | | | 50 | |
| | | 23,329 | | | | 23,329 | | | | (1,733 | ) | | | 1,991 | | | | 8.5 | | | | 141 | | | | | |
| 2012 | | | | | | | | | | | | | |
Healthcare | | | 9,983 | | | | 10,005 | | | | (823 | ) | | | 1,026 | | | | 10.3 | | | | 1,298 | | |
Consumer Lifestyle | | | 4,319 | | | | 4,329 | | | | (251 | ) | | | 400 | | | | 9.3 | | | | 422 | | |
Lighting | | | 8,442 | | | | 8,465 | | | | (462 | ) | | | (66 | ) | | | (0.8 | ) | | | 279 | | |
Innovation, Group & Services | | | 713 | | | | 984 | | | | (295 | ) | | | (712 | ) | | | — | | | | (842 | ) | |
Inter-sector eliminations | | | | | (326 | ) | | | | | | | | | |
| | | | | |
| | | 23,457 | | | | 23,457 | | | | (1,831 | ) | | | 648 | | | | 2.8 | | | | 1,157 | | |
| | | | | | | | | | | | | |
| 2011 | | | | | | | | | | | | | |
Healthcare | | | 8,852 | | | | 8,866 | | | | (754 | ) | | | 27 | | | | 0.3 | | | | 707 | | |
Consumer Lifestyle | | | 3,771 | | | | 3,777 | | | | (249 | ) | | | 109 | | | | 2.9 | | | | (271 | ) | |
Lighting | | | 7,638 | | | | 7,652 | | | | (416 | ) | | | (408 | ) | | | (5.3 | ) | | | 208 | | |
Innovation, Group & Services | | | 731 | | | | 984 | | | | (186 | ) | | | (207 | ) | | | — | | | | (1,159 | ) | |
Inter-sector eliminations | | | | | (287 | ) | | | | | | | | | |
| | | | | |
| | | 20,992 | | | | 20,992 | | | | (1,605 | ) | | | (479 | ) | | | (2.3 | ) | | | (515 | ) | |
OurIn 2015, our sectors arewere organized based on the nature of the products and services. The four sectors comprisecomprised Healthcare, Consumer Lifestyle, Lighting and Innovation, Group & Services as shown in the table above.Services. A short description of these sectors is as follows:
Healthcare: ConsistsHealthcare consisted of the following businesses - Imaging Systems, Home Healthcare Informatics, Services & Solutions, Patient Care & Clinical Informatics,Monitoring Solutions, and Customer Services.
Consumer Lifestyle: ConsistsLifestyle consisted of the following businesses - Personal Care, Domestic Appliances, and Health & Wellness.
Lighting: ConsistsLighting consisted of the following businesses - Light Sources & Electronics, Professional Lighting Solutions, and Consumer Luminaires, Automotive Lighting, and Lumileds.Luminaires.
Innovation, Group & Services: ConsistsServices consisted of group headquarters, as well as the overhead expenses of regional and country organizations. Also included are the net results of group innovation, intellectual property & services, the global service units and Philips’ pension and other postretirement benefit costs not directly allocated to the other sectors.
Transactions between the sectors mainly relaterelated to services provided by the sector Innovation, Group & Services to the other sectors. The pricing of such transactions iswas determined on an arm’s length basis.
From an external financial reporting perspective, it should be noted that Royal Philips will introduce new segment reporting, from Q1 2016 onwards. The new reporting structure will be based on different segments than the sectors currently presented and discussed in this Annual Report. Philips’ health technology activities will be reported in three segments (Personal Health, Diagnosis & Treatment, Connected Care & Health Informatics), the Philips Lighting businesses within one segment, and the remaining unallocated corporate items will contain certain legacy items and separation costs. For more details on the new segment reporting in 2016 and onwards, please refer to the introduction of chapter 6, Sector performance, of this report.
152 Annual Report 2013 1712015
11 Group financial statements 11.9 - 11.912.9
Philips Group
SectorsInformation on balance sheet and capital expenditure in millions of EUR
2013 - 2015
| | | | total assets | | | net operating
capital | | total liabilities
excl. debt | | | current accounts
receivable, net | | | tangible and
intangible assets | | | depreciation and
amortization1) | | capital
expenditures | | | | | |
| | | | total assets | | | net operating
capital | | total liabilities
excl. debt | | | current accounts
receivable, net | | | tangible and
intangible assets | | | depreciation and
amortization1) | | capital
expenditures | |
| | | | | |
| 2015 | | | | | | | | | | | | | | | |
Healthcare | | | | 13,363 | | | | 9,212 | | | | 4,095 | | | | 2,343 | | | | 8,587 | | | | (618 | ) | | | 154 | |
Consumer Lifestyle | | | | 3,080 | | | | 1,453 | | | | 1,627 | | | | 853 | | | | 1,658 | | | | (205 | ) | | | 107 | |
Lighting | | | | 5,875 | | | | 3,813 | | | | 2,043 | | | | 1,442 | | | | 3,303 | | | | (281 | ) | | | 88 | |
Innovation, Group & Services | | | | 6,849 | | | | (3,382 | ) | | | 5,264 | | | | 89 | | | | 990 | | | | (177 | ) | | | 173 | |
| | | | | |
Sector totals | | | | 29,167 | | | | 11,096 | | | | 13,029 | | | | 4,727 | | | | 14,538 | | | | (1,281 | ) | | | 522 | |
Assets classified as held for sale | | | | 1,809 | | | | | | 407 | | | | | | | | | |
| | | | | | | | | | | | | | | | | |
Total assets/liabilities (excl. debt) | | | | 30,976 | | | | | | 13,436 | | | | | | | | | |
| 2014 | | | | | | | | | | | | | | | |
Healthcare | | | | 11,274 | | | | 7,565 | | | | 3,629 | | | | 2,112 | | | | 6,934 | | | | (480 | ) | | | 127 | |
Consumer Lifestyle | | | | 3,049 | | | | 1,353 | | | | 1,696 | | | | 791 | | | | 1,647 | | | | (198 | ) | | | 109 | |
Lighting | | | | 5,739 | | | | 3,638 | | | | 2,081 | | | | 1,438 | | | | 3,167 | | | | (351 | ) | | | 84 | |
Innovation, Group & Services | | | | 6,677 | | | | (3,718 | ) | | | 5,525 | | | | 135 | | | | 873 | | | | (158 | ) | | | 117 | |
| | | | | |
Sector totals | | | | 26,739 | | | | 8,838 | | | | 12,931 | | | | 4,476 | | | | 12,621 | | | | (1,187 | ) | | | 437 | |
Assets classified as held for sale | | | | 1,613 | | | | | | 349 | | | | | | | | | |
| | | | | | | | | | | | | | | | | |
Total assets/liabilities (excl. debt) | | | | 28,352 | | | | | | 13,280 | | | | | | | | | |
| 2013 | | | | | | | | | | | | | | | | | | | | | | | | | | | | |
Healthcare | | | 10,465 | | | | 7,437 | | | | 2,943 | | | | 1,978 | | | | 6,467 | | | | (517 | ) | | | 132 | | | | 10,465 | | | | 7,437 | | | | 2,943 | | | | 1,978 | | | | 6,467 | | | | (517 | ) | | | 132 | |
Consumer Lifestyle | | | 2,832 | | | | 1,261 | | | | 1,571 | | | | 743 | | | | 1,574 | | | | (199 | ) | | | 135 | | | | 2,832 | | | | 1,261 | | | | 1,571 | | | | 743 | | | | 1,574 | | | | (199 | ) | | | 135 | |
Lighting | | | 6,711 | | | | 4,462 | | | | 2,229 | | | | 1,567 | | | | 3,857 | | | | (504 | ) | | | 223 | | | | 6,711 | | | | 4,462 | | | | 2,229 | | | | 1,567 | | | | 3,857 | | | | (333 | ) | | | 117 | |
Innovation, Group & Services | | | 6,044 | | | | (2,922 | ) | | | 4,340 | | | | 132 | | | | 648 | | | | (129 | ) | | | 97 | | | | 6,044 | | | | (2,922 | ) | | | 4,340 | | | | 132 | | | | 648 | | | | (128 | ) | | | 98 | |
| | | | | | | | |
| | | 26,052 | | | | 10,238 | | | | 11,083 | | | | 4,420 | | | | 12,546 | | | | (1,349 | ) | | | 587 | | |
Sector totals | | | | 26,052 | | | | 10,238 | | | | 11,083 | | | | 4,420 | | | | 12,546 | | | | (1,177 | ) | | | 482 | |
Assets classified as held for sale | | | 507 | | | | | | 348 | | | | | | | | | | | | 507 | | | | | | 348 | | | | | | | | | |
| | | | | | | | | | | | | | | | | | | | | | | | | | | | | | | | |
Total assets/liabilities (excl. debt) | | | | 26,559 | | | | | | 11,431 | | | | | | | | | |
| | | 26,559 | | | | | | 11,431 | | | | | | | | | | | | | |
| 2012 | | | | | | | | | | | | | | | |
Healthcare | | | 11,248 | | | | 7,976 | | | | 3,186 | | | | 1,967 | | | | 7,130 | | | | (543 | ) | | | 135 | | |
Consumer Lifestyle | | | 3,280 | | | | 1,205 | | | | 2,075 | | | | 865 | | | | 1,694 | | | | (198 | ) | | | 128 | | |
Lighting | | | 6,970 | | | | 4,635 | | | | 2,313 | | | | 1,364 | | | | 4,293 | | | | (543 | ) | | | 290 | | |
Innovation, Group & Services | | | 7,540 | | | | (4,500 | ) | | | 5,761 | | | | 138 | | | | 521 | | | | (114 | ) | | | 108 | | |
| | | | | |
| | | 29,038 | | | | 9,316 | | | | 13,335 | | | | 4,334 | | | | 13,638 | | | | (1,398 | ) | | | 661 | | |
Assets classified as held for sale | | | 43 | | | | | | 27 | | | | | | | | | | |
| | | | | | | | | | | | | | | | | |
| | | 29,081 | | | | | | 13,362 | | | | | | | | | | |
| 2011 | | | | | | | | | | | | | | | |
Healthcare | | | 11,591 | | | | 8,418 | | | | 3,087 | | | | 1,882 | | | | 7,479 | | | | (538 | ) | | | 153 | | |
Consumer Lifestyle | | | 3,794 | | | | 874 | | | | 2,917 | | | | 1,309 | | | | 1,752 | | | | (167 | ) | | | 130 | | |
Lighting | | | 6,915 | | | | 4,965 | | | | 1,927 | | | | 1,261 | | | | 4,320 | | | | (570 | ) | | | 279 | | |
Innovation, Group & Services | | | 6,546 | | | | (3,875 | ) | | | 5,183 | | | | 132 | | | | 475 | | | | (125 | ) | | | 78 | | |
| | | | | |
| | | 28,846 | | | | 10,382 | | | | 13,114 | | | | 4,584 | | | | 14,026 | | | | (1,400 | ) | | | 640 | | |
Assets classified as held for sale | | | 551 | | | | | | 61 | | | | | | | | | | |
| | | | | | | | | | | | | | | | | |
| | | 29,397 | | | | | | 13,175 | | | | | | | | | | |
| 1) | Includes impairments of tangible and intangible assets excluding goodwill |
Philips Group
Goodwill assigned to sectors in millions of EUR
2014 - 2015
| | | | carrying value
at January 1 | | | reclassification | | acquisitions | | | purchase
price
allocation
adjustment | | impairments | | divestments
and transfers
to assets
classified as
held for sale | | translation
differences | | carrying value
at December 31 | | | | | |
| 2013 | | | | | | | | | | | | | | | | | |
| | | | carrying value at January 1 | | | reclassification | | | acquisitions | | | purchase price
allocation
adjustment | | | impairments | | | divestments
and transfers to assets
classified as
held for sale | | translation
differences | | carrying value
at December 31 | |
| | | | | |
| 2015 | | | | | | | | | | | | | | | | | |
Healthcare | | | 4,573 | | | | — | | | | 3 | | | | 11 | | | | — | | | | (40 | ) | | | (272 | ) | | | 4,275 | | | | 4,779 | | | | — | | | | 636 | | | | — | | | | — | | | | — | | | | 514 | | | | 5,929 | |
Consumer Lifestyle | | | 668 | | | | — | | | | — | | | | — | | | | — | | | | (18 | ) | | | (18 | ) | | | 632 | | | | 686 | | | | — | | | | — | | | | — | | | | — | | | | — | | | | 47 | | | | 733 | |
Lighting | | | 1,707 | | | | (8 | ) | | | 1 | | | | (15 | ) | | | (26 | ) | | | — | | | | (73 | ) | | | 1,586 | | | | 1,676 | | | | — | | | | — | | | | 8 | | | | — | | | | (1 | ) | | | 161 | | | | 1,844 | |
Innovation, Group & Services | | | — | | | | 8 | | | | — | | | | — | | | | — | | | | 3 | | | | — | | | | 11 | | | | 17 | | | | — | | | | — | | | | — | | | | — | | | | 1 | | | | (1 | ) | | | 17 | |
| | | | | | | | |
Philips Group | | | | 7,158 | | | | — | | | | 636 | | | | 8 | | | | — | | | | — | | | | 721 | | | | 8,523 | |
| | | 6,948 | | | | — | | | | 4 | | | | (4 | ) | | | (26 | ) | | | (55 | ) | | | (363 | ) | | | 6,504 | | | | | |
| 2012 | | | | | | | | | | | | | | | | | |
| 2014 | | | | | | | | | | | | | | | | | |
Healthcare | | | 4,703 | | | | — | | | | — | | | | (1 | ) | | | — | | | | — | | | | (129 | ) | | | 4,573 | | | | 4,275 | | | | — | | | | 1 | | | | 8 | | | | — | | | | (2 | ) | | | 497 | | | | 4,779 | |
Consumer Lifestyle | | | 674 | | | | — | | | | — | | | | (1 | ) | | | — | | | | (6 | ) | | | 1 | | | | 668 | | | | 632 | | | | — | | | | — | | | | — | | | | — | | | | — | | | | 54 | | | | 686 | |
Lighting | | | 1,639 | | | | — | | | | 100 | | | | — | | | | — | | | | — | | | | (32 | ) | | | 1,707 | | | | 1,586 | | | | — | | | | 58 | | | | — | | | | — | | | | (155 | ) | | | 187 | | | | 1,676 | |
Innovation, Group & Services | | | — | | | | | | — | | | | — | | | | — | | | | — | | | | — | | | | — | | | | 11 | | | | — | | | | 9 | | | | — | | | | — | | | | (3 | ) | | | — | | | | 17 | |
| | | | | | | | |
Philips Group | | | | 6,504 | | | | — | | | | 68 | | | | 8 | | | | — | | | | (160 | ) | | | 738 | | | | 7,158 | |
| | | 7,016 | | | | — | | | | 100 | | | | (2 | ) | | | — | | | | (6 | ) | | | (160 | ) | | | 6,948 | | | | | |
172 Annual Report 20132015 153
11 Group financial statements 11.9 - 11.912.9
Philips Group
Main countries in millions of EUR
2013 - 2015
| | | | | | | | | | | | |
| | | sales1) | | | tangible and intangible assets | | | | | |
| | | | sales1) | | | tangible and intangible assets | |
| | | | | |
| 2015 | | | | | |
Netherlands | | | | 639 | | | | 970 | |
United States | | | | 7,522 | | | | 9,291 | |
China | | | | 2,774 | | | | 1,194 | |
Germany | | | | 1,357 | | | | 170 | |
Japan | | | | 992 | | | | 455 | |
India | | | | 845 | | | | 134 | |
France | | | | 806 | | | | 48 | |
Other countries | | | | 9,309 | | | | 2,276 | |
| | | | | |
Total main countries | | | | 24,244 | | | | 14,538 | |
Assets classified as held for sale | | | | | | 1,159 | |
| | | | | | |
Total tangible and intangible assets | | | | | | 15,697 | |
2014 | | | | | |
Netherlands | | | | 594 | | | | 937 | |
United States | | | | 6,160 | | | | 7,649 | |
China | | | | 2,362 | | | | 1,135 | |
Germany | | | | 1,351 | | | | 153 | |
Japan | | | | 908 | | | | 379 | |
France | | | | 839 | | | | 52 | |
United Kingdom | | | | 722 | | | | 594 | |
Other countries | | | | 8,455 | | | | 1,722 | |
| | | | | |
Total main countries | | | | 21,391 | | | | 12,621 | |
Assets classified as held for sale | | | | | | 989 | |
| | | | | | |
Total tangible and intangible assets | | | | | | 13,610 | |
| 2013 | | | | | | | | |
Netherlands | | | 656 | | | | 915 | | | | 649 | | | | 915 | |
United States | | | 6,442 | | | | 7,384 | | | | 6,325 | | | | 7,384 | |
China | | | 2,942 | | | | 1,057 | | | | 2,616 | | | | 1,057 | |
Germany | | | 1,355 | | | | 288 | | | | 1,316 | | | | 288 | |
Japan | | | 1,006 | | | | 401 | | | | 943 | | | | 401 | |
France | | | 915 | | | | 80 | | | | 890 | | | | 80 | |
United Kingdom | | | 692 | | | | 573 | | | | 677 | | | | 573 | |
Other countries | | | 9,321 | | | | 1,848 | | | | 8,574 | | | | 1,848 | |
| | | | | | | | |
| | | 23,329 | | | | 12,546 | | |
Total main countries | | | | 21,990 | | | | 12,546 | |
Assets classified as held for sale | | | | | 62 | | | | | | 62 | |
| | | | | | | | | | |
Total tangible and intangible assets | | | | | | 12,608 | |
| | | | | 12,608 | | | | | |
| 20122) | | | | | |
Netherlands | | | 627 | | | | 886 | | |
United States | | | 6,824 | | | | 8,007 | | |
China | | | 2,585 | | | | 1,114 | | |
Germany | | | 1,323 | | | | 271 | | |
Japan | | | 1,204 | | | | 537 | | |
France | | | 941 | | | | 90 | | |
United Kingdom | | | 676 | | | | 628 | | |
Other countries | | | 9,277 | | | | 2,105 | | |
| | | | | |
| | | 23,457 | | | | 13,638 | | |
Assets classified as held for sale | | | | | 6 | | |
| | | | | | |
| | | | | 13,644 | | |
| 20112) | | | | | |
Netherlands | | | 636 | | | | 908 | | |
United States | | | 6,159 | | | | 8,473 | | |
China | | | 1,978 | | | | 1,126 | | |
Germany | | | 1,272 | | | | 252 | | |
Japan | | | 908 | | | | 618 | | |
France | | | 892 | | | | 97 | | |
United Kingdom | | | 579 | | | | 615 | | |
Other countries | | | 8,568 | | | | 1,937 | | |
| | | | | |
| | | 20,992 | | | | 14,026 | | |
Assets classified as held for sale | | | | | 287 | | |
| | | | | | |
| | | | | 14,313 | | |
| 1) | The sales are reported based on country of destination |
2) | Previous years reflect the sales and tangible and intangible assets of those respective years of the main countries of 2013destination.
|
Discontinued operations and other assets classified as held for sale
Discontinued operations included in the Consolidated statements of income and the Consolidated statements of cash flows consist of the combined Lumileds and Automotive businesses and certain other divestments reported as discontinued operations.
Discontinued operations: Combined Lumileds and Automotive businesses
The combined businesses of Lumileds and Automotive were reported as discontinued operations in the Consolidated statements of income and Consolidated statements of cash flows with the related assets and liabilities as per the end of November 2014 included as
Assets classified as held for sale and Liabilities directly associated with assets held for sale in the Consolidated balance sheet.
As announced on January 22, 2016, Philips and GO Scale Capital have withdrawn their filing with the Committee on Foreign Investment in the United States (CFIUS) and terminated the agreement pursuant to which the consortium led by GO Scale Capital would have acquired an 80.1% interest in the combined businesses of Lumileds and Automotive. Despite the parties’ extensive efforts to mitigate CFIUS’ concern, regulatory clearance has not been granted for this particular transaction. Philips is actively engaging with other parties that have expressed an interest in the businesses.
154 Annual Report 2015
 Group financial statements 12.9
The following table summarizes the results of the combined businesses of Lumileds and Automotive included in the Consolidated statements of income as discontinued operations.
Philips Group
Results of combined Lumileds and Automotive Lighting businesses in millions of EUR
2013 - 2015
| | | | | | | | | | | | |
| | | | |
| | | 2013 | | | 2014 | | | 2015 | |
| | | | |
Sales | | | 1,268 | | | | 1,416 | | | | 1,619 | |
Costs and expenses | | | (1,134 | ) | | | (1,202 | ) | | | (1,320 | ) |
| | | | |
Income before taxes | | | 134 | | | | 214 | | | | 299 | |
Income tax expense | | | (1 | ) | | | (73 | ) | | | (53 | ) |
| | | | |
Results from discontinued operations | | | 133 | | | | 141 | | | | 246 | |
| | | | |
Upon disposal, the associated currency translation differences, part of Shareholders’ equity, will be recognized in the Consolidated statement of income. At December 31, 2015, the estimated release amounts to a EUR 76 million gain.
The following table presents the assets and liabilities of the combined Lumileds and Automotive business, as Assets classified as held for sale and Liabilities directly associated with assets classified as held for sale in the Consolidated balance sheet as from 2014.
Philips Group
Assets and liabilities of combined Lumileds and Automotive Lighting businesses in millions of EUR
2014 - 2015
| | | | | | | | |
| | | | |
| | | 2014 | | | 2015 | |
| | | | |
Property, plant and equipment | | | 666 | | | | 762 | |
Intangible assets including goodwill | | | 295 | | | | 379 | |
Inventories | | | 248 | | | | 285 | |
Accounts receivable | | | 278 | | | | 314 | |
Other assets | | | 14 | | | | 34 | |
| | | | |
Assets classified as held for sale | | | 1501 | | | | 1,774 | |
Accounts payable | | | (134 | ) | | | (192 | ) |
Provisions | | | (34 | ) | | | (39 | ) |
Other liabilities | | | (149 | ) | | | (170 | ) |
| | | | |
Liabilities directly associated with assets held for sale | | | (317 | ) | | | (401 | ) |
| | | | |
Discontinued operations: Other
Certain results of other divestments, including the Audio, Video, Multimedia & Accessories business and the Television business, reported as discontinued operations are included, with a net loss of EUR 1 million in 2015 (2014: a net gain of EUR 49 million; 2013: a net gain of EUR 5 million).
Other assets classified as held for sale
Assets and liabilities directly associated with assets held for sale relate to property, plant and equipment for an amount of EUR 1 million (December 31, 2014: EUR 23 million) and businesses net assets classified as held for sale amounted to EUR 28 million at December 31, 2015 (December 31, 2014 EUR 19 million).
In 2015, property, plant and equipment divested assets classified as held for sale amounted to EUR 43 million with proceeds of EUR 88 million. Other non-current financial assets divested classified as held for sale amounted to EUR 20 million with proceeds of EUR 20 million. Businesses divested net assets classified as held for sale amounted to EUR 9 million. The businesses divested had proceeds of EUR 59 million.
In 2014, property, plant and equipment divested assets classified as held for sale amounted to EUR 17 million with proceeds of EUR 19 million. Other non-current financial assets divested classified as held for sale amounted to EUR 76 million with proceeds of EUR 76 million. Businesses divested net assets classified as held for sale amounted to EUR 46 million. The businesses divested had proceeds of EUR 45 million.
Acquisitions and divestments
2015
Acquisitions
Philips completed four acquisitions in 2015. These acquisitions involved an aggregated net cash outflow of EUR 1,116 million, with Volcano Corporation (Volcano) being the most notable acquisition.
On February 17, 2015, Philips completed the acquisition of Volcano for a total cash consideration of EUR 1,250 million. This amount involved the purchase price of shares (EUR 822 million), the payoff of certain debt (EUR 405 million) and the settlement of outstanding stock options (EUR 23 million). The overall cash position of Volcano on the transaction date was EUR 158 million, resulting in a net cash outflow related to this acquisition of EUR 1,092 million.
Volcano is a US-based global leader in catheter-based imaging and measurement solutions for cardiovascular applications and is very complementary to the Philips vision, strategy, and portfolio in image-guided therapy.
Annual Report 2013 1732015 155
11Group financial statements
Transaction-related costs that were recognized in General and administrative expenses amounted to EUR 15 million. As of February 17, 2015, Volcano is 100% consolidated as part of the Healthcare sector. The condensed balance sheet of Volcano, immediately before and after the acquisition was as follows:
Volcano
Balance sheet in millions of EUR
2015
| | | | | | | | |
| | | | |
| | | before
acquisition
date | | | after
acquisition date | |
| | | | |
Goodwill | | | 133 | | | | 627 | |
Other intangible assets | | | 87 | | | | 320 | |
Property, plant and equipment | | | 105 | | | | 105 | |
Other assets | | | 80 | | | | 50 | |
Other liabilities | | | (41 | ) | | | (142 | ) |
Working Capital | | | 112 | | | | 156 | |
Cash | | | 158 | | | | 158 | |
| | | | |
Total assets and liabilities | | | 634 | | | | 1,274 | |
| | |
Group Equity | | | (219 | ) | | | (1,250 | ) |
Loans | | | (415 | ) | | | (24 | ) |
| | | | |
Financed by | | | (634 | ) | | | (1,274 | ) |
| | | | |
The goodwill is primarily related to synergies expected to be achieved from integrating Volcano within the Healthcare sector. The goodwill is not tax-deductible. Other intangible assets are comprised of the following:
Volcano
Other intangible assets in millions of EUR
2015
| | | | | | | | |
| | | | |
| | | amount | | | amortization
period in years | |
| | | | |
Installed base | | | 62 | | | | 6 | |
Developed technology - Systems | | | 155 | | | | 15 | |
Developed technology - Disposables | | | 58 | | | | 15 | |
Developed technology - Peripheral Therapeutics | | | 26 | | | | 15 | |
IPR&D | | | 6 | | | | n/a | |
Trade names | | | 13 | | | | 10 | |
| | | | | | | | |
Total other intangible assets | | | 320 | | | | | |
| | | | |
For the period from February 17, 2015, Volcano contributed sales of EUR 286 million and a loss from operations of EUR 113 million, which includes acquisition related costs of EUR 103 million.
Divestments
Philips completed seven divestments during 2015, with the sale of the 20% interest in Assembléon Holding B.V. and the sale of the Remote Control activities being the most notable divestments. The seven divestments involved an aggregated cash consideration of EUR 59 million.
2014
Acquisitions
Philips completed three acquisitions in 2014. These acquisitions involved an aggregated purchase price of EUR 171 million.
One of the acquisitions in 2014, was General Lighting Company (GLC), domiciled in the Kingdom of Saudi Arabia (KSA). This acquisition enables Philips to grow its business in KSA, the largest economy in the Middle East by GDP, particularly in LED lighting.
On September 2, 2014, the Company acquired 51% of GLC from a consortium of shareholders for a total amount of EUR 146 million (on a cash-free, debt-free basis). Taking into account closing conditions, Philips paid an amount of EUR 148 million.
Divestments
Apart from the divestment of the Audio, Video, Multimedia & Accessories business, Philips completed two other divestments of business activities during 2014, which related to Healthcare and Lighting activities. The two transactions involved an aggregate consideration of EUR 43 million.
Interests in entities
In this section we discuss the nature of, and risks associated with, the Company’s interests in its consolidated entities and associates, and the effects of those interests on the Company’s financial position and financial performance. Interests in entities relates to:
Interests in subsidiaries
Investments in associates
Interests in subsidiaries
Wholly owned subsidiaries
The Group financial statements 11.9 - 11.9comprise the assets and liabilities of approximately 450 legal entities. Set out below is a list of material subsidiaries representing greater than 5% of either the consolidated group sales, income from operations or net income (before any intra-group eliminations). All of the entities are 100% owned and have been for the last 3 years.
156 Annual Report 2015
Group financial statements 12.9
Philips Group
2015
| | |
|
Legal entity name | | Principal country of business |
| |
Invivo Corporation | | United States |
Lumileds Malaysia Sdn. Bhd. | | Malaysia |
Philips (China) Investment Company, Ltd. | | China |
Philips Consumer Lifestyle B.V. | | Netherlands |
Philips Electronics North America Corporation | | United States |
Philips Electronics Singapore Pte Ltd | | Singapore |
Philips GmbH | | Germany |
Philips Innovative Applications | | Belgium |
Philips Lighting B.V. | | Netherlands |
Philips Medizin Systeme Böblingen GmbH | | Germany |
Philips Nederland B.V. | | Netherlands |
Philips Oral Healthcare, LLC | | United States |
Philips Respironics GK | | Japan |
Philips Ultrasound, Inc. | | United States |
RI Finance, Inc. | | United States |
RIC Investments, LLC | | United States |
| | |
Not wholly owned subsidiaries
In total, 19 consolidated subsidiaries are not wholly owned by the Company. Among the consolidated legal entities is Saudi Lighting Company Limited created after the acquisition of General Lighting Company (GLC) where the Company owns 51% of the voting power. The Company controls this entity. The sales, income from operations and net income of this entity is 3% of the consolidated financial data. The non-controlling interest of 49% represents an amount of EUR 102 million as per December 31, 2015.
Also among the consolidated legal entities is Philips India Limited where the Company owns 96% of the voting power. The non-controlling interest of 4% represents an amount of EUR 10 million as per December 31, 2015.
The sales, income from operations and net income of the remaining not wholly owned subsidiaries (before any intra-group eliminations) are less than 2% of the consolidated financial data of the Company and are therefore not considered material.
Investments in associates
Philips has investments in a number of associates, none of them are regarded as individually material.
The changes during 2015 are as follows:
Philips Group
Investments in associates in millions of EUR
2015
| | | | |
| | | | |
| | Total investments | |
| | | | |
Balance as of January 1, 2015 | | | 157 | |
Changes: | | | | |
Acquisitions/additions | | | 1 | |
Reclassifications | | | 18 | |
Share in income | | | 10 | |
Share in other comprehensive income | | | 1 | |
Impairments | | | (2 | ) |
Dividends declared | | | (17 | ) |
Translation and exchange rate differences | | | 13 | |
| | | | |
Balance as of December 31, 2015 | | | 181 | |
| | | | |
Included in the line reclassifications is an investment of EUR 18 million that was reclassified from available-for-sale financial assets. The Company owns less than 20% in the capital of the underlying company but is able to exercise significant influence and is therefore accounted for as an Investment in associate.
The Company owns one equity interest which represents more than 20% in the capital of the underlying company. With respect to this equity interest, the Company cannot exercise significant influence based on governance agreements concluded among shareholders. This equity interests is accounted for as Other non-current financial assets. In 2015, the Company’s share in the net income of this entity was insignificant.
Income from operations
For information related to Sales and tangible and intangible assets on a geographical and sector basis, see note 2, Information by sector and main country.
Philips Group
Sales and costs by nature in millions of EUR
2013 - 2015
| | | | | | |
| | | | | | | | 2013 | | | 2014 | | | 2015 | |
| | | 2011 | | 2012 | | 2013 | | | | | |
Sales | | | 20,992 | | | | 23,457 | | | | 23,329 | | | | 21,990 | | | | 21,391 | | | | 24,244 | |
| Costs of materials used | | | (7,119 | ) | | | (8,177 | ) | | | (7,895 | ) | | | (7,494 | ) | | | (7,296 | ) | | | (8,446 | ) |
Employee benefit expenses | | | (5,697 | ) | | | (6,694 | ) | | | (6,129 | ) | | | (5,814 | ) | | | (6,080 | ) | | | (7,107 | ) |
Depreciation and amortization | | | (1,400 | ) | | | (1,398 | ) | | | (1,349 | ) | | | (1,177 | ) | | | (1,187 | ) | | | (1,281 | ) |
Shipping and handling | | | (776 | ) | | | (788 | ) | | | (809 | ) | | | (762 | ) | | | (741 | ) | | | (806 | ) |
Advertising and promotion | | | (865 | ) | | | (841 | ) | | | (882 | ) | | | (869 | ) | | | (913 | ) | | | (1,000 | ) |
Lease expense | | | (314 | ) | | | (364 | ) | | | (347 | )1) | |
Other operational costs | | | (3,993 | ) | | | (4,214 | ) | | | (3,987 | ) | |
Lease expense1) | | | | (344 | ) | | | (318 | ) | | | (324 | ) |
Other operational costs2) | | | | (3,734 | ) | | | (4,156 | ) | | | (4,375 | ) |
Impairment of goodwill | | | (1,355 | ) | | | — | | | | (28 | ) | | | (28 | ) | | | (3 | ) | | | — | |
Other business income and expenses | | | 48 | | | | (333 | ) | | | 88 | | |
Other business income (expenses) | | | | 87 | | | | (211 | ) | | | 87 | |
| | | | | | | | |
Income from operations | | | (479 | ) | | | 648 | | | | 1,991 | | | | 1,855 | | | | 486 | | | | 992 | |
| | | | | |
| 1) | Lease expense includes EUR 35 million (2014: EUR 35 million, 2013: EUR 42 millionmillion) of other costs, such as fuel and electricity, and taxes to be paid and reimbursed to the lessor |
| 2) | Other operational costs contain items which are dissimilar in nature and individually insignificant in amount to disclose separately. These costs contain among others expenses for outsourcing services, mainly in IT and HR, 3rd party workers, consultants, warranty, patents and costs for travelling and external legal services. |
Annual Report 2015 157
Group financial statements 12.9
Sales composition
Philips Group
| | | | | | | | | | | | |
| | | 2011 | | | 2012 | | | 2013 | |
Goods | | | 17,636 | | | | 19,918 | | | | 19,716 | |
Services | | | 2,926 | | | | 3,130 | | | | 3,139 | |
Royalties | | | 430 | | | | 409 | | | | 474 | |
| | | | |
| | | 20,992 | | | | 23,457 | | | | 23,329 | |
Sales composition in millions of EUR
2013 - 2015
| | | | | | | | | | | | |
| | | | |
| | | 2013 | | | 2014 | | | 2015 | |
| | | | |
Goods | | | 18,398 | | | | 17,972 | | | | 20,659 | |
Services | | | 3,130 | | | | 2,948 | | | | 3,080 | |
Royalties | | | 462 | | | | 471 | | | | 505 | |
| | | | |
Sales | | | 21,990 | | | | 21,391 | | | | 24,244 | |
| | | | |
Philips has no single external customer that represents 10% or more of revenues.sales.
Costs of materials used
Cost of materials used represents the inventory recognized in cost of sales.
Employee benefit expenses
Philips Group
| | | | | | |
| | | 2011 | | 2012 | | 2013 |
Salaries and wages | | 4,668 | | 5,499 | | 4,983 |
Post-employment benefits costs | | 272 | | 344 | | 362 |
Other social security and similar charges: | | | | | | |
- Required by law | | 595 | | 678 | | 658 |
- Voluntary | | 162 | | 173 | | 126 |
| | |
| | 5,697 | | 6,694 | | 6,129 |
Employee benefit expenses in millions of EUR
2013 - 2015
| | | | | | | | | | | | |
| | | | |
| | | 2013 | | | 2014 | | | 2015 | |
| | | | |
Salaries and wages | | | 4,722 | | | | 5,018 | | | | 5,533 | |
Post-employment benefits costs | | | 354 | | | | 326 | | | | 780 | |
Other social security and similar charges: | | | | | | | | | | | | |
- Required by law | | | 621 | | | | 623 | | | | 664 | |
- Voluntary | | | 117 | | | | 113 | | | | 130 | |
| | | | |
Employee benefit expenses | | | 5,814 | | | | 6,080 | | | | 7,107 | |
| | | | |
The employee benefit expensesexpense relate to employees who are working on the payroll of Philips, payroll, both with permanent and temporary contracts.
For further information on pensionpost-employment benefit costs, see note 30,20, Post-employment benefits.
DetailsFor details on the remuneration of the members of the Board of Management and the Supervisory Board, see note 33,29, Information on remuneration.
Employees
The average number of employees by category is summarized as follows (in FTEs):follows:
Philips Group
Employees in FTEs
2013 - 2015
| | | | | | |
| | | | | | | | 2013 | | | 2014 | | | 2015 | |
| | | 2011 | | 2012 | | 2013 | | | | |
Production | | 57,011 | | 58,031 | | 58,116 | | | 50,628 | | | | 48,110 | | | | 46,869 | |
Research and development | | 12,539 | | 12,974 | | 12,072 | | | 11,757 | | | | 11,714 | | | | 11,462 | |
Other | | 31,789 | | 32,730 | | 32,006 | | | 31,673 | | | | 32,684 | | | | 34,011 | |
| | | | | | |
Employees | | 101,339 | | 103,735 | | 102,194 | | | 94,058 | | | | 92,508 | | | | 92,342 | |
3rd party workers | | 16,092 | | 15,498 | | 13,171 | | | 12,194 | | | | 12,562 | | | | 13,314 | |
| | | | | | |
Continuing operations | | 117,431 | | 119,233 | | 115,365 | | | 106,252 | | | | 105,070 | | | | 105,656 | |
Discontinued operations | | 6,100 | | 2,901 | | 1,997 | | | 10,792 | | | | 9,222 | | | | 8,556 | |
| | | | | |
Employees consist of those persons working on the payroll of Philips and whose costs are reflected in the Employee benefit expenses table. 3rd party workers consist of personnel hired on a per periodper-period basis, via extenalexternal companies.
Depreciation and amortization
Depreciation of property, plant and equipment and amortization of intangiblesintangible assets, including impairments, are as follows:
Philips Group
| | | | | | |
| | | 2011 | | 2012 | | 2013 |
Depreciation of property, plant and equipment | | 617 | | 678 | | 632 |
Amortization of internal-use software | | 55 | | 45 | | 39 |
Amortization of other intangible assets | | 559 | | 458 | | 432 |
Amortization of development costs | | 169 | | 217 | | 246 |
| | |
| | 1,400 | | 1,398 | | 1,349 |
Depreciation and amortization1) in millions of EUR
2013 - 2015
| | | | | | | | | | | | |
| | | | |
| | | 2013 | | | 2014 | | | 2015 | |
| | | | |
Depreciation of property, plant and equipment | | | 521 | | | | 592 | | | | 582 | |
Amortization of software | | | 39 | | | | 32 | | | | 48 | |
Amortization of other intangible assets | | | 393 | | | | 332 | | | | 380 | |
Amortization of development costs | | | 224 | | | | 231 | | | | 271 | |
| | | | |
Depreciation and amortization | | | 1,177 | | | | 1,187 | | | | 1,281 | |
| | | | |
Depreciation of property, plant and equipment is primarily included in cost of sales. Amortization of the categories of other intangible assets are reported in selling expenses for brand names and customer relationships and are reported in cost of sales for technology based and other intangible assets. Amortization (including impairment) of development cost is included in research and development expenses.
Shipping and handling
Shipping and handling costs are included in cost of sales and selling expenses.
Advertising and promotion
Advertising and promotion costs are included in selling expenses.
174 Annual Report 2013
11 Group financial statements 11.9 - 11.9
Audit fees
Philips Group
Fees KPMG in millions of EUR
2013 - 2015
| | | | | | | | | | | | |
| | | | |
| | | 2013 | | | 2014 | | | 2015 | |
| | | | |
| | | |
Audit fees | | | 15.6 | | | | 14.9 | | | | 15.3 | |
- consolidated financial statements | | | 10.1 | | | | 9.6 | | | | 9.8 | |
- statutory financial statements | | | 5.5 | | | | 5.3 | | | | 5.5 | |
Audit-related fees1) | | | 2.2 | | | | 3.9 | | | | 4.9 | |
- acquisitions and divestments | | | 0.4 | | | | 2.4 | | | | 3.6 | |
- sustainability assurance | | | 0.7 | | | | 0.6 | | | | 0.6 | |
- other | | | 1.1 | | | | 0.9 | | | | 0.7 | |
Tax fees2) | | | 0.8 | | | | 0.2 | | | | 1.1 | |
- tax compliance services | | | 0.8 | | | | 0.2 | | | | 1.1 | |
Other fees | | | 1.3 | | | | 0.0 | | | | 0.0 | |
- other | | | 1.3 | | | | 0.0 | | | | 0.0 | |
| | | | |
Fees KPMG | | | | | | | | | | | | | | | | 2011 | | | 2012 | | | 2013 | | | | | | Audit fees | | | 15.6 | | | | 14.7 | | | | 15.6 | | - consolidated financial statements | | | 10.1 | | | | 9.7 | | | | 10.1 | | - statutory financial statements | | | 5.5 | | | | 5.0 | | | | 5.5 | | Audit-related fees1) | | | 2.4 | | | | 5.6 | | | | 2.2 | | - acquisitions and divestments | | | 0.1 | | | | 2.9 | | | | 0.4 | | - sustainability assurance | | | 0.5 | | | | 0.8 | | | | 0.7 | | - other | | | 1.8 | | | | 1.9 | | | | 1.1 | | Tax fees2) | | | 0.9 | | | | 1.3 | | | | 0.8 | | - tax compliance services | | | 0.9 | | | | 1.3 | | | | 0.8 | | Other fees3) | | | 0.5 | | | | 0.7 | | | | 1.3 | | - royalty investigation | | | 0.4 | | | | 0.1 | | | | 0.0 | | - other | | | 0.1 | | | | 0.6 | | | | 1.3 | | | | | | | Total | | | 19.4 | | | | 22.3 | | | | 19.9 | |
1) | | | 19.9 | | | | 19.0 | | | | 21.3 | The percentage of services provided in 2013 is 11.1% of the total fees
|
2) | The percentage of services provided in 2013 is 4.0% of the total fees
|
3) | The percentage of services provided in 2013 is 6.5% of the total fees
|
This table ‘Fees KPMG’ forms an integral part of the Company Financial Statements, please refer to note K, Audit fees.
Impairment of goodwill
In 2013, goodwill impairment charges amounts to EUR 28 million, including EUR 26 million as result of reduced growth expectations in Consumer Luminaires.
In 2011, goodwill was impaired in the Healthcare sector for an amount of EUR 824 million and in the Lighting sector for an amount of EUR 531 million.
For further information on impairment of goodwill, see note 11, Goodwill.
Other business income (expenses)
Other business income (expenses) consists of the following:
| | | | | | | | | | | | | | | | 2011 | | | 2012 | | | 2013 | | Result on disposal of businesses: | | | | | | | | | | | | | - income | | | 27 | | | | 9 | | | | 50 | | - expense | | | (26 | ) | | | (84 | ) | | | (1 | ) | Result on disposal of fixed assets: | | | | | | | | | | | | | - income | | | 47 | | | | 224 | | | | 19 | | - expense | | | (11 | ) | | | (9 | ) | | | (13 | ) | Result on other remaining businesses: | | | | | | | | | | | | | - income | | | 50 | | | | 42 | | | | 54 | | - expense | | | (39 | ) | | | (515 | ) | | | (21 | ) | | | | | | | | | 48 | | | | (333 | ) | | | 88 | | Total other business income | | | 124 | | | | 275 | | | | 123 | | Total other business expense | | | (76 | ) | | | (608 | ) | | | (35 | ) |
In 2013, result on disposal of businesses was mainly due to divestment of non-strategic businesses within Healthcare. For further information, see note 9, Acquisitions and divestments
In 2013, result on disposal of fixed assets was mainly due to sale of real estate assets.
In 2013, result on other remaining businesses were mainly due to release of earn out provisions. For further information, see note 21, Provisions.
Financial income and expenses
| | | | | | | | | | | | | | | | 2011 | | | 2012 | | | 2013 | | Interest income | | | 39 | | | | 37 | | | | 55 | | Interestincomefromloansandreceivables | | | 5 | | | | 20 | | | | 33 | | Interestincomefromcashandcashequivalents | | | 34 | | | | 17 | | | | 22 | | Dividend income from available for sale financial assets | | | 11 | | | | 4 | | | | 5 | | Net gains from disposal of financial assets | | | 51 | | | | 1 | | | | — | | Net change in fair value of financial assets at fair value through profit or loss | | | 6 | | | | — | | | | — | | Net change in fair value of financial liabilities at fair value through profit or loss | | | — | | | | 44 | | | | — | | Net foreign exchange gains | | | — | | | | — | | | | — | | Other financial income | | | 6 | | | | 20 | | | | 10 | | | | | | | Financial income | | | 113 | | | | 106 | | | | 70 | | Interest expense | | | (340 | ) | | | (363 | ) | | | (323 | ) | Interestondebtandborrowings | | | (245 | ) | | | (271 | ) | | | (245 | ) | Financechargesunderfinanceleasecontract | | | (3 | ) | | | (7 | ) | | | (7 | ) | Interestexpenses-pensions | | | (92 | ) | | | (85 | ) | | | (71 | ) | Unwind of discount of provisions | | | (33 | ) | | | (22 | ) | | | (25 | ) | Net foreign exchange losses | | | (2 | ) | | | — | | | | (6 | ) | Impairment loss of financial assets | | | (34 | ) | | | (8 | ) | | | (10 | ) | Net change in fair value of financial assets at fair value through profit or loss | | | | | | | (2 | ) | | | (9 | ) | Net change in fair value of financial liabilities at fair value through profit or loss | | | | | | | | | | | (3 | ) | Other financial expenses | | | (35 | ) | | | (40 | ) | | | (24 | ) | | | | | | Financial expense | | | (444 | ) | | | (435 | ) | | | (400 | ) | | | | | | Financial income and expenses | | | (331 | ) | | | (329 | ) | | | (330 | ) |
Net financial income and expense showed a EUR 330 million expenses in 2013, which was 1 million higher than in 2012. Total finance income of EUR 70 million included EUR 55 million interest income. Remaining financial income included dividend income of EUR 5 million and other finance income of EUR 10 million. Total financial expense of EUR 400 million included EUR 10 million impairment charges and EUR 323 million interest expenses. Remaining financial expense consisted mainly of EUR 25 million of accretion expenses associated with discounted provisions and uncertain tax positions and EUR 24 million other financing charges.
Net financial income and expense showed a EUR 329 million expense in 2012, which was EUR 2 million lower than in 2011. Total financial income of EUR 106 million included a EUR 46 million gain related to a change in estimate on the valuation of long term derivative contracts. Remaining financial expense consisted mainly of EUR 22 million of accretion expenses associated with discounted provisions and uncertain tax positions and EUR 40 million other financing charges.
Net financial income and expense showed a EUR 331 million expense in 2011. Total finance income of EUR 113 million included EUR 51 million gain on the disposal of financial assets, of which EUR 44 million resulted from
Annual Report 2013 175
11 Group financial statements 11.9 - 11.9
the sale of shares in TCL and EUR 6 million resulted from the sale of Digimarc. Remaining financial income included dividend income of EUR 11 million and a total net EUR 6 million gain from fair value changes, mainly the revaluation of the NXP option. Total finance expense of EUR 444 million included EUR 34 million impairment charges, mainly related to the shareholding in TPV Technology. Remaining financial expense consisted mainly of EUR 33 million of accretion expenses associated with discounted provisions and uncertain tax positions and EUR 35 million other financing charges.
Income taxes
The tax expense on income before tax of continuing operations amounted to EUR 466 million (2012: EUR 185 million, 2011: EUR 251 million).
The components of income before taxes and income tax expense are as follows:
| | | | | | | | | | | | | | | | 2011 | | | 2012 | | | 2013 | | Netherlands | | | 148 | | | | (177 | ) | | | 314 | | Foreign | | | (958 | ) | | | 496 | | | | 1,347 | | | | | | | Income before taxes of continuing operations | | | (810 | ) | | | 319 | | | | 1,661 | | | | | | Netherlands: | | | | | | | | | | | | | Current tax income (expense) | | | (40 | ) | | | (78 | ) | | | — | | Deferred tax income (expense) | | | 82 | | | | 13 | | | | (107 | ) | | | | | | | | | 42 | | | | (65 | ) | | | (107 | ) | | | | | Foreign: | | | | | | | | | | | | | Current tax income (expense) | | | (360 | ) | | | (280 | ) | | | (280 | ) | Deferred tax income (expense) | | | 163 | | | | 143 | | | | (89 | ) | | | | | | | | | (197 | ) | | | (137 | ) | | | (369 | ) | | | | | Income tax expense of continuing operations | | | (251 | ) | | | (185 | ) | | | (466 | ) | Income tax expense of discontinued operations | | | 96 | | | | (17 | ) | | | (10 | ) | | | | | | Income tax expense | | | (155 | ) | | | (202 | ) | | | (476 | ) | | The components of income tax expense are as follows: | | | | | | | | | | | | | | | | | | | | 2011 | | | 2012 | | | 2013 | | | | | | Current tax expense | | | (390 | ) | | | (370 | ) | | | (268 | ) | Prior year results | | | (10 | ) | | | 12 | | | | (12 | ) | | | | | | Current tax income (expense) | | | (400 | ) | | | (358 | ) | | | (280 | ) | | | | | | | | 2011 | | | 2012 | | | 2013 | | Recognition of previously unrecognized tax losses | | | 20 | | | | 1 | | | | 20 | | Current year tax loss carried forwards not recognized | | | (89 | ) | | | (50 | ) | | | (29 | ) | Temporary differences (not recognized) recognized | | | 15 | | | | 2 | | | | (3 | ) | Prior year results | | | 31 | | | | (2 | ) | | | 15 | | Tax rate changes | | | (1 | ) | | | (4 | ) | | | — | | Origination and reversal of temporary differences | | | 269 | | | | 209 | | | | (199 | ) | | | | | | Deferred tax income (expense) | | | 245 | | | | 156 | | | | (196 | ) |
Philips’ operations are subject to income taxes in various foreign jurisdictions. The statutory income tax rates vary from 10.0% to 39.4%, which results in a difference between the weighted average statutory income tax rate and the Netherlands’ statutory income tax rate of 25% (2012: 25.0%; 2011: 25.0%).
A reconciliation of the weighted average statutory income tax rate to the effective income tax rate of continuing operations is as follows:
in %
| | | | | | | | | | | | | | | | 2011 | | | 2012 | | | 2013 | | Weighted average statutory income tax rate | | | 41.6 | | | | 21.9 | | | | 27.6 | | Tax rate effect of: | | | | | | | | | | | | | Changes related to: | | | | | | | | | | | | | - utilization of previously reserved loss carry forwards | | | 2.4 | | | | (0.2 | ) | | | (1.2 | ) | - new loss carry forwards not expected to be realized | | | (7.7 | ) | | | 15.7 | | | | 1.7 | | - addition (releases) | | | 1.8 | | | | (0.6 | ) | | | 0.2 | | Non-tax-deductible impairment charges | | | (61.9 | ) | | | 0.6 | | | | 0.6 | | Non-taxable income | | | 7.1 | | | | (18.7 | ) | | | (8.1 | ) | Non-tax-deductible expenses | | | (14.1 | ) | | | 68.7 | | | | 7.5 | | Withholding and other taxes | | | (2.9 | ) | | | 6.9 | | | | 0.8 | | Tax rate changes | | | (0.1 | ) | | | 1.1 | | | | 0.0 | | Prior year tax results | | | 2.8 | | | | (3.0 | ) | | | (0.2 | ) | Tax expenses due to other liabilities | | | (2.5 | ) | | | 3.1 | | | | 0.5 | | Tax incentives and other | | | 2.5 | | | | (37.5 | ) | | | (1.3 | ) | | | | | | Effective tax rate | | | (31.0 | ) | | | 58.0 | | | | 28.1 | |
The weighted average statutory income tax rate increased in 2013 compared to 2012, as a consequence of a change in the country mix of income tax rates, as well as a significant change in the mix of profits and losses in the various countries.
The effective income tax rate is higher than the weighted average statutory income tax rate in 2013, mainly due to withholding and other taxes which are partly offset by the net impact of non-taxable/non-deductible income and other tax expenses.
176 Annual Report 2013
11 Group financial statements 11.9 - 11.9
Deferred tax assets and liabilities
Net deferred tax assets relate to the following balance sheet captions and tax loss carryforwards (including tax credit carryforwards), of which the movements during the years 2013 and 2012 respectively are as follows:
| | | | | | | | | | | | | | | | | | | | | | | | | | | | December 31,
2012 | | | recognized in
income | | | recognized in OCI | | | acquisitions/ divestments | | | other1) | | | December 31,
2013 | | Intangible assets | | | (928 | ) | | | 13 | | | | — | | | | — | | | | 44 | | | | (871 | ) | Property, plant and equipment | | | 68 | | | | — | | | | — | | | | — | | | | (10 | ) | | | 58 | | Inventories | | | 258 | | | | 9 | | | | — | | | | — | | | | (3 | ) | | | 264 | | Prepaid pension assets | | | — | | | | (24 | ) | | | 23 | | | | — | | | | — | | | | (1 | ) | Other receivables | | | 55 | | | | (3 | ) | | | 1 | | | | — | | | | (3 | ) | | | 50 | | Other assets | | | 42 | | | | (4 | ) | | | (2 | ) | | | (1 | ) | | | (3 | ) | | | 32 | | Provisions: | | | | | | | | | | | | | | | | | | | | | | | | | - pensions | | | 598 | | | | (70 | ) | | | (82 | ) | | | — | | | | (20 | ) | | | 426 | | - guarantees | | | 26 | | | | 4 | | | | — | | | | — | | | | (1 | ) | | | 29 | | - termination benefits | | | 118 | | | | (28 | ) | | | 8 | | | | — | | | | (1 | ) | | | 97 | | - other postretirement benefits | | | 72 | | | | (5 | ) | | | (7 | ) | | | — | | | | (3 | ) | | | 57 | | - other provisions | | | 605 | | | | (32 | ) | | | 16 | | | | — | | | | (22 | ) | | | 567 | | Other liabilities | | | 171 | | | | 27 | | | | — | | | | | | | | (6 | ) | | | 192 | | Tax loss carryforwards (including tax credit carryforwards) | | | 742 | | | | (83 | ) | | | (11 | ) | | | — | | | | 51 | | | | 699 | | | | | | | Net deferred tax assets | | | 1,827 | | | | (196 | ) | | | (54 | ) | | | (1 | ) | | | 23 | | | | 1,599 | | | | | | | | | | | | December 31,
2011 | | | recognized in
income | | | recognized in OCI | | | acquisitions/
divestments | | | other1) | | | December 31,
2012 | | Intangible assets | | | (1,074 | ) | | | 165 | | | | — | | | | (35 | ) | | | 16 | | | | (928 | ) | Property, plant and equipment | | | 77 | | | | (2 | ) | | | — | | | | — | | | | (7 | ) | | | 68 | | Inventories | | | 221 | | | | 41 | | | | — | | | | — | | | | (4 | ) | | | 258 | | Prepaid pension costs | | | 2 | | | | (4 | ) | | | 6 | | | | — | | | | (4 | ) | | | — | | Other receivables | | | 44 | | | | 13 | | | | — | | | | — | | | | (2 | ) | | | 55 | | Other assets | | | 19 | | | | 17 | | | | (7 | ) | | | — | | | | 13 | | | | 42 | | Provisions: | | | | | | | | | | | | | | | | | | | | | | | | | - pensions | | | 617 | | | | (62 | ) | | | 64 | | | | — | | | | (21 | ) | | | 598 | | - guarantees | | | 34 | | | | (10 | ) | | | — | | | | — | | | | 2 | | | | 26 | | - termination benefits | | | 42 | | | | 67 | | | | 5 | | | | — | | | | 4 | | | | 118 | | - other postretirement benefits | | | 71 | | | | 3 | | | | (3 | ) | | | — | | | | 1 | | | | 72 | | - other provisions | | | 636 | | | | (33 | ) | | | 10 | | | | — | | | | (8 | ) | | | 605 | | Other liabilities | | | 231 | | | | (63 | ) | | | (4 | ) | | | — | | | | 7 | | | | 171 | | Tax loss carryforwards (including tax credit carryforwards) | | | 732 | | | | 24 | | | | (7 | ) | | | 6 | | | | (13 | ) | | | 742 | | | | | | | Net deferred tax assets | | | 1,652 | | | | 156 | | | | 64 | | | | (29 | ) | | | (16 | ) | | | 1,827 | |
1) | Primarily includes foreign currency translation differences which were recognized in OCI
|
Annual Report 2013 177
11 Group financial statements 11.9 - 11.9
Deferred tax assets and liabilities relate to the balance sheet captions, as follows:
| | | | | | | | | | | | | | | | assets | | | liabilities | | | net | | | 2013 | | | | | | | | | | | | | Intangible assets | | | 116 | | | | (987 | ) | | | (871 | ) | Property, plant and equipment | | | 107 | | | | (49 | ) | | | 58 | | Inventories | | | 271 | | | | (7 | ) | | | 264 | | Prepaid pension costs | | | 1 | | | | (2 | ) | | | (1 | ) | Other receivables | | | 60 | | | | (10 | ) | | | 50 | | Other assets | | | 48 | | | | (16 | ) | | | 32 | | Provisions: | | | | | | | | | | | | | - pensions | | | 426 | | | | — | | | | 426 | | - guarantees | | | 29 | | | | — | | | | 29 | | - termination benefits | | | 97 | | | | — | | | | 97 | | - other postretirement | | | 57 | | | | — | | | | 57 | | - other | | | 581 | | | | (14 | ) | | | 567 | | Other liabilities | | | 213 | | | | (21 | ) | | | 192 | | Tax loss carryforwards (including tax credit carryforwards) | | | 699 | | | | — | | | | 699 | | | | | | | | | | 2,705 | | | | (1,106 | ) | | | 1,599 | | Set-off of deferred tax positions | | | (1,030 | ) | | | 1,030 | | | | — | | | | | | | Net deferred tax assets | | | 1,675 | | | | (76 | ) | | | 1,599 | |
| | | | | | | | | | | | | | | | assets | | | liabilities | | | net | | | 2012 | | | | | | | | | | | | | Intangible assets | | | 151 | | | | (1,079 | ) | | | (928 | ) | Property, plant and equipment | | | 115 | | | | (47 | ) | | | 68 | | Inventories | | | 263 | | | | (5 | ) | | | 258 | | Prepaid pension costs | | | 2 | | | | (2 | ) | | | — | | Other receivables | | | 58 | | | | (3 | ) | | | 55 | | Other assets | | | 54 | | | | (12 | ) | | | 42 | | Provisions: | | | | | | | — | | | | | | - pensions | | | 599 | | | | (1 | ) | | | 598 | | - guarantees | | | 26 | | | | — | | | | 26 | | - termination benefits | | | 117 | | | | 1 | | | | 118 | | - other postretirement | | | 72 | | | | — | | | | 72 | | - other | | | 624 | | | | (19 | ) | | | 605 | | Other liabilities | | | 198 | | | | (27 | ) | | | 171 | | Tax loss carryforwards (including tax credit carryforwards) | | | 742 | | | | — | | | | 742 | | | | | | | | | | 3,021 | | | | (1,194 | ) | | | 1,827 | | Set-off of deferred tax positions | | | (1,102 | ) | | | 1,102 | | | | — | | | | | | | Net deferred tax assets | | | 1,919 | | | | (92 | ) | | | 1,827 | |
Deferred tax assets are recognized for temporary differences, unused tax losses, and unused tax credits to the extent that realization of the related tax benefits is probable. The ultimate realization of deferred tax assets is dependent upon the generation of future taxable income in the countries where the deferred tax assets originated and during the periods when the deferred tax assets become deductible. Management considers the scheduled reversal of deferred tax liabilities, projected future taxable income, and tax planning strategies in making this assessment.
The net deferred tax assets of EUR 1,599 million (2012: EUR 1,827 million) consist of deferred tax assets of EUR 1,675 million (2012: EUR 1,919 million) in countries with a net deferred tax asset position and deferred tax liabilities of EUR 76 million (2012: EUR 92 million) in countries with a net deferred tax liability position. Of the total deferred tax assets of EUR 1,675 million at December 31, 2013, (2012: EUR 1,919 million), EUR 543 million (2012: EUR 507 million) is recognized in respect of fiscal entities in various countries where there have been fiscal losses in the current or preceding period. Management’s projections support the assumption that it is probable that the results of future operations will generate sufficient taxable income to utilize these deferred tax assets.
At December 31, 2013 and 2012, there were no recognized deferred tax liabilities for taxes that would be payable on the unremitted earnings of certain foreign subsidiaries of Philips Holding USA since it has been determined that undistributed profits of such subsidiaries will not be distributed in the foreseeable future. The temporary differences associated with the investments in subsidiaries of Philips Holding USA, for which a deferred tax liability has not been recognized, aggregate to EUR 32 million (2012: EUR 35 million).
At December 31, 2013, operating loss carryforwards expire as follows:
| | | | | | | | | | | | | | | | | | | | | | | | | | | | | | | | | | Total | | 2014 | | | 2015 | | | 2016 | | | 2017 | | | 2018 | | | 2019/
2023 | | | later | | | unlimi- ted | | 4,330 | | | 28 | | | | 1 | | | | 3 | | | | 6 | | | | 6 | | | | 44 | | | | 841 | | | | 3,401 | |
The Company also has tax credit carryforwards of EUR 138 million, which are available to offset future tax, if any, and which expire as follows:
| | | | | | | | | | | | | | | | | | | | | | | | | | | | | | | | | | Total | | 2014 | | | 2015 | | | 2016 | | | 2017 | | | 2018 | | | 2019/
2023 | | | later | | | unlimi-
ted | | 138 | | | 3 | | | | — | | | | 1 | | | | — | | | | 4 | | | | 19 | | | | 95 | | | | 16 | |
At December 31, 2013, operating loss and tax credit carryforwards for which no deferred tax assets have been recognized in the balance sheet, expire as follows:
| | | | | | | | | | | | | | | | | | | | | | | | | | | | | | | | | | Total | | 2014 | | | 2015 | | | 2016 | | | 2017 | | | 2018 | | | 2019/
2023 | | | later | | | unlimi-
ted | | 1,928 | | | 25 | | | | 1 | | | | 3 | | | | 2 | | | | — | | | | 39 | | | | 9 | | | | 1,849 | |
At December 31, 2013, the amount of deductible temporary differences for which no deferred tax asset has been recognized in the balance sheet is EUR 151 million (2012: EUR 157 million).
Classification of the income tax payable and receivable is as follows:
| | | | | | | | | | | | 2012 | | | 2013 | | Income tax receivable | | | 97 | | | | 70 | | Income tax receivable - under non-current receivables | | | — | | | | — | | Income tax payable | | | (200 | ) | | | (143 | ) | Income tax payable - under non-current liabilities | | | — | | | | (1 | ) |
Tax risks
Philips is exposed to tax uncertainties. These uncertainties include amongst others the following:
Transfer pricing uncertainties
Philips has issued transfer pricing directives, which are in accordance with international guidelines such as those of the Organization of Economic Co-operation and Development. As transfer pricing has a cross-border effect, the focus of local tax authorities on implemented transfer pricing procedures in a country may have an impact on results in another country. In order to reduce the transfer pricing uncertainties, monitoring procedures are carried out by Group Tax and Internal Audit to safeguard the correct implementation of the transfer pricing directives.
Tax uncertainties on general service agreements and specific allocation contracts
Due to the centralization of certain activities in a limited number of countries (such as research and development, centralized IT, group functions and head office), costs are also centralized. As a consequence, these costs and/or revenues must be allocated to the beneficiaries, i.e. the various Philips entities. For that purpose, apart from specific allocation contracts for costs and revenues, general service agreements are signed with a large number of group entities. Tax authorities review the
178 Annual Report 2013
11 Group financial statements 11.9 - 11.9
implementation of GSAs, apply benefit tests for particular countries or audit the use of tax credits attached to GSAs and royalty payments, and may reject the implemented procedures. Furthermore, buy in/out situations in the case of (de)mergers could affect the tax allocation of GSAs between countries. The same applies to the specific allocation contracts.
Tax uncertainties due to disentanglements and acquisitions
When a subsidiary of Philips is disentangled, or a new company is acquired, related tax uncertainties arise. Philips creates merger and acquisition (M&A) teams for these disentanglements or acquisitions. In addition to representatives from the involved sector, these teams consist of specialists from various group functions and are formed, amongst other things, to identify hidden tax uncertainties that could subsequently surface when companies are acquired and to reduce tax claims related to disentangled entities. These tax uncertainties are investigated and assessed to mitigate tax uncertainties in the future of the extent possible. Several tax uncertainties may surface from M&A activities. Examples of uncertainties are: applicability of the participation exemption, allocation issues, and non-deductibility of parts of the purchase price.
Tax uncertainties due to permanent establishments
In countries where Philips starts new operations or alters business models, the issue of permanent establishment may arise. This is because when operations in a country involves a Philips organization in another country, there is a risk that tax claims will arise in the former country as well as in the latter country.
Interests in entities
In this section we discuss the nature of, and risks associated with, the Company’s interests in its consolidated entities and associates, and the effects of those interests on the Company’s financial position and financial performance.
Interests in entities could in principle relate to:
Interests in subsidiaries
Unconsolidated structured entities
Investments in associates
Interests in subsidiaries
Wholly owned subsidiaries
The Group financial statements comprise the assets and liabilities of approximately 400 legal entities. Set out below is a list of material subsidiaries representing greater than 5% of either the consolidated group sales, income from operations or net income (before any intra-group eliminations). All of the entities are 100% owned and have been for the last 3 years.
Interests in subsidiaries
in order of IFO (decreasing)
| | | Legal entity name | | Principal country of business | | | Philips Electronics North America Corporation
| | United States | Philips Medizin Systeme Böblingen GmbH
| | Germany | Philips Consumer Lifestyle B.V.
| | Netherlands | Philips Ultrasound, Inc.
| | United States | Philips (China) Investment Company, Ltd.
| | China | Philips Lighting Poland S.A.
| | Poland | Philips Innovative Applications
| | Belgium | Philips Medical Systems Nederland B.V.
| | Netherlands | RIC Investments, LLC
| | United States | Philips Lighting B.V.
| | Netherlands | Philips Oral Healthcare, Inc.
| | United States | Philips Medical Systems DMC GmbH
| | Germany | Philips GmbH
| | Germany |
Not wholly owned subsidiaries
Among the consolidated legal entities is one entity where the Company owns 44% of the voting power. We have determined that the Company controls this entity on a de facto power basis. The sales, income from operations and net income of this entity is less than 1% of the consolidated financial data of the company and therefore not considered material.
In total eleven consolidated subsidiaries are not wholly owned by the Company. The sales, income from operations and net income of these entities (before any intra-group eliminations) are less than 3% of the consolidated financial data of the company and therefore not considered material.
Joint arrangements and unconsolidated structured entities
The Company did not have joint arrangements or unconsolidated structured entities that require separate disclosure under IFRS 12.
Investments in associates
Philips has investments in a number of associates, none of them are regarded as individually material.
The changes during 2013 are as follows:
Investments in associates
| | | | | | | Total investments | | Balance as of January 1, 2013
| | | 177 | | Changes:
| | | | | Sales/Redemption
| | | (2 | ) | Reclassifications
| | | (7 | ) | Share in income
| | | 5 | | Dividends declared
| | | (6 | ) | Translation and exchange rate differences
| | | (6 | ) | | | | | | Balance as of December 31, 2013
| | | 161 | |
Philips has agreed that it will transfer the remaining 30% stake in the TP Vision venture, which has a book value of nil as at December 31, 2013, to TPV. The net impact of a transaction-related payment has been accrued in Other current liabilities at December 31, 2013 due to conditions that existed at the balance sheet date.
The Company owns four equity interests which represent more than 20% in the capital of the underlying companies. With respect to these equity interests, the Company cannot exercise significant influence based on governance agreements concluded among shareholders. These equity interests are accounted for as Other non-current financial assets. In 2013, the Company’s share in net income of these entities was insignificant.
The Company has one investment where it owns 51% of the shares of an entity, however is not able to control it and therefore it is not consolidated but accounted for as an investment in associate.
During 2013 the Company’s shareholding in two of its investments in associates was diluted and subsequently treated as available-for-sale financial assets. The dilution gains of EUR 16 million are recognized under results related to investments in associates.
The Company has not recognized a proportional share of losses, totaling EUR 37 million (2012: EUR 9 million) in relation to its investments in associates because the Company has no obligation in respect of these losses.
Summarized information of investments in associates
Unaudited summarized financial information on the Company’s most significant investments in associates, on a combined basis, is presented below. It is based on the most recent available financial information.
Included from April 2012 is the 30%-interest in TP Vision Holding which includes the former Philips TV business.
Annual Report 2013 179
11 Group financial statements 11.9 - 11.9
| | | | | | | | | | | | | | | | 2011 | | | 2012 | | | 2013 | | Net sales | | | 408 | | | | 2,534 | | | | 2,180 | | Income before taxes | | | 86 | | | | (7 | ) | | | (243 | ) | Income taxes | | | (27 | ) | | | 2 | | | | 12 | | | | | | | Net income | | | 59 | | | | (5 | ) | | | (231 | ) | | | | | Total share in net income of associates recognized in the Consolidated statements of income | | | 18 | | | | (5 | ) | | | 5 | |
| | | | | | | | | | | | 2012 | | | 2013 | | Current assets | | | 1,635 | | | | 1,368 | | Non-current assets | | | 485 | | | | 412 | | | | | | | | | | 2,120 | | | | 1,780 | | Current liabilities | | | (1,544 | ) | | | (1,327 | ) | Non-current liabilities | | | (186 | ) | | | (278 | ) | | | | | | Net asset value | | | 390 | | | | 175 | | | | | Investments in associates included in the Consolidated balance sheet | | | 177 | | | | 161 | |
Discontinued operations and other assets classified as held for sale
Discontinued operations included in the Consolidated statements of income and the Consolidated statements of cash flows consists of the Audio, Video, Multimedia and Accessories (AVM&A) business, the Television business and certain divestments formerly reported as discontinued operations.
Discontinued operations: Audio, Video, Multimedia and Accessories business
Following the agreement with Funai Electric Co. Ltd which was announced in Q1 2013, the results of the Audio, Video, Multimedia and Accessories (AVM&A) business are reported as discontinued operations in the Consolidated statements of income and Consolidated statements of cash flows. Assets classified as held for sale and Liabilities directly associated with assets held for sale are reported in the Consolidated balance sheet as of the moment of the announcement. This agreement was terminated on October 25, 2013. Since then, Philips has been actively discussing the sale of the business with various parties. Therefore the AVM&A business continues to be reported as discontinued operations in the Consolidated statements of income and Consolidated statements of cash flows with the related assets and liabilities included as Assets classified as held for sale and Liabilities directly associated with assets held for sale in the Consolidated balance sheet.
The following table summarizes the results of the AVM&A business included in the Consolidated statements of income as discontinued operations.
| | | | | | | | | | | | | | | | 2011 | | | 2012 | | | 2013 | | Sales | | | 1,587 | | | | 1,331 | | | | 1,117 | | Costs and expenses | | | (1,499 | ) | | | (1,210 | ) | | | (1,067 | ) | Disentanglement costs | | | — | | | | — | | | | (44 | ) | | | | | | Income before taxes | | | 88 | | | | 121 | | | | 6 | | Income taxes | | | (10 | ) | | | (40 | ) | | | (3 | ) | Investments in associates | | | — | | | | (3 | ) | | | — | | | | | | | Results from discontinued operations | | | 78 | | | | 78 | | | | 3 | |
At the moment of divestment the related balance sheet positions will be transferred, the associated currency translation differences, part of Shareholders’ equity, will be recognized in the Consolidated statement of income. At December 31, 2013, the estimated release amounts to a EUR 3 million loss.
The following table presents the assets and liabilities of the AVM&A business, classified as Assets held for sale and Liabilities directly associated with the assets held for sale in the Consolidated balance sheets.
| | | | | | | 2013 | | Property, plant and equipment
| | | 17 | | Intangible assets including goodwill
| | | 32 | | Inventories
| | | 130 | | Accounts receivable
| | | 212 | | Other assets
| | | 9 | | | | | | | Assets classified as held for sale
|
| | | 400 | | 1) | The percentage of audit-related fees in 2015 is 23.0% of the total fees | Accounts payable
|
| 2) | The percentage of tax fees in 2015 is 5.2% of the total fees | | | 217 | | |
This table ‘Fees KPMG’ forms an integral part of the Company Financial Statements, please refer to note B, Audit fees. Impairment of goodwill In 2014, goodwill impairment charges amount to EUR 3 million consisting of impairments on divested businesses in Healthcare and Lighting. In 2013, goodwill 158 Annual Report 2015
Group financial statements 12.9 impairment charges amounted to EUR 28 million, including EUR 26 million as result of reduced growth expectations in Consumer Luminaires, see note 11, Goodwill. Other business income (expenses) Other business income (expenses) consists of the following: Philips Group Other business income (expenses) in millions of EUR 2013 - 2015 | | | | | | | | | | | | | | | | | | | | | 2013 | | | 2014 | | | 2015 | | | | | | | Result on disposal of businesses: | | | | | | | | | | | | | - income | | | 50 | | | | 7 | | | | 4 | | - expense | | | (1 | ) | | | (2 | ) | | | (5 | ) | Result on disposal of fixed assets: | | | | | | | | | | | | | - income | | | 18 | | | | 18 | | | | 79 | | - expense | | | (13 | ) | | | (1 | ) | | | (9 | ) | Result on other remaining businesses: | | | | | | | | | | | | | - income | | | 54 | | | | 38 | | | | 54 | | - expense | | | (21 | ) | | | (271 | ) | | | (36 | ) | | | | | | Other business income (expenses) | | | 87 | | | | (211 | ) | | | 87 | | | | | | | Total other business income | | | 122 | | | | 63 | | | | 137 | | Total other business expense | | | (35 | ) | | | (274 | ) | | | (50 | ) | | | | | |
In 2015, result on disposal of businesses was mainly due to divestment of non-strategic businesses. For further information, see note 4, Acquisitions and divestments. In 2015, result on disposal of fixed assets was mainly due to sale of real estate assets. In 2015, result on other remaining businesses mainly relates to non-core revenue and various legal matters. In 2014 remaining business expense mainly relates to certain parts of the Cathode Ray Tube antitrust litigation as mentioned in note 26, Contingent assets and liabilities for which the Company concluded it was able to make a reliable estimate of the cash outflow or was able to reach a settlement with the relevant plaintiffs. For more details reference is made to note 19, Provisions - litigation provisions and note 26, Contingent assets and liabilities - legal proceedings. Financial income and expenses Philips Group Financial income and expenses in millions of EUR 2013 - 2015 | | | | | | | | | | | | | | | | | | | | | 2013 | | | 2014 | | | 2015 | | | | | | | Interest income | | | 54 | | | | 39 | | | | 48 | | Interest income from loans and receivables | | | 32 | | | | 22 | | | | 21 | | Interest income from cash and cash equivalents | | | 22 | | | | 17 | | | | 27 | | Dividend income from available for sale financial assets | | | 5 | | | | 4 | | | | 6 | | Net gains from disposal of financial assets | | | — | | | | 60 | | | | 20 | | Net change in fair value of financial assets at fair value through profit or loss | | | — | | | | — | | | | 4 | | Other financial income | | | 11 | | | | 11 | | | | 20 | | | | | | | Financial income | | | 70 | | | | 114 | | | | 98 | | Interest expense | | | (323 | ) | | | (290 | ) | | | (350 | ) | Interest on debt and borrowings | | | (245 | ) | | | (224 | ) | | | (271 | ) | Finance charges under finance lease contract | | | (7 | ) | | | (7 | ) | | | (7 | ) | Interest expenses - pensions | | | (71 | ) | | | (59 | ) | | | (72 | ) | Provision-related accretion and interest | | | (25 | ) | | | (80 | ) | | | (35 | ) | Net foreign exchange losses | | | (6 | ) | | | (1 | ) | | | (11 | ) | Impairment loss of financial assets | | | (10 | ) | | | (17 | ) | | | (46 | ) | Net change in fair value of financial assets at fair value through profit or loss | | | (9 | ) | | | (6 | ) | | | — | | Net change in fair value of financial liabilities at fair value through profit or loss | | | (3 | ) | | | (2 | ) | | | — | | Other financial expenses | | | (24 | ) | | | (19 | ) | | | (25 | ) | | | | | | Financial expense | | | (400 | ) | | | (415 | ) | | | (467 | ) | | | | | | Financial income and expenses | | | (330 | ) | | | (301 | ) | | | (369 | ) | | | | | |
Net financial income and expense showed a EUR 369 million expenses in 2015, which was 68 million higher than in 2014. Interest expense in 2015 was EUR 60 million higher than in 2014, mainly due to weaker EUR against USD in relation to interest expenses on USD bonds. The gain from disposal of financial assets in 2015 amounted to EUR 20 million, mainly from Assembléon, Silicon & Software Systems and other equity interest. The impairment charges in 2015 amounted to EUR 46 million mainly due to valuation allowances on Other current receivables. Provision-related accretion and interest in 2015 primarily consisted of interest expense related to the jury verdict in the Masimo litigation, and accretion expense associated with other discounted provisions and uncertain tax positions. Interest expense in 2014 was EUR 33 million lower than in 2013, mainly as a result of lower average outstanding debt and lower interest related to pensions in 2014. The gain from disposal on financial assets in 2014 amounted to EUR 60 million, mainly from Neusoft, Chimei Innolux, Gilde III and Sapiens. In 2014 impairment charges amounted to EUR 17 million. Provision-related accretion and interest in 2014 primarily consisted of interest expense related to the jury verdict in the Annual Report 2015 159
Group financial statements 12.9 Masimo litigation, and accretion expense associated with other discounted provisions and uncertain tax positions. Net financial income and expense showed a EUR 330 million expense in 2013. Total financial income of EUR 70 million included a EUR 54 million interest income. Income taxes The income tax expense of continuing operations amounted to EUR 239 million (2014: EUR 26 million, 2013: EUR 466 million). The components of income before taxes and income tax expense are as follows: Philips Group Income tax expense in millions of EUR 2013 - 2015 | | | | | | | | | | | | | | | | | | | | | 2013 | | | 2014 | | | 2015 | | | | | | | Netherlands | | | 281 | | | | 665 | | | | 229 | | Foreign | | | 1,244 | | | | (480 | ) | | | 394 | | | | | | | Income before taxes of continuing operations | | | 1,525 | | | | 185 | | | | 623 | | | | | | Netherlands: | | | | | | | | | | | | | Current tax (expense) benefit | | | 5 | | | | (12 | ) | | | 8 | | Deferred tax expense | | | (107 | ) | | | (29 | ) | | | — | | | | | | | Total tax (expense) benefit of continuing operations (Netherlands) | | | (102 | ) | | | (41 | ) | | | 8 | | | | | | Foreign: | | | | | | | | | | | | | Current tax expense | | | (274 | ) | | | (250 | ) | | | (242 | ) | Deferred tax (expense) benefit | | | (90 | ) | | | 265 | | | | (5 | ) | | | | | | Total tax (expense) benefit of continuing operations (foreign) | | | (364 | ) | | | 15 | | | | (247 | ) | | | | | | Income tax expense of continuing operations | | | (466 | ) | | | (26 | ) | | | (239 | ) | | | | | |
Income tax expense of continuing operations excludes the tax expense of the discontinued operations of EUR 54 million (2014: EUR 11 million, 2013: EUR 11 million). The components of income tax expense of continuing operations are as follows: Philips Group Current income tax expense in millions of EUR 2013 - 2015 | | | | | | | | | | | | | | | | | | | | | 2013 | | | 2014 | | | 2015 | | | | | | | Current year tax expense | | | (262 | ) | | | (241 | ) | | | (244 | ) | Prior year tax (expense) benefit | | | (7 | ) | | | (21 | ) | | | 10 | | | | | | | Current tax expense | | | (269 | ) | | | (262 | ) | | | (234 | ) | | | | | |
Philips Group Deferred income tax expense in millions of EUR 2013 - 2015 | | | | | | | | | | | | | | | | | | | | | 2013 | | | 2014 | | | 2015 | | | | | | | Tax loss carryforwards previously unrecognized | | | 20 | | | | 18 | | | | 7 | | Current year tax loss carryforwards unrecognized | | | (29 | ) | | | (65 | ) | | | (86 | ) | Tax assets relating to temporary differences unrecognized | | | (3 | ) | | | (47 | ) | | | (31 | ) | Prior year tax (expense) benefit | | | 15 | | | | 34 | | | | (7 | ) | Tax rate changes | | | — | | | | 12 | | | | (19 | ) | Deferred tax (expense) benefit recognized for the current year | | | (200 | ) | | | 284 | | | | 131 | | | | | | | Deferred tax (expense) benefit | | | (197 | ) | | | 236 | | | | (5 | ) | | | | | |
Philips’ operations are subject to income taxes in various foreign jurisdictions. The statutory income tax rates vary from 10.0% to 39.0%, which results in a difference between the weighted average statutory income tax rate and the Netherlands’ statutory income tax rate of 25.0% (2014: 25.0%; 2013: 25.0%). A reconciliation of the weighted average statutory income tax rate to the effective income tax rate of continuing operations is as follows: Philips Group Effective tax rate in % 2013 - 2015 | | | | | | | | | | | | | | | | | | | | | 2013 | | | 2014 | | | 2015 | | | | | | | Weighted average statutory income tax rate in % | | | 29.2 | | | | 7.9 | | | | 29.8 | | Increase (Decrease) in tax rate resulting from: | | | | | | | | | | | | | - recognition of previously unrecognized tax loss carryforwards | | | (1.3 | ) | | | (9.6 | ) | | | (1.2 | ) | - current year tax loss carryfowards unrecognized | | | 1.9 | | | | 34.9 | | | | 13.7 | | - current year temporary differences unrecognized | | | 0.2 | | | | 25.5 | | | | 4.9 | | Non-deductible impairment charges | | | 0.7 | | | | 1.8 | | | | 0.1 | | Non-taxable income | | | (8.9 | ) | | | (100.1 | ) | | | (30.7 | ) | Non-deductible expense | | | 8.1 | | | | 51.6 | | | | 20.5 | | Withholding and other taxes | | | 0.9 | | | | 13.4 | | | | 4.9 | | Tax rate changes | | | — | | | | (6.3 | ) | | | 3.0 | | Prior year tax expense | | | (0.2 | ) | | | (30.8 | ) | | | (0.4 | ) | Tax expense (benefit) due to other liabilities | | | 0.3 | | | | 5.6 | | | | (5.9 | ) | Tax incentives | | | (0.7 | ) | | | (7.4 | ) | | | (0.7 | ) | Others, net | | | 0.4 | | | | 27.6 | | | | 0.4 | | | | | | | Effective tax rate | | | 30.6 | | | | 14.1 | | | | 38.4 | | | | | | |
The weighted average statutory income tax rate increased in 2015 compared to 2014, as a consequence of a significant change in the geographical mix of actual profits. The effective income tax rate is higher than the weighted average statutory income tax rate in 2015, mainly due to the non-deductible expenses, new loss carryforwards and temporary differences not expected to be realized which are partly offset by non-taxable income. Non-taxable income is partly attributable to favorable tax regulations relating to R&D investments. 160 Annual Report 2015
Group financial statements 12.9 Deferred tax assets and liabilities Net deferred tax assets relate to the following balance sheet captions and tax loss carryforwards (including tax credit carryforwards), of which the movements during the years 2015 and 2014 respectively are presented in the tables below. Deferred tax assets are recognized for temporary differences, unused tax losses, and unused tax credits to the extent that realization of the related tax benefits is probable. The ultimate realization of deferred tax assets is dependent upon the generation of future taxable income in the countries where the deferred tax assets originated and during the periods when the deferred tax assets become deductible. Management considers the scheduled reversal of deferred tax liabilities, projected future taxable income, and tax planning strategies in making this assessment. The net deferred tax assets of EUR 2,594 million (2014: EUR 2,353 million) consist of deferred tax assets of EUR 2,758 million (2014: EUR 2,460 million) in countries with a net deferred tax asset position and deferred tax liabilities of EUR 164 million (2014: EUR 107 million) in countries with a net deferred tax liability position. Of the Philips Group Deferred tax assets and liabilities in millions of EUR 2015 | | | | | | | | | | | | | | | | | | | | | | | | | | | | | | | | | Balance as of
January 1,
2015 | | | recognized in income
statement | | | other1) | | | Balance as of
December 31, 2015 | | | Assets | | | Liabilities | | | | | | | Intangible assets | | | (980 | ) | | | 131 | | | | (240 | ) | | | (1,089 | ) | | | 195 | | | | (1,284 | ) | Property, plant and equipment | | | 73 | | | | (50 | ) | | | (4 | ) | | | 19 | | | | 63 | | | | (44 | ) | Inventories | | | 311 | | | | 10 | | | | 33 | | | | 354 | | | | 360 | | | | (6 | ) | Prepaid pensions | | | 98 | | | | (142 | ) | | | 41 | | | | (3 | ) | | | — | | | | (3 | ) | Other receivables | | | 49 | | | | — | | | | 2 | | | | 51 | | | | 57 | | | | (6 | ) | Other assets | | | 24 | | | | 13 | | | | (20 | ) | | | 17 | | | | 31 | | | | (14 | ) | Provisions: | | | | | | | | | | | | | | | | | | | | | | | | | - pensions | | | 562 | | | | (23 | ) | | | 30 | | | | 569 | | | | 569 | | | | — | | - guarantees | | | 4 | | | | (1 | ) | | | — | | | | 3 | | | | 3 | | | | — | | - termination benefits | | | 109 | | | | (40 | ) | | | 1 | | | | 70 | | | | 71 | | | | (1 | ) | - other postretirement benefits | | | 71 | | | | 1 | | | | (2 | ) | | | 70 | | | | 70 | | | | — | | - other provisions | | | 783 | | | | (3 | ) | | | 5 | | | | 785 | | | | 805 | | | | (20 | ) | Other liabilities | | | 209 | | | | (33 | ) | | | 19 | | | | 195 | | | | 216 | | | | (21 | ) | Deferred tax assets on tax loss carryforwards (including tax credit carryforwards) | | | 1,040 | | | | 132 | | | | 381 | | | | 1,553 | | | | 1,553 | | | | — | | Set-off deferred tax positions | | | | | | | | | | | | | | | | | | | (1,235 | ) | | | 1,235 | | | | | | | Net deferred tax assets | | | 2,353 | | | | (5 | ) | | | 246 | | | | 2,594 | | | | 2,758 | | | | (164 | ) | | | | | |
| | | 33 | | 1) | Other includes the movements of assets and liabilities recognized in OCI, which includes foreign currency translation differences, and acquisitions and divestments. | Other
|
Philips Group Deferred tax assets and liabilities in millions of EUR 2014 | | | | | | | | | | | | | | | | | | | | | | | | | | | | | | | | | Balance as of
January 1,
2014 | | | recognized in income
statement | | | other1) | | | Balance as of
December 31, 2014 | | | Assets | | | Liabilities | | | | | | | Intangible assets | | | (871 | ) | | | 59 | | | | (168 | ) | | | (980 | ) | | | 114 | | | | (1,094 | ) | Property, plant and equipment | | | 58 | | | | 9 | | | | 6 | | | | 73 | | | | 120 | | | | (47 | ) | Inventories | | | 264 | | | | 24 | | | | 23 | | | | 311 | | | | 317 | | | | (6 | ) | Prepaid pension | | | (1 | ) | | | (40 | ) | | | 139 | | | | 98 | | | | 99 | | | | (1 | ) | Other receivables | | | 50 | | | | 6 | | | | (7 | ) | | | 49 | | | | 58 | | | | (9 | ) | Other assets | | | 32 | | | | (8 | ) | | | — | | | | 24 | | | | 45 | | | | (21 | ) | Provisions: | | | | | | | | | | | | | | | | | | | | | | | | | - pensions | | | 426 | | | | (49 | ) | | | 185 | | | | 562 | | | | 562 | | | | — | | - guarantees | | | 29 | | | | (25 | ) | | | — | | | | 4 | | | | 4 | | | | — | | - termination benefits | | | 97 | | | | 23 | | | | (11 | ) | | | 109 | | | | 109 | | | | — | | - other postretirement benefits | | | 57 | | | | 2 | | | | 12 | | | | 71 | | | | 71 | | | | — | | - other provisions | | | 567 | | | | 126 | | | | 90 | | | | 783 | | | | 791 | | | | (8 | ) | Other liabilities | | | 192 | | | | (1 | ) | | | 18 | | | | 209 | | | | 226 | | | | (17 | ) | Deferred tax assets on tax loss carryforwards (including tax credit carryforwards) | | | 699 | | | | 110 | | | | 231 | | | | 1,040 | | | | 1,040 | | | | — | | Set-off deferred tax positions | | | | | | | | | | | | | | | | | | | (1,096 | ) | | | 1,096 | | | | | | | Net deferred tax assets | | | 1,599 | | | | 236 | | | | 518 | | | | 2,353 | | | | 2,460 | | | | (107 | ) | | | | | |
| | | 98| 1) | Other includes the movements of assets and liabilities recognized in OCI, which includes foreign currency translation differences, and acquisitions and divestments. |
Annual Report 2015 161
Group financial statements 12.9 total deferred tax assets of EUR 2,758 million at December 31, 2015, (2014: EUR 2,460 million), EUR 2,119 million (2014: EUR 1,352 million) is recognized in respect of fiscal entities in various countries where there have been fiscal losses in the current or preceding period. Management’s projections support the assumption that it is probable that the results of future operations will generate sufficient taxable income to utilize these deferred tax assets. At December 31, 2015 and 2014, there were no recognized deferred tax liabilities for taxes that would be payable on the unremitted earnings of certain foreign subsidiaries of Philips Holding USA since it has been determined that undistributed profits of such subsidiaries will not be distributed in the foreseeable future. The temporary differences associated with the investments in subsidiaries of Philips Holding USA, for which a deferred tax liability has not been recognized, aggregate to EUR 78 million (2014: EUR 47 million). At December 31, 2015, net operating loss carryforwards expire as follows: Philips Group Expiry years of net operating loss carryforwardsin millions of EUR | | | | | | | | | | | | | | | | | | | | | | | | | | | | | | | | | Total | | 2016 | | 2017 | | | 2018 | | | 2019 | | | 2020 | | | 2021/
2025 | | | later | | | unlimited | | 7,566 | | — | | | 2 | | | | 9 | | | | 176 | | | | 207 | | | | 2,459 | | | | 1,456 | | | | 3,257 | | | | | | | | | | | | | | | | | | | | | | | | | | | | | | | | |
The Company also has tax credit carryforwards of EUR 217 million, which are available to offset future tax, if any, and which expire as follows: Philips Group Expiry years of tax credit carryforwardsin millions of EUR | | | | | | | | | | | | | | | | | | | | | | | | | | | | | | | | | Total | | 2016 | | 2017 | | | 2018 | | | 2019 | | | 2020 | | | 2021/
2025 | | | later | | | unlimited | | 217 | | — | | | 4 | | | | 5 | | | | 4 | | | | 2 | | | | 39 | | | | 146 | | | | 17 | | | | | | | | | | | | | | | | | | | | | | | | | | | | | | | | |
At December 31, 2015, net operating loss and tax credit carryforwards for which no deferred tax assets have been recognized in the balance sheet, expire as follows: Philips Group Net operating loss and tax credit carryforwards for which no deferred tax asset has been recognized in millions of EUR | | | | | | | | | | | | | | | | | | | | | | | | | | | | | | | | | | | Total | | 2016 | | | 2017 | | | 2018 | | | 2019 | | | 2020 | | | 2021/
2025 | | | later | | | unlimited | | 2,507 | | | — | | | | 4 | | | | 5 | | | | 84 | | | | 103 | | | | 335 | | | | 550 | | | | 1,426 | | | | | | | | | | | | | | | | | | | | | | | | | | | | | | | | | | |
At December 31, 2015, the amount of deductible temporary differences for which no deferred tax asset has been recognized in the balance sheet is EUR 139 million (2014: EUR 190 million). Classification of the income tax payable and receivable is as follows: Philips Group Income tax payables and receivablesin millions of EUR 2014 - 2015 | | | | | | | | | | | | | | | | | 2014 | | | 2015 | | | | | | | Income tax receivables | | | 140 | | | | 114 | | Income tax receivables - under non-current receivables | | | — | | | | — | | Income tax payables | | | (102 | ) | | | (116 | ) | Income tax payables - under non-current liabilities | | | (1 | ) | | | — | | | | | | |
Tax risks Philips is exposed to tax uncertainties. These uncertainties include, among others, the following: Transfer pricing uncertainties Philips has issued transfer pricing directives, which are in accordance with international guidelines such as those of the Organization of Economic Co-operation and Development. As transfer pricing has a cross-border effect, potential adjustments by local tax authorities on implemented transfer pricing procedures in a country may have an impact on results in another country. In order to reduce the transfer pricing uncertainties, monitoring procedures are carried out by Group Tax and Internal Audit to safeguard the correct implementation of the transfer pricing directives. Tax uncertainties on general and specific service agreements and licensing agreements Due to the centralization of certain activities in a limited number of countries (such as research and development, IT, Group functions and head office), costs are also centralized. As a consequence, these costs and/or revenues must be allocated to the beneficiaries, i.e. the various Philips entities. For that purpose, service contracts such as intra-group service agreements and licensing agreements are signed with a large number of group entities. Tax authorities review these intra-group service and licensing agreements, and may reject the implemented intra-group charges. Furthermore, buy in/out situations in the case of (de)mergers could affect the cost allocation resulting from the general service agreements between countries. The same applies to the specific service agreements. Tax uncertainties due to disentanglements and acquisitions When a subsidiary of Philips is disentangled, or a new company is acquired, related tax uncertainties may arise. Philips creates merger and acquisition (M&A) teams for these disentanglements or acquisitions. In addition to representatives from the involved business, these teams consist of specialists from various group functions and are formed, among other things, to identify hidden tax uncertainties that could subsequently surface when companies are acquired and to reduce tax claims related to disentangled entities. These tax uncertainties are investigated and 162 Annual Report 2015
Group financial statements 12.9 assessed to mitigate tax uncertainties in the future to the extent possible. Examples of tax uncertainties are: applicability of participation exemptions, allocation issues, and issues related to (non-)deductibility. Tax uncertainties due to permanent establishments In countries where Philips starts new operations or alters business models, the issue of permanent establishment may arise. This is because when operations in a country involves a Philips organization in another country, there is a risk that tax claims will arise in the former country as well as in the latter country. Earnings per share Philips Group Earnings per sharein millions of EUR unless otherwise stated1) 2013 - 2015 | | | | | | | | | | | | | | | | | | | | | | | | | | | | | | | | | 2013 | | | 2014 | | | | | | 2015 | | | | | | | Income from continuing operations | | | | | | | 1,034 | | | | | | | | 221 | | | | | | | | 414 | | Income (loss) attributable to non-controlling interest | | | | | | | 3 | | | | | | | | (4 | ) | | | | | | | 14 | | | | | | | Income from continuing operations attributable to shareholders | | | | | | | 1,031 | | | | | | | | 225 | | | | | | | | 400 | | | | | | | | | Income from discontinued operations | | | | | | | 138 | | | | | | | | 190 | | | | | | | | 245 | | | | | | | | | | | | | | Net income attributable to shareholders | | | | | | | 1,169 | | | | | | | | 415 | | | | | | | | 645 | | | | | | | | | Weighted average number of common shares outstanding (after deduction of treasury shares) during the year | | | | | | | 911,071,970 | | | | | | | | 915,192,683 | | | | | | | | 916,086,943 | | Plus incremental shares from assumed conversions of: | | | | | | | | | | | | | | | | | | | | | | | | | Options | | | 5,464,833 | | | | | | | | 4,617,109 | | | | | | | | 3,565,682 | | | | | | Performance shares | | | 662,973 | | | | | | | | 614,010 | | | | | | | | 2,479,923 | | | | | | Restricted share rights | | | 4,768,777 | | | | | | | | 2,290,472 | | | | | | | | 1,491,960 | | | | | | Convertible debentures | | | 103,899 | | | | | | | | | | | | | | | | | | | | | | | | | | | | | | | | | | | | | | | | | | | | | | | Dilutive potential common shares | | | | | | | 11,000,482 | | | | | | | | 7,521,591 | | | | | | | | 7,537,565 | | Adjusted weighted average number of shares (after deduction of treasury shares) during the year | | | | | | | 922,072,452 | | | | | | | | 922,714,274 | | | | | | | | 923,624,508 | | | | | | | | | | Basic earnings per common share in EUR2) | | | | | | | | | | | | | | | | | | | | | | | | | Income from continuing operations | | | | | | | 1.13 | | | | | | | | 0.24 | | | | | | | | 0.45 | | Income from discontinued operations | | | | | | | 0.15 | | | | | | | | 0.21 | | | | | | | | 0.27 | | Income from continuing operations attributable to shareholders | | | | | | | 1.13 | | | | | | | | 0.25 | | | | | | | | 0.44 | | Net income attributable to shareholders | | | | | | | 1.28 | | | | | | | | 0.45 | | | | | | | | 0.70 | | | | | | | | | | Diluted earnings per common share in EUR2,3,4) | | | | | | | | | | | | | | | | | | | | | | | | | Income from continuing operations | | | | | | | 1.12 | | | | | | | | 0.24 | | | | | | | | 0.45 | | Income from discontinued operations | | | | | | | 0.15 | | | | | | | | 0.21 | | | | | | | | 0.27 | | Income from continuing operations attributable to shareholders | | | | | | | 1.12 | | | | | | | | 0.24 | | | | | | | | 0.43 | | Net income attributable to shareholders | | | | | | | 1.27 | | | | | | | | 0.45 | | | | | | | | 0.70 | | | | | | | | | Dividend distributed per common share in euros | | | | | | | 0.75 | | | | | | | | 0.80 | | | | | | | | 0.80 | | | | | | |
| 1) | Shareholders in this table refer to shareholders of Koninklijke Philips N.V. |
| 2) | The effect on income of convertible debentures affecting earnings per share is considered immaterial |
| 3) | In 2015, 2014 and 2013, respectively 12 million, 19 million and 14 million securities that could potentially dilute basic EPS were not included in the computation of dilutive EPS because the effect would have been antidilutive for the periods presented |
| 4) | The dilutive potential common shares are not taken into account in the periods for which there is a loss, as the effect would be antidilutive |
Annual Report 2015 163
Group financial statements 12.9 Property, plant and equipment Philips Group Property, plant and equipmentin millions of EUR 2015 | | | | | | | | | | | | | | | | | | | | | | | | | | | | | land and
buildings | | | machinery
and
installations | | | other
equipment | | | prepayments and
construction in progress | | | total | | | | | | | Balance as of January 1, 2015: | | | | | | | | | | | | | | | | | | | | | Cost | | | 1,803 | | | | 3,127 | | | | 1,745 | | | | 169 | | | | 6,844 | | Accumulated depreciation | | | (931 | ) | | | (2,520 | ) | | | (1,298 | ) | | | — | | | | (4,749 | ) | | | | | | Book value | | | 872 | | | | 607 | | | | 447 | | | | 169 | | | | 2,095 | | Change in book value: | | | | | | | | | | | | | | | | | | | | | Capital expenditures | | | 13 | | | | 113 | | | | 62 | | | | 387 | | | | 575 | | Assets available for use | | | 59 | | | | 139 | | | | 140 | | | | (338 | ) | | | — | | Acquisitions | | | — | | | | 107 | | | | 2 | | | | — | | | | 109 | | Disposals and sales | | | (3 | ) | | | (3 | ) | | | (6 | ) | | | — | | | | (12 | ) | Depreciation | | | (83 | ) | | | (252 | ) | | | (196 | ) | | | — | | | | (531 | ) | Impairments | | | (8 | ) | | | (27 | ) | | | (16 | ) | | | — | | | | (51 | ) | Transfer (to) from assets classified as held for sale | | | 26 | | | | (10 | ) | | | — | | | | (2 | ) | | | 14 | | Translation differences | | | 37 | | | | 61 | | | | 21 | | | | 4 | | | | 123 | | | | | | | Total changes | | | 41 | | | | 128 | | | | 7 | | | | 51 | | | | 227 | | Balance as of December 31, 2015: | | | | | | | | | | | | | | | | | | | | | Cost | | | 1,864 | | | | 3,260 | | | | 1,873 | | | | 220 | | | | 7,217 | | Accumulated depreciation | | | (951 | ) | | | (2,525 | ) | | | (1,419 | ) | | | — | | | | (4,895 | ) | | | | | | Book value | | | 913 | | | | 735 | | | | 454 | | | | 220 | | | | 2,322 | | | | | | |
Philips Group Property, plant and equipmentin millions of EUR 2014 | | | | | | | | | | | | | | | | | | | | | | | | | | | | | land and
buildings | | | machinery
and
installations | | | other
equipment | | | prepayments and
construction in progress | | | total | | | | | | | Balance as of January 1, 2014: | | | | | | | | | | | | | | | | | | | | | Cost | | | 1,899 | | | | 3,948 | | | | 1,586 | | | | 259 | | | | 7,692 | | Accumulated depreciation | | | (872 | ) | | | (2,885 | ) | | | (1,155 | ) | | | — | | | | (4,912 | ) | | | | | | Book value | | | 1,027 | | | | 1,063 | | | | 431 | | | | 259 | | | | 2,780 | | Change in book value: | | | | | | | | | | | | | | | | | | | | | Capital expenditures | | | 6 | | | | 86 | | | | 68 | | | | 368 | | | | 528 | | Assets available for use | | | 79 | | | | 220 | | | | 132 | | | | (431 | ) | | | — | | Acquisitions | | | 7 | | | | 6 | | | | 4 | | | | 2 | | | | 19 | | Disposals and sales | | | — | | | | (5 | ) | | | (7 | ) | | | — | | | | (12 | ) | Depreciation | | | (91 | ) | | | (295 | ) | | | (178 | ) | | | — | | | | (564 | ) | Impairments | | | (26 | ) | | | (74 | ) | | | (21 | ) | | | (1 | ) | | | (122 | ) | Transfer to assets classified as held for sale | | | (190 | ) | | | (451 | ) | | | (10 | ) | | | (37 | ) | | | (688 | ) | Translation differences | | | 60 | | | | 57 | | | | 28 | | | | 9 | | | | 154 | | | | | | | Total changes | | | (155 | ) | | | (456 | ) | | | 16 | | | | (90 | ) | | | (685 | ) | Balance as of December 31, 2014: | | | | | | | | | | | | | | | | | | | | | Cost | | | 1,803 | | | | 3,127 | | | | 1,745 | | | | 169 | | | | 6,844 | | Accumulated depreciation | | | (931 | ) | | | (2,520 | ) | | | (1,298 | ) | | | — | | | | (4,749 | ) | | | | | | Book value | | | 872 | | | | 607 | | | | 447 | | | | 169 | | | | 2,095 | | | | | | |
Land with a book value of EUR 142 million at December 31, 2015 (2014: EUR 89 million) is not depreciated. The acquisitions through business combinations in 2015 mainly consist of the acquired machinery and installations of Volcano for EUR 104 million. Transfer from assets classified as held for sale mainly includes a property reclassified back to property, plant and equipment for EUR 56 million, as it is no longer expected to be sold in 2016. Transfer to assets classified as held for sale in 2014 mainly relates to the combined businesses of Lumileds and Automotive. Impairment charges of EUR 49 million are related to industrial assets in Lighting in 2014. Property, plant and equipment includes financial lease assets with a book value of EUR 203 million at December 31, 2015 (2014: EUR 192 million). 164 Annual Report 2015
Group financial statements 12.9 The expected useful lives of property, plant and equipment are as follows: Philips Group Useful lives of property, plant and equipmentin years | | | | | Buildings | | | from 5 to 50 years | | Machinery and installations | | | from 3 to 20 years | | Other equipment | | | from 1 to 10 years | | | | | | | Liabilities directly associated with
|
Goodwill The changes in 2014 and 2015 were as follows: Philips Group Goodwill in millions of EUR 2014 - 2015 | | | | | | | | | | | | | | | | | 2014 | | | 2015 | | | | | | | Balance as of January 1: | | | | | | | | | Cost | | | 8,596 | | | | 9,151 | | Amortization and impairments | | | (2,092 | ) | | | (1,993 | ) | | | | | | Book value | | | 6,504 | | | | 7,158 | | | | | Changes in book value: | | | | | | | | | Acquisitions | | | 68 | | | | 636 | | Purchase price allocation adjustment | | | 8 | | | | 8 | | Impairments | | | — | | | | — | | Divestments and transfers to assets classified as held for sale | | | (160 | ) | | | — | | Translation differences | | | 738 | | | | 721 | | | | | Balance as of December 31: | | | | | | | | | Cost | | | 9,151 | | | | 10,704 | | Amortization and impairments | | | (1,993 | ) | | | (2,181 | ) | | | | | | Book value | | | 7,158 | | | | 8,523 | | | | | | |
Goodwill increased by EUR 627 million in 2015 due to the acquisition of Volcano. The increase of EUR 721 million in translation differences was mainly due to the increase in the USD/EUR rate which impacted the goodwill denominated in USD. In 2014 the movement acquisitions mainly related to the acquisition of General Lighting Company (GLC) for EUR 58 million. Divestments and transfer to assets classified as held for sale in 2014 relate to the sectors Healthcare and Lighting. In 2014 the movement of EUR 738 million in translation differences is mainly explained by the increase of the USD/EUR rate which impacted the goodwill nominated in USD. In 2015, the activities of Imaging Systems in the sector Healthcare were split over three new cash-generating units: Image-Guided Therapy, Ultrasound and Diagnostic Imaging. As a result of the change, the goodwill associated with Imaging Systems was allocated over these three new units. For impairment testing, goodwill is allocated to (groups of) cash-generating units (typically one level below operating sector level), which represent the lowest level at which the goodwill is monitored internally for management purposes. Goodwill allocated to the cash-generating units Respiratory Care & Sleep Management, Image-Guided Therapy, Patient Care & Monitoring Solutions and Professional Lighting Solutions is considered to be significant in comparison to the total book value of goodwill for the Group at December 31, 2015. The amounts associated as of December 31, 2015, are presented below: Philips Group Goodwill allocated to the cash-generating units in millions of EUR 2014 - 2015 | | | | | | | | | | | | | | | | | 2014 | | | 2015 | | | | | | | Respiratory Care & Sleep Management | | | 1,704 | | | | 1,884 | | Imaging Systems | | | 1,592 | | | | | | Image-Guided Therapy | | | | | | | 1,066 | | Patient Care & Monitoring Solutions | | | 1,317 | | | | 1,452 | | Professional Lighting Solutions | | | 1,470 | | | | 1,626 | | Other (units carrying a non-significant goodwill balance) | | | 1,075 | | | | 2,495 | | | | | | | Book value | | | 7,158 | | | | 8,523 | | | | | | |
The basis of the recoverable amount used for the units disclosed in this note is the value in use. In the annual impairment test performed in the second quarter and in the tests performed in the second half of 2015, the estimated recoverable amounts of the cash-generating units tested approximated or exceeded the carrying value of the units, therefore no impairment loss was recognized. Key assumptions used in the impairment tests for the units were sales growth rates, income from operations and the rates used for discounting the projected cash flows. These cash flow projections were determined using management’s internal forecasts that cover an initial period from 2015 to 2019 that matches the period used for our strategic process. Projections were extrapolated with stable or declining growth rates for a period of 5 years, after which a terminal value was calculated. For terminal value calculation, growth rates were capped at a historical long-term average growth rate. The sales growth rates and margins used to estimate cash flows are based on past performance, external market growth assumptions and industry long-term growth averages. Income from operations in all mentioned units is expected to increase over the projection period as a result of volume growth and cost efficiencies. In anticipation of the new reporting structure in 2016, the impact of an additional allocation of central overhead costs over the projection period has been considered for units which performed an updated test in the second half of 2015. Cash flow projections of Respiratory Care & Sleep Management, Image-Guided Therapy, Patient Care & Monitoring Solutions and Professional Lighting Solutions for 2015 were based on the key assumptions Annual Report 2015 165
Group financial statements 12.9 included in the table below. These assumptions are based on the annual impairment test performed in the second quarter except for the unit Professional Lighting Solutions which performed an updated test in Q4 2015. Philips Group Key assumptionsin % 2015 | | | | | | | | | | | | | | | | | | | | | | | | | compound sales growth rate1) | | | | | | | | | | | | | | | | | initial
forecast
period | | | extra-
polation
period2) | | | used to
calculate
terminal
value | | | pre-tax
discount
rates | | | | | | | Respiratory Care & Sleep Management | | | 6.9 | | | | 5.6 | | | | 2.7 | | | | 11.5 | | Image-Guided Therapy | | | 3.0 | | | | 2.4 | | | | 2.7 | | | | 12.2 | | Patient Care & Monitoring Solutions | | | 6.0 | | | | 4.8 | | | | 2.7 | | | | 13.4 | | Professional Lighting Solutions | | | 5.0 | | | | 5.1 | | | | 2.7 | | | | 15.1 | | | | | | |
| | | 348| 1) | Compound sales growth rate is the annualized steady growth rate over the forecast period |
| 2) | Also referred to later in the text as compound long-term sales growth rate |
The assumptions used for the 2014 cash flow projections were as follows: Philips Group Key assumptionsin % 2014 | | | | | | | | | | | | | | | | | | | | | | | | | compound sales growth rate1) | | | | | | | | | | | | | | | | | initial
forecast
period | | | extra-
polation
period2) | | | used to
calculate
terminal
value | | | pre-tax
discount
rates | | | | | | | Respiratory Care & Sleep Management | | | 4.2 | | | | 3.6 | | | | 2.7 | | | | 11.4 | | Imaging Systems | | | 3.3 | | | | 3.1 | | | | 2.7 | | | | 12.8 | | Patient Care & Clinical Informatics | | | 4.9 | | | | 3.8 | | | | 2.7 | | | | 12.8 | | Professional Lighting Solutions | | | 10.1 | | | | 6.5 | | | | 2.7 | | | | 13.8 | | | | | | |
| 1) | Compound sales growth rate is the annualized steady growth rate over the forecast period |
| 2) | Also referred to later in the text as compound long-term sales growth rate |
Among the mentioned units, Professional Lighting Solutions has the lowest excess of the recoverable amount over the carrying amount. The headroom of Professional Lighting Solutions was estimated at EUR 100 million. The following changes could, individually, cause the value in use to fall to the level of the carrying value: Philips Group Sensitivity analysis | | | | | | | | | | | | | | | | | | | | | increase in
pre-tax
discount rate,
basis points | | | decrease in
compound long-term
sales growth rate,
basis points | | | decrease in
terminal value
amount, % | | | | | | | Professional Lighting Solutions | | | 40 | | | | 80 | | | | 5.5 | | | | | | |
The results of the annual impairment test of Respiratory Care & Sleep Management, Image-Guided Therapy and Patient Care & Monitoring Solutions indicate that a reasonably possible change in key assumptions would not cause the value in use to fall to the level of the carrying value. Additional information 2015 In addition to the units with significant goodwill, other cash-generating units are sensitive to fluctuations in the assumptions as set out above. Based on the annual impairment test, it was noted that the headroom for the cash-generating unit Home Monitoring was estimated at EUR 30 million. An increase of 130 points in the pre-tax discounting rate, a 320 basis points decline in the compound long-term sales growth rate or a 19% decrease in terminal value would cause its value in use to fall to the level of its carrying value. The goodwill allocated to Home Monitoring at December 31, 2015 amounts to EUR 32 million. Based on the most recent impairment test, it was noted that with regard to the headroom for the cash-generating unit Consumer Luminaires the estimated recoverable amount approximates the carrying value of this cash-generating unit. Consequently, any adverse change in key assumptions would, individually, cause an impairment loss to be recognized. The goodwill allocated to Consumer Luminaires at December 31, 2015 amounts to EUR 127 million. Please refer to note 2, Information by sector and main country for a specification of goodwill by sector. 166 Annual Report 2015
Group financial statements 12.9 Intangible assets excluding goodwill The changes were as follows: Philips Group Intangible assets excluding goodwillin millions of EUR 2015 | | | | | | | | | | | | | | | | | | | | | | | | | other
intangible
assets | | | product
development | | | software | | | total | | | | | | | Balance as of January 1, 2015: | | | | | | | | | | | | | | | | | Cost | | | 5,721 | | | | 1,853 | | | | 446 | | | | 8,020 | | Amortization/impairments | | | (3,371 | ) | | | (964 | ) | | | (317 | ) | | | (4,652 | ) | | | | | | Book value | | | 2,350 | | | | 889 | | | | 129 | | | | 3,368 | | | | | | | Changes in book value: | | | | | | | | | | | | | | | | | Additions | | | 50 | | | | 315 | | | | 70 | | | | 435 | | Acquisitions | | | 326 | | | | — | | | | — | | | | 326 | | Purchase price allocation adjustment | | | (10 | ) | | | | | | | | | | | (10 | ) | Amortization | | | (372 | ) | | | (230 | ) | | | (45 | ) | | | (647 | ) | Impairments | | | (8 | ) | | | (41 | ) | | | (3 | ) | | | (52 | ) | Divestments and transfers to assets classified as held for sale | | | — | | | | (2 | ) | | | — | | | | (2 | ) | Translation differences | | | 210 | | | | 61 | | | | 4 | | | | 275 | | | | | | | Total changes | | | 196 | | | | 103 | | | | 26 | | | | 325 | | | | | | | Balance as of December 31, 2015: | | | | | | | | | | | | | | | | | Cost | | | 6,539 | | | | 2,190 | | | | 522 | | | | 9,251 | | Amortization/impairments | | | (3,993 | ) | | | (1,198 | ) | | | (367 | ) | | | (5,558 | ) | | | | | | Book Value | | | 2,546 | | | | 992 | | | | 155 | | | | 3,693 | | | | | | |
Philips Group Intangible assets excluding goodwillin millions of EUR 2014 | | | | | | | | | | | | | | | | | | | | | | | | | other
intangible
assets | | | product
development | | | software | | | total | | | | | | | Balance as of January 1, 2014: | | | | | | | | | | | | | | | | | Cost | | | 5,533 | | | | 1,761 | | | | 344 | | | | 7,638 | | Amortization/impairments | | | (3,173 | ) | | | (916 | ) | | | (287 | ) | | | (4,376 | ) | | | | | | Book value | | | 2,360 | | | | 845 | | | | 57 | | | | 3,262 | | Changes in book value: | | | | | | | | | | | | | | | | | Additions | | | 15 | | | | 323 | | | | 101 | | | | 439 | | Acquisitions | | | 170 | | | | 2 | | | | 1 | | | | 173 | | Purchase price allocation adjustment | | | (8 | ) | | | | | | | | | | | (8 | ) | Amortization | | | (355 | ) | | | (231 | ) | | | (31 | ) | | | (617 | ) | Impairments | | | (1 | ) | | | (25 | ) | | | (2 | ) | | | (28 | ) | Divestments and transfer to assets classified as held for sale | | | (62 | ) | | | (96 | ) | | | — | | | | (158 | ) | Translation differences | | | 231 | | | | 71 | | | | 3 | | | | 305 | | | | | | | Total changes | | | (10 | ) | | | 44 | | | | 72 | | | | 106 | | Balance as of December 31, 2014: | | | | | | | | | | | | | | | | | Cost | | | 5,721 | | | | 1,853 | | | | 446 | | | | 8,020 | | Amortization/impairments | | | (3,371 | ) | | | (964 | ) | | | (317 | ) | | | (4,652 | ) | | | | | | Book value | | | 2,350 | | | | 889 | | | | 129 | | | | 3,368 | | | | | | |
The additions for 2015 contain internally generated assets of EUR 315 million (2014: EUR 323 million) for product development, and EUR 56 million (2014: EUR 83 million) for software. The acquisitions through business combinations in 2015 mainly consist of the acquired intangible assets of Volcano for EUR 320 million. In addition, other intangible fixed assets changed due to the finalization of purchase price accounting related to acquisitions in the prior year. Transfer to assets classified as held for sale in 2014 mainly relate to combined businesses of Lumileds and Automotive. The impairment charges in 2015 for product development relate to various projects mainly within Healthcare. Annual Report 2015 167
Group financial statements 12.9 The increase of EUR 275 million in translation differences was mainly due to the increase of the USD/ EUR rate which impacted the intangibles denominated in USD. The amortization of intangible assets is specified in note 6, Income from operations. Other intangible assets consist of: Philips Group Amortization of other intangible assetsin millions of EUR 2014 - 2015 | | | | | | | | | | | | | | | | | | | | | | | | | Balance as of
December 31, 2014 | | | Balance as of
December 31, 2015 | | | | | gross | | | amortization/
impairments | | | gross | | | amortization/
impairments | | | | | | | Brand names | | | 1,018 | | | | (497 | ) | | | 1,102 | | | | (582 | ) | Customer relationships | | | 3,045 | | | | (1,622 | ) | | | 3,324 | | | | (1,925 | ) | Technology | | | 1,543 | | | | (1,151 | ) | | | 1,977 | | | | (1,373 | ) | Other | | | 115 | | | | (101 | ) | | | 136 | | | | (113 | ) | | | | | | Other intangibles | | | 5,721 | | | | (3,371 | ) | | | 6,539 | | | | (3,993 | ) | | | | | |
The estimated amortization expense for other intangible assets for each of the next five years is: Philips Group Estimated amortization expense for other intangible assets in years | | | | | 2016 | | | 357 | | 2017 | | | 328 | | 2018 | | | 318 | | 2019 | | | 298 | | 2020 | | | 281 | | | | | | |
The expected useful lives of the intangible assets excluding goodwill are as follows: Philips Group Expected useful lives of intangible assets excluding goodwill in years |
Non-transferrable balance sheet positions, such as certain accounts receivable, accounts payable, accrued liabilities and provisions are reported on the respective balance sheet captions.Customer relationships
| | | 2-25 | |
Discontinued operations: Television businessTechnology
| | | 3-20 | |
As announced in Q1 2012, the Television business’s strategic partnership agreement with TPV Technology Limited was signed on April 1, 2012. In 2013, the discontinued Television business reported a net loss of EUR 6 million (2012: a net loss of EUR 31 million; 2011: a net loss of EUR 515 million).Other
| | | 1-8 | |
The following table summarizes the results of the Television business included in the Consolidated statements of income as discontinued operations.Software
| | | 1-10 | |
Product development | | | | | | | | | | | | | | | | 2011 | | | 2012 | | | 2013 | | Sales | | | 2,702 | | | | 563 | | | | (3 | ) | Costs and expenses | | | (2,913 | ) | | | (622 | ) | | | (3 | ) | loss on sale of discontinued operations | | | (380 | ) | | | 5 | | | | 4 | | | | | | | Income (loss) before taxes | | | (591 | ) | | | (54 | ) | | | (2 | ) | Income taxes | | | 76 | | | | 23 | | | | (4 | ) | Operational income tax | | | 49 | | | | 28 | | | | (2 | ) | Income tax on loss on sale of discontinued operations | | | 27 | | | | (5 | ) | | | (2 | ) | | | | | | Results from discontinued operations | | | (515 | ) | | | (31 | ) | | | (6 | ) |
In 2011, the loss on the sale of the Television business amounted to approximately EUR 380 million, which mainly comprised of present value of initial contributions made to the TV venture (EUR 183 million), total disentanglement costs (EUR 81 million), contributed assets which were not fully recovered (EUR 66 million) and various smaller other items, offset by the revenue associated with the sale, including the fair value of a contingent consideration and a retained 30% interest in the TV venture.
In addition to the contributions that were agreed and recognized as loss on onerous contract, Philips made commitments to provide further financing to the TV venture for more details see note 25, Contractual obligations and note 36, Subsequent events.
The following table presents the in 2012 divested assets and liabilities of the Television business.
180 Annual Report 2013
11 Group financial statements 11.9 - 11.9
| | | | | | | April 1, 2012 | | Property, plant and equipment
| | | 91 | | Intangible assets including goodwill
| | | — | | Write down to fair value less costs to sell
| | | — | | Inventories
| | | 124 | | Other assets
| | | 25 | | | 3-7 | | | | | | | Assets classified as held for sale
| | | 240 | | Provisions
| | | (6 | ) | | | | | | Liabilities classified as held for sale
| | | (6 | ) |
Discontinued operations: Other
Certain results of other divestments formerly reported as discontinued operations are included with a net gain of EUR 5 million in 2013 (2012: a result of EUR nil million; 2011: a net gain of EUR 27
|
The weighted average expected remaining life of other intangible assets is 8.4 years as of December 31, 2015 (2014: 8.5 years).
The capitalized product development costs and software, for which amortization has not yet commenced, amounted to EUR 491 million as of December 31, 2015 (2014: EUR 450 million).
At December 31, 2015 the carrying amount of customer relationships of Respiratory Care & Sleep Management was EUR 466 million (USD 509 million) with a remaining amortization period of 8.2 years (2014: EUR 468 million, USD 569 million; 9.2 years).
At December 31, 2015 the carrying amount of developed technology related to systems for Volcano (now “Image Guided Technology-Devices”) was EUR 150 million (USD 164 million) with a remaining amortization period of 14.1 years.
Other financial assets
The changes during 2015 were as follows:
Philips Group
Other non-current financial assetsin millions of EUR
2015
| | | | | | | | | | | | | | | | | | | | |
| | | | |
| ‘ | | available-
for-sale
financial
assets | | | loans and
receivables | | | held-to-
maturity
invest-
ments | | | financial
assets at
fair value
through
profit or loss | | | total | |
| | | | |
Balance as of January 1, 2015 | | | 210 | | | | 226 | | | | 2 | | | | 24 | | | | 462 | |
Changes: | | | | | | | | | | | | | | | | | | | | |
Reclassifications | | | (18 | ) | | | (9 | ) | | | | | | | | | | | (27 | ) |
Acquisitions/additions | | | 31 | | | | 35 | | | | — | | | | 5 | | | | 71 | |
Sales/redemptions/reductions | | | (23 | ) | | | (13 | ) | | | | | | | (1 | ) | | | (37 | ) |
Impairment | | | (4 | ) | | | — | | | | — | | | | | | | | (4 | ) |
Transfer from and (to) assets classified as held for sale | | | 1 | | | | (2 | ) | | | | | | | | | | | (1 | ) |
Value adjustments | | | 31 | | | | 1 | | | | | | | | 3 | | | | 35 | |
Translation and exchange differences | | | 4 | | | | (16 | ) | | | — | | | | 2 | | | | (10 | ) |
| | | | |
Balance as of December 31, 2015 | | | 232 | | | | 222 | | | | 2 | | | | 33 | | | | 489 | |
| | | | |
Available-for-sale financial assets
The Company’s investments in available-for-sale financial assets mainly consist of investments in common shares of companies in various industries. The line reclassifications mainly represents an investment transferred to investments in associates due to the fact that the Group is able to exercise significant influence. The line additions/acquisitions includes investments of EUR 21 million which relate to the acquisition of Volcano (refer to note 4 Acquisitions and divestments). The remainder mainly relates to capital calls for certain investment funds. The line sales/redemptions/ reductions includes the sale of one of Volcano’s investments for an amount of EUR 16 million and the sale of certain government bonds for an amount of EUR 6 million.
Loans and receivables
The acquisitions/additions line mainly relates to vendor loans issued to an amount of EUR 17 million in relation to the sale of an equity interest. The current portion of this loan (EUR 8 million) was in the course of 2015 reclassified to Current financial assets. The remainder of the loan will be redeemed in 2017.
168 Annual Report 2015
Group financial statements 12.9
Other assets
Other non-current assets
Other non-current assets in 2015 are comprised of prepaid pension costs of EUR 3 million (2014: EUR 2 million) and prepaid expenses of EUR 65 million (2014: EUR 67 million).
For further details see note 20, Post-employment benefits.
Other current assets
Other current assets include prepaid expenses of EUR 444 million (2014: EUR 411 million).
Inventories
Inventories are summarized as follows:
Philips Group
Inventoriesin millions of EUR
2014 - 2015
| | | | | | | | |
| | | | |
| | | 2014 | | | 2015 | |
| | | | |
Raw materials and supplies | | | 962 | | | | 1,068 | |
Work in process | | | 481 | | | | 475 | |
Finished goods | | | 1,871 | | | | 1,920 | |
| | | | |
Inventories | | | 3,314 | | | | 3,463 | |
| | | | |
The write-down of inventories to net realizable value amounted in 2015 to EUR 170 million (2014: EUR 217 million). The write-down is included in cost of sales.
Receivables
Non-current receivables
Non-current receivables are associated mainly with customer financing in Healthcare and insurance receivables in Innovation, Group & Services. The balance as per December 31, 2015 includes an allowance for doubtful accounts of EUR 1 million (2014: EUR 2 million).
Current receivables
The accounts receivable, net, per sector are as follows:
Philips Group
Accounts receivables-netin millions of EUR
2014 - 2015
| | | | | | | | |
| | | | |
| | | 2014 | | | 2015 | |
| | | | |
Healthcare | | | 2,112 | | | | 2,343 | |
Consumer Lifestyle | | | 791 | | | | 853 | |
Lighting | | | 1,438 | | | | 1,442 | |
Innovation, Group & Services | | | 135 | | | | 89 | |
| | | | |
Accounts receivable-net | | | 4,476 | | | | 4,727 | |
| | | | |
The aging analysis of accounts receivable, net, is set out below:
Philips Group
Aging analysisin millions of EUR
2014 - 2015
| | | | | | | | |
| | | | |
| | | 2014 | | | 2015 | |
| | | | |
current | | | 3,719 | | | | 4,003 | |
overdue 1-30 days | | | 251 | | | | 237 | |
overdue 31-180 days | | | 335 | | | | 337 | |
overdue > 180 days | | | 171 | | | | 150 | |
| | | | |
Accounts receivable-net | | | 4,476 | | | | 4,727 | |
| | | | |
The above net accounts receivable represent current and overdue but not impaired receivables.
The changes in the allowance for doubtful accounts receivable are as follows:
Philips Group
Allowance for doubtful accounts receivable in millions of EUR
2013 - 2015
| | | | | | | | | | | | |
| | | | |
| | | 2013 | | | 2014 | | | 2015 | |
| | | | |
Balance as of January 1 | | | 230 | | | | 204 | | | | 227 | |
Additions charged to expense | | | 29 | | | | 48 | | | | 78 | |
Deductions from allowance1) | | | (33 | ) | | | (46 | ) | | | (25 | ) |
Other movements | | | (22 | ) | | | 21 | | | | 21 | |
| | | | |
Balance as of December 31 | | | 204 | | | | 227 | | | | 301 | |
| | | | |
| 1) | Write-offs for which an allowance was previously provided |
The allowance for doubtful accounts receivable has been primarily established for receivables that are past due.
Included in above balances as per December 31, 2015 are allowances for individually impaired receivables of EUR 272 million (2014: EUR 200 million; 2013: EUR 172 million).
Equity
Common shares
As of December 31, 2015, the issued and fully paid share capital consists of 931,130,387 common shares, each share having a par value of EUR 0.20.
In June 2015, Philips settled a dividend of EUR 0.80 per common share, representing a total value of EUR 730 million. Shareholders could elect for a cash dividend or a share dividend. Approximately 59% of the shareholders elected for a share dividend, resulting in the issuance of 17,671,990 new common shares. The settlement of the cash dividend resulted in a payment of EUR 298 million including tax and service charges.
Annual Report 2015 169
Group financial statements 12.9
The following table shows the movements in the outstanding number of shares:
Philips Group
Outstanding number of sharesin number of shares
2014 - 2015
| | | | | | | | |
| | | | |
| | | 2014 | | | 2015 | |
| | | | |
Balance as of January 1 | | | 913,337,767 | | | | 914,388,869 | |
Dividend distributed | | | 18,811,534 | | | | 17,671,990 | |
Purchase of treasury shares | | | (28,537,921 | ) | | | (20,296,016 | ) |
Re-issuance of treasury shares | | | 10,777,489 | | | | 5,338,743 | |
Balance as of December 31 | | | 914,388,869 | | | | 917,103,586 | |
| | | | |
Preference shares
The ‘Stichting Preferente Aandelen Philips’ has been granted the right to acquire preference shares in the Company. Such right has not been exercised. As a means to protect the Company and its stakeholders against an unsolicited attempt to acquire (de facto) control of the Company, the General Meeting of Shareholders in 1989 adopted amendments to the Company’s articles of association that allow the Board of Management and the Supervisory Board to issue (rights to acquire) preference shares to a third-party. As of December 31, 2015, no preference shares have been issued.
Options, restricted and performance shares
The Company has granted stock options on its common shares and rights to receive common shares in the future (see note 28, Share-based compensation).
Treasury shares
In connection with the Company’s share repurchase programs, shares which have been repurchased and are held in treasury for (i) delivery upon exercise of options, performance and restricted share programs, and (ii) capital reduction purposes, are accounted for as a reduction of shareholders’ equity. Treasury shares are recorded at cost, representing the market price on the acquisition date. When issued, shares are removed from treasury shares on a first-in, first-out (FIFO) basis.
When treasury shares are reissued under the Company’s option plans, the difference between the cost and the cash received is recorded in retained earnings. When treasury shares are reissued under the Company’s share plans, the difference between the market price of the shares issued and the cost is recorded in retained earnings, the market price is recorded in capital in excess of par value.
Dividend withholding tax in connection with the Company’s purchase of treasury shares for capital reduction purposes is recorded in retained earnings.
The following transactions took place resulting from employee option and share plans:
Philips Group
Employee option and share plan transactions
2014 - 2015
| | | | | | | | |
| | | | |
| | | 2014 | | | 2015 | |
| | | | |
Shares acquired | | | 7,254,606 | | | | | |
Average market price | | | EUR 24.53 | | | | | |
Amount paid | | | EUR 178 million | | | | | |
Shares delivered | | | 10,777,489 | | | | 5,338,743 | |
Average market price | | | EUR 30.26 | | | | EUR 30.35 | |
Cost of delivered shares | | | EUR 326 million | | | | EUR 162 million | |
Total shares in treasury at year-end | | | 17,127,544 | | | | 11,788,801 | |
Total cost | | | EUR 470 million | | | | EUR 308 million | |
| | | | |
In 2015, no additional share purchase was needed to cover our share-based compensation plan commitments.
In order to reduce share capital, the following transactions took place:
Philips Group
Share capital transactions
2014 - 2015
| | | | | | | | |
| | | | |
| | | 2014 | | | 2015 | |
| | | | |
Shares acquired | | | 21,283,315 | | | | 20,296,016 | |
Average market price | | | EUR 23.95 | | | | EUR 24.39 | |
Amount paid | | | EUR 510 million | | | | EUR 495 million | |
Reduction of capital stock (shares) | | | 21,837,910 | | | | 21,361,016 | |
Reduction of capital stock (EUR) | | | EUR 533 million | | | | EUR 517 million | |
Total shares in treasury at year-end | | | 3,303,000 | | | | 2,238,000 | |
Total cost | | | EUR 77 million | | | | EUR 55 million | |
| | | | |
Share purchase transactions related to share plans, as well as transactions related to the reduction of share capital involved a cash outflow of EUR 506 million, which includes the impact of taxes. Settlements of share-based compensation plans involved a cash inflow of EUR 81 million.
Dividend distribution
A proposal will be submitted to the 2016 Annual General Meeting of Shareholders to pay a dividend of EUR 0.80 per common share, in cash or shares at the option of the shareholder, from the 2015 net income and retained earnings of the Company.
Limitations in the distribution of shareholders’ equity
As at December 31, 2015, pursuant to Dutch law, certain limitations exist relating to the distribution of shareholders’ equity of EUR 2,274 million. Such limitations relate to common shares of EUR 186 million, as well as to legal reserves required by Dutch law included under retained earnings of EUR 958 million, revaluation reserves of EUR 4 million, unrealized currency translation differences of EUR 1,058 million,
170 Annual Report 2015
Group financial statements12.9
available-for-sale financial assets of EUR 56 million and unrealized gains related to cash flow hedges of EUR 12 million.
The legal reserve required by Dutch law of EUR 958 million included under retained earnings relates to any legal or economic restrictions on the ability of affiliated companies to transfer funds to the parent company in the form of dividends.
As at December 31, 2014, these limitations in distributable amounts were EUR 1,515 million and related to common shares of EUR 187 million, as well as to legal reserves required by Dutch law included under retained earnings of EUR 1,059 million, revaluation reserves of EUR 13 million, available-for-sale financial assets of EUR 27 million and unrealized currency translation gains EUR 229 million. The unrealized losses related to cash flow hedges of EUR 13 million, although qualifying as a legal reserve, reduce the distributable amount by their nature.
Non-controlling interests
Non-controlling interests relate to minority stakes held by third parties in consolidated group companies. The Net income attributable to non-controlling interests amounted to EUR 14 million in 2015 (Net loss attributable to non-controlling interests 2014: EUR 4 million).
The non-controlling interests mainly relate to General Lighting Company (GLC), in which Alliance Holding domiciled in Kingdom of Saudi Arabia holds an ownership percentage of 49%.
Objectives, policies and processes for managing capital
Philips manages capital based upon the measures net operating capital (NOC), net debt and cash flows before financing activities.
The Company believes that an understanding of the Philips Group’s financial condition is enhanced by the disclosure of NOC, as this figure is used by Philips’ management to evaluate the capital efficiency of the Philips Group and its operating sectors. NOC is defined as: total assets excluding assets classified as held for sale less: (a) cash and cash equivalents, (b) deferred tax assets, (c) other non-current financial assets and current financial assets, (d) investments in associates, and after deduction of: (e) long-term provisions and short-term provisions, (f) accounts and notes payable, (g) accrued liabilities, (h) income tax payable, (i) non-current derivative financial liabilities and derivative financial liabilities and (j) other non-current liabilities and other current liabilities.
Net debt is defined as the sum of long- and short-term debt minus cash and cash equivalents. The net debt position as a percentage of the sum of group equity (shareholders’ equity and non-controlling interests) and net debt is presented to express the financial strength of the Company. This measure is widely used by management and investment analysts and is therefore included in the disclosure. Our net debt position is managed in such a way that we expect to retain a strong investment grade credit rating.
Furthermore, the Group’s aim when managing the net debt position is dividend stability and a pay-out ratio of 40% to 50% of continuing net income. Following the intended separation of the Lighting business, the dividend pay-out ratio with respect to future years could be subject to change.
Cash flows before financing activities, being the sum of net cash from operating activities and net cash from investing activities, are presented separately to facilitate the reader’s understanding of the Company’s funding requirements.
Philips Group
Net operating capital compositionin millions of EUR
2013 - 2015
| | | | | | | | | | | | |
| | | | |
| | | 2013 | | | 2014 | | | 2015 | |
| | | | |
Intangible assets | | | 9,766 | | | | 10,526 | | | | 12,216 | |
Property, plant and equipment | | | 2,780 | | | | 2,095 | | | | 2,322 | |
Remaining assets | | | 8,699 | | | | 9,041 | | | | 9,423 | |
Provisions | | | (2,554 | ) | | | (3,445 | ) | | | (3,225 | ) |
Other liabilities | | | (8,453 | ) | | | (9,379 | ) | | | (9,640 | ) |
| | | | |
Net operating capital | | | 10,238 | | | | 8,838 | | | | 11,096 | |
| | | | |
Annual Report 2015 171
Group financial statements 12.9
Philips Group
Composition of net debt to group equityin millions of EUR unless otherwise stated
2013 - 2015
| | | | | | | | | | | | |
| | | | |
| | | 2013 | | | 2014 | | | 2015 | |
| | | | |
Long-term debt | | | 3,309 | | | | 3,712 | | | | 4,095 | |
Short-term debt | | | 592 | | | | 392 | | | | 1,665 | |
| | | | |
Total debt | | | 3,901 | | | | 4,104 | | | | 5,760 | |
Cash and cash equivalents | | | 2,465 | | | | 1,873 | | | | 1,766 | |
| | | | |
Net debt1) | | | 1,436 | | | | 2,231 | | | | 3,994 | |
| | | |
Shareholders’ equity | | | 11,214 | | | | 10,867 | | | | 11,662 | |
Non-controlling interests | | | 13 | | | | 101 | | | | 118 | |
| | | | |
Group equity | | | 11,227 | | | | 10,968 | | | | 11,780 | |
| | | |
Net debt and group equity | | | 12,663 | | | | 13,199 | | | | 15,774 | |
Net debt divided by net debt and group equity (in %) | | | 11 | % | | | 17 | % | | | 25 | % |
Group equity divided by net debt and group equity (in %) | | | 89 | % | | | 83 | % | | | 75 | % |
| | | | |
| 1) | Total debt less cash and cash equivalents |
Philips Group
Composition of cash flowsin millions of EUR
2013 - 2015
| | | | | | | | | | | | |
| | | | |
| | | 2013 | | | 2014 | | | 2015 | |
| | | | |
Cash flows from operating activities | | | 912 | | | | 1,303 | | | | 1,167 | |
Cash flows from investing activities | | | (862 | ) | | | (984 | ) | | | (1,941 | ) |
| | | | |
Cash flows before financing activities | | | 50 | | | | 319 | | | | (774 | ) |
| | | | |
In 2015, total debt increased by EUR 1,656 million. New borrowings of EUR 1,335 million were mainly due to a short-term bridge loan used for the Volcano acquisition while repayments amounted to EUR 104 million. Other changes resulting from consolidation and currency effects led to an increase of EUR 425 million.
Debt
Long-term debt
Philips Group
Long-term debtin millions of EUR unless otherwise stated
2014 - 2015
| | | | | | | | | | | | | | | | | | | | | | | | | | | | | | | | |
| | | | |
| | | (range of)
interest
rates | | | average
rate of
interest | | | amount
outstanding
in 2015 | | | amount
due in
1 year | | | amount
due
after 1
year | | | amount
due
after 5
years | | | average
remaining
term (in
years) | | | amount
outstanding
in 2014 | |
| | | | |
USD bonds | | | 3.8 - 7.8 | % | | | 5.6 | % | | | 3,733 | | | | — | | | | 3,733 | | | | 2,595 | | | | 11.7 | | | | 3,355 | |
Bank borrowings | | | 0.0 - 11.0 | % | | | 1.7 | % | | | 259 | | | | 45 | | | | 214 | | | | 201 | | | | 5.0 | | | | 258 | |
Other long-term debt | | | 0.8 - 7.0 | % | | | 3.8 | % | | | 42 | | | | 39 | | | | 3 | | | | 1 | | | | 1.3 | | | | 52 | |
| | | | |
Institutional financing | | | | | | | | | | | 4,034 | | | | 84 | | | | 3,950 | | | | 2,797 | | | | | | | | 3,665 | |
Finance leases | | | 0 - 16.4 | % | | | 3.2 | % | | | 211 | | | | 66 | | | | 145 | | | | 34 | | | | 3.4 | | | | 195 | |
| | | | |
Long-term debt | | | | | | | 5.2 | % | | | 4,245 | | | | 150 | | | | 4,095 | | | | 2,831 | | | | | | | | 3,860 | |
Corresponding data of previous year | | | | | | | 5.2 | % | | | 3,860 | | | | 148 | | | | 3,712 | | | | 2,578 | | | | | | | | 3,671 | |
| | | | |
172 Annual Report 2015
Group financial statements 12.9
The following amounts of long-term debt as of December 31, 2015, are due in the next five years:
Philips Group
Long-term debts due in the next five yearsin millions of EUR
2014 - 2015
| | | | |
2016 | | | 150 | |
2017 | | | 53 | |
2018 | | | 1,182 | |
2019 | | | 18 | |
2020 | | | 11 | |
| | | | |
Long term debt | | | 1,414 | |
Corresponding amount of previous year | | | 1,282 | |
| | | | |
Philips Group
Unsecured USD Bondsin millions of EUR unless otherwise stated
2014 - 2015
| | | | | | | | | | | | |
| | | | |
| | | effective
rate | | | 2014 | | | 2015 | |
| | | | |
Due 5/15/25; 7 3/4% | | | 7.429 | % | | | 81 | | | | 91 | |
Due 6/01/26; 7 1/5% | | | 6.885 | % | | | 136 | | | | 152 | |
Due 5/15/25; 7 1/8% | | | 6.794 | % | | | 84 | | | | 94 | |
Due 3/11/18; 53/4%1) | | | 6.066 | % | | | 1,028 | | | | 1,144 | |
Due 3/11/38; 6 7/8%1) | | | 7.210 | % | | | 823 | | | | 915 | |
Due 3/15/22; 3 3/4%1) | | | 3.906 | % | | | 823 | | | | 915 | |
Due 3/15/42; 5%1) | | | 5.273 | % | | | 411 | | | | 458 | |
Adjustments2) | | | | | | | (31 | ) | | | (36 | ) |
| | | | |
Unsecured USD Bonds | | | | | | | 3,355 | | | | 3,733 | |
| | | | |
| 1) | The provisions applicable to these bonds, issued in March 2008 and in March 2012, contain a ‘Change of Control Triggering Event’. If the Company would experience such an event with respect to a series of corporate bonds, the Company may be required to offer to purchase the bonds of the series at a purchase price equal to 101% of the principal amount, plus accrued and unpaid interest, if any. |
| 2) | Adjustments relate to issued bond discounts, transaction costs and fair value adjustments for interest rate derivatives |
Secured liabilities
In 2015, none of the long-term and short-term debt was secured by collateral (2014: EUR nil million).
Short-term debt
Philips Group
Short-term debtin millions of EUR
2014 - 2015
| | | | | | | | |
| | | | |
| | | 2014 | | | 2015 | |
| | | | |
Short-term bank borrowings | | | 225 | | | | 1,510 | |
Other short-term loans | | | 19 | | | | 5 | |
Current portion of long-term debt | | | 148 | | | | 150 | |
| | | | |
Short-term debt | | | 392 | | | | 1,665 | |
| | | | |
During 2015, the weighted average interest rate on the bank borrowings was 1.6% (2014: 8.3%) due to the bridging loan with low interest rate used for the Volcano acquisition.
Philips has a USD 2.5 billion Commercial Paper Program and a EUR 1.8 billion revolving credit facility that can be used for general group purposes and as a backstop of its commercial paper program and will mature in February 2018. As of December 31, 2015 Philips did not have any loans outstanding under either facility.
Provisions
Philips Group
Provisionsin millions of EUR
2014 - 2015
| | | | | | | | | | | | | | | | |
| | | | |
| | | 2014 | | | 2015 | |
| | | | |
| | | long-
term | | | short-
term | | | long-
term | | | short-
term | |
| | | | |
Provisions for defined-benefit plans (see note 20) | | | 881 | | | | 52 | | | | 841 | | | | 51 | |
Other post retirement benefits (see note 20) | | | 226 | | | | 16 | | | | 220 | | | | 10 | |
Product warranty | | | 77 | | | | 225 | | | | 67 | | | | 222 | |
Environmental provisions | | | 301 | | | | 59 | | | | 278 | | | | 57 | |
Restructuring-related provisions | | | 150 | | | | 230 | | | | 69 | | | | 228 | |
Litigation provisions | | | 480 | | | | 173 | | | | 518 | | | | 60 | |
Other provisions | | | 385 | | | | 190 | | | | 399 | | | | 205 | |
| | | | |
Provisions | | | 2,500 | | | | 945 | | | | 2,392 | | | | 833 | |
| | | | |
Product warranty
The provision for product warranty reflects the estimated costs of replacement and free-of-charge services that will be incurred by the Company with respect to products sold. The Company expects the provision to be utilized mainly within the next year.
Philips Group
Provision for product warrantyin millions of EUR
2013 - 2015
| | | | | | | | | | | | |
| | | | |
| | | 2013 | | | 2014 | | | 2015 | |
| | | | |
Balance as of January 1 | | | 319 | | | | 266 | | | | 302 | |
Changes: | | | | | | | | | | | | |
Additions | | | 350 | | | | 332 | | | | 327 | |
Utilizations | | | (363 | ) | | | (316 | ) | | | (357 | ) |
Transfer to assets classified as held for sale | | | (24 | ) | | | (3 | ) | | | — | |
Translation differences | | | (16 | ) | | | 23 | | | | 17 | |
| | | | |
Balance as of December 31 | | | 266 | | | | 302 | | | | 289 | |
| | | | |
Environmental provisions
The environmental provisions include accrued losses recorded with respect to environmental remediation in various countries. In the United States, subsidiaries of the Company have been named as potentially responsible parties in state and federal proceedings for the clean-up of certain sites.
Provisions for environmental remediation can change significantly due to the emergence of additional information regarding the extent or nature of the contamination, the need to utilize alternative technologies, actions by regulatory authorities as well as changes in judgments and discount rates.
Annual Report 2015 173
Group financial statements 12.9
Philips Group
Environmental provisionsin millions of EUR
2013 - 2015
| | | | | | | | | | | | |
| | | | |
| | | 2013 | | | 2014 | | | 2015 | |
| | | | |
Balance as of January 1 | | | 375 | | | | 311 | | | | 360 | |
Changes: | | | | | | | | | | | | |
Additions | | | 30 | | | | 29 | | | | 27 | |
Utilizations | | | (21 | ) | | | (23 | ) | | | (24 | ) |
Releases | | | (16 | ) | | | (15 | ) | | | (36 | ) |
Changes in discount rate | | | (40 | ) | | | 30 | | | | (7 | ) |
Accretion | | | 6 | | | | 8 | | | | 7 | |
Purchase price allocation adjustment | | | (15 | ) | | | — | | | | — | |
Changes in consolidation | | | — | | | | 4 | | | | 1 | |
Reclassification | | | — | | | | — | | | | (8 | ) |
Translation differences | | | (8 | ) | | | 16 | | | | 15 | |
| | | | |
Balance as of December 31 | | | 311 | | | | 360 | | | | 335 | |
| | | | |
The release of the provision in 2015 originates from additional insights in relation to factors as the estimated cost of remediation, changes in regulatory requirements and efficiencies in completion of various site work phases.
For more details on the environmental remediation reference is made to note 26, Contingent assets and liabilities.
Approximately half of this provision is expected to be utilized within the next five years. The remaining portion relates to longer-term remediation activities.
Restructuring-related provisions
Philips Group
Restructuring-related provisions in millions of EUR
2015
| | | | | | | | | | | | | | | | | | | | | | | | |
| | | | |
| | | Jan. 1, 2015 | | | additions | | | utilizations | | | releases | | | other
changes1) | | | Dec. 31, 2015 | |
| | | | |
Healthcare | | | 48 | | | | 51 | | | | (38 | ) | | | (11 | ) | | | (1 | ) | | | 49 | |
Consumer Lifestyle | | | 12 | | | | 30 | | | | (6 | ) | | | (3 | ) | | | (1 | ) | | | 32 | |
Lighting | | | 195 | | | | 84 | | | | (106 | ) | | | (25 | ) | | | — | | | | 148 | |
Innovation, Group and Services | | | 125 | | | | 29 | | | | (39 | ) | | | (49 | ) | | | 2 | | | | 68 | |
| | | | |
Philips Group | | | 380 | | | | 194 | | | | (189 | ) | | | (88 | ) | | | — | | | | 297 | |
| | | | |
| 1) | Other changes primarily relate to translation differences and assets classified as held for sale reclassifications |
The most significant projects in 2015
In 2015, restructuring projects at Healthcare mainly took place in the US and France.
Consumer Lifestyle restructuring projects were mainly in Italy.
The most significant restructuring projects were mainly related to the industrial footprint rationalization projects in Lighting.
Restructuring projects at Lighting centered on the conventional lamps industry and Professional Lighting Solutions, the largest of which took place in France and Indonesia.
Innovation, Group & Services restructuring projects were mainly related to Group and Regional organizations and centered primarily in France and the Netherlands. The release mainly results from unforeseen changes to the IT restructuring plan in 2015.
The movements in the provisions and liabilities for restructuring in 2014 by Sector are presented as follows:
Philips Group
Restructuring-related provisions in millions of EUR
2014
| | | | | | | | | | | | | | | | | | | | | | | | |
| | | | |
| | | Jan. 1,
2014 | | | addi-
tions | | | utilizations | | | releases | | | other
changes1) | | | Dec. 31,
2014 | |
| | | | |
Healthcare | | | 17 | | | | 67 | | | | (27 | ) | | | (9 | ) | | | — | | | | 48 | |
Consumer Lifestyle | | | 21 | | | | 7 | | | | (10 | ) | | | (7 | ) | | | 1 | | | | 12 | |
Lighting | | | 130 | | | | 180 | | | | (90 | ) | | | (16 | ) | | | (9 | ) | | | 195 | |
Innovation, Group and Services | | | 35 | | | | 110 | | | | (15 | ) | | | (5 | ) | | | — | | | | 125 | |
| | | | |
Philips Group | | | 203 | | | | 364 | | | | (142 | ) | | | (37 | ) | | | (8 | ) | | | 380 | |
| | | | |
| 1) | On July 1, 2013, Philips announced to transfer certain assets and cash proceeds from the sale of certain assets to the Dutch pension plan. In total EUR 94 million of related assets are qualified as held for sale as of December 31, 2013. EUR 92 million relates to other non-current financial assets. For more details see note 30, Post-employment benefits.
Assets and liabilities directly associated with assets held for saleOther changes primarily relate to property, planttranslation differences and equipment for an amount of EUR 13 million (December 31, 2012 EUR 1 million) and business divestments of EUR nil million at December 31, 2013 (December 31, 2012 EUR 15 million).
In 2013, the Company divested two Healthcare businesses formerly reported under Assets classified as held for sale. For more details see note 9, Acquisitions and divestments.
On March 29, 2012, Philips announced the completion of the High Tech Campus transaction with proceeds of EUR 425 million, consisting of a EUR 373 million cash transaction and an amount of EUR 52 million to be received after the deal. The gain from the transaction, after deducting expenses related to other real estate efficiency measures which are part of the EUR 800 million cost reduction program announced in 2011, of EUR 65 million, of which EUR 37 million was recognized in the first quarter of 2012 in income from operations while EUR 28 million was deferred to future periods and is recognized periodically starting as of April 2012. The deferral of the gain relates to the finance lease element in the sale and lease-back arrangement part of the deal.
In 2012, Philips divested several industrial sites in sector Lighting, the Speech Processing business in sector Consumer Lifestyle and a minor service activity in sector Healthcare. The transactions of the industrial sites resulted in a loss of EUR 95 million, consisting of contributed assets, which were not fully recovered leading to a EUR 14 million impairment on property, plant and equipment and EUR 81 million loss reported in other business expense as result on disposal of businesses. As part of these divestments onerous supply agreements were signed, which amounted to EUR 60 million at December 31, 2012. The speech Processing business resulted in a gain of EUR 21 million gain reported in other business income as result on disposal of business.
Annual Report 2013 181
 11 Group financial statements 11.9 - 11.9 11 Group financial statements 11.9 - 11.9
Earnings per share
Earnings per share
| | | | | | | | | | | | | | | | | | | | | | | | | | | | | | | 2011 | | | | | | 2012 | | | | | | 2013 | | Income (loss) from continuing operations | | | | | | | (1,046 | ) | | | | | | | (77 | ) | | | | | | | 1,170 | | Income attributable to non-controlling interest | | | | | | | 4 | | | | | | | | 5 | | | | | | | | 3 | | | | | | | Income (loss) from continuing operations attributable to shareholders | | | | | | | (1,050 | ) | | | | | | | (82 | ) | | | | | | | 1,167 | | | | | | | | | Income (loss) from discontinued operations | | | | | | | (410 | ) | | | | | | | 47 | | | | | | | | 2 | | | | | | | | | Net income (loss) attributable to shareholders | | | | | | | (1,460 | ) | | | | | | | (35 | ) | | | | | | | 1,169 | | | | | | | | | Weighted average number of common shares outstanding (after deduction of treasury shares) during the year | | | | | | | 952,808,965 | 1) | | | | | | | 922,101,005 | 1) | | | | | | | 911,071,970 | | Plus incremental shares from assumed conversions of: | | | | | | | | | | | | | | | | | | | | | | | | | Options and restricted share rights | | | 4,309,777 | | | | | | | | 5,014,991 | | | | | | | | 10,896,583 | | | | | | Convertible debentures | | | 173,890 | | | | | | | | 106,204 | | | | | | | | 103,899 | | | | | | Dilutive potential common shares | | | | | | | 4,483,667 | | | | | | | | 5,121,195 | | | | | | | | 11,000,482 | | Adjusted weighted average number of shares (after deduction of treasury shares) during the year | | | | | | | 957,292,632 | 1) | | | | | | | 927,222,200 | 1) | | | | | | | 922,072,452 | | | | | | | | | | Basic earnings per common share in euro 2) | | | | | | | | | | | | | | | | | | | | | | | | | Income (loss) from continuing operations | | | | | | | (1.10 | ) | | | | | | | (0.08 | ) | | | | | | | 1.28 | | Income (loss) from discontinued operations | | | | | | | (0.43 | ) | | | | | | | 0.05 | | | | | | | | — | | Income (loss) from continuing operations attributable to shareholders | | | | | | | (1.10 | ) | | | | | | | (0.09 | ) | | | | | | | 1.28 | | Net income (loss) attributable to shareholders | | | | | | | (1.53 | ) | | | | | | | (0.04 | ) | | | | | | | 1.28 | | | | | | | | | | Diluted earnings per common share in euro2,3,4) | | | | | | | | | | | | | | | | | | | | | | | | | Income (loss) from continuing operations | | | | | | | (1.10 | ) | | | | | | | (0.08 | ) | | | | | | | 1.27 | | Income (loss) from discontinued operations | | | | | | | (0.43 | ) | | | | | | | 0.05 | | | | | | | | — | | Income (loss) from continuing operations attributable to shareholders | | | | | | | (1.10 | ) | | | | | | | (0.09 | ) | | | | | | | 1.27 | | Net income (loss) attributable to shareholders | | | | | | | (1.53 | ) | | | | | | | (0.04 | ) | | | | | | | 1.27 | | | | | | | | | Dividend distributed per common share in euros | | | | | | | 0.75 | | | | | | | | 0.75 | | | | | | | | 0.75 | |
1) | Adjusted to make previous years comparable for the bonus shares (273 thousand) issued in May 2013transfers between sectors
|
2) | The effect on income of convertible debentures affecting earnings per share is considered immaterialThe most significant projects in 2014 In 2014, restructuring projects at Healthcare mainly took place in the US and the Netherlands. Consumer Lifestyle restructuring projects were mainly in the Netherlands. The most significant restructuring projects related to Lighting and IG&S and were driven by industrial footprint rationalization and the Accelerate! transformation program. Restructuring projects at Lighting centered on Light Sources & Electronics and Professional Lighting Solutions, the largest of which took place in Belgium, the Netherlands and France. Innovation, Group & Services restructuring projects mainly were related to IT and group and country overheads and centered primarily in the Netherlands, US and Belgium. The Company expects the provision will be utilized mainly within the next year. 174 Annual Report 2015
Group financial statements 12.9
The movements in the provisions and liabilities for restructuring in 2013 are presented by sector as follows: Philips Group Restructuring-related provisions in millions of EUR 2013 | | | | | | | | | | | | | | | | | | | | | | | | | | | | | | | | | Jan. 1,
2013 | | | addi-
tions | | | utilizations | | | releases | | | other
changes1) | | | Dec. 31,
2013 | | | | | | | Healthcare | | | 77 | | | | 14 | | | | (50 | ) | | | (23 | ) | | | (1 | ) | | | 17 | | Consumer Lifestyle | | | 48 | | | | 11 | | | | (27 | ) | | | (10 | ) | | | (1 | ) | | | 21 | | Lighting | | | 198 | | | | 64 | | | | (110 | ) | | | (19 | ) | | | (3 | ) | | | 130 | | Innovation, Group and Services | | | 62 | | | | 16 | | | | (30 | ) | | | (15 | ) | | | 2 | | | | 35 | | | | | | | Philips Group | | | 385 | | | | 105 | | | | (217 | ) | | | (67 | ) | | | (3 | ) | | | 203 | | | | | | |
| 1) | Other changes primarily relate to translation differences and transfers between sectors |
3) | In 2013, 2012 and 2011, respectively 14 million, 36 million and 37 million securities that could potentially dilute basic EPS were not included in the computation of dilutive EPS because the effect would have been antidilutive for the periods presented
|
4) | The Dilutive potential common shares are not taken into account in the periods for which there is a loss, as the effect would be antidilutive
|
Acquisitions and divestments
2013
There were four acquisitions in 2013. These acquisitions involved an aggregated purchase price of EUR 10 million. Measured on a yearly basis, the aggregated impact of these acquisitions on Group Sales, Income from operations, Net income and Net income per common share (on a fully diluted basis) are not material in respect of IFRS 3 disclosure requirements.
Philips completed five divestments of business activities during 2013, mainly related to certain Healthcare service activities. The transactions involved an aggregate consideration of EUR 99 million and are therefore deemed immaterial in respect of IFRS 3 disclosure requirements.
2012
During 2012, Philips entered into one acquisition. On January 9, 2012 Philips acquired (in)directly 99.93% of the outstanding shares of Industrias Derivadas del Aluminio, S.L. (Indal). This acquisition involved a cash consideration of EUR 210 million and was accounted for using the acquisition method. By the end of July 2012, Indal was fully owned by Philips.
Philips completed in the first quarter of 2012 the divestment of the Television business. Furthermore there were several divestments of business activities during 2012, which comprised the divestment of certain Lighting manufacturing activities, Speech Processing activities and certain Healthcare service activities. These transactions involved an aggregated consideration of EUR 49 million and are therefore deemed immaterial in respect of IFRS 3 disclosure requirements.
On January 26, 2012, Philips agreed to extend its partnership with Sara Lee Corp (Sara Lee) to drive growth in the global coffee market. Under a new exclusive partnership framework, which will run through to 2020, Philips will be the exclusive Senseo consumer appliance manufacturer and distributor for the duration of the agreement. As part of the agreement, Philips transferred its 50% ownership right in the Senseo trademark to Sara Lee. Under the terms of the agreement, Sara Lee paid Philips a total consideration of EUR 170 million. The consideration was recognized in
182 Annual Report 2013
11 Group financial statements 11.9 - 11.9
Other business income for an amount of EUR 160 million. The remainder was included in various line items of the Consolidated statements of income (EUR 8 million) or deducted from the book value of Property, plant and equipment (EUR 2 million).
2011
During 2011, Philips entered into six acquisitions. These acquisitions involved an aggregated purchase price of EUR 498 million and have been accounted for using the acquisition method. Measured on an annualized basis, the aggregated impact of the six acquisitions on group Sales, Income from operations, Net income and Net income per common share (on a fully diluted basis) is not material in respect of IFRS 3 disclosure requirements.
The divestments in 2011 involved an aggregated consideration of EUR 57 million and were therefore deemed immaterial in respect of IFRS 3 disclosure requirements.
Annual Report 2013 183
11 Group financial statements 11.9 - 11.9
Property, plant and equipment
| | | | | | | | | | | | | | | | | | | | | | | | land and buildings | | | machinery and
installations | | | other equipment | | | prepayments and
construction in
progress | | | total | | Balance as of January 1, 2013: | | | | | | | | | | | | | | | | | | | | | Cost | | | 1,924 | | | | 4,004 | | | | 1,658 | | | | 294 | | | | 7,880 | | Accumulated depreciation | | | (835 | ) | | | (2,851 | ) | | | (1,235 | ) | | | — | | | | (4,921 | ) | | | | | | Book value | | | 1,089 | | | | 1,153 | | | | 423 | | | | 294 | | | | 2,959 | | Change in book value: | | | | | | | | | | | | | | | | | | | | | Capital expenditures | | | 8 | | | | 88 | | | | 61 | | | | 461 | | | | 618 | | Assets available for use | | | 79 | | | | 244 | | | | 160 | | | | (483 | ) | | | — | | Acquisitions | | | — | | | | — | | | | — | | | | — | | | | — | | Disposals and sales | | | (1 | ) | | | (14 | ) | | | (7 | ) | | | (4 | ) | | | (26 | ) | Depreciation | | | (87 | ) | | | (321 | ) | | | (163 | ) | | | — | | | | (571 | ) | Impairments | | | (15 | ) | | | (26 | ) | | | (22 | ) | | | — | | | | (63 | ) | Transfer to assets classified as held for sale | | | (17 | ) | | | (4 | ) | | | (4 | ) | | | — | | | | (25 | ) | Translation differences | | | (29 | ) | | | (57 | ) | | | (17 | ) | | | (9 | ) | | | (112 | ) | | | | | | Total changes | | | (62 | ) | | | (90 | ) | | | 8 | | | | (35 | ) | | | (179 | ) | Balance as of December 31, 2013: | | | | | | | | | | | | | | | | | | | | | Cost | | | 1,899 | | | | 3,948 | | | | 1,586 | | | | 259 | | | | 7,692 | | Accumulated depreciation | | | (872 | ) | | | (2,885 | ) | | | (1,155 | ) | | | — | | | | (4,912 | ) | | | | | | Book value | | | 1,027 | | | | 1,063 | | | | 431 | | | | 259 | | | | 2,780 | |
| | | | | | | | | | | | | | | | | | | | | | | | land and
buildings | | | machinery
and
installations | | | other
equipment | | | prepayments
and
construction
in progress | | | total | | Balance as of January 1, 2012: | | | | | | | | | | | | | | | | | | | | | Cost | | | 1,981 | | | | 3,914 | | | | 1,552 | | | | 365 | | | | 7,812 | | Accumulated depreciation | | | (895 | ) | | | (2,762 | ) | | | (1,141 | ) | | | — | | | | (4,798 | ) | | | | | | Book value | | | 1,086 | | | | 1,152 | | | | 411 | | | | 365 | | | | 3,014 | | Change in book value: | | | | | | | | | | | | | | | | | | | | | Capital expenditures | | | 95 | | | | 114 | | | | 98 | | | | 497 | | | | 804 | | Assets available for use | | | 125 | | | | 312 | | | | 116 | | | | (553 | ) | | | — | | Acquisitions | | | 1 | | | | 4 | | | | 12 | | | | — | | | | 17 | | Disposals and sales | | | (64 | ) | | | (8 | ) | | | (10 | ) | | | (10 | ) | | | (92 | ) | Depreciation | | | (77 | ) | | | (358 | ) | | | (188 | ) | | | — | | | | (623 | ) | Impairments | | | (13 | ) | | | (33 | ) | | | (12 | ) | | | (1 | ) | | | (59 | ) | Transfer to assets classified as held for sale | | | (23 | ) | | | (2 | ) | | | (1 | ) | | | 1 | | | | (25 | ) | Reclassifications | | | (29 | ) | | | — | | | | — | | | | — | | | | (29 | ) | Translation differences | | | (12 | ) | | | (28 | ) | | | (3 | ) | | | (5 | ) | | | (48 | ) | | | | | | Total changes | | | 3 | | | | 1 | | | | 12 | | | | (71 | ) | | | (55 | ) | Balance as of December 31, 2012: | | | | | | | | | | | | | | | | | | | | | Cost | | | 1,924 | | | | 4,004 | | | | 1,658 | | | | 294 | | | | 7,880 | | Accumulated depreciation | | | (835 | ) | | | (2,851 | ) | | | (1,235 | ) | | | — | | | | (4,921 | ) | | | | | | Book value | | | 1,089 | | | | 1,153 | | | | 423 | | | | 294 | | | | 2,959 | |
Land with a book value of EUR 133 million at December 31, 2013 (2012: EUR 152 million) is not depreciated.
Property, plant and equipment includes lease assets with a book value of EUR 187 million at December 31, 2013 (2012: EUR 248 million).
The expected useful lives of property, plant and equipment are as follows:
The most significant projects in 2013 In 2013, In Healthcare, the largest projects were undertaken in Customer Services, Home Healthcare Solutions and Imaging Systems in the United States, Italy and the Netherlands to reduce the operating costs and simplify the organization. Consumer Lifestyle restructuring charges were mainly related to Personal Care (primarily in the Netherlands and Austria) and Coffee (mainly Italy). The most significant restructuring projects related to Lighting and were driven by the industrial footprint rationalization. Restructuring projects at Lighting centered on Luminaires businesses and Light Sources & Electronics, the largest of which took place in the United States, France and Belgium. Innovation, Group & Services restructuring projects mainly focused on the Financial Operations Service Unit, primarily in Italy, France and the United States. Litigation provisions The Company and certain of its group companies and former group companies are involved as a party in legal proceedings, including regulatory and other governmental proceedings. Philips Group Litigation provisions in millions of EUR 2013 - 2015 | | | Buildings
| | from 5 to 50 years | Machinery and installations
| | from 3 to 20 years | Other equipment
| | from 1 to 10 years |
184 Annual Report 2013
11 Group financial statements 11.9 - 11.9 | | | | | | | | | | | | | | | | | | | | | 2013 | | | 2014 | | | 2015 | | | | | | | Balance as of January 1 | | | 238 | | | | 236 | | | | 653 | | Changes: | | | | | | | | | | | | | Additions | | | 48 | | | | 563 | | | | 66 | | Utilizations | | | (17 | ) | | | (32 | ) | | | (25 | ) | Transfer to other current liabilities | | | — | | | | (138 | ) | | | (161 | ) | Changes in discount rate | | | — | | | | — | | | | 8 | | Releases | | | (15 | ) | | | (23 | ) | | | (25 | ) | Accretion | | | — | | | | 6 | | | | 12 | | Translation differences | | | (18 | ) | | | 41 | | | | 50 | | | | | | | Balance as of December 31 | | | 236 | | | | 653 | | | | 578 | | | | | | |
2015
Goodwill
The changes in 2012 and 2013 were as follows:
| | | | | | | | | | | | 2012 | | | 2013 | | Balance as of January 1: | | | | | | | | | Cost | | | 9,224 | | | | 9,119 | | Amortization and impairments | | | (2,208 | ) | | | (2,171 | ) | | | | | | Book value | | | 7,016 | | | | 6,948 | | | | | Changes in book value: | | | | | | | | | Acquisitions | | | 100 | | | | 4 | | Purchase price allocation adjustment | | | (2 | ) | | | (4 | ) | Impairments | | | — | | | | (26 | ) | Divestments and transfers to assets classified as held for sale | | | (6 | ) | | | (55 | ) | Translation differences | | | (160 | ) | | | (363 | ) | | | | Balance as of December 31: | | | | | | | | | Cost | | | 9,119 | | | | 8,596 | | Amortization and impairments | | | (2,171 | ) | | | (2,092 | ) | | | | | | Book value | | | 6,948 | | | | 6,504 | |
The movement of EUR 55 million in Divestments and transfers to assets classified as held for sale mainly relate to divestments in the Healthcare sector.
Acquisitions in 2012 include goodwill related to the acquisition of Indal for EUR 100 million. In addition, goodwill changed due to the finalization of purchase price accounting related to acquisitions in the prior year.
For impairment testing, goodwill is allocated to (groups of) cash- generating units (typically one level below operating sector level), which represents the lowest level at which the goodwill is monitored internally for management purposes.
Goodwill allocated to the cash-generating units Respiratory Care & Sleep Management, Imaging Systems, Patient Care & Clinical Informatics and Professional Lighting Solutions is considered to be significant in comparison to the total book value of goodwill for the Group at December 31, 2013. The amounts allocated are presented below:
| | | | | | | | | | | | 2012 | | | 2013 | | Respiratory Care & Sleep Management | | | 1,706 | | | | 1,544 | | Imaging Systems | | | 1,482 | | | | 1,414 | | Patient Care & Clinical Informatics | | | 1,331 | | | | 1,271 | | Professional Lighting Solutions | | | 1,337 | | | | 1,266 | |
The basis of the recoverable amount used in the annual (performed in the second quarter) and trigger-based impairment tests for the units disclosed in this note is the value in use. Key assumptions used in the impairment tests for the units were sales growth rates, income from operations and the rates used for discounting the projected cash flows. These cash flow projections were determined using management’s internal forecasts that cover an initial period from 2013 to 2017 that matches the period used for our strategic process. Projections were extrapolated with stable or declining growth rates for a period of 5 years, after which a terminal value was calculated. For terminal value calculation, growth rates were capped at a historical long-term average growth rate.
The sales growth rates and margins used to estimate cash flows are based on past performance, external market growth assumptions and industry long-term growth averages.
Income from operations in all units is expected to increase over the projection period as a result of volume growth and cost efficiencies.
Cash flow projections of Respiratory Care & Sleep Management, Imaging Systems, Patient Care & Clinical Informatics and Professional Lighting Solutions for 2013 were based on the following key assumptions (based on the annual impairment test performed in the second quarter):
in %
| | | | | | | | | | | | | | | | | | | | compound sales growth rate1) | | | | | | | | initial
forecast
period | | | extra-
polation
period2) | | | used to
calculate
terminal
value | | | pre-tax
discount
rates | | Respiratory Care & Sleep Management | | | 4.9 | | | | 3.7 | | | | 2.7 | | | | 11.3 | | Imaging Systems | | | 3.9 | | | | 3.4 | | | | 2.7 | | | | 12.4 | | Patient Care & Clinical Informatics | | | 4.1 | | | | 3.5 | | | | 2.7 | | | | 13.2 | | Professional Lighting Solutions | | | 7.4 | | | | 5.4 | | | | 2.7 | | | | 12.8 | |
1) | Compound sales growth rate is the annualized steady growth rate over the forecast period
|
2) | Also referred to later in the text as compound long-term sales growth rate
|
The assumptions used for the 2012 cash flow projections were as follows:
in %
| | | | | | | | | | | | | | | | | | | | compound sales growth rate1) | | | | | | | | initial
forecast
period | | | extra-
polation
period2) | | | used to
calculate
terminal
value | | | pre-tax
discount
rates | | Respiratory Care & Sleep Management | | | 8.0 | | | | 5.8 | | | | 2.7 | | | | 11.2 | | Imaging Systems | | | 3.4 | | | | 2.9 | | | | 2.7 | | | | 12.8 | | Patient Care & Clinical Informatics | | | 6.5 | | | | 4.1 | | | | 2.7 | | | | 13.2 | | Professional Lighting Solutions | | | 6.6 | | | | 5.3 | | | | 2.7 | | | | 13.0 | |
The majority of the ending balance as of December 31, 2015 relates to the patent infringement lawsuit by Masimo Corporation as mentioned in the 2014 paragraph. 1) | Compound sales growth rate is the annualized steady growth rate over the forecast period
|
2) | Also referred to later in the text as compound long-term sales growth rate
|
Among the mentioned units, Respiratory Care & Sleep Management and Professional Lighting Solutions have the highest amount of goodwill and the lowest excess of the recoverable amount over the carrying amount. The headroom of Respiratory Care & Sleep Management was estimated at EUR 660 million, the headroom of Professional Lighting Solutions at EUR 670 million. The increase in the headroom of Professional Lighting Solutions compared to the annual impairment test 2012, in which the headroom approximated the carrying value, is mainly explained by increased forecasted profitability assumptions driven by gross margin improvements. The following changes could, individually, cause the value in use to fall to the level of the carrying value:
| | | | | | | | | | | | | | | | increase in
pre-tax
discount rate,
basis points | | | decrease in
long-term
growth rate,
basis points | | | decrease in
terminal value
amount, % | | Respiratory Care & Sleep Management | | | 290 | | | | 550 | | | | 39 | | Professional Lighting Solutions | | | 290 | | | | 520 | | | | 39 | |
Annual Report 2013 185
11 Group financial statements 11.9 - 11.9
The results of the annual impairment test of Imaging Systems and Patient Care & Clinical Informatics have indicated that a reasonably possible change in key assumptions would not cause the value in use to fall to the level of the carrying value.
Impairment charge 2013
In the fourth quarter, the updated impairment test for Consumer Luminaires resulted in EUR 26 million impairment. This was mainly a consequence of reduced growth rate due to slower anticipated recovery of certain markets and introduction delays of new product ranges. The pre-tax discount rate applied to the most recent cash flow projection is 13.5%. The pre-tax discount rate applied in the previous projection was 13.4%. Compared to the previous impairment test there has been no change in the organization structure which impacts how goodwill is allocated to this cash-generating unit.
After the impairment charge mentioned above the estimated recoverable amount for this cash-generating unit approximates the carrying value. Consequently, any adverse change in key assumptions would, individually, cause a further impairment to be recognized. Remaining goodwill allocated to Consumer Luminaires at December 31, 2013 amounts to EUR 106 million.
Additional information 2013
In addition, other units, are sensitive to fluctuations in the assumptions as set out above.
Based on the annual impairment test, it was noted that the headroom for the cash-generating unit Home Monitoring was EUR 76 million. An increase of 280 points in the pre-tax discounting rate, a 560 basis points decline in the compound long-term sales growth rate or a 38% decrease in terminal value would cause its value in use to fall to the level of its carrying value. The goodwill allocated to Home Monitoring at December 31, 2013 amounts to EUR 35 million.
Based on the annual impairment test, it was noted that with regard to the headroom for the cash-generating unit Lumileds, the estimated recoverable amount approximates the carrying value of the cash- generating unit. Consequently, any adverse change in key assumptions would, individually, cause an impairment to be recognized. The goodwill allocated to Lumileds at December 31, 2013 amounts to EUR 127 million.
Please refer to note 2, Information by sector and main country for a specification of goodwill by sector.
Intangible assets excluding goodwill
The changes were as follows:
| | | | | | | | | | | | | | | | | | | | other
intangible
assets | | | product
development | | | software | | | total | | Balance as of January 1, 2013: | | | | | | | | | | | | | | | | | Cost | | | 5,868 | | | | 1,584 | | | | 369 | | | | 7,821 | | Amortization/impairments | | | (2,972 | ) | | | (817 | ) | | | (301 | ) | | | (4,090 | ) | | | | | | Book value | | | 2,896 | | | | 767 | | | | 68 | | | | 3,731 | | | | | | | Changes in book value: | | | | | | | | | | | | | | | | | Additions | | | 19 | | | | 357 | | | | 30 | | | | 406 | | Acquisitions | | | 15 | | | | — | | | | — | | | | 15 | | Amortization | | | (387 | ) | | | (213 | ) | | | (37 | ) | | | (637 | ) | Impairments | | | (50 | ) | | | (33 | ) | | | (2 | ) | | | (85 | ) | Reversal of impairment | | | 5 | | | | — | | | | — | | | | 5 | | Divestments and transfers to assets classified as held for sale | | | (28 | ) | | | (9 | ) | | | (1 | ) | | | (38 | ) | Translation differences | | | (118 | ) | | | (25 | ) | | | (1 | ) | | | (144 | ) | Other | | | 8 | | | | 1 | | | | — | | | | 9 | | | | | | | Total changes | | | (536 | ) | | | 78 | | | | (11 | ) | | | (469 | ) | | | | | | Balance as of December 31, 2013: | | | | | | | | | | | | | | | | | Cost | | | 5,533 | | | | 1,761 | | | | 344 | | | | 7,638 | | Amortization/impairments | | | (3,173 | ) | | | (916 | ) | | | (287 | ) | | | (4,376 | ) | | | | | | Book Value | | | 2,360 | | | | 845 | | | | 57 | | | | 3,262 | |
186 Annual Report 2013
11 Group financial statements 11.9 - 11.9
| | | | | | | | | | | | | | | | | | | | other
intangible
assets | | | product
development | | | software | | | total | | Balance as of January 1, 2012: | | | | | | | | | | | | | | | | | Cost | | | 5,857 | | | | 1,437 | | | | 369 | | | | 7,663 | | Amortization/impairments | | | (2,593 | ) | | | (793 | ) | | | (281 | ) | | | (3,667 | ) | | | | | | Book value | | | 3,264 | | | | 644 | | | | 88 | | | | 3,996 | | Changes in book value: | | | | | | | | | | | | | | | | | Additions | | | 11 | | | | 347 | | | | 29 | | | | 387 | | Acquisitions and purchase price allocation adjustments | | | 137 | | | | — | | | | — | | | | 137 | | Amortization | | | (455 | ) | | | (190 | ) | | | (44 | ) | | | (689 | ) | Impairments | | | (17 | ) | | | (30 | ) | | | (2 | ) | | | (49 | ) | Translation differences | | | (42 | ) | | | (10 | ) | | | — | | | | (52 | ) | Other | | | (2 | ) | | | 6 | | | | (3 | ) | | | 1 | | | | | | | Total changes | | | (368 | ) | | | 123 | | | | (20 | ) | | | (265 | ) | Balance as of December 31, 2012: | | | | | | | | | | | | | | | | | Cost | | | 5,868 | | | | 1,584 | | | | 369 | | | | 7,821 | | Amortization/impairments | | | (2,972 | ) | | | (817 | ) | | | (301 | ) | | | (4,090 | ) | | | | | | Book value | | | 2,896 | | | | 767 | | | | 68 | | | | 3,731 | |
The additions for 2013 contain internally generated assets of EUR 357 million and EUR 30 million for product development and software respectively (2012: EUR 347 million, EUR 29 million).
The impairment charges in 2013 include an impairment charge of EUR 24 million in Imaging Systems, which relate to capitalized product development for EUR 7 million and other intangibles for EUR 17 million. The impairment charge is based on a trigger-based test on a specific business unit in Imaging Systems. A change in the business outlook coming from a slower than expected sales ramp up resulted in the mentioned impairment charge. The basis of the recoverable amount used in this test is the value in use and a pre-tax discount rate of 9,6% is applied. After the impairment charge the carrying value of the related intangible assets is zero.
The impairment charges in 2013 includes an impairment charge of EUR 32 million for customer relationships in Consumer Luminaires. The charge is based on a trigger-based test on specific mature markets following the initiated turnaround plan, reconsidering product ranges and growth rates. The basis of the recoverable amount used in this test is the value in use and a pre-tax discount rate of 11.4% is applied. After the impairment charge the carrying value of the related intangible assets is zero.
The acquisitions through business combinations in 2012 mainly consist of the acquired intangible assets of Indal for EUR 134 million.
The amortization of intangible assets is specified in note 3, Income from operations.
The impairment charges in 2012 for other intangibles mainly relates to brand names in Professional Lighting Solutions. As part of the rationalization of the go-to-market model in Professional Lighting Solutions, the Company decided to discontinue the use of several brands which resulted in the mentioned impairment charge. The impairment of product development of EUR 30 million relates to various projects in all three operating sectors.
Other intangible assets consist of:
| | | | | | | | | | | | | | | | | | | | December 31, 2012 | | | December 31, 2013 | | | | | gross | | | amortization/
impairments | | | gross | | | amortization/
impairments | | Brand names | | | 966 | | | | (374 | ) | | | 909 | | | | (424 | ) | Customer relationships | | | 3,045 | | | | (1,318 | ) | | | 2,856 | | | | (1,447 | ) | Technology | | | 1,759 | | | | (1,202 | ) | | | 1,678 | | | | (1,226 | ) | Other | | | 98 | | | | (78 | ) | | | 90 | | | | (76 | ) | | | | | | | | | 5,868 | | | | (2,972 | ) | | | 5,533 | | | | (3,173 | ) |
The estimated amortization expense for other intangible assets for each of the next five years is:
| | | | | 2014 | | | 310 | | 2015 | | | 283 | | 2016 | | | 253 | | 2017 | | | 225 | | 2018 | | | 217 | |
The expected useful lives of the intangible assets excluding goodwill are as follows:
The majority of the transfers to other current liabilities relates to certain parts of the Cathode Ray Tube (CRT) antitrust litigation as mentioned in note 26, Contingent assets and liabilities for which the Company was able to reach a settlement. These settlements were subsequently paid out in 2015. The movement of EUR 50 million in translation differences is mainly explained by the increase of the USD/EUR rate which impacted the litigation provisions nominated in USD. The Company expects to use the provisions within the next three years. For more details reference is made to note 26, Contingent assets and liabilities. 2014 The additions and ending balance in 2014 include the patent infringement lawsuit by Masimo Corporation in the United States District Court for the District of Delaware against Philips in which Masimo was awarded a compensation of USD 467 million (EUR 366 million) in 2014. The majority of the remaining additions and remaining ending balance as of December 31, 2014 relates to certain parts of the CRT antitrust litigation for which the company concluded it was able to make a reliable estimate of the cash outflow or was able to reach settlement. The transfer to other current liabilities in the schedule above relates to certain parts of the CRT antitrust litigation where the Company was able to reach settlement. Settlements in excess of provisions recognized previously were recognized as an increase of other current liabilities as disclosed in note 22, Other liabilities. These settlements were subsequently paid out in 2015. As a result of the aforementioned changes in estimates for the CRT antitrust litigation, the results of other business expenses of EUR 271 million in 2014 as included in note 6, Income from operations mainly relate to certain parts of the CRT antitrust litigation for which the company concluded it was able to make a reliable estimate of the cash outflow or where the Company was able to reach settlement. For more details reference is made to note 26, Contingent assets and liabilities. | | | | | Brand names
| | | 2-20 years | | Customer relationships
| | | 2-25 years | | Technology
| | | 3-20 years | | Other
| | | 1-8 years | | Software
| | | 1-3 years | | Product development
| | | 3-5 years | |
The expected weighted average remaining life of other intangible assets is 10.3 years as of December 31, 2013 (2012: 11.2 years).
The capitalized product development costs for which amortization has not yet commenced amounted to EUR 356 million (2012: EUR 361 million).
At December 31, 2013 the carrying amount of customer relationships of Respiratory Care & Sleep Management was EUR 459 million with a remaining amortization period of 10.2 years.
Non-current receivables
Non-current receivables include receivables with a remaining term of more than one year.
Annual Report 2013 187
11 Group financial statements 11.9 - 11.9Annual Report 2015 175
Group financial statements 12.9
Other non-current financial assets
The changes during 2013 were as follows:
| | | | | | | | | | | | | | | | | | | | | | | | available-
for-sale
financial
assets | | | loans and
receivables | | | held-to-
maturity
invest-
ments | | | financial
assets at
fair
value
through
profit or
loss | | | total | | Balance as of January 1, 2013 | | | 232 | | | | 267 | | | | 3 | | | | 47 | | | | 549 | | Changes: | | | | | | | | | | | | | | | | | | | | | Reclassifications | | | 6 | | | | 37 | | | | — | | | | — | | | | 43 | | Acquisitions/additions | | | 17 | | | | 13 | | | | 1 | | | | — | | | | 31 | | Sales/redemptions/reductions | | | (11 | ) | | | (6 | ) | | | — | | | | (8 | ) | | | (25 | ) | Impairment | | | (8 | ) | | | (2 | ) | | | — | | | | — | | | | (10 | ) | Transfer to assets classified as held for sale | | | (62 | ) | | | (30 | ) | | | — | | | | — | | | | (92 | ) | Value adjustments | | | 17 | | | | 1 | | | | — | | | | (9 | ) | | | 9 | | Translation and exchange differences | | | 1 | | | | (8 | ) | | | (1 | ) | | | (1 | ) | | | (9 | ) | | | | | | Balance as of December 31, 2013 | | | 192 | | | | 272 | | | | 3 | | | | 29 | | | | 496 | |
Available-for-sale financial assets
The Company’s investments in available-for-sale financial assets mainly consist of investments in common stock of companies in various industries. An amount of EUR 62 million has been reclassified as assets held for sale in relation to the agreed contribution to the Dutch Pension Fund (please refer to note 30, Post-employment benefits and note 36, Subsequent events).
Loans and receivables
During 2013 loans with face value EUR 30 million were transferred to assets held for sale in relation to the agreed contribution to the Dutch Pension Fund (please refer to note 30, Post-employment benefits and note 36, Subsequent events).
Financial assets at fair value through profit or loss
The reduction of financial assets at fair value through profit and loss includes certain financial instruments that Philips received in exchange for the transfer of its television activities. The initial value of EUR 17 million was adjusted by EUR 11 million during 2012 and EUR 6 million in 2013 reported under Value adjustments. As of December 31, 2013 the fair value reported was nil. On January 20, 2014, Philips has signed a term sheet to transfer its remaining 30% stake in TP Vision, which will also impact the above commitments. For further information, please refer to note 36, Subsequent events.
In 2010 Philips sold its entire holding of common shares in NXP Semiconductors B.V. (NXP) to Philips Pension Trustees Limited (herein referred to as “UK Pension Fund”). As a result of this transaction the UK Pension Fund obtained the full legal title and ownership of the NXP shares, including the entitlement to any future dividends and the proceeds from any sale of shares. From the date of the transaction, the NXP shares became an integral part of the plan assets of the UK Pension Fund. The purchase agreement with the UK Pension Fund includes an arrangement that may entitle Philips to a cash payment from the UK Pension Fund on or after September 7, 2014, if the total value yielded by the NXP shares has increased by this date to a level in excess of a predetermined threshold, which at the time of the transaction was substantially above the transaction price, and the UK Pension Fund is in a surplus (on a swaps basis) on September 7, 2014. The arrangement qualifies as a financial instrument and is reported under Other non-current financial assets. The Trustees of the UK Pension Fund have been selling the NXP shares in a number of transactions since 2010. The remaining number of NXP shares were sold in the course of 2013 and the total sale proceeds of the NXP shares exceeded the predetermined threshold. However as of December 31, 2013 the UK Pension Fund was not in surplus (on the agreed swaps basis). The fair value of the arrangement was estimated to be EUR 14 million as of December 31, 2012. As of December 31, 2013 management’s best estimate of the fair value of the arrangement is EUR 7 million, based on the current funded status as of December 31, 2013 (swaps basis) and the economic and demographic risks of the UK Pension Fund. The change in fair value in 2013 is reported under Value adjustments in the table above and also recognized in Financial income and expense.
Other non-current assets
Other non-current assets in 2013 are comprised of prepaid pension costs of EUR 5 million (2012: EUR 7 million) and prepaid expenses of EUR 58 million (2012: EUR 87 million).
For further details see note 30, Post-employment benefits.
Inventories
Inventories are summarized as follows:
| | | | | | | | | | | | 2012 | | | 2013 | | Raw materials and supplies | | | 1,039 | | | | 1,029 | | Work in process | | | 513 | | | | 375 | | Finished goods | | | 1,943 | | | | 1,836 | | | | | | | | | | 3,495 | | | | 3,240 | |
During 2013, inventories associated with the Audio, Video, Multimedia and Accessories (AVM&A) business have been reclassified to Assets held for sale. For more details, please refer note 7, Discontinued operations and other assets classified as held for sale.
The write-down of inventories to net realizable value amounted in 2013 to EUR 199 million (2012: EUR 273 million). The write-down is included in cost of sales.
Other current assets
Other current assets include prepaid expenses of EUR 354 million (2012: EUR 337 million).
Current receivables
The accounts receivable, net, per sector are as follows:
| | | | | | | | | | | | 2012 | | | 2013 | | Healthcare | | | 1,967 | | | | 1,978 | | Consumer Lifestyle | | | 865 | | | | 743 | | Lighting | | | 1,364 | | | | 1,567 | | Innovation, Group & Services | | | 138 | | | | 132 | | | | | | | | | | 4,334 | | | | 4,420 | |
The aging analysis of accounts receivable, net, is set out below:
| | | | | | | | | | | | 2012 | | | 2013 | | current | | | 3,624 | | | | 3,671 | | overdue 1-30 days | | | 272 | | | | 287 | | overdue 31-180 days | | | 298 | | | | 305 | | overdue > 180 days | | | 140 | | | | 157 | | | | | | | | | | 4,334 | | | | 4,420 | |
A large part of overdue trade accounts receivable relates to public sector customers with slow payment approval processes. The allowance for doubtful accounts receivable has been primarily established for receivables that are past due.
188 Annual Report 2013
11 Group financial statements 11.9 - 11.9
The changes in the allowance for doubtful accounts receivable are as follows:
| | | | | | | | | | | | | | | | 2011 | | | 2012 | | | 2013 | | Balance as of January 1 | | | 264 | | | | 233 | | | | 202 | | Additions charged to income | | | 20 | | | | 11 | | | | 24 | | Deductions from allowance1) | | | (31 | ) | | | (43 | ) | | | (23 | ) | Other movements | | | (20 | ) | | | 1 | | | | (21 | ) | | | | | | Balance as of December 31 | | | 233 | | | | 202 | | | | 182 | |
1) | Write-offs for which an allowance was previously providedOther provisions Philips Group Other provisions in millions of EUR 2013 - 2015
|
Equity
Common shares
As of December 31, 2013, the issued and fully paid share capital consists of 937,845,789 common shares, each share having a par value of EUR 0.20.
In June 2013, Philips settled a dividend of EUR 0.75 per common share, representing a total value of EUR 678 million. Shareholders could elect for a cash dividend or a share dividend. Approximately 59.8% of the shareholders elected for a share dividend, resulting in the issuance of 18,491,337 new common shares. The settlement of the cash dividend resulted in a payment of EUR 272 million.
The following table shows the movements in the outstanding number of shares;
Share movement schedule
| | | | | | | | | | | | 2012 | | | 2013 | | Balance as of January 1 | | | 926,094,902 | | | | 914,591,275 | | Dividend distributed | | | 30,522,107 | | | | 18,491,337 | | Purchase of treasury shares | | | (46,870,632 | ) | | | (27,811,356 | ) | Re-issuance of treasury shares | | | 4,844,898 | | | | 8,066,511 | | Balance as of December 31 | | | 914,591,275 | | | | 913,337,767 | |
Preference shares
The ‘Stichting Preferente Aandelen Philips’ has been granted the right to acquire preference shares in the Company. Such right has not been exercised. As a means to protect the Company and its stakeholders against an unsolicited attempt to acquire (de facto) control of the Company, the General Meeting of Shareholders in 1989 adopted amendments to the Company’s articles of association that allow the Board of Management and the Supervisory Board to issue (rights to acquire) preference shares to a third party. As of December 31, 2013, no preference shares have been issued.
Option rights/restricted shares
The Company has granted stock options on its common shares and rights to receive common shares in the future (see note 31, Share-based compensation).
Treasury shares
In connection with the Company’s share repurchase programs, shares which have been repurchased and are held in treasury for (i) delivery upon exercise of options, performance and restricted share programs and employee share purchase programs, and (ii) capital reduction purposes, are accounted for as a reduction of shareholders’ equity. Treasury shares are recorded at cost, representing the market price on the acquisition date. When issued, shares are removed from treasury shares on a first-in, first-out (FIFO) basis.
Any difference between the cost and the cash received at the time treasury shares are issued, is recorded in retained earnings.
Dividend withholding tax in connection with the Company’s purchase of treasury shares is recorded in retained earnings.
The following transactions took place resulting from employee option and share plans:
| | | | | | | | | | | | 2012 | | | 2013 | | Shares acquired | | | 5,147 | | | | 3,984 | | Average market price | | | EUR 17.86 | | | | EUR 22.51 | | Amount paid | | | EUR 0 million | | | | EUR 0 million | | Shares delivered | | | 4,844,898 | | | | 8,066,511 | | Average market price | | | EUR 24.39 | | | | EUR 28.35 | | Amount received | | | EUR 118 million | | | | EUR 229 million | | Total shares in treasury at year-end | | | 28,712,954 | | | | 20,650,427 | | Total cost | | | EUR 847 million | | | | EUR 618 million | |
In order to reduce share capital, the following transactions took place:
| | | | | | | | | | | | 2012 | | | 2013 | | Shares acquired | | | 46,865,485 | | | | 27,807,372 | | Average market price | | | EUR 16.41 | | | | EUR 22.69 | | Amount paid | | | EUR 769 million | | | | EUR 631 million | | Reduction of capital stock | | | 82,364,590 | | | | 37,778,510 | | Total shares in treasury at year-end | | | 13,828,733 | | | | 3,857,595 | | Total cost | | | EUR 256 million | | | | EUR 100 million | |
Dividend distribution
A proposal will be submitted to the General Meeting of Shareholders to pay a dividend of EUR 0.80 per common share, in cash or shares at the option of the shareholder from the 2013 net income.
Limitations in the distribution of shareholders’ equity
Pursuant to Dutch law, limitations exist relating to the distribution of shareholders’ equity of EUR 1,609 million (2012: EUR 1,480 million). Such limitations relate to common shares of EUR 188 million (2012: EUR 191 million) as well as to legal reserves required by Dutch law included under retained earnings of EUR 1,319 million (2012: EUR 1,161 million), revaluation reserves of EUR 23 million (2012: EUR 54 million), available-for-sale financial assets EUR 55 million (2012: EUR 54 million) and cash flow hedges EUR 24 million (2012: EUR 20 million).
The unrealized losses related to currency translation differences of EUR 569 million (2012: EUR 93 million), although qualifying as a legal reserve, reduce the distributable amount by their nature.
The legal reserve required by Dutch law of EUR 1,319 million included under retained earnings relates to any legal or economic restrictions on the ability of affiliated companies to transfer funds to the parent company in the form of dividends.
Non-controlling interests
Non-controlling interests represent the claims that third parties have on equity of consolidated group companies that are not wholly-owned by the Company. The Company has no material non-controlling interests. The Net income attributable to non-controlling interests amounted to EUR 3 million in 2013 (2012: EUR 5 million).
In 2013 Philips reduced its non-controlling interest by EUR 19 million due to the sale of one of its Healthcare subsidiaries in China in which a local shareholder held an ownership percentage of 49%.
Objectives, policies and processes for managing capital
Philips manages capital based upon the measures net operating capital (NOC), net debt and cash flows before financing activities.
The Company believes that an understanding of the Philips Group’s financial condition is enhanced by the disclosure of net operating capital (NOC), as this figure is used by Philips’ management to evaluate the capital efficiency of the Philips Group and its operating sectors. NOC is defined as: total assets excluding assets from discontinued operations less: (a) cash
Annual Report 2013 189
11 Group financial statements 11.9 - 11.9
and cash equivalents, (b) deferred tax assets, (c) other (non-)current financial assets, (d) investments in associates, and after deduction of: (e) provisions excluding deferred tax liabilities, (f) accounts and notes payable, (g) accrued liabilities, (h) current/non-current liabilities, and (i) trading securities.
Net debt is defined as the sum of long- and short-term debt minus cash and cash equivalents. The net debt position as a percentage of the sum of group equity (shareholders’ equity and non-controlling interests) and net debt is presented to express the financial strength of the Company. This measure is widely used by management and investment analysts and is therefore included in the disclosure. Our net debt position is managed in such a way that we expect to continuously meet our objective to retain our target at A3 rating (Moody’s) and A- rating (Standard and Poor’s). Furthermore, the Group’s objective when managing the net debt position is to fulfill our commitment to a stable dividend policy with a 40% to 50% target pay-out from continuing net income.
Cash flows before financing activities, being the sum of net cash from operating activities and net cash from investing activities, are presented separately to facilitate the reader’s understanding of the Company’s funding requirements.
NOC composition
| | | | | | | | | | | | | | | | 2011 | | | 2012 | | | 2013 | | Intangible assets | | | 11,012 | | | | 10,679 | | | | 9,766 | | Property, plant and equipment | | | 3,014 | | | | 2,959 | | | | 2,780 | | Remaining assets | | | 9,393 | | | | 8,921 | | | | 8,699 | | Provisions | | | (2,680 | ) | | | (2,956 | ) | | | (2,554 | ) | Other liabilities | | | (10,357 | ) | | | (10,287 | ) | | | (8,453 | ) | | | | | | Net operating capital | | | 10,382 | | | | 9,316 | | | | 10,238 | |
Composition of net debt to group equity
| | | | | | | | | | | | | | | | 2011 | | | 2012 | | | 2013 | | Long-term debt | | | 3,278 | | | | 3,725 | | | | 3,309 | | Short-term debt | | | 582 | | | | 809 | | | | 592 | | | | | | | Total debt | | | 3,860 | | | | 4,534 | | | | 3,901 | | Cash and cash equivalents | | | 3,147 | | | | 3,834 | | | | 2,465 | | | | | | | Net debt (cash)1) | | | 713 | | | | 700 | | | | 1,436 | | | | | | Shareholders’ equity | | | 12,328 | | | | 11,151 | | | | 11,214 | | Non-controlling interests | | | 34 | | | | 34 | | | | 13 | | | | | | | Group equity | | | 12,362 | | | | 11,185 | | | | 11,227 | | | | | | Net debt and group equity | | | 13,075 | | | | 11,885 | | | | 12,663 | | Net debt divided by net debt and group equity (in %) | | | 5 | | | | 6 | | | | 11 | | Group equity divided by net debt and group equity (in %) | | | 95 | | | | 94 | | | | 89 | |
1) | Total debt less cash and cash equivalents | | | | | | | | | | | | | | | | | | | | | 2013 | | | 2014 | | | 2015 | | | | | | | Balance as of January 1 | | | 529 | | | | 519 | | | | 575 | | Changes: | | | | | | | | | | | | | Additions | | | 198 | | | | 213 | | | | 198 | | Utilizations | | | (224 | ) | | | (153 | ) | | | (186 | ) | Releases | | | (48 | ) | | | (37 | ) | | | (35 | ) | Reclassification | | | 80 | | | | 17 | | | | 14 | | Liabilities directly associated with assets held for sale | | | (3 | ) | | | (13 | ) | | | (1 | ) | Accretion | | | — | | | | 6 | | | | 7 | | Changes in consolidation | | | (1 | ) | | | (1 | ) | | | 24 | | Translation differences | | | (12 | ) | | | 24 | | | | 8 | | | | | | | Balance as of December 31 | | | 519 | | | | 575 | | | | 604 | | | | | | |
The main elements of other provisions are: provision for post-employment benefits and obligatory severance payments of EUR 47 million (2014: 50 million), onerous contract provisions for unfavorable supply contracts as part of divestment transactions, onerous (sub) lease contracts and expected losses on existing projects / orders totaling EUR 106 million (2014: 103 million), provision for employee jubilee funds EUR 71 million (2014: EUR 74 million), self-insurance liabilities of EUR 70 million (2014: EUR 65 million), provisions for rights of return of EUR 52 million (2014: EUR 52 million), provision for possible taxes/social security of EUR 99 million (2014: EUR 97 million) and provision for decommissioning costs of EUR 52 million (2014: EUR 36 million). Provisions of EUR 24 million have been assumed as a result of the acquisition of Volcano. The provision for self-insurance liabilities is expected to be used within the next five years. More than half of the provision for possible taxes/social security and provision for decommissioning costs and less than half of the provision for employee jubilee funds is expected to be utilized within next five years. All other provisions are expected to be utilized mainly within the next three years, except for provision for rights of return, which the Company expects to use within the next year. Post-employment benefits Employee post-employment plans have been established in many countries in accordance with the legal requirements, customs and the local practice in the countries involved. Most employees that take part in a Company pension plan are covered by defined contribution (DC) pension plans. The Company also sponsors a number of defined benefit pension plans. The benefits provided by these plans are based on employees’ years of service and compensation levels. The Company also sponsors a limited number of defined benefit retiree medical plans. The benefits provided by these plans are typically covering a part of the healthcare insurance costs after retirement. The largest defined benefit pension plans are in:
|
Composition of cash flows
| | | | | | | | | | | | | | | | 2011 | | | 2012 | | | 2013 | | Cash flows from operating activities | | | 760 | | | | 2,082 | | | | 1,138 | | Cash flows from investing activities | | | (1,275 | ) | | | (925 | ) | | | (997 | ) | | | | | | Cash flows before financing activities | | | (515 | ) | | | 1,157 | | | | 141 | |
190 Annual Report 2013
11 Group financial statements 11.9 - 11.9
Long-term debt and short-term debt
Long-term debt
| | | | | | | | | | | | | | | | | | | | | | | | | | | | | | | | | | | | (range of)
interest
rates | | | average
rate of interest | | | amount
outstanding
2013 | | | due in
1 year | | | due
after 1
year | | | due
after 5
years | | | average
remaining
term (in
years) | | | amount
outstanding
2012 | | USD bonds | | | 3.8 - 7.8 | % | | | 5.6 | % | | | 2,958 | | | | — | | | | 2,958 | | | | 2,059 | | | | 13.7 | | | | 3,198 | | Convertible debentures | | | 0 - 0 | % | | | — | | | | — | | | | — | | | | — | | | | — | | | | — | | | | 12 | | Private financing | | | 0 - 0 | % | | | — | | | | — | | | | — | | | | — | | | | — | | | | — | | | | 2 | | Bank borrowings | | | 0 - 7.8 | % | | | 2.0 | % | | | 466 | | | | 260 | | | | 206 | | | | 203 | | | | 3.6 | | | | 469 | | Other long-term debt | | | 0 - 19.0 | % | | | 4.4 | % | | | 48 | | | | 48 | | | | — | | | | — | | | | 1.0 | | | | 52 | | | | | | | | | | | | | | | | | | 3,472 | | | | 308 | | | | 3,164 | | | | 2,262 | | | | | | | | 3,733 | | Finance leases | | | 0.7 - 15.1 | % | | | 3.8 | % | | | 199 | | | | 54 | | | | 145 | | | | 53 | | | | 6.3 | | | | 243 | | | | | | | | | | | | | | 5.0 | % | | | 3,671 | | | | 362 | | | | 3,309 | | | | 2,315 | | | | | | | | 3,976 | | Corresponding data of previous year | | | | | | | 5.2 | % | | | 3,976 | | | | 251 | | | | 3,725 | | | | 3,357 | | | | | | | | 3,417 | |
The following amounts of long-term debt as of December 31, 2013, are due in the next five years:
| | | | | 2014 | | | 362 | | 2015 | | | 42 | | 2016 | | | 26 | | 2017 | | | 16 | | 2018 | | | 910 | | | | | | | Total | | | 1,356 | | Corresponding amount of previous year | | | 619 | |
| | | | | | | | | | | | | | | | effective
rate | | | 2012 | | | 2013 | | | Unsecured USD Bonds | | | | | | | | | | | | | Due 5/15/25; 7 3/4% | | | 7.429 | % | | | 75 | | | | 72 | | Due 6/01/26; 7 1/5% | | | 6.885 | % | | | 126 | | | | 120 | | Due 8/15/13; 7 1/4% | | | 6.382 | % | | | 108 | | | | — | | Due 5/15/25; 7 1/8% | | | 6.794 | % | | | 78 | | | | 74 | | Due 3/11/18; 5 3/4%1) | | | 6.066 | % | | | 948 | | | | 907 | | Due 3/11/38; 6 7/8%1) | | | 7.210 | % | | | 758 | | | | 726 | | Due 3/15/22; 3.750%1) | | | 3.906 | % | | | 758 | | | | 726 | | Due 3/15/42; 5.000%1) | | | 5.273 | % | | | 379 | | | | 363 | | Adjustments2) | | | | | | | (32 | ) | | | (30 | ) | | | | | | | | | | | | | 3,198 | | | | 2,958 | |
1) | The provisions applicable to these bonds, issued in March 2008 and in March 2012, contain a ‘Change of Control Triggering Event’. If the Company would experience such an event with respect to a series of corporate bonds, the Company may be required to offer to purchase the bonds of the series at a purchase price equal to 101% of the principal amount, plus accrued and unpaid interest, if any.
|
2) | Adjustments relate to issued bond discounts, transaction costs and fair value adjustments for interest rate derivatives
|
Secured liabilities
In 2013, none of the long-term and short-term debt was secured by collateral (2012: EUR nil million).
Short-term debt
| | | | | | | | | | | | 2012 | | | 2013 | | Short-term bank borrowings | | | 533 | | | | 207 | | Other short-term loans | | | 25 | | | | 23 | | Current portion of long-term debt | | | 251 | | | | 362 | | | | | | | | | | 809 | | | | 592 | |
During 2013, the weighted average interest rate on the bank borrowings was 6.4% (2012: 7.8%).
In the Netherlands, the Company issued personnel debentures with a 5- year right of conversion into common shares of Koninklijke Philips NV. Convertible personnel debentures may not be converted within a period of 3 years after the date of issue. These convertible personnel debentures were available to most employees in the Netherlands and were purchased by them with their own funds and were redeemable on demand. The convertible personnel debentures become non-convertible debentures at the end of the conversion period.
Although convertible debentures have the character of long-term financing, the total outstanding amounts have been classified as current portion of long-term debt. At December 31, 2013 the conversion period ended, so none were outstanding (2012: EUR 12 million). The conversion price varied between EUR 14.2 and EUR 24.6 with various conversion periods ending between January 1, 2013 and December 31, 2013. As of January 1, 2009, Philips no longer issues these debentures.
Furthermore, Philips has a USD 2.5 billion Commercial Paper Program and a EUR 1.8 billion revolving credit facility that can be used for general corporate purposes and as a backstop of its commercial paper program. In January 2013, the EUR 1.8 billion facility was extended by 2 years until February 18, 2018. As of December 31, 2013 Philips did not have any loans outstanding under either facility.
Annual Report 2013 191
11 Group financial statements 11.9 - 11.9
Provisions
| | | | | | | | | | | | | | | | | | | | 2012 | | | 2013 | | | | | long-
term | | | short-
term | | | long-
term | | | short-
term | | Provisions for defined-benefit plans (see note 30) | | | 808 | | | | 52 | | | | 754 | | | | 51 | | Other postretirement benefits (see note 30) | | | 233 | | | | 17 | | | | 200 | | | | 14 | | Postemployment benefits and obligatory severance payments | | | 56 | | | | 26 | | | | 41 | | | | 25 | | Product warranty | | | 90 | | | | 229 | | | | 59 | | | | 207 | | Environmental provisions | | | 330 | | | | 45 | | | | 249 | | | | 62 | | Restructuring-related provisions | | | 108 | | | | 277 | | | | 75 | | | | 128 | | Onerous contract provisions | | | 67 | | | | 61 | | | | 40 | | | | 53 | | Other provisions | | | 427 | | | | 130 | | | | 485 | | | | 111 | | | | | | | | | | 2,119 | | | | 837 | | | | 1,903 | | | | 651 | |
Post-employment benefits and obligatory severance payments
The provision for post-employment benefits covers benefits provided to former or inactive employees after employment but before retirement, including salary continuation, supplemental unemployment benefits and disability-related benefits.
| | | | | | | | | | | | | | | | 2011 | | | 2012 | | | 2013 | | Balance as of January 1 | | | 116 | | | | 104 | | | | 82 | | Changes: | | | | | | | | | | | | | Additions | | | 29 | | | | 12 | | | | 15 | | Utilizations | | | (41 | ) | | | (37 | ) | | | (29 | ) | Translation differences | | | — | | | | 1 | | | | (1 | ) | Changes in consolidation | | | — | | | | 2 | | | | (1 | ) | | | | | | Balance as of December 31 | | | 104 | | | | 82 | | | | 66 | |
The provision for obligatory severance payments covers the Company commitment to pay employees a lump sum upon the employee’s dismissal or resignation. In the event that a former employee has passed away, the Company may have a commitment to pay a lump sum to the deceased employee’s relatives. The Company expects the provision will be utilized mostly within the next three years.
Product warranty
The provision for product warranty reflects the estimated costs of replacement and free-of-charge services that will be incurred by the Company with respect to products sold. The Company expects the provision will be utilized mainly within the next year. The changes in the provision for product warranty are as follows:
| | | | | | | | | | | | | | | | 2011 | | | 2012 | | | 2013 | | Balance as of January 1 | | | 404 | | | | 378 | | | | 319 | | Changes: | | | | | | | | | | | | | Additions | | | 444 | | | | 370 | | | | 350 | | Utilizations | | | (470 | ) | | | (427 | ) | | | (363 | ) | Transfer to assets classified as held for sale | | | — | | | | — | | | | (24 | ) | Translation differences | | | 1 | | | | (4 | ) | | | (16 | ) | Changes in consolidation | | | (1 | ) | | | 2 | | | | — | | | | | | | Balance as of December 31 | | | 378 | | | | 319 | | | | 266 | |
Environmental provisions
The environmental provisions include accrued losses recorded with respect to environmental remediation. Approximately half of this provision is expected to be utilized within the next five years. The remaining portion relates to longer-term remediation activities.
The changes in this provision are as follows:
| | | | | | | | | | | | | | | | 2011 | | | 2012 | | | 2013 | | Balance as of January 1 | | | 250 | | | | 305 | | | | 375 | | Changes: | | | | | | | | | | | | | Additions | | | 48 | | | | 48 | | | | 30 | | Utilizations | | | (15 | ) | | | (22 | ) | | | (21 | ) | Releases | | | (15 | ) | | | (1 | ) | | | (16 | ) | Changes in discount rate | | | 25 | | | | 18 | | | | (40 | ) | Accretion | | | 6 | | | | 6 | �� | | | 6 | | Translation differences | | | 6 | | | | (4 | ) | | | (8 | ) | Purchase price allocation adjustment | | | — | | | | — | | | | (15 | ) | Changes in consolidation | | | — | | | | 25 | | | | — | | | | | | | Balance as of December 31 | | | 305 | | | | 375 | | | | 311 | |
The decrease of provision due to changes in discount rate in 2013 relates to an overall increase of the market rates used in discounting.
For more details on the main assumptions underlying environmental provisions reference is made to note 26, Contingent assets and liabilities.
Restructuring-related provisions
The most significant projects in 2013
In 2013, the most significant restructuring projects related to Lighting and were driven by the industrial footprint rationalization.
In Healthcare, the largest projects were undertaken in Customer Services, Home Healthcare Solutions and Imaging Systems in the United States, Italy and the Netherlands to reduce the operating costs and simplify the organization.
The Netherlands (settled per May 1, 2015), Consumer Lifestyle restructuring charges were mainly related to Personal Care (primarily in the Netherlands and Austria) and Coffee (mainly Italy).
Restructuring projects at Lighting centered on Luminaires businesses and Light Sources & Electronics, the largest of which took place in the United States, France and Belgium.
Innovation, Group & Services restructuring projects mainly focused on the Financial Operations Service Unit, primarily in Italy, France and the United States.
The Company expects the provision will be utilized mainly within the next year. The movements in the provisions and liabilities for restructuring in 2013 are presented by sector as follows:
| | | | | | | | | | | | | | | | | | | | | | | | | | | | Dec. 31,
2012 | | | addi-
tions | | | utilized | | | released | | | other
changes1) | | | Dec. 31,
2013 | | Healthcare | | | 77 | | | | 14 | | | | (50 | ) | | | (23 | ) | | | (1 | ) | | | 17 | | Consumer Lifestyle | | | 48 | | | | 11 | | | | (27 | ) | | | (10 | ) | | | (1 | ) | | | 21 | | Lighting | | | 198 | | | | 64 | | | | (110 | ) | | | (19 | ) | | | (3 | ) | | | 130 | | IG&S | | | 62 | | | | 16 | | | | (30 | ) | | | (15 | ) | | | 2 | | | | 35 | | | | | | | | | | 385 | | | | 105 | | | | (217 | ) | | | (67 | ) | | | (3 | ) | | | 203 | |
1) | Other changes primarily relate to translation differencesThe United Kingdom (UK) (settled per December 31, 2015) and transfers between sectors
|
The most significant projects in 2012
In 2012, the most significant restructuring projects related to Lighting and Healthcare and were driven by our change program Accelerate!.
192 Annual Report 2013
11 Group financial statements 11.9 - 11.9
In Healthcare, the largest projects were undertaken in Imaging Systems and Patient Care & Clinical Informatics in various locations in the United States, the Netherlands and Germany to reduce the operating costs and simplify the organization.
Consumer Lifestyle restructuring charges were mainly related to Lifestyle Entertainment (primarily in Hong Kong and the United States) and Coffee (mainly Italy).
Restructuring projects at Lighting centered on Luminaires businesses and Light Sources & Electronics, the largest of which took place in the Netherlands, Belgium and in various locations in the US.
Innovation, Group & Services restructuring projects focused on the IT and Financial Operations Service Units (primarily in the Netherlands), Group & Regional Overheads (mainly in the Netherlands and Italy) and Philips Innovation Services (in the Netherlands and Belgium).
The movements in the provisions and liabilities for restructuring in 2012 are presented by sector as follows:
| | | | | | | | | | | | | | | | | | | | | | | | | | | | Dec. 31,
2011 | | | addi-
tions | | | utilized | | | released | | | other
changes1) | | | Dec. 31,
2012 | | Healthcare | | | 18 | | | | 100 | | | | (29 | ) | | | (7 | ) | | | (5 | ) | | | 77 | | Consumer Lifestyle | | | 39 | | | | 58 | | | | (41 | ) | | | (8 | ) | | | — | | | | 48 | | Lighting | | | 52 | | | | 225 | | | | (61 | ) | | | (16 | ) | | | (2 | ) | | | 198 | | IG&S | | | 60 | | | | 67 | | | | (47 | ) | | | (10 | ) | | | (8 | ) | | | 62 | | | | | | | | | | 169 | | | | 450 | | | | (178 | ) | | | (41 | ) | | | (15 | ) | | | 385 | |
1) | Other changes primarily relate to translation differences and transfers between sectorsAt the start of 2015 these plans accounted for more than 90% of the total defined benefit obligation and plan assets. Philips is one of the sponsors of Philips Pensionskasse VVaG in Germany, which is a multi-employer plan and is accounted for as a DC plan. The Netherlands For the pension plan in the Netherlands (the Flexplan) the Company has no other financial obligation to the Pension Fund than to pay an agreed fixed contribution for the annual accrual of active members. The pensionable age is 67 year. The Flexplan is executed by a Company Pension Fund. A mandatory cap imposed by Dutch legislation of EUR 100 thousand applies on the pension salary for future pension accrual. Employees earning more than this cap receive a wage allowance and can join a voluntary net pension saving scheme, at their own expense, for the salary part above the cap. The net pension saving scheme and some related risk insurances are executed by an external provider other than the Company Pension Fund. Up to May 2015, the Company accounted for the Flexplan as a defined benefit (DB) pension plan as it still ran actuarial and investments risks by means of being entitled to a discount arrangement. This discount arrangement would result in potential future variable pension contributions to be paid by the Company. Beginning of May 2015, the Company surrendered its right to future discounts and as a result the plan qualified as a defined contribution plan. Reason for surrendering the discount arrangement was a significant reduction in 2015 of the outlook for a potential discount due to increased pension obligations and a regulatory deficit at the fund (because of a lower regulatory discount rate and higher solvency buffers due to change in investment strategy), combined with the need to avoid unwanted complexity of an allocation of the Dutch fund as a DB plan as part of the separation. Consequently, the plan was classified as a DC plan. This triggered the accounting settlement of the plan which at the time had a EUR 20 million surplus. As the surplus was not recognized in the balance sheet due to the asset ceiling test, and because no further payments were made directly related to the settlement, as per the Company’s accounting policy the Company did not recognize a settlement result in the income statement but in remeasurements for pensions in the Consolidated statements of Comprehensive Income.
|
The most significant projects in 2011
In 2011, the most significant restructuring projects related to Lighting and Innovation, Group & Services were driven by our change program Accelerate!.
In Healthcare, the largest projects were undertaken in Home Healthcare Solutions, Imaging Systems and Patient Care & Clinical Informatics in various locations in the United States to reduce the operating costs and simplify the organization.
Consumer Lifestyle restructuring charges mainly relate to our remaining Television operations in Europe.
Restructuring projects at Lighting are driven by our change program Accelerate!. In addition projects centered on the Luminaires business and Light Sources & Electronics, the largest of which took place in Brazil, the Netherlands and in various locations in the US.
Innovation, Group & Services restructuring projects focused on the Global Service Units (primarily in the Netherlands), Group & Regional Overheads (mainly the Netherlands, Brazil and Italy) and Philips Design (Netherlands).
The movements in the provisions and liabilities for restructuring in 2011 are presented by sector as follows:
| | | | | | | | | | | | | | | | | | | | | | | | | | | | Dec. 31,
2010 | | | addi-
tions | | | utilized | | | released | | | other
changes1) | | | Dec. 31,
2011 | | Healthcare | | | 33 | | | | 16 | | | | (17 | ) | | | (14 | ) | | | — | | | | 18 | | Consumer Lifestyle | | | 75 | | | | 25 | | | | (56 | ) | | | (6 | ) | | | 1 | | | | 39 | | Lighting | | | 70 | | | | 44 | | | | (47 | ) | | | (13 | ) | | | (2 | ) | | | 52 | | IG&S | | | 48 | | | | 37 | | | | (15 | ) | | | (14 | ) | | | 4 | | | | 60 | | | | | | | | | | 226 | | | | 122 | | | | (135 | ) | | | (47 | ) | | | 3 | | | | 169 | |
1) | Other changes primarily relate to translation differences and transfers between sectors
|
Onerous contract provisions
The onerous contract provisions include provisions for the loss recognized upon signing the agreement with TPV Technology Limited for the Television business of EUR 7 million (2012: EUR 24 million), provisions for unfavorable supply contracts as part of divestment transactions of EUR 38 million (2012: EUR 60 million), onerous (sub)lease contracts of EUR 38 million (2012: EUR 35 million) and expected losses on existing projects/ orders of EUR 10 million (2012: EUR 9 million).
The Company expects the provision will be utilized mostly within the next three years. The changes in the provision for onerous contract are as follows:
| | | | | | | | | | | | | | | | 2011 | | | 2012 | | | 2013 | | Balance as of January 1 | | | — | | | | 248 | | | | 128 | | Changes: | | | | | | | | | | | | | Additions | | | 270 | | | | 142 | | | | 34 | | Utilizations | | | (22 | ) | | | (277 | ) | | | (64 | ) | Releases | | | — | | | | (6 | ) | | | (4 | ) | Reclassification | | | — | | | | 21 | | | | (1 | ) | | | | | | Balance as of December 31 | | | 248 | | | | 128 | | | | 93 | |
Other provisions
The main elements of other provisions are: provision for employee jubilee funds totaling EUR 76 million (2012: EUR 76 million), self-insurance liabilities of EUR 56 million (2012: EUR 61 million), liabilities related to business combinations totaling EUR 9 million (2012: EUR 36 million), provisions for rights of return of EUR 45 million (2012: EUR 45 million), provisions in respect of outstanding litigation totaling EUR 236 million (2012: EUR 238 million), provision for possible taxes/social security of EUR 65 million (2012: EUR 28 million) and provision for decommissioning costs of EUR 33 million (2012: EUR nil million).
In 2013, EUR 20 million of releases related to provision for business combinations.
The reclassification in 2013 includes mainly liabilities related to decommissioning costs reclassified to provisions from other (non)current liabilities and possible taxes transferred to provisions from other non- current financial assets. The reclassification in 2012 includes mainly liabilities for rights of return which were recognized in previous years in accrued liabilities.
There are provisions in respect of certain outstanding litigation within various operations, of which management expects the outcomes of these disputes to be resolved within the forthcoming five years. The actual outcome of these disputes and the timing of the resolution cannot be estimated by the Company at this time. The further information ordinarily required by IAS 37, ‘Provisions, contingent liabilities and contingent assets’ has not been disclosed on the grounds that it can be expected to seriously prejudice the outcome of the disputes.
Less than a half of provision for employee jubilee funds and provision for possible taxes/social security is expected to be utilized within next five years. Provision for self-insurance liabilities and provision for decommissioning costs are expected to be used mainly within the next five years. All other provisions are expected to be utilized within the next three years, except for provision for rights of return, which the Company expects to use within the next year.
| | | | | | | | | | | | | | | | 2011 | | | 2012 | | | 2013 | | Balance as of January 1 | | | 310 | | | | 389 | | | | 557 | | Changes: | | | | | | | | | | | | | Additions | | | 201 | | | | 396 | | | | 190 | | Utilizations | | | (138 | ) | | | (260 | ) | | �� | (148 | ) | Releases | | | (9 | ) | | | (27 | ) | | | (55 | ) | Reclassification | | | — | | | | 67 | | | | 84 | | Liabilities directly associated with assets held for sale | | | (6 | ) | | | — | | | | (3 | ) | Translation differences | | | (4 | ) | | | (9 | ) | | | (29 | ) | Changes in consolidation | | | 35 | | | | 1 | | | | — | | | | | | | Balance as of December 31 | | | 389 | | | | 557 | | | | 596 | |
Annual Report 2013 193
11 Group financial statements 11.9 - 11.9
176 Annual Report 2015
Group financial statements 12.9 Other non-current liabilities
Other non-current liabilities are summarized as follows:
| | | | | | | | | | | | 2012 | | | 2013 | | Accrued pension costs | | | 1,166 | | | | 813 | | Income tax payable | | | — | | | | 1 | | Decommissioning cost | | | 23 | | | | — | | Deferred income | | | 194 | | | | 214 | | Other tax liability | | | 488 | | | | 443 | | Other liabilities | | | 134 | | | | 97 | | | | | | | | | | 2,005 | | | | 1,568 | |
The decrease in the accrued pension costs is mainly attributable to the US defined benefit plan. See also note 30, Post-employment benefits.
In 2013, liabilities related to decommissioning cost were reclassified from (non)current liabilities to other provisions.
For further details on tax related liabilities refer to note 5, Income taxes.
Accrued liabilities
Accrued liabilities are summarized as follows:
| | | | | | | | | | | | 2012 | | | 2013 | | Personnel-related costs: | | | | | | | | | - Salaries and wages | | | 590 | | | | 560 | | - Accrued holiday entitlements | | | 192 | | | | 184 | | - Other personnel-related costs | | | 148 | | | | 130 | | Fixed-asset-related costs: | | | | | | | | | - Gas, water, electricity, rent and other | | | 69 | | | | 61 | | Distribution costs | | | 114 | | | | 104 | | Sales-related costs: | | | | | | | | | - Commission payable | | | 52 | | | | 24 | | - Advertising and marketing-related costs | | | 149 | | | | 159 | | - Other sales-related costs | | | 118 | | | | 98 | | Material-related costs | | | 186 | | | | 175 | | Interest-related accruals | | | 75 | | | | 57 | | Deferred income | | | 824 | | | | 812 | | Other accrued liabilities | | | 654 | | | | 466 | | | | | | | | | | 3,171 | | | | 2,830 | |
Other current liabilities
Other current liabilities are summarized as follows:
| | | | | | | | | | | | 2012 | | | 2013 | | Advances received from customers on orders not covered by work in process | | | 308 | | | | 240 | | Other taxes including social security premiums | | | 176 | | | | 193 | | Other liabilities | | | 1,071 | | | | 649 | | | | | | | | | | 1,555 | | | | 1,082 | |
Other liabilities include EUR 530 million (2012: EUR 442 million) accrued customer rebates that cannot be offset with accounts receivables for those customers.
On December 5, 2012 the Company announced that it received a fine of EUR 313 million from the European Commission following an investigation into alleged violation of competition rules in the Cathode-Ray Tubes (CRT) industry. In addition, the European Commission has ordered Philips and LG Electronics to be jointly and severally liable to pay a fine of EUR 392 million for an alleged violation of competition rules by LG. Philips Displays (LPD), a 50/50 joint venture between the Company and LG Electronics. In 2006, LPD went bankrupt. The aggregate of the amount of EUR 313 million and EUR 196 million (being 50% of the fine related to LPD) has been recorded under Other liabilities in December 2012 and paid in Q1 2013.
Contractual obligations
Contractual cash obligations at December 31, 20131)
| | | | | | | | | | | | | | | | | | | | | | | | payments due by period | | | | | total | | | less than
1 year | | | 1-3 years | | | 3-5 years | | | after 5 years | | Long-term debt2) | | | 3,472 | | | | 308 | | | | 2 | | | | 900 | | | | 2,262 | | Finance lease obligations | | | 241 | | | | 61 | | | | 78 | | | | 34 | | | | 68 | | Short-term debt | | | 230 | | | | 230 | | | | — | | | | — | | | | — | | Operating leases | | | 1,017 | | | | 237 | | | | 316 | | | | 182 | | | | 282 | | Derivative liabilities | | | 337 | | | | 112 | | | | 93 | | | | 92 | | | | 40 | | Interest on debt3) | | | 2,421 | | | | 185 | | | | 346 | | | | 315 | | | | 1,575 | | Purchase obligations4) | | | 184 | | | | 81 | | | | 76 | | | | 26 | | | | 1 | | Trade and other payables | | | 2,462 | | | | 2,462 | | | | — | | | | — | | | | — | | | | | | | | | | 10,364 | | | | 3,676 | | | | 911 | | | | 1,549 | | | | 4,228 | |
1) | Data in this table is undiscounted
At the end of 2013 the Company agreed to transfer a one-off EUR 600 million to the Company Pension Fund of which EUR 433 million was paid in 2014; the remainder of EUR 167 million (excluding interest) was paid in the first quarter of 2015. |
2) | Long-term debt includes short-term portion of long-term debt and excludes finance lease obligations
|
3) | Approximately 20% of the debt bears interest at a floating rate. Majority of the interest payments on variable interest rate loans in the table above reflect market forward interest rates at the period end and these amounts may change as market interest rate changes
|
4) | Philips has commitments related to the ordinary course of business which in general relate to contracts and purchase order commitments for less than 12 months. In the table, only the commitments for multiple years are presented, including their short-term portion
|
The long-term operating lease commitments are mainly related to the rental of buildings. A number of these leases originate from sale-and- leaseback arrangements. Operating lease payments under sale-and- leaseback arrangements for 2013 totaled EUR 42 million (2012: EUR 35 million).
The remaining minimum payments from operating leases originating from sale-and-leaseback arrangements are as follows:
| | | | | 2014 | | | 42 | | 2015 | | | 37 | | 2016 | | | 36 | | 2017 | | | 35 | | 2018 | | | 34 | | Thereafter | | | 171 | |
194 Annual Report 2013
11 Group financial statements 11.9 - 11.9
Finance lease liabilities
| | | | | | | | | | | | | | | | | | | | | | | | | | | | 2012 | | | 2013 | | | | | future
mini-
mum
lease
pay-
ments | | | interest | | | present
value of
mini-
mum
lease
pay-
ments | | | future
mini-
mum
lease
pay-
ments | | | interest | | | present
value of
mini-
mum
lease
pay-
ments | | Less than one year | | | 73 | | | | 7 | | | | 65 | | | | 61 | | | | 7 | | | | 54 | | Between one and five years | | | 137 | | | | 25 | | | | 113 | | | | 112 | | | | 20 | | | | 92 | | More than five years | | | 88 | | | | 23 | | | | 65 | | | | 68 | | | | 15 | | | | 53 | | | | | | | | | | 298 | | | | 55 | | | | 243 | | | | 241 | | | | 42 | | | | 199 | |
Philips entered into contracts with several venture capitalists where it committed itself to make, under certain conditions, capital contributions to investment funds to an aggregated amount of EUR 40 million (2012: EUR 48 million) until June 30, 2021. As at December 31, 2013 capital contributions already made to these investment funds are recorded as available-for-sale financial assets within Other non-current financial assets.
Based on its 30% share in the TP Vision venture, Philips had various commitments to provide further funding to the TP Vision venture at December 31, 2013 (see note 32, Related-party transactions).
On 20 January 2014, Philips has signed a term sheet to transfer its remaining 30% stake in the TP Vision venture, which will also impact the above commitments (see note 36, Subsequent events).
See also note 7, Discontinued operations and other assets classified as held for sale for further details on the Television business divestment.
Contingent assets and liabilities
Contingent assets
In 1996, CIEM (Labor Union of Manaus) representing, among other companies Philips Brazil, filed a fiscal claim against Manaus Free Trade Zone Superintendence (SUFRAMA), in order to obtain a judicial declaration of the illegality and unconstitutionality of the Public Price tax, charged by SUFRAMA. The Lower Court ruled favorable for Philips.
In September 2007, Philips requested the Settlement of Declaratory Judgment, in order to refund the amounts unduly paid to SUFRAMA during 1992 to 1999. In August 2011, a ruling was issued to approve Philips credit for the amount of EUR 36 million (BRL 118 million). The estimated amount as of year-end 2013 is EUR 40 million (BRL 130 million), the increase explained by interest.
In December 2008, SUFRAMA filed the appeal against the decision issued in the records of the Settlement of Declaratory Judgment. The Regional Court unanimously upheld the Lower Court decision to reject SUFRAMA’s appeal. SUFRAMA filed two appeals against the Regional Court decision. One to the Superior Court of Justice (STJ) and the other to Supreme Court. Both appeals were denied. SUFRAMA filed a Bill of Review against the decision that denied both appeals. The appeal was admitted in STJ. The judgment is pending since October 2013. Final decision is expected in two years.
Contingent liabilities
Guarantees
Philips’ policy is to provide guarantees and other letters of support only in writing. Philips does not stand by other forms of support. At the end of 2013, the total fair value of guarantees recognized by Philips in other non- current liabilities amounted to less than EUR 1 million. The following table outlines the total outstanding off-balance sheet credit-related guarantees and business-related guarantees provided by Philips for the benefit of unconsolidated companies and third parties as at December 31, 2013.
Expiration per period
in millions of euros
| | | | | | | | | | | | | | | | business-
related
guarantees | | | credit-
related
guarantees | | | total | | | 2013 | | | | | | | | | | | | | Total amounts committed | | | 292 | | | | 41 | | | | 333 | | Less than one year | | | 107 | | | | 19 | | | | 126 | | Between one and five years | | | 117 | | | | 7 | | | | 124 | | After five years | | | 68 | | | | 15 | | | | 83 | | | | | | | 2012 | | | | | | | | | | | | | Total amounts committed | | | 295 | | | | 27 | | | | 322 | | Less than one year | | | 113 | | | | 11 | | | | 124 | | Between one and five years | | | 114 | | | | — | | | | 114 | | After five years | | | 68 | | | | 16 | | | | 84 | |
Environmental remediation
The Company and its subsidiaries are subject to environmental laws and regulations. Under these laws, the Company and/or its subsidiaries may be required to remediate the effects of certain chemicals on the environment. The Company accrues for losses associated with environmental obligations when such losses are probable and reliably estimable. Such amounts are recognized on a discounted basis since they reflect the present value of estimated future cash flows.
Provisions for environmental remediation can change significantly due to the emergence of additional information regarding the extent or nature of the contamination, the need to utilize alternative technologies, actions by regulatory authorities and changes in judgments, assumptions, and discount rates.
The Company and/or its subsidiaries have recognized environmental remediation provisions for sites in various countries. In the United States, subsidiaries of the Company have been named as potentially responsible parties in state and federal proceedings for the clean-up of certain sites.
Legal proceedings
The Company and certain of its group companies and former group companies are involved as a party in legal proceedings, including regulatory and other governmental proceedings, including discussions on potential remedial actions, relating to such matters as competition issues, commercial transactions, product liability, participations and environmental pollution.
In respect of antitrust laws, the Company and certain of its (former) group companies are involved in investigations by competition law authorities in several jurisdictions and are engaged in litigation in this respect. Philips is one of the companies that were inspected by officials of the European Commission in December 2013. The European Commission is looking into potential restrictions on online sales of consumer electronic products and small domestic appliances. Philips is fully cooperating with the European Commission.
Since the ultimate disposition of asserted claims and proceedings and investigations cannot be predicted with certainty, an adverse outcome could have a material adverse effect on the Company’s consolidated financial position, results of operations and cash flows.
Provided below are disclosures of the more significant cases:
Cathode-Ray Tubes (CRT)
On November 21, 2007, the Company announced that competition law authorities in several jurisdictions had commenced investigations into possible anticompetitive activities in the Cathode-Ray Tubes, or CRT industry. On December 5, 2012, the European Commission issued a decision imposing fines on (former) CRT manufacturers including the Company. The European Commission imposed a fine of EUR 313 million on the Company and a fine of EUR 392 million jointly and severally on the Company and LG Electronics, Inc. In total a payable of EUR 509 million was recognized and the fine was paid in the first quarter of 2013. The Company has appealed the decision of the European Commission. The
Annual Report 2013 195
11 Group financial statements 11.9 - 11.9
authorities in Brazil and Hungary are continuing to pursue the matter against Philips and other defendants. Philips will respond to these allegations in 2014.
Subsequent to the public announcement of these investigations in 2007, certain Philips group companies were named as defendants in over 50 class action antitrust complaints filed in various federal district courts in the United States. These actions allege anticompetitive conduct by manufacturers of CRTs and seek treble damages on behalf of direct and indirect purchasers of CRTs and products incorporating CRTs. These complaints assert claims under federal antitrust law, as well as various state antitrust and unfair competition laws and may involve joint and several liability among the named defendants. These actions have been consolidated by the Judicial Panel for Multidistrict Litigation for pretrial proceedings in the United States District Court for the Northern District of California.
In 2012 a settlement agreement was approved between the Company and counsel for direct purchaser plaintiffs fully resolving all claims of the direct purchaser class and obtaining a complete release by class members. Sixteen individual plaintiffs, principally large retailers of CRT products who sought exclusion from the direct purchaser class settlement, filed separate “opt-out” actions against Philips and other defendants based on the same substantive allegations as the putative class plaintiff complaints. These cases are consolidated for pre-trial purposes with the putative class actions in the Northern District of California and discovery is being coordinated. Philips’ motions to dismiss the complaints of the individual plaintiffs have been denied. Trials on the individual claims have not yet been scheduled.
On September 24, 2013 a class of indirect purchasers was certified pursuant to F.R.C.P. 23. Discovery is proceeding in the indirect purchaser action and a trial on these claims is currently scheduled for 2015. Philips intends to continue to vigorously defend these indirect purchaser and individual lawsuits.
In addition, the state attorneys general of California, Florida, Illinois, Oregon and Washington filed actions against Philips and other defendants seeking to recover damages on behalf of the states and, in parens patriae capacity, their consumers. In 2012 the Florida complaint was withdrawn. In 2013 a settlement agreement with the state attorney general of California has been approved. The actions brought by the state attorneys general of Illinois, Oregon and Washington are pending in the respective state courts of the plaintiffs. The Courts have not set trial dates and there is no timetable for the resolution of these cases. Philips intends to continue to vigorously defend these remaining lawsuits.
Certain Philips group companies have also been named as defendants, in proposed class proceedings in Ontario, Quebec and British Columbia, Canada, along with numerous other participants in the industry. At this time, no statement of defense has been filed, no certification motion has been scheduled and no class proceeding has been certified as against the Philips defendants. Philips intends to vigorously oppose these claims.
Due to the considerable uncertainty associated with certain of these matters, on the basis of current knowledge, the Company has concluded that potential losses cannot be reliably estimated with respect to these matters. These investigations and litigation could have a materially adverse effect on the Company’s consolidated financial position, results of operations and cash flows.
In addition to the above cases, in 2006 Italian investor Mr. Carlo Vichi filed a claim against Philips for the repayment of a 2002 EUR 200 million loan (plus interest and damages) that was given to an affiliate of the CRT joint venture LG.Philips Displays (“LPD”) that went bankrupt in January of 2006. One of the issues in the case was whether LPD’s alleged participation in the CRT cartel as determined by the European Commission was a matter that should have been disclosed to Mr. Vichi. The trial in the case took place in December 2012 and after a period of post-trial briefing, the Delaware Chancery Court ruled in favor of Philips on February 18, 2014. The decision is subject to appeal to the Delaware Supreme Court.
Optical Disc Drive (ODD)
On October 27, 2009, the Antitrust Division of the United States Department of Justice confirmed that it had initiated an investigation into possible anticompetitive practices in the Optical Disc Drive (ODD) industry. Philips Lite-On Digital Solutions Corp. (PLDS), a joint venture owned by the Company and Lite-On IT Corporation, as an ODD market participant, is included in this investigation. PLDS and the Company have been accepted under the Corporate Leniency program of the US Department of Justice and have continued to cooperate with the authorities in these investigations. On this basis, the Company expects to be immune from governmental fines.
In July 2012, the European Commission issued a Statement of Objections addressed to (former) ODD suppliers including the Company. The European Commission granted the Company immunity from fines, conditional upon the Company’s continued cooperation. The Company responded to the Statement of Objections both in writing and at an oral hearing. PLDS is also subject to similar investigations outside the US and Europe relating to the ODD market. Where relevant, the Company is cooperating with the authorities.
Subsequent to the public announcement of these investigations in 2009, the Company, PLDS and Philips & Lite-On Digital Solutions USA, Inc. (PLDS USA), among other industry participants, were named as defendants in numerous class action antitrust complaints filed in various federal district courts in the United States. These actions allege anticompetitive conduct by manufacturers of ODDs and seek treble damages on behalf of direct and indirect purchasers of ODDs and products incorporating ODDs. These complaints assert claims under federal antitrust law, as well as various state antitrust and unfair competition laws and may involve joint and several liability among the named defendants. These actions have been consolidated for pre-trial proceedings in the United States District Court for the Northern District of California.
Consolidated Amended Complaints were filed by direct and indirect purchasers. The defendants’ motions to dismiss these Complaints were denied and Philips has filed Answers to the Complaints. Discovery is proceeding. Plaintiffs filed motions seeking to certify the putative classes of direct and indirect purchasers under F.R.C.P. Rule 23 in May 2013, and Defendants have filed responses opposing class certification. Plaintiffs are scheduled to file reply briefs in February 2014, and oral argument will be scheduled after briefing is complete. In addition, five individual entities have filed separate actions against the Company, PLDS, PLDS USA and other defendants. The allegations contained in these individual complaints are substantially identical to the allegations in the direct purchaser class complaints. The Company is in the process of submitting answers to these various individual complaints. All of these matters have been consolidated into the action in the Northern District of California for pre-trial purposes and discovery is being coordinated. The Company intends to vigorously defend all of the civil actions in the US courts.
Also, in June 2013, the State of Florida filed a separate complaint in the Northern District of California against the Company, PLDS, PLDS USA and other defendants containing largely the same allegations as the class and individual complaints. Florida seeks to recover damages sustained in its capacity as a buyer of ODDs and, in its parens patriae capacity, on behalf of its citizens. This case has been joined with the ODD class action cases in the Northern District of California for pre-trial purposes. The Company intends to seek dismissal of the Florida complaint. The Company and certain Philips group companies have also been named as defendants, in proposed class proceedings in Ontario, Quebec, British Columbia, and Manitoba, Canada along with numerous other participants in the industry. These complaints assert claims against various ODD manufacturers under federal competition laws as well as tort laws and may involve joint and several liability among the named defendants. Philips intends to vigorously defend these lawsuits.
Due to the considerable uncertainty associated with these matters, on the basis of current knowledge, the Company has concluded that potential losses cannot be reliably estimated with respect to these matters. These investigations and litigation could have a materially adverse effect on the Company’s consolidated financial position, results of operations and cash flows.
Smart card chips
Philips is part of an investigation by the European Commission into alleged anti-competitive conduct in the period September 2003 to September 2004 relating to the former Philips smart card chips business. This business was part of Philips’ former Product Division Semiconductors, which was divested in 2006. The European Commission issued its Statement of Objections on April 22, 2013. The Company responded to the Statement of Objections both in writing and at a hearing. Based on our current knowledge, the Company does not believe that this investigation will have a materially adverse effect on the Company’s consolidated financial position.
196 Annual Report 2013
11 Group financial statements 11.9 - 11.9
Cash from (used for) derivatives and current financial assets
A total of EUR 93 million cash was paid with respect to foreign exchange derivative contracts related to financing activities (2012: EUR 47 million outflow; 2011: EUR 25 million inflow).
A total of EUR 8 million was paid with respect to current financial assets (2012: EUR 1 million inflow; 2011: EUR 1 million inflow).
Purchase and proceeds from non-current financial assets
In 2013, there were no significant cash flows resulting from investing activities.
In 2012, the cash outflow was mainly due to loans provided to TPV Technology Limited and TP Vision venture in connection with the divestment of the Television business (EUR 151 million in aggregate).
In 2011, the sale of Philips’ interest in TCL Corporation (TCL) and Digimarc generated cash totaling EUR 79 million.
Assets in lieu of cash from sale of businesses
In 2013, there were no transactions related to the sale of businesses that involved assets in lieu of cash.
In 2012, Philips received certain financial instruments in exchange for the transfer of its television business. At the date of this transaction the fair value of these financial instruments involved an amount of EUR 17 million.
In 2011, the Company entered into four transactions with different venture capital partners where certain incubator activities were transferred in exchange for shares in separately established investment entities. The investment entities represented a value of EUR 18 million at the date that these transactions were closed.
Post-employment benefits
Employee post-employment plans have been established in many countries in accordance with the legal requirements, customs and the local practice in the countries involved.
The Company sponsors a number of defined-benefit pension plans. The benefits provided by these plans are based on employees’ years of service and compensation levels. The Company also sponsors a limited number of defined-benefit retiree medical plans. The benefits provided by these plans are typically covering a part of the healthcare insurance costs after retirement. Most employees that take part in a Company pension plan however are covered by defined-contribution (DC) pension plans.
The largest defined-benefit pension plans are in;
The United Kingdom (UK) and
Together these plans account for more than 90% of the total defined- benefit obligation and plan assets.
The Netherlands
The pension plan in the Netherlands is of a defined-benefit nature. The annual accrual rate in this career average pay plan that covers all employees covered under the Collective Labour Agreement is 1.85% of the pension salary. Executives are in a ‘hybrid plan’ with an accrual rate of 1.25% per service year next to a DC contribution, the level of which depends on the executive grade. Both plans are executed by the Company Pension Fund.
Indexation of benefits is conditional and depends among others on the statutory and regulatory funding ratio of the Fund. The Company is required to fund the annual service cost plus surcharges for solvency requirements, costs and a contribution for indexation. The Company is required to pay additional surcharges in case the funded status of the Company Pension Fund drops below an agreed level. The Company is entitled to discounts and refunds if the funded status of the Company Pension Fund exceeds an agreed surplus level.
Following the new Collective Labour Agreement with the respective trade unions in 2013 a new funding agreement has been agreed with the Trustees of the Company Pension Fund. Under the new funding agreement, which becomes effective January 1, 2014, the Company has no further financial obligation to the Pension Fund other than to pay an agreed fixed contribution for the annual accrual of active members. Although the new funding agreement will de-risk the plan, the annual premium can be subject to variability after five years due to potential discounts and as a result, the plan continues to be accounted for as a defined benefit plan. The other changes in the plan are a new pensionable age of 67 (was 65) and the introduction of an employee contribution. These changes had practically no impact on the existing defined benefit obligation. For further details we refer to note 36, Subsequent events.
United Kingdom The UK plan is executed by a Company Pension Fund.Fund currently being wound up. In the UK plan the accrual of new benefits ceased in 2011. A legally mandatory indexation for accrued benefits still applies. The Company does not pay regular contributions, other than an agreed portion of the administration costs. The UK plan assets until September 2013 contained a high concentration of NXP shares. The NXP shares were transferred to the Fund by the Company in 2010 as part of a recovery plan and have by now all been sold by the UK Fund. In 2013November 2015 the Trustee of the UK Fund entered into atwo further bulk insurance contractcontracts - a buy-in contracts - which providesprovide for payment in respect of all remaining parts of the Fund’s pensioners not covered under earlier buy-in contracts. Subsequently, the Company requested the Trustee for a wind-up of the UK Fund in December 2015 resulting in a complete buy-out of the plan. As part of the Fund’s pensioners.buy-out, an additional payment of EUR 305 million was made by the Company to the insurance company taking over the plan liabilities. The asset value related tobuy-out triggers a complete settlement of the UK defined benefit plan. The existing surplus before the extra payment was EUR 375 million. As this buy-in includedsurplus was not recognized in the UKbalance sheet, due to the asset ceiling test, per the Company’s accounting policy the Company did not recognize this as a settlement result in the income statement but in remeasurements for pensions in the Consolidated statements of Comprehensive Income. However, the above mentioned payment of EUR 305 million for EUR 274 million is booked as a related settlement loss in the income statement and for EUR 31 million as a past service cost in the income statement being the increase in the DBO for a plan assets equalschange required by the defined-benefit obligationInsurers. Before and during the wind up of the related pensionersFund several other de-risking actions were held resulting in a settlement loss of EUR 27 million and isa past service cost gain of EUR 508 million per December 31, 2013.14 million.
United States The US defined-benefitdefined benefit plan covers certain hourly workers and salaried workers hired before January 1, 2005. The accrual for salaried workers in the US plan will end per December 31, 2015. The announcement in 2013 of this delayed freeze in the US plan triggered a past service cost gain of EUR 78 million. In the same US plan in 2013 a large group of terminated vested employees accepted a lump-sum offering thus lowering the plan assets and liabilities. The related settlement result was a loss of EUR 31 million.
Indexation of benefits is not mandatory. The Company pays contributions for the annual service costs as well as additional contributions to cover a deficit. The assets of the US plan are in a Trust governed by Trustees. The accrual for salaried workers in the US plan as decided in 2013 would end per December 31, 2015 after which the remaining members become eligible for the existing US DC plan. In 2015 the end date was accelerated to July 1, 2015 triggering a EUR 1 million past service cost gain. In 2015 in preparation of the split of the Company into Lighting Solutions and HealthTech the benefits of a group of former US employees not having worked for any of the current businesses were transferred to a separate plan covered by ERISA section 4044, which ensures a correct split of the plan assets among others based on the maturity of the plan. In October 2015 all the benefits of this plan were transferred to a consortium of three insurance companies. The Company made a EUR 141 million contribution to the plan to enable the transfer. The transfer to the insurance companies triggered a settlement of the plan. The difference between the DBO and settlement price at transfer date amounted to EUR 33 million and is recognized as a settlement loss in the income statement. The effects of ERISA section 4044 for the surviving defined benefit plan will be adjusted by a contribution to the surviving plan early in 2016 which is included in the 2016 cash projection further on in this note. A de-risking action held in the remaining pension plan providing lump sums resulted in a EUR 6 million settlement gain. Risks related to defined-benefit plans These defined-benefitThe remaining defined benefit plans expose the Company to various demographic and economic risks such as longevity risk, investment risks, currency and interest rate risk and in some cases inflation risk. The latter plays a role in the assumed wage increase and in the UK plansome smaller plans where indexation is mandatory.
Pension fund Trustees are responsible for and have full discretion over the investment strategy of the plan assets. In general Trustees manage pension fund risks by diversifying the investments of plan assets and by (partially) matching interest rate risk of liabilities. The Company has an active deriskingde-risking strategy in which it constantly looks for opportunities to reduce the risks associated with its defined benefit plans. Liability driven investment strategies, lump sum cash-out options, buy-ins, buy-outs and the above mentioned 2015 change in the funding ofto DC for the Dutch plan and the other settlements are examples of that strategy. The larger plans are either governed by independent Boards or by Trustees who have a legal obligation to evenly balance the interests of all stakeholders and operate under the local regulatory framework. Balance sheet positions The net balance sheet position presented in this note can be explained as follows: The surplusessurplus in our plansplan in The Netherlands, UK as well some other countries areBrazil is not recognized as a net defined benefit asset because in The Netherlands the current surplus will not bring sufficient future economic benefits to the Company (asset ceiling restrictions) whereasBrazil the regulatory framework in the other countries involved explicitly prohibits refunds to the employer. The deficit of the US defined-benefitdefined benefit plan presented under other liabilities and the provisions of the unfunded plans therefore count for the largest part of the net balance sheet position. The measurement date for all defined-benefit plans is December 31. Annual Report 2013 1972015 177
11 Group financial statements 11.9 - 11.912.9
Summary of pre-tax costs for post-employment benefits The below table contains the total of current- and past service costs, adminadministration costs and settlement results as included in operating costIncome from operations and the interest cost as included in financial income and expense.Financial expenses. | | | | | | | | | | | | | | | | 2011 | | | 2012 | | | 2013 | | Defined-benefit plans | | | 253 | | | | 290 | | | | 297 | | included in operating cost | | | 155 | | | | 205 | | | | 223 | | included in financial expense | | | 93 | | | | 85 | | | | 71 | | included in discontinued operations | | | 5 | | | | — | | | | 3 | | Defined-contribution plans including multi-employer plans | | | 123 | | | | 144 | | | | 142 | | included in operating cost | | | 117 | | | | 139 | | | | 139 | | included in discontinued operations | | | 6 | | | | 5 | | | | 3 | |
Defined-benefitDefined benefit plans: Pensions
Movements in the net liabilities and - assets for defined benefit pension plans: Philips Group | | | | | | | | | | | | | | | | | | | | | | | | | | | | | | | | | | 2012 | | | | | | | | | 2013 | | | | | Netherlands | | | other | | | total | | | Netherlands | | | other | | | total | | Defined-benefit obligation at the beginning of year | | | 13,294 | | | | 8,920 | | | | 22,214 | | | | 14,433 | | | | 9,021 | | | | 23,454 | | Service cost | | | 170 | | | | 81 | | | | 251 | | | | 183 | | | | 77 | | | | 260 | | Interest cost | | | 502 | | | | 388 | | | | 890 | | | | 467 | | | | 351 | | | | 818 | | Employee contributions | | | — | | | | 4 | | | | 4 | | | | — | | | | 4 | | | | 4 | | Actuarial (gains) / losses | | | | | | | | | | | | | | | | | | | | | | | | | – demographic assumptions | | | 133 | | | | 64 | | | | 197 | | | | 205 | | | | 17 | | | | 222 | | – financial assumptions | | | 1,151 | | | | 358 | | | | 1,509 | | | | (214 | ) | | | (385 | ) | | | (599 | ) | – experience adjustment | | | (76 | ) | | | 8 | | | | (68 | ) | | | (75 | ) | | | (32 | ) | | | (107 | ) | (Negative) past service cost | | | (25 | ) | | | (6 | ) | | | (31 | ) | | | (1 | ) | | | (80 | ) | | | (81 | ) | Divestments | | | — | | | | (13 | ) | | | (13 | ) | | | — | | | | (3 | ) | | | (3 | ) | Settlements | | | — | | | | (294 | ) | | | (294 | ) | | | — | | | | (279 | ) | | | (279 | ) | Benefits paid | | | (716 | ) | | | (465 | ) | | | (1,181 | ) | | | (704 | ) | | | (462 | ) | | | (1,166 | ) | Exchange rate differences | | | — | | | | (36 | ) | | | (36 | ) | | | — | | | | (318 | ) | | | (318 | ) | Miscellaneous | | | — | | | | 12 | | | | 12 | | | | — | | | | — | | | | — | | | | | | | Defined-benefit obligation at end of year | | | 14,433 | | | | 9,021 | | | | 23,454 | | | | 14,294 | | | | 7,911 | | | | 22,205 | | Present value of funded obligations at end of year | | | 14,426 | | | | 8,168 | | | | 22,594 | | | | 14,288 | | | | 7,112 | | | | 21,400 | | Present value of unfunded obligations at end of year | | | 7 | | | | 853 | | | | 860 | | | | 6 | | | | 799 | | | | 805 | | | | | | | | 2012 | | | 2013 | | | | | Netherlands | | | other | | | total | | | Netherlands | | | other | | | total | | Fair value of plan assets at beginning of year | | | 13,946 | | | | 7,303 | | | | 21,249 | | | | 15,203 | | | | 7,588 | | | | 22,791 | | Interest income on plan assets | | | 531 | | | | 337 | | | | 868 | | | | 496 | | | | 317 | | | | 813 | | Admin expenses paid | | | (4 | ) | | | (5 | ) | | | (9 | ) | | | (9 | ) | | | (5 | ) | | | (14 | ) | Return on plan assets excluding interest income | | | 1,237 | | | | 460 | | | | 1,697 | | | | (426 | ) | | | (338 | ) | | | (764 | ) | Employee contributions | | | — | | | | 4 | | | | 4 | | | | — | | | | 4 | | | | 4 | | Employer contributions | | | 209 | | | | 216 | | | | 425 | | | | 283 | | | | 187 | | | | 470 | | Divestments | | | — | | | | (1 | ) | | | (1 | ) | | | — | | | | (1 | ) | | | (1 | ) | Settlements | | | — | | | | (294 | ) | | | (294 | ) | | | — | | | | (311 | ) | | | (311 | ) | Benefits paid | | | (716 | ) | | | (407 | ) | | | (1,123 | ) | | | (704 | ) | | | (407 | ) | | | (1,111 | ) | Exchange rate differences | | | — | | | | (25 | ) | | | (25 | ) | | | — | | | | (306 | ) | | | (306 | ) | | | | | | Fair value of plan assets at end of year | | | 15,203 | | | | 7,588 | | | | 22,791 | | | | 14,843 | | | | 6,728 | | | | 21,571 | | | | | | | Funded status | | | 770 | | | | (1,433 | ) | | | (663 | ) | | | 549 | | | | (1,183 | ) | | | (634 | ) | Unrecognized net assets | | | (777 | ) | | | (586 | ) | | | (1,363 | ) | | | (555 | ) | | | (428 | ) | | | (983 | ) | | | | | | Net balance sheet position | | | (7 | ) | | | (2,019 | ) | | | (2,026 | ) | | | (6 | ) | | | (1,611 | ) | | | (1,617 | ) |
Pre-tax costs for post-employment benefits in millions of EUR 2013 - 2015 | | | | | | | | | | | | | | | | | | | | | 2013 | | | 2014 | | | 2015 | | | | | | | Defined-benefit plans | | | 297 | | | | 245 | | | | 561 | | included in operating cost | | | 220 | | | | 182 | | | | 487 | | included in financial expense | | | 71 | | | | 59 | | | | 72 | | included in discontinued operations | | | 6 | | | | 4 | | | | 2 | | Defined-contribution plans including multi-employer plans | | | 142 | | | | 148 | | | | 299 | | included in operating cost | | | 134 | | | | 144 | | | | 293 | | included in discontinued operations | | | 8 | | | | 4 | | | | 6 | | | | | | |
Philips Group Defined-benefit obligations in millions of EUR 2014 - 2015 | | | | | | | | | | | | | | | | | | | | | | | | | | | | | | | | | | | | | | | 2014 | | | | | | | | | 2015 | | | | | | | | | | Netherlands | �� | | other | | | total | | | Netherlands | | | other | | | total | | | | | | | Balance as of January 1 | | | 14,294 | | | | 7,911 | | | | 22,205 | | | | 17,616 | | | | 9,465 | | | | 27,081 | | Service cost | | | 174 | | | | 65 | | | | 239 | | | | 77 | | | | 60 | | | | 137 | | Interest cost | | | 478 | | | | 361 | | | | 839 | | | | 120 | | | | 345 | | | | 465 | | Employee contributions | | | 5 | | | | 4 | | | | 9 | | | | 5 | | | | 4 | | | | 9 | | Actuarial (gains) / losses | | | | | | | | | | | | | | | | | | | | | | | | | – demographic assumptions | | | (80 | ) | | | 197 | | | | 117 | | | | — | | | | — | | | | — | | – financial assumptions | | | 3,487 | | | | 782 | | | | 4,269 | | | | 1,796 | | | | (271 | ) | | | 1,525 | | – experience adjustment | | | 23 | | | | 25 | | | | 48 | | | | (176 | ) | | | 27 | | | | (149 | ) | (Negative) past service cost | | | (68 | ) | | | (1 | ) | | | (69 | ) | | | — | | | | 14 | | | | 14 | | Acquisitions | | | — | | | | 12 | | | | 12 | | | | — | | | | — | | | | — | | Divestments | | | — | | | | — | | | | — | | | | — | | | | (12 | ) | | | (12 | ) | Settlements | | | — | | | | (9 | ) | | | (9 | ) | | | (19,197 | ) | | | (5,193 | ) | | | (24,390 | ) | Benefits paid | | | (699 | ) | | | (506 | ) | | | (1,205 | ) | | | (234 | ) | | | (553 | ) | | | (787 | ) | Exchange rate differences | | | — | | | | 624 | | | | 624 | | | | | | | | 635 | | | | 635 | | Miscellaneous | | | 2 | | | | — | | | | 2 | | | | — | | | | (1 | ) | | | (1 | ) | | | | | | Balance as of December 31 | | | 17,616 | | | | 9,465 | | | | 27,081 | | | | 7 | | | | 4,520 | | | | 4,527 | | Present value of funded obligations at December 31 | | | 17,609 | | | | 8,532 | | | | 26,141 | | | | — | | | | 3,635 | | | | 3,635 | | Present value of unfunded obligations at December 31 | | | 7 | | | | 933 | | | | 940 | | | | 7 | | | | 885 | | | | 892 | | | | | | | Philips Group Plan assets in millions of EUR 2014 - 2015 | | | | | | | | | | | | | | | | | | | | | | | | | | | | | | | | | | | | | | | 2014 | | | | | | | | | 2015 | | | | | | | | | | Netherlands | | | other | | | total | | | Netherlands | | | other | | | total | | | | | | | Balance as of January 1 | | | 14,843 | | | | 6,728 | | | | 21,571 | | | | 17,847 | | | | 8,016 | | | | 25,863 | | Interest income on plan assets | | | 508 | | | | 330 | | | | 838 | | | | 123 | | | | 311 | | | | 434 | | Admin expenses paid | | | (9 | ) | | | (6 | ) | | | (15 | ) | | | (3 | ) | | | (6 | ) | | | (9 | ) | Return on plan assets excluding interest income | | | 2,534 | | | | 674 | | | | 3,208 | | | | 1,233 | | | | (315 | ) | | | 918 | | Employee contributions | | | 5 | | | | 4 | | | | 9 | | | | 5 | | | | 4 | | | | 9 | | Employer contributions | | | 665 | | | | 199 | | | | 864 | | | | 245 | | | | 302 | | | | 547 | | Divestments | | | — | | | | — | | | | — | | | | — | | | | (7 | ) | | | (7 | ) | Settlements | | | — | | | | (8 | ) | | | (8 | ) | | | (19,217 | ) | | | (5,623 | ) | | | (24,840 | ) | Benefits paid | | | (699 | ) | | | (445 | ) | | | (1,144 | ) | | | (233 | ) | | | (492 | ) | | | (725 | ) | Exchange rate differences | | | — | | | | 540 | | | | 540 | | | | — | | | | 520 | | | | 520 | | | | | | | Balance as of December 31 | | | 17,847 | | | | 8,016 | | | | 25,863 | | | | — | | | | 2,710 | | | | 2,710 | | Funded status | | | 231 | | | | (1,449 | ) | | | (1,218 | ) | | | (7 | ) | | | (1,810 | ) | | | (1,817 | ) | Unrecognized net assets | | | (238 | ) | | | (554 | ) | | | (792 | ) | | | — | | | | (90 | ) | | | (90 | ) | | | | | | Net balance sheet position | | | (7 | ) | | | (2,003 | ) | | | (2,010 | ) | | | (7 | ) | | | (1,900 | ) | | | (1,907 | ) | | | | | |
198178 Annual Report 20132015
11 Group financial statements 11.9 - 11.912.9
The classification of the net balance is as follows: Philips Group | | | | | | | | | | | | | | | | | | | | | | | | | | | | 2012 | | | 2013 | | | | | Netherlands | | | other | | | total | | | Netherlands | | | other | | | total | | Prepaid pension costs under other non-current assets | | | — | | | | 7 | | | | 7 | | | | — | | | | 5 | | | | 5 | | Accrued pension costs under other liabilities | | | — | | | | (1,173 | ) | | | (1,173 | ) | | | — | | | | (817 | ) | | | (817 | ) | Provision for pensions under provisions | | | (7 | ) | | | (853 | ) | | | (860 | ) | | | (6 | ) | | | (799 | ) | | | (805 | ) | | | | | | | | | (7 | ) | | | (2,019 | ) | | | (2,026 | ) | | | (6 | ) | | | (1,611 | ) | | | (1,617 | ) |
ChangesNet balance of defined-benefit pension plans in the effectmillions of the asset ceilingEUR
2014 - 2015 | | | | 2012 | | 2013 | | | | | | | | | Netherlands | | | other | | total | | Netherlands | | other | | total | | | | | | | 2014 | | | | | | 2015 | | Unrecognized assets at the beginning of year | | | 660 | | | | 399 | | | | 1,059 | | | | 777 | | | | 586 | | | | 1,363 | | | | | | | | | | | | | Netherlands | | other | | total | | Netherlands | | other | | total | | | | | | | | Prepaid pension costs under other non-current assets | | | | — | | | | 2 | | | | 2 | | | | — | | | | 3 | | | | 3 | | Accrued pension costs under other liabilities | | | | — | | | | (1,072 | ) | | | (1,072 | ) | | | — | | | | (1,018 | ) | | | (1,018 | ) | Provision for pensions under provisions | | | | (7 | ) | | | (926 | ) | | | (933 | ) | | | (7 | ) | | | (885 | ) | | | (892 | ) | Provision in assets held for sale | | | | — | | | | (7 | ) | | | (7 | ) | | | — | | | | — | | | | — | | | | | | | | Net balance of defined-benefit plans | | | | (7 | ) | | | (2,003 | ) | | | (2,010 | ) | | | (7 | ) | | | (1,900 | ) | | | (1,907 | ) | | | | | | | Philips Group Changes in the effect of the asset ceiling in millions of EUR 2014 - 2015 | | | | | | | | | | | | | | | | | | | | 2014 | | | | | | 2015 | | | | | | | | | | | | Netherlands | | other | | total | | Netherlands | | other | | total | | | | | | | | Balance as of January 1 | | | | 555 | | | | 428 | | | | 983 | | | | 238 | | | | 554 | | | | 792 | | Interest on unrecognized assets | | | 26 | | | | 25 | | | | 51 | | | | 25 | | | | 31 | | | | 56 | | | | 19 | | | | 28 | | | | 47 | | | | 2 | | | | 27 | | | | 29 | | Remeasurements | | | 91 | | | | 173 | | | | 264 | | | | (247 | ) | | | (155 | ) | | | (402 | ) | | | (336 | ) | | | 73 | | | | (263 | ) | | | (240 | ) | | | (493 | ) | | | (733 | ) | Exchange rate differences | | | — | | | | (11 | ) | | | (11 | ) | | | — | | | | (34 | ) | | | (34 | ) | | | — | | | | 25 | | | | 25 | | | | — | | | | 2 | | | | 2 | | | | | | | | | | | Unrecognized assets at the end of year | | | 777 | | | | 586 | | | | 1,363 | | | | 555 | | | | 428 | | | | 983 | | | Balance as of December 31 | | | | 238 | | | | 554 | | | | 792 | | | | — | | | | 90 | | | | 90 | | | | | | | |
Plan assets allocation The asset allocation in the Company’s pension plans at December 31 was as follows: Philips Group | | | | | | | | | | | | | | | | | | | | | | | 2012 | | | | | | 2013 | | | | | Netherlands | | | other | | | Netherlands | | | other | | Matching portfolio: | | | | | | | | | | | | | | | | | - Debt securities | | | 11,734 | | | | 6,106 | | | | 11,238 | | | | 4,282 | | Return portfolio: | | | | | | | | | | | | | | | | | - Equity securities | | | 2,366 | | | | 1,083 | | | | 2,524 | | | | 910 | | - Real estate | | | 683 | | | | 19 | | | | 790 | | | | 9 | | - Other | | | 420 | | | | 380 | | | | 291 | | | | 1,527 | | | | | | | | | | 15,203 | | | | 7,588 | | | | 14,843 | | | | 6,728 | |
Plan assets allocation in millions of EUR 2014 - 2015 | | | | | | | | | | | | | | | | | | | | | | | | | | 2014 | | | | | 2015 | | | | | | | | | | Netherlands | | | other | | | Netherlands | | other | | | | | | | Matching portfolio: | | | | | | | | | | | | | | | - Debt securities | | | 10,663 | | | | 5,051 | | | | | | 1,523 | | - Other | | | — | | | | 1,299 | | | | | | | | Return portfolio: | | | | | | | | | | | | | | | - Equity securities | | | 5,088 | | | | 388 | | | | | | 740 | | - Real estate | | | 1,784 | | | | 13 | | | | | | 9 | | - Other | | | 312 | | | | 1,265 | | | | | | 438 | | | | | | | Total assets | | | 17,847 | | | | 8,016 | | | | | | 2,710 | | | | | | |
Asset values related to buy-in contracts are now included in the Matching portfolio under Other. The assets in 20132015 contain 14% (2012: 11%51% (2014: 17%) unquoted assets, the increase compared to 2012 mainly2014 fully related to the buy-in value inexclusion of the UK plan.and NL plan assets. Plan assets in 20132015 do not include property occupied by or financial instruments issued by the CompanyCompany. Assumptions The mortality tables used for the Company’s major schemes are: Netherlands: Prognosis table 2012-20622014 including experience rating TW2012.TW2014. United Kingdom retirees:UK: SAPS 2002- Core CMI 2011 projection
United States: RP2000 CHUS: RP2014 HA/EE Fully Generational scaled with MP2014
In the US the issued MP-2015 mortality improvement scale, not adopted by the Company yet due to the limited extra period (2 years) of observation, would lower the DBO by about EUR 40 million. The weighted averages of the assumptions used to calculate the defined- benefitdefined-benefit obligations as of December 31 were as follows: Philips Group | | | | | | | | | | | | | | | | | | | | | | | 2012 | | | | | | 2013 | | | | | Netherlands | | | other | | | Netherlands | | | other | | Discount rate | | | 3.3 | % | | | 4.1 | % | | | 3.4 | % | | | 4.5 | % | Rate of compensation increase | | | * | | | | 3.3 | % | | | * | | | | 3.2 | % |
Assumptions used for defined-benefit obligations in % 2014 - 2015 * | The rate of compensation increase for the Netherlands consists of a general compensation increase and an individual salary increase based on merit, seniority and promotion. In 2013 the Company determined new turnover- and disability rates and individual salary rates for all active participants based on the period 2010-2012. The individual increase at the average age of 45 is 1.75% (2012 0.75% for CLA A). The indexation assumption used to calculate the defined benefit obligations for the Netherlands is 1.0% (2012: 1.0%). |
| | | | | | | | | | | | | | | | | | | | | | | | | | | | 2014 | | | | | | 2015 | | | | | | | | | | Netherlands | | | other | | | Netherlands | | | other | | | | | | | Discount rate | | | 2.1 | % | | | 3.7 | % | | | — | | | | 4.0 | % | Rate of compensation increase | | | 2.0 | % | | | 3.0 | % | | | — | | | | 2.7 | % | | | | | |
The (average)Discount rate for the Netherlands at the moment of the change to DC was 1.55%. Due to the nature of the pension plan in the Netherlands until May 1, 2015 an assumption was required for the future pension accrual rate. If the fixed premium did not cover the cost of the target accrual of 1.85% per annum a lower percentage must be applied for which the cost will be covered by the fixed premium. The Fund in the Netherlands has set aside part of the EUR 600 million received for active members accrual or indexation. The accrual rate for the next 5 years starting 2015 was expected to be 1.85% but per 31 December 2014 the average future accrual rate used to calculate the defined-benefit obligation and service cost was fixed at 1.74% as after the five year period a lower percentage would apply assuming the current fixed premium level. Per May 1, 2015 this no longer applies due to the change to DC. The average duration of the DBOdefined-benefit obligation of the pension plans is 1510 years for the Netherlands (2012: 14 years) and 11 years for other countries (2012: 11(2014: 12 years). Annual Report 2015 179
Group financial statements 12.9 Defined-benefit plans: retiree medical plans Movements in the net liability for retiree medical plans: | | | | | | | | | | | | 2012 | | | 2013 | | Defined-benefit obligation at the beginning of year | | | 269 | | | | 250 | | Service cost | | | 1 | | | | 1 | | Interest cost | | | 12 | | | | 10 | | Actuarial (gains) or losses arising from: | | | | | | | | | – financial assumptions | | | 1 | | | | (17 | ) | Past service cost | | | (25 | ) | | | — | | Benefits paid | | | (17 | ) | | | (15 | ) | Exchange rate differences | | | (6 | ) | | | (16 | ) | Miscellaneous | | | 15 | | | | — | | | | | | | Defined-benefit obligation at end of year | | | 250 | | | | 213 | | | | | Present value of funded obligations at end of year | | | — | | | | — | | Present value of unfunded obligations at end of year | | | 250 | | | | 213 | | | | | Funded status | | | (250 | ) | | | (213 | ) | | | | | | Net balances | | | (250 | ) | | | (213 | ) | | | | Classification of the net balance is as follows: | | | | | | | | | Provision for other postretirement benefits | | | (250 | ) | | | (213 | ) |
Philips Group Annual Report 2013 199Liability for retiree medical plans in millions of EUR
 11 Group financial statements 11.9 11 Group financial statements 11.911.9
2015 | | | | | | | | | | | | | | | | | 2014 | | | 2015 | | | | | | | Balance as of January 1 | | | 213 | | | | 241 | | Service cost | | | 2 | | | | — | | Interest cost | | | 11 | | | | 12 | | Actuarial (gains) or losses arising from: | | | | | | | | | – Demographic assumptions | | | 3 | | | | — | | – Financial assumptions | | | 9 | | | | (2 | ) | – Experience adjustment | | | (3 | ) | | | (17 | ) | Past service cost | | | — | | | | — | | Benefits paid | | | (15 | ) | | | (13 | ) | Exchange rate differences | | | 21 | | | | 9 | | | | | | | Balance as of December 31 | | | 241 | | | | 230 | | | | | Present value of funded obligations as of December 31 | | | — | | | | — | | Present value of unfunded obligations as of December 31 | | | 241 | | | | 230 | | | | | Funded status | | | (241 | ) | | | (230 | ) | | | | | | Net balances | | | (241 | ) | | | (230 | ) | | | | Classification of the net balance is as follows: | | | | | | | | | Provision for other postretirement benefits | | | (241 | ) | | | (230 | ) | | | | | |
The weighted average assumptions used to calculate the defined benefitdefined-benefit obligations for retiree medical plans as of December 31 were as follows: Philips Group | | | | | | | | | | | | 2012 | | | 2013 | | Discount rate | | | 4.5 | % | | | 4.8 | % | Compensation increase (where applicable) | | | — | | | | — | |
Weighted average assumptions for retiree medical plans in % 2014 - 2015 | | | | | | | | | | | | | | | | | 2014 | | | 2015 | | | | | | | Discount rate | | | 5.0 | % | | | 5.1 | % | Compensation increase (where applicable) | | | 0.0 | % | | | 0.0 | % | | | | | |
Assumed healthcare cost trend rates at December 31: Philips Group | | | | | | | | | | | | 2012 | | | 2013 | | Healthcare cost trend rate assumed for next year | | | 7.5 | % | | | 7.5 | % | Rate that the cost trend rate will gradually reach | | | 5.2 | % | | | 5.2 | % | Year of reaching the rate at which it is assumed to remain | | | 2019 | | | | 2019 | |
Assumed healthcare cost trend rates in % 2014 - 2015 | | | | | | | | | | | | | | | | | 2014 | | | 2015 | | | | | | | Healthcare cost trend rate assumed for next year | | | 7.0 | % | | | 7.5 | % | Rate that the cost trend rate will gradually reach | | | 5.3 | % | | | 5.3 | % | Year of reaching the rate at which it is assumed to remain | | | 2024 | | | | 2025 | | | | | | |
The average duration of the DBOdefined-benefit obligation of the retiree medical plans is 98 years (2012:(2014: 8 years). Investment policy in our largest pension plans It must be acknowledged that trustees of the Philips pension plans are responsible for and have full discretion over the investment strategy of the plan assets. The objective of the liability hedging portfolio of the Philips pension plan in the Netherlands is to match part of the interest rate sensitivity of the plan’s inflation-linked pension liabilities (based on a 2% inflation assumption). The liability hedging portfolio is mainly invested in euro- denominated government bonds, investment grade debt securities and long-duration interest rate swaps. The size of the liability hedging portfolio is targeted to be at least 64% of the fair value of the plan’s inflation-linked pension liabilities. The objective of the return portfolio is to maximize investment returns within well-specified risk constraints. The Philips pension plan in the United Kingdom operates a fixed income portfolio that aims to fully hedge the interest rate and inflation rate sensitivities of the fair value of the plan’s pension liabilities. Part of the portfolio is invested in a buy-in policy, in which an insurance company guarantees all future benefit payments to the plan, thereby matching the investment and longevity risks of the pension liabilities covered in the buy-in policy.
The plan assets of the Philips pension plan in the United StatesUS are invested in a well diversified portfolio. The interest rate sensitivity of the fixed income portfolio is closely aligned to that of the plan’s pension liabilities. Any contributions from the sponsoring company are used to further increase the fixed income part of the assets. As part of the investment strategy, any additional investment returns of the return portfolio are used to further decrease the interest rate mismatch between the plan assets and the pension liabilities.
Cash flows and costs in 20142016 PhilipsThe Company expects considerable cash outflows in relation to employeepost-employment benefits which are estimated to amount to EUR 626660 million in 2014,2016, consisting of of:
EUR 417209 million employer contributions to defined benefit pension plans EUR 140372 million employer contributions to defined contribution pension plans EUR 5261 million expected cash outflows in relation to unfunded pension plans and EUR 1718 million in relation to unfunded retiree medical plans. The employer contributions to defined benefit pension plans are expected to amount to EUR 223174 million for the NetherlandsUS and EUR 19435 million for other countries. The Company continues to fund a part of the existing deficit in the US pension plan in 2014, which amount is included in the amounts aforementioned. For the funding of the deficit in the US plan the Group adheres to the minimum funding requirements of the US Pension Protection Act. The UK plan is currently in a surplus on a regulatory basis and does not require any funding in 2014 other than the agreed administration cost. The funding of the pension fund in the Netherlands for 2014 consists of a fixed percentage of payroll which applies for a period of 5 years. The additional contribution to the pension fund for the Netherlands is not included in the above figures. For further details we refer to note 36, Subsequent events. It is noted that the (majority of the) contribution will need to be written off through Other comprehensive income due to the asset ceiling restrictions in the pension plan in the Netherlands.
The service and administration cost for 20142016 is expected to amount to EUR 25643 million, consisting of EUR 25542 million for defined-benefit pension plans and EUR 1 million for defined-benefit retiree medical plans. The net interest expense for 20142016 is expected to amount to EUR 5466 million, consisting of EUR 4355 million for defined-benefit pension plans and EUR 11 million for defined-benefit retiree medical plans. The cost for defined- contributiondefined-contribution pension plans in 20142016 is expected to amount to EUR 140 million. 204 million in the Netherlands and EUR 168 million in other countries. Sensitivity analysis The table below illustrates the approximate impact on the defined-benefitdefined benefit obligation (DBO) if the Company were to change key assumptions. The DBO was recalculated using a change in the assumptions of 1% which overall is considered a reasonably possible change. The impact on the DBO because of changes in discount rate is normally accompanied by offsetting movements in plan assets, especially when using matching strategies. | | | | | | | | | | | | | | | | Defined benefit obligation | | | | | | | | | | | 2013 | | | | | Pension
Netherlands | | | Pension
other | | | Retiree
medical | | | Increase | | | | | | | | | | | | | Discount rate (1% movement) | | | (1,708 | ) | | | (822 | ) | | | (12 | ) | Wage increase (1% movement) | | | 165 | | | | 28 | | | | — | | Inflation (1% movement) | | | 979 | | | | 461 | | | | — | | Longevity (see explanation) | | | 355 | | | | 232 | | | | 7 | | Medical benefit level (1% price increase) | | | — | | | | — | | | | 12 | | | Decrease | | | | | | | | | | | | | Discount rate (1% movement) | | | 2,158 | | | | 962 | | | | 16 | | Wage increase (1% movement) | | | (147 | ) | | | (26 | ) | | | — | | Inflation (1% movement) | | | (876 | ) | | | (418 | ) | | | — | |
180 Annual Report 2015
Group financial statements 12.9 Philips Group Key assumptionsin millions of EUR 2015 | | | | | | | | | | | | | | | | | | Defined benefit obligation | | | | | Pension | | Pension | | | Retiree | | | | | Netherlands | | other | | | medical | | | | | | | Increase | | | | | | | | | | | Discount rate (1% movement) | | | | | (468 | ) | | | (18 | ) | Wage change (1% movement) | | | | | 23 | | | | | | Inflation (1% movement) | | | | | 115 | | | | | | Longevity (see explanation) | | | | | 80 | | | | 7 | | Medical benefit level (1% price increase) | | | | | | | | | 13 | | | Decrease | | | | | | | | | | | Discount rate (1% movement) | | | | | 550 | | | | 20 | | Wage change (1% movement) | | | | | (20 | ) | | | | | Inflation (1% movement) | | | | | (104 | ) | | | | | | | | |
Philips Group Key assumptionsin millions of EUR 2014 | | | | | | | | | | | | | | | | | | | | | Defined benefit obligation | | | | | Pension | | | Pension | | | Retiree | | | | | Netherlands | | | other | | | medical | | | | | | | | Increase | | | | | | | | | | | | | Discount rate (1% movement) | | | (2,309 | ) | | | (1,056 | ) | | | (18 | ) | Wage change (1% movement) | | | 107 | | | | 31 | | | | — | | Inflation (1% movement) | | | 1,341 | | | | 555 | | | | — | | Longevity (see explanation) | | | 492 | | | | 267 | | | | 7 | | Medical benefit level (1% price increase) | | | — | | | | — | | | | 14 | | | Decrease | | | | | | | | | | | | | Discount rate (1% movement) | | | 2,998 | | | | 1,250 | | | | 19 | | Wage change (1% movement) | | | (132 | ) | | | (28 | ) | | | — | | Inflation (1% movement) | | | (1,185 | ) | | | (486 | ) | | | — | | | | | | |
Longevity also impacts post-employment defined benefit liabilities.obligation. The above sensitivity table illustrates the impact on the defined-benefit obligation of a further 10% decrease in the assumed rates of mortality for the Company’s major schemes. A 10% decrease in assumed mortality rates equals improvement of life expectancy by 0.5 - 1 year. Changes in assumed health carehealthcare cost trend rates can have a significant effect on the amounts reported for the retiree medical plans. A one percentage-point1%-point increase in medical benefit level is therefore included in the above table as a likely scenario. Accrued liabilities Accrued liabilities are summarized as follows: Philips Pension FundGroup Accrued liabilitiesin millions of EUR 2014 - 2015 | | | | | | | | | | | | | | | | | 2014 | | | 2015 | | | | | | | Personnel-related costs: | | | | | | | | | - Salaries and wages | | | 502 | | | | 567 | | - Accrued holiday entitlements | | | 179 | | | | 180 | | - Other personnel-related costs | | | 119 | | | | 196 | | Fixed-asset-related costs: | | | | | | | | | - Gas, water, electricity, rent and other | | | 47 | | | | 53 | | Communication and IT costs | | | 51 | | | | 46 | | Distribution costs | | | 112 | | | | 107 | | Sales-related costs: | | | | | | | | | - Commission payable | | | 17 | | | | 20 | | - Advertising and marketing-related costs | | | 161 | | | | 168 | | - Other sales-related costs | | | 68 | | | | 54 | | Material-related costs | | | 132 | | | | 147 | | Interest-related accruals | | | 56 | | | | 69 | | Deferred income | | | 869 | | | | 932 | | Other accrued liabilities | | | 379 | | | | 324 | | | | | | | Accrued liabilities | | | 2,692 | | | | 2,863 | | | | | | |
Other liabilities Other non-current liabilities Other non-current liabilities are summarized as follows: Philips Group Other non-current liabilitiesin millions of EUR 2014 - 2015 | | | | | | | | | | | | | | | | | 2014 | | | 2015 | | | | | | | Accrued pension costs | | | 1,061 | | | | 970 | | Deferred income | | | 176 | | | | 257 | | Other tax liability | | | 499 | | | | 454 | | Other liabilities | | | 102 | | | | 101 | | | | | | | Other non-current liabilities | | | 1,838 | | | | 1,782 | | | | | | |
The decrease in the Netherlandsaccrued pension costs is mainly attributable to the US defined benefit plan. See also note 20, Post-employment benefits. For further details on tax related liabilities refer to note 8, Income taxes. Other current liabilities Other current liabilities are summarized as follows: Philips Group Other current liabilities in millions of EUR 2014 - 2015 | | | | | | | | | | | | | | | | | 2014 | | | 2015 | | | | | | | Accrued customer rebates that cannot be offset with accounts receivables for those customers | | | 535 | | | | 544 | | Advances received from customers on orders not covered by work in process | | | 312 | | | | 375 | | Other taxes including social security premiums | | | 176 | | | | 177 | | Other liabilities | | | 368 | | | | 177 | | | | | | | Other current liabilities | | | 1,391 | | | | 1,273 | | | | | | |
Annual Report 2015 181
Group financial statements 12.9 The decrease of the balance of other liabilities as per December 31, 2015 mainly relates to the pay out of liabilities in 2015 which were accrued as per December 31, 2014 for certain parts of the Cathode Ray Tube antitrust litigation for which the Company was able to reach settlement. The liabilities per December 31, 2014 include transfers of provisions previously recognized. For more details reference is made to note 19, Provisions and note 26, Contingent assets and liabilities - legal proceedings. Cash used for derivatives and current financial assets In relation2015, a total of EUR 193 million cash was paid with respect to foreign exchange derivative contracts related to activities for liquidity management and funding. (2014: EUR 13 million outflow; 2013: EUR 93 million outflow). In 2015, a total of EUR 121 million was received with respect to current financial assets mainly related to loans TPV Technology Limited (2014: EUR 6 million inflow; 2013: EUR 8 million outflow). Purchase and proceeds from non-current financial assets In 2015, the net cash inflow of EUR 32 million was mainly due to the fraudsale of stakes in Silicon & Software Systems and other equity interest. In 2014, the net cash inflow of EUR 26 million was mainly due to the sale of stakes in Neusoft, Chimei Innolux, and Sapiens, offset by loans provided to TPV Technology Limited. In 2013, there were no significant cash flows resulting from investing activities. Contractual obligations Philips Group Contractual cash obligations1) in millions of EUR 2015 | | | | | | | | | | | | | | | | | | | | | | | | | | | | | | | | payments due by period | | | | | total | | | less than
1 year | | | 1-3 years | | | 3-5 years | | | after 5 years | | | | | | | Long-term debt2) | | | 4,034 | | | | 84 | | | | 1,152 | | | | 1 | | | | 2,797 | | Finance lease obligations | | | 242 | | | | 72 | | | | 92 | | | | 36 | | | | 42 | | Short-term debt | | | 1,515 | | | | 1,515 | | | | — | | | | — | | | | — | | Operating lease obligations | | | 952 | | | | 243 | | | | 280 | | | | 162 | | | | 267 | | Derivative liabilities | | | 995 | | | | 253 | | | | 383 | | | | 156 | | | | 203 | | Interest on debt3) | | | 2,767 | | | | 221 | | | | 438 | | | | 334 | | | | 1,774 | | Purchase obligations4) | | | 175 | | | | 68 | | | | 69 | | | | 30 | | | | 8 | | Trade and other payables | | | 2,673 | | | | 2,673 | | | | — | | | | — | | | | — | | | | | | | Contractual cash obligations | | | 13,353 | | | | 5,129 | | | | 2,414 | | | | 719 | | | | 5,091 | | | | | | |
| 1) | Obligations in this table are undiscounted |
| 2) | Long-term debt includes short-term portion of long-term debt and excludes finance lease obligations |
| 3) | Approximately 32% of the debt bears interest at a floating rate. Majority of the interest payments on variable interest rate loans in the table above reflect market forward interest rates at the period end and these amounts may change as market interest rate changes |
| 4) | Philips has commitments related to the ordinary course of business which in general relate to contracts and purchase order commitments for less than 12 months. In the table, only the commitments for multiple years are presented, including their short-term portion |
The Company entered into contracts with several venture capitalists where it committed itself to make, under certain conditions, capital contributions to investment funds for an aggregated remaining amount of EUR 22 million (2014: EUR 35 million) until June 30, 2021. As at December 31, 2015 capital contributions already made to these investment funds are recorded as available-for-sale financial assets within Other non-current financial assets. The operating lease obligations are mainly related to the rental of buildings. A number of these leases originate from sale-and-leaseback arrangements. Operating lease payments under sale-and-leaseback arrangements for 2015 totaled EUR 36 million (2014: EUR 42 million). The remaining minimum payments under sale-and-leaseback arrangements included in operating lease obligations above are as follows: Philips Group Operating lease - minimum payments under sale-and-leaseback arrangements in millions of EUR 2015 | | | | | 2016 | | | 36 | | 2017 | | | 35 | | 2018 | | | 34 | | 2019 | | | 32 | | 2020 | | | 28 | | Thereafter | | | 115 | | | | | | |
182 Annual Report 2015
 Group financial statements 12.9 Group financial statements 12.9
Finance lease liabilities Philips Group Finance lease liabilities in millions of EUR 2014 - 2015 | | | | | | | | | | | | | | | | | | | | | | | | | | | | 2014 | | | 2015 | | | | | future
mini-
mum
lease
pay-
ments | | | interest | | | present
value of
mini- mum
lease
pay-
ments | | | future
mini-
mum
lease
pay-
ments | | | interest | | | present
value of
mini- mum
lease
pay-
ments | | Less than one year | | | 61 | | | | 7 | | | | 54 | | | | 72 | | | | 6 | | | | 66 | | Between one and five years | | | 117 | | | | 19 | | | | 98 | | | | 128 | | | | 17 | | | | 111 | | More than five years | | | 54 | | | | 11 | | | | 43 | | | | 42 | | | | 8 | | | | 34 | | | | | | | Finance lease | | | 232 | | | | 37 | | | | 195 | | | | 242 | | | | 31 | | | | 211 | | | | | | |
Contingent assets and liabilities Contingent assets Zoll In June 2010, Philips filed a patent infringement lawsuit against Zoll Medical Corporation claiming that its defibrillator related patents were infringed by Zoll’s Automatic External Defibrillator (AED) products. Zoll filed a countersuit claiming patent infringement by Philips’ Advanced Life Support (ALS) products and a method for testing defibrillator electrodes. In December 2013, the liability phase of the Zoll lawsuit was tried before a jury in the Dutch real estate sector uncoveredUnited States District Court for the District Massachusetts. Philips and Zoll were both held to infringe each other’s patents. Philips expects that it will result in a net difference in favor of Philips. The Zoll liability judgment is now pending before the United States Court of Appeals for the Federal Circuit (CAFC). Resolution of the amount ultimately owed to Philips in the Zoll lawsuit is contingent upon both the CAFC affirming the December 2013 jury decision on liability (expected in the first half of 2016) and the subsequent damages trial (expected to take place during the second half of 2016). Contingent liabilities Guarantees Philips’ policy is to provide guarantees and other letters of support only in writing. Philips does not stand by other forms of support. At the end of 2015, the total fair value of guarantees recognized on the balance sheet amounted to EUR nil million (December 31, 2014: EUR nil million). Remaining off-balance-sheet business and credit-related guarantees provided on behalf of third parties and associates increased by EUR 16 million during 2015 to EUR 37 million (December 31, 2014: EUR 21 million). Environmental remediation The Company and its subsidiaries are subject to environmental laws and regulations. Under these laws, the Company and/or its subsidiaries may be required to remediate the effects of certain chemicals on the environment. Legal proceedings The Company and certain of its group companies and former group companies are involved as a party in legal proceedings, regulatory and other governmental proceedings, including discussions on potential remedial actions, relating to such matters as competition issues, commercial transactions, product liability, participations and environmental pollution. While it is not feasible to predict or determine the ultimate outcome of all pending or threatened legal proceedings, regulatory and governmental proceedings, the Company is of the opinion that the cases described below may have, or have had in the recent past, a significant impact on the Company’s consolidated financial position, results of operations and cash flows. Cathode Ray Tubes (CRT) On November 21, 2007, the Company announced that competition law authorities in several jurisdictions had commenced investigations into possible anticompetitive activities in the Cathode Ray Tubes, or CRT industry. On December 5, 2012, the European Commission issued a decision imposing fines on (former) CRT manufacturers including the Company. The European Commission imposed a fine of EUR 313 million on the Company and a fine of EUR 392 million jointly and severally on the Company and LG Electronics, Inc. In total a payable of EUR 509 million was recognized in 2012 and the fine was paid in the first quarter of 2013. The Company appealed the decision of the European Commission with the General Court which appeal was denied on September 9, 2015. On November 23, 2015 the Company lodged an appeal against the decision of the General Court with the European Court of Justice. United States Subsequent to the public announcement of these investigations in 2007, certain Philips Group companies were named as defendants in class action antitrust complaints by direct and indirect purchasers of CRTs filed in various federal district courts in the United States. These actions alleged anticompetitive conduct by manufacturers of CRTs and sought treble damages on a joint and several liability basis. In addition, sixteen individual plaintiffs, principally large retailers of CRT products who opted out of the direct purchaser class, filed separate complaints against the Company and other defendants based on the same substantive allegations. All these actions have been consolidated for pre-trial proceedings in the United States District Court for the Northern District of California. Annual Report 2015 183
Group financial statements 12.9 The Company reached settlements with both the direct purchaser plaintiffs and indirect purchaser plaintiffs fully resolving all claims of the direct and indirect purchaser class. The direct purchaser settlement was approved by the court in 2012, while the indirect purchaser settlement is still subject to court approval with a hearing on the final approval scheduled for March 2016. In the past years the Company also reached settlements with a number of the individual plaintiffs resolving all claims by those retailers on a global basis. The settlements reached to date represent the vast majority of CRT sales attributed to the Company by the individual plaintiffs. In effect, all cases originally scheduled for trial in the Northern District of California have now been resolved, leaving unresolved certain of the cases that were consolidated in the California case for pre-trial purposes that have to be transferred back to their original venue for further proceedings. Trial dates have not yet been set for those cases. In addition, the state attorneys general of California, Florida, Illinois, Oregon and Washington filed actions against the Company and other defendants seeking to recover damages on behalf of the states and, acting as parens patriae, their consumers. In 2012 the Florida complaint was withdrawn. In 2013 a settlement agreement was reached with the state attorney general of California that has been approved subject to review by the California Court of Appeal. The actions brought by the state attorneys general of Illinois, Oregon and Washington are pending in the respective state courts of the plaintiffs. The Oregon Attorney General action has tentatively been set for trial in January 2017. Trial dates for the Washington and Illinois actions have not been set and there is no timetable for resolution of these cases. Canada In 2007, certain Philips Pension FundGroup companies were also being named as defendants in proposed class proceedings in Ontario, Quebec and British Columbia, Canada, along with numerous other participants in the industry. After years of inactivity, in 2014, plaintiffs in the Ontario action initiated the class certification proceedings. Class certification hearings took place late January 2016 and a decision on class certification is expected in the first half of 2016. Other civil claims related to CRT In 2014, the Company was named as a defendant in a consumer class action lawsuit filed in Israel in which damages are claimed against several defendants based on alleged anticompetitive activities in the CRT industry. In addition, an electronics manufacturer filed a claim against the Company and several co-defendants with a court in the Netherlands, have jointlyalso seeking compensation for the alleged damage sustained as a result from the alleged anticompetitive activities in the CRT industry. In 2015, the Company became involved in further civil CRT antitrust litigation with previous CRT customers in the United Kingdom, Germany, Brazil and amicably assessed any residualDenmark. In all cases the same substantive allegations about anticompetitive activities in the CRT industry are made and damages are sought. The Company has received indications that more civil claims may be filed in 2013. In viewdue course. Except for what has been provided or accrued for as disclosed in note 19, Provisions and note 22, Other liabilities, the Company has concluded that due to the considerable uncertainty associated with certain of these matters, on the basis of current knowledge, potential losses cannot be reliably estimated with respect to these matters. Optical Disc Drive (ODD) On October 27, 2009, the Antitrust Division of the new pensionUnited States Department of Justice confirmed that it had initiated an investigation into possible anticompetitive practices in the Optical Disc Drive (ODD) industry. Philips Lite-On Digital Solutions Corp. (PLDS), a joint venture owned by the Company and Lite-On IT Corporation, as an ODD market participant, is included in this investigation. PLDS and the Company have been accepted under the Corporate Leniency program of the US Department of Justice and have continued to cooperate with the authorities in these investigations. On this basis, the Company expects to be immune from governmental fines. In July 2012, the European Commission issued a Statement of Objections addressed to (former) ODD suppliers including the Company and PLDS. The European Commission granted the Company and PLDS immunity from fines, conditional upon the Company’s continued cooperation. The Company responded to the Statement of Objections both in writing and at an oral hearing. On October 21, 2015 the European Commission issued its fining decisions in which it granted immunity to the Company, Lite-On IT Corporation and PLDS. The antitrust authority in one remaining jurisdiction is still investigating the matter. Subsequent to the public announcement of these investigations in 2009, the Company, PLDS and Philips & Lite-On Digital Solutions USA, Inc. (PLDS USA), among other industry participants, were named as defendants in numerous class action antitrust complaints filed in various federal district courts in the United States. These actions allege anticompetitive conduct by manufacturers of ODDs and seek treble damages on behalf of direct and indirect purchasers of ODDs and products incorporating ODDs. These actions have been consolidated for pre-trial proceedings in the United States District Court for the Northern District of California. Initially the plaintiffs’ applications for certification of both the direct and indirect purchaser classes were denied. In May 2015, the indirect purchaser plaintiffs filed a revised motion for class certification seeking to certify a class of end consumers as plaintiffs, which was granted on February 8, 2016. 184 Annual Report 2015
Group financial statements 12.9 In September 2015, prior to the resubmission of a class certification motion by the direct purchaser plaintiffs, PLDS entered into a settlement agreement with the direct purchaser plaintiffs under which includes a new funding structure, effective as of January 1, 2014, Philips decided to make a special cash contribution in 2013 to ensure that any potential financial issuesthe Company was released from the past, including this real estate fraud, were cleared. Asdirect purchaser claims. In addition, various individual entities have filed separate actions against the Company, PLDS, PLDS USA and other defendants. The allegations contained in these individual complaints are substantially identical to the allegations in the direct purchaser class complaints. All of these matters have been consolidated into the action in the Northern District of California for pre-trial purposes and discovery is being coordinated. Also, in June 2013, the State of Florida filed a resultseparate complaint in the Northern District of this special contributionCalifornia against the real estateCompany, PLDS, PLDS USA and other defendants containing largely the same allegations as the class and individual complaints. Florida seeks to recover damages sustained in its capacity as a buyer of ODDs and, in its parens patriae capacity, on behalf of its citizens. The defendants’ motion to dismiss has been denied and Philips filed an answer to the complaint. This case has been closed.joined with the ODD class action cases in the Northern District of California for pre-trial purposes. The Company and certain Philips Group companies have also been named as defendants, in proposed class proceedings in Ontario, Quebec, British Columbia, Manitoba and Saskatchewan, Canada along with numerous other participants in the industry. These complaints assert claims against various ODD manufacturers under federal competition laws as well as tort laws and may involve joint and several liability among the named defendants. Philips intends to vigorously defend these lawsuits. Plaintiffs in the British Columbia case have proceeded with their application to certify that proceeding as a class action. The hearing was held in January 2015. The Court’s decision on class certification is still pending. Due to the considerable uncertainty associated with these matters, on the basis of current knowledge, the Company has concluded that potential losses cannot be reliably estimated with respect to these matters. Consumer Electronics products and small Domestic Appliances Several companies, among which the Company, are involved in an investigation by the European Commission into alleged restrictions of online sales of consumer electronic products and small domestic appliances. This investigation commenced in December 2013 when Philips was one of the companies that was inspected by officials of the European Commission. Philips is fully cooperating with the European Commission. Due to the considerable uncertainty associated with this matter, on the basis of current knowledge, the Company has concluded that potential losses cannot be reliably estimated with respect to these matters. Masimo On October 1, 2014 a jury awarded USD 467 million (EUR 366M) to Masimo Corporation (Masimo) in the patent infringement lawsuit by Masimo in the United States District Court for the District of Delaware against the Company. The decision by the jury is part of extensive litigation, which started in 2009, between Masimo and the Company involving several claims and counterclaims related to a large number of patents in the field of pulse oximetry. The lawsuit filed by Masimo alleges that certain Philips products infringe certain Masimo patents. In response to these claims, the Company filed its answer and counterclaims alleging infringement of a number of Philips’ patents and violation of US antitrust laws and patent misuse by Masimo. The Court has decided to handle the litigation in several phases, the first phase of which was tried in September 2014. The October 2014 decision by the jury is associated with this first phase of the litigation. An additional ongoing (i.e. second) phase of the litigation addresses the alleged infringement of certain Masimo patents which were not included in the first phase of the litigation. In February 2015 the United States District Court for the District of Delaware held a bench trial regarding the enforceability of one of Masimo’s patents and a hearing addressing several post-trial motions following the October 2014 jury decision. In May 2015, the Court decided that the Masimo patent was not held unenforceable, denied the Company’s motions to reverse the October 2014 jury decision regarding the validity of the Masimo patents-in-suit and/or the damages awarded by the jury to Masimo and denied the Company’s request for a new trial. The Court also denied Masimo’s motion to dismiss the Company’s complaint directed to antitrust violations and patent misuse by Masimo. The antitrust and patent misuse (i.e. third) phase of the litigation has now proceeded to the merits phase. The Company continues to pursue all avenues of appeal regarding the October 2014 decision before the Appellate courts in the US. In September 2015, the Court scheduled both the second and third phases of the litigation for trial during the first quarter of 2017. Due to the considerable uncertainty associated with these next phases of the litigation, including the impact of the appeals thereon, the Company has concluded that, on the basis of current knowledge, potential losses cannot be reliably estimated with respect to the remaining phases of the litigation. Miscellaneous As part of the divestment of the Television and Audio, Video, Multimedia & Accessories businesses in 2012 and 2014, the Company transferred economic Annual Report 2015 185
Group financial statements 12.9 ownership and control in some legal entities or divisions thereof, while retaining (partial) legal ownership. Considering the current challenging business environment, the Company might face employee and operational liabilities in case of certain adverse events. Given the uncertain nature of the relevant events and liabilities, it is not practicable to provide information on the estimate of the financial effect, if any, or timing. The outcome of the uncertain events could have a material impact on the Company’s consolidated financial position, results of operations and cash flows.
In the normal course of business, Philips purchases and sells goods and services from/to various related parties in which Philips typically holds a 50% or less equity interest and has significant influence. These transactions are generally conducted with terms comparable to transactions with third parties. Philips Group Related-party transactions in millions of EUR 2013 - 2015 | | | | | | | | | | | | | | | | | | | | | 2013 | | | 2014 | | | 2015 | | | | | | | Sales of goods and services | | | 305 | | | | 215 | | | | 222 | | Purchases of goods and services | | | 143 | | | | 85 | | | | 87 | | Receivables from related parties | | | 39 | | | | 14 | | | | 16 | | Payables to related parties | | | 4 | | | | 4 | | | | 4 | | | | | | |
Non-recourse financing of third-party receivables provided by an associate amounted to EUR 135 million in 2015 (2014: EUR 103 million; 2013: EUR 84 million). In light of the composition of the Executive Committee, the Company considers the members of the Executive Committee and the Supervisory Board to be the key management personnel as defined in IAS 24 ‘Related parties’. For remuneration details of the Executive Committee, the Board of Management and the Supervisory Board see note 29, Information on remuneration. For employee benefit plans see note 20, Post-employment benefits. Share-based compensation The purpose of the share-based compensation plans is to align the interests of management with those of shareholders by providing incentives to improve the Company’s performance on a long-term basis, thereby increasing shareholder value. The Company has the following plans: options on its common shares;
rights to receive common shares in the future based on a service condition (restricted shares);
performance shares: rights to receive common shares in the future based on performance and service conditions (performance shares).conditions; 200 Annual Report 2013restricted shares: rights to receive common shares in the future based on a service condition;
11 Group financial statements 11.9 - 11.9
Options on its common shares, including the 2012 and 2013 Accelerate! grant. Since 2013 the Board of Management and other members of the Executive Committee, executives and certain selected employees are granted performance shares. Restricted shares are granted only to new employees or certain selected employees. Prior to 2013, restricted shares and options were granted to members of the Board of Management and other members of the Executive Committee, executives and certain selected employees. Options were last granted in January 2013. Restricted shares are still granted to new employees or certain selected employees. Furthermore, in January 2012 and 2013, as part of the Accelerate! program, the Company has granted the following: options on its common shares (Accelerate! options); rights to receive common shares in the future (Accelerate! shares).
These Accelerate! options and shares were granted to a group of approximately 500 key employees below the level of Board of Management in January 2012 and to the Board of Management in January 2013.
Under the terms of employee stock purchase plans established by the Company in various countries, employees are eligible to purchase a limited number of Philips shares at discounted prices through payroll withholdings. Share-based compensation costs were EUR 99 million (2014: EUR 85 million, 2013: EUR 104 million). This includes the employee stock purchase plan of 4 million, which is not a share-based compensation that affects equity. The share-based compensation costs excludes the cost for discontinued operations of EUR 6 million. In May 2013 a new long-term incentive plan was approved at the Annual General Meetingconsolidated statements of Shareholders grantingchanges in equity EUR 101 million is recognized in 2015 related to the share-based compensation plans. The amount recognized as an expense is adjusted for forfeiture. USD-denominated performance shares, to members of the Board of Managementrestricted shares and other members of the Executive Committee, executives and certain selected employees. USD-denominated options restricted and performance shares are granted to employees in the United States only.
Share-based compensation costs were EUR 109 million (EUR 91 million, net of tax), EUR 86 million (EUR 75 million, net of tax) and EUR 55 million (EUR 57 million, net of tax) in 2013, 2012 and 2011, respectively.
Option plansPerformance shares
Under the Company’s plans, options are granted at fair market value on the date of grant.
The Company granted optionsperformance is measured over a three-year performance period. The performance shares have two performance conditions, relative Total Shareholders’ Return compared to a peer group of 21 companies and adjusted Earnings Per Share growth. The performance shares vest three years after the grant date. The number of performance shares that expire after 10 years. Generally, these optionswill vest after 3 years,is dependent on achieving the two performance conditions, which are equally weighted, and provided that the grantee is still employed with the Company. A limited number The amount recognized as an expense is adjusted for actual performance of options grantedadjusted Earnings Per Share growth since this is anon-market performance condition. It is not adjusted for non-vesting or extra vesting of performance shares due to certain employees of acquired businesses may contain accelerated vesting. As of December 31, 2013 there are no non-vested options which contain non-marketa relative Total Shareholders’ Return performance conditions. The fair values ofthat differs from the Company’s 2013, 2012 and 2011 option grants were estimated usingperformance anticipated at the grant date, since this is a Black-Scholes option valuation model and the following weighted average assumptions:market-based performance condition.
| | | | | | | | | | | | | EUR-denominated | | 2011 | | | 2012 | | | 2013 | | Risk-free interest rate | | | 2.89 | % | | | 1.87 | % | | | 1.20 | % | Expected dividend yield | | | 3.3 | % | | | 4.7 | % | | | 4.5 | % | Expected option life | | | 6.5 yrs | | | | 6.5 yrs | | | | 6.5 yrs | | Expected share price volatility | | | 30 | % | | | 32 | % | | | 33 | % | | | | | | | | | | | | | | | | | USD-denominated | | | | | | | | | | Risk-free interest rate | | | 2.78 | % | | | 1.23 | % | | | 1.32 | % | Expected dividend yield | | | 3.6 | % | | | 4.5 | % | | | 4.6 | % | Expected option life | | | 6.5 yrs | | | | 6.5 yrs | | | | 6.5 yrs | | Expected share price volatility | | | 34 | % | | | 38 | % | | | 39 | % |
The fair value of the Company’s 2013performance shares is measured based on Monte-Carlo simulation, which takes into account dividend payments between the grant date and 2012 Accelerate! option grants were estimated using a Black-Scholes option valuation modelthe vesting date by including reinvested dividends, the market conditions expected to impact relative Total Shareholders’ Return performance in relation to selected peers, and the following weighted-average assumptions: | | | | | | | | | EUR-denominated | | 2012 | | | 2013 | | Risk-free interest rate | | | 1.52 | % | | | 0.89 | % | Expected dividend yield | | | 4.3 | % | | | 3.9 | % | Expected option life | | | 6.5 yrs | | | | 6.5 yrs | | Expected share price volatility | | | 32 | % | | | 32 | % | | | | | | | | | | | | | USD-denominated | | | | | | | Risk-free interest rate | | | 1.19 | % | | | — | | Expected dividend yield | | | 4.0 | % | | | — | | Expected option life | | | 6.5 yrs | | | | — | | Expected share price volatility | | | 38 | % | | | — | |
186 Annual Report 2015
Group financial statements 12.9 Philips Group Assumptions used in Monte-Carlo simulation for valuation in % 2015 | | | | | | | | | | | | 2015 | | | | | | | | EUR-denominated | | | | Risk-free interest rate | | | (0.11 | )% | Expected dividend yield | | | 4.0 | % | Expected share price volatility | | | 25 | % | | | | | | | | USD-denominated | | | | Risk-free interest rate | | | (0.10 | )% | Expected dividend yield | | | 4.0 | % | Expected share price volatility | | | 27 | % | | | | | |
The assumptions were used for these calculations only and do not necessarily represent an indication of Management’s expectationsexpectation of future developments. The Black-Scholes option valuation model was developeddevelopments for use in estimating the fair value of traded options which have no vesting restrictions and are fully transferable. In addition, option valuation models require the input of subjective assumptions, including the expected price volatility.
other purposes. The Company has based its volatility assumptions on historical experience formeasured over a period equalten-year period. The approach in calculating relative Total Shareholders Return performance was determined to be based on local currency instead of translating to the expected lifeeuro. This clarification in the share-based compensation arrangement did not result in accounting implications for the grant of 2013 and 2014. For the grant of 2015 an incremental fair value of EUR 6 million was recognized in July and will be spread over the remaining vesting period. The incremental fair value was measured using the same assumptions used in theMonte-Carlo simulation for the valuation of the options. The expected life2015 grant, except for the risk-free interest rate which was updated to (0.17)%. A summary of the options is also based upon historical experience. The Company’s employee stock options have characteristics significantly different from thosestatus of traded options, and changes in the assumptions can materially affect the fair value estimate.
The following tables summarize information about the Company’s optionsperformance share plans as of December 31, 20132015 and changes during the year:year are presented below:
Philips Group OptionPerformance share plans (excluding Accelerate! options)
EUR-denominated2015
| | | | | | | | | | | | options | | | weighted average exercise price | | Outstanding at January 1, 2013 | | | 23,109,265 | | | | 21.43 | | Granted | | | 35,193 | | | | 22.28 | | Exercised | | | 2,664,550 | | | | 18.45 | | Forfeited | | | 1,807,077 | | | | 23.74 | | Expired | | | 15,003 | | | | 22.12 | | | | | | | Outstanding at December 31, 2013 | | | 18,657,828 | | | | 21.63 | | | | | | | Exercisable at December 31, 2013 | | | 11,657,060 | | | | 23.99 | |
The exercise prices range from EUR 12.63 to EUR 32.04. The weighted average remaining contractual term for options outstanding and options exercisable at December 31, 2013, was 5.3 years and 3.8 years, respectively. The aggregate intrinsic value of the options outstanding and options exercisable at December 31, 2013, was EUR 104 million and EUR 41 million, respectively.
The weighted average grant-date fair value of options granted during 2013, 2012, and 2011 was EUR 4.21, EUR 2.84 and EUR 4.82, respectively. The total intrinsic value of options exercised during 2013, 2012, and 2011 was approximately EUR 15 million, EUR 3 million and EUR 1 million, respectively.
| | | | | | | | | | | | | | | | | shares1) | | | weighted
average
grant-date
fair value | | | | | | | | EUR-denominated | | | | | | | Outstanding at January 1, 2015 | | | 6,304,002 | | | | 22.92 | | Granted | | | 3,067,530 | | | | 28.54 | | Forfeited | | | 976,550 | | | | 24.18 | | | | | | | Outstanding at December 31, 2015 | | | 8,394,982 | | | | 24.83 | | | | | | | | | | | | | | USD-denominated | | | | | | | Outstanding at January 1, 2015 | | | 4,200,900 | | | | 30.44 | | Granted | | | 1,985,066 | | | | 30.19 | | Forfeited | | | 411,266 | | | | 30.48 | | | | | | | Outstanding at December 31, 2015 | | | 5,774,700 | | | | 30.35 | | | | | | |
Annual Report 2013 201
11 Group financial statements 11.9 - 11.9
Option plans (excluding Accelerate! options)| 1) | Excludes dividend declared on outstanding shares between grant date and vesting date that will be issued in shares (EUR-denominated: 566,851 shares and USD-denominated: 395,970 shares) USD-denominated
| | | | | | | | | | | | options | | | weighted average exercise price | | Outstanding at January 1, 2013 | | | 16,606,652 | | | | 29.04 | | Granted | | | 22,275 | | | | 28.69 | | Exercised | | | 1,969,901 | | | | 23.27 | | Forfeited | | | 1,209,456 | | | | 30.66 | | Expired | | | — | | | | — | | | | | | | Outstanding at December 31, 2013 | | | 13,449,570 | | | | 29.74 | | | | | | | Exercisable at December 31, 2013 | | | 8,313,489 | | | | 33.26 | |
The exercise prices range from USD 16.76 to USD 44.15. The weighted average remaining contractual term for options outstanding and options exercisable at December 31, 2013, was 5.4 years and 3.9 years, respectively. The aggregate intrinsic value of the options outstanding and options exercisable at December 31, 2013, was USD 106 million and USD 40 million, respectively.
The weighted average grant-date fair value of options granted during 2013, 2012 and 2011 was USD 6.70, USD 4.56 and USD 7.47, respectively. The total intrinsic value of options exercised during 2013, 2012 and 2011 was USD 17 million, USD 4 million and USD 4 million.
|
At December 31, 2013,2015, a total of EUR 9157 million of unrecognized compensation costs relate to non-vested EUR and USD denominated options.performance shares. These costs are expected to be recognized over a weighted- averageweighted-average period of 1.01.8 years. Cash received from exercises under the Company’s option plans amounted to EUR 84 million, EUR 19 million and EUR 20 million in 2013, 2012, and 2011, respectively. The actual tax deductions realized as a result of option exercises totaled approximately EUR 5 million, EUR 1 million and EUR 1 million, in 2013, 2012, and 2011, respectively. The outstanding options are categorized in exercise price ranges as follows:
Option plans (excluding Accelerate! options)
| | | | | | | | | | | | | exercise price | | options | | | intrinsic
value in millions | | | weighted average remaining contractual term | | EUR-denominated | | | | | | | | | | | | | 10-15 | | | 4,967,645 | | | | 61 | | | | 7.4 yrs | | 15-20 | | | 1,104,222 | | | | 9 | | | | 2.5 yrs | | 20-25 | | | 8,547,886 | | | | 33 | | | | 5.6 yrs | | 25-30 | | | 1,693,773 | | | | 1 | | | | 2.3 yrs | | 30-35 | | | 2,344,302 | | | | — | | | | 3.3 yrs | | | | | | | | | | 18,657,828 | | | | 104 | | | | 5.3 yrs | | USD-denominated | | | | | | | | | | | | | 15-20 | | | 3,406,981 | | | | 62 | | | | 7.6 yrs | | 20-25 | | | 335,769 | | | | 5 | | | | 7.8 yrs | | 25-30 | | | 3,220,919 | | | | 26 | | | | 5.3 yrs | | 30-35 | | | 2,943,429 | | | | 12 | | | | 4.7 yrs | | 35-40 | | | 1,813,212 | | | | 1 | | | | 4.2 yrs | | 40-55 | | | 1,729,260 | | | | — | | | | 3.3 yrs | | | | | | | | | | 13,449,570 | | | | 106 | | | | 5.4 yrs | |
The aggregate intrinsic value in the tables and text above represents the total pre-tax intrinsic value (the difference between the Company’s closing share price on the last trading day of 2013 and the exercise price, multiplied by the number of in-the-money options) that would have been received by the option holders if the options had been exercised on December 31, 2013.
The following table summarizes information about the Company’s Accelerate! options as of December 31, 2013 and changes during the year:
Accelerate! options
| | | | | | | | | | | | options | | | weighted average exercise price | | EUR-denominated | | | | | | | | | Outstanding at January 1, 2013 | | | 2,927,000 | | | | 15.24 | | Granted | | | 152,000 | | | | 22.43 | | Forfeited | | | 225,000 | | | | 15.24 | | | | | | | Outstanding at December 31, 2013 | | | 2,854,000 | | | | 15.62 | | Exercisable at December 31, 2013 | | | 2,722,000 | | | | 15.29 | | USD-denominated | | | | | | | | | Outstanding at January 1, 2013 | | | 860,000 | | | | 20.02 | | Granted | | | — | | | | — | | Forfeited | | | 65,000 | | | | 20.02 | | | | | | | Outstanding at December 31, 2013 | | | 795,000 | | | | 20.02 | | Exercisable at December 31, 2013 | | | 795,000 | | | | 20.02 | |
The exercise price of the Accelerate! options granted in 2012 are EUR 15.24 and USD 20.02 and in 2013 EUR 22.43. The weighted average remaining contractual term for EUR and USD Accelerate! options outstanding and exercisable at December 31, 2013 was 8.1 years. The aggregate intrinsic value of the Accelerate! options outstanding at December 31, 2013, was EUR 31 million and USD 13 million, respectively.
The grant-date fair value of Accelerate! options granted during 2013 was EUR 4.41 per option. At December 31, 2013 there are no unrecognized compensation costs related to both EUR and USD Accelerate! options. At December 31, 2013 all performance targets under the Accelerate! program, which were based on the 2013 mid-term financial targets, have been met.
Restricted and Accelerate! shares The fair value of restricted and Accelerate! shares is equal to the fair value of the share price at grant date less the present value, using the risk-free interest rate, of estimated future dividends which will not be received up to the vesting date. The Company issues restricted shares that, in general, vest in equal annual installments over a three-year period, starting one year after the date of grant. For grants up to and including January 2013 the Company granted 20% additional (premium) shares, provided the grantee still holds the shares after three years from the delivery date and the grantee is still with the Company on the respective delivery dates. 202 Annual Report 20132015 187
11 Group financial statements 11.9 - 11.912.9
A summary of the status of the Company’s restricted shares as of December 31, 20132015 and changes during the year are presented below: Philips Group Restricted shares (excluding Accelerate! shares)1) 2015 | | | | | | | | | | | | | shares1) | | | weighted
average
grant-date fair value | | | | | shares | | | weighted
average grant- date fair value | | | | | | EUR-denominated | | | | | | | | | | | Outstanding at January 1, 2013 | | | 1,954,985 | | | | 16.45 | | | Outstanding at January 1, 2015 | | | | 525,462 | | | | 16.44 | | Granted | | | 85,296 | | | | 21.90 | | | | 871,881 | | | | 23.63 | | Vested/Issued | | | 885,733 | | | | 18.07 | | | | 381,915 | | | | 15.27 | | Forfeited | | | 89,379 | | | | 16.01 | | | | 6,753 | | | | 14.56 | | | | | | | | | | | Outstanding at December 31, 2013 | | | 1,065,169 | | | | 15.31 | | | Outstanding at December 31, 2015 | | | | 1,008,675 | | | | 23.41 | | | | | | | | | | | | USD-denominated | | | | | | | | | | | Outstanding at January 1, 2013 | | | 1,924,156 | | | | 20.99 | | | Outstanding at January 1, 2015 | | | | 600,679 | | | | 21.51 | | Granted | | | 114,127 | | | | 31.48 | | | | 601,206 | | | | 26.08 | | Vested/Issued | | | 795,668 | | | | 23.14 | | | | 422,288 | | | | 19.15 | | Forfeited | | | 102,369 | | | | 20.18 | | | | 21,188 | | | | 26.88 | | | | | | | | | | | Outstanding at December 31, 2013 | | | 1,140,246 | | | | 20.33 | | | Outstanding at December 31, 2015 | | | | 758,409 | | | | 26.90 | | | | | | | |
| 1) | ExcludesRestricted shares granted before 2013 excludes 20% additional (premium) shares that may be received if shares delivered under the restricted share rights plan are not sold for a three- year periodthree-year period. Restricted shares granted after 2013 excludes dividend declared on outstanding shares between grant date and vesting date that will be issued in shares.
|
At December 31, 2013,2015, a total of EUR 1624 million of unrecognized compensation costs relate to non-vested restricted shares. These costs are expected to be recognized over a weighted-average period of 1.81.6 years. A summary of the status of the Company’s Accelerate! shares as of December 31, 2013 and changes during the year are presented below:
Accelerate! shares
| | | | | | | | | | | | shares | | | weighted
average grant- date fair value | | EUR-denominated | | | | | | | | | Outstanding at January 1, 2013 | | | 2,927,000 | | | | 13.75 | | Granted | | | 152,000 | | | | 21.68 | | Forfeited | | | 225,000 | | | | 13.75 | | Vested | | | 2,854,000 | | | | 14.17 | | | | | | | Outstanding at December 31, 2013 | | | — | | | | — | | USD-denominated | | | | | | | | | Outstanding at January 1, 2013 | | | 860,000 | | | | 18.05 | | Granted | | | — | | | | — | | Forfeited | | | 65,000 | | | | 18.05 | | Vested | | | 795,000 | | | | 18.05 | | | | | | | Outstanding at December 31, 2013 | | | — | | | | — | |
On January 28, 2014 the Supervisory Board resolved that all performance targets under the Accelerate! program, which were based on the 2013 mid- term financial targets, have been met. This means that in accordance with IFRS accounting requirements the Accelerate! shares vested and that at December 31, 2013 there are no unrecognized compensation costs to both EUR and USD Accelerate! shares. After delivery an additional two-year holding period applies, except for Accelerate! shares granted to the Board of Management of which after delivery an additional four-year holding period applies.
Performance sharesOption plans
The performance is measured over a three-year performance period. The performance shares have two performance conditions, relative Total Shareholders’ Return compared to a peer group of 21 companies and adjusted Earnings Per Share growth. The performance sharesCompany granted options that expire after 10 years. These options vest threeafter 3 years, after the grant date. The number of performance shares that will vest is dependent on achieving the two performance conditions, which are equally weighted, and provided that the grantee is still employed with the Company. The fair value of the performance shares is measured based on Monte- Carlo simulation and the following weighted average assumptions: | | | | | EUR-denominated
| | 2013 | | Risk-free interest rate
| | | 0.55 | % | Expected dividend yield
| | | 3.7 | % | Expected share price volatility
| | | 27 | % | | | | | | | USD-denominated | | | | Risk-free interest rate
| | | 0.55 | % | Expected dividend yield
| | | 3.7 | % | Expected share price volatility
| | | 30 | % |
The Company has based its volatility assumptions on historical experience measured over a ten-year period.
A summary of the status oftables summarize information about the Company’s performance share plansoptions as of December 31, 20132015 and changes during the year are presented below:year:
Philips Group Options on EUR-denominated listed share 2015 | | | | | | | | | | | | shares | | | weighted average grant- date fair value | | EUR-denominated | | | | | | | | | Granted | | | 3,509,518 | | | | 23.53 | | Forfeited | | | 66,595 | | | | 23.45 | | Outstanding at December 31, 2013 | | | 3,442,923 | | | | 23.53 | | USD-denominated | | | | | | | | | Granted | | | 2,419,445 | | | | 30.77 | | Forfeited | | | 121,219 | | | | 30.70 | | Outstanding at December 31, 2013 | | | 2,298,226 | | | | 30.77 | |
| | | | | | | | | | | | | | | | | options | | | weighted average
exercise price | | | | | | | | | | | Outstanding at January 1, 2015 | | | 15,076,954 | | | | 21.65 | | Exercised | | | 2,868,531 | | | | 18.57 | | Forfeited | | | 466,739 | | | | 26.68 | | Expired | | | 94,370 | | | | 19.45 | | | | | | | Outstanding at December 31, 2015 | | | 11,647,314 | | | | 22.23 | | | | | | | Exercisable at December 31, 2015 | | | 11,630,889 | | | | 22.23 | | | | | | |
The exercise prices range from EUR 12.63 to EUR 32.04. The weighted average remaining contractual term for options outstanding and options exercisable at December 31, 2015, was 3.6 years. The aggregate intrinsic value of the options outstanding and options exercisable at December 31, 2015, was EUR 38 million. The total intrinsic value of options exercised during 2015 was EUR 21 million (2014: EUR 11 million, 2013: EUR 15 million). Philips Group Options on USD-denominated listed share 2015 | | | | | | | | | | | | | | | | | options | | | weighted average
exercise price | | | | | | | Outstanding at January 1, 2015 | | | 11,361,836 | | | | 29.84 | | Exercised | | | 1,013,652 | | | | 20.90 | | Forfeited | | | 569,858 | | | | 33.46 | | Expired | | | 101,519 | | | | 25.38 | | | | | | | Outstanding at December 31, 2015 | | | 9,676,807 | | | | 30.62 | | | | | | | Exercisable at December 31, 2015 | | | 9,670,357 | | | | 30.62 | | | | | | |
The exercise prices range from USD 16.76 to USD 44.15. The weighted average remaining contractual term for options outstanding and options exercisable at December 31, 2015, was 3.7 years. The aggregate intrinsic value of the options outstanding and options exercisable at December 31, 2015, was USD 16 million. The total intrinsic value of options exercised during 2015 was USD 8 million (2014: USD 9 million, 2013: USD 17 million). At December 31, 2013, a total of EUR 116 million of2015 there were no unrecognized compensation costs relaterelated to non-vested performance shares. These costsoutstanding options. Cash received from exercises under the Company’s option plans amounted to EUR 72 million in 2015 (2014: EUR 77 million, 2013: EUR 84 million). The actual tax deductions realized as a result of option exercises totaled approximately EUR 3 million in 2015 (2014: EUR 3 million, 2013: EUR 5 million). The outstanding options as of December 31, 2015 are expected to be recognized over a weighted-average period of 2.3 years.categorized in exercise price ranges as follows: Philips Group Other plansOutstanding options
2015 | | | | | | | | | | | | | | | | | | exercise
price | | options | | | intrinsic
value in
millions | | | weighted average
remaining
contractual term | | | | | | | EUR-denominated | | | | | | | | | | | | | 10-15 | | | 3,077,645 | | | | 30 | | | | 5.5 yrs | | 15-20 | | | 86,137 | | | | 1 | | | | 5.8 yrs | | 20-25 | | | 5,281,935 | | | | 7 | | | | 4.2 yrs | | 25-30 | | | 1,306,224 | | | | | | | | 0.3 yrs | | 30-35 | | | 1,895,373 | | | | | | | | 1.3 yrs | | | | | | | Outstanding options | | | 11,647,314 | | | | 38 | | | | 3.6 yrs | | USD-denominated | | | | | | | | | | | | | 15-20 | | | 2,276,293 | | | | 15 | | | | 5.6 yrs | | 20-25 | | | 237,689 | | | | 1 | | | | 6.0 yrs | | 25-30 | | | 1,907,931 | | | | | | | | 5.2 yrs | | 30-35 | | | 2,339,551 | | | | | | | | 2.7 yrs | | 35-40 | | | 1,435,203 | | | | | | | | 2.2 yrs | | 40-55 | | | 1,480,140 | | | | | | | | 1.3 yrs | | | | | | | Outstanding options | | | 9,676,807 | | | | 16 | | | | 3.7 yrs | | | | | | |
188 Annual Report 2015
Employee share purchase plan Group financial statements 12.9 Group financial statements 12.9
Under the terms of employee stock purchase plans established by the Company in various countries, substantially all employees in those countries are eligible to purchase a limited number of Philips shares at discounted prices through payroll withholdings, of which the maximum ranges from 10% to 20% of total salary. Generally, the discount provided to the employees is
The aggregate intrinsic value in the range of 10% to 20%. Atables and text above represents the total of 1,425,048 shares were bought by employees in 2013 underpre-tax intrinsic value (the difference between the plan at an average price of EUR 21.92 (2012: 1,906,183 shares at EUR 15.69; 2011: 1,851,718 shares at EUR 17.93). Convertible personnel debentures
In the Netherlands, the Company issued personnel debentures with a 2- year right of conversion into its common shares starting three years after the date of issuance, with a conversion price equal to theCompany’s closing share price on the last trading day of 2015 and the exercise price, multiplied by the number of in-the-money options) that date. would have been received by the option holders if the options had been exercised on December 31, 2015.
The last issuancefollowing table summarizes information about the Company’s Accelerate! options as of this particular plan was in December 2008. From 2009 onwards, employees in31, 2015 and changes during the Netherlands are able to join an employee share purchase plan as described in the previous paragraph. Inyear: Philips Group Accelerate! options 2015 Annual Report 2013 203
| | | | | | | | | | | | | | | | | options | | | weighted average exercise price | | | | | | | EUR-denominated | | | | | | | | | Outstanding at January 1, 2015 | | | 1,768,800 | | | | 15.86 | | Exercised | | | 464,300 | | | | 15.24 | | | | | | | Outstanding at December 31, 2015 | | | 1,304,500 | | | | 16.08 | | | | | | | Exercisable at December 31, 2015 | | | 1,304,500 | | | | 16.08 | | USD-denominated | | | | | | | | | Outstanding at January 1, 2015 | | | 458,800 | | | | 20.02 | | Exercised | | | 106,000 | | | | 20.02 | | Forfeited | | | 5,000 | | | | 20.02 | | | | | | | Outstanding at December 31, 2015 | | | 347,800 | | | | 20.02 | | | | | | | Exercisable at December 31, 2015 | | | 347,800 | | | | 20.02 | | | | | | |
 11 Group financial statements 11.9 - 11.9 11 Group financial statements 11.9 - 11.9
2013, 509,195 shares were issued in conjunction with conversions at anThe exercise prices of the Accelerate! options are EUR 15.24 and EUR 22.43 for EUR-denominated options and is USD 20.02 for USD-denominated options. The weighted average price of EUR 14.21 (2012: 270,827 shares at an average price of EUR 14.22; 2011: 1,079 shares at an average price of EUR 24.66).
Related-party transactions
In the normal course of business, Philips purchasesremaining contractual term for EUR-denominated Accelerate! options outstanding and sells goods and services from/to various related parties in which Philips typically holds a 50% or less equity interest and has significant influence. These transactions are generally conducted with terms comparable to transactions with third parties.
| | | | | | | | | | | | | | | | 2011 | | | 2012 | | | 2013 | | Sales of goods and services | | | 278 | | | | 288 | | | | 305 | | Purchases of goods and services | | | 117 | | | | 130 | | | | 143 | | Receivables from related parties | | | 19 | | | | 13 | | | | 39 | | Payables to related parties | | | 6 | | | | 4 | | | | 4 | |
Based on its 30% share in the TP Vision venture, Philips had various commitments to provide further funding to the TP Vision ventureexercisable at December 31, 2013:2015 was 6.2 years. The weighted average remaining contractual term for USD-Accelerate! options outstanding and exercisable at December 31, 2015 was 6.1 years. The aggregate intrinsic value of theEUR-denominated Accelerate! options outstanding and exercisable at December 31, 2015, was EUR 10 million. The aggregate intrinsic value of theUSD-denominated Accelerate! options outstanding and exercisable at December 31, 2015, was USD 2 million.
A subordinated shareholder loanThe total intrinsic value of Accelerate! options exercised during 2015 was EUR 515 million (fully drawn) can be extended depending on the venture’s funding needs.for EUR-denominated options (2014: EUR 10 million) and USD 1 million for USD-denominated options (2014: USD 5 million).
Cash received from exercises for EUR-denominated and USD-denominated Accelerate! options amounted to EUR 9 million in 2015 (2014: EUR 21 million). The actual tax deductions realized as a result of Accelerate! options exercises totaled approximately EUR 0.3 million of this loan is due in April 2015 and(2014: EUR 30 million due in April 2017, A senior 12-month EUR 30 million bridge loan facility (undrawn) to the venture can be extended up to April 2017 depending on the venture’s funding needs,
A committed EUR 60 million loan facility (undrawn) that can be extended up to April 2018, depending on the venture’s funding needs.
On 20 January 2014, Philips has signed a term sheet to transfer its remaining 30% stake in the TP Vision venture, which will also impact the above commitments (note 36, Subsequent events)1 million).
See also, note 7, Discontinued operations and other assets classified as held for sale for further details on the Television business divestment.
In light of the composition of the Executive Committee during 2012 and 2013, the Company considered the members of the Executive Committee and the Supervisory board to be the key management personnel as defined in IAS 24 ‘Related parties’. In 2011, the Company considered the members of the Board of Management and the Supervisory Board to be the key management personnel.
For remuneration details of the Executive Committee, the Board of Management and the Supervisory Board see note 33, Information on remuneration.
For employee benefit plans see note 30, Post-employment benefits.
Remuneration of the Executive Committee In 2013,2015, the total remuneration costs relating to the members of the Executive Committee (including the members of the Board of Management) amounted to EUR 24,773,537 (2012:15,098,023 (2014: EUR 18,585,112)16,878,909, 2013: EUR 24,773,537) consisting of the elements in the table below. At December 31, 2015, the members of the Executive Committee (including the members of the Board of Management) held 843,461 (2014: 1,050,080; 2013: 1,479,498) stock options at a weighted average exercise price of EUR 18.67 (2014: EUR 18.53; 2013: EUR 18.69). Remuneration of the Board of Management In 2015, the total remuneration costs relating to the members of the Board of Management amounted to EUR 6,612,092 (2014: EUR 6,635,334; 2013: EUR 10,928,951). At December 31, 2015, the members of the Board of Management held 479,881 stock options (2014: 586,500; 2013: 586,500) at a weighted average exercise price of EUR 19.52 (2014: EUR 19.60; 2013: EUR 19.60). Philips Group Remuneration costs of the Executive Committee in EUR in euros2013 - 2015
| | | | 2012 | | | 2013 | | | | | | Salary | | | 5,640,090 | | | | 6,011,557 | | | | | | | 2013 | | | 2014 | | | 2015 | | | | | | | | Salary/Base compensation | | | | 6,011,557 | | | | 6,513,027 | | | | 5,974,928 | | Annual incentive1) | | | 4,839,949 | | | | 4,422,732 | | | | 4,422,732 | | | | 1,526,658 | | | | 2,705,560 | | Performance shares2) | | | 1,049,205 | | | | 6,478,554 | | | | 6,478,554 | | | | 3,357,142 | | | | 2,740,004 | | Stock options2) | | | 1,194,444 | | | | 2,020,040 | | | | 2,020,040 | | | | 583,755 | | | | 88,775 | | Restricted share rights2) | | | 1,566,448 | | | | 1,115,504 | | | | 1,115,504 | | | | 409,809 | | | | 91,339 | | Pension costs | | | 2,054,516 | | | | 2,277,705 | | | Pension allowances | | | | — | | | | — | | | | 2,193,409 | | Pension scheme costs | | | | 2,277,705 | | | | 2,458,759 | | | | 209,462 | | Other compensation3) | | | 2,240,460 | | | | 2,447,445 | | | | 2,447,445 | | | | 2,029,759 | | | | 1,094,546 | | | | | | | |
| 1) | The annual incentives are related to the performance in the year reported which are paid out in the subsequent year |
| 2) | Costs of performance shares, stock options and restricted share rights are based on accounting standards (IFRS) and do not reflect the value of stock options at the end of the lock up period and the value of performance shares and restricted share rights at the vesting/release date. Costs for the Accelerate! Grant are includeddate |
| 3) | The stated amountamounts mainly concern (share of) allowances to members of the Executive Committee that can be considered as remuneration. In a situation where such a share of an allowance can be considered as (indirect) remuneration (for example, private use of the company car), then the share is both valued and accounted for here. The method employed by the fiscal authorities in the Netherlands is the starting point for the value stated. TheIn 2013 a crisis levy tax levy of 16% ashas been imposed by the Dutch government, amountsamounting in total to EUR 1,245,944 (2012: EUR 702,940).1,245,944. This crisis taxamount is payable by the employer and is charged over income of employees exceeding a EUR 150,000 threshold in 2012 and 2013. These amounts are included in the amountsamount stated under Other compensation |
At December 31, 2013, the members
Annual Report 2015 189
Group financial statements 12.9 For further information on remuneration costs, see sub-section 10.2.4, Remuneration costs, of this report. The tables below give an overview of the Executive Committee (includingperformance share plans, restricted share rights and the stock option plans of the Company, held by the members of the Board of Management) held 1,479,498 (2012: 1,376,913) stock options at a weighted average exercise priceManagement: Philips Group Number of EUR 18.69 (2012: EUR 18.23). Remunerationperformance shares (holdings)in number of the Board of Managementshares
In 2013, the total remuneration costs relating to the members of the Board of Management amounted to EUR 10,928,951 (2012: EUR 7,301,334; 2011: EUR 10,844,833).
At December 31, 2013, the members of the Board of Management held 586,500 stock options (2012: 454,500; 2011: 1,072,431) at a weighted average exercise price of EUR 19.60. (2012: EUR 18.78; 2011: EUR 23.01).2015
| | | | | | | | | | | | | | | | | | | | | | | | | | | | | | | | | January 1,
2015 | | | awarded
2015 | | | awarded
dividend
shares 2015 | | | realized
2015 | | | December 31,
2015 | | | vesting date | | | | | | | F.A. van Houten | | | 66,903 | | | | — | | | | 2,194 | | | | — | | | | 69,097 | | | | 05.03.2016 | | | | | 61,113 | | | | — | | | | 2,004 | | | | — | | | | 63,117 | | | | 04.28.2017 | | | | | — | | | | 54,877 | | | | 1,800 | | | | — | | | | 56,677 | | | | 05.05.2018 | | A. Bhattacharya | | | 12,670 | | | | — | | | | 416 | | | | — | | | | 13,086 | | | | 05.03.2016 | | | | | 11,071 | | | | — | | | | 363 | | | | — | | | | 11,434 | | | | 04.28.2017 | | | | | — | | | | 11,676 | | | | 383 | | | | — | | | | 12,059 | | | | 05.05.2018 | | P.A.J. Nota | | | 31,678 | | | | — | | | | 1,039 | | | | — | | | | 32,717 | | | | 05.03.2016 | | | | | 28,785 | | | | — | | | | 944 | | | | — | | | | 29,729 | | | | 04.28.2017 | | | | | — | | | | 26,465 | | | | 868 | | | | — | | | | 27,333 | | | | 05.05.2018 | | | | | | | Performance shares (holdings) | | | 212,220 | | | | 93,018 | | | | 10,011 | | | | — | | | | 315,249 | | | | | | | | | | |
204 Annual Report 2013Philips Group
Number of restricted share rights (holdings)in number of shares11 Group financial statements 11.9 - 11.9
2015 | | | | | | | | | | | | | | | | | | | | | | | | | | | | | January 1,
2015 | | | awarded
2015 | | | released
2015 | | | December 31,
2015 | | | potential
premium
shares | | | | | | | F.A. van Houten | | | 6,667 | | | | — | | | | 6,667 | | | | — | | | | 7,010 | | A. Bhattacharya1) | | | 1,467 | | | | — | | | | 1,467 | | | | — | | | | 1,374 | | P.A.J. Nota | | | 4,534 | | | | — | | | | 4,534 | | | | — | | | | 4,291 | | | | | | | Restricted share rights (holdings) | | | 12,668 | | | | — | | | | 12,668 | | | | — | | | | 12,675 | | | | | | |
| 1) | Awarded before date of appointment as a member of the Board of Management |
Philips Group Remuneration costs of individual members of the Board of Managementin EUR in euros2013 - 2015
| | | | | | | | | | | | | | | | | | | | | | | | | | | | | | | | salary | | | annual incentive1) | | | performance shares2) | | | stock options2) | | | restricted share rights2) | | | pension costs | | | other compensation3) | | | 20134) | | | | | | | | | | | | | | | | | | | | | | | | | | | | | F.A. van Houten | | | 1,100,000 | | | | 1,081,520 | | | | 1,594,675 | | | | 461,215 | | | | 190,441 | | | | 468,407 | | | | 75,906 | | R.H. Wirahadiraksa | | | 656,250 | | | | 497,745 | | | | 1,040,393 | | | | 307,699 | | | | 128,856 | | | | 263,451 | | | | 35,732 | | P.A.J. Nota | | | 618,750 | | | | 561,713 | | | | 1,025,153 | | | | 352,608 | | | | 146,626 | | | | 253,605 | | | | 68,206 | | | | | | | | | | 2,375,000 | | | | 2,140,978 | | | | 3,660,221 | | | | 1,121,522 | | | | 465,923 | | | | 985,463 | | | | 179,844 | | | 20124) | | | | | | | | | | | | | | | | | | | | | | | | | | | | | F.A. van Houten | | | 1,100,000 | | | | 1,279,520 | | | | — | | | | 209,589 | | | | 315,760 | | | | 422,845 | | | | 47,154 | | R.H. Wirahadiraksa | | | 600,000 | | | | 523,440 | | | | — | | | | 149,067 | | | | 217,020 | | | | 243,438 | | | | 34,961 | | P.A.J. Nota | | | 600,000 | | | | 556,200 | | | | — | | | | 188,029 | | | | 253,836 | | | | 247,883 | | | | 60,754 | | S.H. Rusckowski (Jan. - Apr.) | | | 233,333 | | | | 178,500 | | | | — | | | | (200,400 | ) | | | (209,638 | ) | | | 90,211 | | | | 159,833 | | | | | | | | | | 2,533,333 | | | | 2,537,660 | | | | — | | | | 346,285 | | | | 576,978 | | | | 1,004,377 | | | | 302,701 | | | 2011 | | | | | | | | | | | | | | | | | | | | | | | | | | | | | F.A. van Houten (Apr. - Dec.) | | | 825,000 | | | | 363,000 | | | | — | | | | 125,957 | | | | 253,926 | | | | 297,179 | | | | 39,709 | | R.H. Wirahadiraksa (Apr. - Dec.) | | | 450,000 | | | | 148,500 | | | | — | | | | 105,477 | | | | 180,686 | | | | 170,299 | | | | 72,125 | | G.H.A. Dutiné | | | 650,000 | | | | 214,500 | | | | — | | | | 462,263 | | | | 334,186 | | | | 245,018 | | | | 143,774 | | P.A.J. Nota (Apr. - Dec.) | | | 450,000 | | | | 148,500 | | | | — | | | | 131,159 | | | | 255,159 | | | | 168,532 | | | | 67,067 | | S.H. Rusckowski | | | 687,500 | | | | 231,000 | | | | — | | | | 211,915 | | | | 341,856 | | | | 254,975 | | | | 336,773 | | G.J. Kleisterlee (Jan. - March) | | | 275,000 | | | | 92,400 | | | | — | | | | 375,736 | | | | 29,973 | | | | (48,117 | )5) | | | 105,679 | | P-J. Sivignon (Jan. - March) | | | 178,750 | | | | 45,045 | | | | — | | | | 213,435 | | | | 7,041 | | | | 68,830 | | | | 9,340 | | R.S. Provoost (Jan. - Sept.) | | | 512,500 | | | | 132,300 | | | | — | | | | 213,434 | | | | 69,545 | | | | 175,301 | | | | 22,606 | | | | | | | | | | 4,028,750 | | | | 1,375,245 | | | | — | | | | 1,839,376 | | | | 1,472,372 | | | | 1,332,017 | | | | 797,073 | |
| | | | | | | | | | | | | | | | | | | | | | | | | | | | | | | | | | | | | | | | | | | | | Base
compensation/
salary | | | annual
incentive1) | | | performance
shares2) | | | stock
options2) | | | restricted
share
rights2) | | | pension
allowances | | | pension
scheme
costs | | | other
compensation3) | | | total costs | | | | | | | | 2015 | | | | | | | | | | | | | | | | | | | | | | | | | | | | | | | | | | | | | F.A. van Houten | | | 1,168,750 | | | | 768,920 | | | | 1,273,940 | | | | 17,713 | | | | 28,279 | | | | 529,387 | | | | 25,241 | | | | 78,035 | | | | 3,890,265 | | A. Bhattacharya | | | 23,551 | | | | 11,937 | | | | 8,968 | | | | — | | | | 183 | | | | 7,315 | | | | 886 | | | | 998 | | | | 53,838 | | R.H. Wirahadiraksa | | | 664,583 | | | | 239,250 | | | | (652,049 | ) | | | 12,045 | | | | (37,210 | ) | | | 290,772 | | | | 24,002 | | | | 29,477 | | | | 570,870 | | P.A.J. Nota | | | 672,500 | | | | 383,112 | | | | 605,749 | | | | 12,045 | | | | 21,964 | | | | 270,529 | | | | 26,302 | | | | 104,918 | | | | 2,097,119 | | | | | | | | | | 2,529,384 | | | | 1,403,219 | | | | 1,236,608 | | | | 41,803 | | | | 13,216 | | | | 1,098,003 | | | | 76,431 | | | | 213,428 | | | | 6,612,092 | | 2014 F.A. van Houten | | | 1,137,500 | | | | 349,600 | | | | 860,564 | | | | 101,344 | | | | 76,951 | | | | — | | | | 485,655 | | | | 86,554 | | | | 3,098,168 | | R.H. Wirahadiraksa | | | 712,500 | | | | 156,600 | | | | 446,337 | | | | 68,914 | | | | 52,965 | | |
| —
|
| | | 298,995 | | | | 35,909 | | | | 1,772,220 | | P.A.J. Nota | | | 643,750 | | | | 258,180 | | | | 406,358 | | | | 68,914 | | | | 57,200 | | |
| —
|
| | | 267,037 | | | | 63,507 | | | | 1,764,946 | | | | | | | | | | 2,493,750 | | | | 764,380 | | | | 1,713,259 | | | | 239,172 | | | | 187,116 | | | | — | | | | 1,051,687 | | | | 185,970 | | | | 6,635,334 | | | 20134) | | | | | | | | | | | | | | | | | | | | | | | | | | | | | | | | | | | | | F.A. van Houten | | | 1,100,000 | | | | 1,081,520 | | | | 1,594,675 | | | | 461,215 | | | | 190,441 | | |
| —
|
| | | 468,407 | | | | 75,906 | | | | 4,972,164 | | R.H. Wirahadiraksa | | | 656,250 | | | | 497,745 | | | | 1,040,393 | | | | 307,699 | | | | 128,856 | | |
| —
|
| | | 263,451 | | | | 35,732 | | | | 2,930,126 | | P.A.J. Nota | | | 618,750 | | | | 561,713 | | | | 1,025,153 | | | | 352,608 | | | | 146,626 | | | | — | | | | 253,605 | | | | 68,206 | | | | 3,026,661 | | | | | | | | | | 2,375,000 | | | | 2,140,978 | | | | 3,660,221 | | | | 1,121,522 | | | | 465,923 | | | | — | | | | 985,463 | | | | 179,844 | | | | 10,928,951 | |
| 1) | The annual incentives are related to the performance in the year reported which are paid out in the subsequent year. For more details on the annual incentives, see sub-section 9.2.6,10.2.6, Annual Incentive, of this report |
| 2) | Costs of performance shares, stock options and restricted share rights (including the once-only Accelerate! Grant) are based on accounting standards (IFRS) and do not reflect the value of stock options at the end of the lock up period and the value of performance shares and restricted share rights at the vesting/release date |
| 3) | The stated amounts mainly concern (share of) allowances to members of the Board of Management that can be considered as remuneration. In a situation where such a share of an allowance can be considered as (indirect) remuneration (for example, private use of the company car), then the share is both valued and accounted for here. The method employed by the fiscal authorities in the Netherlands is the starting point for the value stated. In 2011 the other compensation for Mr Rusckowski includes an amount of USD 445,976 (= EUR 325,352) related to tax equalization in connection with pension obligationsstated |
| 4) | A crisis levy of 16% ashas been imposed by the Dutch government amountsamounting to in total EUR 681,596 in 2013 (2012: EUR 413,405) in total.for 2013. This crisis tax levy iswas payable by the employer and iswas charged over income of employees exceeding a EUR 150,000 threshold in 2012 and 2013. These expenses do not form part of the remuneration costs mentioned |
5) | As Mr Kleisterlee was born before January 1, 1950, he continued to be a member of the final pay plan with a pensionable age of 60. No further accrual took place
|
For further information on remuneration costs, see sub-section 9.2.4, Remuneration costs, of this report.
190 Annual Report 2013 2052015
11 Group financial statements 11.9 - 11.912.9
The tables below give an overviewPhilips Group
Stock options (holdings)in number of the holding of the members of the Board of Management under the performance share plans, restricted share rights plan and the stock option plans of the Company:shares Number of performance shares (holdings)2015
| | | | | | | | | | | | | | | | | January 1, 2015 | | granted | | | exercised | | | expired | | | December 31,
2015 | | | grant price (in euros) | | | share (closing) price on exercise date | | | expiry date | | | | | January 1, 2013 | | | awarded
2013 | | awarded dividend shares 2013 | | | December 31,
2013 | | | | | | F.A. van Houten | | | — | | | | 62,559 | | | | 2,112 | | | | 64,671 | | | | 20,400 | 1) | | | — | | | | — | | | | — | | | | 20,400 | | | | 22.88 | | | | — | | | | 10.18.2020 | | | | | — | | | | 55,000 | 1) | | | — | | | | 55,000 | | | | 75,000 | | | | — | | | | — | | | | — | | | | 75,000 | | | | 20.90 | | | | — | | | | 04.18.2021 | | R.H. Wirahadiraksa | | | — | | | | 31,991 | | | | 1,080 | | | | 33,071 | | | | | | | 75,000 | | | | — | | | | — | | | | — | | | | 75,000 | | | | 14.82 | | | | — | | | | 04.23.2022 | | | | | | 55,000 | | | | — | | | | — | | | | — | | | | 55,000 | | | | 22.43 | | | | — | | | | 01.29.2023 | | A. Bhattacharya | | | | 3,681 | 1) | | | — | | | | — | | | | — | | | | 3,681 | | | | 26.28 | | | | — | | | | 04.18.2016 | | | | | | 16,500 | 1) | | | — | | | | — | | | | — | | | | 16,500 | | | | 22.88 | | | | — | | | | 10.18.2020 | | | | | | 16,500 | 1) | | | — | | | | — | | | | — | | | | 16,500 | | | | 20.90 | | | | — | | | | 04.18.2021 | | | | | | 20,000 | 1) | | | — | | | | — | | | | — | | | | 20,000 | | | | 15.24 | | | | — | | | | 01.30.2022 | | | | | — | | | | 38,500 | 1) | | | — | | | | 38,500 | | | | 16,500 | 1) | | | — | | | | — | | | | — | | | | 16,500 | | | | 14.82 | | | | — | | | | 04.23.2022 | | P.A.J. Nota | | | — | | | | 29,621 | | | | 1,000 | | | | 30,621 | | | | 40,800 | 1) | | | — | | | | — | | | | — | | | | 40,800 | | | | 22.88 | | | | — | | | | 10.18.2020 | | | | | — | | | | 38,500 | 1) | | | — | | | | 38,500 | | | | 51,000 | | | | — | | | | — | | | | — | | | | 51,000 | | | | 20.90 | | | | — | | | | 04.18.2021 | | | | | | | | | 51,000 | | | | — | | | | — | | | | — | | | | 51,000 | | | | 14.82 | | | | — | | | | 04.23.2022 | | | | | — | | | | 256,171 | | | | 4,192 | | | | 260,363 | | | | 38,500 | | | | — | | | | — | | | | — | | | | 38,500 | | | | 22.43 | | | | — | | | | 01.29.2023 | | | | | | | | Stock options (holdings) | | | | 479,881 | | | | — | | | | — | | | | — | | | | 479,881 | | | | | | | | | | | | | |
| 1) | Once-only Accelerate! Grant
|
Number of restricted share rights (holdings)
| | | | | | | | | | | | | | | | | | | | | | | | January 1,
2013 | | | awarded
2013 | | | released
2013 | | | December 31,
2013 | | | potential
premium shares | | F.A. van Houten | | | 35,035 | 1) | | | — | | | | 15,034 | | | | 20,001 | | | | 9,024 | | R.H. Wirahadiraksa | | | 24,045 | 1) | | | — | | | | 10,443 | | | | 13,602 | | | | 6,935 | | P.A.J. Nota | | | 26,070 | 1) | | | — | | | | 12,468 | | | | 13,602 | | | | 7,482 | | | | | | | | | | 85,150 | | | | — | | | | 37,945 | | | | 47,205 | | | | 23,441 | |
1) | (Partly) awarded before date of appointment as a member of the Board of Management
|
Stock options (holdings)
| | | | | | | | | | | | | | | | | | | | | | | | | | | | | | | | | | | | January 1, 2013 | | | granted | | | exercised | | | expired | | | December 31, 2013 | | | grant price
(in euros) | | | share (closing)
price on
exercise date | | | expiry date | | F.A. van Houten | | | 20,400 | 1) | | | — | | | | — | | | | — | | | | 20,400 | | | | 22.88 | | | | — | | | | 10.18.2020 | | | | | 75,000 | | | | — | | | | — | | | | — | | | | 75,000 | | | | 20.90 | | | | — | | | | 04.18.2021 | | | | | 75,000 | | | | — | | | | — | | | | — | | | | 75,000 | | | | 14.82 | | | | — | | | | 04.23.2022 | | | | | — | | | | 55,000 | 2) | | | — | | | | — | | | | 55,000 | | | | 22.43 | | | | — | | | | 01.29.2023 | | R.H. Wirahadiraksa | | | 10,800 | 1) | | | — | | | | — | | | | — | | | | 10,800 | | | | 23.11 | | | | — | | | | 04.14.2018 | | | | | 12,000 | 1) | | | — | | | | — | | | | — | | | | 12,000 | | | | 12.63 | | | | — | | | | 04.14.2019 | | | | | 16,500 | 1) | | | — | | | | — | | | | — | | | | 16,500 | | | | 24.90 | | | | — | | | | 04.19.2020 | | | | | 51,000 | | | | — | | | | — | | | | — | | | | 51,000 | | | | 20.90 | | | | — | | | | 04.18.2021 | | | | | 51,000 | | | | — | | | | — | | | | — | | | | 51,000 | | | | 14.82 | | | | — | | | | 04.23.2022 | | | | | — | | | | 38,500 | 2) | | | — | | | | — | | | | 38,500 | | | | 22.43 | | | | — | | | | 01.29.2023 | | P.A.J. Nota | | | 40,800 | 1) | | | — | | | | — | | | | — | | | | 40,800 | | | | 22.88 | | | | — | | | | 10.18.2020 | | | | | 51,000 | | | | — | | | | — | | | | — | | | | 51,000 | | | | 20.90 | | | | — | | | | 04.18.2021 | | | | | 51,000 | | | | — | | | | — | | | | — | | | | 51,000 | | | | 14.82 | | | | — | | | | 04.23.2022 | | | | | — | | | | 38,500 | 2) | | | — | | | | — | | | | 38,500 | | | | 22.43 | | | | — | | | | 01.29.2023 | | | | | | | | | | 454,500 | | | | 132,000 | | | | — | | | | — | | | | 586,500 | | | | | | | | | | | | | |
1) | Awarded before date of appointment as a member of the Board of Management |
2) | Performance Accelerate! Grant options as of January 29, 2013
|
206 Annual Report 2013
11 Group financial statements 11.9 - 11.9
See note 31,28, Share-based compensation for further information on performance shares, stock options and restricted share rights as well sub- section 9.2.7,sub-section 10.2.7, Long-Term Incentive Plan, of this report. The accumulated annual pension entitlements and the pension costs of individual members of the Board of Management are as follows (in euros)EUR): Philips Group Accumulated annual pension entitlements and pension related costsin EUR 2015 | | | | | | | | | | | | | | | age at
December 31, 2015 | | | accumulated annual
pension as of
December 31, 20151) | | | total pension related costs2) | | | | | age at
December 31,
2013 | | | accumulated
annual
pension as of
December 31,
20131) | | | pension costs2,3) | | | | | | F.A. van Houten | | | 53 | | | | 60,203 | | | | 468,407 | | | | 55 | | | | 291,722 | | | | 554,628 | | A. Bhattacharya | | | | 54 | | | | 22,254 | | | | 8,201 | | P.A.J. Nota | | | | 51 | | | | 42,434 | | | | 296,831 | | R.H. Wirahadiraksa | | | 53 | | | | 33,208 | | | | 263,451 | | | | 55 | | | | 109,141 | | | | 314,774 | | P.A.J. Nota | | | 49 | | | | 24,785 | | | | 253,605 | | | | | | | | | | | | Pension costs | | | | | | | | 1,174,434 | | | | | | | | | 985,463 | | | | | |
| 1) | Under average pay plan,Total of entitlements under Philips pension scheme, including - if applicable - transferred pension entitlements under pension scheme(s) of previous employer(s)
|
| 2) | Including costsCost related to employer contribution in defined-contribution pension plan
|
3) | Cost are related to the period of board membership and include paid pension allowances as well as pension premium paid by employer to Collective Defined Contribution plan
|
When pension rights are granted to members of the Board of Management, necessary payments(ifpayments (if insured) and all necessary provisions are made in accordance with the applicable accounting principles. In 2013,2015, no (additional) pension benefits were granted to former members of the Board of Management. Remuneration of the Supervisory Board The remuneration of the members of the Supervisory Board amounted to EUR 747,000 (2012:1,083,667 (2014: EUR 799,500; 2011:816,668; 2013: EUR 803,250);747,000) former members received no remuneration. At December 31, 2013,2015 the members of the Supervisory Board held no stock options. Annual Report 2013 207
11 Group financial statements 11.9 - 11.9
The individual members of the Supervisory Board received, by virtue of the positions they held, the following remuneration (in euros)EUR): | | | | | | | | | | | | | | | | | | | | membership | | | committees | | | other
compensation1) | | | total | | | 20132) | | | | | | | | | | | | | | | | | J. van der Veer | | | 110,000 | | | | 20,500 | | | | 5,000 | | | | 135,500 | | J.J. Schiro | | | 65,000 | | | | 18,500 | | | | 8,000 | | | | 91,500 | | C.J.A. van Lede | | | 65,000 | | | | 10,000 | | | | 5,000 | | | | 80,000 | | E. Kist | | | 65,000 | | | | 8,000 | | | | 5,000 | | | | 78,000 | | H. von Prondzynski | | | 65,000 | | | | 10,000 | | | | 5,000 | | | | 80,000 | | C. Poon | | | 65,000 | | | | 14,000 | | | | 11,000 | | | | 90,000 | | J.P. Tai | | | 65,000 | | | | 15,000 | | | | 20,000 | | | | 100,000 | | N. Dhawan | | | 65,000 | | | | 10,000 | | | | 17,000 | | | | 92,000 | | | | | | | | | | 565,000 | | | | 106,000 | | | | 76,000 | | | | 747,000 | | | 2012 | | | | | | | | | | | | | | | | | J. van der Veer | | | 110,000 | | | | 20,500 | | | | 5,000 | | | | 135,500 | | J.M. Thompson (Jan. - Apr.) | | | 32,500 | | | | 4,667 | | | | 11,000 | | | | 48,167 | | C.J.A. van Lede | | | 65,000 | | | | 10,834 | | | | 5,000 | | | | 80,834 | | E. Kist | | | 65,000 | | | | 10,333 | | | | 5,000 | | | | 80,333 | | J.J. Schiro | | | 65,000 | | | | 17,000 | | | | 17,000 | | | | 99,000 | | H. von Prondzynski | | | 65,000 | | | | 10,000 | | | | 5,000 | | | | 80,000 | | C. Poon | | | 65,000 | | | | 12,666 | | | | 14,000 | | | | 91,666 | | J.P. Tai | | | 65,000 | | | | 13,333 | | | | 17,000 | | | | 95,333 | | N. Dhawan (Apr. - Dec.) | | | 65,000 | | | | 6,667 | | | | 17,000 | | | | 88,667 | | | | | | | | | | 597,500 | | | | 106,000 | | | | 96,000 | | | | 799,500 | | | 2011 | | | | | | | | | | | | | | | | | J. van der Veer | | | 98,750 | | | | 19,375 | | | | 2,000 | | | | 120,125 | | J-M. Hessels (Jan. - March) | | | 55,000 | | | | 5,125 | | | | 2,000 | | | | 62,125 | | J.M. Thompson | | | 65,000 | | | | 14,000 | | | | 20,000 | | | | 99,000 | | C.J.A. van Lede | | | 65,000 | | | | 12,500 | | | | 2,000 | | | | 79,500 | | E. Kist | | | 65,000 | | | | 15,000 | | | | 2,000 | | | | 82,000 | | J.J. Schiro | | | 65,000 | | | | 14,000 | | | | 17,000 | | | | 96,000 | | H. von Prondzynski | | | 65,000 | | | | 10,000 | | | | 2,000 | | | | 77,000 | | C. Poon | | | 65,000 | | | | 10,000 | | | | 20,000 | | | | 95,000 | | J.P. Tai (Apr, - Dec.) | | | 65,000 | | | | 7,500 | | | | 20,000 | | | | 92,500 | | | | | | | | | | 608,750 | | | | 107,500 | | | | 87,000 | | | | 803,250 | |
1) | The amounts mentioned under other compensation relate to the fee for intercontinental travel and the entitlement of EUR 2,000 under the Philips product arrangement
|
2) | As of 2013, part of the renumeration of members of the Supervisory Board living in the Netherlands is subject to VAT. The amounts mentioned in this table are excluding VAT
|
Supervisory Board members’ and Board of Management members’ interests in Philips shares Members of the Supervisory Board and of the Board of Management are not allowed to hold any interests in derivativederivatives of Philips securities. Philips Group NumberShares held by Board members1)in number of shares1)
2015 | | | | | | | | | | | | December 31,
2012 | | | December 31,
2013 | | J. van der Veer | | | 16,624 | | | | 17,192 | | H. von Prondzynski | | | 3,290 | | | | 3,402 | | J.P. Tai | | | 1,053 | | | | 2,175 | | F.A. van Houten | | | 21,048 | | | | 37,258 | | R.H. Wirahadiraksa | | | 16,060 | | | | 27,879 | | P.A.J. Nota | | | 11,757 | | | | 24,937 | |
| | | | | | | | | | | | | | | | | December 31, 2014 | | | December 31,
2015 | | | | | | | J. van der Veer | | | 17,784 | | | | 18,366 | | H. von Prondzynski | | | 3,519 | | | | 3,633 | | J.P.Tai | | | 3,284 | | | | 3,716 | | F.A. van Houten | | | 109,570 | | | | 121,762 | | A. Bhattacharya | | | 26,807 | | | | 29,415 | | P.A.J. Nota | | | 59,491 | | | | 66,133 | | | | | | |
| 1) | Reference date for board membership is December 31, 2015 |
Annual Report 2015 191
Group financial statements 12.9 Philips Group Remuneration of the Supervisory Boardin EUR 2013 - 2015 | | | | | | | | | | | | | | | | | | | | | | | | | membership | | | committees | | | other
compensation1) | | | total | | | | | | | | 20152) | | | | | | | | | | | | | | | | | J.A. van der Veer | | | 135,000 | | | | 31,667 | | | | 7,000 | | | | 173,667 | | C. Poon | | | 90,000 | | | | 17,500 | | | | 15,000 | | | | 122,500 | | C.J.A. van Lede | | | 80,000 | | | | 14,333 | | | | 7,000 | | | | 101,333 | | E. Kist | | | 80,000 | | | | 10,000 | | | | 2,000 | | | | 92,000 | | H. von Prondzynski | | | 80,000 | | | | 26,833 | | | | 19,500 | | | | 126,333 | | J.P. Tai | | | 80,000 | | | | 29,167 | | | | 35,000 | | | | 144,167 | | N. Dhawan | | | 80,000 | | | | 13,000 | | | | 20,000 | | | | 113,000 | | O. Gadiesh | | | 80,000 | | | | 13,000 | | | | 17,000 | | | | 110,000 | | D.E.I. Pyott (May-Dec.) | | | 80,000 | | | | 8,667 | | | | 12,000 | | | | 100,667 | | | | | | | | | | 785,000 | | | | 164,167 | | | | 134,500 | | | | 1,083,667 | | | 20142) | | | | | | | | | | | | | | | | | J.A. van der Veer | | | 110,000 | | | | 20,500 | | | | 2,000 | | | | 132,500 | | J.J. Schiro (Jan.-Aug.) | | | 65,000 | | | | 12,334 | | | | 2,000 | | | | 79,334 | | C. Poon | | | 65,000 | | | | 14,000 | | | | 17,000 | | | | 96,000 | | C.J.A. van Lede | | | 65,000 | | | | 10,000 | | | | 2,000 | | | | 77,000 | | E. Kist | | | 65,000 | | | | 8,000 | | | | 2,000 | | | | 75,000 | | H. von Prondzynski | | | 65,000 | | | | 15,167 | | | | 2,000 | | | | 82,167 | | J.P. Tai | | | 65,000 | | | | 15,000 | | | | 23,000 | | | | 103,000 | | N. Dhawan | | | 65,000 | | | | 10,000 | | | | 23,000 | | | | 98,000 | | O. Gadiesh (May-Dec.) | | | 65,000 | | | | 6,667 | | | | 2,000 | | | | 73,667 | | | | | | | | | | 630,000 | | | | 111,668 | | | | 75,000 | | | | 816,668 | | | 20132) | | | | | | | | | | | | | | | | | J. van der Veer | | | 110,000 | | | | 20,500 | | | | 5,000 | | | | 135,500 | | J.J. Schiro | | | 65,000 | | | | 18,500 | | | | 8,000 | | | | 91,500 | | C.J.A. van Lede | | | 65,000 | | | | 10,000 | | | | 5,000 | | | | 80,000 | | E. Kist | | | 65,000 | | | | 8,000 | | | | 5,000 | | | | 78,000 | | H. von Prondzynski | | | 65,000 | | | | 10,000 | | | | 5,000 | | | | 80,000 | | C. Poon | | | 65,000 | | | | 14,000 | | | | 11,000 | | | | 90,000 | | J.P. Tai | | | 65,000 | | | | 15,000 | | | | 20,000 | | | | 100,000 | | N. Dhawan | | | 65,000 | | | | 10,000 | | | | 17,000 | | | | 92,000 | | | | | | | | | | 565,000 | | | | 106,000 | | | | 76,000 | | | | 747,000 | |
| 1) | The amounts mentioned under other compensation relate to the fee for intercontinental travel, inter-european travel (effective 2015) and the entitlement of EUR 2,000 under the Philips product arrangement |
| 2) | As of 2013, part of the remuneration of members of the Supervisory Board living in the Netherlands is subject to VAT. The amounts mentioned in this table are excluding VAT |
The estimated fair value of financial instruments has been determined by the Company using available market information and appropriate valuation methods. The estimates presented are not necessarily indicative of the amounts that will ultimately be realized by the Company upon maturity or disposal. The use of different market assumptions and/or estimation methods may have a material effect on the estimated fair value amounts. For cash and cash equivalents, current receivables, accounts payable, interest accrual and short-term debts, the carrying amounts approximate fair value because of the short maturity of these instruments, and therefore fair value information is not included in the table below. The fair value of Philips’ debt is estimated on the basis of the quoted market prices for certain issues, or on the basis of discounted cash flow analysis based upon market rates plus Philips’ spread for the particular tenors of the borrowing arrangement. Accrued interest is not included within the carrying amount or estimated fair value of debt. 208192 Annual Report 20132015
11 Group financial statements 11.9 - 11.912.9
Philips Group | | | | | | | | | | | | | | | | | | | | December 31, 2012 | | | December 31, 2013 | | | | | carrying
amount | | | estimated
fair value | | | carrying
amount | | | estimated
fair value | | Financial assets | | | | | | | | | | | | | | | | | Carried at fair value: | | | | | | | | | | | | | | | | | Available-for-sale financial assets-non-current | | | 153 | | | | 153 | | | | 96 | | | | 96 | | Available-for-sale financial assets-current | | | — | | | | — | | | | 10 | | | | 10 | | Securities classified as assets held for sale | | | — | | | | — | | | | 62 | | | | 62 | | Fair value through profit and loss-non-current | | | 47 | | | | 47 | | | | 29 | | | | 29 | | Derivative financial instruments | | | 137 | | | | 137 | | | | 150 | | | | 150 | | | | | | | | | | 337 | | | | 337 | | | | 347 | | | | 347 | | Carried at (amortized) cost: | | | | | | | | | | | | | | | | | Cash and cash equivalents | | | 3,834 | | | | | | | | 2,465 | | | | | | Loans and receivables: | | | | | | | | | | | | | | | | | Non-current loans and receivables | | | 140 | | | | 140 | | | | 143 | | | | 143 | | Other non-current loans and receivables | | | 127 | | | | | | | | 129 | | | | | | Loans classified as assets held for sale | | | — | | | | | | | | 30 | | | | | | Receivables-current | | | 4,585 | | | | | | | | 4,678 | | | | | | Receivables-non-current | | | 176 | | | | 176 | | | | 144 | | | | 144 | | Held-to-maturity investments | | | 3 | | | | | | | | 3 | | | | | | Available-for-sale financial assets | | | 79 | | | | | | | | 96 | | | | | | | | | | | | | | 8,944 | | | | 316 | | | | 7,688 | | | | 287 | | Financial liabilities | | | | | | | | | | | | | | | | | Carried at fair value: | | | | | | | | | | | | | | | | | Fair value through profit and loss-non-current | | | (11 | ) | | | (11 | ) | | | (13 | ) | | | (13 | ) | Derivative financial instruments | | | (517 | ) | | | (517 | ) | | | (368 | ) | | | (368 | ) | Carried at (amortized) cost: | | | | | | | | | | | | | | | | | Accounts payable | | | (2,839 | ) | | | | | | | (2,462 | ) | | | | | Interest accrual | | | (75 | ) | | | | | | | (57 | ) | | | | | Debt (Corporate bond and finance lease) | | | (3,412 | ) | | | (4,162 | ) | | | (3,157 | ) | | | (3,545 | ) | Debt (Bank loans, overdrafts etc.) | | | (1,122 | ) | | | | | | | (744 | ) | | | | | | | | | | | | | (7,448 | ) | | | (4,162 | ) | | | (6,420 | ) | | | (3,545 | ) |
Fair value of financial assets and liabilitiesin millions of EUR 2014 - 2015 | | | | | | | | | | | | | | | | | | | | | | | | | Balance as of
December 31, 2014 | | | Balance as of
December 31, 2015 | | | | | | | | | | carrying
amount | | | estimated
fair value | | | carrying
amount | | | estimated
fair value | | | | | | | Financial assets | | | | | | | | | | | | | | | | | Carried at fair value: | | | | | | | | | | | | | | | | | Available-for-sale financial assets - non-current | | | 143 | | | | 143 | | | | 199 | | | | 199 | | Securities classified as assets held for sale | | | 38 | | | | 38 | | | | (1 | ) | | | (1 | ) | Fair value through profit and loss - non-current | | | 24 | | | | 24 | | | | 33 | | | | 33 | | Derivative financial instruments | | | 207 | | | | 207 | | | | 161 | | | | 161 | | | | | | | Financial assets carried at fair value | | | 412 | | | | | | | | 392 | | | | | | Carried at (amortized) cost: | | | | | | | | | | | | | | | | | Cash and cash equivalents | | | 1,873 | | | | | | | | 1,766 | | | | | | Loans and receivables: | | | | | | | | | | | | | | | | | Loans - current | | | 125 | | | | 125 | | | | 12 | | | | | | Non-current loans and receivables | | | 86 | | | | 86 | | | | 88 | | | | 88 | | Other non-current loans and receivables | | | 140 | | | | | | | | 134 | | | | | | Loans classified as assets held for sale | | | — | | | | | | | | 2 | | | | | | Receivables - current | | | 4,723 | | | | | | | | 4,982 | | | | | | Receivables - non-current | | | 177 | | | | 177 | | | | 191 | | | | 191 | | Held-to-maturity investments | | | 2 | | | | | | | | 2 | | | | | | Available-for-sale financial assets | | | 67 | | | | | | | | 33 | | | | | | | | | | | Financial assets carried at (amortized) costs | | | 7,193 | | | | | | | | 7,210 | | | | | | Financial liabilities | | | | | | | | | | | | | | | | | Carried at fair value: | | | | | | | | | | | | | | | | | Derivative financial instruments | | | (857 | ) | | | (857 | ) | | | (933 | ) | | | (933 | ) | | | | | | Financial liabilities carried at fair value | | | (857 | ) | | | | | | | (933 | ) | | | | | Carried at (amortized) cost: | | | | | | | | | | | | | | | | | Accounts payable | | | (2,499 | ) | | | | | | | (2,673 | ) | | | | | Interest accrual | | | (56 | ) | | | | | | | (69 | ) | | | | | Debt (Corporate bond and finance lease) | | | (3,551 | ) | | | (4,164 | ) | | | (3,944 | ) | | | (4,294 | ) | Debt (Bank loans, overdrafts etc.) | | | (553 | ) | | | | | | | (1,816 | ) | | | | | | | | | | Financial liabilities carried at (amortized) costs | | | (6,659 | ) | | | | | | | (8,502 | ) | | | | | | | | | |
Annual Report 2015 193
Group financial statements 12.9 Philips Group Fair value hierarchyin millions of EUR 2015 | | | | | | | | | | | | | | | | | | | | | | | | | level 1 | | | level 2 | | | level 3 | | | total | | | | | | | Balance as of December 31, 2015 | | | | | | | | | | | | | | | | | Available-for-sale financial assets - non-current | | | 76 | | | | 68 | | | | 55 | | | | 199 | | Securities classified as assets held for sale | | | (1 | ) | | | — | | | | — | | | | (1 | ) | Financial assets designated at fair value through profit and loss - non-current | | | — | | | | 33 | | | | — | | | | 33 | | Derivative financial instruments - assets | | | — | | | | 161 | | | | — | | | | 161 | | Non-current loans and receivables | | | — | | | | 88 | | | | — | | | | 88 | | Receivables - non-current | | | — | | | | 191 | | | | — | | | | 191 | | | | | | | Total financial assets | | | 75 | | | | 541 | | | | 55 | | | | 671 | | Derivative financial instruments - liabilities | | | — | | | | (933 | ) | | | — | | | | (933 | ) | Debt | | | (4,084 | ) | | | (210 | ) | | | — | | | | (4,294 | ) | | | | | | Total financial liabilities | | | (4,084 | ) | | | (1,143 | ) | | | — | | | | (5,227 | ) | Balance as of December 31, 2014 | | | | | | | | | | | | | | | | | Available-for-sale financial assets - non-current | | | 17 | | | | 105 | | | | 21 | | | | 143 | | Securities classified as assets held for sale | | | 1 | | | | — | | | | 37 | | | | 38 | | Financial assets designated at fair value through profit and loss - non-current | | | — | | | | 24 | | | | — | | | | 24 | | Derivative financial instruments - assets | | | — | | | | 207 | | | | — | | | | 207 | | Loans - current | | | — | | | | 125 | | | | — | | | | 125 | | Non-current loans and receivables | | | — | | | | 86 | | | | — | | | | 86 | | Receivables - non-current | | | — | | | | 177 | | | | — | | | | 177 | | | | | | | Total financial assets | | | 18 | | | | 724 | | | | 58 | | | | 800 | | Derivative financial instruments - liabilities | | | — | | | | (857 | ) | | | — | | | | (857 | ) | Debt | | | (3,969 | ) | | | (195 | ) | | | — | | | | (4,164 | ) | | | | | | Total financial liabilities | | | (3,969 | ) | | | (1,052 | ) | | | — | | | | (5,021 | ) | | | | | |
The table belowabove represents categorization of measurement of the estimated fair values of financial assets and liabilities. | | | | | | | | | | | | | | | | | | Fair value hierarchy | | | | | | | | | | | | | | | | level 1 | | | level 2 | | | level 3 | | | total | | December 31, 2013 | | | | | | | | | | | | | | | | | Available-for-sale financial assets - non-current | | | 42 | | | | — | | | | 54 | | | | 96 | | Available-for-sale financial assets - current | | | 6 | | | | 4 | | | | — | | | | 10 | | Securities classified as assets held for sale | | | 62 | | | | — | | | | — | | | | 62 | | Financial assets designated at fair value through profit and loss - non-current | | | 22 | | | | — | | | | 7 | | | | 29 | | Derivative financial instruments - assets | | | — | | | | 150 | | | | — | | | | 150 | | Non-current loans and receivables including guarantee deposits | | | — | | | | 143 | | | | — | | | | 143 | | Receivables - non-current | | | — | | | | 144 | | | | — | | | | 144 | | | | | | | Total financial assets | | | 132 | | | | 441 | | | | 61 | | | | 634 | | Financial liabilities designated at fair value through profit and loss - non-current | | | — | | | | — | | | | (13 | ) | | | (13 | ) | Derivative financial instruments - liabilities | | | — | | | | (368 | ) | | | — | | | | (368 | ) | Debt | | | (3,345 | ) | | | (200 | ) | | | — | | | | (3,545 | ) | | | | | | Total financial liabilities | | | (3,345 | ) | | | (568 | ) | | | (13 | ) | | | (3,926 | ) | December 31, 2012 | | | | | | | | | | | | | | | | | Available-for-sale financial assets - non-current | | | 110 | | | | — | | | | 43 | | | | 153 | | Financial assets designated at fair value through profit and loss - non-current | | | 28 | | | | — | | | | 19 | | | | 47 | | Derivative financial instruments - assets | | | | | | | 137 | | | | — | | | | 137 | | Non-current loans and receivables including guarantee deposits | | | — | | | | 140 | | | | — | | | | 140 | | Receivables - non-current | | | — | | | | 176 | | | | — | | | | 176 | | | | | | | Total financial assets | | | 138 | | | | 453 | | | | 62 | | | | 653 | | Financial liabilities designated at fair value through profit and loss - non-current | | | — | | | | — | | | | (11 | ) | | | (11 | ) | Derivative financial instruments - liabilities | | | — | | | | (517 | ) | | | — | | | | (517 | ) | Debt | | | (3,948 | ) | | | (214 | ) | | | — | | | | (4,162 | ) | | | | | | Total financial liabilities | | | (3,948 | ) | | | (731 | ) | | | (11 | ) | | | (4,690 | ) |
Specific valuation techniques used to value financial instruments include: Level 1 Instruments included in level 1 are comprised primarily of listed equity investments classified as available-for-sale financial assets, investees and financial assets designated at fair value through profit and loss. The fair value of financial instruments traded in active markets is based on quoted market prices at the balance sheet date. A market is regarded as active if quoted prices are readily and regularly available from an exchange, dealer, broker, industry group, pricing service, or regulatory agency, and those prices represent actual and regularly occurring market transactions on an arm’s length basis. Annual Report 2013 209
11 Group financial statements 11.9 - 11.9
Level 2 The fair value of financial instruments that are not traded in an active market (for example, over-the-counter derivatives or convertible bond instruments) are determined by using valuation techniques. These valuation techniques maximize the use of observable market data where it is available and rely as little as possible on entity-specific estimates. If all significant inputs required to fair value an instrument are based on observable market data, the instrument is included in level 2. The fair value of derivatives is calculated as the present value of the estimated future cash flows based on observable interest yield curves, basis spread and foreign exchange rates. The valuation of convertible bond instruments uses observable market quoted data for the options and present value calculations using observable yield curves for the fair value of the bonds. Level 3 If one or more of the significant inputs are not based on observable market data, the instrument is included in level 3. The arrangement
Transfers between levels At 31 December 2015, an available-for-sale equity security with a carrying amount of EUR 51 million was transferred from Level 2 to Level 1 due to its listing with quoted prices in the UK Pension Fund in conjunctionmarket. An available-for-sale equity security with a carrying amount of EUR 23 million was transferred to Level 3 due to the sale of NXP is a financial instrument carried atupdated fair value classified as level 3. At the end of 2013, the fair value of this instrument is estimated to be EUR 7 million with the changesfrom a private financing round. The classifications of fair value recorded to financial income and expense. Please refer to note 14, Other non-currenthierarchies of financial assets were restated for more details.2014. Furthermore, deferred consideration and loan extension options to TP Vision are also included in level 3. On January 20, 2014, Philips has signed a term sheet to transfer its remaining 30% stake in TP Vision, which will also impact the above commitments. For further information, please refer to note 36, Subsequent events.
194 Annual Report 2015
Group financial statements 12.9 The table below shows the reconciliation from the beginning balance to the end balance for fair value measured in Level 3 of the fair value hierarchy. Philips Group | | | | | | | | | | | | financial assets | | | financial liabilities | | Balance at January 1, 2013 | | | 62 | | | | (11 | ) | Total gains and losses recognized in: | | | | | | | | | - profit or loss | | | (12 | ) | | | (2 | ) | - other comprehensive income | | | 11 | | | | — | | | | | | | Balance at December 31, 2013 | | | 61 | | | | (13 | ) |
Reconciliation of the fair value hierarchyin millions of EUR 2015 | | | | | | | financial assets | | | | | | | Balance as of January 1, 2015 | | | 58 | | Gains and losses recognized in: | | | | | - in profit or loss | | | 9 | | - in other comprehensive income | | | 15 | | Transfer into level 3 | | | 13 | | Purchase | | | 7 | | Sales | | | (47 | ) | | | | | | Balance as of December 31, 2015 | | | 55 | | | | | | |
Philips has the following balances related to its derivative activities. These transactions are subject to master netting and set-off agreements. In case of certain termination events, under the terms of the Master Agreement, Philips can terminate the outstanding transactions and aggregate their positive and negative values to arrive at a single net termination sum (or close-out amount). This contractual right is subject to the following: The right may be limited by local law if the counterparty is subject to bankruptcy proceedings; The right applies on a bilateral basis. Philips Group Financial assets subject to offsetting, enforceable master netting arrangements or similar agreementsin millions of EUR 2014 - 2015 | | | | | | | | | | | | | 2014 | | | 2015 | | | | | 2012 | | 2013 | | | | | | | Derivatives | | | | | | | | | Gross amounts of recognized financial assets | | | 137 | | | | 150 | | | | 207 | | | | 161 | | Gross amounts of recognized financial liabilities offset in the statement of financial position | | | — | | | | — | | | Net amounts of financial assets presented in the statement of financial position | | | 137 | | | | 150 | | | Gross amounts of recognized financial liabilities offset in the balance sheet | | | | — | | | | — | | | | | | | | Related amounts not offset in the statement of financial position | | | | | | Net amounts of financial assets presented in the balance sheet | | | | 207 | | | | 161 | | | Related amounts not offset in the balance sheet | | | | | | Financial instruments | | | (67 | ) | | | (85 | ) | | | (161 | ) | | | (81 | ) | Cash collateral received | | | — | | | | — | | | | — | | | | — | | | | | | | | | | | Net amount | | | 70 | | | | 65 | | | | 46 | | | | 80 | | | | | | | |
Philips Group Financial liabilities subject to offsetting, enforceable master netting arrangements or similar agreementsin millions of EUR 2014 - 2015 | | | | | | | | | | | | | 2014 | | | 2015 | | | | | 2012 | | 2013 | | | | | | | Derivatives | | | | | | | | | Gross amounts of recognized financial liabilities | | | (517 | ) | | | (368 | ) | | | (857 | ) | | | (933 | ) | Gross amounts of recognised financial assets offset in the statement of financial position | | | — | | | | — | | | Net amounts of financial liabilities presented in the statement of financial position | | | (517 | ) | | | (368 | ) | | Gross amounts of recognized financial assets offset in the balance sheet | | | | — | | | | — | | | | | | | | Related amounts not offset in the statement of financial position | | | | | | Net amounts of financial liabilities presented in the balance sheet | | | | (857 | ) | | | (933 | ) | | Related amounts not offset in the balance sheet | | | | | | Financial instruments | | | 67 | | | | 85 | | | | 161 | | | | 81 | | Cash collateral received | | | — | | | | — | | | | — | | | | — | | | | | | | | | | | Net amount | | | (450 | ) | | | (283 | ) | | | (696 | ) | | | (852 | ) | | | | | | |
Philips is exposed to several types of financial risk.risks. This note further analyzes financial risks. Philips does not purchase or hold derivative financial instruments for speculative purposes. Information regarding financial instruments is included in note 34,30, Fair value of financial assets and liabilities. Liquidity risk Liquidity risk is the risk that an entity will encounter difficulty in meeting obligations associated with financial liabilities. Liquidity risk for the group is monitored through the Treasury liquidity committee which tracks the development of the actual cash flow position for the group and uses input from a number of sources in order to forecast the overall liquidity position both on a short and long termlong-term basis. Group Treasury invests surplus cash in money market deposits with appropriate maturities to ensure sufficient liquidity is available to meet liabilities when due. The rating of the Company’s debt by major rating services may improve or deteriorate. As a result, Philips’ future borrowing capacity may be influenced and its financing costs may fluctuate. Philips has various sources to mitigate the liquidity risk for the group. At December 31, 2013,2015, Philips had EUR 2,4651,766 million in cash and cash equivalents (2012:(2014: EUR 3,8341,873 million), within which short-term deposits of EUR 1,714855 million (2012:(2014: EUR 3,1771,057 million) and other liquid assets of EUR 18171 million (2012:(2014: EUR 120121 million). Philips pools cash from subsidiaries to the extent legally and economically feasible; cash not pooled remains available for operational or investment needs by the Company. 210 Annual Report 2013
11 Group financial statements 11.9 - 11.9
Furthermore, Philips has a USD 2.5 billion Commercial Paper Program and a EUR 1.8 billion revolving credit facility that can be used for general group purpose and as a backstop for its commercial paper program. In January 2013 the EUR 1.8 billion facility was extended by 2 years until February 18, 2018. The facility has no financial covenants and repetitive material adverse change clauses and can be used for general group purposes. As of December 31, 2013,2015, Philips did not have any amounts outstanding under any of these facilities. Additionally Philips also held EUR 6575 million of equity investments in available-for-sale financial assets (fair value at December 31, 2013)2015). Currency risk Currency risk is the risk that reported financial performance or the fair value or future cash flows of a financial instrument will fluctuate because of changes in foreign exchange rates. Currency Philips operates in many countries and currencies and therefore currency Annual Report 2015 195
Group financial statements 12.9 fluctuations may impact Philips’ financial results. Philips is exposed to currency risk in the following areas: Transaction exposures, related to forecastedanticipated sales and purchases and on-balance-sheet receivables/payables resulting from such transactions Translation exposure of net income in foreign entities
Translation exposure of foreign-currency intercompany and external debt and deposits Translation exposure of net income in foreign entities Translation exposure of foreign-currency-denominated equity invested in consolidated companies Translation exposure to equity interests in non-functional-currency investments in associates and available-for-sale financial assets. It is Philips’ policy that significant transactionto reduce the potential year on year volatility caused by foreign-currency movements on its net earnings by hedging the anticipated net exposure of foreign currencies resulting from foreign-currency sales and purchases. In general net anticipated exposures for the Group are hedged by the businesses. Accordingly, all businesses are requiredduring a period of 15 months in layers of 20% up to identifya maximum hedge of 80%, using forwards and measure their exposures resulting from material transactions denominated in currencies other than their own functional currency.currency options. Philips’ policy generally requires significant committed foreign currency exposures to be fully hedged, generally using forwards. Anticipated transactionsHowever not every foreign currency can or shall be hedged as there may be hedged using forwardsregulatory barriers or options prohibitive hedging cost preventing Philips from effectively and/or a combination thereof. The amount hedged as a proportion of the total anticipated exposure identified varies per business and is a function of the ability to project cash flows, the time horizon for the cash flows and the way in which the businesses can adapt to changing levels of foreign-currency exchange rates.efficiently hedging its currency exposures. As a result, hedging activities cannot and will not eliminate all currency risks for theseanticipated and committed transaction exposures. During 2015 Philips has changed its hedging policy with regard to anticipated transaction exposures. Generally,The previous hedging policy focused on protecting against changes in value of forecasted individual transactions and cash flows. Under the maximum tenorprevious policy the hedging ratio and period were set by individual businesses based on their ability to forecast cash flows, the time horizon for the cash flows and their ability to adapt to changing levels of theseforeign currency rates. Existing hedges is 18 months.under the old policy are continued until they mature against the original forecasted transactional exposures. The following table outlines the estimated nominal value in millions of eurosEUR for transaction exposure and related hedges for Philips’ most significant currency exposures consolidated as of December 31, 2013:2015: Philips Group Estimated transaction exposure and related hedges in millions of eurosEUR 2015 | | | | | | | | | | | | | | | | | | | | maturity 0-60 days | | | maturity over 60 days | | | | | exposure | | | hedges | | | exposure | | | hedges | | December 31, 2013 | | | | | | | | | | | | | | | | | Receivables | | | | | | | | | | | | | | | | | | | | | | Functional vs. exposure currency | | | | | | | | | | | | | | | | | | | | | | EUR vs. USD | | | 387 | | | | (364 | ) | | | 1,718 | | | | (1,169 | ) | USD vs. EUR | | | 191 | | | | (166 | ) | | | 695 | | | | (354 | ) | EUR vs. GBP | | | 83 | | | | (71 | ) | | | 284 | | | | (158 | ) | USD vs. JPY | | | 46 | | | | (42 | ) | | | 217 | | | | (113 | ) | EUR vs. JPY | | | 39 | | | | (39 | ) | | | 166 | | | | (116 | ) | EUR vs. CNY | | | 18 | | | | (18 | ) | | | 73 | | | | (41 | ) | USD vs. AUD | | | 16 | | | | (12 | ) | | | 65 | | | | (33 | ) | EUR vs. CHF | | | 21 | | | | (18 | ) | | | 57 | | | | (33 | ) | USD vs. CAD | | | 10 | | | | (8 | ) | | | 63 | | | | (33 | ) | GBP vs USD | | | 12 | | | | (12 | ) | | | 57 | | | | (33 | ) | Others | | | 148 | | | | (124 | ) | | | 296 | | | | (156 | ) | Total 2013 | | | 971 | | | | (874 | ) | | | 3,691 | | | | (2,239 | ) | Total 2012 | | | 1,098 | | | | (998 | ) | | | 4,037 | | | | (2,453 | ) | | | | | | Payables | | | | | | | | | | | | | | | | | | | | | | Functional vs. exposure currency | | | | | | | | | | | | | | | | | | | | | | EUR vs. USD | | | (171 | ) | | | 253 | | | | (831 | ) | | | 518 | | USD vs. CNY | | | (70 | ) | | | 70 | | | | (162 | ) | | | 92 | | EUR vs. PLN | | | (30 | ) | | | 24 | | | | (102 | ) | | | 36 | | EUR vs. GBP | | | (23 | ) | | | 18 | | | | (81 | ) | | | 46 | | USD vs. SGD | | | (14 | ) | | | 12 | | | | (26 | ) | | | 19 | | INR vs. USD | | | (21 | ) | | | 21 | | | | (16 | ) | | | 16 | | IDR vs. USD | | | (24 | ) | | | 14 | | | | (12 | ) | | | 7 | | EUR vs. RON | | | (3 | ) | | | 3 | | | | (28 | ) | | | 15 | | BRL vs. USD | | | (14 | ) | | | 11 | | | | (15 | ) | | | 8 | | USD vs. EUR | | | (5 | ) | | | 4 | | | | (18 | ) | | | 9 | | Others | | | (82 | ) | | | 72 | | | | (106 | ) | | | 65 | | Total 2013 | | | (457 | ) | | | 502 | | | | (1,397 | ) | | | 831 | | Total 2012 | | | (622 | ) | | | 560 | | | | (1,875 | ) | | | 1,050 | |
| | | | | | | | | | | | | | | | | | | | Receivables | | | Payables | | | | | exposure | | | hedges | | | exposure | | | hedges | | Balance as of December 31, 2015 | | | | | | | | | | | | | | | | | | | | | | Exposure currency | | | | | | | | | | | | | | | | | USD | | | 1,691 | | | | (1,329 | ) | | | (1,297 | ) | | | 1,120 | | GBP | | | 473 | | | | (267 | ) | | | (39 | ) | | | 26 | | JPY | | | 473 | | | | (283 | ) | | | (25 | ) | | | 22 | | CAD | | | 199 | | | | (86 | ) | | | (13 | ) | | | 11 | | AUD | | | 165 | | | | (90 | ) | | | (2 | ) | | | 1 | | CHF | | | 143 | | | | (74 | ) | | | (2 | ) | | | 1 | | PLN | | | 112 | | | | (90 | ) | | | (14 | ) | | | 14 | | SEK | | | 77 | | | | (42 | ) | | | (5 | ) | | | 2 | | CNY | | | 63 | | | | (63 | ) | | | (358 | ) | | | 200 | | DKK | | | 42 | | | | (22 | ) | | | — | | | | — | | Others | | | 777 | | | | (603 | ) | | | (204 | ) | | | 131 | | | | | | | Total 2015 | | | 4,215 | | | | (2,949 | ) | | | (1,959 | ) | | | 1,528 | | Total 2014 | | | 5,557 | | | | (3,800 | ) | | | (2,277 | ) | | | 1,492 | | | | | | |
The derivatives related to transactions are, for hedge accounting purposes, split into hedges of on-balance-sheet accounts receivable/payable and forecasted sales and purchases. Changes in the value of on-balance-sheet foreign-currency accounts receivable/payable, as well as the changes in the fair value of the hedges related to these exposures, are reported in the income statement under costs of sales. Hedges related to forecasted transactions, where hedge accounting is applied, are accounted for as cash flow hedges. The results from such hedges are deferred in other comprehensive income within equity to the extent that the hedge is effective. As of December 31, 2013,2015, a gain of EUR 2412 million was deferred in equity as a result of these hedges. The result deferred in equity will be released to earnings mostly during 20142016 at the time when the related hedged transactions affect the income statement. During 2013,2015, a net gainloss of EUR 52 million was recorded in the consolidated statement of income as a result of ineffectiveness on certain anticipated cash flow hedges. Annual Report 2013 211
11 Group financial statements 11.9 - 11.9
The total net fair value of hedges related to transaction exposure as of December 31, 20132015 was an unrealized asset of EUR 4417 million. An instantaneous 10% increase in the value of the euroEUR against all currencies would lead to a decreasean increase of EUR 6866 million in the value of the derivatives; including a EUR 5825 million increase related to foreign exchange transactions of USD against EUR, a EUR 18 million increase related to foreign exchange transactions of the GBP against euro, a EUR 14 million increase related to foreign exchange transactions of the JPY and a EUR 7 million increase related to PLN. This 196 Annual Report 2015
Group financial statements 12.9 was partially offset by a EUR 34 million decrease related to foreign exchange transactions of the US dollarEUR against the euro, a EUR 15 million decrease related to foreign exchange transactions of the Japanese yen against euro, a EUR 15 million decrease related to foreign exchange transactions of the Pound sterling, partially offset by a EUR 46 million increase related to foreign exchange transactions of the euro against the US dollar.USD. The EUR 6866 million decreaseincrease includes a lossgain of EUR 195 million that would impact the income statement, which would largely offset the opposite revaluation effect on the underlying accounts receivable and payable, and the remaining lossgain of EUR 4961 million would be recognized in equity to the extent that the cash flow hedges were effective. The total net fair value of hedges related to transaction exposure as of December 31, 20122014 was an unrealized assetliability of EUR 2527 million. An instantaneous 10% increase in the value of the euroEUR against all currencies would lead to a decreasean increase of EUR 6996 million in the value of the derivatives; including a EUR 9673 million increase related to foreign exchange transactions of the USD against the EUR, a EUR 14 million increase related to foreign exchange transactions of the JPY against EUR, a EUR 14 million increase related to foreign exchange transactions of the GBP, partially offset by a EUR 46 million decrease related to foreign exchange transactions of the US dollarEUR against the euro, a EUR 17 million decrease related to foreign exchange transactions of the Japanese yen against euro, a EUR 8 million decrease related to foreign exchange transactions of the Pound sterling, partially offset by a EUR 69 million increase related to foreign exchange transactions of the euro against the US dollar.USD. Foreign exchange exposure also arises as a result of inter-company loans and deposits. Where the Company enters into such arrangements the financing is generally provided in the functional currency of the subsidiary entity. The currency of the Company’s external funding and liquid assets is matched with the required financing of subsidiaries either directly through external foreign currency loans and deposits, or synthetically by using foreign exchange derivatives, including cross currency interest rate swaps and foreign exchange forward contracts. In certain cases where group companies may also have external foreign currency debt or liquid assets, these exposures are also hedged through the use of foreign exchange derivatives. Changes in the fair value of hedges related to this exposure are either recognized within financial income and expenses in the statements of income, accounted for as cash flow hedges or where such loans would be considered part of the net investment in the subsidiary then net investment hedging would be applied. Translation exposure of foreign-currency equity invested in consolidated entities may be hedged. If a hedge is entered into, it is accounted for as a net investment hedge. Net current period change, before tax, of the currency translation reserve of EUR 644 million relates to the positive impact of the weaker EUR against the foreign currencies of countries in which Philips’ operations are located, partially offset by net investment hedging instruments. The change in currency translation reserve was mostly related to development of the USD and to a lesser extent to other currencies such as the CNY, JPY and SAR. As of December 31, 20132015 cross currency interest rate swaps and foreign exchange forward contracts with a fair value liability of EUR 261812 million and external bond funding for a nominal value of USD 4,059 million were designated as net investment hedges of our financing investments in foreign operations. During 20132015 a total gain of EUR 20.1 million was recognized in the income statement as ineffectiveness on net investment hedges. The total net fair value of these financing derivatives as of December 31, 2013,2015, was a liability of EUR 260794 million. An instantaneous 10% increase in the value of the euro against all currencies would lead to an increase of EUR 245187 million in the value of the derivatives, including a EUR 272210 million increase related to the US dollar.USD. As of December 31, 2014 cross currency interest rate swaps and foreign exchange forward contracts with a fair value liability of EUR 655 million and external bond funding for a nominal value of USD 4,059 million were designated as net investment hedges of our financing investments in foreign operations. During 2014 a total gain of EUR 0.2 million was recognized in the income statement as ineffectiveness on net investment hedges. The total net fair value of these financing derivatives as of December 31, 2014, was a liability of EUR 623 million. An instantaneous 10% increase in the value of the EUR against all currencies would lead to an increase of EUR 301 million in the value of the derivatives, including a EUR 323 million increase related to the USD. Philips does not currently hedge the foreign exchange exposure arising from equity interests in non-functional-currency investments in associates and available-for-sale financial assets. Interest rate risk Interest rate risk is the risk that the fair value or future cash flows of a financial instrument will fluctuate because of changes in market interest rates. Philips had outstanding debt of EUR 3,9015,760 million, which created an inherent interest rate risk. Failure to effectively hedge this risk could negatively impact financial results. At year-end, Philips held EUR 2,4651,766 million in cash and cash equivalents, total long-term debt of EUR 3,3094,095 million and total short-term debt of EUR 5921,665 million. At December 31, 2013,2015, Philips had a ratio of fixed-rate long-term debt to total outstanding debt of approximately 80%68%, compared to 72%85% one year earlier. A sensitivity analysis conducted as of January 20142016 shows that if long-term interest rates were to decrease instantaneously by 1% from their level of December 31, 2013,2015, with all other variables (including foreign exchange rates) held constant, the fair value of the long-term debt would increase by approximately EUR 317303 million. If there was an increase of 1% in long-term interest rates, this would reduce the market value of the long-term debt by approximately EUR 251302 million. If interest rates were to increase instantaneously by 1% from their level of December 31, 2013,2015, with all other variables held constant, the annualized net interest Annual Report 2015 197
Group financial statements 12.9 expense would decreaseincrease by approximately EUR 181 million. This impact was based on the outstanding net cash position at December 31, 2013.2015. A sensitivity analysis conducted as of January 20132015 shows that if long-term interest rates were to decrease instantaneously by 1% from their level of December 31, 2012,2014, with all other variables (including foreign exchange rates) held constant, the fair value of the long-term debt would increase by approximately EUR 422342 million. If there was an increase of 1% in long-term interest rates, this would reduce the market value of the long-term debt by approximately EUR 339341 million. If interest rates were to increase instantaneously by 1% from their level of December 31, 2012,2014, with all other variables held constant, the annualized net interest expense would decrease by approximately EUR 2513 million. This impact was based on the outstanding net cash position at December 31, 2012.2014. Equity price risk Equity price risk is the risk that the fair value or future cash flows of a financial instrument will fluctuate because of changes in equity prices. Philips is a shareholder in severalsome publicly listed companies, including Chimei Innolux, Shenyang Neusoft Corporation Ltd, and TPV Technology Ltd.Corindus Vascular Robotics. As a result, Philips is exposed to potential financial loss through movements in their share prices. The aggregate equity price exposure in its main available-for-salesuch financial assets amounted to approximately EUR 6575 million at year-end 2013 (2012:2015 (2014: EUR 120 million including investments in associates shares that were sold during 2012) and a further EUR 62 million that has been reclassified as assets held for sale in relation to the agreed contribution to the Dutch Pension Fund (please refer to note 36, Subsequent events)12 million). Philips does not hold derivatives in its own stockshares or in the above-mentionedabove mentioned listed companies. Philips is also a shareholder in several privately-owned companies amounting to EUR 5048 million. As a result, Philips is exposed to potential value adjustments. As part of the sale of shares in NXP to Philips Pension Trustees Limited there was an arrangement that may entitle Philips to a cash payment from the UK Pension Fund on or after September 7, 2014 if the value of the NXP shares has increased by this date to a level in excess of a predetermined threshold, which at the time of the transaction was substantially above the transaction price, and the UK Pension Fund is in surplus (on the regulatory funding basis) on September 7, 2014.
Commodity price risk Commodity price risk is the risk that the fair value or future cash flows of a financial instrument will fluctuate because of changes in commodity prices. Philips is a purchaser of certain base metals, precious metals and energy. Philips hedges certain commodity price risks using derivative instruments to minimize significant, unanticipated earnings fluctuations caused by commodity price volatility. The commodity price derivatives that Philips enters into are accounted for as cash flow hedges to offset forecasted purchases. As of December 2013,2015, a loss of EUR 2.20.2 million was deferred in equity as a result of these hedges. A 10% increase in the market price of all commodities as of December 31, 20132015 would increase the fair value of the derivatives by less than EUR 1.40.1 million. As of December 2012,2014, a loss of EUR 0.30.7 million was deferred in equity as a result of these hedges. A 10% increase in the market price of all commodities as of December 31, 20122014 would increase the fair value of the derivatives by EUR 20.7 million. Credit risk Credit risk represents the loss that would be recognized at the reporting date, if counterparties failed completely to perform their payment obligations as contracted. Credit risk is present within Philips trade receivables. To have better insights into the credit exposures, Philips performs ongoing evaluations of the financial and non-financial condition of its customers and adjusts credit limits when appropriate. In instances where the creditworthiness of a customer is determined not to be sufficient to grant the credit limit required, there are a number of mitigation tools that can be utilized to close the gap including reducing payment terms, cash on delivery, pre-payments and pledges on assets. Philips invests available cash and cash equivalents with various financial institutions and is exposed to credit risk with these counterparties. Philips is also exposed to credit risks in the event of non-performance by financial 212 Annual Report 2013
11 Group financial statements 11.9 - 11.9
institutions with respect to financial derivative instruments. Philips actively manages concentration risk and on a daily basis measures the potential loss under certain stress scenarios, should a financial institution default. These worst-case scenario losses are monitored and limited by the Company. The Company does not enter into any financial derivative instruments to protect against default by financial institutions. However, where possible the Company requires all financial institutions with whom it deals in derivative transactions to complete legally enforceable netting agreements under an International Swap Dealers Association master agreement or otherwise prior to trading, and whenever possible, to have a strong credit rating from Standard & Poor’s and Moody’s Investor Services. Philips also regularly monitors the development of the credit risk of its financial counterparties. Wherever possible, cash is invested and financial transactions are concluded with financial institutions with strong credit ratings or with governments or government-backed institutions. Below table shows the credit ratings of the financial institutions with which Philips had short-term deposits above EUR 25 million as of December 31, 2013:2015: Philips Group Credit risk with number of counterparties for deposits above EUR 25 million 2015 | | | | | | | | | | | | | | | | 25-100
million | | | 100-500
million | | | 500-2,000
million | | AA-rated governments | | | — | | | | 2 | | | | — | | AA-rated government banks | | | — | | | | 1 | | | | — | | AAA-rated bank counterparties | | | — | | | | — | | | | — | | AA-rated bank counterparties | | | 1 | | | | 2 | | | | — | | A-rated bank counterparties | | | 1 | | | | 3 | | | | — | | | | | | | | | | 2 | | | | 8 | | | | — | |
| | | | | | | | | | | | | | | | | 25-100
million | | | 100-500
million | | | | | | | AA-rated bank counter parties | | | | | | | 2 | | A-rated bank counter parties | | | 4 | | | | 2 | | | | | | | | | | 4 | | | | 4 | | | | | | |
For an overview of the overall maximum credit exposure of the group’s financial assets, please refer to note 34,30, Fair value of financial assets and liabilities for details of carrying amounts and fair value. 198 Annual Report 2015
 Group financial statements 12.9 Group financial statements 12.9
Country risk Country risk is the risk that political, legal, or economic developments in a single country could adversely impact our performance. The country risk per country is defined as the sum of the equity of all subsidiaries and associated companies in country cross-border transactions, such as intercompany loans, accounts receivable from third parties and intercompany accounts receivable. The country risk is monitored on a regular basis. As of December 31, 2013,2015, the Company had country risk exposure of EUR 7.810.3 billion in the United States, EUR 2.5 billion in Belgium and EUR 1.51.7 billion in China (including Hong Kong)., EUR 1.1 billion in Singapore and EUR 1.1 billion in Belgium. Other countries higher than EUR 500 million are Germany (EUR 770 million), United Kingdom (EUR 673739 million), Japan (EUR 608662 million), Netherlands (EUR 549 million), Poland (EUR 519 million) and the NetherlandsMalaysia (EUR 517507 million). Countries where the risk exceeded EUR 300 million but was less than EUR 500 million are Poland, GermanySaudi Arabia and Malaysia.India. The degree of risk of a country is taken into account when new investments are considered. The Company does not, however, use financial derivative instruments to hedge country risk. Other insurable risks Philips is covered for a broad range of losses by global insurance policies in the areas of property damage/business interruption, general and product liability, transport, directors’ and officers’ liability, employment practice liability, crime and aviation product liability.cyber. The counterparty risk related to the insurance companies participating in the above mentioned global insurance policies are actively managed. As a rule Philips only selects insurance companies with aan S&P credit rating of at least A-. Throughout the year the counterparty risk is monitored on a regular basis. To lower exposures and to avoid potential losses, Philips has a global Risk Engineering program in place. The main focus of this program is on property damage and business interruption risks including company interdependencies. Regular on-site assessments take place at Philips locations and business critical suppliers by risk engineers of the insurer in order to provide an accurate assessment of the potential loss and its impact. The results of these assessments are shared across the Company’s stakeholders.On-site assessments are carried out against the predefined Risk Engineering standards which are agreed between Philips and the insurers. Recommendations are made in a Risk Improvement report and are monitored centrally. This is the basis for decision-making by the local management of the business as to which recommendations will be implemented. For all policies, deductibles are in place, which vary from EUR 250,000 to EUR 2,500,0005,000,000 per occurrence and this variance is designed to differentiate between the existing risk categories within Philips. Above this first layer of working deductibles, Philips operates its own re-insurance captive, which during 20132015 retained EUR 2.5 million per occurrence for property damage and business interruption losses and EUR 5 million in the aggregate per year. For general and product liability claims, the captive retained EUR 1.5 million per claim and EUR 6 million in the aggregate. New contracts were signed on December 31, 2013,2015, for the coming year, whereby the re-insurance captive retentions remained unchanged.
Dutch pension plan contribution
On July 1, 2013, Philips announced that it had reached an agreement with the Dutch trade unions on a new collective labor agreement that covers the period January 1, 2013 till December 31, 2014. The new agreement includes changes in the plan rules and the funding agreement with the Dutch pension plan, which is the company’s largest Defined Benefit pension plan. The plan changes have become effective as of January 1, 2014 and the new funding agreement has been signed by the Trustees of the Dutch pension plan. As part of these changes, Philips agreed to make a EUR 600 million contribution to the Dutch pension plan, of which EUR 240 million has been settled in cash on February 19, 2014. During 2014 and 2015, the remainder of the consideration will be settled through the transfer of assets and cash proceeds from the sale of assets which are currently owned by Philips. The (majority of the) contribution will need to be written off through other comprehensive income due to the asset ceiling restrictions in the plan.
Healthcare facility in Cleveland, OhioFinancing Volcano
In our healthcare facility2015, Philips financed the acquisition of Volcano with a short-term loan of USD 1.3 billion. Philips decided in Cleveland, Ohio, certain issuesDecember 2015 to amend and extend the loan which was actually executed in the general area of manufacturing process controls were identified during an ongoing US Food and Drug Administration (FDA) inspection. To address these issues, on January 10, 2014 we started a voluntary, temporary suspension of new production at the facility, primarily to strengthen manufacturing process controls. Currently, there is no indication of product safety issues. This action is estimated to have a negative impact on the sector’s operational results of approximately EUR 60 to 70 million2016. The loan will mature in the first half of 2014, of which we expect to recover a substantial part in the second half of 2014. Transfer of the remaining 30%-stake in TP Vision Holding to TPV
Technology Limited (TPV)
On January 20, 2014 Philips announced that it has signed a term sheet to transfer the remaining 30% stake in the TP Vision venture to TPV Technology Limited. The signing of definitive agreements is expected to take place in the first quarter of 2014, with completion expected in the second half of 2014, subject to certain regulatory and TPV shareholder approvals. After completion, TPV will fully own TP Vision, which will enable further integration with TPV’s TV business.
The remaining 30% stake in the TP Vision venture will be transferred for a deferred purchase price and all outstanding loans and stand-by facilities between Philips and the TP Vision venture will be transferred to TPV. The brand license agreement between Philips and the TP Vision venture will remain in place, with an annual royalty of 2.2% of sales payable by the TP Vision venture to Philips. The minimum annual royalty has been reduced from EUR 50 million to EUR 40 million. The agreement includes a EUR 50 million transaction-related payment, which Philips has accounted for in the fourth quarter of 2013 under Results relating to investments in associates (see note 6, Interests in entities).
LTI coverage program
To cover Philips’ outstanding obligations resulting from past and present long-term incentive and employee stock purchase programs dating back to 2004, Philips will repurchase up to 12 million additional Philips shares on NYSE Euronext Amsterdam, to be executed during 2014. The shares repurchased will be held by Philips as treasury shares until they are distributed to participants.
Philips started this program as of January 28, 2014 and will enter into subsequent discretionary management agreements with one or more banks to repurchase Philips shares within the limits of relevant laws and regulations (in particular EC Regulation 2273/2003) and Philips’ articles of association. All transactions are published on Philips’ website (www.philips.com/investor) on a weekly basis.December 2016.
Annual Report 2013 2132015 199
11 GroupCompany financial statements 11.9 - 11.9
The LTI coverage program is over and above the existing EUR 1.5 billion share repurchase program for cancellation purposes which started on October 21, 2013.
214 Annual Report 2013
11 Group financial statements 11.10 - 11.1013
11.10 Independent auditors’ report – Group
Report of Independent Registered Public Accounting Firm
To the Supervisory Board and Shareholders of Koninklijke Philips N.V.:
We have audited the accompanying consolidated balance sheets of Koninklijke Philips N.V. and subsidiaries as of December 31, 2013 and 2012, and the related consolidated statements of income, comprehensive income, cash flows, and changes in equity for each of the years in the three-year period ended December 31, 2013. These consolidated financial statements are the responsibility of the Koninklijke Philips N.V.’s management. Our responsibility is to express an opinion on these consolidated financial statements based on our audits.
We conducted our audits in accordance with the standards of the Public Company Accounting Oversight Board (United States). Those standards require that we plan and perform the audit to obtain reasonable assurance about whether the financial statements are free of material misstatement. An audit includes examining, on a test basis, evidence supporting the amounts and disclosures in the financial statements. An audit also includes assessing the accounting principles used and significant estimates made by management, as well as evaluating the overall financial statement presentation. We believe that our audits provide a reasonable basis for our opinion.
In our opinion, the consolidated financial statements referred to above present fairly, in all material respects, the financial position of Koninklijke Philips N.V. and subsidiaries as of December 31, 2013 and 2012, and the results of their operations and their cash flows for each of the years in the three-year period ended December 31, 2013, in conformity with International Financial Reporting Standards as issued by the International Accounting Standards Board.
We also have audited, in accordance with the standards of the Public Company Accounting Oversight Board (United States), Koninklijke Philips N.V. and subsidiaries’ internal control over financial reporting as of December 31, 2013, based on criteria established in Internal Control — Integrated Framework (1992) issued by the Committee of Sponsoring Organizations of the Treadway Commission (COSO), and our report dated February 25, 2014, expressed an unqualified opinion on the effectiveness of the Koninklijke Philips N.V. and subsidiaries’ internal control over financial reporting.
/s/ KPMG Accountants N.V.
Amsterdam, The Netherlands
February 25, 2014
Annual Report 2013 215
1213 Company financial statements 12 - 12
12 Company financial statements
Introduction Statutory financial statements The sections Group financial statements and Company financial statements contain the statutory financial statements of Koninklijke Philips N.V. (the Company). A description of the Company’s activities and group structure is included in the Consolidated Financial Statements. Accounting policies applied The financial statements of the Company included in this section are prepared in accordance with Part 9 of Book 2 of the Dutch Civil Code. Section 362 (8), Book 2, Dutch Civil Code, allows companies that apply IFRS as adoptedendorsed by the European Union in their consolidated financial statements to use the same measurement principles in their company financial statements. The Company has prepared these Company financial statements using this provision. The accounting policies are described in note 1, Significant accounting policies. Investments in group companies are accounted for using the equity method in these Company financial statements. Presentation of Company financial statements The structure of the Company balance sheets is aligned with the Consolidated balance sheets in order to achieve optimal transparency between the Group financial statements and the Company financial statements. Consequently, the presentation of the Company balance sheets deviates from Dutch regulations. The Company balance sheet has been prepared before the appropriation of result. The Company statement of income has been prepared in accordance with Section 2:402 of the Dutch Civil Code, which allows a simplified Statement of income in the Company financial statements in the event that a comprehensive Statement of income is included in the consolidated Group financial statements. Additional information For ‘Additional information’ within the meaning of Section 2:392 of the Dutch Civil Code, please refer to section 13.5, Independent auditor’s report—Group, section 12.5, Independent auditor’s report—Company,report, of this report, and section 4.4,5.4, Proposed distribution to shareholders, of this report. Adjustments Prior-period financial statementsThe presentation of certain prior-year disclosures have been restated followingadjusted to align with the adoption of IAS 19R, which mainly relates to accounting for pensions.current year disclosures.
216200 Annual Report 20132015
12 Company financial statements 12.1 - 12.113.1
12.113.1 Balance sheets before appropriation of results
Balance sheets of Koninklijke Philips N.V. as of December 31
Balance sheetsin millions of eurosEUR unless otherwise stated As of December 31 | | | | | | | | | | | | | | | | | | | | 2014 | | | | | | 2015 | | | | | | | 2012 | | | | | 2013 | | | | | | | Assets | | | | | | | | | | | | | | | | | Non-current assets: | | | | | | | | | | | | | | | | | Property, plant and equipment | | | 2 | | | | | | 18 | | | | | | 1 | | | | | | 1 | | | |  Intangible assets Intangible assets
| | | 9 | | | | | | 55 | | | | | | 57 | | | | | | 81 | | | |  Financial fixed assets Financial fixed assets
| | | 16,597 | | | | | | 19,535 | | | | | | 19,676 | | | | | | 21,176 | | | | Non-current receivables | | | 49 | | | | | | 32 | | | | | | 61 | | | | | | 88 | | | | Deferred tax assets | | | 212 | | | | | | 161 | | | | | | 479 | | | | | | 766 | | | |  Other non-current financial assets Other non-current financial assets
| | | 325 | | | | | | 283 | | | | | | 229 | | | | | | 279 | | | | | | | | | 17,194 | | | | | | 20,084 | | | | | | Total non-current assets | | | | | | 20,503 | | | | | | 22,391 | | Current assets: | | | | | | | | | | | | | | | | | Current financial assets | | | | 121 | | | | | | 10 | | | |  Receivables Receivables
| | | 7,988 | | | | | | 7,500 | | | | | | 8,454 | | | | | | 8,298 | | | | Assets classified as held for sale | | | — | | | | | | 45 | | | | | | 54 | | | | | | — | | | | Cash and cash equivalents | | | 2,879 | | | | | | 1,282 | | | | | | 701 | | | | | | 730 | | | | | | | | | 10,867 | | | | | | 8,827 | | | | | | Total current assets | | | | | | 9,330 | | | | | | 9,038 | | | | | | | | | | | | | | | | 28,061 | | | | | | 28,911 | | | Total assets | | | | | | 29,833 | | | | | | 31,429 | | Liabilities and shareholders’ equity | | | | | | | | | | | | | | | | |  Shareholders’ equity: Shareholders’ equity:
| | | | | | | | | | | | | | | | | Preference shares, par value EUR 0.20 per share: | | | | | | | | | | | | | | | | | - Authorized: 2,000,000,000 shares (2012: 2,000,000,000 shares) | | | | | | | | | | - Authorized: 2,000,000,000 shares (2014: 2,000,000,000 shares) | | | | | | | | | | - Issued: none | | | | | | | | | | | | | | | | | Common shares, par value EUR 0.20 per share: | | | | | | | | | | | | | | | | | - Authorized: 2,000,000,000 shares (2012: 2,000,000,000 shares) | | | | | | | | | | - Issued and fully paid: 937,845,789 shares (2012: 957,132,962 shares) | | | 191 | | | | | | 188 | | | | | - Authorized: 2,000,000,000 shares (2014: 2,000,000,000 shares) | | | | | | | | | | - Issued and fully paid: 931,130,387 shares (2014: 934,819,413 shares) | | | | 187 | | | | | | 186 | | | | Capital in excess of par value | | | 1,304 | | | | | | 1,796 | | | | | | 2,181 | | | | | | 2,669 | | | | Legal reserve: revaluation | | | 54 | | | | | | 23 | | | | | | 13 | | | | | | 4 | | | | Legal reserve: available-for-sale financial assets | | | 54 | | | | | | 55 | | | | | | 27 | | | | | | 56 | | | | Legal reserve: cash flow hedges | | | 20 | | | | | | 24 | | | | | | (13 | ) | | | | | 12 | | | | Legal reserve: affiliated companies | | | 1,161 | | | | | | 1,319 | | | | | | 1,059 | | | | | | 958 | | | | Legal reserve: currency translation differences | | | (93 | ) | | | | | (569 | ) | | | | | 229 | | | | | | 1,058 | | | | Retained earnings | | | 9,598 | | | | | | 7,927 | | | | | | 7,316 | | | | | | 6,437 | | | |  Net income1) Net income1)
| | | (35 | ) | | | | | 1,169 | | | | | | 415 | | | | | | 645 | | | | Treasury shares, at cost: 24,508,022 shares (2012: 42,541,687 shares) | | | (1,103 | ) | | | | | (718 | ) | | | | Treasury shares, at cost: 14,026,801 shares (2014: 20,430,544 shares) | | | | (547 | ) | | | | | (363 | ) | | | | | | | | 11,151 | | | | | | 11,214 | | | | | | Total equity | | | | | | 10,867 | | | | | | 11,662 | | Non-current liabilities: | | | | | | | | | | | | | | | | |  Long-term debt Long-term debt
| | | 3,539 | | | | | | 3,158 | | | | | | 3,555 | | | | | | 3,933 | | | | Long-term provisions | | | 10 | | | | | | 16 | | | | | | 10 | | | | | | 5 | | | | Deferred tax liabilities | | | 19 | | | | | | 15 | | | | | | 12 | | | | | | 12 | | | | Other non-current liabilities | | | 139 | | | | | | 161 | | | | | | 670 | | | | | | 789 | | | | | | | | | 3,707 | | | | | | 3,350 | | | | | | Total non-current liabilities | | | | | | 4,247 | | | | | | 4,739 | | Current liabilities: | | | | | | | | | | | | | | | | | Short-term debt | | | 11,742 | | | | | | 13,645 | | | | | | 14,060 | | | | | | 14,528 | | | |  Other current liabilities Other current liabilities
| | | 1,461 | | | | | | 702 | | | | | | 659 | | | | | | 500 | | | | | | | | | 13,203 | | | | | | 14,347 | | | | | | Total current liabilities | | | | | | 14,719 | | | | | | 15,028 | |  Contractual obligations and contingent liabilities not appearing in the balance sheet Contractual obligations and contingent liabilities not appearing in the balance sheet
| | | | | | | | | | | | | | | | | | | | | | | | | | Liabilities and shareholders’ equity | | | | | | 29,833 | | | | | | 31,429 | | | | | | | 28,061 | | | | | | 28,911 | | | | | |
| 1) | Prepared before appropriation of results |
Annual Report 2013 2172015 201
12 Company financial statements 12.2 - 12.313.2
12.213.2 Statements of income
Koninklijke Philips N.V. Statements of income of Koninklijke Philips N.V. for the years ended December 31 in millions of eurosEUR unless otherwise stated For the year ended December 31 | | | | | | | | | | | | 2012 | | | 2013 | | Net income from affiliated companies | | | 375 | | | | 1,276 | | Other net income | | | (410 | ) | | | (107 | ) | | | | | | Net income | | | (35 | ) | | | 1,169 | |
| | | | | | | | | | | | | | | | 2014 | | | 2015 | | | | | | | Net loss from affiliated companies | | | (432 | ) | | | (44 | ) | Other net income | | | 847 | | | | 689 | | | | | | |  Net income Net income
| | | 415 | | | | 645 | | | | | | |
12.313.3 Statement of changes in equity
Koninklijke Philips N.V. Statement of changes in equity of Koninklijke Philips N.V. in millions of eurosEUR unless otherwise stated For the year ended December 31 | | | | legal reserves | | | | | | | | | com- mon shares | | capital
in
excess
of par
value | | revalua-
tion | | available-
for-sale
financial
assets | | cash
flow
hedges | | affiliated
compa-
nies | | | currency
translation
differences | | retained
earnings | | net
income | | treasury
shares
at cost | | share-
holders’
equity | | | com- mon
shares | | capital
in
excess
of par
value | | revalua- tion | | available-
for-sale
financial
assets | | cash
flow
hedges | | affiliated
compa- nies | | currency
translation
differences | | retained
earnings | | net
income | | treasury
shares | | share- holders’
equity | | Balance as of January 1, 2013 | | | 191 | | | | 1,304 | | | | 54 | | | | 54 | | | | 20 | | | | 1,161 | | | | (93 | ) | | | 9,598 | | | | (35 | ) | | | (1,103 | ) | | | 11,151 | | | | | | | | | | | | legal reserves | | | | | | | | | | | Balance as of January 1, 2015 | | | | 187 | | | | 2,181 | | | | 13 | | | | 27 | | | | (13 | ) | | | 1,059 | | | | 229 | | | | 7,316 | | | | 415 | | | | (547 | ) | | | 10,867 | | Appropriation of prior year result | | | | | | | | | | | | | | | | | (35 | ) | | | 35 | | | | | | | | | | | | | | | | | | | | | | 415 | | | | (415 | ) | | | | | Net income | | | | | | | | | | | | | | | | | | | 1,169 | | | | | | 1,169 | | | | | | | | | | | | | | | | | | | | 645 | | | | | | 645 | | Release revaluation reserve | | | | | | | (31 | ) | | | | | | | | | | | 31 | | | | | | | | — | | | | | | | | (9 | ) | | | | | | | | | | | 9 | | | | | | | | — | | Net current period change | | | | | | | | | (5 | ) | | | 68 | | | | 158 | | | | (427 | ) | | | (96 | ) | | | | | | | (302 | ) | | | | | | | | | 33 | | | | (38 | ) | | | (101 | ) | | | 643 | | | | 9 | | | | | | | | 546 | | Income tax on net current period change | | | | | | | | | | | (2 | ) | | | | | (35 | ) | | | | | | | | | (37 | ) | | | | | | | | | — | | | | — | | | | | | 187 | | | | | | | | | | 187 | | Reclassification into income | | | | | | | | | 6 | | | | (62 | ) | | | | | (14 | ) | | | | | | | | | (70 | ) | | | | | | | | | (4 | ) | | | 63 | | | | | | (1 | ) | | | | | | | | | 58 | | Dividend distributed | | | 4 | | | | 402 | | | | | | | | | | | | | | (678 | ) | | | | | | | (272 | ) | | | 3 | | | | 429 | | | | | | | | | | | | | | (730 | ) | | | | | | | (298 | ) | Cancellation of treasury shares | | | (7 | ) | | | | | | | | | | | | | | | (780 | ) | | | | | 787 | | | | — | | | | (4 | ) | | | | | | | | | | | | | | | (513 | ) | | | | | 517 | | | | — | | Purchase of treasury shares | | | | | | | | | | | | | | | | | (38 | ) | | | | | (631 | ) | | | (669 | ) | | | | | | | | | | | | | | | | | (12 | ) | | | | | (495 | ) | | | (507 | ) | Re-issuance of treasury shares | | | | | (36 | ) | | | | | | | | | | | | | (75 | ) | | | | | 229 | | | | 118 | | | | | | (23 | ) | | | | | | | | | | | | | (57 | ) | | | | | 162 | | | | 82 | | Share-based compensation plans | | | | | 105 | | | | | | | | | | | | | | | | | | | | 105 | | | | | | 101 | | | | | | | | | | | | | | | | | | | | 101 | | Income tax on share-based compensation plans | | | | | 21 | | | | | | | | | | | | | | | | | | | | 21 | | | | | | (19 | ) | | | | | | | | | | | | | | | | | | | (19 | ) | | | | | | | | | | Balance as of December 31, 2013 | | | 188 | | | | 1,796 | | | | 23 | | | | 55 | | | | 24 | | | | 1,319 | | | | (569 | ) | | | 7,927 | | | | 1,169 | | | | (718 | ) | | | 11,214 | | | Balance as of December 31, 2015 | | | | 186 | | | | 2,669 | | | | 4 | | | | 56 | | | | 12 | | | | 958 | | | | 1,058 | | | | 6,437 | | | | 645 | | | | (363 | ) | | | 11,662 | | | | | | | |
218202 Annual Report 20132015
12   Company financial statements Company financial statements 12.4 - 12.413.4
12.413.4 Notes
All amounts in millions of euros unless otherwise stated
Notes to the Company financial statements
Net income from affiliated companies represents the share of the company in the results of these affiliated companies. Audit fees For a summary of the audit fees, please refer to the Group Financial statements, note 6, Income from operations, which is deemed incorporated and repeated herein by reference. Intangible assets Intangible assets includes mainly licenses and patents. The changes during 20132015 are as follows; Koninklijke Philips N.V. Intangible assets in millions of EUR 2015 | | | | | | | intangible assets | | Balance as of January 1, 2013:2015: | | | | | Cost | | | 5587 | | Amortization/impairments | | | (4630 | ) | | | | | | Book value | | | 957 | | Changes in book value: | | | | | Reclassifications
| | | 7 | | Additions | | | 4144 | | Amortization | | | (220 | ) | | | | | | Total changes | | | 4624 | | Balance as of December 31, 2013:2015: | | | | | Cost | | | 67131 | | Amortization/impairments | | | (1250 | ) | | | | | | Book value | | | 5581 | | | | | | |
The investments in group companies and associates are presented as financial fixed assets in the balance sheet using the equity method. Goodwill paid upon acquisition of investments in group companies or associates is included in the net equity value of the investment and is not shown separately on the face of the balance sheet. Loans are provided to group companies and associates and are stated at amortized cost, less impairment. | | | | | | | | | | | | | | | | | | | | investments
in group
companies | | | investments
in associates | | | loans | | | total | | Balance as of January 1, 2013 | | | 10,407 | | | | 87 | | | | 6,103 | | | | 16,597 | | Changes: | | | | | | | | | | | | | | | | | Reclassification | | | — | | | | (3 | ) | | | — | | | | (3 | ) | Acquisitions/additions | | | 2,632 | | | | — | | | | 529 | | | | 3,161 | | Sales/redemptions | | | (131 | ) | | | (2 | ) | | | (524 | ) | | | (657 | ) | Net income from affiliated companies | | | 1,309 | | | | (8 | ) | | | — | | | | 1,301 | | Dividends received | | | (340 | ) | | | — | | | | — | | | | (340 | ) | Translation differences | | | (458 | ) | | | (3 | ) | | | (235 | ) | | | (696 | ) | Other | | | 172 | | | | — | | | | — | | | | 172 | | | | | | | Balance as of December 31, 2013 | | | 13,591 | | | | 71 | | | | 5,873 | | | | 19,535 | |
A list of investments in group companies, prepared in accordance with the relevant legal requirements (Dutch Civil Code, Book 2, Sections 379 and 414), is deposited at the Chamber of Commerce in Eindhoven, Netherlands. Koninklijke Philips N.V. Financial fixed assetsin millions of EUR 2015 | | | | | | | | | | | | | | | | | | | | | | | | | investments in group
companies | | | investments
in associates | | | loans | | | total | | | | | | | Balance as of January 1, 2015 | | | 12,660 | | | | 66 | | | | 6,950 | | | | 19,676 | | Changes: | | | | | | | | | | | | | | | | | Acquisitions/additions | | | 283 | | | | | | | | 8,018 | | | | 8,301 | | Sales/redemptions | | | (183 | ) | | | | | | | (6,225 | ) | | | (6,408 | ) | Net income from affiliated companies | | | (66 | ) | | | | | | | | | | | (66 | ) | Dividends received | | | (1,689 | ) | | | | | | | | | | | (1,689 | ) | Translation differences | | | 829 | | | | 7 | | | | 526 | | | | 1,362 | | | | | | | Balance as of December 31, 2015 | | | 11,834 | | | | 73 | | | | 9,269 | | | | 21,176 | | | | | | |
Investment in group companies The Netherlands.acquisitions/additions line mainly relates to capital injections into group companies. One group company made a capital repayment of EUR 127 million which is reflected as part of the movement sales/redemptions. The same group company paid an interim dividend of EUR 1,464 million included in the dividends received line. The remaining movements in sales/redemptions reflect restructuring transactions within the group. Loans In December 2013, investments in group companies increased by EUR 2,111 million due to2015, the purchase of 25% of a group company which was previously owned by another group company. This transaction was executed in view of our continued effort to restructure and optimize ourCompany revisited its foreign based intra-group finance activities. In addition, investments inthis context intra-group funding of certain group companies also increasedwas directly provided by Koninklijke Philips N.V. and no longer via a foreign based group finance entity. The newly provided direct funding by the Company, resulted in loan additions by EUR 517 million as a result of capital injections. These transactions reflect most of the increase6,485 million. The change resulted in the line Acquisitions/additions.redemption of loans by EUR 5,314 million, which were initially provided by the Company to the foreign based group finance entity. Annual Report 2015 203
Company financial statements 13.4  
The changes during 2015 were as follows: Koninklijke Philips N.V. Other non-current financial assets in millions of EUR 2015 | | | | available-
for-sale
financial
assets | | loans and
receivables | | financial
assets at
fair
value
through
profit
and loss | | total | | | | | | Balance as of January 1, 2013 | | | 84 | | | | 221 | | | | 20 | | | | 325 | | | | | | | available- for-sale financial
assets | | loans and
receivables | | financial
assets at
fair
value
through
profit
and loss | | | total | | | | | | | | Balance as of January 1, 2015 | | | | 96 | | | | 133 | | | | — | | | | 229 | | Changes: | | | | | | | | | | | | | | | | | Reclassifications | | | 3 | | | | — | | | | — | | | | 3 | | | | | | (8 | ) | | | | | (8 | ) | Acquisitions/additions | | | 9 | | | | — | | | | — | | | | 9 | | | | 3 | | | | 17 | | | | 5 | | | | 25 | | Sales/redemptions/reductions | | | — | | | | (1 | ) | | | — | | | | (1 | ) | | | (1 | ) | | | (6 | ) | | | | | (7 | ) | Impairments | | | (7 | ) | | | (1 | ) | | | — | | | | (8 | ) | | | (4 | ) | | | | | | | (4 | ) | Transfer to assets classified as held for sale | | | (15 | ) | | | (30 | ) | | | — | | | | (45 | ) | | | 1 | | | | | | | | 1 | | Value adjustments | | | 12 | | | | 1 | | | | (13 | ) | | | — | | | | 37 | | | | 2 | | | | 4 | | | | 43 | | | | | | | | | | | Balance as of December 31, 2013 | | | 86 | | | | 190 | | | | 7 | | | | 283 | | | Balance as of December 31, 2015 | | | | 132 | | | | 138 | | | | 9 | | | | 279 | | | | | | | |
Available-for-sale financial assets The Company’s investments in available-for-sale financial assets mainly consist of investments in common stockshares of companies in various industries. An amount of EUR 15 million has been reclassifiedThe line additions/acquisitions mainly relates to assets heldcapital calls for sale in relationcertain investment funds. The impairment movement relates to the agreed contribution to the Philips Pension Fund (please refer to note 30, Post-employment benefits and note 36, Subsequent events).a specific investment’s declining financial performance. Loans and receivables During 2013The acquisitions/additions line mainly relates to vendor loans with face valueissued to an amount of EUR 3017 million were transferred to assets held for sale in relation to the agreed contribution to the Philips Pension Fund (please refer to note 30, Post-employment benefits and note 36, Subsequent events).
Financial assets at fair value through profit and loss
Included in this category are certain financial instruments that Philips received in exchange for the transfersale of its television activities.an equity interest. The initial value of EUR 17 million was adjusted by EUR 11 million during 2012 and EUR 6 million in 2013 reported under Value adjustments. As of December 31, 2013 the fair value reported was nil. For more information please refer to note 36, Subsequent events.
In 2010, Philips sold its entire holding of common shares in NXP Semiconductors B.V. (NXP) to Philips Pension Trustees Limited (herein referred to as “UK Pension Fund”). As a resultcurrent portion of this transaction the UK Pension Fund obtained the full legal title and ownership of the NXP shares, including the entitlement to any future dividends and the proceeds from any sale of shares. From the date of the transaction the NXP shares became an integral part of the plan assets of the UK Pension Fund. The purchase agreement with the UK Pension Fund includes an arrangement that may entitle Philips to a cash payment from the UK Pension Fund on or after September 7, 2014, if the total value yielded by the NXP shares has increased by this date to a level in excess of a predetermined threshold, which at the time of the transactionloan (EUR 8 million) was substantially above the transaction price, and the UK Pension Fund is in a surplus (on a swaps basis) on September 7, 2014. The arrangement qualifies as a financial instrument and is reported under Other non-current financial assets. The Trustees of the UK Pension Fund have been selling the NXP shares in a number of transactions since 2010. The remaining number of NXP shares were sold in the course of 2013 and the total sale proceeds2015 reclassified to Current financial assets. The remainder of the NXP shares exceeded the predetermined threshold. However, as of December 31,
Annual Report 2013 219
12 Company financial statements 12.4 - 12.4
2013 the UK Pension Fund was notloan will be redeemed in surplus (on the agreed swaps basis). The fair value of the arrangement was estimated to be EUR 14 million as of December 31, 2012. As of December 31, 2013 management’s best estimate of the fair value of the arrangement is EUR 7 million, based on the current funded status as of December 31, 2013 (swaps basis) and the economic and demographic risks of the UK Pension Fund. The change in fair value in 2013 is reported under Value adjustments in the table above.2017.
Koninklijke Philips N.V. | | | | | | | | | | | | 2012 | | | 2013 | | Trade accounts receivable | | | 83 | | | | 80 | | Affiliated companies | | | 7,690 | | | | 7,177 | | Other receivables | | | 23 | | | | 5 | | Advances and prepaid expenses | | | 16 | | | | 28 | | Derivative instruments—assets | | | 176 | | | | 210 | | | | | | | | | | 7,988 | | | | 7,500 | |
2014 - 2015 | | | | | | | | | | | | | | | | | 2014 | | | 2015 | | | | | | | Trade accounts receivable | | | 105 | | | | 91 | | Affiliated companies | | | 7,916 | | | | 7,966 | | Other receivables | | | 48 | | | | 64 | | Advances and prepaid expenses | | | 15 | | | | 19 | | Derivative instruments—assets | | | 370 | | | | 158 | | | | | | | Receivables | | | 8,454 | | | | 8,298 | | | | | | |
Shareholders’ equity Common shares As of December 31, 2013,2015, the issued and fully paidpaid-up share capital consists of 937,845,789931,130,387 common shares, each share having a par value of EUR 0.20. In June 2013,2015, Philips settled a dividend of EUR 0.750.80 per common share, representing a total value of EUR 678730 million. Shareholders could elect for a cash dividend or a share dividend. Approximately 59.8%59% of the shareholders elected for a share dividend, resulting in the issuance of 18,491,33717,671,990 new common shares. The settlement of the cash dividend resulted in a payment of EUR 272 million.298 million including tax and service charges. The following table shows the movements in the outstanding number of shares;shares: Koninklijke Philips N.V. Share movement scheduleOutstanding number of shares in number of shares
2014 - 2015 | | | | | | | | | | | | | 2014 | | | 2015 | | | | | 2012 | | 2013 | | | | | | Balance as of January 1 | | | 926,094,902 | | | | 914,591,275 | | | | 913,337,767 | | | | 914,388,869 | | Dividend distributed | | | 30,522,107 | | | | 18,491,337 | | | | 18,811,534 | | | | 17,671,990 | | Purchase of treasury shares | | | (46,870,632 | ) | | | (27,811,356 | ) | | | (28,537,921 | ) | | | (20,296,016 | ) | Re-issuance of treasury shares | | | 4,844,898 | | | | 8,066,511 | | | | 10,777,489 | | | | 5,338,743 | | | | | | | | Balance as of December 31 | | | 914,591,275 | | | | 913,337,767 | | | | 914,388,869 | | | | 917,103,586 | | | | | | | |
Preference shares The ‘Stichting Preferente Aandelen Philips’ has been granted the right to acquire preference shares in the Company. Such right has not been exercised. As a means to protect the Company and its stakeholders against an unsolicited attempt to (de facto) take over control of the Company, the General Meeting of Shareholders in 1989 adopted amendments to the Company’s articles of association that allow the Board of Management and the Supervisory Board to issue (rights to acquire) preference shares to a third party.third-party. As of December 31, 2013,2015, no preference shares have been issued. Option rights/Options, restricted and performance shares
The Company has granted stock options on its common shares and rights to receive common shares in the future. Please refer to note 31,28, Share-based compensation, which is deemed incorporated and repeated herein by reference. Treasury shares In connection with the Company’s share repurchase programs, shares which have been repurchased and are held in treasury for (i) delivery upon exercise of options, performance and restricted share programs, and employee share purchase programs, and (ii) capital reduction purposes, are accounted for as a reduction of shareholders’ equity. Treasury shares are recorded at cost, representing the market price on the acquisition date. When issued, shares are removed from treasury shares on a FIFO basis. AnyWhen treasury shares are reissued under the Company’s option plans, the difference between the cost and the cash received at the timeis recorded in retained
204 Annual Report 2015
Company financial statements 13.4 earnings. When treasury shares are reissued under the Company’s share plans, the difference between the market price of the shares issued and the cost is recorded in retained earnings.earnings, the market price is recorded in capital in excess of par value. Dividend withholding tax in connection with the Company’s purchase of treasury shares for capital reduction purposes is recorded in retained earnings. The following transactions took place resulting from employee option and share plans: Koninklijke Philips N.V. | | | | | | | | | | | | 2012 | | | 2013 | | Shares acquired | | | 5,147 | | | | 3,984 | | Average market price | | | EUR 17.86 | | | | EUR 22.51 | | Amount paid | | | EUR 0 million | | | | EUR 0 million | | Shares delivered | | | 4,844,898 | | | | 8,066,511 | | Average market price | | | EUR 24.39 | | | | EUR 28.35 | | Amount received | | | EUR 118 million | | | | EUR 229 million | | Total shares in treasury at year-end | | | 28,712,954 | | | | 20,650,427 | | Total cost | | | EUR 847 million | | | | EUR 618 million | |
Employee option and share plan transactions 2014 - 2015 | | | | | | | | | | | | | | | | | 2014 | | | 2015 | | | | | | | Shares acquired | | | 7,254,606 | | | | | | Average market price | | | EUR 24.53 | | | | | | Amount paid | | | EUR 178 million | | | | | | Shares delivered | | | 10,777,489 | | | | 5,338,743 | | Average market price | | | EUR 30.26 | | | | EUR 30.35 | | Cost of delivered shares | | | EUR 326 million | | | | EUR 162 million | | Total shares in treasury at year-end | | | 17,127,544 | | | | 11,788,801 | | Total cost | | | EUR 470 million | | | | EUR 308 million | | | | | | |
In 2015, there was no need to acquire additional shares to cover our commitments under share-based compensation plans. In order to reduce share capital, the following transactions took place: Koninklijke Philips N.V. | | | | | | | | | | | | 2012 | | | 2013 | | Shares acquired | | | 46,865,485 | | | | 27,807,372 | | Average market price | | | EUR 16.41 | | | | EUR 22.69 | | Amount paid | | | EUR 769 million | | | | EUR 631 million | | Reduction of capital stock | | | 82,364,590 | | | | 37,778,510 | | Total shares in treasury at year-end | | | 13,828,733 | | | | 3,857,595 | | Total cost | | | EUR 256 million | | | | EUR 100 million | |
Share capital transactions 2014 - 2015 | | | | | | | | | | | | | | | | | 2014 | | | 2015 | | | | | | | Shares acquired | | | 21,283,315 | | | | 20,296,016 | | Average market price | | | EUR 23.95 | | | | EUR 24.39 | | Amount paid | | | EUR 510 million | | | | EUR 495 million | | Reduction of capital stock (shares) | | | 21,837,910 | | | | 21,361,016 | | Reduction of capital stock (EUR) | | | EUR 533 million | | | | EUR 517 million | | Total shares in treasury at year-end | | | 3,303,000 | | | | 2,238,000 | | Total cost | | | EUR 77 million | | | | EUR 55 million | | | | | | |
Share purchase transactions related to employee option and share plans, as well as transactions related to the reduction of share capital involved a cash outflow of EUR 506 million, which includes the impact of taxes. Settlements of share-based compensation plans involved a cash inflow of EUR 81 million. Dividend distribution A proposal will be submitted to the 20142016 Annual General Meeting of Shareholders to pay a dividend of EUR 0.80 per common share, in cash or shares at the option of the shareholder, from the 20132015 net income.income and retained earnings of the Company. Legal reserves As of December 31, 2013,2015, legal reserves relate to the revaluation of assets and liabilities of acquired companies in the context of multi-stage acquisitions of EUR 234 million (2012:(2014: EUR 5413 million), unrealized gains on available-for-sale financial assets of EUR 5556 million (2012:(2014: EUR 5427 million), unrealized gains on cash flow hedges of EUR 2412 million (2012:(2014: EUR 20 million)13 million unrealized losses), ‘affiliated companies’ of EUR 1,319958 million (2012:(2014: EUR 1,1611,059 million) and unrealized currency translation lossesgains of EUR 5691,058 million (2012:(2014: EUR 93 million)229 million unrealized losses). The item ‘affiliated companies’ relates to the ‘wettelijke reserve deelnemingen’, which is required by Dutch law. This reserve relates to any legal or economic restrictions on the ability of affiliated companies to transfer funds to the parent company in the form of dividends. Limitations in the distribution of shareholders’ equity Pursuant to Dutch law, limitations exist relating to the distribution of shareholders’ equity of EUR 1,6092,274 million (2012: EUR 1,480 million). Asas at December 31, 2013, such2015. Such limitations relate to common shares of EUR 188186 million, (2012: EUR 191 million) as well as to legal reserves included under ‘revaluation’ of EUR 234 million, (2012: EUR 54 million), available-for-sale financial assets of EUR 5556 million, (2012: EUR 54 million), unrealized gains onrelated to cash flow hedges of EUR 2412 million, (2012:unrealized currency translation gains of EUR 20 million)1,058 million and ‘affiliated companies’ of EUR 1,319958 million. As at December 31, 2014 the limitations on distributable amounts were EUR 1,515 million (2012:and related common shares of EUR 1,161 million). 187 million, as well as to legal reserves included under ‘revaluation’ of EUR 13 million, available-for-sale financial assets of EUR 27 million, unrealized currency gains of EUR 229 million and ‘affiliated companies’ of EUR 1,059 million. The unrealized losses related to currency translation differencescash flow hedges of EUR 56913 million, (2012: EUR 93 million), although qualifying as a legal reserve, reduce the distributable amount by their nature. 220 Annual Report 20132015 205
12 Company financial statements 12.4 - 12.4   13.4    
Long-term debt and short-term debtDebt
Long-term debt Koninklijke Philips N.V. | | | | | | | | | | | | | | | | | | | | | | | | | | | | | | | | | | | | (range of)
interest
rates | | | average
interest
rate | | | amount
outstanding | | | due in
1 year | | | due
after 1
year | | | due
after 5
years | | | average
remaining
term (in
years) | | | amount
outstanding
2012 | | USD bonds | | | 3.8 - 7.8 | % | | | 5.6 | % | | | 2,958 | | | | — | | | | 2,958 | | | | 2,059 | | | | 13.7 | | | | 3,198 | | Convertible debentures | | | | | | | | | | | | | | | | | | | | | | | | | | | | | | | 12 | | Private financing | | | | | | | | | | | | | | | | | | | | | | | | | | | | | | | 2 | | Intercompany financing | | | 0.0 - 2.3 | % | | | 0.7 | % | | | 2,296 | | | | 2,296 | | | | — | | | | — | | | | 0.6 | | | | 442 | | Bank borrowings | | | 1.5 - 2.2 | % | | | 1.9 | % | | | 450 | | | | 250 | | | | 200 | | | | 200 | | | | 3.6 | | | | 450 | | Other long-term debt | | | 1.8 - 19.0 | % | | | 4.5 | % | | | 47 | | | | 47 | | | | — | | | | — | | | | 1.0 | | | | 49 | | | | | | | | | | | | | | | | | | 5,751 | | | | 2,593 | | | | 3,158 | | | | 2,259 | | | | | | | | 4,153 | | Corresponding data previous year | | | | | | | | | | | 4,153 | | | | 614 | | | | 3,539 | | | | 3,289 | | | | | | | | 4,030 | |
Long-term debtin millions of EUR, unless otherwise stated 2014 - 2015 | | | | | | | | | | | | | | | | | | | | | | | | | | | | | | | | | | | | | | | | | (range of)
interest rates | | | average
interest
rate | | | amount
outstanding
in 2015 | | | amount due in
1 year | | | amount due
after 1 year | | | amount due
after 5
years | | | average
remaining
term (in
years) | | | amount
outstanding
in 2014 | | | | | | | USD bonds | | | 3.8 - 7.8 | % | | | 5.6 | % | | | 3,733 | | | | | | | | 3,733 | | | | 2,595 | | | | 12 | | | | 3,355 | | Intercompany financing | | | 0.0 - 7.7 | % | | | 1.9 | % | | | 1,660 | | | | 1,660 | | | | | | | | | | | | | | | | 3,025 | | Bank borrowings | | | 1.13 - 1.33 | % | | | 1.3 | % | | | 200 | | | | | | | | 200 | | | | 200 | | | | 6 | | | | 200 | | Other long-term debt | | | 1.3 - 7.0 | % | | | 3.9 | % | | | 39 | | | | 39 | | | | | | | | | | | | 1 | | | | 43 | | | | | | | | | | | | | | | | | | 5,632 | | | | 1,699 | | | | 3,933 | | | | 2,795 | | | | | | | | 6,623 | | Corresponding data previous year | | | | | | | | | | | 6,623 | | | | 3,068 | | | | 3,555 | | | | 2,533 | | | | | | | | 5,751 | | | | | | |
The following amounts of the long-term debt as of December 31, 2013,2015, are due in the next five years: Koninklijke Philips N.V. | | | | | 2014 | | | 2,593 | | 2015 | | | — | | 2016 | | | — | | 2017 | | | — | | 2018 | | | 899 | | | | | | | | | | 3,492 | | Corresponding amount previous year | | | 864 | |
Long-term debt due in the next five yearsin millions of EUR 2015 | | | | | 2016 | | | 1,699 | | 2017 | | | | | 2018 | | | 1,138 | | 2019 | | | | | 2020 | | | | | | | | | | Long-term debt | | | 2,837 | | Corresponding amount previous year | | | 4,090 | | | | | | |
Short-term debt Short-term debt includes the current portion of outstanding external and intercompany long-term debt of EUR 2,5931,699 million (2012:(2014: EUR 6143,068 million), other debt to group companies totaling EUR 10,97611,578 million (2012:(2014: EUR 11,01510,929 million) and short-term bank borrowings of EUR 761,245 million (2012:(2014: EUR 11363 million).
Koninklijke Philips N.V. | | | | | | | | | | | | 2012 | | | 2013 | | Income tax payable | | | 78 | | | | 4 | | Other short-term liabilities | | | 538 | | | | 53 | | Accrued expenses | | | 253 | | | | 174 | | Derivative instruments—liabilities | | | 592 | | | | 471 | | | | | | | | | | 1,461 | | | | 702 | |
In 2012, Other short-termcurrent liabilities included a payable amountin millions of EUR 509 million related to a fine from the European Commission following an investigation into alleged violation of competition rules in the Cathode-Ray Tubes (CRT) industry. The payable amount represented the aggregate of EUR 313 million paid by the Company and EUR 196 million, being 50% of the fine related to LPD. This amount was paid in 2013 and is therefore reflected in the reduction of other short-term liabilities compared with 2012.
2014 - 2015 | | | | | | | | | | | | | | | | | 2014 | | | 2015 | | | | | | | Other short-term liabilities | | | 63 | | | | 59 | | Accrued expenses | | | 138 | | | | 127 | | Derivative instruments—liabilities | | | 458 | | | | 314 | | | | | | | Other current liabilities | | | 659 | | | | 500 | | | | | | |
Net income
Net income in 2013 amounted to a profit of EUR 1,169 million (2012: a loss of EUR 35 million). The increase of net results in 2013 compared to 2012 is especially due to the financial performance of affiliated companies.
The number of persons employed by the Company at year-end 20132015 was 10 (2012: 10) and included the members of the Board of Management and certain leaders from functions, businesses and markets, together referred to as the Executive Committee. 7 (2014: 9). For the remuneration of past and present members of both the Board of Management and the Supervisory Board, please refer to note 33,29, Information on remuneration, which is deemed incorporated and repeated herein by reference.
PhilipsThe Company has entered into contractsa contract with severala venture capitalistscapitalist where it committed itself to make, under certain conditions, capital contributions to its investment funds to an aggregated amount of EUR 4022 million (2012:(2014: EUR 4835 million) until June 30, 2021. As at December 31, 20132015 capital contributions already made to thesethis investment fundsfund are recorded as available-for-sale financial assets within Other non-current financial assets. Furthermore, Philipsthe Company made commitments to third parties in 20132015 of EUR 1626 million (2012:(2014: EUR 2510 million) with respect to sponsoring activities. The majority of the amounts are due before 2016.over a term of 10 years.
General guarantees as referred to in Section 403, Book 2, of the Dutch Civil Code, have been given by the Company on behalf of several group companies in the Netherlands. The liabilities of these companies to third parties and investments in associates totaled EUR 1,2551,374 million as of year-end 2013 (2012:2015 (2014: EUR 1,4161,546 million). Guarantees totaling EUR 255698 million (2012:(2014: EUR 284636 million) have also been given on behalf of other group companies andcompanies. As at December 31, 2015 there has been no credit guarantees totaling EUR 15 million (2012: EUR 4 million)given on behalf of unconsolidated companies and third parties.third-parties (2014: EUR 4 million). The Company is the head of a fiscal unity that contains the most significant Dutch wholly-owned group companies. The Company is therefore jointly and severally liable for the tax liabilities of the tax entity as a whole. For additional information, please refer to note 26, Contingent assets and liabilities, , which is deemed incorporated and repeated herein by reference. Audit fees
For a summary of the audit fees, please refer to the Group Financial statements, note 3, Income from operations, which is deemed incorporated and repeated herein by reference.
Dutch pension plan contributionFinancing Volcano
On July 1 2013,In 2015, Philips announced that it had reached an agreementfinanced the acquisition of Volcano with a short-term loan of USD 1.3 billion. Philips decided in December 2015 to amend and extend the Dutch trade unions on a new collective labor agreement that covers the periodloan which was actually executed in January 1, 2013 till2016. The loan will mature in December 31, 2014. The new agreement includes changes in the plan rules and the funding agreement with the Dutch pension plan, which is the company’s largest Defined Benefit pension plan. The plan changes have become effective as of January 1, 2014 and the new funding agreement has been signed by the Trustees of the Dutch pension plan. As part of these changes, Philips agreed to make a EUR 600 million contribution to the Dutch pension plan, of which EUR 240 million has been settled in cash on February 19, 2014. During 2014 and 2015, the remainder of the consideration will be settled through the transfer of assets and cash proceeds from the sale of assets which are currently owned by Philips. The (majority of the) contribution will need to be written off through other comprehensive income due to the asset ceiling restrictions in the plan.2016.
206 Annual Report 2013 2212015
12 Company financial statements 12.5 - 12.513.5
Healthcare facility in Cleveland, Ohio
In our healthcare facility in Cleveland, Ohio, certain issues in the general area of manufacturing process controls were identified during an ongoing US Food and Drug Administration (FDA) inspection. To address these issues, on January 10 we started a voluntary, temporary suspension of new production at the facility, primarily to strengthen manufacturing process controls. Currently, there is no indication of product safety issues. This action is estimated to have a negative impact on the sector’s Adjusted IFO of approximately EUR 60 to 70 million in the first half of 2014, of which we expect to recover a substantial part in the second half of 2014.
Transfer of the remaining 30%-stake in TP Vision Holding to TPV Technology
On January 20, 2014 Philips announced that it has signed a term sheet to transfer the remaining 30% stake in the TP Vision venture to TPV Technology Limited. The signing of definitive agreements is expected to take place in the first quarter of 2014, with completion expected in the second half of 2014, subject to certain regulatory and TPV shareholder approvals. After completion, TPV will fully own TP Vision, which will enable further integration with TPV’s TV business.
The remaining 30% stake in the TP Vision venture will be transferred for a deferred purchase price and all outstanding loans and stand-by facilities between Philips and the TP Vision venture will be transferred to TPV. The brand license agreement between Philips and the TP Vision venture will remain in place, with an annual royalty of 2.2% of sales payable by the TP Vision venture to Philips. The minimum annual royalty has been reduced from EUR 50 million to EUR 40 million. The agreement includes a EUR 50 million transaction-related payment, which Philips has accounted for in the fourth quarter of 2013 under Results relating to investments in associates (see note 6, Interests in entities).
LTI coverage program
To cover Philips’ outstanding obligations resulting from past and present long-term incentive and employee stock purchase programs dating back to 2004, Philips will repurchase up to 12 million additional Philips shares on NYSE Euronext Amsterdam, to be executed during 2014. The shares repurchased will be held by Philips as treasury shares until they are distributed to participants.
Philips started this program as of January 28, 2014 and will enter into subsequent discretionary management agreements with one or more banks to repurchase Philips shares within the limits of relevant laws and regulations (in particular EC Regulation 2273/2003) and Philips’ articles of association. All transactions are published on Philips’ website (www.philips.com/investor) on a weekly basis.
The LTI coverage program is over and above the existing EUR 1.5 billion share repurchase program for cancellation purposes which started on October 21, 2013.
February 25, 2014
The Supervisory Board
The Board of Management
12.513.5 Independent auditor’s report—Companyreport
Independent auditor’s report
To the Supervisory Board andTo: The Annual General Meeting of Shareholders of Koninklijke Philips N.V.:
Report on the Company financial statements We have audited the accompanying Company financial statements 2013 which are partaudit of the financial statements 2015
Opinion In our opinion: the consolidated financial statements give a true and fair view of the financial position of Koninklijke Philips N.V., Eindhoven, the Netherlands, and comprise the Company balance sheets as at December 31, 2013,2015, and of its result and its cash flows for 2015 in accordance with International Financial Reporting Standards as endorsed by the Company statementsEuropean Union (EU-IFRS) and with Part 9 of income, and changes in equity for the year then ended and notes, comprising a summaryBook 2 of the accounting policies and other explanatory information in section 12 and 12.4.Netherlands Civil Code; Management’s responsibility
The Board of Management is responsible for the preparationcompany financial statements give a true and fair presentation of these Company financial statements and the preparationview of the Management report, bothfinancial position of Koninklijke Philips N.V. as at December 31, 2015, and of its result for 2015 in accordance with Part 9 of Book 2 of the DutchNetherlands Civil Code. Furthermore, management is responsible for such internal control as it determines is necessary to enable
What we have audited We have audited the preparation of the Company financial statements that are free from material misstatement, whether due to fraud or error. Auditor’s responsibility
Our responsibility is to express an opinion on these Company2015 of Koninklijke Philips N.V. (the Company), based in Eindhoven, the Netherlands. The financial statements based oninclude the consolidated financial statements and the company financial statements.
The consolidated financial statements comprise: | 1. | the consolidated balance sheet as at December 31, 2015; |
| 2. | the following statements for 2015: consolidated statements of income, comprehensive income, cash flows and changes in equity for the year then ended; and |
| 3. | the notes comprising a summary of the significant accounting policies and other explanatory information. |
The company financial statements comprise: | 1. | the company balance sheet as at December 31, 2015; |
| 2. | the company statements of income and changes in equity for 2015; and |
| 3. | the notes comprising a summary of the significant accounting policies and other explanatory information. |
Basis for our audit. opinion We conducted our audit in accordance with Dutch law, including the Dutch Standards on Auditing. This requires that we comply with ethical requirements and plan and performOur responsibilities under those standards are further described in the ‘Our responsibilities for the audit to obtain reasonable assurance about whetherof the Company financial statementsstatements’ section of our report. We are free from material misstatement. An audit involves performing procedures to obtain audit evidence aboutindependent of Koninklijke Philips N.V. in accordance with the amounts“Verordening inzake de onafhankelijkheid van accountants bij assurance- opdrachten” (ViO) and disclosuresother relevant independence regulations in the Company financial statements. The procedures selected depend onNetherlands. Furthermore, we have complied with the auditor’s judgment, including the assessment of the risks of material misstatement of the Company financial statements, whether due to fraud or error. In making those risk assessments, the auditor considers internal control relevant to the entity’s preparation and fair presentation of the Company financial statements in order to design audit procedures that are appropriate in the circumstances, but not for the purpose of expressing an opinion on the effectiveness of the entity’s internal control. An audit also includes evaluating the appropriateness of accounting policies used and the reasonableness of accounting estimates made by management, as well as evaluating the overall presentation of the Company financial statements.“Verordening gedrags- en beroepsregels accountants” (VGBA).
We believe that the audit evidence we have obtained is sufficient and appropriate to provide a basis for our audit opinion. OpinionAudit approach
InSummary
Materiality Overall materiality of EUR 60 million Audit scope Sufficient and appropriate on account balances Key audit matters Company separation and Finance Transformation Acquisitions and disposals Accounting for income tax Contingent liabilities and provisions from claims, proceedings and investigations Materiality Misstatements can arise from fraud or error and are considered material if, individually or in aggregate, they could reasonably be expected to influence the economic decisions of users taken on the basis of these financial statements. The materiality affects the nature, timing and extent of our audit procedures and the evaluation of the effect of identified misstatements on our opinion. Based on our professional judgment we determined the materiality for the financial statements as a whole at EUR 60 million (2014: EUR 80 million). We have reduced materiality to EUR 60 million in anticipation of the separation of the company. The materiality is determined with reference to sales. We consider sales as the most appropriate benchmark given the nature of the business and size of the Company and materiality approximates 0.25% of sales. We have also taken into account misstatements and/or possible misstatements that in our opinion the are material for qualitative reasons Annual Report 2015 207
Company financial statements give a true and fair view13.5 for the users of the financial positionstatements, such as possible misstatements in the information on remuneration disclosures. We agreed with the Supervisory Board that misstatements in excess of EUR 3 million, which are identified during the audit, would be reported to them, as well as smaller misstatements that in our view must be reported on qualitative grounds. Scope of our group audit Koninklijke Philips N.V. is the parent company of the Philips Group (the Group). The financial information of the Group is included in the financial statements of Koninklijke Philips N.V. as at December 31, 2013 and of its result Considering our ultimate responsibility for the opinion, we are also responsible for directing, supervising and performing the group audit. In this context, we have determined the nature and extent of the audit procedures to be performed for group entities (components). Decisive factors were the significance and / or the risk profile of the components. On this basis, we selected the components for which an audit of account balance or specified procedures had to be performed. Furthermore, we have determined the nature and extent of the audit procedures that we perform at group level, sector level and in the accounting operations centers. We scope components to be involved with the audits of account balances into the group audit where account balances are of significant size, have significant risks of material misstatement to the Group associated with them or are considered significant for other reasons. Where this does not give adequate coverage we use our judgment to scope additional procedures on account balances or request the component auditors to perform specified procedures. As a result of our scoping of account balances and the performance of audit procedures at different levels in the organization, our actual coverage varies per account balance and the depth of our audit procedures per account balance varies depending on our risk assessment. Accordingly, our audit coverage per account balance included in the key audit matters stated below, can be summarized as follows: 
Audits of account balances or specified procedures were performed to materiality levels, the majority of which were based on the relevant local statutory audit materiality which is considerably lower than Group materiality. In the other cases, component materiality was determined by the judgment of the group auditor, having regard to the materiality for the financial statements as a whole and the reporting structure within the Group. Component materiality did not exceed EUR 42 million and the majority of our component auditors applied a component materiality that is significantly less than this threshold. We sent detailed instructions to all component auditors, covering the significant areas that should be covered (which included the relevant risks of material misstatement detailed below) and set out the information required to be reported to the group auditor. Based on our risk assessment, the group auditor visited component locations in China, Poland, the Netherlands, Saudi Arabia, the United Kingdom, Japan and multiple component locations in the USA. Most of our component auditors visited the Netherlands in 2014 to attend our global audit conference, which is held every three years, to discuss the Group audit, risks, audit approach and instructions. Telephone calls were also held with the auditors of components. During these visits and meetings, the audit approach, findings and observations reported to the group auditor were discussed in more detail. We have used to a limited extent other (non-KPMG) auditors for audit procedures on certain components outside the Netherlands. By performing the procedures mentioned above at components, combined with additional procedures at group level, sector level and at accounting operations centers, we have been able to obtain sufficient and 208 Annual Report 2015
Company financial statements 13.5 appropriate audit evidence regarding the group’s financial information to provide an opinion on the financial statements. Our key audit matters Key audit matters are those matters that, in our professional judgment, were of most significance in our audit of the financial statements. We have communicated the key audit matters to the Supervisory Board. The key audit matters are not a comprehensive reflection of all matters discussed. Key audit matters were addressed in the context of our audit of the financial statements as a whole and in forming our opinion thereon, and we do not provide a separate opinion on these matters. Compared to last year then endedthe intended separation of the Company into HealthTech and Lighting, the acquisition of Volcano Corporation and the continued classification of the Lumileds and Automotive business as Assets Held for Sale and Discontinued operations have been included as a key audit matter. Company separation and Finance Transformation | | | | | | Key audit matter | | In September 2014 Philips announced its plan to establish two standalone companies focused on the HealthTech and Lighting opportunities respectively with a scheduled completion of the separation of the Lighting business in the first half of 2016. As the separation is expected to impact all businesses, markets and support functions and expected to impact all assets and liabilities of the Company, we have identified the separation as a significant risk for our 2015 audit. Furthermore, the Company continued to implement its global Accelerate! initiative, which includes a Finance Transformation program. The Finance Transformation has a significant impact on the Company’s business processes, control activities and internal control responsibilities. We focused on the Finance Transformation as part of our audit because there is a significant risk that a material misstatement could occur if the program is not implemented with proper oversight and a focus on maintaining effective internal controls throughout the process. | | | | Our response | | Our audit procedures included, amongst others, meeting with the Board of Management and the Audit Committee of the Supervisory Board on a regular basis during the year to understand and monitor the potential impact of the scheduled separation of the Company on the assets and liabilities in the 2015 financial statements. The potential impact of the separation on the valuation of goodwill and (deferred) tax positions were assessed as part of the audit procedures on these accounts as further detailed in the key audit matters below. Furthermore we have used these meetings to understand and monitor the effects of the scheduled separation of the Company and the Finance Transformation on the Company’s internal control environment, across the organization. We have also instructed our component auditors to perform procedures designed to provide reasonable assurance that a material misstatement did not exist in the financial statements as a result of the scheduled separation and the Finance Transformation. We also tested monitoring activities executed at different levels of the organization designed to ensure continued effectiveness of the internal control framework during the separation process and the Finance Transformation. |
Acquistions and disposals | | | | | | Key audit matter | | The acquisition of Volcano Corporation was significant to our audit due to the complexity of and significant judgments and assumptions involved in the purchase price allocation for Volcano Corporation. At the acquisition date February 17, 2015, the increase in the intangibles recognized under goodwill and other intangibles related to Volcano Corporation amounted to EUR 947 million. | | | | | The continued classification of the Lumileds and Automotive business as Assets Held for Sale and Discontinued operations, following the termination of the agreement pursuant to which the consortium led by GO Scale would have acquired an 80.1% interest in the combined businesses of Lumileds and Automotive, was significant to our audit due to the complexity of the assessment process and significant judgments and assumptions involved. | | | | Our response | | With respect to the accounting for the Volcano Corporation acquisition, we have, amongst others, read the asset purchase agreements, confirming the correct accounting treatment has been applied and appropriate disclosure has been made; assessed the valuation and accounting for the consideration payable and traced payments to bank statements; audited the identification and fair valuation of the assets and liabilities the Group acquired including any fair value adjustments; and assessed the valuation assumptions such as discount, tax and royalty rates by recalculating these, evaluating and challenging assumptions used in such calculations amongst others based on external evidence. | | | | | In doing so we have utilized valuation specialists to assist with the audit of the identification and valuation of the assets and liabilities acquired. We have also tested the effectiveness of the Company’s internal controls around the accounting for the acquisition of Volcano. | | | | | We have assessed management’s evaluation in relation to the continued classification of the Lumileds and Automotive business as Assets Held for Sale and Discontinued operations, in accordance with the classification criteria under EU-IFRS, as this has a material effect on the presentation of the financial statements. We also assessed the adequacy of the disclosures in Section 12.9, Note 4 Acquisitions and Divestments (Volcano Corporation) and Note 3 Discontinued operations and other assets classified as held for sale (Lumileds and Automotive). |
Annual Report 2015 209
Company financial statements 13.5 Valuation of goodwill | | | | | | Key audit matter | | Under EU-IFRSs, the Company is required to test the amount of goodwill for impairment, both annually and if there is a trigger for testing. The impairment tests were significant to our audit due to the complexity of the assessment process and significant judgments and assumptions involved which are affected by expected future market or economic conditions. At December 31, 2015, the goodwill amounted to EUR 8.5 billion. | | | | Our response | | Our audit procedures included, amongst others, the involvement of a valuation expert to assist us in evaluating the assumptions and methodologies used by the Company, in particular those relating to the compound sales growth rate and pre-tax discount rate. The cash flow projections, mainly for Healthcare cash-generating units (Respiratory Care & Sleep Management, Image-Guided Therapy, Patient Care & Monitoring Solutions and Home Monitoring) and Lighting cash-generating units (Professional Lighting Solutions and Consumer Luminaires) have been assessed and challenged by us, and includes an assessment of the historical accuracy of management’s estimates and evaluation of business plans. We have also tested the effectiveness of the Company’s internal controls around the valuation of goodwill. | | | | | We believe the assumptions used are within the acceptable range. Based on the impairment test, it was noted that with regard to the headroom for cash-generating unit Consumer Luminaires, the estimated recoverable amount approximates the carrying value of the cash-generating unit. Furthermore, we noted that the headroom for the cash-generating units Professional Lighting Solutions and Home Monitoring is relatively limited. We also assessed the adequacy of the disclosures in Section 12.9, Note 11 Goodwill relating to those assumptions to which the outcome of the impairment test is most sensitive, that is, those that have the most significant effect on the determination of the recoverable amount of goodwill. |
Accounting for income tax positions | | | | | | Key audit matter | | Income tax was significant to our audit because the assessment process is complex and the amounts involved are material to the financial statements as a whole. The Company has extensive international operations and in the normal course of business makes judgments and estimates in relation to tax issues and exposures resulting in the recognition of other tax liabilities. At December 31, 2015, the net deferred tax assets are valued at EUR 2.8 billion and the other tax liability related to tax uncertainties is valued at EUR 454 million. | | | | Our response | | We have tested the completeness and accuracy of the amounts reported for current and deferred tax, including the assessment of disputes with tax authorities, based on the developments in 2015 and the impact of the scheduled separation of the Company. In this area our audit procedures included, amongst others, assessment of correspondence with the relevant tax authorities, testing the effectiveness of the Company’s internal controls around the recording and continuous re-assessment of the other tax liabilities, and the involvement of our local component auditors including tax specialists in those components determined to be the regions with significant tax risk. In respect of deferred tax assets, we analyzed and tested management’s assumptions used to determine the probability that deferred tax assets recognized in the balance sheet will be recovered through taxable income in the countries where the deferred tax assets originated and during the periods when the deferred tax assets become deductible. During our procedures, we use amongst others budgets, forecasts and tax laws and in addition we assessed the historical accuracy of management’s assumptions. We believe the assumptions used are within the acceptable range. We also assessed the adequacy of the Company’s disclosure included in Section 12.9, Note 8 Income taxes in respect of income tax positions and uncertain tax positions. |
Revenue recognition | | | | | | Key audit matter | | Sales contracts for certain projects in the Healthcare and Lighting sectors typically involve multi-element contracts, for example a single sales transaction that combines the delivery of goods and rendering of services, and involve separately identifiable components that are recognized based on relative fair value. This gives rise to the risk that sales could be misstated due to the complexity of the multi-element contracts and the incorrect valuation of the relative fair value elements. Other sales are generally recognized when the risks and rewards of the underlying products have been transferred to the customer and tend not to have multiple deliverable elements. There is a risk that sales may be deliberately overstated as a result of management override resulting from the pressure management may feel to achieve planned results. The management of the Group focuses on sales as a key performance measure which could create an incentive for sales to be recognized before the risks and rewards have been transferred. | | | | Our response | | Our audit procedures included, amongst others, assessing the appropriateness of the Company’s revenue recognition accounting policies including those relating to multi-element contracts and assess compliance with the policies in terms of EU-IFRS. We tested the effectiveness of the Company’s controls over calculation of rebates, fair value determination of multi-element sales contracts, and the correct timing of revenue recognition. We also assessed sales transactions taking place before and after year-end to ensure that revenue was recognized in the correct period and assessed the accuracy of the sales recorded, based amongst others on inspection of sales contracts, hand over certificates and installation hours reported after recognition of revenue. We also assessed the adequacy of the sales disclosures contained in Section 12.9, Note 2 Information by sector and main country and Note 6 Income from operations. |
210 Annual Report 2015
Company financial statements 13.5 Contingent liabilities and provisions from claims, proceedings an investigations (Legal) | | | | | | Key audit matter | | The Company and certain of its group companies and former group companies are involved as a party in legal proceedings, including regulatory and other governmental proceedings as well as investigations by authorities. Since the ultimate disposition of asserted claims and proceedings and investigations cannot be predicted with certainty, an adverse outcome could have a material adverse effect on the financial position, results of operations and cash flows, resulting in the identification of a significant risk. | | | | | The accounting and disclosure for (contingent) liabilities from claims, proceedings and investigations is complex and judgmental, and the amounts involved are, or can be material to the financial statements as a whole. At December 31, 2015, the provisions from legal proceedings amount to EUR 578 million and the litigation payables which were transferred to other current liabilities in 2015 at the moment the Company was able to reach a settlement. In case the company has a present legal or constructive obligation that cannot be estimated reliably, no provisions have been recognized. | | | | Our response | | In response to these risks, our audit procedures included, amongst others, testing the effectiveness of the Company’s controls around the identification and evaluation of claims, proceedings and investigations at different levels in the organization, and the recording and continuous re-assessment of the related (contingent) liabilities and provisions and disclosures, in accordance with EU-IFRS. We also inquired with both legal and financial staff in respect of ongoing investigations or claims, proceedings and investigations, inspected relevant correspondence, inspected the minutes of the meetings of the Audit Committee, Supervisory Board and Executive Committee, requested external legal confirmation letters from a selection of external legal counsel, met with external legal counsel when deemed necessary and obtained a legal representation letter from the Company. | | | | | We evaluated and tested the Company’s policies, procedures and controls surrounding the application of the General Business Principles (GBP), the identification and reporting of violations, and assessed management’s response to any GBP violations. We also assessed the disclosure regarding (contingent) liabilities from legal proceedings and investigations as contained in Section 12.9, Note 19 Provisions, Note 22 Other Liabilities and Note 26 Contingent assets and liabilities. |
Responsibilities of the Board of Management and the Supervisory Board for the financial statements The Board of Management is responsible for the preparation and fair presentation of the financial statements in accordance with EU-IFRS and with Part 9 of Book 2 of the Netherlands Civil Code and for the preparation of the Management report in accordance with Part 9 of Book 2 of the DutchNetherlands Civil Code. Furthermore, the Board of Management is responsible for such internal control as Board of Management determines is necessary to enable the preparation of the financial statements that are free from material misstatement, whether due to errors or fraud. In preparing the financial statements, the Board of Management is responsible for assessing the Company’s ability to continue as a going concern. Based on the financial reporting frameworks mentioned, the Board of Management should prepare the financial statements using the going concern basis of accounting unless the Board of Management either intends to liquidate the Company or to cease operations, or has no realistic alternative but to do so. The Board of Management should disclose events and circumstances that may cast significant doubt on the Company’s ability to continue as a going concern in the financial statements. The Supervisory Board is responsible for overseeing the Company’s financial reporting process. Our responsibilities for the audit of the financial statements Our objective is to plan and perform the audit assignment in a manner that allows us to obtain sufficient and appropriate audit evidence for our opinion. Our audit has been performed with a high, but not absolute, level of assurance, which means we may have not detected all errors and fraud. For a further description of our responsibilities in respect of an audit of financial statements in general, we refer to the website of the professional body for accountants in the Netherlands (NBA). www.nba.nl/standardtexts-auditorsreport. Report on other legal and regulatory requirements Report on the Management report and the other information Pursuant to the legal requirements under Section 2:393 sub 5 at e and fPart 9 of Book 2 of the Dutch Civil Code we(concerning our obligation to report about the Management report and other information): We have no deficiencies to report as a result of our examination whether the Management report, as defined in the introduction paragraph of section 11 Group financial statements, to the extent we can assess, has been prepared in accordance with Part 9 of Book 2 of thisthe Dutch Civil Code, and whether the information as required under Section 2:392 sub 1 at b - hby Part 9 of Book 2 of the Dutch Civil Code has been annexed. Further, we We report that the Management report, to the extent we can assess, is consistent with the financial statements. Annual Report 2015 211
Company financial statements 13.5 Engagement We were engaged before 2003 for the first time as requiredauditor of Koninklijke Philips N.V. and operated as auditor since then. We were re-appointed by Section 2:391 sub 4the Annual General Meeting of Shareholders as auditor of Koninklijke Philips N.V. on May 1, 2014, for the Dutch Civil Code.year 2015, after which we will rotate off from the Philips audit. Amsterdam, The Netherlands February��25, 2014February 23, 2016
KPMG Accountants N.V. J.F.C. van EverdingenE.H.W. Weusten RA
Note that the report set out above is included for the purpose of Koninklijke Philips N.V.’s Annual Report on Form 20-F for 2015 only and does not form part of Koninklijke Philips N.V.’s Annual Report for 2015. 222212 Annual Report 20132015
13 Sustainability statements 13 - 1314
1314 Sustainability statements
Approach to sustainability reporting Philips has a long tradition of sustainability reporting, beginning in 1999 when we publishedwith our first environmental annual report.Annual Report published in 1999. This was expanded in 2003, with the launch of our first sustainability annual report,Annual Report, which provided details of our social and economic performance in addition to our environmental results. In 2008, we decided to publish an integrated financial, social and environmental report, reflecting the progress we have made embedding sustainability in our way of doing business. This is also supported by the inclusion of sustainability in the Philips Mission, Vision and the company strategy. For more information, please refer to chapter 4, Our strategic focus, of this report. This is our sixtheighth annual integrated financial, social and environmental report which has been prepared in line with the International Integrated Reporting Council (IIRC) Integrated Reporting (IR) framework, including a visualization of our value creation process section 4.2, How we create value, of this report. Philips publishes its integrated Annual Report with the highest (reasonable) assurance level on the financial, social and environmental performance. With that overall reasonable assurance level Philips is a frontrunner in this field. Tracking trends We continuously follow external trends to determine the issues most relevant for our company and those where we can make a positive contribution to society at large. In addition to our own research, we make use of a variety of sources, including the United Nations Environmental Programme (UNEP), World Bank, World Business Council for Sustainable Development (WBCSD), World Economic Forum and World Health Organization. Our work also involves tracking topics of concern to governments, regulatory bodies, academia, and non-governmental organizations (NGO), and following the resulting media coverage. Stakeholders We seek to engagederive significant value from our diverse stakeholders across all our activities and engage with, listen to gain their feedback on specific areas of our business.and learn from them. Working in partnerships is crucial in delivering on our vision to make the world healthier and more sustainable through innovation. When appropriate and relevant to our business, we incorporate their feedback on specific areas of our business into our planning and actions. In addition to engagement with our customers, our suppliers, employees, investors, local communities and governments and non-governmental organizations, we participate in meetings and task forces as a member of organizations including the WBCSD, World Economic Forum, Electronic Industry Citizenship Coalition (EICC), Carbon Disclosure Project Supply Chain, European Committee of Domestic Equipment Manufacturers (CECED), Federation of National Manufacturers Associations for Luminaires and Electrotechnical Components for Luminaires in the European Union (CELMA), European Coordination Committee of the Radiological, Electromedical and Healthcare IT Industry (COCIR), Digital Europe, European Lamp Companies Federation (ELC), European Roundtable of Industrialists (ERT), National Electrical Manufacturers Association (NEMA), Environmental Leadership Council of the Information Technology Industry Council (ELC ITIC), Consumer Electronics Association (CEA), Association of Home Appliance Manufacturers (AHAM), Healthcare Plastics Recycling Council (HPRC) and the Ellen MacArthur Foundation. A multi-stakeholder project with the Sustainable Trade Initiative (IDH), a number of NGOs, and electronicelectronics companies was started in 2011 and continuedexpanded in 2013.2014 and 2015 to include suppliers in the Yangtzhe river delta. The program focuses on improving working circumstances in the electronics industry in China. Furthermore, we engaged with the leading Dutch labor union (FNV) and a number of NGOs, including Enough, GoodElectronics, MakeITfair, the Chinese Institute of Public and Environmental Affairs, SOMO, Amnesty International, Greenpeace and Friends of the Earth.Earth as well as a variety of investors and analysts. In addition to face-to-face meetings, webinars and social media channels provide us with ongoing feedback on our strategy, performance and emerging topics. Our sustainability e-mail account(philips.sustainability@philips.com) enables stakeholders to share their issues, comments and questions with the sustainability team. As described in the Materiality section below, various stakeholder groups have been invited to provide input to the materiality analysis which was updated for the Annual Report 2015. The table below provides an overview of the different stakeholder groups, examples of those stakeholders and topics discussed. Annual Report 2015 213
Sustainability statements 14 Stakeholder overview (non-exhaustive) | | | | | | | Examples | | Processes | | | | | Employees | | - European Works Council - Individual employees | | Regular meetings, quarterly My Accelerate! Surveys, employee development process, quarterly update webinars. For more information refer to section 5.2, Social performance, of this report. | | | | | Customers | | - Hospitals - Real estate developers - Consumers | | Joint (research) projects, business development, Lean value chain projects, consumer panels, Net Promoter Scores, Philips Customer Care centers, Training centers, social media | | | | | Suppliers | | - Chinese suppliers in the Pearl and Yangtzhe river deltas - HP, Randstad, Maersk | | Supplier development activities (including topical training sessions), supplier forums, supplier website, participation in industry working groups like COCIR and EICC. For more information refer to sub-section 14.2.8, Supplier indicators, of this report. | | | | | Governments, municipalities, etc. | | - European Union - Authorities in Los Angeles, Singapore | | Issues meetings, annual Innovation Experience, research projects, policy and legislative developments, business development | | | | | NGOs | | - Dutch Sustainable Trade initiative (IDH) - Friends of the Earth | | Issues meetings, cross-sector (multi-stakeholder) projects, joint projects, social investment program and Philips Foundation | | | | | Investors | | - Mainstream investors - ESG investors | | Webinars, roadshows, capital markets day,investor relations andsustainability accounts | |
Reporting standards In this report, we have followed relevant best practice standards and international guidelines while reporting on our sustainability performance. Most important areguidelines; the IIRC Integrated Reporting <IR> framework and the Global Reporting Initiative’s (GRI) new G4 Sustainability Reporting Guidelines as well asGuidelines. Sustainability is integrated in our company strategy and embedded in the International Integrated Reporting Council (IIRC) Integrated Reportingorganization. We have developed a value creation model (section 4.2, How we create value, of this report), including the six capitals, in line with the <IR> framework. A detailed overview of the G4 Comprehensive Indicators is provided at the end of this section. Sustainability is integrated in our company strategy and embedded in the organization. We have tried to reflect this “integrated thinking” while writing this report, in line with the <IR> framework.
We signed on to the United Nations Global Compact in March 2007, joining thousands of companies from all regions of the world as well as international labor and civil society organizations to advance 10 universal principles in the areas of human rights, labor, the environment and anti- corruption.anti-corruption. Our General Business Principles, Sustainability and Environmental Policies, and our Supplier Sustainability Declaration are the cornerstones that enable us to live up to the standards set by the Global Compact. This is closely monitored and reported, as illustrated throughout this report, which is also our annual Communication on Progress (COP) submitted to the UN Global Compact Office. As part of our commitment to the Sustainable Development Goals (SDGs), we use this report to communicate on our progress towards the relevant SDGs (please refer to sub-section 14.2.7, Stakeholder Engagement, of this report), next to our reporting into the SDG Compass reporting tool. Material aspects and our focus Based on ongoing trend analysis, stakeholder input and media analysis, weWe identify the key materialenvironmental, social, and governance aspects forwhich have the greatest impact on our company from a sustainability perspective. We have mappedbusiness and the aspects in the table below, taking into account the:
greatest level of concern to society at largestakeholders along our value chain. These direct or indirect aspects may represent opportunities and stakeholders, versus significance of therisks and influence our ability to create, preserve or erode economic, environmental and social impact onvalue for our stakeholders and by Philips through our operationsPhilips. Assessing these aspects enables us to prioritize and products/solutions.
This is a dynamic process, as we continuously monitorfocus upon the world around us. We developmost material issues and effectively address these in our policies and programs as well as measure and understand their implications in financial and non-financial terms.
Our materiality assessment is based on an ongoing trend analysis, media search, and stakeholder input. In 2015, we have updated our findings.assessment by asking a diverse group of stakeholders (incl. customers, suppliers, investors and NGOs) to evaluate the materiality of a long-list of aspects. The results are reflected on the vertical axis of the materiality matrix. The scores on the horizontal axis are based on Philips’ assessment to the best of our knowledge. Our materiality assessment has been conducted in the context of the GRI G4 Reporting Framework and the results have been reviewed and approved by the Philips Sustainability Board. The results of this analysis are given in the matrix below and the key material aspects as well as the links to the relevant sections in this report are provided as well. 214 Annual Report 2013 2232015
13 Sustainability statements 13 - 1314
Materiality matrix 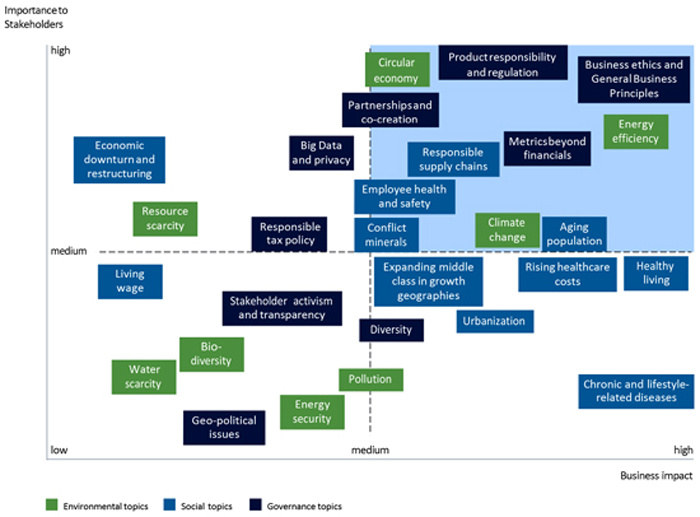
Key material aspects | | | | | | | | | | | Reference1) | | | | | Environmental | | | | | Boundaries | | | | | - Climate change | | section 2.3, Market opportunities,chapter 2, Message from the CEO, of this report
section 4.3,4.1, Addressing global challenges, of this report section 5.3, Environmental performance, of this report chapter 13,14, Sustainability statements, of this report | | | Supply chain, operations, use phase | | | | | - Energy efficiency | | section 2.3, Market opportunities,4.1, Addressing global challenges, of this report section 4.3,5.3, Environmental performance, of this report chapter 13,14, Sustainability statements, of this report | | | Supply chain, operations, use phase | | | | - Clean technologies
| | sub-section 5.4.1, About Innovation, Group & Services, of this report | | Use phase | | | | - Circular Economy (incl. resource efficiency and collection & recycling) | | chapter 2, Message from the CEO, of this report sub-section 4.3.1,5.3.1, Green Innovation, of this report section 4.3,5.3, Environmental performance, of this report sub-section 13.2.2,14.2.8, Supplier indicators, of this report | | | Supply chain, operations, use phase | | | | | | | | | | | - Biodiversity (increased focus on natural resources)
| | section 4.3, Environmental performance, of this report
chapter 13, Sustainability statements, of this report
| | Operations, use phase | | | | - Water scarcity
| | chapter 13, Sustainability statements, of this report | | Operations | | | | - Pollution (incl. air and acidification)
| | sub-section 5.4.1, About Innovation, Group & Services, of this report | | Operations, use phase | | | | | | Reference1) | | | | | | | | Societal | | | | | Boundaries | | | | | - Aging population | | Message from the CEO,section 4.1, Addressing global challenges, of this report
section 2.3, Market opportunities,sub-section 6.1.1, Healthcare landscape, of this report
section 5.1, Healthcare,sub-section 6.2.1, Consumer landscape, of this report
| | Use phase | | | | - Rising healthcare costs
| | Message from the CEO, of this report
section 2.3, Market opportunities, of this report
section 5.1, Healthcare, of this report
| | Use phase | | | | - Chronic and lifestyle related diseases
| | Message from the CEO, of this report
section 2.3, Market opportunities, of this report
section 5.1, Healthcare, of this report
| | Use phase | | | | - Healthy Living
| | Message from the CEO, of this report
section 2.3, Market opportunities, of this report
section 5.2, Consumer Lifestyle, of this report
| | Use phase | | | | - Expanding middle class in growth geographies
| | Message from the CEO, of this report
section 5.2, Consumer Lifestyle, of this report
| | Use phase | | | | - Responsible Supply Chains (inc. human rights) | | section 4.2,5.2, Social performance, of this report chapter 13,14, Sustainability statements, of this report | | Supply chain | | | | - Demographic shift and urbanization
| | section 2.3, Market opportunities, of this report
sub-section 5.3.1, Lighting business landscape, of this report
| | Use phase | | | | - Conflict minerals
| | sub-section 4.2.10, Supplier sustainability, of this report
sub-section 13.2.2, Supplier indicators, of this report
| | Supply chain | | | | | - Employee health and safety | | section 4.2,5.2, Social performance, of this report | | | Supply chain, operations | | | | | - Economic downturnConflict minerals | | Message from | | | Supply chain | | | | | | | sub-section 5.2.10, Addressing issues deeper in the CEO,supply chain, of this report | | Supply chain, operations, use phase | | | | |
224 Annual Report 20132015 215
13 Sustainability statements 13 - 1314
| | | | | | | | | | | Reference1) | | | | | | Governance
| | | | Boundaries | | | | - Privacy and on-line salesGovernance
| | section 6.5, Compliance risks, of this report | | Operations, use phase | Boundaries | | | | | - Business ethics and General Business Principles | | section 6.5,7.5, Compliance risks, of this report sub-section 5.2.7, General Business Principles, of this report | | | Supply chain, operations, use phase | | | | | - Partnerships and co-creation | | sub-section 5.4.1,6.4.1, About Innovation, Group & Services in 2015, of this report chapter 13,14, Sustainability statements, of this report | | | Supply chain, use phase | | | | - Impact of social media
| | sub-section 4.2.8, Stakeholder engagement, of this report
section 6.4, Operational risks, of this report
| | Supply chain, operations, use phase | | | | - Stakeholder activism and transparency
| | sub-section 4.2.8, Stakeholder engagement, of this report
sub-section 4.2.10, Supplier sustainability, of this report
section 6.4, Operational risks, of this report
| | Supply chain, operations, use phase | | | | - Metrics beyond financials | | section 4.2,5.2, Social performance, of this report section 4.3,5.3, Environmental performance, of this report chapter 13,14, Sustainability statements, of this report | | | Supply chain, operations, use phase | | | | | - Product responsibility and regulation (inc. transparency on chemicals) | | section 6.5,7.5, Compliance risks, of this report sub-section 5.1.2,6.1.2, About Philips Healthcare in 2015, of this report sub-section 5.2.2,6.2.2, About Philips Consumer Lifestyle in 2015, of this report sub-section 5.3.2,6.3.2, About Philips Lighting in 2015, of this report | | | Supply chain, operations, use phase | | | | - Diversity
| | section 2.5, Our people, of this report
sub-section 4.2.3, Diversity and inclusion, of this report
| | Operations |
1)1) | With the exception of section 4.2,5.2, Social performance, of this report, section 4.3,5.3, Environmental performance, of this report, and chapter 13,14, Sustainability statements, of this report, the sections and chapters referred to are not included in the scope of the assurance engagement |
Programs and targets Our sustainability commitments are grouped under the label EcoVision, comprising the following elements:key elements, more detailed targets can be found in the respective sections. Philips Group Sustainability commitments 2015 | | | | | | | | | | | | | baseline year | | | target 2015 | | | 2015 actual | | | | | target 2015 | | | baseline year | | | | | | | Green Product Sales | | | 50% of total sales | | | | | | | | 50% of total sales | | | | 54% | | | Lives Improved | | | 2 billion | | | | | | | | 2 billion | | | | 2 billion | | | Green Innovation | | | | | | | | | | | | - Investments | | | EUR 2 billion (cumulative) | | | | 2010 | | | | 2010 | | | | EUR 2 billion (cumulative) | | | | EUR 2.2 billion | | | - Energy Efficiency | | | 49 Lumen/Watt (up 50%) | | | | 2009 | | | | 2009 | | | | 50.3 lumen/watt (up 50%) | | | | 44.5 lumen/watt | | | - Materials | | | | | | | | | | | | - Collection & Recycling | | | 45,000 tonnes (up 100%) | | | | 2009 | | | | 2009 | | | | 45,000 tonnes (up 100%) | | | | 28,500 tonnes | | | - Recycled content | | | 15,000 tonnes (up 100%) | | | | 2009 | | | | 2009 | | | | 15,000 tonnes (up 100%) | | | | 13,500 tonnes | | | Green Operations | | | | | | | | | | | | - CO2reduction | | | 40% | | | | 2007 | | | | 2007 | | | | 40% | | | | 41% | | | - Health & Safety | |
| 0.26 Lost Workday
Injury Cases per 100 FTE |
| | | | | |
| 0.26 Lost Workday Injury
Cases per year |
| | | 0.21 | | | Supplier Sustainability1) | | | 72% compliant | | | | | | | | 72% compliant | | | | 86% | | | | | | | |
| 1) | For more information see sub-section 13.2.2,14.2.8, Supplier indicators, of this report |
All of our programs are guided by the Philips General Business Principles, which provide the framework for all of our business decisions and actions. Boundaries of sustainability reporting Our sustainability performance reporting encompasses the consolidated Philips Group activities, following the consolidation criteria detailed in this section. As a result of impact assessments of our value chain we have identified the material topics, determined their relative impact in the value chain (supply chain, our own operations, and use phase of our products) and report for each topic on the relevant parts of the value chain. More details on our impact are provided in the relevant sections. The consolidated selected financial information in this sustainability statements section has been derived from the Group Financial Statements, which are based on IFRS. Comparability and completeness We used expert opinions and estimates for some parts of the Key Performance Indicator calculations. There is therefore an inherent uncertainty in our calculations. The figures reported are Philips’ best estimate. As our insight increases, we may enhance the methodology in the future. The Green Product definition has changed in 2013 for Lighting; with the phase-out of incandescent lamps, the Eco Halogen lamp became the reference product for many lamps and was not included in our Green Product sales any longer. This had a downward impact on the Green Product sales of Lighting of some 4%. At the same time it was decided to include sustainable services provided by the business group Professional Lighting Solutions (PLS)There have been three changes in the Green Product definition Lighting. This hadLives Improved model causing a significant change in the results. Firstly, the source of installed base reporting for part of the Healthcare business was discontinued at the end of 2014, a new source has been used in 2015. Historical results could not be recalculated using the new installed base source, however the upward impact of this change has been estimated at a maximum of 4%. Secondly, the inclusion of three types of patient monitors has been added to the model. Historical results have been recalculated for this change and have an upward impact of 1,5%maximum 2%. Thirdly, in the 2014 Lighting sales data an update on quantities of green products sold has taken place. This has a downward effect of maximum 4%.
Social data cover all employees, including temporary employees, but exclude contract workers. Due to the Green Product salesimplementation of this sector.new HRM systems, we are able to provide more specific exit information on Philips employees as from 2014. In 2015, in line with previous years, the emission factor set for consumed electricity has been updated to the IEA 2015 publications. Also, the emission factors for natural gas were implemented according to DEFRA (UK Department of Environment, Food and Rural Affairs). Lastly, all scope three emission factors for business travel and logistics have been updated from a bespoke emission factor set to DEFRA guidance as well. The latter has had an upward effect on our scope 3 emissions ranging from 15% to 32% in the years 2007-2015. 216 Annual Report 2015
Sustainability statements 14 The emissions of substances data is based on measurements and estimates at manufacturing site level. There is therefore an inherent uncertainty in our calculations. The figures reported are Philips’ best estimate. As our insight increases, we may enhance the methodology in the future. Integration of newly acquired activities is scheduled according to a defined integration timetable (in principle, first full reporting year after the year of acquisition) and subject to the integration agenda. Data for activities that are divested during the reporting year are not included in full-year reporting. Environmental data are reported for manufacturing sites with more than 50 industrial employees. Social data cover all employees, including temporary employees, but exclude contract workers. Due to the implementation of new HRM systems, we are able to provide exit diversity information on Philips employees as from 2012. Historical comparisons may not be available, however.
Annual Report 2013 225
13 Sustainability statements 13 - 13
Health and safety data is reported for units with over 50 FTEs (full-time equivalents) and is voluntary for smaller units. New acquisitions must report, in principle, the first year after acquisition and subject to the integration agenda. Data for activities that are divested during the reporting year are not included in full-year reporting.
In line with the discontinued operations presentation in the Group financial statements regarding the Audio, Video, MultimediaLumileds and Accessories (AVM&A)Automotive business, we have excluded the AVM&Athis data from the consolidated Sustainability data.data if relevant. Where the impact of the exclusion was material, we clearly disclosed the impact. Prior-period financial statements have been restated for the treatment of Audio, Video, Multimedia and Accessories as discontinued operations and the adoption of IAS 19R, which mainly relates to accounting for pensions.
Data definitions and scope Lives improved, energy efficiency and materials The key performance indicatorsKey Performance Indicators on ‘lives improved’, ‘energy efficiency’ and ‘materials’ and the scope are defined in the respective methodology documents that can be found atwww.philips.com/sustainability.sustainability. Health and safety Health and safety data is reported by sites with over 50 FTEs (full-time equivalents) and is voluntary for smaller locations. Health and safety data are reported and validated each month via an online centralized IT tool. The focus of reporting is on work-related injuries and illnesses that predominantly occur in manufacturing operations and Field Services Organizations for incidents leading to at least one lost workday. Fatalities are reported for staff, contractors and visitors and include commuting accidents. From 2016 onward, the annual number of cases leading to a Recordable Case will be reported per 100 FTEs (Total Recordable Case Rate). General Business Principles Alleged GBP violations are registered in our intranet-based reporting and validation tool. Supplier audits Supplier audits are primarily focused on identified risk suppliers, based on identified risk countries and on spend of more than EUR 1 million (new suppliers EUR 100,000 and no threshold for high risk suppliers). Based on the Maplecroft Human Rights Risk Indexes, risk countries for Supply Management in 2015 were: Belarus, Brazil, China, Dominican Republic, India, Indonesia, Mexico, Philippines, Russia and Ukraine. Suppliers of new ventures are included to the extent that the integration process of these ventures has been finalized. Normative integration period is two years after closure of the new venture. Green Products Green Products offer a significant environmental improvement in one or more Green Focal Areas: Energy efficiency, Packaging, Hazardous substances, Weight, Recycling and disposal and Lifetime reliability. The life cyclelifecycle approach is used to determine a product’s overall environmental improvement. It calculates the environmental impact of a product over its total life cycle (raw materials, manufacturing, product use and disposal). Green Products need to prove leadership in at least one Green Focal Area compared to industry standards, which is defined by a sector specific peer group. This is done either by outperforming reference products (which can be a competitor or predecessor product in the particular product family) by at least 10%, outperforming product-specific eco-requirements or by being awarded with a recognized eco-performance label. Because of different product portfolios, sectors have specified additional criteria for Green Products, including product-specific minimum requirements where relevant. Green Innovation Green Innovation comprisecomprises all R&D activities directly contributing to the development of Green Products or Green Technologies. A wide set of additional criteria and boundaries have been defined as the basis for internal and external validation. Environmental data All environmental data from manufacturing operations are reported on a half-yearhalf-yearly basis in our sustainability reporting and validation tool, according to defined company guidelines that include definitions, procedures and calculation methods. Internal validation processes are followedhave been implemented and peer audits performed to ensure consistent data quality and to assess the robustness of data reporting systems. These environmental data from manufacturing are tracked and reported to measure progress against our Green operationsOperations program targets. Reporting on ISO 14001 certification is based on manufacturing units reporting in the sustainability reporting system. Operational carbon footprint The Philips operational carbon footprint (Scope 1, 2 and 3) is calculated on a half-yearly basis and includes:
Industrial sites – manufacturing and assembly sites
Non-industrial sites – offices, warehouses, IT centers and R&D facilities
Business travel – lease and rental cars and airplane travel
Logistics – air, sea and road transport
All emission factors used to transform input data (for example, amount of tonne-kilometers transported) into CO2 emissions are fromreports in line with the Greenhouse Gas Protocol (GHGP), except for business travel, where the service providers supplied CO2 data based on their own verified methodology.. The GHGP distinguishes three scopes. It is mandatoryscopes, as described below. The GHGP requires to report on the first two scopes to comply with the GHGP reporting standards. As per the updated GHGP Scope 2 reporting
Annual Report 2015 217
Sustainability statements 14 guidance, from this year onward our scope 2 emissions reporting will include both the market based method as well as location based method. The market based method of reporting will serve as our reference for calculating our total operational carbon footprint. | • | | Scope 1 – direct CO2 emissions – is reported on with direct emissions from our industrial and non-industrialnonindustrial sites in full. Emissions from industrial sites, which consist of direct emissions resulting from processes and fossil fuel combustion on site, are reported in the sustainability reporting system. Energy use and CO2 emissions from non-industrial sites are based on actual data where available. If this is not the case, they are estimated based on average energy usage per square meters, taking the geographical location and building type of the site into account. |
| • | | Scope 2 – indirect CO2 emissions resulting from the generation of purchased electricity for our premises – is reported on with electricity useindirect emissions from our industrial and non-industrial sites in full. Indirect CO2 emissions resulting from purchased electricity, steam, heat and heatother indirect sources are reported in the sustainability reporting system. ThoseThe indirect emissions of industrial sites not yet reporting are calculated on the same basis as described in Scope 1. Indirect emissions of non-industrial sites are calculated in the same manner as described in Scope 1. |
The location based method of scope 2 reporting reflects the average emissions intensity of grids on which energy consumption occurs (using mostly grid-average emission factor data). For this method our emission factors derive from the International Energy Agency (IEA) 2015 and are based on grid averages. | • | | The market based method of scope 2 reporting allows using an emission factor that is specific to the energy purchased. Emissions intensity of consumed energy can differ based on contractual instruments used. For example, so-called ‘green electricity contracts’ guarantee the purchaser will be supplied with electricity coming from renewable sources which typically have less emissions per energy generated. In the market based method Philips will account for renewable electricity with an emission factor of 0 grams CO2 per kWh. All renewable electricity claimed by Philips is sourced within the same energy market as where the electricity-consuming operations are located, and is tracked and redeemed, retired, or cancelled solely on behalf of Philips. All certificates were obtained through procurement of Green-e certified Renewable Energy Certificates (RECs) in the United States and European Guarantees of Origin from the Association of Issuing Bodies (AIB) of the European Energy Certificate System (EECS). |
| • | | Scope 3 – other CO2 emissions related to activities not owned or controlled by the Group is reported on for our business travel and distribution activities. Commuting by our employees, upstream distribution (before suppliers ship to us), outsourced activities and emissions resulting from product use by our customers are not included in our operational carbon footprint. The calculations for business travel by lease cars are based on actual fuel usage and for rental cars on distance traveled. Emissions from business travel by airplane are calculated by the supplier based on mileage flown and emission factors from DEFRA (UK Department of Environment, Food and Rural Affairs), distinguishing between short, medium and long flights. Further, emissions from air freight for distribution are calculated based on the amount of tonne-kilometers transported between airports (distinguishing between short, medium and long hauls), including an estimate (based on actual data of the lanes with the largest volumes) for trucking from sites and distribution centers to airports and vice versa. Express shipments are generally a mix of road and air transport, depending on the distance. |
The Philips operational carbon footprint (Scope 1, 2 and 3) is calculated on a half-yearly basis and includes the emissions from our: Industrial sites – manufacturing and assembly sites Non-industrial sites – offices, warehouses, IT centers and R&D facilities Business travel – lease and rental cars and airplane travel Logistics – air, ocean and road transport All emission factors used to transform input data (for example, amount of tonne-kilometers transported) into CO2 emissions have been updated from the previously used DEFRA (UK Department for Environment, Food & Rural Affairs) 2007 and bespoke emission factors to the applicable DEFRA 2015 emission factors for each year respectively. Therefore, an increase of our total carbon emissions compared with previous reported results can be observed. The total CO2 emission resulting from these calculations serve as input for scope 1, 2 and 3. Commuting by our employees, upstream distribution (before suppliers ship to us), outsourced activities and emissions resulting from product use by our customers are not included in our operational carbon footprint. The calculations for business travel by lease cars are based on actual fuel usage and for rental cars on distance travelled. Taxis and chauffeur driven cars used for business travel are not included in the calculations. Emissions from business travel by airplane are calculated by the supplier based on mileage flown and emission factors from DEFRA, distinguishing between short, medium and long flights. Further, emissions from air freight for distribution are calculated based on the amount of tonne-kilometers transported between airports (distinguishing between short, medium and long hauls), including an estimate (based on actual data of the lanes with the largest volumes) for trucking from sites and distribution centers to airports and vice versa. Express shipments are generally a mix of road and air transport, depending on the distance. Therefore the assumption is applied that shipments over less than 600 km are transported by road and the rest of the shipments by air (those emissions by air are calculated in the same way as air freight). For sea transport, only data on transported volume were available so an estimate had to be made about the average weight of a container. Transportation to and from ports is not registered. This fore and aft part of sea transport was estimated to be around 3% of the total distance (based on actual data of the lanes with the largest volumes), consisting of a mix of modalities, and was added to the total emissions accordingly. CO2 emissions from road transport were also calculated based on tonne-kilometers. If data were incomplete, the emissions were estimated based on sales volumes. Return travel of vehicles is not included in the data for sea and road distribution. |
Health and safety
Health and safety data are reported and validated monthly. The focus is on reporting work-related injuries, which predominantly occur in manufacturing operations. The annual number of cases leading to at least one lost workday is reported per 100 FTEs (full-time equivalents). Fatalities are reported for staff, contractors and visitors and include commuting accidents.
General Business Principles
Alleged GBP violations are registered in our intranet-based reporting and validation tool.
Supplier audits
Supplier audits are primarily focused on identified risk suppliers, based on identified risk countries and on spend of more than EUR 1 million (new suppliers EUR 100,000 and no threshold for high risk suppliers).
Based on the Maplecroft Human Rights Risk Indexes, risk countries for Supply Management in 2013 were: Brazil, China, India, Indonesia, Mexico, Ukraine, and Vietnam.
Suppliers of new ventures are included to the extent that the integration process of these ventures has been finalized. Normative integration period is two years after closure of the new venture.
Sustainability governance Sustainability is strongly embedded in our core business processes, like innovation (EcoDesign), sourcing (Supplier Sustainability Involvement Program), manufacturing (Green Manufacturing 2015) and Logistics (Green Logistics) and projects like the Circular Economy initiative. 218 Annual Report 2015
Sustainability statements 14 The Sustainability Board is the highest governing sustainability body in Philips, which was chaired by Jim Andrew, member of the Executive Committee.Committee until September 2015, as he left the Company. Three other Executive Committee members sit inon the Sustainability Board 226 Annual Report 2013
13 Sustainability statements 13 - 13.2.1
jointly with sector and functional executives. The Sustainability Board convenes four times per year, defines Philips’ sustainability strategy and programs, monitors progress and takes corrective action where needed. Progress on Sustainability is communicated internally on a quarterly basis to Philips staff and at least annually in the Executive Committee and Supervisory Board. External assurance KPMG has provided reasonable assurance on whether the information in chapter 13,14, Sustainability statements, of this report and section 4.2,5.2, Social performance, of this report and section 4.3,5.3, Environmental performance, of this report presents fairly, in all material respects, the sustainability performance in accordance with the reporting criteria. WePlease refer to section 13.4,14.4, Independent assurance report,Auditor’s Assurance Report, of this report. 13.114.1 Economic indicators
This section provides summarized information on contributions on an accruals basis to the most important economic stakeholders as a basis to drive economic growth. For a full understanding of each of these indicators, see the specific financial statements and notes in this report. Philips Group Distribution of direct economic benefits in millions of eurosEUR 2013 - 2015 | | | | | | | | | | | | | | | 2013 | | | 2014 | | | 2015 | | | | | 2011 | | | 2012 | | | 2013 | | | | | | Suppliers: goods and services | | | 12,732 | | | | 14,466 | | | | 13,641 | | | | 12,653 | | | | 13,185 | | | | 14,388 | | Employees: salaries and wages | | | 4,668 | | | | 5,499 | | | | 4,983 | | | | 4,722 | | | �� | 5,018 | | | | 5,533 | | Shareholders: distribution from retained earnings | | | 711 | | | | 687 | | | | 678 | | | | 678 | | | | 729 | | | | 730 | | Government: corporate income taxes | | | 251 | | | | 185 | | | | 466 | | | | 466 | | | | 26 | | | | 239 | | Capital providers: net interest | | | 302 | | | | 325 | | | | 268 | | | | 269 | | | | 251 | | | | 302 | | | | | | | |
Total purchased goods and services as included in cost of sales amounted to EUR 13.614.4 billion, representing 58%59% of total revenues of the Philips Group. Of this amount, 70%approximately 65% was spent with global suppliers, the remainder with local suppliers. Compared to 2012, spending decreased significantly mainly as a result of Bill of Material savings. In 2013,2015, the salaries and wages totaled EUR 4.985.5 billion. This amount is some EUR 500 million lowerhigher than in 2012,2014, mainly caused by a reduction in headcountthe acquisition of Volcano, unfavorable currency effects and lower restructuring costs.settlement for pension de-risking. See note 3,6, Income from operations for more information. Dividend distributed toPhilips’ shareholders were given EUR 730 million in the form of a dividend, the cash portion of which amounted to EUR 678 million, comparable to 2012.298 million.
Income taxes amounted to EUR 466239 million, compared to EUR 18526 million in 2012.2014. The effective income tax rate was 28.1%, compared to 58.0% in 2012. Excluding the non-tax-deductible European Commission fine and charges related to various legal matters in 2012, the effective tax rate in 2012 was 25.5%38.4%. The 2.6 percentage points increase in 20132015 was mainly relateddue to a higher weighted average statutorythe non-deductible expenses, new loss carryforwards and temporary differences not expected to be realized which were partly offset by non-taxable income. Non-taxable income is predominantly attributable to favorable tax regulations relating to R&D investments. The comparable effective income tax rate in 2013 due to a change in the country mix of profit and loss, whichfor 2014 was partly offset by lower valuation allowances.14.1%. For a further understanding, see note 5,8, Income taxes. For more information, please refer toPhilips’ Tax Principles. 13.214.2 Social statements
This section provides additional information on (some of) the social performance parameters reported in section 4.2,5.2, Social performance, of this reportreport. 13.2.114.2.1 Engaging our employees
In 2014 we implemented a team-focused quarterly survey called My Accelerate! Survey (MAS). In 2015, 76% of respondents agreed with the transformation journey statement: ‘In my team we role model the Philips behaviors’. There was also an increase in areas concerning ‘Speed of decision making’, resulting in an overall engagement score of 71% favorable answers across the Philips population. We also noted that, compared with 2014, we maintained a strong favorable engagement score and saw a significant decrease in the unfavorable score (from 17% down to 7%). The MAS indicates very high favorable scores within the set of questions referring to Alignment (‘How clear are we about customer needs and business priorities?’) and Execution (‘How good are we at getting things done?’) at 81% and 74% favorable respectively. An area for improvement is in the questions referring to Renewal (‘How do we stay effective and adapt?’). Improvement initiatives to address these are driven at the team level via Team Performance Dialogues, and we continue to monitor our overall engagement results in Leadership Team quarterly reviews. 14.2.2 People development The creation of Philips University reflects our Accelerate! transformation, driven by our growth and performance culture, as well as our belief that everyone has talent and can grow and contribute with increasing impact. Philips University offers world-class learning interventions to help our people develop critical capabilities, and it does so in a simplified, standardized and innovative way, with one central Learning Management System accessible to all employees. Annual Report 2015 219
Sustainability statements 14.2.2 In 2015, more than 800 new courses were made available in the Philips University. By year-end, more than 55,000 unique employees had enrolled for courses in the Philips University. In total, more than one million hours were spent on training through Philips University in 2015, with more than 450,000 training completions. Some of the most popular programs included our Philips Excellence e-learnings, which are being rolled out to all employees as part of our ongoing commitment to operational excellence. Our belief in an inclusive culture was also embedded in our Philips University programs. The Leadership Academy continued to emphasize inclusion in key programs such as ‘Next Generation Women’s Leadership’, ‘Leading Across Cultures’, and ‘Inclusive Leadership.’ Our learning philosophy is likewise inclusive: all our employees have access to content such as the award-winning Harvard Manage Mentor leadership suite, and in 2015 more than 21,000 learners were registered (up from 9,000 in 2014). Philips University continued to be a key catalyst for transformation and change in 2015, with ongoing support for our end-to-end Accelerate! programs. To support the embedding of our end-to-end ways of working, many engineers and architects, sales and account managers and supply chain employees have been trained and have gone through certification paths, gained new capabilities and brought new ways of working to their daily work. Newly developed Marketing education programs are being rolled out globally with active involvement of leaders as trainers, certified coaches and strong alignment to business and individual development plans. Other programs At Philips, our vision to offer the best place to work for people who share our passion is not limited to employees on our payroll. In the Netherlands, for example, we run a special employment program, WGP (Werkgelegenheidsplan, or Philips Employment Scheme), to offer vulnerable groups of external jobseekers a work experience placement, usually combined with training. Since its launch in 1983, more than 12,500 people have participated, and around 70% find a regular job after taking part in the program. In 2015, Philips employed 140 people via the WGP program, including 19 people with autism. As we move into 2016, we will continue to offer an environment for all of our people to thrive and grow. 14.2.3 Global talent acquisition Top sources of talent Philips’ talent management approach is to build and develop our existing employees continuously, while strategically buying talent where critical capabilities need to be strengthened to achieve our strategic objectives. In 2015, our global Talent Acquisition team recruited talent both internally and externally, hiring over 11,000 people including interns. As in the years before, nearly one third of those vacancies were filled with internal candidates, and the remainder filled with qualified talent from the external labor market. Further strengthening in-house executive recruitment Executive Search Services (ESS), Philips’ in-house executive recruiting services unit, delivered 72 high-quality senior-level hires in 2015 (over 80% of external executives were placed by the ESS team rather than using external search firms, saving over EUR 5 million for Philips). ESS provides services such as demand-based executive recruiting, executive intelligence & talent consulting services, and executive-specific referral and onboarding programs. The further strengthening of this focused in-house recruiting capability ensures we are able to attract the right profiles into our most business-critical positions. A strong global employer brand with local relevance in the digital age Philips knows that it is crucial to attract the best talent in order to deliver on our strategic goals. In 2015, we strengthened our employer brand in our growth markets through dedicated resources and local activations. We also narrowed our focus and strategic recruitment marketing investments on the most critical talent segments that will drive our transformation and growth. For example, Philips launched a digital employer brand campaign that raised awareness and generated preference for Philips as an employer among Engineering, Quality, Marketing and Sales professionals. The campaign is running across key social and digital media channels in 33 countries. As part of our global Talent Acquisition strategy, we seek to attract talent from proven high-quality sources. In 2015, the top five sources of hire were: Philips employee referral – Historical data has proven that our top-performing hires are those referred by our own employees. We engage our employees to share their network through a formal employee referral program, which generates close to 30% of our total hires each year. Internal hire – Part of our Accelerate! transformation is a stated cultural imperative to embed a growth and performance culture and facilitate a mobile, diverse workforce. As a result, we fill nearly one third of our vacancies with internal top performers each year. Proactively sourced by recruiter – Our dedicated in-house sourcing function focuses solely on building proactive talent pipelines and requires all recruitment professionals to contribute to the proactive identification of passive industry talent. | • | | Digital career channel (employee review sites, social media sites, online community groups, etc.) – In line with our overall focus on increasing our digital footprint, our recruitment marketing team continued to invest in Philips’ social employer brand and recruiting activations in 2015, but took a more targeted approach. As a result, we further improved |
220 Annual Report 2015
Sustainability statements 14.2.3 | our online reach and delivered over 2,200 hired candidates. Channel-specific indicators included an increase of 3.2% in the Philips Talent Brand Index on LinkedIn and positive trends in our Glassdoor.com employee ratings since late Q3 2015. For employer brand updates and company content, visit thePhilips LinkedIn Careers page |
Philips careers website – Our career website attracts talent by emphasizing our Employer Value Proposition through targeted information sharing and storytelling from our employees and leadership teams. The Philips global career website can be found atwww.philips.com/careers. 14.2.4 Health and Safety performance In Philips, Health and Safety performance has continued to improve. A number of sites showed outstanding safety performance, for example the Healthcare Pune site in India reached a significant milestone by achieving over 3 million man-hours without a Lost Workday Injury Case (LWIC) by the end of 2015 (over 3 years without an accident). In Glemsford, UK, Consumer Lifestyle implemented a Lean Behavior Based Safety program resulting in significant improvement in both incident statistics and overall safe behavior for the entire site. It is viewed as an internal best practice program with plans to be deployed globally at all manufacturing units within Philips beginning in 2016. Philips Group Lost workday injuriesper 100 FTEs 2011 - 2015 | | | | | | | | | | | | | | | | | | | | | | | | | | | | | 2011 | | | 2012 | | | 2013 | | | 2014 | | | 2015 | | | | | | | Healthcare | | | 0.20 | | | | 0.22 | | | | 0.19 | | | | 0.20 | | | | 0.19 | | Consumer Lifestyle | | | 0.23 | | | | 0.25 | | | | 0.24 | | | | 0.12 | | | | 0.13 | | Lighting | | | 0.67 | | | | 0.47 | | | | 0.42 | | | | 0.37 | | | | 0.34 | | Innovation, Group & Services | | | 0.04 | | | | 0.05 | | | | 0.04 | | | | 0.02 | | | | 0.03 | | | | | | | Continuing operations | | | 0.38 | | | | 0.31 | | | | 0.27 | | | | 0.23 | | | | 0.21 | | Discontinued operations | | | 0.59 | | | | 0.55 | | | | 0.37 | | | | 0.25 | | | | 0.27 | | | | | | | Philips Group | | | 0.38 | | | | 0.31 | | | | 0.28 | | | | 0.23 | | | | 0.22 | | | | | | |
Lighting Lighting achieved a substantial reduction in reported incident rates in recent years. In 2015, the number of LWIC decreased to 119, compared with 132 in 2014. The LWIC rate decreased to 0.34, compared with 0.37 in 2014. The number of Lost Workdays stayed on a similar level with 4,832 days in 2015 due to longer-term absences in a few cases. One major achievement was a zero level of LWIC at 7 significant industrial units (over 100 FTEs) in 2015. Efforts are being continued to further reduce accident rates by focusing on injury prevention. The injury prevention framework was launched in the course of 2015 and is being integrated in the operational Lean framework. It will continue in 2016. Healthcare Healthcare Health and Safety performance showed a slight improvement in 2015. The number of LWIC decreased to 69 compared with 72 in 2014. The LWIC rate improved to 0.19 compared with 0.20 in 2014. The total number of Lost Workdays remained stable at 2,240 days compared to 2,242 days in 2014. The Healthcare Field Service Organization (FSO) became the main contributor to the number of LWICs of the sector, which is 54% of the sector total. The number of LWICs increased to 37 from 31 in 2014, the number of Lost Workdays in the FSO increased to 58% of the sector total compared with 33% in 2014. Continued focus on a formalized FSO Health and Safety global structure and an increase in standardized safety program deployment are among the improvement actions for 2016. A major achievement in Healthcare for 2015 was a zero level of LWIC at 13 industrial sites. Consumer Lifestyle Consumer Lifestyle showed a stable number of 21 LWIC compared to 2014. The LWIC rate increased slightly, by 4% compared to 2014, to a level of 0.13. The number of Lost Workdays decreased considerably, from 1608 to 649 days as recovery periods shortened. One major achievement was a zero level of LWIC at 8 of the Consumer Lifestyle industrial units, which is 50% of the total number of Consumer Lifestyle industrial units. 14.2.5 General Business Principles The analysis is based upon 335 concerns reportedIn 2015, 447 GBP complaints were filed via the formalPhilips Ethics Line and the GBP procedure in 2013 relating to alleged violationsCompliance Officers.
Compared with 2014 (393 complaints), this represents an increase of the General Business Principles (GBP), compared to 374 in 2012.14%. The decreaseThis upward trend in the overall number of concerns reported can mainly be attributed primarily to a decrease in the Americas. We see a slight decrease in percentage of reportedsignificantly more concerns in North America, which accounted for 43% of all concerns (2012: 47%), and a continued decrease in concernsbeing reported in Latin America (2013: 17%; 2012: 21%, 2011: 32%).APAC and EMEA. In Europe and the Middle East show a stable 15%(24% of the total) (2014: 18%) there was an upward trend in terms of relative and absolute numbers. The number of complaints in the Asia Pacific region (20% of the total) increased compared with 2014 (17%). Latin America fell back down to 25% of the total number of reported concerns (2012: 15%reports (2014; 30%, 2013: 17%), whilst in North America although the percentage declined the absolute number of complaints remained stable, accounting for 31% of the total number in 2014 (2014: 35%). Only
This year, for the first time since Philips started operating an ethics hotline, the dominance of the Americas seems to be giving way to a more equal spread between the four regions, due to a continued increase in the number of complaints in Europe, the Middle East and the Asia Pacific region, which accounted for 25% of all concerns, shows a notable andregion. We believe this continuing increase in reports (2012: 18%). The continuing dominance in North America we believe is due to a corporate culture in which employees are very much awarebe the result of compliance issues,the ongoing intensive communication campaigns to improve employees’ awareness across the globe of their rights with regard to the GBP, and the opportunities for reporting potential violations. The continuing increase in the Asia Pacific region we believe is the consequence of our efforts in that regionfacilities available to strengthen our corporate culture in the area of ethics and compliance.them. Annual Report 2015 221
Sustainability statements 14.2.5 Most common types of concerns reported concerns Treatment of employees The most commoncommonly reported concern remainsstill related to the Treatment of employees category,category. 242 concerns were reported, which represented 61%54% of all reports (2012: 55%(2014: 52%). As While not as evident as in 2012,2014 (81%), the vast majority (64%) of the Treatment of employees concerns (81%) remainsstill related to two issues – Equal and fair treatment and Respectful treatment. Concerns regarding Equal and fair treatment – primarily favoritism, discrimination and unfair treatment – originated principally inthat fell into the US. Of the concerns reported in the US, 39% related to equal and fair treatment, whereas that figure was 24% for Philips. Most concerns regarding lack of Respectful treatment –category related primarily to verbal abuse, (sexual) harassment and a hostile work environment, – again come fromwhilst concerns in the US. Equal and fair treatment category related primarily to favoritism, discrimination and unfair treatment. Almost 40% of the reports in these two categories originated in North America, with a further 36% being reported in Latin America.
Of the concerns reported66 cases in the US, 33%‘Other’ category, the majority related to respectful treatment; comparedHR procedural issues, e.g. related to 25% for Philips as a whole.salary payment. Business integrity In second place, with 33% of the total number of138 reports are(31%), were concerns reported in the Business integrity‘Business Integrity’ category (2012: 32%(2014: 28%). MostThe majority (40%) of these concerns (60%originated in APAC, followed by Europe and the Middle East (31%), Latin America (16%) in this category originate in the Asia Pacific region. Followed by the regionsand North America and Europe and Middle East (both 17%) and Latin America (7%(13%). More information on these categories can be found in the GBP Directives on atwww.philips.com/gbp.gbp. Substantiated/unsubstantiated concerns Out of the 447 concerns reported in 2015, 180 are still pending closure, in particular those that were filed towards the end of the year. The table below shows a comparison between those concerns which, after investigation, could be substantiated and those that could not. This year the investigations into 267 concerns were finalized (2014: 260). Of these concerns 32% were substantiated after investigation. The most notable increase was in the ‘Employee treatment’ category, where 39% of the concerns were substantiated (2014: 22%, 2013: 20%). The most notable decrease was in the ‘Business Integrity’ category, with only 21% of concerns being substantiated (2014: 36%, 2013: 50%). Out of the reported concerns that were substantiated, i.e. concerns for which there was found to be a breach of our General Business Principles, 52 were followed up with disciplinary measures varying from termination of employment and written warnings to training and coaching. In other cases, corrective action was taken, which varied from strengthening the business processes to increasing awareness of the expected standard of business conduct. Philips Group Classification of the concerns investigatedin number of reports 2013 - 2015 | | | | | | | | | | | | | | | | | | | | | | | | | | | | | | | | | 2013 | | | 2014 | | | 2015 | | | | | | | | | | substantiated | | | unsubstantiated | | | substantiated | | | unsubstantiated | | | substantiated | | | unsubstantiated | | | | | | | Health & Safety | | | — | | | | 2 | | | | 1 | | | | 7 | | | | 3 | | | | 4 | | Treatment of employees | | | 33 | | | | 136 | | | | 32 | | | | 112 | | | | 62 | | | | 95 | | Legal | | | 2 | | | | 2 | | | | 4 | | | | 9 | | | | 4 | | | | 9 | | Business Integrity | | | 32 | | | | 32 | | | | 25 | | | | 45 | | | | 16 | | | | 62 | | Supply Management | | | — | | | | 3 | | | | 1 | | | | — | | | | — | | | | 1 | | IT | | | 3 | | | | 1 | | | | 2 | | | | — | | | | — | | | | 2 | | Other | | | — | | | | — | | | | 4 | | | | 18 | | | | 1 | | | | 8 | | | | | | | Total | | | 70 | | | | 176 | | | | 69 | | | | 191 | | | | 86 | | | | 181 | | | | | | |
Philips Group Breakdown of reported GBP concernsin number of reports 2011 - 2015 | | | | | | | | | | | | | | | | | | | 2011 | | | 2012 | | | 2013 | | | 2014 | | | 2015 | | | | | 2009 | | | 2010 | | | 2011 | | | 2012 | | | 2013 | | | | | | Health & Safety | | | 6 | | | | 3 | | | | 2 | | | | 11 | | | | 3 | | | | 2 | | | | 11 | | | | 3 | | | | 10 | | | | 9 | | | | | | | | Treatment of employees | | | 162 | | | | 184 | | | | 132 | | | | 205 | | | | 203 | | | | 132 | | | | 205 | | | | 203 | | | | 203 | | | | 242 | | - Collective bargaining | | | — | | | | 1 | | | | — | | | | 1 | | | | 5 | | | | — | | | | 1 | | | | 5 | | | | — | | | | — | | - Equal and fair treatment | | | 63 | | | | 64 | | | | 41 | | | | 72 | | | | 80 | | | | 41 | | | | 72 | | | | 80 | | | | 72 | | | | 44 | | - Employee development | | | 3 | | | | 1 | | | | — | | | | — | | | | 4 | | | | — | | | | — | | | | 4 | | | | — | | | | 2 | | - Employee privacy | | | 2 | | | | 2 | | | | 1 | | | | 1 | | | | 1 | | | | 1 | | | | 1 | | | | 1 | | | | 3 | | | | 8 | | - Employee relations | | | 15 | | | | 4 | | | | 1 | | | | 2 | | | | 5 | | | | 1 | | | | 2 | | | | 5 | | | | 6 | | | | — | | - Respectful treatment | | | 53 | | | | 96 | | | | 71 | | | | 102 | | | | 84 | | | | 71 | | | | 102 | | | | 84 | | | | 93 | | | | 111 | | - Remuneration | | | 22 | | | | 12 | | | | 6 | | | | 15 | | | | 15 | | | | 6 | | | | 15 | | | | 15 | | | | 11 | | | | 9 | | - Right to organize | | | — | | | | — | | | | — | | | | 1 | | | | — | | | | — | | | | 1 | | | | — | | | | — | | | | — | | - Working hours | | | 4 | | | | 4 | | | | 2 | | | | — | | | | 3 | | | | 2 | | | | — | | | | 3 | | | | 5 | | | | 2 | | - HR other | | | — | | | | — | | | | 10 | | | | 11 | | | | 6 | | | | 10 | | | | 11 | | | | 6 | | | | 13 | | | | 66 | | | | | | | | Legal | | | 4 | | | | 13 | | | | 10 | | | | 19 | | | | 9 | | | | 10 | | | | 19 | | | | 9 | | | | 30 | | | | 35 | | | | | | | | Business Integrity | | | 88 | | | | 112 | | | | 107 | | | | 119 | | | | 109 | | | | 107 | | | | 119 | | | | 109 | | | | 110 | | | | 138 | | | | | | | | Supply management | | | 4 | | | | 4 | | | | 3 | | | | 3 | | | | 5 | | | | 3 | | | | 3 | | | | 5 | | | | 6 | | | | 6 | | | | | | | | IT | | | — | | | | — | | | | — | | | | — | | | | 6 | | | | — | | | | — | | | | 6 | | | | 7 | | | | 4 | | | | | | | | Other | | | 54 | | | | 22 | | | | 15 | | | | 17 | | | | — | | | | 15 | | | | 17 | | | | — | | | | 27 | | | | 13 | | | | | | | | | | | Total | | | 318 | | | | 338 | | | | 269 | | | | 374 | | | | 335 | | | | 269 | | | | 374 | | | | 335 | | | | 393 | | | | 447 | | | | | | | |
Substantiated versus unsubstantiated concerns14.2.6 The Philips Foundation
Although 89The Philips Foundation was established in 2014 and is a registered charity with the goal to make a difference in the communities and lives of those in most need. The
222 Annual Report 2015
Sustainability statements 14.2.6 Philips Foundation seeks to make use of the 335 GBP concerns reported in 2013 are still pending (especially those lodged duringexpertise of partners, visionaries and innovators and the last three monthsinnovation capabilities of Philips to create lasting impact. Over 2015, the Foundation has developed a firm program based on the strategic pillars of community development, disaster relief and social entrepreneurship activities. Philips supported the program of the year),Philips Foundation with a donation of EUR 10 million in 2015 and provides the tableoperating staff, in kind and the expert support of investigated concerns provides an initial indicationover 200 skilled employees who support the Foundation’s program for part of their time. The Philips Foundation has established global innovation partnerships with UNICEF and the Red Cross. The partnership with the Red Cross focuses on exploring innovations that could assist in providing immediate relief to people in regions affected by humanitarian crises including natural disasters. The Philips Foundation has partnered with the Netherlands Red Cross and the Ivory Coast Red Cross on a project in Ivory Coast to strengthen the resilience of a community in the Blolequin region with a focus on the health of mothers and children. The Philips Foundation and UNICEF have partnered to develop healthcare innovations for the first 1000 days of children’s lives. The Philips Foundation is supporting UNICEF’s Global Innovation Center and is a lead partner in the Kenya Maker for Maternal, Newborn and Child Health Project in Nairobi, which is focused on developing and deploying solutions and new business models that improve access to healthcare for mothers and their children in low-resource settings. In addition, around 30 local projects have been approved to be set up throughout the world, often with local NGOs as partners and are supported and channeled through the Philips Foundation. These projects offer employee engagement opportunities including skilled expert volunteering. Philips employees are further engaging in a variety of fundraising activities, including the global initiative ‘Make the difference: a quarter of giving’. Employee donations were also a large part of the Philips Foundation’s response to the earthquake in Nepal in April 2015, the floods in Southern India in December 2015, and to the Refugee Crisis in Europe and the Middle East. The Foundation coordinated and matched employee gifts as well as providing in-kind donations of relief goods. In total, Philips employees donated some EUR 225,000 to disaster relief and related projects, which the Foundation matched to EUR 450,000. More information about the Philips Foundation, its purpose and scope as well as the Philips Foundation Annual Report 2014 can be foundhere. Examples of innovation projects supported by the Philips Foundation Philips Community Light Centers provide solar powered lighting to communities that are not connected or are underserved by the grid, thus providing opportunities for local civilians to improve their social and economic well-being. Philips had installed over 100 Community Light Centers across Africa by the end of 2015, each typically lighting an area comparable to a full-size soccer pitch. Over the years, Philips has partnered with many organizations to optimize the benefits of light, for example by facilitating access to education, health and sanitation. A key partnership utilizing the Community Light Center concept is with KNVB (the Royal Dutch Football Association) and its World Coaches program that aims to train young people in key life skills such as sanitation, HIV prevention and crime prevention. The Philips Foundation is supporting the continuity of this program by ensuring maintenance and sustained ownership of installed set ups. The prevalence of cardiovascular heart disorders in the young population of Turkey has been noted as the highest in all of Europe. Between 13,000 and 14,000 children are born each year with congenital heart disorders. Most of these children have no access to medical treatment. Supported by the Philips Foundation, the Little Hearts Project aims to create healthier generations by raising awareness of heart disorders, providing early diagnosis and treatment, and improving children’s access to preventive health services. As part of the project, 180,000 children will receive heart scans in Southeastern Anatolia, in Turkey. Philips receives support for the project from the Turkish Heart Association and the Turkish Ministry of Development. Community involvement of Philips employees In North America, thePhilips Cares program provides ways for employees to work together to improve people’s lives by creating healthy, sustainable communities that contribute to the success and well- being of future generations. This can take many forms: from helping a child to excel in math, or providing safety and energy-efficient home improvements for the disadvantaged, to raising awareness about the importance of cardiac health. In 2015 alone, more than 5,000 employee volunteers participated in community outreach projects that suited their needs, schedules, and passions individually as well as through partnerships with organizations such as the American Heart Association, Rebuilding Together, and the March of Dimes. 14.2.7 Stakeholder Engagement Working in partnerships is crucial in delivering on our vision to make the world healthier and more sustainable through innovation. A number of substantiated concerns compared to the number of concerns which, upon investigation, could not be substantiated. Out of the 246 concerns investigated, it was found that roughly one quarter (28%) were justified, comparable with 2012 (26%).our partnerships are described below.
Annual Report 2013 2272015 223
13 Sustainability statements 13.2.1 - 13.2.214.2.7
Strategic Partner of the World Economic Forum Philips is a strategic partner of the World Economic Forum. With regardits mission of “improving the state of the world”, the Forum engages the foremost political, business and other leaders of society to concerns regarding Treatmentshape global, regional and industry agendas. Philips is a main contributor to the WEF’s content agenda, as a member of employees, there wasseveral of its Industry Groups, Global Challenge Initiatives as well as Global Agenda Councils. Philips executives engaged as discussion leaders in numerous panels and were present in all of the regional meetings, in addition to the Annual Meeting in Davos. As a notable increasenew initiative, Philips and the International Committee of the Red Cross jointly hosted a dinner dialogue meeting during the Annual Meeting in Davos. Around 20 key opinion leaders in healthcare from around the world, representing government, business, international organizations, academia and civil society, shared their thoughts on the topic ‘Strengthening health systems through collaboration and innovation’. Cross-sector collaboration to drive the Circular Economy transformation To create a sustainable world, Philips believes the transition from a linear to a circular economy (CE) is essential. A circular economy aims to decouple economic growth from the use of natural resources and ecosystems by using those resources more effectively. To promote cross-industry and cross-sector collaboration, Philips joins forces with thought leaders and conveners. One such initiative is Project Mainstream, driven by the Ellen MacArthur Foundation, the WEF and McKinsey. Frans van Houten is on the Steering Board and leads the work stream Asset-tracking. This project addresses the outer circle of the circular economy concept, the material streams where significantly more traction is needed to scale up to mainstream business and improve material quality. A Research team has developed a white paper to describe innovation opportunities to address CE challenges. The paper has been widely distributed internally to all Philips businesses to stimulate innovation activities across the company. Sustainable Development Goals Philips aspires to be a major private sector contributor to the Sustainable Development Goals (SDGs) that were launched during the UN General Assembly in New York in September 2015. The SDGs provide an integrated development agenda that addresses the interdependence between economic, environmental and social elements of sustainable development. As a key enabler of any development agenda that aims for scale and impact, private sector involvement is recognized as a vital element of the SDG agenda. Good health and access to energy are drivers and outcomes of sustainable development and Philips is committed to working closely with all relevant stakeholders to provide healthcare and energy-efficient solutions to address the issues of health, energy and governance. This is a natural expression of our commitment to improve the lives of billions of people around the world. Every Woman Every Child pledge Philips has pledged its support to the United Nations’ “Every Woman, Every Child” global initiative and commits to improve the lives of at least 100 million women and children in sub-Saharan Africa and South East Asia by 2025. Philips’ efforts are focused on strengthening local healthcare infrastructures, developing solutions for healthier and safer living, and promoting healthy and nutritious diets for mothers and children. In 2015, we conducted a study to understand the needs and aspirations related to breastfeeding for working mothers in Africa. We especially focused on the barriers to breastfeeding and on how innovation can empower working African mothers to continue breastfeeding at the levels recommended by the WHO. The study has yielded a lot of valuable insights, both for Philips as well as the international development community, which we are now converting into an innovation agenda. On World Pneumonia Day, Philips announced the introduction of a new device to help diagnose fast breathing in children. Fast breathing is a key vital sign in the numberdiagnosis of justified concernschildhood pneumonia, which is the main infectious-disease cause of death among children under the age of 5, in low-resource countries. The Children’s Automated Respiration Monitor is aimed to 20%help improve the accuracy of the total numberdiagnosis, and subsequently the treatment of concernspneumonia, potentially preventing many of the 935,000 childhood deaths caused by pneumonia each year. The monitor has been specifically designed for appropriate usage in low resource settings, making it easy to use, power independent and affordable and will assist health workers, in all levels of care, in automatically establishing an accurate breath rate. Collaborating on locally relevant innovation in Africa The Philips Africa Innovation Hub in Nairobi, Kenya, is our base for creating locally relevant innovations and business models. The Innovation Hub employs African talents and operates on the concept of open innovation, working in close collaboration with the R&D ecosystem of Kenya and Africa. In order to strengthen primary care in communities, it developed the concept of Community Life Centers (CLCs), a community hub where technology is bundled with services: solar power, indoor and outdoor LED-lighting, healthcare equipment, laboratory equipment, refrigeration, IT-solutions and water supply and purification. In 2014, the first center was opened in Kenya, which now delivers two babies per day, and receives 13 times more patients than before. Key for success was close co-creation with the local government and involvement of community members. 224 Annual Report 2015
Sustainability statements 14.2.7 CLC was realized in close public-private partnership with the County Government of Kiambu in Kenya. We also involved community members in the assessment and design in order to create ownership. Healthcare workers at the site were empowered through clinical coaching and education. Philips entered a partnership with the South-Africa based non-profit organization PET (PowerFree Education Technology) to further develop, test and commercialize a Wind-Up Doppler Ultrasound Fetal Heart Monitor, a unique, power-independent clinical innovation aimed at addressing the high rates of preventable infant mortality across Africa, designed specifically for low-resource settings. Further developed by the Philips Africa Innovation Hub, the Wind-up Fetal Doppler is a device to detect a slowing of the fetal heart rate while the mother is in labor, an important indicator that the fetus is not receiving enough oxygen and may suffer brain damage or die. If this category, backis detected early enough, a midwife or delivering nurse can take the necessary actions to save the child. Philips and the Medical Credit Fund, part of the PharmAccess Group, started a partnership to improve access to quality health care in Africa. Through the partnership small and medium-sized private clinics in Africa will have access to financing for innovative medical technologies and services from Philips, which is often difficult to obtain from banks due to the level of 2011 (2012: 13%, 2011: 21%). In the other major category, i.e. the investigated concernshigh investment risks. The Medical Credit Fund works with African banks to provide these clinics with affordable loans, combined with management training and a quality improvement program, which enhances trust in the Business integrity category, the percentage of concerns that was justified increased considerably to 50% (2012: 42%).
A range of disciplinaryclinics among both patients and corrective measures have been implemented as a result of established violations of the General Business Principles, ranging from dismissal and written warnings to awareness training sessions and organizational measures.financial institutions.
Classification of the concerns investigated
| | | | | | | | | | | | | | | | | | | | | | | | | | | | | | | 2011 | | | | | | 2012 | | | | | | 2013 | | | category | | substantiated | | | unsubstantiated | | | substantiated | | | unsubstantiated | | | substantiated | | | unsubstantiated | | Health & Safety | | | — | | | | 2 | | | | 2 | | | | 7 | | | | — | | | | 2 | | Treatment of employees | | | 18 | | | | 68 | | | | 22 | | | | 150 | | | | 33 | | | | 136 | | Legal | | | — | | | | 5 | | | | 5 | | | | 8 | | | | 2 | | | | 2 | | Business Integrity | | | 33 | | | | 43 | | | | 37 | | | | 51 | | | | 32 | | | | 32 | | Supply Management | | | 2 | | | | 1 | | | | 1 | | | | — | | | | — | | | | 3 | | IT | | | — | | | | — | | | | — | | | | — | | | | 3 | | | | 1 | | Other | | | 3 | | | | 5 | | | | 11 | | | | 4 | | | | — | | | | — | | | | | | | Total | | | 56 | | | | 124 | | | | 78 | | | | 220 | | | | 70 | | | | 176 | |
13.2.2 Supplier indicatorsWorking on global issues
In addition2015, a number of important developments and events took place in the areas of sustainable development and climate change. At Philips we continued and expanded existing initiatives and partnerships. The events and conferences included Climate Week NYC in New York, and COP21, the United Nations Climate Change Conference in Paris, where we joined world leaders and made a commitment to become carbon-neutral by 2020, regarding our greenhouse gas emissions from manufacturing and non-manufacturing operations, business travel and logistics. It was encouraging to see that the Global Energy Efficiency Accelerator Platform, which runs under the UN’s SE4All program (and of which we are a co-founder), is gaining traction. This program, built with the lighting sector transition and the en.lighten initiative as an example, now covers the entire spectrum of energy efficiency sectors, and works with a growing number of (sub)national governments. With The Climate Group, the global ‘LED city consultation program’ that was initiated at WEF in Davos two years ago, launched a landmark study ‘The Big Switch’ at Climate Week NYC, summarizing the learnings and insights from the workshops held across the world over the last two years. We expect that this work will lead to a further acceleration of the transition to (connected) LED street lighting in cities in all regions. During 2015 we participated as global patron sponsor in the UNESCO-led International Year of Light, where our main messaging focused on the need to eradicate light poverty by 2030. It is our aim to continue our work in this area so that the currently 1.1 billion people who lack access to electricity will be able to benefit from the socio-economic development opportunities that will be unlocked once solar LED lighting is available to them. Innovation Experience Philips organized Innovation Experiences in 2015 in Sao Paolo, Sydney, Singapore, Jakarta, Milan, Buenos Aires, and Johannesburg, which were attended by over 2,200 journalists, customers, scientists, partners and employees. At the events Philips explored how technology can make our homes healthier and more tailored to our lifestyles, how cloud-based solutions can provide care across the health continuum and connect the patient from the hospital to their home, and how personalized digital solutions can help people living with disabilities or chronic diseases manage their condition from the comfort of their own sustainability activities, wehome. We firmly believe that these challenges can only be addressed through Open Innovation and constructive dialogue with all stakeholders involved. Philips also engage our supplierssponsored the Dutch Pavilion at the World Expo 2015 in Milan, Italy, with an installation focused on healthy farming, healthy cooking, and their suppliers toward better sustainability practices. To that end, we are active in various supply chain initiatives around the world.healthy living. 14.2.8 Supplier indicators Philips has a direct business relationship with approximately 10,000 product and component suppliers and 30,000 service providers. Givenproviders, and in many cases the size and complexity ofsustainability issues deeper in our supply chain we needrequire us to focusintervene beyond tier 1 of the chain. Managing our efforts. Therefore, we developed anlarge and complex supply chain in a socially and environmentally responsible way requires a structured and innovative approach based onwhile being transparent and engaging with a wide variety of stakeholders. Insights gained through the supplier’s sustainability risk profile related to spend, country of production, business risk and type of supplier relationship. The risk profile isstakeholder engagement process are used to select suppliers for inclusion indevelop our supplier sustainability audit program, conflict minerals, hazardous substance management and IDH Electronics program.strategy. We then translate this strategy into dedicated programs. Annual Report 2015 225
Sustainability statements 14.2.8 Philips Supplier Sustainability Declaration The Philips Supplier Sustainability Declaration is based on the EICC Code of Conduct and in line with our General Business Principles, we added requirements on Freedom of Association and Collective Bargaining.Principles. The topics covered include labor and human rights, worker health and safety, environmental impact, ethics, and management systems. We monitor supplier compliance to the Declaration through a system of regular audits. In 2012 we updated the Philips Supplier Sustainability Declaration, in line with the new version of the EICC Code of Conduct. In 2013, weWe rolled-out the updated Declaration via the new purchasing contracts signed with suppliers, and via all trainings and audits done per January 1, 2013. The updated Declaration includes 4 entirely new provisions, and 14 updates to existing provisions. The new provisions are related to responsible sourcing of minerals, protection of privacy, non-retaliation, and supplier responsibility to monitor code compliance at next tier suppliers.audits.
The Declaration requires suppliers to cascade the EICC Code down to their next tiernext-tier suppliers. Suppliers must regard the Code as a total supply chain initiative and, at a minimum, also require its next tiertheir next-tier suppliers to acknowledge and implement the Code. This roll-out to deeper levels 2015 supplier audits in the supply chain is reviewed during the on-site audits, where it is assessed how requirements have been communicated to the next tier suppliers and whether there is an effective process in place to ensure that the next tier suppliers implement the Code. Risk suppliers with who we have a direct business relationship are included in the supplier sustainability audit program, and most of these are tier 1 suppliers. However, sometimes Philips also selects and prescribes the tier 2 suppliers, in which case these tier 2 suppliers will also be included in the audit program.
Supplier Sustainability Audit Program
We monitor supplier compliance with the Declaration through a system of regular audits. During these audits, an independent external party visits the supplier’s site for several man-days to hold interviews with workers and management, do a factory tour, and review documentation. Based on their risk profile, 572 risk suppliers are included in the supplier audit and development program; the majority of these are in China. During the audits, compliance with all sections of the Declaration is reviewed. In the event of non-compliance (NC) we require suppliers to make a corrective action plan, and we monitor its implementation until all major NCs are resolved. Full-scope audits are conducted in a 3-year cycle; to date we have audited 90% of all identified risk suppliers.
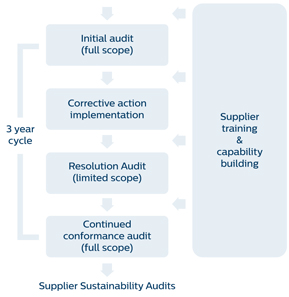
2013 Auditscountries
In 20132015, we audited 200195 of our current risk suppliers, including 131120 continued conformance audits with suppliers that we had already audited in 2010. Risk suppliers from recently acquired companies are also included, and this year we audited 27 suppliers from the acquisitions of Povos and Preethi.2012. As in previous years, the majority of the audits were done in China. AlsoThere were also audits performed in Brazil, India and Mexico audits were done, as well as aMexico. A small number of audits took place in Belarus, Dominican Republic, Indonesia, UkrainePhilippines, Russia and Vietnam.Ukraine. With these audits we directly or indirectly impacted over 110,000almost 116,000 workers employed at the production sites that were audited. On top of the audits with current risk suppliers, we also audited 5926 potential suppliers during the supplier selection process. These potential suppliers need to close any zero-tolerance issues before they can start delivering to Philips. Below we report on the findings at existing suppliers only; findings at potential suppliers are not included in this report since these suppliers are not (yet) part of Philips’ supply base. 228 Annual Report 2013
13 Sustainability statements 13.2.2 - 13.2.2
To track improvements Philips measures the ‘compliance rate’ for the identified risk suppliers, being the percentage of risk suppliers was audited within the last 3 years and don’tdo not have –- or have resolved all –- major NCs. During 20132015 we achieved a compliance rate of 77% (2012: 75%86% (2014: 86%). 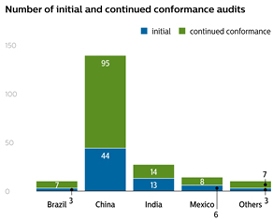
Per January 2013 we rolled out an updated version of the Philips Supplier Sustainability Declaration and audit checklist. Philips follows the EICC classification for distinguishing major and minor NCs, and in the new audit checklist the classification of what is a major and what is a minor NC changed for several topics. This explains some of the differences in audit findings 2013 compared to 2012.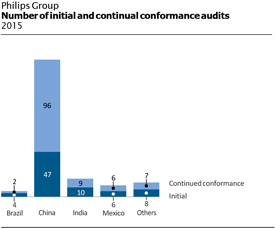
Audit findings BelowThe table below shows the results of the full scope audits done during 2013.2015; potential suppliers are not included. When the audit reveals areas of non-compliance we request suppliers to implement corrective actions and our sustainability experts and independent third partythird-party auditors monitor the implementation during resolution audits. The results of the resolution audits are not included in the table below.table. Four suppliers proved outstanding performance during their initial audit, without NCs found.
Positive trends comparedTo prevent audit fatigue and limit the burden of audit preparation and follow-up at a single supplier site, Philips has agreed with some of the other EICC members to last yearshare audit results. This eliminates the need for multiple audits and enables a stronger focus on corrective actions and their follow-up.
Most frequent areas of non-compliance in 2015: Occupational safety (NCs down 29%)Certified Management System (ISO9001, ISO14001, and OHSAS18001) Working hours (on average 22% less NCs in 2013)Emergency Preparedness Emergency preparedness (NCs down 8%)Working Hours Wages and benefits (NCs down 8%)
Above topics belong to the most frequently observed areas of non- compliance and therefore, during our supplier development activities and visits we have paid more attention to these topics in 2013.
Negative trends compared to last year
Business integrity (NCs up 28% – no training provided for employees)
Freely chosen employment (NCs up 11% – workers paying deposits)
Child labor prohibition/young worker management (NCs up 10% – young employees working overtime)
Above increases we believe are mostly the result of more stringent criteria in the new EICC audit checklist.
Management systems
There may be areas where our audits reveal compliance in actual practice, but the related underlying management systems to safeguard continued compliance may not be sufficient. Therefore, also management systems are reviewed during the audits. Although the 2013 audits show improvements compared to previous years, we see this as a continued weak area at suppliers where further capacity building is necessary. Related to management systems the most frequently observed NCs are a lack of third-party certified management systems, supplier responsibility (EICC Code requirements have not been communicated to the next tier suppliers), insufficient management accountability and responsibility, and absence of improvement objectives.
226 Annual Report 2013 2292015
13 Sustainability statements 13.2.2 - 13.2.214.2.8
Philips Group Summary of 2013 initial and continued conformance2015 audit findings per region suppliers with one or moreSuppliers without any major non-compliances per category (in % of suppliers audited in 2013)2015).
| | | | | | | | | | | | | | | | | | | | | | | | China | | | Asia excl. China | | | LATAM | | | EMEA | | | Total | | No. of audits | | | 143 | | | | 25 | | | | 20 | | | | 7 | | | | 195 | | Initial audits | | | 47 | | | | 11 | | | | 11 | | | | 6 | | | | 75 | | Continued conformance audits | | | 96 | | | | 14 | | | | 9 | | | | 1 | | | | 120 | | Average number of non-compliances per audit | | | 11.2 | | | | 20.4 | | | | 18.0 | | | | 10.4 | | | | 13.0 | | Workers employed at sites audited | | | 92,358 | | | | 11,263 | | | | 10,382 | | | | 2,097 | | | | 116,100 | | | | | | | | Labor | | | | | | | | | | | | | | | | | | | | | Freely Chosen Employment1) | | | >75 | % | | | 25-50 | % | | | 50-75 | % | | | 100 | % | | | >75 | % | Child labor prohibition /young worker management2) | | | >75 | % | | | 100 | % | | | 100 | % | | | 100 | % | | | >75 | % | Working hours | | | 25-50 | % | | | 50-75 | % | | | >75 | % | | | 100 | % | | | 50-75 | % | Wages and Benefits | | | 50-75 | % | | | 50-75 | % | | | >75 | % | | | 100 | % | | | 50-75 | % | Humane Treatment | | | 100 | % | | | >75 | % | | | >75 | % | | | 100 | % | | | >75 | % | Non-discrimination | | | >75 | % | | | 100 | % | | | >75 | % | | | 100 | % | | | >75 | % | Freedom of association | | | 100 | % | | | >75 | % | | | 100 | % | | | 100 | % | | | >75 | % | Health & Safety | | | | | | | | | | | | | | | | | | | | | Occupational Safety | | | 50-75 | % | | | 50-75 | % | | | 50-75 | % | | | 50-75 | % | | | 50-75 | % | Emergency Preparedness | | | 50-75 | % | | | 25-50 | % | | | 25-50 | % | | | 10-25 | % | | | 25-50 | % | Occupational Injury and Illness | | | >75 | % | | | 25-50 | % | | | 50-75 | % | | | 100 | % | | | 50-75 | % | Industrial Hygiene | | | 50-75 | % | | | 50-75 | % | | | 50-75 | % | | | >75 | % | | | 50-75 | % | Physically demanding work | | | >75 | % | | | >75 | % | | | 50-75 | % | | | 100 | % | | | >75 | % | Machine safeguarding | | | >75 | % | | | >75 | % | | | >75 | % | | | 100 | % | | | >75 | % | Food Sanitation and Housing | | | 50-75 | % | | | >75 | % | | | 50-75 | % | | | >75 | % | | | 50-75 | % | Environment | | | | | | | | | | | | | | | | | | | | | Environmental Permits and Reporting | | | >75 | % | | | 50-75 | % | | | >75 | % | | | 100 | % | | | >75 | % | Pollution prevention and resource reduction | | | >75 | % | | | 50-75 | % | | | 50-75 | % | | | 100 | % | | | >75 | % | Hazardous substances | | | >75 | % | | | 50-75 | % | | | 50-75 | % | | | >75 | % | | | 50-75 | % | Waste water and solid waste | | | >75 | % | | | 100 | % | | | >75 | % | | | 100 | % | | | >75 | % | Air emissions | | | >75 | % | | | >75 | % | | | 50-75 | % | | | 100 | % | | | >75 | % | Product content restrictions | | | 100 | % | | | 100 | % | | | 100 | % | | | 100 | % | | | 100 | % | Management systems | | | | | | | | | | | | | | | | | | | | | Certified management system (SA8000, etc.) | | | 10-25 | % | | | 10-25 | % | | | 25-50 | % | | | 10-25 | % | | | 10-25 | % | Company commitment | | | >75 | % | | | 50-75 | % | | | 50-75 | % | | | 50-75 | % | | | >75 | % | Management accountability and responsibility | | | 50-75 | % | | | 25-50 | % | | | 25-50 | % | | | 25-50 | % | | | 50-75 | % | Legal and customer requirements | | | 50-75 | % | | | 25-50 | % | | | 25-50 | % | | | 50-75 | % | | | 50-75 | % | Risk assessment and risk management | | | 50-75 | % | | | 10-25 | % | | | 25-50 | % | | | 50-75 | % | | | 50-75 | % | Improvement objectives | | | 50-75 | % | | | 25-50 | % | | | 25-50 | % | | | 50-75 | % | | | 50-75 | % | Training | | | 50-75 | % | | | 25-50 | % | | | 25-50 | % | | | 50-75 | % | | | 50-75 | % | Communication | | | 50-75 | % | | | 25-50 | % | | | 50-75 | % | | | 50-75 | % | | | 50-75 | % | Worker feedback and participation | | | >75 | % | | | >75 | % | | | 50-75 | % | | | 50-75 | % | | | >75 | % | Audits and assessments | | | 50-75 | % | | | 25-50 | % | | | 25-50 | % | | | 50-75 | % | | | 50-75 | % | Corrective action process | | | 50-75 | % | | | 25-50 | % | | | 50-75 | % | | | 50-75 | % | | | 50-75 | % | Documentation and records | | | >75 | % | | | 25-50 | % | | | 25-50 | % | | | 50-75 | % | | | 50-75 | % | Supplier responsibility | | | 50-75 | % | | | 10-25 | % | | | 25-50 | % | | | 25-50 | % | | | 50-75 | % | Ethics | | | | | | | | | | | | | | | | | | | | | Business Integrity | | | >75 | % | | | 25-50 | % | | | 25-50 | % | | | 100 | % | | | 50-75 | % | No improper advantage | | | >75 | % | | | >75 | % | | | 50-75 | % | | | 100 | % | | | >75 | % | Disclosure of information | | | >75 | % | | | 100 | % | | | 100 | % | | | 100 | % | | | >75 | % | Protection of Intellectual Property | | | >75 | % | | | >75 | % | | | >75 | % | | | 100 | % | | | >75 | % | Fair business, advertising and competition | | | >75 | % | | | 100 | % | | | 100 | % | | | 100 | % | | | >75 | % | Protection of identity | | | >75 | % | | | >75 | % | | | >75 | % | | | 100 | % | | | >75 | % | Responsible sourcing of minerals | | | >75 | % | | | 100 | % | | | 100 | % | | | 100 | % | | | >75 | % | Privacy | | | 100 | % | | | 100 | % | | | 100 | % | | | 100 | % | | | 100 | % | Non-retaliation | | | >75 | % | | | 100 | % | | | 100 | % | | | 100 | % | | | >75 | % | General | | | | | | | | | | | | | | | | | | | | | EICC Code | | | >75 | % | | | 50-75 | % | | | >75 | % | | | >75 | % | | | >75 | % |
“<10%>75%” means that <10%>75% of the supplier audits done in 20132015 showed areas of non-compliancecompliance for a certain topiccategory | | | | | | | | | | | | | | | | | | | | | | | | China | | | Asia excl. China | | | LATAM | | | EMEA | | | Total | | No. of audits | | | 139 | | | | 35 | | | | 24 | | | | 2 | | | | 200 | | Initial audits | | | 44 | | | | 15 | | | | 9 | | | | 1 | | | | 69 | | Continued conformance audits | | | 95 | | | | 20 | | | | 15 | | | | 1 | | | | 131 | | Average number of non-compliances per audit | | | 11 | | | | 18 | | | | 9 | | | | 11 | | | | 12 | | Workers employed at sites audited | | | 88,775 | | | | 13,008 | | | | 8,067 | | | | 516 | | | | 110,336 | | | | | | | | Labor | | | | | | | | | | | | | | | | | | | | | Freely Chosen Employment1) | | | 10-25 | % | | | 50-75 | % | | | 10-25 | % | | | — | | | | 10-25 | % | Child labor prohibition/young worker management2) | | | 10-25 | % | | | <10 | % | | | <10 | % | | | — | | | | 10-25 | % | Working hours | | | 50-75 | % | | | 50-75 | % | | | <10 | % | | | — | | | | 50-75 | % | Wages and Benefits | | | 50-75 | % | | | 25-50 | % | | | — | | | | 50-75 | % | | | 25-50 | % | Humane Treatment | | | <10 | % | | | <10 | % | | | <10 | % | | | — | | | | <10 | % | Non-discrimination | | | <10 | % | | | — | | | | — | | | | — | | | | <10 | % | Freedom of association | | | — | | | | 10-25 | % | | | <10 | % | | | — | | | | <10 | % | Health & Safety | | | | | | | | | | | | | | | | | | | | | Occupational Safety | | | 25-50 | % | | | 25-50 | % | | | <10 | % | | | 50-75 | % | | | 25-50 | % | Emergency Preparedness | | | 25-50 | % | | | 50-75 | % | | | 25-50 | % | | | >75 | % | | | 25-50 | % | Occupational Injury and Illness | | | 25-50 | % | | | 25-50 | % | | | 10-25 | % | | | 50-75 | % | | | 25-50 | % | Industrial Hygiene | | | 25-50 | % | | | 25-50 | % | | | <10 | % | | | >75 | % | | | 25-50 | % | Physically demanding work | | | <10 | % | | | <10 | % | | | 10-25 | % | | | — | | | | <10 | % | Machine safeguarding | | | 10-25 | % | | | <10 | % | | | — | | | | 50-75 | % | | | 10-25 | % | Food Sanitation and Housing | | | 10-25 | % | | | 10-25 | % | | | 10-25 | % | | | 50-75 | % | | | 10-25 | % | Environment | | | | | | | | | | | | | | | | | | | | | Environmental Permits and Reporting | | | 10-25 | % | | | 25-50 | % | | | 10-25 | % | | | >75 | % | | | 10-25 | % | Pollution prevention and resource reduction | | | <10 | % | | | 25-50 | % | | | 10-25 | % | | | — | | | | <10 | % | Hazardous substances | | | 25-50 | % | | | 25-50 | % | | | — | | | | 50-75 | % | | | 25-50 | % | Waste water and solid waste | | | <10 | % | | | <10 | % | | | 10-25 | % | | | 50-75 | % | | | <10 | % | Air emissions | | | 10-25 | % | | | <10 | % | | | 10-25 | % | | | — | | | | 10-25 | % | Product content restrictions | | | — | | | | — | | | | — | | | | — | | | | — | | Management systems | | | | | | | | | | | | | | | | | | | | | Certified management system (SA8000, etc.) | | | 50-75 | % | | | >75 | % | | | 50-75 | % | | | >75 | % | | | 50-75 | % | Company commitment | | | 10-25 | % | | | 25-50 | % | | | 10-25 | % | | | — | | | | 10-25 | % | Management accountability and responsibility | | | 25-50 | % | | | 50-75 | % | | | 25-50 | % | | | 50-75 | % | | | 25-50 | % | Legal and customer requirements | | | 10-25 | % | | | 25-50 | % | | | 25-50 | % | | | — | | | | 10-25 | % | Risk assessment and risk management | | | 25-50 | % | | | 50-75 | % | | | 10-25 | % | | | >75 | % | | | 25-50 | % | Improvement objectives | | | 25-50 | % | | | 50-75 | % | | | 25-50 | % | | | — | | | | 25-50 | % | Training | | | 10-25 | % | | | 50-75 | % | | | 25-50 | % | | | — | | | | 25-50 | % | Communication | | | 10-25 | % | | | 25-50 | % | | | 10-25 | % | | | — | | | | 25-50 | % | Worker feedback and participation | | | 10-25 | % | | | 25-50 | % | | | 10-25 | % | | | — | | | | 10-25 | % | Audits and assessments | | | 25-50 | % | | | 50-75 | % | | | 25-50 | % | | | — | | | | 25-50 | % | Corrective action process | | | 25-50 | % | | | 25-50 | % | | | 25-50 | % | | | — | | | | 25-50 | % | Documentation and records | | | 10-25 | % | | | 25-50 | % | | | <10 | % | | | — | | | | 10-25 | % | Supplier responsibility | | | 25-50 | % | | | 50-75 | % | | | 25-50 | % | | | — | | | | 25-50 | % | Ethics | | | | | | | | | | | | | | | | | | | | | Business Integrity | | | 25-50 | % | | | 25-50 | % | | | 25-50 | % | | | — | | | | 25-50 | % | No improper advantage | | | <10 | % | | | <10 | % | | | 25-50 | % | | | — | | | | <10 | % | Disclosure of information | | | <10 | % | | | <10 | % | | | — | | | | — | | | | <10 | % | Protection of Intellectual Property | | | <10 | % | | | 25-50 | % | | | <10 | % | | | — | | | | <10 | % | Fair business, advertising and competition | | | 10-25 | % | | | <10 | % | | | 10-25 | % | | | — | | | | <10 | % | Protection of identity | | | <10 | % | | | 25-50 | % | | | 10-25 | % | | | — | | | | <10 | % | Responsible sourcing of minerals | | | <10 | % | | | <10 | % | | | — | | | | — | | | | <10 | % |
230 Annual Report 2013
13 Sustainability statements 13.2.2 - 13.2.2
| | | | | | | | | | | | | | | | | | | | | | | China | | | Asia excl. China | | | LATAM | | | EMEA | | | Total | | Privacy
| | | — | | | | — | | | | — | | | | — | | | | — | | Non-retaliation
| | | <10 | % | | | <10 | % | | | <10 | % | | | — | | | | <10 | % | General
| | | | | | | | | | | | | | | | | | | | | EICC Code
| | | <10 | % | | | 25-50 | % | | | 10-25 | % | | | 50-75 | % | | | 10-25 | % |
| 1) | Freely Chosen Employment: these cases are related to workers having to paynot receiving a deposit tocontract in their employer, which is not acceptable under the EICC Code of Conduct. We requested suppliers to take corrective action and verified that the deposits were returned to the workers and supplier policies were changed.mother language |
| 2) | Child labor avoidance/youngavoidance /young worker management: this is related to A) 20 cases of young workers (16 – 18 years) working overtime hours, which is not allowed by local laws. We requested suppliers to stop this and verified implementation of corrective action during resolving audits. B) two cases of historic child labor, where a labor agency and a supplier hired 2 workers a couple of months prior to reaching the legal age. We requested suppliers to strengthen its management system and age verification procedure, and ensured that the workers were enrolled in the young worker management program. If we find anyNo cases of child labor we require supplierswere found. The non-compliances identified are related to take immediate action accordingmissing procedures to the ILO guidelines for employers ofadequately prevent child labor, see also our child labor policylabor. |
Annual Report 2015 227
Sustainability statements 14.2.8 Implementing corrective actions On average we see 1213 major NCs per supplier audit (2014: 11) and work with each supplier to resolve these NCs within 90 days where possible. GoalThe goal is to improve the conditions in the supplier factories. Therefore, we focus on training, supplier development and implementation of corrective action plans with those suppliers. In exceptional cases where the supplier is unwilling to improve, we will decide to end the business relationship, which we did for 15 suppliers in 2013. If Philips notices that there is a delay in the realization of the corrective action plan by the supplier, Philips uses a stratified approach for consequence management. Depending on the root causeroot-cause why the supplier is not taking sufficient corrective actions, Philips can decide to: send a formal warning to the supplier; allocate no new projects; allocate no new orders; or stop doing business. Audit progress and targetsCollaboration Road with IPE in Environment Protection
| | | 2013 Goals | | Progress | | | Compliance rate: 67% | | Reached 77% compliance rate | | | 2014 Goals | | | | | 75% of corrective actions implemented within 90 days (for major NCs found in 2014 audits) | | |
More information on theSince 2011, Philips’ Supplier Sustainability Involvement Program,Office has partnered with the Institute of Public & Environmental Affairs (IPE) to monitor and improve China supplier environment performance via pollution index from Water and Air pollution Maps.
In 2015, Philips Supplier Sustainability Declarationcontinued teaming up with IPE to address Water and audit approach can be foundAir pollution in China. We established a mechanism to screen suppliers’ environmental performance and oversee corrective plans and monitor every implementation at www.philips.com/the suppliers. High environmental impact suppliers were identified and asked to extend environment performance governance to their suppliers and even their suppliers’ suppliers. In such way Philips successfully helped suppliers with environment issues in Guangdong and Zhejiang to make and implement corrective plans in sewage treatment. In 2016, Philips will continue its environmental collaboration with the IPE by intensifying its surveillance over our supplier environmental performance, in order to build a sustainable green supply chain in China. Supplier training and capacity building Based on many years of experience with the audit program, we know that a combination of audits, capacity building, consequence management and structural attention from management is crucial to realize structural and lasting changes at supplier production sites.
Developing risk suppliers
Since 2012 we are extending our capacity building initiatives which are offered to help suppliers improve their practices. We organizeprovide classroom training sessions for suppliers, Philips sustainability experts regularly visit suppliers to provide on-site consultancy and training, and we invite suppliers to participate in trainings provided by the EICC.
This is what In 2015, we did different in 2013organized 11 training sessions to improve the impact of the supplier trainings and audit results:
Smaller groups (less than 40 attendees per training, more training sessions, 22 full days of training were given), to enable more interaction and dialogue with and between suppliers
Suppliers performed self-assessments prior to the training
Suppliers learned how to do a self-audit after the training, Philips experts helped suppliers in this process and with the follow-up actions
In China we invited suppliers for classroom training sessions which were attended by over 190 active and potential suppliers, representing a workforce of more than 120,000 factory workers in total. Next to basic training on the EICC Code of Conduct dedicated trainingswhich were provided for areas whereattended by more than 500 suppliers globally.
To address emerging issues we often see weak performance during the audits, e.g. fire safety, working hours, and management systems. We continued our trainingalso provide in-depth capacity building programs for Philips buyers and quality managers, supporting them to further integrate sustainability in their daily work with suppliers.our suppliers on specific topics.
Supplier training and capacity buildingIDH Electronics program
| | | 2013 Goals | | Progress | | | 35% of active risk suppliers in China involved in supplier sustainability development program | | Supplier sustainability development program was initiated in China. 44% suppliers are involved in sustainability development program | | | | | Worked together with Philips customers to improve sustainability performance over multiple tiers of the supply chain, harmonizing sustainability expectations and requirements towards suppliers. | | | 2014 | | | | | Roll-out best practices and learnings from IDH electronics program to Chinese suppliers included in audit program | | | | | Start dedicated 3-year program to improve Health & Safety conditions in supplier factories. Start roll-out to 20% of the Chinese suppliers in 2014 | | |
Sustainable Trade Initiative IDH
Since 2011 Philips has been an active initiator and participant inis one of the initiators of the IDH Electronics Program a multi-stakeholder, an innovative multi- stakeholder initiative sponsored by the Dutch government to accelerate sustainable trade by building partnerships between leading multinationals,and the Sustainable Trade Initiative (IDH) together with Dell, HP, Philips and civil society organizations, governments, and other stakeholders.
The IDH Electronics Program aims to support the development of sustainable and innovative workforce management practices for over 75 suppliers. Unlike other CSR programs that have been implemented previously in the industry, this program steers away from traditional auditing methods and seeks to make a significant impact by building and up-scaling the skills of both workers and management. By promoting worker-management dialogue and helping to develop employees’ skills and careers, the program strives to reduce employee turnover and wastage, improve energy efficiency and improve the overall performance of supplier factories. The goal is to improve working conditions for more than 500,000 employees in the electronics sector.
Participating suppliers are given an ‘Entry Point Assessment’ to identify issues that affect both factory management and employees, such as worker-management communication, occupational health and safety,
Annual Report 2013 231
13 Sustainability statements 13.2.2 - 13.2.2
production, performance management and environmental issues. This is then used to develop a tailor-made action plan with each supplier, based on improved dialogue between management and employees. Suppliers receive support over a period of up to 24 months, and the cost of the program is shared between the supplier, Philips, and the IDH.organizations.
In 2013, IDH was extended from the Pearl River Delta Area to include the Yangtze River Delta, area. As of year-end 2013, the program covers 52 suppliers to Philips, Apple, Nokia, Dell and Hewlett-Packard. Aa total of 1519 Philips suppliers are now involved in the program, seven in the Yangtze River Delta area and eight in the Pearl River Delta Area, covering around 17,000 employees. Together with other branded goods manufacturers, we are going beyond a supplier audit. In order to ensure a worthwhile output we are also working togetherProgram, which has identified more than 200 major corrective actions with suppliers and helped improve the working conditions and the relationship between employees and management for more than 70,000 employees. In 2015, Philips introduced the IDH Fast Track Program, which is a one-year program aimed at helping even more suppliers to further improve their labor management, environment, Health and Safety via professional on-site assessment, analysis and correction plan. Seven additional Chinese suppliers were involved through the IDH Fast Track Program. In 2015, the Sustainable Trade Initiative (IDH) capped its Electronics Program by holding review and exchange meetings in Shenzhen and Shanghai. The meetings also marked the last phase of the 4-year IDH program. Nearly 200 people participated in the meetings, including representatives from Philips, and other brands, as well as implementation parties, NGOs and suppliers. When the program is completed in 2016, Philips will continue to support its suppliers by further enhancing their management-employee communication, so that the outcomes of the IDH program teamwill be applied to identifydrive sustainability. More information on the top three improvement actions,Supplier Sustainability Audit Program can be found here: Supplier Sustainability Goals and weProgress. Responsible Sourcing of Minerals: Addressing issues deeper in the supply chain Global supply chains in the electronics and health-tech industry are monitoring progress closely. Suppliers such as ‘company B’ are startinglong and complex; typically with more than 7 layers between the finished product and the very source of the raw materials used in its manufacturing. Addressing all issues deep in the supply chains is not going to see the benefits ofbe easy, and it will not happen overnight. However, Philips’ mission to improve people’s lives does not stop with its customers or even its first-tier suppliers. Philips has already demonstrated this commitment by becoming a frontrunner with its advanced Conflict Minerals program. IDH
| | | 2013 Goals | | Progress | | | Increase number of participating Philips suppliers from 7 to 15 suppliers | | 15 suppliers are now participating. Another 5 were invited and are in the process of enrolling | | | Each IDH supplier identifies its top 3 improvement actions | | All 15 suppliers completed their Entry Point Assessments and identified improvement areas and 11 suppliers defined their top 3 improvement actions and completed development of their work plans | | | 2014 Goals | | | | | Increase number of participating suppliers to 20 | | | | | All participating suppliers identify their top 3 improvement actions and develop their work plans | | | | | 70% of all identified top 3 improvement actions implemented by end 2014 | | |
IDH case study228 Annual Report 2015
B is a company based in Hong Kong, which has an electronics factory located in Dongguan, China. As a Philips supplier, B has been involved in the IDH Electronics Program since January 2013.
Sustainability statements 14.2.8 B has implemented a series of improvement plans in different areas, including worker-management communication, workers’ welfare and pay, health and safety, factory facilities and production. These improvement actions have resulted in increased productivity and greater employee satisfaction.
To improve worker-management communication, for example, B has set up a factory improvement team made up of front-line production workers, departmental representatives and managerial staff. B’s management believes that talking directly to front-line workers gives a more accurate picture of what is going on in the company than hear-say reports that are passed up through the organizational hierarchy. The team structure helps to facilitate B’s cultural values of mutual respect and open communication.
In the coming years B’s management will continue their active cooperation and dialogue with employees. Challenges will be identified jointly through constructive dialogue facilitated by the IDH Program.
Issues further down the chain
ConflictConflict-free minerals
In line with Philips’Responsible sourcing of minerals is an important part of our supplier sustainability commitment to supply chain sustainability,and we feel obliged to implement measures in our chain to ensure that our products are not directly or indirectly funding human atrocities in the Democratic Republic of the Congo (DRC). We are concerned about the situation in eastern DRC where proceeds from the extractives sector are used to finance rebel conflicts in the region. Philips is committed to address this issue, even though it does not directly source minerals from the DRC. The supply chain for the metals of concern consists of many tiers, including mines, traders, exporters, smelters, refiners, alloy producers and component manufacturers, before reaching Philips’ direct suppliers.
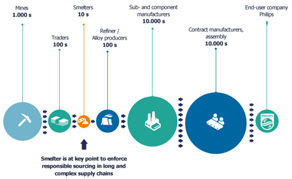
Philips has committed not to purchase raw materials, subassemblies, or supplies which we know contain conflict minerals that directly or indirectly finance or benefit armed groups in the DRC or an adjoining country. Philips works towards the following goals:
Minimize trade inEliminate all illicit minerals from the market by steering our supply chain towards sourcing from the conflict minerals that benefit armed groups infree validated smelters only, while working with all relevant industries to increase the DRC or an adjoining countrynumber of audited smelters.
Enable legitimate minerals from the region to enter global supply chains, thereby supporting the Congolese economy and the local communities that depend on these exports. What areConflict-free minerals from the DRC region
Many companies have ceased buying minerals from the Democratic Republic of Congo (DRC) to eliminate any chance of supporting the conflict minerals? Conflict minerals are definedby which they created a de facto embargo in a region where mining is often the US Dodd-Frank Act asonly source of income for local communities. To help break this regional boycott, Philips has helped set a conflict free supply chain of tin from the region. In 2015 the project has been scaled up also to tantalum and tungsten and gold. They can come2 additional countries, currently covering over 800 active mines. Responsibly sourced minerals from DRC and surrounding countries are now part of many sources around the world, includingdifferent Philips products globally.
Conflict-free minerals policy and Supply chain due diligence Philips does not directly source minerals from mines in the DRC or elsewhere, and the supply chain for these metals consists of many tiers, including mines, traders, exporters, smelters, refiners, alloy producers and component manufacturers, before reaching Philips’ direct suppliers. Philips has committed not to purchase raw materials, subassemblies, or supplies which are estimatedfound to provide approximately 18% of global tantalum production, 4% of tin, 3% of tungsten, and 2% of gold. These minerals may end up in many different products such as cars, planes, chemicals, jewelry, packaging, and electronics equipment.contain conflict minerals. Collaboration with different stakeholders
We believe that industry collaboration and stakeholder dialogue are key to creating impact at these deeper levels of our supply chain. Since 2008 Philips is actively contributingcontinued its active contribution to the Conflict FreeConflict-Free Sourcing Initiative a joint effort founded by a coalition of leadingwhich brings together the electronics, companies fromautomotive and other industries to jointly improve conditions in the extractives industry organizations EICC and GeSI (formerly called the “EICC-GeSI Extractives Work Group”(www.conflictfreesourcing.org). Over 120 companies participate in this initiative today, and we have formed partnershipsWe also engaged with relevant other leadership groups from across industries, government and civil society. The Conflict Free Sourcing Initiative provides information on conflict-free smelters and refiners, common tools and standards to collect supply chain information, and forums for exchanging best practices. It is amulti-sector, multi-stakeholder network, and reduces the need for duplication of efforts across the many sectors that are using these minerals. See also www.conflictfreesmelter.org
As we have been doing for years, we continued in 2013 our engagement with relevant stakeholders including the European Parliament, other industry organizationsEU institutions and local as well as international NGOs in Europe and the U.S. to see how we can resolve the issue. To assist in developing a due diligence standard for conflict minerals, we participated in the multi-stakeholder OECD-hosted program for the implementation of the “OECD Due Diligence Guidance for Responsible Supply Chains of Minerals fromConflict-Affected and High-Risk Areas”.
Supply chain due diligenceNGOs.
In 20132015, we continued our work with 349some 400 priority suppliers selected based on largest purchasing spend and metal usage. Philips Conflict Minerals Support Center was set up to raise awarenesshelp suppliers in undertaking this sometimes daunting task to investigate their long and conductcomplex supply chains. Philips requests its suppliers to adopt and implement a conflict-free minerals policy, to investigate their supply chain investigations into the country of origin for the metals. These suppliers cover more than 80% of the relevant purchasing spend. Using the standard Conflict Minerals Reporting 232 Annual Report 2013
13 Sustainability statements 13.2.2 - 13.2.2
Template we requested our suppliers to report back their progress and to disclose which smelters areshare all smelter names used in their supply chains to produce the metals. Suppliers are also asked to cascade Philips’ request to only source from smelters validated as conflict free further into the chain.
We carefully review the information received via the Conflict Minerals Reporting Template from each supplier against the Philips requirements. We developed additional training materials in 2015 to assist suppliers with improving their due diligence performance, e.g. smelter data quality. 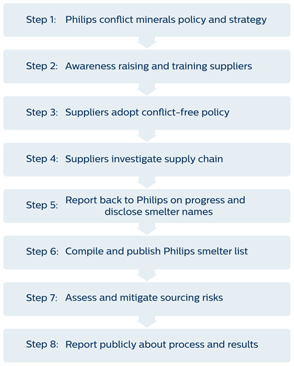
Progress on smelter identification conflict-free smelters Philips suppliers have provided the names of several hundred possible smelters and we are working to confirm which of these actually are smelters. For all four metals together we now identified 191 confirmed smelters in our supply chain, of which the majority is located in Asia. 29% of these successfully passed their Conflict Free Smelter (CFS) assessment, thereby confirming their conflict-free status. None of the smelters identified in our supply chain is known to source minerals that benefit armed groups in the DRC, and our suppliers reported back that they provide us with conflict-free products. Nevertheless, we continue to urge smelters to confirm their status via independent third party assessments.
Philips was the first company to publish its smelter list on internet in 2012. In doing so we created transparency at deeper levels in our supply chain of those actors that we believe hold the key towards effectively addressing the concerns around conflict minerals. In 2013 we updated the smelter list with new information received from our suppliers, and we will continue to do so as more information becomes available over time.
Conflict-free smelter program
Smelters mix minerals from many sources and refine itthem into metal used in our industry. The smelter is at a key point in the supply chain to enforce responsible sourcing by implementing due diligence in selecting their mineral sources. The EICC-GeSI CFS program makes it possible to identifyConflict-Free Smelter Program (CFSP) identifies smelters that can demonstrate through an independent third partythird-party assessment that the minerals they procure did not originateare conflict-free. During 2015 impressive progress was made in validating additional conflict-free smelters, from sources that contribute186 in January 2015 to conflict253 in the DRC. January 2016. Philips is actively directing its supply chain towards these smelters. Seewww.conflictfreesmelter.org for more details. After having identified smelters in our supply chain, we published oursmelter list as part of Philips’ Conflict Minerals declaration. Back in 2012 Philips startedwas the first company to invitemake its smelter list public. We did this to drive awareness and create a call for action for smelters and all users of these smelters to participate inmetals. We regularly update the CFS program. APhilips smelter list of CFS compliant smelters for tin, tantalum and gold has been published, and assessments for tungsten smelters are under way. As sufficient conflict-free smelters for all four metals become available, Philips plans to direct its supply chain towards these smelters. See www.conflictfreesmelter.org for more details.with new information received from our suppliers.
Conflict Free Tin InitiativeMinerals Report The results of Philips’ supply chain investigation, Reasonable Country of origin Inquiry (RCOI) and smelter analysis findings are available in thePhilips Conflict Minerals Report (CMR) which is updated annually after the SEC filing and is available on the Philips website. In September 2012,line with the US Dodd-Frank Act, we published the second Philips Conflict Free Tin Initiative was launched, introducing a tightly controlled conflict-free supply chain for tin, from a mineMinerals Report (CMR) in the Democratic RepublicMay 2015, describing our due diligence process and results. We engaged external auditors to perform an independent private sector audit (IPSA) of Congo (DRC) all the way to an end-product.this report. Among thousands of companies that published their reports, Philips is one of the industry partners brought together by the Dutch governmentonly 6 companies that initiatedchose to do this conflict-free sourcing program in eastern DRC. In an effort to prevent minerals from financing war, many companies worldwide have refrained from purchasing minerals from the DRC, leading to a de facto embargo and a collapse of the local economy. voluntary audit. The easiest route would have been to simply abandon sources from the DRC and nearby countries (forbidding suppliers from sourcing there) and to rely instead on supplies from conflict-free regions. However, we decided against that approach. Instead of avoiding the DRC, we took the more difficult road, supporting conflict-free sources within the region. Conflict minerals
| | | 2013 Goals | | Progress | | | Awareness raising and capability building with buyers and suppliers | | Conflict minerals is now a standard part of the Philips procurement core curriculum | | | | | Organized webinars for buyers and suppliers, attended by about 120 participants and installed a helpdesk (English and Chinese) to support suppliers in collecting the requested information | | | Priority suppliers to adopt a conflict-free sourcing policy | | 71% of the priority suppliers did | | | Priority suppliers to investigate supply chain and report back on progress and results | | 94% of the priority suppliers completed the standard Conflict Minerals Reporting Template. 69% disclosed smelters identified in their supply chain | | | Conflict Free Tin Initiative: include DRC tin in end-user product | | In Q4 the first products were made using this DRC conflict-free tin | | | 2014 Goals | | | | | Publish a Philips Conflict Minerals Report validated by external auditors | | | | | Collect Conflict Minerals Reporting Templates from at least 80% of priority suppliers, applying stricter criteria on data quality and completeness | | | | | Conflict Free Tin Initiative: include DRC tin in mainstream solder supply (move from pilot to normal business) | | |
For more details, see www.philips.com/suppliers and the published Philips position paper on Conflict Minerals.next update is scheduled for May 2016.
Annual Report 2013 2332015 229
13 Sustainability statements 13.2.2 - 13.3.114.2.8
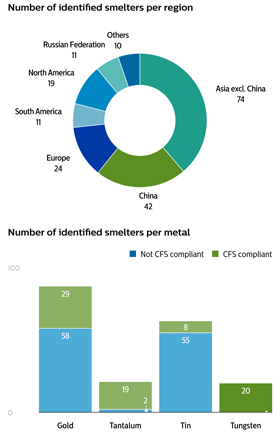
Tin mining in Indonesia The islands of Bangka and Belitung, Indonesia are oneproduces roughly one-third of the world’s principal tin-producing regions. Recently concerns have been raised abouttin supply, of which the vast majority comes from the islands Bangka and Belitung. The intensity of tin mining, the illegal small-scale miners and the irresponsible way it is carried out cause environmental devastation and unsafe working conditions related tosafety risks for miners.
Philips does not directly source tin from Indonesia and there are typically 7 or more tiers in the illegal mining of tin in this region. To evaluate possibilities for addressing these concerns,supply chain between a mine and a Philips supplier. Being highly concerned about the situation, Philips teamed up with other frontrunner companies,multinationals, the tin industry and civil society in the new IDH Indonesian Tin Working Group (TWG), coordinated by the Dutch Sustainable Trade Initiative IDH. We co-fundedInitiative. The Tin Working Group has achieved several important milestones in 2015, including an official written endorsement of relevant Indonesian ministries and securing a situational analysiscommitment of several front running mining companies. In collaboration with the local industry and sustainability assessment commissionedgovernment a roadmap to sustainable tin mining was drafted, defining improvement areas for onshore land reclamation and offshore low impact mining. In 2016, implementation of the roadmap will start with first pilots kick off, governed by this working group to better understand the situation andlocal steering committee. Philips was one of the potential ways for downstreamfirst companies to take constructive action.commit to co-funding the next phase of TWG and to support the sustainable mining practices through promoting responsible sourcing in Philips supply chain. “We (IDH, the Sustainable Trade Initiative) are very impressed with the commitment and engagement that Philips has showed over the past years as member of the Tin Working Group to address the non-sustainable tin mining practices in Bangka island in Indonesia. This was again demonstrated in December 2015 during the visit of a TWG delegation to the Indonesian government and tin mining representatives in which Philips actively participated in the dialogue to create a systemic value chain intervention. This is clearly CSR leadership behavior from Philips!” Ted van der Put Program Director, IDH Other sustainability initiatives in our supply chain Carbon footprint ofManaging CO2 emissions in our supply chain
In addition to developing energy-efficient products and becoming carbon-neutral by 2020, Philips will continue to tackle scope 3 emissions in its upstream supply chain. Via collaborative initiatives like the Carbon Pact, supplier development projects with upstream partners and by organizing awareness sessions for suppliers Philips proactively initiates, develops and supports carbon emission reduction activities in the supply chain. Via collaborative initiatives like the Carbon Pact between Philips and Mærsk Line, Supplier Development projects with upstream partners and by organizing awareness sessions for suppliers Philips proactively initiates, develops and supports Carbon Emission reduction activities in the supply chain. Partnership in the Supply Chain In 2015, Maersk Line and Philips expressed their mutual values for achieving sustainable growth by signing a Carbon Pact. As part of the Carbon Pact Maersk and Philips intend to: Create transparency on the environmental impact of the supply chain | • | | Reduce Philips’CO2 emissions per container moved with Maersk Line by 20% from 2016-2020 |
| • | | Integrate CO2 and other sustainability indicators into the commercial relationship |
SocietyUsing theCDP Supply Chain program Philips has a pressing needreached out to manage and reduceover 500 suppliers (four times more than in 2014), allowing information sharing on CO2 emissions over the whole value chain, including at supplier level. Therefore 80 of the largest suppliers to Philips have been invited to report their carbon footprint as part of the Carbon Disclosure Project (CDP) Supply Chain program. 69 suppliers completed the full questionnaire, showing increased performance with respect toand climate change. This year, Philips becamestrategies. As a founding member of theCDP Action Exchange program we continued connecting our suppliers to globally recognized solutions providers in the field of energy-efficient technology, helping themtechnology. Our suppliers have indicated that this initiative has been helpful in their search for innovative solutions to reduce their future emissions,footprint.
In 2016 we will stimulate and facilitate further improvement in our supply chain. A growing number of suppliers will be assisted in supplier development projects using Lean methodologies to reduce energy usage. Using the CDP platform Philips will continue to connect to suppliers, monitoring development, sharing best practices and identifying new improvement opportunities. Circular Procurement Procurement is a key driver in the transition towards embracing the concept of Circular Economy. Timely decisions in the product creation process are a pre-requisite to closing the materials loop at the end of the product life, with products made for instancerepair or refurbishment and re-use from the start. The focus is on innovative performance- or usage- based business models replacing the traditional “ownership” models. This is of course only possible while nurturing long-term business relationships with suppliers and customers. In 2014, Philips joined Dutch GreenDeal Circular Procurement, which is facilitated by applying LED lighting technology.organizations such asMVO Nederland, NEVI, and the Dutch government. Its goal is to accelerate the 230 Annual Report 2015
Sustainability statements 14.2.8 transition towards a Circular Economy by implementing circular procurement within purchasing processes, policies and strategy by the end of 2016. Philips is currently involved in over 20 Circular Economy projects and most of them involve procurement. Circular Economy (Value Leakage model) is now part of the DfX training (Design for X), which is a program and toolbox for proactively including end-user experience in the product development phase. As such, 90% of our procurement colleagues have been trained in this concept so far. The first Circular Economy DfX convention was held in 2015, focusing on refurbishing returned garment care steam generators. More successful applications of circular procurement can be found in non-product-related procurement such as services or equipment. In 2015, we continued in our successful partnership with HP to create a secure and compliant global process for the disposal of retired IT hardware. HP Case Study Over the past years the Philips-HP relationship has managed over 60,000 assets across 22 countries spanning 4 continents. the process has been covering activities from data wiping, which comprehensively mitigates security and privacy risks, through to remarketing and recycling. Notwithstanding the significant volume of assets, coming from so many locations, the HP Asset Recovery service has been able to remarket 90% of them, ensuring that even after their useful life within the Philips business has ended, these assets can return value as part of a well-structured end-of-life asset management process. For the remaining 10% of products, HP provides a full recycling service that recovers valuable raw materials and ensures compliance with our zero landfill policy. “Philips stands out as an organization that truly understands the importance of managing their legacy IT, both from a perspective of recognizing the maximum value of their IT Assets but also and arguably more importantly, recognizing their corporate social responsibility to ensure they manage their disposal process with minimal environmental impact. It’s for this reason that HP is proud to be Philips partner of choice for Asset Recovery Services and will continue to collaborate on our shared circular economy objectives.” Substance management with suppliersDr. Kirstie McIntyre
We work withHP Social and Environmental Responsibility Director, EMEA
Process chemicals Process chemicals are and will remain a topic of high concern for Philips and as such we will continue addressing it through industry collaboration (EICC taskforce) as well as via the new Philips approach to supplier assessment and capacity building which will be launched in 2016. In our new supplier sustainability approach we aim to structurally improve the sustainability performance at our suppliers. Within this new approach, one of the key areas to address is Health & Safety at our supplier sites. Philips will focus on training suppliers to eliminatemanage process chemicals, from integration into management systems, information sharing, handling and minimizeprotective measures, to their reduction and full elimination. The EICC taskforce on process chemicals in the use of hazardous substancessupply chain initiated by Philips in our products and2014 focuses on high-risk production processes. Since regulatory requirements affecting electronics frequently change, we structurally collect information from suppliers in an online tool (BOMcheck) since 2010, in particular for those suppliers that provide materials which could represent a risk in terms of compliance, e.g. soft plastics, complex materials, and ROHS-relevant materials. Philips validates the substance declarations received from suppliers to ensure that the products we put on the market are compliantThe taskforce is working towards one industry approach with the Philips Regulated Substances Listfinal goal of eliminating hazardous process chemicals, or – if no alternatives are available – minimizing the health risks for workers handling these chemicals. We are continuing an active multi-stakeholder engagement dialogue and all relevant legislation. During 2013 we collectedworking towards defining one list of ‘process chemicals of concern’ that can be used across different industries, including a plan for substitution or elimination. Chemical management is a critical component of the EICC Code of Conduct, as reflected in Section B – Health and validated substance declarations for nearly 95%Safety, and Section C – Environment. These two sections have been a point of all relevant components and products.emphasis in the EICC Validated Audit Process auditor training in 2015. Chemical management is also a point of emphasis in the EICC training programs, with course offerings in four categories. 13.314.3 Environmental statements
This section provides additional information on (some of) the environmental performance parameters reported in section 4.3,5.3, Environmental performance, of this report. 13.3.114.3.1 EcoVision
Our latest EcoVision program includes key performance indicators in relation to Green Product sales, Improving people’s lives, Green Innovation, Green Operations, Health & Safety, Employee Engagement and Supplier Sustainability.Sustainability and ended in 2015. We plan to announce our next five-year sustainability program in the second quarter of 2016. Improving people’s lives At Philips, we strive to make the world healthier and more sustainable through innovation. Our goal is to improve the lives of 3 billion people a year by 2025. Through Philips products and solutions that directly support the curative or preventive side of people’s health, we improved the lives of 630881 million people in 2013, Annual Report 2015 231
Sustainability statements 14.3.1 2015, driven by our Healthcare sector. Additionally, our well-being products that help people live a healthy life, and our Green Products that contribute to a healthy ecosystem, improved the lives of 290304 million and 1.491.7 billion people respectively. After the elimination of double counts – people touched multiple times – we arrived at 1.82.0 billion lives. This is an increase of 100around 140 million compared to our total baseline of 1.7 billion people a year, established in 2012.2014. Examples of products in the ‘well-being’ category that help people live a healthier life are air purifiers, juicers, blenders, air fryers, but also mother and childcare products. Examples of Green Products, products offering a significant environmental improvement in one or more Green Focal Areas, can be found in sub-section 4.3.2,5.3.2, Green Product sales, of this report. Further details on this parameter and the methodology can be found in the document ‘Improving people’s lives’. The circular economy program The circular economy program at Philips ran for the third year in 2015 and consists of four strategic pillars: | 1. | Connect to stakeholders outside Philips |
| 2. | Internal employee engagement |
| 3. | Create proof points and metrics |
| 4. | Embed circular economy in Philips processes |
Philips leverages the global partnership with the Ellen MacArthur Foundation, which includes the CE100 events and education. But partnerships with Circle Economy Netherlands, Turntoo, World Economic Forum, US Chamber of Commerce Foundation and The Guardian also help Philips to take a leading position in driving circular thinking. For example, Philips opened the doors of its refurbishment facilities in Bothell, USA and hosted a Business Delegation Tour, co-organized by Ecova and the US Chamber of Commerce Foundation, showcasing to a growing number of interested North-American businesses how the circular economy looks like in action. Through internal events, presentations, brochures, internal communications, social media, etc. Philips’ employees are inspired and stimulated to start or become involved in circular economy projects. For example, new circular design criteria for luminaires were road-tested by Philips engineers at multiple sites, creating the basis for a new range of modular lighting products to be developed in the coming years. In many Philips business groups circular economy projects have started. These are either linked to customer access over ownership (pay for performance), business model innovations (from transactions to relationships via service and solution models) or reverse cycles (remanufacturing, refurbishment and parts harvesting). To measure progress, a circular economy scorecard has been developed. As the circular economy touches many different business areas (strategy, design, business development, marketing, finance, etc.) it is important to have the right processes and procedures developed and embedded throughout the company. This is done as part of the development of the Philips Excellence Process Framework. More information can be found on thecircular economy website. Operational carbon footprint and energy efficiency – 2015 details Operational energy efficiency andThis year we have achieved our 2015 EcoVision reduction target that was set at a 40% decrease in CO2 reductions compared to our 2007 base year. Our carbon footprint: 2013 detailsfootprint decreased by 7% compared to 2014, resulting in a total of 1,417 kilotonnes CO
2, a 41% decrease compared to 2007. The 20132015 results can be attributed to several factors: | • | | Accounting for 45%28% of the total footprint, total CO2 emissions from manufacturing increaseddecreased by 17% due the higher use of SF6 (a substance with high Global Warming Potential impact)to operational changes resulting in our Lighting manufacturing operations. This was, however, partly offset by our continued focus ondecreased energy efficiency improvement programs, our changing industrial footprint, the further increase ofusage and a lower load; additionally the share of purchased electricitycoming from renewable sources to 50% of total purchased electricity.increased. |
| • | | CO2 emissions from non-industrial operations (offices, warehouses, etc.) represent 7% of the total. TheThis year the overall floor space decreased significantly in 2013 as a result of our Work Place Innovation program, which promotes flex-working and thus reduces the floor space in our non-industrial real estate portfolio. As a result,portfolio decreased by 6%. Combined with increased renewable energy usage, emissions reduced 20%decreased by 16% compared to 2012 as2014. In 2016, we also continuedwill continue to focus on the most efficient use of facility space and increasedincrease the share of purchased electricity from renewable sources. |
| • | | The total CO2 emissions related to business travel, accounting for 14% of our carbon footprint, increased 5%. This is mainly attributableshowed a slight decrease of 1% compared to Philips’ increasing presence2014. The 2% reductions achieved within business flights mitigated the increase of 7% in emerging markets. Our stringent in-house travel policy remains in place, as does our Green Lease Car policy.rental car emissions. |
| • | | Overall CO2 emissions from logistics, representing approximately one third51% of the total, increased 5%showed a slight decrease of 0.3% compared to 2012.2014. We recorded an increase in sea freight, confirming the effect of our gatekeeping process to move freightemissions from air to sea.and parcel freight. However, increased air shipments to address supply shortagesreduced emissions from road and ocean freight resulted in our Lighting sector mitigated the reduction realized by this policy.a downward change for logistics as a whole. |
234 Annual Report 2013
13 Sustainability statements 13.3.1 - 13.3.3
Philips Group Operational carbon footprint for logistics in kilotonnes CO2-equivalent 2011 - 2015 | | | | | | | | | | | | | | | | | | | | | | | | 2009 | | | 2010 | | | 2011 | | | 2012 | | | 2013 | | Air transport | | | 308 | | | | 345 | | | | 328 | | | | 309 | | | | 326 | | Road transport | | | 174 | | | | 160 | | | | 176 | | | | 105 | | | | 108 | | Sea transport | | | 145 | | | | 167 | | | | 153 | | | | 132 | | | | 141 | | | | | | | | | | | Philips Group | | | 627 | | | | 672 | | | | 657 | | | | 546 | | | | 575 | |
| | | | | | | | | | | | | | | | | | | | | | | | | | | | | 2011 | | | 2012 | | | 2013 | | | 2014 | | | 2015 | | | | | | | Air transport | | | 389 | | | | 366 | | | | 385 | | | | 348 | | | | 429 | | Road transport | | | 275 | | | | 169 | | | | 174 | | | | 164 | | | | 118 | | Ocean transport | | | 239 | | | | 210 | | | | 227 | | | | 208 | | | | 171 | | | | | | | Philips Group | | | 903 | | | | 745 | | | | 786 | | | | 720 | | | | 718 | | | | | | |
13.3.214.3.2 Biodiversity
Philips recognizes the importance of healthy ecosystems and rich biodiversity for our company, our employees, and society as a whole. We aim to minimize any negative impacts and actively promote ecosystem 232 Annual Report 2015
Sustainability statements 14.3.2 restoration activities including biodiversity restoration projects with social components, sustainable development, and poverty relief,relief. The Philips Biodiversity policy was issued in 2014 and carbon offsetting. In 2013 Philipsprogress was made significant steps forward inon biodiversity management, both on sites (e.g. impact measurement), on natural capital valuation and on the management level. The stepsMost initiatives were led by the Philips Leaders for Nature (LFN) team, site management, local sustainability organizations worldwide sustainability managers, and Group Sustainability in Eindhoven, the Netherlands. We made intensive use of the internal company-wide social network platform to create and share activities and achievements including training programs. We continued our global partnership with the International Union for the Conservation of Nature (IUCN) Netherlands Committee and our participation in the IUCN LFN program which brings companies, NGOs and governmentgovernments together to work on the topic of business and biodiversity. Next, we made intensive use of the internal company-wide social network platform to create and share activities and achievements including training programs.
Our projects in 2013 included improving our understanding ofIn 2014, a biodiversity by organizing together with the IUCN a very well-attended Business & Ecosystems Training (BET) on the topics of Natural Capital, Ecosystem Services and Biodiversity and the link to business. We worked on actively preserving biodiversity in and aroundimpact assessment was performed for all our industrial sites, with local communitiesusing the geo-locations of these sites and environmental organizations. In the Netherlands,Integrated Biodiversity Assessment Tool (IBAT). For every industrial site the Drachten Consumer Lifestyle and Best Healthcare plants restructured theirnearest Key Biodiversity Area or IUCN protected area was determined as well as the distance to such area.
The results of our assessment for all industrial sites for optimal restoration of biodiversity and employee well-being. Other examples are a large-scale employee-led biodiversity initiativecan be found here:GRI Biodiversity. Philips participated in Reedsville, Pennsylvania; and conservation efforts2015 in the Miribel (France), Ketrzyn Fareldevelopment of the Natural Capital Protocol and Pila (Poland), San Jose (USA), Varginha (Brazil),volunteered as a pilot company. These activities will continue in 2016. The environmental impact of Philips itself is limited as the company is not very energy-intensive and Pune (India) sites for example. In addition Philips employees established a community garden at theHigh-Tech Campus in Eindhoven (the Netherlands). A diverse team organized several internal and external events for the Netherlands sustainability day in October 2013 – including an introduction to the Circular Economy program and a product disassembly workshop. Finally, Philips co-hosted the “Mind Your Business” event with PwC and the Netherlands Ministrydoes not emit large quantities of Economic Affairs on ‘The transition to a bio-based economy – the role of government, thehigh-impact substances. The impact of/for companies, and partnerships/networks – the necessity of joint projects and knowledge sharing’. We also conducted a biodiversity survey and water risk investigation of our industrial sites. The biodiversity survey results have enabled us to build a knowledge basesupply chain however is significantly higher than our own impact. For this reason, we used the identified hot-spots in our supply chain as input for our CDP Supply Chain program. More information on that program can be found at sub-section 14.2.8, Supplier indicators, of endangered and resident species, nature reserves and wildlife corridors, biodiversity initiatives and partnerships atthis report. In this Annual Report, Philips industrial sites. This will enable us to prepare biodiversity guidelines for sites.
Philips commissioned Trucost, in 2013, to perform an Environmental Profit and Loss (EP&L) analysis using 2012 data to help identifyhas also followed the IIRC Integrated Reporting <IR> framework which includes natural capital dependency “hot spots” and placeas a financialsource of value on Philips environmental impacts. The preliminary results show that between 2007 and 2012 Philips was able to decrease its exposure to natural capital risks and hence be better positioned to succeed in a natural capital constrained economy.creation. Together with the WBCSD we willare further developdeveloping the EP&L concept and methodology, including the environmental benefits.
To build and expand the Philips biodiversity strategy Philips has developed a biodiversity policy.
13.3.314.3.3 Green Operations
In 2010, we decided to group all activitiesOur Green Operations program, related to improving the environmental performance of our manufacturing facilities, (including chemicals management) under the Green Manufacturing 2015 program, which we renamed to Green Operations. The program focuses on most contributors to climate change, but also addresses water, recycling of waste and chemical substances.
In the courseFor an overview of 2013 we implemented an improved process to report chemicals used in processes in more detail. Based on the new insights gained, we included a few additional substances to our reporting scope in 2013. These substances do not have a material impact on our reported data. New chemicals on which we will focus our reduction efforts and new reduction targets will be incorporated in the next Philips’ industrial sites, please go here:Philips industrial sites.
Philips Group Green Operations program. Green Operations
in % unless otherwise stated 2015 | | | | | | | | | | | | | | | 2007 | | | 2015 | | | 2015 | | | | | 2007 | | 2013 | | 2015 | | | baseline year | | | target1) | | | actual1) | | | | | baseline year | | actual1) | | target1) | | | | | | Total CO2from manufacturing | |
| 865 kilotonnes CO2 -
equivalent |
| | | (19 | ) | | | (25 | ) | |
| 883 kilotonnes CO2 -
equivalent |
| | | (25 | ) | | | (58 | ) | | Water | | | 4.2 million m | 3 | | | 20 | | | | (10 | ) | | | 4.0 million m | 3 | | | (10 | ) | | | (32 | ) | | Materials provided for recycling via external contractor per total waste | | | 79 | | | | 81 | | | | 80 | | | | 79 | | | | 80 | | | | 83 | | | Restricted substances: | | | | | | | | | | | | | Benzene emission | | | 52 kg | | | | (100 | ) | | | achieved | | | | 52 kg | | | | (50 | ) | | | (65 | ) | Mercury emission | | | 185 kg | | | | (96 | ) | | | (100 | ) | | | 185 kg | | | | (100 | ) | | | (96 | ) | CFCs, HCFCs | | | 156 kg | | | | (100 | ) | | | achieved | | | | 156 kg | | | | (100 | ) | | | (100 | ) | Hazardous substances | | | | | | | | | | | | | Lead emission | | | 1,838 kg | | | | (100 | ) | | | achieved | | | | 1,838 kg | | | | (100 | ) | | | (100 | ) | PFCs | | | 1,534 kg | | | | 248 | | | | (35 | ) | | | 1,534 kg | | | | (35 | ) | | | (100 | ) | Toluene emission | | | 2,210 kg | | | | (46 | ) | | | (90 | ) | | | 2,210 kg | | | | (90 | ) | | | (93 | ) | Xylene emission | | | 4,506 kg | | | | 525 | | | | (90 | ) | | | 4,502 kg | | | | (90 | ) | | | 345 | | Styrene | | | 80,526 kg | | | | (93 | ) | | | achieved | | | | 80,526 kg | | | | (90 | ) | | | (94 | ) | Antimony, Arsenic and their compounds | | | 18 kg | | | | (100 | ) | | | achieved | | | | 18 kg | | | | (100 | ) | | | (100 | ) | | | | | | |
| 1) | Against the base year 2007 |
Energy use in manufacturing Total energy usage in manufacturing amounted to 14,1609,702 terajoules in 2013,2015, of which Lighting consumesconsumed about 79%70%. Compared to 2012,2014, energy consumption at Philips went down by 2%14%. This was driven by new acquisitions reporting for the first time,a decrease in activities in high energy-intensive operations in Lighting, organizational changes, and energy efficiency improvements.improvements, partly offset by one manufacturing site reporting for the first time. The energy use of our discontinued operations amounted to 2,179 terajoules in 2015 (2014: 2,160 terajoules). Philips Group Total energy consumption in manufacturingin terajoules in terajoules2011 - 2015
| | | | | | | | | | | | | | | | | | | 2011 | | | 2012 | | | 2013 | | | 2014 | | | 2015 | | | | | 2009 | | | 2010 | | | 2011 | | | 2012 | | | 2013 | | | | | | Healthcare | | | 1,670 | | | | 1,545 | | | | 1,541 | | | | 1,798 | | | | 1,794 | | | | 1,541 | | | | 1,798 | | | | 1,794 | | | | 1,773 | | | | 1,808 | | Consumer Lifestyle | | | 1,188 | | | | 1,274 | | | | 1,252 | | | | 1,104 | | | | 1,142 | | | | 1,252 | | | | 1,104 | | | | 1,142 | | | | 1,115 | | | | 1,131 | | Lighting | | | 11,535 | | | | 11,580 | | | | 11,189 | | | | 11,519 | | | | 11,224 | | | | 9,237 | | | | 9,112 | | | | 9,027 | | | | 8,369 | | | | 6,763 | | Innovation, Group & Services | | | 28 | | | | 27 | | | | — | | | | — | | | | — | | | | — | | | | — | | | | — | | | | — | | | | — | | | | | | | | | | | Philips Group | | | 14,421 | | | | 14,426 | | | | 13,982 | | | | 14,421 | | | | 14,160 | | | | 12,030 | | | | 12,014 | | | | 11,963 | | | | 11,257 | | | | 9,702 | | | | | | | |
Carbon emissions in manufacturing The greenhouse gas emissions of our manufacturing operations totaled 705371 kilotonnes CO2-equivalent in 2013, 2% higher2015, 21% lower than in 2012.2014. This is the result of new acquisitions reporting for the first timedecreased energy usage related to decreased production and increased usage of specific process chemicals.operational changes. Indirect CO2 emissions decreased overall, decreased, mainly as a result of increaseddue to decreased usage of electricity generated by renewable sources.at various Lighting sites. The carbon emissions of our discontinued operations amounted to 145 kilotonnes CO2-equivalent in 2015 (2014: 141 kilotonnes CO2-equivalent). Annual Report 2013 2352015 233
13 Sustainability statements 13.3.2 - 13.3.314.3.3
Philips Group Total carbon emissions in manufacturing in kilotonnes CO2-equivalent 2011 – 2015 | | | | | | | | | | | | | | | | | | | | | | | | 2009 | | | 2010 | | | 2011 | | | 2012 | | | 2013 | | Direct CO21) | | | 295 | | | | 299 | | | | 294 | | | | 294 | | | | 281 | | Indirect CO2 | | | 443 | | | | 317 | | | | 273 | | | | 310 | | | | 293 | | Other greenhouse gases | | | 54 | | | | 34 | | | | 40 | | | | 60 | | | | 104 | | From glass production | | | 24 | | | | 25 | | | | 28 | | | | 27 | | | | 27 | | | | | | | Philips Group2) | | | 816 | | | | 675 | | | | 635 | | | | 691 | | | | 705 | |
| | | | | | | | | | | | | | | | | | | | | | | | | | | | | 2011 | | | 2012 | | | 2013 | | | 2014 | | | 2015 | | | | | | | Direct CO21) | | | 290 | | | | 278 | | | | 276 | | | | 253 | | | | 200 | | Indirect CO2 | | | 238 | | | | 252 | | | | 208 | | | | 185 | | | | 148 | | Other greenhouse gases | | | 4 | | | | 6 | | | | 7 | | | | 6 | | | | 6 | | From glass production | | | 28 | | | | 27 | | | | 27 | | | | 24 | | | | 17 | | | | | | | Philips Group2) | | | 560 | | | | 563 | | | | 518 | | | | 468 | | | | 371 | | | | | | |
| 2) | Excluding new acquisitionsnon-reporting industrial sites therefore different from Operational carbon footprint |
CO2 emissions decreased at Healthcare due to energy efficiency improvements and increased use of electricity generated by renewable sources, this was however partly mitigatedsources. At Consumer Lifestyle, CO2 emissions increased slightly due to a decrease in the use of electricity generated by new acquisitions reporting for the first time.renewable sources. Lighting increaseddecreased its CO2 emissions due to the increased uselower load of specific process chemicals, mitigated by electricity generated by renewable sources.energy-intensive activities and organizational changes. Philips Group Total carbon emissions in manufacturing per sector in kilotonnes CO2-equivalent 2011 - 2015 | | | | | | | | | | | | | | | | | | | 2011 | | | 2012 | | | 2013 | | | 2014 | | | 2015 | | | | | 2009 | | | 2010 | | | 2011 | | | 2012 | | | 2013 | | | | | | Healthcare | | | 118 | | | | 57 | | | | 54 | | | | 70 | | | | 58 | | | | 57 | | | | 78 | | | | 57 | | | | 50 | | | | 47 | | Consumer Lifestyle | | | 53 | | | | 42 | | | | 39 | | | | 38 | | | | 38 | | | | 41 | | | | 42 | | | | 37 | | | | 34 | | | | 37 | | Lighting | | | 644 | | | | 575 | | | | 542 | | | | 583 | | | | 609 | | | | 462 | | | | 443 | | | | 424 | | | | 384 | | | | 287 | | Innovation, Group & Services | | | 1 | | | | 1 | | | | — | | | | — | | | | — | | | | — | | | | — | | | | — | | | | — | | | | — | | | | | | | | | | | Philips Group | | | 816 | | | | 675 | | | | 635 | | | | 691 | | | | 705 | | | | 560 | | | | 563 | | | | 518 | | | | 468 | | | | 371 | | | | | | | |
Restricted substances Emissions of restricted substances totaled 926 kilos in 2013, a significant decrease compared to 2012 mainly as a result2015. Mercury, only used in Lighting, accounted for 8 kilos of the continued reduction in mercury emissions in Lighting, and more accurate measurements.this category. With the Green Operations program we continue to focus on a reduction of a selection of the most important substances in our processes. The Lumileds and Automotive operations did not have emissions of restricted substances. Philips Group Restricted substancesin kilos in kilos2011 - 2015
| | | | | | | | | | | | | | | | | | | | | | | | 2009 | | | 2010 | | | 2011 | | | 2012 | | | 2013 | | Benzene and Benzene compounds | | | 136 | | | | 101 | | | | 55 | | | | — | | | | — | | Mercury and Mercury Compounds | | | 122 | | | | 83 | | | | 51 | | | | 54 | | | | 8 | | CFCs/HCFCs1) | | | 14 | | | | 4 | | | | 5 | | | | 1 | | | | 1 | | | | | | | Total | | | 272 | | | | 188 | | | | 111 | | | | 55 | | | | 9 | |
| | | | | | | | | | | | | | | | | | | | | | | | | | | | | 2011 | | | 2012 | | | 2013 | | | 2014 | | | 2015 | | | | | | | Benzene and benzene compounds | | | 55 | | | | 12 | 1) | | | 28 | 1) | | | 20 | 1) | | | 18 | | Mercury and mercury compounds | | | 51 | | | | 54 | | | | 8 | | | | 8 | | | | 8 | | CFCs/HCFCs2) | | | 5 | | | | 1 | | | | 1 | | | | 1 | | | | — | | | | | | | Restricted substances | | | 111 | | | | 67 | | | | 37 | | | | 29 | | | | 26 | | | | | | |
| 1) | Numbers have been restated |
| 2) | Excluding cooling systems |
Benzene LightingBenzene was the only sector that used benzeneby one site in manufacturing, but has been successfulChina in 2012a thinner and will be phased out in the phase-out of benzene.2016.
Mercury Mercury is used exclusively by Lighting. Emissions decreased from 54 kgemissions in 2012Lighting remained stable at 8 kilos in 2015 and 2014. As a result of changes in the manufacturing process, for the third year in a row, Lighting’s mercury emissions were at the ‘as low as reasonably achievable’ level, according to 8 kg in 2013, due to continued emissions reductions activities and improved measurements. Sustainability world mapour assessment.
CFCs/HCFCs In 20132015, total emissions from CFCs/HCFCs remained at very low levels, at less than 1 kg. Hazardous substances TargetsAs described above, reduction targets have been set on a selected number of hazardous substances.substances in our Green Operations program. In the following section our results are described. The Lumileds and Automotive data was excluded from the overview. Emissions from PFCs are material for a Lumileds site in Asia.
Philips Group Hazardous substancesin kilos in kilos2011 - 2015
| | | | | | | | | | | | | | | | | | | 2011 | | | 2012 | | | 2013 | | | 2014 | | | 2015 | | | | | 2009 | | | 2010 | | | 2011 | | | 2012 | | | 2013 | | | | | | Lead and lead compounds | | | 1,958 | | | | 108 | | | | 44 | | | | 73 | | | | 1 | | | | 44 | | | | 73 | | | | 1 | | | | 8 | | | | 6 | | PFCs (Per Fluorinated Compounds) | | | 2,535 | | | | 1,507 | | | | 1,842 | | | | 2,560 | | | | 5,331 | | | PFCs (Per Fluorinated Compounds)1) | | | | 1 | | | | — | | | | — | | | | — | | | | — | | Toluene | | | 2,160 | | | | 6,745 | | | | 5,745 | | | | 6,184 | | | | 1,190 | | | | 5,745 | | | | 6,184 | | | | 1,188 | | | | 162 | | | | 163 | | Xylene | | | 4,619 | | | | 30,491 | | | | 37,889 | | | | 18,947 | | | | 28,176 | | | | 37,889 | | | | 18,944 | | | | 28,176 | | | | 22,979 | | | | 20,025 | | Styrene | | | 21,567 | | | | 22,920 | | | | 19,920 | | | | 42,329 | | | | 5,753 | | | | 19,920 | | | | 42,329 | | | | 5,753 | | | | 5,161 | | | | 4,907 | | Antimony, Arsenic and their compounds | | | 30 | | | | 24 | | | | 37 | | | | — | | | | — | | | | 5 | | | | — | | | | — | | | | — | | | | — | | | | | | | | | | | Total | | | 32,869 | | | | 61,795 | | | | 65,477 | | | | 70,093 | | | | 40,451 | | | Hazardous substances | | | | 63,604 | | | | 67,530 | | | | 35,118 | | | | 28,310 | | | | 25,101 | | | | | | | |
| 1) | Excluding cooling systems |
Lead and lead compounds The strong decreaseconsumption of lead and lead compounds went down significantly (by 41%) in 2013 was mainlyLighting production due to more accurate calculations based on the improved reporting process.portfolio changes, which resulted in lower emissions in 2015, 6 kilos compared to 8 kilos in 2014. PFCs The increasePFCs were only used in 2013 to 5,331 kg was causedLumileds sites. Emissions by Lumileds sites where PFCs are used as process chemicals.amounted to 4,174 kilos in 2015, a 23% increase compared to 2014.
Toluene The emission of toluene remained at the same level as 2014, mainly usedreported in wet lacquers, decreased by 81% in 2013 largelyLighting. In Lighting, toluene is no longer used as a resultbasic carrier in solvents and lacquers. The latter process has been gradually replaced by powder coating processes, resulting in decreased emissions compared to the start of phase-out programs in Consumer Lifestyle.the Green Operations program. Xylene The use of xylene increasedXylene emissions decreased by 49%13% due to increasedlower production of products where these specific lacquers and thinners are used at Consumer Lifestyle sites.Lifestyle.
234 Annual Report 2015
Sustainability statements 14.3.3 Styrene Styrene is mainly usedTwo sites in Lighting. In 2013, the emissionConsumer Lifestyle emitted 3,670 kilos of styrene (22% increase compared to 2014); emissions decreased significantlyat two Lighting sites due to more accurate calculations based on the improved reporting process.portfolio changes.
Antimony, Arsenicarsenic and their compounds Lighting was successful in phasing-out these substances.In 2015, total emissions from antimony remained at very low levels, at less than 1 kg.
ISO 14001 certification In 2013, 80%2015, 78% of reporting manufacturing sites were certified. This increasecertified, a slight decrease compared to the previous year is attributable2014. In Lighting, several certified sites were closed, whereas one site was certified. In Healthcare, one site that started to new acquisitions being certified for the first time. The sectors have programs in placereport was not yet certified. In 2015, Healthcare completed a project to address certification at newalign most of its global manufacturing units under a ‘One Healthcare ISO14001 Certificate’ covering 19 manufacturing sites. Philips Group ISO 14001 certification as a % of all reporting organizations 2011 - 2015 | | | | | | | | | | | | | | | | | | | | | | | | 2009 | | | 2010 | | | 2011 | | | 2012 | | | 2013 | | Philips Group | | | 92 | | | | 95 | | | | 89 | | | | 71 | | | | 80 | |
| | | | | | | | | | | | | | | | | | | | | | | | | | | | | 2011 | | | 2012 | | | 2013 | | | 2014 | | | 2015 | | | | | | | Philips Group | | | 87 | | | | 69 | | | | 79 | | | | 79 | | | | 78 | | | | | | |
Environmental Incidents In 2013, 3 incidents were2015, one environmental incident with an oil spill was reported by Healthcare related to waste water and a leakage.in Healthcare. Consumer Lifestyle reported 1one non-compliance in soil, followed by a remediation plan and one environmental incident which did not result in a fine. Three non-compliances were reported at Lighting. One related to emissions, to air and Lighting reported 3 incidents reported to waste water andresulting in a leakage. Therenon-material fine. For discontinued operations, one spillage occurred; non-compliances were no fines reported in our sustainability reporting tool in connection with any of the incidents.not reported. Annual Report 2015 235
Sustainability statements 14.3.3 Sustainability world map 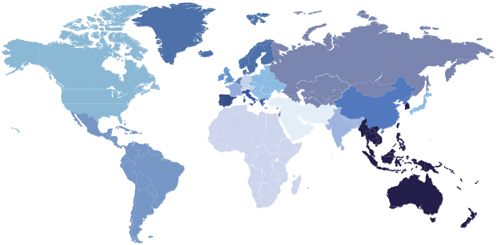
| | | | | | | | | | | | | | | | | | | | | | | | | | | | | | | | | | | | | | | | | | | | | Total waste | | | | | | Emissions (kg) | | | Markets | | Manufacturing
sites | | | Lost Workday
Injury rate1) | | | CO2 emitted
(Tonnes CO2) | | | Waste
(Tonnes) | | | Recycled
(%) | | | Water
(m3) | | | Restricted
substances | | | Hazardous
substances | | Africa | | | — | | | | 0.00 | | | | — | | | | — | | | | — | | | | — | | | | — | | | | — | | ASEAN2) | | | 3 | | | | 0.09 | | | | 29,252 | | | | 2,979 | | | | 46 | % | | | 98,741 | | | | — | | | | 1,822 | | Benelux | | | 10 | | | | 0.22 | | | | 20,219 | | | | 9,472 | | | | 79 | % | | | 466,848 | | | | — | | | | 167 | | Central & Eastern Europe | | | 7 | | | | 0.34 | | | | 65,342 | | | | 16,725 | | | | 89 | % | | | 374,427 | | | | 1 | | | | 11,962 | | Germany, Austria & Switzerland | | | 4 | | | | 0.31 | | | | 4,986 | | | | 2,282 | | | | 87 | % | | | 48,669 | | | | — | | | | 4 | | France | | | 2 | | | | 0.81 | | | | 1,443 | | | | 411 | | | | 72 | % | | | 8,951 | | | | — | | | | 22 | | Greater China2) | | | 12 | | | | 0.09 | | | | 89,979 | | | | 5,203 | | | | 86 | % | | | 752,810 | | | | 20 | | | | 536 | | Iberia | | | 2 | | | | 0.94 | | | | 4,647 | | | | 4,415 | | | | 97 | % | | | 36,337 | | | | — | | | | — | | Indian Subcontinent | | | 5 | | | | 0.03 | | | | 64,208 | | | | 5,964 | | | | 99 | % | | | 225,605 | | | | — | | | | 3,673 | | Italy, Israel and Greece | | | 4 | | | | 0.52 | | | | 5,123 | | | | 1,428 | | | | 65 | % | | | 28,179 | | | | — | | | | 4,802 | | Japan | | | — | | | | 0.16 | | | | — | | | | — | | | | — | | | | — | | | | — | | | | — | | Latin America2) | | | 11 | | | | 0.19 | | | | 12,468 | | | | 5,999 | | | | 90 | % | | | 74,790 | | | | — | | | | 1,910 | | Middle East & Turkey3) | | | 3 | | | | 0.38 | | | | — | | | | — | | | | — | | | | — | | | | — | | | | — | | Nordics | | | 1 | | | | 0.00 | | | | 245 | | | | 98 | | | | 69 | % | | | 2,400 | | | | — | | | | — | | North America3) | | | 29 | | | | 0.23 | | | | 71,646 | | | | 12,303 | | | | 73 | % | | | 520,949 | | | | 5 | | | | 197 | | Russia and Central Asia | | | — | | | | 0.00 | | | | — | | | | — | | | | — | | | | — | | | | — | | | | — | | UK & Ireland | | | 2 | | | | 0.11 | | | | 1,051 | | | | 1,135 | | | | 77 | % | | | 88,403 | | | | — | | | | 6 | |
| 1) | Includes manufacturing and non-manufacturing sites |
| 2) | One manufacturing site had not yet started to report environmental data |
| 3) | Three manufacturing sites had not yet started to report environmental data |
236 Annual Report 20132015
13 Sustainability statements 13.3.3 - 13.3.3
Sustainability
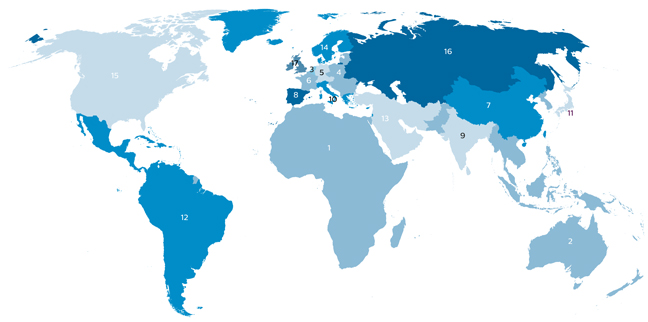
| | | | | | | | | | | | | | | | | | | | | | | | | | | | | | | | | | | | | | | | | | | | | Total waste | | | | | | Emissions (kg) | | | Markets | | Manufacturing sites | | | Lost Workday Injury rate* | | | CO2 emitted (Tonnes CO2) | | | Waste (Tonnes) | | | Recycled (%) | | | Water (m3) | | | Restricted substances | | | Hazardous substances | | 1. Africa | | | 0 | | | | 0.33 | | | | — | | | | — | | | | — | | | | — | | | | — | | | | — | | 2. ASEAN | | | 7 | | | | 0.09 | | | | 251,450 | | | | 7,827 | | | | 57 | % | | | 1,276,133 | | | | 4 | | | | 5,520 | | 3. Benelux | | | 13 | | | | 0.31 | | | | 32,176 | | | | 20,057 | | | | 89 | % | | | 590,061 | | | | 1 | | | | 177 | | 4. Central & East Europe | | | 8 | | | | 0.32 | | | | 72,092 | | | | 18,628 | | | | 85 | % | | | 491,337 | | | | 0 | | | | 22,045 | | 5. DACH | | | 4 | | | | 0.46 | | | | 5,515 | | | | 2,926 | | | | 90 | % | | | 191,435 | | | | 1 | | | | 3 | | 6. France | | | 4 | | | | 1.15 | | | | 3,119 | | | | 747 | | | | 76 | % | | | 19,179 | | | | 0 | | | | 36 | | 7. Greater China | | | 13 | | | | 0.16 | | | | 119,750 | | | | 7,625 | | | | 86 | % | | | 988,721 | | | | 1 | | | | 1,724 | | 8. Iberia** | | | 2 | | | | 1.22 | | | | — | | | | — | | | | — | | | | — | | | | — | | | | — | | 9. Indian Subcontinent | | | 5 | | | | 0.11 | | | | 69,491 | | | | 7,316 | | | | 100 | % | | | 267,278 | | | | 0 | | | | 24 | | 10. Italy, Israel and Greece | | | 4 | | | | 0.76 | | | | 5,461 | | | | 1,614 | | | | 66 | % | | | 26,622 | | | | 0 | | | | 4,738 | | 11. Japan | | | 0 | | | | 0.00 | | | | — | | | | — | | | | — | | | | — | | | | — | | | | — | | 12. Latin America | | | 6 | | | | 0.14 | | | | 188 | | | | 1,282 | | | | 93 | % | | | 27,126 | | | | 0 | | | | 780 | | 13. Middle East & Turkey | | | 0 | | | | 0.14 | | | | — | | | | — | | | | — | | | | — | | | | — | | | | — | | 14. Nordics | | | 2 | | | | 0.28 | | | | 15 | | | | 57 | | | | 99 | % | | | 1,249 | | | | 0 | | | | 0 | | 15. North America | | | 40 | | | | 0.28 | | | | 141,559 | | | | 21,937 | | | | 70 | % | | | 1,140,441 | | | | 2 | | | | 5,366 | | 16. Russia and Central Asia | | | 0 | | | | 0.00 | | | | — | | | | — | | | | — | | | | — | | | | — | | | | — | | 17. UK & Ireland | | | 3 | | | | 0.37 | | | | 3,808 | | | | 1,918 | | | | 85 | % | | | 24,780 | | | | 0 | | | | 38 | |
* | Includes manufacturing and non-manufacturing sites |
** | Acquired manufacturing sites did not start reporting environmental data yet |
Annual Report 2013 237
13 Sustainability statements 13.4 - 13.414.4
13.414.4 Independent assurance reportAuditor’s Assurance Report
To theTo: The Supervisory Board and Shareholders of Koninklijke Philips N.V.:
Our Opinion We were engaged by the Supervisory Board of Koninklijke Philips N.V. (further ‘Philips’) to provide assurance onhave audited the information in the chapter Sustainability statements and the sections Social performance and Environmental performance in the Annual Report 20132015 (further ‘The Sustainability Information’). The Board of Management is responsible forKoninklijke Philips N.V. (further: ‘Philips’), Eindhoven, the preparation ofNetherlands. In our opinion, The Sustainability Information including the identification of material issues. Our responsibility is to issue an assurance report based on the engagement outlined below. Scope
Our assurance engagement was designed to provide reasonable assurance on whether The Sustainability Information is presentedpresents fairly, in all material respects, the sustainability performance of Philips in accordance with the reporting criteria.criteria as mentioned below.
We report, to the extent we can assess, that the information on sustainability in the rest of the Annual Report 2015 is consistent with The Sustainability Information. Basis for our opinion We conducted our engagement in accordance with the Dutch Standard 3810N: “Assurance engagements relating to sustainability reports”, which is a specified standard under the International Standard on Assurance Engagements (ISAE) 3000: “Assurance Engagements other than Audits or Reviews of Historical Financial Information”. Our responsibilities under Standard 3810N and procedures performed have been further specified in the paragraph titled “Our responsibility for reasonable assurance on The Sustainability Information”. We are independent of Koninklijke Philips N.V. in accordance with the “Verordening inzake de onafhankelijkheid van accountants bij assurance-opdrachten” (ViO) and other relevant independence requirements in The Netherlands. Furthermore we have complied with the “Verordening gedrags- en beroepsregels accountants” (VGBA). We do not provide any assurance on the achievability of the objectives, targets and expectations of Philips. Reporting criteriaWe believe that the assurance evidence we have obtained is sufficient and assurance standardappropriate to provide a basis for our opinion.
Responsibilities of the Board of Management for The Sustainability Information Philips appliesThe Board of Management is responsible for the preparation and fair presentation of The Sustainability Information in accordance with the Sustainability Reporting Guidelines G4 of the Global Reporting Initiative, supported by internally developed guidelines as described in Approach to sustainability reporting in the chapter Sustainability statements of this Annual Report. It is important to view the performance data in the context of these criteria.
We conducted our engagement in accordance with the Dutch Standard 3410N: Assurance engagements relating to sustainability reports and which is a specificAs part of this, the International StandardBoard of Management is responsible for Assurance Engagement (ISAE 3000): Assurance Engagement other than Auditssuch internal control as it determines is necessary to enable the preparation of The Sustainability Information that is free from material misstatement, whether due to fraud or Reviews of Historical Financial Information, issued by the International Auditing and Assurance Standards Board. This standard requires, among others, that the assurance team possesses the specific knowledge, skills and professional competencies needed to provideerror.
Our responsibility for reasonable assurance on sustainability information,The Sustainability Information Our objective is to plan and perform the reasonable assurance assignment in a manner that they complyallows us to obtain sufficient and appropriate assurance evidence for our opinion. We apply the “Nadere voorschriften accountantskantoren ter zake van assurance opdrachten” and accordingly maintain a comprehensive system of quality control including documented policies and procedures regarding compliance with theethical requirements, professional standards and applicable legal and regulatory requirements. Our assurance engagement has been performed with a high, but not absolute, level of the Codeassurance, which means we may not have detected all errors and fraud. The procedures selected depend on our understanding of Ethics for Professional AccountantsThe Sustainability Information and other engagement circumstances, and our consideration of the International Federation of Accountants to ensure their independence. Work undertaken
areas where material misstatements could arise. Our procedures included performing a risk assessment, (part of which was a media search), assessing the appropriateness of the accounting and other policies used, evaluating the design and implementation and testing the operating effectiveness of the systems and processes for collecting and processing the qualitative and quantitative information in The Sustainability Information, (includingincluding the implementation of these at a number of sites),sites, and evaluating the overall presentation of sustainability information within our scope. Also we held interviews with relevant management and tested documentation on a sample basis to determine whether the information is supported by sufficient evidence. Additionally we determined, to the extent we can assess, whether the information concerning sustainability in the other sections of the Annual Report 2013 is consistent with the information in The Sustainability Information.
Opinion
In our opinion, The Sustainability Information presents fairly, in all material respects, the sustainability performance of Philips in accordance with the reporting criteria.
We also report, to the extent we can assess, that the information on sustainability in the rest of the Annual Report 2013 is consistent with information in The Sustainability Information.
Amsterdam, The Netherlands February 25, 201423, 2016 KPMG Accountants N.V. J.F.C. van EverdingenE.H.W. Weusten RA
238 Annual Report 20132015 237
13 Sustainability statements 13.5 - 13.514.5
13.514.5 Global Reporting Initiative (GRI) table 4.0
KPMG has audited Chapter 11chapter 12, Group financial statements, of this report and Chapter 12chapter 13, Company financial statements, of this report, as well as sections 4.2section 5.2, Social performance, 4.3of this report, section 5.3, Environmental performance, of this report and Chapter 13chapter 14, Sustainability statements.statements, of this report. Where in the table cross-reference is made to these parts, the information is included in the scope of one of these audits. For the other information in the report, KPMG has assessed whether this information is consistent with the information in the aforementioned parts. Where there is no cross-reference to a section in the Report, assurance is not applicable. Please refer to sections 11.10, 12.5section 13.5, Independent auditor’s report, of this report and 13.4 for the independent auditor’s reports. Annualsection 14.4, Independent Auditor’s Assurance Report, 2013 239of this report.
13 Sustainability statements 13.5 - 13.5
General Standard Disclosures | | | | | | | | | | | profile
disclosure
| | description | | cross-reference | | Strategy and analysis | | | | | | | | | | | | | G4-1 | | Statement from the most senior decision-maker of the organization (incl. strategy relates to sustainability, impacts of the activities in relation to the stakeholders) | | chapter 2, Message from the CEO | | | | | | | G4-2 | | Description of key impacts, risks, and opportunities | | chapter 2, Message from the CEO section 2.3, Market opportunities section 6.2,7.2, Risk categories and factors
section 6.3,7.3, Strategic risks section 6.4,7.4, Operational risks section 6.5,7.5, Compliance risks section 6.6,7.6, Financial risks section 7.7, Separation risk chapter 13,14, Sustainability statements - “Material aspects and our focus” | |
238 Annual Report 2015
Sustainability statements 14.5 | | | | | | | | | | | profile
disclosure
| | description | | cross-reference | | Organizational profile | | | | | | | | | | | | | G4-3 | | Name of the organization | | chapter 10,11, Corporate governance | | | | | | | G4-4 | | Primary brands, products, and/or services | | section 1.4, Next phase4.2, How we create value section 2.1, Our rich heritagesub-section 6.1.2, About Healthcare in 2015
section 2.3, Market opportunities
section 2.4, Our business system
section 2.6, Global presence
| | | | | | | sub-section 6.2.2, About Consumer Lifestyle in 2015 | | | | | | | sub-section 6.3.2, About Lighting in 2015 | | | | | | | G4-5 | | Location of organization’s headquarters | | section 10.5,11.5, Investor Relations | | | | | | | G4-6 | | Number of countries where the organization operates, and names of countries with either major operations or that are specifically relevant to the sustainability issues covered in the report | | section 2.6, Global presence
chapter 5,6, Sector performance section 13.2, Social statementsnote 2, Information by sector and main country
note 5, Interests in entities Related content: Philips industrial sites | | | | | | | G4-7 | | Nature of ownership and legal form | | chapter 10,11, Corporate governance | | | | | | | G4-8 | | Markets served (including geographic breakdown, sectors served and types of customers/beneficiaries) | | chapter 1, Performance highlights section 4.4, Lives improved section 4.5, Global presence chapter 3, Delivering innovation that matters to you6, Sector performance | | | | | | | G4-9 | | Scale of the reporting organization | | chapter 1, Performance highlights sub-section 5.1.4, 2013 financial
| | | | | | | section 4.2, How we create value | | | | | | | section 5.1, Financial performance sub-section 5.2.4, 2013 financial performance
sub-section 5.3.4, 2013 financial performance
sub-section 5.4.2, 2013 financial performance
| | | | | | | note 2, Information by sector and main country | | | | | | | note 5, Interests in entities | | | | | | | note 6, Income from operations | | | | | | | G4-10 | | Total workforce by employment type, gender, employment contract and region | | sub-section 4.2.3, Diversity and inclusion5.2.3, Inclusion sub-section 4.2.4,5.2.4, Employment note 3,6, Income from operations | | | | | | | G4-11 | | Percentage of employees covered by collective bargaining agreements | | For all Philips businesses, guidance is applicable regarding collective bargaining agreements. See www.philips.com/gbpGeneral Business Principles. The actual percentage of employees covered by collective bargaining agreements is managed and monitored at local level. Philips considers this percentage on consolidated level not relevant. | | | | | | | G4-12 | | Describe the organization’s supply chain (incl. product or service providers, engaged suppliers in total number, type, and location, payments made to suppliers) | | chapter 13,14, Sustainability statements section 13.1,14.1, Economic indicators sub-section 13.2.2,14.2.8, Supplier indicators Related content: Supplier Sustainability Involvement ProgramGoals and Progress | | | | | | | G4-13 | | Significant changes during the reporting period relating to size, structure, or ownership or its supply chain (incl. changes in location, operations, facilities, capital information and supplier information) | | sub-section 5.1.11, Discontinued operations sub-section 5.1.13, Acquisitions and divestments sub-section 5.1.15, Cash flows provided by continuing operations sub-section 5.1.16, Cash flows from discontinued operations section 16.2,17.2, Share information section 16.5, Philips’ acquisitions
note 7,3, Discontinued operations and other assets classified as held for sale | | | | | | | note 9,4, Acquisitions and divestments | | | | | | | chapter 13,14, Sustainability statements sub-section 13.2.2,14.2.8, Supplier indicators | | | | | | | G4-14 | | Explanation of whether and how the precautionary approach or principle is addressed by the organization | | section 6.1,7.1, Our approach to risk management and business control chapter 10, Corporate governancesection 11.1, Board of Management - “Risk management approach”
| | | | | | | G4-15 | | Externally developed economic, environmental, and social charters, principles, or other initiatives to which the organization subscribes or endorses | | sub-section 5.2.8, Working with stakeholders chapter 13,14, Sustainability statements |
240 Annual Report 2013
13 Sustainability statements 13.5 - 13.5
| | | | | | | | | profile
disclosuresub-section 14.2.8, Supplier indicators - “IDH Electronics program”
| | description | | cross-referencesub-section 14.2.7, Stakeholder Engagement | | | | | | | G4-16 | | Memberships in associations (such as industry associations) | | chapter 13,14, Sustainability statements – “Stakeholders” sub-section 14.2.7, Stakeholder Engagement | | | | | | | | | | | | | | | | | profile
disclosure | | description | | cross-reference | | Identified material aspects and boundaries | | | | | | | | | | | | | G4-17 | | Operational structure of the organization, including main divisions, operating companies, subsidiaries, and joint ventures (List (List all entities in the consolidated financial statements) | | chapter 1, Performance highlights Message from the CEO
chapter 5,6, Sector performance chapter 9, Supervisory Board report
note 2, Information by sector and main country | | | | | | | G4-18 | | Process for defining report content and the Aspect Boundaries and explain how the Reporting Principles has been implemented | | chapter 13,14, Sustainability statements | | | | | | | G4-19 | | List all the material Aspects identified | | chapter 13,14, Sustainability statements | | | | | | | G4-20 | | The Aspect Boundary within the organization: | | chapter 14, Sustainability statements |
Annual Report 2015 239
Sustainability statements 14.5 | | | | | | | | | | profile
disclosure | | description | | cross-reference | | | | | | | | | Whether the Aspect is material within the organization; | | | | | | | The list of entities included in G4-17 for which the Aspect is or is not material; | | | | | | | Specific limitation regarding the Aspect Boundary within the organization | | chapter 13, Sustainability statements | | | | | | | G4-21 | | The Aspect Boundary outside the organization: Whether the Aspect is material outside the organization; The list of entities for which the Aspect is material, relate to geographical location; Specific limitation regarding the Aspect Boundary outside the organization | | chapter 13,14, Sustainability statements | | | | | | | G4-22 | | Explanation of the effect of anyre-statements | | chapter 13, Sustainability statements – “Comparability and completeness”
note 7,3, Discontinued operations and other assets classified as held for sale note 4, Acquisitions and divestments chapter 14, Sustainability statements – “Comparability and completeness” | | | | | | | G4-23 | | Significant changes from previous reporting periods in the Scope and Aspect Boundaries | | chapter 13,14, Sustainability statements | | | | | | | | | | | | | | | | | profile
disclosure
| | description | | cross-reference | | Stakeholder engagement | | | | | | | | | | | | | G4-24 | | List of stakeholder groups engaged by the organization | | sub-section 4.2.8, Stakeholder engagement5.2.8, Working with stakeholders chapter 13,14, Sustainability statements – “Stakeholders” | | | | | | | G4-25 | | Basis for identification and selection of stakeholders with whom to engage | | sub-section 4.2.8, Stakeholder engagement5.2.8, Working with stakeholders chapter 13,14, Sustainability statements – “Stakeholders” | | | | | | | G4-26 | | Approaches to stakeholder engagement, including frequency of engagement by type and by stakeholder group | | sub-section 4.2.8, Stakeholder engagement5.2.8, Working with stakeholders chapter 13,14, Sustainability statements – “Stakeholders” | | | | | | | G4-27 | | Key topics and concerns that have been raised through stakeholder engagement, and how the organization has responded to those key topics and concerns, including through its reporting; Report the stakeholder groups that raised each of the key topics and concerns | | sub-section 4.2.8, Stakeholder engagement5.2.8, Working with stakeholders chapter 13,14, Sustainability statements – “Stakeholders” sub-section 14.2.7, Stakeholder Engagement | | | | | | | | | | | | | | | | | profile
disclosure
| | description | | cross-reference | | Report profile | | | | | | | | | | | | | G4-28 | | Reporting period | | section 11.1,12.1, Management’s report on internal control |
Annual Report 2013 241
13 Sustainability statements 13.5 - 13.5
| | | | | | | | | profile
disclosure | | description | | cross-reference | | | | | | | | | | | chapter 13,14, Sustainability statements | | | | | | | G4-29 | | Date of most recent previous report | | chapter 16, Five-year overview | | | | | | | G4-30 | | Reporting cycle | | chapter 16, Five-year overview | | | | | | | G4-31 | | Contact point for questions regarding the report or its contents | | section 16.7,17.6, Investor contact | | | | | | | G4-32 | | Table identifying the location of the Standard Disclosures in the report | | chapter 13,14, Sustainability statements – “Reporting standards” | | | | | | | section 13.5,14.5, Global Reporting Initiative (GRI) table 4.0 | | | | | | | G4-33 | | Policy and current practice with regard to seeking external assurance for the report | | section 9.3,10.3, Report of the Audit Committee section 10.4, Logistics of the General11.4, Meeting of Shareholderslogistics and provision ofother information - “Auditor information” & “Auditor policy” section 11.1,12.1, Management’s report on internal control section 12.2, Report of the independent auditor Auditor’s report section 12.3, Independent auditors’ reports on the consolidated financial statements and on internal control over financial reporting section 13.5, Independent auditor’s report note 6, Income from operations - Group note K, Audit fees“Audit fees” section 12.5,13.5, Independent auditor’s report chapter 14, Sustainability statements - Company chapter 13, Sustainability statements“External assurance” section 13.4,14.4, Independent assurance reportAuditor’s Assurance Report | | | | | | | | | | | | | profile
disclosure | | description | | cross-reference | | Governance | | | | | | |
240 Annual Report 2015
Sustainability statements 14.5 | | | | | | | | | | profile
disclosure | | description | | cross-reference | | | | | | | G4-34 | | Governance structure of the organization (incl. report the committees responsible for decision-making on economic, environmental and social impacts) | | chapter 10,11, Corporate governance section 10.1,11.1, Board of Management section 10.2,11.2, Supervisory Board section 10.3,11.3, General Meeting of Shareholders section 10.4, Logistics of the General11.4, Meeting of Shareholderslogistics and provision ofother information chapter 13,14, Sustainability statements - “Sustainability governance” | | | | | | | G4-35 | | Process for delegating authority for economic, environmental and social topics | | section 10.1,11.1, Board of Management section 10.2,11.2, Supervisory Board chapter 13,14, Sustainability statements - “Sustainability governance” | | | | | | | G4-36 | | Whether the organization has appointed an executive-level position or positions with responsibility for economic, environmental and social topics, and whether post holders report directly to the highest governance body | | chapter 7,8, Management section 10.1,11.1, Board of Management section 10.2,11.2, Supervisory Board chapter 13,14, Sustainability statements - “Sustainability governance” | | | | | | | G4-37 | | Processes for consultation between stakeholders and the highest governance body on economic, environmental and social topics (to whom, any feedback) | | sub-section 4.2.2,5.2.2, Employee engagement sub-section 4.2.8, Stakeholder engagement5.2.8, Working with stakeholders section 10.5,11.5, Investor Relations chapter 13,14, Sustainability statements - “Stakeholders” sub-section 14.2.7, Stakeholder Engagement section 16.7,17.6, Investor contact | | | | | | | G4-38 | | The composition of the highest governance body and its committees | | chapter 7,8, Management chapter 8,9, Supervisory Board section 10.1,11.1, Board of Management section 10.2,11.2, Supervisory Board chapter 13,14, Sustainability statements - “Sustainability governance” | | | | | | | G4-39 | | Indicate whether the Chair of the highest governance body is also an executive officer | | section 10.1,11.1, Board of Management | | | | | | | G4-40 | | Process for determining the qualifications and expertise of the members of the highest governance body | | chapter 9,10, Supervisory Board report section 9.1,10.1, Report of the Corporate Governance and Nomination & Selection Committee section 10.2,11.2, Supervisory Board | | | | | | | G4-41 | | Processes in place for the highest governance body to ensure, that conflicts of interest are avoided | | section 10.1,11.1, Board of Management section 10.2,11.2, Supervisory Board | | | | | | | G4-42 | | Roles in the development, approval, and updating of the organization’s purpose, value or mission statements, strategies, policies, and goals | | chapter 9,10, Supervisory Board report section 10.1,11.1, Board of Management section 10.2,11.2, Supervisory Board section 10.3,11.3, General Meeting of Shareholders section 10.4, Logistics of the General11.4, Meeting of Shareholderslogistics and provision ofother information chapter 13,14, Sustainability statements - “Sustainability governance” | | | | | | | G4-43 | | The measures taken to develop and enhance the highest governance body’s collective knowledge | | chapter 9,10, Supervisory Board report section 10.1,11.1, Board of Management section 10.2,11.2, Supervisory Board |
242 Annual Report 2013
13 Sustainability statements 13.5 - 13.5
| | | | | | | | | profile
disclosure
| | description | | cross-reference | | | | | | | G4-44 | | Processes for evaluating the highest governance body’s own performance | | section 6.1,7.1, Our approach to risk management and business control chapter 9,10, Supervisory Board report section 10.1,11.1, Board of Management section 10.2,11.2, Supervisory Board chapter 13,14, Sustainability statements - “Sustainability governance” | | | | | | | G4-45 | | Procedures of the highest governance body for overseeing the organization’s identification and management of performance, including relevant risks and opportunities, and adherence or compliance with internationally agreed standards, codes of conduct and principles | | section 6.1,7.1, Our approach to risk management and business control chapter 9,10, Supervisory Board report chapter 10,11, Corporate governance section 10.1,11.1, Board of Management section 10.2,11.2, Supervisory Board | | | | | | | G4-46 | | The highest governance body’s role in reviewing the effectiveness of the organization’s risk management processes for economic, environmental and social topics | | section 6.1,7.1, Our approach to risk management and business control section 9.3,10.3, Report of the Audit Committee section 10.1,11.1, Board of Management chapter 13,14, Sustainability statements - “Sustainability governance” | | | | | | | G4-47 | | The frequency of the highest governance body’s review of economic, environmental and social impacts, risks, and opportunities | | section 6.1,7.1, Our approach to risk management and business control section 9.3,10.3, Report of the Audit Committee section 10.1,11.1, Board of Management chapter 13,14, Sustainability statements - “Sustainability governance” | | | | | | | G4-48 | | The highest committee or position that formally reviews and approves the organization’s sustainability report and ensures that all material Aspects are covered | | section 10.2,chapter 10, Supervisory Board report
chapter 13,14, Sustainability statements - “Sustainability governance” |
Annual Report 2015 241
Sustainability statements 14.5 | | | | | | | | | | profile
disclosure | | description | | cross-reference | | | | | | | G4-49 | | The process for communicating critical concerns to the highest governance body | | sub-section 4.2.7,5.2.7, General Business Principles section 6.1,7.1, Our approach to risk management and business control section 11.1, Board of Management | | | | | | | G4-50 | | The nature and total number of critical concerns that were communicated to the highest governance body and the mechanism(s) used to address and resolve them | | sub-section 13.2.1,14.2.5, General Business Principles | | | | | | | G4-51 | | Linkage between compensation for members of the highest governance body, senior managers, and executives, and the organization’s performance | | section 9.2,10.2, Report of the Remuneration Committee note 29, Information on remuneration | | | | | | | G4-52 | | The process for determining remuneration; Whether remuneration consultants are involved | | section 9.2,10.2, Report of the Remuneration Committee section 10.1,11.1, Board of Management section 10.2,11.2, Supervisory Board note 29, Information on remuneration | | | | | | | G4-53 | | Mechanisms for shareholders and employees to provide recommendations or direction to the highest governance body | | section 10.3,11.3, General Meeting of Shareholders section 10.4, Logistics of the General11.4, Meeting of Shareholderslogistics and provision ofother information section 10.5,11.5, Investor Relations | | | | | | | G4-54 | | The ratio of the annual total compensation for the organization’s highest-paid individual in each country of significant operations to the median annual total compensation for all employees (excluding the highest-paid individual) in the same country | | Philips does not consider this indicator relevant, Philips makes an impact on local communities by the salaries it pays its employees. Salaries are based on industry norms as described in www.philips.com/gbp (GBP - 4.4 Wages and payment) General Business Principles. | | | | | | | G4-55 | | The ratio of percentage increase in annual total compensation for the organization’s highest-paid individual in each country of significant operations to the median percentage increase in annual total compensation for all employees (excluding the highest-paid individual) in the same country | | Philips does not consider this indicator relevant, Philips makes an impact on local communities by the salaries it pays its employees. Salaries are based on industry norms as described in www.philips.com/gbp General Business Principles. | | | | | | | | | | | | | | | | | profile
disclosure
| | description | | cross-reference | | | | | | Ethics and integrity | | | | | | | | | | | | | G4-56 | | Internally developed statements of mission or values, codes of conduct, and principles relevant to economic, environmental, and | | sub-section 4.2.7, General Business Principles
section 6.1, Our approach to risk management and business control
|
Annual Report 2013 243
13 | Sustainability statements 13.5 - 13.5 |
| | | | | | | | | profile
disclosure | | description | | cross-reference | | | | | | | | | social performance and the status of their implementation | | sub-section 5.2.7, General Business Principles section 7.1, Our approach to risk management and business control See www.philips.com/gbpGeneral Business Principles. | | | | | | | G4-57 | | The internal and external mechanisms for seeking advice on ethical and lawful behavior, and matters related to organizational integrity, such as helplines or advice lines | | sub-section 4.2.7,5.2.7, General Business Principles section 6.1,7.1, Our approach to risk management and business control | | | | | | | G4-58 | | The internal and external mechanisms for reporting concerns about unethical or unlawful behavior, and matters related to organizational integrity, such as escalation through line management, whistleblowing mechanisms or hotlines | | sub-section 13.2.1,14.2.5, General Business Principles | | Specific Standard Disclosures | | | | | | | | | | | | | | | profile
disclosure
| | description | | cross-reference | | Economic | | | | | | | | | | | | Economic performance | | | | | | | | | | | | | G4-EC1 | | Direct economic value generated and distributed, including revenues, operating costs, employee wages and benefits, payments to providers of capital, payments to government (by country) and community investments; EVG&D separately at country, regional or market level | | chapter 1, Performance highlights section 4.2, How we create value sub-section 4.2.9, Social Investment Programs14.2.6, The Philips Foundation note 2, Information by sector and main country section 13.1,14.1, Economic indicators | | | | | | | G4-EC2 | | Financial implications and other risks and opportunities for the organization’s activities due to climate change | | sub-section 4.3.1,5.3.1, Green Innovation sub-section 4.3.2,5.3.2, Green Product sales section 6.4,7.4, Operational risks - “Any damage to Philips’ reputation could have an adverse effect on its businesses.” sub-section 13.3.2, Biodiversity14.3.1, EcoVision - “Operational carbon footprint and energy efficiency - 2015 details” sub-section 14.3.3, Green Operations |
242 Annual Report 2015
Sustainability statements 14.5 | | | | | | | | | | profile
disclosure | | description | | cross-reference | | | | | | | G4-EC3 | | Coverage of the organization’s defined- benefitdefined-benefit plan obligations | | note 30,20, Post-employment benefits | | | | | | | G4-EC4 | | Significant financial assistance received from government | | Philips does not receive significant financial assistance from governments. | | | | | | Market presence | | | | | | | | | | | | | G4-EC5 | | Ratios of standard entry level wage by gender compared to local minimum wage at significant locations of operation | | For all Philips businesses, guidance is applicable regarding equal and fair treatment and wages and payment. See www.philips.com/gbp (GBPGeneral Business Principles - 4.3 Equal and fair treatment and 4.4 Wages and payment)“1.1 Fair employment practices”. Actual ratios are managed and monitored at local level. Philips considers this ratio on consolidated level not relevant. | | | | | | | G4-EC6 | | Procedures for local hiring and proportion of senior management hired from the local community at significant locations of operation | | sub-section 4.2.3, Diversity and inclusion5.2.3, Inclusion sub-section 4.2.4,5.2.4, Employment | | | | | | Indirect economic impacts | | | | | | | | | | | | | G4-EC7 | | Development and impact of infrastructure investments and services supported | | sub-section 4.2.8, Stakeholder engagement5.2.8, Working with stakeholders sub-section 4.2.9, Social Investment Programs14.2.6, The Philips Foundation sub-section 5.1.3, 20136.1.3, 2015 business highlights sub-section 5.3.3, 20136.3.3, 2015 business highlights sub-section 14.2.7, Stakeholder Engagement | | | | | | | G4-EC8 | | Significant indirect economic impacts, including the extent of impacts | | sub-section 4.2.8, Stakeholder engagement5.2.8, Working with stakeholders sub-section 4.2.9, Social Investment Programs14.2.6, The Philips Foundation sub-section 5.1.3, 20136.1.3, 2015 business highlights sub-section 5.3.3, 20136.3.3, 2015 business highlights sub-section 14.2.7, Stakeholder Engagement | | | | | | Procurement practices | | | | | | | | | | | | | G4-EC9 | | Proportion of spending on local suppliers at significant locations of operation | | section 13.1,14.1, Economic indicators Related content: Supplier sustainability Related content: Involvement programSustainability Goals and Progress
|
244 Annual Report 2013
13 Sustainability statements 13.5 - 13.5
|
| | | | | | | | | | | profile
disclosure
| | description | | cross-reference | | | | | | Environment | | | | | | | | | | | | Materials | | | | | | | | | | | | | G4-EN1 | | Materials used by weight or volume | | sub-section 4.3.3, Green Operationssection 4.2, How we create value
sub-section 13.3.3,5.3.1, Green OperationsInnovation sub-section 5.3.2, Green Product sales sub-section 6.2.5, Delivering on EcoVision sustainability commitments chapter 16, Five-year overview | | | | | | | G4-EN2 | | Percentage of materials used that are recycled input materials | | section 4.2, How we create value sub-section 4.3.1,5.3.1, Green Innovation sub-section 4.3.3,5.3.2, Green OperationsProduct sales sub-section 6.2.5, Delivering on EcoVision sustainability commitments chapter 13, Sustainability statements sub-section 13.3.3, Green Operations16, Five-year overview
| | | | | | Energy | | | | | | | | | | | | | G4-EN3 | | Energy consumption within the organization | | sub-section 4.3.3,5.3.3, Green Operations sub-section 13.3.3,14.3.3, Green Operations | | | | | | | G4-EN4 | | Energy consumption outside of the organization | | sub-section 13.2.2,14.2.8, Supplier indicators Philips does not report this indicator - “Other sustainability initiatives in the Annual Report, but in the Carbon Disclosure Project (CDP) reporting.
our supply chain” | | | | | | | G4-EN5 | | Energy intensity | | sub-section 4.3.3,5.3.3, Green Operations sub-section 13.3.1,14.3.1, EcoVision | | | | | | | G4-EN6 | | Reduction of energy consumption | | sub-section 4.3.3,5.3.3, Green Operations sub-section 13.3.3,14.3.3, Green Operations | | | | | | | G4-EN7 | | Reductions in energy requirements of products and services | | sub-section 4.3.1,5.3.1, Green Innovation sub-section 4.3.2,5.3.2, Green Product sales chapter 13,14, Sustainability statements | | | | | | Water | | | | | | | | | | | | | G4-EN8 | | Total water withdrawal by source | | sub-section 4.3.3,5.3.3, Green Operations sub-section 13.3.3,14.3.3, Green Operations | | | | | | | G4-EN9 | | Water sources significantly affected by withdrawal of water | | Philips is not a water-intensive company, so this indicator is not applicable for Philips. | | | | | | | G4-EN10 | | Percentage and total volume of water recycled and reused | | Philips is not a water-intensive company, so this indicator is not applicable for Philips. | | | | | | Biodiversity | | | | | | | | | | | | | G4-EN11 | | Location and size of land owned, leased, managed in or adjacent to protected areas and areas of high biodiversity value outside protected areas | | sub-section 13.3.2,14.3.2, Biodiversity |
Annual Report 2015 243
Sustainability statements 14.5 | | | | | | | This data is currently not available for all sites. Philips plans to report on this indicator in 2014.
| | | profile
disclosure | | description | | cross-reference | | | | | | | G4-EN12 | | Description of significant impacts of activities, products and services on biodiversity in protected areas and areas of high biodiversity value outside protected areas | | sub-section 13.3.2,14.3.2, Biodiversity This data is currently not available for all sites. Philips plans to report on this indicator in 2014.
| | | | | | | G4-EN13 | | Habitats protected or restored | | sub-section 13.3.2,14.3.2, Biodiversity This data is currently not available for all sites. Philips plans to report on this indicator in 2014.
| | | | | | | G4-EN14 | | Total number of IUCN Red List species and national conservation list species with habitats in areas affected by operations, by level of extinction risk | | sub-section 13.3.2,14.3.2, Biodiversity This data is currently not available for all sites. Philips plans to report on this indicator in 2014.
| | | | | | Emissions | | | | | | | | | | | | | G4-EN15 | | Direct greenhouse gas (GHG) emissions (Scope 1) | | sub-section 4.3.3,5.3.3, Green Operations sub-section 13.3.3,14.3.3, Green Operations | | | | | | | G4-EN16 | | Indirect greenhouse gas (GHG) emissions (Scope 2) | | sub-section 4.3.3,5.3.3, Green Operations sub-section 13.3.3,14.3.3, Green Operations | | | | | | | G4-EN17 | | Other indirect greenhouse gas (GHG) emissions (Scope 3) | | sub-section 4.3.3,5.3.3, Green Operations sub-section 13.2.2,14.2.8, Supplier indicators | | | | | | | G4-EN18 | | Greenhouse gas (GHG) emissions intensity | | sub-section 4.3.3,5.3.3, Green Operations | | | | | | | G4-EN19 | | Emissions of ozone-depleting substances (ODS) | | sub-section 13.3.3,14.3.3, Green Operations | | | | | | | G4-EN20 | | Emissions of ozone-depleting substances by weight | | sub-section 13.3.3,14.3.3, Green Operations | | | | | | | G4-EN21 | | NOx, SOx, and other significant air emissions | | Philips does not report this indicator in the Annual Report, but in the Carbon Disclosure Project (CDP) reporting. | | | | | | Effluents and Waste | | | | | | | | | | | | | G4-EN22 | | Total water discharge by quality and destination | | Philips is not a water-intensive company, so this indicator is not applicable for Philips. |
Annual Report 2013 245
13 Sustainability statements 13.5 - 13.5
| | | | | | | | | profile
disclosure | | description | | cross-reference | | | | | | | G4-EN23 | | Total weight of waste by type and disposal method | | sub-section 4.3.3,5.3.3, Green Operations sub-section 13.3.3,14.3.3, Green Operations | | | | | | | G4-EN24 | | Total number and volume of significant spills | | sub-section 13.3.3,14.3.3, Green Operations | | | | | | | G4-EN25 | | Weight of transported, imported, exported, or treated waste deemed hazardous under the terms of the Basel Convention2 Annex I, II, III, and VIII, and percentage of transported waste shipped internationally | | sub-section 13.3.3,14.3.3, Green Operations | | | | | | | G4-EN26 | | Identity, size, protected status, and biodiversity value of water bodies and related habitats significantly affected by the organization’s discharges of water and runoff | | sub-section 13.3.2,14.3.2, Biodiversity This data is currently not available for all sites. Philips plans to report on this indicator in 2014.
- “GRI Biodiversity” | | | | | | Products and Services | | | | | | | | | | | | | G4-EN27 | | Extent of impact mitigation of environmental impacts of products and services | | sub-section 4.3.1,5.3.1, Green Innovation | | | | | | | G4-EN28 | | Percentage of products sold and their packaging materials that are reclaimed by category | | sub-section 4.3.1,5.3.1, Green Innovation | | | | | | Compliance | | | | | | | | | | | | | G4-EN29 | | Monetary value of significant fines and total number of non-monetary sanctions for non-compliance with environmental laws and regulations | | note 26, Contingent assets and liabilities sub-section 14.3.3, Green Operations – “Environmental Incidents” | | | | | | Transport | | | | | | | | | | | | | G4-EN30 | | Significant environmental impacts of transporting products and other goods and materials for the organization’s operations, and transporting members of the workforce | | sub-section 4.3.3,5.3.3, Green Operations | | | | | | Overall | | | | | | | | | | | | | G4-EN31 | | Total environmental protection expenditures and investments by type | | chapter 13,14, Sustainability statements sub-section 13.3.2,14.2.7, Stakeholder Engagement - “Working on global issues” sub-section 14.3.2, Biodiversity Philips does not monitor such expenditures at Group level | | | | | | Supplier environmental assessment | | | | | | | | | | | | | G4-EN32 | | Percentage of new suppliers that were screened using environmental criteria | | sub-section 4.2.10,5.2.9, Supplier sustainability chapter 13,14, Sustainability statements - “Supplier audits” | | | | | | | G4-EN33 | | Significant actual and potential negative environmental impacts in the supply chain and actions taken | | sub-section 13.2.2,14.2.8, Supplier indicators |
244 Annual Report 2015
Sustainability statements 14.5 | | | | | | | | | | profile
disclosure | | description | | cross-reference | | | | | | Environmental grievance mechanisms | | | | | | | | | | | Environmental grievance mechanisms | | G4-EN34 | | Number of grievances about environmental impacts filed, addressed, and resolved through formal grievance mechanisms | | sub-section 13.3.3,14.3.3, Green Operations - environmental incidents“Environmental Incidents” | | | | | | | | | | | | | profile
disclosure | | description | | cross-reference | | Labor practices and decent work | | | | | | | | | | | | Employment | | | | | | | | | | | | | G4-LA1 | | Total workforce by employment type, employment contract and region | | sub-section 4.2.3, Diversity and inclusion5.2.3, Inclusion sub-section 4.2.4,5.2.4, Employment note 3,6, Income from operations | | | | | | | G4-LA2 | | Benefits provided to full-time employees that are not provided to temporary or part- timepart-time employees, by significant locations of operation | | Benefits provided are fully compliant with all applicable national laws. See See www.philips.com/gbp
(GBP Directives - 9.10 Employment conditions)General Business Principles.
| | | | | | | G4-LA3 | | Return to work and retention rates after parental leave, by gender | | For all Philips businesses, guidance is applicable regarding equal and fair treatment. See See www.philips.com/gbpGeneral Business Principles.
(GBP Directives - 9.7 Equal and fair treatment)
|
246 Annual Report 2013
13 Sustainability statements 13.5 - 13.5
| | | | | | | | | profile
disclosure | | description | | cross-reference | | | | | | | | | | | Actual rates are managed and monitored at local level. Philips considers this rate on consolidated level not relevant. | | | | | | Labor/Management relations | | | | | | | | | | | | | G4-LA4 | | Minimum notice periods regarding operational changes, including whether these are specified in collective agreements | | For all Philips businesses, guidance is applicable regarding Employment conditions. See See www.philips.com/gbp
(GBP Directives - 9.10 Employment conditions)General Business Principles.
Notice periods are managed and monitored at local level. Philips considers this data on consolidated level not relevant. | | | | | | Occupational health and safety | | | | | | | | | | | | | G4-LA5 | | Percentage of total workforce represented in formal joint management–worker health and safety committees that help monitor and advise on occupational health and safety programs | | On sector level, different initiatives exist to help decrease the number and severeness of Lost Workday Injuries cases. See sub-section 4.2.6,5.2.6, Health and Safety The percentage of total workforce represented is managed and monitored at local level. Philips considers this data on consolidated level not relevant. | | | | | | | G4-LA6 | | Type of injury and rates of injury, occupational diseases, lost days, and absenteeism, and total number of work- relatedwork-related fatalities, by region and by gender | | sub-section 4.2.6,5.2.6, Health and Safety Sustainabilitysub-section 14.3.3, Green Operations - “Sustainability world mapmap”
On site level, insights exist in gender specific information. Philips considers this data on consolidated level not relevant. | | | | | | | G4-LA7 | | Workers with high incidence or high risk of diseases related to their occupation | | sub-section 4.2.6,5.2.6, Health and Safety | | | | | | | G4-LA8 | | Health and safety topics covered in formal agreements with trade unions | | See www.philips.com/gbp (GBP - 4.1 Right to organize and 4.2 Health and safety)General Business Principles.
The content of formal agreements with trade unions varies per country. The inclusion of Health and Safety topics in these agreements is monitored locally and not considered relevant to be reported at Group level. | | | | | | Training and education | | | | | | | | | | | | | G4-LA9 | | Average hours of training per year per employee by gender, and by employee category | | sub-section 4.2.5,5.2.5, Developing our people The number of enrollments and the training spend are managed and monitored on consolidated level. The hours of training per year per employee are managed and monitored on local level. Philips considers these data on consolidated level not relevant. | | | | | | | G4-LA10 | | Programs for skills management and lifelong learning that support the continued employability of employees and assist them in managing career endings | | Our people, our culture
sub-section 4.2.5,5.2.5, Developing our people | | | | | | | G4-LA11 | | Percentage of employees receiving regular performance and career development reviews, by gender and by employee category | | sub-section 4.2.5,5.2.5, Developing our people Philips implemented a semi-annual performance review, but does not track the percentage of employees benefitting from this centrally. | | | | | | Diversity and equal opportunity | | | | | | | | | | | | | G4-LA12 | | Composition of governance bodies and breakdown of employees per category according to gender, age group, minority group membership and other indicators of diversity | | sub-section 4.2.3, Diversity and inclusion5.2.3, Inclusion section 10.1,11.1, Board of Management section 10.2,11.2, Supervisory Board | | | | | | Equal remuneration for women and men | | | | | | |
Annual Report 2015 245
Sustainability statements 14.5 | | | | | | | | | | profile
disclosure | | description | | cross-reference | | | | | | | G4-LA13 | | Ratio of basic salary and remuneration of women to men by employee category, by significant locations of operation | | For all Philips businesses, guidance is applicable regarding equal and fair treatment and wages and payment. See www.philips.com/gbpGeneral Business Principles. (GBP - 4.3 Equal and fair treatment and 4.4 Wages and payment). Actual ratios are managed and monitored at local level. Philips considers this ratio on consolidated level not relevant.
| | | | | | Supplier assessment for labor practices | | | | | | | | | | | | | G4-LA14 | | Percentage of new suppliers that were screened using labor practices criteria | | sub-section 4.2.10,5.2.9, Supplier sustainability chapter 13,14, Sustainability statements - “Supplier audits” | | | | | | | G4-LA15 | | Significant actual and potential negative impacts for labor practices in the supply chain and actions taken | | sub-section 13.2.2,14.2.8, Supplier indicators |
Annual Report 2013 247
13 Sustainability statements 13.5 - 13.5
| | | | | | | | | profile
disclosure | | description | | cross-reference | | | | | | Labor practices grievance mechanisms | | | | | | | | | | | | | G4-LA16 | | Number of grievances about labor practices filed, addressed, and resolved through formal grievance mechanisms | | sub-section 4.2.10,5.2.9, Supplier sustainability sub-section 13.2.1,14.2.5, General Business Principles sub-section 13.2.2,14.2.8, Supplier indicators See www.philips.com/gbpGeneral Business Principles. | | | | | | | | | | | | | profile
disclosure | | description | | cross-reference | Human rights Investment | | | | | | | | | | | | Investment | | | | | | | | | | | | | G4-HR1 | | Total number and percentage of significant investment agreements and contracts that include human rights clauses or that underwent human rights screening | | sub-section 4.2.10,5.2.9, Supplier sustainability chapter 13,14, Sustainability statements See www.philips.com/gbpGeneral Business Principles. Philips does not monitor the percentage centrally. | | | | | | | G4-HR2 | | Total hours of employee training on human rights policies or procedures concerning aspects of human rights that are relevant to operations, including the percentage of employees trained | | sub-section 4.2.7,5.2.7, General Business Principles sub-section 13.2.1,14.2.5, General Business Principles sub-section 13.2.2,14.2.8, Supplier indicators For all Philips businesses, guidance is applicable regarding employee training on human rights policies as part of the GBP. Total hours of employee training are managed and monitored at local level. Philips considers these data on consolidated level not relevant. | | | | | | Non-discrimination | | | | | | | | | | | | | G4-HR3 | | Total number of incidents of discrimination and actions taken | | sub-section 13.2.1,14.2.5, General Business Principles sub-section 13.2.2,14.2.8, Supplier indicators | | | | | | Freedom of association and collective bargaining | | | | | | | | | | | | | G4-HR4 | | Operations and suppliers identified in which the right to exercise freedom of association and collective bargaining may be violated or at significant risk, and measures taken to support these rights | | sub-section 13.2.1,14.2.5, General Business Principles sub-section 13.2.2,14.2.8, Supplier indicators | | | | | | Child Labor | | | | | | | | | | | | | G4-HR5 | | Operations and suppliers identified as having significant risk for incidents of child labor, and measures taken to contribute to the effective abolition of child labor | | sub-section 13.2.1,14.2.5, General Business Principles sub-section 13.2.2,14.2.8, Supplier indicators | | | | | | Forced or compulsory labor | | | | | | | | | | | | | G4-HR6 | | Operations and suppliers identified as having significant risk for incidents of forced or compulsory labor, and measures to contribute to the elimination of all forms of forced or compulsory labor | | sub-section 13.2.1,14.2.5, General Business Principles sub-section 13.2.2,14.2.8, Supplier indicators | | | | | | Security practices | | | | | | | | | | | | | G4-HR7 | | Percentage of security personnel trained in the organization’s human rights policies or procedures that are relevant to operations | | The actual percentage of security personnel trained in the organization’s human rights policies or procedures that are relevant to operations is managed and monitored at local level. Philips considers this data on consolidated level not relevant. | | | | | | Indigenous rights | | | | | | | | | | | | | G4-HR8 | | Total number of incidents of violations involving rights of indigenous people and actions taken | | Philips is not operational in areas with indigenous people. Therefore this indicator is not relevant. | | | | | | Assessment | | | | | | | | | | | | | G4-HR9 | | Total number and percentage of operations that have been subject to human rights reviews or impact assessments | | The total number and percentage of operations that have been subject to human rights reviews or impact assess- |
246 Annual Report 2015
Sustainability statements 14.5 | | | | | | | | | | profile
disclosure | | description | | cross-reference | | | | | | | | | human rights reviews or impact assessments | | ments are managed and monitored at local level. Philips considers this data on consolidated level not relevant. | | | | | | Supplier human rights assessment | | | | | | | | | | | | | G4-HR10 | | Percentage of new suppliers that were screened using human rights criteria | | sub-section 4.2.10,5.2.9, Supplier sustainability |
248 Annual Report 2013
13 Sustainability statements 13.5 - 13.5
| | | | | | | | | profile
disclosure | | description | | cross-reference | | | | | | | | | | | sub-section 4.2.11, Conflict minerals:5.2.10, Addressing issues further downdeeper in the supply chain chapter 13,14, Sustainability statements - “Supplier audits” | | | | | | | G4-HR11 | | Significant actual and potential negative human rights impacts in the supply chain and actions taken | | sub-section 13.2.2,14.2.8, Supplier indicators | | | | | | Human rights grievance mechanisms | | | | | | | | | | | | | G4-HR12 | | Number of grievances about human rights impacts filed, addressed, and resolved through formal grievance mechanisms | | sub-section 4.2.10,5.2.9, Supplier sustainability sub-section 13.2.1,14.2.5, General Business Principles sub-section 13.2.2,14.2.8, Supplier indicators See www.philips.com/gbpGeneral Business Principles. | | | | | | | | | | | | | profile
disclosure | | description | | cross-reference | | Society | | | | | | | | Local Communities | | | | | | | | | | | | | G4-SO1 | | Percentage of operations with implemented local community engagement, impact assessments, and development programs | | sub-section 4.2.8, Stakeholder engagement5.2.8, Working with stakeholders sub-section 4.2.9, Social Investment Programs sub-section 5.1.3, 20136.1.3, 2015 business highlights
sub-section 5.3.3, 20136.3.3, 2015 business highlights sub-section 14.2.7, Stakeholder Engagement Philips has groupwide community involvement programs and policies that its sites implement and evaluate at local level. Philips does not consider the calculation of an overall percentage as relevant in this context. | | | | | | | G4-SO2 | | Operations with significant actual or potential negative impacts on local communities | | Sustainabilitysub-section 14.3.3, Green Operations - “Sustainability world mapmap” | | | | | | Anti-corruption | | | | | | | | | | | | | G4-SO3 | | Total number and percentage of operations assessed for risks related to corruption and the significant risks identified | | section 6.1,7.1, Our approach to risk management and business control sub-section 13.2.1,14.2.5, General Business Principles | | | | | | | G4-SO4 | | Communication and training on anti-corruption policies and procedures | | sub-section 4.2.7,5.2.7, General Business Principles | | | | | | | G4-SO5 | | Confirmed incidents of corruption and actions taken | | sub-section 13.2.1,14.2.5, General Business Principles | | | | | | Public Policy | | | | | | | | | | | | | G4-SO6 | | Total value of political contributions by country and recipient/beneficiary | | Philips does not make political contributions as defined in www.philips.com/gbp (GBP DirectivesGeneral Business Principles - chapter 72.5 Dealing responsibly with governments,government, political parties and politicians)
politicians. | | | | | | Anti-competitive Behavior | | | | | | | | | | | | | G4-SO7 | | Total number of legal actions for anti- competitiveanti-competitive behavior, anti-trust, and monopoly practices and their outcomes | | section 6.5,7.5, Compliance risks | | | | | | Compliance | | | | | | | | | | | | | G4-SO8 | | Monetary value of significant fines and total number of non-monetary sanctions for non-compliance with laws and regulations | | note 26, Contingent assets and liabilities | | | | | | Supplier assessment for impacts on society | | | | | | | | | | | | | G4-SO9 | | Percentage of new suppliers that were screened using criteria for impacts on society | | sub-section 4.2.10,5.2.9, Supplier sustainability sub-section 4.2.11, Conflict minerals: issues further down the chain
chapter 13,14, Sustainability statements | | | | | | | G4-SO10 | | Significant actual and potential negative impacts on society in the supply chain and actions taken | | sub-section 13.2.2,14.2.8, Supplier indicators | | | | | | Grievance mechanisms for impacts on society | | | | | | |
Annual Report 2013 249
13 Sustainability statements 13.5 - 13.5
| | | | | | | | | profile
disclosure
| | description | | cross-reference | | | | | | | G4-SO11 | | Number of grievances about impacts on society filed, addressed, and resolved through formal grievance mechanisms | | sub-section 4.2.10,5.2.9, Supplier sustainability sub-section 13.2.1,14.2.5, General Business Principles sub-section 13.2.2,14.2.8, Supplier indicators sub-section 13.3.3,14.3.3, Green Operations - “Environmental incidents” See www.philips.com/gbpGeneral Business Principles. | |
Annual Report 2015 247
Sustainability statements 14.5 | | | | | | | | | | | profile
disclosure
| | description | | cross-reference | | Product responsibility | | | | | | | | | | | | Customer health and safety | | | | | | | | | | | | | G4-PR1 | | Life cycle stages in which health and safety impacts of products and services are assessed for improvement, and percentage of significant products and services categories subject to such procedures | | All significant products are assessed in terms of Health and Safety impact during the design phase as part of our EcoDesign procedure, but also during the sourcing phase. For more information on EcoDesign refer to sub-section 5.1.2, About Philips Healthcare 5.3.1, Green Innovation, for more information on our sourcing refer tosub-section 5.2.2, About Philips Consumer Lifestyle sub-section 5.3.2, About Philips Lighting
14.2.8, Supplier indicators. | | | | | | | G4-PR2 | | Total number of incidents of non-compliance with regulations and voluntary codes concerning the health and safety impacts of products and services during their life cycle, by type of outcomes | | Philips plansAs defined in the G4 Implementation Manual, no incidents of non-compliance related to report on this indicatorany type of court order took place in 2014.2015. Information on current consumer product recalls can be found at www.recall.philips.com.onwww.recall.philips.com | | | | | | Product and service labeling | | | | | | | | | | | | | G4-PR3 | | Type of product and service information required by procedures, and percentage of significant products and services subject to such information requirements | | sub-section 5.1.2, About Philips Healthcare
sub-section 5.2.2, About Philips Consumer Lifestyle
sub-section 5.3.2, About Philips Lighting
The type of product and service information provided on our products is based on local and/or regional requirements e.g. EU-CE safety marking and performance markings based on ErP directive. For all significant products certain kind of labelling is needed based on different regulations. | | | | | | | G4-PR4 | | Total number of incidents of non-compliance with regulations and voluntary codes concerning product and service information and labeling, by type of outcomes | | Philips plansAs defined in the G4 Implementation Manual, no incidents of non-compliance related to report on this indicatorany type of court order took place in 2014.2015. | | | | | | | G4-PR5 | | Results of surveys measuring customer satisfaction | | Philips measures the Net Promoter Scores, but does not disclose these for confidentiality reason. | | | | | | Marketing communications | | | | | | | | | | | | | G4-PR6 | | Sale of banned or disputed products | | To the best of our knowledge, Philips plans to report on this indicatordid not sell any banned or disputed products in 2014. Refer also to www.philips.com/gbp2015. | | | | | | | G4-PR7 | | Total number of incidents of non-compliance with regulations and voluntary codes concerning marketing communications, including advertising, promotion, and sponsorship, by type of outcomes | | Philips plansAs defined in the G4 Implementation Manual, no incidents of non-compliance related to report on this indicatorany type of court order took place in 2014. Refer also to www.philips.com/gbp2015. | | | | | | Customer privacy | | | | | | | | | | | | | G4-PR8 | | Total number of substantiated complaints regarding breaches of customer privacy and losses of customer data | | section 6.5, Compliance risksTo the best of our knowledge, Philips did not receive any substantiated complaints regarding breaches of customer privacy and losses of customer data in 2015. | | | | | | Compliance | | | | | | | | | | | | | G4-PR9 | | Monetary value of significant fines for non-compliance with laws and regulations concerning the provision and use of products and services | | note 26, Contingent assets and liabilities | |
Disclosure of management approach | | | | | | | | Material aspectsAspects | | DMA and Indicators | | Omissions | | External Assurance | | | | | chapter 13,14, Sustainability statements - “Key material aspects” | | chapter 13,14, Sustainability statements - “Key material aspects” section 13.5,14.5, Global Reporting Initiative (GRI) table 4.0 - “Specific Standard Disclosures” | | section 13.5,14.5, Global Reporting Initiative (GRI) table 4.0 - “Cross-reference”“Cross-reference” | | chapter 13, Sustainability statements - “Key material aspects” (Footnote 1)section 14.4, Independent Auditor’s Assurance Report | |
250248 Annual Report 20132015
14 Reconciliation of non-GAAP information 14 - 14
15��
1415 Reconciliation of non-GAAP information
Explanation of Non-GAAP measures Koninklijke Philips N.V. (the ‘Company’) believes that an understanding of sales performance, capital efficiency, financial strength and its funding requirements is enhanced when the effects of currency movementsby introducing certain Non-GAAP measures, respectively Comparable sales growth, EBITA, Net operating capital, Net debt and acquisitionsFree cash flow. In this chapter these measures are further explained and divestments (changes in consolidation) are excluded. Accordingly, in additionreconciled to presenting ‘nominal growth’, ‘comparable growth’ is provided.GAAP measures. Comparable sales growth Comparable sales exclude the effects of currency movements and changes in consolidation. As indicated in thenote 1, Significant accounting policies, sales and income are translated from foreign currencies into the Company’s reporting currency, the euro, at the exchange rate on transaction dates during the respective years. As a result of significant currency movements during the years presented, the effects of translating foreign currency sales amounts into euros could have a material impact. Therefore, these impacts have been excluded in arriving at the comparable sales in euros. Currency effects have been calculated by translating previous years’ foreign currency sales amounts into euros at the following year’s exchange rates in comparison with the sales in euros as historically reported. Years under review were characterized by a number of acquisitions and divestments, as a result of which activities were consolidated or deconsolidated. The effect of consolidation changes has also been excluded in arriving at the comparable sales. For the purpose of calculating comparable sales growth, when a previously consolidated entity is sold or contributed to a venture that is not consolidated by the Company, relevant sales are excluded from impacted prior-year periods. Similarly, when an entity is acquired, relevant sales are excluded from impacted periods. Philips Group Sales growth composition per sectorin % 2013 - 2015 | | | | | | | | | | | | | | | | | | | | | | | | | comparable growth | | | currency effects | | | consolidation changes | | | nominal growth | | | | | | | 2015 versus 2014 | | | | | | | | | | | | | | | | | Healthcare | | | 3.8 | | | | 11.7 | | | | 3.3 | | | | 18.8 | | Consumer Lifestyle | | | 5.8 | | | | 7.2 | | | | 0.0 | | | | 13.0 | | Lighting | | | (2.8 | ) | | | 8.5 | | | | 2.2 | | | | 7.9 | | Innovation, Group & Services | | | 5.4 | | | | 1.7 | | | | (12.2 | ) | | | (5.1 | ) | | | | | | Philips Group | | | 2.2 | | | | 9.4 | | | | 1.7 | | | | 13.3 | | | | | | | 2014 versus 2013 | | | | | | | | | | | | | | | | | Healthcare | | | (2.0 | ) | | | (1.6 | ) | | | (0.5 | ) | | | (4.1 | ) | Consumer Lifestyle | | | 5.8 | | | | (3.1 | ) | | | 0.0 | | | | 2.7 | | Lighting | | | (2.6 | ) | | | (2.3 | ) | | | 1.0 | | | | (3.9 | ) | Innovation, Group & Services | | | (11.8 | ) | | | (0.1 | ) | | | 2.9 | | | | (9.0 | ) | | | | | | Philips Group | | | (0.9 | ) | | | (2.0 | ) | | | 0.2 | | | | (2.7 | ) | | | | | | 2013 versus 2012 | | | | | | | | | | | | | | | | | Healthcare | | | 0.8 | | | | (4.6 | ) | | | (0.3 | ) | | | (4.1 | ) | Consumer Lifestyle | | | 10.0 | | | | (3.4 | ) | | | 0.0 | | | | 6.6 | | Lighting | | | 1.3 | | | | (3.5 | ) | | | 0.0 | | | | (2.2 | ) | Innovation, Group & Services | | | (0.3 | ) | | | (0.4 | ) | | | 6.4 | | | | 5.7 | | | | | | | Philips Group | | | 2.7 | | | | (3.9 | ) | | | 0.1 | | | | (1.1 | ) | | | | | |
Annual Report 2015 249
Reconciliation of non-GAAP information 15 Philips Group Sales growth composition per geographic clusterin % 2013 - 2015 | | | | | | | | | | | | | | | | | | | | | | | | | comparable growth | | | currency effects | | | consolidation changes | | | nominal growth | | | | | | | 2015 versus 2014 | | | | | | | | | | | | | | | | | Western Europe | | | 1.3 | | | | 1.9 | | | | 0.7 | | | | 3.9 | | North America | | | 1.4 | | | | 18.4 | | | | 1.4 | | | | 21.2 | | Other mature geographies | | | 2.7 | | | | 5.3 | | | | 3.7 | | | | 11.7 | | | | | | | Mature geographies | | | 1.5 | | | | 10.2 | | | | 1.4 | | | | 13.1 | | Growth geographies | | | 3.5 | | | | 7.9 | | | | 2.4 | | | | 13.8 | | | | | | | Philips Group | | | 2.2 | | | | 9.4 | | | | 1.7 | | | | 13.3 | | | | | | | 2014 versus 2013 | | | | | | | | | | | | | | | | | Western Europe | | | (0.9 | ) | | | 0.4 | | | | 0.2 | | | | (0.3 | ) | North America | | | (1.8 | ) | | | (0.9 | ) | | | (0.3 | ) | | | (3.0 | ) | Other mature geographies | | | (0.9 | ) | | | (4.7 | ) | | | 0.0 | | | | (5.6 | ) | | | | | | Mature geographies | | | (1.3 | ) | | | (0.8 | ) | | | (0.1 | ) | | | (2.2 | ) | Growth geographies | | | 0.0 | | | | (4.4 | ) | | | 0.7 | | | | (3.7 | ) | | | | | | Philips Group | | | (0.9 | ) | | | (2.0 | ) | | | 0.2 | | | | (2.7 | ) | | | | | | 2013 versus 2012 | | | | | | | | | | | | | | | | | Western Europe | | | 0.0 | | | | (0.6 | ) | | | 0.5 | | | | (0.1 | ) | North America | | | (2.9 | ) | | | (3.1 | ) | | | (0.2 | ) | | | (6.2 | ) | Other mature geographies | | | 10.1 | | | | (13.5 | ) | | | 0.0 | | | | (3.4 | ) | | | | | | Mature geographies | | | (0.3 | ) | | | (3.3 | ) | | | 0.1 | | | | (3.5 | ) | Growth geographies | | | 8.9 | | | | (5.1 | ) | | | 0.0 | | | | 3.8 | | | | | | | Philips Group | | | 2.7 | | | | (3.9 | ) | | | 0.1 | | | | (1.1 | ) | | | | | |
Adjusted IFO The Company uses the term IFO and Adjusted IFO to evaluate the performance of the Philips Group and its operating sectors. The term IFO has the same meaning as Income from operations (IFO). Referencing Adjusted IFO will make the underlying performance of our businesses more transparent by factoring outexcluding the amortization of acquiredand impairment on intangible assets.assets (excluding software and capitalized development expenses). As a consequence Adjusted income from operationsIFO represents income from operations before amortization and impairment of intangible assets generated in acquisitions (excluding software and capitalized development expenses).acquisitions. Philips Group Adjusted IFO to Income from operations (or IFO)in millions of EUR 2013 - 2015 | | | | | | | | | | | | | | | | | | | | | | | | | | | | | Philips Group | | | Healthcare | | | Consumer Lifestyle | | | Lighting | | | Innovation, Group
& Services | | | | | | | 2015 | | | | | | | | | | | | | | | | | | | | | Adjusted IFO | | | 1,372 | | | | 1,024 | | | | 673 | | | | 594 | | | | (919 | ) | Amortization of intangible assets1) | | | (380 | ) | | | (205 | ) | | | (52 | ) | | | (108 | ) | | | (15 | ) | Impairment of goodwill | | | — | | | | — | | | | — | | | | — | | | | — | | | | | | | Income from operations (or IFO) | | | 992 | | | | 819 | | | | 621 | | | | 486 | | | | (934 | ) | | | | | | | 2014 | | | | | | | | | | | | | | | | | | | | | Adjusted IFO | | | 821 | | | | 616 | | | | 573 | | | | 293 | | | | (661 | ) | Amortization of intangible assets1) | | | (332 | ) | | | (159 | ) | | | (53 | ) | | | (106 | ) | | | (14 | ) | Impairment of goodwill | | | (3 | ) | | | (1 | ) | | | — | | | | (2 | ) | | | — | | | | | | | Income from operations (or IFO) | | | 486 | | | | 456 | | | | 520 | | | | 185 | | | | (675 | ) | | | | | | | 2013 | | | | | | | | | | | | | | | | | | | | | Adjusted IFO | | | 2,276 | | | | 1,512 | | | | 483 | | | | 580 | | | | (299 | ) | Amortization of intangible assets1) | | | (393 | ) | | | (195 | ) | | | (54 | ) | | | (141 | ) | | | (3 | ) | Impairment of goodwill | | | (28 | ) | | | (2 | ) | | | — | | | | (26 | ) | | | — | | | | | | | Income from operations (or IFO) | | | 1,855 | | | | 1,315 | | | | 429 | | | | 413 | | | | (302 | ) | | | | | |
| 1) | Excluding amortization of software and product development. |
250 Annual Report 2015
Reconciliation of non-GAAP information 15 Net operating capital (NOC) The Company believes that an understanding of the Philips Group’s financial condition is enhanced by the disclosure of net operating capital (NOC), as this figure is used by Philips’ management to evaluate the capital efficiency of the Philips Group and its operating sectors. NOC is defined as: total assets excluding assets classified as held for sale less: (a) cash and cash equivalents, (b) deferred tax assets, (c) other non-current financial assets and current financial assets, (d) investments in associates, and after deduction of: (e) long-term provisions and short-term provisions, (f) accounts and notes payable, (g) accrued liabilities, (h) income tax payable, (i) non-current derivative financial liabilities and derivative financial liabilities and (j) other non-current liabilities and other current liabilities. Philips Group Net operating capital to total assetsin millions of EUR 2013 - 2015 | | | | | | | | | | | | | | | | | | | | | | | | | | | | | Philips Group | | | Healthcare | | | Consumer Lifestyle | | | Lighting | | | Innovation, Group
& Services | | | | | | | 2015 | | | | | | | | | | | | | | | | | | | | | Net operating capital (NOC) | | | 11,096 | | | | 9,212 | | | | 1,453 | | | | 3,813 | | | | (3,382 | ) | Exclude liabilities comprised in NOC: | | | | | | | | | | | | | | | | | | | | | - payables/liabilities | | | 9,640 | | | | 3,064 | | | | 1,356 | | | | 1,510 | | | | 3,710 | | - intercompany accounts | | | — | | | | 128 | | | | 36 | | | | 87 | | | | (251 | ) | - provisions | | | 3,225 | | | | 903 | | | | 235 | | | | 446 | | | | 1,641 | | Include assets not comprised in NOC: | | | | | | | | | | | | | | | | | | | | | - investments in associates | | | 181 | | | | 56 | | | | — | | | | 19 | | | | 106 | | - current financial assets | | | 12 | | | | — | | | | — | | | | — | | | | 12 | | - other non-current financial assets | | | 489 | | | | — | | | | — | | | | — | | | | 489 | | - deferred tax assets | | | 2,758 | | | | — | | | | — | | | | — | | | | 2,758 | | - cash and cash equivalents | | | 1,766 | | | | — | | | | — | | | | — | | | | 1,766 | | | | | | | Total assets excluding assets classified as held for sale | | | 29,167 | | | | 13,363 | | | | 3,080 | | | | 5,875 | | | | 6,849 | | Assets classified as held for sale | | | 1,809 | | | | | | | | | | | | | | | | | | | | | | | | | | | | | | | | | | | | | | | Total assets | | | 30,976 | | | | | | | | | | | | | | | | | | | | | | | | 2014 | | | | | | | | | | | | | | | | | | | | | Net operating capital (NOC) | | | 8,838 | | | | 7,565 | | | | 1,353 | | | | 3,638 | | | | (3,718 | ) | Exclude liabilities comprised in NOC: | | | | | | | | | | | | | | | | | | | | | - payables/liabilities | | | 9,379 | | | | 2,711 | | | | 1,411 | | | | 1,422 | | | | 3,835 | | - intercompany accounts | | | — | | | | 125 | | | | 65 | | | | 129 | | | | (319 | ) | - provisions | | | 3,445 | | | | 793 | | | | 220 | | | | 530 | | | | 1,902 | | Include assets not comprised in NOC: | | | | | | | | | | | | | | | | | | | | | - investments in associates | | | 157 | | | | 80 | | | | — | | | | 20 | | | | 57 | | - current financial assets | | | 125 | | | | — | | | | — | | | | — | | | | 125 | | - other non-current financial assets | | | 462 | | | | — | | | | — | | | | — | | | | 462 | | - deferred tax assets | | | 2,460 | | | | — | | | | — | | | | — | | | | 2,460 | | - cash and cash equivalents | | | 1,873 | | | | — | | | | — | | | | — | | | | 1,873 | | | | | | | Total assets excluding assets classified as held for sale | | | 26,739 | | | | 11,274 | | | | 3,049 | | | | 5,739 | | | | 6,677 | | Assets classified as held for sale | | | 1,613 | | | | | | | | | | | | | | | | | | | | | | | | | | | | | | | | | | | | | | | Total assets | | | 28,352 | | | | | | | | | | | | | | | | | | | | | | | | 2013 | | | | | | | | | | | | | | | | | | | | | Net operating capital (NOC) | | | 10,238 | | | | 7,437 | | | | 1,261 | | | | 4,462 | | | | (2,922 | ) | Exclude liabilities comprised in NOC: | | | | | | | | | | | | | | | | | | | | | - payables/ liabilities | | | 8,453 | | | | 2,541 | | | | 1,275 | | | | 1,672 | | | | 2,965 | | - intercompany accounts | | | — | | | | 124 | | | | 75 | | | | 105 | | | | (304 | ) | - provisions | | | 2,554 | | | | 278 | | | | 221 | | | | 452 | | | | 1,603 | | Include assets not comprised in NOC: | | | | | | | | | | | | | | | | | | | | | - investments in associates | | | 161 | | | | 85 | | | | — | | | | 20 | | | | 56 | | - current financial assets | | | 10 | | | | — | | | | — | | | | — | | | | 10 | | - other non-current financial assets | | | 496 | | | | — | | | | — | | | | — | | | | 496 | | - deferred tax assets | | | 1,675 | | | | — | | | | — | | | | — | | | | 1,675 | | - cash and cash equivalents | | | 2,465 | | | | — | | | | — | | | | — | | | | 2,465 | | | | | | | Total assets excluding assets classified as held for sale | | | 26,052 | | | | 10,465 | | | | 2,832 | | | | 6,711 | | | | 6,044 | | Assets classified as held for sale | | | 507 | | | | | | | | | | | | | | | | | | | | | | | | | | | | | | | | | | | | | | | Total assets | | | 26,559 | | | | | | | | | | | | | | | | | | | | | | |
Annual Report 2015 251
Reconciliation of non-GAAP information 15 Net debt Net debt is defined as the sum of long- and short-term debt minus cash and cash equivalents. The net debt position as a percentage of the sum of group equity (shareholders’ equity and non-controlling interests) and net debt is presented to express the financial strength of the Company. This measure is widely used by management and investment analysts and is therefore included in the disclosure. Our Philips Group Composition of net debt position is managed to group equityin such a way that we expect to continiously meet our objective to retain an A3 rating (Moody’s) and A- rating (Standard and Poor’s). Furthermore, the Group’s objective when managing the net debt position is to fulfill our commitment to a stable dividend policy with a 40% to 50% pay-outmillions of continuing net income.EUR unless otherwise stated 2013 - 2015 | | | | | | | | | | | | | | | | | | | | | 2013 | | | 2014 | | | 2015 | | | | | | | Long-term debt | | | 3,309 | | | | 3,712 | | | | 4,095 | | Short-term debt | | | 592 | | | | 392 | | | | 1,665 | | | | | | | Total debt | | | 3,901 | | | | 4,104 | | | | 5,760 | | Cash and cash equivalents | | | 2,465 | | | | 1,873 | | | | 1,766 | | | | | | | Net debt1) | | | 1,436 | | | | 2,231 | | | | 3,994 | | | | | | Shareholders’ equity | | | 11,214 | | | | 10,867 | | | | 11,662 | | Non-controlling interests | | | 13 | | | | 101 | | | | 118 | | | | | | | Group equity | | | 11,227 | | | | 10,968 | | | | 11,780 | | | | | | Net debt and group equity | | | 12,663 | | | | 13,199 | | | | 15,774 | | Net debt divided by net debt and group equity (in %) | | | 11 | % | | | 17 | % | | | 25 | % | Group equity divided by net debt and group equity (in %) | | | 89 | % | | | 83 | % | | | 75 | % | | | | | |
| 1) | Total debt less cash and cash equivalents. |
Free cash flow Cash flows before financing activities, being the sum of net cash from operating activities and net cash from investing activities, and free cash flow, being net cash from operating activities minus net capital expenditures, are presented separately to facilitate the reader’s understanding of the Company’s funding requirements. Net capital expenditures comprise of purchase of intangible assets, proceeds from sale of intangible assets, expenditures on development assets, capital expenditures on property, plant and equipment and proceeds from salesdisposals of property, plant and equipment. This measure is widely used by management to calculate free cash flow. Philips Group AdjustmentsFree cash flowin millions of EUR
2013 - 2015 | | | | | | | | | | | | | | | | | | | | | 2013 | | | 2014 | | | 2015 | | | | | | | Cash flows from operating activities | | | 912 | | | | 1,303 | | | | 1,167 | | Cash flows from investing activities | | | (862 | ) | | | (984 | ) | | | (1,941 | ) | | | | | | Cash flows before financing activities | | | 50 | | | | 319 | | | | (774 | ) | | | | | Cash flows from operating activities | | | 912 | | | | 1,303 | | | | 1,167 | | Net capital expenditures: | | | (830 | ) | | | (806 | ) | | | (842 | ) | Purchase of intangible assets | | | (49 | ) | | | (114 | ) | | | (121 | ) | Expenditures on development assets | | | (326 | ) | | | (295 | ) | | | (314 | ) | Capital expenditures on property, plant and equipment | | | (482 | ) | | | (437 | ) | | | (522 | ) | Proceeds from disposals of property, plant and equipment | | | 27 | | | | 40 | | | | 115 | | | | | | | Free cash flow | | | 82 | | | | 497 | | | | 325 | | | | | | |
252 Annual Report 2015
Five-year overview 16 16 Five-year overview Philips Group General datain millions of EUR unless otherwise stated 2011 - 2015 | | | | | | | | | | | | | | | | | | | | | | | | | | | | | 2011 | | | 2012 | | | 2013 | | | 2014 | | | 2015 | | | | | | | Sales | | | 19,918 | | | | 22,234 | | | | 21,990 | | | | 21,391 | | | | 24,244 | | % increase over previous year | | | 3 | % | | | 12 | % | | | (1 | )% | | | (3 | )% | | | 13 | % | Income from operations (IFO) (loss) | | | (542 | ) | | | 592 | | | | 1,855 | | | | 486 | | | | 992 | | Financial income and expenses - net | | | (331 | ) | | | (329 | ) | | | (330 | ) | | | (301 | ) | | | (369 | ) | Income (loss) from continuing operations | | | (1,106 | ) | | | (166 | ) | | | 1,034 | | | | 221 | | | | 414 | | Income (loss) from continuing operations attributable to shareholders | | | (1,110 | ) | | | (171 | ) | | | 1,031 | | | | 225 | | | | 400 | | Income (loss) from discontinued operations | | | (350 | ) | | | 136 | | | | 138 | | | | 190 | | | | 245 | | Net income (loss) | | | (1,456 | ) | | | (30 | ) | | | 1,172 | | | | 411 | | | | 659 | | Net income (loss) attributable to shareholders | | | (1,460 | ) | | | (35 | ) | | | 1,169 | | | | 415 | | | | 645 | | Free cash flow | | | (53 | ) | | | 1,645 | | | | 82 | | | | 497 | | | | 325 | | Net assets | | | 12,362 | | | | 11,185 | | | | 11,227 | | | | 10,968 | | | | 11,780 | | Turnover rate of net operating capital1) | | | 1.81 | | | | 2.22 | | | | 2.39 | | | | 2.30 | | | | 2.32 | | Total employees at year-end | | | 125,240 | | | | 118,087 | | | | 116,082 | | | | 113,678 | | | | 112,959 | | | | | | |
| 1) | Calculated based upon the values excluding the businesses restated to discontinued operations. |
Philips Group Incomein millions of EUR unless otherwise stated 2011 - 2015 | | | | | | | | | | | | | | | | | | | | | | | | | | | | | 2011 | | | 2012 | | | 2013 | | | 2014 | | | 2015 | | | | | | | IFO | | | (542 | ) | | | 592 | | | | 1,855 | | | | 486 | | | | 992 | | as a % of sales | | | (2.7 | )% | | | 2.7 | % | | | 8.4 | % | | | 2.3 | % | | | 4.1 | % | Adjusted IFO | | | 1,334 | | | | 1,003 | | | | 2,276 | | | | 821 | | | | 1,372 | | as a % of sales | | | 6.7 | % | | | 4.5 | % | | | 10.4 | % | | | 3.8 | % | | | 5.7 | % | Income taxes | | | (248 | ) | | | (218 | ) | | | (466 | ) | | | (26 | ) | | | (239 | ) | as a % of income before taxes | | | 28.4 | % | | | (82.9 | )% | | | (30.6 | )% | | | (14.1 | )% | | | (38.4 | )% | Income (loss) from continuing operations | | | (1,106 | ) | | | (166 | ) | | | 1,034 | | | | 221 | | | | 414 | | as a % of shareholders’ equity (ROE) | | | (8.2 | )% | | | (1.4 | )% | | | 9.4 | % | | | 2.0 | % | | | 3.6 | % | Net income (loss) | | | (1,456 | ) | | | (30 | ) | | | 1,172 | | | | 411 | | | | 659 | | | | | | |
Philips Group Capital employedin millions of EUR unless otherwise stated 2011 - 2015 | | | | | | | | | | | | | | | | | | | | | | | | | | | | | 2011 | | | 2012 | | | 2013 | | | 2014 | | | 2015 | | | | | | | Cash and cash equivalents | | | 3,147 | | | | 3,834 | | | | 2,465 | | | | 1,873 | | | | 1,766 | | Receivables and other current assets | | | 5,567 | | | | 5,128 | | | | 5,220 | | | | 5,591 | | | | 5,655 | | Assets classified as held for sale | | | 551 | | | | 43 | | | | 507 | | | | 1,613 | | | | 1,809 | | Inventories | | | 3,625 | | | | 3,495 | | | | 3,240 | | | | 3,314 | | | | 3,463 | | Non-current financial assets/investments in associates | | | 549 | | | | 726 | | | | 657 | | | | 619 | | | | 670 | | Non-current receivables/assets | | | 1,932 | | | | 2,217 | | | | 1,924 | | | | 2,721 | | | | 3,075 | | Property, plant and equipment | | | 3,014 | | | | 2,959 | | | | 2,780 | | | | 2,095 | | | | 2,322 | | Intangible assets | | | 11,012 | | | | 10,679 | | | | 9,766 | | | | 10,526 | | | | 12,216 | | | | | | | Total assets | | | 29,397 | | | | 29,081 | | | | 26,559 | | | | 28,352 | | | | 30,976 | | | | | | | | Property, plant and equipment: | | | | | | | | | | | | | | | | | | | | | Capital expenditures for the year | | | 477 | | | | 479 | | | | 482 | | | | 437 | | | | 522 | | Depreciation for the year | | | 525 | | | | 588 | | | | 521 | | | | 592 | | | | 582 | | Capital expenditures: depreciation | | | 0.9 | | | | 0.8 | | | | 0.9 | | | | 0.7 | | | | 0.9 | | | | | | | | Inventories as a % of sales1) | | | 16.5 | % | | | 14.1 | % | | | 13.7 | % | | | 15.3 | % | | | 14.2 | % | Outstanding trade receivables, in days sales1) | | | 54 | | | | 50 | | | | 53 | | | | 56 | | | | 56 | | | | | | |
| 1) | Calculated based upon the values excluding inventories and sales related to acquisitions, divestments and discontinued operations |
Annual Report 2015 253
Five-year overview 16 Philips Group Financial structurein millions of EUR unless otherwise stated 2011 - 2015 | | | | | | | | | | | | | | | | | | | | | | | | | | | | | 2011 | | | 2012 | | | 2013 | | | 2014 | | | 2015 | | | | | | | Other liabilities | | | 10,434 | | | | 10,379 | | | | 8,529 | | | | 9,486 | | | | 9,804 | | Liabilities directly associated with assets held for sale | | | 61 | | | | 27 | | | | 348 | | | | 349 | | | | 407 | | Debt | | | 3,860 | | | | 4,534 | | | | 3,901 | | | | 4,104 | | | | 5,760 | | Provisions | | | 2,680 | | | | 2,956 | | | | 2,554 | | | | 3,445 | | | | 3,225 | | | | | | | | | | | Total provisions and liabilities | | | 17,035 | | | | 17,896 | | | | 15,332 | | | | 17,384 | | | | 19,196 | | Shareholders’ equity | | | 12,328 | | | | 11,151 | | | | 11,214 | | | | 10,867 | | | | 11,662 | | Non-controlling interests | | | 34 | | | | 34 | | | | 13 | | | | 101 | | | | 118 | | | | | | | Group equity and liabilities | | | 29,397 | | | | 29,081 | | | | 26,559 | | | | 28,352 | | | | 30,976 | | | | | | | | Net debt: group equity ratio | | | 5:95 | | | | 6:94 | | | | 11:89 | | | | 17:83 | | | | 25:75 | | Market capitalization at year-end | | | 15,077 | | | | 18,200 | | | | 24,340 | | | | 22,082 | | | | 21,607 | | | | | | |
Philips Group Key figures per sharein EUR unless otherwise stated 2011 - 2015 | | | | | | | | | | | | | | | | | | | | | | | | | | | | | 2011 | | | 2012 | | | 2013 | | | 2014 | | | 2015 | | | | | | | Sales per common share | | | 20.90 | | | | 24.11 | | | | 24.14 | | | | 23.37 | | | | 26.46 | | Adjusted IFO per common share - diluted | | | 1.39 | | | | 1.08 | | | | 2.47 | | | | 0.89 | | | | 1.49 | | Weighted average amount of shares outstanding: | | | | | | | | | | | | | | | | | | | | | - basic1) | | | 952,809 | | | | 922,101 | | | | 911,072 | | | | 915,193 | | | | 916,087 | | - diluted1) | | | 957,293 | | | | 927,222 | | | | 922,072 | | | | 922,714 | | | | 923,625 | | Basic earnings per common share: | | | | | | | | | | | | | | | | | | | | | Income (loss) from continuing operations attributable to shareholders per share | | | (1.16 | ) | | | (0.19 | ) | | | 1.13 | | | | 0.25 | | | | 0.44 | | Net income (loss) attributable to shareholders | | | (1.53 | ) | | | (0.04 | ) | | | 1.28 | | | | 0.45 | | | | 0.70 | | Diluted earnings per common share: | | | | | | | | | | | | | | | | | | | | | Income (loss) from continuing operations attributable to shareholders per share | | | (1.16 | ) | | | (0.19 | ) | | | 1.12 | | | | 0.24 | | | | 0.43 | | Net income (loss) attributable to shareholders | | | (1.53 | ) | | | (0.04 | ) | | | 1.27 | | | | 0.45 | | | | 0.70 | | Dividend distributed per common share | | | 0.75 | | | | 0.75 | | | | 0.75 | | | | 0.80 | | | | 0.80 | | Total shareholder return per common share | | | (5.89 | ) | | | 4.37 | | | | 7.50 | | | | (1.70 | ) | | | 0.21 | | Shareholders’ equity per common share | | | 13.31 | | | | 12.19 | | | | 12.28 | | | | 11.88 | | | | 12.72 | | Price/earnings ratio | | | (14.03 | ) | | | (104.74 | ) | | | 23.58 | | | | 96.60 | | | | 53.55 | | Share price at year-end | | | 16.28 | | | | 19.90 | | | | 26.65 | | | | 24.15 | | | | 23.56 | | Highest closing share price during the year | | | 25.34 | | | | 20.33 | | | | 26.78 | | | | 28.10 | | | | 27.65 | | Lowest closing share price during the year | | | 12.23 | | | | 13.76 | | | | 20.26 | | | | 20.98 | | | | 20.79 | | Average share price | | | 18.11 | | | | 16.92 | | | | 23.33 | | | | 24.00 | | | | 24.51 | | Amount of common shares outstanding at year-end1) | | | 926,095 | | | | 914,591 | | | | 913,338 | | | | 914,389 | | | | 917,104 | | | | | | |
254 Annual Report 2015
Five-year overview 16 Philips Group Sustainability 2011 - 2015 | | | | | | | | | | | | | | | | | | | | | | | | | | | | | 2011 | | | 2012 | | | 2013 | | | 2014 | | | 2015 | | | | | | | Lives improved, in billions | | | | | | | 1.6 | | | | 1.7 | | | | 1.9 | | | | 2.0 | | Energy efficiency of products, in lumen/watt | | | 37.6 | | | | 39.3 | | | | 40.1 | | | | 40.5 | | | | 44.5 | | Collection and recycling amount, in tonnes | | | 27,500 | | | | 30,500 | | | | 31,000 | | | | 31,500 | | | | 28,500 | | Recycled material in products, in tonnes | | | 10,000 | | | | 15,000 | | | | 14,000 | | | | 13,000 | | | | 13,500 | | Green Product sales, as a % of total sales | | | 39 | % | | | 46 | % | | | 50 | % | | | 52 | % | | | 54 | % | Green Innovation, in millions of euros | | | 363 | | | | 453 | | | | 405 | | | | 463 | | | | 495 | | Operational carbon footprint, in kilotonnes CO2-equivalent | | | 1,892 | | | | 1,640 | | | | 1,678 | | | | 1,521 | | | | 1,417 | | Operational energy efficiency, in terajoules per million euro sales | | | 1.59 | | | | 1.30 | | | | 1.35 | | | | 1.29 | | | | 1.06 | | Total energy consumption in manufacturing, in terajoules1) | | | 12,030 | | | | 12,014 | | | | 11,963 | | | | 11,257 | | | | 9,702 | | Total carbon emissions in manufacturing, in kilotonnes CO2-equivalent | | | 560 | | | | 563 | | | | 518 | | | | 468 | | | | 371 | | Water intake, in thousands m3 | | | 2,895 | | | | 3,137 | | | | 3,289 | | | | 3,103 | | | | 2,727 | | Total waste, in kilotonnes1) | | | 87.0 | | | | 80.6 | | | | 75.9 | | | | 75.0 | | | | 68.5 | | Materials provided for recycling via external contractor per total waste, in % | | | 78 | % | | | 77 | % | | | 79 | % | | | 80 | % | | | 83 | % | Restricted substances, in kilos | | | 111 | | | | 67 | | | | 37 | | | | 29 | | | | 26 | | Hazardous substances, in kilos | | | 63,604 | | | | 67,530 | | | | 35,118 | | | | 28,310 | | | | 25,101 | | ISO 14001 certification, as a % of all reporting organizations1) | | | 87 | % | | | 69 | % | | | 79 | % | | | 79 | % | | | 78 | % | Employee Engagement Index, % favorable | | | 76 | % | | | 79 | % | | | 75 | % | | | 72 | % | | | 71 | % | Female executives, in % of total | | | 13 | % | | | 14 | % | | | 15 | % | | | 18 | % | | | 19 | % | Lost Workday Injuries, per 100 FTEs | | | 0.38 | | | | 0.31 | | | | 0.27 | | | | 0.23 | | | | 0.21 | | Fatalities | | | 2 | | | | 7 | | | | 3 | | | | 1 | | | | — | | Initial and continual conformance audits, number of audits | | | 212 | | | | 159 | | | | 200 | | | | 203 | | | | 195 | | Suppliers audits, compliance rate, in % | | | 72 | % | | | 75 | % | | | 77 | % | | | 86 | % | | | 86 | % | | | | | |
| 1) | In manufacturing excluding new acquisitions |
16.1 Five-year overview (condensed) Prior-period financial statements haveinformation has been restated for the treatment of Audio, Video, Multimediathe combined businesses of Lumileds and AccessoriesAutomotive as discontinued operations (see note 7,3, Discontinued operations and other assets classified as held for sale) and the adoption of IAS 19R, which mainly relates to pension reporting (see note 30, Post-employment benefits) Annual Report 2013 251
14 Reconciliation of non-GAAP information 14 - 14
Sales growth composition per sector
in %
| | | | | | | | | | | | | | | | | | | | comparable growth | | | currency effects | | | consolidation changes | | | nominal growth | | | 2013 versus 2012 | | | | | | | | | | | | | | | | | Healthcare | | | 0.8 | | | | (4.6 | ) | | | (0.3 | ) | | | (4.1 | ) | Consumer Lifestyle | | | 10.0 | | | | (3.4 | ) | | | 0.0 | | | | 6.6 | | Lighting | | | 3.2 | | | | (3.5 | ) | | | 0.0 | | | | (0.3 | ) | Innovation, Group & Services | | | (2.0 | ) | | | (0.5 | ) | | | 5.7 | | | | 3.2 | | | | | | | Philips Group | | | 3.3 | | | | (3.9 | ) | | | 0.1 | | | | (0.5 | ) | | | | | | | 2012 versus 2011 | | | | | | | | | | | | | | | | | Healthcare | | | 6.4 | | | | 6.4 | | | | 0.0 | | | | 12.8 | | Consumer Lifestyle | | | 8.7 | | | | 4.4 | | | | 1.4 | | | | 14.5 | | Lighting | | | 3.8 | | | | 4.6 | | | | 2.1 | | | | 10.5 | | Innovation, Group & Services | | | 0.3 | | | | 1.7 | | | | (4.4 | ) | | | (2.5 | ) | | | | | | Philips Group | | | 5.7 | | | | 5.2 | | | | 0.8 | | | | 11.7 | | | | | | | | 2011 versus 2010 | | | | | | | | | | | | | | | | | Healthcare | | | 5.3 | | | | (2.5 | ) | | | 0.1 | | | | 2.9 | | Consumer Lifestyle | | | 11.0 | | | | (1.8 | ) | | | 4.5 | | | | 13.7 | | Lighting | | | 6.2 | | | | (2.4 | ) | | | (2.7 | ) | | | 1.1 | | Innovation, Group & Services | | | (12.9 | ) | | | (0.9 | ) | | | (9.0 | ) | | | (22.8 | ) | | | | | | Philips Group | | | 5.8 | | | | (2.3 | ) | | | (0.7 | ) | | | 2.8 | |
Sales growth composition per geographic cluster
in %
| | | | | | | | | | | | | | | | | | | | comparable growth | | | currency effects | | | consolidation changes | | | nominal growth | | | 2013 versus 2012 | | | | | | | | | | | | | | | | | Western Europe | | | 0.1 | | | | (0.6 | ) | | | 0.5 | | | | 0.0 | | North America | | | (2.4 | ) | | | (3.1 | ) | | | (0.2 | ) | | | (5.7 | ) | Other mature geographies | | | 5.0 | | | | (12.3 | ) | | | 0.0 | | | | (7.3 | ) | | | | | | Total mature geographies | | | (0.5 | ) | | | (3.4 | ) | | | 0.1 | | | | (3.8 | ) | Growth geographies | | | 10.7 | | | | (5.1 | ) | | | 0.0 | | | | 5.6 | | | | | | | Philips Group | | | 3.3 | | | | (3.9 | ) | | | 0.1 | | | | (0.5 | ) | | | | | | | 2012 versus 2011 | | | | | | | | | | | | | | | | | Western Europe | | | (0.9 | ) | | | 1.1 | | | | 2.5 | | | | 2.7 | | North America | | | 2.7 | | | | 8.7 | | | | (0.7 | ) | | | 10.7 | | Other mature geographies | | | 11.8 | | | | 9.2 | | | | (0.1 | ) | | | 20.9 | | | | | | | Total mature geographies | | | 2.4 | | | | 5.6 | | | | 0.7 | | | | 8.7 | | Growth geographies | | | 12.5 | | | | 4.3 | | | | 1.2 | | | | 18.0 | | | | | | | Philips Group | | | 5.7 | | | | 5.2 | | | | 0.8 | | | | 11.7 | | | | | | | | 2011 versus 2010 | | | | | | | | | | | | | | | | | Western Europe | | | (0.7 | ) | | | 0.3 | | | | (1.9 | ) | | | (2.3 | ) | North America | | | 5.2 | | | | (4.9 | ) | | | 0.3 | | | | 0.6 | | Other mature geographies | | | 6.9 | | | | 2.7 | | | | (2.0 | ) | | | 7.6 | | | | | | | Total mature geographies | | | 2.9 | | | | (1.8 | ) | | | (0.9 | ) | | | 0.2 | | Growth geographies | | | 12.4 | | | | (3.3 | ) | | | (0.3 | ) | | | 8.8 | | | | | | | Philips Group | | | 5.8 | | | | (2.3 | ) | | | (0.7 | ) | | | 2.8 | |
252 Annual Report 2013
14 Reconciliation of non-GAAP information 14 - 14
Composition of net debt to group equity
| | | | | | | | | | | | | | | | 2011 | | | 2012 | | | 2013 | | Long-term debt | | | 3,278 | | | | 3,725 | | | | 3,309 | | Short-term debt | | | 582 | | | | 809 | | | | 592 | | | | | | | Total debt | | | 3,860 | | | | 4,534 | | | | 3,901 | | Cash and cash equivalents | | | 3,147 | | | | 3,834 | | | | 2,465 | | | | | | | Net debt (cash)1) | | | 713 | | | | 700 | | | | 1,436 | | | | | | Shareholders’ equity | | | 12,328 | | | | 11,151 | | | | 11,214 | | Non-controlling interests | | | 34 | | | | 34 | | | | 13 | | | | | | | Group equity | | | 12,362 | | | | 11,185 | | | | 11,227 | | | | | | Net debt and group equity | | | 13,075 | | | | 11,885 | | | | 12,663 | | Net debt divided by net debt and group equity (in %) | | | 5 | | | | 6 | | | | 11 | | Group equity divided by net debt and group equity (in %) | | | 95 | | | | 94 | | | | 89 | |
1) | Total debt less cash and cash equivalents
|
Composition of cash flows
| | | | | | | | | | | | | | | | 2011 | | | 2012 | | | 2013 | | Cash flows from operating activities | | | 760 | | | | 2,082 | | | | 1,138 | | Cash flows from investing activities | | | (1,275 | ) | | | (925 | ) | | | (997 | ) | | | | | | Cash flows before financing activities | | | (515 | ) | | | 1,157 | | | | 141 | | | | | | Cash flows from operating activities | | | 760 | | | | 2,082 | | | | 1,138 | | Net capital expenditures: | | | (857 | ) | | | (455 | ) | | | (966 | ) | Purchase of intangible assets | | | (69 | ) | | | (34 | ) | | | (49 | ) | Proceeds from sale of intangible assets | | | — | | | | 160 | | | | — | | Expenditures on development assets | | | (276 | ) | | | (345 | ) | | | (357 | ) | Capital expenditures on property, plant and equipment | | | (640 | ) | | | (661 | ) | | | (587 | ) | Proceeds from disposals of property, plant and equipment | | | 128 | | | | 425 | | | | 27 | | | | | | | Free cash flows | | | (97 | ) | | | 1,627 | | | | 172 | |
Annual Report 2013 253
14 Reconciliation of non-GAAP information 14 - 14
Adjusted IFO to Income from operations (or IFO)
| | | | | | | | | | | | | | | | | | | | | | | | Philips Group | | | Healthcare | | | Consumer Lifestyle | | | Lighting | | | Innovation, Group
& Services | | | 2013 | | | | | | | | | | | | | | | | | | | | | Adjusted IFO | | | 2,451 | | | | 1,512 | | | | 483 | | | | 695 | | | | (239 | ) | Amortization of intangible assets1) | | | (432 | ) | | | (195 | ) | | | (54 | ) | | | (180 | ) | | | (3 | ) | Impairment of goodwill | | | (28 | ) | | | (2 | ) | | | — | | | | (26 | ) | | | — | | | | | | | Income from operations (or IFO) | | | 1,991 | | | | 1,315 | | | | 429 | | | | 489 | | | | (242 | ) | | | | | | | | 2012 | | | | | | | | | | | | | | | | | | | | | Adjusted IFO | | | 1,106 | | | | 1,226 | | | | 456 | | | | 128 | | | | (704 | ) | Amortization of intangible assets1) | | | (458 | ) | | | (200 | ) | | | (56 | ) | | | (194 | ) | | | (8 | ) | | | | | | Income from operations (or IFO) | | | 648 | | | | 1,026 | | | | 400 | | | | (66 | ) | | | (712 | ) | | | | | | | | 2011 | | | | | | | | | | | | | | | | | | | | | Adjusted IFO | | | 1,435 | | | | 1,080 | | | | 153 | | | | 399 | | | | (197 | ) | Amortization of intangible assets1) | | | (559 | ) | | | (229 | ) | | | (44 | ) | | | (276 | ) | | | (10 | ) | Impairment of goodwill | | | (1,355 | ) | | | (824 | ) | | | — | | | | (531 | ) | | | — | | | | | | | Income from operations (or IFO) | | | (479 | ) | | | 27 | | | | 109 | | | | (408 | ) | | | (207 | ) |
1) | Excluding amortization of software and product development
|
254 Annual Report 2013
14 Reconciliation of non-GAAP information 14 - 14
Net operating capital to total assets
| | | | | | | | | | | | | | | | | | | | | | | | Philips Group | | | Healthcare | | | Consumer Lifestyle | | | Lighting | | | Innovation, Group
& Services | | | 2013 | | | | | | | | | | | | | | | | | | | | | Net operating capital (NOC) | | | 10,238 | | | | 7,437 | | | | 1,261 | | | | 4,462 | | | | (2,922 | ) | Exclude liabilities comprised in NOC: | | | | | | | | | | | | | | | | | | | | | - payables/liabilities | | | 8,453 | | | | 2,541 | | | | 1,275 | | | | 1,672 | | | | 2,965 | | - intercompany accounts | | | — | | | | 124 | | | | 75 | | | | 105 | | | | (304 | ) | - provisions | | | 2,554 | | | | 278 | | | | 221 | | | | 452 | | | | 1,603 | | Include assets not comprised in NOC: | | | | | | | | | | | | | | | | | | | | | - investments in associates | | | 161 | | | | 85 | | | | — | | | | 20 | | | | 56 | | - current financial assets | | | 10 | | | | — | | | | — | | | | — | | | | 10 | | - other non-current financial assets | | | 496 | | | | — | | | | — | | | | — | | | | 496 | | - deferred tax assets | | | 1,675 | | | | — | | | | — | | | | — | | | | 1,675 | | - liquid assets | | | 2,465 | | | | — | | | | — | | | | — | | | | 2,465 | | | | | | | | | | 26,052 | | | | 10,465 | | | | 2,832 | | | | 6,711 | | | | 6,044 | | Assets classified as held for sale | | | 507 | | | | | | | | | | | | | | | | | | | | | | | | | | | | | | | | | | | | | | | Total assets | | | 26,559 | | | | | | | | | | | | | | | | | | | | | | | | | 2012 | | | | | | | | | | | | | | | | | | | | | Net operating capital (NOC) | | | 9,316 | | | | 7,976 | | | | 1,205 | | | | 4,635 | | | | (4,500 | ) | Exclude liabilities comprised in NOC: | | | | | | | | | | | | | | | | | | | | | - payables/liabilities | | | 10,287 | | | | 2,760 | | | | 1,718 | | | | 1,695 | | | | 4,114 | | - intercompany accounts | | | — | | | | 71 | | | | 42 | | | | 37 | | | | (150 | ) | - provisions | | | 2,956 | | | | 355 | | | | 315 | | | | 581 | | | | 1,705 | | Include assets not comprised in NOC: | | | | | | | | | | | | | | | | | | | | | - investments in associates | | | 177 | | | | 86 | | | | — | | | | 22 | | | | 69 | | - other non-current financial assets | | | 549 | | | | — | | | | — | | | | — | | | | 549 | | - deferred tax assets | | | 1,919 | | | | — | | | | — | | | | — | | | | 1,919 | | - liquid assets | | | 3,834 | | | | — | | | | — | | | | — | | | | 3,834 | | | | | | | | | | 29,038 | | | | 11,248 | | | | 3,280 | | | | 6,970 | | | | 7,540 | | Assets classified as held for sale | | | 43 | | | | | | | | | | | | | | | | | | | | | | | | | | | | | | | | | | | | | | | Total assets | | | 29,081 | | | | | | | | | | | | | | | | | | | | | | | | | 2011 | | | | | | | | | | | | | | | | | | | | | Net operating capital (NOC) | | | 10,382 | | | | 8,418 | | | | 874 | | | | 4,965 | | | | (3,875 | ) | Exclude liabilities comprised in NOC: | | | | | | | | | | | | | | | | | | | | | - payables/ liabilities | | | 10,357 | | | | 2,697 | | | | 2,292 | | | | 1,593 | | | | 3,775 | | - intercompany accounts | | | — | | | | 103 | | | | 74 | | | | 51 | | | | (228 | ) | - provisions | | | 2,680 | | | | 287 | | | | 551 | | | | 283 | | | | 1,559 | | Include assets not comprised in NOC: | | | | | | | | | | | | | | | | | | | | | - investments in associates | | | 203 | | | | 86 | | | | 3 | | | | 23 | | | | 91 | | - other non-current financial assets | | | 346 | | | | — | | | | — | | | | — | | | | 346 | | - deferred tax assets | | | 1,731 | | | | — | | | | — | | | | — | | | | 1,731 | | - liquid assets | | | 3,147 | | | | — | | | | — | | | | — | | | | 3,147 | | | | | | | | | | 28,846 | | | | 11,591 | | | | 3,794 | | | | 6,915 | | | | 6,546 | | Assets classified as held for sale | | | 551 | | | | | | | | | | | | | | | | | | | | | | | | | | | | | | | | | | | | | | | Total assets | | | 29,397 | | | | | | | | | | | | | | | | | |
Annual Report 2013 255
15 Five-year overview 15 - 15
15 Five-year overview
all amounts in millions of euros unless otherwise stated
Prior-period financial statements have been restated for the treatment of Audio, Video, Multimedia and Accessories as discontinued operations (see note 7, Discontinued operations and other assets classified as held for sale) and the adoption of IAS 19R, which mainly relates to pension reportingtwo voluntary accounting policy changes (see note 1, Significant accounting policies).
Due to factors such as acquisitions and divestments, the amounts, percentages and ratios are not directly comparable. General data
Annual Report 2015 255
Five-year overview 16.1 | | | | | | | | | | | | | | | | | | | | | | | | | | | | 2009
EUR | | | 2010
EUR | | | 2011
EUR | | | 2012
EUR | | | 2013
EUR | | | 2013
USD1) | | | | | | | | | Sales | | | 18,149 | | | | 20,415 | | | | 20,992 | | | | 23,457 | | | | 23,329 | | | | 32,156 | | | | | | | | | Income from operations (IFO) (loss) | | | 377 | | | | 1,721 | | | | (479 | ) | | | 648 | | | | 1,991 | | | | 2,744 | | Financial income and expenses - net | | | (280 | ) | | | (175 | ) | | | (331 | ) | | | (329 | ) | | | (330 | ) | | | (455 | ) | Income (loss) from continuing operations | | | 173 | | | | 1,157 | | | | (1,046 | ) | | | (77 | ) | | | 1,170 | | | | 1,613 | | Income (loss) from continuing operations attributable to shareholders | | | 159 | | | | 1,151 | | | | (1,050 | ) | | | (82 | ) | | | 1,167 | | | | 1,609 | | Income (loss) from discontinued operations | | | 86 | | | | 144 | | | | (410 | ) | | | 47 | | | | 2 | | | | 3 | | Net income (loss) | | | 259 | | | | 1,301 | | | | (1,456 | ) | | | (30 | ) | | | 1,172 | | | | 1,615 | | Net income (loss) attributable to shareholders | | | 245 | | | | 1,295 | | | | (1,460 | ) | | | (35 | ) | | | 1,169 | | | | 1,611 | | | | | | | | | Total assets | | | 30,897 | | | | 32,712 | | | | 29,397 | | | | 29,081 | | | | 26,559 | | | | 36,608 | | Net assets | | | 14,631 | | | | 15,067 | | | | 12,362 | | | | 11,185 | | | | 11,227 | | | | 15,475 | | | | | | | | | Financial structure | | | | | | | | | | | | | | | | | | | | | | | | | | | | | | | | Debt | | | 4,267 | | | | 4,658 | | | | 3,860 | | | | 4,534 | | | | 3,901 | | | | 5,377 | | Provisions | | | 2,476 | | | | 2,377 | | | | 2,680 | | | | 2,956 | | | | 2,554 | | | | 3,520 | | | | | | | | | Shareholders’ equity | | | 14,582 | | | | 15,021 | | | | 12,328 | | | | 11,151 | | | | 11,214 | | | | 15,457 | | Non-controlling interests | | | 49 | | | | 46 | | | | 34 | | | | 34 | | | | 13 | | | | 18 | | | | | | | | | Key figures per share | | | | | | | | | | | | | | | | | | | | | | | | | | | | | | | | Weighted average shares outstanding: | | | | | | | | | | | | | | | | | | | | | | | | | - basic2) | | | 927,709 | | | | 941,691 | | | | 952,809 | | | | 922,101 | | | | 911,072 | | | | 911,072 | | - diluted2) | | | 931,264 | | | | 949,554 | | | | 957,293 | | | | 927,222 | | | | 922,072 | | | | 922,072 | | Basic earnings per common share3) | | | | | | | | | | | | | | | | | | | | | | | | | Income (loss) from continuing operations attributable to shareholders | | | 0.17 | | | | 1.22 | | | | (1.10 | ) | | | (0.09 | ) | | | 1.28 | | | | 1.76 | | Net income (loss) attributable to shareholders | | | 0.26 | | | | 1.38 | | | | (1.53 | ) | | | (0.04 | ) | | | 1.28 | | | | 1.76 | | Diluted earnings per common share3) | | | | | | | | | | | | | | | | | | | | | | | | | Income (loss) from continuing operations attributable to shareholders | | | 0.17 | | | | 1.21 | | | | (1.10 | ) | | | (0.09 | ) | | | 1.27 | | | | 1.75 | | Net income (loss) attributable to shareholders | | | 0.26 | | | | 1.36 | | | | (1.53 | ) | | | (0.04 | ) | | | 1.27 | | | | 1.75 | |
Philips Group Selected financial datain millions of EUR unless otherwise stated 2011 - 2015 | | | | | | | | | | | | | | | | | | | | | | | | | | | | | | | | | 2011 | | | 2012 | | | 2013 | | | 2014 | | | 2015 | | | 2015 | | | | | | | | | | EUR | | | EUR | | | EUR | | | EUR | | | EUR | | | USD1) | | | | | | | Sales | | | 19,918 | | | | 22,234 | | | | 21,990 | | | | 21,391 | | | | 24,244 | | | | 26,493 | | Income from operations (IFO) (loss) | | | (542 | ) | | | 592 | | | | 1,855 | | | | 486 | | | | 992 | | | | 1,084 | | Financial income and expenses - net | | | (331 | ) | | | (329 | ) | | | (330 | ) | | | (301 | ) | | | (369 | ) | | | (403 | ) | Income (loss) from continuing operations | | | (1,106 | ) | | | (166 | ) | | | 1,034 | | | | 221 | | | | 414 | | | | 452 | | Income (loss) from continuing operations attributable to shareholders | | | (1,110 | ) | | | (171 | ) | | | 1,031 | | | | 225 | | | | 400 | | | | 437 | | Income (loss) from discontinued operations | | | (350 | ) | | | 136 | | | | 138 | | | | 190 | | | | 245 | | | | 268 | | Net income (loss) | | | (1,456 | ) | | | (30 | ) | | | 1,172 | | | | 411 | | | | 659 | | | | 720 | | Net income (loss) attributable to shareholders | | | (1,460 | ) | | | (35 | ) | | | 1,169 | | | | 415 | | | | 645 | | | | 705 | | Total assets | | | 29,397 | | | | 29,081 | | | | 26,559 | | | | 28,352 | | | | 30,976 | | | | 33,850 | | Net assets | | | 12,362 | | | | 11,185 | | | | 11,227 | | | | 10,968 | | | | 11,780 | | | | 12,873 | | Debt | | | 3,860 | | | | 4,534 | | | | 3,901 | | | | 4,104 | | | | 5,760 | | | | 6,294 | | Provisions | | | 2,680 | | | | 2,956 | | | | 2,554 | | | | 3,445 | | | | 3,225 | | | | 3,524 | | Shareholders’ equity | | | 12,328 | | | | 11,151 | | | | 11,214 | | | | 10,867 | | | | 11,662 | | | | 12,744 | | Non-controlling interests | | | 34 | | | | 34 | | | | 13 | | | | 101 | | | | 118 | | | | 129 | | Weighted average shares outstanding: | | | | | | | | | | | | | | | | | | | | | | | | | - basic2) | | | 952,809 | | | | 922,101 | | | | 911,072 | | | | 915,193 | | | | 916,087 | | | | 916,087 | | - diluted2) | | | 957,293 | | | | 927,222 | | | | 922,072 | | | | 922,714 | | | | 923,625 | | | | 923,625 | | Basic earnings per common share3) | | | | | | | | | | | | | | | | | | | | | | | | | Income (loss) from continuing operations attributable to shareholders | | | (1.16 | ) | | | (0.19 | ) | | | 1.13 | | | | 0.25 | | | | 0.44 | | | | 0.48 | | Net income (loss) attributable to shareholders | | | (1.53 | ) | | | (0.04 | ) | | | 1.28 | | | | 0.45 | | | | 0.70 | | | | 0.76 | | Diluted earnings per common share3) | | | | | | | | | | | | | | | | | | | | | | | | | Income (loss) from continuing operations attributable to shareholders | | | (1.16 | ) | | | (0.19 | ) | | | 1.12 | | | | 0.24 | | | | 0.43 | | | | 0.47 | | Net income (loss) attributable to shareholders | | | (1.53 | ) | | | (0.04 | ) | | | 1.27 | | | | 0.45 | | | | 0.70 | | | | 0.76 | | | | | | |
| 1) | For the convenience of the reader, the euro amounts have been converted into US dollars at the exchange rate used for balance sheet purposes at December 31, 20132015 (USD 1 = EUR 0.7255.0.9151. The US dollar amounts are unaudited.) |
| 3) | In euros or US dollars as indicated in the header |
256 Annual Report 20132015
16 Investor Relations 16 - 16.117
1617 Investor Relations
16.117.1 Key financials and dividend policy
Prior-period financial statements have been restated for the treatment of Audio, Video, Multimedia and Accessories as discontinued operations (see note 7, Discontinued operations and other assets classified as held for sale) and the adoption of IAS 19R, which mainly relates to pension reporting (see note 30, Post-employment benefits).
Key financials Net income attributable to shareholders of theKoninklijke Philips GroupN.V. in 20132015 showed a gain of EUR 1,169645 million, or EUR 1.270.70 per common share (diluted; basic EUR 1.280.70 per common share). This compares to a lossgain of EUR 35415 million, or EUR 0.040.45 per common share (diluted; basic EUR 0.040.45 per common share), in 2012.2014. 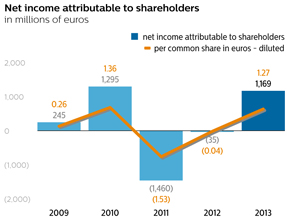
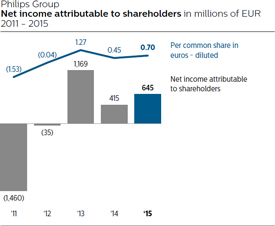
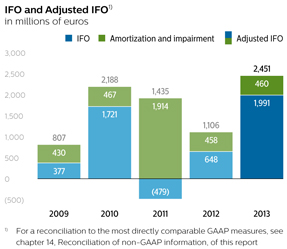 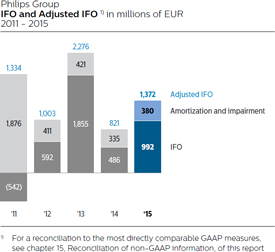
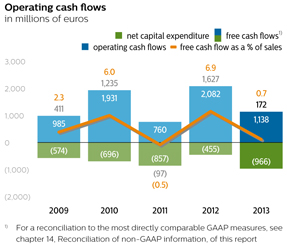 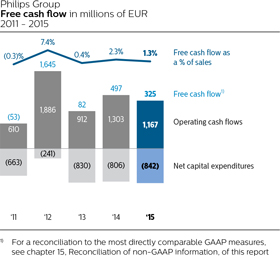
Dividend policy We are committed to a stablePhilips’ dividend policy withis aimed at dividend stability and a pay-out ratio of 40% to 50% target pay-out of continuing net income. Following the intended separation of the Lighting business, the dividend pay-out ratio with respect to future years could be subject to change.
Continuing net income after adjustments is the base figure used to calculate the dividend payout for the year. For 2013,2015, the key exclusions from net income to arrive at continuing net income after adjustments are the following: the results related to the Television and Audio, Video, Multimedia and Accessories businesses of Consumer Lifestyle that are shown as discontinued operations, the gainscharges related to past-service pension costs insettlements, charges related to the USdevaluation of the Argentine Peso, a charge related to the currency revaluation of the provision for the Masimo litigation, a legal matter, and the settlement loss arising from a lump sum offering to terminated vested employees in the US pension plan, as well as the impairment of goodwill in Lighting and of other intangible assets in Healthcare and Lighting. Annual Report 2013 257
16 Investor Relations 16.1 - 16.1
Restructuring and acquisition-related charges and the result ofgains on the sale of the 30% stake in investment in associate TP Visionreal estate assets. Restructuring, acquisition-related and separation charges are also excluded.
Proposed distribution A proposal will be submitted to the 20142016 Annual General Meeting of Shareholders to declare a dividend of EUR 0.80 per common share (up to EUR 740 million), in cash or in shares at the option of the shareholder, against the net income for 2013.2015 and retained earnings. Shareholders will be given the opportunity to make their choice between cash and shares between May 8, 2014,18, 2016, and May 30, 2014.June 10, 2016. If no choice is made during this election period, the dividend will be paid in shares. On May 30, 2014June 10, 2016 after close of trading, the number of share dividend rights entitled to one new common share will be determined based on the volume weightedvolume-weighted average price of all traded common shares of Koninklijke Philips N.V. at NYSE Euronext Amsterdam on 28, 298, 9 and 30 May, 2014.10 June, 2016. The Company will calculate the number of share dividend rights entitled to one new common share, Annual Report 2015 257
Investor Relations 17.1 such that the gross dividend in shares will be approximately equal to the gross dividend in cash. On June 3, 201414, 2016 the ratio and the number of shares to be issued will be announced. Payment of the dividend and delivery of new common shares, with settlement of fractions in cash, if required, will take place from June 4, 2014.15, 2016 onwards. The distribution of dividend in cash to holders of New York registryRegistry shares will be made in USD at the USD/EUR rate fixed by the European Central Bank on June 2, 2014.13, 2016. Dividend in cash is in principle subject to 15% Dutch dividend withholding tax, which will be deducted from the dividend in cash paid to the shareholders. Dividend in shares paid out of net income and retained earnings is subject to 15% dividend withholding tax, but only in respect of the par value of the shares (EUR 0.20 per share). Shareholders are advised to consult their own tax advisor on the applicable situation with respect to taxes on the dividend received. In 2013,2015, a dividend of EUR 0.750.80 per common share was paid in cash or shares, at the option of the shareholder. For 59.8%59.2% of the shares, an election was madethe shareholders elected for a share dividend, resulting in the issuanceissue of 18,491,33717,671,990 new common shares, leading to a 2.1% percent1.9% dilution. EUR 271,991,204298 million was paid in cash. For additional information, see section 4.4,5.4, Proposed distribution to shareholders, of this report. | | | | | | | | | | | | | | | | | | | | | ex-dividend date | | | record date | | | payment date | | | | | | | | | | | Amsterdam shares | | | May 5, 201416, 2016 | | | | May 7, 201417, 2016 | | | | June 4, 201415, 2016 | | | | | | New York shares | | | May 5, 201413, 2016 | | | | May 7, 201417, 2016 | | | | June 4, 201415, 2016 | | | | | | |
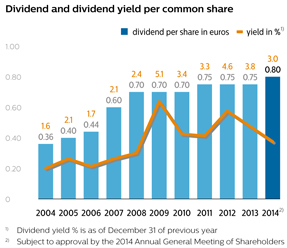
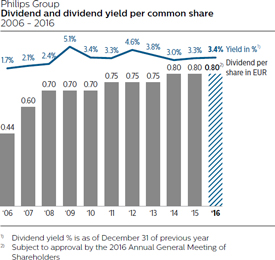
Information for investors in New York Registry shares program Dividends and distributions per common share The following table sets forth in euros the gross dividends on the common shares in the fiscal years indicated (from prior-year profit distribution) and such amounts as converted into US dollars and paid to holders of shares of the New York registry:Registry: Philips Group Gross dividends on the common shares 2011 - 2015 | | | | | | | | | | | | | | | | | | | 2011 | | | 2012 | | | 2013 | | | 2014 | | | 2015 | | | | | 2009 | | | 2010 | | | 2011 | | | 2012 | | | 2013 | | | | | | in EUR | | | 0.70 | | | | 0.70 | | | | 0.75 | | | | 0.75 | | | | 0.75 | | | | 0.75 | | | | 0.75 | | | | 0.75 | | | | 0.80 | | | | 0.80 | | in USD | | | 0.94 | | | | 0.93 | | | | 1.11 | | | | 0.94 | | | | 0.98 | | | | 1.11 | | | | 0.94 | | | | 0.98 | | | | 1.09 | | | | 0.89 | | | | | | | |
Exchange rates USD : EUR The following two tables set forth, for the periods and dates indicated, certain information concerning the exchange rate for US dollars into euros based on the Noon Buying Rate in New York City for cable transfers in foreign currencies as certified for customs purposes by the Federal Reserve Bank of New York (the “Noon Buying Rate”). The Noon Buying Rate on February 14, 201412, 2016 was EUR 0.73050.8901 per USD 1. Exchange rate (based on the “Noon Buying Rate”) 258 Annual Report 2013EUR per USD
16 Investor Relations 16.12011 - 16.2
2015 | | | | | | | | | | | | | | | | | | | | | | | | | period end | | | average | | | high | | | low | | | | | | | 2011 | | | 0.7708 | | | | 0.7186 | | | | 0.7736 | | | | 0.6723 | | 2012 | | | 0.7584 | | | | 0.7782 | | | | 0.8290 | | | | 0.7428 | | 2013 | | | 0.7257 | | | | 0.7532 | | | | 0.7828 | | | | 0.7238 | | 2014 | | | 0.8264 | | | | 0.7533 | | | | 0.8264 | | | | 0.7180 | | 2015 | | | 0.9209 | | | | 0.9018 | | | | 0.9502 | | | | 0.8323 | | | | | | |
Exchange rate per month (based on the “Noon Buying Rate”) EUR per USD 2015 - 2016 | | | | | | | | | | | | | | | | | | | | | | | | | | EUR per USD | | | | | period end | | | average | | | high | | | low | | 2008 | | | 0.7184 | | | | 0.6844 | | | | 0.8035 | | | | 0.6246 | | 2009 | | | 0.6977 | | | | 0.7187 | | | | 0.7970 | | | | 0.6623 | | 2010 | | | 0.7536 | | | | 0.7579 | | | | 0.8362 | | | | 0.6879 | | 2011 | | | 0.7708 | | | | 0.7186 | | | | 0.7736 | | | | 0.6723 | | 2012 | | | 0.7584 | | | | 0.7782 | | | | 0.8290 | | | | 0.7428 | | 2013 | | | 0.7257 | | | | 0.7532 | | | | 0.7828 | | | | 0.7238 | |
| | | | | | | | | | | | highest rate | | | lowest rate | | August, 2013 | | | 0.7578 | | | | 0.7448 | | September, 2013 | | | 0.7622 | | | | 0.7387 | | October, 2013 | | | 0.7413 | | | | 0.7241 | | November, 2013 | | | 0.7487 | | | | 0.7350 | | December, 2013 | | | 0.7379 | | | | 0.7238 | | January, 2014 | | | 0.7407 | | | | 0.7309 | |
Philips publishes its financial statements in euros while a substantial portion of its net assets, earnings and sales are denominated in other currencies. Philips conducts its business in more than 50 different currencies.
| | | | | | | | | | | | | | | | | highest rate | | | lowest rate | | | | | | | August, 2015 | | | 0.9201 | | | | 0.8636 | | September, 2015 | | | 0.9006 | | | | 0.8804 | | October, 2015 | | | 0.9122 | | | | 0.8744 | | November, 2015 | | | 0.9468 | | | | 0.9069 | | December, 2015 | | | 0.9458 | | | | 0.9070 | | January, 2016 | | | 0.9308 | | | | 0.9121 | | | | | | |
Unless otherwise stated, for the convenience of the reader, the translations of euros into US dollars appearing in this reportsection have been made based on the closing rate on December 31, 20132015 (USD 1 = EUR 0.7255)0.9151). This rate is not materially different from the Noon Buying Rate on such date (USD 1 = EUR 0.7257)0.9209). The following table sets out the exchange rate for US dollars into euros applicable for translation of Philips’ financial statements for the periods specified. | | | | | | | | | | | | | | | | | | | | | | | | | | EUR per USD | | | | | period end | | | average | | | high | | | low | | 2008 | | | 0.7096 | | | | 0.6832 | | | | 0.7740 | | | | 0.6355 | | 2009 | | | 0.6945 | | | | 0.7170 | | | | 0.7853 | | | | 0.6634 | | 2010 | | | 0.7485 | | | | 0.7540 | | | | 0.8188 | | | | 0.7036 | | 2011 | | | 0.7728 | | | | 0.7192 | | | | 0.7728 | | | | 0.6721 | | 2012 | | | 0.7582 | | | | 0.7776 | | | | 0.8166 | | | | 0.7500 | | 2013 | | | 0.7255 | | | | 0.7527 | | | | 0.7805 | | | | 0.7255 | |
258 Annual Report 2015
Investor Relations 17.1 Exchange rate (based on Philips’ consolidation rate) EUR per USD 2011 - 2015 | | | | | | | | | | | | | | | | | | | | | | | | | period end | | | average | | | high | | | low | | | | | | | 2011 | | | 0.7728 | | | | 0.7192 | | | | 0.7728 | | | | 0.6721 | | 2012 | | | 0.7582 | | | | 0.7776 | | | | 0.8166 | | | | 0.7500 | | 2013 | | | 0.7255 | | | | 0.7527 | | | | 0.7805 | | | | 0.7255 | | 2014 | | | 0.8227 | | | | 0.7527 | | | | 0.8227 | | | | 0.7201 | | 2015 | | | 0.9151 | | | | 0.9007 | | | | 0.9410 | | | | 0.8796 | | | | | | |
16.217.2 Share information
Market capitalization Philips’ market capitalization was EUR 24.321.6 billion at year-end 2013. The highest2015. On December 31, 2015, the closing price for Philips’ shares during 2013 in Amsterdam was EUR 26.78 on December 27, 201323.56 and the lowest was EUR 20.26 on January 4, 2013. The highest closing price for Philips’number of common shares during 2013 in New York was USD 36.97 on December 31, 2013 and the lowest was USD 26.60 on January 4, 2013.outstanding (after deduction of treasury shares) amounted to 917 million. 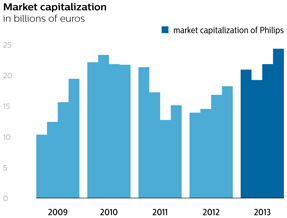
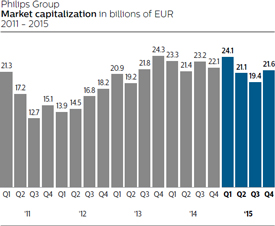
Share capital structure During 2013,2015, Philips’ issued share capital decreased by approximately 194 million common shares to a level of 938931 million common shares. The main reasons for this are the cancellation of 37,778,51021,361,016 Philips shares acquired pursuant to the EUR 21.5 billion share repurchase program and the issuance of 18,491,33717,671,990 shares related to the elective dividend. The number of basic shares outstanding decreasedincreased from 915914 million at the end of December 201231, 2014 to 913917 million at the end of 2013. As of December 31, 2013,2015. At December 31, 2015, the shares held in treasury amounted to 2514 million shares, of which 2112 million are held by Philips to cover long-term incentive and employee stock purchase plans. The Dutch Act on Financial Supervision imposes an obligation on persons holding certain interests to disclose (inter alia) percentage holdings in the capital and/or voting rights in the Company when such holdings reach, exceed or fall below 3, 5, 10, 15, 20, 25, 30, 40, 50, 60, 75 and 95 percent (as a result of an acquisition or disposal by a person, or as a result of a change in the company’s total number of voting rights or capital issued). Certain cash settled.Certain cash-settled derivatives are also taken into account when calculating the capital interest. Pursuant to new legislation, effective July 1, 2013, theThe statutory obligation to disclose capital interest does not Annual Report 2013 259
16 Investor Relations 16.2 - 16.2
only relate to gross long positions, but also to gross short positions. Required disclosures must be made to the Netherlands Authority for the Financial Markets (AFM) without delay. The AFM then notifies such disclosures to the Company and includes them in a register which is published on the AFM’s website. Furthermore, an obligation to disclose (net) short positions is set out in the EU Regulation on Short Selling. On July 1, 2013June 23, 2015 the Company received notification from the AFM that it had received disclosuresdisclosure under the Dutch Act on Financial Supervision of a substantial holding4.97% of 4.3%the voting rights by Dodge & Cox International Stock Fund.Cox. On August 14, 2013July 24, 2015 the Company received notification from the AFM that it had received disclosuresdisclosure under the Dutchsuch Act on Financial Supervision of a total shareholdingsubstantial holding of 3.01%4.06%, and 3.45%of 5% of the voting rights by BlackRockBlackrock, Inc. On January 3, 20147, 2016 the Company received notification from the AFM that it had received disclosuresdisclosure under the Dutchsuch Act on Financial Supervision of a substantial holding (and voting rights) of 3.08%4.99% by Norges Bank.Harris Associates L.P. BasedThe following shareholder portfolio information is based on a survey in December 2013 and information provided by several large custodians the following shareholder portfolio information is includedand a survey conducted in the graphs Shareholders by region and Shareholders by style.December 2015.
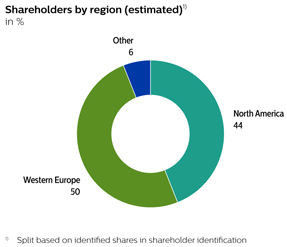
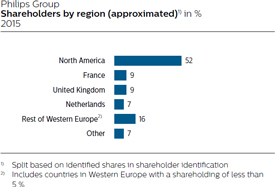
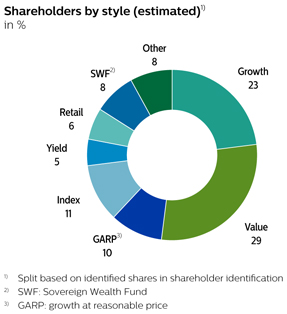 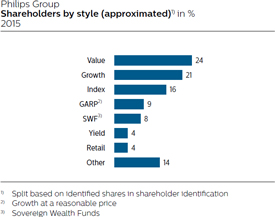
Annual Report 2015 259
Investor Relations 17.2 Share repurchase programs Share repurchases for capital reduction purposes By the end of Q2 2013, Philips completed the EUR 2 billion share repurchase program that started in July 2011. On September 17, 2013, Royal Philips announced a new EUR 1.5 billion share repurchase program. This program started on October 21, 2013 and is towill be completed overby October 2016. The shares repurchased under this program will be held by Philips as treasury shares until they are cancelled. Philips has entered into a subsequent discretionary management agreement with a bank to make the next two to three years. repurchase within the limits of relevant laws and regulations (in particular EC Regulation 2273/2003) and Philips’ articles of association.
By the end of 2013,2015, Philips had completed 7%74% of the EUR 1.5 billion share repurchase program. Share repurchases related to Long-Term Incentive (LTI) and employee stock purchase programs To cover Philips’ outstanding obligations resulting from past and present long-term incentive and employee stock purchase(LTI) programs, dating back to 2004, Philips will repurchase up to 12 millionrepurchases additional Philips shares on NYSE Euronext Amsterdam from time to be executed during 2014.time. The shares repurchased to such LTI positions will be held by Philips as treasury shares until theythese are distributed to participants. In order to repurchase for covering LTI programs, Philips started this program on January 28, 2014 and willmay enter into subsequent discretionary management agreements with one or more banks to repurchase Philips shares within the limits of relevant laws and regulations (in particular EC Regulation 2273/2003) and Philips’ articles of association. Philips has not repurchased any shares for LTI coverage in 2015. During 2016, Philips may consider to start share repurchases for LTI coverage, the size of which will depend on the movement of the Philips share price. Further details on the share repurchase programs can be found on the Investor Relations website. For more information see chapter 10,11, Corporate governance, of this report. 260 Annual Report 2013
16 Investor Relations 16.2 - 16.3
Impact of share repurchases on share count
in thousands of shares
| | | | | | | | | | | | | | | | | | | | | | | | 2009 | | | 2010 | | | 2011 | | | 2012 | | | 2013 | | Shares issued | | | 972,412 | | | | 986,079 | | | | 1,008,975 | | | | 957,133 | | | | 937,846 | | Shares in treasury | | | 44,955 | | | | 39,573 | | | | 82,880 | | | | 42,542 | | | | 24,508 | | Shares outstanding | | | 927,457 | | | | 946,506 | | | | 926,095 | | | | 914,591 | | | | 913,338 | | Shares repurchased | | | 2 | | | | 15 | | | | 47,508 | | | | 46,871 | | | | 27,811 | | Shares cancelled | | | — | | | | — | | | | — | | | | 82,365 | | | | 37,779 | |
A total of 24,508,02214,026,801 shares were held in treasury by the Company at December 31, 2013 (2012: 42,541,6872015 (2014: 20,430,544 shares). As of that date, a total of 4439 million rights to acquire shares (underunder long-term incentive plans)plans were outstanding (2012: 52(2014: 41 million). Philips Group | | | | | | | | | | | | | | | | | | Period | | total number of shares
purchased | | | average price paid per share
in EUR | | | total number of shares
purchased as part of publicly
announced programs | | | maximum EUR amount of
shares that may yet be
purchased under the
programs | | January, 2013 | | | 2,806,796 | | | | 21.38 | | | | 2,806,796 | | | | 471,195,448 | | February, 2013 | | | 6,340,305 | | | | 22.55 | | | | 6,339,803 | | | | 328,260,385 | | March, 2013 | | | 2,368,862 | | | | 23.12 | | | | 2,367,018 | | | | 273,523,670 | | April, 2013 | | | 4,552,000 | | | | 22.10 | | | | 4,552,000 | | | | 172,938,033 | | May, 2013 | | | 5,119,261 | | | | 22.12 | | | | 5,117,783 | | | | 59,707,937 | | June, 2013 | | | 2,766,495 | | | | 21.58 | | | | 2,766,377 | | | | — | | July, 2013 | | | — | | | | — | | | | — | | | | — | | August, 2013 | | | 35 | | | | 21.05 | | | | — | | | | — | | September, 2013 | | | — | | | | — | | | | — | | | | — | | October, 2013 | | | 766,047 | | | | 25.85 | | | | 766,040 | | | | 1,480,195,100 | | November, 2013 | | | 1,434,010 | | | | 26.10 | | | | 1,434,010 | | | | 1,442,763,231 | | December, 2013 | | | 1,657,545 | | | | 25.70 | | | | 1,657,545 | | | | 1,400,158,416 | |
Impact of share repurchases on share count in thousands of shares 2011 - 2015 | | | | | | | | | | | | | | | | | | | | | | | | | | | | | 2011 | | | 2012 | | | 2013 | | | 2014 | | | 2015 | | | | | | | Shares issued | | | 1,008,975 | | | | 957,133 | | | | 937,846 | | | | 934,820 | | | | 931,131 | | Shares in treasury | | | 82,880 | | | | 42,542 | | | | 24,508 | | | | 20,431 | | | | 14,027 | | Shares outstanding | | | 926,095 | | | | 914,591 | | | | 913,338 | | | | 914,389 | | | | 917,104 | | Shares repurchased | | | 47,508 | | | | 46,871 | | | | 27,811 | | | | 28,538 | | | | 20,296 | | Shares cancelled | | | — | | | | 82,365 | | | | 37,779 | | | | 21,838 | | | | 21,361 | | | | | | |
Philips Group Total number of shares purchased 2015 | | | | | | | | | | | | | | | | | | | | | | | | | total number of shares purchased | | | average price paid per share
in EUR | | | total number of shares
purchased as part of publicly
announced programs | | | maximum EUR amount of
shares that may yet be
purchased under share
repurchases for capital
reduction purposes | | | | | | | January, 2015 | | | 2,453,000 | | | | 24.12 | | | | 2,453,000 | | | | 831,305,431 | | February, 2015 | | | 1,667,000 | | | | 25.28 | | | | 1,667,000 | | | | 789,158,522 | | March, 2015 | | | 1,658,000 | | | | 26.49 | | | | 1,658,000 | | | | 745,246,053 | | April, 2015 | | | 1,254,000 | | | | 26.76 | | | | 1,254,000 | | | | 711,690,985 | | May, 2015 | | | 2,317,000 | | | | 24.78 | | | | 2,317,000 | | | | 654,264,258 | | June, 2015 | | | 1,706,816 | | | | 24.31 | | | | 1,706,816 | | | | 612,769,082 | | July, 2015 | | | 892,700 | | | | 23.86 | | | | 892,700 | | | | 591,469,324 | | August, 2015 | | | 1,592,000 | | | | 24.12 | | | | 1,592,000 | | | | 553,070,885 | | September, 2015 | | | 2,143,500 | | | | 22.17 | | | | 2,143,500 | | | | 505,559,920 | | October, 2015 | | | 1,208,000 | | | | 22.41 | | | | 1,208,000 | | | | 478,493,624 | | November, 2015 | | | 1,371,000 | | | | 24.70 | | | | 1,371,000 | | | | 444,634,342 | | December, 2015 | | | 2,033,000 | | | | 24.16 | | | | 2,033,000 | | | | 395,526,396 | | | | | | |
260 Annual Report 2015
Investor Relations 17.3 16.317.3 Philips’ rating
Philips’ existing long-term debt is rated A3BBB+ (with stable outlook)2)1) by Moody’sStandard & Poor’s and A-Baa1 (with stable outlook)1)2) by Standard & Poor’s. ItMoody’s. As part of the capital allocation policy, it is Philips’ objectiveambition to manage its financial ratios to be in line with an A3/A-retain a strong investment grade credit rating. There is no assurance that Philips will be able to achieve this goal. Ratings are subject to change at any time. OutstandingThe Company’s outstanding long-term bondsdebt and credit facilities do not have a repetitive material adverse change clause,contain financial covenants or credit rating-relatedcross acceleration possibilities.provisions that are based on adverse changes in ratings or on material adverse change. Philips Group Credit rating summary 2015 | | | | | | | | | | | | | | | | | | | | | long-term | | | short-term | | | outlook | | | | | | | Standard and& Poor’s | | | A-BBB+ | 1) | | | A-2 | | | | Stable | 1) | Moody’s | | | A3Baa1 | 2) | | | P-2 | | | | Stable | 2) | | | | | |
| 1) | On July 24, 2013,28, 2015, Standard and& Poor’s changed the long-term rating from A- to BBB+ and the outlook from negative to stable |
| 2) | On February 6, 2014,March 17, 2015, Moody’s changed the outlooklong-term rating from negativeA3 to stableBaa1 |
Annual Report 2013 261
16 Investor Relations 16.4 - 16.4
16.417.4 Performance in relation to market indices
The common shares of the Company are listed on the stock market of NYSE Euronext Amsterdam. The New York Registry Shares of the Company, representing common shares of the Company, are listed on the New York Stock Exchange. The principal market for the common shares is NYSE Euronext Amsterdam. For the New York Registry Shares it is the New York Stock Exchange. The following table shows the high and low closing sales prices of the common shares on the stock market of NYSE Euronext Amsterdam as reported in the Official Price List and the high and low closing sales prices of the New York Registry Shares on the New York Stock Exchange: Philips Group | | | | | | | | | | | | | | | | | | | | | | | | | | | Euronext Amsterdam (EUR) | | | New York stock exchange (USD) | | | | | | | | high | | | low | | | high | | | low | | 2009 | | | | | | | 21.03 | | | | 10.95 | | | | 30.19 | | | | 13.98 | | | | | | | | 2010 | | | 1st quarter | | | | 25.28 | | | | 20.34 | | | | 33.48 | | | | 28.26 | | | | | 2nd quarter | | | | 26.94 | | | | 22.83 | | | | 35.90 | | | | 28.09 | | | | | 3rd quarter | | | | 26.23 | | | | 21.32 | | | | 33.32 | | | | 26.84 | | | | | 4th quarter | | | | 24.19 | | | | 20.79 | | | | 33.90 | | | | 27.10 | | 2011 | | | 1st quarter | | | | 25.34 | | | | 21.73 | | | | 33.81 | | | | 29.81 | | | | | 2nd quarter | | | | 22.84 | | | | 16.33 | | | | 32.44 | | | | 23.36 | | | | | 3rd quarter | | | | 17.84 | | | | 12.23 | | | | 25.74 | | | | 16.87 | | | | | 4th quarter | | | | 16.28 | | | | 12.77 | | | | 22.54 | | | | 17.22 | | 2012 | | | 1st quarter | | | | 16.56 | | | | 14.48 | | | | 21.51 | | | | 18.34 | | | | | 2nd quarter | | | | 15.57 | | | | 13.76 | | | | 20.26 | | | | 17.32 | | | | | 3rd quarter | | | | 19.49 | | | | 15.51 | | | | 24.89 | | | | 19.11 | | | | | 4th quarter | | | | 20.33 | | | | 18.27 | | | | 26.81 | | | | 23.52 | | 2013 | | | 1st quarter | | | | 23.67 | | | | 20.26 | | | | 31.72 | | | | 26.60 | | | | | 2nd quarter | | | | 23.48 | | | | 20.36 | | | | 30.65 | | | | 26.75 | | | | | 3rd quarter | | | | 25.32 | | | | 20.89 | | | | 33.60 | | | | 27.28 | | | | | 4th quarter | | | | 26.78 | | | | 23.17 | | | | 36.97 | | | | 31.36 | | | | | | | | August, 2013 | | | | | | | 24.58 | | | | 22.90 | | | | 32.45 | | | | 30.62 | | September, 2013 | | | | | | | 25.32 | | | | 23.83 | | | | 33.60 | | | | 31.57 | | October, 2013 | | | | | | | 26.08 | | | | 23.17 | | | | 35.69 | | | | 31.36 | | November, 2013 | | | | | | | 26.50 | | | | 25.70 | | | | 35.76 | | | | 34.81 | | December, 2013 | | | | | | | 26.78 | | | | 24.64 | | | | 36.97 | | | | 33.92 | | January, 2014 | | | | | | | 28.10 | | | | 25.52 | | | | 38.36 | | | | 34.61 | |
High and low closing price of common shares 2011 - 2016 | | | | | | | | | | | | | | | | | | | | | | | | | | | | | | | | | | | | Euronext Amsterdam (EUR) | | | New York Stock Exchange (USD) | | | | | | | | | | | | | | | | | | | | | high | | | low | | | high | | | low | | | | | | | | | | | January, 2016 | | | | | | | 24.50 | | | | 22.15 | | | | 26.68 | | | | 24.04 | | December, 2015 | | | | | | | 25.49 | | | | 23.19 | | | | 27.14 | | | | 25.41 | | November, 2015 | | | | | | | 25.88 | | | | 24.40 | | | | 27.29 | | | | 26.05 | | October, 2015 | | | | | | | 24.59 | | | | 21.09 | | | | 26.94 | | | | 23.66 | | September, 2015 | | | | | | | 23.29 | | | | 20.79 | | | | 25.86 | | | | 23.19 | | August, 2015 | | | | | | | 25.71 | | | | 21.94 | | | | 28.23 | | | | 24.79 | | | | | | | | 2015 | | | 4th quarter | | | | 25.88 | | | | 21.09 | | | | 27.29 | | | | 23.66 | | | | | 3rd quarter | | | | 25.71 | | | | 20.79 | | | | 28.23 | | | | 23.19 | | | | | 2nd quarter | | | | 27.65 | | | | 22.82 | | | | 30.08 | | | | 25.46 | | | | | 1st quarter | | | | 27.40 | | | | 23.16 | | | | 30.31 | | | | 27.54 | | 2014 | | | 4th quarter | | | | 24.68 | | | | 20.98 | | | | 31.02 | | | | 26.36 | | | | | 3rd quarter | | | | 25.27 | | | | 22.11 | | | | 32.39 | | | | 29.80 | | | | | 2nd quarter | | | | 25.86 | | | | 22.22 | | | | 35.95 | | | | 30.35 | | | | | 1st quarter | | | | 28.10 | | | | 23.88 | | | | 38.36 | | | | 33.13 | | 2013 | | | 4th quarter | | | | 26.78 | | | | 23.17 | | | | 36.97 | | | | 31.36 | | | | | 3rd quarter | | | | 25.32 | | | | 20.89 | | | | 33.60 | | | | 27.28 | | | | | 2nd quarter | | | | 23.48 | | | | 20.36 | | | | 30.65 | | | | 26.75 | | | | | 1st quarter | | | | 23.67 | | | | 20.26 | | | | 31.72 | | | | 26.60 | | 2012 | | | 4th quarter | | | | 20.33 | | | | 18.27 | | | | 26.81 | | | | 23.52 | | | | | 3rd quarter | | | | 19.49 | | | | 15.51 | | | | 24.89 | | | | 19.11 | | | | | 2nd quarter | | | | 15.57 | | | | 13.76 | | | | 20.26 | | | | 17.32 | | | | | 1st quarter | | | | 16.56 | | | | 14.48 | | | | 21.51 | | | | 18.34 | | | | | | | | 2011 | | | | | | | 25.34 | | | | 12.23 | | | | 33.81 | | | | 16.87 | | | | | | | | | | |
262 Annual Report 20132015 261
16 Investor Relations 16.4 - 16.417.4
Euronext Amsterdam Philips Group Share price development in Amsterdamin EUR in euros2014 - 2015
| | | | | | | | | | | | | | | | | | | | | | | | | | | | | PHIA | | Jan | | | Feb | | | Mar | | | Apr | | | May | | | Jun | | | Jul | | | Aug | | | Sep | | | Oct | | | Nov | | | Dec | | | Jan | | | Feb | | | Mar | | | Apr | | | May | | | Jun | | | Jul | | | Aug | | | Sep | | | Oct | | | Nov | | | Dec | | 2013 | | | | | | | | | | | | | | | | | | | | | | | | | | 2015 | | | | | | | | | | | | | | | | | | | | | | | | | | High | | | 23.13 | | | | 23.31 | | | | 23.67 | | | | 23.48 | | | | 22.90 | | | | 21.81 | | | | 24.41 | | | | 24.58 | | | | 25.32 | | | | 26.08 | | | | 26.50 | | | | 26.78 | | | | 26.80 | | | | 26.77 | | | | 27.40 | | | | 27.65 | | | | 25.44 | | | | 24.94 | | | | 25.32 | | | | 25.71 | | | | 23.29 | | | | 24.59 | | | | 25.88 | | | | 25.49 | | Low | | | 20.26 | | | | 21.23 | | | | 21.56 | | | | 20.54 | | | | 20.45 | | | | 20.36 | | | | 20.89 | | | | 22.90 | | | | 23.83 | | | | 23.17 | | | | 25.70 | | | | 24.64 | | | | 23.16 | | | | 24.54 | | | | 25.98 | | | | 25.66 | | | | 24.24 | | | | 22.82 | | | | 22.38 | | | | 21.94 | | | | 20.79 | | | | 21.09 | | | | 24.40 | | | | 23.19 | | Average | | | 21.34 | | | | 22.26 | | | | 22.93 | | | | 22.15 | | | | 21.97 | | | | 21.29 | | | | 22.81 | | | | 24.00 | | | | 24.54 | | | | 24.68 | | | | 26.14 | | | | 25.81 | | | | 24.49 | | | | 25.45 | | | | 26.64 | | | | 26.96 | | | | 24.96 | | | | 23.94 | | | | 23.97 | | | | 24.19 | | | | 22.11 | | | | 22.71 | | | | 25.05 | | | | 24.06 | | Average daily volume1) | | | 5.50 | | | | 6.11 | | | | 6.09 | | | | 6.57 | | | | 6.17 | | | | 5.90 | | | | 5.33 | | | | 3.81 | | | | 6.32 | | | | 5.41 | | | | 3.90 | | | | 4.99 | | | | 9.26 | | | | 5.64 | | | | 5.86 | | | | 7.66 | | | | 6.96 | | | | 8.79 | | | | 7.30 | | | | 6.88 | | | | 6.75 | | | | 6.00 | | | | 6.08 | | | | 6.05 | | | 2012 | | | | | | | | | | | | | | | | | | | | | | | | | | 2014 | | | | | | | | | | | | | | | | | | | | | | | | | | High | | | 16.56 | | | | 16.42 | | | | 16.26 | | | | 15.32 | | | | 15.26 | | | | 15.57 | | | | 17.90 | | | | 18.86 | | | | 19.49 | | | | 20.11 | | | | 20.21 | | | | 20.33 | | | | 28.10 | | | | 26.47 | | | | 25.86 | | | | 25.86 | | | | 23.64 | | | | 24.22 | | | | 23.82 | | | | 23.46 | | | | 25.27 | | | | 24.68 | | | | 24.26 | | | | 24.37 | | Low | | | 14.48 | | | | 15.45 | | | | 14.95 | | | | 13.76 | | | | 14.00 | | | | 13.87 | | | | 15.51 | | | | 18.09 | | | | 18.16 | | | | 18.27 | | | | 19.47 | | | | 19.83 | | | | 25.52 | | | | 25.09 | | | | 23.88 | | | | 22.98 | | | | 22.43 | | | | 22.22 | | | | 23.08 | | | | 22.11 | | | | 23.12 | | | | 20.98 | | | | 22.05 | | | | 22.52 | | Average | | | 15.31 | | | | 15.80 | | | | 15.55 | | | | 14.51 | | | | 14.49 | | | | 14.67 | | | | 16.47 | | | | 18.46 | | | | 18.80 | | | | 18.95 | | | | 19.95 | | | | 20.05 | | | | 27.17 | | | | 25.79 | | | | 24.82 | | | | 24.66 | | | | 23.21 | | | | 23.13 | | | | 23.37 | | | | 22.82 | | | | 23.89 | | | | 22.51 | | | | 22.91 | | | | 23.78 | | Average daily volume1) | | | 6.77 | | | | 5.53 | | | | 5.54 | | | | 8.05 | | | | 6.91 | | | | 6.10 | | | | 6.15 | | | | 4.68 | | | | 5.60 | | | | 4.97 | | | | 4.89 | | | | 3.88 | | | | 6.23 | | | | 5.55 | | | | 6.52 | | | | 6.94 | | | | 5.66 | | | | 5.38 | | | | 5.03 | | | | 4.07 | | | | 5.94 | | | | 7.75 | | | | 5.74 | | | | 5.74 | | | | | | | |
New York Stock Exchange Philips Group Share price development in New Yorkin USD in US dollars2014 - 2015
| | | | | | | | | | | | | | | | | | | | | | | | | | | | | PHG | | Jan | | | Feb | | | Mar | | | Apr | | | May | | | Jun | | | Jul | | | Aug | | | Sep | | | Oct | | | Nov | | | Dec | | | Jan | | | Feb | | | Mar | | | Apr | | | May | | | Jun | | | Jul | | | Aug | | | Sep | | | Oct | | | Nov | | | Dec | | 2013 | | | | | | | | | | | | | | | | | | | | | | | | | | 2015 | | | | | | | | | | | | | | | | | | | | | | | | | | High | | | 31.16 | | | | 31.72 | | | | 30.72 | | | | 30.65 | | | | 29.21 | | | | 29.19 | | | | 32.47 | | | | 32.45 | | | | 33.60 | | | | 35.69 | | | | 35.76 | | | | 36.97 | | | | 30.31 | | | | 30.10 | | | | 29.80 | | | | 30.08 | | | | 28.77 | | | | 27.99 | | | | 27.81 | | | | 28.23 | | | | 25.86 | | | | 26.94 | | | | 27.29 | | | | 27.14 | | Low | | | 26.60 | | | | 27.82 | | | | 28.23 | | | | 26.88 | | | | 26.75 | | | | 26.94 | | | | 27.28 | | | | 30.62 | | | | 31.57 | | | | 31.36 | | | | 34.81 | | | | 33.92 | | | | 27.54 | | | | 27.80 | | | | 27.83 | | | | 28.57 | | | | 27.29 | | | | 25.46 | | | | 24.87 | | | | 24.79 | | | | 23.19 | | | | 23.66 | | | | 26.05 | | | | 25.41 | | Average | | | 28.41 | | | | 29.68 | | | | 29.71 | | | | 28.84 | | | | 28.37 | | | | 28.12 | | | | 29.91 | | | | 31.92 | | | | 32.86 | | | | 33.63 | | | | 35.22 | | | | 35.48 | | | | 28.49 | | | | 28.96 | | | | 28.85 | | | | 29.17 | | | | 27.90 | | | | 26.83 | | | | 26.35 | | | | 26.84 | | | | 24.75 | | | | 25.50 | | | | 26.82 | | | | 26.21 | | Average daily volume1) | | | 0.85 | | | | 0.77 | | | | 0.82 | | | | 0.77 | | | | 0.80 | | | | 0.93 | | | | 0.86 | | | | 0.44 | | | | 0.66 | | | | 0.66 | | | | 0.39 | | | | 0.39 | | | | 1.34 | | | | 0.80 | | | | 0.77 | | | | 1.56 | | | | 1.16 | | | | 1.73 | | | | 2.04 | | | | 1.77 | | | | 1.60 | | | | 1.21 | | | | 0.93 | | | | 0.90 | | | 2012 | | | | | | | | | | | | | | | | | | | | | | | | | | 2014 | | | | | | | | | | | | | | | | | | | | | | | | | | High | | | 21.47 | | | | 21.36 | | | | 21.51 | | | | 20.26 | | | | 20.00 | | | | 19.67 | | | | 22.11 | | | | 23.30 | | | | 24.89 | | | | 26.23 | | | | 26.01 | | | | 26.81 | | | | 38.36 | | | | 36.15 | | | | 35.37 | | | | 35.95 | | | | 32.32 | | | | 32.75 | | | | 32.39 | | | | 31.04 | | | | 32.08 | | | | 31.02 | | | | 30.05 | | | | 30.12 | | Low | | | 18.34 | | | | 20.24 | | | | 19.58 | | | | 17.98 | | | | 17.68 | | | | 17.32 | | | | 19.11 | | | | 22.00 | | | | 22.99 | | | | 23.52 | | | | 24.80 | | | | 25.91 | | | | 34.61 | | | | 34.04 | | | | 33.13 | | | | 31.75 | | | | 31.08 | | | | 30.35 | | | | 30.80 | | | | 29.80 | | | | 30.14 | | | | 26.36 | | | | 27.61 | | | | 28.04 | | Average | | | 19.73 | | | | 20.85 | | | | 20.57 | | | | 19.10 | | | | 18.57 | | | | 18.41 | | | | 20.26 | | | | 22.84 | | | | 24.20 | | | | 24.48 | | | | 25.51 | | | | 26.27 | | | | 36.86 | | | | 35.11 | | | | 34.26 | | | | 34.05 | | | | 31.78 | | | | 31.44 | | | | 31.68 | | | | 30.38 | | | | 30.80 | | | | 28.52 | | | | 28.50 | | | | 29.24 | | Average daily volume1) | | | 1.64 | | | | 0.93 | | | | 1.32 | | | | 1.80 | | | | 1.03 | | | | 0.83 | | | | 0.63 | | | | 0.54 | | | | 0.82 | | | | 0.64 | | | | 0.77 | | | | 0.62 | | | | 0.70 | | | | 0.56 | | | | 0.49 | | | | 0.57 | | | | 0.48 | | | | 0.69 | | | | 0.93 | | | | 0.55 | | | | 0.77 | | | | 0.78 | | | | 0.60 | | | | 0.57 | | | | | | | |
Annual Report 2013 263
16 Investor Relations 16.4 - 16.4
Philips Group 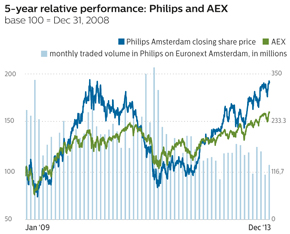

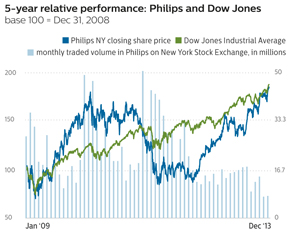
| | | | | | | Share listings | | | Amsterdam, New York | | | | | | | Ticker code | | | PHIA, PHG | | No. of shares issued at Dec. 31, 20132015 | | | 938931 million | | No. of shares outstanding issued at Dec. 31, 20132015 | | | 913917 million | | Market capitalization at year-end 20132015 | | | EUR 24.321.6 billion | | Industry classification | | | | | MSCI: Capital Goods | | | 20105010 | | ICB: Diversified Industrials | | | 2727 | | Members of indices | | | | | AEX, NYSE, DJSI, and others | | | | | | | | | |
264262 Annual Report 20132015
16 Investor Relations 16.5 - 16.517.4
16.5 Philips’ acquisitions
Philips made no announcements of acquisitions in 2013 and 2012.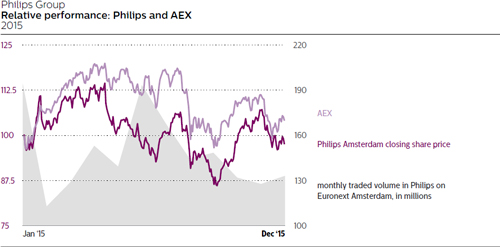
| | | | | | | Acquisitions 2011 / Announcement dates

| | | | | | | January 5, 2011
| | Optimum Lighting, LLC | | Professional Luminaires | | Expand portfolio with customized energy-efficient lighting solutions | | | | | January 20, 2011
| | Preethi1) | | Domestic Appliances | | Become a leading kitchen appliances company in India | | | | | March 9, 2011
| | Dameca A/S | | Patient Care & Clinical
Informatics | | Expand portfolio with integrated, advanced anesthesia care solutions | | | | | June 20, 2011
| | AllParts Medical | | Customer Services | | Expand capabilities in imaging equipment services, strengthening Philips’ Multi-Vendor Services business | | | | | June 27, 2011
| | Sectra Mamea AB2) | | Imaging Systems | | Expand Women’s Healthcare portfolio with a unique digital mammography solution in terms of radiation dose | | | | | June 29, 2011
| | Indal Group | | Professional Luminaires | | Strengthen leading position in professional lighting within Europe | | | | | July 11, 2011
| | Povos Electric Appliance (Shanghai) Co., Ltd.2) | | Domestic Appliances | | Expand product portfolio in China and continue to build business creation capabilities in growth geographies |
1) | Asset transaction
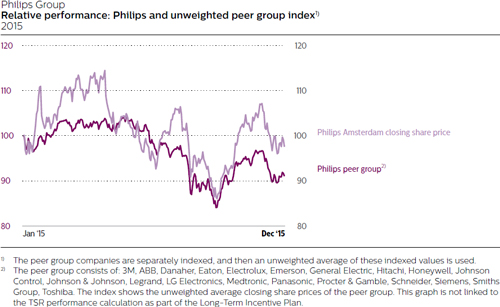
|
2) | Combined asset transaction / share transaction
|
| | | | | | | Acquisitions 2010 / Announcement dates
| | | | | | | February 11, 2010
| | Luceplan | | Consumer Luminaires | | Iconic brand in the premium design segment for residential applications | | | | | February 24, 2010
| | Somnolyzer1) | | Home Healthcare | | Somnolyzer 24x7 automated-scoring solution that can improve the productivity of sleep centers | | | | | March 26, 2010
| | Tecso | | Patient Care &
Clinical Informatics | | Strengthen clinical informatics portfolio with leading Brazilian provider of Radiology Information Systems (RIS) | | | | | July 13, 2010
| | Street Light Control Portfolio1) | | Lighting Electronics | | Strengthen outdoor lighting portfolio with acquisition control portfolio. Street Lighting controls activities of Amplex A/S | | | | | July 28, 2010
| | Apex | | Imaging Systems | | Strengthen portfolio of high-quality transducers aimed at the value segment in emerging markets | | | | | August 2, 2010
| | CDP Medical1) | | Patient Care &
Clinical Informatics | | Expand clinical informatics portfolio in high-growth markets in the area of PACS | | | | | August 20, 2010
| | Burton | | Professional
Luminaires | | Expand portfolio with leading provider of specialized lighting solutions for healthcare facilities | | | | | September 13, 2010
| | Wheb Sistemas | | Patient Care &
Clinical Informatics | | Strengthen clinical informatics portfolio with a leading Brazilian provider of clinical information systems | | | | | October 11, 2010
| | Discus | | Health & Wellness | | Expand oral healthcare portfolio with leading manufacturer of professional tooth whitening products | | | | | December 6, 2010
| | NCW | | Professional
Luminaires | | Expand global leadership position of professional lighting entertainment solutions | | | | | January 6, 2011
| | medSage Technologies1) | | Home Healthcare | | Strengthen portfolio by becoming a leading provider of patient interaction and management applications |
Annual Report 2013 2652015 263
16 Investor Relations 16.6 - 16.717.5
16.617.5 Financial calendar
| | | | Financial calendar | | | | | | Annual General Meeting of Shareholders | | | | | | Record date Annual General Meeting of Shareholders | | April 3, 201414, 2016 | | | Annual General Meeting of Shareholders | | May 1, 201412, 2016 | | | Quarterly reports 2014 | | | | | | First quarter results 20142016 | | April 22, 201425, 2016 | | | Second quarter results 20142016 | | July 21, 201425, 2016 | | | Third quarter results 20142016 | | October 20, 201424, 2016 | | | Fourth quarter results 20142016 | | January 27, 201524, 20171) | | | Capital Markets Days 2014Day | | | | | | Capital Markets Days (Healthcare, Consumer Lifestyle and Lighting)Day - HealthTech | | September 23-24, 201413, 20161) | |
| 1) | Subject to final confirmation |
16.717.6 Investor contact
Shareholder services Holders of shares listed on Euronext Amsterdam Philips offers a dynamic print manager on its Annual Report website that facilitates the creation and download of a customized PDF. Non-US shareholders and other non-US interested parties can make inquiries about the Annual Report 20132015 to: Royal Philips Annual Report Office Philips Center, HBT 12 P.O. Box 77900 1070 MX Amsterdam, The Netherlands E-mail:annual.report@philips.com Communications concerning share transfers, lost certificates, dividends and change of address should be directed to: ABN AMRO Bank N.V. Department Equity Capital Markets/Corporate Broking HQ7050 Gustav Mahlerlaan 10, 1082 PP Amsterdam The Netherlands Telephone: +31-20-34 42000 Fax: +31-20-62 88481 E-mail:corporate.broking@nl.abnamro.com Holders of New York Registry shares Philips offers a dynamic print manager on it’s Annual Report website that facilitates the creation and download of a customized PDF. Holders of New York Registry shares and other interested parties in the US can make inquiries about the Annual Report 20132015 to: Citibank Shareholder Service P.O. Box 43077 Providence, Rhode Island 02940-3077 Telephone: 1-877-CITI-ADR (toll-free) Telephone: 1-781-575-4555 (outside of US) Fax: 1-201-324-3284 Website:www.citi.com/dr E-mail:citibank@shareholders-online.com Communications concerning share transfers, lost certificates, dividends and change of address should be directed to Citibank. The Annual Report on Form 20-F is filed electronically with the US Securities and Exchange Commission. 266 Annual Report 2013
16 Investor Relations 16.7 - 16.7
International direct investment program Philips offers a dividend reinvestment and direct stockshare purchase plan designed for the US market. This program provides existing shareholders and interested investors with an economical and convenient way to purchase and sell Philips New York Registry shares and to reinvest cash dividends. Philips does not administer or sponsor the program and assumes no obligation or liability for the operation of the plan. For further information on this program and for enrollment forms, contact: Citibank Shareholder Service Telephone: 1-877-248-4237 (1-877-CITI-ADR) Monday through Friday 8:30 AM EST through 6:00 PM EST Websitewww.citi.com/dr E-mail:citibank@shareholders-online.com or by writing to: Citibank Shareholder Service International Direct Investment Program P.O. Box 2502, Jersey City, NJ 07303-2502 20142016 Annual General Meeting of Shareholders
The Agenda and the explanatory notes ofto the Agenda for the 2014 Annual General Meeting of Shareholders areon May 12, 2016, will be published on the Company’s website. For the 2016 Annual General Meeting of Shareholders, on May 1, 2014, a record date of April 3, 201414, 2016 will apply. Those persons who, on April 3, 2014that date, hold shares in the Company, and are registered as such in one of the registers designated by the Board of Management for the Annual General Meeting of Shareholders, will be entitled to participate in, and vote at, the meeting. The Dutch Shareholders Communication Channel decided to terminate its activities as per the end of 2013. Their decision follows the entry into force of new legislation on July 1, 2013 which provides a legal basis in Dutch law for shareholder communication.
Investor relationsRelations activities From time to time the Company engages in communicationscommunicates with investors via road shows, one-on-one meetings, group meetings, broker conferences and capital markets days.a Capital Markets Day, announced in advance on the Company’s website. The purpose of these meetingsengagements is to inform the market onof the results, strategy and decisions made, as well as to receive feedback from shareholders. Also,Furthermore, the Company engages in bilateral communications with investors. These communications take place either at the initiative of the Company or at the initiative of investors. During these communications theThe Company is generally represented by its Investor Relations department. However,department during these interactions, however, on a limited number of occasions the Investor Relations 264 Annual Report 2015
Investor Relations 17.6 department is accompanied by one or more members of the Board of Management.senior management. The subject matter of the bilateral communications ranges from individual queries from investors to more elaborate discussions following disclosures that the Company has made, such as its annual and quarterly reports. TheAlso here, the Company is strict in its compliance with applicable rules and regulations on fair and non-selective disclosure and equal treatment of shareholders. More information on the activities of Investor Relations can be found in chapter 10,11, Corporate governance, of this report. Analysts’ coverage Philips is covered by approximately 3530 analysts who frequently issue reports on the company. Annual Report 2013 267
16 Investor Relations 16.7 - 16.8
For a list of our current analysts, please refer to:www.philips.com/a-w/about/investor/shareholder-info/analyst-coverage.html How to reach us Investor Relations contact Royal Philips Philips Center, HBT 14 P.O. Box 77900 1070 MX Amsterdam, The Netherlands Telephone: +31-20-59 77222 Website:www.philips.com/investor E-mail:investor.relations@philips.com Robin Jansen Head of Investor Relations Telephone: +31-20-59 77222 Vanessa Bruinsma-Kleijkers Investor Relations Manager Telephone: +31-20-59 77447 Leandro Mazzoni Investor Relations Manager Telephone: +31-20-59 77055 The registered office of Royal Philips is High Tech Campus 5 5656 AE Eindhoven, The Netherlands Switch board, telephone: +31-40-27 91111 Sustainability contact Philips Group Sustainability High Tech Campus 5 (room 2.56) 5656 AE Eindhoven, The Netherlands Telephone: +31-40-27 83651 Fax: +31-40-27 86161 Website:www.philips.com/sustainability E-mail:philips.sustainability@philips.com CorporateGroup Communications contact
Royal Philips Philips Center, HBT 19 P.O. Box 77900Amstelplein 2
1070 MX1096 BC Amsterdam, The Netherlands
E-mail:corporate.communications@philips.comgroup.communications@philips.com For media contacts please refer to: www.newscenter.philips.com/main/standard/news/contacts Annual Report 2015 265
Investor Relations 17.7 16.817.7 Taxation
Dutch Taxation The statements below are only a general summary of certain material Dutch tax consequences for holders of common shares that are non-residents of the Netherlands based on present Dutch tax laws and the Tax Convention of December 18, 1992, as amended by the protocol that entered into force on December 28, 2004, between the United States of America and the Kingdom of the Netherlands (the U.S.US Tax Treaty) and are not to be read as extending by implication to matters not specifically referred to herein. As to individual tax consequences, investors in the common shares should consult their own professional tax advisor. With respect to a holder of common shares that is an individual who receives income or derives capital gains from the common shares and this income received or capital gains derived are attributable to past, present or future employment activities of such holder, the income of which is taxable in the Netherlands, the Dutch tax position is not discussed in this summary. Dividend withholding tax In general, a distribution to shareholders by a company resident in the Netherlands (such as the Company) is subject to a withholding tax imposed by the Netherlands at a rate of 15%. Share dividends paid out of the Company’s paid-in share premium recognized for Dutch tax purposes are not subject to the above mentioned withholding tax. Share dividends paid out of the Company’s retained earnings are subject to dividend withholding tax on the nominal value of the shares issued. Pursuant to the provisions of the U.S.US Tax Treaty, a reduced rate may be applicable in respect of dividends paid by the Company to a beneficial owner holding directly 10% or more of the voting power of the Company, if such owner is a company resident of the United States (as defined in the U.S.US Tax Treaty) and entitled to the benefits of the U.S.US Tax Treaty. Pursuant to Dutch anti-dividend stripping legislation, a holder of common shares who is the recipient of dividends will generally not be considered the beneficial owner of the dividends if (i) as a consequence of a combination of transactions, a person other than the recipient wholly or partly benefits from the dividends; (ii) whereby such other person retains, directly or indirectly, an interest similar to that in the common shares on which the dividends were paid; and 268 Annual Report 2013
16 Investor Relations 16.8 - 16.8
(iii) that other person is entitled to a credit, reduction or refund of dividend withholding tax that is less than that of the recipient. Dividends paid to qualifying exempt US pension trusts and qualifying exempt US organizations are under certain conditions exempt from Dutch withholding tax under the U.S.US Tax Treaty. Qualifying exempt US pension trusts normally remain subject to withholding at the rate of 15% and are required to file for a refund of the tax withheld. Only if certain conditions are fulfilled, such pension trusts may be eligible for relief at source upon payment of the dividend. However, for qualifying exempt US organizations no relief at source upon payment of the dividend is available; such exempt US organizations should apply for a refund of the 15% withholding tax withheld. Further, under certain circumstances, certain exempt organisations (e.g pension funds) may be eligible for a refund of Dutch withholding tax upon their request pursuant to Dutch tax law. The Company may, with respect to certain dividends received from qualifying non-Dutch subsidiaries, credit taxes withheld from those dividends against the Dutch withholding tax imposed on certain qualifying dividends that are redistributed by the Company, up to a maximum of the lesser of: 3% of the amount of qualifying dividends redistributed by the Company; and 3% of the gross amount of certain qualifying dividends received by the Company. The reduction is applied to the Dutch dividend withholding tax that the Company must pay to the Dutch tax authorities and not to the Dutch dividend withholding tax that the Company must withhold. Income and capital gains Income and capital gains derived from the common shares by a non-resident individual or non-resident corporate shareholder are generally not subject to Dutch income or corporation tax, unless (i) such income and gains are attributable to a (deemed) permanent establishment or (deemed) permanent representative in the Netherlands of the shareholder; or (ii) the shareholder is entitled to a share in the profits of an enterprise or (in case of a non-resident corporate shareholder only) a co-entitlement to the net worth of an enterprise, that is effectively managed in the Netherlands (other than by way of securities) and to which enterprise the common shares are attributable; or (iii) such income and capital gains are derived from a direct, indirect or deemed substantial participation in the share capital of athe company (such substantial participation not being a business asset), and, in the case of a non-resident corporate shareholder only, it being held with the primary aim or one of the primary aims to avoid the levy of income tax or dividend withholding tax from another person; or (iv) in case of a non-resident corporate shareholder, such shareholder is a resident of Aruba, Curacao or Saint Martin with a permanent establishment or permanent representative in Bonaire, Eustatius or Saba to which the common shares are attributable, while the profits of such shareholder are taxable in the Netherlands pursuant to article 17(3)(c) of the Dutch Corporate Income Tax Act 1969; or (v) in case of a non-resident individual, (a) such individual derives income or capital gains from the common shares that are taxable as benefits from ‘miscellaneous activities’ in the Netherlands (resultaat uit overige werkzaamheden, as 266 Annual Report 2015
Investor Relations 17.7 defined in the Dutch Income Tax Act 2001), which includes the performance of activities with respect to the ordinary shares that exceed regular portfolio management;management.It is noted that pursuant to Dutch tax law changes as per 1 January 2016, in deviation from the applicable wording for 2015 under (iii) above, a non-resident corporate shareholder that holds a direct, indirect or (b)deemed substantial participation in the Company is subject to Dutch corporation tax if such individual has electedsubstantial participation is being held with the primary aim or one of the primary aims to be treated as a Dutch resident.avoid the levy of income tax or dividend withholding tax from another person and is put in place without valid commercial reasons that reflect economic reality. In general, a holder of common shares has a substantial participation if he holds either directly or indirectly and either independently or jointly with his partner (as defined in the Dutch Income Tax Act 2001), the ownership of, or certain other rights over, at least 5% of the total issued share capital or total issued particular class of shares of the Company or rights to acquire shares, whether or not already issued, that represent at any time 5% or more of the total issued capital (or the total issued particular class of shares) or the ownership of certain profit participating certificates that relate to 5% or more of the annual profit or to 5% or more of the liquidation proceeds. A shareholder will also have a substantial participation in the Company if one or more of certain relatives of the shareholder hold a substantial participation in the Company. A deemed substantial participation amongst others exists if (part of) a substantial participation has been disposed of, or is deemed to have been disposed of, on a non-recognition basis. Estate and gift taxes No estate, inheritance or gift taxes are imposed by the Netherlands on the transfer or deemed transfer of common shares by way of gift by or on the death of a shareholder if, at the time of the death of the shareholder or the gift of the common shares (as the case may be), such shareholder is not a (deemed) resident of the Netherlands. Inheritance or gift taxes (as the case may be) are due, however, if such shareholder: Annual Report 2013 269
16 Investor Relations 16.8 - 16.8
has Dutch nationality and has been a resident of the Netherlands at any time during the ten years preceding the time of the death or gift; or has no Dutch nationality but has been a resident of the Netherlands at any time during the twelve months preceding the time of the gift (for Netherlands gift taxes only) United States Federal Taxation This section describes the material United States federal income tax consequences to a US holder (as defined below) of owning common shares. It applies only if the common shares are held as capital assets for tax purposes. This section does not apply to a member of a special class of holders subject to special rules, including: a trader in securities that elects to use a mark-to-market method of accounting for securities holdings, a tax-exempt organization, a life insurance company, a person liable for alternative minimum tax, a person that actually or constructively owns 10% or more of our voting stock, a person that holds common shares as part of a straddle or a hedging or conversion transaction, a person that purchases or sells common shares as part of a wash sale for tax purposes, or a person whose functional currency is not the US dollar. This section is based on the Internal Revenue Code of 1986, as amended, its legislative history, existing and proposed regulations, published rulings and court decisions, all as currently in effect, as well as on the U.S.US Tax Treaty. These laws and regulations are subject to change, possibly on a retroactive basis. If a partnership holds the common shares, the United States federal income tax treatment of a partner will generally depend on the status of the partner and the tax treatment of the partnership. A partner in a partnership holding the common shares should consult its tax advisor with regard to the United States federal income tax treatment of an investment in the common shares. A US holder is defined as a beneficial owner of common shares that is: a citizen or resident of the United States, an estate whose income is subject to United States federal income tax regardless of its source, or a trust if a United States court can exercise primary supervision over the trust’s administration and one or more United States persons are authorized to control all substantial decisions of the trust. A US holder should consult its own tax advisor regarding the United States federal, state and local and other tax consequences of owning and disposing of common shares in its particular circumstances. This discussion addresses only United States federal income taxation. Taxation of Dividends Under the United States federal income tax laws, the gross amount of any dividend paid out of our current or accumulated earnings and profits (as determined for United States federal income tax purposes) is subject to United States federal income taxation. For a non-corporate US holder, dividends paid that constitute Annual Report 2015 267
Investor Relations 17.7 qualified dividend income will be taxable at a maximum tax rate of 20% provided that the non-corporate US holder holds the common shares for more than 60 days during the 121-day period beginning 60 days before the ex-dividend date and meets other holding period requirements. Dividends paid with respect to the common shares generally will be qualified dividend income1). A US holder must include any Dutch tax withheld from the dividend payment in this gross amount even though it does not in fact receive it. The dividend is taxable to a US holder when it receives the dividend, actually or constructively. The dividend will not be eligible for the dividends-received deduction generally allowed to United States corporations in respect of dividends received from other United States corporations. The amount of the dividend distribution that a US holder must include in its income will be the US dollar value of the Euroeuro payments made, determined at the spot Euro/euro/US dollar rate on the date the dividend distribution is includible in its income, regardless of whether the payment is in fact converted into US dollars. Generally, any gain or loss resulting from currency exchange fluctuations during the period from the date a US holder includes the dividend payment in income to the date a US holder converts the payment into US dollars will be treated as ordinary income or loss and will not be eligible for the special tax rate applicable to qualified dividend income. The gain or loss generally will be income or loss from sources within the United States for foreign tax credit limitation purposes. Distributions in excess of current and accumulated earnings and profits, as determined for 270 Annual Report 2013
16 Investor Relations 16.8 - 16.8
United States federal income tax purposes, will be treated as a non-taxable return of capital to the extent of a US holder’s basis in the common shares and thereafter as capital gain. Subject to certain limitations, the Dutch tax withheld in accordance with the U.S.US Tax Treaty and paid over to the Netherlands will be creditable or deductible against a US holder’s United States federal income tax liability. Special rules apply in determining the foreign tax credit limitation with respect to dividends that are subject to the maximum 20% tax rate. To the extent a refund of the tax withheld is available under Dutch law, or under the U.S.US Tax Treaty, the amount of tax withheld that is refundable will not be eligible for credit against United States federal income tax liability. Dividends will be income from sources outside the United States, and depending on a holder’s circumstances, will generally be either “passive” or “general” income for purposes of computing the foreign tax credit allowable to the holder. Taxation of Capital Gains A US holder that sells or otherwise disposes of its common shares will recognize capital gain or loss for United States federal income tax purposes equal to the difference between the US dollar value of the amount that it realizes and its tax basis, determined in US dollars, in its common shares. Capital gain of a non-corporate US holder is generally taxed at a maximum tax rate of 20% where the holder has a holding period greater than one year2). The gain or loss will generally be income or loss from sources within the United States for foreign tax credit limitation purposes. PFIC Rules We do not believe that the common shares will be treated as stock of a passive foreign investment company, or PFIC, for United States federal income tax purposes, but this conclusion is a factual determination that is made annually and thus is subject to change. If we are treated as a PFIC, unless a US holder elects to be taxed annually on a mark-to-market basis with respect to the common shares, gain realized on the sale or other disposition of the common shares would in general not be treated as capital gain. Instead a US holder would be treated as if it had realized such gain and certain “excess distributions” ratably over the holding period for the common shares and would be taxed at the highest tax rate in effect for each such year to which the gain was allocated, in addition to which an interest charge in respect of the tax attributable to each such year would apply. Any dividends received by a US holder will not be eligible for the special tax rates applicable to qualified dividend income if we are treated as a PFIC with respect to such US holder either in the taxable year of the distribution or the preceding taxable year, but instead will be taxable at rates applicable to ordinary income and subject to the excess distribution regime described above. | 1) | In addition, a US holder that is an individual or estate, or a trust that does not fall into a special class of trusts that is exempt from such tax, is subject to a 3.8% tax on the lesser of (1) the US holder’s “net investment income” for the relevant taxable year and (2) the excess of the US holder’s modified adjusted gross income for the taxable year over a certain threshold (the “Medicare tax”). A US holder’s net investment income generally includes its dividend income. |
| 2) | In addition, the gain or loss is generally included in a US holder’s net investment income, which may be subject to a 3.8% tax as described in the discussion of the Medicare tax under the heading – “Taxation of Dividends”. |
268 Annual Report 2013 2712015
16 Investor Relations 16.9 - 16.917.8
16.917.8 New York Registry Shares
Fees and Charges Payable by a Holder of New York Registry Shares Citibank, N.A. as the US registrar, transfer agent, paying agent and shareholder servicing agent (“Agent”) under Philips’ New York Registry Share program (the “Program”), collects fees for delivery and surrender of New York Registry Shares directly from investors depositing ordinary shares or surrendering New York Registry Shares for the purpose of withdrawal or from intermediaries acting for them. The Agent collects fees for making distributions to investors by deducting those fees from the amounts distributed or by selling a portion of the distributable property to pay the fees. The charges of the Agent payable by investors are as follows: The New York Transfer Agent charges shareholders a fee of up to USD 5.00 per 100 shares for the exchange of New York Registry shares for ordinary shares and vice versa. Fees and Payments made by the Agent to Philips The Agent has agreed to reimburse certain expenses of Philips related to the Program and incurred by Philips in connection with the Program. In the year ended December 31, 20132015 the Agent reimbursed to Philips, or paid amounts on Philips behalf to third parties, a total sum of EUR 763,913.1,009,956. The table below sets forth the types of expenses that the Agent has agreed to reimburse and the amounts reimbursed in the year ended December 31, 2013:2015: Category of Expense Reimbursed to Philipsin EUR in euros
amount Reimbursedreimbursed in the year ended December 31, 20132015 | | | | | Program related expenses such as legal fees and New York Stock Exchange listing fees | | | 13,93292,635 | | A portion of the issuance and cancellation fees actually received by the Agent from holders of New York Registry Shares, net of Program-related expenses already reimbursed by the Agent to Philips. | | | 749,981917,322 | 1)1) | | | | | | TotalExpense reimbursed
| | | 763,9131,009,956 | | | | | | |
| 1) | Translated at USD/EUR exchange rate of actual date(s) of reimbursement(s) during 20132015 |
The Agent has also agreed to waive certain fees for standard costs associated with the administration of the program. The table below sets forth those expenses that the Agent paid directly to third parties in the year ended December 31, 2013.2015. Category of Expense paid directly to third parties in EUR amount in euros the year ended December 31, 2015 | | | | | amount in the year ended December 31, 2013 | | Reimbursement of Proxy Process expenses | | | 7,38510,047 | | Reimbursement of Legal Fee expenses | | | 1,076 | | NYSE Listing Fee | | | 5,44182,588 | | Fullfillment | | | 29 | | | | | | | TotalExpense paid directly to third parties
| | | 13,93292,635 | | | | | | |
Under certain circumstances, including removal of the Agent or termination of the Program by Philips, Philips is required to repay the Agent certain amounts reimbursed and/or expenses paid to or on behalf of Philips. 272 Annual Report 20132015 269
17 Definitions and abbreviations 17 - 1718
1718 Definitions and abbreviations
Base of the Pyramid
The base of the pyramid is the largest, but poorest socio-economic group. In global terms, this is the 4 billion people who live on less than USD 2.50 per day.
BMC Business Market Combination - As a diversified technology group, Philips has a wide portfolio of categories/business innovation units which are grouped in business groups based primarily on technology or customer needs. Philips has physical market presence in over 100 countries, which are grouped into 17 market clusters. Our primary operating modus is the Business Market matrix comprising Business Groups and Markets. These Business Market Combinations (BMCs) drive business performance on a granular level at which plans are agreed between global businesses and local market teams. Brominated flame retardants (BFR) Brominated flame retardants are a group of chemicals that have an inhibitory effect on the ignition of combustible organic materials. Of the commercialized chemical flame retardants, the brominated variety are most widely used. Compound annual growth rate (CAGR)
The CAGR is the average Comparable Sales calculated over a period of more than one year. Compound comparable sales exclude the effect of currency movements and acquisitions and divestments (changes in consolidation) over the total period. Philips believes that CAGR information enhances understanding of sales performance over a period longer than a year.
CO2-equivalent CO2-equivalent or carbon dioxide equivalent is a quantity that describes, for a given mixture and amount of greenhouse gas, the amount of CO2CO2 that would have the same global warming potential (GWP), when measured over a specified timescale (generally 100 years). Cash flow before financing activities The cash flow before financing activities is the sum of net cash flow from operating activities and net cash flow from investing activities. Chlorofluorocarbon (CFC) A chlorofluorocarbon is an organic compound that contains carbon, chlorine and fluorine, produced as a volatile derivative of methane and ethane. CFCs were originally developed as refrigerants during the 1930s. Circular economy A circular economy aims to decouple economic growth from the use of natural resources and ecosystems by using those resources more effectively. By definition it is a driver for innovation in the areas of material-, component- and product reuse, as well as new business models such as solutions and services. In a Circular Economy, the more effective use of materials enables to create more value, both by cost savings and by developing new markets or growing existing ones. Comparable sales Comparable sales exclude the effect of currency movements and acquisitions and divestments (changes in consolidation). Philips believes that comparable sales information enhances understanding of sales performance. Continuing net income This equals recurring net income from continuing operations, or net income excluding discontinued operations and excluding material non-recurring items. Dividend yield The dividend yield is the annual dividend payment divided by Philips’ market capitalization. All references to dividend yield are as of December 31 of the previous year. EBITA Earnings before interest, tax and amortization (EBITA) represents income from continuing operations excluding results attributable to non-controlling interest holders, results relating to investments in associates, income taxes, financial income and expenses, amortization and impairment on intangible assets (excluding software and capitalized development expenses). Philips believes that EBITA information makes the underlying performance of its businesses more transparent by factoring out the amortization of these intangible assets, which arises when acquisitions are consolidated. In our Annual Report on form 20-F this definition is referred to as Adjusted IFO. EBITA per common share EBITA divided by the weighted average number of shares outstanding (basic). The same principle is used for the definition of net income per common share, replacing EBITA.EBITA with net income. Electronic Industry Citizenship Coalition (EICC) The Electronic Industry Citizenship Coalition was established in 2004 to promote a common code of conduct for the electronics and information and communications technology (ICT) industry. EICC now includes more than 40100 global companies and their suppliers. Employee Engagement Index (EEI) The Employee Engagement Index (EEI) is the single measure of the overall level of employee engagement at Philips. It is a combination of perceptions and attitudes related to employee satisfaction, commitment and advocacy. Energy-using Products (EuP) An energy-using product is a product that uses, generates, transfers or measures energy (electricity, gas, fossil fuel). Examples areinclude boilers, computers, televisions, transformers, industrial fans and industrial furnaces etc.furnaces. Free cash flow Free cash flow is the net cash flow from operating activities minus net capital expenditures. Full-time equivalent employee (FTE) Full-time equivalent is a way to measure a worker’s involvement in a project. An FTE of 1.0 means that the person is equivalent to a full-time worker, while an FTE of 0.5 signals that the worker is onlyworks half-time. Global Reporting Initiative (GRI) The Global Reporting Initiative (GRI) is a network-based organization that pioneered the world’s most widely used sustainability reporting framework. GRI is committed to the framework’s continuous improvement and application worldwide. GRI’s core goals include the mainstreaming of disclosure on environmental, social and governance performance. Green Innovation Green Innovation comprise all R&D activities directly contributing to the development of Green Products or Green Technologies. Annual Report 2013 273
17 Definitions and abbreviations 17 - 17
Green Products Green Products offer a significant environmental improvement in one or more Green Focal Areas: Energy efficiency, Packaging, Hazardous substances, Weight, Recycling and disposal and Lifetime reliability. The life cycle approach is used to determine a product’s overall environmental improvement. It calculates the environmental impact of a product over its total life cycle (raw materials, manufacturing, product use and disposal). Green Products need to prove leadership in at least one Green Focal Area compared to industry standards, which is defined by a sector specific peer group. This is done either by outperforming reference products (which can be a competitor or predecessor product in the particular product family) by at least 10%, outperforming product specific eco-requirements or by being awarded with a recognized eco-performance label. Because of different product portfolios, sectors have specified additional criteria for Green Products, including product specific minimum requirements where relevant. Growth geographies Growth geographies are the developing geographies comprising of Asia Pacific (excluding Japan, South Korea, Australia and New Zealand), Latin America, Central & Eastern Europe, the Middle East (excluding Israel) and Africa. Hydrochlorofluorocarbon (HCFC) Hydrochlorofluorocarbon is a fluorocarbon that is replacing chlorofluorocarbon as a refrigerant and propellant in aerosol cans. Income as % of shareholders’ equity (ROE) This ratio measures income from continuing operations as a percentage of average shareholders’ equity. ROE rates Philips’ overall profitability by evaluating how much profit the company generates with the money shareholders have invested.
Income from continuing operations
Net income from continuing operations, or net income excluding discontinued operations. Initiatief Duurzame Handel (IDH) IDH is the Dutch Sustainable Trade Initiative. It brings together government, frontrunner companies, civil society organizations and labor unions to accelerate and up-scale sustainable trade in mainstream commodity markets from the emerging countries to Western Europe. International Standardization Organization (ISO) The International Standardization Organization (ISO)is the world’s largest developer and publisher of International Standards. ISO is a network of the national standards institutes of more than 160 countries, one member per country, with a Central Secretariat in Geneva, Switzerland, that coordinates the system. ISO is a non-governmental organization that forms a bridge between the public and private sectors. 270 Annual Report 2015
Definitions and abbreviations 18 Light-Emitting Diode (LED) Light-Emitting Diode (LED), in electronics, is a semiconductor device that emits infrared or visible light when charged with an electric current. Visible LEDs are used in many electronic devices as indicator lamps, in automobiles as rear-window and brake lights, and on billboards and signs as alphanumeric displays or even full-color posters. Infrared LEDs are employed in autofocus cameras and television remote controls and also as light sources in fiber-optic telecommunication systems. Lives improved by Philips To calculate how many lives we are improving, market intelligence and statistical data on the number of people touched by the products contributing to the social or ecological dimension over the lifetime of a product are multiplied by the number of those products delivered in a year. After elimination of double counts – multiple different product touches per individual are only counted once – the number of lives improved by our innovative solutions is calculated. In 2012 weWe established our 2012 baseline at 1.71.6 billion a year. Mature geographies Mature geographies are the highly developed markets comprising of Western Europe, North America, Japan, South Korea, Israel, Australia and New Zealand. Millennium Development Goals (MDG)
Adopted by world leaders in the year 2000 and set to be achieved by 2015, the Millennium Development Goals (MDGs) provide concrete, numerical benchmarks for tackling extreme poverty in its many dimensions. The MDGs also provide a framework for the entire international community to work together towards a common end – making sure that human development reaches everyone, everywhere. Goals include for example eradicating extreme poverty and hunger, achieving universal primary education and ensuring environmental sustainability.
Net debt : group equity ratio The %percentage distribution of net debt over group equity plus net debt. Non-Governmental Organization (NGO) A non-governmental organization (NGO) is any non-profit, voluntary citizens’ group which is organized at a local, national or international level. OEM Original Equipment Manufacturer. Operational carbon footprint A carbon footprint is the total set of greenhouse gas emissions caused by an organization, event, product or person; usually expressed in kilotonnes CO2-equivalent. The Philips operational carbon footprint is calculated on a half-year basis and includes industrial sites (manufacturing and assembly sites), non-industrial sites (offices, warehouses, IT centers and R&D facilities), business travel (lease and rental cars and airplane travel) and logistics (air, sea and road transport). Perfluorinated compounds (PFC) A perfluorinated compound (PFC) is an organofluorine compound with all hydrogens replaced by fluorine on a carbon chain—but the molecule also contains at least one different atom or functional group. PFCs have unique properties to make materials stain, oil, and water resistant, and are widely used in diverse applications. PFCs persist in the environment as persistent organic pollutants, but unlike PCBs,Printed Circuit Board (PCB), they are not known to degrade by any natural processes due to the strength of the carbon–fluorine bond. Polyvinyl chloride (PVC) Polyvinyl chloride, better known as PVC or vinyl, is an inexpensive plastic so versatile it has become completely pervasive in modern society. The list of products made from polyvinyl chloride is exhaustive, ranging from phonograph records to drainage and potable piping, water bottles, cling film, credit cards and toys. More uses include window frames, rain gutters, wall paneling, doors, wallpapers, flooring, garden furniture, binders and even pens. Productivity Philips uses Productivity internally and as mentioned in this annual reportAnnual Report as a non-financial indicator of efficiency that relates the added value, being income from operations adjusted for certain items such as restructuring and acquisition-related charges etc. plus salaries and wages (including pension costs and other social security and similar charges), depreciation of property, plant and equipment, and amortization of intangibles, to the average number of employees over the past 12 months. Regulation on Hazardous Substances (RoHS) The RoHS Directive prohibits all new electrical and electronic equipment placed on the market in the European Economic Area from containing lead, mercury, cadmium, hexavalent chromium, poly-brominated biphenyls (PBB) or polybrominated diphenyl ethers (PBDE), except in certain specific applications, in concentrations greater than the values decided by the European Commission. These values have been established as 0.01% by weight per homogeneous material for cadmium and 0.1% for the other five substances. Return on equity (ROE) IncomeThis ratio measures income from continuing operations as a %percentage of average shareholders’ equity (calculated onequity. ROE rates Philips’ overall profitability by evaluating how much profit the quarterly balance sheet positions).
274 Annual Report 2013
17 Definitions and abbreviations 17 - 17
company generates with the money shareholders have invested. Return on invested capital (ROIC) Return on Invested Capital consists of income from continuing operations excluding results attributable to non-controlling interest holders, results relating to investments in associates and financial income and expenses, divided by the average net operating capital at year end and the preceding four quarter ends. Philips believes that ROIC information makes the underlying performance of its businesses more transparent as it relates returns to the operating capital in use. SF6 SF6 (Sulfur hexafluoride) is used in the electrical industry as a gaseous dielectric medium. Turnover rate of net operating capital Sales divided by average net operating capital (calculated on the quarterly balance sheet positions). Voluntary turnover Voluntary turnover covers all employees who resigned of their own volition. Waste Electrical and Electronic Equipment (WEEE) The Waste Electrical and Electronic Equipment Directive (WEEE Directive) is the European Community directive on waste electrical and electronic equipment which became European Law in February 2003, setting collection, recycling and recovery targets for all types of electrical goods. The directive imposes the responsibility for the disposal of waste electrical and electronic equipment on the manufacturers of such equipment. Weighted Average Statutory Tax Rate (WASTR) The reconciliation of the effective tax rate is based on the applicable statutory tax rate, which is a weighted average of all applicable jurisdictions. This weighted average statutory tax rate (WASTR) is the aggregation of the result before tax multiplied by the applicable statutory tax rate without adjustment for losses, divided by the group result before tax. Annual Report 2013 2752015 271
18 Exhibits 18 - 18.119
18 19Exhibits
18.119.1 Index of exhibits
| | | | | | Exhibit 1 | | English translation of the Articles of Association of the Company (incorporated by reference to Exhibit 1 of the Company’s Annual Report on Form 20-F for the fiscal year ended December 31, 2008, File No. 001-05146-01).Company. | | | | Exhibit 2 (b) (1) | | Indenture between Koninklijke Philips N.V. and Deutsche Bank Trust Company Americas, Trustee, dated as of March 11, 2008, as supplemented by the First Supplemental Indenture (Incorporated by reference to Exhibits 4.1 and 4.2 of Registration Statement on Form F-3 No. 333-179889). The total amount of long-term debt securities of the Company and its subsidiaries authorized under any one other instrument does not exceed 10% of the total assets of Philips and its subsidiaries on a consolidated basis. Philips agrees to furnish copies of any or all such instruments to the Securities and Exchange Commission upon request. | | | | Exhibit 4 | | EmploymentServices contracts of the members of the Board of Management (incorporated by reference to Exhibit 4 of the Company’s Annual Report on Form 20-F for the fiscal year ended December 31, 2011, File No. 001-05146-01).Management. | | | | Exhibit 4 (a) | | EmploymentServices contract between the Company and F.A. van Houten (incorporated by reference to Exhibit 4 (a) of the Company’s Annual Report on Form 20-F for the fiscal year ended December 31, 2011, File No. 001-05146-01).Houten. | | | | Exhibit 4 (b) | | EmploymentServices contract between the Company and R.H. Wirahadiraksa (incorporated by reference to Exhibit 4 (b) of the Company’s Annual Report on Form 20-F for the fiscal year ended December 31, 2011, File No. 001-05146-01).A. Bhattacharya. | | | | Exhibit 4 (c) | | EmploymentServices contract between the Company and P.A.J.Nota (incorporated by referenceP.A.J. Nota. | | | | Exhibit 7 | | Ratio of earnings to Exhibit 4 (d) of the Company’s Annual Report on Form 20-F for the fiscal year ended December 31, 2011, File No. 001-05146-01)fixed charges | | | | Exhibit 8 | | List of Subsidiaries. | | | | Exhibit 12 (a) | | Certification of F.A. van Houten filed pursuant to 17 CFR 240. 13a-14(a). | | | | Exhibit 12 (b) | | Certification of R.H. WirahadiraksaA. Bhattacharya filed pursuant to 17 CFR 240. 13a-14(a). | | | | Exhibit 13 (a) | | Certification of F.A. van Houten furnished pursuant to 17 CFR 240. 13a-14(b). | | | | Exhibit 13 (b) | | Certification of R.H. WirahadiraksaA. Bhattacharya furnished pursuant to 17 CFR 240. 13a-14(b). | | | | Exhibit 15 (a) | | Consent of independent registered public accounting firm. | | | | Exhibit 15 (b) | | Letter of KPMG relating to disclosure under Item 16F | | | | Exhibit 15 (c) | | Description of industry terms. | |
276272 Annual Report 20132015
18 Exhibits 18.1 - 18.219.2
18.219.2 Signatures
The registrant hereby certifies that it meets all of the requirements for filing on Form 20-F and that it has duly caused and authorized the undersigned to sign this annual reportAnnual Report on its behalf. Annual Report 2013 277
18 Exhibits 18.2 - 18.2
KONINKLIJKE PHILIPS N.V. (Registrant) | | | | /s/ F.A. van Houten | | /s/ R.H. WirahadiraksaA. Bhattacharya | | F.A. van Houten | | R.H. WirahadiraksaA. Bhattacharya | | (CEO, Chairman of the Board of Management and the Executive Committee) | | (Executive Vice-President, Chief Financial Officer, member of the Board of Management and the Executive Committee) |
Date: February 25, 201423, 2016 278 Annual Report 20132015 273
18 Exhibits 18.2 - 18.319.3
18.319.3 Exhibits
| | | | | | Exhibit 1 | | English translation of the Articles of Association of the Company (incorporated by reference to Exhibit 1 of the Company’s Annual Report on Form 20-F for the fiscal year ended December 31, 2008, File No. 001-05146-01).Company. | | | | Exhibit 2 (b) (1) | | Indenture between Koninklijke Philips N.V. and Deutsche Bank Trust Company Americas, Trustee, dated as of March 11, 2008, as supplemented by the First Supplemental Indenture (Incorporated by reference to Exhibits 4.1 and 4.2 of Registration Statement on Form F-3 No. 333-179889). The total amount of long-term debt securities of the Company and its subsidiaries authorized under any one other instrument does not exceed 10% of the total assets of Philips and its subsidiaries on a consolidated basis. Philips agrees to furnish copies of any or all such instruments to the Securities and Exchange Commission upon request. | | | | Exhibit 4 | | EmploymentServices contracts of the members of the Board of Management (incorporated by reference to Exhibit 4 of the Company’s Annual Report on Form 20-F for the fiscal year ended December 31, 2011, File No. 001-05146-01).Management. | | | | Exhibit 4 (a) | | EmploymentServices contract between the Company and F.A. van Houten. (incorporated by reference to Exhibit 4 (a) of the Company’s Annual Report on Form 20-F for the fiscal year ended December 31, 2011, File No. 001-05146-01). | | | | Exhibit 4 (b) | | EmploymentServices contract between the Company and R.H. Wirahadiraksa. (incorporated by reference to Exhibit 4 (b) of the Company’s Annual Report on Form 20-F for the fiscal year ended December 31, 2011, File No. 001-05146-01).A. Bhattacharya. | | | | Exhibit 4 (c) | | EmploymentServices contract between the Company and P.A.J.Nota (incorporated by referenceP.A.J. Nota. | | | | Exhibit 7 | | Ratio of earnings to Exhibit 4 (d) of the Company’s Annual Report on Form 20-F for the fiscal year ended December 31, 2011, File No. 001-05146-01)fixed charges | | | | Exhibit 8 | | List of Subsidiaries. | | | | Exhibit 12 (a) | | Certification of F.A. van Houten filed pursuant to 17 CFR 240. 13a-14(a). | | | | Exhibit 12 (b) | | Certification of R.H. WirahadiraksaA. Bhattacharya filed pursuant to 17 CFR 240. 13a-14(a). | | | | Exhibit 13 (a) | | Certification of F.A. van Houten furnished pursuant to 17 CFR 240. 13a-14(b). | | | | Exhibit 13 (b) | | Certification of R.H. WirahadiraksaA. Bhattacharya furnished pursuant to 17 CFR 240. 13a-14(b). | | | | Exhibit 15 (a) | | Consent of independent registered public accounting firm. | | | | Exhibit 15 (b) | | Letter of KPMG relating to disclosure under Item 16F | | | | Exhibit 15 (c) | | Description of industry terms. | |
274 Annual Report 2013 2792015

|