As filed with the Securities and Exchange Commission on February 25, 201421, 2017
UNITED STATES
SECURITIES AND EXCHANGE COMMISSION
WASHINGTON, D.C. 20549
Form20-F
(Mark one)
| | REGISTRATION STATEMENT PURSUANT TO SECTION 12(b) OR (g) OF THE SECURITIES EXCHANGE ACT OF 1934 |
OR
| | ANNUAL REPORT PURSUANT TO SECTION 13 OR 15(d) OF THE SECURITIES EXCHANGE ACT OF 1934 |
For the fiscal year ended December 31, 20132016
OR
| | TRANSITION REPORT PURSUANT TO SECTION 13 OR 15(d) OF THE SECURITIES EXCHANGE ACT OF 1934 |
OR
| | SHELL COMPANY REPORT PURSUANT TO SECTION 13 OR 15(d) OF THE SECURITIES EXCHANGE ACT OF 1934 |
Commission file number001-05146-01
KONINKLIJKE PHILIPS N.V.
(Exact name of Registrant as specified in charter)
ROYAL PHILIPS
(Translation of Registrant’s name into English)
The Netherlands
(Jurisdiction of incorporation or organization)
BreitnerPhilips Center, Amstelplein 2, 1096 BC Amsterdam, The Netherlands
(Address of principal executive office)
Eric Coutinho,Marnix van Ginneken, Chief Legal Officer & Secretary to the Board of Management
+31 20 59 77232, eric.coutinho@philips.com, Breitnermarnix.van.ginneken@philips.com, Philips Center, Amstelplein 2, 1096 BC Amsterdam, The Netherlands
(Name, Telephone,E-mail and/or Facsimile number and Address of Company Contact Person)
Securities registered or to be registered pursuant to Section 12(b) of the Act:
| Title of each class | Name of each exchange on which registered | |||
| Common Shares – par value | New York Stock Exchange | |||
| Euro (EUR) 0.20 per share | ||||
Securities registered or to be registered pursuant to Section 12(g) of the Act:
None
Securities for which there is a reporting obligation pursuant to Section 15(d) of the Act:
None
(Title of class)
Indicate the number of outstanding shares of each of the issuer’s classes of capital or common stock as of the close of the period covered by the annual report:
| Class | Outstanding at December 31, | |
| Koninklijke Philips N.V. | ||
| Common Shares par value EUR 0.20 per share |
|
Indicate by check mark if the registrant is a well-known seasoned issuer, as defined in Rule 405 of the Securities Act. x☒ Yes ¨No ☐
If this report is an annual or transition report, indicate by check mark if the registrant is not required to file reports pursuant to section 13 or 15(d) of the Securities Exchange Act of 1934. ¨☐ Yes x☒ No
Note-Checking the box above will not relieve any registrant required to file reports pursuant to Section 13 or 15(d) of the Securities Exchange Act of 1934 from their obligations under those Sections.
Indicate by check mark whether the registrant (1) has filed all reports required to be filed by Section 13 or 15(d) of the Securities Exchange Act of 1934 during the preceding 12 months (or for such shorter period that the registrant was required to file such reports), and (2) has been subject to such filing requirements for the past 90 days. x☒ Yes ¨☐ No
Indicate by check mark whether the registrant has submitted electronically and posted on its corporate Web site, if any, every Interactive Data File required to be submitted and posted pursuant to Rule 405 of RegulationS-T (§232.405 of this chapter) during the preceding 12 months (or for such shorter period that the registrant was required to submit and post such files). ¨☐ Yes ¨☐ No
Indicate by check mark whether the registrant is a large accelerated filer, an accelerated filer, or anon-accelerated filer. See definition of “accelerated filer and large accelerated filer” in Rule12b-2 of the Exchange Act. (Check one):
Large accelerated filer x☒ Accelerated filer ☐ ¨Non-accelerated Non-accelerated filer ¨☐
Indicate by check mark which basis of accounting the registrant has used to prepare the financial statements included in this filing:
U.S. GAAP | International Financial Reporting Standards as issued by by the International Accounting Standards Board | Other |
If “Other” has been checked in response to the previous question, indicate by check mark which financial statement item the registrant has elected to follow. ¨☐ Item 17 ¨☐ Item 18
If this is an annual report, indicate by check mark whether the registrant is a shell company (as defined in Rule12b-2 of the Exchange Act). ¨☐ Yes x☒ No
IFRS basis of presentation
The financial information included in this document is based on IFRS, as explained innote 1, Significant accounting policies, of this report, unless otherwise indicated.
Dutch Financial Markets Supervision Act
This document comprises regulated information within the meaning of the Dutch Financial Markets Supervision Act(Wet op het financieel toezicht).
Statutory financial statements and management report
The chapters Group financial statements and Company financial statements contain the statutory financial statements of the Company. The introduction to the chapter Group financial statements sets out which parts of this Annual Report form the Management report within the meaning of Section 2:391 of the Dutch Civil Code (and related Decrees).
Significant developments
In September 2014, Philips announced its plan to sharpen its strategic focus by establishing two stand-alone companies focused on the HealthTech and Lighting opportunities respectively. To this end, a stand-alone structure was established for Philips Lighting within the Philips Group, effective February 1, 2016. Then, on May 27, 2016, Philips Lighting was listed and started trading on Euronext in Amsterdam under the symbol ‘LIGHT’. Following the listing of Philips Lighting, Philips retained a 71.225% stake and continued to consolidate Philips Lighting through 2016. On February 8, 2017, Philips announced that it had successfully completed an accelerated bookbuild offering to institutional investors and to Philips Lighting of 26.0 million shares in Philips Lighting, reducing Philips’ stake in Philips Lighting’s issued and outstanding share capital from 71.225% to approximately 55.180%. The transaction is in line with Philips’ stated objective to fully sell down its stake in Philips Lighting over the next several years.
Philips has signed an agreement to sell an 80.1% interest in the combined Lumileds and Automotive businesses to certain funds managed by affiliates of Apollo Global Management, LLC. Philips will retain the remaining 19.9% interest. The transaction is expected to be completed in the first half of 2017, subject to customary closing conditions, including the relevant regulatory approvals.
| The integration of Volcano, aUS-based global leader in catheter-based imaging and measurement solutions for cardiovascular applications, into our Image-Guided Therapy business group has been successful, helping to drive synergies and improved performance. |
2 Annual Report 20132016
| ||||||||
| ||||||||
|
| |||||||
| ||||||||
| ||||||||
| ||||||||
| ||||||||
| ||||||||
| ||||||||
| ||||||||
| ||||||||
| ||||||||
| ||||||||
| ||||||||
| ||||||||
|
| |||||||
| ||||||||
| ||||||||
| ||||||||
| ||||||||
| ||||||||
| ||||||||
| ||||||||
| ||||||||
| ||||||||
| ||||||||
| ||||||||
| ||||||||
| ||||||||
| ||||||||
| ||||||||
| ||||||||
| ||||||||
| ||||||||
| ||||||||
|
| |||||||
| ||||||||
| ||||||||
| ||||||||
| ||||||||
| ||||||||
| ||||||||
| ||||||||
| ||||||||
| ||||||||
| ||||||||
| ||||||||
| ||||||||
| ||||||||
| ||||||||
| ||||||||
| ||||||||
| ||||||||
| ||||||||
| ||||||||
| ||||||||
| ||||||||
| ||||||||
| ||||||||
|
| |||||||
| ||||||||
| ||||||||
| ||||||||
| ||||||||
| ||||||||
| ||||||||
| ||||||||
| ||||||||
| ||||||||
| ||||||||
| ||||||||
| ||||||||
| ||||||||
| ||||||||
| ||||||||
| ||||||||
| ||||||||
| ||||||||
| ||||||||
|
| |||||||
|
| |||||||
|
| |||||||
|
| |||||||
|
| |||||||
|
| |||||||
Annual Report 20132016 3
| 18.9 | Exhibit 15 (a) | 292 | ||||
| 18.10 | Exhibit 15 (b) | 293 |
4 Annual Report 2013
Introduction
This document contains information required for the annual reportAnnual Report on Form20-F for the year ended December 31, 20132016 of Koninklijke Philips N.V. (the 20132016 Form20-F). Reference is made to the Form20-F cross reference table herein. Only (i) the information in this document that is referenced in the Form20-F cross reference table, (ii) this introduction and the cautionary statement “forward-looking statements” and explanation on “use of non-GAAP information” on the next threetwo pages and (iii) the Exhibits shall be deemed to be filed with the Securities and Exchange Commission for any purpose. Any additional information in this document which is not referenced in the Form20-F cross reference table, or the Exhibits themselves, shall not be deemed to be so incorporated by reference, shall not be part of the 20132016 Form20-F and is furnished to the Securities and Exchange Commission for information only.
The terms “Philips”, the “Company”, “Group”, “we”, “our” and “us” refer to Koninklijke (Royal) Philips N.V. and as applicable to its subsidiaries and and/or its interest in joint ventures and associates.
IFRS based information
The audited consolidated financial statements as of December 31, 20132016 and 2012,2015, and for each of the years in thethree-year period ended December 31, 2013,2016, included in the 20132016 Form20-F have been prepared in accordance with International Financial Reporting Standards (IFRS) as endorsed by the European Union (EU). All standards and interpretations issued by the International Accounting Standards Board (IASB) and the IFRS Interpretations Committee effectiveyear-end 2013 2016 have been endorsed by the EU, except that the EU did not adopt certain paragraphs of IAS 39 applicable to certain hedge transactions. Philips has no hedge transactions to which these paragraphs are applicable. Consequently, the accounting policies applied by Philips also comply fully with IFRS as issued by the IASB.
Non-GAAPUse ofnon-GAAP information
In presenting and discussing the Philips Group’sGroup financial position, operating results and cash flows, management uses certainnon-GAAP financial measures such as: comparable growth; adjusted income from operations; net operating capital; net debt; cash flow before financing activities; net capital expenditures and free cash flow.measures. Thesenon-GAAP financial measures should not be viewed in isolation as alternatives to the equivalent IFRS measure and should be used in conjunction with the most directly comparable IFRS measure(s).measures.Non-GAAP financial measures do not have standardized meaning under IFRS and therefore may not be comparable to similar measures presented by other issuers. A reconciliation of thesenon-GAAP measures to the most directly comparable IFRS measures is contained in this document. Reference is made to the section titled “Useinchapter 4, Reconciliation ofnon-GAAP information” for further information. information, of this report.
Third-party market share data
Statements regarding market share, contained in this document, including those regarding Philips’ competitive position, are based on outside sources such as specialized research institutes, industry and dealer panels in combination with management estimates. Where full year information regarding 20132016 is not yet available to Philips, market share statements may also be based on estimates and projections prepared by outside sources or management. Rankings are based on sales unless otherwise stated.
Fair value informationUse of fair-value measurement
In presenting the Philips Group’sGroup financial position, fair values are used for the measurement of various items in accordance with the applicable accounting standards. These fair values are based on market prices, where available, and are obtained from sources that are deemed to be reliable. Readers are cautioned that these values are subject to changes over time and are only valid at the balance sheet date. When quoted prices or observable market values doare not exist,readily available, fair values are estimated using valuation models, which we believe are appropriate for their purpose. Theyand unobservable inputs. Such fair value estimates require management to make significant assumptions with respect to future developments which are inherently uncertain and may therefore deviate from actual developments. Critical assumptions used are disclosed in the financial statements. In certain cases, independent
Independent valuations aremay have been obtained to support management’s determination of fair values.
Documents on display
It is possible to read and copy documents referred to in the 20132016 Form20-F that have been filed with the SEC at the SEC’s public reference room located at 100 F Street, N.E., Room 1580, Washington, D.C. 20549.
Please call the SEC at1-800-SEC-0330 for further information on the public reference rooms and their copy charges. Philips SEC filings are also publicly available through the SEC’s website atwww.sec.gov.www.sec.gov.
Annual Report 2013 5
Introduction
For definitions and abbreviations reference is made tochapter 17,15, Definitions and abbreviations, of this report.
4 Annual Report 2016
Introduction
Pursuant to provisions of the United States Private Securities Litigation Reform Act of 1995, Philips is providing the following cautionary statement.
This document, including the information referred to in the Form20-F cross reference table, contains certain forward lookingforward-looking statements with respect to the financial condition, results of operations and business of Philips and certain of the plans and objectives of Philips with respect to these items, in particular, among other statements, certain statements in Item 4 “Information on the Company” with regard to management objectives, market trends, market standing, product volumes, business risks, the implementation of our Accelerate! program, the statements in Item 8 “Financial Information” relating to legal proceedings, the statements in Item 5 “Operating and financial review and prospects” with regardregards to trends in results of operations, margins overall market trends, risk management, exchange rates, the statements in Item 8 “Financial Information” relating to legal proceedings and goodwill and statements in Item 11 “Quantitative and qualitative disclosuresdisclosure about market risks” relating to risk caused by derivative positions, interest rate fluctuations and other financial exposure are forward-lookingforward- looking in nature. Forward-looking statements can be identified generally as those containing words such as “anticipates”, “assumes”, “believes”, “estimates”, “expects”, “should”, “will”, “will likely result”, “forecast”, “outlook”, “projects”, “may” or similar expressions. By their nature, forward-lookingthese statements involve risk and uncertainty because they relate to future events that depend onand circumstances that will occur in the future. Thereand there are a number ofmany factors that could cause actual results and developments to differ materially from those expressed or implied by these forward-looking statements.
These factors include, but are not limited to, domestic and global economic and business conditions, developments within the euro zone, the successful implementation of our strategy and our ability to realize the benefits of this strategy, our ability to develop and market new products, changes in legislation, legal claims, intellectual property, disputes, data protection challenges, changes in exchange and interest rates, changes in tax rates, pension costs and actuarial assumptions, raw materials and employee costs, our ability to identify and complete successful acquisitions and to integrate those acquisitions into our business,
6 Annual Report 2013
Introduction
our ability to successfully exit certain businesses or restructure our operations, the rate of technological changes, political, economic and other developments in countries where Philips operates, industry consolidation and competition.competition and the state of international capital markets as they may affect the timing and nature of the disposition by Philips of its interests in Philips Lighting and the Lumileds and Automotive business.
As a result, Philips’ actual future results may differ materially from the plans, goals and expectations set forth in such forward-looking statements. For a discussion of factors that could cause future results to differ from such forward-looking statements, reference is made to the information in Item 3D “Risk Factors”.
Koninklijke Philips N.V. (the ‘Company’) believes that an understanding of sales performance is enhanced when the effects of currency movements and acquisitions and divestments (changes in consolidation) are excluded. Accordingly, in addition to presenting ‘nominal growth’, ‘comparable growth’ is provided.
Comparable sales exclude the effects of currency movements and changes in consolidation. As indicated in the note 1, Significant accounting policies, sales and income are translated from foreign currencies into the Company’s reporting currency, the euro, at the exchange rate on transaction dates during the respective years. As a result of significant currency movements during the years presented, the effects of translating foreign currency sales amounts into euros could have a material impact on our sales figures. Therefore, these impacts have been excluded in arriving at the comparable sales in euros. Currency effects have been calculated by translating previous years’ foreign currency sales amounts into euros at the following year’s exchange rates in comparison with the sales in euros as historically reported. The years under review were characterized by a number of acquisitions and divestments, as a result of which activities were consolidated or deconsolidated. The effect of consolidation changes has also been excluded in arriving at the comparable sales. For the purpose of calculating comparable sales growth, when a previously consolidated entity is sold or contributed to a venture that is not consolidated by the Company, relevant sales are excluded from impacted prior-year periods. Similarly, when an entity is acquired, relevant sales are excluded from impacted periods.
Philips discusses “adjusted income from operations” in the 2013 Form 20-F. Adjusted income from operations represents income from operations before amortization and impairment of intangible assets generated in acquisitions (excluding software and capitalized development expenses).
Annual Report 2013 72016 5
IntroductionForm20-F
The Company uses the term “adjusted income from operations” to evaluate the performance of the Philips Group and its sectors. Referencing “adjusted income from operations” is considered appropriate in light of the following:
Philips has announced that one of its strategic drivers is to increase profitability through re-allocation of its resources towards opportunities offering more consistent and higher returns. Moreover, Philips intends to redeploy capital through value-creating acquisitions. Since 2006, management has used the “adjusted income from operations” measurement internally to monitor performance of the businesses on a comparable basis. As of 2007, Philips has also set external performance targets based on this measurement as it will not be distorted by the unpredictable effects of future, unidentified acquisitions.
Non US investors are advised that such presentation is different from the terms used in Philips’ results announcements and 2013 Annual Report. Philips believes that an understanding of the Group’s financial condition is enhanced by the disclosure of net operating capital (NOC), as this figure is used by Philips’ management to evaluate the capital efficiency of the Philips Group and its operating sectors. NOC is defined as: total assets excluding assets from discontinued operationsless: (a) cash and cash equivalents, (b) deferred tax assets, (c) other (non)-current financial assets, (d) investments in associates, and after deduction of: (e) provisions, (f) accounts and notes payable, (g) accrued liabilities, (h) current/noncurrent liabilities.
Net debt is defined as the sum of long- and short-term debt minus cash and cash equivalents. The net debt position as a percentage of the sum of group equity (shareholders’ equity and non-controlling interests) and net debt is presented to express the financial strength of the Company. This measure is widely used by management and investment analysts and is therefore included in the disclosure.
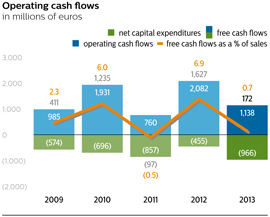
Cash flows before financing activities, being the sum total of net cash from operating activities and net cash from investing activities, and free cash flow, being net cash from operating activities minus net capital expenditures, are presented separately to facilitate the reader’s understanding of the Company’s funding requirements.
Net capital expenditures comprise of purchase of intangible assets, expenditures on development assets, capital expenditures on property, plant and equipment and proceeds from disposals of property, plant and equipment. This measure is widely used by management to calculate free cash flow.
8 Annual Report 2013
Form 20-F cross reference table
Form20-F cross reference table
Only (i) the information in this document that is referenced in the Form20-F cross reference table, (ii) the Introduction and the cautionary statements concerning Forward-lookingforward-looking statements and explanation on use of non-GAAP information, of this report on pages 5-8,4-5, and (iii) the Exhibits shall be deemed to be filed with the Securities and Exchange Commission for any purpose. The content of Philips’ websites and other websites referenced herein should not be considered to be a part of or incorporated into the 20132016 Form20-F. Any additional information which is not referenced in the Form20-F cross reference table or the Exhibits themselves shall not be deemed to be so incorporated by reference, shall not be part of the 20132016 Form20-F and is furnished to the Securities and Exchange Commission for information only.
The table below sets out the location in this document of the information required by SEC Form20-F. The exact location is included in the column ‘Location in this document’. The column ‘Page’ includes the starting page of the section/paragraph for reference only.
6 Annual Report 2013 92016
Form 20-F cross reference table
| Item | Form 20-F caption | Location in this document | Page | |||||
| Part 1 | ||||||||
1 | Identity of directors, senior management and advisors | Not applicable | ||||||
2 | Offer statistics and expected timetable | Not applicable | ||||||
3 | Key information | |||||||
| A Selected financial data | ||||||||
| B Capitalization and indebtedness | Not applicable | |||||||
| C Reason for the offer and use of proceeds | Not applicable | |||||||
| D Risk factors | ||||||||
4 | Information on the Company | |||||||
| A History and development of the company | ||||||||
| 2.1.6. Restructuring and impairment charges | 25 | |||||||
| 9.5. Investor Relations - Corporate seat and head office | 109 | |||||||
| Note | ||||||||
| Note | ||||||||
| Note | ||||||||
| B Business Overview | Introduction - Third-party market share data | |||||||
2.1.24. Procurement | ||||||||
3. Segment performance - Our structure in 2016 | ||||||||
3.1.1. About Personal Health businesses | ||||||||
3.1.3. 2016 financial performance | ||||||||
3.2.1. About Diagnosis & Treatment businesses | ||||||||
3.2.3. 2016 financial performance | ||||||||
10 Annual Report 2013
Form 20-F cross reference table
3.3.1. About Connected Care & Health Informatics businesses | ||||||||
3.3.3. 2016 financial performance | ||||||||
3.4.1. About HealthTech Other | ||||||||
3.4.3. 2016 financial performance | ||||||||
3.5.2. About Lighting | ||||||||
3.5.4. 2016 financial performance | ||||||||
3.6. Legacy Items | ||||||||
3.6.1. 2016 financial performance | ||||||||
5.1. Our approach to risk management | ||||||||
5.3. Strategic risks - | ||||||||
5.4. Operational risks -Fourth & fifth paragraph | ||||||||
5.5. Compliance risks | ||||||||
9. Corporate governance - Corporate governance of the Philips Group - | ||||||||
Introduction | ||||||||
Note | ||||||||
12.3.8. Supplier indicators - Responsible Sourcing of Minerals | ||||||||
Annual Report 2013 112016 7
Form 20-F cross reference table
| Item | Form 20-F caption | Location in this document | Page | |||
| C Organizational structure | 3. Segment performance - Our structure in 2016 | 49 | ||||
| 141 | ||||||
Note 5 Interests in entities | 145 | |||||
16.6. Exhibit 8 | 271 | |||||
| D Property, plant and equipment | Note 2 Information by segment and main country | 141 | ||||
Note 10 Property, plant and equipment | 154 | |||||
Note 19 Provisions - Environmental provisions | 164 | |||||
Note 24 Contractual obligations | 173 | |||||
Note 25 Contingent assets and liabilities - Contingent liabilities - Environmental remediation | 174 | |||||
4A | Unresolved staff comments | Not applicable | ||||
5 | Operating and financial review and prospects | |||||
| A Operating results | 4. Reconciliation ofnon-GAAP information | 69 | ||||
2.1. Financial performance - Management summary | 16 | |||||
2.1. Financial performance - from 2.1.1 to 2.1.14 | 16 | |||||
2.5. Critical accounting policies | 47 | |||||
3.1.1. About Personal Health businesses | 51 | |||||
3.1.3. 2016 financial performance | 52 | |||||
3.2.1. About Diagnosis & Treatment businesses | 54 | |||||
3.2.3. 2016 financial performance | 56 | |||||
3.3.1. About Connected Care & Health Informatics businesses | 58 | |||||
3.3.3. 2016 financial performance | 60 | |||||
3.4.1. About HealthTech Other | 62 | |||||
3.4.3. 2016 financial performance | 64 | |||||
3.5.2. About Lighting | 65 | |||||
3.5.4. 2016 financial performance | 66 | |||||
3.6. Legacy Items | 68 | |||||
3.6.1. 2016 financial performance | 68 | |||||
5.3. Strategic risks | 77 | |||||
5.4. Operational risks | 79 | |||||
5.5. Compliance risks | 81 | |||||
5.6. Financial risks | 82 | |||||
Note 3 Discontinued operations and other assets classified as held for sale | 143 | |||||
Note 4 Acquisitions and divestments | 144 | |||||
Note 6 Income from operations | 147 | |||||
Note 7 Financial income and expenses | 149 | |||||
Note 11 Goodwill | 155 | |||||
Note 12 Intangible assets excluding goodwill | 157 | |||||
Note 30 Details of treasury / other financial risks | 187 | |||||
| B Liquidity and capital resources | 2.1. Financial performance | 16 | ||||
Note 17 Equity | 159 | |||||
Note 18 Debt | 162 | |||||
Note 23 Cash flow statement supplementary information | 173 | |||||
Note 24 Contractual obligations | 173 | |||||
Note 30 Details of treasury / other financial risks | 187 | |||||
| C Research and development, patents and licenses, etc. | 2.1.4. Research and development | 23 | ||||
3.4.1. About HealthTech Other | 62 | |||||
| D Trend information | 2.1. Financial performance | 16 | ||||
2.1.24. Procurement | 34 | |||||
5.3. Strategic risks- First & second paragraph | 77 | |||||
8 Annual Report 2016
Form 20-F cross reference table
| Item | Form 20-F caption | Location in this document | Page | |||
| EOff-balance sheet arrangements | 2.1.23. Cash obligations | 33 | ||||
Note 24 Contractual obligations | 173 | |||||
Note 25 Contingent assets and liabilities | 174 | |||||
Note 30 Details of treasury / other financial risks | 187 | |||||
| F Tabular disclosure of contractual obligations | 2.1.23. Cash obligations | 33 | ||||
Note 24 Contractual obligations | 173 | |||||
| G Safe Harbor | Forward-looking statements | 5 | ||||
6 | Directors, senior management and employees | |||||
| A Directors and senior management | 6. Management | 84 | ||||
7. Supervisory Board | 85 | |||||
9.1. Board of Management and Executive Committee - Introduction | 98 | |||||
| 9.1. Board of Management and Executive Committee - (Term of) Appointment and conflicts of interest | ||||||
| B Compensation | Note | |||||
Note | ||||||
8.2. Report of the Remuneration Committee | ||||||
| C Board practices | ||||||
7. Supervisory Board | ||||||
8. Supervisory Board report | ||||||
9.1. Board of Management and Executive Committee | ||||||
9.2. Supervisory Board | ||||||
9.4. Meeting | ||||||
| D Employees | ||||||
Note | ||||||
| E Share ownership | ||||||
Note | ||||||
Note | ||||||
Note
| ||||||
7 | Major shareholders and related party transactions | |||||
| A Major shareholders | ||||||
9.6. Additional | ||||||
14.2. Share information | 240 | |||||
| B Related party transactions | ||||||
Note | ||||||
Note | ||||||
| C Interests of experts and counsel | Not applicable
| |||||
8 | Financial information | |||||
Annual Report 2016 9
Form 20-F cross reference table
| Item | Form 20-F caption | Location in this document | Page | |||
| A Consolidated statements and other financial information | ||||||
| 115 | ||||||
| 10.4. Independent auditors’ reports on the consolidated financial statements | 118 | |||||
| 14.1. Key financials and dividend | ||||||
B Significant changes | Note
| |||||
9 | The offer and listing | |||||
| A Offer and listing details | ||||||
12 Annual Report 2013
Form 20-F cross reference table
| B Plan of distribution | Not applicable | ||||||||
| C Markets | |||||||||
| D Selling shareholders | Not applicable | ||||||||
| E Dilution | Not applicable | ||||||||
F Expense of the issue | Not applicable
| ||||||||
10 | Additional information | ||||||||
| A Share capital | Not applicable | ||||||||
| B Memorandum and articles of association | |||||||||
| 105 | |||||||||
| 9.3. General Meeting of Shareholders - Main powers of the General Meeting of Shareholders | |||||||||
| C Material contracts | |||||||||
| D Exchange controls | |||||||||
| E Taxation | |||||||||
| F Dividends and paying agents | Not applicable | ||||||||
| G Statements by experts | Not applicable | ||||||||
| H Documents on display | Introduction - Documents on display | ||||||||
| I Subsidiary information | Not applicable
| ||||||||
11 | Quantitative and qualitative disclosure about market risk | ||||||||
| A Quantitative information about market risk | Note | ||||||||
| B Qualitative information about market risk | Note | ||||||||
| C Interim periods | Not applicable | ||||||||
10 Annual Report 2016
Form 20-F cross reference table
| Item | Form20-F caption | Location in this document | Page | |||
| D Safe harbor | Note
|
| ||||
| Forward-looking statements | 5 | |||||
| E Small business issuers | Not applicable
| |||||
12 | Description of securities other than equity securities | |||||
| A Debt securities | Not applicable | |||||
| B Warranty and rights | Not applicable | |||||
| C Other securities | Not applicable | |||||
| D American depository shares | 14.8. New York Registry Shares | 249 | ||||
Part 2 | ||||||
13 | Defaults, dividend arrearages and delinquencies | Not applicable | ||||
14 | Material modifications to the rights of security holders and use of proceeds | Not applicable | ||||
15 | Controls and procedures | |||||
| A Disclosure controls and procedures | 10.1.1. Disclosure controls and procedures | 115 | ||||
| B Management Annual Report on internal control over financial reporting | 10.1. Management’s report on internal control | 115 | ||||
| C Attestation report of the registered public accounting firm | 10.3. Independent auditors’ report on internal control over financial reporting | 117 | ||||
D Changes in internal control over financial reporting | 10.1.2. Changes in internal control over financial reporting | 115 | ||||
16A | Audit Committee Financial Expert | 9.2. Supervisory Board - The Audit Committee | 101 | |||
16B | Code of Ethics | 5.1. Our approach to risk management - Financial Code of Ethics | 73 | |||
16C | Principal Accountant Fees and Services | 8.3. Report of the Audit Committee | 95 | |||
| 9.4. Meeting logistics and other information - Auditor policy | 107 | |||||
| Note 6 Income from operations - Audit fees | 147 | |||||
16D | Exemptions from the Listing Standards for Audit Committees | Not applicable | ||||
16E | Purchases of Equity Securities by the Issuer and Affiliated Purchasers | 9.3. General Meeting of Shareholders - Repurchase and issue of (rights to) own shares | 105 | |||
14.2. Share information - Share repurchase programs for capital reduction purposes | 240 | |||||
16F | Change in Registrant’s Certifying Accountant | Not applicable | ||||
16G | Corporate Governance | 9. Corporate governance - Corporate governance of the Philips Group - Introduction | 97 | |||
| 9.6. Additional information - General | 110 | |||||
| 9.6. Additional information - Board structure | ||||||
| 9.6. Additional information - Independence of members of our Supervisory Board | ||||||
| 9.6. Additional information - Committees of our Supervisory Board | ||||||
| 9.6. Additional information - Equity compensation plans | ||||||
| 9.6. Additional information - Code of business conduct | ||||||
16H | Mine Safety Disclosure | Not applicable | ||||
Annual Report 2013 132016 11
Form 20-F cross reference table
| Item | Form 20-F caption | Location in this document | Page | |||
| B Warranty and rights | Not applicable | |||||
| C Other securities | Not applicable | |||||
| D American depository shares | 16.9. New York Registry Shares
| 272 | ||||
| Part 2 | ||||||
| 13 | Defaults, dividend arrearages and delinquencies | Not applicable | ||||
| 14 | Material modifications to the rights of security holders and use of proceeds | Not applicable | ||||
| 15 | Controls and procedures | |||||
| A Disclosure controls and procedures | 11.1.1. Disclosure controls and procedures | 154 | ||||
| B Management annual report on internal control over financial reporting | 11.1. Management’s report on internal control | 154 | ||||
| C Attestation report of the registered public accounting firm | 11.3. Auditor’s report on internal control over financial reporting | 155 | ||||
D Changes in internal control over financial reporting
| 11.1.2. Changes in internal control over financial reporting | 154 | ||||
| 16A | Audit Committee Financial Expert | 10.2. Supervisory Board - The Audit Committee | 144 | |||
| 16B | Code of Ethics | 6.1. Our approach to risk management and business control - Financial Code of Ethics | 116 | |||
| 16C | Principal Accountant Fees and Services | 9.3. Report of the Audit Committee | 140 | |||
| 10.4. Logistics of the General Meeting of Shareholders and provision of information - Auditor policy | 147 | |||||
| Note 3 Income from operations - Audit fees | 174 | |||||
| 16D | Exemptions from the Listing Standards for Audit Committees | Not applicable | ||||
| 16E | Purchases of Equity Securities by the Issuer and Affiliated Purchasers | Note 19 Equity - Treasury shares | 189 | |||
| 10.3. General Meeting of Shareholders - Repurchase and issue of (rights to) own shares | 146 | |||||
16.2. Share information - Share repurchase programs for capital reduction purposes
| 259 | |||||
| 16F | Change in Registrant’s Certifying Accountant | Not applicable | ||||
| 16G | Corporate Governance | 9. Supervisory Board report | 131 | |||
10. Corporate governance
| 142 | |||||
| Part 3 | ||||||
| 17 | Financial statements | Not applicable | ||||
| 18 | Financial statements | 11. Group financial statements | 154 | |||
| 19 | Exhibits | 18.1. Index of exhibits | 277 | |||
| Item | Form20-F caption | Location in this document | Page | |||
Part 3 | ||||||
17 | Financial statements | Not applicable | ||||
18 | Financial statements | 10. Group financial statements - from 10.4 to 10.9 | 114 | |||
19 | Exhibits | 16.1. Index of exhibits | 253 |
1412 Annual Report 2013
Performance highlights
Prior-period financial statements and related information have been restated for the treatment of Audio, Video, Multimedia and Accessories as discontinued operations (see note 7, Discontinued operations and other assets classified as held for sale) and the adoption of IAS 19R, which mainly relates to accounting for pensions (see note 30, Post-employment benefits). For a reconciliation to the most directly comparable GAAP measures, seeReconciliation of non-GAAP information.
Financial table
all amounts in millions of euros unless otherwise stated
| 2011 | 2012 | 2013 | ||||||||||
Sales | 20,992 | 23,457 | 23,329 | |||||||||
Adjusted IFO | 1,435 | 1,106 | 2,451 | |||||||||
as a % of sales | 6.8 | 4.7 | 10.5 | |||||||||
IFO | (479 | ) | 648 | 1,991 | ||||||||
as a % of sales | (2.3 | ) | 2.8 | 8.5 | ||||||||
Net income (loss) | (1,456 | ) | (30 | ) | 1,172 | |||||||
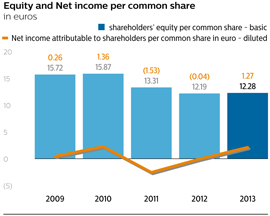
Net income attributable to shareholders per common share in euro: | ||||||||||||
- basic | (1.53 | ) | (0.04 | ) | 1.28 | |||||||
- diluted | (1.53 | ) | (0.04 | ) | 1.27 | |||||||
Net operating capital | 10,382 | 9,316 | 10,238 | |||||||||
Free cash flows | (97 | ) | 1,627 | 172 | ||||||||
Shareholders’ equity | 12,328 | 11,151 | 11,214 | |||||||||
Employees at December 31 | 125,240 | 118,087 | 116,681 | |||||||||
of which discontinued operations | 5,645 | 2,005 | 1,992 | |||||||||
Financial performance 2013
| ||||||||
| ||||||||
| ||||||||

Annual Report 2013 15
Performance highlights
Performance
in millions of euros
| Group | Healthcare | Consumer Lifestyle | Lighting | |||||||||||||||||||||||||||||||||||||||||||||
| 2012 | 2013 | 2012 | 2013 | 2012 | 2013 | 2012 | 2013 | |||||||||||||||||||||||||||||||||||||||||
Sales | 23,457 | 23,329 | 1% | 9,983 | 9,575 | 4% | 4,139 | 4,605 | 7% | 8,442 | 8,413 | 0% | ||||||||||||||||||||||||||||||||||||
Green product sales | 10,981 | 11,815 | 8% | 3,610 | 3,690 | 2% | 1,619 | 2,270 | 40% | 5,572 | 5,855 | 2% | ||||||||||||||||||||||||||||||||||||
Sales in mature geographies5) | 15,407 | 14,825 | 4% | 7,615 | 7,154 | 6% | 2,365 | 2,418 | 2% | 5,010 | 4,758 | 5% | ||||||||||||||||||||||||||||||||||||
Sales in growth geographies5) | 8,050 | 8,504 | 6% | 2,368 | 2,421 | 2% | 1,954 | 2,187 | 12% | 3,432 | 3,655 | 6% | ||||||||||||||||||||||||||||||||||||
Adjusted IFO | 1,106 | 2,451 | 122% | 1,226 | 1,512 | 23% | 456 | 483 | 6% | 128 | 695 | 443% | ||||||||||||||||||||||||||||||||||||
Net operating capital | 9,316 | 10,238 | 10% | 7,976 | 7,437 | 7% | 1,205 | 1,261 | 5% | 4,635 | 4,462 | 4% | ||||||||||||||||||||||||||||||||||||
16 Annual Report 20132016
Message from the CEO 1

“Our Accelerate! initiatives helped us to achieve our mid-term 2013 targets. We are implementing thehave transformed Philips Business System across the company to improve customer focus and operational excellence, and drive our businesses systematically to global leadership performance. With our mission to deliver meaningfulinto a focused leader in health technology, delivering innovation to make the world healthierhelp people manage their health and more sustainable, we are well positioned to improve our growth rate.support care providers in delivering care effectively.”
Frans van Houten, CEO Royal Philips
Dear stakeholder,Stakeholder,
I am very excited about the future of Philips as a focused leader in health technology, innovating new approaches to global health challenges. 2016 was a defining year for our company as we celebrated our 125th year as an innovation company and continued to advance our transformation. Our strategic focus is already delivering results.
We have successfully integrated our Volcano acquisition, achieving multiple quarters of double-digit growth, significant growth synergies with our image-guided therapy business, and cost synergies well beyond our original plans.
We separated the Lighting business, executing a complex project on time and below budget. In May we successfully listed Philips Lighting on the Amsterdam Euronext stock exchange, giving it the opportunity to build on its leadership position in the exciting lighting industry. In its first year as a stand-alone company, Philips Lighting delivered strong LED sales growth and a significant increase in profitability, demonstrating the continued progress that the largest lighting company in the industry is making. In February 2017 we further reduced our stake in Philips Lighting’s issued and outstanding share capital to approximately 55%, in line with our stated aim to fully sell down our stake in Philips Lighting over the next several years. Separately, in December we signed an agreement to sell the combined Lumileds and automotive lighting businesses, effectively completing our portfolio transformation.
I am pleased with the momentum in the overall business performance of our HealthTech portfolio as our health technology businesses posted 5% comparable sales growth1 and a significant increase in profitability. At the same time, we again stepped up our investments in quality, growth initiatives and innovation.
Our solutions approach – where we combine suites of systems, smart devices, software and services to help our customers improve patient outcomes and productivity – continues to gain traction, as evidenced by 11% solutions revenue growth in the year and our winning 15 new long-term strategic partnerships around the world with an aggregate value of approximately EUR 900 million.
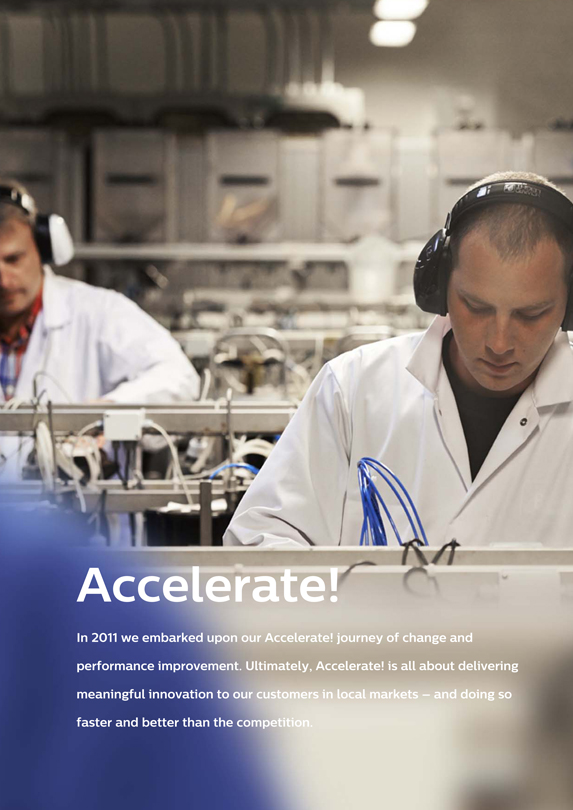
In 2013 we passed a major milestone on2016, our Accelerate! transformation journey to unlock Philips’ full potential. Despite economic headwinds, especially in Europeproducts and services improved the United States, our Accelerate! initiatives helped us to achieve our mid-term 2013 targets. I am delighted with this result, as it underlines yet again that Philips is, above all, a caselives of self-help.
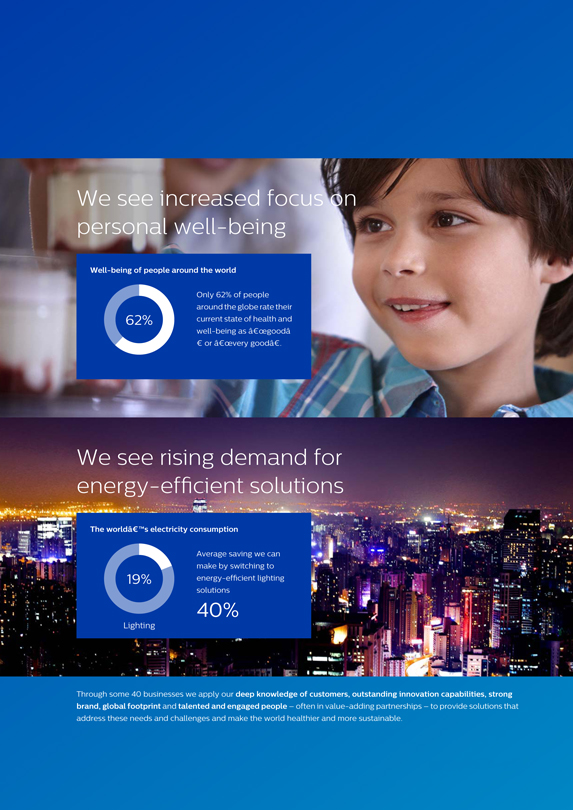
Accelerate! is helping us get closer to our customers, as illustrated by our landmark alliance with Georgia Regents Medical Center. And the transformation of our value chains is speeding up the introduction of locally relevant innovations in key markets2.1 billion people around the world. Innovations likeWe also launched our EPIQ ultrasound imaging system,new five-year ‘Healthy people, sustainable planet’ program, supporting the aim of improving the lives of 3 billion people per year by 2025 and becoming carbon-neutral in our Smart Air Purifieroperations by 2020. And at the World Economic Forum in January 2017 the Chairman of our Supervisory Board and AirfryerI signed the Compact for Responsive and Responsible Leadership, an initiative to promote and align the long-term sustainability of corporations and the long-term goals of society, with an inclusive approach for all stakeholders.
Our overall 2016 performance gives me great confidence for the future as we build upon outstanding positions in the hospital and the home, appliances,expand our solutions capability and continue to deliver on the promise of digitization and smart, connected care.
Transforming the delivery of care
As consumers take a more active role in managing their health, we see professional healthcare and consumer health converging. This provides a tremendous opportunity for technology to play a role in data-enabled healthcare delivery, also supporting the shift from hospital care and acute reactive care to more proactive ambulatory and home care.
Through our energy-efficient CityTouch lightingmarket-leading propositions in personal health, we have natural touchpoints with consumers to promote healthy lifestyles, which are critical to good health. For example, our Dream Family is a comprehensive solution comprising sleep therapy devices, a comfortable mask, therapy management system.software and services to provide a good night’s sleep for people with obstructive sleep apnea. And our connected Sonicare toothbrushes with smart sensor technology help to improve oral healthcare through real-time feedback and post-brush analytics.
| 1 | Non-GAAP financial measure. For the definition and reconciliation to the most directly comparable GAAP measure, refer to chapter 4, Reconciliation ofnon-GAAP information, of this Annual Report |
Annual Report 2013 172016 13
Message from the CEO 1
In the hospital we are leading in integrated diagnostic solutions across various disciplines including radiology, pathology and genomics, combining advanced imaging modalities and clinical decision support aided by artificial intelligence and practice management software.
We are also seeingleading in image-guided, minimally invasive therapies which, compared with open surgery, have the steady developmentbenefits reduced patient trauma, shorter recovery times and higher productivity. Our suites of ainterventional imaging technologies and navigation software, combined with interventional devices such as smart catheters, enable complex procedures in cardiology and oncology, for example. Our enterprise patient monitoring informatics solutions greatly reduce adverse events for patients and lighten the workload for nurses. And we are increasing our contribution to improve population health management with data analytics and targeted programs to improve health outcomes of patient cohorts with multipleco-morbidities and to reduce costs.
HealthSuite, our secure yet open healthcare Internet of Things cloud platform, connects patients and millions of devices with care providers, supported by powerful artificial intelligence. It ‘connects the dots’, enabling the flow of data needed to support first-time-right precision diagnoses and to deliver personalized treatments. At Philips, we believe this will improve outcomes, reduce costs and increase well-being.
Our initiative to build primary care capacity in developing markets through the Community Life Centers has passed its clinical and practical validation tests and will soon be ready for furtherroll-out, with the aim of cost-effectively improving access to care for millions of people.
Significant opportunities for value creation
Our EUR 17 billion health technology portfolio serves markets that offer attractive prospects in terms of growth and profitability.
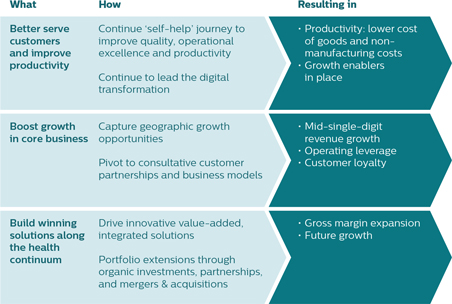
We see a great opportunity tofurther improve our operational performance culture characterized by strong employee engagement, teamwork, and to deal forthrightly with the drive for operationalpossible impact of regulatory investigations. We believe we are making progress in improving our customer excellence programs and accountability for results.in strengthening margins through productivity. This is making us more agile, entrepreneuriala continuation of our Accelerate! program, where there is considerable scope for ‘self-help’ by applying the Philips Business System. We will drive higher productivity by lowering the cost of goods,non-manufacturing cost and innovative.the cost ofnon-quality, while at the same time embedding the digital transformation in everything we do. Digitization is a great enabler of cutting-edge value propositions, as well as driving higher levels of customer service, productivity and quality.
Financial performance
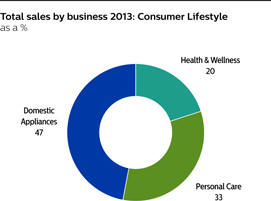
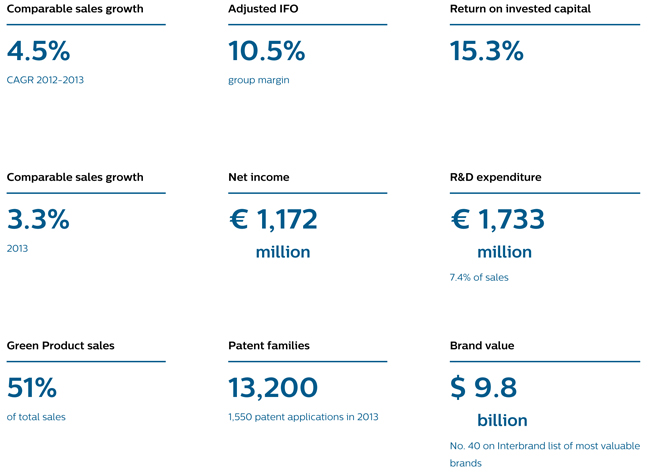
The economic environment in 2013 was challenging. Full-year sales declined by 1% in nominal terms, but increased by 3% on a comparable basis. Closing the year with strong 7% top-lineSecond, we see opportunities toboost growth in our existing core health technology businesses. We will do this by executing more effectively on customer partnerships, further transforming the fourth quarter,business model from ‘transactional’ to one of ‘long-term partnerships’, with shared business goals and recurring revenue streams. Another proven avenue of growth is via geographical adjacencies. This approach has worked well in our Personal Health businesses, where we delivered a compound annual growth rate for comparable sales over the period 2012-2013 of 4.5%, compared to our target of 4-6%. In regional terms, our growth geographies delivered 11% comparable sales growth in 2013 and now make up 36% of total sales.
Profitability improved significantly on the back of increased gross margins and productivity gains from our Accelerate! program. This resulted in a reported Adjusted IFO of 10.5%, within the target bandwidth of 10-12%. And our return on invested capital was 15.3%, above the targeted range of 12-14%.
Our Healthcare business increased operational earnings despite a virtually flat top line. With the issues surrounding health care reformhave taken products that have been successful in the USUnited States or Japan, for example, and budget constraintsbrought them into emerging economies, where there is a huge appetite for innovation and our brand. We anticipate market share gains in key markets,several of our businesses, including our Diagnostic Imaging business, which has largely overcome the incidents of the past.
Third, we are increasingly focusing on becoming the technology solutions partner of choice to major hospitals as a way to unlock new growth. Reflecting the success of its innovative propositions for personal health and well-being, Consumer Lifestyle posted strongdriving future growth and good earnings, while Lighting recorded higher sales, driven by a 38% increase in LED-based sales, and improved operational earnings.
In 2013 we also completed the execution of our EUR 2 billion share buy-back program, thereby improving the efficiency of our balance sheet, and announced a new EUR 1.5 billion program to be concluded over the next 2-3 years. By the end of 2013 we had completed 7% of this new program.
Other 2013 highlights
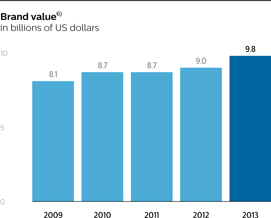
In 2013 we rose to # 40 on Interbrand’s annual ranking of the top-100 global brands,profit expansion with our brand value increasing by 8%shift to close to USD 10 billion. And in November we unveiled our new brand positioning and brand line – “innovation and you” – and our redesigned shield, which enjoyed an enthusiastic reception from customers, employees and other stakeholders.
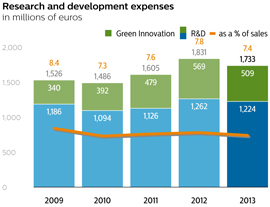
In 2014 we celebrate 100 years of Philips Research, and over the past year we underlined our commitment to innovation bysolutions. We are investing EUR 1.7 billionstrongly in research and development. We filed over 1,500 patent applications in 2013. Other innovation highlights includeddevelopment for value-added, integrated solutions along the increasing adoption of our Digital Pathology solution and the development of the 200 lm/W TLED prototype to replace fluorescent tube lighting.
We also continued to deliver on our EcoVision sustainability commitments in 2013, improving the lives of 1.8 billion people around the globe and hitting our Green Product sales target of 50% of total sales two years ahead of schedule. In Buenos Aires we were awarded the order to renovatehealth continuum, most of the city’s 125,000 street lights with our CityTouch system, and in Dubai we were selected to transform over 260 Municipality buildings with intelligent LED solutions – both projects reducing energy consumption by some 50%. Our efforts to create a healthier and more sustainable world received recognitionnotably in the formareas of a rise to 23rd place in Interbrand’s ranking of the top 50 Best Global Green Brands, as well as a top rating from the Carbon Disclosure Project.
Of course, no year is entirely free of disappointment,precision diagnostics, cardiology, oncology, respiratory, and in 2013 we had to contend with the termination of the deal with Funai for our Audio, Video, Multimedia and Accessories business. We also faced compliance issues relating to our General Business Principles, which we are refining and strengthening.
Looking ahead – our Path to Value by 2016
Philips is a diversified technology company with a portfolio of some 40 businesses across various strategic domains. Over half of these businesses hold global leadership positions. Our portfolio is underpinned by strong assets: deep market insights; world-class innovation capabilities – technology, know-how and strong IP positions; our global footprint; our talented, engaged people; and the Philips brand.
The significant changes we have made to our portfolio in recent years have created a better growth platform with higher profit potential. And with the transformation of our business model architecture, we are increasingly becoming a technology solutions partner, with recurring revenue streams accounting for over 25% of sales.
Meeting the needs of a changing worldpopulation health.
In light of the mega-trends and challenges the world is facing, we are confident in our chosen strategic direction. With its focus on health and sustainability, our
1814 Annual Report 20132016
Message from the CEO 1
visionRoadmap to improvewin
We do need to navigate carefully the many potentialgeo-political risks that we see today. Given that we have a balanced footprint across the world, we believe this is manageable. We are also still exposed to certain risks from legacy issues, which we aim to manage with strong focus and care.
In conclusion
I would like to thank all our customers and stakeholders for their continued support. I would also like to pay tribute to our teams around the world for their outstanding work – and the progress they achieved – in the course of the year.
With a strong commitment to continuous improvement, we will deliver the meaningful innovation and quality our customers expect – and take the next steps on our journey to reach our goal of improving the lives of 3 billion people a year by 2025 helps to differentiate us from the competition, have a closer relationship with our customers, create IP and ultimately create more value.
We see the shift from a linear to a circular economy as a further opportunity to create value. In a linear economy, products are used briefly and then discarded as waste. In a circular economy, products are designed so they become part of a value network where re-use and refurbishment ensure continuous re-exploitation of resources.
We are redesigning our products in order to capture their residual value. And we are shifting from transactions to relationships via service and solution business models. A good example is the 10-year performance contract we were awarded to install, monitor and maintain 13,000 connected lighting fixtures and energy management controls for parking garages in Washington, DC. Because we are ensuring light levels and delivering the solutions as a service that is paid for by the energy savings, Washington gets brighter, safer LED lighting for its garages with none of the up-front cost, thereby removing one of the main barriers to the adoption of energy-efficient technology.2025!
Driving productivity improvement
Over the coming years we will continue to drive operational excellence and invest in innovation and sales development. We will also continue to focus on improving profitability, e.g. by further reducing overhead costs and driving value engineering through our Design for Excellence (DfX) program. Altogether we see significant potential to improve productivity over the next few years. We also have scope for value-creating bolt-on acquisitions, but will remain prudent with our capital allocation. Most of our growth opportunities are organic.
In 2014 we will roll out a new IT landscape to make Philips a truly real-time company, and we will further embed the Philips Business System (PBS). The PBS is the way we run our company to ensure business success is repeatable. This year will also see our new brand positioning being activated across the globe.
New growth initiatives
I am pleased to say that Philips has multiple new growth opportunities in the making. Within our Healthcare sector we have established the Healthcare Informatics Solutions & Services business group, which is focusing on a digital connected healthcare delivery platform, advanced informatics and big data analytics, and world-class integration and consulting services. At Consumer Lifestyle we have a new business initiative on Personal Health. And in our Innovation, Group & Services sector we have several highly promising start-ups, although it will be a few years before they are margin-accretive because of the necessary investments. Examples of these exciting new business areas include point-of-care diagnostics as well as horticultural and city farming technology.
Confident in the future
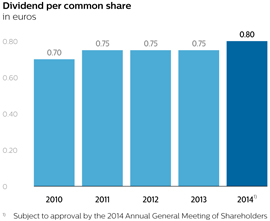
While remaining cautious about the short-term macro- economic outlook, we are committed to delivering on our 2016 financial performance targets. As a sign of our confidence in Philips’ future, we are proposing to the upcoming General Meeting of Shareholders to increase this year’s dividend to EUR 0.80 per common share, in cash or stock.
On behalf of my colleagues on the Executive Committee, I wish to thank all our employees for embracing Accelerate!, helping to build a great company fit for the demands of the 21st century, and delivering innovations that matter to people the world over. And I would like to thank our customers, shareholders and other stakeholders, for their continued trust and support.

Frans van Houten
Chief Executive Officer
Annual Report 2013 192016 15
Driving change and improvement
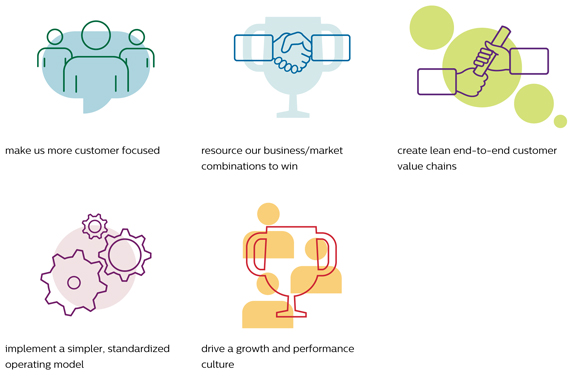
Now in its third year, Accelerate! is making Philips a more agile and entrepreneurial innovator. The program, which is set to run through 2017, is made up of five streams designed to:
Annual Report 2013 21
Accelerated! in action

22 Annual Report 2013

Annual Report 2013 23

With the help of patient advisors like Alice Reece, Philips and Georgia Regents Medical Center are working to redefine patient and family care.
“When I think about the future of healthcare we have to re-think everything: every square foot, every person, every dollar, every resource. And that forces real dynamic change in a way that this industry hasn’t seen in years.”
David Hefner
Executive Vice President
Georgia Regents Medical Center

“Providing care requires us to be innovative, requires us to think differently. The partnership that we now have with Philips really stresses a better outcome for our patients.”
Dr Ricardo Azziz
CEO
Georgia Regents Health System

24 Annual Report 2013

Around the world, we are working together with our partners and customers to optimize every step in the value chain. This end-to-end approach is enabling us to innovate and execute faster and more efficiently.
Driving growth in oral healthcare
In Germany, we are building on our professional recommendation strategy and driving conversion of manual toothbrush users to electric tooth brushing through innovation leadership, portfolio expansion and distribution via new channels. This end-to-end approach resulted in a market share improvement of over 7%.
With only a third of German households owning a rechargeable toothbrush, there is a significant opportunity to expand our leadership in the sonic toothbrush segment. Taking an end-to-end perspective, we identified three key drivers for expansion: driving and communicating innovation leadership with superior propositions; creating a Philips Sonicare proposition at a price-point accessible for a broader audience; and making that proposition available to consumers in channels like drugstores and hypermarkets.
Philips Sonicare is already leading in the German market, with consumers responding to superior propositions like Flexcare Platinum and DiamondClean. In 2013, our leadership position was further supported through celebrity endorsement, which is driving awareness and conversion.
To present current manual toothbrush users with more alternatives from Philips Sonicare, driving growth in the mid-segment, we created a more accessibly priced proposition, the Philips Sonicare PowerUp. This product features similar brushing movements to manual and is gentle and effective. Research showed that over 90% of consumers surveyed preferred the Sonicare PowerUp over their manual toothbrush.
The majority of electric toothbrushes and replacement brush heads are sold in drugstores and hypermarkets. To leverage this opportunity, Sonicare PowerUp launched in DM and Budni drugstores, as well as Kaufland and Marktkauf hypermarkets, adding 2,000 stores to our distribution. We optimized our supply chain to work with these partners, designing bespoke packaging, significantly reducing time-to-market and improving transparency.
In less than a year our end-to-end strategy resulted in strong market share gains and double-digit growth in brush head sales. Consumer satisfaction increased, with patients advised by their dentist to switch to electric brushing conveniently able to purchase a Philips Sonicare and replacement brush heads at their local drugstore.
Annual Report 2013 25
LED façade lighting faster to market
Through our end-to-end transformation program, we have identified and driven improvements along the entire LED value chain in China. This has resulted in a broad range of competitively priced façade lighting solutions for the mid-tier market segment in China, with a 40% reduction in time-to-market for new product introductions and a significant increase in on-time delivery.
In 2012, market intelligence showed that we were missing out on the LED façade lighting segment in China – a segment predicted to reach € 520 million by 2015, 70% of which will be taken by mid-range solutions. The problem was that in China we only offered top-range LED façade solutions. Clearly, something had to be done.
An end-to-end transformation program was immediately initiated, and a cross-functional team representing both the business and our market organization was assembled to address all opportunities along the value chain. The team took ownership of the common goal to achieve ambitious cost targets. It invested in market research and started with market sizing and customer segmentation, before developing imaginative strategies for product positioning, go-to-market and time-to-market. From the outset, everyone knew that the new product line had to be conceived, developed and fine-tuned extremely quickly.
The result was a new range of competitive LED façade lighting solutions specially designed for the mid-range market in China. And all in just under 28 weeks – a massive reduction compared to the 12 months it previously took to bring a new product line to market. Another benefit of this end-to-end collaboration is that achievement of the delivery time target of 25 days has increased from 43% to 66%, with a further rise to 95% expected by 2015.

26 Annual Report 2013

In 2013 we continued to drive structural change through our multi-year transformation program Accelerate! We are seeing the steady emergence of a growth and performance culture that is making us more agile, entrepreneurial and innovative.
With our Accelerate! behaviors – Eager to win, Take ownership and Team up to excel – firmly embedded in the organization, we are rolling out a wide range of initiatives designed to harness the talents, viewpoints and experience of our employees and so build a winning culture. A culture anchored by our General Business Principles.
Transformation and change
To date, over 1,350 of our leading executives have taken part in our Accelerate! Leadership Program (ALP). This immersive program is designed to strengthen our leaders’ transformational capabilities so they can drive change in the organization. Complementing the ALP, the Accelerate! Team Performance (ATP) is a transformational session designed to reinforce behaviors that enhance team effectiveness. By year-end, more than 200 teams and 3,650 participants had been through the program, which also touched more than 2,000 employees via viral events.
The transformation drive is being embraced across the organization. In Healthcare, to name just one example, a group of over 160 employee advocates or “Culture Champions” is now in place, role-modeling and instilling the new culture from the middle of the organization outwards. They are providing invaluable insights and helping to drive changes in day-to-day activities and behaviors.
Capability building
ALP and ATP are also an integral part of our capability-building efforts. In 2013 we took the next steps in becoming a learning organization by completing the organizational design of Philips University. This involved a fundamental shift to align our learning activities with the organizational development priorities we have set to enable us to deliver on our business strategy. New flagship learning programs will be introduced early in 2014, and a move to one single learning management system is scheduled for the second half of the year.
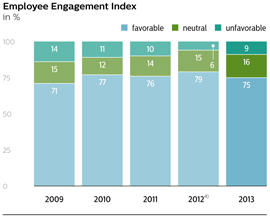
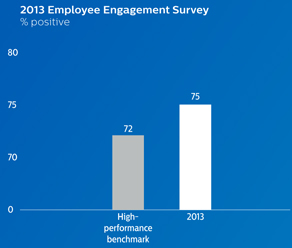
Employee engagement
In October 2013 we launched our renewed bi-annual Employee Engagement Survey (EES), emphasizing the dimensions of employee behavior that affect performance, including change agility, alignment, and engagement. The overall engagement index shows a positive score of 75% – 3 percentage points above the chosen global external high-performance benchmark.
Annual Report 2013 27
Bringing our brand to life
Reflecting this culture of engagement, our employees also play a crucial role as ambassadors of our brand. In May 2013 our Employee Brand Jam focused on engaging employees around our new brand promise. They were asked to share, via a dedicated dashboard, their stories about how Philips delivers innovation to them. This campaign won a European Excellence Award in the Internal Communications category.
In the lead-up to brand launch day, 13 November, we invited the world to uncover our redesigned shield through a mosaic launched via social media. Over 14,000 individuals took part in the 48 hours ahead of the reveal. On the day itself, over 60 sites around the world hosted simultaneous events linked to a live feed of the unveiling at our head office in Amsterdam. In this way, a highly engaged workforce was brought together to celebrate a landmark event in the history of the company.
Diversity and inclusion
Having an inclusive culture where differences are honored, respected and encouraged and a diverse workforce that mirrors the markets we’re active in, enables us to deliver innovation that matters to our customers and consumers and thus to create value for Philips and its stakeholders. Our new Diversity & Inclusion Policy defines our global standards and the role all employees need to play to create a diverse and inclusive workplace.

28 Annual Report 2013

In 2011, Philips embarked on a comprehensive program to significantly increase the efficiency of its overhead structure: those activities which take place mainly above the level of operational businesses and market organizations. Since then, real progress has been made – with more work to be done over the coming years.
The Accelerate! productivity program looked first to benchmarks – to what was currently industry best-in-class – and subsequently leveraged this insight to re-engineer the company’s overhead activities such as IT, Finance, Human Resources and Real Estate. The objective was to deliver improved service levels to internal customers in a faster, simpler, easier-to-experience way – at lower cost.
The focus of the program was on the operating model – how the function was set up to deliver its services. These ‘smarter functions’ looked to pool services into Centers of Expertise which then provide high-quality, 24/7 support to a wide range of businesses and geographies from a single hub. Equally impactful was the increased use of ‘output-based delivery’, swapping contract workers brought into Philips to support initiatives for clear output-based contracts with the 3rd-party suppliers. Last, but by no means least, was the reduction in managerial layers and subsequent increase in span of control of individual managers; this has led to less bureaucracy and faster decision making across the company.
Finance is a good example. Traditionally, finance professionals were spread widely across Philips, each supporting business management in everything from basic bookkeeping to analysis of upcoming Asian competition. As of 2013, we have re-engineered the operating model of our Finance activity, pooling knowledge into efficient, dedicated Centers of Expertise – one focused on fundamental bookkeeping and internal control, another on financial planning and analysis of business performance, yet another on expert company-wide advice on specific topics ranging from foreign exchange to pensions. This has led to a simpler, leaner, more effective operating model which, critically, is able to deliver faster, better services to its internal customers. Similar transformations in the other functions – and indeed more broadly in business management – have, collectively, allowed us to substantially improve the efficiency and effectiveness of our overhead structure and – in the process – report a gross cost reduction of over EUR 1 billion through the end of 2013.
Annual Report 2013 29
Our 2013 results
30 Annual Report 2013
The journey continues
First milestone passed
Accelerate! is working and driving our transformation. We are pleased to have achieved the first major milestone on our Accelerate! journey – our mid-term 2013 financial targets. However, we still have a way to go before we have delivered Philips’ full potential.
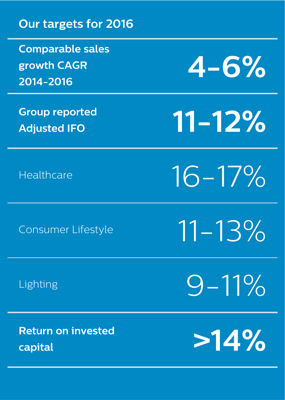
New targets on Path to Value
That’s why we have set ourselves challenging new targets, to be realized by the end of 2016. These indicate the value we create, as measured by sales growth, profitability and our use of capital:
Annual Report 2013 31
A born innovator
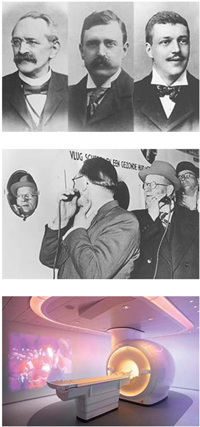
Philips was founded in Eindhoven, Netherlands, in 1891 by Frederik and Gerard Philips – later joined by Gerard’s brother Anton – to “manufacture incandescent lamps and other electrical products”. For the 120-plus years since then, we have been improving people’s lives with a steady flow of ground-breaking innovations.
Today, we are building upon this rich heritage as we touch billions of lives each year with our innovative healthcare and lighting solutions and our personal health and well-being products.
Whatweaspireto
At Philips, we strive to make the world healthier and more sustainable through innovation.
Our goal is to improve the lives of 3 billion people a year by 2025.
We will be the best place to work for people who share our passion.
Together we will deliver superior value for our customers and shareholders.
Annual Report 2013 33
Responding to global challenges
With our understanding of many of the longer-term challenges our world faces, we see major opportunities to apply our innovative competencies and create value for our stakeholders.

34 Annual Report 2013
Ensuring success is repeatable
The Philips Business System is the way we run our company to deliver on our mission and vision. It is designed to ensure that success is repeatable, i.e. that we create value for our stakeholders time after time.
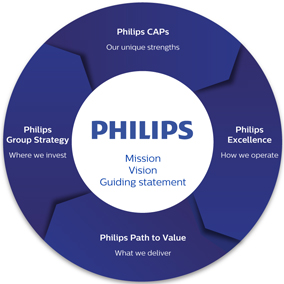
Group Strategy: We manage our portfolio with clearly defined strategies and allocate resources to maximize value creation.
CAPs: We strengthen and leverage our core Capabilities, Assets and Positions as they create differential value: deep customer insight, technology innovation, our brand, global footprint, and our people.
Excellence: We are a learning organization that applies common operating principles to deliver Philips Excellence.
Path to Value: We define and execute business plans that deliver sustainable results along a credible Path to Value.
Engaged employees crucial for success
We need all our people collaborating effectively – in a diverse and inclusive environment, where they can grow and fulfill their ambitions. Engagement supports our culture of growth and performance improvement, reinforcing our goal of being the best place to work for people who share our passion.
36 Annual Report 2013
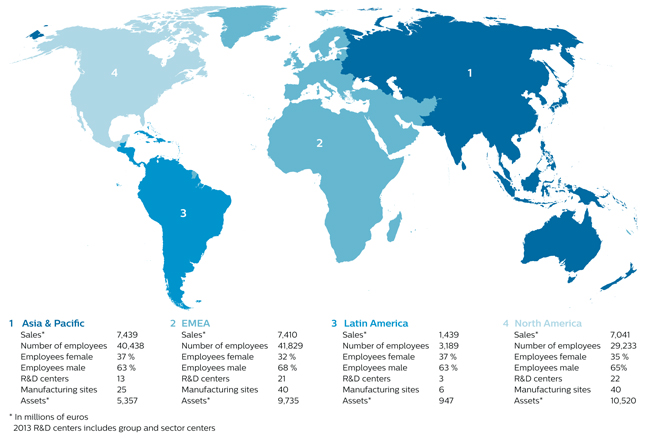
Find out more about the scale and location of our activities throughout the world.
Annual Report 2013 37
Who do we mean by ‘you’?
Philips delivers innovation that matters to you.
But just who is ‘you’? And what matters to you? To get ever closer to our customers, these are questions we ask every day.
With our global presence – we have customer-facing staff in over 100 countries – and our trusted brand, we are uniquely placed to capture local customer insights.
By understanding the challenges local people face – whether they be a hospital director, a city planner, a doctor or a consumer – we ensure that their actual needs and aspirations drive our innovation efforts. So we can deliver what really matters to them.

Annual Report 2013 39
2. Understanding people’s needs
What matters to you?

40 Annual Report 2013

Annual Report 2013 41
42 Annual Report 2013

Ralph and Helen McCurdy, a loving husband and wife who can live together at home and receive high-quality health care, thanks to an innovative and efficient telemedicine program from Philips and Banner Health.
“Without communication, Ralph and I could have never survived the 64 years. To be able to talk to a doctor on a video and we don’t have to wait two or three days for a doctor appointment, it’s fabulous.”
Helen McCurdy


This is the future. It’s really an amazing model of care that doesn’t exist anywhere else… yet. When I have a team of people, augmented by a lot of Philips technology, I can catch things earlier, treat things earlier, and intervene in a way that allows me to accomplish what I set out to do as a geriatrician, and ultimately to do some good in these patient’s lives.”
Edward Perrin, MD
Geriatric Care Specialist & Medical Director
Banner Hospice
Annual Report 2013 43

The Philips Airfryer lets Dable Kwan prepare spring rolls and other delicious fried foods with much less oil. Who knew innovation could be so good for you, and taste so good too?
“My name is Dable and I live in Hong Kong. I’m a housewife and I love to cook. I really started to cook seriously about 10 years ago.
My husband loves fried food. Back then I would tell him, ‘No, there’s too much oil and grease, and it’s not good for your health.’ But since getting the Philips Airfryer, ah, what a happy man.”


“It really makes cooking much easier, much healthier, and much more fun. Now, I’m using less oil, less salt, less everything else. We just had our check-ups and our cholesterol, blood sugar and everything else are at very healthy levels.”
44 Annual Report 2013

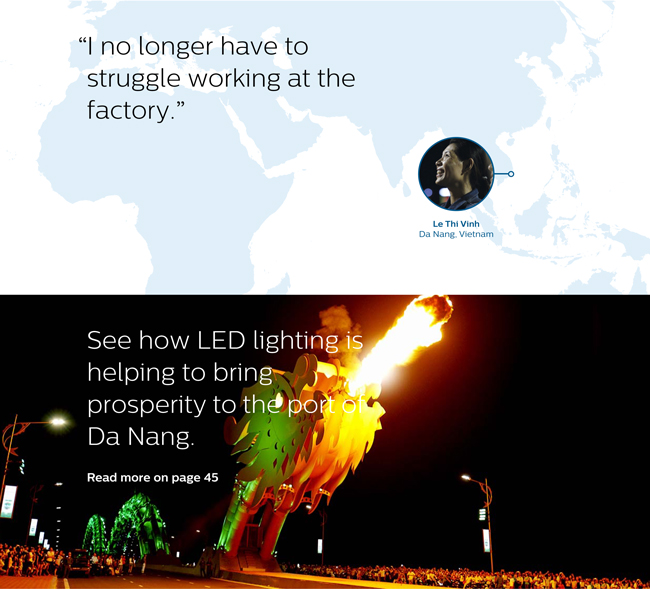
The port of Da Nang has grown in prosperity since Philips LEDs began lighting up the Dragon Bridge. See how the lives of fisherman Le Van Khe and his daughter Le Thi Vinh are improving.
“The lights make the structure more vibrant and interesting for people who come to marvel at it… The bridge has been central to our overall growth. This year we’re hoping to receive around 3 million tourists.”
Tran Chi Cuong
Deputy Director
Danang Department of Culture, Sports and Tourism

“I have my own sugarcane juice cart near the Dragon Bridge. When the bridge opened I saw a lot of tourists arrive and figured that selling sugarcane to them would be better than working at the factory. My father is very happy that I no longer have to struggle working at the factory.

On a Saturday and Sunday it’s so much fun to see the show. The bridge is very important to my family and me. My life lit up because the bridge lit up. It has changed our lives for the better.”
Le Thi Vinh
Annual Report 2013 45
How we innovate for you
Armed with deep insights into local customer needs, we then bring together our R&D and design expertise and our local business-creation capabilities to address these needs.
The locally relevant solutions we develop – often in collaboration with our customers – do not always involve ‘new technology’. Instead, they may mean a new application or a unique customer proposition brought about by an innovative partnership.
Discover overleaf how we applied our innovation and design capability to help women breastfeed for longer.
46 Annual Report 2013

Almost 25% of mothers stop breastfeeding within the first three months because it becomes too painful. A further 40% stop because of a decreased milk supply. Discover how the Philips AVENT Natural range addresses these problems.
Using a breast pump to express milk can make it easier for mothers to continue breastfeeding. People researchers at Philips discovered that moms thought pumps were too cold and mechanical, and forced them to lean forward to make sure the milk flows down into the bottle.
Around the same time, a clinical study by Philips confirmed that comfort is physiologically essential to helping mothers produce lots of milk. Pain, stress or discomfort hampers the release of oxytocin, the hormone responsible for triggering milk production.
Philips AVENT Comfort breast pump
Therefore we took comfort as the starting point of the design and reshaped the pump to make it possible for moms to sit back in a more relaxing position to express milk. Using ultrasound and MRI scanners, we studied how babies actually suckle. To mimic that, we added five oval petals that gently massage the areas around the nipple to stimulate more milk. We changed the texture of the cushioned silicone funnel that cups the breast, giving it a silky feel that is warm and gentle against the skin.
Philips AVENT Natural bottle
We used the same insights to create a new baby bottle, designed to tackle two things: teat acceptance (also known as ‘latch on’) and colic. When babies suckle at the breast, they cause the nipple to elongate in a rhythmic way, so we created a teat to stretch in the same way. To create a more natural breast-like shape, the designers made the teat much wider at the base. And to prevent babies swallowing too much air when they are feeding, we added an ‘anti-colic’ twin-valve system that allows air to vent into the bottle rather than the baby’s stomach.
Both the bottle and the breast pump have received several awards for outstanding design.
Annual Report 2013 47
We take a two-dimensional approach –social and ecological – to improving people’s lives. Products and solutions that directly support the curative (care) or preventive (well-being) side of people’s health, determine the contribution to the social dimension.
The contribution to the ecological dimension is determined by means of our Green product portfolio, such as our energy-efficient lighting. For additional information, please visitwww.philips.com/sustainability.
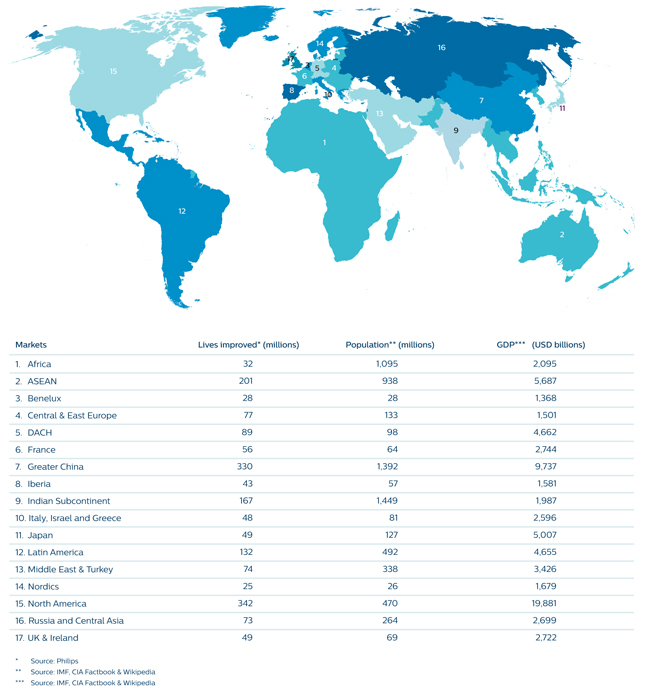
48 Annual Report 2013
4 Group performance

“2013 was a significant step forward on our Path to Value. Despite stronger headwinds than initially anticipated, we succeeded in achieving our mid-term 2013 financial targets. We delivered a compound annual growth rate for comparable sales over the period 2012-2013 of 4.5%, compared to our target of 4-6%. We achieved a reported Adjusted IFO of 10.5% of sales, within our target bandwidth of 10-12%. And our return on invested capital reached 15.3% at year-end, above the targeted range of 12-14%.”
Ron Wirahadiraksa, CFO
Annual Report 2013 49
4 Group performance 4.1 - 4.12
“Our strategic focus on health technology and the successful separation of Lighting has delivered two winning companies and a significant improvement in Group performance. Our net income more than doubled to EUR 1.5 billion while our income from operations increased to EUR 1.9 billion from EUR 1.0 billion in the previous year. Improved earnings and tight management of working capital generated EUR 1.9 billion of cash from our operating activities.”
Abhijit Bhattacharya, CFO Royal Philips
Prior-periodManagement summary
The year 2016
| • | Sales rose to EUR 17.4 billion, a nominal increase of 4%, in our HealthTech portfolio. On a comparable basis1) sales increased by 5% in our HealthTech portfolio, which combines our Personal Health businesses, Diagnosis & Treatment businesses, Connected Care & Health Informatics businesses, HealthTech Other and Legacy Items. Lighting posted a 5% decline on a nominal basis and a 2% decline on a comparable basis1). Overall, Group sales increased by 1% on a nominal basis and 3% on a comparable basis1), to EUR 24.5 billion. |
| • | Our Personal Health businesses’ sales increased to EUR 7,099 million, an increase of 5% on a nominal basis. The 7% growth on a comparable basis1) was driven by double-digit growth in Health & Wellness andmid-single-digit growth in Personal Care, Sleep & Respiratory Care and Domestic Appliances. |
| • | Our Diagnosis & Treatment businesses’ sales amounted to EUR 6,686 million, an increase of 3% on a nominal basis. The 4% growth on a comparable basis1) was driven by double-digit growth in Image-Guided Therapy andlow-single-digit growth in Diagnostic Imaging, while Ultrasound was in line with 2015. |
| • | Our Connected Care & Health Informatics businesses’ sales rose to EUR 3,158 million, an increase of 5% on a nominal basis. The 4% growth on a comparable basis1) was driven bymid-single-digit growth in Patient Care & Monitoring Solutions andlow-single-digit growth in Healthcare Informatics, Solutions & Services, partly offset by alow-single-digit decline in Population Health Management. |
| • | Lighting’s operational performance continued to improveyear-on-year. Sales in 2016 were EUR 7,094 million. Comparable sales1) reflected double-digit growth in LED and Home, which was more than offset by a double-digit decline in Lamps and alow-single-digit decline in Professional. |
In line with our mission to improve people’s lives, we have embedded sustainability at the heart of our business processes, and Green Revenues, including products and solutions sales, increased to 64% of total revenues in 2016. In recognition of our sustainability achievements, Philips was named industry group leader in the Capital Goods category in the 2016 Dow Jones Sustainability Index.
Net income amounted to EUR 1.5 billion and increased by EUR 832 million compared to 2015, driven by improved performance in the HealthTech portfolio and in Lighting as well as the Funai arbitration award, partly offset by higher financial statements have been restated forexpenses and tax charges. Net income is not allocated to segments as certain income and expense line items are monitored on a centralized basis.
| • | Adjusted income from operations1) totaled EUR 2.2 billion, compared to EUR 1.4 billion a year earlier. Our three cost savings programs all delivered ahead of plan in 2016. We achieved EUR 269 million of gross savings in overhead costs, EUR 418 million of gross |
16 Annual Report 2016
Group performance 2.1
| savings in procurement, and our End2End process improvement program delivered productivity savings of EUR 204 million. |
Net cash provided by operating activities increased from EUR 1.2 billion in 2015 to EUR 1.9 billion, mainly due to higher earnings and lower outflows related to pension de-risking settlements, partly offset by a EUR 280 million outflow related to the treatmentMasimo agreements and a EUR 91 million premium payment related to the October 2016 bond redemption.
As of Audio, Video, MultimediaOctober 20, 2016, Philips had completed the3-year EUR 1.5 billion sharebuy-back program. During the year Philips returned EUR 868 million in dividends and Accessories as discontinued operations (see note 7, Discontinued operations and other assets classified as held for sale) and the adoption of IAS 19R, which mainly relates to accounting for pensions (see note 30, Post-employment benefits).shares repurchase.
Philips Group
Management summary
Key data
in millions of eurosEUR unless otherwise stated
2014 - 2016
| 2011 | 2012 | 2013 | ||||||||||
Sales | 20,992 | 23,457 | 23,329 | |||||||||
Adjusted IFO1) | 1,435 | 1,106 | 2,451 | |||||||||
as a % of sales | 6.8 | 4.7 | 10.5 | |||||||||
IFO | (479 | ) | 648 | 1,991 | ||||||||
as a % of sales | (2.3 | ) | 2.8 | 8.5 | ||||||||
Financial income and expenses | (331 | ) | (329 | ) | (330 | ) | ||||||
Income tax expense | (251 | ) | (185 | ) | (466 | ) | ||||||
Results of investments in associates | 15 | (211 | ) | (25 | ) | |||||||
|
| |||||||||||
Income (loss) from continuing operations | (1,046 | ) | (77 | ) | 1,170 | |||||||
Income (loss) from discontinued operations - net of income tax | (410 | ) | 47 | 2 | ||||||||
|
| |||||||||||
Net income (loss) | (1,456 | ) | (30 | ) | 1,172 | |||||||
Net income attributable to shareholders per common share in euros: | ||||||||||||
—basic | (1.53 | ) | (0.04 | ) | 1.28 | |||||||
—diluted | (1.53 | ) | (0.04 | ) | 1.27 | |||||||
Net operating capital (NOC)1) | 10,382 | 9,316 | 10,238 | |||||||||
Cash flows before financing activities1) | (515 | ) | 1,157 | 141 | ||||||||
Employees (FTEs) | 125,240 | 118,087 | 116,681 | |||||||||
of which discontinued operations | 5,645 | 2,005 | 1,992 | |||||||||
|
| |||||||||||
| 2014 | 2015 | 2016 | ||||||||||
|
| |||||||||||
Condensed statement of income | ||||||||||||
Sales | 21,391 | 24,244 | 24,516 | |||||||||
Income from operations (EBIT) | 486 | 992 | 1,882 | |||||||||
as a % of sales | 2.3 | % | 4.1 | % | 7.7 | % | ||||||
Adjusted income from operations1) | 821 | 1,372 | 2,235 | |||||||||
as a % of sales | 3.8 | % | 5.7 | % | 9.1 | % | ||||||
Financial income and expenses | (301 | ) | (369 | ) | (493 | ) | ||||||
Income tax expense | (26 | ) | (239 | ) | (327 | ) | ||||||
Investments in associates | 62 | 30 | 13 | |||||||||
|
| |||||||||||
Income from continuing operations | 221 | 414 | 1,075 | |||||||||
Income from Discontinued operations - net of income tax | 190 | 245 | 416 | |||||||||
|
| |||||||||||
Net income | 411 | 659 | 1,491 | |||||||||
Other indicators | ||||||||||||
Net income attributable to shareholders per common share in EUR: | ||||||||||||
basic | 0.45 | 0.70 | 1.58 | |||||||||
diluted | 0.45 | 0.70 | 1.56 | |||||||||
Net cash provided by operating activities | 1,303 | 1,167 | 1,904 | |||||||||
Net capital expenditures | (806 | ) | (842 | ) | (831 | ) | ||||||
Employees (FTEs) | 113,678 | 112,959 | 114,731 | |||||||||
Continuing operations | 105,365 | 104,204 | 105,223 | |||||||||
Discontinued operations | 8,313 | 8,755 | 9,508 | |||||||||
|
| |||||||||||
The year 2015
Sales rose to EUR 16.8 billion, a nominal increase of 16% in our HealthTech portfolio. Lighting sales increased by 8% on a nominal basis. Overall, nominal sales for the Group increased by 13%. On a comparable basis1), sales increased by 4.4% in our HealthTech portfolio, which combines our Personal Health businesses, Diagnosis & Treatment businesses and Connected Care & Health Informatics businesses, HealthTech Other and Legacy Items. Lighting comparable sales1) decreased by 3%. Overall, comparable sales1) for the Group increased by 2% to EUR 24.2 billion. |
| • | Personal Health businesses’ sales increased to EUR 6,751 million, an increase of 14% on a nominal basis. The 5% increase on a comparable basis1) was driven by double-digit growth in Health & Wellness and high-single-digit growth in Personal Care. |
| • | Diagnosis & Treatment businesses’ sales rose to EUR 6,484 million, an increase of 23% on a nominal basis. The 6% increase on a comparable basis1) was driven by double-digit growth in Diagnostic Imaging, low-single-digit growth in Ultrasound and flatyear-on- year comparable sales1) in Image-Guided Therapy. |
| • | Connected Care & Health Informatics businesses’ sales amounted to EUR 3,022 million, an increase of 13% on a nominal basis. On a comparable basis1), flatyear-on-year due tolow-single-digit sales were growth in Healthcare Informatics, Solutions & Services, partly offset by alow-single-digit decline in Population Health Management. |
| • | Lighting recorded another year of operational improvements, resulting in a substantial increase in profitability. Sales in 2015 totaled EUR 7,438 million. LED business performance improved strongly. On a full-year basis LED accounted for 43% of total Lighting sales. In the conventional lamps business Lighting continued to gain market share in a declining market and improved profitability combined with a solid cash flow. On a nominal basis, Lighting increased by 8%. On a comparable basis1), the expected decline in conventional Lighting led to a 3% decrease for the Lighting business overall. |
In line with our mission to improve people’s lives, we have embedded sustainability at the heart of our business processes, and Green Revenues, including products and solutions sales, increased to 61% of total revenues in 2015. In recognition of our sustainability achievements, Philips was named industry leader in the Industrial Conglomerates category in the 2015 Dow Jones Sustainability Index.
Net income amounted to EUR 659 million, a 60% increase from EUR 411 million in 2014. Net income is not allocated to segments as certain income and expense line items are monitored on a centralized basis.
| • | Adjusted income from operations1) totaled EUR 1.4 billion, compared to EUR 821 million a year earlier. Our three cost savings programs all delivered ahead of plan in 2015. We achieved EUR 290 million of gross savings in overhead costs, EUR 379 million of gross savings in procurement, and our End2End process improvement program delivered productivity savings of EUR 187 million. |
| 1) | Non-GAAP financial measure. For |
The year 2013
Annual Report 2016 17
Group performance 2.1.1
In 2013 we continued to make good progressNet cash provided by operating activities decreased from EUR 1.3 billion in a challenging economic environment, particularly in the United States and Western Europe. We recorded 3% comparable sales growth (1% nominal decline), with a strong contribution from growth geographies. The profitability improved substantially, with all sectors delivering solid earnings. Net income for the year amounted2014 to EUR 1,172 million,1.1 billion, mainly drivendue to CRT litigation claims, higher outflows related to pensionde-risking settlements, partly offset by strong operational performance, including significant gross margin improvement and productivity gains coming from the Accelerate! program.higher earnings.
Sales amounted to EUR 23.3 billion, a 1% nominal decline for the year. Excluding unfavorable currency effects, comparable sales were 3% above 2012, driven by all three operating sectors. Healthcare sales grew 1%, mainly driven by Customer Services. Lighting sales were 3% above 2012, driven by Lumileds and Automotive, partly tempered by a sales decline at Consumer Luminaires. Sales at Consumer Lifestyle were 10% above 2012, with double-digit growth at Domestic Appliances and high-single-digit growth at Personal Care and Health & Wellness.
Our growth geographies achieved 11% comparable growth, while mature geographies declined by 1%, as a result of the overall macroeconomic developments, including the continued weakness of the Western European markets and the continued economic uncertainty in North America. In 2013, growth geographies accounted for 36% of total sales, compared to 34% in 2012.
IFO amounted to EUR 1,991 million, or 8.5% of sales, compared to EUR 648 million, or 2.8% of sales, in 2012. IFO improvement was seen at all sectors, but was mainly driven by Lighting and Healthcare.
In 2013 we generated EUR 1,138 million of cash flow from operating activities, which was EUR 944 million lower than in 2012. The decrease is mainly a result of the payment of the European Commission fine in Q1 2013, increased working capital requirements and the payout of restructuring provisions in 2013. Our cash flows before financing activities were EUR 1,016 million lower than in 2012, due to a decrease in cash flows from operating activities and proceeds from divestments, partly offset by lower outflows related to acquisitions of new businesses.
In 2013 we completed the execution of our EUR 2 billion share buy-back program, thereby improving the efficiency of our balance sheet, and announced a new EUR 1.5 billion program to be concluded over the next 2-3 years. By the end of the year we had also completed 7%74% of thisthe EUR 1.5 billion- sharebuy-back program.
The year 2012
Despite strong economic headwinds, we continued on our steady path of improvement driven by our multi-year change and performance program, Accelerate!. We recorded 6% comparable sales growth (12% nominal growth), with a strong contribution from growth geographies. Healthcare and Consumer Lifestyle delivered solid earnings,
50 Annual Report 2013
4 Group performance 4.1.1 - 4.1.1
|
Sales amounted to EUR 23.5 billion, a 12% nominal increase for the year. Excluding favorable currency effects and portfolio changes, comparable sales were 6% above 2011, driven by all three operating sectors. Healthcare sales grew 6%, with solid growth in all businesses. Lighting sales were 4% above 2011, with strong growth coming from Light Sources & Electronics, mainly fueled by market demand for LED, and Automotive, partly tempered by a sales decline at Lumileds. Sales at Consumer Lifestyle were 9% above 2011, with double-digit growth at Domestic Appliances and Health & Wellness and mid-single-digit growth at Personal Care.
Our growth geographies achieved 13% comparable growth, while mature geographies grew by a modest 2%, as a result of the overall macroeconomic developments and the continued weakness of the Western European markets, particularly Southern Europe. In 2012, growth geographies accounted for 34% of total sales, compared to 32% in 2011.
IFO amounted to EUR 648 million, or 2.8% of sales, compared to a loss of EUR 479 million, or negative 2.3% of sales, in 2011. Excluding impairment charges of EUR 1,355 million in 2011, significant IFO improvement was seen at Consumer Lifestyle and Healthcare, while Lighting was impacted by charges related to restructuring activities.
In 2012, we completed the divestment of our Television business to TP Vision and extended our partnership in Senseo with Sara Lee. Additionally, we completed the acquisition of Indal, strengthening our position in outdoor lighting.
In 2012 we generated EUR 2,082 million of cash flow from operating activities, which was EUR 1,322 million higher than in 2011. The increase was largely a result of lower working capital requirements and higher cash earnings. Our cash flows before financing activities were EUR 1,672 million above the level of 2011, due to higher cash flow from operating activities, higher proceeds from divestments, and lower outflows related to acquisitions of new businesses.
4.1.12.1.1 Sales
The year 20132016
The composition of sales growth in percentage terms in 2013,2016, compared to 2012,2015, is presented in the table below.
Philips Group
Sales growth composition 2013 in %
2016 versus 2012
in %2015
| comparable growth | currency effects | consolidation changes | nominal growth | |||||||||||||
Healthcare | 0.8 | (4.6 | ) | (0.3 | ) | (4.1 | ) | |||||||||
Consumer Lifestyle | 10.0 | (3.4 | ) | 0.0 | 6.6 | |||||||||||
Lighting | 3.2 | (3.5 | ) | 0.0 | (0.3 | ) | ||||||||||
IG&S1) | (2.0 | ) | (0.5 | ) | 5.7 | 3.2 | ||||||||||
|
| |||||||||||||||
Philips Group | 3.3 | (3.9 | ) | 0.1 | (0.5 | ) | ||||||||||
|
| |||||||||||||||
nominal growth | currency effects | consolidation changes | comparable growth1) | |||||||||||||
|
| |||||||||||||||
Personal Health | 5.2 | 2.0 | 0.0 | 7.2 | ||||||||||||
Diagnosis & Treatment | 3.1 | 0.9 | (0.4 | ) | 3.6 | |||||||||||
Connected Care & Health Informatics | 4.5 | 0.1 | (0.1 | ) | 4.5 | |||||||||||
HealthTech Other | (5.0 | ) | 0.0 | 0.0 | (5.0 | ) | ||||||||||
Lighting | (4.6 | ) | 2.1 | 0.2 | (2.3 | ) | ||||||||||
|
| |||||||||||||||
Philips Group | 1.1 | 1.4 | 0.2 | 2.7 | ||||||||||||
|
| |||||||||||||||
Group sales amounted to EUR 23,32924,516 million in 2013,2016, which represents a 1% nominal declinegrowth compared to 2012.
Adjusting2015. Adjusted for a 4%2% negative currency effect and consolidation impact, comparable sales1) were 3% above 2012. Comparable sales were up 10% at Consumer Lifestyle, while Lighting was 3% higher and Healthcare 1% higher than the previous year.2015.
HealthcareOur Personal Health businesses’ sales amounted to EUR 9,5757,099 million, which was EUR 408348 million lowerhigher than in 2012, but 1%2015, or 5% higher on a nominal basis. The 7% growth on a comparable basis. Higherbasis1) was drive by double-digit growth in Health & Wellness, andmid-single-digit growth in Personal Care, Domestic Appliances and Sleep & Respiratory Care. From a geographic perspective, on a comparable sales were driven by mid-single-digit growth at Customer Services, while Home Healthcare Solutionsbasis1) both mature and Patient Care & Clinical Informatics recorded low-single-digit growth. This was partly offset by a mid-single-digit decline at Imaging Systems. Increases in growth geographies, were tempered by a decline in North America and Western Europe.achieved high-single-digit growth.
Consumer Lifestyle reportedOur Diagnosis & Treatment businesses’ sales ofamounted to EUR 4,6056,686 million, which was EUR 286202 million higher than in 2012,2015, or 10%3% higher on a nominal basis. The 4% growth on a comparable basis. We achievedbasis1) was driven by double-digit growth at Domestic Appliancesin Image-Guided Therapy,low-single-digit growth in Diagnostic Imaging, while Ultrasound was in line with 2015. From a geographic perspective, comparable sales1) in growth geographies showed double-digit growth, while mature geographies sales were in line with 2015.
Our Connected Care & Health Informatics businesses’ sales amounted to EUR 3,158 million, which was EUR 136 million higher than in 2015, or 5% higher on a nominal basis. The 4% growth on a comparable basis1) reflectedmid-single-digit growth in Patient Care & Monitoring Solutions,low-single-digit growth in Healthcare Informatics, Solutions & Services and high-single-digita low-single-digit decline in Population Health Management. From a geographic perspective, comparable sales1) in mature geographies showedmid-single-digit growth, at Health & Wellness and Personal Care.while growth geographies sales reportedlow-single-digit growth.
Lighting sales amounted to EUR 8,4137,094 million, which was EUR 29344 million lower than in 2012, but 3% higher2015 and 5% lower on a nominal basis. The 2% decline on a comparable basis. Growth was largely driven bybasis1) reflected double-digit growth at Automotivein LED and Lumileds and low-single-digit growth at Light Sources & Electronics. ThisHome, which was temperedmore than offset by a low-single-digitan anticipated double-digit decline at Consumer Luminaires. while Professional Lighting Solutions was flat year-on-year.Lamps and alow-single-digit decline at Professional. From a geographic perspective, comparable sales1) showed alow-single-digit decline in growth and mature geographies.
Annual Report 2013 51
4 Group performance 4.1.2 - 4.1.2
IG&SHealthTech Other reported sales of EUR 736478 million, which wasreflected EUR 2338 million higher than in 2012,lower royalty income due to higher royalty income.the foreseen expiration of licenses, partly offset byone-time patent license deals and strong double-digit growth in Emerging Businesses.
The year 20122015
The composition of sales growth in percentage terms in 2012,2015, compared to 2011,2014, is presented in the table below.
Philips Group
Sales growth composition 2012in %
2015 versus 2011
in %2014
| comparable growth | currency effects | consolidation changes | nominal growth | |||||||||||||
Healthcare | 6.4 | 6.4 | 0.0 | 12.8 | ||||||||||||
Consumer Lifestyle | 8.7 | 4.4 | 1.4 | 14.5 | ||||||||||||
Lighting | 3.8 | 4.6 | 2.1 | 10.5 | ||||||||||||
IG&S | 0.3 | 1.7 | (4.4 | ) | (2.5 | ) | ||||||||||
|
| |||||||||||||||
Philips Group | 5.7 | 5.2 | 0.8 | 11.7 | ||||||||||||
|
| |||||||||||||||
nominal growth | currency effects | consolidation changes | comparable growth1) | |||||||||||||
|
| |||||||||||||||
Personal Health | 13.5 | (8.6 | ) | 0.0 | 4.9 | |||||||||||
Diagnosis & Treatment | 22.7 | (10.9 | ) | (5.7 | ) | 6.1 | ||||||||||
Connected Care & Health Informatics | 12.6 | (12.2 | ) | 0.0 | 0.4 | |||||||||||
HealthTech Other | 3.3 | (0.3 | ) | (1.9 | ) | 1.1 | ||||||||||
Lighting | 8.2 | (8.5 | ) | (2.2 | ) | (2.5 | ) | |||||||||
|
| |||||||||||||||
Philips Group | 13.3 | (9.4 | ) | (1.7 | ) | 2.2 | ||||||||||
|
| |||||||||||||||
Group sales amounted to EUR 23,45724,244 million in 2012,2015, which represents 12%13% nominal growth compared to 2011.2014. Nominal sales were up 14% in the Personal Health businesses, 23% in the Diagnosis & Treatment businesses, 13% in the Connected Care & Health Informatics businesses and 8% in Lighting.
AdjustingAdjusted for a 5% favorable9% positive currency effect and a 1% favorable portfolio effect,2% consolidation impact, comparable sales1) were 6%2% above 2011.2014. Comparable sales1) were up 9% at Consumer Lifestyle,5% in the Personal Health businesses and 6% in the Diagnosis & Treatment businesses, while Healthcare was 6% higherthe Connected Care & Health Informatics businesses were in line with 2014 and Lighting 4% higher than the previous year.reported a comparable sales1) decline of 3%.
HealthcareOur Personal Health businesses’ sales amounted to EUR 9,9836,751 million, which was EUR 1,131803 million higher than in 2011,2014, or 6%14% higher on a nominal basis. The 5% increase on a comparable basis. High-single-digitbasis1) was mainly driven by
| 1) | Non-GAAP financial measure. For the definition and reconciliation to the most directly comparable GAAP measure, refer tochapter 4, Reconciliation ofnon-GAAP information, of this report. |
18 Annual Report 2016
Group performance 2.1.2
double-digit growth in Health & Wellness, high-single-digit growth in Personal Care andlow-single-digit growth in Sleep & Respiratory Care and Domestic Appliances. From a geographic perspective, comparable sales1) in growth was achieved by Imaging Systems, Home Healthcare Solutionsgeographies recorded high-single-digit growth and Patient Caremature geographies recordedlow-single-digit growth.
Our Diagnosis & Clinical Informatics, while Customer Services showed low-single-digit growth
Consumer Lifestyle reportedTreatment businesses’ sales ofamounted to EUR 4,3196,484 million, which was EUR 5481,200 million higher than in 2011,2014, or 9%23% higher on a nominal basis. The 6% increase on a comparable basis. Webasis1) was driven by double-digit growth in Diagnostic Imaging and mid-single-digit growth in Ultrasound, while Image-Guided Therapy sales were in line with 2014. From a geographic perspective, comparable sales1) in growth geographies achieved double-digit growth, at Domestic Applianceswhile mature geographies recordedlow-single-digit growth.
Our Connected Care & Health Informatics businesses sales amounted to EUR 3,022 million, which was EUR 338 million higher than in 2014, or 13% on a nominal basis. On a comparable basis1), sales were flatyear-on- year due tolow-single-digit growth in Healthcare Informatics, Solutions & Services, Patient Care & Monitoring Solutions sales in line with 2014 and low-single-digit decline in Population Health & Wellness and mid-single-digitManagement. From a geographic perspective, comparable sales1) in mature geographies recordedlow-single-digit growth, at Personal Care.while growth geographies recorded a high-single-digit decline.
Lighting sales amounted to EUR 8,4427,438 million, which was EUR 804564 million higher than in 2011,2014, or 4%8% higher on a nominal basis. The 3% decrease on a comparable basis. Growthbasis1) was largely driven by high-single-digitthe double-digit growth at Automotivein LED which was more than offset by a double-digit decline in Lamps. Home showed low single-digit-growth and Professional remained flatyear-on-year. From a geographic perspective, comparable sales1) showed amid-single-digit decline in growth at Light Sources & Electronics. This was tempered by low-single-digit growth at Professional Lighting Solutionsgeographies and Consumer Luminaires and a saleslow-single-digit decline at Lumileds.in mature geographies.
IG&SHealthTech Other reported sales of EUR 713503 million, which was EUR 1816 million lowerhigher than in 2011,2014, mainly due to the divestment of Assembléonhigher sales in the prior year.Emerging Businesses.
4.1.22.1.2 Earnings
Net income is not allocated to segments as certain income and expense line items are monitored on a centralized basis.
The year 20132016
In 2013,2016, Philips’ gross margin was EUR 9,68810,612 million, or 41.5%43.3% of sales, compared to EUR 8,9919,856 million, or 38.3%40.7% of sales, in 2012.2015. Gross margin in 20132016 included EUR 52107 million of restructuring and acquisition-related charges, whereas 20122015 included EUR 289176 million of restructuring and acquisition-related charges. Higher gross2016 also included a EUR 12 million net release of provisions and EUR 4 million of charges related to the separation of the Lighting business. Gross margin percentages were seen in all sectors.2015 also included charges of EUR 35 million related to the devaluation of the Argentine peso, a EUR 28 million currency revaluation of the provision for the Masimo litigation and EUR 3 million related to the separation of the Lighting business. Theyear-on-year increase was driven by improved performance in the HealthTech portfolio and in Lighting, as well as lower restructuring and acquisition-related charges.
Selling expenses decreasedincreased from EUR 5,3345,815 million in 20122015 to EUR 5,0755,888 million in 2013. 20132016. Selling expenses as a % of total sales remained in line with 2015 at 24.0%. Selling expenses in 2016 included EUR 4567 million of restructuring and acquisition-related charges, compared to EUR 184 million of restructuring charges in 2012. The year-on-year decrease was mainly attributable to lower restructuring activities and overhead reductions in our commercial organizations. In relation to sales, selling expenses decreased from 22.7% to 21.8%. Selling expenses as a percentage of sales were lower in all sectors.
General and administrative expenses amounted to EUR 949 million in 2013, compared to EUR 845 million in 2012. As a percentage of sales, costs increased from 3.6% in 2012 to 4.1%. 2013 included EUR 562 million of restructuring and acquisition related-charges, comparedacquisition-related charges in 2015. Selling expenses in 2016 included EUR 38 million related to the separation of the Lighting business, while 2015 included charges of EUR 31 million in 2012. The 2012 figure includedrelated to a legal provision and EUR 2569 million past-service pension cost gain from a change in a medical retiree plan, while 2013 included a pension settlement lossrelated to the separation of EUR 31 million.the Lighting business.
Research and development costs decreasedincreased from EUR 1,8311,927 million, or 7.9% of sales, in 20122015 to EUR 1,7332,021 million, or 8.2% of sales, in 2013.2016. Research and development costs in 20132016 included EUR 1534 million of restructuring and acquisition-related charges, compared to EUR 5716 million in 2012.2015. Theyear-on-year decrease increase was largely attributablemainly due to lowerhigher spend in the Personal Health businesses and Diagnosis & Treatment businesses, as well as higher restructuring charges and currency effects. As a percentageacquisition-related charges.
General and administrative expenses amounted to EUR 845 million, or 3.4% of sales, researchin 2016, compared to EUR 1,209 million, or 5.0% of sales, in 2015. 2016 included EUR 5 million of restructuring and development costs decreasedacquisition related- charges, compared to EUR 30 million in 2015. 2016 also included charges of EUR 109 million related to the separation of the Lighting business, a EUR 26 million impairment of real estate assets, as well as a EUR 46 million gain from 7.8% in 2012the settlement of a pension-related claim. 2015 also included charges of EUR 345 million mainly related to 7.4% in 2013.settlements for pensionde-risking and EUR 111 million related to the separation of the Lighting business.
The overview below shows sales, IFOincome from operations (EBIT) and Adjusted IFOincome from operations1) according to the 2013 sector2016 segment classifications.
52 Annual Report 2013
4 Group performance 4.1.2 - 4.1.2
Sales, IFO and Adjusted IFO
in millions of euros unless otherwise stated
| sales | IFO | % | Adjusted IFO1) | % | ||||||||||||||||
2013 | ||||||||||||||||||||
Healthcare | 9,575 | 1,315 | 13.7 | 1,512 | 15.8 | |||||||||||||||
Consumer Lifestyle | 4,605 | 429 | 9.3 | 483 | 10.5 | |||||||||||||||
Lighting | 8,413 | 489 | 5.8 | 695 | 8.3 | |||||||||||||||
IG&S | 736 | (242 | ) | — | (239 | ) | — | |||||||||||||
|
| |||||||||||||||||||
Philips Group | 23,329 | 1,991 | 8.5 | 2,451 | 10.5 | |||||||||||||||
2012 | ||||||||||||||||||||
Healthcare | 9,983 | 1,026 | 10.3 | 1,226 | 12.3 | |||||||||||||||
Consumer Lifestyle | 4,319 | 400 | 9.3 | 456 | 10.6 | |||||||||||||||
Lighting | 8,442 | (66 | ) | (0.8 | ) | 128 | 1.5 | |||||||||||||
IG&S | 713 | (712 | ) | — | (704 | ) | — | |||||||||||||
|
| |||||||||||||||||||
Philips Group | 23,457 | 648 | 2.8 | 1,106 | 4.7 | |||||||||||||||
| 1) | Non-GAAP financial measure. For |
Annual Report 2016 19
Group performance 2.1.2
Philips Group
Sales, Income from operations (EBIT) and Adjusted income from operations1)
in millions of EUR unless otherwise stated
2015 - 2016
|
| |||||||||||||||||||
| Sales | Income from operations (EBIT) | % | Adjusted from operations1) | % | ||||||||||||||||
|
| |||||||||||||||||||
2016 | ||||||||||||||||||||
Personal Health | 7,099 | 953 | 13.4 | % | 1,092 | 15.4 | % | |||||||||||||
Diagnosis & Treatment | 6,686 | 546 | 8.2 | % | 594 | 8.9 | % | |||||||||||||
Connected Care & Health Informatics | 3,158 | 275 | 8.7 | % | 322 | 10.2 | % | |||||||||||||
HealthTech Other | 478 | (129 | ) | (120 | ) | |||||||||||||||
Lighting | 7,094 | 432 | 6.1 | % | 542 | 7.6 | % | |||||||||||||
Legacy Items | 1 | (195 | ) | (195 | ) | |||||||||||||||
|
| |||||||||||||||||||
Philips Group | 24,516 | 1,882 | 7.7 | % | 2,235 | 9.1 | % | |||||||||||||
|
| |||||||||||||||||||
2015 | ||||||||||||||||||||
Personal Health | 6,751 | 736 | 10.9 | % | 885 | 13.1 | % | |||||||||||||
Diagnosis & Treatment | 6,484 | 322 | 5.0 | % | 377 | 5.8 | % | |||||||||||||
Connected Care & Health Informatics | 3,022 | 173 | 5.7 | % | 227 | 7.5 | % | |||||||||||||
HealthTech Other | 503 | 49 | 64 | |||||||||||||||||
Lighting | 7,438 | 334 | 4.5 | % | 441 | 5.9 | % | |||||||||||||
Legacy Items | 46 | (622 | ) | (622 | ) | |||||||||||||||
|
| |||||||||||||||||||
Philips Group | 24,244 | 992 | 4.1 | % | 1,372 | 5.7 | % | |||||||||||||
|
| |||||||||||||||||||
| 1) | Non-GAAP financial measure. For the definition and reconciliation to the most directly comparable GAAP measure, refer tochapter 4, Reconciliation ofnon-GAAP information, of this report. |
In 2013, IFO2016, income from operations (EBIT) increased by EUR 1,343890 million year-on-yearyear-on- year to EUR 1,9911,882 million, or 8.5%7.7% of sales. 2013 included EUR 117 million of restructuringRestructuring and acquisition-related charges amounted to EUR 213 million, compared to EUR 561283 million in 2012. 2013 IFO was2015. Income from operations (EBIT) in 2016 also impacted byincluded EUR 152 million of charges related to the separation of the Lighting business, a EUR 26 million impairment of real estate assets, a EUR 12 million net release of provisions and a EUR 46 million gain from the settlement of a pension-related claim. Income from operations (EBIT) in 2015 also included charges of EUR 47183 million from a past-servicerelated to the separation of the Lighting business, EUR 345 million mainly related to settlements for pension cost gainde-risking, EUR 35 million related to the devaluation of the Argentine peso, EUR 31 million relating to legal provisions, EUR 28 million related to the currency revaluation of the provision for the Masimo litigation, and related settlement loss in the US, as well as a EUR 2137 million gain onrelated to the sale of a business in Healthcare. 2012 IFO included a EUR 313 million impact of the European Commission fine related to the alleged violation of competition rules in the Cathode-Ray Tube (CRT) industry, EUR 132 million of provisions related to various legal matters, a net gain on EUR 197 million on the sale of assets, mainly for the Senseo and High Tech Campus transactions, and a EUR 81 million loss on the sale of industrial assets at Lighting. In addition, 2012 IFO also included a past-service cost gain of EUR 25 million related to a retiree medical plan.real estate assets.
Amortization and impairment of intangibles, excluding software and capitalized product development costs, amounted to EUR 432350 million in 2013,2016, compared to EUR 458380 million in 2012. Additionally,2015. In 2016, goodwill impairment charges amounted to EUR 3 million consisting of impairments on divested businesses in Lighting, seenote 11, Goodwill. In 2015 goodwill impairment charges were nil.
Adjusted income from operations1) increased from EUR 1,372 million, or 5.7% of sales, in 2015 to EUR 2,235 million, or 9.1% of sales, in 2016. Theyear-on-year increase was driven by improved performance at all segments except HealthTech Other.
Personal Health businesses
In 2016, income from operations (EBIT) totaled EUR 953 million, compared to EUR 736 million in 2015. Adjusted income from operations1) amounted to EUR 1,092 million, or 15.4% of sales, compared to EUR 885 million, or 13.1% of sales, in 2015. Adjusted income from operations1) included restructuring and acquisition-related charges of EUR 16 million, compared to EUR 37 million in 2015. Adjusted income from operations1) in 2015 also included charges of EUR 31 million relating to legal provisions and charges of EUR 13 million related to the devaluation of the Argentine peso. Theyear-on-year increase was mainly attributable to higher volumes and cost productivity.
Diagnosis & Treatment businesses
In 2016, income from operations (EBIT) totaled EUR 546 million, compared to EUR 322 million in 2015. Adjusted income from operations1) amounted to EUR 594 million, or 8.9% of sales, compared to EUR 377 million, or 5.8% of sales, in 2015. Adjusted income from operations1) included restructuring and acquisition-related charges of EUR 37 million, compared to EUR 131 million in 2015. 2015 also included charges of EUR 7 million related to the devaluation of the Argentine peso. Theyear-on-year increase was largely driven by Image-Guided Therapy and Diagnostic Imaging, as well as lower restructuring and acquisition-related charges.
Connected Care & Health Informatics businesses
In 2016, income from operations (EBIT) totaled EUR 275 million, compared to EUR 173 million in 2015. Adjusted income from operations1) amounted to EUR 322 million, or 10.2% of sales, compared to EUR 227 million, or 7.5% of sales, in 2015. Adjusted income from operations1) included restructuring and acquisition-related charges of EUR 14 million, compared to EUR 38 million in 2015. 2016 also included a EUR 12 million net release of provisions, while 2015 also included a EUR 28 million charge related to the currency revaluation of the Masimo provisions and charges of EUR 1 million related to the devaluation of the Argentine peso. The increase was mainly driven by higher volumes and lower restructuring and acquisition-related charges and other items, partly offset by higher expenditure on innovation.
HealthTech Other
In 2016, income from operations (EBIT) totaled EUR (129) million, compared to EUR 49 million in 2015. Adjusted income from operations1) amounted net cost of EUR 120 million, compared to a gain of EUR 64 million in 2015. Adjusted income from operations1) included restructuring and acquisition-related charges of EUR 28 million and a EUR 26 million were takenimpairment of
20 Annual Report 2016
Group performance 2.1.2
real estate assets, compared to a net restructuring release of EUR 19 million and a EUR 37 million gain related to the sale of real estate assets in the fourth quarter of 20132015. Theyear-on-year decrease was mainly as a result of reduced growth expectations at Consumer Luminaires.attributable to higher restructuring and acquisition-related charges and other items, investments in Emerging Businesses, brand campaigns and cyber security.
Lighting
In 2016, income from operations (EBIT) totaled EUR 432 million, compared to EUR 334 million in 2015. Adjusted IFO improvedincome from operations1) amounted to EUR 1,106542 million, or 4.7%7.6% of sales, in 2012 toayear-on-year increase of EUR 2,451 million, or 10.5% of sales, in 2013. Adjusted IFO showed a year-on-year increase at all Sectors.
Healthcare
Adjusted IFO improved from EUR 1,226 million, or 12.3% of sales, in 2012 to EUR 1,512 million, or 15.8% of sales, in 2013. Adjusted IFO improvements were realized across all businesses, due to higher sales and reduced expenses resulting from cost-saving programs.101 million. Restructuring and acquisition-related charges in 2013 were close2016 amounted to zero,EUR 119 million, compared to EUR 13497 million in 2012. 20132015. Adjusted income from operations1) in 2016 also included a gain of EUR 14 million related to a release of provisions originating from the separation activities, compared to EUR 14 million of charges related to the devaluation of the Argentine peso in 2015. The increase was mainly attributable to cost reduction programs and an increase in gross margin, partly offset by higher restructuring and acquisition-related charges.
Legacy Items
Income from operations (EBIT) mainly included EUR 152 million of charges related to the separation of the Lighting business, a EUR 14 million charge related to provisions originating from the separation of the Lighting business, EUR 9 million of costs of addressing legacy issues related to environmental provisions, EUR 4 million of pension costs, EUR 36 million of stranded costs related to the combined Lumileds and Automotive businesses, EUR 11 million of charges related to various provisions, as well as a EUR 46 million gain from the settlement of a pension-related claim. Income from operations (EBIT) in 2015 included EUR 345 million of settlements mainly related to pensionde-risking.
The year 2015
In 2015, Philips’ gross margin was EUR 9,856 million, or 40.7% of sales, compared to EUR 8,206 million, or 38.4% of sales, in 2014. Gross margin in 2015 included EUR 176 million of restructuring and acquisition-related charges, whereas 2014 included EUR 249 million of restructuring and acquisition-related charges. 2015 also included charges of EUR 35 million related to the devaluation of the Argentine peso, a EUR 28 million currency revaluation of the provision for the Masimo litigation and EUR 3 million related to the separation of the Lighting business. Gross margin in 2014 included charges of EUR 366 million related to the provision for the Masimo litigation, EUR 68 million of impairment and other charges related to industrial assets at Lighting, EUR 46 million of mainly inventory write-downs related to the voluntary suspension of production at the Cleveland facility, and a past-service pension cost gain of EUR 61 million and a gain on the sale of a business of EUR 2117 million.
Consumer Lifestyle
Adjusted IFO improved from EUR 456 million, or 10.6% of sales, in 2012 to EUR 483 million, or 10.5% of sales, in 2013. Restructuring and acquisition-related charges amounted to EUR 14 million in 2013, compared to EUR 56 million in 2012. 2012 Adjusted IFO included a EUR 160 million gain on the Senseo transaction, while 2013 Adjusted IFO included a past-service pension cost gain of EUR 1 million.
Lighting
Adjusted IFO improved from EUR 128 million, or 1.5% of sales, in 2012 to EUR 695 million, or 8.3% of sales, in 2013. Restructuring and acquisition-related charges amounted to EUR 100 million in 2013, compared to EUR 315 million in 2012. 2012 Adjusted IFO included EUR 81 million of losses related to the sale of industrial assets, while 2013 Adjusted IFO included a past-service pension cost gain of EUR 10 million. Excluding these impacts, the increase in Adjusted IFO was mainly attributable to higher operational performance.
Innovation, Group & Services
Adjusted IFO improved from a loss of EUR 704 million in 2012 to a loss of EUR 239 million in 2013. Restructuring and acquisition-related charges amounted to EUR 3 million in 2013, compared to EUR 56 million in 2012. 2013 Adjusted IFO included a net EUR 25 million loss from a past-service pension cost gain and related settlement loss. 2012 Adjusted IFO included a EUR 313 million impact of the European Commission fine, EUR 132 million of provisions related to various legal matters, a EUR 37 million gain on the sale of the High Tech Campus, and a EUR 25 million past-service cost gain related to a medical retiree plan.
For further information regarding the performance of the sectors, see chapter 5, Sector performance, of this report.
Annual Report 2013 53
4 Group performance 4.1.2 - 4.1.2
The year 2012
In 2012, Philips’ gross margin was EUR 8,991 million, or 38.3% of sales, compared to EUR 8,260 million, or 39.3% of sales, in 2011. Gross margin in 2012 included EUR 289 million of restructuring and acquisition-related charges, whereas 2011 included EUR 52 million of restructuring and acquisition-related charges. Compared with 2011, the gross margin percentage was higher at Healthcare, but lower at Lighting and Consumer Lifestyle.
Selling expenses increased from EUR 5,0255,124 million in 20112014 to EUR 5,3345,815 million in 2012. 20122015. Selling expenses as a % of total sales remained in line with 2014 at 24.0%. 2015 included EUR 18462 million of restructuring and acquisition-related charges, compared to EUR 53128 million of restructuring charges in 2011.2014. Selling expenses in 2015 included charges of EUR 31 million related to a legal provision and EUR 69 million related to the separation of the Lighting business, while 2014 included a past-service pension cost gain of EUR 20 million.
Research and development costs increased from EUR 1,635 million, or 7.6% of sales, in 2014 to EUR 1,927 million, or 7.9% of sales, in 2015. Research and development costs in 2015 included EUR 16 million of restructuring and acquisition-related charges, compared to EUR 34 million in 2014. Research and development costs in 2014 also included a past-service pension gain of EUR 22 million and charges of EUR 3 million of mainly write-downs related to the voluntary suspension of production at the Cleveland facility. Theyear-on-year increase was mainly attributabledue to restructuring activitiescurrency impact and higher expenses aimedspend at supporting a higher level of sales. In relation to sales, selling expenses decreased from 23.9% to 22.7%. Selling expenses as a percentage of sales were lower in all sectors.Diagnosis & Treatment and HealthTech Other.
General and administrative expenses amounted to EUR 8451,209 million, or 5.0% of sales, in 2012,2015, compared to EUR 802747 million, or 3.5% of sales, in 2014. 2015 included EUR 30 million of restructuring and acquisition related-charges, compared to EUR 23 million in 2011. As2014. 2015 also included charges of EUR 345 million mainly related to settlements for pensionde-risking and EUR 111 million related to the separation of the Lighting business, while 2014 included a past-service pension cost gain of EUR 8 million. Theyear-on-year increase was attributable to higher charges related to settlements for pension de-risking and the separation of the Lighting business, partly offset by general and administrative costs reductions in all operating segments.
The overview below shows sales, Income from operations (EBIT) and Adjusted income from operations1) according to the 2016 segment classifications.
| 1) | Non-GAAP financial measure. For the definition and reconciliation to the most directly comparable GAAP measure, refer tochapter 4, Reconciliation ofnon-GAAP information, of this report. |
Annual Report 2016 21
Group performance 2.1.2
Philips Group
Sales, Income from operations (EBIT) and Adjusted income from operations1)in millions of EUR
2014
|
| |||||||||||||||||||
| Sales | EBIT | % | Adjusted income from operations1) | % | ||||||||||||||||
|
| |||||||||||||||||||
Personal Health | 5,948 | 620 | 10.4 | % | 758 | 12.7 | % | |||||||||||||
Diagnosis & Treatment | 5,284 | 349 | 6.6 | % | 374 | 7.1 | % | |||||||||||||
Connected Care & Health Informatics | 2,684 | (157 | ) | (5.9 | )% | (106 | ) | (3.9 | )% | |||||||||||
HealthTech Other | 487 | 37 | 51 | |||||||||||||||||
Lighting | 6,874 | 25 | 0.4 | % | 133 | 1.9 | % | |||||||||||||
Legacy Items | 114 | (388 | ) | (389 | ) | |||||||||||||||
|
| |||||||||||||||||||
Philips Group | 21,391 | 486 | 2.3 | % | 821 | 3.8 | % | |||||||||||||
|
| |||||||||||||||||||
| 1) | Non-GAAP financial measure. For the definition and reconciliation to the most directly comparable GAAP measure, refer tochapter 4, Reconciliation ofnon-GAAP information, of this report. |
In 2015, income from operations (EBIT) increased by EUR 506 millionyear-on-year to EUR 992 million, or 4.1% of sales. Restructuring and acquisition-related charges amounted to EUR 283 million, which included the Volcano acquisition, compared to EUR 434 million in 2014. 2015 income from operations (EBIT) also included charges of EUR 345 million mainly related to settlements for pensionde-risking, EUR 183 million relating to the separation of the Lighting business, EUR 35 million related to the devaluation of the Argentine peso, EUR 31 million relating to legal provisions, EUR 28 million related to the currency revaluation of the provision for the Masimo litigation, and a EUR 37 million gain related to the sale of real estate assets. Income from operations(EBIT) in 2014 included charges of EUR 366 million related to the provision for the Masimo litigation, EUR 244 million related to the CRT antitrust litigation, EUR 68 million of impairment and other charges related to industrial assets at Lighting, EUR 49 million of mainly inventory write-downs related to the Cleveland facility, and a EUR 67 million past-service pension cost gain.
Amortization and impairment of intangibles, excluding software and capitalized product development costs, amounted to EUR 380 million in 2015, compared to EUR 332 million in 2014. In 2015, goodwill impairment charges amounted to nil, while 2014 included charges of EUR 3 million consisting of impairments on divested businesses in the Connected Care & Health Informatics segment and Lighting, seenote 11, Goodwill.
Adjusted income from operations1) increased from EUR 821 million, or 3.8% of sales, in 2014 to EUR 1,372 million, or 5.7% of sales, in 2015. Adjusted income from operations1) showed ayear-on-year increase in all segments except Legacy Items.
Personal Health businesses
In 2015, income from operations (EBIT) amounted to EUR 736 million, or 10.9% of sales. Adjusted income from operations1) increased from EUR 758 million, or 12.7% of sales, in 2014 to EUR 885 million, or 13.1% of sales, in 2015. 2015 Adjusted income from operations1) included EUR 37 million of restructuring and acquisition-related charges, charges of EUR 13 million related to the devaluation of the Argentine peso and EUR 31 million charges related to legal provisions. 2014 Adjusted income from operations1) included restructuring and acquisition related charges of EUR 17 million and a EUR 11 million past-service pension cost gain. Theyear-on-year increase was largely driven by cost productivity, higher volumes, and product mix, partly offset by higher restructuring and acquisition-related charges.
Diagnosis & Treatment businesses
In 2015, income from operations (EBIT) amounted to EUR 322 million, or 5.0% of sales. Adjusted income from operations1) amounted to EUR 377 million, or 5.8% of sales, in 2015, compared to EUR 374 million, or 7.1% of sales, in 2014. Adjusted income from operations1) in 2015 included restructuring and acquisition-related charges of EUR 131 million, which included the Volcano acquisition, compared to EUR 49 million in 2014. 2015 Adjusted income from operations1) also included charges of EUR 7 million related to the devaluation of the Argentine peso. Adjusted income from operations1) in 2014 included charges of EUR 49 million of mainly inventory write-downs related to Cleveland, and a EUR 13 million past-service pension cost gain. Theyear-on-year increase was largely driven by higher volumes, partly offset by an increase in Quality & Regulatory spend, higher planned expenditure for growth initiatives and higher restructuring and acquisition-related charges.
Connected Care & Health Informatics businesses
In 2015, income from operations (EBIT) amounted to EUR 173 million, or 5.7% of sales. Adjusted income from operations1) improved from a loss of EUR 106 million in 2014 to a net gain of EUR 227 million, or 7.5% of sales, in 2015. Adjusted income from operations1) in 2015 included restructuring and acquisition-related charges of EUR 38 million, charges related to the currency revaluation of the provision for the Masimo litigation of EUR 28 million and charges of EUR 1 million related to the devaluation of the Argentine peso. Adjusted income from operations1) in 2014 included restructuring and acquisition-related charges of EUR 30 million, charges of EUR 366 million related to the provision for the Masimo litigation and a past-service pension cost gain of EUR 3 million in the US. Theyear-on-year increase was mainly due to lower charges related to the provision for the Masimo litigation, partly offset by an increase in Quality & Regulatory spend and higher planned expenditure for growth initiatives.
22 Annual Report 2016
Group performance 2.1.3
HealthTech Other
In 2015, income from operations (EBIT) amounted to EUR 49 million. Adjusted income from operations1) increased from EUR 51 million in 2014 to EUR 64 million in 2015. Adjusted income from operations1) in 2015 included a EUR 19 million net release of restructuring charges, compared to EUR 58 million of restructuring charges in 2014. 2015 Adjusted income from operations1) included a EUR 37 million gain related to the sale of real estate assets. 2014 Adjusted income from operations1) included a EUR 16 million past-service pension cost gain.
Lighting
In 2015, income from operations (EBIT) amounted to 344 million, or 4.5% of sales. Adjusted income from operations1) increased from EUR 133 million, or 1.9% of sales, in 2014 to EUR 441 million, or 5.9% of sales, in 2015. Restructuring and acquisition-related charges amounted to EUR 97 million in 2015, compared to EUR 281 million in 2014. 2015 Adjusted income from operations1) included a EUR 14 million of charges related to the devaluation of the Argentine peso, while 2014 Adjusted income from operations1) included EUR 68 million of impairment and other charges related to industrial assets and a EUR 23 million past-service pension cost gain in the Netherlands. The increase in Adjusted income from operations1) was largely driven by lower restructuring and acquisition-related charges, cost productivity and improved LED gross margins.
Legacy Items
Income from operations(EBIT) declined from a loss of EUR 389 million in 2014 to a loss of EUR 622 million in 2015. Income from operations(EBIT) 2015, included EUR 345 million of charges mainly related to settlements for pensionde-risking and charges of EUR 183 million related to the separation of the Lighting business. 2014 income from operations(EBIT) included a net release of restructuring charges of EUR 1 million and EUR 244 million of charges related to the CRT antitrust litigation.
2.1.3 Advertising and promotion
The year 2016
Philips’ total advertising and promotion expenses were EUR 1,085 million in 2016, an increase of 9% compared to 2015. The increase was mainly due to investments in key mature geographies such as the United States and Japan, as well as Germany. The total advertising and promotion investment as a percentage of sales costs decreased from 3.8%was 4.4% in 20112016, compared to 3.6%.4.1% in 2015.
Philips’ brand value increased by 4% to over USD 11.3 billion as measured by Interbrand. In the 2016 listing, Philips is ranked the 41st most valuable brand in the world.
Philips Group
Advertising and promotion expenses in millions of EUR
2012 - 2016
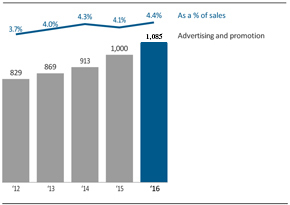
The year 2015
Philips’ total advertising and promotion expenses were EUR 1,000 million in 2015, an increase of 10% compared to 2014. The increase was mainly due to investments in key growth geographies, such as China and India, and mature geographies such as the United States and Japan. The total advertising and promotion investment as a percentage of sales was 4.1% in 2015, compared to 4.3% in 2014.
Philips brand value increased by 6% to over USD 10.9 billion as measured by Interbrand. In the 2015 listing, Philips was ranked the 47th most valuable brand in the world.
2.1.4 Research and development
The year 2016
Research and development costs increased from EUR 1,6051,927 million in 20112015 to EUR 1,8312,021 million in 2012.2016. Research and development costs in 2016 included EUR 35 million of restructuring and acquisition-related charges, compared to EUR 16 million in 2015. Theyear-on-year increase was largely attributablemainly due to higher investmentsspend at the Personal Health businesses and the Diagnosis & Treatment businesses. As a percentage of sales, research and development costs increased from 7.9% in growth2015 to 8.2% in 2016.
Philips Group
Research and innovation.development expenses in millions of EUR
2012 - 2016
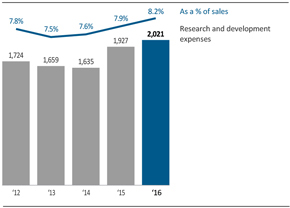
| 1) | Non-GAAP financial measure. For the definition and reconciliation to the most directly comparable GAAP measure, refer tochapter 4, Reconciliation ofnon-GAAP information, of this report. |
Annual Report 2016 23
Group performance 2.1.5
Philips Group
Research and development expenses in millions of EUR
2014 - 2016
|
| |||||||||||
| 2014 | 2015 | 2016 | ||||||||||
|
| |||||||||||
Personal Health | 332 | 383 | 412 | |||||||||
Diagnosis & Treatment | 455 | 596 | 629 | |||||||||
Connected Care & Health Informatics | 289 | 386 | 388 | |||||||||
HealthTech Other | 153 | 189 | 219 | |||||||||
Lighting | 395 | 365 | 350 | |||||||||
Legacy Items | 11 | 8 | 23 | |||||||||
|
| |||||||||||
Philips Group | 1,635 | 1,927 | 2,021 | |||||||||
|
| |||||||||||
The year 2015
Research and development costs increased from EUR 1,635 million in 2014 to EUR 1,927 million in 2015. 2015 included EUR 16 million of restructuring and acquisition-related charges, compared to EUR 34 million in 2014. 2014 also included a past-service pension gain of EUR 22 million and charges of EUR 3 million of mainly inventory write-downs related to Cleveland. Theyear-on-year increase was mainly due to currency impact and higher spend at the Diagnosis & Treatment businesses and HealthTech Other. As a percentage of sales, research and development costs increased from 7.6% in 20112014 to 7.8% in 2012.
Sales, IFO and Adjusted IFO
in millions of euros, unless otherwise stated
| sales | IFO | % | Adjusted IFO1) | % | ||||||||||||||||
2011 | ||||||||||||||||||||
Healthcare | 8,852 | 27 | 0.3 | 1,080 | 12.2 | |||||||||||||||
Consumer Lifestyle | 3,771 | 109 | 2.9 | 153 | 4.1 | |||||||||||||||
Lighting | 7,638 | (408 | ) | (5.3 | ) | 399 | 5.2 | |||||||||||||
IG&S | 731 | (207 | ) | — | (197 | ) | — | |||||||||||||
|
| |||||||||||||||||||
Philips Group | 20,992 | (479 | ) | (2.3 | ) | 1,435 | 6.8 | |||||||||||||
In 2012, IFO increased by EUR 1,127 million year-on-year, to EUR 648 million, or 2.8% of sales. 2012 included EUR 561 million of restructuring and acquisition-related charges, compared to EUR 159 million in 2011. The year-on-year increase was mainly attributable to goodwill impairments of EUR 1,355 million in 2011 and higher gross margin percentages in Healthcare and Consumer Lifestyle, but was partly offset by the EUR 313 million impact of the European Commission fine.
Amortization of intangibles, excluding software and capitalized product development costs, amounted to EUR 458 million in 2012, compared to EUR 559 million in 2011.
Adjusted IFO decreased from EUR 1,435 million, or 6.8% of sales, in 2011 to EUR 1,106 million, or 4.7% of sales, in 2012. Adjusted IFO showed a year-on-year increase at Consumer Lifestyle and Healthcare, but was lower at Lighting.
Healthcare
Adjusted IFO increased from EUR 1,080 million, or 12.2% of sales, in 2011 to EUR 1,226 million, or 12.3% of sales, in 2012. Adjusted IFO improvements were realized across Patient Care & Clinical Informatics, Home Healthcare Solutions and Imaging Systems, mainly due to higher sales and reduced expenses as a result of cost-saving programs. Restructuring and acquisition-related charges totaled EUR 134 million, compared to EUR 21 million in 2011.
Consumer Lifestyle
Adjusted IFO increased from EUR 153 million, or 4.1% of sales, in 2011 to EUR 456 million, or 10.6% of sales, in 2012. Restructuring and acquisition-related charges amounted to EUR 56 million in 2012, compared to EUR 49 million in 2011. 2012 results included a EUR 160 million one-time gain from the extension of our partnership with Sara Lee, including the transfer of our 50% ownership rights to the Senseo trademark. Excluding this one-time gain, the year- on-year Adjusted IFO increase was driven by higher sales across all growth businesses as well as lower net costs formerly reported as part of the Television business.
Lighting
Adjusted IFO decreased from EUR 399 million, or 5.2% of sales, in 2011 to EUR 128 million, or 1.5% of sales, in 2012. Restructuring and acquisition-related charges amounted to EUR 315 million, compared to EUR 66 million in 2011. The decrease in Adjusted IFO was mainly attributable to higher restructuring and acquisition- related charges, as well as losses on the sale of industrial assets amounting to EUR 81 million, partly offset by higher sales. Compared to 2011, Adjusted IFO declined in all businesses except Automotive.
54 Annual Report 2013
4 Group performance 4.1.3 - 4.1.4
Innovation, Group & Services
Adjusted IFO decreased from a loss of EUR 197 million in 2011 to a loss of EUR 704 million in 2012. Results in 2012 were negatively impacted by a charge of EUR 313 million related to the European Commission fine and provisions related to various legal matters totaling EUR 132 million. Adjusted IFO in 2012 also included a EUR 25 million gain from a change in a medical retiree benefit plan and a EUR 37 million gain on the sale of the High Tech Campus, while 2011 included a EUR 21 million gain related to a change in a pension plan.
Restructuring and acquisition-related charges amounted to EUR 56 million in 2012, compared to EUR 23 million in 2011.
For further information regarding the performance of the sectors, see chapter 5, Sector performance, of this report.
4.1.3 Advertising & Promotion7.9%.
The year 2013
Philips’ total advertising and promotion expenses were EUR 882 million in 2013, an increase of 5% compared to 2012. The increase was mainly due to the launch of our new brand positioning as well as higher investments in growth geographies, such as China. As in 2012, the Company allocated a higher proportion of its total advertising and promotion spend to growth geographies and strategic markets. Accordingly, the advertising and promotion spend in key growth geographies increased by 4% compared to 2012. The total advertising and promotion investment as a percentage of sales was 3.8% in 2013, compared to 3.6% in 2012.
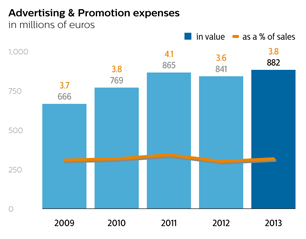
Philips increased its brand value by 8% in 2013 to over USD 9.8 billion in the ranking of the world’s 100 most valuable brands, as measured by Interbrand. In the 2013 listing, Philips moved up one position to the 40th most valuable brand in the world.
The year 2012
Philips’ total advertising and promotion expenses approximated EUR 841 million in 2012, a decrease of 3% compared to 2011, mainly due to decreased investments in Western Europe.
Consistent with 2011, the Company allocated a higher proportion of its total advertising and promotion spend towards growth geographies and strategic markets, priority areas for the Company’s growth strategy. Accordingly, the Company increased its advertising and promotion spend in key growth geographies by 5% compared to 2011. Total advertising and promotion investment as a percentage of sales 3.6% in 2012, compared to 4.1% in 2011.
4.1.4 Research and development
The year 2013
Research and development costs decreased from EUR 1,831 million in 2012 to EUR 1,733 million in 2013. 2013 included EUR 15 million of restructuring and acquisition-related charges, compared to EUR 57 million in 2012. As a percentage of sales, research and development costs decreased from 7.8% in 2012 to 7.4%. The year-on-year decrease was largely attributable to currency effects and lower restructuring charges.
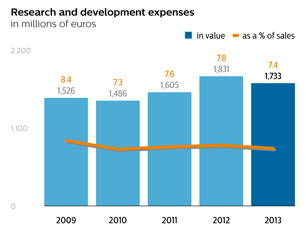
Research and development costs within Healthcare decreased by EUR 43 million, mainly due to lower restructuring activities at Imaging Systems and Patient Care and Clinical Informatics. At Lighting, research and development costs decreased by EUR 21 million,
Annual Report 2013 55
4 Group performance 4.1.5 - 4.1.5
primarily in the conventional businesses within Light Sources & Electronics. At Consumer Lifestyle, research and development spending was EUR 10 million higher than in 2012, mainly in Health & Wellness. In Innovation, Group & Services, research and development expenses decreased by EUR 44 million, due to lower restructuring, productivity savings as well as lower costs at Intellectual Property & Standards.
Research and development expenses per sector
in millions of euros
| 2011 | 2012 | 2013 | ||||||||||
Healthcare | 754 | 823 | 780 | |||||||||
Consumer Lifestyle | 249 | 251 | 261 | |||||||||
Lighting | 416 | 462 | 441 | |||||||||
Innovation, Group & Services | 186 | 295 | 251 | |||||||||
|
| |||||||||||
Philips Group | 1,605 | 1,831 | 1,733 | |||||||||
The year 2012
Research and development costs increased from EUR 1,605 million in 2011 to EUR 1,831 million in 2012. The year-on-year increase was largely attributable to higher investments in growth and innovation, including an increased focus on new value spaces. As a percentage of sales, research and development costs increased from 7.6% in 2011 to 7.8%.
Research and development costs within Healthcare increased by EUR 69 million, mainly at Imaging Systems and Home Healthcare Solutions. At Lighting, research and development costs increased by EUR 46 million, primarily at Lumileds and our Controls business within Professional Lighting Solutions. At Consumer Lifestyle, research and development spending was EUR 2 million higher than in 2011. In Innovation, Group & Services, R&D expenses increased by EUR 109 million, driven by investments in new value spaces as well as innovation and design initiatives.
4.1.52.1.5 Pensions
The year 20132016
In 2013,2016, the total costs of post-employment benefits amounted to EUR 29453 million for defined-benefit plans and EUR 139382 million for defined-contribution plans, compared to EUR 289559 million and EUR 139293 million respectively in 2012.2015.
The above costs are reported in operating expensesIncome from operations except for the included net interest cost component which is reported in financialFinancial expense. The net interest cost for defined-benefit plans was EUR 66 million in 2016 (2015: EUR 72 million).
2016 included a legal claim settlement gain of EUR 46 million related to the UK pension plan, a EUR 8 million settlement gain related tode-risking actions in the US and a combined settlement loss of EUR 2 million in other countries. Past-service cost gains of EUR 8 million were recognized in 2016 relating to a number of small plan changes.
2015 included settlement costs of EUR 329 million mainly related to the settlement of the UK plan, results of otherde-risking actions in the UK prior to the settlement and the settlement of parts of the US pension plan. Past-service costs of EUR 14 million were recognized related tode-risking actions taken in the UK prior to the settlement of the plan, including a past-service cost for GMP Equalization in the same UK plan. Some smaller plan changes in other countries resulted in a small past-service cost gain.
In 2015, the total costs of post-employment benefits amounted to EUR 559 million for defined-benefit plans and EUR 293 million for defined-contribution plans, compared to EUR 241 million and EUR 144 million respectively in 2014.
The overall funded status improved in 2016, mainly due to contributions of EUR 250 million in the US, partly offset by an increase of the defined-benefit obligation due to lower discount rates. The pension deficit recognized in the balance sheet decreased for the same reasons.
For further information, refer tonote 20, Post-employment benefits.
The year 2015
In 2015, the total costs of post-employment benefits amounted to EUR 559 million for defined-benefit plans and EUR 293 million for defined-contribution plans, compared to EUR 241 million and EUR 144 million respectively in 2014.
The above costs are reported in Operating expenses except for the net interest cost component which is reported in Financial income and expense. The net interest cost for defined-benefit plans was EUR 7172 million in 2013 (2012:2015 (2014: EUR 8559 million).
20132015 included settlement costs of EUR 329 million and past-service costs of EUR 14 million were recognized related tode-risking actions taken in the UK prior to the settlement of the plan, including a past-service cost for GMP Equalization in the same UK plan. Some smaller plan changes in other countries resulted in a small past-service cost gain. Due to the above, and the change to defined-contribution accounting for the Dutch pension plan, which is explained in thenote 20, Post-employment benefits, the Company’s Defined Benefit Obligation decreased from EUR 27 billion to EUR 4.5 billion at the end of 2015.
2014 included past-service cost gains in the Netherlands of EUR 8167 million, which included EUR 78 millionwere mainly related to the announced freeze of accrual after December 31, 2015 for salaried workersmandatory plan change in the Company’s US defined-benefit pension plan. In the same US planNetherlands, where a settlement losssalary cap of EUR 31 million was recognized in 2013 following a lump-sum offering100,000 must be applied to terminated vested employees. This offering resulted in settling the pension obligations towards these employees. The past-service cost gain is allocated to the respective sectors of the US employees involved whereas the settlement loss is allocated fully to Pensions in IG&S as it related to inactive employees.
In 2012, past-service cost gains of EUR 31 million were recognized of which EUR 25 million in the Dutch pension plan due to a restructuring. In one ofsalary with effect from January 1, 2015. This change lowers the Company’s defined-benefit retiree medical plans,Defined Benefit Obligation, which is recognized as a past-service cost gain of EUR 25 million was recognized due to a benefit change.gain. Compensatory measures are given in wages for employees impacted.
The overall funded status in 2015 decreased as the surpluses of our defined-benefitthe Dutch and UK plans were no longer included due to their settlements in 2015. The pension plans in 2013 was comparable to that of 2012. The deficits recognized on ourin the balance sheet decreased by approximately EUR 400 millionmainly due to a higher discount ratethe above mentionedde-risking actions in the US, cash contributions and the US events described above.US. The surpluses of the Dutch and UK plans were not recognized in the Netherlands and UK decreased, but as Philips does not recognize a surplus in these countries, the net balance sheet position wasdue to the asset ceiling test and therefore their settlement did not impacted.impact the pension balances as per the Company’s accounting policy.
In 2013, major progress was made in managing the financial exposure to defined-benefit plans, such as the changes in the funding of the Dutch pension plan, the changes in the US plan as described above, and a buy-in in the UK plan.
24 Annual Report 2016
Group performance 2.1.6
For further information, refer tonote 30,20, Post-employment benefits.benefits.
The year 2012
In 2012, the total costs of post-employment benefits amounted to EUR 289 million for defined benefit plans and EUR 139 million for defined contribution plans, compared to EUR 248 million and EUR 117 million respectively in 2011.
56 Annual Report 2013
4 Group performance 4.1.6 - 4.1.6
The funded status of our defined-benefit plans improved in 2012, in spite of decreasing discount rates and improved life expectancy assumptions in the Netherlands and UK plans. The surpluses of the plans in the Netherlands and UK increased, but Philips does not recognize the surplus in these countries, the net balance sheet position was not impacted.
In 2012, past-service cost gains of EUR 31 million were recognized of which 25 million in the Dutch pension plan due to a restructuring. In one of the Company’s defined-benefit retiree medical plans, a past service cost gain of EUR 25 million was recognized due to a benefit change.
In 2011, the company recognized a past-service cost gain of EUR 40 million, including a EUR 19 million curtailment gain.
For further information, refer to note 29, Post-employment benefits
4.1.62.1.6 Restructuring and impairment charges
The year 20132016
In 2013, IFO2016, income from operations (EBIT) included net charges totaling EUR 101173 million for restructuring. In addition to the annual goodwill-impairment tests for Philips, trigger-based impairment tests were performed during the year, resulting in a goodwill impairment of EUR 263 million.
In 2015, income from operations (EBIT) included net charges totaling EUR 171 million at Consumer Luminaires, mainly as a consequence of reduced growth rates resulting from a slower-than-anticipated recovery of certain markets, as well as delays infor restructuring and the introduction of new product ranges.goodwill impairment was nil.
2012 included EUR 511 million of restructuring charges.
For further information on sensitivity analysis, please refer tonote 11, Goodwill.
GoodwillRestructuring and related charges.
in millions of euros
| 2011 | 2012 | 2013 | ||||||||||
Restructuring and related charges per sector: | ||||||||||||
Healthcare | 3 | 116 | (6 | ) | ||||||||
Consumer Lifestyle | 5 | 38 | 10 | |||||||||
Lighting | 54 | 301 | 94 | |||||||||
Innovation, Group & Services | 23 | 56 | 3 | |||||||||
|
| |||||||||||
Continuing operations | 85 | 511 | 101 | |||||||||
Discontinued operations | 18 | 29 | 16 | |||||||||
Cost breakdown of restructuring and related charges: | ||||||||||||
Personnel lay-off costs | 105 | 423 | 103 | |||||||||
Release of provision | (44 | ) | (35 | ) | (64 | ) | ||||||
Restructuring-related asset impairment | 10 | 66 | 36 | |||||||||
Other restructuring-related costs | 14 | 57 | 26 | |||||||||
|
| |||||||||||
Continuing operations | 85 | 511 | 101 | |||||||||
Discontinued operations | 18 | 29 | 16 | |||||||||
In 2013,2016, the most significant restructuring projects were mainly related to Lighting and HealthTech Other. Restructuring projects at HealthTech Other were driven bymainly to overhead cost reduction programs and took place in the industrial footprint rationalization.Netherlands. Restructuring projects at Lighting centered on Luminaires businesseswere related to manufacturing footprint rationalization and Light Sources & Electronics,simplification of the largest of whichbusiness structure, and mainly took place in the United States, France and Belgium. Innovation, Group & Services restructuring projects mainly focused on the Financial Operations Service Unit, primarily in Italy, France and the United States. Consumer Lifestyle restructuring charges mainly related to Personal Care (primarily in the Netherlands and Austria) and Coffee (mainly Italy).
In 2012,2015, the most significant restructuring projects were related to Lighting, and Healthcare and were driven by Accelerate! transformation program. Restructuring projects at Lighting centered on LuminairesDiagnosis & Treatment businesses and Light Sources & Electronics, the largest of which took place in the Netherlands, Germany and various locations in the United States. In Healthcare, the largest projects were undertaken at Imaging Systems and PatientConnected Care & ClinicalHealth Informatics in various locations in the United States, to reduce operating costs and simplify the organization. Innovation, Group & Services restructuring projects focused on the IT and Financial Operations Service Units (primarily in the Netherlands), Group & Regional Overheads (mainly in the Netherlands and Italy) and Philips Innovation Services (in the Netherlands and Belgium). Consumer Lifestyle restructuring charges mainly related to Coffee (mainly Italy) and Health & Wellness (in the United States).businesses.
Annual Report 2013 57
4 Group performance 4.1.7 - 4.1.7
For further information on restructuring, refer tonote 21, Provisions.19, Provisions.
Philips Group
Restructuring and related charges in millions of EUR
2014 - 2016
|
| |||||||||||
| 2014 | 2015 | 2016 | ||||||||||
|
| |||||||||||
Restructuring and related charges per segment: | ||||||||||||
Personal Health | 16 | 38 | 16 | |||||||||
Diagnosis & Treatment | 47 | 25 | 6 | |||||||||
Connected Care & Health Informatics | 31 | 37 | 9 | |||||||||
HealthTech Other | 58 | (20 | ) | 27 | ||||||||
Lighting | 262 | 90 | 115 | |||||||||
Legacy Items | — | 1 | — | |||||||||
|
| |||||||||||
Continuing operations | 414 | 171 | 173 | |||||||||
Discontinued operations | 18 | 5 | 5 | |||||||||
Cost breakdown of restructuring and related charges: | ||||||||||||
Personnellay-off costs | 354 | 194 | 158 | |||||||||
Release of provision | (36 | ) | (88 | ) | (61 | ) | ||||||
Restructuring-related asset impairment | 57 | 46 | 38 | |||||||||
Other restructuring-related costs | 39 | 19 | 38 | |||||||||
|
| |||||||||||
Continuing operations | 414 | 171 | 173 | |||||||||
Discontinued operations | 18 | 5 | 5 | |||||||||
|
| |||||||||||
The year 20122015
2012In 2015, income from operations (EBIT) included net charges totaling EUR 511171 million offor restructuring. In addition to the annual goodwill impairmentgoodwill-impairment tests for Philips, trigger-based impairment tests were performed during the year, resulting in noa goodwill impairment.impairment of nil.
In 2014, income from operations (EBIT) included EUR 414 million of restructuring charges and a goodwill impairment of EUR 2 million at Lighting and EUR 1 million in the Connected Care & Health Informatics segment.
For further information on sensitivity analysis, please refer tonote 11, Goodwill.Goodwill.
In 2012,2015, the most significant restructuring projects were related to Lighting, Diagnosis & Treatment businesses and HealthcareConnected Care & Health Informatics businesses and were driven by Accelerate! transformationindustrial footprint rationalization and the overhead cost reduction program. Restructuring projects at Lighting centered on Luminaires businessesthe declining conventional lamps industry and Light Sources & Electronics,Professional, the largest of which took place in the Netherlands, GermanyFrance and various locationsIndonesia. Restructuring projects in the US. In Healthcare,Diagnosis & Treatment businesses and Connected Care & Health Informatics businesses mainly took place in the largestUS and France. Personal Health restructuring projects were undertaken at Imaging Systems and Patient Care & Clinical Informatics,mainly in various locations, in the United States to reduce operating costs and simplify the organization. Innovation, Group & Services restructuring projects focused on the IT and Financial Operations Service Units (primarily in the Netherlands), Group & Regional Overheads (mainly in the Netherlands and Italy) and Philips Innovation Services (in the Netherlands and Belgium). Consumer Lifestyle restructuring charges mainly related to Coffee (mainly Italy) and Health & Wellness (in the United States).Italy.
In 2011,2014, the most significant restructuring projects were related to Lighting and Innovation, Group & ServicesHealthTech Other and were mainly driven by Accelerate! transformationindustrial footprint rationalization and the overhead cost reduction program. Restructuring projects at Lighting centered on Luminaires businessesProfessional and Light Sources & Electronics,Home, the largest of which took place in Belgium, the Netherlands Brazil and in the United States. Innovation, Group & ServicesFrance. HealthTech Other restructuring projects focused on the Global Service Units (primarily in the Netherlands), Corporate and Country Overheads (mainly in the Netherlands, Brazil and Italy) and Philips Design (the Netherlands). At Healthcare, the largest projects were undertaken at Imaging Systems, Home Healthcare Solutions and Patient Care & Clinical Informatics, in various locations in the United States to reduce operating costs and simplify the organization. Consumer Lifestyle restructuring charges mainly related to IT and group and country overheads and centered primarily on the remaining Television operationsNetherlands, the US and Belgium. Restructuring projects in Europe.the Diagnosis & Treatment businesses and Connected Care & Health Informatics businesses mainly took place in the US and the Netherlands. Personal Health restructuring projects were mainly in the Netherlands.
4.1.7For further information on restructuring, refer tonote 19, Provisions.
2.1.7 Financial income and expenses
The year 20132016
A breakdown of Financial income and expenses is presented in the table below.
Annual Report 2016 25
Group performance 2.1.8
Philips Group
Financial income and expenses
in millions of eurosEUR
2014 - 2016
|
| |||||||||||||||||||||||
| 2014 | 2015 | 2016 | ||||||||||||||||||||||
| 2011 | 2012 | 2013 |
|
| ||||||||||||||||||||
Interest expense (net) | (302 | ) | (325 | ) | (268 | ) | (251 | ) | (302 | ) | (327 | ) | ||||||||||||
Sale of securities | 51 | 1 | — | 60 | 20 | 3 | ||||||||||||||||||
Impairments | (34 | ) | (8 | ) | (10 | ) | (17 | ) | (46 | ) | (27 | ) | ||||||||||||
Other | (46 | ) | 3 | (52 | ) | (93 | ) | (41 | ) | (142 | ) | |||||||||||||
|
|
|
| |||||||||||||||||||||
Financial income and expenses | (301 | ) | (369 | ) | (493 | ) | ||||||||||||||||||
| (331 | ) | (329 | ) | (330 | ) |
|
| |||||||||||||||||
The netNet interest expense in 20132016 was EUR 5725 million lowerhigher than in 2012,2015, mainly as a result of lowerdriven by higher interest expense resulting from higher average outstanding debt and interest relateddebt.
Impairments amounted to pensions in 2013.EUR 27 million, mainly due to Corindus Vascular Robotics.
Other financial income was aexpense amounted to EUR 52142 million loss in 2013,2016, primarily consisting of a EUR 25 million accretion expense (mainly associated with discounted provisions) and EUR 24 million of other financing charges.
Other financial income was a EUR 3 million gain in 2012, primarily consisting of a EUR 46 million gaincharges related to a changethe early redemption of USD bonds in estimate on the valuation of long-term derivative contractsOctober 2016 and remaining other financial income of EUR 20 million. This was offset by a EUR 22 million accretion expense (mainly associated with discounted provisions) and EUR 41 million other financing charges.January 2017.
Impairments
in millions of euros
| 2011 | 2012 | 2013 | ||||||||||
TPV | (25 | ) | — | — | ||||||||
Chi-Mei Innolux | (4 | ) | (1 | ) | (1 | ) | ||||||
BG Medicine | (2 | ) | (1 | ) | (1 | ) | ||||||
Prime Technology | (1 | ) | — | — | ||||||||
Tendris | — | (5 | ) | (1 | ) | |||||||
Gilde III | — | (1 | ) | (2 | ) | |||||||
Lighting Science Group | — | — | (3 | ) | ||||||||
Other | (2 | ) | — | (2 | ) | |||||||
|
| |||||||||||
| (34 | ) | (8 | ) | (10 | ) | |||||||
58 Annual Report 2013
4 Group performance 4.1.8 - 4.1.9
Impairment charges in 2013 amounted to EUR 10 million, mainly from shareholdings in Lighting Science Group and Gilde III. In 2012, impairment charges amounted to EUR 8 million, mainly from shareholdings in Tendris.
For further information, refer tonote 4,7, Financial income and expenses.expenses.
The year 20122015
The netNet interest expense in 20122015 was EUR 2351 million higher than in 2011,2014, mainly asdue to a result of higher average outstanding debt.weaker euro against the US dollar in relation to interest expenses on USD bonds.
In 2012 there was a EUR 1 millionThe gain on the sale of securities. In 2011, income from the sale of securities totaled EUR 51 million, including a EUR 44 million gain on the sale of the remaining sharesstakes in TCL and a EUR 6 million gain on the sale of shares of Digimarc.
Impairment charges in 20122015 amounted to EUR 820 million, mainly from shareholdings in Tendris. In 2011, impairment chargesAssembléon Technologies B.V., Silicon & Software Systems and other equity interest.
Impairments amounted to EUR 3446 million mainly from shareholdings in TPV Technologies Ltd.due to valuation allowances.
Other financial income was aexpense amounted to EUR 341 million gain in 2012,2015, primarily consisting of a EUR 46 million gaininterest expense related to a changethe jury verdict in estimate on the valuation of long-term derivative contractsMasimo litigation, and remaining other financial income of EUR 20 million. This was offset by a EUR 22 million accretion expense (mainly associated with other discounted provisions) and EUR 41 million other financing charges.provisions.
Other financial expensesexpense amounted to EUR 93 million in 20112014, primarily consistedconsisting of a EUR 34 million other financing chargeinterest expense related to the jury verdict in the Masimo litigation, and a EUR 33 million accretion expense (mainly associated with other discounted provisions) offset by EUR 11 million dividend incomeprovisions and other financial income, including a net gain of EUR 6 million mostly from the revaluation impact of the option related to NXP.uncertain tax positions.
For further information, refer tonote 4,7, Financial income and expenses.expenses.
4.1.82.1.8 Income taxes
The year 20132016
Income taxes amounted to EUR 327 million, compared to EUR 239 million in 2015. The effective income tax rate in 2016 was 23.5%, compared to 38.4% in 2015. The decrease was largely due to a change in the geographical mix of actual profits andone-off tax benefits in 2016 mainly relating to recognition of deferred tax assets.
For 2017, we expect our effective tax rate to be around 30%. However, the actual rate will depend on the geographical mix of profits.
For further information, refer tonote 8, Income taxes.
The year 2015
Income taxes amounted to EUR 466239 million, compared to EUR 18526 million in 2012. The effective income tax rate was 28.1%, compared to 58.0% in 2012. Excluding the non-tax-deductible European Commission fine and charges related to various legal matters in 2012, the effective tax rate in 2012 was 25.5%. The 2.6 percentage points increase in 2013 was mainly related to a higher weighted average statutory income tax rate in 2013 due to a change in the country mix of profit and loss, which was partly offset by lower valuation allowances.
For 2014, the effective tax rate excluding incidental non-taxable items is expected to be between 30% and 32%.
For further information, refer to note 5, Income taxes.
The year 2012
Income taxes amounted to EUR 185 million, compared to EUR 251 million in 2011. The year-on-year decrease was largely attributable to lower incidental tax expenses.
The tax burden in 2012 corresponded to an effective income tax rate of 58.0%, compared to negative 31.0% in 2011. In 2011, the negative effective income tax rate was attributable to goodwill impairment losses of EUR 1,355 million, which were largely non-tax-deductible.2014. The effective income tax rate in 2012 included2015 was 38.4%, compared to 14.1% in 2014. The increase was mainly due to a significant change in the impactgeographical mix of actual profits and the non-tax-deductibleabsence of various items that reduced the charge of EUR 509 million arising fromin the European Commission fine. Excluding the European Commission fine and charges relatedprior year, in particular favorable tax regulations relating to various legal mattersR&D investments in 2012, the effective tax rate in 2012 was 25.5%.
For further information, refer to note 5, Income taxes.2014.
4.1.92.1.9 Results of investments in associates
The year 20132016
Results related to investments in associates decreased from a gain of EUR 30 million in 2015 to a gain of EUR 13 million in 2016, mainly reflecting the proceeds from the sale of Assembléon Technologies B.V. in 2015.
For further information, refer tonote 5, Interests in entities.
The year 2015
The results related to investments in associates improveddecreased from a lossgain of EUR 21162 million in 20122014 to a lossgain of EUR 2530 million in 2013, largely attributable to2015. 2015 included proceeds from the sale of Assembléon Technologies B.V., while 2014 included a charge of EUR 19632 million dilution gain related to the former LG.Philips Displays joint venturePhilips’ stake in 2012.Corindus Vascular Robotics.
The European Commission imposed fines in relation to alleged violations of competition rules in the Cathode-Ray Tube industry. Philips recorded a total charge of EUR 509 million, of which EUR 313 million was directly related to Philips and therefore recorded in Income from operations, while EUR 196 million related to LG.Philips Displays and was therefore recorded in Results of investments in associates.
Annual Report 2013 59
4 Group performance 4.1.10 - 4.1.11
Results of investments in associates
in millions of euros
| 2011 | 2012 | 2013 | ||||||||||
Company’s participation in income | 18 | (5 | ) | 5 | ||||||||
Investment impairment and other charges | (3 | ) | (206 | ) | (30 | ) | ||||||
|
| |||||||||||
| 15 | (211 | ) | (25 | ) | ||||||||
The Company’s participation in income increaseddecreased from a loss of EUR 530 million in 20122014 to a gain of EUR 510 million in 2013.2015. The gain in 20132015 was mainly attributable to the results of Philips Medical Capital, while the loss in 2012 was mainly due to the results of EMGO.Capital.
For further information, refer to note 6, Interests in entities.2.1.10Non-controlling interests
The year 20122016
Net income attributable tonon-controlling interests increased from EUR 14 million in 2015 to EUR 43 million in 2016, mainly as a result of the sale of the 28.775% minority interest in Philips Lighting.
The results relatedyear 2015
Net income attributable to investments in associates declined from incomenon-controlling interests amounted to a gain of EUR 1514 million in 20112015, compared to a loss of EUR 211 million in 2012, largely attributable to a charge of EUR 196 million related to the former LG.Philips Displays joint venture.
The European Commission imposed fines in relation to alleged violations of competition rules in the Cathode-Ray Tube industry. Philips recorded a total charge of EUR 509 million, of which EUR 313 million was directly related to Philips and therefore recorded in Income from operations, while EUR 196 million related to LG.Philips Displays and was therefore recorded in Results of investments in associates.
The Company’s participation in income decreased from EUR 18 million in 2011 to negative EUR 5 million in 2012. The loss in 2012 was mainly attributable to the results of EMGO, while the income in 2011 was mainly due to the results of Intertrust.
For further information, refer to note 6, Interests in entities.
4.1.10 Non-controlling interests
The year 2013
Net income attributable to non-controlling interests amounted to EUR 3 million in 2013, compared to EUR 5 million in 2012.
The year 2012
Net income attributable to non-controlling interests amounted to EUR 5 million in 2012, compared to EUR 4 million in 2011.2014.
4.1.112.1.11 Discontinued operations
The year 20132016
Discontinued operations consist primarily of the combined businesses of Lumileds and Automotive, the Audio, Video, Multimedia and& Accessories (AVM&A) business, the Television business, and certain divestments formerly reported as discontinued operations. The results related to these businesses are reported under Discontinued operations in the Consolidated statements of income and Consolidated statements of cash flows.
Philips had reached an agreement to transfer the AVM&A business to Funai Electric Co. Ltd in Q1 2013. This agreement was terminated on October 25, 2013. Since then, Philips has received expressions of interest in the business from various parties and has been actively discussing the sale of the business with potential buyers. In the meantime, the AVM&A business operates as a standalone entity named WOOX Innovations.
The Television business was divested as part of a strategic partnership agreement with TPV Technology Ltd (TPV) that was signed on April 1, 2012. Philips retained a 30% interest in TP Vision Holdings BV (TP Vision venture). On January 20, 2014, Philips announced that it has signed a term sheet to transfer the remaining 30% stake in TP Vision to TPV.
After completion, TPV will fully own TP Vision, which will enable further integration with TPV’s TV business.
Income from discontinued operations decreased by EUR 45 million to EUR 2 million in 2013. The decrease was mainly attributable to lower operational results and higher disentanglement costs in the AVM&A business. In 2012, income from discontinued operations of EUR 47 million was composed of EUR 78 million of net income related to AVM&A, partly offset by a EUR 31 million net loss related to the Television business.
For further information, refer to note 7, Discontinued operations and other assets classified as held for sale.
The year 2012
Discontinued operations consist of the Audio, Video, Multimedia and Accessories (AVM&A) business, the Television business and certain divestments formerly reported as discontinued operations. The results related to these businesses are reported under Discontinued operations in the Consolidated statements of income and Consolidated statements of cash flows.
6026 Annual Report 20132016
4 Group performance 4.1.12 - 4.1.132.1.12
In 2012,2014, Philips announced the start of the process to combine the Lumileds and Automotive Lighting businesses into a stand-alone company and explore strategic options to attract capital from third-party investors for this combined business.
In January 2016, Philips announced that the transaction with Go Scale Capital had been terminated despite efforts to mitigate the concerns of the Committee on Foreign Investment in the United States (‘CFIUS’).
Philips announced December 12, 2016 that it has signed an agreement to sell an 80.1% interest in Lumileds, a leading supplier of LED components and automotive lighting, to certain funds managed by affiliates of Apollo Global Management, LLC (NYSE: APO). Philips will retain the remaining 19.9% interest in Lumileds.
Philips Group
Net income of Discontinued operationsin millions of EUR unless otherwise stated
2014 - 2016
|
| |||||||||||
| 2014 | 2015 | 2016 | ||||||||||
|
| |||||||||||
The combined Lumileds and Automotive businesses | 141 | 246 | 282 | |||||||||
Other | 49 | (1 | ) | 134 | ||||||||
|
| |||||||||||
Net income of Discontinued operations | 190 | 245 | 416 | |||||||||
|
| |||||||||||
In 2016, income from discontinuedDiscontinued operations increased by EUR 171 million to EUR 416 million. Theyear-on-year increase was mainly due to improved results of the combined Lumileds and Automotive businesses, which were driven by higher sales and improvements in Gross margin, and the Funai arbitration award of EUR 47144 million, included EUR 78 million of net income related to AVM&A, partly offset by a EUR 31 million net loss related to the Television business. In 2011, income from discontinued operations amounted to a loss of EUR 410 millionwhich includes disbursements and was primarily composed of EUR 78 million of net income related to AVM&A, offset by a EUR 515 million net loss related to the Television business. The net loss in the Television business was composed of a EUR 353 million transaction loss recorded on the sale of the business,interest as well as net operational losses of EUR 162 million.compensation for damages.
For further information, refer tonote 7,3, Discontinued operations and other assets classified as held for sale.
sale4.1.12 Net income.
The year 20132015
In 2015, income from discontinued operations increased compared to 2014 by EUR 55 million to EUR 245 million. Theyear-on-year increase was mainly due to the positive impact from the treatment of depreciation and amortization of assets held for sale of the combined Lumileds and Automotive businesses.
For further information, refer tonote 3, Discontinued operations and other assets classified as held for sale.
2.1.12 Net income
Net income is not allocated to segments as certain income and expense line items are monitored on a centralized basis.
The year 2016
Net income increased from a net loss of EUR 30659 million in 20122015 to a net profit of EUR 1,1721,491 million in 2013.2016. The increase was largely due to higher income from operations (EBIT) of EUR 1,343890 million and net income from Discontinued operations of EUR 171 million, partly offset by higher financial charges of EUR 124 million, higher IFOincome tax charges of EUR 88 million and better results relating toEUR 17 million lower net income from investments in associatesassociates.
Basic earnings per common share from net income attributable to shareholders increased from EUR 0.70 per common share in 2015 to EUR 1.58 per common share in 2016.
The year 2015
Net income increased from EUR 411 million in 2014 to EUR 659 million in 2015. The increase was largely due to higher income from operations (EBIT) of EUR 186506 million and net income from Discontinued operations of EUR 55 million, partly offset by higher income tax charges of EUR 281213 million and lower results from investments in associates of EUR 32 million.
Basic earnings per common share from net income attributable to shareholders increased from negative EUR 0.040.45 per common share in 20122014 to EUR 1.280.70 per common share in 2013.2015.
The year 2012
Net income increased from a loss of EUR 1,456 million in 2011 to a loss of EUR 30 million in 2012. The increase was largely due to EUR 1,127 million higher IFO, EUR 457 million lower costs related to discontinued operations and lower income tax of EUR 66 million, partly offset by lower results relating to investments in associates of EUR 226 million.
Basic earnings per common share from net income increased from negative EUR 1.53 per common share in 2011 to negative EUR 0.04 per common share in 2012.
4.1.132.1.13 Acquisitions and divestments
Acquisitions
In 2013, there were four minor acquisitions.2016, Philips completed two acquisitions, the largest being Wellcentive, a leadingUS-based provider of population health management software solutions. Acquisitions in 20132016 and previousprior years led to post-merger integration charges totalingof EUR 1631 million in 2013: Healthcare EUR 6 million, Consumer Lifestylethe Diagnosis & Treatment businesses, EUR 4 million in the Connected Care & Health Informatics businesses and Lighting EUR 6 million.3 million in Lighting.
In 2012,2015, Philips completed four acquisitions, the acquisitionlargest being Volcano Corporation, an image-guided therapy company based in the United States, and Blue Jay Consulting, a leading provider of Indal within Lighting.hospital emergency room consulting services. Acquisitions in 20122015 and previousprior years led to post-merger integration charges totalingof EUR 50107 million, mainly in the Diagnosis & Treatment businesses, and EUR 5 million in 2012: Healthcare EUR 18 million, Consumer Lifestyle EUR 18 million, and Lighting EUR 14 million.Lighting.
In 2011, we completed six acquisitions. Healthcare acquisitions included Sectra, AllParts Medical and Dameca. Within Consumer Lifestyle, Philips completed the acquisition of Preethi and Povos. Within Lighting,2014, Philips acquired Optimum Lighting.Unisensor, a Danish healthcare company, and a 51% interest in General Lighting Company (GLC) based in the Kingdom of Saudi Arabia. Philips also purchased some minor magnetic resonance imaging (MRI) activities from Hologic, a US healthcare company. Acquisitions in 20112014 and previousprior years led to post-merger integration charges totalingof EUR 741 million in 2011: Healthcarethe Diagnosis & Treatment businesses, EUR 171 million Consumer Lifestylein the Personal Health businesses and EUR 4519 million and Lighting EUR 12 million.in Lighting.
Divestments
During 2013,In 2016, Philips completed six divestments, mainly several small businesses within Lighting.
Annual Report 2016 27
Group performance 2.1.13
In 2015, Philips completed seven divestments, which included, the sale of Assembléon Holding B.V., OEM Remote Controls, Axsun Technologies LLC, and several small businesses within the HealthTech portfolio and Lighting.
In 2014, Philips completed the divestment of its Lifestyle Entertainment activities to Gibson Brands Inc. Philips also completed two other divestments of business activities mainlywhich related to certain Healthcarethe HealthTech portfolio and Lighting activities.
During 2012, Philips completed several divestments of business activities, namely the Television business (for further information see note 7, Discontinued operations and other assets classified as held for sale), certain Lighting manufacturing activities, Speech Processing activities and certain Healthcare service activities. The Speech Processing activities were sold to Invest AG, in line with our strategy.
In 2012, Philips agreed to extend its partnership with Sara Lee Corp (Sara Lee) to drive growth in the global coffee market. Under a new exclusive partnership framework, which will run through to 2020, Philips will be the exclusive Senseo consumer appliance manufacturer and distributor for the duration of the agreement. As part of the agreement, Philips divested its 50% ownership right in the Senseo trademark to Sara Lee.
In 2011, Philips completed several divestments, of which Assembléon was the most significant. Philips sold 80% of the shares in Assembléon to H2 Equity Partners, an Amsterdam-based private equity firm, for a consideration of EUR 14 million.
For details, please refer tonote 9,4, Acquisitions and divestments.
Annual Report 2013 61
4 Group performance 4.1.14 - 4.1.15
divestments.
4.1.142.1.14 Performance by geographic cluster
The year 20132016
In 2013,2016, sales grewincreased 1% nominally, largely due to unfavorable foreign exchange impacts, and 3% on a comparable basis (-1% nominally)1), driven by 5% comparable sales growth at Consumer Lifestyle, notably1) in growth geographies.the HealthTech portfolio.
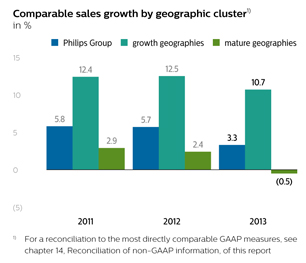
Sales in mature geographies were EUR 582312 million lowerhigher than in 2012,2015, or 1% lower2% higher on both a nominal and comparable basis.basis1). Sales in Western Europe were impacted by macroeconomic developments2% higher than in 2015, with growth in the Diagnosis & Treatment businesses and were flat on a comparable basis. Growth at Lighting and Consumer Lifestyle wasPersonal Health businesses, partly offset by a decline at Healthcare.in the Connected Care & Health Informatics businesses and Lighting. Sales in North America declinedincreased by EUR 429166 million, or 2% lower on a comparable basis mainly due to declines at Healthcare and Lighting. Both nominal and comparable1). Comparable sales1) in other mature geographies showed strong growth. Comparable salesa 2% increase, with growth in other mature geographies showed mid-single-digit growth, mainly driven by strong performance at Consumer Lifestylethe Connected Care & Health Informatics businesses and Healthcare.Personal Health businesses, while Diagnosis & Treatment businesses declined 1% and Lighting was in line with 2015.
In growth geographies, sales grew by EUR 454 million, or 11%were flatyear-on-year on a nominal basis. The 5% increase on a comparable basis1) reflected double-digit growth in the Diagnosis & Treatment businesses, high-single-digit growth in the Personal Health businesses and low-single-digit growth in the Connected Care & Health Informatics businesses, partly offset by alow-single digit decline at Lighting. The increase was driven by double-digit growth at Consumer Lifestyle and Lighting. In China andin Central & Eastern Europe, high-single-digit growth in Latin America we achieved solid double-digit nominal and comparable growth.mid-single-digit growth in China, partly offset by amid-single-digit decline in Middle East & Turkey.
Philips Group
Comparable sales growth by geographic cluster1)in %
2014 - 2016
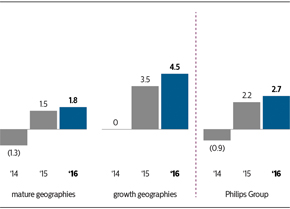
| 1) | Non-GAAP financial measure. For the definition and reconciliation to the most directly comparable GAAP measure, refer tochapter 4, Reconciliation ofnon-GAAP information, of this report. |
Philips Group
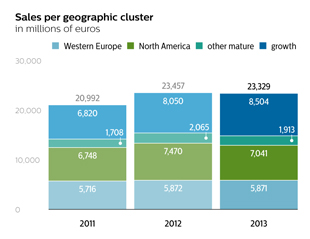
2014 - 2016
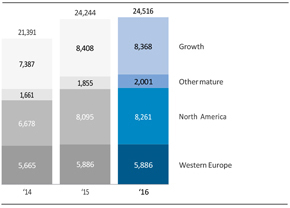
The year 20122015
In 2012,2015, sales grew 6%increased 13% nominally, largely due to favorable foreign exchange impacts, and 2% on a comparable basis (12% nominally)1), driven by growth at Consumer Lifestylethe Diagnosis & Treatment businesses and Healthcare, notably in growth geographies.Personal Health businesses.
Sales in mature geographies were EUR 1,2351,832 million higher than in 2011,2014, 13% higher on a nominal basis or 2%1% higher on a comparable basis.basis1). Sales in Western Europe were impacted by macroeconomic developments, resulting4% higher in a 1% decline in comparable sales, attributable to Lighting and Healthcare. On a nominal basis sales in Western Europe were EUR 156 millionor 1% higher than in 2011, driven2014 on a comparable basis1), with growth in the Personal Health businesses, Diagnosis & Treatment businesses and Connected Care & Health Informatics businesses partly offset by the acquisition of Indal ina decline at Lighting. Sales in North America wereincreased by EUR 7221,417 million, higher,21% on a nominal basis or 3% higher1% on a comparable basis driven by single-digit growth in all sectors. Both nominal and comparable sales1). Sales in other mature geographies showed strong growth. Comparable salesposted a 12% increase on a nominal basis. The 3% increase on a comparable basis1), was driven by the growth in other mature geographies showed double-digit growththe Diagnosis & Treatment businesses and Personal Health businesses partly offset by a decline at Consumer Lifestyle andConnected Care & Health Informatics businesses, while Lighting while Healthcare recorded high-single-digit growth.was in line with 2014.
| 1) | Non-GAAP financial measure. For the definition and reconciliation to the most directly comparable GAAP measure, refer tochapter 4, Reconciliation ofnon-GAAP information, of this report. |
28 Annual Report 2016
Group performance 2.1.15
In growth geographies, sales grewincreased by EUR 1,2301,021 million, or 13%14% on a nominal basis. The 4% increase on a comparable basis1) was driven by double-digit growth in the Diagnosis & Treatment businesses and high-single-digit growth in the Personal Health businesses, partly offset by a high-single-digit decline in the Connected Care & Health Informatics businesses and amid-single-digit decline at HealthcareLighting. Double-digit growth in Central & Eastern Europe and Consumer Lifestyle. In China, all Sectors recorded solid double-digit nominalhigh-single-digit growth in Asia Pacific and comparable growth. SalesIndia were partly offset by flat growthyear-on-year in Russia & Central Asia also showed double-digit comparable sales growth, attributable to strong sales performance at Consumer Lifestyle and Healthcare.China.
4.1.15 Cash flows2.1.15 Net cash provided by (used for) continuing operations
The year 2013
Cash flows from operating activities2016
Net cash flow fromprovided by operating activities
Net cash provided by operating activities amounted to EUR 1,1381,904 million in 2013,2016, which iswas EUR 944737 million lowerhigher than in 2012. The decrease is2015, mainly a resultdue to higher earnings, net improvements in accounts payable, accrued liabilities and other current liabilities, receivables and other current assets and inventories related inflows and the higher outflows recorded in 2015 related to CRT litigation claims and pensionde-risking settlements.
Philips Group
Net cash provided by operating activities and net capital expendituresin millions of theEUR
2012 - 2016
62 Annual Report 2013
4 Group performance 4.1.15 - 4.1.15
payment of the European Commission fine, increased working capital usage and the payout of restructuring charges in 2013.
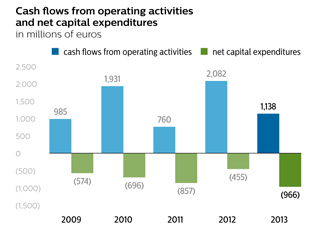
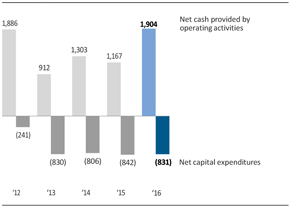
Condensed consolidated statements of cash flows for the years ended December 31, 2011, 20122014, 2015 and 20132016 are presented below:
Philips Group
Condensed consolidated cash flow statements1)
in millions of eurosEUR
2014 - 2016
| 2011 | 2012 | 2013 | ||||||||||
Cash flows from operating activities: | ||||||||||||
Net income (loss) | (1,456 | ) | (30 | ) | 1,172 | |||||||
Adjustments to reconcile net income to net cash provided by operating activities | 2,216 | 2,112 | (34 | ) | ||||||||
|
| |||||||||||
Net cash provided by operating activities | 760 | 2,082 | 1,138 | |||||||||
Net cash (used for) provided by investing activities | (1,275 | ) | (925 | ) | (997 | ) | ||||||
|
| |||||||||||
Cash flows before financing activities2) | (515 | ) | 1,157 | 141 | ||||||||
Net cash used for financing activities | (1,790 | ) | (293 | ) | (1,241 | ) | ||||||
|
| |||||||||||
Cash (used for) provided by continuing operations | (2,305 | ) | 864 | (1,100 | ) | |||||||
Net cash (used for) discontinued operations | (374 | ) | (126 | ) | (206 | ) | ||||||
Effect of changes in exchange rates on cash and cash equivalents | (7 | ) | (51 | ) | (63 | ) | ||||||
|
| |||||||||||
Total change in cash and cash equivalents | (2,686 | ) | 687 | (1,369 | ) | |||||||
Cash and cash equivalents at the beginning of year | 5,833 | 3,147 | 3,834 | |||||||||
|
| |||||||||||
Cash and cash equivalents at the end of year | 3,147 | 3,834 | 2,465 | |||||||||
|
| |||||||||||
| 2014 | 2015 | 2016 | ||||||||||
|
|
|
|
|
| |||||||
Net cash provided by operating activities | 1,303 | 1,167 | 1,904 | |||||||||
Net cash used for investing activities | (984 | ) | (1,941 | ) | (1,167 | ) | ||||||
Net capital expenditures | (806 | ) | (842 | ) | (831 | ) | ||||||
Other investing cash flows | (178 | ) | (1,099 | ) | (336 | ) | ||||||
Net cash provided by (used for) financing activities | (1,189 | ) | 508 | (420 | ) | |||||||
|
| |||||||||||
Net cash provided by (used for) continuing operations | (870 | ) | (266 | ) | 317 | |||||||
Net cash provided by (used for) Discontinued operations | 193 | 79 | 268 | |||||||||
Effect of changes in exchange rates on cash and cash equivalents | 85 | 80 | (17 | ) | ||||||||
|
| |||||||||||
Total change in cash and cash equivalents | (592 | ) | (107 | ) | 568 | |||||||
Cash and cash equivalents at the beginning of year | 2,465 | 1,873 | 1,766 | |||||||||
|
| |||||||||||
Cash and cash equivalents at the end of year | 1,873 | 1,766 | 2,334 | |||||||||
|
| |||||||||||
| 1) | Please refer tosection |
|
Cash flows fromNet cash used for investing activities
Other investing cash flows
In 2013,2016, acquisitions of businesses (including acquisition of investments in associates) amounted to a cash flows from investing activities resulted in a net outflow of EUR 997202 million. This was attributable
Net cash proceeds from divestment of businesses amounted to EUR 96631 million and were received mainly from divested businesses held for sale.
Net cash used foroutflow fromnon-current financial assets of EUR 45 million was mainly due to the acquisition of stakes in investment funds.
EUR 120 million net capital expenditures, EUR 101 million cash used for derivatives and current financial assets as well as EUR 24 million used for acquisitions of businesses and non-current financial assets, partly offset by EUR 94 million of net proceeds from divestments.
In 2012, cash flows from investing activities resulted in a net outflow of EUR 925 million. This was attributable to EUR 455 million cash used for net capital expenditures, EUR 261 million used for acquisitions, as well as a EUR 167 million outflow for financial assets, mainly due to loans providedEUR 132 million cash paid with respect to TPV and the TP Vision venture in connection with the divestment of the Television business (EUR 151 million in aggregate).
Net capital expendituresforeign exchange derivative contracts related to activities for liquidity management funding.
Net capital expenditures totaled EUR 966 million, which was EUR 511 million higher than in 2012, mainly reflecting the impact of proceeds received in 2012 from the sale of the High Tech Campus of EUR 425 million and the 2012 divestment of Philips’ 50% ownership right in the Senseo trademark to Sara Lee for EUR 170 million. Excluding these impacts in 2012, net capital expenditures were EUR 84 million lower than in 2012, mainly due to lower investments at Lighting.cash (used for) provided by financing activities
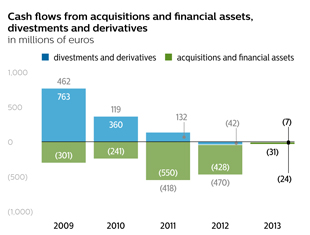
Acquisitions and financial assets
The net cash impact of acquisitions of businesses and financial assets in 2013 was a total of EUR 24 million. There was a EUR 11 million outflow for acquisitions of businesses and a EUR 13 million outflow for financial assets.
The net cash impact of acquisitions of businesses and financial assets in 2012 was a total of EUR 428 million, mainly related to the acquisition of Indal. The EUR 167
Annual Report 2013 63
4 Group performance 4.1.15 - 4.1.15
million outflow for financial assets mainly related to loans provided to TPV and the TP Vision venture in connection with the divestment of the Television business (EUR 151 million in aggregate).
Divestments and derivatives
Cash proceeds of EUR 94 million were received from divestments, mainly of non-strategic businesses within Healthcare. Cash flows from derivatives and current financial assets led to a net cash outflow of EUR 101 million.
In 2012, cash proceeds of EUR 4 million were received from divestments. Cash flows from derivatives and securities led to a net cash outflow of EUR 46 million.
Cash flows from financing activities
Net cash used for financing activities in 20132016 was EUR 1,241420 million. Philips’ shareholders were given EUR 678732 million in the form of a dividend, of which the cash portion of the dividend amounted to EUR 272330 million. The net impact of changes in debt was a decrease of EUR 407 million, including the redemption of a USD 143 million bond.377 million. Additionally, net cash outflows for share buybackbuy-back and share delivery totaled EUR 562526 million.
| 1) | Non-GAAP financial measure. For the definition and reconciliation to the most directly comparable GAAP measure, refer tochapter 4, Reconciliation of non-GAAP information, of this report. |
Annual Report 2016 29
Group performance 2.1.16
The year 2015
Net cash provided by operating activities
Net cash flow provided by operating activities amounted to EUR 1,167 million in 2015, which was EUR 136 million lower than in 2014, mainly due to pension settlement costs and CRT litigation claims, partly offset by higher earnings.
Net cash used for investing activities
Other investing cash flows
In 2015, acquisitions of businesses (including acquisition of investments in associates) amounted to a cash outflow of EUR 1,116 million which was mainly related to the acquisition of Volcano.
Net cash proceeds from divestment of businesses amounted to EUR 57 million and were received mainly from the divestment of Assembléon Holding B.V., the OEM remote control business and Axsun Technologies LLC.
Net cash inflow fromnon-current financial assets of EUR 32 million was mainly due to the sale of stakes in Silicon & Software Systems and other equity interest.
EUR 72 million net cash used for derivatives and current financial assets was mainly due to EUR 193 million cash paid with respect to foreign exchange derivative contracts related to activities for liquidity management funding, partially offset by EUR 121 million received with respect to current financial assets mainly related to TPV Technology Limited loans.
In 2014, acquisitions of businesses (including acquisition of investments in associates) amounted to a cash outflow of EUR 177 million which was mainly related to the acquisition of a 51% interest in the General Lighting Company (GLC) in the Kingdom of Saudi Arabia.
Net cash proceeds from divestment of businesses amounted to EUR (20) million which included the divestment of the Shakespeare business.
Net cash inflow fromnon-current financial assets of EUR 26 million was mainly due to the sale of stakes in Neusoft, Chimei Innolux, and Sapiens, partially offset by loans provided to TPV Technology Limited.
EUR 7 million net cash used for derivatives and current financial assets was mainly due to EUR 13 million cash paid with respect to foreign exchange derivative contracts related to activities for liquidity management funding.
Net cash provided by (used for) financing activities
Net cash provided by financing activities in 20122015 was EUR 293508 million. Philips’ shareholders were given EUR 687730 million in the form of a dividend, of which the cash portion of the dividend amounted to EUR 255298 million. The net impact of changes in debt was an increase of EUR 730 million, including the issuance of USD 1.5 billion in bonds, partially offset by the early redemption of a USD 500 million bond.1,231 million. Additionally, net cash outflows for sharebuy-back and share delivery totaled EUR 768425 million.
The year 2012
Cash flows from operating activities
Net cash flow from operating activities amounted to EUR 2,082 million in 2012, compared to EUR 760 million in 2011. The year-on-year improvement was largely attributable to lower working capital outflows, mainly related to accounts payable, as well as higher cash earnings. The increase in other current liabilities included a payable of EUR 509 million related to the European Commission fine. Excluding the fine payable, the increase in accounts payable and accrued and other current liabilities was attributable to increased volume from higher sales, while the outflow in 2011 was attributable to a tightening of vendor payments in the operating sectors.
Cash flows from investing activities
2012 cash flows from investing activities resulted in a net outflow of EUR 925 million. This was attributable to EUR 455 million cash used for net capital expenditures, EUR 261 million used for acquisitions, as well as a EUR 167 million outflow for financial assets, mainly due to loans provided to TPV and the TP Vision venture in connection with the divestment of the Television business (EUR 151 million in aggregate).
In 2011, cash flows from investing activities resulted in a net outflow of EUR 1,275 million. This was attributable to EUR 857 million cash used for net capital expenditures and EUR 550 million used for acquisitions, mainly for Povos, Preethi and Sectra. This was partly offset by EUR 106 million proceeds from the sale of financial assets and divestments, mainly TCL and Digimarc shares.
Net capital expenditures
Net capital expenditures totaled EUR 455 million, which was EUR 402 million lower than in 2011, mainly reflecting the impact of proceeds received from the sale of the High Tech Campus of EUR 425 million (consisting of a EUR 373 million cash transaction and an amount of EUR 52 million that will be received in future years) and the divestment of Philips’ 50% ownership right in the Senseo trademark to Sara Lee for EUR 170 million. Excluding these impacts, higher investments were visible in all sectors, notably additional growth-focused investments at Lighting.
Acquisitions and financial assets
The net cash impact of acquisitions of businesses and financial assets in 2012 was a total of EUR 428 million, mainly related to the acquisition of Indal. The EUR 167 million outflow for financial assets mainly related to loans provided to TPV and the TP Vision venture in connection with the divestment of the Television business (EUR 151 million in aggregate).
The net cash impact of acquisitions of businesses and financial assets in 2011 was a total of EUR 550 million, mainly related to the acquisitions of Povos, Preethi and Sectra.
Divestments and derivatives
In 2012, cash proceeds of EUR 4 million were received from divestments. Cash flows from derivatives and securities led to a net cash outflow of EUR 46 million.
In 2011, cash proceeds of EUR 106 million were received from divestments, including EUR 69 million from the sale of remaining shares in TCL, as well as divestments
64 Annual Report 2013
4 Group performance 4.1.16 - 4.1.18
of non- strategic businesses within Consumer Lifestyle and Healthcare. Cash flows from derivatives and securities led to a net cash inflow of EUR 26 million.
Cash flows from financing activities
Net cash used for financing activities in 20122014 was EUR 2931,189 million. Philips’ shareholders were given EUR 687729 million in the form of a dividend, of which the cash portion of the dividend amounted to EUR 255 million. The net impact of changes in debt was an increase of EUR 730 million, including the issuance of USD 1.5 billion in bonds, partially offset by the early redemption of a USD 500 million bond. Additionally, net cash outflows for share buyback and share delivery totaled EUR 768 million.
Net cash used for financing activities in 2011 was EUR 1,790 million. Philips’ shareholders were given EUR 711 million in the form of a dividend of which the cash portion of the dividend amounted to EUR 259292 million. The net impact of changes in debt was a decrease of EUR 860 million, including the redemption of a EUR 750 million bond, a USD 350 million bond and other debts totaling EUR 1,314 million, partially offset by the drawdown of a EUR 200 million committed facility and other new long-term borrowing totaling EUR 454301 million. Additionally, net cash outflows for share buybackbuy-back and share delivery totaled EUR 671596 million.
4.1.162.1.16 Cash flows from discontinued operations
The year 20132016
In 2013, EUR 206 million2016, cash was used by discontinued operations. The Television business used net cash of EUR 138, attributable to cash outflows of EUR 91 million forinflow from Discontinued operations as reported within operating activities andamounted to EUR 47268 million, for investing activities. The Audio, Video Multimedia and Accessories business used net cash of EUR 68 millionmainly attributable to operating activities.
In 2012, EUR 126 million cash was used by discontinued operations. The Television business used net cash of EUR 256 million, attributable to operating cash outflows of EUR 296 million partly offset by cash inflows from investing activities of EUR 40 million. The Audio, Video Multimedia and Accessories business generated a cash inflow of EUR 130148 million attributable to operating activities.from the Automotive and Lumileds businesses and a cash inflow from the Audio, Video, Multimedia & Accessories business of EUR 119 million.
The year 20122015
In 2012,2015, cash inflow from Discontinued operations as reported within operating activities amounted to EUR 12679 million, cash was used by the discontinued operations. The Television business used net cash of EUR 256 million,mainly attributable to operating cash outflows of EUR 296 million partly offset by cash inflows from investing activities of EUR 40 million. The Audio, Video Multimedia and Accessories business generated a cash inflow of EUR 130115 million attributable to operating activities.
In 2011, EUR 374 millionfrom the Automotive and Lumileds businesses, offset by a cash was used byoutflow from the discontinued operations of the Television and Audio, Video, Multimedia and& Accessories businesses. The Television business used net cash of EUR 36437 million.
In 2014, cash inflow from Discontinued operations amounted to EUR 193 million. Cash flows from the businesses reported in operating activities amounted to a EUR 105 million cash inflow, mainly attributable to operatinga cash outflowsinflow from the Automotive and Lumileds businesses of EUR 270240 million, andoffset by cash outflows to investing activities of EUR 94 million. Theoutflow from the Audio, Video, Multimedia and& Accessories business usedof EUR 10107 million. The cash consideration received for the sale of the Audio, Video, Multimedia & Accessories business amounted to EUR 88 million of netand was reported as cash attributable to operatingflow from investing activities.
30 Annual Report 2016
Group performance 2.1.17
4.1.172.1.17 Financing
The year 20132016
Condensed consolidated balance sheets for the years 2011, 20122014, 2015 and 20132016 are presented below:
Philips Group
Condensed consolidated balance sheet information1)
in millions of eurosEUR
2014 - 2016
|
| |||||||||||||||||||||||
| 2014 | 2015 | 2016 | ||||||||||||||||||||||
| 2011 | 2012 | 2013 |
|
| ||||||||||||||||||||
Intangible assets | 11,012 | 10,679 | 9,766 | 10,526 | 12,216 | 12,450 | ||||||||||||||||||
Property, plant and equipment | 3,014 | 2,959 | 2,780 | 2,095 | 2,322 | 2,155 | ||||||||||||||||||
Inventories | 3,625 | 3,495 | 3,240 | 3,314 | 3,463 | 3,392 | ||||||||||||||||||
Receivables | 5,117 | 4,858 | 4,892 | 5,040 | 5,287 | 5,636 | ||||||||||||||||||
Assets held for sale | 551 | 43 | 507 | 1,613 | 1,809 | 2,180 | ||||||||||||||||||
Other assets | 2,931 | 3,213 | 2,909 | 3,891 | 4,113 | 4,156 | ||||||||||||||||||
Payables | (6,563 | ) | (6,210 | ) | (5,435 | ) | (5,282 | ) | (5,604 | ) | (6,028 | ) | ||||||||||||
Provisions | (2,680 | ) | (2,956 | ) | (2,554 | ) | ||||||||||||||||||
Provisions3) | (4,517 | ) | (4,243 | ) | (3,606 | ) | ||||||||||||||||||
Liabilities directly associated with assets held for sale | (61 | ) | (27 | ) | (348 | ) | (349 | ) | (407 | ) | (525 | ) | ||||||||||||
Other liabilities | (3,871 | ) | (4,169 | ) | (3,094 | ) | ||||||||||||||||||
Other liabilities3) | (3,132 | ) | (3,182 | ) | (3,030 | ) | ||||||||||||||||||
|
|
|
| |||||||||||||||||||||
| 13,075 | 11,885 | 12,663 | ||||||||||||||||||||||
Net asset employed | 13,199 | 15,774 | 16,780 | |||||||||||||||||||||
Cash and cash equivalents | 3,147 | 3,834 | 2,465 | 1,873 | 1,766 | 2,334 | ||||||||||||||||||
Debt | (3,860 | ) | (4,534 | ) | (3,901 | ) | (4,104 | ) | (5,760 | ) | (5,606 | ) | ||||||||||||
|
|
|
| |||||||||||||||||||||
Net cash (debt) | (713 | ) | (700 | ) | (1,436 | ) | ||||||||||||||||||
Net debt2) | (2,231 | ) | (3,994 | ) | (3,272 | ) | ||||||||||||||||||
Non-controlling interests | (34 | ) | (34 | ) | (13 | ) | (101 | ) | (118 | ) | (907 | ) | ||||||||||||
Shareholders’ equity | (12,328 | ) | (11,151 | ) | (11,214 | ) | (10,867 | ) | (11,662 | ) | (12,601 | ) | ||||||||||||
|
|
|
| |||||||||||||||||||||
Financing | (13,199 | ) | (15,774 | ) | (16,780 | ) | ||||||||||||||||||
| (13,075 | ) | (11,885 | ) | (12,663 | ) |
|
| |||||||||||||||||
| 1) | Please refer tosection |
| 2) | Non-GAAP financial measure. For the definition and reconciliation to the most directly comparable GAAP measure, refer tochapter 4, Reconciliation ofnon-GAAP information, of this report. |
| 3) | Adjusted to reflect a reclassification of net defined-benefit obligations into Long-term provisions. Seenote 1, Significant accounting policies |
4.1.182.1.18 Cash and cash equivalents
The year 20132016
In 2013,2016, cash and cash equivalents increased by EUR 568 million to EUR 2,334 million atyear-end. The increase was mainly attributable to cash inflows of EUR 1,904 million from net cash provided by operating activities, EUR 825 million net proceeds from Philips Lighting IPO and EUR 268 million from Discontinued operations. This was partly offset by cash outflows of EUR 831 million from net capital expenditures, EUR 526 million from treasury share transactions, EUR 377 million from decreases in debt, cash dividends paid of EUR 342 million including EUR 12 million of dividends paid tonon-controlling interest and EUR 263 million related to acquisitions.
Philips Group
Cash balance movementsin millions of EUR
2016
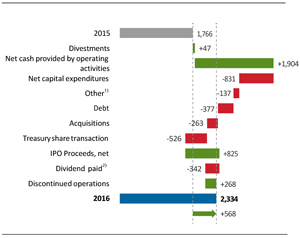
| 1) | Includes cash flow for derivatives and currency effect |
| 2) | Includes dividends paid to shareholders of Koninklijke Philips N.V and tonon-controlling interests |
The year 2015
In 2015, cash and cash equivalents decreased by EUR 1,369107 million to EUR 2,4651,766 million atyear-end. The decrease was mainly attributable to an outflow of EUR 1,137 million on acquisitions mainly related to Volcano, cash outflows for treasury share transactions of EUR 425 million, and a cash dividend payout of EUR 298 million. This was partly offset by EUR 1,231 million from increases in debt, and EUR 110 million related to divestments.
In 2014, cash and cash equivalents decreased by EUR 592 million to EUR 1,873 million atyear-end. The decrease was mainly attributable to an outflow on cash for net capital expenditures of EUR 966806 million, cash outflows
Annual Report 2013 65
4 Group performance 4.1.19 - 4.1.19
for treasury share transactions of EUR 562596 million, cash dividend payout of EUR 272292 million, EUR 407301 million from decreases in debt and a EUR 206258 million outflow related to discontinued operations.acquisitions. This was partly offset by a cash inflow of EUR 1,138 million inflow from operations.
In 2012, cash and cash equivalents increased by EUR 687 million to EUR 3,834 million at year-end. The increase was mainly attributable to cash inflows from operations amounting to EUR 2,082 million and EUR 7301,303 million from increases in debt. This was partly offsetthe net cash provided by a EUR 768 million outflow for treasury share transactions, an outflow on net capital expenditures of EUR 455 million, a EUR 428 million outflow for acquisitions of businesses and financial assets, a EUR 255 million outflow for the cash dividend payout, and a EUR 126 million outflow related to discontinued operations.
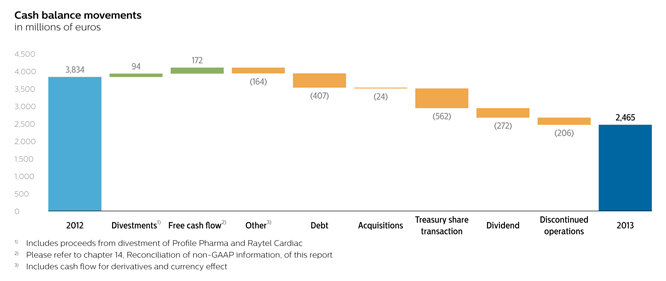
The year 2012
In 2012, cash and cash equivalents increased by EUR 687 million to EUR 3,834 million at year-end. The increase was mainly attributable to cash inflows from operations amounting to EUR 2,082 million and EUR 730 million from increases in debt. This was partly offset by a EUR 768 million outflow for treasury share transactions, an outflow on net capital expenditures of EUR 455 million, a EUR 428 million outflow for acquisitions of businesses and financial assets, a EUR 255 million outflow for the cash dividend payout, and a EUR 126 million outflow related to discontinued operations.
In 2011, cash and cash equivalents decreased by EUR 2,686 million to EUR 3,147 million at year-end. The decrease was mainly attributable to an outflow on net capital expenditures of EUR 857 million, a EUR 860 million decrease in debt, a EUR 671 million outflow for treasury share transactions, a EUR 550 million outflow for acquisitions of businesses and financial assets, and a EUR 259 million outflow for the cash dividend payout. This was partly offset by cash inflows from operations amounting to EUR 760 million, EUR 106 million in proceeds from divestments, and a EUR 374 million outflow related to discontinued operations.
4.1.192.1.19 Debt position
The year 20132016
Total debt outstanding at the end of 20132016 was EUR 3,9015,606 million, compared with EUR 4,5345,760 million at the end of 2012.2015.
Philips Group
Changes in debt
in millions of eurosEUR
| 2011 | 2012 | 2013 | ||||||||||
New borrowings | (454 | ) | (1,361 | ) | (64 | ) | ||||||
Repayments | 1,314 | 631 | 471 | |||||||||
Consolidation and currency effects | (62 | ) | 56 | 226 | ||||||||
|
| |||||||||||
Total changes in debt | 798 | (674 | ) | 633 | ||||||||
2014 - 2016
|
| |||||||||||
| 2014 | 2015 | 2016 | ||||||||||
|
| |||||||||||
New borrowings | (69 | ) | (1,335 | ) | (1,304 | ) | ||||||
Repayments | 370 | 104 | 1,681 | |||||||||
Currency effects and consolidation changes | (504 | ) | (425 | ) | (223 | ) | ||||||
|
| |||||||||||
Changes in debt | (203 | ) | (1,656 | ) | 154 | |||||||
|
| |||||||||||
In 2013,2016, total debt decreased by EUR 633 million.154 million compared to 2015. New borrowings of EUR 641,304 million consistedwere mainly of replacementsdue to lease contracts. Repaymentnew loan facilities for Philips
Annual Report 2016 31
Group performance 2.1.20
Lighting of EUR 471740 million includedand USD 500 million to replace intragroup financing from Royal Philips. Repayments amounted to EUR 1,681 million, mainly due to the repayment of a USD 1431,300 million redemption on USD bondsbridge loan used for the Volcano acquisition, as well as payments on short-term debt.the early redemption of USD 285 million in aggregate principal amount of USD bonds. Other changes resulting from consolidation and currency effects led to a decreasean increase of EUR 226223 million.
In 2012,2015, total debt increased by EUR 6741,656 million. New borrowings of EUR 1,3611,335 million included the issuance of USD 1.5 billion in bonds. Repayment of EUR 631
66 Annual Report 2013
4 Group performance 4.1.20 - 4.1.21
million included early redemption of a USD 500 million bond. Other changes resulting from consolidation and currency effects ledwere mainly due to a decrease of EUR 56 million.
Long-term debt as a proportion ofshort-term bridging loan with low interest rate used for the total debt stood at 85% at the end of 2013 with an average remaining term of 12.8 years, compared to 82% and 12.7 years at the end of 2012.
For further information, please refer to note 20, Long-term debt and short-term debt.
The year 2012
Total debt outstanding at the end of 2012 was EUR 4,534 million, compared with EUR 3,860 million at the end of 2011.
In 2012, total debt increased by EUR 674 million. New borrowings of EUR 1,361 million included the issuance of USD 1.5 billion in bonds. Repayment of EUR 631 million included early redemption of a USD 500 million bond. Other changes resulting from consolidation and currency effects led to a decrease of EUR 56 million.
In 2011, total debt decreased by EUR 798 million. The repayment of EUR 1,314 million included redemption of a EUR 750 million bond, a USD 350 million bond, and a EUR 217 million repayment of short-term debt. New borrowing and finance leasesVolcano acquisition, while repayments amounted to EUR 454104 million. Other changes resulting from consolidation and currency effects led to an increase of EUR 62425 million.
Long-termAt the end of 2016, long-term debt as a proportion of the total debt stood at 82% at the end of 201272% with an average remaining term of 12.77.8 years, compared to 85%71% and 10.410.7 years at the end of 2011.2015.
For further information, please refer tonote 20, Long-term debt and short-term debt.
18, Debt4.1.20 Net debt to group equity.
The year 20132015
Philips ended 2013 in a netTotal debt position (cash and cash equivalents, netoutstanding at the end of debt) of2015 was EUR 1,4365,760 million, compared to a net debt position ofwith EUR 7004,104 million at the end of 2012.
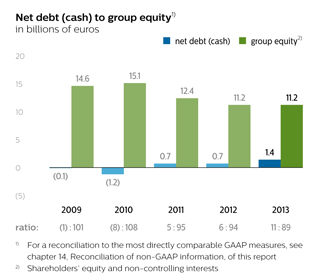
The year 2012
Philips ended 2012 in a net debt position (cash and cash equivalents, net of debt)2014 an increase of EUR 7001,656 million.
In 2014, total debt increased by EUR 203 million. New borrowings of EUR 69 million consisted mainly of replacements to lease contracts. Repayment of EUR 370 million included a EUR 250 million repayment of a five-year loan. Other changes resulting from consolidation and currency effects led to an increase of EUR 504 million.
At the end of 2015, long-term debt as a proportion of the total debt stood at 71% with an average remaining term of 10.7 years, compared to a net debt position of EUR 713 million90% and 11.6 years at the end of 2011.2014.
4.1.21For further information, please refer tonote 18, Debt.
2.1.20 Shareholders’ equity
The year 20132016
Shareholders’ equity increased by EUR 63939 million in 20132016 to EUR 11,21412,601 million at December 31, 2013.2016. The increase was mainly a result of EUR 1,1691,491 million net income, partially offset by EUR 476 million of currency translation losses and EUR 669589 million related to the purchase of treasury shares.shares for the sharebuy-back program. The dividend payment to shareholders of Koninklijke Philips N.V. in 20132016 reduced equity by EUR 272330 million including tax and service charges, while the delivery of treasury shares increased equity by EUR 118 million and the share premium due to share-based compensation plans increased equity by EUR 10574 million.
Shareholders’ equity decreased by EUR 1,177 million in 2012 to EUR 11,151 million at December 31, 2012. The decrease was mainly as a result of EUR 816 million related to the purchase of treasury shares, EUR 100 million of currency translation losses and a EUR 35 million net loss. The dividend payment to shareholders in 2012 reduced equity by EUR 259 million. The decrease was partially offset by a EUR 50 million increase related to the delivery of treasury shares and a EUR 84 million increase in share premium due to share-based compensation plans.
The number of outstanding common shares of Royal Philips at December 31, 20132016 was 913922 million (2012: 915(2015: 917 million).
Annual Report 2013 67
4 Group performance 4.1.22 - 4.1.22
At the end of 2013,2016, the Company held 20.77.2 million shares in treasury to cover the future delivery of shares (2012: 28.7(2015: 11.8 million shares). This was in connection with the 44.333.5 million rights outstanding at the end of 2013 (2012: 52.32016 (2015: 39.1 million rights) under the Company’s long-term incentive plans. At the end of 2013,2016, the Company held 3.9 milliondid not hold any shares for cancellation (2012: 13.8(2015: 2.2 million shares). In 2016 Philips purchased call options on Philips shares matching the majority of the options granted to employees until 2013. As of December 31, 2016 Philips held 14.1 million call options as a hedge of 15.9 million remaining options granted to employees.
The year 20122015
Shareholders’ equity decreasedincreased by EUR 1,177795 million in 20122015 to EUR 11,151 million11,662 at December 31, 2012.2015. The decreaseincrease was mainly as a result of EUR 816645 million net income and EUR 791 million of other comprehensive income, partially offset by EUR 507 million related to the purchase of treasury shares EUR 100 million of currency translation losses and a EUR 35 million of net loss.for the sharebuy-back program. The dividend payment to shareholders in 20122015 reduced equity by EUR 259 million. The decrease was partially offset by a EUR 50298 million increase related toincluding tax and service charges, while the delivery of treasury shares and a EUR 84 million increase in share premium due to share-based compensation plans.
Shareholders’ equity decreased by EUR 2,693 million in 2011 to EUR 12,328 million at December 31, 2011. The decrease was mainly as a result of a EUR 1,460 million net loss as well as EUR 751 million related to the purchase of treasury shares. The dividend payment to shareholders in 2011 reducedincreased equity by EUR 263 million. The decrease was partially offset by a EUR 4682 million increase related to the delivery of treasury shares and a EUR 56 million increase in share premium due tonet share-based compensation plans.plans increased equity by EUR 82 million.
The number of outstanding common shares of Royal Philips at December 31, 20122015 was 915917 million (2011: 926(2014: 914 million).
At the end of 2012,2015, the Company held 28.711.8 million shares in treasury to cover the future delivery of shares (2011: 33.6(2014: 17.1 million shares). This was in connection with the 52.339.1 million rights outstanding at the end of 2012 (2011: 47.12015 (2014: 40.8 million rights) under the Company’s long-term incentive plan and convertible personnel debentures.plans. At the end of 2012,2015, the Company held 13.82.2 million shares for cancellation (2011: 49.3(2014: 3.3 million shares).
4.1.222.1.21 Net debt to equity
The year 2016
Philips ended 2016 with a position of EUR 3,272 million, compared to a net debt1) position of EUR 3,994 million at the end of 2015.
Philips Group
Net debt to group equity2)in billions of EUR
2012 - 2016

| 1) | Shareholders’ equity andnon-controlling interests |
| 2) | Non-GAAP financial measure. For the definition and reconciliation to the most directly comparable GAAP measure, refer tochapter 4, Reconciliation ofnon-GAAP information, of this report |
| 1) | Non-GAAP financial measure. For the definition and reconciliation to the most directly comparable GAAP measure, refer tochapter 4, Reconciliation ofnon-GAAP information, of this report. |
32 Annual Report 2016
Group performance 2.1.22
The year 2015
Philips ended 2015 with a net debt1) position (total debt less cash and cash equivalents) of EUR 3,994 million, compared to a net debt1) position of EUR 2,231 million at the end of 2014.
2.1.22 Liquidity position
IncludingThe year 2016
As of December 31, 2016, including the Company’s net debt (cash)cash position (cash and cash equivalents, netequivalents), as well as its EUR 2.3 billion committed revolving credit facilities, the Philips Group had access to available liquidity of debt)EUR 4,634 million vs. Gross Debt (including short and long-term) of EUR 5,606 million.
As of December 31, 2015, including the Company’s cash position (cash and cash equivalents), listed available-for-sale financial assets, as well as its EUR 1.8 billion committed revolving credit facility, the Company had access to net available liquid resourcesliquidity of EUR 4293,566 million asvs. Gross Debt (including short and long-term) of December 31, 2013, compared to EUR 1,220 million one year earlier.5,760 million.
Philips Group
Liquidity position
in millions of eurosEUR
2014 - 2016
|
| |||||||||||||||||||||||
| 2014 | 2015 | 2016 | ||||||||||||||||||||||
| 2011 | 2012 | 2013 |
|
| ||||||||||||||||||||
Cash and cash equivalents | 3,147 | 3,834 | 2,465 | 1,873 | 1,766 | 2,334 | ||||||||||||||||||
Committed revolving credit facility/CP program/Bilateral loan | 3,200 | 1,800 | 1,800 | 1,800 | 1,800 | 2,300 | ||||||||||||||||||
|
|
|
| |||||||||||||||||||||
Liquidity | 6,347 | 5,634 | 4,265 | 3,673 | 3,566 | 4,634 | ||||||||||||||||||
Available-for-sale financial assets at fair value | 110 | 120 | 65 | 75 | 75 | 36 | ||||||||||||||||||
Short-term debt | (582 | ) | (809 | ) | (592 | ) | (392 | ) | (1,665 | ) | (1,585 | ) | ||||||||||||
Long-term debt | (3,278 | ) | (3,725 | ) | (3,309 | ) | (3,712 | ) | (4,095 | ) | (4,021 | ) | ||||||||||||
|
|
|
| |||||||||||||||||||||
Net available liquidity resources | 2,597 | 1,220 | 429 | (356 | ) | (2,119 | ) | (936 | ) | |||||||||||||||
|
| |||||||||||||||||||||||
The fair value of the Company’s available-for-sale financial assets amounted to EUR 65 million.
Royal Philips has a EUR 1.8 billion committed revolving credit facility that can be used for general corporategroup purposes and as a backstop of its commercial paper program. In January 2013, the EUR 1.8 billion facility was extended by 2 years untilCommercial Paper Programme and will mature in February 2018. The commercial paper programCommercial Paper Programme amounts to USD 2.5 billion, under which Royal Philips can issue commercial paper up to 364 days in tenor, both in the US and in Europe, in any major freely convertible currency. There is a panel of banks, in Europe and in the US, which service the program. The interest is at market rates prevailing at the time of issuance of the commercial paper. There is no collateral requirement in the commercial paper program.Commercial Paper Programme. Also, there are no limitations on Philips’ use of funds from the program. As atof December 31, 2013,2016, Royal Philips did not have any loans outstanding under these facilities.
Royal Philips’ existing long-term debt is rated A3Baa1 (with stable outlook) by Moody’s and A-BBB+ (with stable outlook) by Standard & Poor’s. ItOur net debt1) position is managed in such a way that we expect to retain a strong investment grade credit rating. Furthermore, the Group’s aim when managing the net debt1) position is dividend stability and apay-out ratio of 40% to 50% of continuing net income. Royal Philips’ objective to manage its financial ratios to be in line with an A3/A- rating. There is no assurance that Philips will be able to achieve this goal. Ratings are subject to change at any time. Outstandingoutstanding long-term bondsdebt and credit facilities do not have a repetitive material adverse change clause,contain financial covenants or credit-rating-related acceleration possibilities.cross-acceleration provisions that are based on adverse changes in ratings. A description of Philips’ credit facilities, including any covenants, can be found innote 18, Debt.
As at December 31, 2013,2016, Philips had total cash and cash equivalents of EUR 2,4652,334 million. Philips pools cash from subsidiaries to the extent legally and economically feasible. Cash not pooled remains
68 Annual Report 2013
4 Group performance 4.1.22 - 4.1.23
available for local operational or investment needs. Philips had a total gross debt position of EUR 3,901 million at year-end 2013.
Philips believes its current workingliquidity and direct access to capital markets is sufficient to meet its present working capitalfinancing requirements.
4.1.23In December 2016, Royal Philips delivered a notice of redemption to the holders of the outstanding 5.750% Notes due 2018 in the aggregate principal amount of USD 1,250 million for redemption in January 2017. For further information, refer tonote 31, Subsequent events.
The year 2015
Including the Company’s cash position (cash and cash equivalents), as well as its EUR 1.8 billion committed revolving credit facility, the Company had access to available liquid resources of EUR 3,566 million vs Gross Debt (including short and long term) of EUR 5,760 million as of December 31, 2015.
2.1.23 Cash obligations
Contractual cash obligations
Presented below is a summary of the Group’s contractual cash obligations and commitments at December 31, 2013.2016.
Contractual cash obligations at December 31, 2013
in millions of euros1)
| payments due by period | ||||||||||||||||||||
| less | ||||||||||||||||||||
| than 1 | 1-3 | 3-5 | after 5 | |||||||||||||||||
| total | year | years | years | years | ||||||||||||||||
Long-term debt2) | 3,472 | 308 | 2 | 900 | 2,262 | |||||||||||||||
Finance lease obligations | 241 | 61 | 78 | 34 | 68 | |||||||||||||||
Short-term debt | 230 | 230 | — | — | — | |||||||||||||||
Operating leases | 1,017 | 237 | 316 | 182 | 282 | |||||||||||||||
Derivative liabilities | 337 | 112 | 93 | 92 | 40 | |||||||||||||||
Interest on debt3) | 2,421 | 185 | 346 | 315 | 1,575 | |||||||||||||||
Purchase obligations4) | 184 | 81 | 76 | 26 | 1 | |||||||||||||||
Trade and other payables | 2,462 | 2,462 | — | — | — | |||||||||||||||
|
| |||||||||||||||||||
| 10,364 | 3,676 | 911 | 1,549 | 4,228 | ||||||||||||||||
| 1) |
|
Annual Report 2016 33
Group performance 2.1.23
Philips Group
Contractual cash obligations1,2)in millions of EUR
2016
|
| |||||||||||||||||||
| Payments due by period | ||||||||||||||||||||
|
| |||||||||||||||||||
| less | ||||||||||||||||||||
| than 1 | 1-3 | 3-5 | after 5 | |||||||||||||||||
| total | year | years | years | years | ||||||||||||||||
|
| |||||||||||||||||||
Long-term debt3) | 5,117 | 1,290 | 104 | 1,297 | 2,426 | |||||||||||||||
Finance lease obligations | 307 | 93 | 127 | 54 | 33 | |||||||||||||||
Short-term debt | 210 | 210 | — | — | — | |||||||||||||||
Operating leases | 942 | 227 | 300 | 195 | 220 | |||||||||||||||
Derivative liabilities | 841 | 280 | 410 | — | 151 | |||||||||||||||
Interest on debt4) | 2,229 | 184 | 306 | 295 | 1,444 | |||||||||||||||
Purchase obligations5) | 260 | 108 | 73 | 33 | 46 | |||||||||||||||
Trade and other payables | 2,848 | 2,848 | — | — | — | |||||||||||||||
|
| |||||||||||||||||||
Contractual cash obligations | 12,754 | 5,240 | 1,320 | 1,874 | 4,320 | |||||||||||||||
|
| |||||||||||||||||||
| 1) | Obligations in this table are undiscounted |
| 2) | This table excludes pension contribution commitments and income tax liabilities in respect of tax risks because it is not possible to make a reasonably reliable estimate of the actual period of cash settlement |
| 3) | Long-term debt includes short-term portion of long-term debt and excludes finance lease obligations |
Approximately |
Philips has commitments related to the ordinary course of business which in general relate to contracts and purchase order commitments for less than 12 months. In the table, only the commitments for multiple years are presented, including their short-term portion |
Philips has no material commitments for capital expenditures.
Additionally, Philips has a number of commercial agreements, such as supply agreements, which provide that certain penalties may be charged to the Company if it does not fulfill its commitments.
Certain Philips suppliers factor their trade receivables from Philips with third parties through supplier finance arrangements. At December 31, 20132016 approximately EUR 343360 million of the Philips accounts payablespayable were known to have been sold onward under such arrangements whereby Philips confirms invoices. Philips continues to recognize these liabilities as trade payables and will settle the liabilities in line with the original payment terms of the related invoices.
Other cash commitments
The Company and its subsidiaries sponsor post-employment benefit plans in many countries in accordance with legal requirements, customs and the local situation in the countries involved. For a discussion of the plans and expected cash outflows, please refer tonote 30,20, Post-employment benefits.benefits.
The Company had EUR 203201 million restructuring-related provisions by the end of 2013,2016, of which EUR 128174 million is expected to result in cash outflows in 2014.2017. Refer tonote 21,19, Provisions for details of restructuring provisions and potential cash flow impact for 2014 and further.provisions.
A proposal will be submitted to the upcoming Annual General Meeting of Shareholders to declare a distributiondividend of EUR 0.80 per common share (up to EUR 740745 million), in cash or shares at the option of the shareholder, against the net income for 2013.2016. Further details will be given in the agenda for the Annual General Meeting of Shareholders, to be held on May 1, 2014.11, 2017.
Guarantees
Philips’ policy is to provide guarantees and other letters of support only in writing. Philips does not provide other forms of support. At the end of 2013,2016, the total fair value of guarantees recognized by Philips in other non-current liabilitieson the balance sheet amounted to less than EUR 1 million. The following table outlines the total outstanding off- balance sheetnil (December 31, 2015: EUR nil). Remainingoff-balance-sheet business and credit-related guarantees and business-related guarantees provided by Philips for the benefiton behalf of unconsolidated companies and third parties as at Decemberand associates decreased by EUR 9 million during 2016 to EUR 28 million (December 31, 2012 and 2013.
Annual Report 2013 69
4 Group performance 4.1.23 - 4.1.24
2015: EUR 37 million).
Expiration per period
in millions of euros
| total amounts committed | less than 1 year | 1-5 years | after 5 years | |||||||||||||
2013 | ||||||||||||||||
Business-related guarantees | 292 | 107 | 117 | 68 | ||||||||||||
Credit-related guarantees | 41 | 19 | 7 | 15 | ||||||||||||
|
| |||||||||||||||
| 333 | 126 | 124 | 83 | |||||||||||||
2012 | ||||||||||||||||
Business-related guarantees | 295 | 113 | 114 | 68 | ||||||||||||
Credit-related guarantees | 27 | 11 | — | 16 | ||||||||||||
|
| |||||||||||||||
| 322 | 124 | 114 | 84 | |||||||||||||
4.1.24 Supply management2.1.24 Procurement
The year 20132016
Throughout 2013In the average market prices for energy and raw materials, which represent approximately 15% of our direct and indirect spend, remained fairly stable compared to the average for 2012. The potential impact of improving economic conditions in mature economies in the second halffirst quarter of the year, global economic growth was offsetrunning at its weakest pace in three years. In June, an additional threat to future growth came in the shape of Brexit, high credit growth, debt exposures in emerging markets and volatile financial markets.
Commodity prices continued to weaken at the start of 2016. Oil and metal prices fell to extreme lows on weaker global demand, especially due to the slowdown in manufacturing activity in China, but also because of increases in inventories and supply following the past (mining) investments.
Market prices for steel, however, showed increases during 2016, driven by a simultaneous slow-downsteeper cost curve, a consolidated market as well as the more aggressive anti-dumping approach.
For commodities, the election of Donald Trump as US President spurred price gains as investors bet that demand in growth geographies, especially in China. Steelfor materials would pick up with a focus on infrastructure and further protectionism. However, actual consumption has not yet significantly increased for most materials and the influence of speculation is hard to determine.
Oil, copper, steel and other metals prices were stable atall surged by over 20% in the last few months of the year to the highest price levels sincemid-2015, partly driven by additional Chinese fiscal stimulus in the form of public construction sector support and the acceleration of public-private partnership infrastructure projects.
Risks
Continued reliance on credit as a historically low level, while oilgrowth driver is heightening the risk of an eventual disruptive adjustment in China. In addition, a shift toward protectionist policies is a distinct threat. Geopolitical
34 Annual Report 2016
Group performance 2.1.24
tensions, terrorism and plastics stabilized atthe European challenge with refugees could also play a higher level. Givenkey role in the economic circumstances it was remarkable that packagingoutlook in several economies.
The currency risk remains and might get stronger in 2017 as the US dollar continued to appreciate against the euro and Chinese renminbi in 2016.
Implications
The lower commodity market prices increasedover the last two years created a tailwind for Philips. The coming year will show a different picture, judging by current economic improvement, speculation on apick-up in 2013.commodity demand and actual price increases over the last months of 2016.
Rare earth prices continued to slide,Concerning shortages, the low price levels of raw materials and this has contributed to realizing higher savings levels in 2013. Contingency measures are in place to delay and mitigate the impact of a possible new hike in the price of rare earths in the future. The major successes ofEco-Halogen lamps and similar products in the marketenergy during 2016 have fueled demand for Xenon, which is used as a filler gas in these lamps. Since global production has not increased, this has led to tight supplyreduced investment in future supply. This creates the risk of new headwind once real consumption picks up again and a price peak. Therefore a major effort was made resulting in replacement of Xenon by an alternative gas for a large part of the portfolio by the end of 2013. The availability of helium remains a constant concern, though acute shortages have not occured. Technical measures have been taken to almost completely prevent loss of helium in our operations.
Thanks to a rigid procurement focus on organizational set-up and performance drivers, the overall procurement performance improved substantially in 2013 in accordance with the plan to save an additional EUR 1 billion. This is supporting the competitiveness of our business propositions. All parts of the new Procurement organization have contributed to this improvement.supply-demand situation reverses.
The year 20122015
InGlobal growth remained moderate during 2015. While the courseadvanced economies showed a modest recovery, the emerging markets showed further declines in their growth rates. Main themes in 2015 were further signs of 2012,weakening economic growth in emerging markets, especially China, strongly declining oil prices, commodity prices trending down slightly, and currency volatility.
Growth within the marketUS, Europe and Japan was supported by declining oil and material prices, monetary policies and, in the case of energy and raw materials, which together represent 15% of our purchasing spend, showed diverse trendsEurope, the euro currency depreciation.
Commodity prices weakened in a very volatile market. Prices of most metals dropped2015. After an increase in the spring from their high levels in 2011 largely asJanuary lows, oil prices declined sharply, reflecting a consequencecombination of weaker global demand and steady supply growth, and increased again following the slowdown of thenuclear deal with Iran.
Metal prices also fell on weaker global economy, anddemand, especially due to slower Chinese consumption growth. In spitethe slowdown in manufacturing activity in China, but also because of increases in inventories and supply following the economic slowdown, energypast mining investments. Market prices kept their high price levels in 2012, mainly duefor steel continued to market fears and uncertainty from turbulence in various oil-producing countries in 2012.
70 Annual Report 2013
4 Group performance 4.2 - 4.2.2
fall.
At Philips we are passionate about improving lives through meaningful innovation. Our businesses provide innovative solutionspeople find this aim powerful and inspiring, answering a calling to help create a healthier society. We reflect this aim in all that address major trends affectingwe do, starting with our people, extending to our stakeholders, as inspiration for new products and services, and through the world –community work of the demand for affordable healthcare,Philips Foundation.
Our people
At Philips, we are committed to fostering an ecosystem that inspires inclusion, enables our employees to thrive, and puts our purpose of improving lives at the need for greater energy efficiencyheart of everything we do. Our people are one of our unique strengths and each one of our employees is instrumental in Philips’ success. Our strategy is based on the desire for personal well-being.
In 2013,belief that every employee at Philips further strengthened its focus on sustainability. Thishas talent and can grow and contribute with increasing impact. We take great pride in our Philips culture, which is rooted in innovation, R&D and entrepreneurship. We strive to hire employees with backgrounds and perspectives that can mirror the diversity of our long-standing belief that sustainability ismarkets and customers, fueling insight and innovation across our business.
During 2016 we successfully split Philips Lighting from Royal Philips. This facilitated greater focus and growth in each business, but also necessitated change and adjustment for our people. Throughout this process, our people have demonstrated their significant professionalism in making this a key enablersmooth transition, from both a people and business perspective, ensuring moments of value creation and offers opportunities to innovate our way out of the challenging economic circumstances. Therefore, sustainability is an integral part of Philips’ vision and strategy.uncertainty were supported with care.
4.2.12.2.1 Improving people’s lives
At Philips, we strive to make the world healthier and more sustainable through innovation. Our goal is to improve the lives of 3 billion people a year by 2025. To guide our efforts and measure our progress, we take atwo-dimensional approach – social and ecological – to improving people’s lives. Products and solutionsSolutions from our portfolio that directly support the curative (care) or preventive (well-being) side of people’s health determine the contribution to the social dimension. This is also our contribution to the UN Sustainable Development Goal 3 (“to ensure healthy lives and promote well-being for all at all ages”). As healthy ecosystems are also needed for people to live a healthy life, the contribution to the ecological dimension is determined by means of our steadily growing Green ProductSolutions portfolio, such as our energy-efficient lighting.energy- efficient products in our Personal Health businesses. This is our contribution to Sustainable Development Goal 12 (“to ensure sustainable consumption and production patterns”).
Through Philips products and solutions that directly support the curative or preventive side of people’s health, we improved the lives of 630908 million people in 2013,2016, driven by our Healthcare sector.Diagnosis & Treatment businesses and Connected Care & Health Informatics businesses. Additionally, our well-being products that help people live a healthy life improved the lives of 324 million people, and our Green ProductsSolutions that contribute to a healthy ecosystem improved the lives of 290 million and 1.491.74 billion people respectively.people. After the elimination of double counts -– people touched multiple times -– we arrived at 1.82.1 billion lives. This is an increase of around 100 million compared to our total baseline of 1.7 billion people a year, established2015, driven by all segments, mainly in 2012. Greater China, North America, ASEAN, and the Indian subcontinent.
More information on this metric can be found in chapter 13, Sustainability statements,Methodology for calculating Lives Improved.
Annual Report 2016 35
Group performance 2.2.1
Lives Improved per market
To find out about our Lives Improved metric at global, regional and market level, go towww.results.philips.com/interactive-worldmap
The following table shows the Lives Improved metric per market.
Philips Group
Lives Improved per market
|
| |||||||||||
| Market | Lives Improved (million)1) | Population (million)2) | GDP (USD billion)3) | |||||||||
|
| |||||||||||
Africa | 54 | 1,185 | 2,186 | |||||||||
ASEAN and the Pacific | 246 | 948 | 5,765 | |||||||||
Benelux | 28 | 29 | 1,301 | |||||||||
Central & East Europe | 86 | 125 | 1,399 | |||||||||
Germany, Austria and Switzerland | 94 | 100 | 4,548 | |||||||||
France | 60 | 66 | 2,519 | |||||||||
Greater China | 395 | 1,410 | 12,851 | |||||||||
Iberia | 46 | 57 | 1,463 | |||||||||
Indian subcontinent | 213 | 1,522 | 2,583 | |||||||||
Italy, Israel and Greece | 55 | 82 | 2,392 | |||||||||
Japan | 35 | 127 | 4,730 | |||||||||
Latin America | 179 | 630 | 5,273 | |||||||||
Middle East & Turkey | 109 | 346 | 2,888 | |||||||||
Nordics | 26 | 27 | 1,460 | |||||||||
North America | 354 | 360 | 20,094 | |||||||||
Russia and Central Asia | 82 | 285 | 1,721 | |||||||||
UK & Ireland | 51 | 70 | 2,973 | |||||||||
| 1) | Source: Philips, double counts eliminated |
| 2) | Source: The World Bank, CIA Factbook & Wikipedia |
| 3) | Source: IMF, CIA Factbook & Wikipedia |
Philips Group
Lives improvedin billions
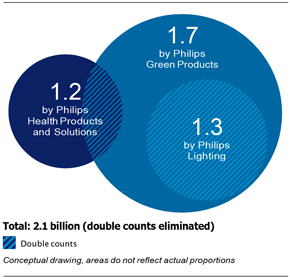
2.2.2 Including, engaging and inspiring our people
The ability to capture growth and seize market opportunities depends on our people – their alignment with our vision, a sense of this report.common purpose, and the belief that their role at Philips is making a positive contribution.
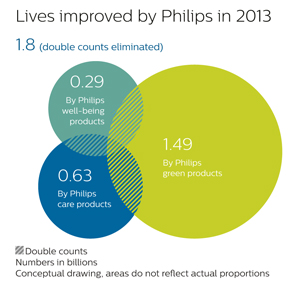
4.2.2 Employee engagementPhilips recognizes that the best and most innovative solutions are generated through collaboration between people who think differently from one another and genuinely welcome a variety of ideas and viewpoints.
Employee engagement is keyInclusion requires intentional acceptance; a mindset and workplace where every employee’s ideas, knowledge, perspectives, experiences, and styles are valued. The conviction that all individuals should be treated fairly and respectfully, have equal access to opportunities and resources, and can contribute fully to our competitive performance. Engagedsuccess.
Data insights
Gender diversity figures remained stable at 36% overall, with slight increases in the Staff, Professional and Management categories
Age diversity increased slightly in 2016 with an increase in the under 25 age group
120+ nationalities bringing a rich diversity of capabilities, opinions and perspectives
47% of our employees help us meet our business goalsare located in growth geographies
36 Annual Report 2016
Group performance 2.2.2
Philips Group
Gender diversityin %
2014 - 2016
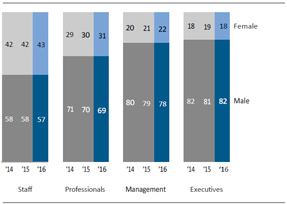
Philips Group
Employees per age categoryin %
2014 - 2016
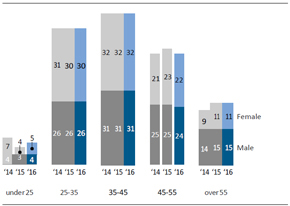
Engagement and help make Philips a great place to work. We have usedInspiration
Our employee engagement surveys for over a decade to gather feedback and focus areas and have seen tangible results along our journey.
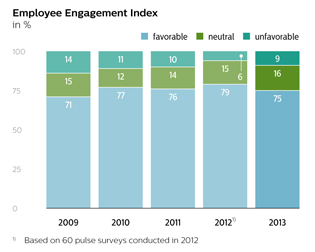
In 2012, we announced our intention to move from an annual measurement of Employee Engagement Survey data to a bi-annual basis in order to allow more time for teams to analyze results and implement improvement actions. We also used this as an opportunity to review the way we approach engagement, with the aim of improving the link between thesurvey consistently reports high levels of employee engagement, above 70% throughout 2010-2016, and rising from 71% to 74% favorable between 2015 to 2016 for the HealthTech businesses. Details on the Lighting employee engagement results can be found in the Philips Lighting Investor Relationswebsite.
At Philips, we care for our people and believe that we achieveare at our best when our team are at theirs. We understand work is only one part of life. That is why we offer a variety of innovative benefits and improved business results.health programs to help keep our people mentally and physically strong, and foster flexibility to manage life’s unexpected moments at home.
By keeping our finger on the pulse of employee sentiment toward the company, listening to employees’ ideas for improvement, and demonstrating to employees that their feedback is valued, we are working to ensure that every member of our global team has a role in creating lasting value for our customers, shareholders, and other stakeholders.
Philips Group
Employee Engagement Indexin %
2012 - 2016
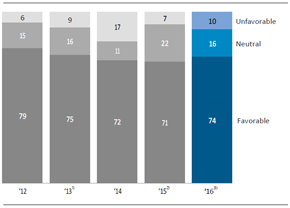
| 1) | Based on 60 pulse surveys conducted in 2012 |
| 2) | Based on My Accelerate! Surveys |
| 3) | Based on My Accelerate Surveys in HealthTech |
2.2.3 Hiring and acquiring our people
In 2013 we applied2016, over 10,000 people were appointed to roles within Philips; 69% of executive vacancies were filled by internal candidates, the remainder were external hires with 60% coming from other healthcare or IT companies. In line with previous years, roughly one third of all roles were filled with internal candidates and the remainder filled with highly qualified external talent.
Three successful integrations were completed in 2016, Volcano, PathXL and Wellcentive, also infusing the organization with additional talent with deep health technology expertise.
Philips’ focus on health technology has enabled activation of more highly targeted recruitment campaigns and outreach efforts. As such, Philips has continued to strengthenin-house talent acquisition capabilities, completing 80% of Executive hires in 2016, and saving EUR 3 million in agency costs.
Recruitment campaigns have been customized to raise awareness and attractiveness of Philips as a more contemporary model relevanttop healthcare technology employer within critical talent segments, for example Software and Q&R. TheCode to Care campaign achieved 340,000 prospects to the next stepssoftware careers page, supporting 77% growth in our journey. While our employee survey usingdigital talent pipelines. Likewise the refreshed methodologyQuality Gene campaign resulted in a 35% increase in applications, and a 39% increase in Q&R hires from strategically targeted companies.
In 2016, Philips was recognized as thebest-in-class in talent acquisition byCorporate Executive Board and is not directly comparablein the top 1% ofLinkedIn top global talent attractors. In addition, Best Place to our historical metric, we seeWork programs helped Philips boost attractiveness to passive talent in the labor market in 2016, winning category awards in the United States, Netherlands, Germany, Spain, and Panama.
Annual Report 2013 712016 37
4 Group performance 4.2.2 - 4.2.32.2.4
that 75% of our employees provided a favorable response to our new engagement index, 3 points above the external high-performing benchmark. This is a very encouraging result; especially given the speed and scale of our current transformation.
The survey results indicate the following areas as strengths:
Clarity of strategic direction provided by senior leadership
Adopting good ideas from all over the company
Making good use of skills and abilities
Providing opportunities for employees to grow and develop
Senior leaders’ belief in the future of Philips
There are also improvement areas:
Making the changes necessary to compete effectively and applying these changes in a consistent manner
Ability as an organization to fix problems so they don’t happen again
Senior leaders have to do more to ensure we drive collaboration, execution and improvement across organizational boundaries
Focus on customers must continue to strengthen
Need to create a diverse workforce and inclusive culture where people of all backgrounds can succeed in Philips
Engagement is now an integral part of how we build our culture and is an ingredient in a broader portfolio of initiatives and measurement tools. For example, in our end-to-end transformations, we use surveys to ensure forward progress while creating opportunities for team dialogues. We will use shorter, targeted surveys and dialogue platforms to maintain focus on key areas until the next full-census employee survey in 2015.
4.2.3 Diversity and inclusion
We set measurable objectives for achieving diversity and inclusion within Philips. Measuring performance against defined metrics twice annually, Executive Committee members hold their organizations accountable for progress and review actions and outcomes as part of business reviews.
With the roll-out of a revised Diversity and Inclusion (D&I) strategy and the launch of a new global D&I policy in 2013, Philips has taken major steps to clearly anchor diversity and inclusion as priorities and to engage all employees and leaders in contributing to an inclusive work environment. This policy prescribes:
Championing workforce diversity. We embrace unique individuals regardless of race, color, age, gender, gender identity or expression, sexual orientation, language, religion, political or other opinion, disability, national or social origin or birth.
Valuing diverse perspectives. We leverage the diverse thinking, skills, experience and working styles of everyone in our company.
Building a flexible organization. We provide opportunities for work arrangements that accommodate the diverse needs of people at different career and life stages.
Respecting stakeholder diversity. We develop strong and sustainable relationships with diverse stakeholders including customers, communities, governments, suppliers and shareholders.
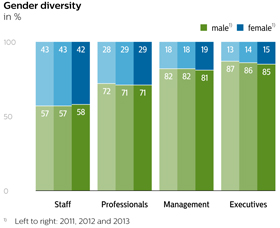
Progress has been made in ensuring a better representation of women in leadership roles: women now constitute 15% of Philips’ executive population, an increase of 1 percentage point year-on-year. Also, we have been appointing more local leaders: at year-end 2013, over 75% of senior leaders in countries were of local origin.
Going forward, driving D&I remains a priority for Philips. While female representation has also increased at professional and management level, Philips has made this an attention point for the coming year as well, recognizing that this is necessary in order to strengthen the leadership pipeline and create a strong basis for sustainable change. Therefore, a commitment has been made to increase the share of women in corporate grades 70 – 90 (refer to professionals and management category in the graphs) by 5 percentage points (per
72 Annual Report 2013
4 Group performance 4.2.3 - 4.2.4.1
grade) by 2016 compared to the 2012 baseline. Over the same period, the share of female executives is to increase to 20% of the total executive population.
Philips has two women on its Executive Committee and two female members of the Supervisory Board. Philips executives come from more than 30 countries.
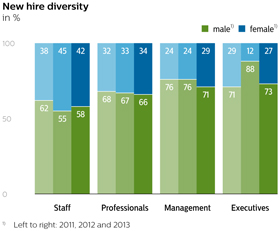
In 2013, Philips employed 35% females, a decrease of 1 percentage point compared to 2012.
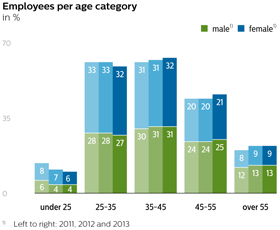
In 2013, employee turnover amounted to 16% (15% in non-manufacturing sites; 20% in manufacturing locations), an increase compared to 2012 caused by the changing industrial footprint, divestments at Healthcare, the company’s overhead reduction program and high turnover of manufacturing staff in our factories, mainly in the growth markets.
Employee turnover
in %
| 2011 | 2012 | 2013 | ||||||||||
Female | 13 | 14 | 18 | |||||||||
Male | 10 | 13 | 15 | |||||||||
|
| |||||||||||
Philips Group | 11 | 14 | 16 | |||||||||
Employee turnover: manufacturing vs non-manufacturing sites
in %
| 2012 | 2013 | |||||||
Manufacturing staff | 17 | 20 | ||||||
Non-manufacturing staff | 12 | 15 | ||||||
|
| |||||||
Group | 14 | 16 | ||||||
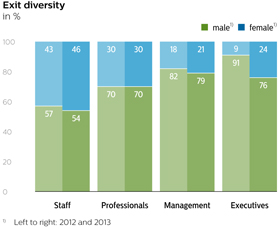
4.2.42.2.4 Employment
The year 20132016
The total number of Philips Group employees (Continued(continuing operations) was 114,689105,223 at the end of 2013,2016, compared to 116,082104,204 at the end of 2012.2015. Approximately 41%33% were employed in the Lighting sector, due to the continued vertical integration in this business. Some 32% were employedsegment, 23% in the Healthcare sector and approximately 16%Diagnosis & Treatment businesses, 21% in the Consumer Lifestyle sector.Personal Health businesses, 13% in the HealthTech Other segment and 10% in the Connected Care & Health Informatics businesses.
Philips Group
Employees per segmentin FTEs atyear-end
2014 - 2016
Annual Report 2013 73
4 Group performance 4.2.4.1 - 4.2.4.1
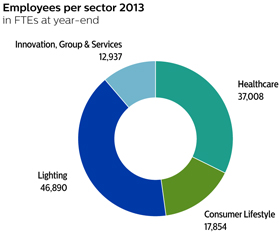
|
| |||||||||||
| 2014 | 2015 | 2016 | ||||||||||
|
| |||||||||||
Personal Health | 21,488 | 21,384 | 22,530 | |||||||||
Diagnosis & Treatment | 20,104 | 23,638 | 23,791 | |||||||||
Connected Care & Health Informatics | 9,119 | 10,290 | 11,033 | |||||||||
HealthTech Other | 13,019 | 11,493 | 13,570 | |||||||||
Lighting | 41,635 | 37,399 | 34,256 | |||||||||
Legacy Items | 43 | |||||||||||
|
| |||||||||||
Continuing operations | 105,365 | 104,204 | 105,223 | |||||||||
Discontinued operations | 8,313 | 8,755 | 9,508 | |||||||||
|
| |||||||||||
Philips Group | 113,678 | 112,959 | 114,731 | |||||||||
|
| |||||||||||
Compared to 2012,2015, the number of employees in continuing operations decreasedincreased by 1,393.1,019. The increase reflects insourced manufacturing for products with critical process capability requirements, increased resources in digital innovation across marketing and software, and growth through acquisition. This decrease reflects a reduction of 688 employees, mainly related to thetargeted growth was partially offset by industrial footprint rationalization at Lighting. It also reflects the departureLighting, a reduction of 705 employees due to divestmentstraditional sales roles, and a decrease in Healthcare.operational headcount in central functions.
Approximately 52%53% of the Philips workforce was located in mature geographies, and about 48%47% in growth geographies. In 2013,2016, the number of employees in mature geographies decreasedincreased by 1,614,67, mainly attributable to reductions relatingdue to the company’s overhead reduction programWellcentive acquisition in the Connected Care & Health Informatics segment. The number of employees in growth geographies increased by 952 driven by three factors: Global Business Services right-shoring supporting functions, further shift and therationalization in industrial footprint, reductionand new legislation introduced in Lighting. Growth geographies headcount increased by 221, primarily in the growth businesses in Consumer Lifestyle.China, which capped contingent workforce size at 10% and prompted insourcing of contingent workers.
Philips Group
Employees per sector
in FTEs at year-end
| 2011 | 2012 | 2013 | ||||||||||
Healthcare | 37,955 | 37,460 | 37,008 | |||||||||
Consumer Lifestyle | 15,471 | 16,542 | 17,854 | |||||||||
Lighting | 53,168 | 50,224 | 46,890 | |||||||||
Innovation, Group & Services | 13,001 | 11,856 | 12,937 | |||||||||
|
| |||||||||||
Continuing operations | 119,595 | 116,082 | 114,689 | |||||||||
Discontinued operations | 5,645 | 2,005 | 1,992 | |||||||||
|
| |||||||||||
| 125,240 | 118,087 | 116,681 | ||||||||||
Employees per geographic cluster
in FTEs atyear-end
2014 - 2016
|
| |||||||||||||||||||||||
| 2014 | 2015 | 2016 | ||||||||||||||||||||||
| 2011 | 2012 | 2013 |
|
| ||||||||||||||||||||
Western Europe | 32,901 | 31,126 | 30,514 | 29,105 | 28,590 | 28,326 | ||||||||||||||||||
North America | 28,129 | 26,134 | 25,080 | 22,283 | 23,614 | 23,839 | ||||||||||||||||||
Other mature geographies | 3,232 | 3,359 | 3,478 | 3,643 | 3,908 | 4,014 | ||||||||||||||||||
|
|
|
| |||||||||||||||||||||
Total mature geographies | 64,262 | 60,619 | 59,072 | |||||||||||||||||||||
Mature geographies | 55,031 | 56,112 | 56,179 | |||||||||||||||||||||
Growth geographies | 55,333 | 55,463 | 55,617 | 50,334 | 48,092 | 49,044 | ||||||||||||||||||
|
|
|
| |||||||||||||||||||||
Continuing operations | 119,595 | 116,082 | 114,689 | 105,365 | 104,204 | 105,223 | ||||||||||||||||||
Discontinued operations | 5,645 | 2,005 | 1,992 | 8,313 | 8,755 | 9,508 | ||||||||||||||||||
|
|
|
| |||||||||||||||||||||
Philips Group | 113,678 | 112,959 | 114,731 | |||||||||||||||||||||
| 125,240 | 118,087 | 116,681 |
|
| ||||||||||||||||||||
Philips Group
Employmentin FTEs atyear-end
in FTEs2014 - 2016
| 2011 | 2012 | 2013 | ||||||||||
Position at beginning of year | 119,775 | 125,240 | 118,087 | |||||||||
Consolidation changes: | ||||||||||||
acquisitions | 4,759 | 909 | — | |||||||||
divestments | (479 | ) | (1,024 | ) | (705 | ) | ||||||
comparable changes | (850 | ) | (3,398 | ) | (688 | ) | ||||||
Divestment and other changes in discontinued operations | 2,035 | (3,640 | ) | (13 | ) | |||||||
|
| |||||||||||
Position at year-end | 125,240 | 118,087 | 116,681 | |||||||||
of which: | ||||||||||||
continuing operations | 119,595 | 116,082 | 114,689 | |||||||||
discontinued operations | 5,645 | 2,005 | 1,992 | |||||||||
|
| |||||||||||
| 2014 | 2015 | 2016 | ||||||||||
|
| |||||||||||
Balance as of January 1 | 116,082 | 113,678 | 112,959 | |||||||||
Consolidation changes: | ||||||||||||
Acquisitions | 1,506 | 1,865 | 163 | |||||||||
Divestments | (247 | ) | (300 | ) | (571 | ) | ||||||
Changes in Discontinued operations | (2,132 | ) | 442 | 753 | ||||||||
Other changes | (1,531 | ) | (2,726 | ) | 1,427 | |||||||
|
| |||||||||||
Balance as of December 31 | 113,678 | 112,959 | 114,731 | |||||||||
|
| |||||||||||
In 2016, employee turnover amounted to 16.0% (of which 9.6% was voluntary) compared to 16.6% (9.7% voluntary) in 2015. 2016 turnover was mainly due to the changing industrial footprint in Lighting and our overhead reduction program.
Philips Group
Employee turnoverin %
2016
|
| |||||||||||||||||||
| Staff | Professionals | Management | Executives | Total | ||||||||||||||||
|
| |||||||||||||||||||
Female | 21.2 | 12.1 | 10.8 | 13.7 | 17.0 | |||||||||||||||
Male | 23.4 | 10.3 | 9.3 | 10.7 | 15.4 | |||||||||||||||
|
| |||||||||||||||||||
Philips Group | 22.4 | 10.8 | 9.6 | 11.2 | 16.0 | |||||||||||||||
|
| |||||||||||||||||||
Philips Group
Voluntary turnoverin %
2016
|
| |||||||||||||||||||
| Staff | Professionals | Management | Executives | Total | ||||||||||||||||
|
| |||||||||||||||||||
Female | 13.0 | 8.0 | 7.5 | 5.9 | 10.7 | |||||||||||||||
Male | 13.4 | 6.3 | 4.7 | 4.8 | 9.0 | |||||||||||||||
|
| |||||||||||||||||||
Philips Group | 13.2 | 6.8 | 5.3 | 5.0 | 9.6 | |||||||||||||||
|
| |||||||||||||||||||
The year 20122015
The total number of Philips Group employees (continuing operations) was 116,082104,204 at the end of 2012,2015, compared to 119,595105,365 at the end of 2011.2014. Approximately 43%36% were employed in the Lighting sector, due to the continued vertical integration in this business. Some 32% were employedsegment, 23% in the Healthcare sector and approximately 14%Diagnosis & Treatment businesses, 21% in the Consumer Lifestyle sector.Personal Health businesses, 11% in the HealthTech Other segment and 10% in the Connected Care & Health Informatics businesses.
Compared to 2011,2014, the number of employees in continuing operations decreased by 3,513. This1,161. The decrease reflects a reduction of 3,398 employees, mainly related to the company’s overhead reduction program, primarilyindustrial footprint rationalization at Lighting and IG&S. It also reflectsa reduction in third-party workers in the departurePersonal Health businesses, partly offset by the consolidation of 1,024 employees, mainly due to the industrial footprint reduction at Lighting, andVolcano acquisition in the addition of 909 employees from acquisitions (mainly Indal).Diagnosis & Treatment segment.
Approximately 52%54% of the Philips workforce was located in mature geographies, and about 48%46% in growth geographies. In 2012,2015, the number of employees in mature geographies decreasedincreased by 5,036, as the additional headcount from acquisitions was more than offset by reductions relating1,081, mainly due to the company’sVolcano acquisition in the Diagnosis & Treatment
7438 Annual Report 20132016
4 Group performance 4.2.5 - 4.2.62.2.5
overhead reduction program and the industrialsegment. The number of employees in growth geographies decreased by 2,242 largely driven by footprint reduction inrationalization at Lighting. Growth geographies headcount increased by 1,523, primarily in the growth businesses in Consumer Lifestyle.
4.2.52.2.5 Developing our people
Philips’ vision statement includesAt Philips, we operate with in belief that everyone has talent and that our people are critical to our organizational success. With over 105,000 talented and motivated employees all over the following affirmation: “Weworld, it is our people who continue to turn our strategy into reality. Our sustained growth and long-term success will be achieved by becoming a world-class talent-builder, offering attractive and rewarding work which contributes to the best place to work for people who share our passion. Together we will deliver superior value for our customers and shareholders.”
As partcareers of our drive to build a learning organization, learners at Philips are supported by a personalized University Portal accessible through all media, which facilitates individual learning journeys according to the 70 (on-the-job experience): 20 (coaching): 10 (classroom) model.
Our key 2013 objective in terms of leadership development was the creation of a Leadership Academy, based on a strategic framework that differentiates the learning needs of leaders at every level in the organization: Transformation, Transition and Accelerate.people.
The Academy flagship leadership development programs (including the market programShaping Marketsand the first-time manager programLeading People@Philips) are being co-created in collaboration with leading suppliers and business schools, with a strong emphasis on helping people to develop on the job and through external coaching and mentoring.Philips University
In 2013 we also started building2016, Philips University began implementing a stronger, more focused and cost-effectivetargeted approach to assessment for development. We introduced two new assessment tools – Manager Ready, a powerful virtual manager readiness assessment solution which was piloted in key markets (China, India, ASEAN, Central Europe, Benelux, Middle East & Turkey, and the US) and the renewed 360 program baseddelivering learning, focusing on the new Leadership Competencies and Philips behaviors.
Enrollment in functional curricula programs, including Marketing, Finance, IT, Sales, HR, Procurement and Innovation, decreased to 19,000 from 24,000 in 2012. Onestrategic needs, identified through strategic plans of the reasons forbusiness, strategic workforce planning, and talent reviews. These plans help ensure the effectiveness of our learning budget. Also, innovative learning techniques including gamification, video and micro-learning were infused into learning offerings.
For more information on our people’s development, please refer tosub-section 12.3.2, People development, of this reduction is that many functional curricula were reviewed and content rationalized in 2013, allowing us to redeploy the investment into development of new content.
number of enrollments
| 2009 | 2010 | 2011 | 2012 | 2013 | ||||||||||||||||
Core Curriculum programs | 5,500 | 20,000 | 39,500 | 43,000 | 32,500 | |||||||||||||||
The Legal curriculum hit the record of 63,000 enrollments, largely driven by the global roll-out of mandatory Compliance programs. In 2013, we also introduced local market programs with specific training modules for our staff in various geographies, including China, India and Africa.
We recorded 1,000 enrollments for the new Philips Excellence curriculum and around 2,500 registrations for the End2End curriculum programs.report.
Other programs
Philips has played a pioneering role in the Netherlands with its national Vocational Qualification Program (CV) and the Philips Employment Scheme (WGP). The CV project has been running since 2004 and targets employees who know their trade well, but do not have a diploma to prove it. CV provides a solution by awarding these people a recognized qualification. To date, some 1,800 participants have obtained a qualification that will help them in their future careers.
Via WGP, we offer vulnerable groups of external jobseekers a work experience placement, usually combined with some kind of training. The program started in 1983 and over 12,500 people have participated since. After participating in the program, about 70% find a job. In 2013, Philips employed some 150 persons via the WGP program, including young people with autism who are training to become a test engineer. Of the previous group of 10 autistic persons, eight found a job, one proceeded with a course of study, and the other is applying for jobs.
Training spend
Our external training spend in 2013 amounted to EUR 47.3 million, in line with EUR 46.9 million in 2012.
4.2.62.2.6 Health and Safety
At Philips we strive to make the world healthier and more sustainable through innovation. A critical aspect of which starts with our own people. We believe we are at our best when our employees are at theirs. A belief championed by our CEO in his recentFinancial Times article.
Philips strives for an injury-free and illness-free work environment, with a sharp focus on decreasingreducing the number of injuries and process improvements. Thisimproving processes. As of 2016, the Total Recordable Cases (TRC) rate is defined as a KPI,Key Performance Indicator (KPI), on which we set yearly targets for the company, Business Groups and our individual sectors.
Annual Report 2013 75
4 Group performance 4.2.6 - 4.2.7
industrial sites. For data comparability reasons, we also provide the Lost Workday Injury Cases (LWIC) rate.
We regret to report threetwo fatalities in 2013, all involving contractors.Philips Lighting in 2016. One of our sales officers passed away after a traffic accident in Pakistan. In Pakistan and Colombia, two contractors died while working on a Lighting project. In PolandIndia a contractor died while working on a reconstructiondue to injuries sustained at one of our factories. For both of these fatalities, a thorough investigation and root cause analysis were conducted. Corrective actions were implemented, including reminding our employees of safe driving rules and accelerating our injury prevention program to prevent such occurrences in the future.
In 2013,2016, we recorded 307 Lost Workday Injuries cases, i.e.174 LWIC, of which 71 in Philips Lighting. These are occupational injury cases where the injured person is unable to work one or more days after the injury,injury. This represents a significant decrease compared with 345213 in 2012.2015, and continues the downward trend since 2010. The LWIC rate decreased to 0.18 per 100 FTEs, compared with 0.21 in 2015. The number of Lost Workdays caused by these injuries amounteddecreased by 1,253 days (16%) to 9,603 days down from 12,6306,728 days in 2012. The rate2016.
In 2016, we recorded 395 TRC, of Lost Workday Injuries decreasedwhich 156 in Philips Lighting. These are cases where the injured employee is unable to 0.28 per 100 FTEs compared with 0.31work one or more days, or had medical treatment or sustained an industrial illness. We will continue to monitor this KPI and actively set reduction targets for all our businesses in 2012.2017.
Lost Workday InjuriesFor more information on Health and Safety, please refer tosub-section 12.3.4, Health and Safety performance, of this report.
per 100 FTEs
| 2009 | 2010 | 2011 | 2012 | 2013 | ||||||||||||||||
Healthcare | 0.20 | 0.25 | 0.20 | 0.22 | 0.19 | |||||||||||||||
Consumer Lifestyle | 0.26 | 0.26 | 0.23 | 0.25 | 0.24 | |||||||||||||||
Lighting | 0.76 | 0.80 | 0.64 | 0.45 | 0.41 | |||||||||||||||
Innovation, Group & Services | 0.07 | 0.13 | 0.04 | 0.05 | 0.04 | |||||||||||||||
|
| |||||||||||||||||||
Philips Group | 0.44 | 0.50 | 0.38 | 0.31 | 0.28 | |||||||||||||||
All sectors showed a decrease in the Lost Workday Injury rate. At Lighting, a dedicated action program, “Safety First”, was launched five years ago to drive down injury levels. In 2012, various regional Health & Safety improvement programs and peer audit programs were started and further expanded in 2013. Since 2010, Lighting achieved a strong decline in reported accident rates mainly attributed to active management involvement, launch of a new policy on machine safety improvements and further strengthening of management systems at major sites implementing the “Safety First” program. Lighting initiated a work stream to address Health & Safety management in Turnkey projects, headed by the Lighting market leaders. In efforts to further reduce injury rates, Lighting will also roll-out a Behavior Based Safety program in 2014.
The Health & Safety performance of Healthcare improved significantly in 2013. The Lost Workday Cases (LWC) decreased from 80 to 70 while the LWC Rate decreased from 0.22 to 0.19 compared to 2012 figures.
Healthcare targeted Health & Safety performance improvement actions within their Field Service Organization (FSO) to include organizational ownership and program management among other items. The FSO overall impact on the Sector Health & Safety performance decreased in 2013 compared to 2012. FSO Lost Workday Cases decreased from 46% to 38% of the Sector total while the number of Lost Workdays decreased from 49% to 38% of the Sector total compared to 2012. While the total number of Lost Workday Cases decreased in 2013, the number of Lost Workdays increased primarily due to isolated incidents with extended healing times.
Consumer Lifestyle continued to have low injury case levels. A new governance structure was launched in the Consumer Lifestyle organization to embed Health & Safety performance review and ownership in the businesses. The acquisitions Preethi and Povos started reporting their performance in 2013.
4.2.72.2.7 General Business Principles
The Philips General Business Principles (GBP) govern Philips’ business decisions and actions throughout the world, applying equally to corporate actions and the behavior of individual employees. They incorporate the fundamental principles withinfor all Philips business around the world. They set the minimum standard for doing business.
Thebusiness conduct for both individual employees and for the company and our subsidiaries. Our GBP also stand as a reference for the business conduct we expect from our business partners and suppliers. Translations of the text are available in most of the local32 languages, and are an integral part of the labor contracts in virtually all countries where Philips has business activities. Responsibility for compliance with the principles rests primarily with the management of each business. Every country organization and each main production site has a compliance officer. Confirmation of compliance withallowing almost every employee to read the GBP is an integral part of the annual Statementin their native language. Detailed underlying policies, manuals, training and tools are in place to give employees practical guidance on Business Controls that hashow to be issued by the management of each business unit. The GBP incorporate a whistleblower policy, standardized complaint reporting and a formal escalation procedure. The whistleblower policy is intended to supplement more specific local grievance or complaint procedures. If employees wish to raise an issue for which there is a more specific procedure or grievance channel available, they are free to use this, e.g. use the applicable human resources procedures for employment issues. However, in case of concerns of suspected violations of applicable laws or regulations employees are urged to always report these to either their GBP Compliance Officer or the Philips Ethics Line.
The global implementation of the Philips Ethics hotline seeks to ensure that alleged violations are registered and dealt with consistently within one company-wide system.
76 Annual Report 2013
4 Group performance 4.2.7 - 4.2.8
To drive the practical deployment ofapply the GBP a setin theirday-to-day work environments.
In addition, there are separate Codes of directives has been published, which are applicable to all employees. There are also separate directives whichEthics that apply to employees working in specific categoriesareas of employees, e.g.our business, i.e. the Supply ManagementProcurement Code of Ethics and the Financial Code of Ethics. Details of these can be found atwww.philips.com/gbp.
In 2013, we introduced a mandatory sign-off on GBP for all executives.gbp.
Business Integrity Survey
In June 2013, a business integrity survey has been rolled outAs part of our unyielding effort to all employees in eight most relevant languages to get their inputraise GBP awareness and create engagement throughout the organization on the effectivenessdifferent forms acting with integrity can take, each year a GBP communications and training plan is deployed. In 2016 a number of new initiatives were undertaken through various channels such as our spotlight article series, Quick Reference Cards forat-a-glance guidance on how to handle a number of common GBP concerns as well as returning programs such ase-Learnings which were deployed early in the year. Many of these initiatives contributed to building momentum towards our annual Dialogue Week in the third quarter, which serves as the highlight of our GBP program. program for the year. During 2016’s Dialogue Week hundreds of Philips teams held open and frank discussions on what Acting with Integrity means to them, and posted pictures of their sessions on the Philips social platform using the hashtag, #integritymatters.
The survey provides inputGBP form an integral part of labor contracts in virtually every country in which Philips operates. It is the responsibility of each employee to live up to our GBP, and employees are requested to affirm their commitment after having completed their GBP
Annual Report 2016 39
Group performance 2.2.7
e-training. In addition, employees in respective specialized areas mustsign-off on the Financial and Supply Management Codes of Ethics. Executives are requested tosign-off on the General Business Principles to confirm a numberrenewed commitment to awareness of aspects that are recognized to influenceand compliance with the respective codes each year.
The GBP Review Committee is responsible business conduct. The insights that were derived from this survey were used to further enhancefor the effectivenesseffective deployment of the currentGBP and for generally promoting a culture of compliance activitiesand ethics within Philips. The GBP Review Committee is a body chaired by the Chief Legal Officer, and its members include the Chief HR Officer, the Chief Market Leader and the Chief Financial Officer. They are supported in the implementation of their initiatives by a Committee Secretariat, and a network of GBP Compliance Officers who are appointed in all countries and at all major sites where Philips has operations.
Related roles and responsibilities are laid down in the Charter of the GBP Review Committee. In 2016, in response to external regulatory developments in business ethics and compliance, a revised charter was deployed by the GBP Review Committee. This newly updated charter impacted the composition of the GBP Review Committee, the roles and responsibilities of its members as well as the composition, roles and responsibilities of the GBP Compliance function. To strengthen monitoring and oversight of GBP compliance road map.within Philips, a mandatory annual GBP self-assessment questionnaire was introduced. The GBP Review Committee Secretariat receives an overview of the results of this self-assessment and can take action when deemed necessary. We believe this has created a more robust network equipped with the requisite skills and support to monitor and enhance compliance in the increasingly regulated environments in which Philips operates.
The overall conclusionGBP are supported by established mechanisms that could be drawn fromensure standardized reporting and escalation of concerns. These mechanisms are based on the survey isGBP Reporting Policy that the Philips culture provides a sound basisurges employees to build upon, and that leaders are well positioned to manage integrity even more actively so as to support an environment in which employees feel comfortable to discuss or report potential issues and dilemmas.
Ongoing training
Theany concerns they may have regarding business integrity survey provided the kickoff of a global GBP communications campaign, culminating in a global event called the ‘GBP dialogue week’ held in October 2013, in which managers were invited to hold sessions with their teams to discuss GBPconduct in relation to their function or business. In their feedback, participating managers indicated they experienced this week as very meaningful and worth repeating.
The mandatory web-based GBP training, which is designed to reinforce awareness of the need for compliance with the GBP is availableeither through a GBP Compliance Officer or through the Philips Ethics Line. The Philips Ethics Line enables employees and also third parties to report a concern either by telephone or online via a web intake form in 23 languages. Every quarter,a variety of different languages 24/7 all new hires get an invitation to take this trainingyear round. All concerns raised are registered consistently in their local language. In addition, targeted audiences have been invited to take a web-based training on specific topics, including anti-bribery, antitrust, privacysingle database hosted externally from Philips by a third party and export controls.are investigated uniformly in accordance with standardized investigation procedures.
More information on the Philips GBP can be found inchapter 6,5, Risk management, of this report. ResultsThe results of the monitoring measures in place are providedgiven in the chapter 13, Sustainability statements,sub-section 12.3.5, General Business Principles, of this report.
4.2.8 Stakeholder engagement2.2.8 Working with stakeholders
In organizing ourselves around customers and markets, we create dialogues with our stakeholders in order to explore common grounds inground for addressing societal challenges, buildbuilding partnerships and jointly developdeveloping supporting ecosystems for our innovations. Working with partners is crucial in deliveringinnovations around the world. To deliver on our vision to make the world healthier and more sustainable through innovation.innovation, working with partners is crucial. An overview of stakeholders and topics discussed is provided inchapter 13,12, Sustainability statements, of this report.
Strategic PartnerFor more information on our stakeholder engagement activities in 2016, please refer tosub-section 12.3.7, Stakeholder Engagement, of this report.
2.2.9 Supplier sustainability
Royal Philips has a direct business relationship with approximately 8,500 product and component suppliers and 22,000 service providers. In many cases the sustainability issues deeper in our supply chain require us to intervene beyond tier 1 of the World Economic Forumchain.
Supplier sustainability strategy
In 2013,Managing our large and complex supply chain in a socially and environmentally responsible way requires a structured and innovative approach while being transparent and engaging with a wide variety of stakeholders. Insights gained through the stakeholder engagement process are used as an input to develop our supplier sustainability strategy. We then translate this strategy into five dedicated programs:
1. Supplier sustainability compliance
Combination of contractual sustainability commitment of Philips entered intosuppliers defined in two core Supplier Sustainability policy documents (Supplier Sustainability Declaration (SSD) and Regulated Substances List (RSL)) and additional transparency requirements to provide information and evidence on topics mentioned in SSD and RSL.
2. Supplier sustainability performance
This program aims to bring about structural, sustainable improvement in our supply chain while focusing on health and safety, remuneration and benefits, and workforce turnover. This approach has been designed to replace the Philips audit program and was piloted in 2016 on a strategic partnership withsample of 93 supplier sites in China.
3. Responsible sourcing
This program aims to manage sustainability risks related to minerals mined in conflict-affected and high-risk regions. Philips addresses the World Economic Forum. The Forum’s mission of ‘Improving the statecomplexities of the world’ closely matches our own and the Forum engages business, political, academic and other leaders of societyminerals supply chains through continuous due diligence process combined with multi-stakeholder initiatives to shape global, regional and industry agendas in an informal, action focused way.
During the first year of our partnership, Philips contributed significantly to the Forum’s agenda, with active participation in three industry groups, numerous speaking roles at the various meetings and a co-chairmanship of Frans van Houten at the World Economic Forum on Africa summit in Cape Town. Furthermore, Deborah DiSanzo, CEO Healthcare, has accepted to chair a thought leadership initiative that will explore Health Systems Leapfrogging in Emerging Markets.
The Philips Center for Health and Well-being
Over the last 5 years, Philips has run The Philips Center for Health and Well-being as a knowledge-sharing forum that raised the level of dialogue on key societal questions that matter most to citizens and communities. In 2013, the Aging Well think tank, one of the initiatives of the Center, actively participated in a number of events, such as the Aging in America conference of the American Society on Aging, the International Congress on Telehealth and Telecare of the King’s Fund in the UK, and a well-attended expert roundtable to explore next-generation technologies for aging well. As of 2014, the activities of the Center will be merged with our other stakeholder engagement platforms and initiatives across the businesses and markets.
Partnering to improve healthcare in Africa
In November 2013, Philips and AMREF Flying Doctors announced that they will work together in a partnership to structurally improve healthcare infrastructure and provision in Africa. Both parties will leverage their respective strengths to help tackle inadequatelyresponsible sourcing.
40 Annual Report 2013 772016
4 Group performance 4.2.8 - 4.2.92.2.9
equipped medical facilities and inadequately trained staff as a way to better address the growing incidence of non-communicable diseases across the continent. AMREF and Philips will also work with local stakeholders to develop and implement large-scale projects to make healthcare more accessible to the local population.4. Circular procurement
We sought similar partnerships in our ‘Fabric of Africa’ campaign launched in 2013. The campaign’s primary intentPhilips’ ambition is to enter into public/private partnerships with localincrease its circular business proposition and international stakeholdersit has set a 2020 target to improve healthcare deliveryachieve 15% circular revenues. This program identifies how procurement can contribute to our ambition to be a provider of circular solutions and services.
5. Environmental footprint China
This program serves to reduce the environmental footprint of our suppliers’ sites in the areasChina. Furthermore, we want to focus on increasing supply chain transparency in terms of non-communicable diseases, maternal and child health, healthcare infrastructure, technology and clinical training. Philips has developed innovative, low-resource setting health technologies and e-Health solutions to address the challenges in the African market. More information on this campaign can be found at www.philips.com/FabricofAfrica.
Working on global issues
In 2013, Philips participated in a number of international conferences and events focused on sustainable development and climate change. These included the Climate Week in New York City (organized by The Climate Group), co-launching the ‘Cities & Aging’ policy snapshot with the Global Cities Indicator Facility in Toronto, as well as the United Nations Climate Change Conference in Warsaw, Poland. Most notably we were invited as the only private sector company to join the UN Secretary General’s Chief Executives Board, with Ban Ki Moon and part of his UN leadership team. Here we highlighted that energy efficient and intelligent LED solutions will result in a 30% reduction of electricity consumption by the global lighting market in 2020 compared to 2006. This equates to a reduction of 515 megaton CO2 emissions, while also significantly reducing energy bills by around EUR 100 billion in 2020.
Innovation event
In November, Philips Research organized an Innovation Event at the High Tech Campus with external guest speakers, to share best practices, share Philips corporate ambition for more sustainable product solutions; initiate new innovative concepts to radically improve access to healthcare; new products that decrease food waste and help meet world food security goals;environmental footprint and to identify new approaches todrive responsible use of resources through our supply chain. An example is the circular economy, focusing on concepts such as “design for reuse” and improved recycling efficiency. We believe these global challenges can only be addressed through Open Innovation and regional partnerships with all stakeholders involved. We collaborate with academics, universities through direct partnerships, Open Innovation initiatives and government driven initiatives, like FP7 and Horizon 2020, two European Union research programs.
4.2.9 Social Investment Programs
In 2013, we continued to develop and localize our global social investment program, SimplyHealthy@Schools. In Brazil, 230 employees fromcollaboration of Philips offices and factories registered to volunteer inFal@ndo em Bem-Estar, the local adaptation of SimplyHealthy@Schools. The program aims to empower kids from 8 to 12 to change their habits, health and environment and educates teenagers about safe sex and sexual transferable diseases prevention, a critical national issue.
Philips Brazil also rolled-out a new initiative in 2013 with an important Healthcare partner, Fleury. Based on the same topics and questions explored in ourFal@ndo em Bem-Estar,the project consists of a giant interactive board game, developed to be used in schools throughout the entire country by Fleury and Philips employees.
In North America, the Philips Cares program provides ways for employees to work together to improve people’s lives by creating healthy, sustainable communities that contribute to the success and well- being of future generations. This can take many forms: from helping a child to excel in math, to providing safety and energy efficient home improvements to the disadvantaged, to raising awareness about the importance of cardiac health. In 2013 alone, more than 5,000 employees participated in volunteer opportunities that suited their needs, schedules, and passions in partnerships with organizations such as American heart Association, March of Dimes, and Rebuilding Together.
At the end of 2012 we signed a three year partnership agreement with the Royal Dutch Football Association (KNVB) to support their WorldCoaches program by installing more than 100 solar lighting ‘Light Centers’ in rural communities throughout Africa and South America. Working together with local communities and the KNVB, the Light Centers will provide safe and functional space for sports and other community activities after dark.
Throughout 2014, Philips will roll out a new three pillar social investment strategy, comprising of a disaster relief program, a local community investment program
78 Annual Report 2013
4 Group performance 4.2.9 - 4.2.10
and a signature social innovation program. The main focus will be on access to healthcare, access to light and healthy futures.
4.2.10 Supplier sustainability
Many of our products are being created and manufactured in close cooperation with a wide rangeChinese NGO, the Institute of business partners, both in the electronics industry and other industries. Philips needs suppliers to share our commitment to sustainability, and not just in the development and manufacturing of products but also in the way they conduct their business. We require suppliers to provide a safe working environment for their workers, to treat workers with respect, and to work in an environmentally sound way. Our programs are designed to engage and support our suppliers on a shared journey towards continuous improvement in supply chain sustainability.
As a leading company in sustainability, Philips will act as a catalyst and support our suppliers in their pursuit of continuous improvement of social and environmental performance. We recognize that this is a huge challenge requiring an industry-wide effort in collaboration with other societal stakeholders. Therefore, we remain active, together with peers in the industry, in the Electronic Industry Citizenship Coalition (EICC) and encourage our strategic suppliers to join the EICC too. We will also continue to seek active cooperation and dialogue with other societal stakeholders including governments and civil society organizations, either directly or through institutions like the EICC, the multi- stakeholder programs of the Sustainable Trade Initiative IDH, and the OECD.Public Environment (IPE).
Supplier Sustainability Involvement Program
The Philips Supplier Sustainability Involvement Program is our overarching program to help improve the sustainability performance of our suppliers. We create commitment from our suppliers by requiring them to comply with our Regulated Substances List and the Philips Supplier Sustainability Declaration, which we include in all purchasing contracts. The Declaration is based on the EICC code of conduct and we added requirements on Freedom of Association and Collective Bargaining. The topics covered in the Declaration are listed below. We monitor supplier compliance with the Declaration through a system of regular audits.
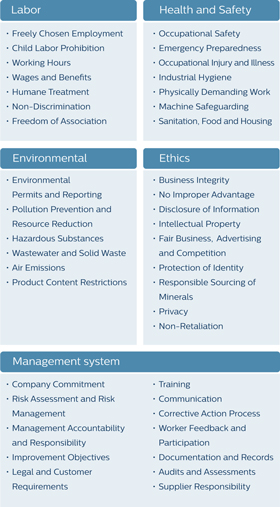
2013 supplier audits in risk countries
In 2013, Philips conducted 200 full-scope audits, including four joint audits conducted on behalf of Philips and other EICC member companies. Additionally, 59 audits of potential suppliers were performed. Potential suppliers are audited as part of the supplier approval process, and they need to close any zero-tolerance issues before they can start delivering to Philips. In our new audit approach, we place more focus on capacity building programs to realize structural improvements leading to better audit results.
As in previous years, the majority of the audits in 2013 were done in China. The total number of full-scope audits carried out since we started the program in 2005 is 2,162. This number includes repeated audits (131 in 2013), since we execute a full-scope audit at our risk suppliers every three years. The audit program covers 90% of our spend with risk suppliers.
Annual Report 2013 79
4 Group performance 4.2.10 - 4.2.11
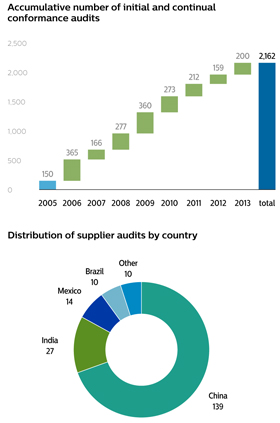
Audit findings
We believe it is important to be transparent about the issues we observe during the audits. Therefore we have published a detailed list of identified major non-compliances in our annual report since 2010.
To track improvements Philips measures the ‘compliance rate’ for the identified risk suppliers, being the percentage of risk suppliers that was audited within the last 3 years, and do not have any – or have resolved all major non-compliance. During 2013 we achieved a compliance rate of 77% (2012: 75%).
Please refer tosub-section 13.2.2, 12.3.8, Supplier indicators, of this report for the detailed findings of 2013.
Supplier development and capacity building
Based on many years of experience with the audit program, we know that a combination of audits, capacity building, consequence management and structural attention from management is crucial to realize structural and lasting changes at supplier production sites. In 2013 we continued our focus on capacity building initiatives which are offered to help suppliers improve their practices. Our supplier sustainability experts in China, India and Brazil organized trainings, visited suppliers for on-site consultancy, conducted pre-audit checks and helped suppliers to train their own employees on topics like occupational health and safety, emergency preparedness and chemicals management.
We also teamed up with peers in the industry and civil innovative multi-stakeholder initiative sponsored by the Sustainable Trade Initiative (Initiatief Duurzame Handel). The goal is to improve working conditions for more than 500,000 employees in the electronics sector. Two years ago the program was kicked-off in China’s Pearl River Delta, and now expanded to also cover supplier factories in the Yangtze River Delta area. A total of 15 Philips suppliers are now participating in the program.
4.2.11 Conflict minerals: issues further down the chain
In line with Philips’ commitment to supply chain sustainability, we feel obliged to implement measures in our chain to ensure that our products are not directly or indirectly funding human atrocities in the Democratic Republic of the Congo (DRC). We are concerned about the situation in eastern DRC where proceeds from the extractives sector are used to finance rebel conflicts in the region. Philips is committed to address this issue through the means and influencing mechanisms available to us, even though Philips does not directly source minerals from the DRC and mines are typically seven or more tiers removed from our direct suppliers.
Although this region has a rich supply of minerals, its economy has collapsed due to decades of ongoing conflict. In an effort to prevent minerals from financing war, many companies worldwide have shied away from purchasing minerals from the DRC, creating a de facto embargo in a region where mining is often the only source of income for local communities. We decided that this was not the right approach and instead of avoiding the DRC, we took the more difficult road, supporting conflict-free sourcing from the DRC. To promote cooperation and economic growth in the region outside the control of the rebels, we launched the Conflict-Free Tin Initiative. This initiative introduces a tightly controlled conflict-free supply chain of tin from a mine in the DRC all the way down to an end-product. Philips is one of the industry partners brought together by the Dutch government that initiated the program in 2012. To underline our commitment to conflict-free sourcing, we joined a delegation in February 2013 to visit the mine and engage with different local stakeholders in the DRC. At the end of 2013 we reached
80 Annual Report 2013
4 Group performance 4.2.11 - 4.3.1
an important milestone when the first end-user products containing this conflict-free tin were made in our Philips Lighting factory.
During 2013 we continued our work with 349 priority suppliers to raise awareness and conduct supply chain investigations to determine the origin of the metals in our products. This resulted in the identification of 191 smelters in our supply chain involved to process these metals. We publish this smelter list on our website, creating transparency at deeper levels in our supply chain of those actors that we believe hold the key towards effectively addressing the concerns around conflict minerals. Philips encourages all smelters in our supply chain to join the Conflict Free Smelter program and demonstrate their conflict-free status via independent third party assessments. 29% of the smelters identified by our suppliers have now successfully passed the Conflict Free Smelter assessment. As sufficient conflict-free smelters for all four metals (Tin, Tantalum, Tungsten and Gold) will become available, Philips plans to direct its supply chain towards these smelters.
We believe that industry collaboration and stakeholder dialogue are important to create impact at these deeper levels of our supply chain. Therefore Philips continued its active contribution to the Conflict Free Sourcing Initiative, a joint effort of the EICC and GeSI and others to positively influence the social and environmental conditions in the metals extractives supply chain. To assist in developing a due diligence standard for conflict minerals, we continued our participation in the multi-stakeholder OECD-hosted program for the implementation of the “OECD Due Diligence Guidance for Responsible Supply Chains of Minerals from Conflict-Affected and High-Risk Areas”. We also continued our engagement with relevant stakeholders including the European Parliament, other industry organizations and local as well as international NGOs in Europe and the U.S. to see how we can resolve the issue.
In line with the US Dodd-Frank Act, we started preparations for publishing a Philips Conflict Minerals Report, including an audit of the Conflict Minerals Report as required by the Act.
For more details and result of our supplier sustainability program, please refer to sub-section 13.2.2,the Philips Lighting Investor Relationswebsite for details on the Lighting Supplier indicators, of this report.
4.3 Environmental performanceSustainability program.
EcoVision2.3 Environmental performance
Philips has a long sustainability history stretching all the way back to our founding fathers. In 1994, we launched our first program and set sustainability targets for our own operations. Next, we launched our first EcoVisionsecond program in 1998, which focused on the environmental dimension of our operations and products. We also started to focus on sustainability in our supply chain in 2003. We extended our scope further in 2010 by including the social dimension of products and solutions, which is now reflected in our renewed company vision stating that wevision:
We strive to make the world healthier and more sustainable through innovation. Our goal is to improve the lives of 3 billion people a year by 2025.
In 2016, our CEO Frans van Houten launched our new Royal Philips five-year sustainability program, ‘Healthy people, sustainable planet’, addressing both social and environmental challenges and including associated targets to be achieved by 2020.
The main elementsthree pillars of the EcoVision‘Healthy people, sustainable planet’ program are:
Improving people’s livesCreating value for our customers throughSustainable Solutions
Green Product salesLeading by example in ourSustainable Operations
Green Innovation, including Circular EconomyMultiplying our impact by drivingSustainability through our supply chain
More details on the new program, as well as the initial results, have been addressed in this report.
Green Operations
HealthEvery year, Royal Philips publishes a full Integrated Annual Report. Our independent auditor Ernst & SafetyYoung (EY) has not only audited our financial information but has also provided reasonable (highest level) assurance on Sustainability Information inchapter 12, Sustainability statements, of this report and sectionssection 2.2, Social performance, of this report andsection 2.3, Environmental performance, of this report. Please refer tosection 12.5, Assurance report of the independent auditor, of this report. With this, Philips is a frontrunner in this field.
Please refer to the Philips Lighting Investor Relationswebsite for more details on the new Lighting sustainability program and results.
Supplier Sustainability
In this environmentalEnvironmental performance section an overview is given of the most important environmental parameters of the new program. Improving people’s lives, Health &and Safety, and Supplier Sustainability are addressed in the Social performance section. Details of the EcoVision‘Healthy people, sustainable planet’ parameters can be found in thechapter 13,12, Sustainability statements, of this report.
4.3.12.3.1 Green Innovation
Green Innovation is the Research & Development spend related to the development of new generations of Green Products and Solutions and Green Technologies. We announced in 2010 our plan
Sustainable Innovation is the Research & Development spend related to investthe development of new generations of products and solutions that address the United Nations’ Sustainable Development Goals 3 (“to ensure healthy lives and promote well-being for all at all ages”) or 12 (“to ensure sustainable consumption and production patterns”). With regard to the latter, Philips set a cumulativetarget of EUR 27.5 billion in Green Innovation during(cumulative) for its HealthTech businesses over the coming 5 years. five years as part of the ‘Healthy people, sustainable planet’ program.
In 20132016, Philips invested some EUR 509558 million in Green Innovation withwhile the strongest contribution from Lighting mainly stemming from investmentsHealthTech businesses invested EUR 1.3��billion in LED.Sustainable Innovation.
Philips Group
Green Innovation per segmentin millions of EUR
2014 - 2016
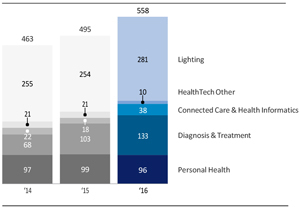
Diagnosis & Treatment businesses
Philips develops innovative Diagnosis & Treatment solutions that enable first-time right diagnosis, precision interventions and therapy, while respecting
Annual Report 2013 812016 41
4 Group performance 4.3.1 - 4.3.12.3.1
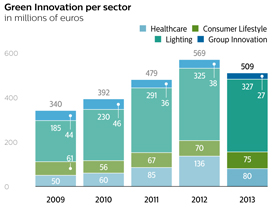
Healthcare
Philips Healthcare develops innovative solutions across the continuumboundaries of carenatural resources. Investments in collaborating with clinicians and customersGreen Innovation in 2016 amounted to improve patient outcomes, provide better value, and expand accessEUR 133 million, a 29% increase compared to care. While doing so, we take into account all2015. All Philips Green Focal Areas andare taken into account while we aim to reduce environmental impact over the total lifecycle, with alifecycle. Energy efficiency is an area of focus, on energy efficiency and dose reduction. Healthcare investments in Green Innovation in 2013 amounted to EUR 80 million, a significant decrease compared with 2012. This can be attributed to a number of significant Healthcare projects which were completed in 2012. Other areas covered include increased levels of recycled content inespecially for our products, remote servicing and closinglarge imaging systems such as MRI. Closing the materials loop e.g. throughis another area where our focus on developing upgrading strategies, parts harvestingpathways has enabled extended product life and refurbishing programs as well as reducing environmentally relevant substances from our products. Philips Healthcaretherefore reduced materials use and lower cost. Our Diagnosis & Treatment businesses actively supportssupport a voluntary industry initiative (COCIR) for improvingto improve the energy efficiency of medical imaging equipment. Moreover, we are actively partnering with multiple leading care providers to look together for innovative ways to reduce the environmental impact of healthcare, for example by optimizing energy efficientmaximizing energy-efficient use of medical equipment.equipment and optimizing lifecycle value.
Consumer LifestyleConnected Care & Health Informatics businesses
Philips innovates with connected health IT solutions that integrate, collect, combine and deliver quality data for actionable insights to help improve access to quality care, while respecting the boundaries of natural resources. It is our belief that well-designede-health solutions can reduce thetravel-related carbon footprint of healthcare, and improve access and outcomes. Investments in Green Innovation at Consumer Lifestylein 2016 amounted to EUR 7538 million, a doubling compared to 2015. All Philips Green Focal Areas are taken into account as we aim to reduce environmental impact over the total lifecycle. Energy efficiency and material reduction are the main areas of focus.
Personal Health businesses
Continuous high R&D investments at our Personal Health businesses are also reflected in Green Innovation spend, which amounted to EUR 7096 million in 2012 and2016, compared with EUR 99 million in 2015. The investments resulted in an increase inhigh Green Product salesRevenues in all Business Groups. The sectorPersonal Health businesses continued itstheir work on improving the energy efficiency of itstheir products, closing the materials loop (e.g. by using recycled materials in products and packaging) and the voluntaryphase-out of polyvinyl chloride (PVC), brominated flame retardants (BFR) and, Bisphenol A (BPA) and phthalates from, among others, food contact products. In particular, more than 80%close to 100% of the shavingMother & Child Care, Male Grooming and groomingOral Healthcare products are completely PVC/BFR-free.BFR free.
Lighting
AtPhilips Lighting we strivestrives to make the world healthier and more sustainable through energy-efficient lighting solutions. In 2013light. With a 2016 investment of EUR 281 million in Green Innovation, Lighting invested EUR 327 million11% more compared to 2015. Increasing investments in line with EUR 325 million in 2012digital solutions and connectivity have led to develop products and solutions that address environmental and social challenges. Investments are made to advance the LED revolution, which can substantially reduce carbon dioxide emissions (by switching from inefficient to energy-efficient lighting). Recent examples include the TLED and the Philips LUXEON Altilon product familyfurther improvements in the Mercedes S-class Intelligentarea of energy efficiency. In 2016, Philip Lighting System, making thisteamed up with the Dubai Municipality to create the Dubai Lamp Initiative, a unique research partnership that resulted in the development of the world’s most energy-efficient commercially available LED lamp. By replacing conventional lamps with the Dubai Lamp – the first car in which allcommercially available 200 lumen per watt LED lamp – households and enterprises can reduce electricity used for lighting functions are LED. Furthermore, Lighting has developed solutions for water purification, solar LEDs for ruralby more than 90% compared to incandescent technologies. In addition to raising light and urban locations, and LED solutions for agricultural applications supporting biodiversity.energy efficiency to new levels, the Dubai Lamp is extremely durable with an average lifespan of up to 15 times that of conventional lamps.
Philips Group InnovationHealthTech Other
Philips Group InnovationHealthTech Other invested EUR 2710 million in Green Innovations, spread over projects focused on global challenges related to water, air, waste, energy, food, Circular Economy, and access to affordable healthcare. Group Innovation deployedThe Research organization within HealthTech Other used the Sustainable InnovationsInnovation Assessment tool, in which innovation projects are mapped, categorizedevaluated and scored along the environmental and social dimensiondimensions, in order to identify those innovation projects that most strongly drive sustainable innovation. One examplesustainability. Transfers of Research projects include a Group Innovation project is relatedLives Improved calculation to low cost solar-powered LED lighting.
Whenassess what the sun sets in Africa, over 600 millionproject’s contribution will be to Philips’ vision to improve the lives of 3 billion people ona year by 2025. Intellectual Property & Standards has developed a Sustainable IP portfolio for which the continent rely on kerosene and candles to seespend has been included in the dark. For most of the population who are at the Base of the Pyramid (BoP) these lighting solutions remain costly, give only low illumination and are highly non-sustainable. The BoP comprises four billion people living in our world today, and in the poorest socio-economic group. We engaged directly with BoP consumers in some of the poorest areas of Africa to understand their needsabove total for lighting and energy and how they wish to use that light. The insights derived from these studies have resulted in a re-design of our entire portfolio of solar lighting for the consumer. HealthTech Other.
At the same time the new products take advantageend of the very latest developments in LED, solar panels and battery technology, resulting in a2016, Philips’ IP portfolio that is flexible in use-case, has a high performance, is robust and long lasting.consisted of 5.7% green patent families. All this is providedfamilies are labeled with at price-points that match the spending power of the target consumers with a payback time within 3-6 months.
82 Annual Report 2013
4 Group performance 4.3.1 - 4.3.2
Energy efficiency of products
Energy efficiency is a keyleast one Green Focal Area for our Green Products. About 97% of the energy consumed during the use phase of our products is attributable to Lighting products, according to our analysis. The remaining 3% is split over Consumer Lifestyle and Healthcare. Therefore, we focus on the energy efficiency of our Lighting products in the calculation. The annual energy consumption per product category is calculated by multiplying the power consumption of a product by the average annual operating hours and the annual pieces sold and then dividing the light output (lumens) by the energy consumed (watts). The average energy efficiencyArea. In 2016, 3.3% of our total productnew patent filings were flagged as relating to green patent family. As IP is an extension of Philips’ innovation efforts, the portfolio improved some 2%percentage related to green patents is multiplied by our annual patent portfolio costs to determine Philips’ yearly investment in 2013 (19% compared to 2009).Green IP.
In 2013 LED sales continued to advance well, but demand for conventional lighting remained fairly stable due to the challenging economic environment. Since the number of traditional lamps sold is significantly higher than LEDs, the energy efficiency improvement of the total Lighting portfolio in 2013 was limited. As the traditional incandescent lamp will be banned in more countries, we expect the energy efficiency improvement to advance in the coming years. Our target for 2015 isWhile a 50% improvement compared to the 2009 baseline. In this target setting, assumptions were made on the speed of the regulatory developments in this area, which stayed behind expectations. Therefore, in 2015 the target of 50% improvement will probably not yet be achieved. Further details on this parameter and the methodologyproduct can be foundclassified as green because it incorporates an environmentally friendly technology, such technology cannot always be protected in the document ‘Energy efficiencya patent because of Philips products’ at www.philips.com/sustainability.a lack of patentability over thestate-of-the-art technology. Therefore, there is not necessarily a correlation between green patents and Green Technologies in Green Products and Solutions.
Circular economyEconomy
For a sustainable world, theThe transition from a linear to a circular economy is essential to create a necessary boundary condition.sustainable world. A circular economy aims to decouple economic growth from the use of natural resources and ecosystems by using thosethese resources more effectively. It is a driver forof innovation in the areas of material-, component-material, component and product reuse,re-use, as well as new business models such as system solutions and services. In a circular economy, the more effective (re)use of materials enables to createthe creation of more value, both by means of cost savings and by developing new markets or growing existing ones. The ‘Healthy people, sustainable planet’ program includes a target to generate 15% of our revenues in 2020 from Circular Products and Solutions.
In 2013, Philips started its circular economy approach. Key characteristics are customer access over ownership (pay for
42 Annual Report 2016
Group performance e.g. pay per lux or pay per scan), business model innovations (from transactions to relationships via service and solution models), reverse cycles (including partners outside current value chains e.g. upstream-downstream integration and co-creation) and logistics, innovations for material-, component-, and product reuse, products designed for disassembly and serviceability. In 2013, Philips became a global partner of the Ellen McArthur Foundation, the leading organization on the concept of circular economy.2.3.1
ClosingFor more information on our Circular Economy activities and the material loopprogress towards targets in 2016, please refer to
In 2013 we restated the 2009 baseline for global collection and recycling amounts at around 22,500 tonnes (excluding TV and AVM&A)sub-section 12.4.1, Circular Economy, based on the data retrieved from the WEEE collection schemes and from our own recycling and refurbishment services (mainly Healthcare). The amount of collection and recycling for 2012 (reported in 2013) was calculated at 31,000 tonnes, excluding AVM&A (which was calculated at 9,000 tonnes). A small improvement comparedthis report. Please refer to the amountPhilips Lighting Investor Relationswebsite for 2011 due to an increase in recycled products in Healthcare.
Recycled materials
We calculated the amount of recycled materials in our products in 2013 at some 14,000 tonnes (2012: 15,000 tonnes), by focusingmore details on the material streams plastics, aluminum, refurbishedcircular products and spare parts harvesting depending on the relevance in each sector.
Our target is to double the global collection and recycling and the amountsolutions of recycled materials in our products by 2015 compared to 2009. Further details on this parameter and the methodology can be found in the document ‘Closing the material loop’ at www.philips.com/sustainability.Philips Lighting.
4.3.22.3.2 Green Product salesRevenues
Green ProductsRevenues are generated through products and solutions which offer a significant environmental improvement in one or more Green Focal Areas: Energy efficiency, Packaging, Hazardous substances, Weight, Recycling and disposalCircularity, and Lifetime reliability. Sales from Green ProductsRevenues, excluding the Lumileds and Automotive business, increased fromto EUR 11.015.7 billion in 2012 to EUR 11.8 billion in 2013,2016, or 51%64.1% of sales (61.0% in 2015), thereby reaching the target of 50% we set ourselvesa record level for 2015.Philips.
All sectors contributed to the growth in Green Product sales, but Consumer Lifestyle achieved the highest Green Product nominal sales growth, followed by Healthcare and Lighting. The exclusion of AVM&ALumileds and Automotive had a 10% positive1% negative impact in 2013 on the total Green Product sales percentageRevenues percentage.
Philips Group
Green Revenues per segmentin millions of Consumer Lifestyle (2013: 49%).EUR
2014 - 2016
Annual Report 2013 83
4 Group performance 4.3.2 - 4.3.3
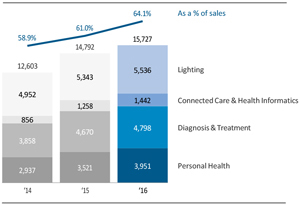
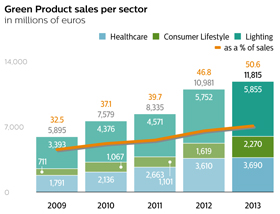
New Green Products from each sector include the following examples.
Healthcare
During 2013, Healthcare expanded the Green Product portfolio with 13 new products to improve patient outcomes, provide better value, and expand access to care, while reducing environmental impact. Philips’ new EPIQ platform for example, delivers high-quality ultrasound imaging to every setting where echocardiography is used and at the same time reduces both energy use and product weight by almost 30% compared to the predecessor model. The energy consumption for each of Philips MRI models is lower than the market average according to COCIR. Other examples are new X-ray systems such as DuraDiagnost systems and a new Certeray X-ray generator, with significantly lower energy use and product weight versus predecessor models. Green Products from Patient Care & Clinical Informatics include MX400/450 and MX 500 patient monitors, for which product weight is significantly reduced (up to 27%) as well as energy consumption (up to 23%) when compared to their predecessor models.
Consumer Lifestyle
Consumer Lifestyle is focusing on the avoidance of substances of concern, the application of recycled materials and the energy efficiency of the products. In 2013, in China, Consumer Lifestyle introduced energy efficient living room Air purifiers. The products have an energy efficient motor, and score the highest grade (A) on the China energy label for Air purifiers.
Lighting
An example of a new Green Product introduced in 2013 is the Pacific LED Green Parking system covered parking solution. It ensures safety, whilst offering outstanding energy savings, low maintenance and long lifetimes. Through a mix of LED luminaires, wireless controls and presence detection, it can save up to 80% in running costs whilst typically delivering back the return on investment in under 3 years. As the solution is wireless, it is an easy retrofit solution that will match the lumen output of traditional fluorescents.
Weour EcoDesign process we aim to create products and solutions that have significantly less impact on the environment during their whole lifecycle through our EcoDesign process.lifecycle. Overall, the most significant improvements have been realized in our energy efficiency Green Focal Area, an important objective of our EcoVision program, although there was also growing attention for hazardous substances and recyclability in all sectorssegments in 2013,2016, the latter driven by our Circular Economy initiatives.
New Green Products and Solutions from each segment include the following examples.
4.3.3Diagnosis & Treatment businesses
In 2016, our Diagnosis & Treatment businesses maintained the Green Product and Solutions portfolio with redesigns of various Green Products with further environmental improvements. These products improve patient outcomes, provide better value, and help secure access to high-quality care, while reducing environmental impact. We continued to add an energy-efficient CryoCompressor to our MRI systems, with energy savings in the variousnon-scanning modes of30-40%.
Connected Care & Health Informatics businesses
Our Connected Care & Health Informatics businesses grew the Green Product and Solutions portfolio with three new products and solutions which offer better technology and functionality and at the same time reduce environmental impact. Examples include a new patient monitor GS10/GS20/G30E/G40E series from our Goldway China site with a 21% reduction in product weight and an 18% reduction in energy usage, compared to the predecessor products. Another example is the patient mask AF541, which has a 33% lower product weight and no longer contains polycarbonate compared to its predecessor mask and thus has no risk of containingbisphenol-A.
Personal Health businesses
Our Personal Health businesses focuses on Green Products and Solutions which meet or exceed our minimum requirements in the areas of energy consumption, packaging, and substances of concern. Green Revenues in 2016 surpassed 56% of total sales. All our Green Products with rechargeable batteries (like toothbrushes, shavers, and grooming products) exceed the stringent California energy efficiency norm by at least 10%. We are making steady progress in developingPVC/BFR-free products. More than 55% of sales consist ofPVC/BFR-free products, with the exception of the power cords, for which there are not yet economically viable alternatives available. In the remaining 30% of product sales, PVC/BFR has already been phased out to a significant extent, but the products are not yet completely free of these substances.
Sleep & Respiratory Care (S&RC) launched the Simple Mini Go portable oxygen concentrator (POC), the smallest and lightest POC ever developed by Philips; compared to its predecessor the product weight has been reduced by 40% and energy efficiency improved by 20%.
Lighting
Green Revenues within Lighting increased to 78% in 2016. Connected Lighting systems and LED contributed to Green Revenues with solutions in more applications and market segments. In Jakarta, Indonesia, 90,000 street luminaires were retrofitted this year with energy efficient LED lights connected by the Philips CityTouch lighting management system. Each light point is now connected, using sensors that collect performance data. As a result, city officials can now monitor Jakarta’s lighting infrastructure, remotely managing light levels to match different needs by district. At the same time, Jakarta can better manage its carbon footprint, reduce energy expenses and improve public services.
Annual Report 2016 43
Group performance 2.3.3
2.3.3 Sustainable Operations
The GreenSustainable Operations program focusesprograms, in Royal Philips and Philips Lighting focus on the main contributors to climate change, recycling of waste, reduction of water consumption, and reduction of emissions of restricted and hazardous substances.
emissions. Full details can be found inchapter 13,12, Sustainability statements, of this report.
Carbon footprint and energy efficiency
Both Royal Philips and Philips Lighting are committed to the ambition of becoming carbon-neutral in our operations during the COP21 United Nations Climate Summit in Paris (December 2015). The target we have set is to be 100% carbon-neutral in our operations by 2020 and sourcing all our electricity usage from 100% renewable sources.
After achieving our EcoVision4 carbon emissions40% reduction target in 2012 (25% operational CO22015 compared to our 2007 base year we continued to decrease our carbon emissions in 2016. We achieved a 5% carbon reduction compared to 2007, the baseline year) we continued our energy efficiency improvement programs across different disciplines2015, resulting in 2013. Examples are Work Place Innovation, partnering in the KLM BioFuel program and Green Logistics. However, in 2013 our Carbon Footprint increased by 2% to 1,654a total of 1,344 kilotonnes CO2 asemission. This reduction is mainly driven by increasing our renewable electricity share globally from 56% in 2015 to 62% in 2016. This led to a result17% carbon reduction in our industrial sites. As of increasedDecember 2016 we source 100% of our US electricity demand from the Los Mirasoles windfarm in Texas through a15-year Power Purchase Agreement. Additionally, Philips created a renewable electricity purchasing consortium with AkzoNobel, DSM and Google, and the four companies closed the first wind energy transaction in the Netherlands in October 2016 – the Krammer windfarm in the Zeeland province.
Our business travel emissions showed a reduction of 4% compared to 2015, driven by a stricter air travel policy introduced in the last quarter of 2016. This led to an air travel reduction of 5%. The emissions resulting from our lease cars decreased by 4%, slightly offset by an increase in carbon emissions from air transport (to mitigate supply shortages), the increased use of SF6 (a substance with high Global Warming Potential impact) and increasedour rental cars usage (+6%). In order to further decrease our business travel due to our increasing focus on emerging markets. These were, however, partly offset by decreasing emissions resulting from reduced office space (Work Place Innovation), consolidation of warehouses, the changing industrial footprint, and the increase in purchased electricity from renewable sources.
In 2013, CO2 emissions from non-industrial sites decreased 20%, in large part attributable to our Work Place Innovation program which enables flex-working and thus reduces the floor space in our portfolio. But also our continuing focus on buildings’ energy efficiency and the increased share of purchased electricity from renewable sources have helped achieve this.
84 Annual Report 2013
4 Group performance 4.3.3 - 4.3.3
After a decrease in 2012, total emissions from business travel increased 5% in 2013 as reduced emissions from our lease car fleet were off-set by increased air travel. Wewe will continue to promote video conferencing as an alternative to travel. In 2013,travel in 2017.
Within our logistics CO2operations we have seen no significant changes in the overall carbon emissions increased 5%compared to the previous year. Our air freight emissions went up 6% over the course of 2016 to meet demand in comparison with 2012. These were mainlyour HealthTech businesses, partially caused by increaseddistress at one of our larger ocean freight carriers. This was offset by significant reductions within Lighting due to a stricter air shipmentsfreight policy and a Royal Philips program to mitigate supply shortages inincrease the loading degree of our Lighting sector.containers for ocean freight.
Our operational energy efficiency decreased 5%improved by 8%, from 1.151.11 terajoules per million euro sales in 20122015 to 1.211.01 terajoules per million euro sales in 20132016 as a result of intensifiedenergy efficiency programs in our industrial activities, increasedsites. During 2016, the applied emission factors used to calculate our operational carbon footprint have been updated with the latest DEFRA (UK Department for Environment, Food & Rural Affairs) 2016 emission factors. Philips reports all its emissions in line with the Greenhouse Gas Protocol (GHGP) as further described inchapter 12, Sustainability statements, of this report.
The impact of the exclusion of Lumileds and Automotive is displayed as discontinued operations in the next graph; the size of which varies over the years, but averages around 18% over the past five years where emissions from ournon-industrial facilities and business travel have been estimated based on FTE data. In 2016, Lumileds and increasedAutomotive business travel was based on actuals andnon-industrial sites were extrapolated based on floor area. For our logistics activities.emissions, the part of discontinued operations has been estimated using Philips Lighting revenue share as a proxy.
Philips Group
Operational carbon footprintin kilotonnes CO2-equivalent
2012 - 2016
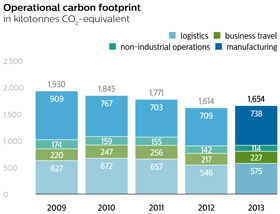

Philips Group
Operational carbon footprint by Greenhouse Gas Protocol scopesin kilotonnes CO2-equivalent
2012 - 2016
|
| |||||||||||||||||||
| 2012 | 2013 | 2014 | 2015 | 2016 | ||||||||||||||||
|
| |||||||||||||||||||
Scope 1 | 355 | 361 | 320 | 261 | 229 | |||||||||||||||
Scope 2 (market based) | 335 | 313 | 277 | 236 | 204 | |||||||||||||||
Scope 3 | 950 | 1,004 | 924 | 920 | 911 | |||||||||||||||
|
| |||||||||||||||||||
Philips Group | 1,640 | 1,678 | 1,521 | 1,417 | 1,344 | |||||||||||||||
Scope 2 (location based) | 584 | 583 | 546 | 496 | 488 | |||||||||||||||
|
| |||||||||||||||||||
Philips Group
Ratios relating to carbon emissions and energy use
| 2009 | 2010 | 2011 | 2012 | 2013 | ||||||||||||||||
Operational CO2 emissions in kilotonnes CO2-equivalent | 1,930 | 1,845 | 1,771 | 1,614 | 1,654 | |||||||||||||||
Operational CO2 efficiency in tonnes CO2-equivalent per million euro sales | 83 | 73 | 70 | 65 | 71 | |||||||||||||||
Operational energy use in terajoules | 31,145 | 32,766 | 31,402 | 28,405 | 28,162 | |||||||||||||||
Operational energy efficiency in terajoules per million euro sales | 1.34 | 1.29 | 1.24 | 1.15 | 1.21 | |||||||||||||||
Operational carbon footprint by Greenhouse Gas Protocol scopes
in kilotonnes CO2-equivalent2012 - 2016
| 2009 | 2010 | 2011 | 2012 | 2013 | ||||||||||||||||
Scope 1 | 447 | 441 | 431 | 443 | 465 | |||||||||||||||
Scope 2 | 636 | 485 | 427 | 409 | 387 | |||||||||||||||
Scope 3 | 847 | 919 | 913 | 762 | 802 | |||||||||||||||
|
| |||||||||||||||||||
Philips Group | 1,930 | 1,845 | 1,771 | 1,614 | 1,654 | |||||||||||||||
|
| |||||||||||||||||||
| 2012 | 2013 | 2014 | 2015 | 2016 | ||||||||||||||||
|
| |||||||||||||||||||
Operational CO2 emissions in kilotonnes CO2-equivalent | 1,640 | 1,678 | 1,521 | 1,417 | 1,344 | |||||||||||||||
Operational CO2 efficiency in tonnes CO2-equivalent per million EUR sales | 74 | 76 | 71 | 58 | 55 | |||||||||||||||
Operational energy use in terajoules | 30,013 | 30,890 | 28,741 | 26,792 | 24,824 | |||||||||||||||
Operational energy efficiency in terajoules per million EUR sales | 1.35 | 1.40 | 1.34 | 1.11 | 1.01 | |||||||||||||||
|
| |||||||||||||||||||
44 Annual Report 2016
Group performance 2.3.3
Water
Total water intake in 20132016 was 5.02.4 million m3, about 4% higher11% lower than in 2012.2015. This increasedecrease was mainly due to a new acquisition in China that started to report in 2013, which accountedoperational changes, lower production volumes at multiple Lighting sites where water is used for 6% of group water consumption in 2013 as well as increased water usecooling purposes, and water-saving actions at two Lighting Lumileds sites, mitigated by water conservation activities across all sectors.various sites.
Lighting represents around 79%60% of total water usage. In this sector,At Lighting, water is used in manufacturing as well as for domestic purpose. The other sectors usepurposes. In Royal Philips, water is mainly used for domestic purposes. The exclusion of Lumileds and Automotive has a significant downward impact on the water consumption of Philips. In 2016, Lumileds and Automotive accounted for 1.7 million m3 of water.
Philips Group
Water intake
in thousands of m3
2012 - 2016
| 2009 | 2010 | 2011 | 2012 | 2013 | ||||||||||||||||
Healthcare | 363 | 256 | 308 | 421 | 454 | |||||||||||||||
Consumer Lifestyle | 315 | 351 | 338 | 303 | 586 | |||||||||||||||
Lighting | 3,531 | 3,604 | 3,682 | 4,133 | 4,004 | |||||||||||||||
Innovation, Group & Services | 7 | 7 | — | — | — | |||||||||||||||
|
| |||||||||||||||||||
Philips Group | 4,216 | 4,218 | 4,328 | 4,857 | 5,044 | |||||||||||||||
|
| |||||||||||||||||||
| 2012 | 2013 | 2014 | 2015 | 2016 | ||||||||||||||||
|
| |||||||||||||||||||
Personal Health | 368 | 652 | 585 | 614 | 613 | |||||||||||||||
Diagnosis & Treatment | 281 | 311 | 392 | 268 | 269 | |||||||||||||||
Connected Care & Health Informatics | 75 | 77 | 74 | 94 | 81 | |||||||||||||||
Lighting | 2,413 | 2,249 | 2,052 | 1,751 | 1,451 | |||||||||||||||
|
| |||||||||||||||||||
Continuing operations | 3,137 | 3,289 | 3,103 | 2,727 | 2,414 | |||||||||||||||
Discontinued operations | 1,720 | 1,755 | 1,700 | 1,684 | 1,651 | |||||||||||||||
|
| |||||||||||||||||||
Philips Group | 4,857 | 5,044 | 4,803 | 4,411 | 4,065 | |||||||||||||||
|
| |||||||||||||||||||
In 2013, 82%2016, 70% of water was purchased and 18%30% was extracted from groundwater wells.
Waste
TotalIn 2016, total waste increaseddecreased by some 5% compared to 922015 to 64.8 kilotonnes, in 2013 from 88 kilotonnes in 2012. Lighting (77%) and Consumer Lifestyle (12%) account for 89% of our total waste. The increase was mainly due to one-time demolition scrapoperational changes, lower production volumes and less packaging waste at a Lighting sitesites. Lighting contributed 62% of total waste, Personal Health businesses 22%, Diagnosis & Treatment businesses 14% and Connected Care & Health Informatics businesses 2%. The reported increase in the Netherlands (10 kilotonnes) and a new acquisitionwaste in China, mitigatedDiagnosis & Treatment businesses was partially caused by the removal of obsolete components and two newly acquired reporting sites. The exclusion of the AVM&A business in CLLumileds and Automotive had a downward impact on total waste reduction programs in all sectors.of 6.2 kilotonnes.
Philips Group
Total waste in kilotonnes
in kilotonnes2012 - 2016
| 2009 | 2010 | 2011 | 2012 | 2013 | ||||||||||||||||
Healthcare | 8.2 | 11.2 | 9.3 | 10.4 | 9.6 | |||||||||||||||
Consumer Lifestyle | 20.1 | 23.2 | 19.6 | 12.7 | 11.4 | |||||||||||||||
Lighting | 69.3 | 70.1 | 65.1 | 64.5 | 71.0 | |||||||||||||||
Innovation, Group & Services | 0.1 | 0.1 | 0.0 | 0.0 | 0.0 | |||||||||||||||
|
| |||||||||||||||||||
Philips Group | 97.7 | 104.6 | 94.0 | 87.6 | 92.0 | |||||||||||||||
|
| |||||||||||||||||||
| 2012 | 2013 | 2014 | 2015 | 2016 | ||||||||||||||||
|
| |||||||||||||||||||
Personal Health | 14.6 | 13.2 | 13.1 | 13.8 | 14.3 | |||||||||||||||
Diagnosis & Treatment | 7.4 | 6.7 | 6.8 | 8.0 | 9.2 | |||||||||||||||
Connected Care & Health Informatics | 1.1 | 1.1 | 1.2 | 1.4 | 1.4 | |||||||||||||||
Lighting | 57.5 | 54.9 | 53.9 | 45.3 | 39.9 | |||||||||||||||
|
| |||||||||||||||||||
Continuing operations | 80.6 | 75.9 | 75.0 | 68.5 | 64.8 | |||||||||||||||
Discontinued operations | 7.0 | 16.1 | 5.4 | 6.4 | 6.2 | |||||||||||||||
|
| |||||||||||||||||||
Philips Group | 87.6 | 92.0 | 80.4 | 74.9 | 71.0 | |||||||||||||||
|
| |||||||||||||||||||
Total waste consists of waste that is delivered for landfill, incineration or recycling. Materials delivered for recycling via an external contractor comprised 7454 kilotonnes, which equatedequals 83% of total waste, comparable to 2015. Of the 17% remaining waste, 81%, an improvement compared comprisednon-hazardous waste and 19% hazardous waste. A total of 6.1 kilotonnes of waste was sent to 77% landfill. Our sites are addressing both the recycling percentage as well as waste sent to landfill as part of both the new Royal Philips and Philips Lighting sustainability programs.
Philips Group
Industrial waste delivered for recyclingin 2012, as our manufacturing sites%
2016
Annual Report 2013 85
4 Group performance 4.3.3 - 4.4
implemented recycling programs. Of the remaining waste, 14% comprised non-hazardous waste and 5% hazardous waste.
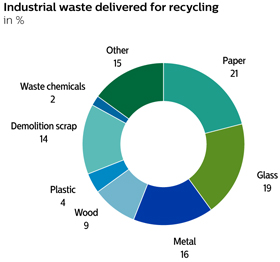
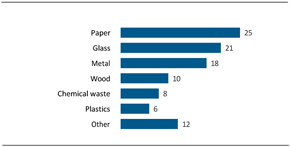
Emissions
In the ‘Healthy people, sustainable planet’ program, Royal Philips included new reduction targets for the substances that are most relevant for its businesses. In order to provide comparable information at Group level, please find the summary of the emissions of the formerly targeted substances below. Emissions of restricted substances totaled 9reduced from 26 kilos in 2013, a significant decrease compared2015 to 557 kilos in 2012, due to2016, mainly caused by one site in China which phased out a continued reductionthinner containing benzene. For the fourth year in a row, mercury emissions at Lighting and more accurate measurements.were as low as reasonably achievable, according to our assessment. The level of emissions of hazardous substances decreased from 25,101 kilos to 12,412 kilos in 2016(-51%), mainly driven by some 40% from 70,093 to 40,451 kilos, mainly as a result of a decreasechanges in total styrene emissions at Lightingthe lacquering process and more accurate measurements mitigated by an increaseproduct mix in xylene emissions in CL. All sectors have reduction programs for the restricted and hazardous substances.Personal Health businesses.
Philips Group
Restricted and hazardous substancesin kilos
in kilos2012 - 2016
|
| |||||||||||||||||||||||||||||||||||||||
| 2012 | 2013 | 2014 | 2015 | 2016 | ||||||||||||||||||||||||||||||||||||
| 2009 | 2010 | 2011 | 2012 | 2013 |
|
| ||||||||||||||||||||||||||||||||||
Restricted substances | 272 | 188 | 111 | 55 | 9 | 67 | 37 | 29 | 26 | 7 | ||||||||||||||||||||||||||||||
Hazardous substances | 32,869 | 61,795 | 65,477 | 70,093 | 40,451 | 67,530 | 35,118 | 28,310 | 25,101 | 12,412 | ||||||||||||||||||||||||||||||
|
| |||||||||||||||||||||||||||||||||||||||
For more details on restricted and hazardousemissions from substances, please refer tosub-section 13.3.3, Green 12.4.3, Sustainable Operations, of this report.
Annual Report 2016 45
Group performance 2.4
4.42.4 Proposed distribution to shareholders
Pursuant to article 34 of the articles of association of Royal Philips, a dividend will first be declared on preference shares out of net income. The remainder of the net income, after reservations made with the approval of the Supervisory Board, shall be available for distribution to holders of common shares subject to shareholder approval afteryear-end. As of December 31, 2013,2016, the issued share capital consists only of common shares; no preference shares have been issued. Article 33 of the articles of association of Royal Philips gives the Board of Management the power to determine what portion of the net income shall be retained by way of reserve, subject to the approval of the Supervisory Board.
A proposal will be submitted to the 2014upcoming Annual General Meeting of Shareholders to declare a dividend of EUR 0.80 per common share (up to EUR 740745 million), in cash or in shares at the option of the shareholder, against the net income for 2013.2016.
If the above dividend proposal is adopted, the shares will be tradedex-dividend as of May 12, 2017 and May 15, 2017 at the New York Stock Exchange and Euronext Amsterdam, respectively. In compliance with the listing requirements of the New York Stock Exchange and the stock market of Euronext Amsterdam, the dividend record date will be May 16, 2017.
Shareholders will be given the opportunity to make their choice between cash and shares between May 8, 201417, 2017 and May 30, 2014.June 9, 2017. If no choice is made during this election period the dividend will be paid in shares.cash. On May 30, 2014June 9, 2017 after close of trading, the number of share dividend rights entitled to one new common share will be determined based on the volume weighted average price of all traded common shares Koninklijke Philips N.V. at NYSE Euronext Amsterdam on 28, 29June 7, 8 and 30 May 2014.9, 2017. The Company will calculate the number of share dividend rights entitled to one new common share (the ‘ratio’), such that the gross dividend in shares will be approximately equal to the gross dividend in cash. On June 3, 2014 theThe ratio and the number of shares to be issued will be announced.announced on June 13, 2017. Payment of the dividend and delivery of new common shares, with settlement of fractions in cash, if required, will take place from June 4, 2014.14, 2017. The distribution of dividend in cash to holders of New York registryRegistry shares will be made in USD at the USD/EUR rate fixed byas per WM/ Reuters FX Benchmark 2 PM CET fixing of June 12, 2017.
Further details will be given in the European Central Bank on June 2, 2014.
86agenda for the 2017 Annual Report 2013
4 Group performance 4.4 - 4.6
General Meeting of Shareholders. All dates mentioned remain provisional until then.
Dividend in cash is in principle subject to 15% Dutch dividend withholding tax, which will be deducted from the dividend in cash paid to the shareholders. Dividend in shares paid out of net income and retained earnings is subject to 15% dividend withholding tax, but only in respect of the par value of the shares (EUR 0.20 per share).
In 2013,2016, a dividend of EUR 0.750.80 per common share was paid in cash or shares, at the option of the shareholder. Approximately 59.8%For 55.0% of the shares, the shareholders elected for a share dividend resulting in the issue of 18,491,33717,344,462 new common shares, leading to a 2.1% percent1.9% dilution. EUR 271,991,204330 million was paid in cash. For additional information, see See alsochapter 16,14, Investor Relations, of this report.
The balance sheet presented in this report, as part of the Company financial statements for the period ended December 31, 2013,2016, is before appropriation of the result for the financial year 2013.2016.
46 Annual Report 2016
Group performance 2.5
Achieving the 2013 financial targets was an important milestone and we have now set our sights on reaching our 2016 targets. We are confident in our ability to further improve our performance by continuing the strong focus on our Accelerate! transformation program. Looking at 2014, we remain cautious because of the ongoing macro-economic uncertainties, currency headwinds and softer order intake in Q4 2013. Therefore, we expect that 2014 will be a modest step towards our 2016 targets, also taking into account restructuring to drive the new productivity targets and investments in additional growth initiatives.
4.62.5 Critical accounting policies
Critical accounting policies
The preparation of Philips’ financial statements requires us to make estimates and judgments that affect the reported amounts of assets and liabilities at the date of our financial statements. The policies that management considers both to be most important to the presentation of Philips’ financial condition and results of operations and to make the most significant demands on management’s judgments and estimates about matters that are inherently uncertain, are discussed below. Management cautions that future events often vary from forecasts and that estimates routinely require adjustment. A more detailed description of Philips’ accounting policies appears in the note 1, Significant accounting policies section.
Accounting for pensions and other postretirement benefits.
Retirement benefits represent obligations that will be settled in the future and require assumptions to project benefit obligations and fair values of plan assets. Retirement benefit accounting is intended to reflect the recognition of future benefit costs over the employee’s approximate service period, based on the terms of the plans and the investment and funding decisions made. The accounting requires management to make assumptions regarding variables such as discount rate, rate of compensation increase, mortality rate and future healthcare costs. Pension assumptions are set centrally by management in consultation with its local, regional or country management and locally appointed actuaries at least once a year. For the Company’s major plans, a full discount rate curve of high quality corporate bonds (using Towers Watson RATE:Link data) is used to determine the defined benefit obligation whereas for other plans a single point discount rate is used based on the plan’s maturity. Plans in countries without a deep corporate bond market, use a discount rate based on the local sovereign curve and the plan’s maturity. Relevant data regarding various local swap curves, sovereign bond curves and/or corporate AA bonds are set by local actuaries. Changes in the key assumptions can have a significant impact on the projected benefit obligations, funding requirements and periodic cost incurred.
Annual Report 2013 87
4 Group performance 4.6 - 4.6
For a discussion of the current funded status, a sensitivity analysis with respect to pension plan assumptions, a summary of the changes in the accumulated postretirement benefit obligations and a reconciliation of the obligations to the amounts recognized in the consolidated balance sheet, please refer to note 30, Post-employment benefits.
Accounting for income taxes
As part of the process of preparing consolidated financial statements, the Company is required to estimate income taxes in each of the jurisdictions in which it conducts business. This process involves estimating actual current tax expense and temporary differences between tax and financial reporting.deferred tax. Temporary differences result in deferred tax assets and liabilities, which are included in the consolidated balance sheet. The Company regularly reviews the deferred tax assets for recoverability and will only recognize these if it is believed that sufficient future taxable profit is available, including income from forecasted operating earnings, the reversal of existing taxable temporary differences and established tax planning relating to the same taxation authority and the same taxable entity. For a discussion of the fiscaltax uncertainties, please refer to the information under the heading “Tax risks” innote 5,8, Income taxes.taxes.
Multi-element sales transactions
From time to time the Company is engaged in complex sales transactions relating to multi-element deliveries (for example a single sales transaction that combines of the delivery of goods and rendering of services). The process of revenue recognition of such multi-element sales transactions involves the identification of the different sales components, the allocation of revenue to these different components and the timing of revenue recognition per component. Each of these process steps can be complex and requires judgment. In order to identify different components in a single sales contract, the Company verifies if a component has a stand-alone value to the customer and whether the fair value of the component can be measured reliably. Allocation of revenue to the different components is performed based on either a relative fair value approach or by means of a residual or fair value method, depending on which method is deemed most appropriate to the transaction. Eventually, revenue for each component is recognisedrecognized when meeting the revenue recognition criteria in accordance with IAS 18 or IAS 11.18.
Provisions and Contingent liabilities
The Company and certain of its group companies and former group companies are involved as a party in legal proceedings, including regulatory and other governmental proceedings, and discussions on potential remedial actions, relating to such matters as antitrust laws, competition issues, commercial transactions, product liabilities, participations and environmental pollution. Since the ultimate disposition of asserted claims and proceedings and investigations cannot be predicted with certainty, an adverse outcome could have a material adverse effect on the Company’s Consolidatedconsolidated financial statements.
The Company recognizes a liability when it is probable that an outflow of resources embodying economic benefits will result from the settlement of a present obligation and the amount at which the settlementoutflow will take place can be measured reliably. If the likelihood of the outcome is less than probable and more than remote or a reliable estimate is not determinable, the matter is disclosed as a contingent liability if management concludes that it is material.
In determining the provision for losses associated withthe environmental remediation obligations, significant professional judgments are necessary. The Company utilizes experts in the estimation process. The Company accruesprovides for lossescost associated with environmental obligations when such lossesthey are probable and can be estimated reliably. The provisions are adjusted as new information becomes available and they are remeasured at the end of each period using the current discount rate.
Provisions on restructuring represents estimated costs of initiated reorganizations, the most significant of which have been approved by the BoardExecutive Committee, and which generally involve the realignment of Management.certain parts of the industrial and commercial organization. When such restructurings require discontinuance and/or closure of lines of activities, the anticipated costs of closure or discontinuance are included in restructuring provisions. A liability is recognized for those costs only when the Company has a detailed formal plan for the restructuring and has raised a valid expectation with those affected that it will carry out the restructuring by starting to implement that plan or announcing its main features to those affected by it.
Provisions on onerous contracts represent the lesser of the unavoidable costs of either fulfilling or exiting the related contract, and in which the costs to fulfill the contract exceed the benefits expected to be received under such contract. In determining the cost of fulfilling the contract, the payments due in the period in which the contract cannot be cancelled are considered, unless there is a lesser amount of penalty to exit the
88 Annual Report 2013
4 Group performance 4.6 - 4.6
contract. Generally, unavoidable costs only include incremental costs related to the contract and exclude allocated or shared costs. Before a provision is established, the Company recognizesrecognized any impairment loss on the assets associated with that contract.the restructuring.
The Company provides for warranty costs based on historical trends in product return rates and the expected material and labor costs to provide warranty services. The provision is based on historical warranty data and a weighing of possible outcomes against their associated probabilities.
Annual Report 2016 47
Group performance 2.5
Accounting for obsolete inventoriesImpairment ofnon-financial assets
The Company records its inventories at cost and accounts for the risk of obsolescence using the lower of cost and net realizable value principle. The expected future use of inventory is based on estimates about future demand and past experience with similar inventories and their usage.
Accounting for bad debt
The risk of uncollectability of accounts receivable is primarily estimated based on prior experience with, and the past due status of, doubtful debtors, while large accounts are assessed individually based on factors that include ability to pay, bankruptcy and payment history. In addition, debtors in certain countries are subject to a higher collectability risk, which is taken into account when assessing the risk of uncollectability. Should the outcome differ from the assumptions and estimates, revisions to the estimated valuation allowances would be required.
Impairment of non-financial assets
Goodwill is not amortized, but tested for impairment annually and whenever impairment indicators require so. The Company reviewsnon-financial assets, other than goodwill for impairment, when events or circumstances indicate that carrying amounts may not be recoverable.
In determining impairments ofnon-current assets like intangible assets, property, plant and equipment, investments in associates and goodwill, management must make significant judgments and estimates to determine whether the recoverable amount is lower than the carrying value. Changes in assumptions and estimates included within the impairment reviews and tests could result in significantly different results than those recorded in the consolidated financial statements.
In 2016 the Company performed and completed annual impairment tests in the second quarter, in line with all years presented in the Statements of income, and in the fourth quarter. The recoverable amount is the higheradditional impairment test at year-end was performed in view of the asset’s valuechange in usethe date of test from second quarter to fourth quarter, as from 2017, to better align it with planning and its fair value less costs to sell, the determination of which involves significant judgment and estimates from management.forecasting cycles.
Goodwill is allocated to the cash generating units. The basis of the recoverable amount used in the annual impairment test (performed in Q2) and trigger-based impairment tests is generally the value in use. Key assumptions used in the impairment tests were sales growth rates, Adjusted income from operations1) and the rates used for discounting the projected cash flows. These cash flow projections were determined using management’s internal forecasts that cover an initial period from 20132016 to 2017 that matches the period used2019 for our strategic review.Royal Philips units and 2016 to 2020 for Philips Lighting units. Projections were extrapolated with stable or declining growth rates for a period of five years, after which a terminal value was calculated. For terminal value calculation, growth rates were capped at a historical long termlong-term average growth rate.
Annual Report 2013 89
4 Group performance 4.6 - 4.6
The sales growth rates and marginsAdjusted income from operations1) used to estimate cash flows are based on past performance, external market growth assumptions and industry long-term growth averages. IncomeAdjusted income from operations1) in all units is expected to increase over the projection period as a result of volume growth and cost efficiencies. Please refer tonote 11, Goodwill.Goodwill.
Discontinued operations andnon-current assets held for sale
Non-current assets (disposal groups comprising assets and liabilities) that are expected to be recovered primarily through sale rather than through continuing use are classified as held for sale. A discontinued operation is a component of an entity that either has been disposed of, or that is classified as held for sale, and (a) represents a separate major line of business or geographical area of operations; (b) is a part of a single coordinated plan to dispose of a separate major line of business or geographical area of operations; or (c) is a subsidiary acquired exclusively with a view to sell. Non-current assets held for sale and discontinued operations are carried at the lower of carrying amount or fair value less costs to sell.
Determining whether anon-current asset will be primarily recovered through sale rather than through continuing use requires judgment. The Company assesses whether such asset is available for immediate sale in its present condition subject only to terms that are usual and customary for sales of such assets or disposal groups, and its sale is assessed to be highly probably. Furthermore, in order to determine if that component qualifies as a discontinued operations, judgment is required when the Company assesses whether a component of an entity represents a major line of business or geographical area compared to the whole of the Company and whether the sale is a part of a single coordinated plan.
New Accounting Standards
For a description of the new pronouncements, please refer to the information under the heading “IFRS accounting standardstandards adopted as from 2013”2016” innote 1, Significant accounting policies.policies.
Off-balance sheet arrangements
Please refer to the information under the heading “Guarantees” insub-section 4.1.23, 2.1.23, Cash obligations, of this report and innote 26,25, Contingent assets and liabilities.liabilities.
| 1) | Non-GAAP financial measure. For the definition and reconciliation to the most directly comparable GAAP measure, refer tochapter 4, Reconciliation ofnon-GAAP information, of this report. |
90
48 Annual Report 20132016
5 SectorSegment performance 5 - 53
The health technology landscape

Fundamental transformative changes are already taking place in the healthcare industry to enable the provision of affordable, quality care to those who need it. A shift is under way towards value-based healthcare, which places greater emphasis on results, driving the reduction of waste and inefficiency, increasing access and improving outcomes, while at the same time reducing costs.
Consumers are becoming increasingly engaged in managing their own health, with greater attention being focused on the benefits of healthy living and home care. Mobile and digital technologies are significant enablers of this trend, leading to new care delivery models – founded upon integrated care, real-time analytics and personalized solutions and services – that give patients greater control over, and responsibility for, their health.
Philips (NYSE: PHG, AEX: PHIA) is a health technology company focused on improving people’s lives through meaningful innovation across the health continuum – from healthy living and prevention to diagnosis, treatment and home care. Applying advanced technologies and deep clinical and consumer insights, Philips partners with customers to deliver integrated solutions that enable better outcomes at lower cost.
Innovation, Group & Services
Group Innovation • Design • New Venture Integration • Group and Regional Overheads • Pensions and Global Service Units

Our structure in 2016
Koninklijke Philips N.V. (the(‘Royal Philips’ or the ‘Company’) is the parent company of the Philips Group (‘Philips’ or the ‘Group’)., headquartered in Amsterdam, the Netherlands. The Company is managed by the members of the Executive Committee (comprising the Board of Management and Executive Committeecertain key officers) under the supervision of the Supervisory Board. The Executive Committee operates under the chairmanship of the Chief Executive Officer and shares responsibility for the deployment of Philips’ strategy and policies, and the achievement of its objectives and results.
In September 2014, Philips announced its plan to sharpen its strategic focus by establishing two stand-alone companies focused on the HealthTech and Lighting opportunities respectively. To this end, a stand-alone structure was established for Philips Lighting within the Philips Group, effective February 1, 2016. Then, on May 27, 2016, Philips Lighting was listed and started trading on Euronext in Amsterdam under the symbol ‘LIGHT’. Following the listing of Philips Lighting, Philips retained a 71.225% stake and continued to consolidate Philips Lighting, through 2016. On February 8, 2017, Philips announced that it had successfully completed an accelerated bookbuild offering to institutional investors and to Philips Lighting of 26.0 million shares in Philips Lighting, reducing Philips’ stake in Philips Lighting’s issued and outstanding share capital from 71.225% to approximately 55.180%. The transaction is in line with Philips’ stated objective to fully sell down its stake in Philips Lighting over the next several years.
In light of its focus on health technology, effective January 1, 2016, Philips eliminated the former Healthcare and Consumer Lifestyle sector layers in order to drive the convergence of consumer health and professional healthcare, as well as to reduce overhead costs, and changed the reporting of its health technology activities. At the same time, the former Innovation, Group & Services was split and allocated to Philips and Philips Lighting respectively.
Annual Report 2016 49
Segment performance 3
In 2016, Philips’ activities in the field of health and well-being aretechnology were organized on a sector basis, with each operating sector – Healthcare, Consumer Lifestylesegment basis. The reportable segments are Personal Health businesses, Diagnosis & Treatment businesses, Connected Care & Health Informatics businesses and Lighting, –each being responsible for the management of its businessesbusiness worldwide.
The Innovation, Group & Services sector includes the activities of Group Innovation, through which Additionally, Philips invests in projects that are currently not part of the operating sectors, but which could lead to additional organic growth or create value through future spin-offs. Furthermore, Groupidentifies HealthTech Other and regional management organizations support the creation of value, connecting Philips with key stakeholders, especially our employees, customers, government and society. Additionally, the global shared business services for procurement, finance, human resources, IT and real estate are reported in this sector,Legacy Items, as well as certain pension costs.shown below:
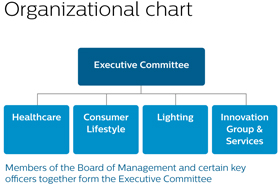
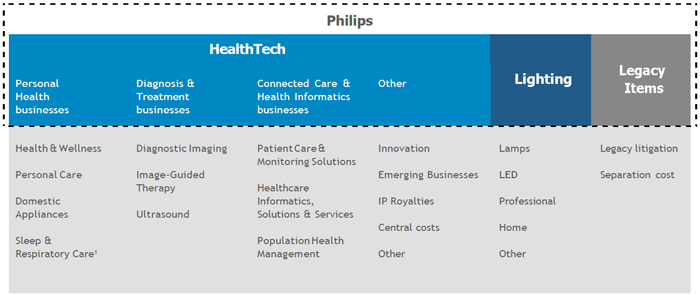
| Focus of external reporting |
| 1) | Previously part of the Healthcare sector |
At the end of 2013,2016, Philips had 11182 production sites in 2822 countries, sales and service outlets in approximately 100 countries, and 114,689105,223 employees.
50 Annual Report 2013 912016
5 SectorSegment performance 5 - 5
Sales, IFO and Adjusted IFO 2013
in millions of euros unless otherwise stated
| sales | IFO | % | Adjusted IFO1) | % | ||||||||||||||||
Healthcare | 9,575 | 1,315 | 13.7 | 1,512 | 15.8 | |||||||||||||||
Consumer Lifestyle | 4,605 | 429 | 9.3 | 483 | 10.5 | |||||||||||||||
Lighting | 8,413 | 489 | 5.8 | 695 | 8.3 | |||||||||||||||
Innovation, Group & Services | 736 | (242 | ) | — | (239 | ) | — | |||||||||||||
|
| |||||||||||||||||||
Philips Group | 23,329 | 1,991 | 8.5 | 2,451 | 10.5 | |||||||||||||||
|
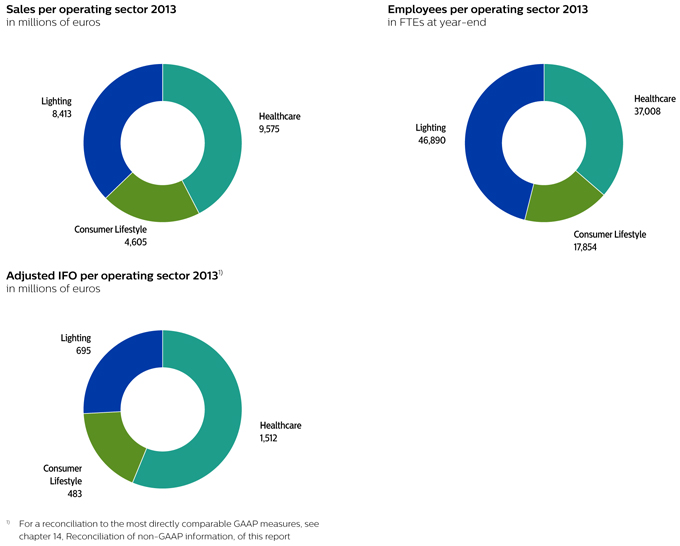
92 Annual Report 2013
5 Sector performance 5.1 - 5.13.1
5.1 Healthcare3.1 Personal Health businesses

“As3.1.1 About Personal Health businesses
Our Personal Health businesses play an important role on the health systems around the world address the complexities of care delivery atcontinuum, delivering integrated, connected solutions that support healthier lifestyles and those living with chronic disease.
Leveraging our deep consumer expertise and extensive healthcareknow-how, we enable people to live a healthy life in a healthy home environment, and to proactively manage their core, Philips Healthcare is responding to the global call for transformation through meaningful and intelligent innovation. Across our businesses, we are collaborating with customers to consistently provide better care at lower cost to more patients. own health.
Through our Accelerate! program, we are delivering on this commitment to our customers fastervarious businesses, Personal Health has delivered sustained strong growth and more effectively than ever before.”Deborah DiSanzo, CEO Philips Healthcaremargin expansion in recent years, driven by four main factors:
By focusingInnovation at the forefront of digital health, based on innovations in key areas across the continuum of care and aligning our resources with customers and clinicians, we continue to provide solutions that offer more value while helping lower the cost of care.deep consumer insights
The ongoing implementation of Accelerate! has been enhancing our ability to move quickly and efficiently in delivering the innovation that matters most to our customers.Value propositions leveraging consumer data, unlocking recurring revenue streams
We continue to drive profitable growth and deliver on our commitments, despite challenging economic headwinds, for instance in North America and Europe.
Annual Report 2013 93
5 Sector performance 5.1.1 - 5.1.2
5.1.1 Health care landscape
Health systems in mature, developing and underserved markets around the world continue to press for new solutions that can help them provide accessible, affordable, quality care to diverse patient populations.
Increasingly, they are abandoning the notion that incremental improvements can resolve the overwhelming economic, demographic and logistic issues standing in the way of the care that is needed. Instead, they are pursuing new opportunities to approach the delivery of care differently.
This broader, deeper and bolder way of thinking is opening the door to a world of transformational solutions with far-reaching implications, ranging from cutting-edge technology platforms and protocols to innovative new business models and initiatives that are redefining the clinical experience across the continuum of care.
The demand for more effective care delivery is intensifying and unrelenting, as people live longer, suffer increasingly from chronic disease, and become bigger consumers of constrained healthcare resources. The burden that this places on health systems is unsustainable – and driving the need for industry-defining solutions.
5.1.2 About Philips Healthcare
At Philips, we are dedicated to delivering innovation that matters to our customers and the patients they serve. We do this by developing innovative solutions across the continuum of care in partnership with clinicians and our customers to improve patient outcomes, provide more and better value, and expand access to care.
Philips is one of the world’s leading healthcare companies (based on sales) along with General Electric and Siemens. The United States, our largest market, represented 40% of Healthcare’s global sales in 2013, followed by China, Japan and Germany. Growth geographies accounted for 25% of Healthcare sales. Philips Healthcare has approximately 37,000 employees worldwide.
In 2013 our Healthcare business was organized around four strategic business groups*:
Imaging Systems: Integrated clinical solutions that include radiation oncology, clinical applications and platforms, and portfolio management; advanced diagnostic imaging, including computed tomography (CT), magnetic resonance imaging (MRI) and molecular imaging (MI); diagnostic X-ray, including digital X-ray and mammography; interventional X-ray, encompassing cardiology, radiology, surgery and other areas; and ultrasound, a modality with diverse customers and broad clinical presence.High-impact consumer marketing programs
PatientGeographical expansion with proven propositions
Through 2016, we have driven above-market growth and are stepping up profitability towards the mid- teens, building on a strong track record. Personal Health has many distinct product categories and associated competitors, including Procter & Gamble in Personal Care and Oral Healthcare, Groupe SEB in Domestic Appliances and ResMed in Sleep & Clinical Informatics: Enterprise-wide patient monitoring solutions, from value solutions to sophisticated connected solutions, for real-time clinical information at the patient’s bedside; cardiology informatics and enterprise imaging informatics, including picture archiving and communication systems and other clinical information systems; patient monitoring and clinical informatics; mother and child care, including products and solutions for pregnancy, labor and delivery, newborn and neonatal intensive care and the transition home; and therapeutic care, including cardiac resuscitation, emergency care solutions, therapeutic temperature management, anesthesia care, hospital respiratory systems and ventilation.
Home Healthcare Solutions: Sleep management, respiratory care and non-invasive ventilation; medical alert and medication dispensing services for independent living; and remote patient monitoring.
Customer Services: Equipment services and support, including service contracts, installation, equipment maintenance, remote proactive monitoring and multi-vendor services; managed services, including equipment financing and asset management; and professional services, including consulting, site planning and project management, education and design.
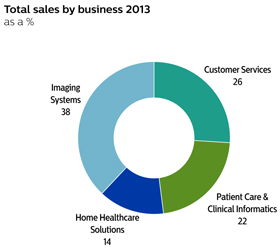
94 Annual Report 2013
5 Sector performance 5.1.2 - 5.1.3
Sales at Healthcare are generally higher in the second half of the year largely due to the timing of new product availability and customer spending patterns.
Regulatory requirements
Philips Healthcare is subject to extensive regulation. We are committed to compliance with regulatory product approval and quality system requirements in every market we serve by addressing specific terms and conditions of local and national regulatory authorities, including the US FDA, the SFDA in China, and other comparable foreign agencies. Obtaining regulatory approval is costly and time-consuming, but a prerequisite for market introduction.Respiratory Care.
In our Healthcare facility in Cleveland, Ohio, certain issues in2016, the general area of manufacturing process controls were identified during an ongoing US Food and Drug Administration (FDA) inspection. To address these issues, on January 10, 2014, we started a voluntary, temporary suspension of new production at the facility, primarily to strengthen manufacturing process controls. Currently, there is no indication of product safety issues. Please refer to note 36, Subsequent events for further details.
With regard to sourcing, please refer to sub-section 13.2.2, Supplier indicators, of this report.
5.1.3 2013 highlights
In 2013, as healthcare systems continued to move forward with fundamental changes, we remained focused on delivering innovative solutions and investing in strategic alliances that help enable this transformation:
Addressing the world’s most prevalent diseases starts with the clinician’s ability to visualize clearly and accurately within the human body. By integrating imaging and information in meaningful ways – and drawing on our expertise in cardiology, oncology and other critical areas – we expanded our solutions offering with the launch of the EPIQ ultrasound system, advancements in image-guided interventional therapy and other innovations to improve diagnosis, treatment and management of disease.
Achieving the best possible patient outcomes depends on the clinician’s ability to access relevant information, anywhere and anytime. Through innovative devices and strategic collaboration, such as our work with Mayo Clinic on developing cloud-based solutions for the intensive care unit (ICU), we helped providers manage massive amounts of patient data for more confident diagnosis and treatment. Our solutions also helped optimize workflows in an increasingly connected care environment.
The delivery of continuous, quality care to patients living with chronic conditions requires a thoughtful, coordinated approach. New solutions combining advanced functionality and patient-centric design, including the Wisp minimal contact nasal mask for sleep and respiratory therapy, were introduced to help patients adhere to a health regimen for more independent living.
The complexities of healthcare delivery call for comprehensive solutions to address staggering costs, clinician shortages and demanding patient populations. Through customized models and programs, as demonstrated by our multi-year alliance with Georgia Regents Medical Center to facilitate innovative and affordable patient-centered care, we continued to help visionary health systems address these challenges today while moving toward a sustainable future.
Optimizing resources to cost-effectively meet the needs of resource-intensive patient populations requires integrated solutions. By leveraging our leadership in telehealth technology and care coordination, we implemented new Hospital to Home programs with BannerPersonal Health in the US and opened eICUs with Guy’s and St Thomas’ Hospitals in the UK.
2013 also marked the third year of our Accelerate! journey of change and performance improvement. We made significant progress driving customer centricity deep into our organization, embracing operational excellence through programs like Design for X (where X can be cost, quality, manufacturing, refurbishment, etc.) and fostering a growth and performance culture across our businesses. One of the key outcomes has been faster alignment across Philips Healthcare in delivering locally relevant innovations and making these solutions more cost-effective through efficiencies in product development.
Annual Report 2013 95
5 Sector performance 5.1.4 - 5.1.4
5.1.4 2013 financial performance
| Key data | ||||||||||||
| in millions of euros unless otherwise stated | ||||||||||||
| 2011 | 2012 | 2013 | ||||||||||
Sales | 8,852 | 9,983 | 9,575 | |||||||||
Sales growth | ||||||||||||
% increase, nominal | 3 | 13 | (4 | ) | ||||||||
% increase, comparable1) | 5 | 6 | 1 | |||||||||
Adjusted IFO1) | 1,080 | 1,226 | 1,512 | |||||||||
as a % of sales | 12.2 | 12.3 | 15.8 | |||||||||
IFO | 27 | 1,026 | 1,315 | |||||||||
as a % of sales | 0.3 | 10.3 | 13.7 | |||||||||
Net operating capital (NOC)1) | 8,418 | 7,976 | 7,437 | |||||||||
Cash flows before financing activities1) | 707 | 1,298 | 1,292 | |||||||||
Employees (FTEs) | 37,955 | 37,460 | 37,008 | |||||||||
|
In 2013, sales amounted to EUR 9,575 million, 4% lower than in 2012 on a nominal basis. Excluding a 5% negative currency effect, comparable sales increased by 1%. Customer Services achieved solid mid-single-digit growth. Home Healthcare Solutions and Patient Care & Clinical Informatics both posted low-single-digit growth, while Imaging Systems recorded a mid-single-digit decline. Green Product sales amounted to EUR 3,690 million, or 39% of sector sales.
Geographically, comparable sales in growth geographies showed high-single digit growth, largely driven by strong double-digit growth in China and Latin America, partly offset by a decline in Russia & Central Asia. In mature geographies, comparable sales declined by 1%. The year-on-year sales decrease was largely attributable to North America and Western Europe, as sales in other mature geographies showed a high-single-digit increase, led mainly by Japan.
Adjusted IFO increased from EUR 1,226 million, or 12.3% of sales, in 2012 to EUR 1,512 million, or 15.8% of sales, in 2013. All businesses delivered improved Adjusted IFO, largely as a result of cost-saving programs related to overhead reduction. Restructuring and acquisition-related charges were close to zero, compared with EUR 134 million in 2012. Adjusted IFO in 2013 also included EUR 61 million from a past-service pension gain and a EUR 21 million gain on the sale of a business.
IFO amounted to EUR 1,315 million, or 13.7% of sales, and included EUR 197 million of charges related to intangible assets.
Net operating capital decreased by EUR 539 million to EUR 7.4 billion, mainly due to currency effects and lower fixed assets.
Cash flows before financing activities decreased slightly from EUR 1,298 million in 2012 to EUR 1,292 million, as higher earnings were more than offset by higher outflows from working capital and provisions.
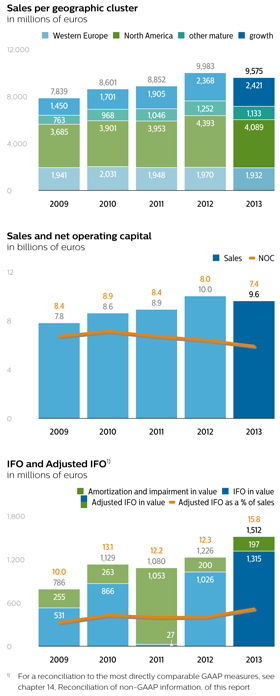
96 Annual Report 2013
5 Sector performance 5.1.5 - 5.1.6
2012 financial performance
In 2012, sales amounted to EUR 9,983 million, 13% higher than in 2011 on a nominal basis, driven by higher sales in all businesses. Excluding a 7% favorable impact of currency effects, comparable sales increased by 6%. High-single-digit comparable sales growth was achieved by Imaging Systems, Home Healthcare Solutions and Patient Care & Clinical Informatics. Green Product sales amounted to EUR 3,610 million, a 36% increase year-on-year.
Geographically, comparable sales in mature geographies were higher than in 2011 in all businesses. The year-on-year sales increase was largely attributable to North America and other mature markets, as sales in Western Europe were in line with 2011. In growth geographies, we achieved 20% growth, largely driven by strong, double-digit growth in China, Brazil, India and Russia.
Adjusted IFO increased from EUR 1,080 million, or 12.2% of sales, in 2011 to EUR 1,226 million, or 12.3% of sales, in 2012. All businesses recorded an improvement in Adjusted IFO, largely as a result of higher sales and cost-saving programs. Restructuring and acquisition-related charges amounted to EUR 134 million, compared with EUR 20 million in 2011.
IFO amounted to EUR 1,026 million, or 10.3% of sales, and included EUR 200 million of charges related to amortization of intangible assets.
Net operating capital in 2012 decreased by EUR 442 million to EUR 8.0 billion, mainly due to currency effects and an increase in provisions related to restructuring charges. All businesses showed improved efficiency in inventory usage year-over-year.
Cash flows before financing activities increased from EUR 707 million in 2011 to EUR 1,298 million, mainly due to higher earnings and lower working capital requirements.
5.1.5 Delivering on EcoVision sustainability commitments
The increasing population and rising levels of human development worldwide pose a number of challenges, such as scarcity of natural resources, pollution, and stressed health care systems. Philips Healthcare continues to help increase the number of lives improved annually around the globe by developing solutions that improve access to care, while at the same time respecting the boundaries of natural resources. In 2013 we introduced 13 new Green Products to support energy efficiency, materials reduction and other sustainability goals. We are also actively collaborating with care providers to look for innovative ways to reduce the environmental impact of health care, for example by improving the energy efficiency of medical equipment.
5.1.6 Delivering innovation that matters to you
Annual Report 2013 97

With image-guided High Intensity Focused Ultrasound from Philips, doctors at the University Hospital in Utrecht are researching ways of providing cancer therapy with fewer side effects and reducing the need for surgery.1)
“Up to 70% of patients with cancer will be facing bone metastases… The patients we see are in a lot of pain. The problems they have are in their daily activities such as sleeping, walking. This pain can be really debilitating.”
“No instruments whatsoever will go into the patient’s body. Without touching the patient we can treat the patient… By managing their pain we restore patients’ quality of life.”
Dr Merel Huisman
Department of Radiology
UMC Utrecht
“If we have patients with cancer that don’t need to be treated anymore with the surgical scalpel and leave a day after treatment in a good clinical condition, that would be a really major shift in health care and cancer treatment.”
Dr Maurice van den Bosch
Interventional Radiologist
UMC Utrecht

|
98 Annual Report 2013
5 Sector performance 5.2 - 5.2

“Across the world people are increasingly motivated to look and feel their best, seeking solutions that are truly meaningful, solutions that fit their daily lives. At Philips Consumer Lifestyle we are driving profitable growth, by taking global innovations and bringing them to market in a way that is highly locally relevant. We are empowering millions of consumers to make healthier choices every day, in areas such as oral healthcare, nutrition and healthy air.”Pieter Nota, CEO Philips Consumer Lifestyle
We are executing our strategy with rigor, delivering strong growth and improving profitability through locally relevant innovation.
Future growth drivers are clearly set: grow the core businesses through local and global innovation, and geographical expansion of proven propositions; further expand in the domain of personal health and well-being by exploring new business adjacencies and new business areas.
Accelerate! has transformed the sector into a market-driven organization, by changing our operating model, performance culture and end-to-end approach.
Annual Report 2013 99
5 Sector performance 5.2.1 - 5.2.2
5.2.1 Lifestyle retail landscape
Across the world, consumers are looking for solutions that help them to be healthy, live well and enjoy life. They want to be in control of their own health and well-being and to care for their family and friends. They want to look and feel good.
In a connected, digital world, consumers are looking for smart, personalized solutions. Purchase decisions are increasingly made or influenced online; this is as true of consumers in growth geographies such as China, as it is in developed markets such as Western Europe.
The rise of the middle class in growth geographies is another trend impacting the retail landscape. This rapidly expanding group is experiencing greater spending power.
In 2013, economic headwinds caused continued pressure on consumer spending in some markets. However, living a healthy life remained a high priority for consumers.
5.2.2 About Philips Consumer Lifestyle
At Consumer Lifestyle we aim to make a difference to people’s lives by making it easier for them to achieve a healthier and better lifestyle. The sector is focused on value creation through category leadership and operational excellence. We are increasing the quality and local relevance of product innovation, the speed with which we innovate, and expanding our distribution to capture increasing spending power in growth geographies.
Accelerate! is fully embedded in Consumer Lifestyle and delivering strong results. Having moved from a functional, centrally-led organization to an organization built around businesses and markets, we are now able to direct investments to where the growth is, addressing locally relevant consumer needs. This approach enables us to take locally developed platforms and adapt them for other markets or on a global scale.
Our end-to-end approach is accelerating our specialist capability development in mature markets, to enable effective partnerships with customers and consumers, and in growth geographies, to enable development of go-to-market strategies. Additionally, an extensive change program has instilled an organizational performance culture with a strong focus on accountability.
In 2013 the Consumer Lifestyle sectorsegment consisted of the following areas of business*:business:
Health & Wellness:Wellness: mother and childcare,child care, oral healthcare, pain managementrelief
Personal Care:Care: male grooming, beauty
Domestic Appliances:Appliances: kitchen appliances, coffee, air, garment care, floor care air purification
Sleep & Respiratory Care: sleep, respiratory care, respiratory drug delivery
Personal Health
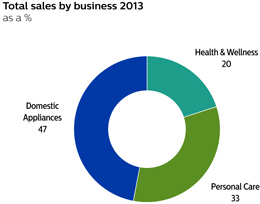
2016
We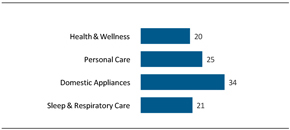
Through our Personal Health businesses, we offer a broad range of products from high to low price/value quartiles, necessitating a diverse distribution model. We continue to expand our portfolio toand increase its accessibility, particularly for inlower-tier cities in growth geographies. We have implemented innovative approachesare well positioned to capture further growth in online sales and social mediacontinue to build our branddigital and drivee-commerce capabilities. We are adapting our web functionality to offer consumers a better user experience via smaller screens, driving improvements from conversion to sales. And we continue toroll-out high-impact consumer marketing programs in support of key innovations. The launch of Philips OneBlade, for example, was accompanied by the deployment of an innovative Digital Advocacy Marketing Program.
The company’s wide portfolio of connected consumer health products leverages Philips HealthSuite – a cloud-enabled connected health ecosystem of devices, apps and digital tools that enables personalized health and continuous care.
We are leveraging connectivity to engage consumers in new and impactful ways through social media and digital innovation. For example, in 2016 we launched the Philips Sonicare FlexCare Platinum Connected toothbrush. With unique smart sensor technology inside the toothbrush – connecting to the Philips Sonicare smartphone app via Bluetooth – users receive personalizedstep-by-step coaching, real-time feedback and post-brush analysis with a visual 3D mouth map to help improve brushing technique. Via the Philips HealthSuite digital platform, the app allows data to be shared with dental practices, so hygienists can mark up areas that need special attention.
Under normal economic conditions, the Consumer Lifestyle sector experiencesPhilips’ Personal Health businesses experience seasonality, with higher sales in the fourth quarter.
Consumer Lifestyle employsIn 2016, Personal Health employed approximately 17,90022,530 people worldwide. OurThe global sales and service organization coverscovered more than 50 developedmature and growth geographies. In addition, we operateoperated manufacturing and business creation organizations in Argentina, Austria, Brazil, China, India, Indonesia, Italy, the Netherlands, Romania, the UK and the US.
100 Annual Report 2013
5 Sector performance 5.2.2 - 5.2.4
A new innovation site in Shanghai is fully equippedCommitment to target specific market needs. Innovating directly in the market allows us to increase the annual number of locally relevant introductions and to implement product and packaging updates faster.
Regulatory requirementsquality
Consumer LifestyleThe implementation of the Philips Business System is embedding a fundamental commitment to quality across all our processes, products, systems and services. Philips’ Personal Health businesses are subject to significant regulatory requirements in the markets where it operates.they operate. This includes the European Union’s Waste from Electrical and Electronic Equipment (WEEE), Restriction of Hazardous Substances (RoHS), Registration, Evaluation, Authorization and Restriction of Chemicals (REACH), Energy-use of Products (EuP) requirements and Product Safety Regulations. Consumer Lifestyle has a growing portfolio of medically regulated products in its Health & Wellness and Personal Care businesses. For these products we are subject to the applicable requirements of the US FDA, the European Medical Device Directive, the SFDA in China, the regulations stipulated by Health Authorities in India and comparable regulations in other countries. Through our growing beauty, oral healthcare and mother and childcare product portfolio the range of applicable regulations has been extended to include requirements relating to cosmetics and, on a very small scale, pharmaceuticals.
With regard to sourcing, please refer to sub-section 13.2.2, Supplier indicators, of this report.
5.2.3 2013 highlights
Building our leadership in digital innovation, we unveiled a range of connected consumer propositions at this year’s IFA trade show in Berlin. Highlights included a smart air purifier, baby monitor and a digital grooming guide.
The extended Philips AVENT Natural infant feeding range was showcased at the Kind + Jugend fair in Germany. The Natural baby bottle is proven to be more easily accepted by babies, thanks to its unique teat design.
Further strengthening our global leadership, the latest introductions in Oral Healthcare, including the Philips Sonicare PowerUp and Sonicare FlexCare Platinum, have been well received by consumers and are driving strong growth in North America and China.
Continuing the geographical expansion and localization of proven product innovations, we introduced the Airfryer in Japan and the SoupMaker in markets across Europe, the Middle East and Latin America. Additionally, following major success in Russia, the MultiCooker was launched in several European markets, with initial market response exceeding expectations.
Innovative, precision tools are driving market share and brand preference in male grooming. Following the successful launch of the Click & Style range, we further expanded our portfolio with the introduction of the world’s first laser-guided beard trimmer: the Philips Beard Trimmer 9000.
Demonstrating our ability to respond quickly to local market opportunities, we recorded strong sales growth in our air purifier business in China on the back of heightened awareness of outdoor air quality in the country.
5.2.4 2013 financial performance
Key data
in millions of euros unless otherwise stated
| 2011 | 2012 | 2013 | ||||||||||
Sales | 3,771 | 4,319 | 4,605 | |||||||||
Sales growth | ||||||||||||
% increase (decrease), nominal | 14 | 15 | 7 | |||||||||
% increase (decrease), comparable1) | 11 | 9 | 10 | |||||||||
Adjusted IFO1) | 153 | 456 | 483 | |||||||||
as a % of sales | 4.1 | 10.6 | 10.5 | |||||||||
IFO | 109 | 400 | 429 | |||||||||
as a % of sales | 2.9 | 9.3 | 9.3 | |||||||||
Net operating capital (NOC)1) | 874 | 1,205 | 1,261 | |||||||||
Cash flows before financing activities1) | (271 | ) | 422 | 472 | ||||||||
Employees (FTEs) | 15,471 | 16,542 | 17,854 | |||||||||
|
Sales amounted to EUR 4,605 million, a nominal increase of 7% compared to 2012. Excluding a 3% negative currency impact, comparable sales were 10% higher year-on-year. Domestic Appliances achieved strong double-digit growth, while Health & Wellness and Personal Care recorded high-single-digit growth.
From a geographical perspective, comparable sales showed a 17% increase in growth geographies and 4% growth in mature geographies. In growth geographies, the year-on-year sales increase was driven by Russia and China, primarily in our Domestic Appliances and Personal Care businesses. Growth geographies’ share of sector sales increased from 45% in 2012 to 47% in 2013.
Adjusted IFO increased from EUR 456 million, or 10.6% of sales, in 2012 to EUR 483 million, or 10.5% of sales, in 2013. Restructuring and acquisition-related charges
Annual Report 2013 101
5 Sector performance 5.2.4 - 5.2.4
amounted to EUR 14 million in 2013, compared to EUR 56 million in 2012. Adjusted IFO in 2012 included a EUR 160 million one-time gain from the extension of our partnership with Sara Lee, including the transfer of our 50% ownership right to the Senseo trademark. Excluding this one-time gain, the year-on-year Adjusted IFO increase was driven by improved earnings in all businesses.
IFO amounted to EUR 429 million, or 9.3% of sales, which included EUR 54 million of amortization charges, mainly related to intangible assets at Health & Wellness and Domestic Appliances.
Net operating capital increased from EUR 1,205 million in 2012 to EUR 1,261 million in 2013, due to higher working capital and lower provisions.
Cash flows before financing activities increased from EUR 422 million in 2012 to EUR 472 million in 2013. Excluding the cash proceeds of EUR 170 million received in 2012 from the Senseo transaction, cash flows before financing activities increased by EUR 120 million mainly attributable to higher cash earnings.
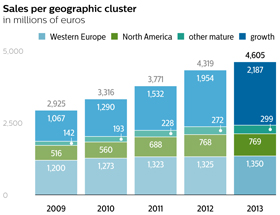
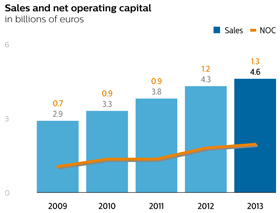
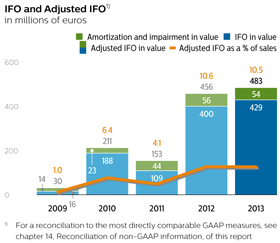
2012 financial performance
Sales amounted to EUR 4,319 million, a nominal increase of 15% compared to 2011, mainly driven by double-digit growth in our Health & Wellness and Domestic Appliances businesses. Excluding a 4% favorable currency impact and a 2% impact from portfolio changes, comparable sales were 9% year-on-year.
From a geographical perspective, comparable sales showed a 7% increase in growth geographies, which was partly offset by a 2% decline in mature geographies, mainly in Western Europe. In growth geographies, the year-on-year sales increase was driven by Russia and China, primarily in our Domestic Appliances and Personal Care businesses. Growth geographies’ share of sector sales increased from 41% in 2011 to 45% in 2012.
Adjusted IFO increased from EUR 153 million, or 4.1% of sales, in 2011 to EUR 456 million, or 10.6% of sales, in 2012. Restructuring and acquisition-related charges amounted to EUR 56 million in 2012, compared to EUR 49 million in 2011. 2012 results included a EUR 160 million one-time gain from the extension of our partnership with Sara Lee, including the transfer of our 50% ownership right to the Senseo trademark. Excluding this one-time gain, the year-on-year Adjusted IFO increase was driven by higher sales as well as lower net costs formerly reported as part of the Television business. Compared to 2011, Adjusted IFO improvements were seen in all businesses.
IFO amounted to EUR 400 million, or 9.3% of sales, which included EUR 56 million of amortization charges, mainly related to intangible assets at Health & Wellness and Domestic Appliances.
102 Annual Report 2013
5 Sector performance 5.2.5 - 5.2.6
Net operating capital increased from EUR 874 million in 2011 to EUR 1,205 million in 2012, primarily due to a reduction in the accounts payable balance related to the former Television business in Consumer Lifestyle.
Cash flows before financing activities increased from a cash outflow of EUR 271 million in 2011 to a cash inflow of EUR 422 million. The increase was attributable to higher cash earnings, lower cash outflows for acquisitions as well as cash proceeds of EUR 170 million from the Senseo transaction.
5.2.5 Delivering on EcoVision sustainability commitments
Sustainability plays an important role at Consumer Lifestyle, with the main focus on optimizing the sustainability performance of our products and operations. Green products, which meet or exceed our minimum requirements in the areas of energy consumption, packaging and substances of concern, accounted for 49% of total sales in 2013. And more than 80% of our shaving and grooming products are completely PVC/BFR-free.
In 2013 we continued to increase the use of recycled materials in our products. Over 330 tons of recycled plastics were used in vacuum cleaners and almost 250 tons in irons. In our operations we continue to use more energy from renewable sources, with the ultimate aim of having CO2-neutral production sites. In 2013 we improved the recycling percentage of our industrial waste to almost 80%.
5.2.6 Delivering innovation that matters to you
Annual Report 2013 103

Jialing Jin’s family means the world to him. And he wants them to know it. When he shaves with a Philips SensoTouch 3D, he feels more confident and his family feels the difference.
“I think having a clean-cut and neat appearance can boost a man’s confidence. In the past I used a standard razor, but it irritated my skin.”


“Since I began using the new Philips SensoTouch 3D razor, my shaving experience has noticeably improved. My skin is even smoother and my daughter loves to touch my face. She tells me my skin is so smooth! Having a clean-cut and tidy appearance increases my confidence, and with that I am able to enjoy a full life.”
104 Annual Report 2013
5 Sector performance 5.3 - 5.3.1

“In 2013 our industry experienced a huge transformation as the shift to LED lighting gathered pace. We delivered value by improving our profitability and achieved a leading position in LED lighting solutions. Going forward, we will accelerate the drive to LED and help our customers to realize the benefits of intelligent connected lighting, serving both consumers and the growing professional market for integrated systems and services.”Eric Rondolat, CEO Philips Lighting
The lighting industry is undergoing a radical transformation.
The lighting market is being driven by the transition to LED and digital applications.
Our four-pillar strategy will enable us to improve performance, maximize growth and strengthen our position as a global leader in the lighting market.
5.3.1 Lighting business landscape
We are witnessing a number of trends and transitions that are affecting the lighting industry and changing the way people use and experience light.
We serve a large and attractive market that is driven by the need for more light, energy-efficient lighting, and digital lighting. Over half the world’s population currently lives in urban areas: a figure that is expected to rise to over 70% by 2050. That means 3 billion extra city
Annual Report 2013 105
5 Sector performance 5.3.1 - 5.3.2
dwellers. These people will all need light. In addition, the world needs energy-efficient light in the face of rising energy prices and climate change. At the same time, the lighting industry is moving from conventional to LED lighting, which is changing the way people use, experience and interact with light. LED technology, when combined with controls and software and linked into a network, is allowing light points to achieve a degree of intelligence. This is opening up the possibility of new functionalities and services based on the transmission and analysis of data.
The lighting market is expected to grow by 4-6% on a compound annual basis between 2013 and 2016. The majority of this growth will be driven by LED-based solutions and applications – heading towards a 45% share by 2015 – and growth geographies.
5.3.2 About Philips Lighting
Philips Lighting is a global market leader with recognized expertise in the development, manufacture and application of innovative, energy-efficient lighting products, systems and services that improve people’s lives. We have pioneered many of the key breakthroughs in lighting over the past 122 years, laying the basis for our current strength and ensuring we are well-placed to be a leader in the digital transformation.
We have a firm strategy in place to deliver even greater value for our customers. This strategy is based upon four pillars:
Lead the technological revolution – strengthen our leadership position through continued innovation in high-quality, efficient and connected LED systems.
Win in the consumer market – build on our strengths in lamps by meeting consumers’ needs and delivering innovative products, such as the Hue personal wireless lighting system that can be controlled by a smart phone or tablet. At the same time we are addressing costs so that consumers can quickly enjoy the advantages of new LED innovations in lamps, luminaires and systems. In addition, we are developing new channels to market.
Drive innovation in professional lighting systems and services – providing integrated offerings for this market, which is an early adopter of energy-efficient LED and now intelligent connected lighting technologies.
Accelerate! – strengthen our capabilities and improve the way we work so that we reduce our costs, are more productive, and fully satisfy our customers’ expectations.
We aim to further strengthen our position in the digital market through added investment in LED leadership while at the same time capitalizing on our broad portfolio, distribution and brand in conventional lighting – seizing the significant opportunity to grow market share and optimize profits in conventional lamps and drivers by flexibly anticipating the slower or faster phase-out of conventional products.
We address people’s lighting needs across a full range of market segments. Indoors, we offer lighting solutions for homes, shops, offices, schools, hotels, factories and hospitals. Outdoors, we offer solutions for roads (street lighting and car lights) and for public spaces, residential areas and sports arenas, as well as solar-powered LED off-grid lighting. In addition, we address the desire for light-inspired experiences through architectural projects. Finally, we offer specific applications of lighting in specialized areas, such as horticulture and water purification.
Philips Lighting spans the entire lighting value chain – from light sources, luminaires, electronics and controls to application-specific systems and services – through the following businesses:
Light Sources & Electronics: LED, eco-halogen, (compact) fluorescent, high-intensity discharge and incandescent light sources, plus electronic and electromagnetic gear, modules and drivers
Consumer Luminaires: functional, decorative, lifestyle, scene-setting luminaires
Professional Lighting Solutions: controls and luminaires for city beautification, road lighting, sports lighting, office lighting, shop/hospitality lighting, industry lighting
Automotive Lighting: car headlights and signaling
Lumileds: packaged LEDs
The Light Sources & Electronics business conducts its sales and marketing activities through the professional, OEM and consumer channels, the latter also being used by our Consumer Luminaires business. Professional Lighting Solutions is organized in a trade business (commodity products) and a project solutions business (project luminaires, systems and services). Automotive Lighting is organized in two businesses: OEM and Aftermarket.
The conventional lamps industry is highly consolidated, with GE and Osram as key competitors. The LED lighting market, on the other hand, is very dynamic. We face new competition from Asia and new players from the
106 Annual Report 2013
5 Sector performance 5.3.2 - 5.3.4
semiconductor and building management sectors. The luminaires industry is fragmented, with our competition varying per region and per market segment.
Under normal economic conditions, Lighting’s sales are generally not materially affected by seasonality.
Philips Lighting has manufacturing facilities in some 25 countries in all regions of the world, and sales organizations in more than 60 countries. Commercial activities in other countries are handled via distributors working with our International Sales organization. Lighting has approximately 46,900 employees worldwide.
Regulatory requirements
Lighting is subject to significant regulatory requirements in the markets where it operates. These include the European Union’s Waste from Electrical and Electronic Equipment (WEEE), Restriction of Hazardous Substances (RoHS), Registration, Evaluation, Authorization and Restriction of Chemicals (REACH), Energy-using Products (EuP) requirements and Energy PerformanceProduct Safety Regulations. We have a growing portfolio of Buildings (EPBD) directives.medically regulated products in our Health & Wellness and Personal Care businesses.
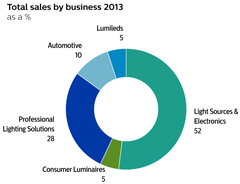
Segment performance 3.1.1
For these products we are subject to the applicable requirements of the US FDA, the European Medical Device Directive, the CFDA in China and comparable regulations in other countries. Through our growing beauty, oral healthcare and mother and child care product portfolio the range of applicable regulations has been extended to include requirements relating to cosmetics and, on a very small scale, pharmaceuticals.
5.3.3 2013With regard to sourcing, please refer tosub-section 12.3.8, Supplier indicators, of this report.
3.1.2 2016 business highlights
In 2013, our lighting innovations underlined our four-pillar strategy aimedPhilips introduced a range of personalized health programs at delivering even greater value for our customersthis year’s IFA trade show in Berlin, including the Philips Sonicare FlexCare Platinum Connected toothbrush and shareholders.the uGrow medical-grade baby app. The health programs leverage Philips HealthSuite, a cloud-enabled connected health ecosystem of devices, apps and digital tools.
LeadingPersonal Care successfully launched Philips OneBlade – a hybrid styler that can trim, shave and create clean lines and edges – in France, the technological revolution in lighting, we delivered a number of groundbreaking innovations. Lumileds setUK, Germany and North America.
Sleep & Respiratory Care launched the standard in high and mid-power LEDs, improving efficacy and light quality. In our drivecloud-based Patient Adherence Management Service, which supports new patients’ transition to continuously reduce energy consumption, Philips wassleep therapy. Building on the first to show a prototype TLED providing 200 lumens per watt, which is twice as efficient as current LED-based solutions. We also continued to pioneer innovations in connected lighting, in segments such as home and city lighting.
Our smart and connected CityTouch lighting system was installed in a number of cities around the world. This intelligent lighting system enables cities to control light points in a dynamic and flexible way to deliver light where and when needed, saving energy and maintenance costs.
Our innovations in architectural lighting were used to rejuvenate somesuccess of the best-known landmarksintegrated Dream Family solution in the world, such asUS, Europe and Japan, the Bay Bridge in San Francisco,Philips DreamStation Go portable CPAP solution was introduced. DreamStation Go is a compact and lightweight device designed to create new city icons such asprovide sleep therapy for travelers with obstructive sleep apnea.
Oral Healthcare continued its growth trajectory, supported by a strong performance of the firePhilips Sonicare FlexCare Platinum Connected toothbrush, which hasbuilt-in sensor technology that enables real- time feedback and water-breathing Dragon Bridge in Da Nang, Vietnam. Underlining our expertise in integrated solutions, we collaborated with the Rijksmuseum, Amsterdamcoaching to develop a customized LED lighting solution for the museum’s entire exhibition area, bringing the color and detail of masterpieces such as Rembrandt’s Night Watch to life as never before.help consumers optimize their brushing routine.
The latest innovation in Philips Hue, our groundbreaking connected lighting system for the home, connects to internet services, making the system even more intelligent, with new functionality to enjoy. We also launched ‘Friends of Hue’ – lamp fittings and luminaires such as LivingColors Bloom and LightStrips which enable consumers to create even richer lighting experiences. Resulting from our partnership with Disney, StoryLight Mickey is another addition to the Friends of Hue portfolio. It transforms bedtime stories into a unique experience. The Philips-Disney partnership combines Philips’ innovation in lighting with the magic of Disney characters and storytelling to transform a child’s bedroom into a more imaginative place for them to read, play and fall asleep.
5.3.4 20133.1.3 2016 financial performance
Net income is not allocated to segments as certain income and expense line items are monitored on a centralized basis.
| Key data | ||||||||||||
| in millions of euros unless otherwise stated | ||||||||||||
| 2011 | 2012 | 2013 | ||||||||||
Sales | 7,638 | 8,442 | 8,413 | |||||||||
Sales growth | ||||||||||||
% increase, nominal | 1 | 11 | 0 | |||||||||
% increase, comparable1) | 6 | 4 | 3 | |||||||||
Adjusted IFO1) | 399 | 128 | 695 | |||||||||
as a % of sales | 5.2 | 1.5 | 8.3 | |||||||||
IFO | (408 | ) | (66 | ) | 489 | |||||||
as a % of sales | (5.3 | ) | (0.8 | ) | 5.8 | |||||||
Net operating capital (NOC)1) | 4,965 | 4,635 | 4,462 | |||||||||
Cash flows before financing activities1) | 208 | 279 | 478 | |||||||||
Employees (FTEs) | 53,168 | 50,224 | 46,890 | |||||||||
Personal Health
Key datain millions of EUR unless otherwise stated
2014 - 2016
|
| |||||||||||
| 2014 | 2015 | 2016 | ||||||||||
|
| |||||||||||
Sales | 5,948 | 6,751 | 7,099 | |||||||||
Sales growth | ||||||||||||
% increase, nominal | 3 | % | 14 | % | 5 | % | ||||||
% increase, comparable1) | 6 | % | 5 | % | 7 | % | ||||||
Income from operations (EBIT) | 620 | 736 | 953 | |||||||||
as a % of sales | 10.4 | % | 10.9 | % | 13.4 | % | ||||||
Adjusted income from operations1) | 758 | 885 | 1,092 | |||||||||
as a % of sales | 12.7 | % | 13.1 | % | 15.4 | % | ||||||
|
| |||||||||||
| 1) | Non-GAAP financial measure. For |
Annual Report 2013 107
5 Sector performance 5.3.4 - 5.3.4
In 2013,2016, sales amounted to EUR 8,4137,099 million, in line with 2012 on a nominal basis.increase of 5% compared to 2015. Excluding a 3%2% negative currency effect,impact, comparable sales increased by 3%. Double-digit comparable sales growth was achieved by Lumileds and Automotive. Light Sources & Electronics recorded low-single-digit growth, while comparable sales at Professional Lighting Solutions1) were in line with 2012. Consumer Luminaires showed a low-single-digit decline.
The 7% higheryear-on-year, comparable sales increase was substantially driven by growth geographies, which grew 12% on a comparable basis. As a proportion of total sales, sales in growth geographies increased to 43% of total Lighting sales, driven by double-digit growth in ChinaHealth & Wellness and Indonesia, comparedmid-single-digit growth in Personal Care, Sleep & Respiratory Care and Domestic Appliances. Green Revenues amounted to 41% in 2012. InEUR 3,951 million, or 56% of total segment sales.
From a geographic perspective, on a comparable basis1) both growth geographies and mature geographies sales showed a low-single-digit decline, largely due to lower demandachieved high-single-digit growth. In growth geographies, the increase was mainly driven by Central & Eastern Europe and Middle East & Turkey. Mature geographies recorded high-single-digit growth, driven by high-single-digit growth in Western Europe,mid-single-digit growth in North America and Western Europe, particularly at Professional Lighting Solutions and Consumer Luminaires.low-single-digit growth in other mature geographies.
Sales of LED-based products grew to 29% of total sales, upIncome from 22% in 2012, driven by Light Sources & Electronics and Professional Lighting Solutions. Sales of energy-efficient Green Products exceeded EUR 5,855 million, or 70% of sector sales.
Adjusted IFOoperations(EBIT) amounted to EUR 695953 million, or 8.3% of sales, compared to EUR 128 million, or 1.5% of sales, in 2012. Restructuring and acquisition-related charges amounted to EUR 100 million in 2013, compared to EUR 315 million in 2012. The increase in Adjusted IFO was mainly attributable to higher operational earnings, as well as lower restructuring and acquisition-related charges. Additionally, 2012 included losses on the sale of industrial assets amounting to EUR 81 million.
IFO amounted to EUR 489 million, or 5.8%13.4% of sales, which included EUR 180139 million of amortization charges, mainly related to intangible assets at Professional Lighting Solutions, and an impairment of EUR 32 million related to customer relationships at Consumer Luminaires. Additionally, a goodwill impairment charge of EUR 26 million was taken in the fourth quarter of 2013 due to reduced growth expectations.Sleep & Respiratory Care.
Net operating capital decreased by EUR 173 million to EUR 4.5 billion, primarily due to currency effects, partly offset by a reduction in restructuring provisions.
Cash flows before financing activitiesAdjusted income from operations1) increased from EUR 279 million in 2012 to EUR 478 million, mainly due to higher cash earnings and lower net capital expenditures, partly offset by higher outflows for working capital.
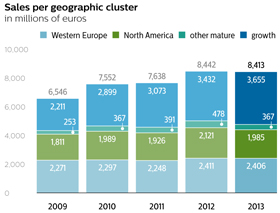
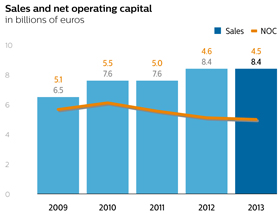
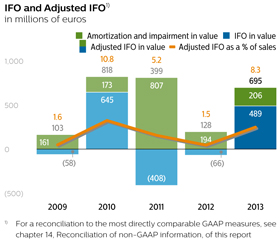
2012 financial performance
Sales amounted to EUR 8,442 million, a nominal increase of 11% compared to 2011, mainly driven by growth at Light Sources & Electronics and Professional
108 Annual Report 2013
5 Sector performance 5.3.5 - 5.3.6
Lighting Solutions, partly offset by a sales decline at Lumileds. Excluding a 5% favorable currency impact and a 2% positive effect from portfolio changes, comparable sales increased by 4%.
The year-on-year sales increase was substantially driven by growth geographies, which grew 7% on a comparable basis. Sales in growth geographies increased to 41% of total Lighting sales, driven by double-digit growth in China and India, compared to 40% in 2011. In mature geographies, sales growth was limited to low single digits due to lower demand in North America and Western Europe, particularly at Professional Lighting Solutions and Consumer Luminaires.
Sales of LED-based products grew to over 22% of total sales, up from 16% in 2011, driven by Light Sources & Electronics and Professional Lighting Solutions. Sales of energy-efficient Green Products exceeded EUR 5,752885 million, or 68% of sector sales.
Adjusted IFO amounted to EUR 128 million, or 1.5% of sales, compared to EUR 399 million, or 5.213.1% of sales, in 2011.2015 to EUR 1,092 million, or 15.4% of sales, in 2016. Restructuring and acquisition-related charges amounted to EUR 31516 million in 2012,2016, compared to EUR 6637 million in 2011.2015. Adjusted income from operations1) in 2015 also included charges related to the devaluation of the Argentine peso of EUR 13 million. The decreaseincrease in Adjusted IFOincome from operations1) was mainly attributable to higher restructuringvolumes and acquisition-related charges, as well as losses on the salecost productivity.
Personal Health
Sales per geographic clusterin millions of industrial assets amountingEUR
2014 - 2016
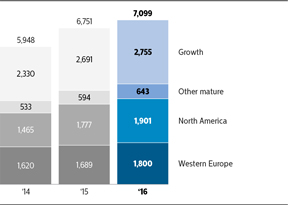
| 1) | Non-GAAP financial measure. For the definition and reconciliation to the most directly comparable GAAP measure, refer tochapter 4, Reconciliation ofnon-GAAP information, of this report. |
52 Annual Report 2016
Segment performance 3.1.3
Personal Health
Income from operations (EBIT) and Adjusted income from operations1)in millions of EUR
2014 - 2016
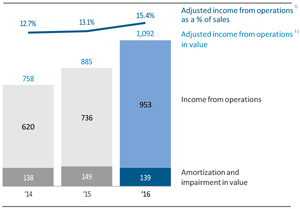
| 1) | Non-GAAP financial measure. For the definition and reconciliation to the most directly comparable GAAP measure, refer tochapter 4, Reconciliation ofnon-GAAP information, of this report |
2015 financial performance
Sales amounted to EUR 816,751 million, partly offset bya nominal increase of 14% compared to 2014. Excluding 9% positive currency impact, comparable sales1) were 5% higher sales.
IFOyear-on-year. On a comparable basis1), Health & Wellness achieved double-digit growth, Personal Care recorded high-single-digit growth and Sleep & Respiratory Care and Domestic Appliances recordedlow-single-digit growth. Green Revenues amounted to a loss of EUR 663,521 million, or negative 0.8%52% of total segment sales.
From a geographical perspective, on a comparable basis1) growth geographies achieved high-single-digit growth and mature geographies registeredlow-single-digit growth. In growth geographies, the increase was mainly driven by Central & Eastern Europe, Asia Pacific and India, primarily in Health & Wellness and Personal Care. Growth geographies’ share of segment sales was 40%, compared to 39% in 2014.
Income from operations(EBIT) amounted to EUR 736 million, or 10.9% of sales, which included EUR 194149 million of amortization charges, mainly related to intangible assets at Professional Lighting Solutions.Sleep & Respiratory Care.
Adjusted income from operations1) increased from EUR 758 million, or 12.7% of sales, in 2014 to EUR 885 million, or 13.1% of sales, in 2015. Restructuring and acquisition-related charges amounted to EUR 37 million in 2015, compared to EUR 17 million in 2014. Adjusted income from operations1) in 2015 also included charges of EUR 31 million related to a legal matter and EUR 13 million related to the devaluation of the Argentine peso. Adjusted income from operations1) in 2014 also included a EUR 11 million past-service pension cost gain. Theyear-on-year increase was largely driven by cost productivity, higher volumes and product mix.
3.1.4 Healthy people, sustainable planet
Sustainability continued to play an important role in the Personal Health businesses in 2016, with the main focus on optimizing the sustainability performance of our products and operations. Green Revenues, sales of products and solutions which meet or exceed our minimum requirements in the area of energy consumption, packaging and/or substances of concern, accounted for 56% of total sales in 2016. All Green Products with rechargeable batteries exceed the stringent California energy efficiency standard by at least 10%. And over 54% of total sales arePVC- and/orBFR-free products (excluding power cords).
As part of our Circular Economy program we have continued to increase the use of recycled materials in our products. Over 1,440 tons of recycled plastics were used in kitchen appliances, vacuum cleaners, irons, air purification and coffee machines, compared to 900 tons in 2015. The revenue from Circular Products reached over EUR 414 million in 2016, comprised of turnover generated from performance- and access-based business models in Sleep & Respiratory Care and products with recycled plastic materials.
As a concrete example of our commitment to sustainability we launched the new Performer Ultimate vacuum cleaner, for which we have created a closed-loop recycling system. Old Philips vacuum cleaners are collected in Western Europe and recycled separately from other products and brands. The plastics from the old vacuum cleaners are then mixed with other recycled plastics to create a new recycled plastic that is used to produce the new Performer Ultimate, which is free of PVC/BFR, has anA-class energy label and contains 36% recycled plastics.
In our operations we continue to draw most of our electricity from renewable sources, with the ultimate aim of havingCO2-neutral production sites by 2020. In 2016, 47% of the electricity used in manufacturing sites came from renewable sources and 85% of the industrial waste was recycled. We sent 7% of our manufacturing waste to landfill in 2016 and started a detailed analysis of waste streams that are landfilled by our production sites. Based on this we will define actions to reach our goal of zero waste to landfill in 2020.
| 1) | Non-GAAP financial measure. For the definition and reconciliation to the most directly comparable GAAP measure, refer tochapter 4, Reconciliation ofnon-GAAP information, of this report. |
Annual Report 2016 53
Segment performance 3.2
3.2 Diagnosis & Treatment businesses
The Chief Business Leader of the Diagnosis & Treatment businesses segment, Rob Cascella, joined Philips in April 2015. He has more than 30 years of experience in the healthcare industry and has served on the Boards of several companies, including 10 years as President and later CEO of Hologic Inc.
3.2.1 About Diagnosis & Treatment businesses
Our Diagnosis & Treatment businesses are foundational to our health technology strategy, delivering on the promise of precision medicine and least-invasive treatment and therapy. We enable our customers to realize the full potential of their ‘triple aim’ – to improve outcomes, lower the cost of care delivery and enhance the patient experience – by enabling first-time-right diagnosis and treatment. We are focused on providing the most efficient path to obtaining a definitive diagnosis by integrating multiple sources of information and combining the data to create a comprehensive patient view. By bringing together imaging morphology, pathology and genomics, we are able to interrogate and extract the information needed to offer very personalized care. Our informatics platform provides the intelligence to make more consistent decisions, as well as making it easier to share and collaborate.
With our image-guided therapy, clinicians are provided with the technology necessary to determine the presence of disease, guide treatment procedures and confirm effectiveness. Our solutions enable patient- specific treatment planning and selection, simplify complex procedures through integrated real-time guidance, and provide clinically proven treatment solutions. We provide image guidance both in our proprietary products and by partnering with radiation therapy companies like Elekta and IBA to deliver real- time, precise cancer treatment.
In addition to our solutions for clinical pathways, we provide a range of technologies to help our customers improve their operational results. This year we introduced a comprehensive suite of software services designed to improve radiology department operations – PerformanceBridge is a multi-vendor offering that provides practice management, dose management and service analytics. It can be delivered as a service offering to promote continuous improvement, or as a professional service where our people partner with our customers to improve operating effectiveness.
The value proposition to our customers is based on leveraging our extensive clinical experience with our broad portfolio of technologies – making us uniquely capable to provide meaningful solutions that ultimately can improve the lives of the patients we serve while lowering the cost of care delivery for our customers.
Through our various businesses, Diagnosis & Treatment is focused on growing market share and profitability by:
continuing to improve business fundamentals in Diagnostic Imaging; we made substantial progress in 2016, with, amongst others, the full CT (Computed Tomography) portfolio shipping from Cleveland, Haifa, Suzhou and other facilities
enhancing our offering in oncology and radiology and expanding our solutions offering, which comprises systems, smart devices, software and services
leveraging the successful integration of Volcano and driving expansion into devices for treatment
addressing underpenetrated adjacencies in General Imaging and Obstetrics/Gynecology in Ultrasound
Philips is one of the world’s leading health technology companies (based on sales) along with General Electric and Siemens. The competitive landscape in the healthcare industry is evolving with the emergence of new market players. The United States, our largest market, represented 34% of Diagnosis & Treatment’s global sales in 2016, followed by China, Japan and Germany. Growth geographies accounted for 33% of Diagnosis & Treatment’s sales. In 2016, Diagnosis & Treatment had 23,791 employees worldwide.
Through 2016 we consistently focused on our value- creation strategy to ensure continued growth and margin improvement.
In 2016, the Diagnosis & Treatment segment consisted of the following areas of business:
Diagnostic Imaging: Magnetic Resonance Imaging, Computed Tomography, DiagnosticX-Ray, which includes digitalX-ray and mammography, Advanced Molecular Imaging, and integrated clinical solutions, which include radiation oncology planning, disease- specific oncology solutions andX-Ray dose management
Image-Guided Therapy: interventionalX-ray systems, encompassing cardiology, radiology and surgery, and interventional imaging and therapy devices that include Intravascular Ultrasound (IVUS), Fractional Flow Reserve (FFR) and atherectomy for the treatment of coronary artery and peripheral vascular disease
Ultrasound: imaging products focused on diagnosis, treatment planning and guidance for cardiology, general imaging, Obstetrics/Gynecology, and point-of-care applications, as well as proprietary software capabilities to enable advanced diagnostics and intervention
54 Annual Report 2016
Segment performance 3.2.1
Diagnosis & Treatment
Total sales by businessas a %
2016
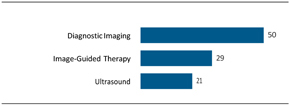
Sales at Philips’ Diagnosis & Treatment businesses are generally higher in the second half of the year, largely due to the timing of new product availability and customer spending patterns.
Sales channels are a mix of a direct sales force, especially in all the larger markets, combined with online sales portal and distributors – this varies by product, market and price segment. Sales are mostly driven by a direct sales force that has an intimate knowledge of the procedures for which our devices are used, and visits our customer base frequently.
Commitment to quality
The implementation of the Philips Business System is embedding a fundamental commitment to quality across all our processes, products, systems and services. This commitment is of vital importance in the extensively regulated health equipment and system business. We are committed to compliance with regulatory product approval and quality system requirements in every market we serve, by addressing specific requirements of local and national regulatory authorities including the US FDA, the CFDA in China and comparable agencies in other countries, as well as the European Union’s Waste from Electrical and Electronic Equipment (WEEE), Restriction of Hazardous Substances (RoHS) and Registration, Evaluation, Authorization and Restriction of Chemicals (REACH) regulations.
The imaging businesses and image processing applications are governed by regulatory approvals in the markets that we serve. In almost all cases, new products that we introduce are subject to a regulatory approval process (e.g. 510k for FDA approvals in the USA). Failing to comply with the regulatory requirements can have severe consequences. The number and diversity of regulatory bodies in the various markets we operate in globally adds complexity and time to product introductions. Regulatory approval is a prerequisite for market introduction of medical devices.
Further progress was made in 2016 in strengthening the remediated quality management system at our facility in Cleveland, Ohio, with theramp-up of production and shipments continuing in 2017.
With regard to sourcing, please refer tosub-section 12.3.8, Supplier indicators, of this report.
3.2.2 2016 business highlights
In line with its strategy of building multi-year strategic partnerships, Philips signed multiple agreements in 2016, including a10-year EUR 74 million agreement with Russia’s Expert Group of Companies to provide solutions combining advanced imaging systems with clinical informatics to improve cardiac care. In China, leveraging its expertise in cardiology, Philips signed a5-year interventional cardiology solutions agreement with DeltaHealth for the new DeltaHealth Hospital Shanghai, which will specialize in cardiac care. The agreement comprises interventionalX-ray systems, ultrasound imaging, software and services.
Within Image-Guided Therapy, Philips Volcano delivered a strong performance with comparable sales growth1) and continued operational improvements. This was driven by growth across the smart catheter product portfolio, synergies with the Image-Guided Therapy Systems business and expansion in therapy solutions and new geographies.
At RSNA 2016, Philips launched new data-driven, intelligent solutions to improve operational efficiencies and enhance diagnostics and patient care. These include IIlumeo Adaptive Intelligence and IntelliSpace Portal 9.0 – advanced informatics and visual analysis solutions with machine-learning capabilities to support the physician.
Leveraging its innovation leadership in diagnostic imaging, Philips has installed the Philips IQon Spectral CT across the globe. The system is the world’s first and only spectral detector computed tomography modality that provides clinicians with a comprehensive view of the patient’s anatomy, with a single,low-dose examination. Market success is the result of the modality’s superb image quality and disease assessment, in particular for oncology.
Demonstrating its continued leadership in ultrasound imaging solutions, Philips received the ‘2016 Best in KLAS’ award in the Ultrasound category. KLAS, a leading global research firm, recognizes companies with the Best in KLAS award for outstanding innovation and contributions to improved patient outcomes based on the past 12 months’ performance ratings.
Philips introduced the first commercially availableMR-only simulation solution indicated for prostate cancer radiation oncology treatment planning in the United States. The solution is part of Philips’ IngeniaMR-RT platform, which supports radiation departments that want to rely on MRI as their primary imaging modality for prostate cancer treatment planning.
| 1) | Non-GAAP financial measure. For the definition and reconciliation to the most directly comparable GAAP measure, refer tochapter 4, Reconciliation ofnon-GAAP information, of this report. |
Annual Report 2016 55
Segment performance 3.2.3
3.2.3 2016 financial performance
Net operating capital decreased by EUR 330 millionincome is not allocated to segments as certain income and expense line items are monitored on a centralized basis.
| Diagnosis & Treatment | ||||||||||||
| Key data in millions of EUR unless otherwise stated | ||||||||||||
| 2014 - 2016 | ||||||||||||
|
| |||||||||||
| 2014 | 2015 | 2016 | ||||||||||
|
| |||||||||||
Sales | 5,284 | 6,484 | 6,686 | |||||||||
Sales growth | ||||||||||||
% increase (decrease), nominal | (7 | )% | 23 | % | 3 | % | ||||||
% increase (decrease), comparable1) | (5 | )% | 6 | % | 4 | % | ||||||
Income from operations (EBIT) | 349 | 322 | 546 | |||||||||
as a % of sales | 6.6 | % | 5.0 | % | 8.2 | % | ||||||
Adjusted income from operations1) | 374 | 377 | 594 | |||||||||
as a % of sales | 7.1 | % | 5.8 | % | 8.9 | % | ||||||
|
| |||||||||||
| 1) | Non-GAAP financial measure. For the definition and reconciliation to the most directly comparable GAAP measure, refer tochapter 4, Reconciliation ofnon-GAAP information, of this report |
In 2016, sales amounted to EUR 4.6 billion, primarily due6,686 million, 3% higher than in 2015 on a nominal basis. Excluding a 1% negative currency effect, comparable sales1)increased by 4%, driven by double-digit growth in Image Guided Therapy,low-single-digit growth in Diagnostic Imaging, while Ultrasound was in line with 2015. Green Revenues amounted to EUR 4,798 million, or 71% of total segment sales.
From a geographic perspective, comparable sales1) in growth geographies showed double-digit growth, reflecting double-digit growth in Latin America and India and high-single-digit growth in China. Mature geographies were in line with 2015, driven bylow-single-digit growth in Western Europe, partly offset by alow-single-digit decline in other mature geographies. North America was in line with 2015.
Income from operations(EBIT) amounted to EUR 546 million, or 8.2% of sales, and included EUR 48 million of amortization charges, mainly related to acquired intangible assets in Image-Guided Therapy.
Adjusted income from operations1) amounted to EUR 594 million, or 8.9% of sales, compared to EUR 377 million, or 5.8% of sales, in 2015. 2016 included restructuring and acquisition- related charges of EUR 37 million, compared to EUR 131 million in 2015. 2015 also included charges of EUR 7 million related to the devaluation of the Argentine peso. The improvement in margin was driven by Image-Guided Therapy and Diagnostic Imaging, as well as lower restructuring and acquisition-related charges.
Diagnosis & Treatment
Sales per geographic clusterin millions of EUR
2014 - 2016
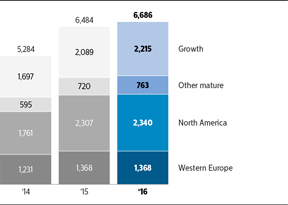
Diagnosis & Treatment
Income from operations (EBIT) and Adjusted income from operations1)in millions of EUR
2014 - 2016
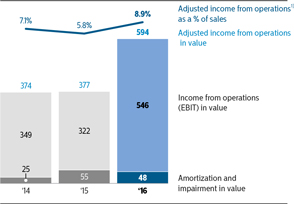
| 1) | Non-GAAP financial measure. For the definition and reconciliation to the most directly comparable GAAP measure, refer tochapter 4, Reconciliation ofnon-GAAP information, of this report |
2015 financial performance
In 2015, sales amounted to EUR 6,484 million, 23% higher than in 2014 on a nominal basis. Excluding an 11% positive currency effect and 6% consolidation impact, comparable sales1) increased by 6%. On a comparable basis1), Diagnostic Imaging achieved double-digit growth, Ultrasound postedmid-single-digit growth and Image-Guided Therapy sales were in line with 2014. Green Revenues amounted to EUR 4,670 million, or 72% of total segment sales.
From a geographical perspective, comparable sales1) in growth geographies showed double-digit growth driven by China, India and Asia Pacific. In mature geographies, comparable sales1) also showed alow-single-digit growth driven bymid-single-digit growth in Western Europe and other mature geographies, andlow-single-digit growth in North America.
Income from operations(EBIT) amounted to EUR 322 million, or 5.0% of sales, and included EUR 55 million of amortization charges, mainly related to acquired intangible assets in Image-Guided Therapy.
| 1) | Non-GAAP financial measure. For the definition and reconciliation to the most directly comparable GAAP measure, refer tochapter 4, Reconciliation ofnon-GAAP information, of this report. |
56 Annual Report 2016
Segment performance 3.2.4
Adjusted income from operations1) increased from EUR 374 million, or 7.1% of sales, in 2014 to EUR 377 million, or 5.8% of sales, in 2015. Restructuring and acquisition- related charges amounted to EUR 131 million in 2015, which included the Volcano acquisition, up from EUR 49 million in 2014. Adjusted income from operations1) in 2015 also included EUR 7 million of charges related to the devaluation of Argentine peso, while in 2014 also included charges of EUR 49 million of mainly inventory write-downs related to Cleveland and a EUR 13 million past-service pension cost gain. Theyear-on-year increase was largely driven by higher volumes, partly offset by an increase in provisionsQuality & Regulatory spend, higher planned expenditure for growth initiatives and higher restructuring and acquisition-related charges.
3.2.4 Healthy people, sustainable planet
A growing and aging population, the rise of chronic and lifestyle-related diseases and global resource constraints pose a number of challenges, including pollution and stressed healthcare systems. Philips continues to improve lives around the globe by developing diagnosis and treatment solutions that enable first-time-right diagnosis, precision interventions and therapy, while respecting the boundaries of natural resources.
In 2016, Green Revenues in Diagnosis & Treatment amounted to EUR 4,798 million thanks to a large portfolio of Philips Green Products and Solutions that support energy efficiency, materials reduction and other sustainability goals. We also actively collaborate with care providers around the globe to look for ways to minimize the environmental impact of healthcare, for example by reducing the energy use of medical equipment.
Supporting the transition to a circular economy, we have continued to expand the Diamond Select refurbishment program and also the SmartPath upgrading program for all modalities in the Diagnosis & Treatment portfolio.
Philips was presented with the ‘Champion for Change’ Award by Practice Greenhealth for the third year in a row. This award honors businesses that go beyond taking steps to improve their own green practices, but also help hospitals to expand their sustainable practices.
| 1) | Non-GAAP financial measure. For the definition and reconciliation to the most directly comparable GAAP measure, refer tochapter 4, Reconciliation ofnon-GAAP information, of this report. |
Annual Report 2016 57
Segment performance 3.3
3.3 Connected Care & Health Informatics businesses
The Chief Business Leader of the Connected Care & Health Informatics businesses segment, Jeroen Tas, has over 30 years of global experience as an entrepreneur and senior executive in the healthcare, information technology and financial services industries. Previously he was CEO of Philips Healthcare Informatics, Solutions & Services, overseeing digital health and clinical informatics, and Group Chief Information Officer (CIO), leading IT worldwide. In February 2017, Jeroen Tas was appointed as Chief Innovation & Strategy Officer and succeeded by Carla Kriwet who joined the Executive Committee as Chief Business Leader of Connected Care & Health Informatics. Carla Kriwet is also the BG Leader of Patient Care & Monitoring Solutions and previously was the Philips Market Leader of Germany, Austria & Switzerland.
3.3.1 About Connected Care & Health Informatics businesses
Spanning the entire health continuum, the Connected Care & Health Informatics businesses aim to empower consumers, care givers and clinicians with digital solutions that facilitate value-based care by enabling precision medicine and population health management, building on Philips’ strengths in consumer technology, patient monitoring and clinical informatics.
This requires a common digital framework that connects and aligns consumers, patients, payers and healthcare providers. A framework that aggregates and leverages information from clinical, personal and historic data, using analytics to support care providers in first-time-right diagnosis and treatment, and helps identify the risk and needs of different groups within a population.
To this end we have developed Philips HealthSuite – a cloud-based connected health ecosystem of devices, apps and digital tools. Applying analytics and algorithms, we can use data to deliver predictive, personalized insights, for example to help motivate healthy behavior through digital coaching, to support healthcare professionals in making clinical decisions, or to alert medical teams to potential problems, e.g. with elderly patients living independently at home.
In 2016, the Connected Care & Health Informatics segment consisted of the following areas of business:
Patient Care & Monitoring Solutions: Enterprise- wide patient monitoring solutions, from value solutions to sophisticated connected solutions, for real-time clinical information at the patient’s bedside; patient analytics, patient monitoring and clinical decision support systems including diagnostic ECG data management for improved quality of cardiac care; therapeutic care, including cardiac resuscitation, emergency care solutions, invasive andnon-invasive ventilators for acute andsub-acute hospital environments, and respiratory monitoring devices; consumables across the patient monitoring and therapeutic care businesses; and customer service, including clinical, IT, technical, and remote customer propositions.
Healthcare Informatics, Solutions & Servicescomprises advanced healthcare IT, clinical and advanced visualization and quantification informatics solutions for radiology, cardiology, oncology and neurology departments. It also offers Universal Data Management solutions, Picture Archiving and Communication Systems (PACS) and fully integrated Electronic Medical Record (EMR) systems to support healthcare enterprises in optimizing health system performance. The business group also includes a professional services business (Healthcare Transformation Services) spanning consulting, education, clinical and business performance improvement, program management and system integration services, as well as the Philips HealthSuite digital platform. This platform enables interoperability, data security, big data and predictive analytics, optimized workflows and care pathways, rapid application development, enhanced patient centricity and engagement for the solutions part of the Philips HealthSuite connected health ecosystem.
Population Health Management: Our services and solutions leverage our data, analytics and actionable workflow products, and include: personal health programs(app-based with medical grade measurement devices and coaching) to help people manage their health; technology-enabled monitoring and intervention (telehealth, remote patient monitoring, personal emergency response systems, and care coordination) to improve aging and chronic condition experiences; actionable programs to predict risk (including medication and care compliance, outreach, and fall prediction); and cloud-based solutions for health organizations to manage population health, driving quality improvement and business transformation for those transitioning to value-based care.
Connected Care & Health Informatics
Total sales by businessas a %
2016
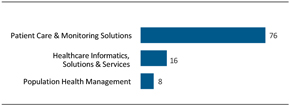
Sales at Philips’ Connected Care & Health Informatics businesses are generally higher in the second half of the year, largely due to the timing of new product availability and customer spending patterns.
58 Annual Report 2016
Segment performance 3.3.1
Sales channels are a mix of a direct sales force, especially in all the larger markets, combined with online sales portal and distributors – this varies by product, market and price segment. Sales are mostly driven by a direct sales force that has an intimate knowledge of the procedures for which our devices are used, and visits our customer base frequently.
Commitment to quality
The implementation of the Philips Business System is embedding a fundamental commitment to quality across all our processes, products, systems and services. This commitment is of vital importance in the extensively regulated health equipment and system business. We are committed to compliance with regulatory product approval and quality system requirements in every market we serve, by addressing specific requirements of local and national regulatory authorities including the US FDA, the CFDA in China and comparable agencies in other countries, as well as the European Union’s Waste from Electrical and Electronic Equipment (WEEE), Restriction of Hazardous Substances (RoHS) and Registration, Evaluation, Authorization and Restriction of Chemicals (REACH) regulations.
The connected care and health informatics applications are governed by regulatory approvals in the markets that we serve. In almost all cases, new products that we introduce are subject to a regulatory approval process (e.g. 510k for FDA approvals in USA, CE Mark in the European Union). Failing to comply with the regulatory requirements of the target markets can prevent shipment of products. The number and diversity of regulatory bodies in the various markets we operate in globally adds complexity and time to product introductions. Regulatory approval is a prerequisite for market introduction.
Philips’ products and related services are subject to restructuring, lower inventoriesvarious regulations and currency effects,standards. The Company is committed to quality and over the last years made investments to enable significant progress in this area. The Company is currently in advanced discussions on resolving a civil matter with the US Department of Justice representing the US Food and Drug Administration (FDA), arising from past inspections by the FDA in and prior to 2015. The discussions focus primarily on the Company’s compliance with the FDA’s Quality System Regulations in the Company’s Emergency Care and Resuscitation (ECR) business in the United States. While discussions have not yet concluded, the Company anticipates that the actions necessary to address the FDA’s compliance concerns will have a meaningful impact on the operations of its ECR business.
With regard to sourcing, please refer tosub-section 12.3.8, Supplier indicators, of this report.
3.3.2 2016 business highlights
Philips launched new data-driven, intelligent solutions to improve operational efficiencies and enhance diagnostics and patient care. These include PerformanceBridge, a new suite of operational performance improvement software and services for radiology departments, and Illumeo Adaptive Intelligence and IntelliSpace Portal 9.0, advanced informatics and visual analysis solutions with machine- learning capabilities to support the physician.
Philips acquired Wellcentive, a leadingUS-based provider of population health management software solutions. Wellcentive complements Philips’ portfolio with cloud-based IT solutions to import, aggregate and analyze clinical, claims and financial data across hospital and health systems, to help care providers deliver coordinated care.
In line with its strategy of delivering solutions consisting of smart devices, software and services to address specific customer needs, Philips signed a3-year patient monitoring solutions agreement with Rush University Medical Center, Chicago. The company also signed a multi-year agreement with the Medical University of South Carolina Health focused on integrated patient monitoring solutions.
Expanding its global leadership in patient monitoring solutions beyond acute care settings, Philips launched the latest version of its IntelliVue Guardian solution in Europe. This solution comprises smart devices including wearable biosensors, clinical decision support software and services. It is designed to aid clinicians in the early recognition of patient deterioration in the hospital’s general wards, allowing timely intervention and avoiding adverse events, unplanned transfers back to the ICU and longer lengths of hospitalization.
Building on its expertise in new care models based on telehealth technologies, Philips enabled Macquarie University’s MQ Health in Sydney, Australia, and Emory Healthcare in Atlanta, US, to provide continuous nighttime critical care oversight to ICU patients back in Atlanta during daytime hours in Australia.
Annual Report 2016 59
Segment performance 3.3.3
3.3.3 2016 financial performance
Net income is not allocated to segments as certain income and expense line items are monitored on a centralized basis.
| Connected Care & Health Informatics | ||||||||||||
| Key data in millions of EUR unless otherwise stated | ||||||||||||
| 2014 - 2016 | ||||||||||||
|
| |||||||||||
| 2014 | 2015 | 2016 | ||||||||||
|
| |||||||||||
Sales | 2,684 | 3,022 | 3,158 | |||||||||
Sales growth | ||||||||||||
% increase (decrease), nominal | (2 | )% | 13 | % | 5 | % | ||||||
% increase (decrease), comparable1) | 0 | % | 0 | % | 4 | % | ||||||
Income from operations (EBIT) | (157 | ) | 173 | 275 | ||||||||
as a % of sales | (5.9 | )% | 5.7 | % | 8.7 | % | ||||||
Adjusted income from operations1) | (106 | ) | 227 | 322 | ||||||||
as a % of sales | (3.9 | )% | 7.5 | % | 10.2 | % | ||||||
|
| |||||||||||
| 1) | Non-GAAP financial measure. For the definition and reconciliation to the most directly comparable GAAP measure, refer tochapter 4, Reconciliation ofnon-GAAP information, of this report |
In 2016, sales amounted to EUR 3,158 million, 5% higher than in 2015 on a nominal basis. The 4% increase on a comparable basis1)was driven bymid-single-digit growth in Patient Care & Monitoring Solutions,low-single-digit growth in Healthcare Informatics, Solutions & Services, partly offset by the consolidationalow-single-digit decline in Population Health Management. Green Revenues amounted to EUR 1,442 million, or 45% of Indal.segment sales.
Cash flows before financing activities increasedFrom a geographic perspective, comparable sales1) in growth geographies showed high-single-digit growth, and mature geographies recordedlow-single-digit growth.
Income from operations(EBIT) amounted to EUR 208275 million, or 8.7% of sales, and included EUR 47 million of amortization charges, mainly related to acquired intangible assets at Population Health Management and Patient Care & Monitoring Solutions.
Adjusted income from operations1) amounted to EUR 322 million, or 10.2% of sales, compared to EUR 227 million, or 7.5% of sales, in 2015. Adjusted income from operations1) in 2016 included restructuring and acquisition-related charges of EUR 14 million compared to EUR 38 million in 20112015. 2016 Adjusted income from operations1) also included a net release of provisions of EUR 12 million, while in 2015 included charges of EUR 28 million related to the currency revaluation of the Masimo provision and charges of EUR 1 million related to the devaluation of the Argentine peso. The margin increase was mainly driven by higher volumes and lower restructuring and acquisition-related charges and other items, partly offset by higher expenditure on innovation.
Connected Care & Health Informatics
Sales per geographic clusterin millions of EUR
2014 - 2016
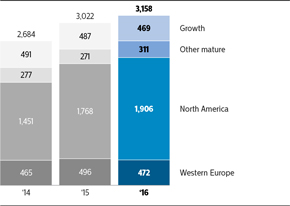
Connected Care & Health Informatics
Income from operations (EBIT) and Adjusted income from operations1)in millions of EUR
2014 - 2016
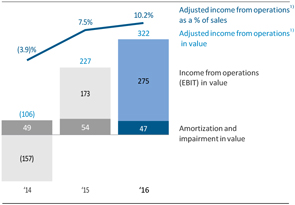
| 1) | Non-GAAP financial measure. For the definition and reconciliation to the most directly comparable GAAP measure, refer tochapter 4, Reconciliation ofnon-GAAP information, of this report |
2015 financial performance
In 2015, sales amounted to EUR 2793,022 million, 13% higher than in 2014 on a nominal basis. Excluding a 12% positive currency effect, comparable sales1) were in line with 2014. On a comparable basis1), Healthcare Informatics, Solutions & Services recordedlow-single-digit growth, Patient Care & Monitoring Solutions sales were in line with 2014 and Population Health Management posted alow-single-digit decline. Green Revenues amounted to EUR 1,258 million, or 42% of segment sales.
From a geographic perspective, comparable sales1) in growth geographies showed a high-single-digit decline mainly driven by China and Latin America. In mature geographies, comparable sales1) showedlow-single-digit growth driven bymid-single-digit growth in Western Europe andlow-single-digit growth in North America, partly offset by amid-single-digit decline in other mature geographies.
Income from operations(EBIT) amounted to EUR 173 million, or 5.7% of sales, and included EUR 54 million of charges related to intangible assets.
| 1) | Non-GAAP financial measure. For the definition and reconciliation to the most directly comparable GAAP measure, refer tochapter 4, Reconciliation ofnon-GAAP information, of this report. |
60 Annual Report 2016
Segment performance 3.3.4
Adjusted income from operations1) increased to a gain of EUR 227 million, or 7.5% of sales compared to a loss of EUR 106 million in 2014. Restructuring and acquisition-related charges amounted to EUR 38 million in 2015, compared to EUR 30 million in 2014. 2015 Adjusted income from operations1) included charges of EUR 28 million related to the currency revaluation of the provision for the Masimo litigation and charges of EUR 1 million related to the devaluation of Argentine peso. Adjusted income from operations1) in 2014 included charges of EUR 366 million related to the provision for the Masimo litigation and a EUR 3 million past service pension cost gain. Theyear-on-year increase was mainly due to lower working capital outflows,charges related to the provision for the Masimo litigation, partly offset by an increase in Quality & Regulatory spend and higher outflowsplanned expenditure for acquisitions.growth initiatives.
5.3.5 Delivering on EcoVision sustainability commitments3.3.4 Healthy people, sustainable planet
A growing and aging population, the rise of chronic and lifestyle-related diseases and global resource constraints pose a number of challenges, including pollution and stressed healthcare systems. Philips is committed to addressing these challenges with connected health IT solutions that integrate, collect, combine and deliver quality data for actionable insights to help improve access to quality care, while respecting the boundaries of natural resources.
It is our belief that well-designed solutions can reduce thetravel-related carbon footprint of healthcare, and improve access and outcomes.
In 2013, Philips Lighting invested EUR 327 million in2016, Green Innovation, comparedRevenues increased to EUR 3251,442 million in 2012. Investmentsand we continued to expand the portfolio of Philips Green Products that support energy efficiency, materials reduction and other sustainability goals.
Supporting the transition to a circular economy, we continue to be madeexpand innovative ‘access over ownership’ service solutions where our customers pay for things where and when required, while Philips can secure high levels of recycling and materialsre-use.
Philips was presented with the ‘Champion for Change’ Award by Practice Greenhealth for the third year in energy-saving technologies such as LED, OLED and lighting controls and in the reduction of regulated substances in our product portfolio. In April, Philips announceda row. This award honors businesses that it had created the first LED lamp prototype delivering 200 lumens per watt of high-quality light, halving energy use comparedgo beyond taking steps to current LED lamps. The energy efficiency of our total product portfolio improved from 37.9improve their own green practices, but also help hospitals to 38.5 lumens per watt in 2013. Within the Green Operations 2015 program, we are on track to meet our commitments to reduce Lighting’s environmental footprint. By using energy from renewable sources and implementing energy-saving programs in our major operational sites, we have reduced our carbon footprint from energy by approximately 15% since the baseline year of 2009. In 2013, 83% of our total waste was re-used as a result of recycling.expand their sustainable practices.
5.3.6 Delivering innovation that matters to you
| 1) | Non-GAAP financial measure. For the definition and reconciliation to the most directly comparable GAAP measure, refer tochapter 4, Reconciliation ofnon-GAAP information, of this report. |
Annual Report 2013 1092016 61

Meet a London couple who use Philips Hue lighting to create a happy and inspiring environment for their daughter, Elena.
“Being a parent is not easy, I think anyone can understand that. And I think it’s about trying to find the small things that just help you through the day a bit better.”


“We also find during play especially, it’s a great way to interact with her. Painting itself is great fun, but when you can kind of paint the colors with the light bulb, that’s even better. Or dancing is great fun, but when you can dance and the lights change, it just brings a whole new element to the experience. It makes for a much more engaging and fun day for us and for her.”
110 Annual Report 2013
5 SectorSegment performance 5.4 - 5.4.13.4
5.4 Innovation, Group & Services3.4 HealthTech Other

“In 2013, we continued to better align3.4.1 About HealthTech Other
Innovation
At Philips, our innovation strategiesefforts are aligned with our business strategies. We are making real progress improving our ability to innovate end-to-end, all the way from gaining a deep understanding of local customer needs to actual impact in the marketplace. Our innovation process is becoming more effective, efficient and faster, allowing us to better deliver solutions that really matter to people.”Jim Andrew, Chiefstrategy. The Innovation & Strategy Officer
Introduction
Innovation, Group & Services comprises the activities of Group Innovation, Group headquarters, including country and regional management, and certain costs of pension and other post-retirement benefit plans. Additionally, the global shared business services for procurement, finance, human resources, IT and real estate are reported in this sector.
5.4.1 About Innovation, Group & Services
Philips Group Innovation
Philips Group Innovation (PGI)function feeds the innovation pipeline, enabling its business partners – the Philips operating businesses – to create new business options through new technologies, new business creation, and intellectual property management and development. Focused research and development improvement activities drivetime-to-market efficiency and increased innovation effectiveness.
Annual Report 2013 111
5 Sector performance 5.4.1 - 5.4.1
effectiveness.Innovation & Strategy facilitates innovation from idea to product asco-creator and strategic partner for the Philips businesses and complementary partners. It does so through cooperation between research, design, marketing, strategy and businesses in interdisciplinary teams along the innovation chain, fromfront-end tofirst-of-a-kind product development. In addition, PGIit opens up new value spaces beyond the direct scope of current business scope or focusbusinesses (Emerging Business Areas)Businesses), manages the Emerging-Business-Areas-relatedCompany-funded R&D portfolio, and creates synergysynergies for cross-sectorcross-segment initiatives.
PGI encompasses PhilipsInnovation & Strategy includes, among others, the Chief Technology Office and Research, Philipsthe Chief Medical Office, Innovation Services, the Philips Innovation Campus inIntellectual Property & Standards, Design, Strategy, and Sustainability. Key locations include Eindhoven (Netherlands), Cambridge (USA), Bangalore the Philips Innovation Center(India) and Shanghai Philips Design, the Philips Healthcare Incubator as well as Emerging Business Areas.(China). In total, PGIInnovation & Strategy employs some 4,9005,000 professionals around the globe.
PGIInnovation & Strategy actively participates in ‘Open Innovation’Open Innovation through relationships with academic, clinical, and industrial partners, as well as via European and regional projects,public- private partnerships. It does so in order to improve innovation effectiveness and efficiency, capture and effectiveness, generate new ideas, enhance technology partnering capabilities, and share the related financial exposure.
Research
Research focuses on exploration of new technologies and business ideas, deliveringproofs-of-concept and offering consultancy in technology development projects, particularly forfirst-of-a-kind products and services. It aims to improve people’s lives through technology-enabled meaningful innovations – as co- creator and strategic partner of the Philips businesses, markets and Open Innovation ecosystem participants.
Research investigates trends and creates concepts for solutions within strategic Philips domains linked to societal challenges, such as the increase in cardiovascular diseases and cancer, ageing societies, limited access to healthcare and increasing obesity.
The Eindhoven lab is the core lab of Philips Research. It was awarded the Open Innovation 2.0 award from the European Union in 2016 in recognition of its role in creating the High Tech Campus in Eindhoven (Netherlands), the Philips Innovation Campus in Bangalore (India), and the Philips Innovation Center in Shanghai (China) are prime examples of environments enabling Open Innovation.
Through Open Innovation, Philips also seeks to ensure proximity of innovation activities to growth geographies. For example, in 2013, Philips and Dubai Economic Council signed a memorandum of understanding to develop a series of strategic initiatives to encourage the adoption of Open Innovation strategies between businesses and government in the United Arab Emirates.
A joint initiative between PGI, IT and multiple Philips businesses aims at speeding up digital innovation to create personalized solutions that matter to people. One of the results in 2013 was that Philips, together with Accenture, simulated the first proof-of-concept for the seamless transfer of patient vital signs into Google Glass. At the IFA in Berlin, Philips also demonstrated apps that add smart personalized functionalities to consumer products, such as a facial hair style app, an air purification app, and a coffee experience app.vibrant innovation ecosystem.
Philips Research
In the fall of 2015, Philips Research is the main partner of Philips’ operating businesses for technology-enabled innovation. It createsopened a new technologies and the related intellectual property (IP)Innovation Lab in Cambridge, MA (USA), which enables Philipsis now fully up and running. It is home to grow in businesses and markets. Together with the businesses and the markets,approximately 100 Philips Research co-creates innovationsNorth America employees and another 150 Philips employees from other innovation functions and ventures. Being within close proximity to strengthen the core businessesMIT campus and clinical collaboration partners allows researchers to collaborate easily with MIT faculties and PhD students on jointly defined research programs, as well as to participate in Open Innovation projects.
Philips Research China broadened its scope in 2016 by adding a Digital Innovation team focused on the creation of local digital propositions.
With the aim of extending our capabilities in research for IT healthcare applications, in 2016 we announced our intention to open upan R&D site at the Skolkovo Innovation Centre in Moscow, Russia. The new opportunitiesCenter will focus on machine learning, artificial intelligence, and computer and data science.
The Philips Africa Innovation Hub in adjacent business areas. Research’sNairobi, Kenya, creates locally relevant innovations ‘in Africa, for Africa’, with particular focus on improving access to affordable healthcare. The Africa Innovation Hub is a collaboration between Philips Research and the Africa market organization. Based on work from this hub, in 2016 Philips and Grand Challenges Canada signed a repayable grant agreement to scale the manufacturing and distribution of the Philips Children’s Respiration Monitor (also known as ChARM) to make it affordable and accessible for community-based health workers inlow-resource settings throughout the world.
Coming under the Chief Technology Office for reporting purposes, Philips Photonics is a global leader in VCSEL technology. VCSELs are infrared lasers for a rapidly growing range of consumer and professional applications like gesture control, environmental sensing, precise scene illumination for surveillance cameras, and ultra-fast data communication. Following a significant rise in demand for VCSELs, Philips Photonics announced in 2016 that it would double manufacturing capacity at its laser-diode facility in Ulm, Germany.
Chief Medical Office
The Chief Medical Office is responsible for clinical innovation pipeline is aligned with our vision and strategy, health economics and inspired by unmet customer needs as well as major societal challenges.market access, and medical thought leadership. This includes engaging with stakeholders across the care continuum to build Philips’ leadership in health technology and acting with agility on new value-based reimbursement models that benefit the patient and care provider.
In 2013,
62 Annual Report 2016
Segment performance 3.4.1
Leveraging the knowledge and expertise of the medical professional community across Philips, Research createdthe Chief Medical Office includes many healthcare professionals who practice in the world’s most energy-efficient warm-white LED lamp. The new TLED prototype, designed to replace fluorescent tube lighting, delivers 200 lumens per watt of high-quality light, halving energy use compared to current LED lamps.
Inleading health systems. Supporting the area of Healthcare, Philips Research co-created innovative imaging solutionscompany’s objectives across the health continuum, its activities include strategic guidance, leveraging clinical and scientific knowledge, fosteringpeer-to-peer relationships in relevant medical communities, liaising with improved ultrasound, MRImedical regulatory bodies, and X-ray results. In the case of X-ray, the Philips AlluraClarity system provides industry-leading visibility for live image guidance at low X-ray dose levels.
The new EPIQ premium ultrasound platform received outstanding feedback from key opinion leaders about the exceptional image quality delivered by multiline beam forming (nSight Imaging)supporting clinical and Anatomical Intelligence.marketing evidence development.
Philips Innovation Services
Philips Innovation Services offers a wide range of advanced innovationexpert services expertisein development, realization and high-tech facilities across the entire innovation activity chain. Services extend from concept creation, product development, prototyping and small series production, industrialization, quality and reliability, to sustainability and industrial consulting. Innovation Services’Its skills are leveraged by the Philips businesses, markets and Philips Group Innovation across& Strategy in all regions, on a wide range of innovation projects.
Examples of recent innovations supported by Innovation Services include the Hue personal wireless lighting, intelligent catheters such as the EchoNavigator live image-guidance tool, OLED lighting, Green Hospital energy-saving services for medical institutions, and the Smart Air Purifier.
Innovation Services also supports Philips’ drive to deliver innovations that are locally relevant. This year the organization opened a new Service Center at the Philips innovation site in Shanghai. Staffed by experts in electronics design, electromagnetic compatibility, reliability and mechatronics, the Service Center provides locally relevant services meeting Philips’ innovation needs in China.
112 Annual Report 2013
5 Sector performance 5.4.1 - 5.4.1
regions.
Philips Innovation Campus Bangalore
Philips Innovation Campus Bangalore (PIC) hosts activities from most of our operating businesses, Philips Research, Design, IP&S and IT. Healthcare isR&D activities at the largest R&D organization at PIC with activities ininclude Diagnostic Imaging, Systems and Patient Care & Clinical Informatics. While Monitoring Solutions, Sleep & Respiratory Care, Personal Health, and Healthcare Informatics, Solutions & Services.
PIC originally started asplays a key role in Philips’ digital transformation journey. Originally a software center, it has since developed intotoday PIC is a broad product development center (includingincluding mechanical, electronics, and supply chain capabilities). Several Healthcarecapabilities. PIC works with growth geographies to build market- specific solutions, and several businesses have also located business organizations focusing on growth geographies at PIC.
Philips Innovation Center Shanghai
Philips Research China is Philips’ second-largest research lab globally. The organization currently has over 170 staff, working in the Healthcare, Consumer Lifestyle and Lighting programs, and cooperates extensively with Philips labs across the world. Research China anchors our broader commitment to our Shanghai R&D campus as an innovation hub.
Philips Design
Philips Design is the global design function for the company, ensuring that innovations are meaningful, people-focused and locally relevant. Design is also responsible for ensuring that the Philips brand experience is differentiating, consistently expressed, and drives customer preference.
Philips Design partners with the Philips businesses, Group Innovation & Strategy, markets and functions, to ensurechampioning a multidisciplinaryco-create approach that our innovations are people-focused, meaningful and locally relevant, and that the Philips brand experience is differentiating, consistent and drives customer preference across all its touch-points.
Philips Design is a global function within the company, comprised of a Group Design team that leads the function and develops new competencies, and fully integrated sector Designbrings teams ensuring close alignment with the Philips businesses. The organization is made up of designers across various disciplines, as well as psychologists, ergonomists, sociologists and anthropologists – all working together to understand people’s needsthe different factors that influence how a new product or solution will appear, perform and desiresbehave.
Increasingly we leverage our design capabilities and processes to translate these into relevantwork directly with our customers and our customer-facing teams. Innovating directly with our customers enables Philips Design to deliver people- focused solutions that optimize the user and patient experience and the overall performance of their healthcare systems across the health continuum.
Emerging Businesses
Emerging Businesses is a group dedicated to identifying, developing and bringing to market breakthrough products and services that will help shape the future of healthcare. The group focuses on innovating at the intersection between supportive technologies and current care models that drive improved outcomes, higher patient satisfaction/ engagement and reductions in overall cost of care.
One of the businesses is Digital Pathology Solutions, which empowers pathologists with a complete connected digital pathology solution that is designed to optimize productivity and workflow, and ultimately improve the quality of diagnosis. In June 2016, Philips acquired Northern Ireland-based PathXL, an innovator in digital pathology image analysis, workflow software and educational tools, to further expand its Digital Pathology Solutions offering and leadership in Computational Pathology.
Another business is Handheld Diagnostics, with its Minicare proposition launched in May 2016, which provides directpoint-of-care diagnostic information at the patient’s bedside, enabling physicians to make medical decisions on the spot. Based on innovative technologies, we have designedeasy-to-use, patient- centric IVD(in-vitro diagnostics)-enabled solutions and experiencesconnected services that create valuehave the potential to revolutionize health management and improve existing workflows.
A third business is Light & Health, a pioneer in photo dermatology. Leveraging its advanced understanding of the biological effects of light, the team of Philips Light & Health researchers, collaborating with leading research institutions and hospitals, has developed a number of products, for peopleinstance Philips BlueControl for treating patients with psoriasis, which feature LED light and business. Design’s forward-looking exploration projects deliver vital insights for new business development.offer proven medical benefits.
In the area of emergency care, for example, the DesignFinally, a fourth team has been instrumental in developing a new user interaction concept for the next generation of automatic external defibrillation (AED). BasedEmerging Businesses is working on newcomputational neurology, neuro-mapping and deeper insights from onsite research into stakeholder requirements, protocols, routines and behavior in emergency settings in firehouses and police stations, it improves the ease of use for first responders, resulting in faster deployment. The Philips HeartStart FR3 AED won a red dot design award in 2013.
Philips Design is widely recognized as a world leader in people-centric design. In 2013, it won over 100 key design awards, including an unprecedented 39 iF design awards in the areas of product, communication and innovation design, 22 red dot design awards, eight Successful Design Awards China, seven Dutch Good Industrial Design Recognition prizes, and four Australian International Design Awards.neuro-monitoring.
Philips Healthcare IncubatorIP Royalties
The Philips Healthcare Incubator is a corporate organization within Philips Group Innovation dedicated to new business creation. Its mission is to identify novel business opportunities addressing unmet needs of patients, payors and care providers through ground-breaking innovation, and to transform these into successful businesses. The ultimate goal is to create new, sizeable business categories for Philips in health care.
Philips Intellectual Property & Standards
Philips IP&S proactively pursues the creation of new intellectual propertyIntellectual Property (IP) in closeco-operation with Philips’ operating businesses and Philips Group Innovation.Innovation & Strategy. IP&S is a leading industrial IP organization providing world-class IP solutions to Philips’ businesses to support their growth, competitiveness and profitability.
Royal Philips’ total IP portfolio currently consists of approximately 13,20079,000 patent families, 2,680 trademark families, 3,930rights, 49,000 trademarks, 86,000 design families,rights and 2,1504,400 domain name families.names. Philips filed approximately 1,550 patent applications1,690 patents in 2013,2016, with a strong focus on the growth areas in health and well-being.
IP&S participates in the setting of standards to create new business opportunities for the Healthcare, Consumer Lifestyle and Lighting sectors.Philips operating businesses. A substantial portion of revenue and costs is allocated to the operating sectors.businesses. Philips
Annual Report 2016 63
Segment performance 3.4.1
believes its business as a whole is not materially dependent on any particular patent or license, or any particular group of patents and licenses.
Group and Regional CostsCentral costs
Group and Regional organizations supportThe central cost organization supports the creation of value, connecting Philips with key stakeholders, especially our employees, customers, governmentgovernments and society. These organizations includeIt includes the Executive Committee, Brand Management, Sustainability, New Venture Integration, the Group functions related to strategy, human resources, legal and finance, as well as country and regional management.
Annual Report 2013 113
5 Sector performance 5.4.1 - 5.4.2
It also includes functional services to businesses in areas such as IT, Real Estate and Accounting, thereby helping to drive global cost efficiencies.
Accelerate! Investments3.4.2 2016 business highlights
Innovation, Group & Services playsStrengthening its Digital Pathology business, Philips acquired PathXL, an important roleinnovator in digital pathology image analysis, workflow software and educational tools. Philips also signed a licensing agreement with Visiopharm to offer their breast cancer panel software algorithms with Philips’ IntelliSite digital pathology solution to support pathologists in providing an objective diagnosis of breast cancer.
In the 2016 Interbrand annual ranking of the world’s most valuable brands, Philips’ ranking improved to #41 from #47, with a total estimated brand value of approximately USD 11.3 billion.
Philips rose to first place in the Accelerate!European Patent Office’s 2015 ranking of patent applicants for patents filed at the EPO. In addition, the company ranked first in three of the ten leading fields of technology: Medical Technology; Electrical machinery, apparatus, energy; and Measurement.
Building on its commitment to sustainability, Philips launched its new5-year ‘Healthy people, sustainable planet’ program notably by helping to improve the end-to-end value chain. The End-to-End approach consistslives of three core processes: Idea-to-Market, Market-to-Order,2.5 billion people per year, increase its Green Revenues to 70% of sales, generate 15% of its sales from Circular Revenues and Order-to-Cash. Innovation, Group & Services supports a more efficient and effective Idea-to-Market processbecome carbon-neutral in five focal areas: speeding up time-to-market, portfolio optimization, driving breakthrough innovation, improving innovation competencies, and strengthening the position of Philips as an innovation leader. Based on deeper customer insights, and enhanced capability and competency building, we are driving value more effectively.its operations by 2020.
5.4.2 2013Philips became the Industry Group Leader in the Capital Goods category in the 2016 Dow Jones Sustainability Index, achieving the highest possible scores in three sections, including climate strategy and operationaleco-efficiency.
Philips Design received 158 design awards, including becoming the #1 ranked company in the prestigious international iF ranking for design.
3.4.3 2016 financial performance
Net income is not allocated to segments as certain income and expense line items are monitored on a centralized basis.
| Key data | ||||||||||||
in millions of euros unless otherwise stated | ||||||||||||
| 2011 | 2012 | 2013 | ||||||||||
Sales | 731 | 713 | 736 | |||||||||
Sales growth | ||||||||||||
% increase (decrease), nominal | (23 | ) | (2 | ) | 3 | |||||||
% increase (decrease), comparable1) | (13 | ) | — | (2 | ) | |||||||
Adjusted IFO of: | ||||||||||||
Group Innovation | (78 | ) | (149 | ) | (134 | ) | ||||||
IP Royalties | 262 | 253 | 312 | |||||||||
Group and Regional costs | (140 | ) | (161 | ) | (175 | ) | ||||||
Accelerate! investment | (28 | ) | (128 | ) | (137 | ) | ||||||
Pensions | 22 | 24 | (41 | ) | ||||||||
Service Units and other | (235 | ) | (543 | ) | (64 | ) | ||||||
|
| |||||||||||
Adjusted IFO1) | (197 | ) | (704 | ) | (239 | ) | ||||||
IFO | (207 | ) | (712 | ) | (242 | ) | ||||||
Net operating capital (NOC)1) | (3,875 | ) | (4,500 | ) | (2,922 | ) | ||||||
Cash flows before financing activities1) | (1,159 | ) | (842 | ) | (2,101 | ) | ||||||
Employees (FTEs) | 13,001 | 11,856 | 12,937 | |||||||||
| HealthTech Other | ||||||||||||
| Key data in millions of EUR unless otherwise stated | ||||||||||||
| 2014 - 2016 | ||||||||||||
|
| |||||||||||
| 2014 | 2015 | 2016 | ||||||||||
|
| |||||||||||
Sales | 487 | 503 | 478 | |||||||||
Income from operations (EBIT) | 37 | 49 | (129 | ) | ||||||||
Adjusted income from operations of:1) | ||||||||||||
IP Royalties | 299 | 284 | 286 | |||||||||
Emerging businesses | (38 | ) | (63 | ) | (98 | ) | ||||||
Innovation | (92 | ) | (118 | ) | (127 | ) | ||||||
Central costs | (105 | ) | (31 | ) | (173 | ) | ||||||
Other | (13 | ) | (8 | ) | (8 | ) | ||||||
Adjusted income from operations1) | 51 | 64 | (120 | ) | ||||||||
|
| |||||||||||
| 1) | Non-GAAP financial measure. For the definition and reconciliation to the most directly comparable GAAP measure, refer tochapter 4, Reconciliation ofnon-GAAP information, of this report |
In 2016, sales amounted to EUR 478 million and reflected EUR 38 million lower royalty income due to the foreseen expiration of licenses, partly offset by new patent license agreements and strong double-digit growth in Emerging Businesses.
In 2016, income from operations (EBIT) totaled to EUR (129) million compared to EUR 49 million in 2015. Adjusted income from operations1) amounted to a net cost of EUR 120 million, compared to net gain of EUR 64 million in 2014. Adjusted income from operations1) in 2016 included restructuring and acquisition-related charges of EUR 28 million and a EUR 26 million impairment of real estate assets. Adjusted income from operations1) in 2015 included a net restructuring release of EUR 19 million and a EUR 37 million gain related to the sale of real estate assets. Theyear-on-year decrease was mainly attributable to higher restructuring and acquisition-related charges and other items, investments in Emerging Businesses, brand campaigns and cyber security.
2015 financial performance
In 2015, sales amounted to EUR 503 million, and were mainly related to IP Royalties income and Emerging Businesses. Sales were EUR 16 million higher than in 2014, mainly due to strong comparable sales growth1) at Emerging Businesses and Photonics.
Adjusted income from operations1) increased from EUR 51 million in 2014 to EUR 64 million in 2015. Adjusted income from operations1) in 2015 included EUR 19 million net release of restructuring charges, compared to EUR 58 million restructuring charges in 2014. Adjusted income from operations1) in 2015 also included a EUR 37 million gain related to the sale of real estate assets. Adjusted income from operations1) in 2014 also included EUR 18 million past-service pension cost gain.
| 1) | Non-GAAP financial measure. For the definition and reconciliation to the most directly comparable GAAP measure, refer tochapter 4, Reconciliation ofnon-GAAP information, of this report. |
64 Annual Report 2016
Segment performance 3.4.3
The Adjusted income from operations1) decline was mainly attributable to investments in Innovation and Emerging Businesses and lower royalty income.
Annual Report 2016 65
Segment performance 3.5
Philips Lighting is led by Eric Rondolat, who has held the position of Chief Executive Officer since the company was listed on the Euronext Amsterdam stock exchange (ticker symbol: LIGHT) on May 27, 2016. Prior to that, he was Chief Executive Officer of Lighting at Royal Philips from April 2012 to May 27, 2016.
Following the listing of Philips Lighting, Philips retained a 71.225% stake and continued to consolidate Philips Lighting through 2016, with the aim of fully selling down over the next several years. On February 8, 2017, Philips announced that it had successfully completed an accelerated bookbuild offering to institutional investors and to Philips Lighting of 26.0 million shares in Philips Lighting, reducing Philips’ stake in Philips Lighting’s issued and outstanding share capital from 71.225% to approximately 55.180%. The transaction is in line with Philips’ stated objective to fully sell down its stake in Philips Lighting over the next several years.
3.5.1 Lighting landscape
A number of trends and transitions are affecting the lighting industry and changing the way people use and experience light.
Philips Lighting serves a large and attractive market that is driven by the need for more light, the need for energy-efficient lighting, and the need for digital and connected lighting.
The world’s population is forecast to grow from 7 billion today to over 10 billion by 2050. At the same time, we are witnessing rapid urbanization, with about two-thirds of the world’s population expected to live in urban areas by 2050. These trends will increase demand for light. In addition, in the face of resource constraints and climate change, the world needs that light to be energy-efficient. At the same time, the lighting industry is moving from conventional to LED lighting, which is changing the way people use, experience and interact with light. Digital technologies enable connectivity and seamless integration in software architectures, systems and services.
Connected lighting allows light points to be used as information pathways, opening up new functionalities and services based on the transmission and analysis of data.
3.5.2 About Lighting
Philips Lighting is a global market leader with recognized expertise in the development, manufacture and application of innovative, energy-efficient lighting products, systems and services that improve people’s lives. It has pioneered many of the key breakthroughs in lighting over the past 125 years, laying the basis for its current strength and leading position in the digital transformation to connected lighting.
Philips Lighting has a firm strategy which is based upon six priorities:
Optimize cash from conventional products to fund our growth
Innovate in LED products commercially and technologically to outgrow the market
Lead the shift to systems, building the largest connected installed base
Capture adjacent value through new services business models
Be our customers’ best business partner locally, leveraging our global scale
Accelerate! on our operational excellence improvement journey
The work Philips Lighting did in 2016 saw it extend its lighting leadership into the Internet of Things and allowed it to unlock new experiences and value for customers. It announced many connected lighting innovations, and new customers and partnerships, for street lighting, retail, offices and homes.
The company aims to further invest to support its leadership in LED and connected lighting systems and services while at the same time capitalizing on its broad portfolio, distribution and brand in conventional lighting by successful implementation of its ‘last man standing’ strategy.
Philips Lighting addresses people’s lighting needs across a full range of market segments. Indoors, it offers lighting products, systems and services for homes, shops, offices, schools, hotels, factories and hospitals. Outdoors, it offers products, systems and services for roads, streets, public spaces, residential areas and sports arenas, as well as solar-powered LEDoff-grid lighting. In addition, it addresses the desire for light- inspired experiences through architectural projects. Finally, it offers specific applications of lighting in specialized areas, such as entertainment, horticulture, and water purification.
In 2016, Philips Lighting spanned a full-service lighting value chain – from lamps, luminaires, electronics and controls to connected and application-specific systems and services – through the business groups Lamps, LED, Professional and Home.
Lighting
Total sales by businessas a %
2016
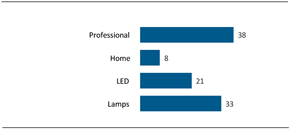
66 Annual Report 2016
Segment performance 3.5.2
Philips Lighting is one of the few companies in the world to offer solutions across the lighting value chain – including software, controls, luminaires, light sources, and modules. It will build on its global reach with current commercial activities that cover approximately 180 countries. Philips Lighting has operational manufacturing plants in 22 countries in all major regions of the world, and more than 70 sales offices worldwide.
Commitment to quality
The implementation of the Philips Business System is embedding a fundamental commitment to quality across all Philips Lighting’s processes, products, systems and services. Lighting is subject to significant regulatory requirements in the markets where it operates. These include the European Union’s Waste from Electrical and Electronic Equipment (WEEE), Restriction of Hazardous Substances (RoHS), Registration, Evaluation, Authorization and Restriction of Chemicals (REACH), Energy-related Products (ErP) and Energy Performance of Buildings (EPBD) directives.
3.5.3 2016 business highlights
Philips Lighting is actively building partnerships for its connected lighting systems for both professional and consumer markets. The company announced a partnership with US company Aisle411 for digital mapping of retail stores. It also teamed up with Amazon Alexa, Google Home and with Huawei’s OceanConnect for the interoperability of the Philips Hue connected lighting system, making this the first connected lighting system that can be used with all leading smart home platforms.
Philips Lighting’s partnership with Cisco resulted in Power-over-Ethernet connected lighting systems for the headquarters of Smartworld in Dubai, Intel’s new research campus in Bangalore and Infinorsa’s Torre Europa building in Madrid.
In the retail segment Philips Lighting implemented its first connected lighting indoor positioning system in the Middle East with United Arab Emirates-based retailer aswaaq, one of the world’s most innovative supermarkets and community malls. The new system uses lights that act as a positioning system and allows customers to use smartphones to access location-based services.
Philips Lighting also extended the number of connected street lighting contracts, supplying nearly 90,000 connected street luminaires in Jakarta as one of its biggest projects to date. The system will be managed by the Philips CityTouch street lighting management system, which has been installed in more than 700 projects across 35 countries since its inception in 2012.
The range of LED lighting was extended with Philips SceneSwitch, which combines multiple light settings in one lamp, enabling users to select the right light for their needs using an existing wall switch. It also introduced a range of spots and decorative bulbs that use WarmGlow for dimming, meaning the more you dim, the warmer the light effect. With Dubai Municipality the company developed the Dubai lamp, the world’s most energy-efficient commercially available lamp. This family of six lamps and two spots covers 80% of the light sockets in the city.
The company broadened the appeal of its Philips Hue connected lighting system for the home by adding an innovative motion sensor, which allows users to switch their Philips Hue lights on and off simply by walking in or leaving a room.
The Philips Hue range was also extended with Philips Hue white ambiance, providing users with every shade of white light.
Philips Lighting expanded the number of sports stadiums using its Philips ArenaVision dynamic LED pitch lighting, adding the Amsterdam Arena, the Juventus Stadium in Turin, the Volkswagen Arena in Wolfsburg and the indoor stadium in Cairo. The company also provided pitch, façade and office lighting for Atletico Madrid. Philips Lighting is responsible for the pitch lighting of over 65% of stadiums involved in major international sports events.
3.5.4 2016 financial performance
Net income is not allocated to segments as certain income and expense line items are monitored on a centralized basis.
Lighting | ||||||||||||
Key data in millions of EUR unless otherwise stated | ||||||||||||
2014 - 2016 | ||||||||||||
|
| |||||||||||
| 2014 | 2015 | 2016 | ||||||||||
|
| |||||||||||
Sales | 6,874 | 7,438 | 7,094 | |||||||||
Sales growth | ||||||||||||
% increase (decrease), nominal | (4 | )% | 8 | % | (5 | )% | ||||||
% increase (decrease), comparable1) | (3 | )% | (3 | )% | (2 | )% | ||||||
Income from operations (EBIT) | 25 | 334 | 432 | |||||||||
as a % of sales | 0.4 | % | 4.5 | % | 6.1 | % | ||||||
Adjusted income from operations1) | 133 | 441 | 542 | |||||||||
as a % of sales | 1.9 | % | 5.9 | % | 7.6 | % | ||||||
|
| |||||||||||
| 1) | Non-GAAP financial measure. For the definition and reconciliation to the most directly comparable GAAP measure, refer tochapter 4, Reconciliation ofnon-GAAP information, of this report |
In 2016, sales amounted to EUR 7,094 million, 5% decrease on a nominal basis. Excluding a 3% negative currency effect and portfolio changes, comparable sales1) decreased by 2%, reflecting double-digit growth in LED and Home, alow-single-digit decline Professional and a double-digit decline in Lamps. Green Revenues amounted to EUR 5,536 million, or 78% of total segment sales.
Annual Report 2016 67
Segment performance 3.5.4
Income from operations(EBIT) amounted to EUR 432 million, or 6.1% of sales, which included EUR 110 million of amortization charges, mainly related to acquired intangible assets at Professional.
Adjusted income from operations1) increased from EUR 441 million, or 5.9% of sales, in 2015 to EUR 542 million, or 7.6% of sales in 2016. Restructuring and acquisition-related charges were EUR 119 million, compared to EUR 97 million in 2015. Adjusted income from operations1) in 2016 also included a gain of EUR 14 million related to a release of provisions originating from the separation activities. Adjusted income from operations1) in 2015 also included EUR 14 million of charges related to the devaluation of the Argentine peso. The increase was mainly attributable to cost reduction programs and an increase in gross margin, partly offset by higher restructuring and acquisition-related charges.
Lighting
Sales per geographic clusterin millions of EUR
2014 - 2016
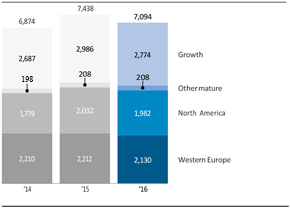
Lighting
Income from operations (EBIT) and Adjusted income from operations1)in millions of EUR
2014 - 2016
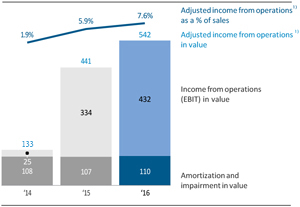
| 1) | For a reconciliation to the most directly comparable GAAP measures, seechapter |
2015 financial performance
In 2013,2015, sales amounted to EUR 7367,438 million, EUR 23 million8% higher than in 2012, due to higher royalty income.
Adjusted IFO in 2013on a nominal basis. Excluding an 11% positive currency effect and portfolio changes, comparable sales1) decreased by 3%. On a comparable basis1), LED achieved double-digit growth, Home reported low-single-digit growth, Professional remained flatyear-on-year, while Lamps posted a double-digit decline. Green Revenues amounted to EUR 5,343 million, or 72% of total segment sales.
From a lossgeographic perspective, comparable sales1) in growth geographies showed amid-single-digit decline, largely driven by declines at Lamps and Home in China and at Home and Professional in Middle East & Turkey. Sales in growth geographies increased from 39% of total sales in 2014 to 40% in 2015. Comparable sales1) in mature geographies showed alow-single-digit decline, with Western Europe and North America recording alow-single-digit decline.
Income from operations(EBIT) amounted to EUR 239334 million, compared to a lossor 4.5% of sales, which included EUR 704107 million in 2012. In 2012, Adjusted IFO included the EUR 313 million impact of the European Commission fine and provisionsamortization charges, mainly related to various legal matters totalingintangible assets at Professional.
Adjusted income from operations1) increased from EUR 132 million.133 million, or 1.9% of sales, in 2014 to EUR 441 million, or 5.9% of sales in 2015. Restructuring and acquisition-related charges amounted to EUR 397 million in 2013,2015, compared to EUR 56281 million in 2012. 2013 Adjusted IFO2014. 2015 also included EUR 14 million of charges related to the devaluation of the Argentine peso, while 2014 included a EUR 13 million past-service pension cost gain and EUR 68 million of EUR 6 million, whichimpairment and other charges related to industrial assets. The increase in Adjusted income from operations1) was recorded across Group Innovation, IP Royalties, Group and Regional Overheads and Service Units and Others.
Adjusted IFO at Group Innovation was a EUR 15 million lower net cost than in 2012, mainly due tolargely driven by lower restructuring charges.and acquisition-related charges, cost productivity and improved LED gross margins.
3.5.5 Brighter Lives, Better World
During Climate Week NYC, Eric Rondolat launched Philips Lighting’s new sustainability program ‘Brighter Lives, Better World’, building on the long legacy of Philips’ EcoVision programs. The new program is built on two pillars: Green Revenues and Sustainable operations. With 78% of 2016 sales coming from sustainable products, systems and services (72% in 2015), Green Revenues reached a record level for Philips Lighting.
In 2016, approximately 15% of the world’s electricity is still being used for lighting. Through its digital LED technology, Philips Lighting offers light that is up to 80% more energy-efficient than conventional technologies, which are still commonly used globally. For this reason, the company has pledged to cumulatively sell 2 billion LED light bulbs by 2020, for which it has already sold 628 million units thus far. In addition, Philips Lighting effectively reduced its operational carbon footprintyear-on-year by 20%, also increasing the share of renewable electricity to 67%. Its solutions to effectively reduce, recycle, andre-use the waste in its sites as much as possible resulted in 85% of its total industrial waste being recycled, as part of its journey towards zero waste to landfill.
| 1) | Non-GAAP financial measure. For the definition and reconciliation to the most directly comparable GAAP measure, refer tochapter 4, Reconciliation ofnon-GAAP information, of this report. |
68 Annual Report 2016
Segment performance 3.5.6
3.5.6 Separation of Lighting
In September 2014, Philips announced its plan to sharpen its strategic focus by establishing two stand-alone companies focused on the HealthTech and Lighting opportunities respectively. Before the listing of Philips Lighting on Euronext in May 2016, a stand-alone structure was established for Philips Lighting within the Philips Group, effective February 1, 2016. To effectuate the separation and to provide a framework for the relationship between the two companies after the separation, Philips and Philips Lighting entered into a separation agreement and a set of ancillary agreements (collectively, the “Separation Agreement”). The Separation Agreement allocated assets, liabilities, employees and contracts of the Philips Group between the current groups of Philips and Philips Lighting. The separation was guided by the principle that the Philips Lighting group comprises substantially all of Philips’ former lighting business, related assets and liabilities, employees and contracts, as well as allocated activities from the former Innovation, Group & Regional OverheadServices sector. Furthermore, certain historical exposures and liabilities of the Philips Group were allocated to each of the groups of Philips and Philips Lighting, which are unrelated to their respective businesses.
Upon the listing of Philips Lighting in May 2016, Philips and Philips Lighting also entered into a relationship agreement (the “Relationship Agreement”) to manage the continuing relationship between Philips Lighting and Philips as a large shareholder of Philips Lighting upon such listing. The Relationship Agreement will terminate when the stake of Philips falls below 10% (with the exception of certain specific provisions).
Philips engages in various transactions with certain affiliated entities which form part of the consolidated Group, including Philips Lighting and its consolidated subsidiaries. These transactions include, but are not limited to, provision of certain transitional services (including transitional IT services) by Philips to such affiliated entities or by such affiliated entities to Philips, licensing of intellectual property (including trademarks of the Group) by Philips to such affiliated entities, and licensing of the Philips company name to such affiliated entities. Such transactions between Philips and its subsidiaries are not disclosed innote 26, Related-party transactions, because they are eliminated on consolidation. A list of our material subsidiaries, including material subsidiaries of Philips Lighting, is shown innote 5, Interests in entities as well as insection 16.6, Exhibit 8, of this report.
Legacy Items consists mainly of separation costs, werelegacy legal items, legacy pension costs, environmental provisions and stranded costs.
3.6.1 2016 financial performance
| Legacy Items | ||||||||||||
| Key datain millions of EUR unless otherwise stated | ||||||||||||
| 2014 - 2016 | ||||||||||||
|
| |||||||||||
| 2014 | 2015 | 2016 | ||||||||||
|
| |||||||||||
Separation costs | (183 | ) | (152 | ) | ||||||||
Other | (388 | ) | (439 | ) | (43 | ) | ||||||
|
| |||||||||||
Income from operations (EBIT) | (388 | ) | (622 | ) | (195 | ) | ||||||
|
| |||||||||||
Income from operations (EBIT) mainly included EUR 152 million of charges related to the separation of the Lighting business, a EUR 14 million higher than in 2012, mainly duecharge related to increasedprovisions originating from the separation of the Lighting business, EUR 9 million of costs of addressing legacy issues related to environmental provisions, EUR 4 million of pension costs, EUR 36 million of stranded costs related to our new brand positioning.
Accelerate! investments amounted tothe combined Lumileds and Automotive businesses, EUR 13711 million in 2013, and include investments in IT infrastructure, internal departments and external consultancy dedicated to the Accelerate! program.
Pensions amounted to a net cost of EUR 41 million, and represent costs related to deferred pensioners covered by company plans. In 2013, Adjusted IFO was impacted by a EUR 31 million settlement loss arising from a lump-sum offering to terminated vested employees in our US pension plan. In 2012, Adjusted IFO was positively impacted by a EUR 25 million gain from a change in a medical retiree plan.
Adjusted IFO at Service Units and Other increased from a loss of EUR 543 million in 2012 to a loss of EUR 64 million. In 2012, Adjusted IFO included the EUR 313 million impact of the European Commission fine and provisionscharges related to various legal matters totaling EUR 132 million,provisions, as well as a EUR 46 million gain onfrom the salesettlement of the High Tech Campusa pension-related claim. Income from operations (EBIT) in 2015 included EUR 345 million of settlements mainly related to pensionde-risking.
2015 financial performance
Income from operations (EBIT) mainly included charges of EUR 37 million. Excluding these impacts, the increase in Adjusted IFO in 2013 was mainly due to lower restructuring costs as well as releases of environmental provisions.
Net operating capital decreased to negative EUR 2.9 billion, primarily183 million related to the paymentseparation of the European Commission fine, a decreaseLighting business and EUR 345 million mainly related to settlements for pensionde- risking. Income from operations (EBIT) in pension liabilities, an increase in the value2014 included EUR 244 million of currency hedges as well as a reclassification of real estate assets from the sectorscharges related to the Service Units.
Cash flows before financing activities decreased from an outflow of EUR 842 million in 2012 to an outflow of EUR 2,101 million, mainly due to the payment of the European Commission fine and lower cash inflows from the sale of fixed assets.
2012 financial performanceCRT settlement.
In 2012, sales amounted to EUR 713 million, EUR 18 million lower than in 2011, reflecting the divestment of Assembléon in 2011.
114 Annual Report 2013
5 Sector performance 5.4.2 - 5.4.2
Adjusted IFO in 2012 amounted to a loss of EUR 704 million, compared to a loss of EUR 197 million in 2011. The year-on-year decrease in Adjusted IFO was largely attributable to a EUR 313 million impact of European Commission fine and provisions related to various legal matters totaling EUR 132 million. Restructuring and acquisition-related charges amounted to EUR 56 million in 2012, compared to EUR 23 million in 2011.
Adjusted IFO at Group Innovation was EUR 71 million lower than in 2011, due to new innovation and design initiatives, as well as higher investments in new value spaces.
Group & Regional Overhead costs were EUR 21 million higher than in 2011, mainly due to increased costs related to strengthening the market access and growth initiatives.
Accelerate! investments amounted to EUR 128 million in 2012, and include investments in IT infrastructure, internal departments and external consultancy dedicated to the Accelerate! program.
Adjusted IFO at Pensions was EUR 2 million higher than in 2011. 2011 was positively impacted by a EUR 21 million gain due to a plan change in one of our major plans, while 2012 was positively impacted by a EUR 25 million gain from a change in a medical retiree plan.
Adjusted IFO at Service Units and Other decreased from a loss of EUR 235 million in 2011 to a loss of EUR 543 million. The decrease was largely attributable to the EUR 313 million impact of the European Commission fine and provisions related to various legal matters totaling EUR 132 million, partly offset by a gain on the sale of High Tech Campus of EUR 37 million and lower stranded costs from the divestment of our Television business.
Net operating capital decreased to negative EUR 4.5 billion, primarily related to an increase in payables and provisions due to legal and environmental matters.
Cash flows before financing activities improved from an outflow of EUR 1,159 million in 2011 to an outflow of EUR 842 million, mainly due to higher cash inflows from the sale of fixed assets.
Annual Report 2013 1152016 69
6 Risk management 6 - 6.1Reconciliation of non-GAAP information 4
64 Reconciliation ofnon-GAAP information
Koninklijke Philips N.V. (the ‘Company’) believes that an understanding of sales performance, capital efficiency, financial strength and its funding requirements is enhanced by introducing certainNon-GAAP measures, such as Comparable sales growth, Adjusted income from operations / EBITA and Net debt. In this chapter these measures are further explained and reconciled to GAAP measures.
Non-GAAP measures referred to in this report are cross referenced to this chapter.
Comparable sales growth
Comparable sales exclude the effects of currency movements and changes in consolidation. As indicated in thenote 1, Significant accounting policies, sales and income are translated from foreign currencies into the Company’s reporting currency, the euro, at the exchange rate on transaction dates during the respective years. As a result of significant currency movements during the years presented, the effects of translating foreign currency sales amounts into euros could have a material impact. Therefore, these impacts have been excluded in arriving at the comparable sales in euros. Currency effects have been calculated by translating previous years’ foreign currency sales amounts into euros at the following year’s exchange rates in comparison with the sales in euros as historically reported. The years under review were characterized by a number of acquisitions and divestments, as a result of which activities were consolidated or deconsolidated. The effect of consolidation changes has also been excluded in arriving at the comparable sales. For the purpose of calculating comparable sales, when a previously consolidated entity is sold or contributed to a venture that is not consolidated by the Company, relevant sales are excluded from impacted prior-year periods. Similarly, when an entity is acquired, relevant sales are excluded from impacted periods.
Philips Group
Sales growth composition per segmentin %
2014 - 2016
|
| |||||||||||||||
| nominal growth | currency effects | consolidation changes | comparable growth | |||||||||||||
|
| |||||||||||||||
2016 versus 2015 | ||||||||||||||||
Personal Health | 5.2 | 2.0 | 0.0 | 7.2 | ||||||||||||
Diagnosis & Treatment | 3.1 | 0.9 | (0.4 | ) | 3.6 | |||||||||||
Connected Care & Health Informatics | 4.5 | 0.1 | (0.1 | ) | 4.5 | |||||||||||
HealthTech Other | (5.0 | ) | 0.0 | 0.0 | (5.0 | ) | ||||||||||
Lighting | (4.6 | ) | 2.1 | 0.2 | (2.3 | ) | ||||||||||
|
| |||||||||||||||
Philips Group | 1.1 | 1.4 | 0.2 | 2.7 | ||||||||||||
2015 versus 2014 | ||||||||||||||||
Personal Health | 13.5 | (8.6 | ) | 0.0 | 4.9 | |||||||||||
Diagnosis & Treatment | 22.7 | (10.9 | ) | (5.7 | ) | 6.1 | ||||||||||
Connected Care & Health Informatics | 12.6 | (12.2 | ) | 0.0 | 0.4 | |||||||||||
HealthTech Other | 3.3 | (0.3 | ) | (1.9 | ) | 1.1 | ||||||||||
Lighting | 8.2 | (8.5 | ) | (2.2 | ) | (2.5 | ) | |||||||||
|
| |||||||||||||||
Philips Group | 13.3 | (9.4 | ) | (1.7 | ) | 2.2 | ||||||||||
2014 versus 2013 | ||||||||||||||||
Personal Health | 3.0 | 2.7 | 0.2 | 5.9 | ||||||||||||
Diagnosis & Treatment | (6.6 | ) | 1.5 | 0.5 | (4.6 | ) | ||||||||||
Connected Care & Health Informatics | (2.2 | ) | 1.7 | 0.3 | (0.2 | ) | ||||||||||
HealthTech Other | (8.5 | ) | 0.0 | (3.7 | ) | (12.2 | ) | |||||||||
Lighting | (3.9 | ) | 2.2 | (1.0 | ) | (2.7 | ) | |||||||||
|
| |||||||||||||||
Philips Group | (2.7 | ) | 2.0 | (0.2 | ) | (0.9 | ) | |||||||||
|
| |||||||||||||||
70 Annual Report 2016
Reconciliation of non-GAAP information 4
Philips Group
Sales growth composition per geographic clusterin %
2014 - 2016
|
| |||||||||||||||
| nominal growth | currency effects | consolidation changes | comparable growth | |||||||||||||
|
| |||||||||||||||
2016 versus 2015 | ||||||||||||||||
Western Europe | 0.0 | 1.6 | 0.2 | 1.8 | ||||||||||||
North America | 2.1 | (0.3 | ) | (0.1 | ) | 1.7 | ||||||||||
Other mature geographies | 7.9 | (5.5 | ) | (0.4 | ) | 2.0 | ||||||||||
|
| |||||||||||||||
Mature geographies | 2.0 | (0.2 | ) | 0.0 | 1.8 | |||||||||||
Growth geographies | (0.5 | ) | 4.6 | 0.4 | 4.5 | |||||||||||
|
| |||||||||||||||
Philips Group | 1.1 | 1.4 | 0.2 | 2.7 | ||||||||||||
2015 versus 2014 | ||||||||||||||||
Western Europe | 3.9 | (1.9 | ) | (0.7 | ) | 1.3 | ||||||||||
North America | 21.2 | (18.4 | ) | (1.4 | ) | 1.4 | ||||||||||
Other mature geographies | 11.7 | (5.3 | ) | (3.7 | ) | 2.7 | ||||||||||
|
| |||||||||||||||
Mature geographies | 13.1 | (10.2 | ) | (1.4 | ) | 1.5 | ||||||||||
Growth geographies | 13.8 | (7.9 | ) | (2.4 | ) | 3.5 | ||||||||||
|
| |||||||||||||||
Philips Group | 13.3 | (9.4 | ) | (1.7 | ) | 2.2 | ||||||||||
2014 versus 2013 | ||||||||||||||||
Western Europe | (0.3 | ) | (0.4 | ) | (0.2 | ) | (0.9 | ) | ||||||||
North America | (3.0 | ) | 0.9 | 0.3 | (1.8 | ) | ||||||||||
Other mature geographies | (5.6 | ) | 4.7 | 0.0 | (0.9 | ) | ||||||||||
|
| |||||||||||||||
Mature geographies | (2.2 | ) | 0.8 | 0.1 | (1.3 | ) | ||||||||||
Growth geographies | (3.7 | ) | 4.4 | (0.7 | ) | 0.0 | ||||||||||
|
| |||||||||||||||
Philips Group | (2.7 | ) | 2.0 | (0.2 | ) | (0.9 | ) | |||||||||
|
| |||||||||||||||
Adjusted income from operations
The Company uses the terms EBIT and Adjusted income from operations to evaluate the performance of the Philips Group and its operating segments. The term EBIT has the same meaning as Income from operations and the term EBITA has the same meaning as Adjusted income from operations. Adjusted income from operations represents income from operations before amortization and impairment on intangible assets (excluding software and capitalized development expenses). Referencing Adjusted income from operations is considered appropriate as the Company uses it as one of its strategic drivers to increase profitability throughre-allocation of its resources towards opportunities offering more consistent and higher returns and it will make the underlying performance of our businesses more transparent as it will not be distorted by the unpredictable effects of future, unidentified acquisitions.
Adjusted income from operations is not a financial measure in accordance with IFRS. Below is a reconciliation of Adjusted income from operations to the most directly comparable IFRS measure, Net income, for the years indicated. Net income is not allocated to segments as certain income and expense line items are monitored on a centralized basis, resulting in them being shown on a Philips Group level only.
Annual Report 2016 71
Reconciliation of non-GAAP information 4
Philips Group
Net income to Adjusted income from operationsin millions of EUR
2014 - 2016
|
| |||||||||||||||||||||||||||
| Philips Group | Personal Health | Diagnosis & Treatment | Connected Care & Health Informatics | HealthTech Other | Lighting | Legacy Items | ||||||||||||||||||||||
|
| |||||||||||||||||||||||||||
2016 | ||||||||||||||||||||||||||||
Net Income | 1,491 | |||||||||||||||||||||||||||
Discontinued operations, net of income taxes | (416 | ) | ||||||||||||||||||||||||||
Investments in associates, net of income taxes | (13 | ) | ||||||||||||||||||||||||||
Income tax expense | 327 | |||||||||||||||||||||||||||
Financial expenses | 569 | |||||||||||||||||||||||||||
Financial income | (76 | ) | ||||||||||||||||||||||||||
|
| |||||||||||||||||||||||||||
Income from operations (EBIT) | 1,882 | 953 | 546 | 275 | (129 | ) | 432 | (195 | ) | |||||||||||||||||||
Amortization of intangible assets1) | 350 | 139 | 48 | 47 | 9 | 108 | (1 | ) | ||||||||||||||||||||
Impairment of goodwill | 3 | — | — | — | — | 2 | 1 | |||||||||||||||||||||
|
| |||||||||||||||||||||||||||
Adjusted income from operations | 2,235 | 1,092 | 594 | 322 | (120 | ) | 542 | (195 | ) | |||||||||||||||||||
Sales | 24,516 | 7,099 | 6,686 | 3,158 | 478 | 7,094 | ||||||||||||||||||||||
Adjusted income from operations as a % of sales | 9.1 | % | 15.4 | % | 8.9 | % | 10.2 | % | 7.6 | % | ||||||||||||||||||
2015 | ||||||||||||||||||||||||||||
Net Income | 659 | |||||||||||||||||||||||||||
Discontinued operations, net of income taxes | (245 | ) | ||||||||||||||||||||||||||
Investments in associates, net of income taxes | (30 | ) | ||||||||||||||||||||||||||
Income tax expense | 239 | |||||||||||||||||||||||||||
Financial expenses | 467 | |||||||||||||||||||||||||||
Financial income | (98 | ) | ||||||||||||||||||||||||||
|
| |||||||||||||||||||||||||||
Income from operations (EBIT) | 992 | 736 | 322 | 173 | 49 | 334 | (622 | ) | ||||||||||||||||||||
Amortization of intangible assets1) | 380 | 149 | 55 | 54 | 15 | 107 | — | |||||||||||||||||||||
Impairment of goodwill | — | — | — | — | — | — | — | |||||||||||||||||||||
|
| |||||||||||||||||||||||||||
Adjusted income from operations | 1,372 | 885 | 377 | 227 | 64 | 441 | (622 | ) | ||||||||||||||||||||
Sales | 24,244 | 6,751 | 6,484 | 3,022 | 503 | 7,438 | ||||||||||||||||||||||
Adjusted income from operations as a % of sales | 5.7 | % | 13.1 | % | 5.8 | % | 7.5 | % | 5.9 | % | ||||||||||||||||||
2014 | ||||||||||||||||||||||||||||
Net Income | 411 | |||||||||||||||||||||||||||
Discontinued operations, net of income taxes | (190 | ) | ||||||||||||||||||||||||||
Investments in associates, net of income taxes | (62 | ) | ||||||||||||||||||||||||||
Income tax expense | 26 | |||||||||||||||||||||||||||
Financial expenses | 415 | |||||||||||||||||||||||||||
Financial income | (114 | ) | ||||||||||||||||||||||||||
|
| |||||||||||||||||||||||||||
Income from operations (EBIT) | 486 | 620 | 349 | (157 | ) | 37 | 25 | (388 | ) | |||||||||||||||||||
Amortization of intangible assets1) | 332 | 138 | 25 | 50 | 14 | 106 | (1 | ) | ||||||||||||||||||||
Impairment of goodwill | 3 | — | — | 1 | — | 2 | — | |||||||||||||||||||||
|
| |||||||||||||||||||||||||||
Adjusted income from operations | 821 | 758 | 374 | (106 | ) | 51 | 133 | (389 | ) | |||||||||||||||||||
Sales | 21,391 | 5,948 | 5,284 | 2,684 | 487 | 6,874 | ||||||||||||||||||||||
Adjusted income from operations as a % of sales | 3.8 | % | 12.7 | % | 7.1 | % | (3.9 | )% | 1.9 | % | ||||||||||||||||||
|
| |||||||||||||||||||||||||||
| 1) | Excluding amortization of software and product development. |
72 Annual Report 2016
Reconciliation of non-GAAP information 4
Net debt
Net debt is defined as the sum of long- and short-term debt minus cash and cash equivalents. The net debt position as a percentage of the sum of group equity (shareholders’ equity andnon-controlling interests) and net debt is presented to express the financial strength of the Company. This measure is used by Treasury management of the Company and investment analysts and is therefore included in the disclosure.
Philips Group
Composition of net debt and group equityin millions of EUR unless otherwise stated
2014 - 2016
|
| |||||||||||
| 2014 | 2015 | 2016 | ||||||||||
|
| |||||||||||
Long-term debt | 3,712 | 4,095 | 4,021 | |||||||||
Short-term debt | 392 | 1,665 | 1,585 | |||||||||
|
| |||||||||||
Total debt | 4,104 | 5,760 | 5,606 | |||||||||
Cash and cash equivalents | 1,873 | 1,766 | 2,334 | |||||||||
|
| |||||||||||
Net debt1) | 2,231 | 3,994 | 3,272 | |||||||||
Shareholders’ equity | 10,867 | 11,662 | 12,601 | |||||||||
Non-controlling interests | 101 | 118 | 907 | |||||||||
|
| |||||||||||
Group equity | 10,968 | 11,780 | 13,508 | |||||||||
Net debt and group equity | 13,199 | 15,774 | 16,780 | |||||||||
Net debt divided by net debt and group equity (in %) | 17 | % | 25 | % | 19 | % | ||||||
Group equity divided by net debt and group equity (in %) | 83 | % | 75 | % | 81 | % | ||||||
Net debt and group equity ratio | 17:83 | 25:75 | 19:81 | |||||||||
|
| |||||||||||
| 1) | Total debt less cash and cash equivalents |
Annual Report 2016 73
Risk management 5
6.1 5.1Our approach to risk management and business control
The following section presents an overviewExecutive Committee, supported by the Risk Management Support Team, oversees and manages enterprise risk. The Risk Management Support Team consists of Philips’ approacha number of functional experts covering the various categories of enterprise risk and supports by increasing the understanding of the Enterprise Risk profile and continuously working to improve the enterprise risk management framework. Management is the primary responsible for identifying the critical risks and business controlsfor the implementation of appropriate risk responses.
Philips believes risk management is a value creating activity and a descriptionas such it is an integral element of the naturePhilips Business System (PBS). Risk management supports us in taking sound risk-reward strategic decisions to maximize value creation, it supports sustainable results on our Path to Value, it protects our key strengths (Capabilities, Assets, and the extent of its exposure to risks. Positions) and it supports process excellence.
Philips’ risk management focuses on the following risk categories: Strategic, Operational, Compliance and Financial risks. TheseThe main risks within these categories are further described insection 6.2,5.2, Risk categories and factors, of this report. The risk overview highlights the mainmaterial risks known to Philips, which could hinder it in achieving its strategic and financial business objectives. The risk overview may, however, not include all the risks that may ultimately affect Philips. Some risks not yet known to Philips, or currently believed not to be material, could ultimately have a major impact on Philips’ businesses, objectives, revenues, income, assets, liquidity or capital resources.
All oral and written forward-looking statements made on or after the date of this Annual Report and attributable to Philips are expressly qualified in their entirety by the factors described in the cautionary statement included inForward-looking statements, of this report and the overview of risk factors described insection 6.2,5.2, Risk categories and factors, of this report.
Risk Management Framework
Risk management and control forms an integral part of the Philips business planning and performance review cycle. The company’s risk and control policy is designed to provide reasonable assurance that objectives are met by integrating risk assessment in the strategic planning process, integrating management control into the daily operations, by ensuring compliance with legal requirements and by safeguarding the integrity of the company’s financial reporting and its related disclosures. It makes management responsible for identifying the critical business risks and for the implementation of fit-for-purposeappropriate risk responses. Philips’ risk management approach is embedded in the areas of corporate governance,Corporate Governance, elements of the Philips Business System (Strategic Investment Decision Making, Asset Protection, Operational Excellence, Planning & Performance Cycle), Philips Business Control Framework and Philips General Business Principles. The Risk Management Support Team supports management by assessing the Enterprise Risk profile and continuously working to improve the enterprise risk management framework. Structured risk assessments take place according to the Philips process standard for managing risk.
Philips’ risk management process addresses risks related to different categories: Strategic, Operational, Compliance and Financial risks. The Executive Committee and management consider risk appetite when taking decisions and seek to manage risks consistently within the risk appetite. Risk appetite is different for the various risk categories:
Strategic risks and opportunities may affect Philips’ strategic ambitions. Strategic risks include economic and political developments and the need to anticipate and respond timeously to market circumstances. Philips is prepared to take considerable strategic risks given the necessity to invest in research & development and manage the portfolio of businesses, including acquisitions and divestments, in a highly uncertain global political and economic environment.
Operational risks include adverse unexpected developments resulting from internal processes, people and systems, or from external events that are linked to the actual running of each business (examples are solution and product creation and supply chain management). Philips aims to minimize downside risks due to the need for high quality of its products and services, reliable IT systems and sustainability commitments.
Compliance risks cover unanticipated failures to implement, or comply with, appropriate laws, regulations, policies and procedures. Philips has a zero tolerance policy towardsnon-compliance in relation to breaches of its General Business Principles.
Financial risk include risks related to Treasury, Accounting and Reporting, Pensions and Tax. Philips is prudent with regard to financial risks and the risk appetite is described in various chapters of this annual report, includingnote 30, Details of treasury / other financial risks.
Philips does not classify these risk categories in order of importance.
74 Annual Report 2016
Risk management 5.1
Corporate governanceGovernance
Corporate governance is the system by which a company is directed and controlled. Philips believes that good corporate governance is a critical factor in achieving business success. Good corporate governance derives from, amongstamong other things, solideffective internal controls and high ethical standards.
The quality of Philips’ systemssystem of risk management, business controlscontrol and theother findings of internal and external audits are reported to and discussed by the Audit Committee of the Supervisory Board. Internal auditors monitor the quality of therisk management and business controls through risk-based operational audits, inspections of financial reporting controls and compliance audits.
Audit & Risk committees at groupGroup level, (Group, Finance, InnovationBusiness Groups, Markets and IT), at Global Market level and at Sector level (Healthcare, Lighting, Consumer Lifestyle)key Functional areas meet quarterly, chaired by first line leadership, to address weaknesses in therisk management and business controls infrastructurestructure as reported by internal and external auditors or revealed by self-assessment of management and to take corrective action where necessary. These auditAudit & Risk committees are also involved in determining the desired company-wide internal audit planning as approved by the Audit Committee of the Supervisory Board. In addition to the Audit Committee, the Quality and Regulatory (Q&R) Committee of the Supervisory Board assists the Supervisory Board in fulfilling its oversight responsibilities particularly in respect of the quality of the Company’s products, systems, services and software and the development, testing, manufacturing, marketing and servicing thereof, and regulatory requirements relating thereto. As such, the Q&R Committee supports the Company’s risk management in the relevant risk areas. Anin-depth description of Philips’ corporate governance structure can be found inchapter 10,9, Corporate governance, of this report.
Risk Management
Taking risks is an inherent part of entrepreneurial behavior and well-structured risk management allows management to take risks in a controlled manner. In order to provide a comprehensive view of Philips’ risks, structured risk assessments take place according to the Philips process standard for risk management, combining elements of atop-down andbottom-up approach. The process is supported by workshops with management at Business, Market and Group Function levels. During 2016, several risk management workshops were held.
Risk diagram
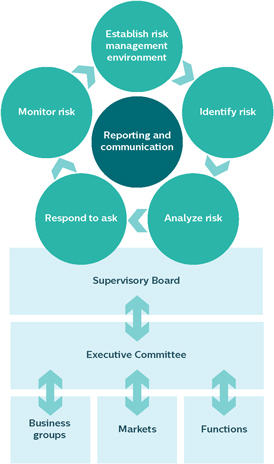
Key elements of the Philips risk management process are:
Annual risk assessment for the Group, Business Groups, Markets and key Functions as part of the annual update of the strategic plan. Risks are assessed and prioritized on their impact on objectives, likelihood of occurrence and effectiveness of controls. Management is accountable for the timely development of effective risk responses.
Developments in the risk profile and management’s initiatives to improve risk responses are explicitly discussed and monitored during the quarterly Audit & Risk Committees and in the Quarterly Performance Reviews (QPR).
As an integral part of the strategy review, the Executive Committee annually assesses the enterprise risk profile, including appropriate risk scenarios and sensitivity analysis, and reviews the potential impact of the enterprise risk profile versus the Group’s risk appetite. This risk assessment is based on the latest annual risk assessments of the Group, Business Groups, Markets and key Functions and changes to these, if any, as reported during the periodic review meetings, findings from Philips Internal Audit, Legal and Insurance, the Materiality analysis as described inchapter 12, Sustainability
Annual Report 2016 75
Risk management 5.1
| statements, of this report, views from key stakeholders, external analysis, and risks reported in the annual certification statement on Risk Management and Business Controls. |
Developments in the Enterprise Risk profile and management’s initiatives to improve risk responses are discussed and monitored during the quarterly Group Audit & Risk Committee.
The Executive Committee reviews at least annually the Philips risk management approach and improves the process as required.
The Philips risk profile and the risk management approach are discussed at least annually with the Supervisory Board.
Examples of measures taken to further strengthen the risk management framework include:
Definition and execution of the Enterprise Risk Management (ERM) improvement roadmap;
Process standardization for Risk Management, Internal Control, Compliance and Audit processes as part of the Philips Excellence Process Framework (PEPF) to drive efficiency and continuous improvement;
The establishment of an Information Security Office and Program in light of the increasing exposure to cybercrime and information security requirements resulting from digitalization and a focus on the Healthcare industry;
The development of risk management related to long-term strategic partnership given the growing importance of service-based business models.
Philips Business Control Framework
The Philips Business Control Framework (BCF) sets the standard for risk management and business control in Philips. The objectives of the BCF are to maintain integrated management control of the company’s operations, in order to ensure the integrity of the financial reporting, as well as compliance with laws and regulations. Philips is usinghas designed its BCF based on the “Internal Control-Integrated Framework (2013)” established by the Committee of Sponsoring Organizations of the Treadway Commission (COSO) framework on internal control (1992) as a basis for the BCF.. Philips continuously evaluates and improves its BCF to align with business dynamics and good practice.
As part of the BCF, Philips has implemented a global standard for internal control over financial reporting (ICS). The ICS, together with Philips’ established accounting procedures, is designed to provide reasonable assurance that assets are safeguarded, that the books and records properly reflect transactions necessary to permit preparation of financial statements, that policies and procedures are carried out
116 Annual Report 2013
6 Risk management 6.1 - 6.1
by qualified personnel and that published financial statements are properly prepared and do not contain any material misstatements. ICS has been deployed in all mainmaterial reporting units, where business process owners perform an extensive number of controls, document the results each quarter, and take corrective action where necessary. ICS supports sectorbusiness and functional management in a quarterly cycle of assessment and monitoring of its control environment. The findings of management’s evaluation are reported to the Executive Committee and the Supervisory Board quarterly.
As part of the Annual Report process, management’s accountability for business controls is enforced through the formal issuance of a Statement on Business Controls and a Letter of Representation by sectorBusiness Group, Market and functionalFunctional management to the Executive Committee. Any deficiencies noted in the design and operating effectiveness of controls over financial reporting which were not completely remediated are evaluated atyear-end by the Executive Committee.Board of Management. The Executive Committee’sBoard of Management’s report, including its conclusions regarding the effectiveness of internal control over financial reporting, can be found insection 11.1,10.1, Management’s report on internal control, of this report.
Philips General Business Principles
The Philips General Business Principles (GBP) govern Philips’ business decisions and actions throughout the world, applying to corporate actions and the behavior of individual employees. They incorporate the fundamental principles withinfor all Philips businesses around the globe. They set the minimum standard for doing business. The intentionbusiness conduct, both for individual employees and for the company and our subsidiaries. Our GBP also stand as a reference for the business conduct we expect from our business partners and suppliers. Translations of the text are available in 32 languages, allowing almost every employee to read the GBP in their native language. Detailed underlying policies, manuals, training and tools are in place to give employees practical guidance on how to apply the GBP in theirday-to-day work environments.
In addition, there are separate Codes of Ethics that apply to employees working in specific areas of our business, i.e. the Procurement Code of Ethics and the Financial Code of Ethics. Details can be found at:www.philips.com/gbp.
As part of our unyielding effort to raise GBP awareness and create engagement throughout the organization, each year a GBP communications and training plan is deployed. In 2016, a number of new initiatives were undertaken through various channels such as Quick Reference Cards forat-a-glance guidance on how to ensure compliance with laws and regulations,handle a number of common GBP concerns, as well as returning programs such ase-Learnings for selected high-risk audiences. Many of these initiatives contributed to building momentum toward our now annual GBP Dialogue Week in October. During 2016’s Dialogue Week, hundreds of Philips teams held open and frank discussions on what Acting with Philips’ normsIntegrity means to them, and values.posted pictures of their sessions on the Philips social platform using the hashtag #integritymatters.
The GBP are available in most of the local languages and areform an integral part of the labor contracts in virtually all countries whereevery country in which Philips has business activities. Responsibility for compliance withoperates. It is the principles rests primarily with the managementresponsibility of each business. Every country organization employee to live up to our GBP,
76 Annual Report 2016
Risk management 5.1
and each main production site has a compliance officer. All compliance officers operate underemployees are requested to affirm their commitment after completing their GBPe-training. In addition, employees in the supervision of the GBP Review Committee. Confirmation of compliance with the GBP is an integral part of the annual Statementrespective specialized areas must sign off on Business Controls that has to be issued by the management of each business unit. The GBP incorporate a whistleblower policy, standardized complaint reporting and a formal escalation procedure.
The Philips Ethics hotline seeks to ensure that alleged violations are registered and dealt with consistently within a company-wide system. To drive the practical deployment of the GBP, a set of directives has been published, which are applicable to all employees. There are also separate directives which apply to specific categories of employees (e.g. the Supply Management Code of Ethics and Financial Code of Ethics, refer to www.philips.com/gbp).
To seek to ensure compliance with the highest standards of transparency and accountability by all employees performing important financial functions, the Financial Code of Ethics contains, amongst other things, standards to promote honest and ethical conduct, as well as full, accurate and timely disclosure procedures in order to avoid conflicts of interest.
Both the Finance and Supply Management CodeCodes of EthicsEthics. Executives are signedrequested to sign off on an annual basis by the relevant employees,GBP each year to confirmreaffirm their awareness of and compliance with the respective codes.them.
The GBP self-assessment processReview Committee is fully embedded in an automated workflow application (ICS) supporting Sector, Market and functional management in monitoring internal controls, as described underresponsible for the Philips Business Control Framework. Embedding GBP self-assessments in ICS seeks to ensure that GBP compliance is now part of Sector, Market and functional management’s quarterly ICS/SOx (Sarbanes-Oxley) monitoring process, and that GBP non-compliance issues, if significant, are reported to the Board of Management/Executive Committee via the Quarterly Certification Statement process.
In June 2013, as parteffective deployment of the global GBP communications campaign,and for generally promoting a business integrity survey was rolled out toculture of compliance and ethics within Philips. The GBP Review Committee is chaired by the Chief Legal Officer, and its members include the Chief HR Officer, the Chief Market Leader and the Chief Financial Officer. They are supported in the implementation of their initiatives by a Committee Secretariat, and a network of GBP Compliance Officers, who are appointed in all employees to obtain their input onmarkets, countries and at all major sites where Philips has operations.
Related roles and responsibilities are laid down in the effectiveness of our GBP program. The insights that were derived from this survey were used to further enhance the effectivenessCharter of the currentGBP Review Committee. In 2016, in response to external regulatory developments in business ethics and compliance, activitiesa revised charter was deployed by the GBP Review Committee. This newly updated charter impacted the composition of the GBP Review Committee, the roles and responsibilities of its members as well as the composition, roles and responsibilities of the GBP Compliance function. To strengthen monitoring and oversight of GBP compliance road map.within Philips, the mandatory annual GBP self-assessment questionnaire, part of our Internal Control framework, was completely renewed. The business integrity survey also providedGBP Review Committee Secretariat receives an overview of the kickoff forresults of this self-assessment and can take action when deemed necessary. We believe this has created a global GBP communications campaign, culminatingmore robust network equipped with the requisite skills and support to monitor and enhance compliance in a global event called the ‘GBP dialogue week’ held in October 2013,increasingly regulated environments in which managers were invitedPhilips operates.
The GBP are supported by established mechanisms that ensure standardized reporting and escalation of concerns. These mechanisms are based on the GBP Reporting Policy that urges employees to hold sessions with their teams to discuss GBPreport any concerns they may have regarding business conduct in relation to their function or business.
Mandatory web-based GBP training, which is designed to reinforce awareness of the need for compliance with the GBP, is available in 23 languages. Every quarter, all neweither through a GBP Compliance Officer or through the Philips Ethics Line. The Philips Ethics Line enables employees are invitedand also third parties to take this training in their
Annual Report 2013 117
6 Risk management 6.1 - 6.1
local language. In 2013, targeted audiences participatedreport a concern either by telephone or online in a web-based training focusing on specific topics, including anti-bribery, antitrust, privacyvariety of different languages 24/7 all year round. All concerns raised are registered consistently in a single database hosted outside Philips by a third party and export controls.
In 2013, we introduced a mandatory sign-off on GBP for all executives.
For further details, please refer to the General Business Principles paragraphare investigated systematically in chapter 13, Sustainability statements, of this report.accordance with standardized investigation procedures.
Financial Code of Ethics
The Company recognizes that its businesses have responsibilities within the communities in which they operate. The Company has a Financial Code of Ethics which applies to the CEO (the principal executive officer) and CFO (the principal financial and principal accounting officer), and to the heads ofsenior management in the Group Control, Group Treasury, Group Fiscal and Group Internal AuditPhilips Finance Leadership Team who head the Finance departments of the Company. The Company has published its Financial Code of Ethics within the investor section of its website located at www.philips.com.www.philips.com. No changes were considered necessary and no changes have been made to the Financial Code of Ethics since its adoption and no waivers have been granted therefrom to the officers mentioned above in 2013.2016.
For more information, please refer tosub-section 2.2.7, General Business Principles, of this report.
118 Annual Report 20132016 77
6 Risk management 6.2 - 6.25.2
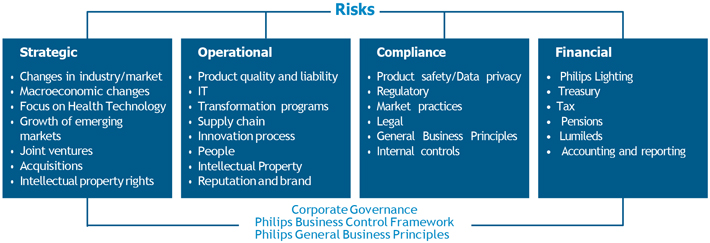
6.25.2 Risk categories and factors
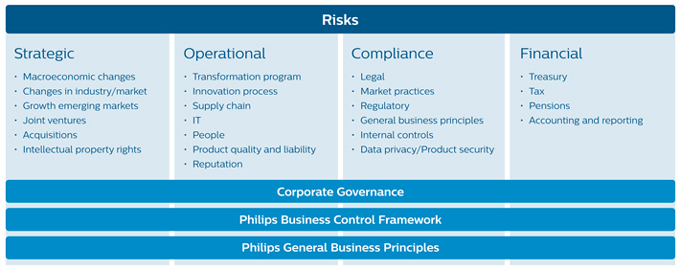
Taking risks is an inherent part of entrepreneurial behavior. A structured risk management process allows management to take risks in a controlled manner. In order to provide a comprehensive view of Philips’ enterprise risks, structured risk assessments take place in accordance with the Philips process standard to manage risk as described insection 5.1, Our approach to risk management, of this report. As a result of this process, amongst others, the following actions were performed during 2016:
Philips completed the separation of its Lighting business activities, risks and opportunities are identifiedsubsequently listed Philips Lighting on the Amsterdam stock exchange and sold a portion of its ownership. This separation has eliminated the separation risk discussed in a structured way combining elements of a top-down and bottom-up approach. Risks are reported on a regular basis as partthe 2015 Annual Report. Until the completion of the ‘Business Performance Management’ process. All relevantsale of its entire ownership in Philips Lighting, Philips remains exposed to risks and opportunities are prioritized in terms of impact and likelihood, considering quantitative and/or qualitative aspects. The bottom-up identification and prioritization process is supported by workshops with the respective management at Sector, Market and Group Function level. The top-down element allows potential new risks and opportunities to be discussed at management level and included in the subsequent reporting process, if found to be applicable. Reported risks and opportunities are analyzed for potential cumulative effects and are aggregated at Sector, Market and Group level. Philips has a structured risk management process to address different risk categories: Strategic, Operational, Compliance and Financial risks.
Strategic risks and opportunities may affect Philips’ strategic ambitions. Operational risks include adverse unexpected developments resulting from internal processes, people and systems, or from external events that are linkedregard to the actual runningvalue of each business (examples are solutionPhilips Lighting.
The challenging global political and product creation, and supply chain management). Compliance risks cover unanticipated failures to implement, or comply with, appropriate laws, regulations, policies and procedures. Withineconomic developments had an impact on our results. Even though the areamanagement of Financial risks, Philips identifies risks related to Treasury, Accounting and reporting, Pensions and Tax. Philips doesthese developments has not classify thesechanged compared to 2015, we continuously monitor the impact on our risk categories in order of importance.profile.
Philips describes the risk factors within each risk category in order of Philips’ current view of expected significance, to give stakeholders an insight into which risks and opportunities it considers more prominent than others at present. The risk overview highlights the main risks and opportunities known to Philips, which could hinder it in achieving its strategic and financial business objectives. The risk overview may, however, not include all the risks that may ultimately affect Philips. Describing risk factors in their order of expected significance within each risk category does not mean that a lower listed risk factor may not have a material and adverse impact on Philips’ business, strategic objectives, revenues, income, assets, liquidity, capital resources or achievement of Philips’ 2016 goals.
Furthermore, a risk factor described after other risk factors may ultimately prove to have more significant adverse consequences than those other risk factors. Over time Philips may change its view as to the relative significance of each risk factor.
Annual Report 2013 119
6 Risk management 6.3 - 6.3
Philips may be unable to adapt swiftly to changes in industry or market circumstances, which could have a material adverse impact on its financial condition and results.
Fundamental shifts in the Healthcare and/or Lighting industries, like the transition towards digital, may drastically change the business environment. If Philips is unable to recognize these changes in good time, is late in adjusting its business models, or if circumstances arise such as pricing actions by competitors, then this could have a material adverse effect on Philips’ growth ambitions, financial condition and operating result.
As Philips’ business is global, its operations are exposed to economic and political developments in countries across the world that could adversely impact its revenues and income.
Philips’ business environment is influenced by political and economic conditions in the domesticindividual and global economies. Continued concerns aboutmarkets. Philips experienced the macroeconomic environmentimpact from changes in macro-economic development in various geographies during 2016. Economic growth in China was markedly lower compared to average growth over the last two decades. The economic growth of countries which are highly dependent on revenues from energy, raw materials and commodities remains adversely affected by the slowdown of growth in China, most strongly in emerging market countries. Low revenues from oil also affected countries in the Middle East where public spending has shown its impact on global marketsbeen dramatically reduced. Monetary interventions by the European Central Bank did not result in any increase of inflation nor in stronger economic growth in the European Union in 2016. The consensus economic outlook for Great Britain as well as for the European Union has become less favorable as a result of the Brexit vote in June 2016. Although the US economy continued to perform well during 2013. Towards2016, the endresult of 2013 the macroeconomic environment seemed to tilt towards a more positive outlook, however with substantial differences between geographical areas. AnticipatedUS presidential election and potential changes in US economic and monetary policy during 2013policies (i.e. expected further rate hikes) may have resulted inan impact not only on US dollar but also on a range of emerging market currencies. Both Brexit and the policies of the
78 Annual Report 2016
Risk management 5.3
new US administration may have significant negative impact on foreign currency rates in a number of emerging markets, highlighting fiscal problemsinternational trade tariffs and other economic vulnerabilities in these countries.customs laws. The disparate macroeconomic outlook for the main geographies, political conflicts and the potentialunknown impact of further changes in fiscal andEurozone monetary policy continuescontinue to providecreate uncertainty onas to the levels of (public) capital expenditures in general, unemployment levels and consumer and business confidence, which could adversely affect demand for products and services offered by Philips. Political developments, such as healthcare reformsThese economic conditions may have an adverse effect on financial markets, which could affect the ability of Philips to make strategic divestments at reasonable price levels or within a reasonable period of time.
The general global political environment remains unfavorable for the business environment due to a rise in various countries may impose additional uncertainties by redistributing sector spending, changing reimbursement modelspolitical conflicts and fiscal changes.
terrorism. Numerous other factors, such as the fluctuationsustained lower levels of energy and raw material prices, regional political conflicts in the Middle East, Turkey, Russia and Ukraine and other regions, as well as global political conflicts in North Africa, the Middle Eastlarge-scale (in)voluntary migration and other regions,profound social instability could continue to impact macroeconomic factors and the international capital and credit markets. The new US administration may implement changes in, among others, US foreign policy, healthcare, trade and tax laws, the impact of which cannot be predicted. Uncertainty on the timing and the nature of Brexit may adversely affect economic growth and the business environment in the United Kingdom and the rest of the European Union. Elections in a number of key European countries during 2017, which could trigger additional exits from the European Union, may have a similar adverse impact. Economic and political uncertainty may have a material adverse impact on Philips’ financial condition or results of operations and can also make it more difficult for Philips to budget and forecast accurately. Philips may encounter difficulty in planning and managing operations due to the lack of adequate infrastructure and unfavorable political factors, including unexpected legal or regulatory changes such as foreign exchange import or export controls, increased healthcare regulation, nationalization of assets or restrictions on the repatriation of returns from foreign investments.
Given that growth geographiesin emerging market countries is correlated to US and European economic growth and that such emerging market countries are becoming increasingly important in Philips’ operations, the above-mentioned risks are also expected to grow and could have a material adverse effect on Philips’ financial condition and operating results.
Philips’ overall risk profile will be changing as a result of the focus on Health Technology.
The risk profile of Philips may be unablewill change as and when Philips Lighting is sold and deconsolidated. The risk profile is expected to adapt swiftlyshift towards risks generally associated to changes in industry or market circumstances, which could have a material adverse impact on its financial condition and results.
Fundamental shifts in the industry, like the transition from traditional lighting to LED lighting, may drastically change the business environment. If Philips is unable to recognize these changes in good time, is late in adjusting its business models, or if circumstances arise such as pricing actions by competitors, then this could have a material adverse effect on Philips’ growth ambitions, financial condition and operating result.Health Technology companies.
Philips’ overall performance in the coming years is dependentexpected to depend on realizingthe realization of its growth ambitions in growth geographies.
Growth geographies are becoming increasingly important in the global market. In addition, Asia is an important production, sourcing and design center for Philips. Philips faces strong competition to attract the best talent in tight labor markets and intense competition from local companies as well as other global players for market share in growth geographies. Philips needs to maintain and grow its position in growth geographies, invest in data driven services, invest in local talents,talent, understand developments in end-userend- user preferences and localize the portfolio in order to stay competitive. If Philips fails to achieve this,these objectives, then this could have a material adverse effect on growth ambitions, financial condition and operating result.
The growth ambitions of Philips may be adversely affected by economic volatility inherent in growth geographies and the impact of changes in macroeconomic circumstances on growth economies.
Philips may not control joint ventures or associated companies in which it invests, which could limit the ability of Philips to identify and manage risks.
Philips has invested or willand may invest in joint ventures orand associated companies in which Philips will have anon-controlling interest. In these cases, , Philips has limited influence over, and limited or no control of, the governance, performance and cost of operations of joint ventures orand associated companies. Some of these joint ventures orand associated companies may represent significant investments.investments and potentially also use Philips’ brand. The joint ventures and associated companies that Philips does not control may make business, financial or investment decisions contrary to Philips’ interests or may make decisions different from those whichthat Philips itself may have made. Additionally, Philips partners or members of a joint venture or associated company may not be able to meet their financial or other obligations, which could
120 Annual Report 2013
6 Risk management 6.3 - 6.4
expose Philips to additional financial or other obligations, as well as havehaving a material adverse effect on the value of its investments in those entities or potentially subject Philips to additional claims. Lumileds and Philips Lighting are examples of companies in which Philips may continue to have a significant (residual) interest but may not have control.
Acquisitions could expose Philips to integration risks and challenge management in continuing to reduce the complexity of the company.
Philips’ acquisitions may continue to expose Philips in the future to integration risks in areas such as sales and service force integration, logistics, regulatory compliance, information technology and finance. Integration difficulties and complexity may adversely impact the
Annual Report 2016 79
Risk management 5.3
realization of an increased contribution from acquisitions. Philips may incur significant acquisition, administrative and other costs in connection with these transactions, including costs related to the integration of acquired businesses.
Furthermore, organizational simplification expected to be implemented following an acquisition and the resulting cost savings may be difficult to achieve. Acquisitions may also lead to a substantial increase in long-lived assets, including goodwill. Write-downs of these assets due to unforeseen business developments may have a material adverse effect on Philips’ earnings particularly in Healthcare and Lighting, which have significant amounts of goodwill (see alsonote 11, Goodwill)Goodwill).
Philips’ inability to secure and retainmaintain intellectual property rights for products, whilst maintaining overall competitiveness, could have a material adverse effect on its results.
Philips is dependent on its ability to obtain and retainmaintain licenses and other intellectual property (IP) rights covering its products and its design and manufacturing processes. The IP portfolio is the result of an extensive patenting process that could be influenced by a number of factors, including innovation. The value of the IP portfolio is dependent on the successful promotion and market acceptance of standards developed orco-developed by Philips. This is particularly applicable to Consumer LifestylePersonal Health where third-party licenses are important and a loss or impairment could have a material adverse impact on Philips’ financial condition and operating results.
Failure to delivercomply with quality standards and regulations can trigger warranty and product liability claims against Philips and can lead to financial losses and adversely impact Philips’ reputation, market share and brand.
Philips is required to comply with the highest standards of quality in the manufacture of its medical devices.
Philips hereto is subject to the supervision of various national regulatory authorities. Conditions imposed by such national regulatory authorities could result in product recalls or a temporary ban on products and/or production facilities. In addition such quality issues and/or liability claims could affect Philips’ reputation and its relationships with key customers (both customers for end products and customers that use Philips’ products in their production process). As a result, depending on the product and manufacturing site concerned and the severity of the objection, this could lead to financial losses through lost revenue and costs of any required remedial actions, and have further impacts on Philips’ reputation, market share and brand.
Philips has observed a global increase in IT security threats and higher levels of sophistication in computer crime, posing a risk to the confidentiality, availability and integrity of data and information.
The global increase in security threats and higher levels of professionalism in computer crime have increased the importance of effective IT security measures, including proper identity management processes to protect against unauthorized systems access.
Nevertheless, Philips’ systems, networks, products, solutions and services remain vulnerable to attacks, which could lead to the leakage of confidential information, improper use of its systems and networks or defective products, which could in turn have a material adverse effect on Philips’ financial condition and operating results. In recent years, the risks that we and other companies face from cyber-attacks have increased significantly. The objectives of these cyber- attacks vary widely and may include, among things, disruptions of operations including provision of services to customers or theft of intellectual property or other sensitive information belonging to us or other business partners. Successful cyber-attacks may result in substantial costs and other negative consequences, which may include, but are not limited to, lost revenues, reputational damage, remediation costs, and other liabilities to customers and partners. Furthermore, enhanced protection measures can involve significant costs. Although we have experienced cyber-attacks and to date have not incurred any significant damage as a result and did not incur significant monetary cost in taking corrective action, there can be no assurance that in the transformation programs.future Philips will be as successful in avoiding damages from cyber-attacks, which could lead to financial losses. Additionally, the integration of new companies and successful outsourcing of business processes are highly dependent on secure and well controlled IT systems.
Diversity in information technology (IT) could result in ineffective or inefficient business management. IT outsourcing andoff-shoring strategies could result in complexities in service delivery and contract management.
Philips continuously seeks to create a more open, standardized and cost-effective IT landscape, including through further outsourcing,off-shoring, commoditization and ongoing reduction in the number of IT systems. These changes create risk with regard to the delivery of IT services, the availability of IT systems and the scope and nature of the functionality offered by IT systems.
Transformation programs
In 2011, Philips startedbegan a very extensive transformation program (Accelerate!) designed to unlock Philips’ full potential. In 2014, as a next phase in the Accelerate! spanstransformation program, Philips announced its plan to sharpen its strategic focus by establishing two stand- alone companies focused on the HealthTech and Lighting opportunities respectively. The Lighting business was separated in 2016, with Philips selling a time periodportion of several years. its ownership stake and Philips Lighting becoming listed on the Amsterdam Stock Exchange.
80 Annual Report 2016
Risk management 5.4
Failure to achieve the objectives of theany transformation programsprogram may have a material adverse effect on the midmid- term and long termlong-term financial targets.
In addition, theany transformation program ofin relation to the Finance function may expose Philips to adverse changes in the quality of its systems of internal control.
If Philips is unable to ensure effective supply chain management, e.g. facing an interruption of its supply chain, including the inability of third parties to deliver parts, components and services on time, and if it is subject to rising raw material prices, it may be unable to sustain its competitiveness in its markets.
Philips is continuing the process of creating a leaner supply base with fewer suppliers, while maintaining dual/multiple sourcing strategies where possible. This strategy very much requires close cooperation with suppliers to enhance, among other things, time to market and quality. In addition, Philips is continuing its initiatives to replace internal capabilities with less costly outsourced products and services. These processes may result in increased dependency on external suppliers and providers. Although Philips works closely with its suppliers to avoid supply-related problems, there can be no assurance that it will not encounter supply problems in the future or that it will be able to replace a supplier that is not able to meet its demand sufficiently quickly to avoid disruptions.
Shortages or delays could materially harm its business. Most of Philips’ activities are conducted outside of the Netherlands, and international operations bring challenges. For example, Philips depends partly on the production and procurement of products and parts from Asian countries, and this constitutes a risk that production and shipping of products and parts could be interrupted by regional conflicts, a natural disaster or extreme weather events resulting from climate changes. A general shortage of materials, components or subcomponents as a result of natural disasters also poses the risk of unforeseeable fluctuations in prices and demand, which could have a material adverse effect on Philips’ financial condition and operating results.
Businesses purchase raw materials, includingso-called rare earth metals, copper, steel, aluminum, noble gases andoil-related products, which exposes them to fluctuations in energy and raw material prices. In recent times, commodities have been subject to volatile markets, and such volatility is expected to continue. If Philips is not able to compensate for increased costs or pass them on to customers, price increases could have a material adverse impact on Philips’ results. In contrast, in times of falling commodity prices, Philips may not fully benefit from such price decreases, since Philips attempts to reduce the risk of rising commodity prices by several means, including long-term contracting or physical and financial hedging.
Failure to achieve improvements in Philips’ solution and product creation process and/or increased speed ininnovation-to-market could hamper Philips’ profitable growth ambitions.
Further improvements in Philips’ solution and product creation process, ensuring timely delivery of new solutions and products at lower cost and upgrading ofimprovement in customer service levels to create sustainable competitive advantage,advantages, are important in realizing Philips’ profitable growth ambitions. The emergence of newlow-cost competitors, particularly in Asia, further underlines the importance of improvements in the product creation process. The success of new solution and product creation, however, depends on a number of factors, including timely and successful completion of development efforts, market acceptance, Philips’ ability to manage the risks associated with new products and productionramp-up issues, the ability of Philips to attract and retain employees with the appropriate skills, the availability of products in the right quantities and at appropriate costs to meet anticipated demand and the risk that new products and services may have quality or other defects in the early stages of introduction. Accordingly, Philips cannot determine in advance the ultimate effect that new solutions and product creations will have on its financial condition and operating results. If Philips fails to accelerate its innovation-to-market processescreate and commercialize products or fails to ensure that end-userend- user insights are fully captured and translated into solution and product creations that improve product mix and consequently contribution, it may face an erosion oflose its market share and competitiveness, which could have a material adverse effect on its financial condition and operating results.
Annual Report 2013 121
6 Risk management 6.4 - 6.4
If Philips is unable to ensure effective supply chain management, e.g. facing an interruption of its supply chain, including the inability of third parties to deliver parts, components and services on time, and if it is subject to rising raw material prices, it may be unable to sustain its competitiveness in its markets.
Philips is continuing the process of creating a leaner supply base with fewer suppliers, while maintaining dual sourcing strategies where possible. This strategy very much requires close cooperation with suppliers to enhance, amongst other things, time to market and quality. In addition, Philips is continuing its initiatives to reduce assets through outsourcing. These processes may result in increased dependency on external suppliers and providers. Although Philips works closely with its suppliers to avoid supply-related problems, there can be no assurance that it will not encounter supply problems in the future or that it will be able to replace a supplier that is not able to meet its demand. Shortages or delays could materially harm its business.
Most of Philips’ activities are conducted outside of the Netherlands, and international operations bring challenges. For example, production and procurement of products and parts in Asian countries are increasing, and this creates a risk that production and shipping of products and parts could be interrupted by a natural disaster, such as occurred in Japan in 2011. A general shortage of materials, components or subcomponents as a result of natural disasters also bears the risk of unforeseeable fluctuations in prices and demand, which could have a material adverse effect on its financial condition and operating results.
Sectors purchase raw materials including so-called rare earth metals, copper, steel, aluminum and oil, which exposes them to fluctuations in energy and raw material prices. In recent times, commodities have been subject to volatile markets, and such volatility is expected to continue. If we are not able to compensate for our increased costs or pass them on to customers, price increases could have a material adverse impact on Philips’ results. In contrast, in times of falling commodity prices, Philips may not fully profit from such price decreases as Philips attempts to reduce the risk of rising commodity prices by several means, such as long-term contracting or physical and financial hedging. In addition to the price pressure that Philips may face from our customers expecting to benefit from falling commodity prices or adverse market conditions, this could also adversely affect its financial condition and operating results.
Diversity in information technology (IT) could result in ineffective or inefficient business management. IT outsourcing and off-shoring strategies could result in complexities in service delivery and contract management.
Philips is engaged in a continuous drive to create a more open, standardized and consequently, more cost-effective IT landscape. This is leading to an approach involving further outsourcing, off-shoring, commoditization and ongoing reduction in the number of IT systems. This could introduce additional risk with regard to the delivery of IT services, the availability of IT systems and the scope and nature of the functionality offered by IT systems.
Philips observes a global increase in IT security threats and higher levels of sophistication in computer crime, posing a risk to the confidentiality, availability and integrity of data and information.
The global increase in security threats and higher levels of professionalism in computer crime have increased the importance of effective IT security measures, including proper identity management processes to protect against unauthorized systems access. Nevertheless, Philips’ systems, networks, products, solutions and services remain potentially vulnerable to attacks, which could potentially lead to the leakage of confidential information, improper use of its systems and networks or defective products, which could in turn materially adversely affect Philips’ financial condition and operating results. In recent years, the risks that we and other companies face from cyber-attacks have increased significantly. The objectives of these cyber-attacks vary widely and may include, among things, disruptions of operations including provision of services to customers or theft of intellectual property or other sensitive information belonging to us or other business partners. Successful cyber-attacks may result in substantial costs and other negative consequences, which may include, but are not limited to, lost revenues, reputational damage, remediation costs, and other liabilities to customers and partners. Furthermore, enhanced protection measures can involve significant costs. Although we have experienced cyber-attacks but to date have not incurred any significant damage as a result, there can be no assurance that in the future Philips will be as successful in avoiding damages from cyber-attacks. Additionally, the integration of new companies and successful outsourcing of business processes are highly dependent on secure and well controlled IT systems.
122 Annual Report 2013
6 Risk management 6.4 - 6.5
Due to the fact thatBecause Philips is dependent on its personnel for leadership and specialized skills, the loss of its ability to attract and retain such personnel would have an adverse effect on its business.
The attraction and retention of talented employees in sales and marketing, research and development, finance and general management, as well as of highly specialized technical personnel, especially in transferring technologies tolow-cost countries, is critical to Philips’ success. This issuccess particularly valid in times of economic recovery. The loss of specialized skills could also result in business interruptions. There can be no assurance that Philips will continue to be successful in attracting and retaining all the highly qualified employees and key personnel needed in the future.
Warranty and product liability claims against Philips could cause Philips to incur significant costs and affect Philips’ results as well as its reputation and relationships with key customers.Risk of unauthorized use of intellectual property rights
Philips produces and sells products and services which incorporate technology protected by intellectual property rights. Philips develops and acquires intellectual property rights on a regular basis. Philips is from timeexposed to time subjectthe risk that a third party may claim to warrantyown the intellectual property rights on technology applied in Philips products and product liabilityservices and that in the event
Annual Report 2016 81
Risk management 5.4
that their claims with regardof infringement of these intellectual property rights are successful, they may be entitled to product performancedamages and effects. Philips could incur product liability losses as a result of repair and replacement costs in response to customer complaints or in connection with the resolution of contemplated or actual legal proceedings relating to such claims. In addition to potential losses arising from claims and related legal proceedings, product liability claims could affect Philips’ reputation and its relationships with key customers (both customers for end products and customers that use Philips’ products in their production process). As a result, product liability claims could materially impact Philips’ financial condition and operating results.fine.
Any damage to Philips’ reputation could have an adverse effect on its businesses.businesses and brand.
Philips is exposed to developments which could affect its reputation. Such developments could be of an environmental or social nature, or connected to the behavior of individual employees or suppliers, andor could relate to adherence to regulations related to labor, health and safety, environmental and chemical management. Reputational damage could materially impact Philips’ brand value, financial condition and operating results.
Philips is exposed tonon-compliance with product safety laws and data privacy.
Philips’ brand image and reputation would be adversely impacted bynon-compliance with various product safety laws and data protection. In light of Philips’ digital strategy, data privacy laws are increasingly important. Also, Diagnosis & Treatment and Connected Care & Health Informatics are subject to various (patient) data protection and safety laws. In Diagnosis & Treatment and Connected Care & Health Informatics, privacy and product safety and security issues may arise, especially with respect to remote access or monitoring of patient data or loss of data on our customers’ systems. Philips is exposed to the risk that its products, including components or materials procured from suppliers, may prove to be not compliant with safety laws, e.g. chemical safety regulations. Suchnon-compliance could result in a ban on the sale or use of these products.
Philips operates in a highly regulated product safety and quality environment. Philips’ products are subject to regulation by various government agencies, including the FDA (US) and comparable foreign agencies. Obtaining their approval is costly and time consuming, but a prerequisite for introducing products in the market. A delay or inability to obtain the necessary regulatory approvals for new products could have a material adverse effect on business. The risk exists that product safety incidents or user concerns could trigger FDA business reviews which, if failed, could lead to business interruption which in turn could adversely affect Philips’ financial condition and operating results. For example the voluntary suspension in 2014 of new production at our Healthcare facility in Cleveland, Ohio targeted to further strengthen manufacturing process controls after certain issues in this area were identified during an ongoing FDA inspection.
Philips’ global presence exposes the company to regional and local regulatory rules, changes to which may affect the realization of business opportunities and investments in the countries in which Philips operates.
Philips has established subsidiaries in over 80 countries. These subsidiaries are exposed to changes in governmental regulations and unfavorable political developments, which may affect the realization of business opportunities or impair Philips’ local investments. Philips’ increased focus on the healthcare sector increases its exposure to highly regulated markets, where obtaining clearances or approvals for new products is of great importance, and where there is a dependency on the available funding for healthcare systems. In addition, changes in government reimbursement policies may affect spending on healthcare.
Philips is exposed to governmental investigations and legal proceedings with regard to possible anti- competitive market practices.
National and European authorities are increasingly focused on possible anti-competitive market practices. Philips’ financial position and results could be materially affected by an adverse final outcome of governmental investigations and litigation, as well as any potential related claims.
Legal proceedings covering a range of matters are pending in various jurisdictions against Philips and its current and former group companies. Due to the uncertainty inherent in legal proceedings, it is difficult to predict the final outcome.
Philips, including a certain number of its current and former group companies, is involved in legal proceedings relating to such matters as competition issues, commercial transactions, product liability, participations and environmental pollution. Since the ultimate outcome of asserted claims and proceedings, or the impact of any claims that may be asserted in the future, cannot be predicted with certainty, Philips’ financial position and results of operations could be affected materially by adverse outcomes.
Please refer tonote 26,25, Contingent assets and liabilities, for additional disclosure relating to specific legal proceedings.
Philips is exposed to governmental investigationsnon-compliance with business conduct rules and legal proceedings with regard to possible anti-competitive market practices.regulations.
Philips is facing increased scrutiny by national and European authorities of possible anti-competitive market practices. For example, Philips is one of the companies that were inspected by officials of the European Commission in December 2013. The European Commission is looking into potential restrictions on online sales of consumer electronic products and small domestic appliances. Philips is fully cooperating with the European Commission. Philips’ financial position and results could be materially affected by an adverse final outcome of governmental investigations and litigation, as well as any potential related claims.
Philips’ global presence exposes the company to regional and local regulatory rules, changes to which may affect the realization of business opportunities and investments in the countries in which Philips operates.
Philips has established subsidiaries in over 80 countries. These subsidiaries are exposed to changes in governmental regulations and unfavorable political developments, which may affect the realization of business opportunities or impair Philips’ local investments. Philips’ increased focus on the healthcare sector increases its exposure to highly regulated markets, where obtaining clearances or approvals for new products is of great importance, and where there is
Annual Report 2013 123
6 Risk management 6.5 - 6.5
a dependency on the available funding for healthcare systems. In addition, changes in reimbursement policies may affect spending on healthcare.
Philips is exposed to non-compliance with General Business Principles.
Philips’ attempts to realize its growth ambitions could expose it to the risk ofnon-compliance with the Philips General Business Principles,business conduct rules and regulations, such as anti-bribery provisions. This risk is heightened in growth geographies as the legal and regulatory environment is less developed in growth geographies compared to mature geographies. Examples include commission payments to third parties, remuneration payments to
82 Annual Report 2016
Risk management 5.5
agents, distributors, consultants and the like, and the acceptance of gifts, which may be considered in some markets to be normal local business practice.practice (See alsonote 26,25, Contingent assets and liabilities.liabilities).
Defective internal controls would adversely affect our financial reporting and management process.
The reliability of reporting is important in ensuring that management decisions for steering the businesses and managing bothtop-line and bottom-line growth are based on top-qualityreliable data. Flaws in internal control systems could adversely affect the financial position and results and hamper expected growth.
The correctness ofAccurate disclosures providesprovide investors and other market professionals with significant information for a better understanding of Philips’ businesses.
Imperfections or lack of clarity in the disclosures could create market uncertainty regarding the reliability of the data presented and could have a negative impact on the Philips share price.
The reliability of revenue and expenditure data is key for steering the business and for managingtop-line and bottom-line growth. The long lifecycle of healthcare sales, from order acceptance to accepted installation, together with the complexity of the accounting rules for when revenue can be recognized in the accounts, presents a challenge in terms of ensuring there is consistency of application of the accounting rules throughout Philips Healthcare’sPhilips’ global business.
Philips is exposed to non-compliance with data privacyuncertainty on the timing and product safety laws.
Philips’ brand image and reputation would be adversely impacted by non-compliance with various data protection and product security laws. In lightproceeds of a sale of Philips digital strategy, data privacy lawsLighting
In 2016, Philips separated its Lighting business and on May 27, 2016, Philips Lighting was listed on the Amsterdam Stock Exchange. Since then Philips Lighting operates as a separate listed company. Philips has subsequently sold down part of its ownership in Philips Lighting. Philips’ overall objective is to fully divest its ownership of Philips Lighting. The nature or form, timing and the level of proceeds from this divestment process are increasingly important. Also,uncertain. The timing and level of proceeds will depend on general market conditions and investor appetite for companies of this size and nature. During this process Philips Healthcare is subject to various (patient) data protectionmay lose control over Philips Lighting and safety laws. Indeconsolidate the assets, liabilities and financial results of Philips Healthcare, privacy and product safety and security issues may arise, especially with respect to remote access or monitoring of patient data or loss of data on our customers’ systems.
Philips operates in a highly regulated product safety and quality environment. Philips’ products are subject to regulation by various government agencies, including the FDA (US) and comparable foreign agencies. Obtaining their approval is costly and time consuming, but a prerequisite for market introduction. A delay or inability to obtain the necessary regulatory approvals for new products could have a material adverse effect on business. The risk exists that product safety incidents or user concerns could trigger FDA business reviews which, if failed, could lead to business interruption which in turn could adversely affect Philips’ financial condition and operating results. E.g. the voluntary, temporary suspension of new production at our Healthcare facility in Cleveland, Ohio targets to further strengthen manufacturing process controls after certain issues in this area were identified during an ongoing FDA inspection.
124 Annual Report 2013
6 Risk management 6.6 - 6.6
Philips is exposed to a variety of treasury risks and other financial risks including liquidity risk, currency risk, interest rate risk, commodity price risk, credit risk, country risk and other insurable risk.
Negative developments impacting the liquidity of global liquiditycapital markets could affect the ability of Philips to raise orre-finance debt in the capital markets or could lead to significant increases in the cost of such borrowing in the future. If the markets expect a downgrade or downgrades by the rating agencies or if such a downgrade has actually taken place, itthis could increase the cost of borrowing, reduce our potential investor base and adversely affect our business.
Philips isoperates in over 100 countries and its earnings and equity are therefore inevitably exposed to fluctuations in exchange rates especially betweenof foreign currencies against the euro. Philips’ sales are sensitive in particular to movements in the US dollar, Japanese yen and the euro. A high percentage of its business volume is conducted in the US but based on exports from Europe, whilst, a considerable amount of US dollar—denominated imports is also sold in Europe. A weakening of the US dollar versus the euro would have an adverse effect on reported earnings of the company. In addition, Philips is exposed to the fluctuation in exchange rateswide range of other currencies from developed and emerging markets. Philips’ sourcing and manufacturing spend is concentrated in the Eurozone, United States and China. Income from operations is sensitive to movements in currencies from countries where the Group has no manufacturing/sourcing activities or only has manufacturing/sourcing activities on a small scale such as the Japanese yenJapan, Canada, Australia and currenciesGreat Britain and in a range of growth geographiesemerging markets such as China,Russia, Korea, Indonesia, India and Brazil.
The credit risk of financial andnon-financial counterparties with outstanding payment obligations creates exposures for Philips, particularly in relation to accounts receivable with customers and liquid assets and fair values of derivatives and insurance receivables contracts with financial counterparties. A default by counterparties in such transactions can have a material adverse effect on Philips’ financial condition and operating results.
Philips’ supply chain is exposed to fluctuations in energy and raw material prices. Commodities such as oil are subject to volatile markets and significant price increases from time to time. If Philips is not able to compensate for, or pass on in good time, its increased costs to customers, such price increases could have an adverse impact on its financial condition and operating results.
Philips is exposed to interest rate risk, particularly in relation to its long-term debt position; this risk can take the form of either fair value or cash flow risk. Failure to effectively hedge this risk can impact Philips’ financial condition and operating results.
For further analysis, please refer tonote 35,30, Details of treasury / other financial risks.risks.
Philips is exposed to a number of different fiscaltax uncertainties, which could have a significant impact on local tax results.financial impact.
Philips is exposed to a number of different tax uncertainties, which could result in double taxation, penalties and interest payments. These include transfer pricing uncertainties on internal cross-border deliveries of goods and services, tax uncertainties related to acquisitions and divestments, tax uncertainties related to the use of tax credits and permanent establishments, tax uncertainties duerelating to losses carried forwardtax loss and tax credits carried forward and potential changes in tax law that could result in higher tax expenseexpenses and payments. Those The
Annual Report 2016 83
Risk management 5.6
uncertainties may have a significant impact on local financial tax results which in turn could adversely affect Philips’ financial condition and operating results.
The value of the tax losses carried forward is subject to havingavailability of sufficient taxable income available within the loss-carried-forwardtax loss-carry-forward period, but also to havingavailability of sufficient taxable income within the foreseeable future in the case of tax losses carried forward with an indefinite carry-forward period. The ultimate realization of the Company’s deferred tax assets, including tax losses and tax credits carried forward, is dependent upon the generation of future taxable income in the countries where the temporary differences, unused tax losses and unused tax credits were incurred and during theon periods induring which the deferred tax assets become deductible. Additionally, in certain instances, realization of such deferred tax assets is dependent upon the successful execution of tax planning strategies. Accordingly, there can be no absolute assurance that all (net) tax losses and credits carried forward will be realized.
For further details, please refer to the fiscaltax risks paragraph innote 5,8, Income taxes.taxes.
Philips has defined-benefit pension plans and other post-retirement plans in a number of countries. The funded status and the cost of maintaining these plans are influenced by movements in financial market and demographic developments, creating volatility in Philips’ financials.
A significant proportion of (former) employees in Europe and North and Latin America is covered by defined-benefit pension plans and other post- retirement plans. The accounting for defined-benefit pensionsuch plans requires management to make estimates on assumptions such as discount rates, inflation, longevity, expected cost of medical care and expected rates of compensation. Movements (e.g. due to the movements of financial markets) in these assumptions
Annual Report 2013 125
6 Risk management 6.6 - 6.6
can have a significant impact on the Defined Benefit Obligation and pensionnet interest cost. A negative performance of the financial markets could have a material impact on cash funding requirements and pension costsnet interest cost and also affect the value of certain financial assets and liabilities of the company.
For further details, please see note 30, Post-employment benefitsPhilips is exposed to uncertainty on the timing and note 36, Subsequent events.proceeds of the sale of Lumileds.
On January 22, 2016, Philips announced the termination of its agreement with GO Scale Capital to sell a stake of 80.1% in Lumileds due to the inability to mitigate regulatory concerns in the US. Philips subsequently engaged with other parties and on December 12, 2016, Philips announced that it had signed an agreement to sell an 80.1% interest in Lumileds to certain funds managed by affiliates of Apollo Global Management, LLC. Subject to regulatory approvals and completion of other closing obligations Philips expects to receive cash proceeds, before tax and transaction-related costs, of approximately USD 1.5 billion and participating preferred equity. As part of the agreement, Philips will retain a 19.9% interest in the equity of Lumileds by means of common shares for a minimum period of three years following completion of the transaction, subject to the customary drag-along andtag-along conditions or an IPO. There are no voting rights associated with the participating preferred equity held by Philips.
Philips is exposed to a number of reporting risks.
A risk rating is assigned for each risk identified, based on the likelihood of occurrence and the potential impact of the risk on the financial statements and related disclosures. In determining the probability that a risk will result in a misstatement of a more than inconsequential amount or of a material nature, the following factors are considered to be critical: complexity of the associated accounting activity or transaction process, history of accounting and reporting errors, likelihood of significant (contingent) liabilities arising from activities, exposure to losses, existence of a related party transaction, volume of activity and homogeneity of the individual transactions processed, and changes toin accounting characteristics in the prior period in accounting characteristics compared to the previous period.period before that.
ImportantFor important critical reporting risk areas identified within Philips followingwe refer to the “Use of estimates” section innote 1, Significant accounting policies, as the Company assessed that reporting risk assessment are:is closely related to the use of estimates and application of judgment.
complex accounting for sales-related accruals, warranty provisions, tax assets and liabilities, pension benefits, and business combinations
complex sales transactions relating to multi-element deliveries (combination of goods and services)
valuation procedures with respect to assets (including goodwill and inventories)
significant (contingent) liabilities such as environmental claims and other litigation
outsourcing of high volume/homogeneous transactional finance and IT operations to third-party service providers
employee post-retirement benefits (as described separately)
12684 Annual Report 20132016
7 Management 7 - 76
Koninklijke Philips N.V. is managed by an Executive Committee which comprises the members of the Board of Management and certain key officers from functions, businesses and markets.
The Executive Committee operates under the chairmanship of the Chief Executive Officer and shares responsibility for the deployment of Philips’ strategy and policies, and the achievement of its objectives and results.
Under Dutch Law, the Board of Management is accountable for the actions and decisions of the Executive Committee and has ultimate responsibility for the management and external reporting of Koninklijke Philips N.V. and is answerable to shareholders at the Annual General Meeting of Shareholders. Pursuant to thetwo-tier corporate structure, the Board of Management is accountable for its performance to a separate and independent Supervisory Board.
The Rules of Procedure of the Board of Management and Executive Committee are published on the Company’s website ((www.philips.com/investor)investor).
Corporate governance
A full description of the Company’s corporate governance structure is published inchapter 10,9, Corporate governance, of this report.
Frans van Houten
President/Born 1960, Dutch
Chief Executive Officer (CEO)
Chairman of the Board of Management since April 2011
Corporate responsibilities:Responsibilities: Chairman of the Executive Committee, InternalBusiness
Transformation, Internal Audit, Information Technology, Supply Management, Marketing &Quality and Regulatory, Participations
Communication, Accelerate! - Overall transformation, End2EndFor a full résumé, clickhere
Abhijit Bhattacharya
Born 1960, Dutch
Eric Coutinho
Executive Vice President, General Secretary & Chief Legal Officer
Corporate responsibilities: Legal, General Business Principles
Born 1951, Dutch
Ronald de Jong1961, Indian
Executive Vice President & Chief Market Leader
Corporate responsibilities: Markets, Areas & Countries (except Greater
China), Accelerate! - Customer Centricity
Born 1967, Dutch
Pieter Nota
Executive Vice President & Chief Executive Officer of Philips Consumer Lifestyle
Member of the Board of Management since April 2011
Corporate responsibilities: Sector Consumer Lifestyle, Accelerate! -
Resource to Win
Born 1964, Dutch
Carole Wainaina
Executive Vice President & Chief Human Resources Officer
Corporate responsibilities: Human Resource Management, Accelerate! -
Culture and change management
Born 1966, Kenyan
Jim Andrew
Executive Vice President & Chief Strategy and Innovation Officer
Corporate responsibilities: Strategy, Innovation, Design, Sustainability
Born 1962, American
Deborah DiSanzo
Executive Vice President & Chief Executive Officer of Philips Healthcare
Corporate responsibilities: Sector Healthcare
Born 1960, American
Patrick Kung
Executive Vice President & Chief Executive Officer Philips Greater China
Corporate responsibilities: Philips Greater China
Born 1951, American
Eric Rondolat
Executive Vice President & Chief Executive Officer Philips Lighting
Corporate responsibilities: Sector Lighting
Born 1966, Italian/French
Ron Wirahadiraksa
Executive Vice President & Chief Financial Officer (CFO)
Member of the Board of Management since April 2011December 2015
Corporate responsibilities:Responsibilities: Finance, Capital structure, Mergers & Acquisitions, Accelerate! -
Operating ModelInvestor Relations, Information Technology, Global Business Services, Participations
For a full résumé, clickhere
Sophie Bechu
Born 1960, French/American
Executive Vice President
Responsibilities: Chief of Operations, Order to Cash Excellence,
Procurement, Global Services, Quality and Regulatory
For a full résumé, clickhere
Jean Botti 1)
Born 1957, French
Executive Vice President
Responsibilities: Chief Innovation and Strategy officer, Innovation,
Strategy & Alliances, Design, Intellectual Property, Sustainability,
Medical Affairs,Innovation-to-Market Excellence
Rob Cascella
Born 1954, American
Executive Vice President
Responsibilities: Diagnosis & Treatment Businesses
For a full résumé, clickhere
Marnix van Ginneken
Born 1973, Dutch/American
Executive Vice President
Responsibilities: Chief Legal Officer, General Secretary, Compliance
For a full résumé, clickhere
Denise Haylor 2)
Born 1964, English/American
Executive Vice President
Responsibilities: Chief Human Resources Officer, Culture
For a full résumé, clickhere
Andy Ho
Born 1961, Chinese
Executive Vice President
Responsibilities: Greater China Market
For a full résumé, clickhere
Ronald de Jong 3)
Born 1967, Dutch
Executive Vice President
Responsibilities: Global Markets (all except Greater China & North
America), Government Affairs,Market-to-Order Excellence
For a full résumé, clickhere
Pieter Nota
Born 1964, Dutch
Executive Vice President
Member of the Board of Management since April 2011
Responsibilities: Personal Health Businesses; Chief Marketing Officer
For a full résumé, clickhere
Brent Shafer
Born 1957, American
Executive Vice President
Responsibilities: North American Market
For a full résumé, clickhere
Jeroen Tas 4)
Born 1959, Dutch
Executive Vice President
Responsibilities: Connected Care & Health Informatics Businesses
For a full résumé, clickhere
| 1) | Left Philips in February 2017 and was succeeded by Jeroen Tas. |
| 2) | Will leave Philips in March 2017 and will be succeeded by Ronald de Jong. |
| 3) | Will take the role of Chief Human Resources Officer in April 2017. |
| 4) | Took the role of Chief Strategy & Innovation Officer in February 2017 and was succeeded by Carla Kriwet. |
Annual Report 2013 1272016 85
7 Management 7 - 7
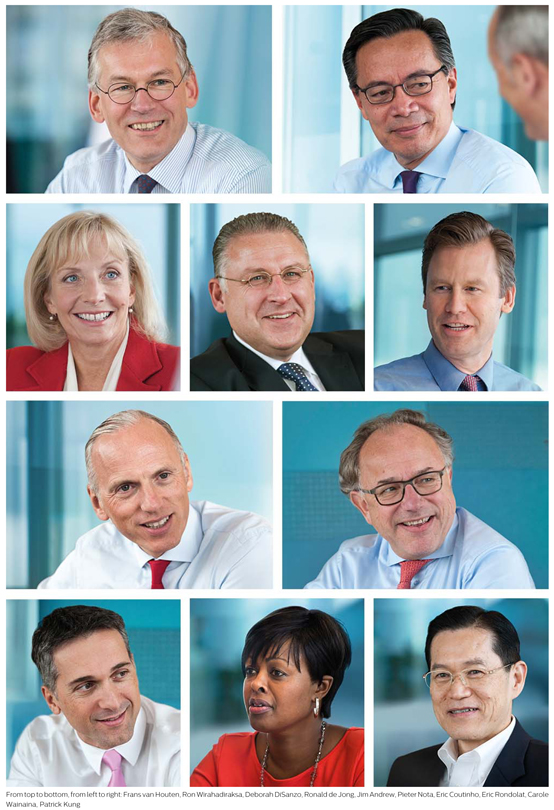
128 Annual Report 2013
8 Supervisory Board 8 - 87
The Supervisory Board supervises the policies of the executive management and the general course of affairs of Koninklijke Philips N.V. and advises the executive management thereon. The Supervisory Board, in thetwo-tier corporate structure under Dutch law, is a separate and independent corporate body.
The Rules of Procedure of the Supervisory Board are published on the Company’s website. For details on the activities of the Supervisory Board, see chapter 9,chapter 8, Supervisory Board report, of this report andsection 10.2,9.2, Supervisory Board, of this report.
Jeroen van der Veer
Born 1947, Dutch2),3)
Chairman
Chairman of the Corporate Governance and Nomination & Selection Committee
Member of the Supervisory Board since 2009; second term expires in 2017
Former Chief Executive and Non-executive Director of Royal Dutch Shell and currently Chairman of the Supervisory Board of ING Group. Member of the Supervisory Board of Concertgebouw N.V., Royal Boskalis Westminster N.V. and Statoil ASA. Also a senior advisor to Mazarine B.V.
Neelam Dhawan
Born 1947, Dutch** ***
Kees van Lede1959, Indian1)
Member of the Supervisory Board since 2003; third2012; second term expires in 20152020
Former Chairman of the Board of Management of Akzo NobelCurrently Vice President - Asia Pacific & Japan - Global Industries and currently Chairman of the Supervisory Board of Royal Imtech N.V. Member of the Supervisory Boards of AirFrance/KLM, Air Liquide and Senior Advisor JP Morgan Plc.Strategic Alliances Hewlett Packard Enterprise.
Orit Gadiesh
Born 1942, Dutch*
Heino von Prondzynski1951, Israeli/American1)
Member of the Supervisory Board since 2007;2014; first term expires in 2018
Currently Chairman of Bain & Company and Member of the Foundation Board of the World Economic Forum (WEF). Also serves on the Supervisory Board of Renova AG and is a member of the United States Council of Foreign Relations.
Christine Poon
Born 1952, American2),3),4)
Vice-chairman and Secretary
Chairman of the Quality & Regulatory Committee Member of the Supervisory Board since 2009; second term expires in 20152017
FormerVice-Chairman of Johnson & Johnson’s Board of Directors and Worldwide Chairman of the Pharmaceuticals Group and former dean of Ohio State University’s Fisher College of Business. Currently member of the Board of Directors of Prudential and Regeneron and Sherwin Williams.
Heino von Prondzynski
Born 1949, German/Swiss2),3),4)
Chairman of the Remuneration Committee Member of the Supervisory Board since 2007; third term expires in 2019
Former member of the Corporate Executive Committee of the F.Hofmann-La Roche Group and former CEO of Roche Diagnostics, currentlyDiagnostics. Currently Chairman of the Supervisory Board of Epigenomics AG, member of the Supervisory Board of HTL Strefa and Epigenomics AG. Lead Director of Quotient Ltd.
David Pyott
Born 1953, British1),4)
Member of the Supervisory Board since 2015; first term expires in 2019
Former Chairman and Chief Executive Officer of Hospira
Born 1949, German*Allergan, Inc. (since 2001 and 1998, respectively, until 2015). Currently Director of Avery Dennison Corporation and its Lead Independent Director (since 1999 and 2010, respectively). Member of the Board of Directors of Alnylam Pharmaceuticals Inc., of BioMarin Pharmaceutical Inc. and ofprivately-held Rani Therapeutics, an InCube Labs company. Also member of the Governing Board of the London Business School, President of the International Council of Ophthalmology Foundation and member of the Advisory Board of the Foundation of the American Academy of Ophthalmology.
Jackson Tai
Born 1950, American1),4)
Chairman of Audit Committee
Member of the Supervisory Board since 2011; firstsecond term expires in 20152019
Former Vice-Chairman and CEO of DBS Group and DBS Bank Ltd and former Managing Director at J.P. Morgan &Co. Incorporated. Currently a member of the Supervisory Boards of The BankDirectors of China Limited, Singapore Airlines, MasterCard Incorporated and Eli Lilly and Company.Company HSBC Holdings PLC and MasterCard. AlsoNon-Executive Director ofprivately-held Russell Reynolds Associates and of Vapor Stream
Born 1950, American*
James Schiro
Vice-Chairman and Secretary; Chairman of the Remuneration Committee
Member of the Supervisory Board since 2005; third term expires in 2017
Former CEO of Zurich Financial Services and Chairman of the Group ManagementCanada Pension Plan Investment Board. Also serves on various boards of private and listed companies including Goldman Sachs as Lead Director and member of the audit committee, PepsiCo as member of the Supervisory Board and Reva Medical as member of the Supervisory Board. Senior Advisor CVC Capital Partners Ltd.
Born 1946, American** ***
Ewald Kist
Member of the Supervisory Board since 2004; third term expires in 2016
Former Chairman of the Executive Board of ING Group and currently member of the Supervisory Boards of DSM, Moody’s Investor Service and Stage Entertainment
Born 1944, Dutch**
Christine Poon
Member of the Supervisory Board since 2009; second term expires in 2017
Former Vice-Chairman of Johnson & Johnson’s Board of Directors and Worldwide Chairman of the Pharmaceuticals Group. Currently dean of Ohio State University’s Fisher College of Business and member of the Board of Directors of Prudential and Regeneron
Born 1952, American** ***
Neelam Dhawan
Member of the Supervisory Board since 2012; first term expires in 2016
Currently Managing Director of Hewlett-Packard India
Born 1959, Indian*
member of the Audit Committee |
member of the Remuneration Committee |
member of the Corporate Governance and Nomination & Selection Committee |
| 4) | member of the Quality & Regulatory Committee |
86 Annual Report 2013 1292016
8 Supervisory Board 8 - 8

130 Annual Report 2013
9 Supervisory Board report 9 - 98
Introduction
We as members of the Supervisory Board are fully committed to our role and responsibility in respect of the proper functioning of the corporate governance of Philips. The Supervisory Board supervises and advises the Board of Management and Executive Committee in performing their management tasks and setting the direction of the business of the Philips group.Group. The Supervisory Board acts, and we as individual members of the Board act, in the interests of Koninklijke Philips N.V., its business and all its stakeholders. This report includes a more specific description of the Supervisory Board’s activities during the financial year 20132016 and other relevant information on its functioning.
Activities of the Supervisory Board
The full scope and details of the discussions within the Supervisory Board are confidential, (inter alia) given the business sensitive nature of the matters discussed. Nevertheless, the overview below indicates a number of matters that we reviewed and/or discussed during meetings throughout 2013:2016:
Philips’The performance of the Philips Group and its underlying businesses and financial headroomheadroom;
Philips’ strategyThe strategic options for Philips Lighting, including a proposed sale and, as pursued and completed in May 2016, the new mid-term targets that were announced during the Capital Markets Dayinitial public offering of shares in September 2013. In particular, thePhilips Lighting. The Supervisory Board focused onalso reviewed potential scenarios for the natureenvisaged sell-down of the Group,remaining stake in Philips Lighting;
The strategic priorities for Philips to improve business performance and capture higher growth in the portfolio of approximately 40 businesses across various strategic domains, the company’s geographic footprint and the roadmap to unlock the company’s full potential over the coming years with emphasis on the Philips Business Systemhealth technology market;
Philips’ annual management commitment and annual operating plan for 20132017;
The review ofCapital allocation, including the integration of large acquisitionsM&A framework, the dividend policy and the share buyback program (which was completed in October 2016);
The changeQuality and regulatory systems and processes, including the remedial efforts in (the funding of)Cleveland and other sites. Please also refer to the pension obligationsdescription of the activities of the Quality & Regulatory Committee given later in the Netherlandsthis Supervisory Board report;
Philips’ progression towards becoming a more digital companySignificant mergers, acquisitions and divestments, including the announcement (in December 2016) of the agreement to sell an 80.1% interest in the combined Lumileds and Automotive business to certain funds managed by affiliates of Apollo Global Management, LLC; which transaction is expected to be completed in the first half 2017 (subject to customary closing conditions);
The enterprisePhilips brand, including the brand performance, brand strategy, communication strategy and engagement strategy;
Enterprise risk management, (whichwhich included thean annual risk assessment and discussion of the changing nature of the risks faced by Philips and the possible impact of such risks). For instance, the Supervisory Board discussedrisks. Such risks included the impact of changing macro-economicnegative market conditions, and the risks posed bydisruptive competition, information security (including product security), ineffective transition to new business models and quality & regulatorynon-compliance;
QualityChanges in the composition of the Executive Committee;
Significant civil litigation claims and regulatory matters,public investigations against or into Philips; and
The divestmentA review of the Audio, Video, MultimediaPhilips’ new five-year sustainability program that will run throughout 2016-2020, and Accessories business (including the termination of the Funai agreement).includes targets for Philips’ solutions, operations and supply chain.
The Supervisory Board conducted so-called “deep dives” on a range of topics such as:including:
Long-term strategic partnerships, covering the strategyinternal governance, risk dynamics and profitability of Consumer Lifestyle; the operationslong-term strategic partnerships; and
Strategic priorities of the Lighting SectorPhilips in North Americahealth technology, including definitive diagnosis and reviews of the company’s activities in Latin America.guided therapy.
The Supervisory Board also conducted a number of reviews of the company’s operations in markets, including in China, Middle-East and Turkey, and Africa. Moreover, the North American Market (including the activities of the Sectors and key functions in that geography) was discussed by the Supervisory Board and we provided feedback on the new brand identity, which was launched in November 2013. Additionally, we received updates on sustainability and the share buy-back program and the impact of currency headwinds.
On multiple occasions, we were briefed on the various aspects of the Accelerate! program, This included the transformation of the Finance and IT functions and also the progress made in transforming the culture within Philips and simplifying its operating model.
The Supervisory Board also reviewed Philips’ annual and interim financial statements, including non-financial information, prior to publication thereof.
Supervisory Board meetings and attendance
In 2013,2016, the Supervisory Board convened for seveneight regular meetings and two extraordinary meetings. Moreover, we collectively and individually interacted with members of the Executive Committee and with senior management outside the formal Supervisory Board meetings. The Chairman of the Supervisory Board and the CEO met regularly for bilateral discussions about the progress of the companyCompany on a variety of matters. The Supervisory Board also held bilateral meetings with several members of the Executive Committee to discuss a variety of topics.
The Supervisory Board meetings were well attended in 2013.2016. The attendance percentage of thelevel at these meetings - including the committee meetings - was again high (in excess of 95%). The Supervisory Board visited the Company’s site in Cambridge, the United States, and toured its Innovation Labs, to view demonstrations of its innovations in the health technology market and meet with employees. The Supervisory Board also visited the Company’s Research & Design facility in Eindhoven, the Netherlands, and met with researchers. The committees of the Supervisory Board also convened regularly (see the separate reports of the committees below) and all of the committees regularly reported back on their activities to the full Supervisory
Annual Report 2013 131
9 Supervisory Board. In addition to the formal meetings of the Board report 9 - 9
Board.and its Committees, the Board members also held private meetings. We, as members of the Board devoted
Annual Report 2016 87
Supervisory Board report 8
sufficient time to engage (proactively if the circumstances so required) in our supervisory responsibilities.
Composition, diversity and self-evaluation by the Supervisory Board
The Supervisory Board is a separate corporate body that is independent of the Board of Management (and the Executive Committee). Its independence is also reflected in the requirement that membersa member of the Supervisory Board can neithercannot be a member of the Board of Management, a member of the Executive Committee noror an employee of Philips. The Supervisory Board furthermore considers all its members to be independent pursuant to the Dutch Corporate Governance Code. We will continue to pay close attention to applicable independence criteria.
The Supervisory Board currently consists of eightseven members.
In 2016, there were a number of changes to the membership of the Board. The term of appointment of Ewald Kist expired at the end of the Annual General Meeting held on 12 May 2016, after he had served three consecutive terms on the Board. We are grateful to Ewald for his years of service, which included him being Chairman of the Audit Committee, and for his dedication and the wisdom that he brought to the Supervisory Board’s discussions and decisions. As of 31 May 2016, Kees van Lede resigned from the Supervisory Board of Philips to become a Supervisory Board member of Philips Lighting. Kees joined our Board in 2003 and served as member of the Audit Committee and as Chairman to the Remuneration Committee and the Separation Committee. We would like to thank Kees for his valuable contributions as a member of the Supervisory Board.
In 2016, Neelam Dhawan was reappointed as a member of the Supervisory Board.
The agenda for the upcoming 20142017 Annual General Meeting of Shareholders includes the proposalwill include proposals to appoint Ms. Orit Gadieshreappoint Jeroen van der Veer and Christine Poon as an additional member tomembers of the Supervisory Board, bringing the total to nine members.each for an additional term of four years.
The profile of the Supervisory Board aims for an appropriate combination of knowledge and experience among its members, encompassing marketing, manufacturing, technology, financial, economic, social, quality & regulatory and legal aspects of international business, government and public administration in relation to the global and multi-productmulti- product character of Philips’ businesses. The Supervisory Board paysattaches great value to diversity in its composition. More particularspecifically, it aims for havingto have members with anboth European and a non- European backgroundnon-European backgrounds (nationality, working experience or otherwise) and one or more members withwho have held an executive or similar position in business or society no longer than five years ago.society.
In addition, we support the Philips’ policy to appoint a well-balanced mix of women and men to its Board of Management, Executive Committee and Supervisory Board. New Dutch legislation, effective per January 1, 2013, requires companies to pursue aBoard, including the policy of having at least 30% of the seats on the Board of Management and the Supervisory Board held by women and at least 30% of the seats held by men.
We believe we are making good progress in implementing this policy. The appointment of Orit Gadiesh, as currently proposed to the General Meeting of Shareholders, will bring Currently, the Supervisory Board’s gender diversity is within the statutorythese criteria. There were no other vacancies to fulfil in 2013. In addition, weWe note that there may be various other pragmatic reasons – such as the other relevant selection criteria and the availability of suitable candidates within Philips – that could play a complicating role in fully achieving the gender targets in the short term.achievement of our diversity targets.
In 2013,2016, the members of the Supervisory Board again each completed a questionnaire to verify compliance in 2013 with the applicable corporate governance rules and its own Rules of Procedure. The outcome of this survey was satisfactory.
In addition, we each submitted to the Chairman responses to a questionnaire designed to self-evaluate the functioning of the Supervisory Board. TheAs in previous years, the questionnaire covered topics such as the composition and competence of the Supervisory Board (for example, the Board’s size and the education and training requirements of its members), access to information, the frequency and quality of the meetings, quality and timeliness of the meeting materials, the nature of the topics discussed during meetings and the functioning of the Supervisory Board’s committees.
The responses to the questionnaire were aggregated into a report, which was discussed by the Supervisory Board in a private meeting. Certain areas were identified that could be improved and it was decided that the Chairman would follow-upfollow up with individual members to address specific issues. Summarizing,This resulted in a number of suggestions to improve the quality of the discussion in Board meetings, which will be implemented in 2017. Members of the Supervisory Board had a“one-to-one” discussion with the Chairman, and the Chairman was evaluated by the Vice-Chairman. The responses provided by the Supervisory Board members indicated that the Board iscontinues to be a well-functioning team and we believe a diversity of experience and skills is presentedrepresented on the Board. The Board has spent time throughout 2016 considering its composition and it will continue to devote attention to this topic during 2017. The functioning of the Supervisory Board committees was considered to be commendable (or better) and specific feedback will bewas addressed by the chairmanChairman of each committee with its members. The evaluation lead to certain practical steps to improve the accessibility of the large quantity of materials provided to Supervisory Board members.
In 2013, theThe use of an external evaluator to measure the functioning of the Supervisory Board was considered; however, it was decided to continue self-evaluation formay be considered in the time being. We will reconsider the use of an external evaluator as circumstances require.future.
Supervisory Board committees
The Supervisory Board has assigned certain of its tasks to the three permanent committees:long-standing committees, also referred to in the Dutch Corporate Governance Code: the Corporate Governance and Nomination & Selection
88 Annual Report 2016
Supervisory Board report 8
Committee, the Remuneration Committee and the Audit
132 Annual Report 2013
9 Committee. In 2015, the Supervisory Board also established the Quality & Regulatory Committee. The separate reports of these committees are part of this Supervisory Board report 9 - 9
Committee. The function of all of the Board’s committees is to prepare the decision-making of the full Supervisory Board, and the committees currently have no independent or assigned powers. The full Board retains overall responsibility for the activities of its committees. The
Separation Committee
In 2015, the Supervisory Board additionally established the Separation Committee, following the decision to separate reportsthe Lighting business from the Company. In January 2016, the Separation Committee met on one occasion and conducted a final review of the committees are partseparation process, focusing on the status of the separation across all Lighting businesses and Markets, and the separation of items including intellectual property, information technology infrastructure, real estate and legacy liabilities. The Separation Committee was abolished following the establishment of a stand-alone structure within the Philips Group effective February 1, 2016 (which was followed by the initial public offering of shares in Philips Lighting in May 2016).
Supervisory Board remuneration
The agenda for the upcoming 2017 Annual General Meeting of Shareholders will include a proposal to increase the Annual Fixed Fee level and Committee Meeting Fees of the Supervisory Board. The agenda will also include a proposal to amend the Remuneration Policy and LTI Plan for the Board of Management. See thesection 8.2, Report of the Remuneration Committee, of this Supervisory Board report and are published below.report.
Financial Statements 20132016
The financial statements of the company for 2013,2016, as presented by the Board of Management, have been audited by KPMGErnst & Young Accountants N.V. asLLP, the independent external auditor appointed by the General Meeting of Shareholders. Its reports have been included in the section Group financial statements; section 11.10,11.5, Independent auditor’s report - Group and the section Company financial statement; section 12.5, Independent auditor’s report - Company,, of this report. We have approved these financial statements, and all individual members of the Supervisory Board (together with the members of the Board of Management) have signed these documents.
We recommend to shareholders that they adopt the 20132016 financial statements. We likewise recommend to shareholders that they adopt the proposal of the Board of Management to make a distribution of EUR 0.80 per common share (up to EUR 740745 million), in cash or in shares at the option of the shareholder, against the net income for 2013.2016.
Finally, we would like to express our thanks to the members of the Executive Committee and all other employees for their continued contribution during the year. In particular, we would like to express our sincere appreciation to Eric Coutinho, our Chief Legal Officer and General Secretary, who will retire in 2014. We wish him all the best for the future.
February 25, 201421, 2017
The Supervisory Board
Jeroen van der Veer
Kees van LedeChristine Poon
Neelam Dhawan
Orit Gadiesh
David Pyott
Heino von Prondzynski
Jackson Tai
James Schiro
Ewald Kist
Christine Poon
Neelam Dhawan
Further information
ForTo gain a better understanding of the responsibilities of the Supervisory Board and forthe internal regulations and procedures forgoverning its functioning and that of its committees, please refer tochapter 10,9, Corporate governance, of this report and to the following documents published on the company’s website:Company’s website:
Articles of Association
Rules of Procedure Supervisory Board, including the Charters of the Board committees
Rules of Conduct with respect to Inside Information
(Re)appointment scheme
Changes andre-appointments Supervisory Board and committees 20132016
Christine Poon, James SchiroNeelam Dhawan wasre-appointed as member of the Supervisory Board.
Ewald Kist and JeroenKees van der Veer have been reappointedLede resigned as a membermembers of the Supervisory Board.
Changes and reappointmentsProposedre-appointments Supervisory Board 20142017
It is proposed to appoint Orit Gadieshre-appoint Jeroen van der Veer and Christine Poon as a membermembers of the Supervisory Board.*
Changes Management 2014
Eric Coutinho, Chief Legal Officer and General Secretary will retire on April 30, 2014. He will be succeeded by Marnix van Ginneken (currently Philips’ Head of Group Legal).
Annual Report 2013 133
9 Supervisory Board report 9.1 - 9.1
9.18.1 Report of the Corporate Governance and Nomination & Selection Committee
The Corporate Governance and Nomination & Selection Committee is chaired by Jeroen van der Veer and its other members are James SchiroChristine Poon and Christine Poon.
Heino von Prondzynski. The Committee is responsible for the review of selection criteria and appointment procedures for the Board of Management, the Executive Committee, certain other key management positions, as well as the Supervisory Board.
In 2013,2016, the Committee consulted with the CEOmet four times and other members of the Board of Managementdevoted time on the appointment or reappointment of candidates to fill current and future vacancies on the Supervisory Board, Board of Management and
Annual Report 2016 89
Supervisory Board report 8.1
Executive Committee and Supervisory Board.Committee. Following whichthose consultations it prepared decisions and advised the Supervisory Board on the candidates for appointment.
The Committee devoted specific attentionThis resulted in the proposal to identifying a suitable candidate matchingre-appointment, at the profileupcoming 2017 Annual General Meeting of Shareholders, Jeroen van der Veer and Christine Poon as members of the Supervisory Board. Subsequently,
This also resulted in the Nomination & Selectionappointment of Sophie Bechu as Chief Operations in September 2016.
The Committee reviewed and approved the nomination of Orit Gadiesh as memberimplications of the Supervisory Board,separation of the Company into two companies for governance, succession and talent development. This resulted in Jeroen Tas and Rob Cascella joining the Executive Committee as leaders for the Connected Care & Health Informatics businesses and Diagnosis & Treatment businesses, respectively, as of 1 July 2016. As per the same date, Brent Shafer and Andy Ho joined the Executive Committee as Market Leaders North America and China, respectively.
Eric Rondolat left the Executive Committee in view of the listing of Philips Lighting.
Early 2017, there were a number of changes in the Executive Committee that the Committee discussed. Jeroen Tas was appointed as Chief Innovation & Strategy Officer, replacing Jean Botti, who was selected from a shortlistleft Philips. Carla Kriwet joined the Executive Committee as Chief Business Leader of suitable candidates.Connected Care & Health Informatics, succeeding Jeroen Tas in that role. The Committee also devoted specific attentionfurther discussed the appointment of Ronald de Jong as Chief Human Resources Officer following the decision by Denise Haylor to succession planning for Executive Committee members.leave Philips in March 2017.
As indicated in its report above, the Supervisory Board believes it is making good progress in implementing a policy of gender diversity. The Committee strives to continue this trend and give appropriate weight to the diversity policy in the nomination and appointment process onfor future vacancies, while taking into account the overall profile and selection criteria for the appointments of suitable candidates to the Supervisory Board, Board of Management and Executive Committee and Supervisory Board.Committee.
Under its responsibility for the selection criteria and appointment procedures for Philips’ senior management, the Committee reviewed the succession plans for the top 70 positions and emergency candidates for key roles in the company.Company.
With respect to corporate governance matters, the Committee discussed relevant developments and legislative changes. The Committee notes a numberdiscussed the revised EU Market Abuse Regulation, the EU Directive and Regulation on audits of important legislative changes toannual accounts and the revised EU Transparency Directive. The revised Dutch corporate law cameCorporate Governance code, which will come into effect in 2013 and 2014. In addition there were changes to Dutch accountancy law, new rules on inquiry proceedings and an amendment to the European Transparency Directive. These legislative developments and other developments were discussed by the Committee, as well as their potential impact on the company’s governance. Finally, the Committee discussed possible agenda items for the upcoming 2014 Annual General Meeting of Shareholders.
134 Annual Report 2013
9 Supervisory Board report 9.2 - 9.2.2
financial year 2017, was also discussed in the Committee.
9.28.2 Report of the Remuneration Committee
Introduction
The Remuneration Committee is chaired by James Schiro and itsHeino von Prondzynski. Its other members are Jeroen van der Veer Ewald Kist and Christine Poon. The Committee is responsible for preparing decisions of the Supervisory Board on the remuneration of individual members of the Board of Management and the Executive Committee. In performing its duties and responsibilities the Remuneration Committee is assisted by an external consultant andin-house remuneration expert acting on the basis of a protocol which ensures that he acts on the instructions of the Remuneration Committee. Currently, no member of the Remuneration Committee is a member of the management board of another listed company. In line with applicable statutory and other regulations, this report focuses on the employmentterms of engagement and remuneration of the members of the Board of Management. The Committee met seven times in 2016.
9.2.18.2.1 Remuneration policy
The objective of the remuneration policy for members of the Board of Management, as adopted by the General Meetinggeneral meeting of Shareholders,shareholders, is in line with that for executives throughout the Philips Group:Group. That is, to attract, motivate and retain qualified senior executives of the highest caliber with an international mindset and the background essential for the successful leadership and effective management of a large global company. The Board of Management remuneration policy is benchmarked regularly against companies in the general industry and aims at the median market position.
One of the goals behind the policy is to focus on improving the performance of the company and enhancingto enhance the value of the Philips Group. Consequently, the remuneration package includes a variable part in the form of an annual cash incentive and a long-term incentive consisting of performance shares. The policy does not encourage inappropriate risk-taking.
The performance targets for the members of the Board of Management are determined annually at the beginning of the year. The Supervisory Board determines whether performance conditions have been met and can adjust the pay-outpayout of the annual cash incentive and the long-term incentive grant upward or downward if the predetermined performance criteria were to produce an inappropriate result in extraordinary circumstances. The authority for such adjustments exists on the basis of contractual ultimum remedium-ultimum-remedium and claw backclaw-back clauses. In addition, pursuant to new Dutch legislation effective January 1, 2014, incentives may, under certain circumstances, be amended or
90 Annual Report 2016
Supervisory Board report 8.2.1
clawed back pursuant to statutory powers. For more information please refer tochapter 10,9, Corporate governance, of this report. Further information on the performance targets is given in the chapters on the Annual Incentive (seesub-section 8.2.6, 2016 Annual Incentive, of this report) and the Long-Term Incentive Plan (seesub-section 8.2.7, 2016 Long-Term Incentive Plan, of this report) respectively.
9.2.2 ContractsKey features of our Board of Management Compensation Program
The list below highlights Philips’ approach to remuneration, in particular taking into account Corporate Governance practices in the Netherlands.
What we do
We pay for performance
We conduct scenario analyses
We have robust stock ownership guidelines
We have claw-back policies incorporated into our incentive plans
We have a simple and transparent remuneration structure in place
What we do not do
We do not pay dividend equivalents on stock options, or restricted share units and performance share units that do not vest
We do not offer executive contracts with longer than 12 months’ separation payments
We do not have a remuneration policy in place that encourages our Board of Management to take any inappropriate risks or to act in their own interests
We do not reward failing members of the Board of Management upon termination of contract
We do not grant loans or give guarantees to members of the Board of Management
8.2.2 Contracts for the provision of services
Below, the main elements of the contracts for the provision of services of the members of the Board of Management are made public no later than the date of the notice convening the General Meeting of Shareholders at which the appointment of the member of the Board of Management will be proposed.included.
Term of appointment
The members of the Board of Management are appointedengaged for a period of 4 years.years, it being understood that this period expires no later than at the end of the following AGM held in the fourth year after the year of appointment.
Philips Group
Contract terms for current members
| end of term | ||||
F.A. van Houten | ||||
| ||||
P.A.J. Nota | ||||
Notice period
Termination of the contract by a memberfor the provision of the Board of Managementservices is subject to threesix months’ notice. A notice period of six months will be applicable in the case of termination by the Company.for both parties.
Severance payment
The severance payment is set at a maximum of one year’s salary.base compensation.
Share ownership
Simultaneously with the introduction of the new LTIcurrent Long-Term Incentive Plan (LTI) in 2013, the guideline for members of the Board of Management to hold a certain number of shares in the company has beenCompany was increased to the level of at least
Annual Report 2013 135
9 Supervisory Board report 9.2.2 - 9.2.6
200% of annual base pay (the CEO 300%)compensation (300% for the CEO). Until this level has been reached the members of the Board of Management are required to retain allafter-tax shares derived from any long-term incentive plan.
Both Frans van Houten and Pieter Nota have reached the required share ownership level. Abhijit Bhattacharya is at 96% of his target (i.e., 192% of annual base compensation).
9.2.38.2.3 Scenario analysis
The Remuneration Committee annually conducts a scenario analysis.analysis annually. This includes the calculation of remuneration under different scenarios, whereby different Philips performance assumptions and corporate actions are looked at.examined. The Supervisory Board concluded that the current policy has proven to function well in terms of a relationship between the strategic objectives and the chosen performance criteria and believebelieves that newthe Annual and Long-Term Incentive Plan has further improvedPlans support this relationship.
9.2.48.2.4 Remuneration costs
The following table below gives an overview of the costs incurred by the Company in the financial year in relation to the remuneration of the Board of Management. Costs related to performance shares stock option and restricted share right grants are taken by the Company over a number of years. As a consequence, the costs mentioned below in the columns stock optionsperformance shares and restricted share rights columns are the accounting cost of multi- yearmulti-year Long-Term Incentive grants given to members of the Board of Management during their board membership.Management.
Annual Report 2016 91
Supervisory Board report 8.2.4
Philips Group
Remuneration Board of Management 20131)in EUR
in euros2016
|
| |||||||||||||||||||||||||||||||||||||||||||||||||||||||||||||||
| Costs in the year | ||||||||||||||||||||||||||||||||||||||||||||||||||||||||||||||||
| Costs in the year2) |
|
| ||||||||||||||||||||||||||||||||||||||||||||||||||||||||||||||
| annual | realized | performance | stock | restricted | pension | other | annual base compensation2) | base compensation | realized annual incentive | performance shares | restricted share rights | pension allowances | pension scheme costs | other compensation | ||||||||||||||||||||||||||||||||||||||||||||||||||
| base salary3) | base salary | annual incentive | shares | options | share rights | costs | compensation |
|
| |||||||||||||||||||||||||||||||||||||||||||||||||||||||
F.A. van Houten | 1,100,000 | 1,100,000 | 1,081,520 | 402,275 | 218,682 | 190,441 | 468,407 | 75,906 | 1,205,000 | 1,197,500 | 1,354,227 | 1,423,538 | 12,041 | 536,195 | 24,838 | 126,703 | ||||||||||||||||||||||||||||||||||||||||||||||||
R.H. Wirahadiraksa | 675,000 | 656,250 | 497,745 | 205,713 | 137,926 | 128,856 | 263,451 | 35,732 | ||||||||||||||||||||||||||||||||||||||||||||||||||||||||
A. Bhattacharya | 650,000 | 650,000 | 540,072 | 362,758 | 3,341 | 201,524 | 24,838 | 73,642 | ||||||||||||||||||||||||||||||||||||||||||||||||||||||||
P.A.J. Nota | 625,000 | 618,750 | 561,713 | 190,473 | 182,835 | 146,626 | 253,605 | 68,206 | 710,000 | 702,500 | 619,745 | 683,101 | 9,251 | 277,649 | 24,838 | 56,558 | ||||||||||||||||||||||||||||||||||||||||||||||||
|
| |||||||||||||||||||||||||||||||||||||||||||||||||||||||||||||||
| 2,550,000 | 2,514,044 | 2,469,397 | 24,633 | 1,015,368 | 74,514 | 256,903 | ||||||||||||||||||||||||||||||||||||||||||||||||||||||||||
|
| |||||||||||||||||||||||||||||||||||||||||||||||||||||||||||||||
| 1) | Reference date for board membership is December 31, |
| 2) |
|
|
Accelerate! GrantFor further details on the pension allowances and pension costs seesub-section 8.2.8, Pensions, of this report.
8.2.5 Annual base compensation
The members of the Board of Management received a special once-only performance grant related to the realization of the Accelerate! program and the mid- term targets of the company (CSG CAGR, Adjusted IFO and ROIC). This grant consists of performance shares and performance options. The costs related to the Accelerate! Grant to the members of the Board of Management have been fully taken in the financial year 2013. Around 450 other key employees received a similar performance grant.
Accelerate! Grant
| number of | number of | |||||||||||
| performance | performance | Costs in | ||||||||||
| shares | stock options | euros | ||||||||||
F.A. van Houten | 55,000 | 55,000 | 1,434,933 | |||||||||
R.H. Wirahadiraksa | 38,500 | 38,500 | 1,004,453 | |||||||||
P.A.J. Nota | 38,500 | 38,500 | 1,004,453 | |||||||||
9.2.5 Base salary
The base salariesannual compensation of the members of the Board of Management havehas been reviewed in April 20132016 as part of the regular remuneration review. The salaryannual compensation of Frans van Houten has not been increased per April 1, 2013 and remained at2016, from EUR 1,100,000.1,175,000 to EUR 1,205,000. The salaryannual compensation of Pieter Nota has been increased from EUR 600,000680,000 to EUR 625,000 and the salary710,000.
Both increases were made to move base compensation levels closer to market levels. The annual compensation of the CFO, Ron Wirahadiraksa, has been increased fromAbhijit Bhattacharya, remained unchanged at EUR 600,000 to EUR 675,000 to bring it closer to market level.650,000, given his appointment as CFO on December 18, 2015.
9.2.68.2.6 2016 Annual Incentive
Each year, a variable cash incentive (Annual Incentive) can be earned, based on the achievement of specific and challenging targets. The Annual Incentive criteria are made up for 80% of the financial indicators of the Company and for 20% of the team targets comprising, among others, sustainability targets as part of our EcoVisionsustainability program.
Theon-target Annual Incentive percentage in 2016 is set at 80% of the annual base compensation for the CEO and at 60% of the annual base salarycompensation for other members of the Board of Management. The maximum Annual Incentive achievable is 160% of the annual base compensation for the CEO and 120% of the annual base compensation for members of the Board of Management and 80% of the base salary for the CEO, and the maximum Annual Incentive achievable is 120% of the annual base salary for members of the Board of Management and for the CEO it is 160% of the annual base salary.Management.
136 Annual Report 2013
9 Supervisory Board report 9.2.6 - 9.2.7
To support the performance culture, the Annual Incentive plan is based on (financial)financial targets we set are at ‘own level’Group level for Frans van Houten and ‘group’Abhijit Bhattacharya and a combination of Group and business level results (line-of-sight).for Pieter Nota. The 2013 realization is a reflection of2016 payouts, shown in the table below, reflect the above target performance onof all three metrics (i.e., Comparable sales growth1), Adjusted IFO, ROICincome from operations1) and Team Targetscash flow based) at Group and a below target realization on CSG, resulting in the pay-out as presented in the table below.business levels that apply to Board of Management.
Philips Group
Annual Incentive realization 2013 (pay-out in 2014)EUR
2016 (payout in euros2017)
|
| |||||||||||||||
| realized annual | as a % of base | realized annual incentive | as a % of base compensation (2016) | |||||||||||||
| incentive | salary (2013) |
|
| |||||||||||||
F.A. van Houten | 1,081,520 | 98.3 | % | 1,354,227 | 112.4 | % | ||||||||||
R.H. Wirahadiraksa | 497,745 | 73.7 | % | |||||||||||||
A. Bhattacharya | 540,072 | 83.1 | % | |||||||||||||
P.A.J. Nota | 561,713 | 89.9 | % | 619,745 | 87.3 | % | ||||||||||
|
| |||||||||||||||
9.2.78.2.7 2016 Long-Term Incentive Plan
In 2013 a newGrants made to Board of Management under the 2016 LTI Plan has been introduced. The new plan consistsconsist of performance shares only.
Grant size
The annual grant size is set by reference to a multiple of base salary.compensation. For the CEO the annual grant size in 2016 is set at 120% of base salarycompensation and for the other members of the Board of Management at 100% of base salary. This is at a mid-market level against leading European listed companies.compensation. The actual number of performance shares to be awarded is determined by reference to the average of the closing price of the Philips share on the day of publication of the first quarterly results and the four subsequent dealing days.
Vesting schedule
Dependent upon the achievement of the performance conditions, cliff-vesting applies three years after the date of grant. During the vesting period, the value of dividends will be added to the performance shares in the form of shares. These dividend equivalentdividend-equivalent shares will only be delivered to the extent that the award actually vests.
Performance conditions
Vesting of the performance shares is based on two equally weighted performance conditions:
50% Adjusted Earnings per Share growth (“EPS”) and
50% Relative Total Shareholder Return (“TSR”)
EPS
EPS growth is calculated by applying the simplepoint-to-point method at year end. Earnings are the income from continued operations attributable to shareholders, as reported in the Annual Report.
| 1) | Non-GAAP financial measure. For the definition and reconciliation to the most directly comparable GAAP measure, refer tochapter 4, Reconciliation ofnon-GAAP information, of this report. |
92 Annual Report 2016
Supervisory Board report 8.2.7
The following performance incentive-zoneperformance-incentive zone applies for EPS:
Philips Group
Performance incentive-zonePerformance-incentive zone for EPSin %
| Below | ||||||||||||||||
| threshold | Threshold | Target | Maximum | |||||||||||||
Pay-out in % | 0 | 40 | 100 | 200 | ||||||||||||
|
| |||||||||||||||
| | Below threshold | | Threshold | Target | Maximum | |||||||||||
|
| |||||||||||||||
Payout | 0 | 40 | 100 | 200 | ||||||||||||
|
| |||||||||||||||
The EPS targets are set annually set by the Supervisory Board. Given the fact that these targets are considered to be company sensitive, disclosure will take place retrospectively at the end of the performance period. EPS targets and the achieved performance are published in the annual reportAnnual Report after the relevant performance period. For realization of the 2014 grant, see the table on vesting 2014 awards at the end of this section.
TSR
TheMedtronic acquired Covidien on January 26, 2015 and following this Covidien was excluded from the 2016 peer group. As a result, the TSR peer group for the new plan2016 LTI Plan consists of the following 2120 companies:
Philips Group
TSR peer group
| ABB | ||||
| Honeywell Int. | Procter & Gamble | |||
| Danaher | Johnson Controls | Schneider Electric | ||
| Eaton | Johnson & Johnson | Siemens | ||
| Electrolux | Legrand | |||
| Emerson Electric | LG Electronics | |||
| General Electric | Medtronic | 3M | ||
| Hitachi | Panasonic |
A ranking approach to TSR applies with Philips itself excluded from the peer group to permit interpolation.
Following Johnson Controls merger with Tyco International in September 2016, the Supervisory Board adopted the approach of recognizing Johnson Controls performance through the merger date and as a proxy for future performance assumed reinvestment in an index of the remaining 19 peer companies.
The performance incentive-zone is outlined in the table below:
Philips Group
Performance incentive-zonePerformance-incentive zone for TSRin %
|
| |||||||||||||||||||||||||||||||||||||||||||||||||||||||||||||||||||
Position | ³14 -21 | ³13 | ³12 | ³11 | ³10 | ³9 | ³8 | ³7 | ³6 -1 |
| ³20 -13 |
| ³12 | ³11 | ³10 | ³9 | ³8 | ³7 |
| ³6 -1 |
| |||||||||||||||||||||||||||||||||||||||||||||||
Pay-out in % | 0 | 60 | 60 | 100 | 120 | 140 | 160 | 180 | 200 | |||||||||||||||||||||||||||||||||||||||||||||||||||||||||||
|
| |||||||||||||||||||||||||||||||||||||||||||||||||||||||||||||||||||
Payout | 0 | 60 | 80 | 120 | 140 | 160 | 180 | 200 | ||||||||||||||||||||||||||||||||||||||||||||||||||||||||||||
|
| |||||||||||||||||||||||||||||||||||||||||||||||||||||||||||||||||||
Under the new LTI Plan members of the Board of Management were granted 124,171115,047 performance shares in 2013.2016.
The following tables provide an overview at end December 2016 of granted but not yet vested (locked up) stock option grants an overview ofand performance shares granted but not yet vested and an overview of restricted share rights granted but not yet released.grants. The reference date for board membership is December 31, 2013. The Accelerate! Grant is reported separately under sub-section 9.2.4, Remuneration costs, of this report.2016.
Annual Report 2013 1372016 93
9 Supervisory Board report 9.2.7 - 9.2.88.2.7
Philips Group
Stock options
|
| |||||||||||||||||||
| grant date | number of stock options | value at grant date1) | end of lock-up period | value at end of lock- up period1) | ||||||||||||||||
|
| |||||||||||||||||||
F.A. van Houten | 2013 | 2) | 55,000 | 242,534 | 2016 | 167,178 | ||||||||||||||
P.A.J. Nota | 2013 | 2) | 38,500 | 169,773 | 2016 | 117,025 | ||||||||||||||
|
| |||||||||||||||||||
1) Value based on Black & Scholes value
2) Accelerate! Grant
Philips Group
Performance shares1)
in euros
|
| |||||||||||||||||||||||||||||||||||||||||||||||
| grant date | number of performance shares originally granted | value at grant date | end of vesting period | number of performance in 2016 | value at vesting date in 2016 | |||||||||||||||||||||||||||||||||||||||||||
| grant date | originally granted number of performance shares | value at grant date | end of period | number of performance in 2013 | value at vesting date in 2013 |
|
| |||||||||||||||||||||||||||||||||||||||||
F.A. van Houten | 2013 | 62,559 | 1,320,000 | 2016 | n.a. | n.a. | 2013 | 62,559 | 1,320,000 | 2016 | 53,175 | 1,263,438 | ||||||||||||||||||||||||||||||||||||
R.H. Wirahadiraksa | 2013 | 31,991 | 675,000 | 2016 | n.a. | n.a. | ||||||||||||||||||||||||||||||||||||||||||
| 2014 | 59,075 | 1,380,000 | 2017 | n.a. | n.a. | |||||||||||||||||||||||||||||||||||||||||||
| 2015 | 54,877 | 1,410,000 | 2018 | n.a. | n.a. | |||||||||||||||||||||||||||||||||||||||||||
| 2016 | 59,287 | 1,446,000 | 2019 | n.a. | n.a. | |||||||||||||||||||||||||||||||||||||||||||
A. Bhattacharya | 2013 | 11,848 | 250,000 | 2016 | 10,071 | 239,287 | ||||||||||||||||||||||||||||||||||||||||||
| 2014 | 10,702 | 250,000 | 2017 | n.a. | n.a. | |||||||||||||||||||||||||||||||||||||||||||
| 2015 | 11,676 | 300,000 | 2018 | n.a. | n.a. | |||||||||||||||||||||||||||||||||||||||||||
| 2016 | 26,650 | 650,000 | 2019 | n.a. | n.a. | |||||||||||||||||||||||||||||||||||||||||||
P.A.J. Nota | 2013 | 29,621 | 625,000 | 2016 | n.a. | n.a. | 2013 | 29,621 | 625,000 | 2016 | 25,178 | 598,229 | ||||||||||||||||||||||||||||||||||||
| 2014 | 27,825 | 650,000 | 2017 | n.a. | n.a. | |||||||||||||||||||||||||||||||||||||||||||
| 2015 | 26,465 | 680,000 | 2018 | n.a. | n.a. | |||||||||||||||||||||||||||||||||||||||||||
| 2016 | 29,110 | 710,000 | 2019 | n.a. | n.a. | |||||||||||||||||||||||||||||||||||||||||||
|
| |||||||||||||||||||||||||||||||||||||||||||||||
1) Accelerate! Grant reported separately. Dividend performance shares resulting from the new LTI Plan not included
Stock options2)
in euros
| grant date | number of stock options | value at grant date | end of lock up period | value at end of lock up period3) | ||||||||||||||||
F.A. van Houten | 2010 | 20,400 | 1) | 103,428 | 2013 | 86,429 | ||||||||||||||
| 2011 | 75,000 | 366,000 | 2014 | n.a. | ||||||||||||||||
| 2012 | 75,000 | 212,550 | 2015 | n.a. | ||||||||||||||||
R.H. Wirahadiraksa | 2010 | 16,500 | 1) | 81,675 | 2013 | 36,290 | ||||||||||||||
| 2011 | 51,000 | 248,880 | 2014 | n.a. | ||||||||||||||||
| 2012 | 51,000 | 144,534 | 2015 | n.a. | ||||||||||||||||
P.A.J. Nota | 2010 | 40,800 | 1) | 206,856 | 2013 | 172,857 | ||||||||||||||
| 2011 | 51,000 | 248,880 | 2014 | n.a. | ||||||||||||||||
| 2012 | 51,000 | 144,534 | 2015 | n.a. | ||||||||||||||||
1) Awarded before date of appointment as a member of the Board of Management
2) Accelerate! Grant reported separately
3) Value at end of lock up period based on Black & Scholes value
Restricted share rights
in euros
| grant date | originally granted number of restricted share rights | value at grant date | number of restricted share rights released in 2013 | value at release date in 2013 | ||||||||||||||||
F.A. van Houten | 2010 | 5,100 | 1) | 116,688 | 1,700 | 41,497 | ||||||||||||||
| 2011 | 20,001 | 418,021 | 6,667 | 145,607 | ||||||||||||||||
| 2012 | 20,001 | 296,415 | 6,667 | 136,807 | ||||||||||||||||
R.H. Wirahadiraksa | 2010 | 4,125 | 1) | 102,713 | 1,375 | 30,113 | ||||||||||||||
| 2011 | 13,602 | 284,282 | 4,534 | 99,023 | ||||||||||||||||
| 2012 | 13,602 | 201,582 | 4,534 | 93,038 | ||||||||||||||||
P.A.J. Nota | 2010 | 10,200 | 1) | 233,376 | 3,400 | 82,994 | ||||||||||||||
| 2011 | 13,602 | 284,282 | 4,534 | 99,023 | ||||||||||||||||
| 2012 | 13,602 | 201,582 | 4,534 | 93,038 | ||||||||||||||||
1) Awarded before date of appointment as a member of the Board of Management
For more details of the LTI Plan seenote 31,27, Share-based compensation.compensation.
9.2.8Realization of 2014 performance share grant
The3-year performance period of the 2014 performance share grant ended on December 31, 2016. The payout results are explained below.
TSR (50% weighting)
On January 26, 2015, Medtronic completed the acquisition of Covidien. To address the delisting of Covidien the Supervisory Board adopted the approach of recognizing Covidien’s performance through the delisting date and as a proxy for future performance, assumed reinvestment in an index of the remaining 20 peer companies, therefore, effectively a peer group of 21 companies.
The TSR achieved by Philips during the performance period was 18.66% This positioned Philips between the 10th and 11th ranked company in the peer group shown in the table below, resulting in an achievement of 105.8%.
TSR results Philips LTI Plan 2014 grants Koninklijke Philips:
18.66%
|
| |||||||
Total Shareholder Return ranking per December 31, 2016 | ||||||||
Start date: December 2013 | ||||||||
End date: December 2016 | ||||||||
|
| |||||||
| Company | total return | rank number | ||||||
|
| |||||||
Covidien | 77.27 | % | 1 | |||||
Electrolux | 48.10 | % | 2 | |||||
Medtronic | 46.91 | % | 3 | |||||
3M | 46.21 | % | 4 | |||||
Danaher | 43.80 | % | 5 | |||||
Honeywell International | 38.51 | % | 6 | |||||
Legrand | 38.21 | % | 7 | |||||
Johnson & Johnson | 36.39 | % | 8 | |||||
Siemens | 27.42 | % | 9 | |||||
General Electric | 27.33 | % | 10 | |||||
|
| |||||||
Procter & Gamble | 15.15 | % | 11 | |||||
Smiths Group | 13.24 | % | 12 | |||||
Schneider Electric | 12.37 | % | 13 | |||||
Panasonic | 11.13 | % | 14 | |||||
ABB | 5.90 | % | 15 | |||||
Johnson Controls | 3.18 | % | 16 | |||||
Eaton | 1.85 | % | 17 | |||||
Toshiba | (5.74 | )% | 18 | |||||
Emerson Electric | (11.02 | )% | 19 | |||||
Hitachi | (12.33 | )% | 20 | |||||
LG Electronics | (27.91 | )% | 21 | |||||
|
| |||||||
94 Annual Report 2016
Supervisory Board report 8.2.7
Adjusted EPS growth (50% weighting)
The EPS payouts and targets set at the beginning of the performance period were as follows:
|
| |||||||||||||||
| below | ||||||||||||||||
| threshold | threshold | target | maximum | |||||||||||||
|
| |||||||||||||||
EPS (euro) | <1.45 | 1.45 | 1.62 | ³1.90 | ||||||||||||
Payout | 0 | % | 40 | % | 100 | % | 200 | % | ||||||||
|
| |||||||||||||||
EPS is based on the underlying income from continuing operations attributable to shareholders, as included in the Annual Report, adjusted for changes in accounting principles. Furthermore, the Supervisory Board has also deemed it appropriate to make adjustments relating to certain other items that were not contemplated when the targets were set in 2014. These relate to the profit and loss impact of acquisitions and discontinued operations, impairments and restructuring costs, bond redemption fees, and impact of foreign exchange variations versus plan. In addition, we have added back thenon-controlling interests related to Philips Lighting since contributions from this business were included in the original EPS targets.
The resulting EPS achievement was determined by the Supervisory Board as 107.1%.
In view of the above, the following performance achievement and vesting levels have been determined by the Supervisory Board in respect of the 2014 grant of performance shares:
|
| |||||||||||
| metric | achievement | weighting | vesting level | |||||||||
|
| |||||||||||
TSR | 105.8 | % | 50 | % | 52.9 | % | ||||||
EPS | 107.1 | % | 50 | % | 53.6 | % | ||||||
total | 106.5 | % | ||||||||||
|
| |||||||||||
8.2.8 Pensions
MembersEffective January 1, 2015 pension plans which allow pension accrual based on a pensionable salary exceeding an amount in 2016 of EUR 101,519 are, for fiscal purposes, considered to benon-qualifying schemes. For this reason the Executive Pension Plan in the Netherlands has been terminated.
The following pension arrangement is in place for the current members of the Board of Management participate in the Executivesworking under a Dutch contract:
Flex Pension Plan in the Netherlands, consistingwhich is a Collective Defined Contribution plan with a fixed contribution of 26.2% up to the maximum pensionable salary of EUR 101,519. The Flex Plan has a combination of a defined-benefit (career average) and defined-contribution plan. The target
138 Annual Report 2013
9 Supervisory Board report 9.2.8 - 9.2.11
retirement age of 67 and a target accrual rate of 1.85%;
A gross Pension Allowance equal to 25% of the base compensation exceeding EUR 101,519;
A temporary gross Transition Allowance, for a maximum period of 8 years (first 5 years in full; year 6: 75%; year 7: 50%, year 8: 25%) for members of the Board who were participants of the former Executive Pension Plan. The level of the allowance is based on the age and salary of the Board member on December 31, 2014.
The total pension cost of the Company related to this new pension arrangement (including the temporary Transition Allowance) is at a comparable level over a period of time to the pension cost under the plan is 62.5. The plan does not require employee contributions. For more details, see note 33, Information on remuneration.former Executive Pension Plan.
9.2.98.2.9 Additional arrangements
In addition to the main conditions as stipulated in the contracts for the provision of employment,services, a number of additional arrangements apply to members of the Board of Management. These additional arrangements, such as expense and relocation allowances, medical insurance, accident insurance and company car arrangements, are in line with those for Philips executives in the Netherlands. In the event of disablement, members of the Board of Management are entitled to benefits in line with those for other Philips executives in the Netherlands.
Unless the law provides otherwise, the members of the Board of Management and of the Supervisory Board shall be reimbursed by the Company for various costs and expenses, like reasonable costs of defending claims, as formalized in the articlesArticles of association.Association. Under certain circumstances, described in the articlesArticles of association,Association, such as an actaction or failure to act by a member of the Board of Management or a member of the Supervisory Board that can be characterized as intentional (“opzettelijk”), intentionally reckless (“bewust roekeloos”) or seriously culpable (“ernstig verwijtbaar”), there will be no entitlement to this reimbursement. The Company has also taken out liability insurance (D&O—Directors & Officers) for the persons concerned.
9.2.108.2.10 Remuneration of the Supervisory Board
A revised remuneration structure for Supervisory Board members was approved at the 2015 General Shareholders’ meeting. The table below givesprovides an overview of the current remuneration structure, which has remained unchanged since 2008.
Remuneration 20131)
in euros per yearstructure.
| Chairman | Member | |||||||
Supervisory Board | 110,000 | 65,000 | ||||||
Audit Committee | 15,000 | 10,000 | ||||||
Remuneration Committee | 12,500 | 8,000 | ||||||
Corporate Governance and Nomination & Selection Committee | 12,500 | 6,000 | ||||||
Fee for intercontinental traveling per trip | 3,000 | 3,000 | ||||||
Entitlement Philips product arrangement | 2,000 | 2,000 | ||||||
Annual Report 2016 95
Supervisory Board report 8.2.10
Philips Group
Remuneration Supervisory Board1)in EUR
2016
|
|
|
|
|
| |||||||
| Chairman | Vice Chairman | Member | ||||||||||
|
|
|
|
|
| |||||||
Supervisory Board | 135,000 | 90,000 | 80,000 | |||||||||
Audit Committee | 22,500 | n.a. | 13,000 | |||||||||
Remuneration Committee | 15,000 | n.a. | 10,000 | |||||||||
Corporate Governance and Nomination & Selection Committee | 15,000 | n.a. | 7,500 | |||||||||
Quality & Regulatory Committee | 15,000 | n.a. | 10,000 | |||||||||
Attendance fee per inter-European trip | 2,500 | 2,500 | 2,500 | |||||||||
Attendance fee per intercontinental trip | 5,000 | 5,000 | 5,000 | |||||||||
Entitlement to Philips product arrangement | 2,000 | 2,000 | 2,000 | |||||||||
|
|
|
|
|
| |||||||
1) For more details,see note 33,28, Information on remuneration
9.2.118.2.11 Year 20142017
Accelerate! Grant
Based2017 is the first full year as a Company focused on the 2013 financial performance on CSG CAGR, Adjusted IFOHealthTech opportunities. Subject to appropriate approvals we will implement changes to our Remuneration Policy, Long-Term Incentive Plans, and ROIC, the Supervisory Board concluded in her January 2014 meetingfee structures that all the performance conditions exceed the mid-term targets as announced in 2011. As a consequence the total number of sharesare more closely aligned to our key business and options under the Accelerate! Grant, as these were originally granted in January 2013, became unconditional. On January 28, 2014 the shares (after tax) have been delivered to the members of the Board of Management. With respect to these shares a holding period until January 29, 2018 applies. The options can be exercised during the period January 29, 2016 - January 29, 2023.talent competitors.
Pensions
In view of upcoming legislation in the Netherlands, the pension arrangements will be reviewed in the course of 2014.
Annual Report 2013 139
9 Supervisory Board report 9.3 - 9.3
9.38.3 Report of the Audit Committee
The Audit Committee is chaired by Jackson Tai, and its other members are Neelam Dhawan, KeesOrit Gadiesh and David Pyott. Jeroen van Lede and Heino von Prondzynski.der Veer also regularly participated in Audit Committee meetings. The Committee assists the Supervisory Board in fulfilling its supervisory responsibilities for, (inter alia)among other things, ensuring the integrity of the company’sCompany’s financial statements.statements and reviewing the Company’s internal controls.
The Audit Committee met for four quarterly meetings and twosix times during 2016, including an education and training sessions during 2013session, and reported its findings to the plenary Supervisory Board. The CEO, the CFO, the Chief Legal Officer, the Head of Internal Audit, the Group ControllerChief Accountant and the external auditor (KPMG(Ernst & Young Accountants N.V.)LLP) attended all regular meetings.
As decided by the 2015 Annual General Meeting of Shareholders, Ernst & Young Accountants LLP were appointed as the company’s new external auditor effective January 1, 2016. Ernst & Young Accountants LLP and the previous external accountant, KMPG Accountants N.V., each reported that the transition between auditors has been completed successfully and without any interruption.
Furthermore, for each meeting, the Committee met each quarter separately with each of the CEO, the CFO, the Chief Legal Officer, the Head of Internal Audit and the external auditor as well as on an ad hoc basisauditor. In addition, the Audit Committee chair metone-on-one with other company employees, such as the Group Treasurer, the Group Controller andChief Accountant, the Head of Financial RiskLegal Compliance and Pensions Management.the Chief Information Security Officer prior to each Committee meeting.
The overview below indicates certainsome of the matters that were discussed during meetings throughout 2013:2016:
The company’s 2013Company’s 2016 annual and interim financial statements, includingnon-financial information, prior to publication thereof. ItThe Committee also assessed in its quarterly meetings the adequacy and appropriateness of internal control policies and internal audit programs and their findings.
Matters relating to accounting policies, financial risks and compliance with accounting standards. Compliance with statutory and legal requirements and regulations, particularly in the financial domain, was also reviewed. Important findings, Philips’ major areas of risk (including the internal auditor’s reporting thereon, and the General Counsel’sChief Legal Officer’s review of litigation and other claims) andfollow-up action actions and appropriate measures were examined thoroughly.
Specifically, Each quarter, the Committee reviewed the company’s pension liabilities and its program to de-risk future pension liabilities and related economic, accounting and legal implications. The Committee reviewed the company’sCompany’s cash flow generation, liquidity and headroom, capital structure throughout the year and the implications for the Company’s credit ratings and its ability to undertake its financial commitments, including the company’sCompany’s share repurchase program, anddividend policy, payment of dividends, as well as implications of contemplated restructurings, dispositions and acquisitions. The Committee also reviewed the goodwill impairment test performed in the second and fourth quarter, risk management, tax issues, IT strategyinformation security, the commercial policy, legal compliance and transformation (including information security) and remediation of IT related internal control findings, the company’s finance transformation, developments in regulatory investigations as well as legal proceedings including antitrust investigations and related provisions, environmental exposuresprovisions.
Specific finance topics included Philips Capital, including its target portfolio risk profile, the progress in the pensionde-risking plan and the Company’s debt financing strategy.
The Committee reviewed information security, including targeted end state, situation readiness and performance of financial holdingscapabilities within the team, and recent acquisitions and new Dutch legislation on mandatory auditor rotation and prohibition on non-audit services.timetable to achieve the end state.
With regard to the internal audit, the Committee reviewed and, if required, approved the internal audit charter, audit plan, audit scope and its coverage in relation to the scope of the external audit, as well as the staffing, independence and organizational structure of the internal audit function. The Committee also reviewed and approved the appointment of a new Head of Internal Audit following the rotational reassignmentseparation of the previous incumbent.audit function for Royal Philips and Philips Lighting, including staffing capabilities and its management succession, was also discussed.
With regard to the external audit, the Committee reviewed the proposed audit scope, approach and fees, the independence of the external auditor,non-audit services provided by the external auditor in conformity with the Philips Auditor Policy, as well as any changes to this policy. The Committee also reviewed the External Auditor’skey audit matters, focusing on revenue
96 Annual Report 2016
Supervisory Board report 8.3
| recognition, Company separation, valuation of goodwill, taxes, contingent liabilities and accounting for Discontinued operations. |
The Committee reviewed the independence as well as itsthe professional fitness and good standing.standing of the external auditor and its engagement partners. For information on the fees of KPMG Accountants N.V.,Group auditor, please refer to the table ‘Fees KPMG’‘Fees’ innote 3,6, Income from operations.operations.
The company’sCommittee convened an education session on compliance, examining changes in regulatory requirements and heighten expectations. The session was led by the Head of Legal Compliance and Chief Legal Officer.
The Company’s policy on business controls, legal compliance and the General Business Principles including(including the deployment thereof and amendments thereto.thereof). The Committee was informed on, and discussed and monitored closely the company’sCompany’s internal control certification processes, in particular compliance with section 404 of the US Sarbanes-Oxley Act and its requirements regarding assessment, review and monitoring of internal controls. It also discussed on a regular basis the developments in and findings resulting from investigations into alleged violations of the General Business Principles and, if required, any measures taken.
On January 1, 2016, the new legislation on mandatory auditor rotation will become effective, which has also been reflected in the Auditor Policy amended as per January 1, 2013 (please refer to chapter 10, Corporate governance, of this report for more information). Under the new rotation rules, Philips must engage a new audit
140 Annual Report 2013
9 Supervisory Board report 9.3 - 9.3
firm for its statutory audit for the financial year starting January 1, 2016. The Committee has been involved in the process of selecting a new auditor and will continue to be involved in the final selection in 2014 of such future auditor, subject to appointment by the 2015 Annual General Meeting of Shareholders.
During each Audit Committee meeting, the Committee reviewed the report from the external auditor in which the auditor set forth its findings and attention points during the relevant period. The Committee also assessesassessed the overall performance of the external auditor, as required by the Auditor Policy. Please refer to the agendaThe Committee also reviewed its own Charter and explanatory notes thereto for the upcoming 2014 Annual General Meeting of Shareholders for more information on the proposed re-appointment, for one additional year,concluded that it was satisfactory.
8.4 Report of the external auditor.Quality & Regulatory Committee
Finally,The Supervisory Board established the Quality and Regulatory Committee in 2015 in view of the continued relevance of the quality of the Company’s products, systems, services, and software and the development, testing, manufacturing, marketing, and servicing thereof, and regulatory requirements relating thereto. The Q&R Committee assists the Supervisory Board in fulfilling its oversight responsibilities in this area whilst recognizing that the Audit Committee assists the Supervisory Board in the oversight of other areas of regulatory, compliance, and legal matters. Its members are Heino von Prondzynski, David Pyott and Jackson Tai, and it is chaired by Christine Poon.
The Q&R Committee met five times in 2016. The overview below indicates some of the matters that were discussed during meetings throughout 2016:
The culture of quality and measures taken to enhance the quality culture and awareness in the Company through inter alia communication by senior management, mandatory quality awareness trainings and quality-specific target-setting in people performance management;
Quality and regulatory dashboards, which display key performance indicators for business groups and markets, the status of ongoing internal and external audits, and any remediation actions underway or completed;
Product quality, including a review of the internal assessment that was conducted on product quality and supply base improvements;
Regulatory developments, covering (amongst others) changes in healthcare regulations in the US, EU, and China;
The standardization of the Quality System across Philips which will lead to consistently robust quality and compliance;
Deployment of performance management that provides a framework for continuous improvement; and
Talent development and adequacy of resources for the Quality and Regulatory team in order to provide a platform for continued growth and stability.
Members of the Q&R Committee also participatedvisited the Andover and San Diego sites in a number of education sessions during 2013, including education on pensionsthe United States and proposed changes to the IFRS accounting standards.reviewed their quality systems.
Annual Report 2013 1412016 97
10 Corporate governance 10 - 10.19
Corporate governance of the Philips groupGroup - Introduction
Koninklijke Philips N.V., a company organized under Dutch law, (the ‘Company’), is the parent company of the Philips Group (‘Philips’ or the ‘Group’).Group. The Company, which started as a limited partnership with the name Philips & Co in Eindhoven, the Netherlands, in 1891, was converted into the company with limited liability N.V. Philips’ Gloeilampenfabrieken on September 11, 1912. The Company’s name was changed to Philips Electronics N.V. on May 6, 1994, to Koninklijke Philips Electronics N.V. on April 1, 1998, and to Koninklijke Philips N.V. on May 3,15, 2013. Its shares have been listed on the Amsterdam Stock Exchange, Euronext Amsterdam, since 1912. The shares have been traded in the United States since 1962 and have been listed on the New York Stock Exchange since 1987.
Over the last decades the Company has pursued a consistent policy to improve its corporate governance in line with Dutch, US and international (codes of) best practices. The Company has incorporated a fair disclosure practice in its investor relations policy, has strengthened the accountability of its executive management and its independent supervisory directors, and has increased the rights and powers of shareholders and the communication with investors. The Company is required to comply with, inter alia, Dutch Corporate Governancecorporate governance rules, the US Sarbanes-Oxley Act, other US securities laws and related regulations (including applicable stock exchange rules), insofar as applicable to the Company. A summary of significant differences between the Company’s corporate governance practice and the New York Stock Exchange corporate governance standards is published on the Company’s website (www.philips.com/investor)(www.philips.com/investor).
In this report, the Company addresses its overall corporate governance structure and states to what extent and how it applies the principles and best practice provisions of the Dutch Corporate Governance Code (as revised on(of December 10, 2008; the ‘Dutch Corporate Governance Code’). On December 8, 2016, a revised Code was published, which will apply in respect of the financial year 2017. This report also includes the information which the Company is required to disclose pursuant to the Dutch governmental decreeDecree on Article 10 Takeover Directive and the governmental decreeDecree on Corporate Governance. Deviations from aspects of the corporate governance structure of the Company, when deemed necessary in the interests of the Company, will be disclosed in the Annual Report. Substantial changes in the Company’s corporate governance structure and in the Company’s compliance with the Dutch Corporate Governance Code, if any, will be submitted to the General Meeting of Shareholders for discussion under a separate agenda item. The Supervisory Board and the Board of Management, which are responsible for the corporate governance structure of the Company, are of the opinion that the principles and best practice provisions of the Dutch Corporate Governance Code that are addressed to the Board of Management and the Supervisory Board, interpreted and implemented in line with the best practices followed by the Company, are being applied.
98 Annual Report 2016
Corporate governance 9.1
10.19.1 Board of Management and Executive Committee
Introduction
The Board of Management is entrusted with the management of the Company. Certain key officers have been appointed to manage the Company together with the Board of Management. The members of the Board of Management and these key officers together constitute the Executive Committee (the ‘Executive Committee’).Committee. Under the chairmanship of the President/Chief Executive Officer (‘CEO’)(CEO), the members of the Executive Committee share responsibility for the deployment of its strategy and policies, and the achievement of its objectives and results. The Executive Committee has, for practical purposes, adopted a division of responsibilities indicating the functional and business areas monitored and reviewed by the individual members. For the purpose of this document,corporate governance report, where the Executive Committee is mentioned this also includes the Board of Management unless the context requires otherwise.
The Board of Management remains accountable for the actions and decisions of the Executive Committee and has ultimate responsibility for the Company’s management and the external reporting and is answerable to shareholders of the Company at the Annual General Meeting of Shareholders.
All resolutions of the Executive Committee are adopted by majority vote comprising the majority of the members of the Board of Management present or represented, such majority comprising the vote of the CEO. The Board of Management retains the authority to, at all times and in all circumstances, adopt resolutions without the participation of the other members of the Executive Committee. In discharging its duties, the Executive Committee shall be guided by the interests of the Company and its affiliated enterprise, taking into consideration the interests of the Company’s stakeholders.
The Executive Committee is supervised by the Supervisory Board and provides the latter with all information the Supervisory Board needs to fulfill its own responsibilities. Major decisions of the Board of Management and Executive Committee require the approval of the Supervisory Board; these include decisions concerning (a) the operational and financial objectives of the Company, (b) the strategy designed to achieve the objectives, (c) if necessary, the parameters to be applied in relation to the strategy and (d) corporate social responsibility issues that are relevant to the Company.
The Executive Committee follows the Rules of Procedure of the Board of Management and Executive Committee, which set forth procedures for meetings, resolutions and minutes. These Rules of Procedure are published on the Company’s website.
(Term of) Appointment and conflicts of interests
Members of the Board of Management as well as the CEO are appointed by the General Meeting of Shareholders upon a binding recommendation drawn up by the Supervisory Board after consultation with the CEO. This binding recommendation may be overruled by a resolution of the General Meeting of Shareholders adopted by a simple majority of the votes cast and representing at leastone-third of the issued share capital. If a simple majority of the votes cast is in favor of the resolution to overrule the binding recommendation, but such majority does not represent at leastone-third of the issued share capital, a new meeting may be convened at which the resolution may be passed by a simple majority of the votes cast, regardless of the portion of the issued share capital represented by such majority. In the event a binding recommendation has been overruled, a new binding recommendation shall be submitted to the General Meeting of Shareholders. If such second binding recommendation has been overruled, the General Meeting of Shareholders shall be free to appoint a board member.
Members of the Board of Management and the CEO are appointed for a term of four years, it being understood that this term expires at the end of the General Meeting of Shareholders to be held in the fourth year after the year of their appointment. Reappointment is possible for consecutive terms of four years or, if applicable, until a later retirement date or other contractual termination date in the fourth year, unless the General Meeting of Shareholders resolves otherwise. Members may be suspended by the Supervisory Board and by the General Meeting of Shareholders and dismissed by the latter. Individual data on the members of the Board of Management and Executive Committee are published inchapter 7,6, Management, of this report.
The other members of the Executive Committee are appointed, suspended and dismissed by the CEO, subject to approval by the Supervisory Board.
The acceptance by a member of the Board of Management of a position as a member of a supervisory board or a position ofnon-executive director in aone-tier board (a ‘Non-Executive Directorship’)(Non-Executive Directorship) at another company requires the approval of the Supervisory Board. The Supervisory Board is required to be notified of other important positions (to be) held by a member of the Board of Management. Under the Dutch Corporate Governance Code, no member of the Board of Management shall hold more than twoNon-Executive Directorships at listed companies, or is aserves as chairman of a supervisory board orone-tier board, other than of a Group company or participating interest of the Company. New Dutch legislation effective January 1, 2013, provides for further limitations on theNon-Executive Directorships. No member of the Board of Management shall hold more than two Non-Executive Directorships at ‘large’ companies (naamloze
Annual Report 2016 99
Corporate governance 9.1
vennootschappenorbesloten vennootschappen) or ‘large’ foundations (stichtingen)(stichtingen) as defined under Dutch law and no member of
142 Annual Report 2013
10 Corporate governance 10.1 - 10.1
the Board of Management shall hold the position of chairman of anotherone-tier board or the position of chairman of another supervisory board. In order for a company or foundation to be regarded as large, it must meet at least two of the following criteria: (i) the value of the assets according to the balance sheet with explanatory notes, considering the acquisition or manufacturing price, exceeds EUR 17.520 million; (ii) the net turnover exceeds EUR 3540 million; or (iii) the average number of employees equals or exceeds 250. During the financial year 20132016 all members of the Board of Management complied with the limitations on Non-ExecutiveNon- Executive Directorships described above.
Pursuant to newSince 2013, Dutch legislation on board diversity effective January 1, 2013,provided that the Company must pursue a policy of having at least 30% of the seats on the Board of Management held by men and at least 30% of the seats held by women. The relevant rule will ceaseceased to have effect on January 1, 2016.2016, but a bill aimed at reintroducing the rule was adopted by the Dutch House of Representatives (Tweede Kamer) in February 2017. For more details on board diversity please be referredrefer to thesection 8.1, Report of the Corporate Governance and Nomination & Selection Committee in, of this Annual Report.report.
New Dutch legislation on conflicts of interests effective January 1, 2013, provides that a member of the Board of Management may not participate in the adoption of resolutions if he or she has a direct or indirect personal conflict of interest with the Company or related enterprise. If all members of the Board of Management have a conflict, the resolution concerned will be adopted by the Supervisory Board. The Company’s corporate governance includes rules to specify situations in which a (potential) conflict may exist, to avoid (potential) conflicts of interests as much as possible, and to deal with such conflicts should they arise. The rules on conflicts of interests apply to the other members of the Executive Committee correspondingly.
Relevant matters relating to conflicts of interests, if any, shall be mentioned in the Annual Report for the financial year in question. No such matters have occurred during the financial year 2013.2016.
Amount and composition of the remuneration of the Board of Management
The remuneration of the individual members of the Board of Management is determined by the Supervisory Board on the proposal of the Remuneration Committee of the Supervisory Board, and must be consistent with the policy thereon as adopted by the General Meeting of Shareholders. The current remuneration policy applicable to the Board of Management was adopted by the 2013 Annual General Meeting of Shareholders, and is published on the Company’s website. A full and detailed description of the composition of the remuneration of the individual members of the Board of Management is included in chapter 9, Supervisory Board report,section 8.2, Report of the Remuneration Committee, of this report.
Pursuant to new Dutch legislation, effective January 1, 2014,the implementation of the remuneration ofpolicy during the members of the Board of Management and the Supervisory Boardfinancial year must be included as a separate agenda item in the convening notice for a general meetingGeneral Meeting of shareholdersShareholders and must be dealt with before the meeting can proceed to consider and adopt the Annual Accounts.
The remuneration structure of the Company, including severance pay, is such that it promotes the interests of the Company in the medium and long-term, does not encourage members of the Board of Management to act in their own interests and neglect the interests of the Company, and does not reward failing members of the Board of Management upon termination of their employment. The level and structure of remuneration shall be determined in the light of factors such as the results, the share price performance and other developments relevant to the Company. Deviations on elements of the remuneration policy in extraordinary circumstances, when deemed necessary in the interests of the Company, will be disclosed in the Annual Report or, in case of an appointment, in good time prior to the appointment of the person concerned.
The main elementsAll current members of the contractBoard of employmentManagement are engaged by means of a newservices agreement (overeenkomst van opdracht), as Dutch legislation prohibits a member of the Board of Management—Management to be employed by means of a contract of employment. In case of the appointment orre-appointment of a member of the Board of Management, the main elements of the services agreement - including the amount of the fixed base salary,compensation, the structure and amount of the variable remunerationcompensation component, any severance plan, pension arrangements and the general performance criteria - shall be made public no later than at the time of issuance of the notice convening the General Meeting of Shareholders in which a proposal for(re-)appointment of that member of the Board of Management has been placed on the agenda. In compliance with the Dutch Corporate Governance Code, the term of contractthe services agreement of the members of the Board of Management is set at four years and, in case of termination, severance payment is limited to a maximum of one year’s base salary; if the maximum of one-year’s salary would be manifestly unreasonable for a member of the Board of Management who is dismissed during his first term of office, the member of the Board of Management shall be eligible for a severance payment not exceeding twice the annual salary.
All current members of the Board of Management are employed by means of a contract of employment. Pursuant to new Dutch legislation, effective January 1, 2013, new members of the Board of Management will be employed by means of a services agreement (overeenkomst van opdracht).
compensation. From 2003 until 2013, Philips maintained a Long-Term Incentive Plan (‘LTI Plan’)(LTI Plan) consisting of a mix of restricted shares rights and stock options for members of the Board of Management, Philips executives and other key employees. A fully revisedSince the full revision in 2013 of the LTI Plan applicable to members of the Board of Management, was approved by the 2013 General Meeting of Shareholders. The revised plan consists of performance shares only, with a three year post-grant performance measurement. For more details please be referredrefer to the section 9.2,8.2, Report of the Remuneration Committee, of this report.
100 Annual Report 2016
Corporate governance 9.1
Theso-called ultimum remedium ultimum-remedium clause and claw-back clause of best practice provisions II.2.10 and II.2.11 of the Dutch Corporate Governance Code are applicable to Annual Incentive payments and LTI grants for the year 2009 onwards to all members of the Board of Management. In respect of the LTI grants, the ultimum remedium clause can be applied to the performance-related actual number of stock options, restricted share rights and/or performance shares that is granted. In addition, pursuant to newly adopted Dutch legislation effective(effective January 1, 2014,2014), the Supervisory Board will beis authorized to change unpaid bonuses awarded to members of the Board of Management if payment or delivery of the bonus would be unacceptable according to the principles of reasonableness and fairness. The Company, which in this respect may also be represented by the Supervisory Board or a special representative appointed for this purpose by the General Meeting of Shareholders, may also claim repayment of bonuses paid or delivered (after December 31, 2013) insofar as these have been granted on the basis of incorrect information on the fulfillment of the relevant performance criteria or other conditions. Bonuses are broadly defined as ‘non-fixed’‘non-fixed’ remuneration, either in cash or in the form of share-based compensation, that is conditional in whole or in part on the achievement of certain targets or the occurrence of certain circumstances. The explanatory notes to the balance sheet shall report on any moderation and/or claim for repayment of board remuneration. The newly adoptedNo such moderation or claim for repayment has occurred during the financial year 2016.
Dutch legislation also introducesprovides for an obligation for the Company to reduce the remuneration of a member of the Board of Management, if and to the extent the value of such member’s share-based remuneration would have increased as a result of the announcement of a large transaction (requiring shareholder approval) or a public offer for the Company.
Members of the Board of Management hold shares in the Company for the purpose of long-term investment and are required to refrain from short-term transactions in Philips securities. According to the Philips Rules of Conduct on Inside Information, members of the Board of Management are only allowed to trade in Philips securities (including the exercise of stock options) during ‘windows’ of twenty business days following the publication of annual and quarterly results (provided the person involved has no ‘inside information’ regarding Philips at that time unless an exemption is available). Furthermore, the Rules of Procedure of the Board of Management and Executive Committee contain provisions concerning ownership of and transactions innon-Philips securities by members of the Board of Management. Members of the Board of Management are prohibited from trading, directly or indirectly, in securities of any of the companies belonging to the peer group, during one week preceding the disclosure of Philips’ annual or quarterly results. TheseThe rules referred to above in this paragraph apply to members of the Executive Committee correspondingly. Transactions in shares in the Company carried out by members of the Board of Management or members of the Supervisory Board and other Insiders (if applicable) are notified to the Netherlands Authority for the Financial Markets (AFM) in accordance with Dutch lawthe European Market Abuse Regulation and, if necessary, to other relevant authorities.
Indemnification of members of the Board of Management and Supervisory Board
Unless the law provides otherwise, the members of the Board of Management and of the Supervisory Board shall be reimbursed by the Company for various costs and expenses, such as the reasonable costs of defending claims, as formalized in the Articles of Association. Under certain circumstances, described in the Articles of Association, such as an act or failure to act by a member of the Board of Management or a member of the Supervisory Board that can be characterized as intentional (‘opzettelijk’(opzettelijk), intentionally reckless (‘(bewust roekeloos’roekeloos) or seriously
Annual Report 2013 143
10 Corporate governance 10.1 - 10.2
culpable (‘(ernstig verwijtbaar’verwijtbaar), there will be no entitlement to this reimbursement unless the law or the principles of reasonableness and fairness require otherwise. The Company has also taken out liability insurance (D&O - Directors&O-Directors & Officers) for the persons concerned.
In line with regulatory requirements, the Company’s policy forbids personal loans to and guarantees on behalf of members of the Board of Management or the Supervisory Board, and no loans and guarantees have been granted and issued, respectively, to such members in 2013,2016, nor are any loans or guarantees outstanding as of December 31, 2013.2016.
The aggregate share ownership of the members of the Board of Management and the Supervisory Board represents less than 1% of the outstanding ordinary shares in the Company.
Risk management approach
Within Philips, risk management forms an integral part of business management. The Company has implemented a risk management and internal control system that is designed to provide reasonable assurance that strategic objectives are met by creating focus, by integrating management control over the Company’s operations, by ensuring compliance with applicable laws and regulations and by safeguarding the reliability of the financial reporting and its disclosures. The Executive Committee reports on and accounts for internal risk management and control systems to the Supervisory Board and its Audit Committee. The Company has designed its internal control system in accordance withbased on the recommendations of“Internal Control-Integrated Framework (2013)” established by the Committee of Sponsoring Organizations of the Treadway Commission (COSO).
Annual Report 2016 101
Corporate governance 9.1
The Company’s risk management approach is embedded in the periodic business planning and review cycle and forms an integral part of business management. On the basis of risk assessments, management determines the risks and appropriate risk responses related to the achievement of business objectives and critical business processes. Risk factors and the risk management approach, as well as the sensitivity of the Company’s results to external factors and variables, are described in more detail in [Risk management].chapter 5, Risk management, of this report. Significant changes and improvements in the Company’s risk management and internal control system have been discussed with the Supervisory Board’s Audit Committee and the external auditor and are disclosed in that section as well.
With respect to financial reporting a structured self-assessment and monitoring process is used company-wide to assess, document, review and monitor compliance with internal control over financial reporting. Internal representations received from management, regular management reviews, reviews of the design and effectiveness of internal controls and reviews in corporateGroup and divisional auditBusiness Group, Market and Function Audit & Risk committees are integral parts of the Company’s risk management approach. On the basis thereof, the Board of Management confirms that internal controls over financial reporting provide a reasonable level of assurance that the financial reporting does not contain any material inaccuracies, and confirms that these controls have properly functioned in 2013.2016. The financial statements fairly represent the financial condition and result of operations of the Company and provide the required disclosures.
It should be noted that the above does not imply that these systems and procedures provide certainty as to the realization of operational and financial business objectives, nor can they prevent all misstatements, inaccuracies, errors, fraud andnon-compliances with rules and regulations.
In view of the above, the Board of Management believes that it is in compliance with the requirements of recommendation II.1.4. of the Dutch Corporate Governance Code. The above statement on internal controls should not be construed as a statement in response to the requirements of section 404 of the US Sarbanes-Oxley Act. The statement as to compliance with section 404 is set forth in the section 10.1, Management’s report on internal control over financial reporting, of this Annual Report.report.
Next to the Philips General Business Principles (GBP), the Company has a financial codeFinancial Code of ethicsEthics which additionally applies to certaindesignated senior officers,executives, including the CEO and the CFO, and to employees performing an accounting or financial function (the financial codeworking in the Finance and Accounting departments. The GBP and the Financial Code of ethics hasEthics have been published on the Company’s website). website.
The Company, through the Supervisory Board’s Audit Committee, also has appropriate procedures in place for the receipt, retention and treatment of complaints received by the Company regarding accounting, internal accounting controls or auditing matters and the confidential, anonymous submission by employees of concerns regarding questionable accounting or auditing matters. Internal ‘whistleblowers’ have the opportunity, without jeopardizing their position,The Company’s whistleblower mechanisms furthermore allow employees and, since May 2015, external parties to confidentially and anonymously report on irregularities of a general, operational or financial nature and to report complaints about members of the Executive Committeegrievances to the ChairmanCompany, also on other topics than those that relate to questionable accounting or auditing matters. The Company does not tolerate retaliation against (internal) whistleblowers who report a concern in good faith. More information on GBP governance and our whistleblower procedures can be found inchapter 12, Sustainability statements, of the Supervisory Board.this report andchapter 5, Risk management, of this report.
In view of the requirements under the US Securities Exchange Act, procedures are in place to enable the CEO and the CFO to provide certifications with respect to the Annual Report on Form20-F.
A Disclosure Committee is in place, which advises the various officers and departments involved, including the CEO and the CFO, on the timely review, publication and filing of periodic and current (financial) reports. In addition to the certification by the CEO and the CFO under US law, each individual member of the Supervisory Board of Management and the Supervisory Board of Management must, under Dutch law, sign the Group and Company financial statements being disclosed and submitted to the General Meeting of Shareholders for adoption. If one or more of their signatures is missing, this shall be stated, and the reasons given for this. The members of the Board of Management issue the responsibility statement with regardas referred to inchapter 11,10, Group financial statements, of this report, as required by applicable Dutch company law and securities law.
Introduction
The Supervisory Board supervises the policies of the Board of Management and Executive Committee and the general course of affairs of Philips and advises the executive management thereon. The Supervisory Board, in thetwo-tier corporate structure under Dutch law, is a separate body that is independent of the Board of Management. Its independent character is also reflected in the requirement that members of the Supervisory Board can be neither a member of the Board of Management nor an employee of the Company. The Supervisory Board considers all its members to be independent pursuant to the Dutch Corporate Governance Code and under the applicable US Securities and Exchange Commission standards.
102 Annual Report 2016
Corporate governance 9.2
The Supervisory Board, acting in the interests of the Company and the Group and taking into account the relevant interest of the Company’s stakeholders, supervises and advises the Board of Management and Executive Committee in performing its management tasks and setting the direction of the Group’s business, including (a) the Philips group’sGroup’s performance, (b) the Philips group’sGroup’s general strategy and the risks connected to its business activities, (c) the operational and financial objectives, (d) the parameters to be approved in relation to the strategy, (e) corporate social responsibility issues (f) the structure and management of the systems of internal business controls, (g) the financial reporting process, (h) the compliance with applicable laws and regulations, (i) the company-shareholdersCompany/shareholder relationship, and (j) the corporate governance structure of the Company. The Group’s strategy and major management decisions are discussed with and approved by the Supervisory Board. For a description of further responsibilities and tasks of the Supervisory Board please refer to the Supervisory Board’s Rules of Procedure which isare published on the Company’s website.
In its report, the Supervisory Board describes the composition and functioning of the Supervisory Board and its committees, the activities of the board and its committees in the financial year 2016, the number of committee meetings and the main items discussed.
Rules of Procedure of the Supervisory Board
The Supervisory Board’s Rules of Procedure set forth its own governance rules (including meetings, items to be discussed, resolutions, appointment andre-election, committees, conflicts of interests, trading in securities, profile of the Supervisory Board). Its composition follows the profile, which aims for an appropriate combination of knowledge and experience among its members encompassing marketing, technological, manufacturing, financial, economic, social and legal aspects of international business and government and public administration in relation to the global and multi- productmulti-product character of the Group’s businesses. The Supervisory Board attaches great importance to diversity in its composition. More particularly, it aims at having members with a European and a non- Europeannon-European background (nationality, working experience or otherwise) and one or more members with an executive or similar position in business or society no longer than 5 years ago.
Pursuant to newSince 2013, Dutch legislation on board diversity effective January 1, 2013,provided that the Company shallmust pursue a policy of having at least 30% of the seats on the Supervisory Board held by men and at least 30% of the seats held by women. The relevant rule will ceaseceased to have effect on January 1, 2016.2016, but a bill aimed at reintroducing the rule was adopted by the Dutch House of Representatives (Tweede Kamer) in February 2017. For more
144 Annual Report 2013
10 Corporate governance 10.2 - 10.2
details on board diversity please be referredrefer tosection 9.1,8.1, Report of the Corporate Governance and Nomination & Selection Committee, of this report.
The Rules of Procedure of the Supervisory Board are published on the Company’s website. They include the charters of its committees as mentioned in the Dutch Corporate Governance Code, to which the plenary Supervisory Board, while retaining overall responsibility, has assigned certain tasks: the Corporate Governance and Nomination & Selection Committee, the Audit Committee, and the Remuneration Committee and (since 2015) the Quality & Regulatory Committee. Each committee reports to, and submits its minutes for information to the Supervisory Board. Please refer tochapter 8, Supervisory Board report, of this report for more information on the composition and activities of these committees.
In line with US and Dutch best practices, the Chairman of the Supervisory Board must be independent pursuant to the Dutch Corporate Governance Code and under the applicable US standards. Furthermore, the Dutch Corporate Governance Code allows a maximum of one member of each Supervisory Board committee not to be independent (as defined by the Code). As mentioned in the introduction ofto this section 10.211.2 above, the Supervisory Board considers all its members to be independent.
The Supervisory Board is assisted by the General Secretary of the Company. The General Secretary sees to it that correct procedures are followed and that the Supervisory Board acts in accordance with its statutory obligations and its obligations under the Articles of Association. Furthermore, the General Secretary assists the Chairman of the Supervisory Board in the actual organization of the affairs of the Supervisory Board (information, agenda, evaluation, introductory program) and is the contact person for interested parties who want to make concerns known to the Supervisory Board. The General Secretary shall be appointed, either on the recommendation of the Supervisory Board or otherwise, be appointed and may be dismissed by the Board of Management, after the approval of the Supervisory Board has been obtained.
(Term of) Appointment, individual data and conflicts of interests
The Supervisory Board consists of at least five members (currently eight)seven), including a Chairman, Vice-Chairman and Secretary. The Dutch ‘structure‘large company regime’ does not apply to the Company itself. Members are currently electedappointed by the General Meeting of Shareholders for fixed terms of four years, upon a binding recommendation from the Supervisory Board.
According to the Company’s Articles of Association, this binding recommendation may be overruled by a resolution of the General Meeting of Shareholders adopted by a simple majority of the votes cast and representing at leastone-third of the issued share capital. If a simple majority of the votes cast is in favor of the resolution to overrule the binding recommendation, but such majority does not represent at leastone-third of the issued share capital, a new
Annual Report 2016 103
Corporate governance 9.2
meeting may be convened at which the resolution may be passed by a simple majority of the votes cast, regardless of the portion of the issued share capital represented by such majority. In the event a binding recommendation has been overruled, a new binding recommendation shall be submitted to the General Meeting of Shareholders. If such second binding recommendation has been overruled, the General Meeting of Shareholders shall be free to appoint a board member.
There is no age limit applicable, and members may be re-elected twice.are eligible forre-election twice (unless the Supervisory Board resolves to deviate in a specific case). The date of expiration of the terms of Supervisory Board members is published on the Company’s website.
Individual data on the members of the Supervisory Board are published in the Annual Report, and updated on the Company’s website. Members may be suspended and dismissed by the General Meeting of Shareholders. In the event of inadequate performance, structural incompatibility of interests, and in other instances in which resignation is deemed necessary in the opinion of the Supervisory Board, the Supervisory Board shall submit to the General Meeting of Shareholders a proposal to dismiss the respective member of the Supervisory Board.
After their appointment, all members of the Supervisory Board shall follow an introductory program, which covers general financial and legal affairs, financial reporting by the Company, any specific aspects that are unique to the Company and its business activities, and the responsibilities of a Supervisory Board member.
Any need for further training or education of members will be reviewed annually, also on the basis of an annual evaluation survey.
Under the Dutch Corporate Governance Code, no member of the Supervisory Board shall hold more than five supervisory board memberships of Dutch listed companies, the chairmanship of a supervisory board counting as two regular memberships. In addition, new Dutch legislation effective January 1, 2013, provides that no member of the Supervisory Board shall hold more than five Non-Executive Directorships at ‘large’ companies or foundations as defined under Dutch law (seesection 10.1,9.1, Board of Management and Executive Committee, of this report), with a position as chairman counting for two. During the financial year 20132016 all members of the Supervisory Board complied with the limitations onNon-Executive Directorships described above.
New Dutch legislation on conflicts of interests effective January 1, 2013, provides that a member of the Supervisory Board may not participate in the adoption of resolutions if he or she has a direct or indirect personal conflict of interest with the Company or related enterprise. If all members of the Supervisory Board have a conflict, the resolution concerned will be adopted by the General Meeting of Shareholders. The Company’s corporate governance includes rules to specify situations in which a (potential) conflict may exist, to avoid (potential) conflicts of interests as much as possible, and to deal with such conflicts should they arise.
Relevant matters relating to conflicts of interests, if any, shall be mentioned in the Annual Report for the financial year in question. No decisions to enter into material transactions in which there are conflicts of interest with members of the Supervisory Board were taken during the financial year 2013.2016.
Meetings of the Supervisory Board
The Supervisory Board meets at least six times per year, including a meeting on strategy. The Supervisory Board, on the advice of its Audit Committee, also discusses, in any event at least once a year, the main risks of the business, and the result of the assessment of the structure and operation of the internal risk management and control systems, as well as any significant changes thereto. The members of the Executive Committee attend meetings of the Supervisory Board except in matters such as the desired profile, composition and competence of the Supervisory Board and the Executive Committee, as well as the remuneration and performance of individual members of the Executive Committee and the conclusions that must be drawn on the basis thereof. In addition to these items, the Supervisory Board, being responsible for the quality of its own performance, discusses, at least once a year on its own, without the members of the Executive Committee being present, (i) both its own functioning and that of the individual members, and the conclusions that must be drawn on the basis thereof, as well as (ii) both the functioning of the Board of Management and that of the individual members, and the conclusions that must be drawn on the basis thereof. The President/CEO and other members of the Executive Committee have regular contacts with the Chairman and other members of the Supervisory Board. The Executive Committee is required to keep the Supervisory Board informed of all facts and developments concerning Philips that the Supervisory Board may need in order to function as required and to properly carry out its duties, to consult it on important matters and to submit certain important decisions to it for its prior approval. The Supervisory Board and its individual members each have their own responsibility to request from the Executive Committee and the external auditor all information that the Supervisory Board needs in order to be able to carry out its duties properly as a supervisory body. If the Supervisory Board considers it necessary, it may obtain information from officers and external advisers of the Company. The Company provides the necessary means for this purpose. The Supervisory Board may also require that certain officers and external advisers attend its meetings.
104 Annual Report 2016
Corporate governance 9.2
The Chairman of the Supervisory Board
The Supervisory Board’s Chairman will see to it that: (a) the members of the Supervisory Board follow their introductory program, (b) the members of the Supervisory Board receive in good time all information which is necessary for the proper performance of their duties, (c) there is sufficient time for consultation and decision-making by the Supervisory Board, (d) the committees of the Supervisory Board function properly, (e) the performance of the Executive Committee members and Supervisory Board members is assessed at least once a year, and (f) the Supervisory Board elects a Vice-Chairman. The Vice-Chairman of the Supervisory Board shall deputize for the Chairman when the occasion arises. The Vice- ChairmanVice-Chairman shall act as the point of contact offor individual members of the Supervisory Board or the Board of Management concerning the functioning of the Chairman of the Supervisory Board.
Remuneration of the Supervisory Board and share ownership
The remuneration of the individual members of the Supervisory Board, as well as the additional remuneration for its Chairman and the members of its committees is determined by the General Meeting of Shareholders. The remuneration of a Supervisory Board member is not dependent on the results of the Company. Further details are published in the Supervisory Board report.
Annual Report 2013 145
10 Corporate governance 10.2 - 10.3
Shares or rights to shares shall not be granted to a Supervisory Board member. In accordance with the Rules of Procedure of the Supervisory Board, any shares in the Company held by a Supervisory Board member are long-term investments. The Supervisory Board has adopted a policy on ownership of and transactions innon-Philips securities by members of the Supervisory Board. This policy is included in the Rules of Procedure of the Supervisory Board.
The Corporate Governance and Nomination & Selection Committee
The Corporate Governance and Nomination & Selection Committee consists of at least the Chairman and Vice-Chairman of the Supervisory Board. The Committee reviews the corporate governance principles applicable to the Company at least once a year, and advises the Supervisory Board on any changes to these principles as it deems appropriate. It also (a) draws up selection criteria and appointment procedures for members of the Supervisory Board, the Board of Management and the Executive Committee; (b) periodically assesses the size and composition of the Supervisory Board, the Board of Management and the Executive Committee, and makes the proposals for a composition profile of the Supervisory Board, if appropriate; (c) periodically assesses the functioning of individual members of the Supervisory Board, the Board of Management and the Executive Committee, and reports on this to the Supervisory Board. The Committee also consults with the President/CEO and the Executive Committee on candidates to fill vacancies on the Supervisory Board, the Board of Management and the Executive Committee, and advises the Supervisory Board on the candidates for appointment. It further supervises the policy of the Executive Committee on the selection criteria and appointment procedures for Philips Executives.
The Remuneration Committee
The Remuneration Committee meets at least twice a year and is responsible for preparing decisions of the Supervisory Board on the remuneration of individual members of the Board of Management and the Executive Committee.
The Remuneration Committee prepares an annual remuneration report. The remuneration report contains an account of the manner in which the remuneration policy has been implemented in the past financial year, as well as an overview of the implementation of the remuneration policy planned by the Supervisory Board for the next year(s). The Supervisory Board aims to have appropriate experience available within the Remuneration Committee. No more than one member of the Remuneration Committee shall be an executive board member of another Dutch listed company.
In performing its duties and responsibilities, the Remuneration Committee is assisted by an external consultant and anin-house remuneration expert acting on the basis of a protocol ensuring that the expert acts on the instructions of the Remuneration Committee and on an independent basis in which conflicts of interests are avoided.
The Audit Committee
The Audit Committee meets at least four times a year, before the publication of the annual, semi-annual and quarterly results. All of the members of the Audit Committee are considered to be independent under the applicable US Securities and Exchange Commission rules and at least one of the members of the Audit Committee, which currently consists of four members of the Supervisory Board, is a financial expert, as set out in the Dutch Corporate Governance Code, and each member is financially literate. In accordance with this code, a financial expert has relevant knowledge and experience of financial administration and accounting at the company in question. None of the members of the Audit Committee is designated as an Audit Committee financial expert, as defined under the regulations of the US Securities and Exchange Commission. The Supervisory Board considers the fact of being compliant with the Dutch Corporate Governance Code, in combination with the knowledgeexpertise and experience available in the Audit Committee, as well as the possibility to take advice from internal and external experts and advisors, to be sufficient for the fulfillment of the tasks and responsibilities of the Audit Committee. None of the members of the Audit Committee is an Audit Committee financial expert as defined under the regulations of the US Securities and Exchange Commission. The Audit Committee may not be chaired by the Chairman of the Supervisory Board or by a (former) member of the Board of Management.
All members of the Audit Committee are independent
Annual Report 2016 105
Corporate governance 9.2
The tasks and functions of the Audit Committee, as described in its charter, which is published on the Company’s website as part of the Rules of Procedure of the Supervisory Board, include the duties recommended in the Dutch Corporate Governance Code. More specifically, the Audit Committee assists the Supervisory Board in fulfilling its oversight responsibilities for the integrity of the Company’s financial statements, the financial reporting process, the system of internal business controls and risk management, the internal and external audit process, the internal and external auditor’s qualifications, its independence and its performance, as well as the Company’s process for monitoring compliance with laws and regulations and the General Business Principles (GBP). It reviews the Company’s annual and interim financial statements, includingnon-financial information, prior to publication and advises the Supervisory Board on the adequacy and appropriateness of internal control policies and internal audit programs and their findings.
In reviewing the Company’s annual and interim statements, includingnon-financial information, and advising the Supervisory Board on internal control policies and internal audit programs, the Audit Committee reviews matters relating to accounting policies and compliance with accounting standards, compliance with statutory and legal requirements and regulations, particularly in the financial domain.
Important findings and identified risks are examined thoroughly by the Audit Committee in order to allow appropriate measures to be taken. With regard to the internal audit, the Audit Committee, in cooperation with the external auditor, reviews the internal audit charter, audit plan, audit scope and its coverage in relation to the scope of the external audit, staffing, independence and organizational structure of the internal audit function.
With regard to the external audit, the Audit Committee reviews the proposed audit scope, approach and fees, the independence of the external auditor, its performance and its(re-)appointment, audit and permittednon-audit services provided by the external auditor in conformity with the Philips Policy on Auditor Independence, as well as any changes to this policy. The Audit Committee also considers the report of the external auditor and its report with respect to the annual financial statements. According to the procedures, the Audit Committee acts as the principal contact for the external auditor if the auditor discovers irregularities in the content of the financial reports. It also advises on the Supervisory Board’s statement to shareholders in the annual accounts. The Audit Committee periodically discusses the Company’s policy on business controls, the GBP including the deployment thereof, overviews on tax, IT, litigation and legal proceedings, environmental exposures, financial exposures in the area of treasury, real estate, pensions, and the Group’s major areas of risk. The Company’s external auditor, in general, attends all Audit Committee meetings and the Audit Committee meets separately at least on a quarterly basis with each of the President/CEO, the CFO, the internal auditor and the external auditor.
The Quality & Regulatory Committee
The Quality & Regulatory Committee has been established by the Supervisory Board in view of the continued relevance of the quality of the Company’s products, systems, services and software and the development, testing, manufacturing, marketing and servicing thereof, and regulatory requirements relating thereto. The Quality & Regulatory Committee assists the Supervisory Board in fulfilling its oversight responsibilities in this area, whilst recognizing that the Audit Committee assists the Supervisory Board in the oversight of other areas of regulatory, compliance and legal matters.
The Quality & Regulatory Committee consists of at least two members and meets as often as is necessary or desirable for the performance of its duties.
10.39.3 General Meeting of Shareholders
Introduction
A General Meeting of Shareholders is held at least once a year to discuss the Annual Report, including the report of the Board of Management, the annual financial statements with explanatory notes thereto and additional information required by law, and the Supervisory Board report, any proposal concerning dividends or other distributions, the(re-)appointment of members of the Board of Management and Supervisory Board (if any), important management decisions as required by Dutch law, and any other matters proposed by the Supervisory Board, the Board of Management or shareholders in accordance with the provisions of the Company’s Articles of Association. The Annual Report, the financial statements and other regulated information such as defined in the Dutch Act on Financial Supervision (Wet(Wet op het Financieel Toezicht)financieel toezicht), will solely be published in English. As a separate agenda item and in application of Dutch law, the General Meeting of Shareholders discusses the discharge of the members of the Board of Management and the Supervisory Board from responsibility for the performance of their respective duties in the preceding financial year. However, this discharge only covers matters that are known to the Company and the General Meeting of Shareholders when the resolution is adopted. The General Meeting of Shareholders is held in Eindhoven, Amsterdam, Rotterdam, The Hague, Utrecht or Haarlemmermeer (Schiphol(including Schiphol Airport) no later than six months after the end of the financial year.
Meetings are convened by public notice, via the Company’s website or other electronic means of communication, and to registered shareholders are notified by letter or by the use of electronic means of communication, at least 42 days prior to the
106 Annual Report 2016
Corporate governance 9.3
(Extraordinary) General Meeting of Shareholders. Extraordinary General Meetings of Shareholders may be convened by the Supervisory Board or the Board of Management if deemed necessary and must be held if shareholders jointly representing at least 10% of the outstanding share capital make a written request to that effect to the Supervisory Board and the Board of Management, specifying in detail the business to be dealt with. The agenda of a General Meeting of Shareholders shall contain such business as may be placed thereon by the Board of Management or the Supervisory Board, and agenda items will be explained where necessary in writing. The agenda shall list which items are for discussion and which items are to be voted upon. Material
146 Annual Report 2013
10 Corporate governance 10.3 - 10.4
Material amendments to the Articles of Association and resolutions for the appointment of members of the Board of Management and Supervisory Board shall be submitted separately to the General Meeting of Shareholders, it being understood that amendments and other proposals that are connected in the context of a proposed (part of the) governance structure may be submitted as one proposal. In accordance with the Articles of Association and Dutch law, requests from shareholders for items to be included on the agenda will generally be honored, subject to the Company’s rights to refuse to include the requested agenda item under Dutch law, and the Dutch Corporate Governance Code, provided that such requests are made in writing at least 60 days before a General Meeting of Shareholders to the Board of Management and the Supervisory Board by shareholders representing at least 1% of the Company’s outstanding capital or, according to the official price list of NYSE Euronext Amsterdam, representing a value of at least EUR 50 million. Written requests may be submitted electronically and shall comply with the procedure stipulated by the Board of Management, which procedure is posted on the Company’s website.
Pursuant to newDutch legislation, effective July 1, 2013, shareholders requesting an item to be included on the agenda, have an obligation to disclose their full economic interest (i.e. long position and short position) to the Company. The Company has the obligation to publish such disclosures on its website.
Main powers of the General Meeting of Shareholders
All outstanding shares carry voting rights. The main powers of the General Meeting of Shareholders are to appoint, suspend and dismiss members of the Board of Management and of the Supervisory Board, to adopt the annual accounts, declare dividends and to discharge the Board of Management and the Supervisory Board from responsibility for the performance of their respective duties for the previous financial year, to appoint the external auditor as required by Dutch law, to adopt amendments to the Articles of Association and proposals to dissolve or liquidate the Company, to issue shares or rights to shares, to restrict or excludepre-emptive rights of shareholders and to repurchase or cancel outstanding shares. Following common corporate practice in the Netherlands, the Company each year requests limited authorization to issue (rights to) shares, to restrict or excludepre-emptive rights and to repurchase shares. In compliance with Dutch law, decisions of the Board of Management that are sofar-reaching that they would greatly change the identity or nature of the Company or the business require the approval of the General Meeting of Shareholders. This includes resolutions toto: (a) transfer the business of the Company, or almost the entire business of the Company, to a third partythird-party (b) enter into or discontinue long-term cooperation by the Company or a subsidiary with another legal entity or company or as a fully liable partner in a limited partnership or ordinary partnership, if this cooperation or its discontinuation is of material significance to the Company or (c) acquire or dispose of a participating interest in the capital of a company to the value of at leastone-third of the amount of the assets according to the balance sheet and notes thereto or, if the Company prepares a consolidated balance sheet, according to the consolidated balance sheet and notes thereto as published in the last adopted annual accounts of the Company, by the Company or one of its subsidiaries. Thus the Company applies principle IV.1 of the Dutch Corporate Governance Code within the framework of the Articles of Association and Dutch law and in the manner as described in this corporate governance report.
The Board of Management and Supervisory Board are also accountable, at the Annual General Meeting of Shareholders, for the policy on the additions to reserves and dividends (the level and purpose of the additions to reserves, the amount of the dividend and the type of dividend). This subject is dealt with and explained as a separate agenda item at the Annual General Meeting of Shareholders. Philips aims for a sustainable and stable dividend distribution to shareholders in the long term. A resolution to pay a dividend is dealt with as a separate agenda item at the General Meeting of Shareholders.
The Board of Management and the Supervisory Board are required to provide the General Meeting of Shareholders with all requested information, unless this would be prejudicial to an overriding interest of the Company. If the Board of Management and the Supervisory Board invoke an overriding interest in refusing to provide information, reasons must be given. If a serious private bid is made for a business unit or a participating interest and the value of the bid exceeds a certain threshold (currentlyone-third of the amount of the assets according to the balance sheet and notes thereto or, if the Company prepares a consolidated balance sheet, according to the consolidated balance sheet and notes thereto as published in the last adopted annual accounts of the Company), and such bid is made public, the Board of Management shall, at its earliest convenience, make public its position on the bid and the reasons for this position.
Annual Report 2016 107
Corporate governance 9.3
A resolution to dissolve the Company or change its Articles of Association can be adopted at thea General Meeting of Shareholders by at least three- fourthsthree-quarters of the votes cast, at which meeting more than half of the issued share capital is represented. If the requisite share capital is not represented, a further meeting shall be convened, to be held within eight weeks of the first meeting, to which no quorum requirement applies.
Furthermore, the resolution requires the approval of the Supervisory Board. If the resolution is proposed by the Board of Management, the adoption needs an absolute majority of votes and no quorum requirement applies to the meeting.
Repurchase and issue of (rights to) own shares
The 2013At the 2016 Annual General Meeting of Shareholders hasit was resolved to authorize the Board of Management, subject to the approval of the Supervisory Board, to acquire shares in the Company within the limits of the Articles of Association and within a certain price range up to and including November 2, 2014.11, 2017. The maximum number of shares the company may hold, will not exceed 10% of the issued share capital as of May 3, 2013,12, 2016, which number may be increased by 10% of the issued capital as of that same date in connection with the execution of share repurchase programs for capital reduction programs.
In addition, at the 20132016 Annual General Meeting of Shareholders it was resolved to authorize the Board of Management, subject to the approval of the Supervisory Board, to issue shares or grant rights to acquire shares in the Company as well as to restrict or exclude thepre-emption right accruing to shareholders up to and including November 2, 2014.11, 2017. This authorization is limited to a maximum of 10% of the number of shares issued as of May 3, 201312, 2016 plus 10% of the issued capital in connection with or on the occasion of mergers, and acquisitions.acquisitions and/or strategic alliances.
10.4 Logistics of the General9.4 Meeting of Shareholderslogistics and provision ofother information
Introduction
Pursuant to Dutch law, the record date for the exercise of the voting rights and the rights relating to General Meetings of Shareholders is set atas the 28th day prior to the day of the meeting. Shareholders registered aton such date are entitled to attend the meeting and to exercise the other shareholder rights (in the meeting in question) notwithstanding subsequent sale of their shares thereafter. This date will be published in advance of every General Meeting of Shareholders.
Information which is required to be published or deposited pursuant to the provisions of company law and securities law applicable to the Company and which is relevant to the shareholders, is placed and updated on the Company’s website, or hyperlinks are established. The Board of Management and Supervisory Board shall ensure that the General Meeting of Shareholders is informed of facts and circumstances relevant to proposed resolutions in explanatory notes to the agenda and, if deemed appropriate, by means of a ‘shareholders circular’ published on the Company’s website.
Resolutions adopted at a General Meeting of Shareholders shall be recorded by a civil law notary andco-signed by the chairman of the meeting; such resolutions shall also be published on the Company’s website within 15 days after the meeting. A draft summary of the discussions during the General Meeting of Shareholders, in the language of the meeting, is made available to shareholders, on request, no later than three months after the meeting. Shareholders shall have the opportunity to respond to this summary for three months, after which a final summary is adopted by the chairman of the meeting in question. Such final summary shall be made available on the Company’s website.
Registration, attending meetings and proxy voting
Holders of common shares who wish to exercise the rights attached to their shares in respect of a General Meeting of Shareholders, are required to register for such meeting. Shareholders may attend a General Meeting of Shareholders in person, or may grant a power of attorney to a third partythird-party to attend the meeting and to vote on their behalf. TheHolders of common shares in bearer form will also be able to give voting instructions via the internet (assuming the agenda for such meeting includes voting items). In addition, the Company will also distribute a voting instruction form for a General Meeting of Shareholders (assumingShareholders. By giving voting instructions via Internet or by returning the agenda for such meeting includes voting items). By returning this form, shareholders grant power to an independent proxy holder who will vote according to the instructions expressly given on the voting instruction form. Also other persons entitled to vote shall be given the possibility to give voting proxies or instructions to an independent third partythird-party prior to the meeting. Details on the registration for meetings, attendingattendance and proxy voting will be included in the notice convening a General Meeting of Shareholders. The Dutch Shareholders Communication Channel decided to terminate its activities as per the end
Annual Report 2013 147
10 Corporate governance 10.4 - 10.4
of 2013. Their decision follows the entry into force of new legislation on July 1, 2013 which provides a legal basis in Dutch law for shareholder communication.
Preference shares and the Stichting Preferente Aandelen Philips
As a means to protect the Company and its stakeholders against an unsolicited attempt to obtain (de facto) control of the Company, the General Meeting of Shareholders in 1989 adopted amendments to the Company’s Articles of Association that allow the Board of Management and the Supervisory Board to issue (rights to) preference shares to a third party.third-party. As a result, the Stichting Preferente Aandelen Philips (the ‘Foundation’)Foundation) was created, which was granted the right to acquire preference shares in the Company. The mere notification that the Foundation wishes to exercise its rights, should a third partythird-party ever seem likely in the judgment of the Foundation to obtain (de facto) control of the Company, will result in the preference shares
108 Annual Report 2016
Corporate governance 9.4
being effectively issued. The Foundation may exercise this right for as many preference shares as there are ordinary shares in the Company outstanding at that time. No preference shares have been issued as of December 31, 2013.2016. In addition, the Foundation has the right to file a petition with the Enterprise Chamber of the Amsterdam Court of Appeal to commence an inquiry procedure within the meaning of section 2:344 Dutch Civil Code.
The object of the Foundation is to represent the interests of the Company, the enterprises maintained by the Company and its affiliated companies within the Group, in such a way that the interests of Philips, those enterprises and all parties involved with them are safeguarded as effectively as possible, and that they are afforded maximum protection against influences which, in conflict with those interests, may undermine the autonomy and identity of Philips and those enterprises, and also to do anything related to the above ends or conducive to them. In the event of (an attempt at) a hostile takeover or other attempt to obtain (de facto) control of the Company this arrangement will allow the Company and its Board of Management and Supervisory Board to determine its position in relation to the third partythird-party and its plans, seek alternatives and defend Philips’ interests and those of its stakeholders from a position of strength. The members of the self-electing Board of the Foundation are Messrs S.D. de Bree, F.J.G.M. Cremers andP.A.F.W. Elverding, M.W. den Boogert.Boogert and F.J.G.M. Cremers. No Philips board members or officers are represented on the board of the Foundation.
The Company does not have any other anti-takeover measures in the sense of other measures which exclusively or almost exclusively have the purpose of frustrating future public bids for the shares in the capital of the Company in case no agreement is reached with the Board of Management on such public bid.
Furthermore, the Company does not have measures which specifically have the purpose of preventing a bidder who has acquired 75% of the shares in the capital of the Company from appointing or dismissing members of the Board of Management and subsequently amending the Articles of Association of the Company. It should be noted that also in the event of (an attempt at) a hostile takeover or other attempt to obtain (de facto) control of the Company, the Board of Management and the Supervisory Board are authorized to exercise in the interests of Philips all powers vested in them.
Audit of theAnnual financial reporting and the position of the external auditorstatements
The annual financial statements are prepared by the Board of Management and reviewed by the Supervisory Board upon the advice of its Audit Committee, and taking into account the report of the external auditor. Upon approval by the Supervisory Board, the accounts are signed by all members of both the Board of Management and the Supervisory Board and are published together with the final opinion of the external auditor. The Board of Management is responsible, under the supervision of the Supervisory Board, for the quality and completeness of such publicly disclosed financial reports. The annual financial statements are presented for discussion and adoption toat the Annual General Meeting of Shareholders, to be convened subsequently. The Company, under US securities regulations, separately files its Annual Report on Form20-F, incorporating major parts of the Annual Report as prepared under the requirements of Dutch law.
Internal controls and disclosure policies
Comprehensive internal procedures, compliance with which is supervised by the Supervisory Board, are in place for the preparation and publication of the Annual Report, the annual accounts, the quarterly figures and ad hoc financial information. As from 2003, the internal assurance process for business risk assessment has been strengthened and the review frequency has been upgraded to a quarterly review cycle, in line with best practices in this area.
As part of these procedures, a Disclosure Committee has been appointed by the Board of Management to oversee the Company’s disclosure activities and to assist the Executive Committee in fulfilling its responsibilities in this respect. The Committee’s purpose is to ensure that the Company implements and maintains internal procedures for the timely collection, evaluation and disclosure, as appropriate, of information potentially subject to public disclosure under the legal, regulatory and stock exchange requirements to which the Company is subject. Such procedures are designed to capture information that is relevant to an assessment of the need to disclose developments and risks that pertain to the Company’s various businesses, and theirthe effectiveness of those procedures for this purpose will be reviewed periodically.
Auditor information
In accordance with the procedures laid down in the Philips Auditor Policy and as mandatorily required by Dutch law, the external auditor of the Company is appointed by the General Meeting of Shareholders on the proposal of the Supervisory Board, after the latter has been advised by the Audit Committee and the Board of Management. Under this Auditor Policy, as updated in 2013, the Supervisory Board and the Audit Committee assessesassess the functioning of the external auditor. The main conclusions of this assessment shall be communicated to the General Meeting of Shareholders for the purposes of assessing the nomination for the appointment of the external auditor.
The current auditor of the Company, KPMGErnst & Young Accountants N.V.LLP (EY), was appointed byat the 1995 General Meeting of Shareholders. In 2002, when the Auditor Policy was adopted, the appointment of KPMG Accountants N.V. was confirmed by the Supervisory Board for an additional three years. The 2008 and 20112015 Annual General Meeting of Shareholders, resolved to re-appoint KPMG Accountants N.V. as auditor.for a term of four years starting January 1, 2016. Mr J.F.C. van EverdingenC.B. Boogaart is the current partner of KPMG Accountants N.V.EY in charge of the audit duties for Philips. The external auditor shall attend the
Annual General Meeting of Shareholders. Questions may be put to him at the meeting about his report. The Board of Management and the Audit Committee of the Supervisory Board shall report on their dealings with the external auditor to the Supervisory Board on an annual basis, particularly with regard to the auditor’s independence. The Supervisory Board shall take this into account when deciding upon its nomination for the appointment of an external auditor. New Dutch legislation on mandatory auditor rotation will become effective January 1,Report 2016 meaning the Company must engage a new audit firm for its statutory audit starting per January 1, 2016.109
Corporate governance 9.4
The external auditor attends, in principle, all meetings of the Audit Committee. The findings of the external auditor, the audit approach and the risk analysis are also discussed at these meetings. The external auditor attends the meeting of the Supervisory Board at which the report of the external auditor with respect to the audit of the annual accounts is discussed, and at which the annual accounts are approved. In its audit report on the annual accounts to the Board of Management and the Supervisory Board, the external auditor refers to the financial reporting risks and issues that were identified during the audit, internal control matters, and any other matters, as appropriate, requiring communication under the auditing and other standards generally accepted in the Netherlands and the US.
The external auditor shall attend the Annual General Meeting of Shareholders. Questions may be put to him at the meeting about his report. The Board of Management and the Audit Committee of the Supervisory Board shall report on their dealings with the external auditor to the Supervisory Board on an annual basis, particularly with regard to the auditor’s independence. The Supervisory Board shall take this into account when deciding upon its nomination for the appointment of an external auditor.
Auditor policy
New Dutch legislation, effective January 1, 2013, has been adopted onlaw requires the separation of audit and non-audit services, meaning the Company’s external auditor is no longer allowed to providenon-audit services, with an exception for non-audit service arrangements already in place on December 31, 2012. services. In light of this new Dutch legislation, the Auditor Policy was updated in 2013. The policy is published on the Company’s website. The policy is also in line with US Securities and Exchange Commission rules under which the appointed external auditor must be independent of the Company both in fact and appearance.
The Auditor Policy includes rules for thepre-approval by the Audit Committee of all services to be provided by the external auditor. Proposed services may be pre-approved at the beginning of the year by the Audit Committee (annualpre-approval) or may be pre-approved during the year by the Audit Committee in respect of a particular engagement (specific pre-approval). The annualpre-approval is based on a detailed, itemized list of services to be provided, designed to ensure that there is no management discretion in determining whether a service has been approved and to ensure the Audit Committee is informed of each services it ispre-approving. Unlesspre-approval with respect to a specific service has been given at the beginning of the year, each proposed service requires specificpre-approval during the year. Any annually pre- approvedpre-approved services where the fee for the engagement is expected to exceedpre-approved cost levels or budgeted amounts will also require specificpre-approval. The term of any annual pre-approval is 12 months
148 Annual Report 2013
10 Corporate governance 10.4 - 10.6
from the date of thepre-approval unless the Audit Committee states otherwise. During 2013,2016, there were no services provided to the Company by the external auditor which were notpre-approved by the Audit Committee.
Introduction
The Company is continually striving to improve relations with its shareholders. In addition to communication with its shareholders at the Annual General Meeting of Shareholders, Philips elaborates its financial results during (public) conference calls, which are broadly accessible. It publishes informative annual, semi-annual and quarterly reports and press releases, and informs investors via its extensive website. The Company is strict in its compliance with applicable rules and regulations on fair andnon-selective disclosure and equal treatment of shareholders.
Each yearFrom time to time the Company organizes Philipscommunicates with investors via road shows, broker conferences and a Capital Market Days and participates in several broker conferences,Markets Day, announced in advance on the Company’s website and by means of press releases.website. Shareholders can follow in real time, by means of webcasting or telephone lines, the meetings and presentations organized by the Company. Thus the Company applies recommendation IV.3.1 of the Dutch Corporate Governance Code, which in its perception and in view of market practice does not extend to less important analyst meetings and presentations. It is Philips’ policy to post presentations to analysts and shareholders on the Company’s website. These meetings and presentations will not take place shortly before the publication of annual, semi-annual and quarterly financial information.
Furthermore, the Company engages in bilateral communications with investors. These communications either take place either at the initiative of the Company or at the initiative of individual investors. During these communications theThe Company is generally represented by its Investor Relations department. However,department during these interactions, however, on a limited number of occasions the Investor Relations department is accompanied by one or more members of the Board of Management.senior management. The subject matter of the bilateral communications ranges from singleindividual queries from investors to more elaborate discussions on the back offollowing disclosures that the Company has made, such as its annual and quarterly reports. Also here, the Company is strict in its compliance with applicable rules and regulations on fair andnon-selective disclosure and equal treatment of shareholders.
The Company shall not, in advance, assess, comment upon or correct, other than factually, any analyst’s reports and valuations. No fee(s) will be paid by the Company to parties for thecarrying-out of research for analysts’ reports or for the production or publication of analysts’ reports, with the exception of credit-rating agencies.
110 Annual Report 2016
Corporate governance 9.5
Major shareholders and other information for shareholders
The Dutch Act on Financial Supervision imposes an obligation on persons holding certain interests to disclose (inter alia) percentage holdings in the capital and/or voting rights in the Company when such holdings reach, exceed or fall below 3, 5, 10, 15, 20, 25, 30, 40, 50, 60, 75 and 95 percent (as a result of an acquisition or disposal by a person, or as a result of a change in the company’s total number of voting rights or capital issued). Certain cash settled derivatives (settled in kind or in cash) are also taken into account when calculating the capital interest. Pursuant to new legislation, effective July 1, 2013, theThe statutory obligation to disclose capital interest does not only relate to gross long positions, but also to gross short positions. Required disclosures must be made to the Netherlands Authority for the Financial Markets (AFM) without delay. The AFM then notifies such disclosures to the Company and includes them in a register which is published on the AFM’s website. Furthermore, an obligation to disclose (net) short positions is set out in the EU Regulation on Short Selling.
On July 1, 2013The AFM register shows the Company receivedfollowing notification fromof substantial holdings and/or voting rights at or above the AFM that it had received disclosures under the Dutch Act on Financial Supervision of a3% threshold: BlackRock, Inc.: substantial holding of 4.3% by Dodge & Cox International Stock Fund. On August 14, 2013 the Company received notification from the AFM that it had received disclosures under the Dutch Act on Financial Supervision of a total shareholding of 3.01%5.03% and 3.45%6.19% of the voting rights by BlackRock Inc. On January 3, 2014 the Company received notification from the AFM that it had received disclosures under the Dutch Act on Financial Supervision of a substantial holding of 3.08% by Norges Bank. (January 5, 2017).
As per December 31, 2013,2016, approximately 91%90% of the common shares were held in bearer form and approximately 9%10% of the common shares were represented by registered shares of New York Registry issued in the name of approximately 1,2181,081 holders of record, including Cede & Co. Cede & Co acts as nominee for the Depository Trust Company holding the shares (indirectly) for individual investors as beneficiaries. Citibank, N.A., 388 Greenwich Street, New York, New York 10013 is the transfer agent and registrar.
Only bearer shares are traded on the stock market of Euronext Amsterdam. Only shares of New York Registry are traded on the New York Stock Exchange. Bearer shares and registered shares may be exchanged for each other. Since certain shares are held by brokers and other nominees, these numbers may not be representative of the actual number of United States beneficial holders or the number of Shares of New York Registry beneficially held by US residents.
The provisions applicable to all corporate bonds that have been issued by the Company in March 2008 and 2012 contain a ‘Change of Control Triggering Event’. This means that if the Company experienced such an event with respect to a series of corporate bonds the Company might be required to offer to purchase the bonds of that series at a purchase price equal to 101% of their principal amount, plus accrued and unpaid interest, if any.
Corporate seat and head office
The statutory seat of the Company is Eindhoven, the Netherlands, and the statutory list of all subsidiaries and affiliated companies, prepared in accordance with the relevant legal requirements (Dutch Civil Code, Book 2, Sections 379 and 414), forms part of the notes to the consolidated financial statements and is deposited at the office of the Commercial Register in Eindhoven, the Netherlands (file no. 17001910).
The executive offices of the Company are located at the BreitnerPhilips Center, Amstelplein 2, 1096 BC Amsterdam, the Netherlands, telephone 0031 (0)20 59+31-20-59 77 777.
Compliance with the Dutch Corporate Governance Code
In accordance with the governmental decreeDecree of December 10, 2009, the Company fully complies with the Dutch Corporate Governance Code and applies all its principles and best practice provisions that are addressed to the Board of Management or the Supervisory Board. The full text of the Dutch Corporate Governance Code can be found at the website of the Monitoring Commission Corporate Governance Code (www.commissiecorporategovernance.nl)(www.commissiecorporategovernance.nl).
February 25, 201421, 2017
10.69.6 Additional information
Set forth below is a summary of certain provisions of the Articles of Association of the Company, applicable Dutch law and related Company policies. This summary does not constitute legal advice regarding those matters and should not be regarded as such.
Articles of association
Object and purpose
The objects of the Company are to establish, participate in, administer and finance legal entities, companies and other legal forms for the purpose of the manufacture and trading of electrical, electronic, mechanical or chemical products, the development and exploitation of technical and other expertise, including software, or for the purpose of other activities, and to do everything pertaining thereto or connected therewith, including the provision of security in particular for commitments of business undertakings which belong to its group, all this in the widest sense, as may also be conducive to the proper continuity of the collectivity of business undertakings, in the Netherlands and abroad, which are carried on by the Company and the companies in which it directly or indirectly participates.
Share Capital
As of December 31, 2013,2015, the issued share capital consists only of common shares; no preference shares have been issued.
Annual Report 2016 111
Corporate governance 9.6
Voting rights
Each common share and each preference share is entitled to one vote. All common shares vote together on all voting matters presented at a General Meeting of Shareholders. Major shareholders do not have different voting rights than other shareholders.
Dividends
A dividend will first be declared on preference shares out of net income. The remainder of the net income, after reservations made with the approval of the Supervisory Board, shall be available for distribution to holders of common shares subject to shareholder approval after year-
Annual Report 2013 149
10 Corporate governance 10.6 - 10.6
end. The Board of Management has the power to determine what portion of the net income shall be retained by way of reserve, subject to the approval of the Supervisory Board. The remainder of the net income, after reservations made, shall be available for distribution to holders of common shares subject to shareholder approval afteryear-end.
Liquidation rights
In the event of the dissolution and liquidation of the Company, the assets remaining after payment of all debts and liquidation expenses are to be distributed in the following order of priority: to the holders of preference shares, the amount paid thereon; and the remainder to the holders of the common shares.
Preemptive rights
Shareholders have a pro rata preferential right of subscription to any common share issuance unless the right is restricted or excluded. If designated by the General Meeting of Shareholders, the Board of Management has the power to restrict or exclude the preferential subscription rights. A designation of the Board of Management will be effective for a specified period of up to five years and may be renewed. Currently, the Board of Management has been granted the power to restrict or exclude the preferential right of subscription up to and including November 2, 2014.6, 2016. If the Board of Management has not been designated, the General Meeting of Shareholders has the power to restrict or exclude such rights, upon the proposal of the Board of Management, which proposal must be approved by the Supervisory Board. Resolutions by the General Meeting of Shareholders referred to in this paragraph require approval of at leasttwo-thirds of the votes cast if less than half of the issued share capital is represented at the meeting.
The foregoing provisions also apply to the issuance of rights to subscribe for shares.
General Meeting of Shareholders
The ordinaryAnnual General Meeting of Shareholders shall be held each year not later than the thirtieth day of June and, at the Board of Management’s option, in Eindhoven, Amsterdam, The Hague, Rotterdam, Utrecht or Haarlemmermeer (including Schiphol airport); the notice convening the meeting shall inform the shareholders accordingly.
Without prejudice to applicable laws and regulations, the Board of Management may resolve to give notice to holders of bearer shares via the Company’s website and/or by other electronic means representing a public announcement, which announcement remains directly and permanently accessible until the general meeting.General Meeting of Shareholders. Holders of registered shares shall be notified by letter, unless the Board of Management resolves to give notice to holders of registered shares by electronic means of communication by sending a legible and reproducible message to the address indicated by the shareholder to the Company for such purpose provided the relevant shareholder has agreed hereto.
In principle all shareholders are entitled to attend the General Meeting of Shareholders, to address the meeting and to vote, except for shares held in treasury by the Company. They may exercise the aforementioned rights at a meeting only for the common shares which on the record date are registered in their name. The record date is published in the above announcement. Holders of registered shares must advise the Company in writing of their intention to attend the General Meeting of Shareholders. Holders of bearer shares who either in person or by proxy wish to attend the General Meeting of Shareholders, should notify ABN AMRO Bank N.V., which is acting as agent for the Company. They must submit a confirmation by a participating institution, in which administration they are registered as holders of the shares, that such shares are registered and will remain registered in its administration up to and including the record date, whereupon the holder will receive an admission ticket for the General Meeting of Shareholders. Holders of shares who wish to attend by proxy have to submit the proxy at the same time. A participating institution is a bank or broker which according to the Dutch Securities Depository Act (‘Wet giraal effectenverkeer’) is a participating institution (‘aangesloten instelling’) of Nederlands Centraal Instituut voor Giraal Effectenverkeer B.V. (Euroclear Nederland).
In connection with the General Meeting of Shareholders, the Company doesn’tdoes not solicit proxies within the United States.
The Articles of Association of the Company provide that there are no quorum requirements to hold a general meetingGeneral Meeting of Shareholders and, unless specified otherwise in the articles of association of the Company, resolutions of the General Meeting of Shareholders shall be adopted by a simple majority of votes. Certain shareholder actions and certain resolutions may require a quorum.
Limitations on right to hold or vote Common Shares
There are no limitations imposed by Dutch law or by the Articles of Association on the right ofnon-resident owners to hold or vote the Common Shares.
Exchange controls
Cash dividends payable in Euros on Netherlands registered shares and bearer shares may be officially transferred from the Netherlands and converted into
112 Annual Report 2016
Corporate governance 9.6
any other currency without Dutch legal restrictions, except that for statistical purposes such payments and transactions must be reported to the Dutch Central Bank, and furthermore, no payments, including dividend payments, may be made to jurisdictions subject to sanctions adopted by the government of the Netherlands and implementing resolutions of the Security Council of the United Nations.
The Articles of Association of the Company provide that cash distributions on Shares of New York Registry shall be paid in US dollars, converted at the rate of exchange on the stock market of Euronext Amsterdam at the close of business on the day fixed and announced for that purpose by the Board of Management.
General
The corporate governance rules introduced by the New York Stock Exchange (“NYSE”) allow foreign private issuers, like the Company, to follow home country practices on most corporate governance matters instead of those that apply to US domestic issuers, provided that they disclose any significant ways in which their corporate governance practices differ from those applying to listed domestic US companies under the NYSE listing standards. A summary of significant differences between certain Dutch practices on corporate governance matters and the corporate governance provisions applicable to US companies under the NYSE listing standards appears below.
Dutch corporate governance provisions
The Company is a company organized under Dutch law, with its Common Shares listed on Euronext Amsterdam, and is subject to the Dutch Corporate Governance Code of December 10, 2008 (the ‘Dutch Corporate Governance Code’). Philip’s New York Registry Shares, representing Common Shares of the Company, are listed on the NYSE.
Board structure
The NYSE listing standards prescribe regularly scheduled executive sessions ofnon-executive directors. As a Dutch company, theThe Company has atwo-tier corporate structure consisting of a Board of Management consisting of executive directors under the supervision of a Supervisory Board consisting exclusively of non-executive directors. Members of the Board of Management and other officers and employees cannot simultaneously act as member of the Supervisory Board. The Supervisory Board must approve specified decisions of the Board of Management.
Independence of members of our Supervisory Board
Under the Dutch Corporate Governance Code all members of the Supervisory Board with the exception of not more than one person, must be independent. The present members of our Supervisory Board are all independent within the meaning of the Dutch Corporate Governance Code. The definitions of independence under the Dutch Corporate Governance Code, however, differ in their details from the definitions of independence under the NYSE listing standards. In some cases the Dutch requirements are stricter than the NYSE listing standards and in other cases the NYSE listing standards are the stricter of the two.
Committees of our Supervisory Board
The Company has established an Audit Committee, a Remuneration Committee and a Corporate Governance and Nomination & Selection Committee, consisting of members of the Supervisory Board only. The roles, responsibilities and composition of these committees reflect the requirements of the Dutch Corporate Governance Code, the company’s Articles of Association and Dutch law, which differ from the NYSE listing standards in these respects. In 2015, the Supervisory Board additionally established the Separation Committee and Quality & Regulatory Committee. The role of each committee is to advise the Supervisory Board and to prepare the decision-making of the Supervisory Board. In principle, the entire Supervisory Board remains responsible for its decisions even if they were prepared by one of the Supervisory Board’s committees.
The NYSE requires that, when an audit committee member of a U.S.US domestic listed company serves on four or more audit committees of public companies, the listed company should disclose (either on its website or in its annual reportAnnual Report on Form10-K) that the board of directors has determined that this simultaneous service would not impair the director’s service to the listed company. Dutch law does not require the Company to make such a determination.
150 Annual Report 2013
10 Corporate governance 10.6 - 10.6
In accordance with the procedures laid down in the Philips Auditor Policy and as mandatorily required by Dutch law, the external auditor of the Company is appointed by the General Meeting of Shareholders on the proposal of the Supervisory Board, after the latter has been advised by the Audit Committee and the Board of Management.
Major shareholders as filed with SEC
On February 22, 2010, Southeastern Asset Management, Inc. filed a Schedule 13G with the SEC indicating that it beneficially owned 4.9% (representing 47,838,028 shares) of the Company’s common shares. On February 6, 2012, Southeastern Asset Management Inc. filed a Schedule 13G with the SEC indicating that it beneficially owned 7.1% (representing 72,051,468 shares) of the Company’s common shares. On February 10, 2012, Dodge & Cox filed a Schedule 13G with the SEC indicating that it beneficially owned 5.3% (representing 53,180,318 shares) of the Company’s common shares. On January 30, 2013, BlackRock Inc. filed a Schedule 13G with the SEC indicating that it beneficially owned 5.09% (48,728,999 shares) of the Company’s common shares. On February 13, 2013, Dodge and Cox filed a Schedule 13G with the SEC indicating that it beneficially owned 6.7% (63,848,817 shares) of the Company’s common shares. On February 14, 2013, Southeastern Asset Management Inc. filed a Schedule 13G with the SEC indicating that it beneficially owned 6.5% (62,001,965 shares) of the Company’s common shares. On March 11, 2013, BlackRock Inc. filed a Schedule 13G with the SEC indicating that it beneficially owned 4.73% (45,264,486 shares) of the Company’s common shares. On August 9, 2013, Southeastern Asset Management Inc. filed a Schedule 13G with the SEC indicating that beneficially owned 4.93% (48,050,0713 shares) of the Company’s common shares. On February 13, 2014, Dodge & Cox filed a Schedule 13G with the SEC indicating that it beneficially owned 5.7% (53,107,793 shares) of the Company’s common shares. On February 13, 2015, Southeastern Asset Management Inc. filed a Schedule 13G with the SEC indicating that it beneficially owned 5.4% (50,880,362 shares) of the Company’s common shares. On February 13, 2015, Dodge & Cox filed a Schedule 13G with the SEC indicating that it beneficially owned 6.3% (59,366,413 shares) of the Company’s common shares. On July 10, 2015, Southeastern Asset Management Inc. filed a Schedule 13G with the SEC indicating that it beneficially owned 4.6% (44,012,103 shares) of the Company’s common shares. On January 22, 2016, BlackRock Inc. filed a Schedule 13G with the SEC indicating that it beneficially owned 6.0% (55,645,648 shares) of the Company’s common shares. On February 12, 2016, Dodge & Cox filed a Schedule 13G with the SEC
Annual Report 2016 113
Corporate governance9.6
indicating that it beneficially owned 3.4% (31,421,723 shares) of the Company’s common shares. On January 25, 2017, BlackRock Inc. filed a Schedule 13G with the SEC indicating that it beneficially owned 6.3% (58,752,370 shares) of the Company’s common shares. Please also refer to ‘Major shareholders and other information for shareholders’ insection 9.5, Investor Relations, of this report.
Equity compensation plans
The Company complies with Dutch legal requirements regarding shareholder approval of equity compensation plans. Dutch law does not require shareholder approval of certain equity compensation plans for which the NYSE listing standards would require such approval. The Company is subject to a requirement to seek shareholder approval for equity compensation-plans for its members of the Board of Management.
Code of business conduct
The listing standards of the NYSE prescribe certain parameters for listed company codes of business conduct and ethics. The Company has implemented the Philips General Business Principles, which are applicable to all employees and a Financial Code of Ethics, which is applicable to all employees performing an accounting or financial function. Waivers granted to Senior (Financial) Officers (as defined in our Financial Code of Ethics) will be disclosed. In 20132015 the Company did not grant any waivers of the Financial Code of Ethics.
KPMG
Annual Report 2013 151
Performance Statements
11 | Group financial statements | 154 | ||||
11.1 | Management’s report on internal control | 154 | ||||
11.2 | Reports of the independent auditor | 155 | ||||
11.3 | Auditor‘s report on internal control over financial reporting | 155 | ||||
11.4 | Consolidated statements of income | 156 | ||||
11.5 | Consolidated statements of comprehensive income | 157 | ||||
11.6 | Consolidated balance sheets | 158 | ||||
11.7 | Consolidated statements of cash flows | 160 | ||||
11.8 | Consolidated statements of changes in equity | 162 | ||||
11.9 | Notes | 163 | ||||
11.10 | Independent auditors’ report – Group | 215 | ||||
12 | Company financial statements | 216 | ||||
12.1 | Balance sheets before appropriation of results | 217 | ||||
12.2 | Statements of income | 218 | ||||
12.3 | Statement of changes in equity | 218 | ||||
12.4 | Notes | 219 | ||||
12.5 | Independent auditor’s report - Company | 222 | ||||
13 | Sustainability statements | 223 | ||||
13.1 | Economic indicators | 227 | ||||
13.2 | Social statements | 227 | ||||
13.3 | Environmental statements | 234 | ||||
13.4 | Independent assurance report | 238 | ||||
13.5 | Global Reporting Initiative (GRI) table 4.0 | 239 |
152114 Annual Report 20132016
Notes overview
Annual Report 2013 153
11 Group financialGroupfinancial statements 11 - 11.1.210
1110 Group financial statements
Introduction
This section of the Annual Report contains the audited consolidated financial statements including the notes thereon that have been prepared in accordance with International Financial Reporting Standards (IFRS) as endorsed by the European Union (EU) and with the statutory provisions of Part 9, Book 2 of the Dutch Civil Code. All standards and interpretations issued by the International Accounting Standards Board (IASB) and the IFRS Interpretations Committee effectiveyear-end 2013 2015 have been endorsed by the EU, except that the EU did not adopt some paragraphs of IAS 39 applicable to certain hedge transactions. Philips has no hedge transactions to which these paragraphs are applicable. Consequently, the accounting policies applied by Philips also comply fully with IFRS as issued by the IASB.
Together with the section Company financial statements, this section contains the statutory financial statements of the Company.
The following sections and chapters:
chapter 1, Accelerate!2, Group performance, of this report
chapter 2, Building a great company,3, Segment performance, of this report
chapter 3, Delivering innovation that matters to you,5, Risk management, of this report
chapter 4, Group performance,8, Supervisory Board report, of this report
chapter 5, Sector performance, of this report
chapter 6, Risk management, of this report
section 9.1,8.1, Report of the Corporate Governance and Nomination & Selection Committee, of this report
section 9.2,8.2, Report of the Remuneration Committee, of this report
chapter 10,9, Corporate governance, of this report
Forward-looking statements, of this report
form the Management report within the meaning of section 2:391 of the Dutch Civil Code (and related Decrees).
The sections Group performance and SectorSegment performance provide an extensive analysis of the developments during the financial year 20132016 and the results. The term EBIT has the same meaning as Income from operations, (IFO), and is used to evaluate the performance of the business. These sections also provide information on the business outlook, investments, financing, personnel and research and development activities.
The Statement of income included in the section Company financial statements has been prepared in accordance with section 2:402 of the Dutch Civil Code, which allows a simplified Statement of income in the Company financial statements in the event that a comprehensive Statement of income is included in the consolidated Group financial statements.
For ‘Additional information’ within the meaning of section 2:392 of the Dutch Civil Code, please refer tosection 11.5, Independent auditor’s report - Group on the Group financial statements, section 12.5, Independent auditor’s report - Company,, of this report on the Company financial statements, section 4.4, Proposed distribution to shareholders, of this report, and note 36, Subsequent events.report.
Please refer toForward-looking statements, of this report for more information about forward-looking statements, third-party market share data, fair value information, and revisions and reclassifications.
The Board of Management of the Company hereby declares that, to the best of our knowledge, the Group financial statements and Company financial statements give a true and fair view of the assets, liabilities, financial position and profit or loss of the Company and the undertakings included in the consolidation taken as a whole and that the management report referred to above gives a true and fair view concerning the position as per the balance sheet date, the development and performance of the business during the financial year of the Company and the undertakings included in the consolidation taken as a whole, together with a description of the principal risks that they face.
Board of Management
Frans van Houten
Ron WirahadiraksaAbhijit Bhattacharya
Pieter Nota
February 25, 201421, 2017
Annual Report 2016 115
Group financial statements10.1
11.110.1 Management’s report on internal control
Management’s report on internal control over financial reporting pursuant to section 404 of the US Sarbanes-Oxley Act
The Board of Management of Koninklijke Philips N.V. (the Company) is responsible for establishing and maintaining an adequate system of internal control over financial reporting (as such term is defined in Rule13a-15(f) under the US Securities Exchange Act). Internal control over financial reporting is a process to provide reasonable assurance regarding the reliability of our financial reporting for external purposes in accordance with IFRS as issued by the IASB.
Internal control over financial reporting includes maintaining records that, in reasonable detail, accurately and fairly reflect our transactions; providing reasonable assurance that transactions are recorded as necessary for preparation of our financial statements; providing reasonable assurance that receipts and expenditures of company assets are made in accordance with management authorization; and providing reasonable assurance that unauthorized acquisition, use or disposition of company assets that could have a material effect on our financial statements would be prevented or detected on a timely basis. Because of its inherent limitations, internal control over financial reporting is not intended to provide absolute assurance that a misstatement of our financial statements would be prevented or detected. Also, projections of any evaluation of the effectiveness of internal control over financial reporting to future periods are subject to the risk that the controls may become inadequate because of changes in conditions, or that the degree of compliance with the policies or procedures may deteriorate.
The Board of Management conducted an assessment of the Company’s internal control over financial reporting based on the “Internal“Internal Control-Integrated Framework (1992)(2013)”established by the Committee of Sponsoring Organizations of the Treadway Commission (COSO). Based on that assessment, the Board of Management concluded that, as of December 31, 2013,2016, the Company’s internal control over Group financial reporting is considered effective.
The effectiveness of the Company’s internal control over financial reporting as of December 31, 2013,2016, as included in this section Group financial statements, has been audited by KPMGErnst & Young Accountants N.V.,LLP, an independent registered public accounting firm, as stated in their report which follows hereafter.
Board of Management
Frans van Houten
Ron WirahadiraksaAbhijit Bhattacharya
Pieter Nota
February 25, 201421, 2017
11.1.110.1.1 Disclosure controls and procedures
The Company’s Chief Executive Officer and Chief Financial Officer have evaluated the effectiveness of the design and operation of the Company’s disclosure controls and procedures (as defined in Rules13a-15(e) and15d-15(e) under the Securities Exchange Act of 1934) as of the end of the period covered by the Annual Report. Based on that evaluation, the Chief Executive Officer and Chief Financial Officer have concluded that these disclosure controls and procedures are effective as of December 31, 2013.2016.
11.1.210.1.2 Changes in internal control over financial reporting
During the year endedsecond quarter, under the supervision and with the participation of our management, we completed the separation of Royal Philips and Philips Lighting. As part of the separation Philips Lighting was publicly listed and began trading on the Euronext exchange in Amsterdam.
Royal Philips retained a 71.255% stake in Philips Lighting, as per December 31, 2013, there2016. Subsequently, on February 8, 2017 Royal Philips reduced its stake in Philips Lighting to 55.180%. Philips Lighting continues to be consolidated and fully included in the Internal Control over Financial Reporting framework of Royal Philips. However, due to the separation, Royal Philips and Philips Lighting have beenaltered and implemented certain control activities which support the new structure. There were no other changes in our internal controlInternal Control over financial reportingFinancial Reporting during 2016 that have materially affected, or are reasonably likely to materially affect, our Internal Control over Financial Reporting.
10.2 Report of the independent auditors
Management’s report on internal control over financial reporting.
154 Annual Report 2013
11 Group financial statements 11.2 - 11.3
reporting is set out in11.2 Reportssection 10.1, Management’s report on internal control, of the independent auditor
this report. The report set out belowinsection 10.3, Independent auditors’ report on internal control over financial reporting, of this report, is provided in compliance with auditing standards of the Public Company Accounting Oversight Board in the US and includes an opinion on the effectiveness of internal control over financial reporting as at December 31, 2013. Management’s report on internal control over financial reporting is set out in section 11.1, Management’s report on internal control, of this Annual Report. KPMG2016.
Ernst & Young Accountants N.V.LLP has also issued a report on the consolidated financial statements in accordance with the standards of the Public Company Accounting Oversight Board in the US, which is set out in 11.10,sub-section 10.4.1, Independent auditors’report - Group,auditors’ report on the consolidated financial statements, of this Annual Report. report.
KPMG Accountants N.V. issued a report on the consolidated financial statements of 2015 and 2014 in accordance with the standards of the Public Company Accounting Oversight Board in the US. This is set out insub-section 10.4.2, Independent auditors’ report on the consolidated financial statements, of this report.
116 Annual Report 2016
Groupfinancial statements 10.2
Ernst & Young Accountants LLP has also issued reportsa report on the consolidated financial statements and the Company financial statements, in accordance with Dutch law, including the Dutch standards on auditing, and on the Company Financial Statements of Koninklijke Philips N.V., which is set out insection 11.5, Independent auditor’s report, of this report.
Annual Report 2016 117
Group financial statements10.3
11.3 Auditor’s10.3 Independent auditors’ report on internal control over financial reporting
Report of Independent Registered Public Accounting Firm
To theTo: The Supervisory Board and Shareholders of Koninklijke Philips N.V.:
We have audited Koninklijke Philips N.V. and subsidiaries’’s internal control over financial reporting as of December 31, 2013,2016, based on criteria established in Internal Control — Integrated Framework (1992) issued by the Committee of Sponsoring Organizations of the Treadway Commission (COSO)(2013 framework) (the COSO criteria). Koninklijke Philips N.V.’s Board of Managementmanagement is responsible for maintaining effective internal control over financial reporting, and for its assessment of the effectiveness of internal control over financial reporting included in the accompanyingsection 11.1, “Management’s10.1, Management’s report on internal control”control, of this Form 20-F.Annual Report. Our responsibility is to express an opinion on the Company’scompany’s internal control over financial reporting based on our audit.
We conducted our audit in accordance with the standards of the Public Company Accounting Oversight Board (United States). Those standards require that we plan and perform the audit to obtain reasonable assurance about whether effective internal control over financial reporting was maintained in all material respects. Our audit included obtaining an understanding of internal control over financial reporting, assessing the risk that a material weakness exists, and testing and evaluating the design and operating effectiveness of internal control based on the assessed risk. Our audit also includedrisk, and performing such other procedures as we considered necessary in the circumstances. We believe that our audit provides a reasonable basis for our opinion.
A company’s internal control over financial reporting is a process designed to provide reasonable assurance regarding the reliability of financial reporting and the preparation of financial statements for external purposes in accordance with generally accepted accounting principles. A company’s internal control over financial reporting includes those policies and procedures that (1) pertain to the maintenance of records that, in reasonable detail, accurately and fairly reflect the transactions and dispositions of the assets of the company; (2) provide reasonable assurance that transactions are recorded as necessary to permit preparation of financial statements in accordance with generally accepted accounting principles, and that receipts and expenditures of the company are being made only in accordance with authorizations of management and directors of the company; and (3) provide reasonable assurance regarding prevention or timely detection of unauthorized acquisition, use, or disposition of the company’s assets that could have a material effect on the financial statements.
Because of its inherent limitations, internal control over financial reporting may not prevent or detect misstatements. Also, projections of any evaluation of effectiveness to future periods are subject to the risk that controls may become inadequate because of changes in conditions, or that the degree of compliance with the policies or procedures may deteriorate.
In our opinion, Koninklijke Philips N.V. and subsidiaries maintained, in all material respects, effective internal control over financial reporting as of December 31, 2013,2016, based on criteria established in Internal Control — Integrated Framework (1992) issued by the Committee of Sponsoring Organizations of the Treadway Commission (COSO).COSO criteria.
We also have audited, in accordance with the standards of the Public Company Accounting Oversight Board (United States), the consolidated balance sheetssheet of Koninklijke Philips N.V. as of December 31, 2016, and the related consolidated statements of income, comprehensive income, cash flows and changes in equity for the year then ended, and our report dated February 21, 2017 expressed an unqualified opinion thereon.
Amsterdam, The Netherlands
February 21, 2017
/s/ Ernst & Young Accountants LLP
118 Annual Report 2016
Group financial statements 10.4
10.4 Independent auditors’ reports on the consolidated financial statements
10.4.1 Independent auditors’ report on the consolidated financial statements
Report of Independent Registered Public Accounting Firm
To: The Supervisory Board and Shareholders of Koninklijke Philips N.V.
We have audited the accompanying consolidated balance sheet of Koninklijke Philips N.V. as of December 31, 2016, and the related consolidated statements of income, comprehensive income, cash flows, and changes in equity for the year then ended. These consolidated financial statements are the responsibility of the Koninklijke Philips N.V.’s management. Our responsibility is to express an opinion on these consolidated financial statements based on our audit.
We conducted our audit in accordance with the standards of the Public Company Accounting Oversight Board (United States). Those standards require that we plan and perform the audit to obtain reasonable assurance about whether the financial statements are free of material misstatement. An audit includes examining, on a test basis, evidence supporting the amounts and disclosures in the financial statements. An audit also includes assessing the accounting principles used and significant estimates made by management, as well as evaluating the overall financial statement presentation. We believe that our audit provides a reasonable basis for our opinion.
In our opinion, the consolidated financial statements referred to above present fairly, in all material respects, the consolidated financial position of Koninklijke Philips N.V. at December 31, 2016 and the consolidated results of its operations and its cash flows for the year then ended, in conformity with International Financial Reporting Standards as issued by the International Accounting Standards Board.
As described in Note 1 “Significant accounting policies — Changes in presentation from the prior year”, Koninklijke Philips N.V. changed the composition of its reportable segments in 2016, and the amounts in the 2015 and 2014 financial statements have been restated to conform to the 2016 composition of reportable segments. We audited the adjustments that were applied to restate the disclosures for reportable segments reflected in the 2015 and 2014 financial statements. We also audited the adjustment described in Note 1, Significant accounting policies — Changes in presentation from the prior year”, that were applied to restate the 2015 consolidated balance sheet to retrospectively apply the change in presentation of all net defined-benefit post-employment plan obligations. In our opinion, such adjustments are appropriate and have been properly applied. We were not engaged to audit, review, or apply any procedures to the 2015 and 2014 consolidated financial statements of Koninklijke Philips N.V. other than with respect to the adjustments and, accordingly, we do not express an opinion or any other form of assurance on the 2015 and 2014 consolidated financial statements taken as a whole.
We also have audited, in accordance with the standards of the Public Company Accounting Oversight Board (United States), Koninklijke Philips N.V.’s internal control over financial reporting as of December 31, 2016, based on criteria established inInternal Control — Integrated Framework issued by the Committee of Sponsoring Organizations of the Treadway Commission (2013 framework), and our report dated February 21, 2017 expressed an unqualified opinion thereon.
Amsterdam, The Netherlands
February 21, 2017
/s/ Ernst & Young Accountants LLP
Annual Report 2016 119
Group financial statements10.4.2
10.4.2 Independent auditors’ report on the consolidated financial statements
Report of Independent Registered Public Accounting Firm
To: The Supervisory Board and Shareholders of Koninklijke Philips N.V.
We have audited, before the effects of the adjustments to retrospectively apply the change in accounting described in note 1 “Significant accounting policies — Changes in presentation from the prior year”, the accompanying consolidated balance sheet of Koninklijke Philips N.V. (the Company) and subsidiaries as of December 31, 2013 and 2012,2015, and the related consolidated statements of income, comprehensive income, cash flows, and changes in equity for each of the years in the three-yeartwo-year period ended December 31, 2013, and our report dated February 25, 2014, expressed2015. The financial statements, before the effects of the adjustments discussed in note 1 “Significant accounting policies — Changes in presentation from the prior year”, are not presented herein. These consolidated financial statements are the responsibility of the Koninklijke Philips N.V.’s management. Our responsibility is to express an unqualified opinion on thosethese consolidated financial statements.statements based on our audit.
KPMG AccountantsWe conducted our audit in accordance with the standards of the Public Company Accounting Oversight Board (United States). Those standards require that we plan and perform the audit to obtain reasonable assurance about whether the financial statements are free of material misstatement. An audit includes examining, on a test basis, evidence supporting the amounts and disclosures in the financial statements. An audit also includes assessing the accounting principles used and significant estimates made by management, as well as evaluating the overall financial statement presentation. We believe that our audits provide a reasonable basis for our opinion.
In our opinion, the consolidated financial statements referred to above, before the effects of the adjustments to retrospectively apply the change in accounting described in note 1 “Significant accounting policies — Changes in presentation from the prior year”, present fairly, in all material respects, the financial position of Koninklijke Philips N.V. and subsidiaries as of December 31, 2015, and the results of their operations and their cash flows for each of the years in thetwo-year period ended December 31, 2015, in conformity with International Financial Reporting Standards as issued by the International Accounting Standards Board.
We were not engaged to audit, review, or apply any procedures to the adjustments to retrospectively apply the change in accounting described note 1 “Significant accounting policies — Changes in presentation from the prior year” and, accordingly, we do not express an opinion or any other form of assurance about whether such adjustments are appropriate and have been properly applied. Those adjustments were audited by a successor auditor.
Amsterdam, The Netherlands
February 25, 201423, 2016
/s/ KPMG Accountants N.V.
120 Annual Report 2013 1552016
11 Group financial statements 11.4 - 11.410.5
11.410.5 Consolidated statements of income
in millions
| Philips Group | ||||||||||||||||
Consolidated statements of incomein millions of EUR unless otherwise stated For the years ended December 31 | ||||||||||||||||
|
| |||||||||||||||
| 2014 | 2015 | 2016 | ||||||||||||||
|
| |||||||||||||||
 | Sales | 21,391 | 24,244 | 24,516 | ||||||||||||
| Cost of sales | (13,185 | ) | (14,388 | ) | (13,904 | ) | ||||||||||
|
| |||||||||||||||
| Gross margin | 8,206 | 9,856 | 10,612 | |||||||||||||
| Selling expenses | (5,124 | ) | (5,815 | ) | (5,888 | ) | ||||||||||
| General and administrative expenses | (747 | ) | (1,209 | ) | (845 | ) | ||||||||||
| Research and development expenses | (1,635 | ) | (1,927 | ) | (2,021 | ) | ||||||||||
| Impairment of goodwill | (3 | ) | — | (3 | ) | |||||||||||
| Other business income | 63 | 137 | 68 | ||||||||||||
| Other business expenses | (274 | ) | (50 | ) | (41 | ) | |||||||||
|
| |||||||||||||||
| Income from operations | 486 | 992 | 1,882 | ||||||||||||
 | Financial income | 114 | 98 | 76 | ||||||||||||
| Financial expenses | (415 | ) | (467 | ) | (569 | ) | |||||||||
|
| |||||||||||||||
| Income before taxes | 185 | 623 | 1,389 | |||||||||||||
 | Income tax expense | (26 | ) | (239 | ) | (327 | ) | |||||||||
|
| |||||||||||||||
| Income after taxes | 159 | 384 | 1,062 | |||||||||||||
| Investments in associates, net of income taxes | 62 | 30 | 13 | |||||||||||||
|
| |||||||||||||||
| Income from continuing operations | 221 | 414 | 1,075 | |||||||||||||
 | Discontinued operations, net of income taxes | 190 | 245 | 416 | ||||||||||||
|
| |||||||||||||||
| Net income | 411 | 659 | 1,491 | |||||||||||||
| Attribution of net income | ||||||||||||||||
| Net income attributable to Koninklijke Philips N.V. shareholders | 415 | 645 | 1,448 | |||||||||||||
| Net income attributable tonon-controlling interests | (4 | ) | 14 | 43 | ||||||||||||
|
| |||||||||||||||
| Philips Group | ||||||||||||||||
| Earnings per common share attributable to Koninklijke Philips N.V. shareholdersin EUR unless otherwise stated For the years ended December 31 | ||||||||||||||||
|
| |||||||||||||||
| 2014 | 2015 | 2016 | ||||||||||||||
|
| |||||||||||||||
| Basic earnings per common share in EUR | ||||||||||||||||
 | Income from continuing operations attributable to shareholders | 0.25 | 0.44 | 1.12 | ||||||||||||
| Net income attributable to shareholders | 0.45 | 0.70 | 1.58 | ||||||||||||
| Diluted earnings per common share in EUR | ||||||||||||||||
| Income from continuing operations attributable to shareholders | 0.24 | 0.43 | 1.11 | ||||||||||||
| Net income attributable to shareholders | 0.45 | 0.70 | 1.56 | ||||||||||||
|
| |||||||||||||||
The accompanying notes are an integral part of euros unless otherwise statedthese consolidated financial statements.
| Consolidated statements of income of the Philips Group for the years ended December 31 | ||||||||||||||
| 2011 | 2012 | 2013 | ||||||||||||
| Sales | 20,992 | 23,457 | 23,329 | |||||||||||
| Cost of sales | (12,732 | ) | (14,466 | ) | (13,641 | ) | ||||||||
|
| |||||||||||||
| Gross margin | 8,260 | 8,991 | 9,688 | |||||||||||
| Selling expenses | (5,025 | ) | (5,334 | ) | (5,075 | ) | ||||||||
| General and administrative expenses | (802 | ) | (845 | ) | (949 | ) | ||||||||
| Research and development expenses | (1,605 | ) | (1,831 | ) | (1,733 | ) | ||||||||
 | Impairment of goodwill | (1,355 | ) | — | (28 | ) | ||||||||
| Other business income | 124 | 275 | 123 | |||||||||||
| Other business expenses | (76 | ) | (608 | ) | (35 | ) | ||||||||
|
| |||||||||||||
 | Income from operations | (479 | ) | 648 | 1,991 | |||||||||
 | Financial income | 113 | 106 | 70 | ||||||||||
| | Financial expenses | (444 | ) | (435 | ) | (400 | ) | |||||||
|
| |||||||||||||
| Income before taxes | (810 | ) | 319 | 1,661 | ||||||||||
 | Income tax expense | (251 | ) | (185 | ) | (466 | ) | |||||||
|
| |||||||||||||
| Income (loss) after taxes | (1,061 | ) | 134 | 1,195 | ||||||||||
 | Results relating to investments in associates: | |||||||||||||
| - Company’s participation in income | 18 | (5 | ) | 5 | ||||||||||
| - Other results | (3 | ) | (206 | ) | (30 | ) | ||||||||
|
| |||||||||||||
| Income (loss) from continuing operations | (1,046 | ) | (77 | ) | 1,170 | |||||||||
 | Discontinued operations - net of income tax | (410 | ) | 47 | 2 | |||||||||
|
| |||||||||||||
| Net income (loss) | (1,456 | ) | (30 | ) | 1,172 | |||||||||
| Attribution of net income (loss) | ||||||||||||||
| Net income (loss) attributable to shareholders | (1,460 | ) | (35 | ) | 1,169 | |||||||||
| Net income (loss) attributable to non-controlling interests | 4 | 5 | 3 | |||||||||||
| Earnings per common share attributable to shareholders | ||||||||||||||
| 2011 | 2012 | 2013 | ||||||||||||
| Basic earnings per common share in euros | ||||||||||||||
 | Income (loss) from continuing operations attributable to shareholders | (1.10 | ) | (0.09 | ) | 1.28 | ||||||||
| | Net income (loss) attributable to shareholders | (1.53 | ) | (0.04 | ) | 1.28 | ||||||||
| Diluted earnings per common share in euros1) | ||||||||||||||
| | Income (loss) from continuing operations attributable to shareholders | (1.10 | ) | (0.09 | ) | 1.27 | ||||||||
| | Net income (loss) attributable to shareholders | (1.53 | ) | (0.04 | ) | 1.27 | ||||||||
Prior-periodAnnual Report 2016 121
Group financial statements10.6
10.6 Consolidated statements of comprehensive income
| Philips Group | ||||||||||||||||
Consolidated statements of comprehensive incomein millions of EUR unless otherwise stated For the years ended December 31 | ||||||||||||||||
|
| |||||||||||||||
| 2014 | 2015 | 2016 | ||||||||||||||
|
| |||||||||||||||
| Net income for the period | 411 | 659 | 1,491 | |||||||||||||
 | Pensions and other post-employment plans: | |||||||||||||||
Remeasurements | (972 | ) | (101 | ) | (96 | ) | ||||||||||
| Income tax effect on remeasurements | 289 | 9 | 28 | ||||||||||||
| Revaluation reserve: | ||||||||||||||||
Release revaluation reserve | (10 | ) | (9 | ) | (4 | ) | ||||||||||
Reclassification directly into retained earnings | 10 | 9 | 4 | |||||||||||||
|
| |||||||||||||||
Total of items that will not be reclassified to Income Statement | (683 | ) | (92 | ) | (68 | ) | ||||||||||
| Currency translation differences: | |||||||||||||||
Net current period change, before tax | 600 | 643 | 219 | |||||||||||||
| Income tax effect | 203 | 187 | 2 | ||||||||||||
Reclassification adjustment for gain realized | (5 | ) | (1 | ) | — | |||||||||||
 | Available-for-sale financial assets: | |||||||||||||||
Net current period change, before tax | 30 | 33 | (44 | ) | ||||||||||||
| Income tax effect | (4 | ) | — | — | |||||||||||
Reclassification adjustment for loss (gain) realized | (54 | ) | (4 | ) | 24 | |||||||||||
| Cash flow hedges: | ||||||||||||||||
Net current period change, before tax | (40 | ) | (38 | ) | 3 | |||||||||||
| Income tax effect | 10 | — | (9 | ) | |||||||||||
Reclassification adjustment for loss (gain) realized | (7 | ) | 63 | 5 | ||||||||||||
|
| |||||||||||||||
Total of items that are or may be reclassified to Income Statement | 733 | 883 | 200 | |||||||||||||
|
| |||||||||||||||
| Other comprehensive income for period | 50 | 791 | 132 | |||||||||||||
|
| |||||||||||||||
| Total comprehensive income for the period | 461 | 1,450 | 1,623 | |||||||||||||
| Total comprehensive income attributable to: | ||||||||||||||||
Shareholders of Koninklijke Philips N.V. | 465 | 1,436 | 1,550 | |||||||||||||
Non-controlling interests | (4 | ) | 14 | 73 | ||||||||||||
|
| |||||||||||||||
The accompanying notes are an integral part of these consolidated financial statements.
122 Annual Report 2016
Group financial statements have been restated for the treatment of Audio, Video, Multimedia and Accessories as discontinued operations (see note 7, Discontinued operations and other assets classified as held for sale) and the adoption of IAS 19R, which mainly relates to accounting for pensions (see note 30, Post-employment benefits). 10.7
10.7 Consolidated balance sheets
| Philips Group | ||||||||||||||||||||||
Consolidated balance sheets in millions of EUR unless otherwise stated As of December 31 |
| |||||||||||||||||||||
|
| |||||||||||||||||||||
| 2015 | 2016 | |||||||||||||||||||||
|
| |||||||||||||||||||||
| Non-current assets | ||||||||||||||||||||||
 |  |  | Property, plant and equipment: | |||||||||||||||||||
| - At cost | 7,217 | 7,064 | ||||||||||||||||||||
| - Less accumulated depreciation | (4,895 | ) | (4,909 | ) | ||||||||||||||||||
|
|
|
| |||||||||||||||||||
| 2,322 | 2,155 | |||||||||||||||||||||
|
| Goodwill | 8,523 | 8,898 | ||||||||||||||||||
|
| Intangible assets excluding goodwill: | ||||||||||||||||||||
| - At cost | 9,251 | 9,782 | ||||||||||||||||||||
| - Less accumulated amortization | (5,558 | ) | (6,230 | ) | ||||||||||||||||||
|
|
|
| |||||||||||||||||||
| 3,693 | 3,552 | |||||||||||||||||||||
| Non-current receivables | 191 | 155 | |||||||||||||||||||
| Investments in associates | 181 | 190 | |||||||||||||||||||
| Othernon-current financial assets | 489 | 335 | |||||||||||||||||||
| Non-current derivative financial assets | 58 | 59 | |||||||||||||||||||
| Deferred tax assets | 2,758 | 2,792 | |||||||||||||||||||
| Othernon-current assets | 68 | 92 | |||||||||||||||||||
|
| |||||||||||||||||||||
| Totalnon-current assets | 18,283 | 18,228 | ||||||||||||||||||||
| Current assets | ||||||||||||||||||||||
| Inventories | 3,463 | 3,392 | |||||||||||||||||||
| Current financial assets | 12 | 101 | |||||||||||||||||||
| Other current assets | 444 | 486 | |||||||||||||||||||
| Current derivative financial assets | 103 | 101 | |||||||||||||||||||
| Income tax receivable | 114 | 154 | |||||||||||||||||||
|
| Receivables: | ||||||||||||||||||||
| - Accounts receivable | 4,727 | 4,992 | ||||||||||||||||||||
| - Accounts receivable from related parties | 16 | 33 | ||||||||||||||||||||
| - Other current receivables | 239 | 302 | ||||||||||||||||||||
|
|
|
| |||||||||||||||||||
| 4,982 | 5,327 | |||||||||||||||||||||
| Assets classified as held for sale | 1,809 | 2,180 | |||||||||||||||||||
| Cash and cash equivalents | 1,766 | 2,334 | |||||||||||||||||||
|
| |||||||||||||||||||||
| Total current assets | 12,693 | 14,075 | ||||||||||||||||||||
|
| |||||||||||||||||||||
| Total assets | 30,976 | 32,303 | ||||||||||||||||||||
|
| |||||||||||||||||||||
Annual Report 2016 123
Group financial statements 10.7
|
| |||||||||||||||||||
| 20151) | 2016 | |||||||||||||||||||
|
| |||||||||||||||||||
| Equity | ||||||||||||||||||||
| Shareholders’ equity: | |||||||||||||||||||
| Preference shares, par value EUR 0.20 per share: | ||||||||||||||||||||
| - Authorized: 2,000,000,000 shares (2015: 2,000,000,000 shares), issued none | ||||||||||||||||||||
| Common shares, par value EUR 0.20 per share: | ||||||||||||||||||||
| - Authorized: 2,000,000,000 shares (2015: 2,000,000,000 shares) | ||||||||||||||||||||
| - Issued and fully paid: 929,644,864 shares (2015: 931,130,387 shares) | 186 | 186 | ||||||||||||||||||
| Capital in excess of par value | 2,669 | 3,083 | ||||||||||||||||||
| Retained earnings | 8,040 | 8,233 | ||||||||||||||||||
| Revaluation reserve | 4 | — | ||||||||||||||||||
| Currency translation differences | 1,058 | 1,234 | ||||||||||||||||||
| Available-for-sale financial assets | 56 | 36 | ||||||||||||||||||
| Cash flow hedges | 12 | 10 | ||||||||||||||||||
| Treasury shares, at cost 7,208,301 shares (2015: 14,026,801 shares) | (363 | ) | (181 | ) | ||||||||||||||||
|
|
|
| |||||||||||||||||
| 11,662 | 12,601 | |||||||||||||||||||
| Non-controlling interests | 118 | 907 | |||||||||||||||||
|
| |||||||||||||||||||
| Group equity | 11,780 | 13,508 | ||||||||||||||||||
| Non-current liabilities | ||||||||||||||||||||
|
| Long-term debt | 4,095 | 4,021 | ||||||||||||||||
| Non-current derivative financial liabilities | 695 | 590 | |||||||||||||||||
|
| Long-term provisions1) | 3,471 | 2,926 | ||||||||||||||||
| Deferred tax liabilities | 164 | 66 | |||||||||||||||||
| Othernon-current liabilities1) | 812 | 719 | |||||||||||||||||
|
| |||||||||||||||||||
| Totalnon-current liabilities | 9,237 | 8,322 | ||||||||||||||||||
| Current liabilities | ||||||||||||||||||||
|
| Short-term debt | 1,665 | 1,585 | ||||||||||||||||
| Derivative financial liabilities | 238 | 283 | |||||||||||||||||
| Income tax payable | 116 | 146 | |||||||||||||||||
|
| Accounts and notes payable: | ||||||||||||||||||
| - Trade creditors | 2,669 | 2,845 | ||||||||||||||||||
| - Accounts payable to related parties | 4 | 3 | ||||||||||||||||||
|
|
|
| |||||||||||||||||
| 2,673 | 2,848 | |||||||||||||||||||
| Accrued liabilities1) | 2,815 | 3,034 | |||||||||||||||||
|
| Short-term provisions1) | 772 | 680 | ||||||||||||||||
| Liabilities directly associated with assets held for sale | 407 | 525 | |||||||||||||||||
| Other current liabilities | 1,273 | 1,372 | |||||||||||||||||
|
| |||||||||||||||||||
| Total current liabilities | 9,959 | 10,473 | ||||||||||||||||||
|
| |||||||||||||||||||
| Total liabilities and group equity | 30,976 | 32,303 | ||||||||||||||||||
|
| |||||||||||||||||||
The accompanying notes are an integral part of these consolidated financial statements.
| 1) |
|
156124 Annual Report 20132016
11 Group financial statements 11.5 - 11.510.8
11.510.8 Consolidated statements of comprehensive incomecash flows
in millions of euros unless otherwise stated
| Philips Group | ||||||||||||||
Consolidated statements of cash flowsin millions of EUR unless otherwise stated For the years ended December 31 |
| |||||||||||||
|
| |||||||||||||
| 20141) | 20151) | 2016 | ||||||||||||
|
| |||||||||||||
| Cash flows from operating activities | ||||||||||||||
Net income | 411 | 659 | 1,491 | |||||||||||
Discontinued operations, net of income taxes | (190 | ) | (245 | ) | (416 | ) | ||||||||
Adjustments to reconcile net income (loss) to net cash provided by operating activities: | ||||||||||||||
Depreciation, amortization, and impairments of fixed assets | 1,187 | 1,281 | 1,267 | |||||||||||
Impairment of goodwill and othernon-current financial assets | 21 | 48 | 29 | |||||||||||
Net gain on sale of assets | (83 | ) | (110 | ) | (15 | ) | ||||||||
Interest income | (39 | ) | (48 | ) | (49 | ) | ||||||||
Interest expense on debt, borrowings and other liabilities | 231 | 278 | 310 | |||||||||||
Income taxes | 26 | 239 | 327 | |||||||||||
Investments in associates, net of income taxes | (62 | ) | (10 | ) | (13 | ) | ||||||||
Decrease (increase) in working capital1) | 304 | 29 | 394 | |||||||||||
Decrease (increase) in receivables and other current assets | (75 | ) | 161 | (220 | ) | |||||||||
Decrease (increase) in inventories | (77 | ) | 22 | 44 | ||||||||||
Increase (decrease) in accounts payable, accrued and other current liabilities1) | 456 | (154 | ) | 570 | ||||||||||
Decrease (increase) innon-current receivables, other assets and other liabilities1) | (573 | ) | 65 | (147 | ) | |||||||||
 | Increase (decrease) in provisions1) | 809 | (440 | ) | (759 | ) | ||||||||
Other items | (242 | ) | (99 | ) | 120 | |||||||||
Interest paid | (232 | ) | (265 | ) | (311 | ) | ||||||||
Interest received | 38 | 48 | 48 | |||||||||||
Dividends received from investments in associates | 41 | 17 | 48 | |||||||||||
Income taxes paid | (344 | ) | (280 | ) | (420 | ) | ||||||||
|
| |||||||||||||
| Net cash provided by (used for) operating activities | 1,303 | 1,167 | 1,904 | |||||||||||
| Cash flows from investing activities | ||||||||||||||
Net capital expenditures | (806 | ) | (842 | ) | (831 | ) | ||||||||
Purchase of intangible assets | (114 | ) | (121 | ) | (108 | ) | ||||||||
Expenditures on development assets | (295 | ) | (314 | ) | (318 | ) | ||||||||
Capital expenditures on property, plant and equipment | (437 | ) | (522 | ) | (443 | ) | ||||||||
| Proceeds from sales of property, plant and equipment | 40 | 115 | 38 | ||||||||||
 | Net proceeds from (cash used for) derivatives and current financial assets | (7 | ) | (72 | ) | (120 | ) | |||||||
| Purchase of othernon-current financial assets | (81 | ) | (21 | ) | (61 | ) | |||||||
| Proceeds from othernon-current financial assets | 107 | 53 | 16 | ||||||||||
Purchase of businesses, net of cash acquired | (177 | ) | (1,116 | ) | (202 | ) | ||||||||
| Proceeds from sale of interests in businesses, net of cash disposed of | (20 | ) | 57 | 31 | |||||||||
|
| |||||||||||||
| Net cash used for investing activities | (984 | ) | (1,941 | ) | (1,167 | ) | ||||||||
| Cash flows from financing activities | ||||||||||||||
 | Proceeds from issuance (payments) of short-term debt | (37 | ) | 1,241 | (1,319 | ) | ||||||||
| Principal payments on short-term portion of long-term debt | (333 | ) | (104 | ) | (362 | ) | |||||||
| Proceeds from issuance of long-term debt | 69 | 94 | 1,304 | ||||||||||
 | Re-issuance of treasury shares | 117 | 81 | 80 | ||||||||||
| Purchase of treasury shares | (713 | ) | (506 | ) | (606 | ) | |||||||
 | IPO Philips Lighting proceeds | 863 | ||||||||||||
| IPO Philips Lighting transaction costs paid | (38 | ) | |||||||||||
| Dividends paid to shareholders of Koninklijke Philips N.V. | (292 | ) | (298 | ) | (330 | ) | |||||||
Dividends paid tonon-controlling interests | (12 | ) | ||||||||||||
|
| |||||||||||||
| �� | Net cash provided by (used for) financing activities | (1,189 | ) | 508 | (420 | ) | ||||||||
|
| |||||||||||||
| Net cash provided by (used for) continuing operations | (870 | ) | (266 | ) | 317 | |||||||||
| Cash flows from discontinued operations | ||||||||||||||
| Net cash provided by (used for) operating activities | 105 | 79 | 268 | |||||||||||
| Net cash provided by (used for) investing activities | 88 | |||||||||||||
|
| |||||||||||||
| Net cash provided by (used for) discontinued operations | 193 | 79 | 268 | |||||||||||
|
| |||||||||||||
| Net cash provided by (used for) continuing and discontinued operations | (677 | ) | (187 | ) | 585 | |||||||||
| Effect of changes in exchange rates on cash and cash equivalents | 85 | 80 | (17 | ) | ||||||||||
| Cash and cash equivalents at the beginning of the year | 2,465 | 1,873 | 1,766 | |||||||||||
|
| |||||||||||||
| Cash and cash equivalents at the end of the year | 1,873 | 1,766 | 2,334 | |||||||||||
|
| |||||||||||||
| Consolidated statements of comprehensive income of the Philips Group for the years ended December 31 | ||||||||||||
| 2011 | 2012 | 2013 | ||||||||||
| Net income (loss) for the period | (1,456 | ) | (30 | ) | 1,172 | |||||||
| Other comprehensive income items that will not be reclassified to profit or loss: | ||||||||||||
| Pensions and other post-employment plans: | ||||||||||||
Remeasurements | (404 | ) | (206 | ) | 139 | |||||||
Income tax effect on remeasurements | 120 | 60 | (77 | ) | ||||||||
| Revaluation reserve: | ||||||||||||
Release revaluation reserve | (16 | ) | (16 | ) | (31 | ) | ||||||
Reclassification directly into retained earnings | 16 | 16 | 31 | |||||||||
|
| |||||||||||
| Total of items that will not be reclassified to profit or loss | (284 | ) | (146 | ) | 62 | |||||||
| Other comprehensive income items that are or may be reclassified to profit or loss: | ||||||||||||
| Currency translation differences: | ||||||||||||
Net current period change, before tax | 71 | (99 | ) | (427 | ) | |||||||
Income tax effect | (2 | ) | — | (35 | ) | |||||||
Reclassification adjustment for gain (loss) realized | 3 | (1 | ) | (14 | ) | |||||||
| Available-for-sale financial assets: | ||||||||||||
Net current period change, before tax | (87 | ) | 8 | (5 | ) | |||||||
Income tax effect | 19 | (2 | ) | — | ||||||||
Reclassification adjustment for (loss) gain realized | (26 | ) | 3 | 6 | ||||||||
| Cash flow hedges: | ||||||||||||
Net current period change, before tax | (31 | ) | 23 | 68 | ||||||||
Income tax effect | — | (8 | ) | (2 | ) | |||||||
Reclassification adjustment for (loss) gain realized | 27 | 14 | (62 | ) | ||||||||
|
| |||||||||||
| Total of items that are or may be reclassified to profit or loss | (26 | ) | (62 | ) | (471 | ) | ||||||
| Other comprehensive (loss) income for period | (310 | ) | (208 | ) | (409 | ) | ||||||
| Total comprehensive income (loss) for the period | (1,766 | ) | (238 | ) | 763 | |||||||
| Total comprehensive income (loss) attributable to: | ||||||||||||
Shareholders | (1,770 | ) | (243 | ) | 760 | |||||||
Non-controlling interests | 4 | 5 | 3 | |||||||||
The Consolidated statements of comprehensive income have been restated for the adoption of IAS 19R, which mainly relates to pension reporting (see note 30, Post-employment benefits). The accompanying notes are an integral part of these consolidated financial statements.
Annual Report 2013 157
11 Group financial statements 11.6 - 11.6
11.6 Consolidated balance sheets
in millions of euros unless otherwise stated
| Consolidated balance sheets of the Philips Group as of December 31 | ||||||||||||||||||||
| Assets | ||||||||||||||||||||
| 2012 | 2013 | |||||||||||||||||||
| Non-current assets | ||||||||||||||||||||
|  | Property, plant and equipment: | ||||||||||||||||||
| - At cost | 7,880 | 7,692 | ||||||||||||||||||
| - Less accumulated depreciation | (4,921 | ) | (4,912 | ) | ||||||||||||||||
| 2,959 | 2,780 | |||||||||||||||||||
| Goodwill | 6,948 | 6,504 | |||||||||||||||||
| Intangible assets excluding goodwill: | |||||||||||||||||||
| - At cost | 7,821 | 7,638 | ||||||||||||||||||
| - Less accumulated amortization | (4,090 | ) | (4,376 | ) | ||||||||||||||||
| 3,731 | 3,262 | |||||||||||||||||||
 | Non-current receivables | 176 | 144 | |||||||||||||||||
| Investments in associates | 177 | 161 | |||||||||||||||||
| Other non-current financial assets | 549 | 496 | |||||||||||||||||
| Deferred tax assets | 1,919 | 1,675 | |||||||||||||||||
| Other non-current assets | 94 | 63 | |||||||||||||||||
|
| |||||||||||||||||||
| Total non-current assets | 16,553 | 15,085 | ||||||||||||||||||
| Current assets | ||||||||||||||||||||
| Inventories - net | 3,495 | 3,240 | |||||||||||||||||
| Current financial assets | — | 10 | ||||||||||||||||||
| Other current assets | 337 | 354 | |||||||||||||||||
| Derivative financial assets | 137 | 150 | |||||||||||||||||
| Income tax receivable | 97 | 70 | |||||||||||||||||
|  | Receivables: | ||||||||||||||||||
| - Accounts receivable - net | 4,334 | 4,420 | ||||||||||||||||||
| - Accounts receivable from related parties | 13 | 39 | ||||||||||||||||||
| - Other current receivables | 238 | 219 | ||||||||||||||||||
| 4,585 | 4,678 | |||||||||||||||||||
| Assets classified as held for sale | 43 | 507 | |||||||||||||||||
| Cash and cash equivalents | 3,834 | 2,465 | |||||||||||||||||
|
| |||||||||||||||||||
| Total current assets | 12,528 | 11,474 | ||||||||||||||||||
| Contingent assets | |||||||||||||||||||
|
| |||||||||||||||||||
| Total assets | 29,081 | 26,559 | ||||||||||||||||||
158 Annual Report 2013
11 Group financial statements 11.6 - 11.6
| Equity and liabilities | ||||||||||||||||||||||
| 2012 | 2013 | |||||||||||||||||||||
| Equity | ||||||||||||||||||||||
| Shareholders’ equity: | |||||||||||||||||||||
| Preference shares, par value EUR 0.20 per share: | ||||||||||||||||||||||
| - Authorized: 2,000,000,000 shares (2012: 2,000,000,000 shares), issued none | ||||||||||||||||||||||
| Common shares, par value EUR 0.20 per share: | ||||||||||||||||||||||
| - Authorized: 2,000,000,000 shares (2012: 2,000,000,000 shares) | ||||||||||||||||||||||
| - Issued and fully paid: 937,845,789 shares (2012: 957,132,962 shares) | 191 | 188 | ||||||||||||||||||||
| Capital in excess of par value | 1,304 | 1,796 | ||||||||||||||||||||
| Retained earnings | 10,724 | 10,415 | ||||||||||||||||||||
| Revaluation reserve | 54 | 23 | ||||||||||||||||||||
| Currency translation differences | (93 | ) | (569 | ) | ||||||||||||||||||
| Available-for-sale financial assets | 54 | 55 | ||||||||||||||||||||
| Cash flow hedges | 20 | 24 | ||||||||||||||||||||
| Treasury shares, at cost 24,508,022 shares (2012: 42,541,687 shares) | (1,103 | ) | (718 | ) | ||||||||||||||||||
| 11,151 | 11,214 | |||||||||||||||||||||
| Non-controlling interests | 34 | 13 | |||||||||||||||||||
|
| |||||||||||||||||||||
| Group equity | 11,185 | 11,227 | ||||||||||||||||||||
| Non-current liabilities | ||||||||||||||||||||||
|
| Long-term debt | 3,725 | 3,309 | ||||||||||||||||||
|
|
| Long-term provisions | 2,119 | 1,903 | |||||||||||||||||
| Deferred tax liabilities | 92 | 76 | |||||||||||||||||||
| Other non-current liabilities | 2,005 | 1,568 | |||||||||||||||||||
|
| |||||||||||||||||||||
| Total non-current liabilities | 7,941 | 6,856 | ||||||||||||||||||||
| Current liabilities | ||||||||||||||||||||||
|
| Short-term debt | 809 | 592 | ||||||||||||||||||
| Derivative financial liabilities | 517 | 368 | |||||||||||||||||||
| Income tax payable | 200 | 143 | |||||||||||||||||||
|
| Accounts and notes payable: | ||||||||||||||||||||
| - Trade creditors | 2,835 | 2,458 | ||||||||||||||||||||
| - Accounts payable to related parties | 4 | 4 | ||||||||||||||||||||
| 2,839 | 2,462 | |||||||||||||||||||||
| Accrued liabilities | 3,171 | 2,830 | |||||||||||||||||||
|
|
| Short-term provisions | 837 | 651 | |||||||||||||||||
| Liabilities directly associated with assets held for sale | 27 | 348 | |||||||||||||||||||
| Other current liabilities | 1,555 | 1,082 | |||||||||||||||||||
|
| |||||||||||||||||||||
| Total current liabilities | 9,955 | 8,476 | ||||||||||||||||||||
|
| Contractual obligations and contingent liabilities | ||||||||||||||||||||
|
| |||||||||||||||||||||
| Total liabilities and group equity | 29,081 | 26,559 | ||||||||||||||||||||
Prior-period financial statements have been restated for the treatment of Audio, Video, Multimedia and Accessories as discontinued operations (see note 7, Discontinued operations and other assets classified as held for sale) and the adoption of IAS 19R, which mainly relates to accounting for pensions (see note 30, Post-employment benefits). The accompanying notes are an integral part of these consolidated financial statements.
Annual Report 2013 159
11 Group financial statements 11.7 - 11.7
11.7 Consolidated statements of cash flows
in millions of euros
| Consolidated statements of cash flows of the Philips Group for the years ended December 31 | ||||||||||||||
| 2011 | 2012 | 2013 | ||||||||||||
| Cash flows from operating activities | ||||||||||||||
| Net income (loss) | (1,456 | ) | (30 | ) | 1,172 | |||||||||
| Result of discontinued operations - net of income tax | 410 | (47 | ) | (2 | ) | |||||||||
| Adjustments to reconcile net income (loss) to net cash provided by operating activities: | ||||||||||||||
| Depreciation, amortization, and impairments of fixed assets | 1,400 | 1,398 | 1,349 | |||||||||||
| Impairment of goodwill and other non-current financial assets | 1,387 | 14 | 38 | |||||||||||
| Net gain on sale of assets | (88 | ) | (141 | ) | (54 | ) | ||||||||
| Loss (income) from investments in associates | (14 | ) | 5 | 25 | ||||||||||
| Dividends received from investments in associates | 44 | 15 | 6 | |||||||||||
| Dividends paid to non-controlling interests | (4 | ) | (4 | ) | (7 | ) | ||||||||
| (Increase) decrease in working capital | (622 | ) | 546 | (1,417 | ) | |||||||||
| Increase in receivables and other current assets | (363 | ) | (191 | ) | (530 | ) | ||||||||
| Increase in inventories | (216 | ) | (32 | ) | (165 | ) | ||||||||
| (Decrease) increase in accounts payable, accrued and other current liabilities | (43 | ) | 769 | (722 | ) | |||||||||
| Increase in non-current receivables, other assets and other liabilities | (425 | ) | (327 | ) | (76 | ) | ||||||||
| (Decrease) increase in provisions | 15 | 429 | (194 | ) | ||||||||||
| Other items | 113 | 224 | 298 | |||||||||||
|
| |||||||||||||
| Net cash provided by operating activities | 760 | 2,082 | 1,138 | |||||||||||
| Cash flows from investing activities | ||||||||||||||
| Purchase of intangible assets | (69 | ) | (34 | ) | (49 | ) | ||||||||
| Proceeds from sale of intangible assets | — | 160 | — | |||||||||||
| Expenditures on development assets | (276 | ) | (345 | ) | (357 | ) | ||||||||
| Capital expenditures on property, plant and equipment | (640 | ) | (661 | ) | (587 | ) | ||||||||
| Proceeds from sales of property, plant and equipment | 128 | 425 | 27 | |||||||||||
 | Cash from (used for) derivatives and current financial assets | 26 | (46 | ) | (101 | ) | ||||||||
| Purchase of other non-current financial assets | (43 | ) | (167 | ) | (13 | ) | ||||||||
 | Proceeds from other non-current financial assets | 87 | 3 | 15 | ||||||||||
| Purchase of businesses, net of cash acquired | (507 | ) | (261 | ) | (11 | ) | ||||||||
| Proceeds from sale of interests in businesses, net of cash disposed of | 19 | 1 | 79 | |||||||||||
|
| |||||||||||||
| Net cash used for investing activities | (1,275 | ) | (925 | ) | (997 | ) | ||||||||
| Cash flows from financing activities | ||||||||||||||
| Proceeds from issuance (payments) of short-term debt | (217 | ) | 133 | (285 | ) | |||||||||
| Principal payments of long-term debt | (1,097 | ) | (631 | ) | (186 | ) | ||||||||
| Proceeds from issuance of long-term debt | 454 | 1,228 | 64 | |||||||||||
| Treasury shares transactions | (671 | ) | (768 | ) | (562 | ) | ||||||||
| Dividends paid | (259 | ) | (255 | ) | (272 | ) | ||||||||
|
| |||||||||||||
| Net cash used for financing activities | (1,790 | ) | (293 | ) | (1,241 | ) | ||||||||
|
| |||||||||||||
| Net cash (used for) provided by continuing operations | (2,305 | ) | 864 | (1,100 | ) | |||||||||
160 Annual Report 2013
11 Group financial statements 11.7 - 11.7
| 2011 | 2012 | 2013 | ||||||||||||
| Cash flows from discontinued operations | ||||||||||||||
Net cash (used for) provided by operating activities | (280 | ) | (166 | ) | (159 | ) | ||||||||
Net cash (used for) provided by investing activities | (94 | ) | 40 | (47 | ) | |||||||||
|
| |||||||||||||
Net cash used for discontinued operations | (374 | ) | (126 | ) | (206 | ) | ||||||||
|
| |||||||||||||
Net cash (used for) provided by continuing and discontinued operations | (2,679 | ) | 738 | (1,306 | ) | |||||||||
Effect of changes in exchange rates on cash and cash equivalents | (7 | ) | (51 | ) | (63 | ) | ||||||||
Cash and cash equivalents at the beginning of the year | 5,833 | 3,147 | 3,834 | |||||||||||
|
| |||||||||||||
Cash and cash equivalents at the end of the year | 3,147 | 3,834 | 2,465 | |||||||||||
| Supplemental disclosures to the Consolidated statements of cash flows | ||||||||||||||
| 2011 | 2012 | 2013 | ||||||||||||
Cash flows from: | ||||||||||||||
Interest paid | (269 | ) | (273 | ) | (267 | ) | ||||||||
Interest received | 38 | 34 | 52 | |||||||||||
Pensions | (639 | ) | (610 | ) | (679 | ) | ||||||||
Income taxes | (582 | ) | (359 | ) | (454 | ) | ||||||||
Net gain on sale of assets: | ||||||||||||||
Cash proceeds from the sale of assets | 234 | 589 | 121 | |||||||||||
Book value of these assets | (164 | ) | (473 | ) | (63 | ) | ||||||||
Deferred results on sale and leaseback transactions | — | 25 | (4 | ) | ||||||||||
Non-cash proceeds | 18 | — | — | |||||||||||
|
| |||||||||||||
| 88 | 141 | 54 | ||||||||||||
Non-cash investing and financing information | ||||||||||||||
 | Assets in lieu of cash from the sale of businesses: | |||||||||||||
Shares/share options/convertible bonds (continuing operations) | 18 | — | — | |||||||||||
Shares/share options/convertible bonds (discontinued operations) | — | 17 | — | |||||||||||
Conversion of convertible personnel debentures | — | 4 | 7 | |||||||||||
Treasury shares transactions: | ||||||||||||||
Shares acquired | (751 | ) | (816 | ) | (669 | ) | ||||||||
Exercise of stock options | 80 | 48 | 107 | |||||||||||
Prior-period financial statements have been restated for the treatment of Audio, Video, Multimedia and Accessories as discontinued operations (see note 7, Discontinued operations and other assets classified as held for sale) and the adoption of IAS 19R, which mainly relates to accounting for pensions (see note 30, Post-employment benefits). The accompanying notes are an integral part of these consolidated financial statements.
For a number of reasons, principally the effects of translation differences and consolidation changes, certain items in the statements of cash flows do not correspond to the differences between the balance sheet amounts for the respective items.
| 1) | Adjusted to reflect a reclassification of net defined-benefit obligations into (Long-term) provisions. Seenote 1, Significant accounting policies |
Annual Report 2013 1612016 125
11 Group financial statements 11.8 - 11.810.9
11.810.9 Consolidated statements of changes in equity
in millions of euros unless otherwise statedPhilips Group
Consolidated statements of changes in equityin millions of EUR unless otherwise stated
For the Philips Groupyear ended December 31
| common share | capital in excess of par value | retained earnings | revaluation reserve | currency translation differences | available- for-sale | cash flow | treasury shares at cost | total shareholders’ equity | non-controlling interests | total equity |
|
| ||||||||||||||||||||||||||||||||||||||||||||||||||||||||||||||||||||||||||||
Balance as of Jan. 1, 2011 | 197 | 354 | 15,391 | 86 | (65 | ) | 139 | (5 | ) | (1,076 | ) | 15,021 | 46 | 15,067 | ||||||||||||||||||||||||||||||||||||||||||||||||||||||||||||||||||||||||||
| common share | capital in excess of par value | retained earnings | revaluation reserve | currency translation differences1) | available- for-sale | cash flow hedges | treasury cost | total shareholders’ equity | non-controlling interests | Group equity | ||||||||||||||||||||||||||||||||||||||||||||||||||||||||||||||||||||||||||||||
|
| |||||||||||||||||||||||||||||||||||||||||||||||||||||||||||||||||||||||||||||||||||||||
Balance as of Jan. 1, 2014 | 188 | 1,796 | 10,415 | 23 | (569 | ) | 55 | 24 | (718 | ) | 11,214 | 13 | 11,227 | |||||||||||||||||||||||||||||||||||||||||||||||||||||||||||||||||||||||||||
Total comprehensive income (loss) | (1,728 | ) | (16 | ) | 72 | (94 | ) | (4 | ) | — | (1,770 | ) | 4 | (1,766 | ) | (258 | ) | (10 | ) | 798 | (28 | ) | (37 | ) | — | 465 | (4 | ) | 461 | |||||||||||||||||||||||||||||||||||||||||||||||||||||||||||
Dividend distributed | 5 | 443 | (711 | ) | (263 | ) | (263 | ) | 3 | 433 | (729 | ) | (293 | ) | (293 | ) | ||||||||||||||||||||||||||||||||||||||||||||||||||||||||||||||||||||||||
Movement in non-controlling interests | (5 | ) | (5 | ) | (16 | ) | (21 | ) | ||||||||||||||||||||||||||||||||||||||||||||||||||||||||||||||||||||||||||||||||
Movement in non-controlling interests - Other | — | — | 92 | 92 | ||||||||||||||||||||||||||||||||||||||||||||||||||||||||||||||||||||||||||||||||||||
Cancellation of treasury shares | — | — | — | — | — | — | (4 | ) | (529 | ) | 533 | — | — | |||||||||||||||||||||||||||||||||||||||||||||||||||||||||||||||||||||||||||
Purchase of treasury shares | — | (51 | ) | (700 | ) | (751 | ) | (751 | ) | (26 | ) | (688 | ) | (714 | ) | (714 | ) | |||||||||||||||||||||||||||||||||||||||||||||||||||||||||||||||||||||||
Re-issuance of treasury shares | (34 | ) | (6 | ) | 86 | 46 | 46 | (127 | ) | (83 | ) | 326 | 116 | 116 | ||||||||||||||||||||||||||||||||||||||||||||||||||||||||||||||||||||||||||
Share-based compensation plans | 56 | — | 56 | 56 | 88 | 88 | 88 | |||||||||||||||||||||||||||||||||||||||||||||||||||||||||||||||||||||||||||||||||
Income tax share-based compensation plans | (6 | ) | — | (6 | ) | (6 | ) | (9 | ) | (9 | ) | (9 | ) | |||||||||||||||||||||||||||||||||||||||||||||||||||||||||||||||||||||||||||
Balance as of Dec. 31, 2011 | 202 | 813 | 12,890 | 70 | 7 | 45 | (9 | ) | (1,690 | ) | 12,328 | 34 | 12,362 | |||||||||||||||||||||||||||||||||||||||||||||||||||||||||||||||||||||||||||
|
| |||||||||||||||||||||||||||||||||||||||||||||||||||||||||||||||||||||||||||||||||||||||
Balance as of Dec. 31, 2014 | 187 | 2,181 | 8,790 | 13 | 229 | 27 | (13 | ) | (547 | ) | 10,867 | 101 | 10,968 | |||||||||||||||||||||||||||||||||||||||||||||||||||||||||||||||||||||||||||
Total comprehensive income (loss) | (165 | ) | (16 | ) | (100 | ) | 9 | 29 | — | (243 | ) | 5 | (238 | ) | 562 | (9 | ) | 829 | 29 | 25 | — | 1,436 | 14 | 1,450 | ||||||||||||||||||||||||||||||||||||||||||||||||||||||||||||||||
Dividend distributed | 6 | 422 | (687 | ) | (259 | ) | (259 | ) | 3 | 429 | (730 | ) | (298 | ) | (298 | ) | ||||||||||||||||||||||||||||||||||||||||||||||||||||||||||||||||||||||||
Movement in non-controlling interests | — | — | (5 | ) | (5 | ) | ||||||||||||||||||||||||||||||||||||||||||||||||||||||||||||||||||||||||||||||||||
Movement in non-controlling interests - Other | 3 | 3 | ||||||||||||||||||||||||||||||||||||||||||||||||||||||||||||||||||||||||||||||||||||||
Cancellation of treasury shares | (17 | ) | — | (1,221 | ) | 1,238 | — | — | (4 | ) | (513 | ) | 517 | — | — | |||||||||||||||||||||||||||||||||||||||||||||||||||||||||||||||||||||||||
Purchase of treasury shares | — | (47 | ) | (769 | ) | (816 | ) | (816 | ) | (12 | ) | (495 | ) | (507 | ) | (507 | ) | |||||||||||||||||||||||||||||||||||||||||||||||||||||||||||||||||||||||
Re-issuance of treasury shares | (22 | ) | (46 | ) | 118 | 50 | 50 | (23 | ) | (57 | ) | 162 | 82 | 82 | ||||||||||||||||||||||||||||||||||||||||||||||||||||||||||||||||||||||||||
Share-based compensation plans | 84 | — | 84 | 84 | 101 | 101 | 101 | |||||||||||||||||||||||||||||||||||||||||||||||||||||||||||||||||||||||||||||||||
Income tax share-based compensation plans | 7 | — | 7 | 7 | (19 | ) | (19 | ) | (19 | ) | ||||||||||||||||||||||||||||||||||||||||||||||||||||||||||||||||||||||||||||||
Balance as of Dec. 31, 2012 | 191 | 1,304 | 10,724 | 54 | (93 | ) | 54 | 20 | (1,103 | ) | 11,151 | 34 | 11,185 | |||||||||||||||||||||||||||||||||||||||||||||||||||||||||||||||||||||||||||
|
| |||||||||||||||||||||||||||||||||||||||||||||||||||||||||||||||||||||||||||||||||||||||
Balance as of Dec. 31, 2015 | 186 | 2,669 | 8,040 | 4 | 1,058 | 56 | 12 | (363 | ) | 11,662 | 118 | 11,780 | ||||||||||||||||||||||||||||||||||||||||||||||||||||||||||||||||||||||||||||
Total comprehensive income (loss) | 1,262 | (31 | ) | (476 | ) | 1 | 4 | — | 760 | 3 | 763 | 1,384 | (4 | ) | 191 | (20 | ) | (1 | ) | 1,550 | 73 | 1,623 | ||||||||||||||||||||||||||||||||||||||||||||||||||||||||||||||||||
Dividend distributed | 4 | 402 | (678 | ) | (272 | ) | (272 | ) | 4 | 398 | (732 | ) | (330 | ) | (330 | ) | ||||||||||||||||||||||||||||||||||||||||||||||||||||||||||||||||||||||||
Movement in non-controlling interests | — | — | (24 | ) | (24 | ) | ||||||||||||||||||||||||||||||||||||||||||||||||||||||||||||||||||||||||||||||||||
IPO Philips Lighting | 125 | (15 | ) | (1 | ) | 109 | 716 | 825 | ||||||||||||||||||||||||||||||||||||||||||||||||||||||||||||||||||||||||||||||||
Cancellation of treasury shares | (7 | ) | (780 | ) | 787 | — | — | (4 | ) | (446 | ) | 450 | ||||||||||||||||||||||||||||||||||||||||||||||||||||||||||||||||||||||||||||
Purchase of treasury shares | (38 | ) | (631 | ) | (669 | ) | (669 | ) | (589 | ) | (589 | ) | (589 | ) | ||||||||||||||||||||||||||||||||||||||||||||||||||||||||||||||||||||||||||
Re-issuance of treasury shares | (36 | ) | (75 | ) | 229 | 118 | 118 | (122 | ) | (35 | ) | 231 | 74 | 74 | ||||||||||||||||||||||||||||||||||||||||||||||||||||||||||||||||||||||||||
Share call options | (103 | ) | 90 | (13 | ) | (13 | ) | |||||||||||||||||||||||||||||||||||||||||||||||||||||||||||||||||||||||||||||||||
Share-based compensation plans | 105 | 105 | 105 | 119 | 119 | 119 | ||||||||||||||||||||||||||||||||||||||||||||||||||||||||||||||||||||||||||||||||||
Income tax share-based compensation plans | 21 | 21 | 21 | 19 | 19 | 19 | ||||||||||||||||||||||||||||||||||||||||||||||||||||||||||||||||||||||||||||||||||
Balance as of Dec. 31, 2013 | 188 | 1,796 | 10,415 | 23 | (569 | ) | 55 | 24 | (718 | ) | 11,214 | 13 | 11,227 | |||||||||||||||||||||||||||||||||||||||||||||||||||||||||||||||||||||||||||
|
| |||||||||||||||||||||||||||||||||||||||||||||||||||||||||||||||||||||||||||||||||||||||
Balance as of Dec. 31, 2016 | 186 | 3,083 | 8,233 | 1,234 | 36 | 10 | (181 | ) | 12,601 | 907 | 13,508 | |||||||||||||||||||||||||||||||||||||||||||||||||||||||||||||||||||||||||||||
|
| |||||||||||||||||||||||||||||||||||||||||||||||||||||||||||||||||||||||||||||||||||||||
The Consolidated statements of changes in equity have been restated for the adoption of IAS 19R, which mainly relates to pension reporting (see note 30, Post-employment benefits). The accompanying notes are an integral part of these consolidated financial statements.
| 1) | Cumulative translation adjustments related to Investments in associates were EUR 40 million at December 31, 2016 (2015: EUR 34 million, 2014: EUR 19 million). |
162
126 Annual Report 20132016
11 Group financial statements
 11.8 - 11.910.10
all amounts in millions of euros unless otherwise stated
Prior-period financial statements have been restated for the treatment of Audio, Video, Multimedia and Accessories as discontinued operations (see note 7, Discontinued operations and other assets classified as held for sale) and the adoption of IAS 19R, which mainly relates to accounting for pensions (see note 30, Post-employment benefits).
Notes to the Consolidated financial statements of the Philips Group
Significant accounting policies
The Consolidated financial statements in thisthe Group financial statements section have been prepared in accordance with International Financial Reporting Standards (IFRS) as endorsed by the European Union (EU) and with the statutory provisions of Part 9, Book 2 of the Dutch Civil Code. All standards and interpretations issued by the International Accounting Standards Board (IASB) and the IFRS Interpretations Committee effective year-end 20132016 have been endorsed by the EU, except that the EU did not adopt some of the paragraphs of IAS 39 applicable to certain hedge transactions. Koninklijke Philips N.V. (hereafter: the ‘Company’ or ‘Philips’) has no hedge transactions to which these paragraphs are applicable. Consequently, the accounting policies applied by Philips also comply fully with IFRS as issued by the IASB. These accounting policies have been applied by group entities.
The Consolidated financial statements have been prepared under the historical cost convention, unless otherwise indicated.
The Consolidated financial statements are presented in euros,euro, which is the Company’s presentation currency.
On February 25, 2014,21, 2017, the Board of Management authorized the Consolidated financial statements for issue. The Consolidated financial statements as presented in this report are subject to the adoption by the Annual General Meeting of Shareholders, to be held on May 1, 2014.11, 2017.
Use of estimates
The preparation of the Consolidated financial statements in conformity with IFRS requires management to make judgments, estimates and assumptions that affect the application of accounting policies and the reported amounts of assets, liabilities, income and expenses. These estimates inherently contain certaina degree of uncertainty. Actual results may differ from these estimates under different assumptions or conditions.
TheseIn the process of applying the accounting policies, management has made estimates and assumptions affectconcerning the future and other key sources of estimation uncertainty at the reporting date, that have a significant risk of causing a material adjustment to the reported amounts of assets and liabilities within the next financial year, as well as to the disclosure of contingent liabilities at the date of the Consolidated financial statements, and the reported amounts of revenues and expenses during the reporting period. We evaluateThe Company evaluates these estimates and judgments on an ongoing basis and base ourbases the estimates on historical experience, current and expected future outcomes, third-party evaluations and various other assumptions that we believePhilips believes are reasonable under the circumstances. Existing circumstances and assumptions about future developments may change due to circumstances beyond the Company’s control and are reflected in the assumptions if and when they occur. The results of these estimates form the basis for making judgments about the carrying values of assets and liabilities as well as identifying and assessing the accounting treatment with respect to commitments and contingencies. We reviseThe Company revises material estimates if changes occur in the circumstances or there is new information or experience on which an estimate was or can be based.
Estimates significantly impactThe areas where the most significant judgments and estimates are made are goodwill, and other intangibles acquired,deferred tax on activities disposed,asset recoverability, impairments, financial instruments, the accounting for an arrangement containing a lease, revenue recognition (multiple element arrangements), assets and liabilities from employee benefit plans, other provisions and tax risks and other contingencies, classification of assets and liabilities held for sale and the presentation of items of profit and loss and cash flows as continued or discontinued. Thediscontinued, as well as when determining the fair values of acquired identifiable intangible assets are based on an assessment of future cash flows. Impairment analysesFor further discussion on these significant judgements and estimates, reference is made to the respective notes within these consolidated financial statements that relate to the above topics.
Further judgment is applied when analyzing impairments of goodwill and intangible assets not yet ready for use and indefinite-lived intangible assetsthat are performed annually and whenever a triggering event has occurred to determine whether the carrying value exceeds the recoverable amount. These analyses generally are based on estimates of future cash flows.
The fair value of financial instruments that are not traded in an active market is determined by using valuation techniques. The Furthermore, the Company uses itsapplies judgment to select from a variety of common valuation methods including the discounted cash flow method and option valuation models and to make assumptions that are mainly based on market conditions existing at each balance sheet date.
Actuarialwhen actuarial assumptions are established to anticipate future events andthat are used in calculating post-employment benefit expenses and liabilities. These factors include assumptions with respect to interest rates, rates of increase in health carehealthcare costs, rates of future compensation increases, turnover rates and life expectancy.
Prior-year informationChanges in presentation from the prior year
The accounting policies set out in this section have been applied consistently for all periods presented in these consolidated financial statements, except for the presentation of certain prior-year information hasthe items mentioned below. Prior-year amounts have been reclassified to conform to the current year presentation, includingpresentation.
Reclassification of net defined-benefit obligations
To enhance transparency, the 2011 presentation of adjustments to the results of prior year’s divestments reported as discontinued operations as a consequence of the resolution of uncertainties that arose from the relevant sales agreements. As a result, an income tax benefit of EUR 30 million was retrospectively reclassifiedCompany presents all net defined-benefit post-employment plan obligations under Long-term provisions in the 2011 comparative figuresbalance sheet as from income tax expense of continuing operationsthis year. Up to income tax from discontinued operations.
Basis of consolidation
The Consolidated financial statements include the accounts of Koninklijke Philips N.V. (‘the Company’) and all subsidiaries that the Company controls, i.e. when it is exposed, or has rights, to variable returns from its involvement with the investee and has the ability to affect those returns through its power over the investee. The existence and effect of potential voting rights are considered when assessing whether the Company controls another entity. Subsidiaries are fully consolidated from the date that control commences until the date that control ceases. All intercompany balances and transactions have been eliminated in the Consolidated financial statements. Unrealized losses are eliminated in the same way as unrealized gains, but only to the extent that there is no evidence of impairment.
Business combinations
Business combinations are accounted for using the acquisition method. Under the acquisition method, the identifiable assets acquired, liabilities assumed and any non-controlling interest in the acquiree are recognized at the acquisition date, which is the date on which control is transferred to the Company.
For acquisitions on or after January 1, 2010, the Company measures goodwill at the acquisition date as:
the fair value of the consideration transferred; plus
the recognized amount of any non-controlling interest in the acquiree; plus
if the business combination is achieved in stages, the fair value of the existing equity interest in the acquiree; less
2015, the net recognized amount (generally fair value) of the identifiable assets acquired and liabilities assumed.
When the excess is negative, a bargain purchase gain is recognized immediately in profit or loss (hereafter referred to as the Statement of income).
The consideration transferred does not include amounts related to the settlement of pre-existing relationships. Such amounts are generally recognized in the Statement of income.
Costs related to the acquisition, other than those associated with the issue of debt or equity securities, that the Company incurs in connection with a business combination are expensed as incurred.
Any contingent consideration payable is recognized at fair value at the acquisition date and initially isdefined-benefit post- employment plan obligations were presented as Long-term provisions. When timing and amount of the consideration become more certain, it is reclassified to Accrued liabilities. If the contingent consideration is classified as equity, it is not remeasured and settlement is accounted for within equity. Otherwise, subsequent changes to the fair value of the contingent consideration are recognized in the Statement of income.
Acquisitions between January 1, 2004 and January 1, 2010
For acquisitions between January 1, 2004 and January 1, 2010, goodwill represents the excess of the cost of the acquisition over the Company’s interest in the recognized amount (generally fair value) of the identifiable assets, liabilities and contingent liabilities of the acquiree. Transaction costs, other than those associated with the issue of debt or equity securities, that the Company incurred in connection with business combinations were capitalized as part of the cost of the acquisition.under
Annual Report 2013 1632016 127
11 Group financial statements 11.9 - 11.910.10
AcquisitionsAccrued liabilities and Othernon-current liabilities for funded plans and under Short-term and Long-term provisions for unfunded plans. The retrospective reclassifications from these liability captions to Long-term provisions are as follows:
Reclassification of and adjustmentsnet defined-benefit obligations to non-controlling interestsLong-term provisions
Acquisitionsin millions of non-controlling interests are accounted for as transactions with ownersEUR
|
| |||||||
| December 31, 2015 | December 31, 2016 | |||||||
|
| |||||||
From | ||||||||
Accrued liabilities | (48 | ) | (34 | ) | ||||
Othernon-current liabilities | (970 | ) | (809 | ) | ||||
Short-term provisions | (61 | ) | (58 | ) | ||||
To | ||||||||
Long-term provisions | (1,079 | ) | (901 | ) | ||||
|
| |||||||
Consequential changes were processed in their capacity as ownersnote 21, Accrued liabilities and therefore no goodwill is recognized. Adjustments to non-controlling interests arising from transactions that do not involve the loss of control are based on a proportionate amount of the net assets of the subsidiary.
For changes to non-controlling interest without the loss of control, the difference between such changenote 22, Other liabilities. Corresponding retrospective reclassifications were processed and any consideration paid or received is recognized directly in equity.
Loss of control
Upon the loss of control, the Company derecognizes the assets and liabilities of the subsidiary, any non-controlling interests and the other components of equity related to the subsidiary. Any surplus or deficit arising on the loss of control is recognized in the Statement of income. If the Company retains any interest in the previous subsidiary, then such interest is measured at fair value at the date the control is lost. Subsequently it is accounted for as an equity-accounted investee or as an available-for-sale financial asset depending on the level of influence retained.
Investments in associates (equity-accounted investees)
Associates are all entities over which the Company has significant influence, but not control. Significant influence is presumed with a shareholding of between 20% and 50% of the voting rights. Investments in associates are accounted for using the equity method of accounting and are initially recognized at cost. The group’s investment in associates includes goodwill identified on acquisition, net of any accumulated impairment loss.
The Company’s share of the net income of these companies is included in results relating to associates in the Statement of income, after adjustments to align the accounting policies with those of the Company, from the date that significant influence commences until the date that significant influence ceases. When the Company’s share of losses exceeds its interest in an associate, the carrying amount of that interest (including any long-term loans) is reduced to zero and recognition of further losses is discontinued except to the extent that the Company has incurred legal or constructive obligations or made payments on behalf of the associate. Unrealized gains on transactions between the Company and its associates are eliminated to the extent of the Company’s interest in the associates. Unrealized losses are also eliminated unless the transaction provides evidence of an impairment of the asset transferred. Remeasurement differences of equity stake resulting from gaining control over the investee previously recorded as associate are recorded under Results related to investments in associates.
Investments in associates include loans from the Company to these investees.
Accounting for capital transactions of a consolidated subsidiary or an associate
The Company recognizes dilution gains or losses arising from the sale or issuance of stock by a consolidated subsidiary or an associate in the Statement of income, unless the Company or the subsidiary either has reacquired or plans to reacquire such shares. In such instances, the result of the transaction is recorded directly in equity.
Dilution gains and losses arising in investments in associates are recognizedexplained in the Consolidated statements of income under Results relating to investmentscash flows. Information on net defined-benefit obligation can be found in associates.
Foreign currenciesnote 20, Post-employment benefits.
Foreign currency transactionsChange in Segment reporting
The financial statementsIn 2016, Philips established two stand-alone companies focused on the HealthTech and Lighting opportunities.
As part of all group entities are measured usingthis separation, Philips has changed the currencyway it allocates resources and analyzes its performance based on a new segment structure.
Accordingly, from 2016 the operational reportable segments for the purpose of the primary economic environmentdisclosures required by IFRS 8 Operating Segments are Personal Health businesses, Diagnosis & Treatment businesses, Connected Care & Health Informatics businesses and Lighting, each being responsible for the management of its business worldwide. Additionally, HealthTech Other and Legacy Items are included in whichthenote 2, Information by segment and main country. The new segment structure has no impact in the entity operates (functional currency)cash-generating units disclosed innote 11, Goodwill. The euro (EUR) isConsequential changes to comparative segment disclosures were processed innote 14, Other assets, note 16, Receivables,and note 19, Provisions.
Prior-period segment results have been reclassified according to the functionalnew reporting structure.
Segment information can be found innote 2, Information by segment and presentation currencymain country.
Specific choices within IFRS
Sometimes IFRS allows alternative accounting treatments for measurement and/or disclosure. Philips has adopted one of the treatments as appropriate to the circumstances of the Company. Foreign currency transactionsThe most important of these alternative treatments are translated into the functional currency using the exchange rates prevailing at the dates of the transactions or valuation where items are remeasured. Foreign exchange gainsmentioned below.
Tangible and losses resulting from the settlement of such transactions and from the translation at year-end exchange rates of monetaryintangible fixed assets and liabilities denominated in foreign currencies are recognized in the Statement of income, except when deferred in Other comprehensive income as qualifying cash flow hedges and qualifying net investment hedges.
Foreign currency differences arising from translation are recognized in profit or loss, except for available-for-sale equity investments (except on impairment in which case foreign currency differences that have been recognized in Other comprehensive income are reclassified to profit and loss), which are recognized in Other comprehensive income.
All exchange difference items are presented as part of Cost of sales, with the exception of tax items and financial income and expense, which are recognized in the same line item as they relate in the Statement of income.
Non-monetary assets and liabilities denominated in foreign currencies that are measured at fair value are retranslated to the functional currency using the exchange rate at the date the fair value was determined. Non-monetary items in a foreign currency that are measured based on historical cost are translated using the exchange rate at the date of transaction.
Foreign operations
The assets and liabilities of foreign operations, including goodwill and fair value adjustments arising on acquisition, are translated to euro at exchange rates at the reporting date. The income and expenses of foreign operations are translated to euro at exchange rates at the dates of the transactions.
Foreign currency differences arising on translation of foreign operations into the Group’s presentation currency are recognized in Other comprehensive income, and presented as part of Currency translation differences in equity. However, if the operation is a non-wholly owned subsidiary, then the relevant proportionate share of the translation difference is allocated to the non-controlling interests.
When a foreign operation is disposed of such that control, significant influence or joint control is lost, the cumulative amount in the translation reserve related to the foreign operation is reclassified to the Statement of income as part of the gain or loss on disposal. When the Company disposes of only part of its interest in a subsidiary that includes a foreign operation while retaining control, the relevant proportion of the cumulative amount is reattributed to Non-controlling interests. When the Company disposes of only part of its investment in an associate or joint venture that includes a foreign operation while retaining significant influence or joint control, the relevant proportion of the cumulative amount is reclassified to the Statement of income.
Financial instruments
Non-derivative financial instruments
Non-derivative financial instruments are recognized initially at fair value whenUnder IFRS, an entity shall choose either the Company becomes a party to the contractual provisions of the instrument.
Regular way purchases and sales of financial instruments are accounted for at the trade date. Dividend and interest income are recognized when earned. Gains or losses, if any, are recorded in Financial income and expense.
Non-derivative financial instruments comprise cash and cash equivalents, receivables, other non-current financial assets and debt and other financial liabilities that are not designated as hedges.
Cash and cash equivalents
Cash and cash equivalents include all cash balances and short-term highly liquid investments with an original maturity of three months or less that are readily convertible into known amounts of cash.
Receivables
Receivables are carried at the lower of amortized cost model or the present value of estimated future cash flows, taking into account discounts given or agreed. The present value of estimated future cash flows is determined through the use of value adjustmentsrevaluation model as its accounting for uncollectible amounts. As soon as individual trade accounts receivable can no longer be collected in the normal waytangible and are expected to result in a loss, they are designated as doubtful trade accounts receivable and valued at the expected collectible amounts. They are written off when they are deemed to be uncollectible because of bankruptcy or other forms of receivership of the debtors. The allowance for the risk of non-collection of trade accounts receivable takes into account credit-risk concentration, collective debt risk based on average historical losses, and specific circumstances such as serious adverse economic conditions in a specific country or region.
164 Annual Report 2013
11 Group financial statements 11.9 - 11.9
In the event of sale of receivables and factoring, the Company derecognizes receivables when the Company has given up control or continuing involvement, which is deemed to have occurred when:
the Company has transferred its rights to receive cash flows from the receivables or has assumed an obligation to pay the received cash flows in full without any material delay to a third party under a ‘pass-through’ arrangement; and
either (a) the Company has transferred substantially all of the risks and rewards of the ownership of the receivables, or (b) the Company has neither transferred nor retained substantially all of the risks and rewards, but has transferred control of the assets.
However, in case the Company neither transfers nor retains substantially all the risks and rewards of ownership of the receivables nor transfers control of the receivables, the receivable is recognized to the extent of the Company’s continuing involvement in theintangible fixed assets. In this case, the Company also recognizes an associated liability. The transferred receivable and associated liability are measured on a basis that reflects the rights and obligations that the Company has retained.
Other non-current financial assets
Other non-current financial assets include held-to-maturity investments, loans and available-for-sale financial assets and financial assets at fair value through profit or loss.
Held-to-maturity investments are those debt securities which the Company has the ability and intent to hold until maturity. Held-to-maturity debt investments are recorded at amortized cost, adjusted for the amortization or accretion of premiums or discounts using the effective interest method.
Loans receivable are stated at amortized cost, less impairment.
Available-for-sale financial assets are non-derivative financial assets that are designated as available-for-sale and that are not classified in any of the other categories of financial assets. Subsequent to initial recognition, they are measured at fair value and changes therein, other than impairment losses and foreign currency differences on available for sale-debt instruments are recognized in Other comprehensive income and presented in the fair value reserve in equity. When an investment is derecognized, the gain or loss accumulated in equity is reclassified to the Statement of income.
Available-for-sale financial assets including investments in privately-held companies that are not associates, and do not have a quoted market price in an active market and whose fair value could not be reliably determined, are carried at cost.
A financial asset is classified as fair value through profit or loss if it is classified as held for trading or is designated as such upon initial recognition. Financial assets are designated as fair value through profit or loss if the Company manages such investments and makes purchase and sale decisions based on their fair value in accordance with the Company-documented risk management or investment strategy. Attributable transaction costs are recognized in the Statement of income as incurred. Financial assets at fair value through profit or loss are measured at fair value, and changes therein are recognized in profit or loss.
Equity
Common shares are classified as equity. Incremental costs directly attributable to the issuance of shares are recognized as a deduction from equity. Where the Company purchases the Company’s equity share capital (treasury shares), the consideration paid, including any directly attributable incremental costs (net of income taxes) is deducted from equity attributable to the Company’s equity holders until the shares are cancelled or reissued. Where such ordinary shares are subsequently reissued, any consideration received, net of any directly attributable incremental transaction costs and the related income tax effects, is included in equity attributable to the Company’s equity holders.
Dividends are recognized as a liability in the period in which they are declared. The income tax consequences of dividends are recognized when a liability to pay the dividend is recognized.
Debt and other liabilities
Debt and liabilities other than provisions are stated at amortized cost. However, loans that are hedged under a fair value hedge are remeasured for the changes in the fair value that are attributable to the risk that is being hedged.
Derivative financial instruments, including hedge accounting
The Company uses derivative financial instruments principally to manage its foreign currency risks and, to a more limited extent, for managing interest rate and commodity price risks. All derivative financial instruments are classified as current assets or liabilities and are accounted for at the trade date. Embedded derivatives are separated from the host contract and accounted for separately if the economic characteristics and risks of the host contract and the embedded derivative are not closely related. The Company measures all derivative financial instruments at fair value derived from market prices of the instruments, or calculated as the present value of the estimated future cash flows based on observable interest yield curves, basis spread, credit spreads and foreign exchange rates, or from option pricing models, as appropriate. Gains or losses arising from changes in fair value of derivatives are recognized in the Statement of income, except for derivatives that are highly effective and qualify for cash flow or net investment hedge accounting.
Changes in the fair value of derivatives that are designated and qualify as fair value hedges are recorded in the Statement of income, together with any changes in the fair value of the hedged asset or liability that are attributable to the hedged risk. For interest rate swaps designated as a fair value hedge of an interest bearing asset or liability that are unwound, the amount of the fair value adjustment to the asset or liability for the risk being hedged is released to the Statement of income over the remaining life of the asset or liability based on the recalculated effective yield.
Changes in the fair value of a derivative that is highly effective and that is designated and qualifies as a cash flow hedge, are recorded in Other comprehensive income, until the Statement of income is affected by the variability in cash flows of the designated hedged item. To the extent that the hedge is ineffective, changes in the fair value are recognized in the Statement of income.
The Company formally assesses, both at the hedge’s inception and on an ongoing basis, whether the derivatives that are used in hedging transactions are highly effective in offsetting changes in fair values or cash flows of hedged items. When it is established that a derivative is not highly effective as a hedge or that it has ceased to be a highly effective hedge, the Company discontinues hedge accounting prospectively. When hedge accounting is discontinued because it is expected that a forecasted transaction will not occur, the Company continues to carry the derivative on the Balance sheet at its fair value, and gains and losses that were accumulated in equity are recognized immediately in the Statement of income. If there is a delay and it is expected that the transaction will still occur, the amount in equity remains there until the forecasted transaction affects income. In all other situations in which hedge accounting is discontinued, the Company continues to carry the derivative at its fair value on the Balance sheet, and recognizes any changes in its fair value in the Statement of income.
Foreign currency differences arising on the retranslation of financial instruments designated as a hedge of a net investment in a foreign operation are recognized directly as a separate component of equity through Other comprehensive income, to the extent that the hedge is effective. To the extent that the hedge is ineffective, such differences are recognized in the Statement of income.
Offsetting and master netting agreements
The Company presents financial assets and financial liabilities on a gross basis as separate linerespect, items in the Consolidated balance sheet.
Master netting agreements may be entered into when the Company undertakes a number of financial instrument transactions with a single counterparty. Such an agreement provides for a net settlement of all financial instruments covered by the agreement in the event of default or certain termination events on any of the transactions. A master netting agreement may create a right of offset that becomes enforceable and affects the realization or settlement of individual financial assets and financial liabilities only following a specified termination event. However, if this contractual right is subject to certain limitations then it does not necessarily provide a basis for offsetting unless both of the offsetting criteria are met, i.e. there is a legally enforceable right and an intention to settle net or simultaneously.
Property, plant and equipment
Items of property, plant and equipment are measured at cost less accumulated depreciation and accumulated impairment losses. The useful lives and residual values are evaluated annually.
Annual Report 2013 165
11 Group financial statements 11.9 - 11.9
Assets manufactured by Furthermore, the Company include direct manufacturing costs, production overheads and interest charges incurred for qualifying assets during the construction period. Government grants are deducted fromchose to apply the cost of the related asset. Depreciation is calculated using the straight-line method over the useful life of the asset. Depreciation of special tooling is generally also based on the straight-line method. Gains and losses on the sale of property, plant and equipment are included in Other business income. Costs relatedmodel meaning that costs relating to repair and maintenance activities are expensed in the period in which they are incurred unless leading to an extension of the original lifetime or capacity.
Plant and equipment under finance leases and leasehold improvements are amortized using the straight-line method over the shorter of the lease term or the estimated useful life of the asset. The gain realized on sale and operating leaseback transactions that are concluded based upon market conditions is recognized at the time of the sale.
The Company capitalizes interest as part of the cost of assets that take a substantial period of time to become ready for use, which is defined by the Company as a period of more than 6 months.
Goodwill
Measurement of goodwill at initial recognition is described under ‘Basis of consolidation’. Goodwill is subsequently measured at cost less accumulated impairment losses. In respect of investment in associates, the carrying amount of goodwill is included in the carrying amount of investment, and an impairment loss on such investment is not allocated to any asset, including goodwill, that forms part of the carrying amount of investment in associates.
Intangible assets other than goodwill
Acquired finite-lived intangible assets are amortized using the straight-line method over their estimated useful life. The useful lives are evaluated annually. Patents and trademarks with a finite useful life acquired from third parties either separately or as part of the business combination are capitalized at cost and amortized over their remaining useful lives. Intangible assets acquired as part of a business combination are capitalized at their acquisition-date fair value.
The Company expenses all research costs as incurred. Expenditure onproduct development, activities, whereby research findings are applied to a plan or design for the production of new or substantially improved products and processes, is capitalized as an intangible asset if the product or process is technically and commercially feasible and the Company has sufficient resources and the intention to complete development.
The development expenditure capitalized comprises of all directly attributable costs (including the cost of materials and direct labor). Other development expenditures and expenditures on research activities are recognized in the Statement of income. Capitalized development expenditure is stated at cost less accumulated amortization and impairment losses. Amortization of capitalized development expenditure is charged to the Statement of income on a straight-line basis over the estimated useful lives of the intangible assets.
Costs relating to the development and purchase of software for both internal use and software intended to be soldother intangible assets are capitalized and subsequently amortized over the estimated useful life. Further information on Tangible and Intangible fixed assets can be found innote 10, Property, plant and equipmentand note 12, Intangible assets excluding goodwill respectively.
Leased assetsEmployee benefit accounting
Leases in which the Company is the lesseeIFRS does not specify how an entity should present its service costs related to pensions and has substantially all the risks and rewards of ownership are classified as finance leases. Finance leases are capitalized at the commencement of the lease at the lower of the fair value of the leased assets and the present value of the minimum lease payments. Each lease payment is allocated between the liability and finance charges. The interest element of the finance cost is charged to the Statement of income over the lease period so as to produce a constant periodic rate ofnet interest on the remaining balance of thenet defined-benefit liability for each period. The corresponding rental obligations, net of finance charges, are included in other short-term and other non-current liabilities. The property, plant and equipment acquired under finance leases is depreciated over the shorter of the useful life of the assets and the lease term.
Leases in which substantially all risks and rewards of ownership are retained by the lessor are classified as operating leases. Payments made under operating leases (net of any incentives received from the lessor) are recognized in the Statement of income on a straight-line basis over the term of the lease.
Inventories
Inventories are stated at the lower of cost or net realizable value. The cost of inventories comprises all costs of purchase, costs of conversion and other costs incurred in bringing the inventories to their present location and condition. The costs of conversion of inventories include direct labor and fixed and variable production overheads, taking into account the stage of completion and the normal capacity of production facilities. Costs of idle facility and abnormal waste are expensed. The cost of inventories is determined using the first-in, first-out (FIFO) method. Inventory is reduced for the estimated losses due to obsolescence. This reduction is determined for groups of products based on purchases in the recent past and/or expected future demand.
Provisions
Provisions are recognized if, as a result of a past event, the Company has a present legal or constructive obligation that can be estimated reliably, and it is probable that an outflow of economic benefits will be required to settle the obligation. Provisions are measured at the present value of the expenditures expected to be required to settle the obligation using a pre-tax discount rate that reflects current market assessments of the time value of money and the risks specific to the obligation. The increase in the provision due to passage of time is recognized as interest expense.
A provision for warranties is recognized when the underlying products or services are sold. The provision is based on historical warranty data and a weighing of possible outcomes against their associated probabilities.
The Company accrues for losses associated with environmental obligations when such losses are probable and can be estimated reliably. Measurement of liabilities is based on current legal and constructive requirements. Liabilities and expected insurance recoveries, if any, are recorded separately. The carrying amount of liabilities is regularly reviewed and adjusted for new facts and changes in law.
The provision for restructuring relates to the estimated costs of initiated reorganizations, the most significant of which have been approved by the Board of Management, and which generally involve the realignment of certain parts of the industrial and commercial organization. When such reorganizations require discontinuance and/or closure of lines of activities, the anticipated costs of closure or discontinuance are included in restructuring provisions. A liability is recognized for those costs only when the Company has a detailed formal plan for the restructuring and has raised a valid expectation with those affected that it will carry out the restructuring by starting to implement that plan or announcing its main features to those affected by it. Before a provision is established, the Company recognizes any impairment loss on the assets associated with the restructuring.
The Company provides for onerous contracts, based on the lower of the expected cost of fulfilling the contract and the expected net cost of terminating the contract. Before a provision is established, the Company recognizes any impairment loss on the assets associated with that contract.
The Company records a provision for decommissioning costs of certain facilities. Decommissioning costs are provided at the present value of expected costs to settle the obligation using estimated cash flows and are recognized as part of the cost of the particular asset. The cash flows are discounted at a current pre-tax rate that reflects the risks specific to the decommissioning liability. The unwinding of the discount is expensed as incurred and recognized in the Statement of income as a Financial expense. The estimated future costs of decommissioning are reviewed annually and adjusted as appropriate. Changes in the estimated future costs or in the discount rate applied are added to or deducted from the cost of the asset.
The Company is a provider of electrical equipment that falls under the EU Directive on Waste Electrical and Electronic Equipment (WEEE). The directive distinguishes between waste management of equipment sold to private households prior to a date as determined by each EU Member State (historical waste) and waste management of equipment sold to private households after that date (new waste). A provision for the expected costs of management of historical waste is recognized when the Company participates in the market during the measurement period as determined by each Member State, and the costs can be reliably measured. These costs are recognized as Other business expenses(asset) in the Statement of income. With respectregards to new waste, a provision forthese elements, the expected costs is recognized when products that fall within the directive are sold and the disposal costs can be reliably measured. Derecognition takes place when the obligation expires, is settled or is transferred. These costs are recognized as part of Costs of sales. With respect to equipment
166 Annual Report 2013
11 Group financial statements 11.9 - 11.9
sold to entities other than private households, a provision is recognized when the Company becomes responsible for the costs of this waste management, with the costs recognized as Other business expenses or Cost of sales as appropriate.
Impairment
Value in use is measured as the present value of future cash flows expected to be generated by the asset. If the carrying amount of an asset is deemed not recoverable, an impairment charge is recognized in the amount by which the carrying amount of the asset exceeds the recoverable amount.
Impairment of goodwill, intangible assets not yet ready for use and indefinite-lived intangible assets
Goodwill, intangible assets not yet ready for use and indefinite-lived intangible assets are not amortized but tested for impairment annually and whenever impairment indicators require. In most cases the Company identified its cash generating units as one level below that of an operating segment. Cash flows at this level are substantially independent from other cash flows and this is the lowest level at which goodwill is monitored by the Executive Committee. The Company performed and completed annual impairment tests in the same quarter of all years presented in the Consolidated Statements of income. An impairment loss is recognized in the Statement of income whenever and to the extent that the carrying amount of a cash-generating unit exceeds the unit’s recoverable amount, which is the greater of its value in use and fair value less cost to sell. An impairment loss on an investment in associates is not allocated to any asset, including goodwill, that forms part of the carrying amount of the investment in associates.
Impairment of non-financial assets other than goodwill, intangible assets not yet ready for use, indefinite-lived intangible assets, inventories and deferred tax assets
Non-financial assets other than goodwill, intangible assets not yet ready for use, indefinite-lived intangible assets, inventories and deferred tax assets are reviewed for impairment whenever events or changes in circumstances indicate that the carrying amount of an asset may not be recoverable. Recoverability of assets to be held and used is recognized and measured by a comparison of the carrying amount of an asset with the greater of its value in use and fair value less cost to sell. Value in use is measured as the present value of future cash flows expected to be generated by the asset. If the carrying amount of an asset is deemed not recoverable, an impairment charge is recognized in the amount by which the carrying amount of the asset exceeds the recoverable amount. The review for impairment is carried out at the level where discrete cash flows occur that are independent of other cash flows.
Impairment losses recognized in prior periods are assessed at each reporting date for any indications that the loss has decreased or no longer exists. An impairment loss is reversed if and to the extent there has been a change in the estimates used to determine the recoverable amount. The loss is reversed only to the extent that the asset’s carrying amount does not exceed the carrying amount that would have been determined, net of depreciation or amortization, if no impairment loss had been recognized. Reversals of impairment are recognized in the Statement of income.
Impairment of financial assets
A financial asset is considered to be impaired if objective evidence indicates that one or more events have had a negative effect on the estimated future cash flows of that asset. In case of available-for-sale financial assets, a significant or prolonged decline in the fair value of the financial assets below its cost is considered an indicator that the financial assets are impaired. If any such evidence exists for available-for-sale financial assets, the cumulative loss - measured as the difference between the acquisition cost and the current fair value, less any impairment loss on that financial asset previously recognized in the Statement of income - is reclassified from the fair value reserve in equity (through Other comprehensive income) to the Statement of income.
If objective evidence indicates that financial assets that are carried at cost need to be tested for impairment, calculations are based on information derived from business plans and other information available for estimating their fair value. Any impairment loss is charged to the Statement of income.
An impairment loss related to financial assets is reversed if in a subsequent period, the fair value increases and the increase can be related objectively to an event occurring after the impairment loss was recognized. The loss is reversed only to the extent that the asset’s carrying amount does not exceed the carrying amount that would have been determined if no impairment loss had been recognized. Reversals of impairment are recognized in the Statement of income except for reversals of impairment of available-for-sale equity securities, which are recognized in Other comprehensive income.
Employee benefit accounting
A defined contribution plan is a post-employment benefit plan under which an entity pays fixed contributions into a separate entity and will have no legal or constructive obligation to pay further amounts. Obligations for contributions to defined contribution pension plans are recognized as an employee benefit expense in the Statement of income in the periods during which services are rendered by employees.
A defined benefit plan is a post-employment benefit plan other than a defined contribution plan. The net pension asset or liability recognized in the Consolidated balance sheet in respect of defined benefit post-employment plans is the fair value of plan assets less the present value of the projected defined benefit obligation (DBO) at the balance sheet date. The projected defined benefit obligation is calculated annually by qualified actuaries using the projected unit credit method. Recognized assets are limited to the present value of any reductions in future contributions or any future refunds.
For the Company’s major plans, a full discount rate curve of high-quality corporate bonds (based on Towers Watson RATE:Link data) is used to determine the defined benefit obligation, whereas for the other plans a single-point discount rate is used based on the plan’s maturity. Plans in countries without a deep corporate bond market use a discount rate based on the local sovereign curve and the plan’s maturity.
Pension costs in respect of defined benefit post-employment plans primarily represent the increase of the actuarial present value of the obligation for post-employment benefits based on employee service during the year and the interest on the net recognized asset or liability in respect of employee service in previous years. The Company presents service costs in Income from operations and the net interest expenses related to defined benefitdefined-benefit plans in Financial expense.
RemeasurementsFurthermore, when accounting for the settlement of defined-benefit plans the Company made the accounting policy choice to adjust the amount of the net defined benefit liability comprise actuarial gains and losses, the return on plan assets (excluding interest) andtransferred for the effect of the asset ceiling (excluding interest)ceiling.
Further information on employee benefit accounting can be found innote 20, Post-employment benefits.
Cash flow statements
Under IFRS, an entity shall report cash flows from operating activities using either the direct method (whereby major classes of gross cash receipts and gross cash payments are disclosed) or the indirect method (whereby profit or loss is adjusted for the effects of transactions of anon-cash nature, any deferrals or accruals of past or future operating cash receipts or payments, and items of income or expense associated with investing or financing cash flows). In this respect, the Company chose to prepare the cash flow statements using the indirect method.
Furthermore, interest cash flows are presented in cash flows from operating activities rather than in cash flows from financing or investing activities, because they enter into the determination of profit or loss. The Company immediately recognizes all remeasurements in Other comprehensive income.chose to present dividends paid to shareholders of Koninklijke Philips N.V. as a component of cash flows from financing activities, rather than to present such dividends as cash flows from operating activities which is an allowed alternative under IFRS.
The Company recognizes gains and losses on the settlementConsolidated statements of a defined benefit plan when the settlement occurs. The gain or loss on settlement comprises any resulting change in the fair value of plan assets and change in the present value of defined benefit obligation. Past service costs following from the introduction of a change to the benefit payable under a plan or a significant reduction of the number of employees covered by a plan, are recognized in full in the Statement of income.
Short-term employee benefit obligations are measured on an undiscounted basis and are expensed as the related service is provided. The Company recognizes a liability and an expense for bonuses and profit-sharing, based on a formula that takes into consideration the profit attributable to the Company’s shareholders after certain adjustments. The Company recognizes a provision where contractually obliged or where there is a past practice that has created a constructive obligation and the obligationcash flows can be measured reliably.found insection 10.8, Consolidated statements of cash flows, of this report.
The Company’s net obligation in respect of long-term employee benefits is the amount of future benefit that employees have earned in return for their service in the current and prior periods, such as jubilee entitlements. That benefit is discounted to determine its present value. Remeasurements are recognized in the income statement in the period in which they arise.
128 Annual Report 2016
Group financial statements 10.10
Share-based payment
The grant-date fair value of equity-settled share-based payment awards granted to employees is recognized as personnel expense, with a corresponding increasePolicies that are more critical in equity, over the vesting period of the award. The Company uses the Black-Scholes option-pricing model and Monte Carlo sampling to determine the fair value of the awards, depending on the type of instruments granted and certain vesting conditions.nature
Revenue recognition
Revenue from the sale of goods in the course of the ordinary activities is measured at the fair value of the consideration received or receivable, net of returns, trade discounts and volume rebates. Revenue for sale of goods is recognized when the significant risks and rewards of ownership have been transferred to the buyer, recovery of the consideration is probable, the associated costs and possible return of the goods can be estimated
Annual Report 2013 167
11 Group financial statements 11.9 - 11.9
reliably, there is no continuing involvement with goods, and the amount of revenue can be measured reliably. If it is probable that discounts will be granted and the amount can be measured reliably, then the discount is recognized as a reduction of revenue as the sales are recognized.
Transfer of risks and rewards varies depending on the individual terms of the contract of sale. For consumer-type products in the sectorssegments Personal Health businesses and Lighting and Consumer Lifestyle, these criteria are met at the time the product is shipped and delivered to the customer and depending on the delivery conditions, title and risk have passed to the customer (depending on the delivery conditions) and acceptance of the product when contractually required, has been obtained, or, in cases where such acceptance is not contractually required, when management has established that all aforementioned conditions for revenue recognition have been met.obtained. Examples of the above-mentioned delivery conditions are ‘Free on Board point of delivery’ and ‘Costs, Insurance Paid point of delivery’, where the point of delivery may be the shipping warehouse or any other point of destination as agreed in the contract with the customer and where title and risk for the goods pass to the customer.
Revenues of transactions that have separately identifiable components are recognized based on their relative fair values. These transactions mainly occur in the Healthcare sectorsegments Diagnosis & Treatment businesses and Connected Care & Health Informatics businesses and include arrangements that require subsequent installation and training activities in order to become operable for the customer. However, since payment for the equipment is contingent upon the completion of the installation process, revenue recognition is generally deferred until the installation has been completed and the product is ready to be used by the customer in the way contractually agreed.
Revenues are recorded net of sales taxes, customer discounts, rebates and similar charges. For products for which a right of return exists during a defined period, revenue recognition is determined based on the historical pattern of actual returns, or in cases where such information is not available, revenue recognition is postponed until the return period has lapsed. Return policies are typically based on customary return arrangements in local markets.
For products for which a residual value guarantee has been granted or a buy-back arrangement has been concluded, revenue recognition takes place when significant risks and rewards of ownership are transferred to the customer. The following are the principal factors that the Company considers in determining that the Company has transferred significant risks and rewards:
the period from the sale to the repurchase represents the major (normally at least 75%) part of the economic life of the asset;
the proceeds received on the initial transfer and the amount of any residual value or repurchase price, measured on a present value basis, is equal to substantially all (normally at least 90%) of the fair value of the asset at the sale date;
insurance risk is borne by the customer; however, if the customer bears the insurance risk but the Company bears the remaining risks, then risks and rewards have not been transferred to the customer; and
the repurchase price is equal to the market value at the time of the buy-back.
In case of loss under a sales agreement, the loss is recognized immediately.
Shipping and handling billed to customers is recognized as revenues. Expenses incurred for shipping and handling of internal movements of goods are recorded as cost of sales. Shipping and handling related to sales to third parties are recorded as selling expenses. When shipping and handling is part of a project and billed to the customer, then the related expenses are recorded as cost or sales. Shipping and handling billed to customers is recognized as revenues. Service revenue related to repair and maintenance activities for goods sold is recognized ratably over the service period or as services are rendered.
A provision for product warranty is made at the time of revenue recognition and reflects the estimated costs of replacement andfree-of-charge services that will be incurred by the Company with respect to the products. For certain products, the customer has the option to purchase an extension of the warranty, which is subsequently billed to the customer. Revenue recognition occurs on a straight-line basis over the extended warranty contract period.
Revenue from services is recognized when the Company can reliably measure the amount of revenue and the associated cost related to the stage of completion of a contract or transaction, and the recovery of the consideration is considered probable.
Royalty income from intellectual property rights, which is generally earned based upon a percentage of sales or a fixed amount per product sold, is recognized on an accrual basis.basis based on actual or reliably estimated sales made by a licensees. Royalty income from an agreement withlump-sum consideration is recognized on accrual basis based on the contractual terms and substance of the relevant agreement with a licensee.
Grants from the government are recognized at their fair value where there is a reasonable assurance that the grant will be received and the Company will comply with all attached conditions. Government grants relating to costs are deferred and recognized in the Statement of income as a reduction of the related costs over the period necessary to match them with the costs that they are intended to compensate.
Financial income Grants related to assets are deducted from the cost of the asset and expenses
Financial income comprises interest income on funds invested (including available-for-sale financial assets) and recognized surpluses for post-employment benefit plans, dividend income,presented net gains on the disposal of available-for-sale financial assets, net fair value gains on financial assets at fair value through profit or loss, net gains on the remeasurement to fair value of any pre-existing available-for-sale interest in an acquiree, and net gains on hedging instruments that are recognized in the Statement of income. Interest income is recognized on accrual basis in the Statement of income, using the effective interest method. Dividend income is recognized in the Statement of income on the date that the Company’s right to receive payment is established, which in the case of quoted securities is normally the ex-dividend date.
Financial expenses comprise interest expense on borrowings and recognized deficits for post-employment benefit plans, unwinding of the discount on provisions and contingent consideration, losses on disposal of available-for-sale financial assets, net fair value losses on financial assets at fair value through profit or loss, impairment losses recognized on financial assets (other than trade receivables), net interest expenses related to defined benefit plans and net losses on hedging instruments that are recognized in the Statement of income.
Borrowing costs that are not directly attributable to the acquisition, construction or production of a qualifying asset are recognized in the Statement of income using the effective interest method.
Foreign currency gains and losses are reported on a net basis as either financial income or financial cost depending on whether foreign currency movements are in a net gain or net loss position.
Income taxtaxes
Income taxtaxes comprises current and deferred tax. Income taxtaxes is recognized in the Statement of income except to the extent that it relates to items recognized directly within equity or in otherOther comprehensive income. Current taxtaxes is the expected taxtaxes payable on the taxable income for the year, using tax rates enacted or substantially-enactedsubstantively-enacted at the reporting date, and any adjustment to tax payable in respect of previous years.
Tax liabilities are recognized when it is considered probable that there will be a future outflow of funds to a taxing authority. In such cases, provision is made for the amount that is expected to be settled, where this can be reasonably estimated. This assessment relies on
Annual Report 2016 129
Group financial statements 10.10
estimates and assumptions and may involve a series of judgments about future events. New information may become available that causes the Company to change its judgment regarding the adequacy of existing tax liabilities; such changes to tax liabilities will impact the income tax expense in the period that such a determination is made.
Deferred tax assets and liabilities are recognized, using the balance sheet method, for the expected tax consequences of temporary differences between the carrying amounts of assets and liabilities and the amounts used for taxation purposes. Deferred tax is not recognized for the following temporary differences: the initial recognition of goodwill,goodwill; the initial recognition of assets and liabilities in a transaction that is not a business combination and that affects neither accounting nor taxable profit,profit; and differences relating to investments in subsidiaries, tojoint ventures and associates where the extentreversal of the respective temporary difference can be controlled by the Company and it is probable that they probablyit will not reverse in the foreseeable future. Deferred tax istaxes are measured at the tax rates that are expected to be applied to temporary differences when they reverse, based on the laws that have been enacted or substantially-enactedsubstantively enacted by the reporting date. Deferred tax assets and liabilities are offset if there is a legally-enforceablelegally enforceable right to offset current tax liabilities and assets, and they relate to income taxes levied by the same tax authority on the same taxable entity or on different tax entities, but they intend to settle current tax liabilities and assets on a net basis or their tax assets and liabilities will be realized simultaneously.
A deferred tax asset is recognized for unused tax losses, tax credits and deductible temporary differences, to the extent that it is probable that future taxable profits will be available against which they can be utilized. The ultimate realization of deferred tax assets is dependent upon the generation of future taxable income in the countries where the deferred tax assets originated and during the periods when the deferred tax assets become deductible. Management considers the scheduled reversal of deferred tax liabilities, projected future taxable income and tax planning strategies in making this assessment.
Deferred tax liabilities for withholding taxes are recognized for subsidiaries in situations where the income is to be paid out as dividend in the foreseeable future and for undistributed earnings of unconsolidated companies to the extent that these withholding taxes are not expected to
168 Annual Report 2013
11 Group financial statements 11.9 - 11.9
be refundable or deductible. Changes in tax rates are reflected in the period when the change has been enacted or substantially-enactedsubstantively enacted by the reporting date.
Further information on income tax can be found innote 8, Income taxes.
Provisions
Provisions are recognized if, as a result of a past event, the Company has a present legal or constructive obligation, the amount can be estimated reliably, and it is probable that an outflow of economic benefits will be required to settle the obligation. Provisions are measured at the present value of the expenditures expected to be required to settle the obligation using apre-tax discount rate that reflects current market assessments of the time value of money. The increase in the provision due to passage of time is recognized as interest expense. The accounting and presentation for some of the Company’s provisions is as follows:
Product warranty – A provision for warranties is recognized when the underlying products or services are sold. The provision is based on historical warranty data and a weighing of possible outcomes against their associated probabilities.
Environmental provisions – Measurement of liabilities associated with environmental obligations, is based on current legal and constructive requirements. Liabilities and expected insurance recoveries, if any, are recorded separately. The carrying amount of environmental liabilities is regularly reviewed and adjusted for new facts and changes in law.
Restructuring-related provisions – The provision for restructuring relates to the estimated costs of initiated restructurings, the most significant of which have been approved by the Executive Committee, and which generally involve the realignment of certain parts of the industrial and commercial organization. When such restructurings require discontinuance and/or closure of lines of activities, the anticipated costs of closure or discontinuance are included in restructuring provisions. A liability is recognized for those costs only when the Company has a detailed formal plan for the restructuring and has raised a valid expectation with those affected that it will carry out the restructuring by starting to implement that plan or announcing its main features to those affected by it. Before a provision is established, the Company recognizes any impairment loss on the assets associated with the restructuring.
Litigation provisions – In relation to legal claim provisions and settlements, the relevant balances are transferred to Other liabilities at the point the amount and timing of cash outflows are no longer uncertain. Settlements which are agreed for amounts in excess of existing provisions are reflected as increases of Other liabilities.
Further information on provisions can be found innote 19, Provisions.
130 Annual Report 2016
Group financial statements 10.10
Goodwill
The measurement of goodwill at initial recognition is described under Basis of consolidation note. Goodwill is subsequently measured at cost less accumulated impairment losses. Further information on goodwill can also be found innote 11, Goodwill.
Intangible assets other than goodwill
Acquired finite-lived intangible assets are amortized using the straight-line method over their estimated useful life. The useful lives are evaluated annually. Intangible assets are initially capitalized at cost, with the exception of intangible assets acquired as part of a business combination, which are capitalized at their acquisition date fair value.
The Company expenses all research costs as incurred. Expenditure on development activities, whereby research findings are applied to a plan or design for the production of new or substantially improved products and processes, is capitalized as an intangible asset if the product or process is technically and commercially feasible, the Company has sufficient resources and the intention to complete development and can measure the attributable expenditure reliably.
The development expenditure capitalized comprises of all directly attributable costs (including the cost of materials and direct labor). Other development expenditures and expenditures on research activities are recognized in the Statement of income. Capitalized development expenditure is stated at cost less accumulated amortization and impairment losses. Amortization of capitalized development expenditure is charged to the Statement of income on a straight-line basis over the estimated useful lives of the intangible assets.
Further information on intangible assets other than goodwill can be found innote 12, Intangible assets excluding goodwill.
Discontinued operations andnon-current assets held for sale
Non-current assets (disposal groups comprising assets and liabilities) that are expected to be recovered primarily through sale rather than through continuing use are classified as held for sale.
Non-current assets classified as held for sale and the assets of a disposal group classified as held for sale are presented separately from the other assets in the balance sheet. The liabilities of a disposal group classified as held for sale are presented separately from other liabilities in the balance sheet.
A discontinued operation is a component of an entity that either has been disposed of, or that is classified as held for sale, and (a) represents a separate major line of business or geographical area of operations; and (b) is a part of a single coordinated plan to dispose of a separate major line of business or geographical area of operations; or (c) is a subsidiary acquired exclusively with a view to sell. A component that previously was held for use will have one or more cash-generating units. Generally, the disposal of a business that previously was part of a single cash-generating unit does not qualify as a component of an entity and therefore shall not be classified as a discontinued operation if disposed of.
Non-current assets held for sale and discontinued operations are carried at the lower of carrying amount or fair value less costs to sell.cost of disposal. Any gain or loss from disposal, of a business, together with the results of these operations until the date of disposal, is reported separately as discontinued operations. The financial information of discontinued operations is excluded from the respective captions in the Consolidated financial statements and related notes for all periods presented. Comparatives in the balance sheet are not re-presentedrepresented when anon-current asset or disposal group is classified as held for sale. Comparatives are restatedrepresented for presentation of discontinued operations in the Statement of cash flow and Statement of income.
Upon classification of a disposal group as held for sale the Company may agree with the buyer to retain certain assets and liabilities, in which case such items are not presented as part of assets/liabilities held for sale, even though the associated item in the Statement of income would be presented as part of discontinued operations. The presentation of cash flows relating to such items in that case mirrors the classification in the Statement of income, i.e. as cash flows from discontinued operations.
Adjustments in the current period to amounts previously presented in discontinued operations that are directly related to the disposal of a discontinued operation in a prior period are classified separately in discontinuedDiscontinued operations. Circumstances to which these adjustments may relate include resolution of uncertainties that arise from the terms of the disposal transaction, such as the resolution of a purchase price adjustments and indemnifications, resolution of uncertainties that arise from and are directly related to the operations of the component before its disposal, such as environmental and product warranty obligations retained by the Company, or the settlement of employee benefit plan obligations provided that the settlement is directly related to the disposal transaction.
SegmentsFurther information on discontinued operations andnon-current assets held for sale can be found innote 3, Discontinued operations and other assets classified as held for sale.
Impairment
Impairment of goodwill and intangible assets not yet ready for use
Goodwill and intangible assets not yet ready for use are not amortized but tested for impairment annually and whenever impairment indicators require. In most cases the Company identified its cash generating units for goodwill at one level below that of an operating segment. Cash flows at this level are substantially independent from other cash flows and this is the lowest level at which goodwill is monitored by the Executive Committee. In 2016 the Company performed and completed annual impairment tests in the second quarter, in line with all years presented in the Statement of income, and in the fourth quarter. The additional impairment test atyear-end was performed in view of the change in the date of test from second quarter to fourth quarter, as from 2017, to better align it with planning and forecasting cycles. An impairment loss is recognized in the Statement of income whenever and
Annual Report 2016 131
Group financial statements 10.10
to the extent that the carrying amount of a cash-generating unit exceeds the unit’s recoverable amount, which is the greater of its value in use and fair value less cost of disposal. Value in use is measured as the present value of future cash flows expected to be generated by the asset.
Further information on impairment of goodwill and intangible assets not yet ready for use can be found innote 11, Goodwill.
Impairment ofnon-financial assets other than goodwill, intangible assets not yet ready for use, inventories and deferred tax assets
Non-financial assets other than goodwill, intangible assets not yet ready for use, inventories and deferred tax assets are reviewed for impairment whenever events or changes in circumstances indicate that the carrying amount of an asset may not be recoverable. Recoverability of assets to be held and used is assessed by a comparison of the carrying amount of an asset with the greater of its value in use and fair value less cost of disposal. Value in use is measured as the present value of future cash flows expected to be generated by the asset. Fair value less cost of disposal is measured as the amount obtained from a sale of an asset in an arm’s length transaction, less costs of disposal. If the carrying amount of an asset is deemed not recoverable, an impairment charge is recognized in the amount by which the carrying amount of the asset exceeds the recoverable amount. The review for impairment is carried out at the level where cash flows occur that are independent of other cash flows.
Impairment losses recognized in prior periods are assessed at each reporting date for any indications that the loss has decreased or no longer exists. An impairment loss is reversed if and to the extent there has been a change in the estimates used to determine the recoverable amount. The loss is reversed only to the extent that the asset’s carrying amount does not exceed the carrying amount that would have been determined, net of depreciation or amortization, if no impairment loss had been recognized. Reversals of impairment are recognized in the Statement of income.
Impairment of financial assets
A financial asset is considered to be impaired if objective evidence indicates that one or more events have had a negative effect on the estimated future cash flows of that asset. In case ofavailable-for-sale financial assets, a significant or prolonged decline in the fair value of the financial assets below its cost is considered an indicator that the financial assets are impaired. If any such evidence exists foravailable-for-sale financial assets, the cumulative loss - measured as the difference between the acquisition cost and the current fair value, less any impairment loss on that financial asset previously recognized in the Statement of income - is reclassified from the fair value reserve in equity (through Other comprehensive income) to the Statement of income.
If objective evidence indicates that financial assets that are carried at cost, such as loans and receivables, need to be tested for impairment, calculations are based on information derived from business plans and other information available for estimating their fair value, which is based on estimated future cash flows discounted at the asset’s original effective interest rate. Any impairment loss is charged to the Statement of income.
An impairment loss related to financial assets is reversed if in a subsequent period, the fair value increases and the increase can be related objectively to an event occurring after the impairment loss was recognized. The loss is reversed only to the extent that the asset’s carrying amount does not exceed the carrying amount that would have been determined if no impairment loss had been recognized. Reversals of impairment are recognized in the Statement of income except for reversals of impairment ofavailable-for-sale equity securities, which are recognized in Other comprehensive income.
Further information on business combinations can be found innote 13, Other financial assets.
Other policies
Basis of consolidation
The Consolidated financial statements comprise the financial statements of Koninklijke Philips N.V. and all subsidiaries that the Company controls, i.e. when it is exposed, or has rights, to variable returns from its involvement with the investee and has the ability to affect those returns through its power over the investee. The existence and effect of potential voting rights are considered when assessing whether the Company controls another entity. Subsidiaries are fully consolidated from the date that control commences until the date that control ceases. All intercompany balances and transactions have been eliminated in the Consolidated financial statements. Unrealized losses are eliminated in the same way as unrealized gains, but only to the extent that there is no evidence of impairment.
Business combinations
Business combinations are accounted for using the acquisition method. Under the acquisition method, the identifiable assets acquired, liabilities assumed and anynon-controlling interest in the acquiree are recognized at the acquisition date, which is the date on which control is transferred to the Company.
The Company measures goodwill at the acquisition date as:
the fair value of the consideration transferred; plus
the recognized amount of anynon-controlling interest in the acquiree; plus
132 Annual Report 2016
Group financial statements 10.10
if the business combination is achieved in stages, the fair value of the existing equity interest in the acquiree; less
the net recognized amount (generally fair value) of the identifiable assets acquired and liabilities assumed.
Costs related to the acquisition, other than those associated with the issue of debt or equity securities, that the Company incurs are expensed as incurred.
Any contingent consideration payable is recognized at fair value at the acquisition date and initially is presented as Long-term provisions. When the timing and amount of the consideration become more certain, it is reclassified to Accrued liabilities. If the contingent consideration that meets the definition of a financial instrument is classified as equity, it is not remeasured and settlement is accounted for within equity. Otherwise, subsequent changes to the fair value of the contingent consideration are recognized in the Statement of income.
Non-controlling interests are measured at their proportionate share of the acquiree’s identifiable net assets at the date of acquisition.
Further information on business combinations can be found innote 4, Acquisitions and divestments.
Acquisitions of and adjustments tonon-controlling interests
Acquisitions ofnon-controlling interests are accounted for as transactions with owners in their capacity as owners and therefore no goodwill is recognized. Adjustments tonon-controlling interests arising from transactions that do not involve the loss of control are based on a proportionate amount of the net assets of the subsidiary.
Loss of control
Upon the loss of control, the Company derecognizes the assets and liabilities of the subsidiary, any non-controlling interests and the other components of equity related to the subsidiary. Any surplus or deficit arising on the loss of control is recognized in the Statement of income. If the Company retains any interest in the previous subsidiary, then such interest is measured at fair value at the date the control is lost. Subsequently it is accounted for as either an equity-accounted investee (associate) or as anavailable-for-sale financial asset, depending on the level of influence retained.
Investments in associates
Associates are all entities over which the Company has significant influence, but no control. Significant influence is presumed with a shareholding of between 20% and 50% of the voting rights. Investments in associates are accounted for using the equity method of accounting and are initially recognized at cost. The carrying amount of an investment includes the carrying amount of goodwill identified on acquisition. An impairment loss on such investment is allocated to the investment as a whole.
The Company’s share of the net income of these companies is included in Results relating to investments in associates in the Statement of income, after adjustments to align the accounting policies with those of the Company, from the date that significant influence commences until the date that significant influence ceases. Dilution gains and losses arising from investments in associates are recognized in the Statement of income as part of Other results relating to investments in associates. When the Company’s share of losses exceeds its interest in an associate, the carrying amount of that interest (including any long-term loans) is reduced to zero and recognition of further losses is discontinued except to the extent that the Company has incurred legal or constructive obligations or made payments on behalf of the associate. Unrealized gains on transactions between the Company and its associates are eliminated to the extent of the Company’s interest in the associates. Unrealized losses are also eliminated unless the transaction provides evidence of an impairment of the asset transferred. Remeasurement differences of an equity stake resulting from gaining control over the investee previously recorded as associate are recorded under investments in associates.
Further information on investments in associates can be found innote 5, Interests in entities.
Foreign currencies
Foreign currency transactions
The financial statements of all group entities are measured using the currency of the primary economic environment in which the entity operates (functional currency). The euro (EUR) is the functional currency of the Company and presentation currency of the Group financial statements. Foreign currency transactions are translated into the functional currency using the exchange rates prevailing at the dates of the transactions or valuation where items are remeasured. Foreign exchange gains and losses resulting from the settlement of such transactions and from the translation atyear-end exchange rates of monetary assets and liabilities denominated in foreign currencies are recognized in the Statement of income, except when deferred in Other comprehensive income as qualifying cash flow hedges and qualifying net investment hedges.
Foreign currency differences arising from translations are recognized in the Statement of income, except foravailable-for-sale equity investments which are recognized in Other comprehensive income. If there is an impairment which results in foreign currency differences being recognized, then these differences are reclassified from Other comprehensive income to the Statement of income.
Annual Report 2016 133
Group financial statements 10.10
All exchange difference items are presented as part of Cost of sales, with the exception of tax items and financial income and expense, which are recognized in the same line item as they relate in the Statement of income.
Non-monetary assets and liabilities denominated in foreign currencies that are measured at fair value are retranslated to the functional currency using the exchange rate at the date the fair value was determined.Non-monetary items in a foreign currency that are measured based on historical cost are translated using the exchange rate at the transaction date.
Foreign operations
The assets and liabilities of foreign operations, including goodwill and fair value adjustments arising on acquisition, are translated to euro at exchange rates at the reporting date. The income and expenses of foreign operations are translated to euro at exchange rates at the dates of the transactions.
Foreign currency differences arising on translation of foreign operations into euro are recognized in Other comprehensive income, and presented as part of Currency translation differences in Equity. However, if the operation is anon-wholly owned subsidiary, then the relevant proportionate share of the translation difference is allocated toNon-controlling interests.
When a foreign operation is disposed of such that control, significant influence or joint control is lost, the cumulative amount in the Currency translation differences related to the foreign operation is reclassified to the Statement of income as part of the gain or loss on disposal. When the Company disposes of only part of its interest in a subsidiary that includes a foreign operation while retaining control, the respective proportion of the cumulative amount is reattributed toNon-controlling interests. When the Company disposes of only part of its investment in an associate or joint venture that includes a foreign operation while retaining significant influence or joint control, the relevant proportion of the cumulative amount is reclassified to the Statement of income.
Financial instruments
Non-derivative financial instruments
Non-derivative financial instruments are recognized initially at fair value when the Company becomes a party to the contractual provisions of the instrument.
Regular way purchases and sales of financial assets are accounted for at the trade date. Dividend and interest income are recognized when earned. Gains or losses, if any, are recorded in Financial income and expense.
Non-derivative financial instruments comprise cash and cash equivalents, receivables, othernon-current financial assets, debt and other financial liabilities that are not designated as hedges.
Cash and cash equivalents
Cash and cash equivalents include all cash balances andshort-term highly liquid investments with an original maturity of three months or less that are readily convertible into known amounts of cash.
Further information on cash and cash equivalents can be found innote 30, Details of treasury / other financial risks.
Receivables
Receivables are carried at the lower of amortized cost or the present value of estimated future cash flows, taking into account discounts given or agreed. The present value of estimated future cash flows is determined through the use of value adjustments for uncollectible amounts. As soon as individual trade accounts receivable can no longer be collected in the normal way and are expected to result in a loss, they are designated as doubtful trade accounts receivable and valued at the expected collectible amounts. They are written off when they are deemed to be uncollectible because of bankruptcy or other forms of receivership of the debtors. The allowance for the risk ofnon-collection of trade accounts receivable takes into account credit-risk concentration, collective debt risk based on average historical losses, and specific circumstances such as serious adverse economic conditions in a specific country or region.
Philips derecognizes receivables on entering into factoring transactions if Philips has transferred substantially all risks and rewards or if Philips does not retain control over receivables.
Further information on receivables can be found innote 16, Receivables.
Othernon-current financial assets
Othernon-current financial assets includeheld-to-maturity investments, loans receivable andavailable-for-sale financial assets and financial assets at fair value through profit or loss.
Held-to-maturity investments are those debt securities which the Company has the ability and intent to hold until maturity.Held-to-maturity debt investments are recorded at amortized cost, adjusted for the amortization or accretion of premiums or discounts using the effective interest method.
Loans receivable are stated at amortized cost, less impairment.
Available-for-sale financial assets arenon-derivative financial assets that are designated asavailable-for-sale and that are not classified in any of the other
134 Annual Report 2016
Group financial statements 10.10
categories of financial assets. Subsequent to initial recognition, they are measured at fair value and changes therein, other than impairment losses and foreign currency differences on available forsale-debt instruments are recognized in Other comprehensive income and presented in the fair value reserve in equity. When an investment is derecognized, the gain or loss accumulated in equity is reclassified to the Statement of income.
Available-for-sale financial assets including investments inprivately-held companies that are not associates, and do not have a quoted market price in an active market and whose fair value could not be reliably determined, are carried at cost.
A financial asset is classified as fair value through profit or loss if it is classified as held for trading or is designated as such upon initial recognition. Financial assets are designated as fair value through profit or loss if the Company manages such investments and makes purchase and sale decisions based on their fair value in accordance with the Company’s documented risk management or investment strategy. Financial assets at fair value through profit or loss are measured at fair value, and changes therein are recognized in the Statement of income. Attributable transaction costs are recognized in the Statement of income as incurred.
Further information on othernon-current financial assets can be found innote 13, Other financial assets.
Equity
Common shares are classified as equity. Incremental costs directly attributable to the issuance of shares are recognized as a deduction from equity. Where the Company purchases the Company’s equity share capital (treasury shares), the consideration paid, including any directly attributable incremental transaction costs (net of income taxes), is deducted from equity attributable to the Company’s equity holders until the shares are cancelled or reissued. Where such ordinary shares are subsequently reissued, any consideration received, net of any directly attributable incremental transaction costs and the related income tax effects, is included in equity attributable to the Company’s equity holders.
Call options on own shares are treated as equity instruments in accordance with International Financial Reporting Standards criteria.
Dividends are recognized as a liability in the period in which they are declared and approved by Shareholders. The income tax consequences of dividends are recognized when a liability to pay the dividend is recognized.
The ‘Stichting Preferente Aandelen Philips’ has been granted the right to acquire preference shares in the Company. Such right has not been exercised. As a means to protect the Company and its stakeholders against an unsolicited attempt to acquire (de facto) control of the Company, the General Meeting of Shareholders in 1989 adopted amendments to the Company’s articles of association that allow the Board of Management and the Supervisory Board to issue (rights to acquire) preference shares to a third party. As of December 31, 2016, no preference shares have been issued.
Further information on equity can be found innote 17, Equity.
Debt and other liabilities
Debt and liabilities other than provisions are stated at amortized cost.
Derivative financial instruments, including hedge accounting
The Company uses derivative financial instruments principally to manage its foreign currency risks and, to a more limited extent, for managing interest rate and commodity price risks. All derivative financial instruments are accounted for at the trade date and classified as current ornon-current assets or liabilities based on the maturity date or the earlier termination date. Embedded derivatives are separated from the host contract and accounted for separately if the economic characteristics and risks of the host contract and the embedded derivative are not closely related. The Company measures all derivative financial instruments at fair value derived from market prices of the instruments, or calculated as the present value of the estimated future cash flows based on observable interest yield curves, basis spread, credit spreads and foreign exchange rates, or from option pricing models, as appropriate. Gains or losses arising from changes in fair value of derivatives are recognized in the Statement of income, except for derivatives that are highly effective and qualify for cash flow or net investment hedge accounting.
Changes in the fair value of a derivative that is highly effective and that is designated and qualifies as a cash flow hedge, are recorded in Other comprehensive income, until the Statement of income is affected by the variability in cash flows of the designated hedged item. To the extent that the hedge is ineffective, changes in the fair value are recognized in the Statement of income.
The Company formally assesses, both at the hedge’s inception and on an ongoing basis, whether the derivatives that are used in hedging transactions are highly effective in offsetting changes in fair values or cash flows of hedged items. When it is established that a derivative is not highly effective as a hedge or that it has ceased to be a highly effective hedge, the Company discontinues hedge accounting prospectively. When hedge accounting is discontinued because it is expected that a forecasted transaction will not occur, the Company continues to carry the derivative on the Balance sheet at its fair value, and gains and losses that
Annual Report 2016 135
Group financial statements 10.10
were accumulated in Other comprehensive income are recognized immediately in the same line item as they relate to in the Statement of income.
Foreign currency differences arising on the retranslation of financial instruments designated as a hedge of a net investment in a foreign operation are recognized directly as a separate component of equity through Other comprehensive income, to the extent that the hedge is effective. To the extent that the hedge is ineffective, such differences are recognized in the Statement of income.
Offsetting and master netting agreements
The Company presents financial assets and financial liabilities on a gross basis as separate line items in the Consolidated balance sheet.
Master netting agreements may be entered into when the Company undertakes a number of financial instrument transactions with a single counterparty. Such an agreement provides for a net settlement of all financial instruments covered by the agreement in the event of default or certain termination events on any of the transactions. A master netting agreement may create a right of offset that becomes enforceable and affects the realization or settlement of individual financial assets and financial liabilities only following a specified termination event. However, if this contractual right is subject to certain limitations then it does not necessarily provide a basis for offsetting unless both of the offsetting criteria are met, i.e. there is a legally enforceable right and an intention to settle net or simultaneously.
Property, plant and equipment
The costs of property, plant and equipment comprise all directly attributable costs (including the cost of material and direct labor).
Depreciation is generally calculated using the straight-line method over the useful life of the asset. Gains and losses on the sale of property, plant and equipment are included in Other Business Income. Costs related to repair and maintenance activities are expensed in the period in which they are incurred unless leading to an extension of the original lifetime or capacity.
Plant and equipment under finance leases and leasehold improvements are amortized using thestraight-line method over the shorter of the lease term or the estimated useful life of the asset. The gain realized on sale and operating leaseback transactions that are concluded based upon market conditions is recognized at the time of the sale in Other Business Income, in the Consolidated statements of income.
Further information on property, plant and equipment can be found innote 10, Property, plant and equipment.
Leased assets
Leases in which the Company is the lessee and has substantially all the risks and rewards of ownership are classified as finance leases. Finance leases are capitalized at the commencement of the lease at the lower of the fair value of the leased assets and the present value of the minimum lease payments. Each lease payment is allocated between the liability and finance charges. The interest element of the finance cost is charged to the Statement of income over the lease period so as to produce a constant periodic rate of interest on the remaining balance of the liability for each period. The corresponding rental obligations, net of finance charges, are included in other short-term and othernon-current liabilities. The property, plant and equipment acquired under finance leases is depreciated over the shorter of the useful life of the assets and the lease term.
Leases in which the Company is the lessee and in which substantially all risks and rewards of ownership are retained by the lessor are classified as operating leases. Payments made under operating leases (net of any incentives received from the lessor) are recognized in the Statement of income on a straight-line basis over the term of the lease.
Inventories
Inventories are stated at the lower of cost or net realizable value. The cost of inventories comprises all costs of purchase, costs of conversion and other costs incurred in bringing the inventories to their present location and condition. The costs of conversion of inventories include direct labor and fixed and variable production overheads, taking into account the stage of completion and the normal capacity of production facilities. Costs of idle facility and abnormal waste are expensed. The cost of inventories is determined using thefirst-in,first-out (FIFO) method. Inventory is reduced for the estimated losses due to obsolescence. This reduction is determined for groups of products based on sales in the recent past and/or expected future demand.
Further information on inventories can be found innote 15, Inventories.
Employee benefit accounting
A defined-contribution plan is a post-employment benefit plan under which an entity pays fixed contributions into a separate entity and will have no legal or constructive obligation to pay further amounts. Obligations for contributions todefined-contribution pension plans are recognized as an employee benefit expense in the Statement of income in the periods during which services are rendered by employees.
A defined-benefit plan is a post-employment benefit plan other than a defined-contribution plan. Plans for which the Company has no legal or constructive obligation to pay further amounts, but to which it does paynon-fixed contributions, are also treated as a
136 Annual Report 2016
Group financial statements 10.10
defined-benefit plan. The net pension asset or liability recognized in the Consolidated balance sheets in respect of defined-benefit post-employment plans is the fair value of plan assets less the present value of the projected defined-benefit obligation at the balance sheet date. The defined-benefit obligation is calculated annually by qualified actuaries using the projected unit credit method. Recognized assets are limited to the present value of any reductions in future contributions or any future refunds. The net pension liability is presented as a long-term provision, no distinction is made for the short-term portion.
For the Company’s major plans, a full discount rate curve of high-quality corporate bonds is used to determine the defined-benefit obligation. The curves are based on Towers Watson’s RATE:Link methodology which uses data of corporate bonds rated AA or equivalent. For the other plans a single point discount rate is used based on corporate bonds for which there is a deep market and the plan’s maturity. Plans in countries without a deep corporate bond market use a discount rate based on the local sovereign curve and the plan’s maturity.
Pension costs in respect of defined-benefit post-employment plans primarily represent the increase of the actuarial present value of the obligation for post-employment benefits based on employee service during the year and the interest on the net recognized asset or liability in respect of employee service in previous years.
Remeasurements of the net defined-benefit asset or liability comprise actuarial gains and losses, the return on plan assets (excluding interest) and the effect of the asset ceiling (excluding interest). The Company recognizes all remeasurements in Other comprehensive income.
The Company recognizes gains and losses on the settlement of a defined-benefit plan when the settlement occurs. The gain or loss on settlement is the difference between the present value of the defined-benefit obligation being settled, as determined on the date of settlement, and the settlement price, including any plan assets transferred and any payments made directly by the Company in connection with the settlement. In this respect, the amount of the plan assets transferred is adjusted for the effect of the asset ceiling. Past service costs following from the introduction of a change to the benefit payable under a plan or a significant reduction of the number of employees covered by a plan (curtailment), are recognized in full in the Statement of income.
Short-term employee benefit obligations are measured on an undiscounted basis and are expensed as the related service is provided. The Company recognizes a liability and an expense for bonuses and incentives based on a formula that takes into consideration the profit attributable to the Company’s shareholders after certain adjustments.
The Company’s net obligation in respect of long-term employee benefits is the amount of future benefit that employees have earned in return for their service in the current and prior periods, such as jubilee entitlements. That benefit is discounted to determine its present value. Remeasurements are recognized in the Statement of income in the period in which they arise.
Further information on employee benefit accounting can be found innote 20, Post-employment benefits.
Share-based payment
Equity-settled transactions
The cost of equity-settled transactions is determined by the fair value at the date when the grant is made using an appropriate valuation model, further details of which are given innote 27, Share-based compensation.
The grant-date fair value of equity-settled share-based payment awards granted to employees is recognized as personnel expense, with a corresponding increase in equity, over the vesting period of the award. The cumulative expense recognized for equity-settled transactions at each reporting date until the vesting date reflects the extent to which the vesting period has expired and the Company’s best estimate of the number of equity instruments that will ultimately vest. The expense or credit in the statement of profit or loss for a period represents the movement in cumulative expense recognized as at the beginning and end of that period.
Service andnon-market performance conditions are not taken into account when determining the grant-date fair value of awards, but the likelihood of the conditions being met is assessed as part of the Company’s best estimate of the number of equity instruments that will ultimately vest. Market performance conditions are reflected within the grant-date fair value.
No expense is recognized for awards that do not ultimately vest becausenon-market performance and/ or service conditions have not been met. Where awards include a market ornon-vesting condition, the transactions are treated as vested irrespective of whether the market ornon-vesting condition is satisfied, provided that all other performance and/or service conditions are satisfied.
When an award is cancelled by the entity or by the counterparty, any remaining element of the fair value of the award is expensed immediately through profit or loss.
Annual Report 2016 137
Group financial statements 10.10
The dilutive effect of outstanding options is reflected as additional share dilution in the computation of diluted earnings per share (further details are given in note 9, Earnings per share).
Financial income and expenses
Financial income comprises interest income on funds invested (includingavailable-for-sale financial assets), dividend income, net gains on the disposal ofavailable-for-sale financial assets, net fair value gains on financial assets at fair value through profit or loss, net gains on the remeasurement to fair value of any preexistingavailable-for-sale interest in an acquiree, and net gains on foreign exchange impacts that are recognized in the Statement of income.
Interest income is recognized on accrual basis in the Statement of income, using the effective interest method. Dividend income is recognized in the Statement of income on the date that the Company’s right to receive payment is established, which in the case of quoted securities is normally theex-dividend date.
Financial expenses comprise interest expenses on borrowings, unwinding of the discount on provisions and contingent consideration, losses on disposal ofavailable-for-sale financial assets, net fair value losses on financial assets at fair value through profit or loss, impairment losses recognized on financial assets (other than trade receivables), net interest expenses related to defined-benefit plans and net losses on foreign exchange impacts that are recognized in the Statement of income.
Further information on financial income and expenses can be found innote 7, Financial income and expenses.
Financial guarantees
The Company recognizes a liability at the fair value of the obligation at the inception of a financial guarantee contract if it is probable that an outflow of resources embodying economic benefits will be required to settle the obligation. The guarantee is subsequently measured at the higher of the best estimate of the obligation or the amount initially recognized.
Cash flow statements
Cash flows arising from transactions in a foreign currency are translated in the Company’s functional currency using the exchange rate at the date of the cash flow. Cash flows from derivative instruments that are accounted for as cash flow hedges are classified in the same category as the cash flows from the hedged items. Cash flows from other derivative instruments are classified as investing cash flows.
Segment information
Operating segments are components of the Company’s business activities about which separate financial information is available that is evaluated regularly by the chief operating decision maker (the Board of ManagementExecutive Committee of the Company). The Board of ManagementExecutive Committee decides how to allocate resources and assesses performance. Reportable segments comprise the operating sectors Healthcare, Consumer Lifestylesegments Personal Health businesses, Diagnosis & Treatment businesses, Connected Care & Health Informatics businesses and Lighting. Innovation, Group & Services (IG&S) is a sectorHealthTech Other and Legacy Items are segments but not a separate reportable segmentsegments and holds, amongsthold, among others, the Emerging Businesses and Innovation businesses, headquarters overhead, and regional/country organization expenses.expenses and separation costs. Segment accounting policies are the same as the accounting policies as applied toby the Group.
Cash flow statements
Cash flow statements are prepared using the indirect method. Cash flows in foreign currencies have been translated into euros using the weighted average rates of exchange for the periods involved. Cash flows from derivative instruments that are accounted for as fair value hedges or cash flow hedges are classified in the same category as the cash flows from the hedged items. Cash flows from other derivative instruments are classified consistent with the nature of the instrument.Company.
Earnings per shareShare
The Company presents basic and diluted earnings per share (EPS) data for its common shares. Basic EPS is calculated by dividing the netNet income (loss) attributable to shareholders of the Company by the weighted average number of common shares outstanding during the period, adjusted for own shares held. Diluted EPS is determined by adjusting the Statement ofNet income (loss) attributable to shareholders and the weighted average number of common shares outstanding during the period, adjusted for own shares held, for the effects of all dilutive potential common shares, which comprise convertible personnel debentures,comprises of restricted shares, performance shares and share options granted to employees.
Financial guaranteesFurther information on earnings per share can be found innote 9, Earnings per share.
The Company recognizes a liability at the fair value of the obligation at the inception of a financial guarantee contract. The guarantee is subsequently measured at the higher of the best estimate of the obligation or the amount initially recognized.New standards and interpretations
IFRS accounting standards adopted as from 20132016
The accountingChanges to policies, set out above have been applied consistently to all periods presented in these Consolidated financial statements except as explained below which addresses changes in accounting policies. In case of the absence of explicit transition requirements for new accounting pronouncements, the Company accounts for any change in accounting principle retrospectively.
The Company has adopted the following new and amended IFRSs as of January 1, 2013.
Disclosures - Offsetting Financial Assets and Liabilities (Amendments to IFRS 7)
As a result of thefrom amendments to IFRS 7,standards, interpretations and the Company has expanded its disclosures about the offsetting of financial assets and liabilities. See note 34, Fair value of financial assets and liabilities.
IFRS 10 Consolidated Financial Statements
IFRS 10 introduces a single control model to determine whether an investee should be consolidated. The new standard includes guidance on control with less than half of the voting rights (‘de facto’ control), participating and protective voting rights and agent/principal relationships. Based on a reassessment of the control conclusion for the investees at January 1, 2013, the adoption of IFRS 10annual improvement cycles, effective 2016, did not have a material impact on the Company’s ConsolidatedGroup financial statements.
IFRS 11 Joint Arrangements
Under IFRS 11, the structure of the joint arrangement, although still an important consideration, is no longer the main factor in determining the type of joint arrangement and therefore the subsequent accounting. Instead:
The Company’s interest in a joint operation, which is an arrangement in which the parties have rightsaccounting standards to the assets and obligations for the liabilities, will be accounted for on the basis of the Company’s interest in those assets and liabilities.
The Company’s interest in a joint venture, which is an arrangement in which the parties have rights to the net assets, are equity-accounted.
Prior to 2012 the Company accounted for jointly controlled entities using the equity method. The adoption therefore does not have a material impact on the Company’s Consolidated financial statements.
IFRS 12 Disclosure of Interests in Other Entities
This standard contains the disclosure requirements for interests in subsidiaries, joint ventures, associates and other unconsolidated interests. As a result of IFRS 12, the Company has expanded its disclosures on interests in other entities. See note 6, Interests in entities.
IFRS 13 Fair Value Measurement
IFRS 13 establishes a single framework for measuring fair value and making disclosures about fair value measurements, when such measurements are required or permitted by other IFRSs. More specifically, the definition of fair value was clarified to be the price at which an orderly transaction to sell an asset or to transfer a liability would take place between market participants at the measurement date. The standard also replaces and expands disclosure requirements about fair value measurements in other IFRSs, of which some of these are required in interim financial statements related to financial instruments. The Company therefore has included additional disclosures in note 34, Fair value of financial assets and liabilities. IFRS 13 has no material impact on the measurements of the Company’s assets and liabilities.
Presentation of Items of Other Comprehensive Income (Amendments to IAS 1)
The new amendment requires separation of items presented in Other comprehensive income into two groups, based on whether or not they can be recycled into the Statement of income in the future. Items that will not be recycled in the future are presented separately from items that may be
Annual Report 2013 169
11 Group financial statements 11.9 - 11.9
recycled in the future. The application of this amendment impacts presentation and disclosures only. Comparative information has been re-presented.
IAS 19 Employee Benefits (2011)
As a result of the introduction of IAS 19 (2011) - or IAS 19R/Revised - the Company has changed its accounting policy with regard to the accounting of defined benefit pension plans. The main change impacts the basis of determining the income or expense for the period related to these pension plans. Under the new standard the Company determines a net interest expense (income) by applying the discount rate used to measure the defined benefit obligation (DBO) at the beginning of the annual period to the net defined benefit liability (asset) at the beginning of the annual period, taking into account any changes in the net defined benefit liability (asset) during the period as a result of contributions and benefit payments. As a result, this net interest now comprises:
interest cost on the DBO;
interest income on plan assets; and
interest on the effect of the asset ceiling.
Previously, the Company determined interest income on plan assets based on their long-term rate of expected return. Furthermore, as from January 1, 2013 the Company presents net interest expenses related to defined benefits in Financial income and expense rather than Income from operations.
The new standard no longer allows for accrual of future pension administration costs as part of the DBO. Such costs should be expensed as incurred. Previously, for the Dutch pension plan the Company accrued a surcharge for pension administration costs as part of the service costs into the DBO. With the adoption of the new standard this accrual was eliminated, resulting in an exclusion of EUR 216 million from the DBO per January 1, 2013, thereby improving the funded status. This funded status improvement is offset by the impact of the asset ceiling test regarding the Dutch pension plan’s surplus, and hence there is no further impact on the Company’s balance sheet figures other than the direct recognition of previously unrecognized past service cost.
The impact on Equity from the IAS 19 (2011) accounting policy change is as follows:
| ||||
| ||||
| ||||
| ||||
| ||||
| ||||
The limited impact on the balance sheet mainly relates to some unrecognized past service cost gains and losses which must be recognized immediately under IAS 19 (2011). The limited impact is explained by the fact that the Company already applied immediate recognition of actuarial gains and losses in Other comprehensive income.
The negative impact of IAS 19 (2011) for post-employment defined benefit plans on Income from operations, Income before taxes and Basic and Diluted earnings per share is as follows:
| 2011 | 2012 | |||||||
Income from operations | (124 | ) | (260 | ) | ||||
Financial income and expenses | (92 | ) | (85 | ) | ||||
|
| |||||||
Income before taxes | (216 | ) | (345 | ) | ||||
Basic earnings per share | (0.17 | ) | (0.28 | ) | ||||
Diluted earnings per share | (0.17 | ) | (0.28 | ) | ||||
Recoverable Amount Disclosures for Non-Financial Assets (Amendments to IAS 36) (2013)
The amendment to IAS 36 Impairment of Assets was introduced following the introduction of IFRS 13 Fair Value Measurement, to reduce the circumstances in which the recoverable amount of assets or cash-generating units is required to be disclosed, clarify the disclosures required, and to introduce an explicit requirement to disclose the discount rate used in determining impairment (or reversals) where recoverable amount (based on fair value less costs of disposal) is determined using a present value technique. As the amendment is basically to avoid unintended disclosure requirements from the introduction of IFRS 13, it was early adopted by the Company. The amendment has no material impact.
Defined Benefit Plans: Employee Contributions (Amendments to IAS 19)
Initially the abovementioned IAS 19 (2011) adjustments required that employee contributions basically would have to be incorporated in the measurement of the defined benefit obligation. This amendment allows a practical expedient to continue to recognize employee contributions in the Statement of income when certain conditions are met. The Company early adopted this amendment and as a result there is no change in the way how employee contributions are currently treated compared to the treatment prior to the IAS 19 (2011) adoption. Up to 2013 the Company has very limited employee contributions in their pension plans.
IFRS accounting standards adopted as from 20142017 and onwards
A number of new standards and amendments to existing standards have been published and are mandatory for the Company beginning on or after January 1, 20142017 or later periods, and the Company has not yet early adopted them. Those which may be the most relevant to the Company are set out below.
IFRIC 21 Levies
IFRIC 21 provides guidance on the accounting for certain outflows imposed on entities by governments in accordance with laws and/or regulations (levies). The Interpretation identifies the obligating event for the recognition of a liability as the activity that triggers the payment of the levy in accordance with the relevant legislation. This Interpretation does not have a material impact on the financial statements.
Changes to other standards, following from Amendmentsamendments and the Annual Improvement Cycles, doannual improvement cycles, are not expected to have a material impact on the Company’s financial statements.
IFRS 9 Financial Instruments
170IFRS 9 Financial Instruments brings together the classification and measurement, impairment and hedge accounting phases of the IASB’s project to replace IAS 39 Financial Instruments: Recognition and Measurement.
138 Annual Report 20132016
11 Group financial statements 11.9 - 11.910.10
IFRS 9 adds a new expected loss impairment model and amendments to classification and measurement for financial assets. The impairment model is based on the concept of providing for expected losses at inception of a contract, except in the case of purchased or originated credit-impaired financial assets, where expected credit losses are incorporated into the effective interest rate.
The standard supersedes all previous versions of IFRS 9 and is effective for periods beginning on or after January 1, 2018. It is endorsed by the EU. The Company is currently in the process of implementing the new Standard, and based on its current assessment of the potential impact of adoption of IFRS 9 based on its positions at 31 December 2016 and hedging relationships designated during 2016 under IAS 39, the following is noted:
Classification
At this moment the Company does not believe that the new classification requirements will have a material impact on its accounting for trade receivables, loans, investments in debt securities and investments in equity securities that are managed on a fair value basis. At 31 December 2016, the Company had equity investments classified asavailable-for-sale with a fair value of approximately EUR 140 million that are held for long-term strategic purposes. The Company did not make a decision yet as to classify these investments as fair-value-through-other-comprehensive-income (FVOCI) orfair-value-through-profit-or-loss (FVTPL) financial assets, assuming these investments continue to be held for the same purpose at initial application of IFRS 9.
On the classification of financial liabilities under IFRS 9 the Company’s current assessment did not indicate any material impact.
Impairment
IFRS 9 requires the Company to record expected credit losses on all of its debt securities, loans and trade receivables, either on a12-month or lifetime basis.
While the group has not yet undertaken a detailed assessment of how its impairment provisions would be affected by the new model, it may result in an earlier recognition of credit losses.
Hedge accounting
The Company’s current plan is that it will elect to apply the new hedge accounting requirements of IFRS 9 rather than to make the accounting policy choice to continue the IAS 39 requirements.
Under IFRS 9 the Company should ensure that hedge accounting relationships are aligned with the Company’s risk management objectives and strategy including a more qualitative and forward-looking approach to assessing hedge effectiveness. Under the new model, it is possible that more risk management strategies, particularly those involving hedging a risk component (other than foreign currency risk) of a non-financial item, will be likely to qualify for hedge accounting. The Company currently does not undertake hedges of such risk components.
Under IAS 39, the change in fair value of the forward element of the forward exchange contracts (“forward points”) is recognized immediately in profit or loss. On adoption of IFRS 9, the Company may elect for the forward points to be separately accounted for as a cost of hedging. In this case, they would be recognized in Other comprehensive income and accumulated in a cost of hedging reserve as a separate component within equity and accounted for subsequently like gains and losses accumulated in the cash flow hedge reserve.
The Company’s current assessment indicated that the types of hedge accounting relationships that the Company currently designates should be capable of meeting the requirements of IFRS 9 if the Company completes certain planned changes to its internal documentation and monitoring processes. While the Company will have to finalize the detailed assessment, it would appear that the Company’s current hedge relationships would qualify as continuing hedges upon the adoption of IFRS 9. Accordingly, the Company does not expect a significant impact on the accounting for its hedging relationships.
Transition
Changes in accounting policies resulting from the adoption of IFRS 9 will generally be applied retrospectively, however the guidance allows certain exemptions on retrospective application. The Company has not made a decision yet in relation to the exemptions and elections that IFRS 9 allows.
IFRS 15 Revenue from Contracts with Customers
IFRS 15 specifies how and when revenue is recognized as well as prescribing more informative and relevant disclosures. The standard supersedes IAS 18 Revenue, IAS 11 Construction Contracts and a number of revenue related interpretations.
The new standard provides a single, principles-based five-step model to be applied to all contracts with customers. Furthermore, it provides new guidance on whether revenue should be recognized at a point in time or over time. The standard also introduces new guidance on costs of fulfilling and obtaining a contract, specifying the circumstances in which such costs should be capitalized. Costs that do not meet the criteria must be expensed when incurred.
Annual Report 2016 139
Group financial statements 10.10
The Company has completed an initial assessment of the potential impact of the adoption of IFRS 15 on its consolidated financial statements. The main aspects of the impact assessment are mentioned below:
General
Revenues of transactions that have separately identifiable components are currently recognized based on the relative fair value of the components and mainly occur in the segments Diagnosis & Treatment businesses and Connected Care & Health Informatics businesses. Under IFRS 15, the total consideration of a sale transaction will be allocated to the different elements based on their relative stand-alone selling prices. These prices will be determined based on the country list prices (including standard discounts where applicable) at which the Company sells the elements in separate transactions. If these country list prices are not available Philips will use either the adjusted market assessment approach or the expected costs plus a margin approach. The residual approach is only permissible in limited circumstances.
The Company performed an initial comparison of the fair value and the stand-alone selling prices of the identified components. Based on the initial assessment, these amounts are broadly the same, therefore the Company at this stage does not anticipate material differences in the revenue recognition under multiple component accounting.
Sale of goods
For the sale of products in the segments Personal Health businesses and Lighting, revenue is currently recognized when goods are delivered to the customer, which is the point in time at which the customer accepts the goods and the related risks and rewards of ownership are transferred. Revenue is only recognized at this moment after other requirements are also met, such as no continuing management involvement with goods, revenue and costs can be reliably measured and probable recovery of the considerations. Under IFRS 15, revenue will be recognized when a customer obtains control of the goods. The overall revenue recognition requirements are captured in the steps of the five-step model.
Based on the initial assessment, the Company did not identify material differences for the mentioned segments, between the transfer of control and the current transfer of risk and rewards. As such, at this stage the Company does not anticipate material differences in the timing of revenue recognition for the sale of products.
Rendering of services
Especially within the segments Diagnosis & Treatment businesses and Connected Care & Health Informatics businesses, the Company currently recognizes revenue from services when the inflow of the amounts involved are deemed probable and revenue and associated costs related to the stage of completion of a contract or transaction can be reliably measured. Furthermore, revenue from services is deferred and recognized in the Statement of income over the period during which the service is rendered. Under IFRS 15, revenue will be recognized when a customer obtains control of the services, which can be at a point in time or over time. For each performance obligation satisfied over time, revenue needs to be recognized by measuring the progress towards complete satisfaction of that performance obligation at the end of each reporting period.
Based on the initial assessment, the Company did not identify material differences between its current accounting treatment and IFRS 15, with respect to the timing of revenue recognition of service revenues.
Royalty income
Currently the Company recognizes revenue from intellectual property (IP) royalties, which is normally generated based upon a percentage of sales or a fixed amount per product sold, on an accrual basis based on actual or reliably estimated sales made by the licensees. Revenue generated from an agreement withlump-sum consideration is recognized on accrual basis based on the contractual terms and substance of the relevant agreement with a licensee. Under IFRS 15, revenues from the license of intellectual property should be recognized based on a right to access the intellectual property or a right to use the intellectual property approach. Under the first option revenue should be recognized over time while under the second option revenue should be recognized at a point in time.
Based on the initial assessment, the Company has identified a potential impact on revenues originating from its IP royalties (Segment HealthTech Other). The potential impact is mainly related to a change in timing of revenue recognition which, under IFRS 15, could be recognized in the Statement of income at an earlier point in time rather than over time under the current methodology.
The Company is currently performing a detailed analysis on a contract by contract basis, to assess the related impact.
Costs of obtaining a contract
Under IFRS 15, the incremental costs of obtaining a contract with a customer are recognized as an asset if the entity expects to recover them. Under the current guidance these costs are expensed when incurred.
The Company identified certain sales commissions that are typical for transactions in the segments Diagnosis & Treatment businesses and Connected Care & Health Informatics businesses to be incremental costs of obtaining a contract. The Company is currently assessing the exact amounts involved as well as the appropriate time in which capitalized contract costs should be amortized.
140 Annual Report 2016
Group financial statements 10.10
The Company has significant commission costs that are currently expensed as incurred, hence the IFRS 15 guidance means a change to current practice.
Transition
The Company plans to adopt IFRS 15 in its consolidated financial statements for the year ending December 31, 2018, using the modified retrospective transition approach upon initial adoption of IFRS 15, applying the standard only to contracts that are not completed as of the date of initial application. This would mean that comparative figures will not be restated and that additional clarifying disclosures will be presented in the Annual Report 2018.
IFRS 15 must be applied for periods beginning on or after January 1, 2018. It is endorsed by the EU (except for the Clarifications to IFRS 15 issued by the IASB in April 2016).
IFRS 16 Leases
For lessees, IFRS 16 requires most leases to be recognizedon-balance (under a single model), eliminating the distinction between operating and finance leases. Lessor accounting however remains largely unchanged and the distinction between operating and finance leases is retained. IFRS 16 supersedes IAS 17 Leases and related interpretations.
Under IFRS 16 a lessee recognizes aright-of-use asset and a lease liability. Theright-of-use asset is treated similarly to othernon-financial assets and is depreciated accordingly. The lease liability is initially measured at the present value of the lease payments payable over the lease term, discounted at the rate implicit in the lease if that can be readily determined. If the interest rate implicit in the lease cannot be readily determined then the incremental borrowing rate should be used for discounting. The liability accrues interest. As with current IAS 17, under IFRS 16 lessors classify leases as operating or finance in nature.
IFRS 16 must be adopted for periods beginning on or after January 1, 2019, with earlier adoption permitted if the abovementioned IFRS 15 has also been adopted. IFRS 16 is not yet endorsed by the EU.
The Company is currently assessing the impact of the new standard. So far, the most significant impact identified is that the Company will recognize assets and liabilities for its operating leases of real estate, while further assessment is ongoing for other operating leases. In this respect, the Company identified almost EUR 1 billion ofoff-balance operating lease obligations (undiscounted) per December 31, 2016. In addition, the nature of expenses related to those leases will now change as IFRS 16 replaces the straight-line operating lease expense with a depreciation charge forright-of-use assets and interest expense on lease liabilities. No significant impact is expected for the Company’s finance leases.
The Company has not yet determined whether to early adopt or not and which transition approach to apply, and has not yet decided whether it will use any of the optional exemptions.
Annual Report 2016 141
Group financial statements 10.10
Information by sectorsegment and main country
Philips Group
Information on income statementin millions of eurosEUR unless otherwise stated
2014 - 2016
|
| |||||||||||||||
| sales | sales including intercompany | depreciation and amortization1) | Adjusted income from operations1) | |||||||||||||
|
| |||||||||||||||
| 2016 | ||||||||||||||||
Personal Health | 7,099 | 7,119 | (385 | ) | 1,092 | |||||||||||
Diagnosis & Treatment | 6,686 | 6,741 | (229 | ) | 594 | |||||||||||
Connected Care & Health Informatics | 3,158 | 3,213 | (184 | ) | 322 | |||||||||||
HealthTech Other | 478 | 620 | (177 | ) | (120 | ) | ||||||||||
Lighting | 7,094 | 7,115 | (291 | ) | 542 | |||||||||||
Legacy Items | 1 | 6 | (1 | ) | (195 | ) | ||||||||||
Inter-segment eliminations | (298 | ) | ||||||||||||||
|
| |||||||||||||||
Philips Group | 24,516 | 24,516 | (1,267 | ) | 2,235 | |||||||||||
| 2015 | ||||||||||||||||
Personal Health | 6,751 | 6,764 | (375 | ) | 885 | |||||||||||
Diagnosis & Treatment | 6,484 | 6,531 | (249 | ) | 377 | |||||||||||
Connected Care & Health Informatics | 3,022 | 3,080 | (198 | ) | 227 | |||||||||||
HealthTech Other | 503 | 657 | (156 | ) | 64 | |||||||||||
Lighting | 7,438 | 7,481 | (309 | ) | 441 | |||||||||||
Legacy Items | 46 | 84 | 6 | (622 | ) | |||||||||||
Inter-segment eliminations | (353 | ) | ||||||||||||||
|
| |||||||||||||||
Philips Group | 24,244 | 24,244 | (1,281 | ) | 1,372 | |||||||||||
| 2014 | ||||||||||||||||
Personal Health | 5,948 | 5,958 | (334 | ) | 758 | |||||||||||
Diagnosis & Treatment | 5,284 | 5,304 | (177 | ) | 374 | |||||||||||
Connected Care & Health Informatics | 2,684 | 2,717 | (168 | ) | (106 | ) | ||||||||||
HealthTech Other | 487 | 627 | (123 | ) | 51 | |||||||||||
Lighting | 6,874 | 6,932 | (382 | ) | 133 | |||||||||||
Legacy Items | 114 | 154 | (3 | ) | (389 | ) | ||||||||||
Inter-segment eliminations | (301 | ) | ||||||||||||||
|
| |||||||||||||||
Philips Group | 21,391 | 21,391 | (1,187 | ) | 821 | |||||||||||
|
| |||||||||||||||
| 1) | Includes all depreciation and amortization. For the definition of Adjusted income from operations and for the amortization not included in Adjusted income from operations, refer to table below |
In 2016, Philips established two stand-alone companies focused on the HealthTech and Lighting opportunities. As part of this separation, Philips has changed the way it allocates resources and analyzes its performance based on a new segment structure. Accordingly, from 2016 the reportable segments for the purpose of the disclosures required by IFRS 8 Operating Segments are Personal Health businesses, Diagnosis & Treatment businesses, Connected Care & Health Informatics businesses and Lighting, each being responsible for the management of its business worldwide. Additionally, HealthTech Other and Legacy Items are included.
Information by sector and main countryThe internal management report provided to the chief operating decision maker (the Executive Committee of the Company) has had changes in 2016. Accordingly the disclosure in this note has been updated. The key segmental performance measure provided in the internal management report to the chief operating decision maker (the Executive Committee of the Company) is Adjusted income from operations1). Management believes it is the most relevant measure to evaluate the results of the segments.
SectorsThe Company uses the terms EBIT and Adjusted income from operations1) to evaluate the performance of the Philips Group and its operating segments. The term EBIT has the same meaning as Income from operations and the term EBITA1) has the same meaning as Adjusted income from operations1). Adjusted income from operations1) represents income from operations before amortization and impairment on intangible assets (excluding software and capitalized development expenses). Referencing Adjusted income from operations1) is considered appropriate as the Company uses it as one of its strategic drivers to increase profitability throughre-allocation of its resources towards opportunities offering more consistent and higher returns and it will make the underlying performance of our businesses more transparent as it will not be distorted by the unpredictable effects of future, unidentified acquisitions.
Adjusted income from operations1) is not a financial measure in accordance with IFRS. Below is a reconciliation of Adjusted income from operations1) to the most directly comparable IFRS measure, Net
| sales | sales including intercompany | research and development expenses | income from operations | income from operations as a % of sales | cash flow before financing activities | |||||||||||||||||||
| 2013 | ||||||||||||||||||||||||
Healthcare | 9,575 | 9,600 | (780 | ) | 1,315 | 13.7 | 1,292 | |||||||||||||||||
Consumer Lifestyle | 4,605 | 4,622 | (261 | ) | 429 | 9.3 | 472 | |||||||||||||||||
Lighting | 8,413 | 8,433 | (441 | ) | 489 | 5.8 | 478 | |||||||||||||||||
Innovation, Group & Services | 736 | 1,049 | (251 | ) | (242 | ) | — | (2,101 | ) | |||||||||||||||
Inter-sector eliminations | (375 | ) | ||||||||||||||||||||||
|
| |||||||||||||||||||||||
| 23,329 | 23,329 | (1,733 | ) | 1,991 | 8.5 | 141 | ||||||||||||||||||
| 2012 | ||||||||||||||||||||||||
Healthcare | 9,983 | 10,005 | (823 | ) | 1,026 | 10.3 | 1,298 | |||||||||||||||||
Consumer Lifestyle | 4,319 | 4,329 | (251 | ) | 400 | 9.3 | 422 | |||||||||||||||||
Lighting | 8,442 | 8,465 | (462 | ) | (66 | ) | (0.8 | ) | 279 | |||||||||||||||
Innovation, Group & Services | 713 | 984 | (295 | ) | (712 | ) | — | (842 | ) | |||||||||||||||
Inter-sector eliminations | (326 | ) | ||||||||||||||||||||||
|
| |||||||||||||||||||||||
| 23,457 | 23,457 | (1,831 | ) | 648 | 2.8 | 1,157 | ||||||||||||||||||
| 2011 | ||||||||||||||||||||||||
Healthcare | 8,852 | 8,866 | (754 | ) | 27 | 0.3 | 707 | |||||||||||||||||
Consumer Lifestyle | 3,771 | 3,777 | (249 | ) | 109 | 2.9 | (271 | ) | ||||||||||||||||
Lighting | 7,638 | 7,652 | (416 | ) | (408 | ) | (5.3 | ) | 208 | |||||||||||||||
Innovation, Group & Services | 731 | 984 | (186 | ) | (207 | ) | — | (1,159 | ) | |||||||||||||||
Inter-sector eliminations | (287 | ) | ||||||||||||||||||||||
|
| |||||||||||||||||||||||
| 20,992 | 20,992 | (1,605 | ) | (479 | ) | (2.3 | ) | (515 | ) | |||||||||||||||
| 1) | Non-GAAP financial measure. For the definition and reconciliation to the most directly comparable GAAP measure, refer to below. |
Our sectors
142 Annual Report 2016
Group financial statements 10.10
income, for the years indicated. Certain income and expense line items are organized basedmonitored on the nature of the productsa centralized basis and services. The four sectors comprise Healthcare, Consumer Lifestyle, Lighting and Innovation, Group & Services as shown in the table above. A short description of these sectors is as follows:
Healthcare: Consists of the following businesses - Imaging Systems, Home Healthcare Solutions, Patient Care & Clinical Informatics, and Customer Services.
Consumer Lifestyle: Consists of the following businesses - Personal Care, Domestic Appliances, and Health & Wellness.
Lighting: Consists of the following businesses - Light Sources & Electronics, Professional Lighting Solutions, Consumer Luminaires, Automotive Lighting, and Lumileds.
Innovation, Group & Services: Consists of group headquarters, as well as the overhead expenses of regional and country organizations. Also included are the net results of group innovation, intellectual property & services, the global service units and Philips’ pension and other postretirement benefit costs not directly allocated to the other sectors.segments, resulting in them being shown on a Philips Group level only.
Transactions between the sectorssegments mainly relaterelated to services provided by the sector Innovation, Group & ServicesHealthTech Other to the other sectors.segments. The pricing of such transactions iswas at cost or determined on an arm’s length basis.
Philips has no single external customer that represents 10% or more of sales.
Annual Report 2013 171Philips Group
11 Group financial statements 11.92014 - 11.9
Sectors
| total assets | net operating capital | total liabilities excl. debt | current accounts receivable, net | tangible and intangible assets | depreciation and amortization1) | capital expenditures | ||||||||||||||||||||||
| 2013 | ||||||||||||||||||||||||||||
Healthcare | 10,465 | 7,437 | 2,943 | 1,978 | 6,467 | (517 | ) | 132 | ||||||||||||||||||||
Consumer Lifestyle | 2,832 | 1,261 | 1,571 | 743 | 1,574 | (199 | ) | 135 | ||||||||||||||||||||
Lighting | 6,711 | 4,462 | 2,229 | 1,567 | 3,857 | (504 | ) | 223 | ||||||||||||||||||||
Innovation, Group & Services | 6,044 | (2,922 | ) | 4,340 | 132 | 648 | (129 | ) | 97 | |||||||||||||||||||
|
| |||||||||||||||||||||||||||
| 26,052 | 10,238 | 11,083 | 4,420 | 12,546 | (1,349 | ) | 587 | |||||||||||||||||||||
Assets classified as held for sale | 507 | 348 | ||||||||||||||||||||||||||
|
|
|
| |||||||||||||||||||||||||
| 26,559 | 11,431 | |||||||||||||||||||||||||||
| 2012 | ||||||||||||||||||||||||||||
Healthcare | 11,248 | 7,976 | 3,186 | 1,967 | 7,130 | (543 | ) | 135 | ||||||||||||||||||||
Consumer Lifestyle | 3,280 | 1,205 | 2,075 | 865 | 1,694 | (198 | ) | 128 | ||||||||||||||||||||
Lighting | 6,970 | 4,635 | 2,313 | 1,364 | 4,293 | (543 | ) | 290 | ||||||||||||||||||||
Innovation, Group & Services | 7,540 | (4,500 | ) | 5,761 | 138 | 521 | (114 | ) | 108 | |||||||||||||||||||
|
| |||||||||||||||||||||||||||
| 29,038 | 9,316 | 13,335 | 4,334 | 13,638 | (1,398 | ) | 661 | |||||||||||||||||||||
Assets classified as held for sale | 43 | 27 | ||||||||||||||||||||||||||
|
|
|
| |||||||||||||||||||||||||
| 29,081 | 13,362 | |||||||||||||||||||||||||||
| 2011 | ||||||||||||||||||||||||||||
Healthcare | 11,591 | 8,418 | 3,087 | 1,882 | 7,479 | (538 | ) | 153 | ||||||||||||||||||||
Consumer Lifestyle | 3,794 | 874 | 2,917 | 1,309 | 1,752 | (167 | ) | 130 | ||||||||||||||||||||
Lighting | 6,915 | 4,965 | 1,927 | 1,261 | 4,320 | (570 | ) | 279 | ||||||||||||||||||||
Innovation, Group & Services | 6,546 | (3,875 | ) | 5,183 | 132 | 475 | (125 | ) | 78 | |||||||||||||||||||
|
| |||||||||||||||||||||||||||
| 28,846 | 10,382 | 13,114 | 4,584 | 14,026 | (1,400 | ) | 640 | |||||||||||||||||||||
Assets classified as held for sale | 551 | 61 | ||||||||||||||||||||||||||
|
|
|
| |||||||||||||||||||||||||
| 29,397 | 13,175 | |||||||||||||||||||||||||||
|
| |||||||||||||||||||||||||||
| Philips Group | Personal Health | Diagnosis & Treatment | Connected Care & Health Informatics | HealthTech Other | Lighting | Legacy Items | ||||||||||||||||||||||
|
| |||||||||||||||||||||||||||
| 2016 | ||||||||||||||||||||||||||||
Net Income | 1,491 | |||||||||||||||||||||||||||
Discontinued operations, net of income taxes | (416 | ) | ||||||||||||||||||||||||||
Investments in associates, net of income taxes | (13 | ) | ||||||||||||||||||||||||||
Income tax expense | 327 | |||||||||||||||||||||||||||
Financial expenses | 569 | |||||||||||||||||||||||||||
Financial income | (76 | ) | ||||||||||||||||||||||||||
|
| |||||||||||||||||||||||||||
Income from operations (EBIT) | 1,882 | 953 | 546 | 275 | (129 | ) | 432 | (195 | ) | |||||||||||||||||||
Amortization of intangible assets1) | 350 | 139 | 48 | 47 | 9 | 108 | (1 | ) | ||||||||||||||||||||
Impairment of goodwill | 3 | — | — | — | — | 2 | 1 | |||||||||||||||||||||
|
| |||||||||||||||||||||||||||
Adjusted income from operations | 2,235 | 1,092 | 594 | 322 | (120 | ) | 542 | (195 | ) | |||||||||||||||||||
| 2015 | ||||||||||||||||||||||||||||
Net Income | 659 | |||||||||||||||||||||||||||
Discontinued operations, net of income taxes | (245 | ) | ||||||||||||||||||||||||||
Investments in associates, net of income taxes | (30 | ) | ||||||||||||||||||||||||||
Income tax expense | 239 | |||||||||||||||||||||||||||
Financial expenses | 467 | |||||||||||||||||||||||||||
Financial income | (98 | ) | ||||||||||||||||||||||||||
|
| |||||||||||||||||||||||||||
Income from operations (EBIT) | 992 | 736 | 322 | 173 | 49 | 334 | (622 | ) | ||||||||||||||||||||
Amortization of intangible assets1) | 380 | 149 | 55 | 54 | 15 | 107 | — | |||||||||||||||||||||
Impairment of goodwill | — | — | — | — | — | — | — | |||||||||||||||||||||
|
| |||||||||||||||||||||||||||
Adjusted income from operations | 1,372 | 885 | 377 | 227 | 64 | 441 | (622 | ) | ||||||||||||||||||||
| 2014 | ||||||||||||||||||||||||||||
Net Income | 411 | |||||||||||||||||||||||||||
Discontinued operations, net of income taxes | (190 | ) | ||||||||||||||||||||||||||
Investments in associates, net of income taxes | (62 | ) | ||||||||||||||||||||||||||
Income tax expense | 26 | |||||||||||||||||||||||||||
Financial expenses | 415 | |||||||||||||||||||||||||||
Financial income | (114 | ) | ||||||||||||||||||||||||||
|
| |||||||||||||||||||||||||||
Income from operations (EBIT) | 486 | 620 | 349 | (157 | ) | 37 | 25 | (388 | ) | |||||||||||||||||||
Amortization of intangible assets1) | 332 | 138 | 25 | 50 | 14 | 106 | (1 | ) | ||||||||||||||||||||
Impairment of goodwill | 3 | — | — | 1 | — | 2 | — | |||||||||||||||||||||
|
| |||||||||||||||||||||||||||
Adjusted income from operations | 821 | 758 | 374 | (106 | ) | 51 | 133 | (389 | ) | |||||||||||||||||||
|
| |||||||||||||||||||||||||||
| 1) |
|
Goodwill assigned to sectors
| carrying value at January 1 | reclassification | acquisitions | purchase price allocation adjustment | impairments | divestments and transfers to assets classified as held for sale | translation differences | carrying value at December 31 | |||||||||||||||||||||||||
| 2013 | ||||||||||||||||||||||||||||||||
Healthcare | 4,573 | — | 3 | 11 | — | (40 | ) | (272 | ) | 4,275 | ||||||||||||||||||||||
Consumer Lifestyle | 668 | — | — | — | — | (18 | ) | (18 | ) | 632 | ||||||||||||||||||||||
Lighting | 1,707 | (8 | ) | 1 | (15 | ) | (26 | ) | — | (73 | ) | 1,586 | ||||||||||||||||||||
Innovation, Group & Services | — | 8 | — | — | — | 3 | — | 11 | ||||||||||||||||||||||||
|
| |||||||||||||||||||||||||||||||
| 6,948 | — | 4 | (4 | ) | (26 | ) | (55 | ) | (363 | ) | 6,504 | |||||||||||||||||||||
| 2012 | ||||||||||||||||||||||||||||||||
Healthcare | 4,703 | — | — | (1 | ) | — | — | (129 | ) | 4,573 | ||||||||||||||||||||||
Consumer Lifestyle | 674 | — | — | (1 | ) | — | (6 | ) | 1 | 668 | ||||||||||||||||||||||
Lighting | 1,639 | — | 100 | — | — | — | (32 | ) | 1,707 | |||||||||||||||||||||||
Innovation, Group & Services | — | — | — | — | — | — | — | |||||||||||||||||||||||||
|
| |||||||||||||||||||||||||||||||
| 7,016 | — | 100 | (2 | ) | — | (6 | ) | (160 | ) | 6,948 | ||||||||||||||||||||||
172 Annual Report 20132016 143
11 Group financial statements 11.9 - 11.910.10
Philips Group
Main countries in millions of EUR
2014 - 2016
| sales1) | tangible and intangible assets |
|
| |||||||||||||
| 2013 | ||||||||||||||||
| sales1) | tangible and intangible assets2) | |||||||||||||||
|
| |||||||||||||||
| 2016 | ||||||||||||||||
Netherlands | 688 | 1,007 | ||||||||||||||
United States | 7,713 | 9,425 | ||||||||||||||
China | 2,811 | 1,167 | ||||||||||||||
Germany | 1,372 | 201 | ||||||||||||||
Japan | 1,134 | 492 | ||||||||||||||
France | 833 | 45 | ||||||||||||||
India | 804 | 121 | ||||||||||||||
Other countries | 9,161 | 2,147 | ||||||||||||||
|
| |||||||||||||||
Total main countries | 24,516 | 14,605 | ||||||||||||||
| 2015 | ||||||||||||||||
Netherlands | 639 | 970 | ||||||||||||||
United States | 7,522 | 9,291 | ||||||||||||||
China | 2,774 | 1,194 | ||||||||||||||
Germany | 1,357 | 170 | ||||||||||||||
Japan | 992 | 455 | ||||||||||||||
France | 806 | 48 | ||||||||||||||
India | 845 | 134 | ||||||||||||||
Other countries | 9,309 | 2,276 | ||||||||||||||
|
| |||||||||||||||
Total main countries | 24,244 | 14,538 | ||||||||||||||
| 2014 | ||||||||||||||||
Netherlands | 656 | 915 | 594 | 937 | ||||||||||||
United States | 6,442 | 7,384 | 6,160 | 7,649 | ||||||||||||
China | 2,942 | 1,057 | 2,362 | 1,135 | ||||||||||||
Germany | 1,355 | 288 | 1,351 | 153 | ||||||||||||
Japan | 1,006 | 401 | 908 | 379 | ||||||||||||
France | 915 | 80 | 839 | 52 | ||||||||||||
United Kingdom | 692 | 573 | 722 | 594 | ||||||||||||
Other countries | 9,321 | 1,848 | 8,455 | 1,722 | ||||||||||||
|
|
|
| |||||||||||||
Total main countries | 21,391 | 12,621 | ||||||||||||||
| 23,329 | 12,546 |
|
| |||||||||||||
Assets classified as held for sale | 62 | |||||||||||||||
| ||||||||||||||||
| 12,608 | ||||||||||||||||
| 20122) | ||||||||||||||||
Netherlands | 627 | 886 | ||||||||||||||
United States | 6,824 | 8,007 | ||||||||||||||
China | 2,585 | 1,114 | ||||||||||||||
Germany | 1,323 | 271 | ||||||||||||||
Japan | 1,204 | 537 | ||||||||||||||
France | 941 | 90 | ||||||||||||||
United Kingdom | 676 | 628 | ||||||||||||||
Other countries | 9,277 | 2,105 | ||||||||||||||
|
| |||||||||||||||
| 23,457 | 13,638 | |||||||||||||||
Assets classified as held for sale | 6 | |||||||||||||||
| ||||||||||||||||
| 13,644 | ||||||||||||||||
| 20112) | ||||||||||||||||
Netherlands | 636 | 908 | ||||||||||||||
United States | 6,159 | 8,473 | ||||||||||||||
China | 1,978 | 1,126 | ||||||||||||||
Germany | 1,272 | 252 | ||||||||||||||
Japan | 908 | 618 | ||||||||||||||
France | 892 | 97 | ||||||||||||||
United Kingdom | 579 | 615 | ||||||||||||||
Other countries | 8,568 | 1,937 | ||||||||||||||
|
| |||||||||||||||
| 20,992 | 14,026 | |||||||||||||||
Assets classified as held for sale | 287 | |||||||||||||||
| ||||||||||||||||
| 14,313 | ||||||||||||||||
| 1) | The sales are reported based on country of |
| 2) |
|
Discontinued operations and other assets classified as held for sale
Discontinued operations included in the Consolidated statements of income and cash flows consist of the combined Lumileds and Automotive businesses, the Audio, Video, Multimedia & Accessories business and certain divestments formerly reported as discontinued operations.
Discontinued operations: Combined Lumileds and Automotive businesses
The combined businesses of Lumileds and Automotive were reported as discontinued operations in the Consolidated statements of income and Consolidated statements of cash flows, with the related assets and liabilities as per the end of November 2014 included as Assets classified as held for sale and Liabilities directly associated with assets held for sale in the Consolidated balance sheet.
In January 2016, Philips announced that the transaction with Go Scale Capital has been terminated despite efforts to mitigate the concerns of the Committee on Foreign Investment in the United States (‘CFIUS’).
Philips announced December 12, 2016 that it has signed an agreement to sell an 80.1% interest in Lumileds, a leading supplier of LED components and automotive lighting, to certain funds managed by affiliates of Apollo Global Management, LLC (NYSE: APO). Philips will retain the remaining 19.9% interest in Lumileds.
The following table summarizes the results of the combined businesses of Lumileds and Automotive included in the Consolidated statements of income as discontinued operations.
144 Annual Report 2016
 Group financial statements 10.10
Philips Group
Results of combined Lumileds and Automotive Lighting businessesin millions of EUR
2014 - 2016
|
| |||||||||||
| 2014 | 2015 | 2016 | ||||||||||
|
| |||||||||||
Sales | 1,416 | 1,619 | 1,711 | |||||||||
Costs and expenses | (1,202 | ) | (1,320 | ) | (1,376 | ) | ||||||
|
| |||||||||||
Income before taxes | 214 | 299 | 335 | |||||||||
Income tax expense | (73 | ) | (53 | ) | (53 | ) | ||||||
|
| |||||||||||
Results from discontinued operations | 141 | 246 | 282 | |||||||||
|
| |||||||||||
Upon disposal, the associated currency translation differences, part of Shareholders’ equity, will be recognized in the Consolidated statement of income. At December 31, 2016, the estimated release amounts to a EUR 63 million gain.
The following table presents the assets and liabilities of the combined Lumileds and Automotive business, as Assets classified as held for sale and Liabilities directly associated with assets classified as held for sale in the Consolidated balance sheet as from 2015.
Philips Group
Assets and liabilities of combined Lumileds and Automotive Lighting businessesin millions of EUR
2015 - 2016
|
| |||||||
| 2015 | 2016 | |||||||
|
| |||||||
Property, plant and equipment | 762 | 909 | ||||||
Intangible assets including goodwill | 379 | 450 | ||||||
Inventories | 285 | 289 | ||||||
Accounts receivable | 314 | 323 | ||||||
Other assets | 34 | 69 | ||||||
|
| |||||||
Assets classified as held for sale | 1,774 | 2,040 | ||||||
Accounts payable | (192 | ) | (183 | ) | ||||
Provisions | (39 | ) | (56 | ) | ||||
Other liabilities | (170 | ) | (269 | ) | ||||
|
| |||||||
Liabilities directly associated with assets held for sale | (401 | ) | (508 | ) | ||||
|
| |||||||
Discontinued operations: Other
Certain results of other divestments, reported as discontinued operations are included, with a net gain of EUR 134 million in 2016 (2015: a net loss of EUR 1 million; 2014: a net gain of EUR 49 million).
The main result in 2016 related to the court decision in favor of Philips in an arbitration case against Funai Electric Co., Ltd. Philips started the arbitration after it terminated the agreement to transfer the Audio, Video, Media & Accessories business to Funai following a breach of contract by Funai. As a consequence the court ordered Funai to pay EUR 144 million, which includes disbursements and interest, as compensation for damages. The amount was received in Q2 2016.
Other assets classified as held for sale
Assets and liabilities directly associated with assets held for sale relate to property, plant and equipment for an amount of EUR 87 million (December 31, 2015: EUR 1 million) and businesses’ net assets classified as held for sale amounted to EUR 36 million at December 31, 2016 (December 31, 2015 EUR 28 million).
In 2016 assets held for sale of property, plant and equipment had an impairment of EUR 25 million and businesses’ net assets classified as held for sale had a goodwill impairment of EUR 2 million.
In 2016, divested property, plant and equipment assets held for sale amounted to EUR 7 million, with proceeds of EUR 19 million. Businesses divested net assets classified as held for sale amounted to EUR 41 million. The businesses divested had proceeds of EUR 44 million.
In 2015, divested property, plant and equipment assets held for sale amounted to EUR 43 million, with proceeds of EUR 88 million. Othernon-current financial assets divested classified as held for sale amounted to EUR 20 million, with proceeds of EUR 20 million. Businesses divested net assets classified as held for sale amounted to EUR 9 million. The businesses divested had proceeds of EUR 59 million.
2016
Acquisitions
Philips completed two acquisitions in 2016. These acquisitions involved an aggregated net cash outflow of EUR 168 million.
Divestments
Philips completed six divestments during 2016. The six divestments involved an aggregated cash consideration of EUR 43 million.
2015
Acquisitions
Philips completed four acquisitions in 2015. These acquisitions involved an aggregated net cash outflow of EUR 1,116 million, with Volcano Corporation (Volcano) being the most notable acquisition.
On February 17, 2015, Philips completed the acquisition of Volcano for a total cash consideration of EUR 1,250 million. This amount involved the purchase price of shares (EUR 822 million), the payoff of certain debt (EUR 405 million) and the settlement of outstanding stock options (EUR 23 million). The overall cash position of Volcano on the transaction date was EUR 158 million, resulting in a net cash outflow related to this acquisition of EUR 1,092 million.
Volcano is aUS-based global leader in catheter-based imaging and measurement solutions for cardiovascular applications and is very complementary to the Philips vision, strategy, and portfolio in image-guided therapy.
Transaction-related costs that were recognized in General and administrative expenses amounted to EUR 15 million. As of February 17, 2015, Volcano was 100% consolidated as part of the Diagnosis & Treatment
Annual Report 2013 1732016 145
11.9 - 11.910.10
businesses segment. The condensed balance sheet of Volcano, immediately before and after the acquisition was as follows:
Volcano
Balance sheetin millions of EUR
2015
|
| |||||||
| before acquisition date | after acquisition date | |||||||
|
| |||||||
Goodwill | 133 | 627 | ||||||
Other intangible assets | 87 | 320 | ||||||
Property, plant and equipment | 105 | 105 | ||||||
Other assets | 80 | 50 | ||||||
Other liabilities | (41 | ) | (142 | ) | ||||
Working Capital | 112 | 156 | ||||||
Cash | 158 | 158 | ||||||
|
| |||||||
Total assets and liabilities | 634 | 1,274 | ||||||
Group Equity | (219 | ) | (1,250 | ) | ||||
Loans | (415 | ) | (24 | ) | ||||
|
| |||||||
Financed by | (634 | ) | (1,274 | ) | ||||
|
| |||||||
The goodwill was primarily related to synergies expected to be achieved from integrating Volcano within the Diagnosis & Treatment businesses segment. The goodwill was nottax-deductible. Other intangible assets were comprised of the following:
Volcano
Other intangible assetsin millions of EUR
2015
|
| |||||||
| amount | amortization period in years | |||||||
|
| |||||||
Installed base | 62 | 6 | ||||||
Developed technology - Systems | 155 | 15 | ||||||
Developed technology - Disposables | 58 | 15 | ||||||
Developed technology - Peripheral Therapeutics | 26 | 15 | ||||||
IPR&D | 6 | n/a | ||||||
Trade names | 13 | 10 | ||||||
|
| |||||||
Total other intangible assets | 320 | |||||||
|
| |||||||
For the period from February 17, 2015, Volcano contributed sales of EUR 286 million and a loss from operations of EUR 113 million, which includes acquisition related costs of EUR 103 million.
Divestments
Philips completed seven divestments during 2015, with the sale of the 20% interest in Assembléon Holding B.V. and the sale of the Remote Control activities being the most notable divestments. The seven divestments involved an aggregated cash consideration of EUR 59 million.
In this section we discuss the nature of, and risks associated with, the Company’s interests in its consolidated entities and associates, and the effects of those interests on the Company’s financial position and financial performance.
IPO Philips Lighting
In May and June 2016, the Company sold 28.775% of its interest in Philips Lighting (a wholly owned subsidiary of the Company) through an IPO (involving 28.75% of the shares) and transactions with the CEO and CFO of Philips Lighting (involving 0.025% of the shares), reducing its remaining interest in Philips Lighting to 71.225%. This transaction involved cash proceeds of EUR 863 million and EUR 38 million transaction costs spend. This partial divestment transaction did not impact the profit and loss account of the Company, as Philips Lighting continues to be fully consolidated.
The transactions had a positive impact on Shareholders’ equity of the Company of EUR 109 million. This amount is based on:
the difference between the proceeds and the carrying value of the 28.775% stake in Philips Lighting (gain of EUR 163 million);
costs related to the IPO which were directly recognized in Shareholders’ equity (loss of EUR 38 million) and;
certain reallocations of Other comprehensive income items toNon-controlling interests (loss of EUR 16 million).
As a result of the IPO,Non-controlling interests increased by EUR 716 million. Please refer also tonote 17, Equity. This amount is based on:
the carrying value of the 28.775% stake in Philips Lighting (increase of EUR 700 million) and;
certain reallocations of Other comprehensive income items from Shareholders’ equity (increase of EUR 16 million).
Prior to the IPO, the Company completed an internal legal restructuring whereby all Lighting activities were concentrated in Philips Lighting. This legal restructuring resulted in an increase of consolidated legal entities from 450 as of December 31, 2015 to 465 as of December 31, 2016.
Sales and Income from operations of Philips Lighting are reflected in the Lighting segment information included innote 2, Information by segment and main country. Certain differences exist between the Lighting segment information reported by the Company and Philips Lighting’s stand-alone Annual Report published on February 21, 2017. Differences in income from operations mainly relate to separation costs (EUR 62 million) that Philips Lighting recognizes in Income from operations, whereas these costs are reflected in the segment Legacy Items by Royal Philips.
Group companies
Set out below is a list of material subsidiaries as per December, 31 2016 representing greater than 5% of either the consolidated group sales, income from operations or net income (before any intra-group eliminations). All of the entities are fully consolidated in
146 Annual Report 2016
Group financial statements 10.10
the group accounts of the Company. Entities that are 100% owned by Philips Lighting are consequently 71.225% owned by Koninklijke Philips N.V. The remaining entities are 100% owned by the Company.
It is noted that Philips reduced its interest in Philips Lighting to approximately 55.180% as per February 8, 2017. Please refer tonote 31, Subsequent events
Philips Group
Interests in group companies in alphabetical order
2016
Legal entity name | Principal country of business | |
Invivo Corporation | United States | |
Lifeline Systems Company | United States | |
Lumileds International B.V. | Netherlands | |
Lumileds LLC | United States | |
Lumileds Malaysia Sdn. Bhd. | Malaysia | |
Philips (China) Investment Company, Ltd. | China | |
Philips Consumer Lifestyle B.V. | Netherlands | |
Philips Electronics Hong Kong Limited | Hong Kong | |
Philips Electronics Nederland B.V. | Netherlands | |
Philips Electronics North America Corporation | United States | |
Philips GmbH | Germany | |
Philips Holding USA Inc. | United States | |
Philips International B.V. | Netherlands | |
Philips Lighting B.V.1) | Netherlands | |
Philips Lighting Holding B.V.1) | Netherlands | |
Philips Lighting Hong Kong Limited1) | Hong Kong | |
Philips Lighting North America Corporation1) | United States | |
Philips Medical Systems (Cleveland), Inc. | United States | |
Philips Medical Systems Nederland B.V. | Netherlands | |
Philips Medizin Systeme Böblingen GmbH | Germany | |
Philips Oral Healthcare, LLC | United States | |
Philips Ultrasound, Inc. | United States | |
RIC Investments, LLC | United States | |
The Genlyte Group Incorporated1) | United States | |
Volcano Corporation | United States | |
| 1) | Owned by Philips Lighting |
Information related toNon-controlling interests (NCI)
In total, five consolidated subsidiaries are not wholly owned by the Company. Group companies that have significantNon-controlling interests are Philips Lighting (NCI 28.775%) and General Lighting Company (GLC, NCI 49%). The following is combined summarized financial information for Philips Lighting and GLC. The information is before inter-company eliminations with other companies in the Group.
Philips Group
Summarized financial information for Philips Lighting and GLC
in millions of EUR
2016
|
| |||||||
| 2016 | ||||||||
|
| |||||||
| Philips Lighting | GLC | |||||||
|
| |||||||
Sales to thirds | 7,115 | 203 | ||||||
Net income | 185 | (11 | ) | |||||
Current assets | 3,660 | 183 | ||||||
Non-current assets | 3,795 | 239 | ||||||
Current liabilities | (2,357 | ) | (126 | ) | ||||
Non-current liabilities | (2,290 | ) | (206 | ) | ||||
|
| |||||||
Net assets | 2,808 | 90 | ||||||
Cashflow from operating activity | 505 | 22 | ||||||
Cashflow from investment activity | (62 | ) | (5 | ) | ||||
Cashflow from financing activity | 506 | (16 | ) | |||||
|
| |||||||
Net increase in cash and cash equivalents | 949 | 1 | ||||||
|
| |||||||
Investments in associates
Philips has investments in a number of associates, none of them are regarded as individually material.
The changes during 2016 are as follows:
Philips Group
Investments in associatesin millions of EUR
2016
| Total investments | ||||
Balance as of January 1, 2016 | 181 | |||
Changes: | ||||
Acquisitions/additions | 34 | |||
Share in income | 19 | |||
Share in other comprehensive income | (1 | ) | ||
Dividends declared | (48 | ) | ||
Other | 5 | |||
Balance as of December 31, 2016 | 190 | |||
Involvement with unconsolidated structured entities
Philips founded three Philips Medical Capital (PMC) entities, in the United States, France and Germany, in which Philips holds a minority interest. Philips Medical Capital, LLC in the United States is the most significant entity. PMC entities provide healthcare equipment financing and leasing services to Philips customers for diagnostic imaging equipment, patient monitoring equipment, and clinical IT systems.
The Company concluded that it does not control, and therefore should not consolidate the PMC entities. In the United States, PMC operates as a subsidiary of De Lage Landen Financial Services, Inc. The same set up and treatment is applied to the PMC entities in the other countries, with other majority shareholders. Operating agreements are in place for all PMC entities, whereby acceptance of sales and financing transactions resides with the respective majority shareholder. After acceptance of a transaction by PMC, Philips transfers significant risk and rewards and does not retain any obligations towards PMC or its customers.
Annual Report 2016 147
Group financial statements 10.10
At December 31, 2016, Philips’ stake in Philips Medical Capital, LLC amounted to EUR 25 million (December 31, 2015: EUR 30 million). Philips sold equipment and non-recourse third-party receivables to PMC US amounting to EUR 250 million in 2016 (2015: EUR 255 million; 2014: EUR 220 million).
For information related to Sales and tangible and intangible assets on a geographicalsegment and sectorgeographical basis, seenote 2, Information by sectorsegment and main country.country.
Philips Group
Sales and costs by nature in millions of EUR
2014 - 2016
|
| |||||||||||||||||||||||
| 2014 | 2015 | 2016 | ||||||||||||||||||||||
| 2011 | 2012 | 2013 |
|
| ||||||||||||||||||||
Sales | 20,992 | 23,457 | 23,329 | 21,391 | 24,244 | 24,516 | ||||||||||||||||||
Costs of materials used | (7,119 | ) | (8,177 | ) | (7,895 | ) | (7,296 | ) | (8,446 | ) | (8,045 | ) | ||||||||||||
Employee benefit expenses | (5,697 | ) | (6,694 | ) | (6,129 | ) | (6,080 | ) | (7,107 | ) | (7,005 | ) | ||||||||||||
Depreciation and amortization | (1,400 | ) | (1,398 | ) | (1,349 | ) | (1,187 | ) | (1,281 | ) | (1,267 | ) | ||||||||||||
Shipping and handling | (776 | ) | (788 | ) | (809 | ) | (741 | ) | (806 | ) | (772 | ) | ||||||||||||
Advertising and promotion | (865 | ) | (841 | ) | (882 | ) | (913 | ) | (1,000 | ) | (1,085 | ) | ||||||||||||
Lease expense | (314 | ) | (364 | ) | (347 | )1) | ||||||||||||||||||
Other operational costs | (3,993 | ) | (4,214 | ) | (3,987 | ) | ||||||||||||||||||
Lease expense1) | (318 | ) | (324 | ) | (324 | ) | ||||||||||||||||||
Other operational costs2) | (4,156 | ) | (4,375 | ) | (4,160 | ) | ||||||||||||||||||
Impairment of goodwill | (1,355 | ) | — | (28 | ) | (3 | ) | 0 | (3 | ) | ||||||||||||||
Other business income and expenses | 48 | (333 | ) | 88 | ||||||||||||||||||||
Other business income (expenses) | (211 | ) | 87 | 27 | ||||||||||||||||||||
|
|
|
| |||||||||||||||||||||
Income from operations | (479 | ) | 648 | 1,991 | 486 | 992 | 1,882 | |||||||||||||||||
|
| |||||||||||||||||||||||
| 1) | Lease expense includes EUR |
| 2) | Other operational costs contain items which are dissimilar in nature and individually insignificant in amount to disclose separately. These costs contain among others expenses for outsourcing services, mainly in IT and HR, 3rd party workers, consultants, warranty, patents, costs for travelling, external legal services and EUR 95 million government grants recognized in 2016 (2015: EUR 66 million, 2014: EUR 45 million). The grants mainly relate to research and development activities and business development. |
Sales composition
| 2011 | 2012 | 2013 | ||||||||||
Goods | 17,636 | 19,918 | 19,716 | |||||||||
Services | 2,926 | 3,130 | 3,139 | |||||||||
Royalties | 430 | 409 | 474 | |||||||||
|
| |||||||||||
| 20,992 | 23,457 | 23,329 | ||||||||||
Philips has no single external customer that represents 10% or moreGroup
Sales composition in millions of revenues.EUR
2014 - 2016
|
| |||||||||||
| 2014 | 2015 | 2016 | ||||||||||
|
| |||||||||||
Goods | 17,972 | 20,659 | 20,740 | |||||||||
Services | 2,948 | 3,080 | 3,263 | |||||||||
Royalties | 471 | 505 | 513 | |||||||||
|
| |||||||||||
Sales | 21,391 | 24,244 | 24,516 | |||||||||
|
| |||||||||||
Costs of materials used
Cost of materials used represents the inventory recognized in cost of sales.
Employee benefit expenses
Philips Group
| 2011 | 2012 | 2013 | ||||
Salaries and wages | 4,668 | 5,499 | 4,983 | |||
Post-employment benefits costs | 272 | 344 | 362 | |||
Other social security and similar charges: | ||||||
- Required by law | 595 | 678 | 658 | |||
- Voluntary | 162 | 173 | 126 | |||
| ||||||
| 5,697 | 6,694 | 6,129 | ||||
Employee benefit expenses in millions of EUR
2014 - 2016
|
| |||||||||||
| 2014 | 2015 | 2016 | ||||||||||
|
| |||||||||||
Salaries and wages1) | 5,018 | 5,533 | 5,832 | |||||||||
Post-employment benefits costs | 326 | 780 | 369 | |||||||||
Other social security and similar charges: | ||||||||||||
- Required by law | 623 | 664 | 676 | |||||||||
- Voluntary | 113 | 130 | 128 | |||||||||
|
| |||||||||||
Employee benefit expenses | 6,080 | 7,107 | 7,005 | |||||||||
|
| |||||||||||
| 1) | Salaries and wages includes Share-based compensation expenses. |
The employee benefit expenses relate to employees who are working on the payroll of Philips, payroll, both with permanent and temporary contracts.
For further information on pensionpost-employment benefit costs, seenote 30,20, Post-employment benefits.benefits.
DetailsFor details on the remuneration of the members of the Board of Management and the Supervisory Board, seenote 33,28, Information on remuneration.remuneration.
Employees
The average number of employees by category is summarized as follows (in FTEs):follows:
Philips Group
Employeesin FTEs
2014 - 2016
|
| |||||||||||||||||
| 2014 | 2015 | 2016 | ||||||||||||||||
| 2011 | 2012 | 2013 |
|
| ||||||||||||||
Production | 57,011 | 58,031 | 58,116 | 48,110 | 46,869 | 46,114 | ||||||||||||
Research and development | 12,539 | 12,974 | 12,072 | 11,714 | 11,462 | 11,380 | ||||||||||||
Other | 31,789 | 32,730 | 32,006 | 32,684 | 34,011 | 34,841 | ||||||||||||
|
|
| ||||||||||||||||
Employees | 101,339 | 103,735 | 102,194 | 92,508 | 92,342 | 92,335 | ||||||||||||
3rd party workers | 16,092 | 15,498 | 13,171 | 12,562 | 13,314 | 12,045 | ||||||||||||
|
|
| ||||||||||||||||
Continuing operations | 117,431 | 119,233 | 115,365 | 105,070 | 105,656 | 104,380 | ||||||||||||
Discontinued operations | 6,100 | 2,901 | 1,997 | 9,222 | 8,556 | 9,192 | ||||||||||||
|
| |||||||||||||||||
Employees consist of those persons working on the payroll of Philips and whose costs are reflected in the Employee benefit expenses table. 3rd party workers consist of personnel hired on a per periodper-period basis, via extenalexternal companies.
Philips Group
Employees per geographical locationin FTEs
2014 - 2016
|
| |||||||||||
| 2014 | 2015 | 2016 | ||||||||||
|
| |||||||||||
Netherlands | 14,042 | 14,020 | 14,569 | |||||||||
Other countries | 91,028 | 91,636 | 89,811 | |||||||||
|
| |||||||||||
Continuing operations | 105,070 | 105,656 | 104,380 | |||||||||
Discontinued operations | 9,222 | 8,556 | 9,192 | |||||||||
|
| |||||||||||
Philips Group | 114,292 | 114,212 | 113,572 | |||||||||
|
| |||||||||||
148 Annual Report 2016
Group financial statements 10.10
Depreciation and amortization
Depreciation of property, plant and equipment and amortization of intangiblesintangible assets, including impairments, are as follows:
Philips Group
| 2011 | 2012 | 2013 | ||||
Depreciation of property, plant and equipment | 617 | 678 | 632 | |||
Amortization of internal-use software | 55 | 45 | 39 | |||
Amortization of other intangible assets | 559 | 458 | 432 | |||
Amortization of development costs | 169 | 217 | 246 | |||
| ||||||
| 1,400 | 1,398 | 1,349 | ||||
Depreciation and amortization1)in millions of EUR
2014 - 2016
|
| |||||||||||
| 2014 | 2015 | 2016 | ||||||||||
|
| |||||||||||
Depreciation of property, plant and equipment | 592 | 582 | 606 | |||||||||
Amortization of software | 32 | 48 | 56 | |||||||||
Amortization of other intangible assets | 332 | 380 | 352 | |||||||||
Amortization of development costs | 231 | 271 | 253 | |||||||||
|
| |||||||||||
Depreciation and amortization | 1,187 | 1,281 | 1,267 | |||||||||
|
| |||||||||||
| 1) | Includes impairments |
Depreciation of property, plant and equipment is primarily included in cost of sales. Amortization of the categories of other intangible assets are reported in selling expenses for brand names and customer relationships and are reported in cost of sales for technology based and other intangible assets. Amortization (including impairment) of development cost is included in research and development expenses.
Shipping and handling
Shipping and handling costs are included in cost of sales and selling expenses.expenses insection 10.5, Consolidated statements of income, of this report. Further information on when costs are to be reported to cost of sales or selling expenses can be found innote 1, Significant accounting policies.
Advertising and promotion
Advertising and promotion costs are included in selling expenses.
174 Annual Report 2013
expenses in11 Group financialsection 10.5, Consolidated statements 11.9 - 11.9of income
, of this report.
Audit fees
The table below shows the fees attributable to the fiscal years 2014, 2015 and 2016 for services rendered by the respective Group auditors.
Philips Group
Fees KPMGin millions of EUR
2014 - 2016
|
| |||||||||||||||||||||||
| 2014 | 2015 | 2016 | ||||||||||||||||||||||
| 2011 | 2012 | 2013 |
|
| ||||||||||||||||||||
Audit fees | 15.6 | 14.7 | 15.6 | 14.9 | 15.3 | 16.8 | ||||||||||||||||||
- consolidated financial statements | 10.1 | 9.7 | 10.1 | 9.6 | 9.8 | 12.1 | ||||||||||||||||||
- statutory financial statements | 5.5 | 5.0 | 5.5 | 5.3 | 5.5 | 4.7 | ||||||||||||||||||
Audit-related fees1) | 2.4 | 5.6 | 2.2 | |||||||||||||||||||||
Audit-related fees | 3.9 | 4.9 | 2.3 | |||||||||||||||||||||
- acquisitions and divestments | 0.1 | 2.9 | 0.4 | 2.4 | 3.6 | 0.9 | ||||||||||||||||||
- sustainability assurance | 0.5 | 0.8 | 0.7 | 0.6 | 0.6 | 0.7 | ||||||||||||||||||
- other | 1.8 | 1.9 | 1.1 | 0.9 | 0.7 | 0.7 | ||||||||||||||||||
Tax fees2) | 0.9 | 1.3 | 0.8 | |||||||||||||||||||||
Tax fees | 0.2 | 1.1 | 0.0 | |||||||||||||||||||||
- tax compliance services | 0.9 | 1.3 | 0.8 | 0.2 | 1.1 | 0.0 | ||||||||||||||||||
Other fees3) | 0.5 | 0.7 | 1.3 | |||||||||||||||||||||
- royalty investigation | 0.4 | 0.1 | 0.0 | |||||||||||||||||||||
All other fees | 0.0 | 0.0 | 0.0 | |||||||||||||||||||||
- other | 0.1 | 0.6 | 1.3 | 0.0 | 0.0 | 0.0 | ||||||||||||||||||
|
|
|
| |||||||||||||||||||||
Total | 19.4 | 22.3 | 19.9 | |||||||||||||||||||||
Fees1) | 19.0 | 21.3 | 19.1 | |||||||||||||||||||||
|
| |||||||||||||||||||||||
| 1) |
|
|
|
This table ‘Fees KPMG’ forms an integral part of the Company Financial Statements, please refer to note K, Audit fees.
Impairment of goodwill
In 2013,2016, goodwill impairment charges amountsamounted to EUR 28 million, including EUR 26 million as result of reduced growth expectations in Consumer Luminaires.
In 2011, goodwill was impaired in the Healthcare sector for an amount of EUR 8243 million and mainly related to divested businesses in the Lighting sector for an amount ofLighting. In 2015 and 2014, goodwill impairment charges amounted to EUR 531 million.
For furthernil million and EUR 3 million, respectively. Further information on impairment of goodwill see movement can be found innote 11, Goodwill.Goodwill.
Other business income (expenses)
Other business income (expenses) consists of the following:
Philips Group
| 2011 | 2012 | 2013 | ||||||||||
Result on disposal of businesses: | ||||||||||||
- income | 27 | 9 | 50 | |||||||||
- expense | (26 | ) | (84 | ) | (1 | ) | ||||||
Result on disposal of fixed assets: | ||||||||||||
- income | 47 | 224 | 19 | |||||||||
- expense | (11 | ) | (9 | ) | (13 | ) | ||||||
Result on other remaining businesses: | ||||||||||||
- income | 50 | 42 | 54 | |||||||||
- expense | (39 | ) | (515 | ) | (21 | ) | ||||||
|
| |||||||||||
| 48 | (333 | ) | 88 | |||||||||
Total other business income | 124 | 275 | 123 | |||||||||
Total other business expense | (76 | ) | (608 | ) | (35 | ) | ||||||
Other business income (expenses)in millions of EUR
2014 - 2016
|
| |||||||||||
| 2014 | 2015 | 2016 | ||||||||||
|
| |||||||||||
Result on disposal of businesses: | ||||||||||||
- income | 7 | 4 | 4 | |||||||||
- expense | (2 | ) | (5 | ) | (7 | ) | ||||||
Result on disposal of fixed assets: | ||||||||||||
- income | 18 | 79 | 21 | |||||||||
- expense | (1 | ) | (9 | ) | (6 | ) | ||||||
Result on other remaining business: | ||||||||||||
- income | 38 | 54 | 43 | |||||||||
- expense | (271 | ) | (36 | ) | (28 | ) | ||||||
|
| |||||||||||
Other business income (expenses) | (211 | ) | 87 | 27 | ||||||||
|
| |||||||||||
Total other business income | 63 | 137 | 68 | |||||||||
Total other business expense | (274 | ) | (50 | ) | (41 | ) | ||||||
|
| |||||||||||
In 2013,2016 and 2015, the result on disposal of businesses was mainly due to divestment ofnon-strategic businesses within Healthcare. For further information, see note 9, Acquisitions and divestments businesses.
In 2013,2016 and 2015, the result on disposal of fixed assets was mainly due to sale of real estate assets.
In 2013,2016 and 2015, the result on other remaining businesses were mainly duerelates to releasenon-core revenue and various legal matters.
In 2014 remaining business expense mainly relates to certain parts of earn out provisions.the Cathode Ray Tube antitrust litigation as mentioned innote 25, Contingent assets and liabilities for which the Company concluded it was able to make a reliable estimate of the cash outflow or was able to reach a settlement with the relevant plaintiffs. For further information, see more details reference is made tonote 21, Provisions.19, Provisions - litigation provisions andnote 25, Contingent assets and liabilities - legal proceedings.
Annual Report 2016 149
Group financial statements 10.10
Philips Group
| 2011 | 2012 | 2013 | ||||||||||
Interest income | 39 | 37 | 55 | |||||||||
Interestincomefromloansandreceivables | 5 | 20 | 33 | |||||||||
Interestincomefromcashandcashequivalents | 34 | 17 | 22 | |||||||||
Dividend income from available for sale financial assets | 11 | 4 | 5 | |||||||||
Net gains from disposal of financial assets | 51 | 1 | — | |||||||||
Net change in fair value of financial assets at fair value through profit or loss | 6 | — | — | |||||||||
Net change in fair value of financial liabilities at fair value through profit or loss | — | 44 | — | |||||||||
Net foreign exchange gains | — | — | — | |||||||||
Other financial income | 6 | 20 | 10 | |||||||||
|
| |||||||||||
Financial income | 113 | 106 | 70 | |||||||||
Interest expense | (340 | ) | (363 | ) | (323 | ) | ||||||
Interestondebtandborrowings | (245 | ) | (271 | ) | (245 | ) | ||||||
Financechargesunderfinanceleasecontract | (3 | ) | (7 | ) | (7 | ) | ||||||
Interestexpenses-pensions | (92 | ) | (85 | ) | (71 | ) | ||||||
Unwind of discount of provisions | (33 | ) | (22 | ) | (25 | ) | ||||||
Net foreign exchange losses | (2 | ) | — | (6 | ) | |||||||
Impairment loss of financial assets | (34 | ) | (8 | ) | (10 | ) | ||||||
Net change in fair value of financial assets at fair value through profit or loss | (2 | ) | (9 | ) | ||||||||
Net change in fair value of financial liabilities at fair value through profit or loss | (3 | ) | ||||||||||
Other financial expenses | (35 | ) | (40 | ) | (24 | ) | ||||||
|
| |||||||||||
Financial expense | (444 | ) | (435 | ) | (400 | ) | ||||||
|
| |||||||||||
Financial income and expenses | (331 | ) | (329 | ) | (330 | ) | ||||||
Financial income and expenses in millions of EUR
2014 - 2016
|
| |||||||||||
| 2014 | 2015 | 2016 | ||||||||||
|
| |||||||||||
Interest income | 39 | 48 | 49 | |||||||||
Interest income from loans and receivables | 22 | 21 | 17 | |||||||||
Interest income from cash and cash equivalents | 17 | 27 | 32 | |||||||||
Dividend income from available for sale financial assets | 4 | 6 | 4 | |||||||||
Net gains from disposal of financial assets | 60 | 20 | 3 | |||||||||
Net change in fair value of financial assets at fair value through profit or loss | — | 4 | — | |||||||||
Other financial income | 11 | 20 | 20 | |||||||||
|
| |||||||||||
Financial income | 114 | 98 | 76 | |||||||||
Interest expense | (290 | ) | (350 | ) | (376 | ) | ||||||
Interest on debt and borrowings | (224 | ) | (271 | ) | (303 | ) | ||||||
Finance charges under finance lease contract | (7 | ) | (7 | ) | (7 | ) | ||||||
Interest expenses - pensions | (59 | ) | (72 | ) | (66 | ) | ||||||
Provision-related accretion and interest | (80 | ) | (35 | ) | 39 | |||||||
Net foreign exchange losses | (1 | ) | (11 | ) | (16 | ) | ||||||
Impairment loss of financial assets | (17 | ) | (46 | ) | (27 | ) | ||||||
Net change in fair value of financial assets at fair value through profit or loss | (6 | ) | — | (4 | ) | |||||||
Net change in fair value of financial liabilities at fair value through profit or loss | (2 | ) | — | — | ||||||||
Other financial expenses | (19 | ) | (25 | ) | (185 | ) | ||||||
|
| |||||||||||
Financial expense | (415 | ) | (467 | ) | (569 | ) | ||||||
|
| |||||||||||
Financial income and expenses | (301 | ) | (369 | ) | (493 | ) | ||||||
|
| |||||||||||
Net financial income and expense showed a EUR 330493 million expensesexpense in 2013,2016, which was 1124 million higher than in 2012. Total finance income of EUR 70 million included EUR 55 million2015. Net interest income. Remaining financial income included dividend income of EUR 5 million and other finance income of EUR 10 million. Total financial expense of EUR 400 million included EUR 10 million impairment charges and EUR 323 million interest expenses. Remaining financial expense consisted mainly ofin 2016 was EUR 25 million higher than in 2015, mainly driven by higher interest expense resulting from higher average debt. The impairment charges in 2016 amounted to EUR 27 million mainly due to Corindus Vascular Robotics. Lower provision-related accretion and interest in 2016 is primarily due to the release of accrued interest as a result of the settlement of the Masimo litigation. Other financial expenses included financial charges related to the early redemption of USD bonds in October 2016 and January 2017 of EUR 91 million and EUR 62 million respectively.
Interest expense in 2015 was EUR 60 million higher than in 2014, mainly due to a weaker EUR against USD in relation to interest expenses on USD bonds. The gain from disposal of financial assets in 2015 amounted to EUR 20 million, mainly from Assembléon, Silicon & Software Systems and other equity interest. In 2015 impairment charges amounted to EUR 46 million. Provision-related accretion expensesand interest in 2015 primarily consisted of interest expense related to the jury verdict in the Masimo litigation, and accretion expense associated with other discounted provisions and uncertainother tax positions and EUR 24 million other financing charges.liabilities.
Net financial income and expense showed a EUR 329301 million expense in 2012, which was EUR 2 million lower than in 2011.2014. Total financial income of EUR 106 million included a EUR 46 million gain related to a change in estimate on the valuation of long term derivative contracts. Remaining financial expense consisted mainly of EUR 22 million of accretion expenses associated with discounted provisions and uncertain tax positions and EUR 40 million other financing charges.
Net financial income and expense showed a EUR 331 million expense in 2011. Total finance income of EUR 113114 million included EUR 51 million gain on the disposal of financial assets, of which EUR 44 million resulted from
Annual Report 2013 175
11 Group financial statements 11.9 - 11.9
the sale of shares in TCL and EUR 6 million resulted from the sale of Digimarc. Remaining financial income included dividend income of EUR 11 million and a total net EUR 6 million gain from fair value changes, mainly the revaluation of the NXP option. Total finance expense of EUR 444 million included EUR 34 million impairment charges, mainly related to the shareholding in TPV Technology. Remaining financial expense consisted mainly of EUR 3339 million of accretion expenses associated with discounted provisions and uncertain tax positions and EUR 35 million other financing charges.interest income.
The income tax expense on income before tax of continuing operations amounted to EUR 466327 million (2012:(2015: EUR 185239 million, 2011:2014: EUR 25126 million).
The components of income before taxes and income tax expense are as follows:
Philips Group
| 2011 | 2012 | 2013 | ||||||||||
Netherlands | 148 | (177 | ) | 314 | ||||||||
Foreign | (958 | ) | 496 | 1,347 | ||||||||
|
| |||||||||||
Income before taxes of continuing operations | (810 | ) | 319 | 1,661 | ||||||||
Netherlands: | ||||||||||||
Current tax income (expense) | (40 | ) | (78 | ) | — | |||||||
Deferred tax income (expense) | 82 | 13 | (107 | ) | ||||||||
|
| |||||||||||
| 42 | (65 | ) | (107 | ) | ||||||||
Foreign: | ||||||||||||
Current tax income (expense) | (360 | ) | (280 | ) | (280 | ) | ||||||
Deferred tax income (expense) | 163 | 143 | (89 | ) | ||||||||
|
| |||||||||||
| (197 | ) | (137 | ) | (369 | ) | |||||||
Income tax expense of continuing operations | (251 | ) | (185 | ) | (466 | ) | ||||||
Income tax expense of discontinued operations | 96 | (17 | ) | (10 | ) | |||||||
|
| |||||||||||
Income tax expense | (155 | ) | (202 | ) | (476 | ) | ||||||
| The components of income tax expense are as follows: | ||||||||||||
| 2011 | 2012 | 2013 | ||||||||||
Current tax expense | (390 | ) | (370 | ) | (268 | ) | ||||||
Prior year results | (10 | ) | 12 | (12 | ) | |||||||
|
| |||||||||||
Current tax income (expense) | (400 | ) | (358 | ) | (280 | ) | ||||||
| 2011 | 2012 | 2013 | ||||||||||
Recognition of previously unrecognized tax losses | 20 | 1 | 20 | |||||||||
Current year tax loss carried forwards not recognized | (89 | ) | (50 | ) | (29 | ) | ||||||
Temporary differences (not recognized) recognized | 15 | 2 | (3 | ) | ||||||||
Prior year results | 31 | (2 | ) | 15 | ||||||||
Tax rate changes | (1 | ) | (4 | ) | — | |||||||
Origination and reversal of temporary differences | 269 | 209 | (199 | ) | ||||||||
|
| |||||||||||
Deferred tax income (expense) | 245 | 156 | (196 | ) | ||||||||
Income tax expensein millions of EUR
2014 - 2016
|
| |||||||||||
| 2014 | 2015 | 2016 | ||||||||||
|
| |||||||||||
Netherlands | 665 | 229 | 119 | |||||||||
Foreign | (480 | ) | 394 | 1,270 | ||||||||
|
| |||||||||||
Income before taxes of continuing operations | 185 | 623 | 1,389 | |||||||||
Netherlands: | ||||||||||||
Current tax (expense) benefit | (12 | ) | 8 | 10 | ||||||||
Deferred tax (expense) benefit | (29 | ) | — | (95 | ) | |||||||
|
| |||||||||||
Total tax (expense) benefit of continuing operations (Netherlands) | (41 | ) | 8 | (85 | ) | |||||||
Foreign: | ||||||||||||
Current tax (expense) | (250 | ) | (242 | ) | (307 | ) | ||||||
Deferred tax (expense) benefit | 265 | (5 | ) | 65 | ||||||||
|
| |||||||||||
Total tax (expense) benefit of continuing operations (foreign) | 15 | (247 | ) | (242 | ) | |||||||
|
| |||||||||||
Income tax expense of continuing operations | (26 | ) | (239 | ) | (327 | ) | ||||||
|
| |||||||||||
Income tax expense of continuing operations excludes the tax expense of the discontinued operations of EUR 57 million (2015: EUR 54 million, 2014: EUR 11 million).
The components of income tax expense of continuing operations are as follows:
Philips Group
Current income tax expense in millions of EUR
2014 - 2016
|
| |||||||||||
| 2014 | 2015 | 2016 | ||||||||||
|
| |||||||||||
Current year tax (expense) benefit | (241 | ) | (244 | ) | (302 | ) | ||||||
Prior year tax (expense) benefit | (21 | ) | 10 | 5 | ||||||||
|
| |||||||||||
Current tax (expense) | (262 | ) | (234 | ) | (297 | ) | ||||||
|
| |||||||||||
150 Annual Report 2016
Group financial statements 10.10
Philips Group
Deferred income tax expensein millions of EUR
2014 - 2016
|
| |||||||||||
| 2014 | 2015 | 2016 | ||||||||||
|
| |||||||||||
Recognition of previously unrecognized tax loss and credit carryforwards | 18 | 7 | 44 | |||||||||
Tax loss and credit carryforwards unrecognized | (65 | ) | (86 | ) | (85 | ) | ||||||
Tax assets relating to temporary differences recognized (unrecognized) | (47 | ) | (31 | ) | 85 | |||||||
Prior year tax (expense) benefit | 34 | (7 | ) | 2 | ||||||||
Tax (expense) benefit due to tax rate changes | 12 | (19 | ) | 3 | ||||||||
Deferred tax (expense) benefit relating to origination and reversal of temporary differences, tax losses and tax credits | 284 | 131 | (79 | ) | ||||||||
|
| |||||||||||
Deferred tax (expense) benefit | 236 | (5 | ) | (30 | ) | |||||||
|
| |||||||||||
Philips’ operations are subject to income taxes in various foreign jurisdictions. The statutory income tax rates vary from 10.0%varies up to 39.4%40.0%, which results in a difference between the weighted average statutory income tax rate and the Netherlands’ statutory income tax rate of 25% (2012:25.0% (2015: 25.0%; 2011:2014: 25.0%).
A reconciliation of the weighted average statutory income tax rate to the effective income tax rate of continuing operations is as follows:
in %Philips Group
| 2011 | 2012 | 2013 | ||||||||||
Weighted average statutory income tax rate | 41.6 | 21.9 | 27.6 | |||||||||
Tax rate effect of: | ||||||||||||
Changes related to: | ||||||||||||
- utilization of previously reserved loss carry forwards | 2.4 | (0.2 | ) | (1.2 | ) | |||||||
- new loss carry forwards not expected to be realized | (7.7 | ) | 15.7 | 1.7 | ||||||||
- addition (releases) | 1.8 | (0.6 | ) | 0.2 | ||||||||
Non-tax-deductible impairment charges | (61.9 | ) | 0.6 | 0.6 | ||||||||
Non-taxable income | 7.1 | (18.7 | ) | (8.1 | ) | |||||||
Non-tax-deductible expenses | (14.1 | ) | 68.7 | 7.5 | ||||||||
Withholding and other taxes | (2.9 | ) | 6.9 | 0.8 | ||||||||
Tax rate changes | (0.1 | ) | 1.1 | 0.0 | ||||||||
Prior year tax results | 2.8 | (3.0 | ) | (0.2 | ) | |||||||
Tax expenses due to other liabilities | (2.5 | ) | 3.1 | 0.5 | ||||||||
Tax incentives and other | 2.5 | (37.5 | ) | (1.3 | ) | |||||||
|
| |||||||||||
Effective tax rate | (31.0 | ) | 58.0 | 28.1 | ||||||||
The weighted average statutoryEffective income tax rate increased in 2013 compared to 2012, as a consequence of a change in the country mix of income tax rates, as well as a significant change in the mix of profits and losses in the various countries.%
2014 - 2016
|
| |||||||||||
| 2014 | 2015 | 2016 | ||||||||||
|
| |||||||||||
Weighted average statutory income tax rate in % | 7.9 | 29.8 | 26.0 | |||||||||
Increase (Decrease) in tax rate resulting from: | ||||||||||||
- recognition of previously unrecognized tax loss and credit carryforwards | (9.6 | ) | (1.2 | ) | (3.2 | ) | ||||||
- tax loss and credit carryforwards unrecognized | 34.9 | 13.7 | 6.1 | |||||||||
- tax assets relating to temporary differences (recognized) unrecognized | 25.5 | 4.9 | (6.1 | ) | ||||||||
Non-deductible impairment charges | 1.8 | 0.1 | 0.1 | |||||||||
Non-taxable income and tax incentives | (107.5 | ) | (31.4 | ) | (7.4 | ) | ||||||
Non-deductible expense | 51.6 | 20.5 | 8.2 | |||||||||
Withholding and other taxes | 13.4 | 4.9 | 4.5 | |||||||||
Tax rate changes | (6.3 | ) | 3.0 | (0.2 | ) | |||||||
Prior year tax expense (benefit) | (30.8 | ) | (0.4 | ) | (0.5 | ) | ||||||
Tax expense (benefit) due to other tax liabilities | 5.6 | (5.9 | ) | (2.7 | ) | |||||||
Others, net | 27.6 | 0.4 | (1.3 | ) | ||||||||
|
| |||||||||||
Effective income tax rate | 14.1 | 38.4 | 23.5 | |||||||||
|
| |||||||||||
The effective income tax rate is higherwas lower than the weighted average statutory income tax rate in 2013,2016, mainly due to withholdingrecognition of deferred tax assets and other taxes which arenon-taxable income, largely attributable to favorable tax regulations relating to R&D investments. These effects were partly offset by the net impact of non-taxable/non-deductible income and other tax expenses.
176 Annual Report 2013
11 Group financial statements 11.9 - 11.9
Deferred tax assets and liabilities
Net deferred tax assets relate to the following balance sheet captions and tax loss carryforwards (including tax credit carryforwards), of which the movements during the years 20132016 and 20122015 respectively are as follows:
| December 31, 2012 | recognized in income | recognized in OCI | acquisitions/ divestments | other1) | December 31, 2013 | |||||||||||||||||||
Intangible assets | (928 | ) | 13 | — | — | 44 | (871 | ) | ||||||||||||||||
Property, plant and equipment | 68 | — | — | — | (10 | ) | 58 | |||||||||||||||||
Inventories | 258 | 9 | — | — | (3 | ) | 264 | |||||||||||||||||
Prepaid pension assets | — | (24 | ) | 23 | — | — | (1 | ) | ||||||||||||||||
Other receivables | 55 | (3 | ) | 1 | — | (3 | ) | 50 | ||||||||||||||||
Other assets | 42 | (4 | ) | (2 | ) | (1 | ) | (3 | ) | 32 | ||||||||||||||
Provisions: | ||||||||||||||||||||||||
- pensions | 598 | (70 | ) | (82 | ) | — | (20 | ) | 426 | |||||||||||||||
- guarantees | 26 | 4 | — | — | (1 | ) | 29 | |||||||||||||||||
- termination benefits | 118 | (28 | ) | 8 | — | (1 | ) | 97 | ||||||||||||||||
- other postretirement benefits | 72 | (5 | ) | (7 | ) | — | (3 | ) | 57 | |||||||||||||||
- other provisions | 605 | (32 | ) | 16 | — | (22 | ) | 567 | ||||||||||||||||
Other liabilities | 171 | 27 | — | (6 | ) | 192 | ||||||||||||||||||
Tax loss carryforwards (including tax credit carryforwards) | 742 | (83 | ) | (11 | ) | — | 51 | 699 | ||||||||||||||||
|
| |||||||||||||||||||||||
Net deferred tax assets | 1,827 | (196 | ) | (54 | ) | (1 | ) | 23 | 1,599 | |||||||||||||||
| December 31, 2011 | recognized in income | recognized in OCI | acquisitions/ divestments | other1) | December 31, 2012 | |||||||||||||||||||
Intangible assets | (1,074 | ) | 165 | — | (35 | ) | 16 | (928 | ) | |||||||||||||||
Property, plant and equipment | 77 | (2 | ) | — | — | (7 | ) | 68 | ||||||||||||||||
Inventories | 221 | 41 | — | — | (4 | ) | 258 | |||||||||||||||||
Prepaid pension costs | 2 | (4 | ) | 6 | — | (4 | ) | — | ||||||||||||||||
Other receivables | 44 | 13 | — | — | (2 | ) | 55 | |||||||||||||||||
Other assets | 19 | 17 | (7 | ) | — | 13 | 42 | |||||||||||||||||
Provisions: | ||||||||||||||||||||||||
- pensions | 617 | (62 | ) | 64 | — | (21 | ) | 598 | ||||||||||||||||
- guarantees | 34 | (10 | ) | — | — | 2 | 26 | |||||||||||||||||
- termination benefits | 42 | 67 | 5 | — | 4 | 118 | ||||||||||||||||||
- other postretirement benefits | 71 | 3 | (3 | ) | — | 1 | 72 | |||||||||||||||||
- other provisions | 636 | (33 | ) | 10 | — | (8 | ) | 605 | ||||||||||||||||
Other liabilities | 231 | (63 | ) | (4 | ) | — | 7 | 171 | ||||||||||||||||
Tax loss carryforwards (including tax credit carryforwards) | 732 | 24 | (7 | ) | 6 | (13 | ) | 742 | ||||||||||||||||
|
| |||||||||||||||||||||||
Net deferred tax assets | 1,652 | 156 | 64 | (29 | ) | (16 | ) | 1,827 | ||||||||||||||||
|
Annual Report 2013 177
11 Group financial statements 11.9 - 11.9
Deferred tax assets and liabilities relate to the balance sheet captions, as follows:tables below.
| assets | liabilities | net | ||||||||||
| 2013 | ||||||||||||
Intangible assets | 116 | (987 | ) | (871 | ) | |||||||
Property, plant and equipment | 107 | (49 | ) | 58 | ||||||||
Inventories | 271 | (7 | ) | 264 | ||||||||
Prepaid pension costs | 1 | (2 | ) | (1 | ) | |||||||
Other receivables | 60 | (10 | ) | 50 | ||||||||
Other assets | 48 | (16 | ) | 32 | ||||||||
Provisions: | ||||||||||||
- pensions | 426 | — | 426 | |||||||||
- guarantees | 29 | — | 29 | |||||||||
- termination benefits | 97 | — | 97 | |||||||||
- other postretirement | 57 | — | 57 | |||||||||
- other | 581 | (14 | ) | 567 | ||||||||
Other liabilities | 213 | (21 | ) | 192 | ||||||||
Tax loss carryforwards (including tax credit carryforwards) | 699 | — | 699 | |||||||||
|
| |||||||||||
| 2,705 | (1,106 | ) | 1,599 | |||||||||
Set-off of deferred tax positions | (1,030 | ) | 1,030 | — | ||||||||
|
| |||||||||||
Net deferred tax assets | 1,675 | (76 | ) | 1,599 | ||||||||
| assets | liabilities | net | ||||||||||
| 2012 | ||||||||||||
Intangible assets | 151 | (1,079 | ) | (928 | ) | |||||||
Property, plant and equipment | 115 | (47 | ) | 68 | ||||||||
Inventories | 263 | (5 | ) | 258 | ||||||||
Prepaid pension costs | 2 | (2 | ) | — | ||||||||
Other receivables | 58 | (3 | ) | 55 | ||||||||
Other assets | 54 | (12 | ) | 42 | ||||||||
Provisions: | — | |||||||||||
- pensions | 599 | (1 | ) | 598 | ||||||||
- guarantees | 26 | — | 26 | |||||||||
- termination benefits | 117 | 1 | 118 | |||||||||
- other postretirement | 72 | — | 72 | |||||||||
- other | 624 | (19 | ) | 605 | ||||||||
Other liabilities | 198 | (27 | ) | 171 | ||||||||
Tax loss carryforwards (including tax credit carryforwards) | 742 | — | 742 | |||||||||
|
| |||||||||||
| 3,021 | (1,194 | ) | 1,827 | |||||||||
Set-off of deferred tax positions | (1,102 | ) | 1,102 | — | ||||||||
|
| |||||||||||
Net deferred tax assets | 1,919 | (92 | ) | 1,827 | ||||||||
Deferred tax assets are recognized for temporary differences, unused tax losses, and unused tax credits to the extent that realization of the related tax benefits is probable. The ultimate realization of deferred tax assets is dependent upon the generation of future taxable income in the countries where the deferred tax assets originated and during the periods when the deferred tax assets become deductible. Management considers the scheduled reversal of deferred tax liabilities, projected future taxable income, and tax planning strategies in making this assessment.
The net deferred tax assets of EUR 1,5992,726 million (2012:(2015: EUR 1,8272,594 million) consist of deferred tax assets of EUR 1,6752,792 million (2012:(2015: EUR 1,9192,758 million) in countries with a net deferred tax asset position and deferred tax liabilities of EUR 7666 million (2012:(2015: EUR 92164 million) in countries with a net deferred tax liability position.. The below table presents the amounts before and after appropriate offsetting. Of the total deferred tax assets of EUR 1,6752,726 million at December 31, 2013, (2012:2016 (2015: EUR 1,9192,758 million), EUR 5432,054 million (2012:(2015: EUR 5072,119 million) is recognized in respect of fiscal entities in various countries where there have been fiscaltax losses in the current or preceding period. Management’s projections support the assumption that it is probable that the results of future operations will generate sufficient taxable income to utilize these deferred tax assets.
At December 31, 20132016 and 2012, there were no recognized deferred tax liabilities for taxes that would be payable on2015 the unremitted earnings of certain foreign subsidiaries of Philips Holding USA since it has been determined that undistributed profits of such subsidiaries will not be distributed in the foreseeable future. The temporary differences associated with the investments, in subsidiaries of Philips Holding USA,including potential income tax consequences on dividends, for which ano deferred tax liability has not beenliabilities are recognized, aggregate to EUR 32685 million (2012:(2015: EUR 35739 million).
At December 31, 2013, operating2016, available tax loss carryforwards expire as follows:
Philips Group
| Total | 2014 | 2015 | 2016 | 2017 | 2018 | 2019/ 2023 | later | unlimi- ted | ||||||||||||||||||||||||
4,330 | 28 | 1 | 3 | 6 | 6 | 44 | 841 | 3,401 | ||||||||||||||||||||||||
Expiry years of net operating loss carryforwardsin millions of EUR
| ||||||||||||||||||||||||||||||||
Total | 2017 | 2018 | 2019 | 2020 | 2021 | 2021/ 2025 | later | unlimited | ||||||||||||||||||||||||
5,564 | 10 | — | 56 | 132 | 31 | 2,492 | 809 | 2,034 | ||||||||||||||||||||||||
|
|
|
|
|
|
|
|
|
|
|
|
|
|
|
| |||||||||||||||||
The Company also has available tax credit carryforwards, of EUR 138 million, which are available to offset future tax, if any, and which expire as follows:
Philips Group
| Total | 2014 | 2015 | 2016 | 2017 | 2018 | 2019/ 2023 | later | unlimi- ted | ||||||||||||||||||||||||
138 | 3 | — | 1 | — | 4 | 19 | 95 | 16 | ||||||||||||||||||||||||
Expiry years of tax credit carryforwardsin millions of EUR
| ||||||||||||||||||||||||||||||||
Total | 2017 | 2018 | 2019 | 2020 | 2021 | 2021/ 2025 | later | unlimited | ||||||||||||||||||||||||
234 | 5 | 4 | 2 | 5 | 6 | 43 | 127 | 42 | ||||||||||||||||||||||||
|
|
|
|
|
|
|
|
|
|
|
|
|
|
|
| |||||||||||||||||
Annual Report 2016 151
Group financial statements 10.10
At December 31, 2013,2016, net operating loss and tax credit carryforwards for which no deferred tax assets have been recognized in the balance sheet, expire as follows:
Philips Group
| Total | 2014 | 2015 | 2016 | 2017 | 2018 | 2019/ 2023 | later | unlimi- ted | ||||||||||||||||||||||||
1,928 | 25 | 1 | 3 | 2 | — | 39 | 9 | 1,849 | ||||||||||||||||||||||||
Net operating loss and tax credit carryforwards for which no deferred tax asset has been recognizedin millions of EUR
| ||||||||||||||||||||||||||||||||
Total | 2017 | 2018 | 2019 | 2020 | 2021 | 2021/ 2025 | later | unlimited | ||||||||||||||||||||||||
2,179 | — | — | 7 | — | 3 | 469 | — | 1,700 | ||||||||||||||||||||||||
|
|
|
|
|
|
|
|
|
|
|
|
|
|
|
| |||||||||||||||||
At December 31, 2013,2016, the amount of deductible temporary differences for which no deferred tax asset has been recognized in the balance sheet iswas EUR 151868 million (2012:(2015: EUR 157139 million).
Philips Group
Deferred tax assets and liabilitiesin millions of EUR
2016
|
| |||||||||||||||||||||||
| Balance as of January 1, 2016 | recognized in income statement | other1) | Balance as of December 31, 2016 | Assets | Liabilities | |||||||||||||||||||
|
| |||||||||||||||||||||||
Intangible assets | (1,089 | ) | 450 | (37 | ) | (676 | ) | 543 | (1,219 | ) | ||||||||||||||
Property, plant and equipment | 19 | 1 | (10 | ) | 10 | 64 | (54 | ) | ||||||||||||||||
Inventories | 354 | 24 | 11 | 389 | 395 | (6 | ) | |||||||||||||||||
Prepaid pensions | (3 | ) | 3 | — | — | — | — | |||||||||||||||||
Other receivables | 51 | 21 | 43 | 115 | 128 | (13 | ) | |||||||||||||||||
Other assets | 17 | 12 | (6 | ) | 23 | 33 | (10 | ) | ||||||||||||||||
Provisions: | — | — | — | — | ||||||||||||||||||||
- pensions | 569 | (104 | ) | 73 | 538 | 538 | — | |||||||||||||||||
- guarantees | 3 | 4 | (1 | ) | 6 | 6 | — | |||||||||||||||||
- termination benefits | 70 | (34 | ) | (7 | ) | 29 | 29 | — | ||||||||||||||||
- other postretirement benefits | 70 | (2 | ) | (38 | ) | 30 | 30 | — | ||||||||||||||||
- other provisions | 785 | (11 | ) | 58 | 832 | 881 | (49 | ) | ||||||||||||||||
Other liabilities | 195 | (26 | ) | (18 | ) | 151 | 221 | (70 | ) | |||||||||||||||
Deferred tax assets on tax loss carryforwards (including tax credit carryforwards) | 1,553 | (368 | ) | 94 | 1,279 | 1,279 | — | |||||||||||||||||
Set-off deferred tax positions | — | — | — | — | (1,355 | ) | 1,355 | |||||||||||||||||
|
| |||||||||||||||||||||||
Net deferred tax assets | 2,594 | (30 | ) | 162 | 2,726 | 2,792 | (66 | ) | ||||||||||||||||
|
| |||||||||||||||||||||||
| 1) | Other includes the movements of assets and liabilities recognized in OCI, which includes foreign currency translation differences, and acquisitions and divestments. |
Philips Group
Deferred tax assets and liabilitiesin millions of EUR
2015
|
| |||||||||||||||||||||||
| Balance as of January 1, 2015 | recognized in income statement | other1) | Balance as of December 31, 2015 | Assets | Liabilities | |||||||||||||||||||
|
| |||||||||||||||||||||||
Intangible assets | (980 | ) | 131 | (240 | ) | (1,089 | ) | 195 | (1,284 | ) | ||||||||||||||
Property, plant and equipment | 73 | (50 | ) | (4 | ) | 19 | 63 | (44 | ) | |||||||||||||||
Inventories | 311 | 10 | 33 | 354 | 360 | (6 | ) | |||||||||||||||||
Prepaid pensions | 98 | (142 | ) | 41 | (3 | ) | — | (3 | ) | |||||||||||||||
Other receivables | 49 | — | 2 | 51 | 57 | (6 | ) | |||||||||||||||||
Other assets | 24 | 13 | (20 | ) | 17 | 31 | (14 | ) | ||||||||||||||||
Provisions: | ||||||||||||||||||||||||
- pensions | 562 | (23 | ) | 30 | 569 | 569 | — | |||||||||||||||||
- guarantees | 4 | (1 | ) | — | 3 | 3 | — | |||||||||||||||||
- termination benefits | 109 | (40 | ) | 1 | 70 | 71 | (1 | ) | ||||||||||||||||
- other postretirement benefits | 71 | 1 | (2 | ) | 70 | 70 | — | |||||||||||||||||
- other provisions | 783 | (3 | ) | 5 | 785 | 805 | (20 | ) | ||||||||||||||||
Other liabilities | 209 | (33 | ) | 19 | 195 | 216 | (21 | ) | ||||||||||||||||
Deferred tax assets on tax loss carryforwards (including tax credit carryforwards) | 1,040 | 132 | 381 | 1,553 | 1,553 | — | ||||||||||||||||||
Set-off deferred tax positions | (1,235 | ) | 1,235 | |||||||||||||||||||||
|
| |||||||||||||||||||||||
Net deferred tax assets | 2,353 | (5 | ) | 246 | 2,594 | 2,758 | (164 | ) | ||||||||||||||||
|
| |||||||||||||||||||||||
| 1) | Other includes the movements of assets and liabilities recognized in OCI, which includes foreign currency translation differences, and acquisitions and divestments. |
152 Annual Report 2016
Group financial statements 10.10
Classification of the income tax payable and receivable is as follows:
Philips Group
| 2012 | 2013 | |||||||
Income tax receivable | 97 | 70 | ||||||
Income tax receivable - under non-current receivables | — | — | ||||||
Income tax payable | (200 | ) | (143 | ) | ||||
Income tax payable - under non-current liabilities | — | (1 | ) | |||||
Income tax payables and receivablesin millions of EUR
2015 - 2016
|
| |||||||
| 2015 | 2016 | |||||||
|
| |||||||
Income tax receivables | 114 | 154 | ||||||
Income tax receivables - undernon-current receivables | — | — | ||||||
Income tax payables | (116 | ) | (146 | ) | ||||
Income tax payables - undernon-current liabilities | — | — | ||||||
|
| |||||||
Tax risks
Philips is exposed to tax uncertainties. With regard to these uncertainties a liability is recognized if, as a result of a past event, Philips has an obligation that can be estimated reliably and it is probable that an outflow of economic benefits will be required to settle the obligation. These uncertainties are presented as Other tax liabilities innote 22, Other liabilities and include, amongstamong others, the following:
Transfer pricing uncertainties
Philips has issued transfer pricing directives, which are in accordance with international guidelines such as those of the Organization of EconomicCo-operation and Development. As transfer pricing has a cross-border effect, the focus of local tax authorities on implemented transfer pricing procedures in a country may have an impact on results in another country. In order to reduce the transfer pricing uncertainties, monitoring procedures are carried out by Group Tax and Internal Audit to safeguard the correct implementation of the transfer pricing directives.
Tax uncertainties on general and specific service agreements and specific allocation contractslicensing agreements
Due to the centralization of certain activities in a limited number of countries (such as research and development, centralized IT and group functions and head office)functions), costs are also centralized. As a consequence, these costs and/or revenues must be allocated to the beneficiaries, i.e. the various Philips entities. For that purpose, apart from specific allocationservice contracts for costssuch as intra-group service agreements and revenues, general servicelicensing agreements are signed with a large number of group entities. Tax authorities review the
178 Annual Report 2013
11 Group financial statements 11.9 - 11.9
implementation of GSAs, apply benefit tests for particular countries or audit the use of tax credits attached to GSAsthese intra-group service and royalty payments,licensing agreements, and may reject the implemented procedures.intra-group charges. Furthermore, buy in/out situations in the case of (de)mergers could affect the taxcost allocation of GSAsresulting from the intragroup service agreements between countries. The same applies to the specific allocation contracts.service agreements.
Tax uncertainties due to disentanglements and acquisitions
When a subsidiary of Philips is disentangled, or a new company is acquired, related tax uncertainties may arise. Philips creates merger and acquisition (M&A) teams for these disentanglements or acquisitions. In addition to representatives from the involved sector,business, these teams consist of specialists from various group functions and are formed, amongstamong other things, to identify hidden tax uncertainties that could subsequently surface when companies are acquired and to reduce potential tax claims related to disentangled entities. These tax uncertainties are investigated and assessed to mitigate tax uncertainties in the future of the extent possible. Several tax uncertainties may surface from M&A activities. Examples of tax uncertainties are: applicability of the participation exemption,exemptions, cost allocation issues, and non-deductibility of parts of the purchase price.issues related to(non-)deductibility.
Tax uncertainties due to permanent establishments
In countries where Philips starts new operations or alters business models, the issue ofA permanent establishment may arise. This is becausearise when operations in a country involvesinvolve a Philips organization in another country, there is a risk that tax claims will arise in the former country as well as in the latter country.
In this section we discuss the nature of, and risks associated with, the Company’s interests in its consolidated entities and associates, and the effects of those interests on the Company’s financial position and financial performance.
Interests in entities could in principle relate to:
Interests in subsidiaries
Joint arrangements
Unconsolidated structured entities
Investments in associates
Interests in subsidiaries
Wholly owned subsidiaries
The Group financial statements comprise the assets and liabilities of approximately 400 legal entities. Set out below is a list of material subsidiaries representing greater than 5% of either the consolidated group sales, income from operations or net income (before any intra-group eliminations). All of the entities are 100% owned and have been for the last 3 years.
Interests in subsidiaries
in order of IFO (decreasing)
| ||
| ||
| ||
| ||
| ||
| ||
| ||
| ||
| ||
| ||
| ||
| ||
| ||
Not wholly owned subsidiaries
Among the consolidated legal entities is one entity where the Company owns 44% of the voting power. We have determined that the Company controls this entity on a de facto power basis. The sales, income from operations and net income of this entity is less than 1% of the consolidated financial data of the company and therefore not considered material.
In total eleven consolidated subsidiaries are not wholly owned by the Company. The sales, income from operations and net income of these entities (before any intra-group eliminations) are less than 3% of the consolidated financial data of the company and therefore not considered material.
Joint arrangements and unconsolidated structured entities
The Company did not have joint arrangements or unconsolidated structured entities that require separate disclosure under IFRS 12.
Investments in associates
Philips has investments in a number of associates, none of them are regarded as individually material.
The changes during 2013 are as follows:
Investments in associates
| ||||
| ||||
| ||||
| ||||
| ||||
| ||||
| ||||
| ||||
Philips has agreed that it will transfer the remaining 30% stake in the TP Vision venture, which has a book value of nil as at December 31, 2013,country; potentially leading to TPV. The net impact of a transaction-related payment has been accrued in Other current liabilities at December 31, 2013 due to conditions that existed at the balance sheet date.
The Company owns four equity interests which represent more than 20% in the capital of the underlying companies. With respect to these equity interests, the Company cannot exercise significant influence based on governance agreements concluded among shareholders. These equity interests are accounted for as Other non-current financial assets. In 2013, the Company’s share in net income of these entities was insignificant.
The Company has one investment where it owns 51% of the shares of an entity, however is not able to control it and therefore it is not consolidated but accounted for as an investment in associate.
During 2013 the Company’s shareholding in two of its investments in associates was diluted and subsequently treated as available-for-sale financial assets. The dilution gains of EUR 16 million are recognized under results related to investments in associates.
The Company has not recognized a proportional share of losses, totaling EUR 37 million (2012: EUR 9 million) in relation to its investments in associates because the Company has no obligation in respect of these losses.
Summarized information of investments in associates
Unaudited summarized financial information on the Company’s most significant investments in associates, on a combined basis, is presented below. It is based on the most recent available financial information.
Included from April 2012 is the 30%-interest in TP Vision Holding which includes the former Philips TV business.double taxation.
Annual Report 2013 1792016 153
11.9 - 11.9
| 2011 | 2012 | 2013 | ||||||||||
Net sales | 408 | 2,534 | 2,180 | |||||||||
Income before taxes | 86 | (7 | ) | (243 | ) | |||||||
Income taxes | (27 | ) | 2 | 12 | ||||||||
|
| |||||||||||
Net income | 59 | (5 | ) | (231 | ) | |||||||
Total share in net income of associates recognized in the Consolidated statements of income | 18 | (5 | ) | 5 | ||||||||
| 2012 | 2013 | |||||||
Current assets | 1,635 | 1,368 | ||||||
Non-current assets | 485 | 412 | ||||||
|
| |||||||
| 2,120 | 1,780 | |||||||
Current liabilities | (1,544 | ) | (1,327 | ) | ||||
Non-current liabilities | (186 | ) | (278 | ) | ||||
|
| |||||||
Net asset value | 390 | 175 | ||||||
Investments in associates included in the Consolidated balance sheet | 177 | 161 | ||||||
Discontinued operations and other assets classified as held for sale
Discontinued operations included in the Consolidated statements of income and the Consolidated statements of cash flows consists of the Audio, Video, Multimedia and Accessories (AVM&A) business, the Television business and certain divestments formerly reported as discontinued operations.
Discontinued operations: Audio, Video, Multimedia and Accessories business
Following the agreement with Funai Electric Co. Ltd which was announced in Q1 2013, the results of the Audio, Video, Multimedia and Accessories (AVM&A) business are reported as discontinued operations in the Consolidated statements of income and Consolidated statements of cash flows. Assets classified as held for sale and Liabilities directly associated with assets held for sale are reported in the Consolidated balance sheet as of the moment of the announcement. This agreement was terminated on October 25, 2013. Since then, Philips has been actively discussing the sale of the business with various parties. Therefore the AVM&A business continues to be reported as discontinued operations in the Consolidated statements of income and Consolidated statements of cash flows with the related assets and liabilities included as Assets classified as held for sale and Liabilities directly associated with assets held for sale in the Consolidated balance sheet.
The following table summarizes the results of the AVM&A business included in the Consolidated statements of income as discontinued operations.
| 2011 | 2012 | 2013 | ||||||||||
Sales | 1,587 | 1,331 | 1,117 | |||||||||
Costs and expenses | (1,499 | ) | (1,210 | ) | (1,067 | ) | ||||||
Disentanglement costs | — | — | (44 | ) | ||||||||
|
| |||||||||||
Income before taxes | 88 | 121 | 6 | |||||||||
Income taxes | (10 | ) | (40 | ) | (3 | ) | ||||||
Investments in associates | — | (3 | ) | — | ||||||||
|
| |||||||||||
Results from discontinued operations | 78 | 78 | 3 | |||||||||
At the moment of divestment the related balance sheet positions will be transferred, the associated currency translation differences, part of Shareholders’ equity, will be recognized in the Consolidated statement of income. At December 31, 2013, the estimated release amounts to a EUR 3 million loss.
The following table presents the assets and liabilities of the AVM&A business, classified as Assets held for sale and Liabilities directly associated with the assets held for sale in the Consolidated balance sheets.
| ||||
| ||||
| ||||
| ||||
| ||||
| ||||
| ||||
| ||||
| ||||
| ||||
Non-transferrable balance sheet positions, such as certain accounts receivable, accounts payable, accrued liabilities and provisions are reported on the respective balance sheet captions.
Discontinued operations: Television business
As announced in Q1 2012, the Television business’s strategic partnership agreement with TPV Technology Limited was signed on April 1, 2012. In 2013, the discontinued Television business reported a net loss of EUR 6 million (2012: a net loss of EUR 31 million; 2011: a net loss of EUR 515 million).
The following table summarizes the results of the Television business included in the Consolidated statements of income as discontinued operations.
| 2011 | 2012 | 2013 | ||||||||||
Sales | 2,702 | 563 | (3 | ) | ||||||||
Costs and expenses | (2,913 | ) | (622 | ) | (3 | ) | ||||||
loss on sale of discontinued operations | (380 | ) | 5 | 4 | ||||||||
|
| |||||||||||
Income (loss) before taxes | (591 | ) | (54 | ) | (2 | ) | ||||||
Income taxes | 76 | 23 | (4 | ) | ||||||||
Operational income tax | 49 | 28 | (2 | ) | ||||||||
Income tax on loss on sale of discontinued operations | 27 | (5 | ) | (2 | ) | |||||||
|
| |||||||||||
Results from discontinued operations | (515 | ) | (31 | ) | (6 | ) | ||||||
In 2011, the loss on the sale of the Television business amounted to approximately EUR 380 million, which mainly comprised of present value of initial contributions made to the TV venture (EUR 183 million), total disentanglement costs (EUR 81 million), contributed assets which were not fully recovered (EUR 66 million) and various smaller other items, offset by the revenue associated with the sale, including the fair value of a contingent consideration and a retained 30% interest in the TV venture.
In addition to the contributions that were agreed and recognized as loss on onerous contract, Philips made commitments to provide further financing to the TV venture for more details see note 25, Contractual obligations and note 36, Subsequent events.
The following table presents the in 2012 divested assets and liabilities of the Television business.
180 Annual Report 2013
11 Group financial statements 11.9 - 11.9
| ||||
| ||||
| ||||
| ||||
| ||||
| ||||
| ||||
| ||||
Discontinued operations: Other
Certain results of other divestments formerly reported as discontinued operations are included with a net gain of EUR 5 million in 2013 (2012: a result of EUR nil million; 2011: a net gain of EUR 27 million).
Other assets classified as held for sale
On July 1, 2013, Philips announced to transfer certain assets and cash proceeds from the sale of certain assets to the Dutch pension plan. In total EUR 94 million of related assets are qualified as held for sale as of December 31, 2013. EUR 92 million relates to other non-current financial assets. For more details see note 30, Post-employment benefits.
Assets and liabilities directly associated with assets held for sale relate to property, plant and equipment for an amount of EUR 13 million (December 31, 2012 EUR 1 million) and business divestments of EUR nil million at December 31, 2013 (December 31, 2012 EUR 15 million).
In 2013, the Company divested two Healthcare businesses formerly reported under Assets classified as held for sale. For more details see note 9, Acquisitions and divestments.
On March 29, 2012, Philips announced the completion of the High Tech Campus transaction with proceeds of EUR 425 million, consisting of a EUR 373 million cash transaction and an amount of EUR 52 million to be received after the deal. The gain from the transaction, after deducting expenses related to other real estate efficiency measures which are part of the EUR 800 million cost reduction program announced in 2011, of EUR 65 million, of which EUR 37 million was recognized in the first quarter of 2012 in income from operations while EUR 28 million was deferred to future periods and is recognized periodically starting as of April 2012. The deferral of the gain relates to the finance lease element in the sale and lease-back arrangement part of the deal.
In 2012, Philips divested several industrial sites in sector Lighting, the Speech Processing business in sector Consumer Lifestyle and a minor service activity in sector Healthcare. The transactions of the industrial sites resulted in a loss of EUR 95 million, consisting of contributed assets, which were not fully recovered leading to a EUR 14 million impairment on property, plant and equipment and EUR 81 million loss reported in other business expense as result on disposal of businesses. As part of these divestments onerous supply agreements were signed, which amounted to EUR 60 million at December 31, 2012. The speech Processing business resulted in a gain of EUR 21 million gain reported in other business income as result on disposal of business.
Annual Report 2013 181
 11 Group financial statements 11.9 - 11.9
Philips Group
Earnings per sharein millions of EUR unless otherwise stated1)
2014 - 2016
| 2011 | 2012 | 2013 | ||||||||||||||||||||||
Income (loss) from continuing operations | (1,046 | ) | (77 | ) | 1,170 | |||||||||||||||||||
Income attributable to non-controlling interest | 4 | 5 | 3 | |||||||||||||||||||||
|
| |||||||||||||||||||||||
Income (loss) from continuing operations attributable to shareholders | (1,050 | ) | (82 | ) | 1,167 | |||||||||||||||||||
Income (loss) from discontinued operations | (410 | ) | 47 | 2 | ||||||||||||||||||||
Net income (loss) attributable to shareholders | (1,460 | ) | (35 | ) | 1,169 | |||||||||||||||||||
Weighted average number of common shares outstanding (after deduction of treasury shares) during the year | 952,808,965 | 1) | 922,101,005 | 1) | 911,071,970 | |||||||||||||||||||
Plus incremental shares from assumed conversions of: | ||||||||||||||||||||||||
Options and restricted share rights | 4,309,777 | 5,014,991 | 10,896,583 | |||||||||||||||||||||
Convertible debentures | 173,890 | 106,204 | 103,899 | |||||||||||||||||||||
Dilutive potential common shares | 4,483,667 | 5,121,195 | 11,000,482 | |||||||||||||||||||||
Adjusted weighted average number of shares (after deduction of treasury shares) during the year | 957,292,632 | 1) | 927,222,200 | 1) | 922,072,452 | |||||||||||||||||||
| Basic earnings per common share in euro 2) | ||||||||||||||||||||||||
Income (loss) from continuing operations | (1.10 | ) | (0.08 | ) | 1.28 | |||||||||||||||||||
Income (loss) from discontinued operations | (0.43 | ) | 0.05 | — | ||||||||||||||||||||
Income (loss) from continuing operations attributable to shareholders | (1.10 | ) | (0.09 | ) | 1.28 | |||||||||||||||||||
Net income (loss) attributable to shareholders | (1.53 | ) | (0.04 | ) | 1.28 | |||||||||||||||||||
| Diluted earnings per common share in euro2,3,4) | ||||||||||||||||||||||||
Income (loss) from continuing operations | (1.10 | ) | (0.08 | ) | 1.27 | |||||||||||||||||||
Income (loss) from discontinued operations | (0.43 | ) | 0.05 | — | ||||||||||||||||||||
Income (loss) from continuing operations attributable to shareholders | (1.10 | ) | (0.09 | ) | 1.27 | |||||||||||||||||||
Net income (loss) attributable to shareholders | (1.53 | ) | (0.04 | ) | 1.27 | |||||||||||||||||||
Dividend distributed per common share in euros | 0.75 | 0.75 | 0.75 | |||||||||||||||||||||
|
| |||||||||||||||||||||||
| 2014 | 2015 | 2016 | ||||||||||||||||||||||
|
| |||||||||||||||||||||||
Income from continuing operations | 221 | 414 | 1,075 | |||||||||||||||||||||
Income (loss) attributable tonon-controlling interest | (4 | ) | 14 | 43 | ||||||||||||||||||||
|
| |||||||||||||||||||||||
Income from continuing operations attributable to shareholders | 225 | 400 | 1,032 | |||||||||||||||||||||
Income from Discontinued operations | 190 | 245 | 416 | |||||||||||||||||||||
|
| |||||||||||||||||||||||
Net income attributable to shareholders | 415 | 645 | 1,448 | |||||||||||||||||||||
Weighted average number of common shares outstanding (after deduction of treasury shares) during the year | 915,192,683 | 916,086,943 | 918,015,863 | |||||||||||||||||||||
Plus incremental shares from assumed conversions of: | ||||||||||||||||||||||||
Options | 4,617,109 | 3,565,682 | 2,456,616 | |||||||||||||||||||||
Performance shares | 614,010 | 2,479,923 | 6,985,509 | |||||||||||||||||||||
Restricted share rights | 2,290,472 | 1,491,960 | 1,331,163 | |||||||||||||||||||||
Dilutive potential common shares | 7,521,591 | 7,537,565 | 10,773,289 | |||||||||||||||||||||
Diluted weighted average number of shares (after deduction of treasury shares) during the year | 922,714,274 | 923,624,508 | 928,789,152 | |||||||||||||||||||||
| Basic earnings per common share in EUR2) | ||||||||||||||||||||||||
Income from continuing operations attributable to shareholders | 0.25 | 0.44 | 1.12 | |||||||||||||||||||||
Net income attributable to shareholders | 0.45 | 0.70 | 1.58 | |||||||||||||||||||||
| Diluted earnings per common share in EUR2,3,4) | ||||||||||||||||||||||||
Income from continuing operations attributable to shareholders | 0.24 | 0.43 | 1.11 | |||||||||||||||||||||
Net income attributable to shareholders | 0.45 | 0.70 | 1.56 | |||||||||||||||||||||
Dividend distributed per common share in euros | 0.80 | 0.80 | 0.80 | |||||||||||||||||||||
|
| |||||||||||||||||||||||
| 1) |
|
| 2) | The effect on income of convertible debentures affecting earnings per share is considered immaterial |
| 3) | In |
| 4) | The |
2013
There were four acquisitions in 2013. These acquisitions involved an aggregated purchase price of EUR 10 million. Measured on a yearly basis, the aggregated impact of these acquisitions on Group Sales, Income from operations, Net income and Net income per common share (on a fully diluted basis) are not material in respect of IFRS 3 disclosure requirements.
Philips completed five divestments of business activities during 2013, mainly related to certain Healthcare service activities. The transactions involved an aggregate consideration of EUR 99 million and are therefore deemed immaterial in respect of IFRS 3 disclosure requirements.
2012
During 2012, Philips entered into one acquisition. On January 9, 2012 Philips acquired (in)directly 99.93% of the outstanding shares of Industrias Derivadas del Aluminio, S.L. (Indal). This acquisition involved a cash consideration of EUR 210 million and was accounted for using the acquisition method. By the end of July 2012, Indal was fully owned by Philips.
Philips completed in the first quarter of 2012 the divestment of the Television business. Furthermore there were several divestments of business activities during 2012, which comprised the divestment of certain Lighting manufacturing activities, Speech Processing activities and certain Healthcare service activities. These transactions involved an aggregated consideration of EUR 49 million and are therefore deemed immaterial in respect of IFRS 3 disclosure requirements.
On January 26, 2012, Philips agreed to extend its partnership with Sara Lee Corp (Sara Lee) to drive growth in the global coffee market. Under a new exclusive partnership framework, which will run through to 2020, Philips will be the exclusive Senseo consumer appliance manufacturer and distributor for the duration of the agreement. As part of the agreement, Philips transferred its 50% ownership right in the Senseo trademark to Sara Lee. Under the terms of the agreement, Sara Lee paid Philips a total consideration of EUR 170 million. The consideration was recognized in
182154 Annual Report 20132016
11 Group financial statements 11.9 - 11.9
Other business income for an amount of EUR 160 million. The remainder was included in various line items of the Consolidated statements of income (EUR 8 million) or deducted from the book value of Property, plant and equipment (EUR 2 million).
2011
During 2011, Philips entered into six acquisitions. These acquisitions involved an aggregated purchase price of EUR 498 million and have been accounted for using the acquisition method. Measured on an annualized basis, the aggregated impact of the six acquisitions on group Sales, Income from operations, Net income and Net income per common share (on a fully diluted basis) is not material in respect of IFRS 3 disclosure requirements.
The divestments in 2011 involved an aggregated consideration of EUR 57 million and were therefore deemed immaterial in respect of IFRS 3 disclosure requirements.
Annual Report 2013 183
 11 Group financial statements 11.9 - 11.9
Philips Group
land and buildings | machinery and | other equipment | prepayments and construction in progress | total | ||||||||||||||||
Balance as of January 1, 2013: | ||||||||||||||||||||
Cost | 1,924 | 4,004 | 1,658 | 294 | 7,880 | |||||||||||||||
Accumulated depreciation | (835 | ) | (2,851 | ) | (1,235 | ) | — | (4,921 | ) | |||||||||||
|
| |||||||||||||||||||
Book value | 1,089 | 1,153 | 423 | 294 | 2,959 | |||||||||||||||
Change in book value: | ||||||||||||||||||||
Capital expenditures | 8 | 88 | 61 | 461 | 618 | |||||||||||||||
Assets available for use | 79 | 244 | 160 | (483 | ) | — | ||||||||||||||
Acquisitions | — | — | — | — | — | |||||||||||||||
Disposals and sales | (1 | ) | (14 | ) | (7 | ) | (4 | ) | (26 | ) | ||||||||||
Depreciation | (87 | ) | (321 | ) | (163 | ) | — | (571 | ) | |||||||||||
Impairments | (15 | ) | (26 | ) | (22 | ) | — | (63 | ) | |||||||||||
Transfer to assets classified as held for sale | (17 | ) | (4 | ) | (4 | ) | — | (25 | ) | |||||||||||
Translation differences | (29 | ) | (57 | ) | (17 | ) | (9 | ) | (112 | ) | ||||||||||
|
| |||||||||||||||||||
Total changes | (62 | ) | (90 | ) | 8 | (35 | ) | (179 | ) | |||||||||||
Balance as of December 31, 2013: | ||||||||||||||||||||
Cost | 1,899 | 3,948 | 1,586 | 259 | 7,692 | |||||||||||||||
Accumulated depreciation | (872 | ) | (2,885 | ) | (1,155 | ) | — | (4,912 | ) | |||||||||||
|
| |||||||||||||||||||
Book value | 1,027 | 1,063 | 431 | 259 | 2,780 | |||||||||||||||
Property, plant and equipmentin millions of EUR
2016
| land and buildings | machinery and installations | other equipment | prepayments and construction in progress | total |
|
| ||||||||||||||||||||||||||||||||||
Balance as of January 1, 2012: | ||||||||||||||||||||||||||||||||||||||||
| land and buildings | machinery and installations | other equipment | prepayments and construction in progress | total | ||||||||||||||||||||||||||||||||||||
|
| |||||||||||||||||||||||||||||||||||||||
Balance as of January 1, 2016: | ||||||||||||||||||||||||||||||||||||||||
Cost | 1,981 | 3,914 | 1,552 | 365 | 7,812 | 1,864 | 3,260 | 1,873 | 220 | 7,217 | ||||||||||||||||||||||||||||||
Accumulated depreciation | (895 | ) | (2,762 | ) | (1,141 | ) | — | (4,798 | ) | (951 | ) | (2,525 | ) | (1,419 | ) | — | (4,895 | ) | ||||||||||||||||||||||
|
|
|
| |||||||||||||||||||||||||||||||||||||
Book value | 1,086 | 1,152 | 411 | 365 | 3,014 | 913 | 735 | 454 | 220 | 2,322 | ||||||||||||||||||||||||||||||
Change in book value: | ||||||||||||||||||||||||||||||||||||||||
Capital expenditures | 95 | 114 | 98 | 497 | 804 | 14 | 142 | 101 | 318 | 575 | ||||||||||||||||||||||||||||||
Assets available for use | 125 | 312 | 116 | (553 | ) | — | 112 | 108 | 137 | (357 | ) | — | ||||||||||||||||||||||||||||
Acquisitions | 1 | 4 | 12 | — | 17 | |||||||||||||||||||||||||||||||||||
Disposals and sales | (64 | ) | (8 | ) | (10 | ) | (10 | ) | (92 | ) | ||||||||||||||||||||||||||||||
Depreciation | (77 | ) | (358 | ) | (188 | ) | — | (623 | ) | (80 | ) | (257 | ) | (191 | ) | — | (528 | ) | ||||||||||||||||||||||
Impairments | (13 | ) | (33 | ) | (12 | ) | (1 | ) | (59 | ) | ||||||||||||||||||||||||||||||
Transfer to assets classified as held for sale | (23 | ) | (2 | ) | (1 | ) | 1 | (25 | ) | |||||||||||||||||||||||||||||||
Reclassifications | (29 | ) | — | — | — | (29 | ) | |||||||||||||||||||||||||||||||||
Translation differences | (12 | ) | (28 | ) | (3 | ) | (5 | ) | (48 | ) | ||||||||||||||||||||||||||||||
Impairments1) | (25 | ) | (40 | ) | (13 | ) | — | (78 | ) | |||||||||||||||||||||||||||||||
Transfer (to) from assets classified as held for sale1) | (92 | ) | (4 | ) | (2 | ) | (2 | ) | (100 | ) | ||||||||||||||||||||||||||||||
Translation differences and other | 12 | (8 | ) | (40 | ) | — | (36 | ) | ||||||||||||||||||||||||||||||||
|
|
|
| |||||||||||||||||||||||||||||||||||||
Total changes | 3 | 1 | 12 | (71 | ) | (55 | ) | (59 | ) | (59 | ) | (8 | ) | (41 | ) | (167 | ) | |||||||||||||||||||||||
Balance as of December 31, 2012: | ||||||||||||||||||||||||||||||||||||||||
Balance as of December 31, 2016: | ||||||||||||||||||||||||||||||||||||||||
Cost | 1,924 | 4,004 | 1,658 | 294 | 7,880 | 1,766 | 3,222 | 1,897 | 179 | 7,064 | ||||||||||||||||||||||||||||||
Accumulated depreciation | (835 | ) | (2,851 | ) | (1,235 | ) | — | (4,921 | ) | (912 | ) | (2,546 | ) | (1,451 | ) | — | (4,909 | ) | ||||||||||||||||||||||
|
|
|
| |||||||||||||||||||||||||||||||||||||
Book value | 1,089 | 1,153 | 423 | 294 | 2,959 | 854 | 676 | 446 | 179 | 2,155 | ||||||||||||||||||||||||||||||
|
| |||||||||||||||||||||||||||||||||||||||
| 1) | For more information please refer tonote 3, Discontinued operations and other assets classified as held for sale. |
Philips Group
Property, plant and equipmentin millions of EUR
2015
|
| |||||||||||||||||||
| land and buildings | machinery and installations | other equipment | prepayments and progress | total | ||||||||||||||||
|
| |||||||||||||||||||
Balance as of January 1, 2015: | ||||||||||||||||||||
Cost | 1,803 | 3,127 | 1,745 | 169 | 6,844 | |||||||||||||||
Accumulated depreciation | (931 | ) | (2,520 | )�� | (1,298 | ) | — | (4,749 | ) | |||||||||||
|
| |||||||||||||||||||
Book value | 872 | 607 | 447 | 169 | 2,095 | |||||||||||||||
Change in book value: | ||||||||||||||||||||
Capital expenditures | 13 | 113 | 62 | 387 | 575 | |||||||||||||||
Assets available for use | 59 | 139 | 140 | (338 | ) | — | ||||||||||||||
Acquisitions | — | 107 | 2 | — | 109 | |||||||||||||||
Depreciation | (83 | ) | (252 | ) | (196 | ) | — | (531 | ) | |||||||||||
Impairments | (8 | ) | (27 | ) | (16 | ) | — | (51 | ) | |||||||||||
Transfer to assets classified as held for sale | 26 | (10 | ) | — | (2 | ) | 14 | |||||||||||||
Translation differences and other | 34 | 58 | 15 | 4 | 111 | |||||||||||||||
|
| |||||||||||||||||||
Total changes | 41 | 128 | 7 | 51 | 227 | |||||||||||||||
Balance as of December 31, 2015: | ||||||||||||||||||||
Cost | 1,864 | 3,260 | 1,873 | 220 | 7,217 | |||||||||||||||
Accumulated depreciation | (951 | ) | (2,525 | ) | (1,419 | ) | — | (4,895 | ) | |||||||||||
|
| |||||||||||||||||||
Book value | 913 | 735 | 454 | 220 | 2,322 | |||||||||||||||
|
| |||||||||||||||||||
Land with a book value of EUR 13373 million at December 31, 2013 (2012:2016 (2015: EUR 152142 million) is not depreciated.
Property, plant and equipment includes financial lease assets with a book value of EUR 187271 million at December 31, 2013 (2012:2016 (2015: EUR 248203 million).
The expected useful lives of property, plant and equipment are as follows:
Philips Group
Useful lives of property, plant and equipmentin years
Buildings | from 5 to 50 years | |||
Machinery and installations | from 3 to 20 years | |||
Other equipment | from 1 to 10 years | |||
184 Annual Report 20132016 155
11 Group financial statements 11.9 - 11.910.10
The changes in 20122015 and 20132016 were as follows:
Philips Group
| 2012 | 2013 | |||||||
Balance as of January 1: | ||||||||
Cost | 9,224 | 9,119 | ||||||
Amortization and impairments | (2,208 | ) | (2,171 | ) | ||||
|
| |||||||
Book value | 7,016 | 6,948 | ||||||
Changes in book value: | ||||||||
Acquisitions | 100 | 4 | ||||||
Purchase price allocation adjustment | (2 | ) | (4 | ) | ||||
Impairments | — | (26 | ) | |||||
Divestments and transfers to assets classified as held for sale | (6 | ) | (55 | ) | ||||
Translation differences | (160 | ) | (363 | ) | ||||
Balance as of December 31: | ||||||||
Cost | 9,119 | 8,596 | ||||||
Amortization and impairments | (2,171 | ) | (2,092 | ) | ||||
|
| |||||||
Book value | 6,948 | 6,504 | ||||||
The movementGoodwillin millions of EUR 55
2015 - 2016
|
| |||||||
| 2015 | 2016 | |||||||
|
| |||||||
Balance as of January 1: | ||||||||
Cost | 9,151 | 10,704 | ||||||
Amortization and impairments | (1,993 | ) | (2,181 | ) | ||||
|
| |||||||
Book value | 7,158 | 8,523 | ||||||
Changes in book value: | ||||||||
Acquisitions | 644 | 140 | ||||||
Translation differences and other | 721 | 235 | ||||||
Balance as of December 31: | ||||||||
Cost | 10,704 | 11,151 | ||||||
Amortization and impairments | (2,181 | ) | (2,253 | ) | ||||
|
| |||||||
Book value | 8,523 | 8,898 | ||||||
|
| |||||||
In 2016, goodwill increased by EUR 124 million in Divestments and transfers to assets classified as held for sale mainly relate to divestments in the Healthcare sector.
Acquisitions in 2012 include goodwill relateddue to the acquisition of Indal forWellcentive and PathXL. The increase of EUR 100 million. 235 million is mainly due to translation differences which impacted the goodwill denominated in USD.
In addition,2015, goodwill changedincreased by EUR 627 million due to the finalizationacquisition of purchase price accounting relatedVolcano. The increase of EUR 721 million is due to acquisitionstranslation differences which impacted the goodwill denominated in the prior year.USD.
For impairment testing, goodwill is allocated to (groups of) cash- generatingcash-generating units (typically one level below operating sectorsegment level), which representsrepresent the lowest level at which the goodwill is monitored internally for management purposes.
Goodwill allocated to the cash-generating units Respiratory Care & Sleep Management, Imaging Systems,Image-Guided Therapy, Patient Care & Clinical InformaticsMonitoring Solutions, Sleep & Respiratory Care and Professional Lighting Solutions is considered to be significant in comparison to the total book value of goodwill for the Group at December 31, 2013.2016. The amounts allocatedassociated as of December 31, 2016, are presented below:
Philips Group
| 2012 | 2013 | |||||||
Respiratory Care & Sleep Management | 1,706 | 1,544 | ||||||
Imaging Systems | 1,482 | 1,414 | ||||||
Patient Care & Clinical Informatics | 1,331 | 1,271 | ||||||
Professional Lighting Solutions | 1,337 | 1,266 | ||||||
Goodwill allocated to the cash-generating unitsin millions of EUR
2015 - 2016
|
| |||||||
| 2015 | 2016 | |||||||
|
| |||||||
Sleep & Respiratory Care | 1,884 | 1,958 | ||||||
Image-Guided Therapy | 1,066 | 1,106 | ||||||
Patient Care & Monitoring Solutions | 1,452 | 1,506 | ||||||
Professional | 1,626 | 1,671 | ||||||
Other (units carrying anon-significant goodwill balance) | 2,495 | 2,657 | ||||||
|
| |||||||
Book value | 8,523 | 8,898 | ||||||
|
| |||||||
The basis of the recoverable amount used in the annual (performed in the second quarter) and trigger-based impairment tests for the units disclosed in this note is the value in use. In the annual impairment test performed in the fourth quarter of 2016, the estimated recoverable amounts of the cash-generating units tested approximated or exceeded the carrying value of the units, therefore no impairment loss was recognized.
Key assumptions - general
Key assumptions used in the impairment tests for the units were sales growth rates, Adjusted income from operations1) and the rates used for discounting the projected cash flows. These cash flow projections were determined using management’sthe Royal Philips and Philips Lighting managements’ internal forecasts that cover an initial period from 20132017 to 2017 that matches the period used for our strategic process.2019. Projections were extrapolated with stable or declining growth rates for a period of 5 years, after which a terminal value was calculated. For terminal value calculation, growth rates were capped at a historical long-term average growth rate.
The sales growth rates and marginsAdjusted income from operations1) used to estimate cash flows are based on past performance, external market growth assumptions and industry long-term growth averages.
Income Adjusted income from operations1) in all units mentioned in this note is expected to increase over the projection period as a result of volume growth and cost efficiencies.
Key assumptions and sensitivity analysis relating to cash-generating units to which a significant amount of goodwill is allocated
Cash flow projections of Respiratory Care & Sleep Management, Imaging Systems,Image-Guided Therapy, Patient Care & Clinical InformaticsMonitoring Solutions, Sleep & Respiratory Care and Professional Lighting Solutions for 2013 wereare based on the following key assumptions (based onincluded in the table below, which were used in the annual impairment test performed in the second quarter):fourth quarter:
Philips Group
Key assumptionsin %
2016
| compound sales growth rate1) | ||||||||||||||||
| initial forecast period | extra- polation period2) | used to calculate terminal value | pre-tax discount rates | |||||||||||||
Respiratory Care & Sleep Management | 4.9 | 3.7 | 2.7 | 11.3 | ||||||||||||
Imaging Systems | 3.9 | 3.4 | 2.7 | 12.4 | ||||||||||||
Patient Care & Clinical Informatics | 4.1 | 3.5 | 2.7 | 13.2 | ||||||||||||
Professional Lighting Solutions | 7.4 | 5.4 | 2.7 | 12.8 | ||||||||||||
|
| |||||||||||||||
| compound sales growth rate1) | ||||||||||||||||
|
| |||||||||||||||
| initial forecast period | extra- polation period2) | used to calculate terminal value3) | pre-tax discount rates | |||||||||||||
|
| |||||||||||||||
Image-Guided Therapy | 7.1 | 5.6 | 2.7 | 12.1 | ||||||||||||
Patient Care & Monitoring Solutions | 6.4 | 4.6 | 2.7 | 14.3 | ||||||||||||
Sleep & Respiratory Care | 6.8 | 4.6 | 2.7 | 12.6 | ||||||||||||
Professional | 5.0 | 4.3 | 2.7 | 13.9 | ||||||||||||
|
| |||||||||||||||
| 1) | Compound sales growth rate is the annualized steady growth rate over the forecast period |
| 2) | Also referred to later in the text as compound long-term sales growth rate |
| 3) | The historical long-term growth rate is only applied to the first year after the 5 year extrapolation period, after which no further growth is assumed for the terminal value calculation |
| 1) | Non-GAAP financial measure. For the definition and reconciliation to the most directly comparable GAAP measure, refer tochapter 4, Reconciliation of non-GAAP information, of this report. |
156 Annual Report 2016
Group financial statements 10.10
The assumptions used for the 20122015 cash flow projections were as follows:
Philips Group
Key assumptionsin %
2015
| compound sales growth rate1) | ||||||||||||||||
| initial forecast period | extra- polation period2) | used to calculate terminal value | pre-tax discount rates | |||||||||||||
Respiratory Care & Sleep Management | 8.0 | 5.8 | 2.7 | 11.2 | ||||||||||||
Imaging Systems | 3.4 | 2.9 | 2.7 | 12.8 | ||||||||||||
Patient Care & Clinical Informatics | 6.5 | 4.1 | 2.7 | 13.2 | ||||||||||||
Professional Lighting Solutions | 6.6 | 5.3 | 2.7 | 13.0 | ||||||||||||
|
| |||||||||||||||
| compound sales growth rate1) | ||||||||||||||||
|
| |||||||||||||||
| initial forecast period | extra- polation period2) | used to calculate terminal value3) | pre-tax discount rates | |||||||||||||
|
| |||||||||||||||
Image-Guided Therapy | 3.0 | 2.4 | 2.7 | 12.2 | ||||||||||||
Patient Care & Monitoring Solutions | 6.0 | 4.8 | 2.7 | 13.4 | ||||||||||||
Sleep & Respiratory Care | 6.9 | 5.6 | 2.7 | 11.5 | ||||||||||||
Professional | 5.0 | 5.1 | 2.7 | 15.1 | ||||||||||||
|
| |||||||||||||||
| 1) | Compound sales growth rate is the annualized steady growth rate over the forecast period |
| 2) | Also referred to later in the text as compound long-term sales growth rate |
| 3) | The historical long-term growth rate is only applied to the first year after the 5 year extrapolation period, after which no further growth is assumed for the terminal value calculation |
Among the units mentioned, units, Respiratory Care & Sleep Management andin 2016 Professional Lighting Solutions have the highest amount of goodwill andhad the lowest excess of the recoverable amount over the carrying amount. The headroom of Respiratory Care & Sleep ManagementProfessional was estimated at EUR 660 million, the headroom of Professional Lighting Solutions at EUR 67050 million. The increase in the headroom of Professional Lighting Solutions compared to the annual impairment test 2012, in which the headroom approximated the carrying value, is mainly explained by increased forecasted profitability assumptions driven by gross margin improvements. The following changes could, individually, cause the value in use to fall to the level of the carrying value:
| increase in pre-tax discount rate, basis points | decrease in long-term growth rate, basis points | decrease in terminal value amount, % | ||||||||||
Respiratory Care & Sleep Management | 290 | 550 | 39 | |||||||||
Professional Lighting Solutions | 290 | 520 | 39 | |||||||||
Philips Group
Annual Report 2013 185Sensitivity analysis
 11 Group financial statements 11.9 - 11.9
|
| |||||||||||
| increase in pre-tax discount rate, basis points | decrease in long-term | decrease in terminal value amount, % | ||||||||||
|
| |||||||||||
Professional | 20 | 60 | 2.6 | |||||||||
|
| |||||||||||
The results of the annual impairment test of Imaging Systems andImage-Guided Therapy, Patient Care & Clinical Informatics have indicatedMonitoring Solutions and Sleep & Respiratory Care indicate that a reasonably possible change in key assumptions would not cause the value in use to fall to the level of the carrying value.
Impairment charge 2013
In the fourth quarter, the updated impairment test for Consumer Luminaires resulted in EUR 26 million impairment. This was mainly a consequence of reduced growth rate dueAdditional information relating to slower anticipated recovery of certain markets and introduction delays of new product ranges. The pre-tax discount rate appliedcash-generating units to which anon-significant amount relative to the most recent cash flow projectiontotal goodwill is 13.5%. The pre-tax discount rate applied in the previous projection was 13.4%. Comparedallocated
In addition to the previous impairment test there has been no change insignificant goodwill recorded at the organization structure which impacts how goodwill is allocated to this cash-generating unit.
After the impairment chargeunits mentioned above, the estimated recoverable amount for this cash-generating unit approximates the carrying value. Consequently, any adverse change in key assumptions would, individually, cause a further impairment to be recognized. Remaining goodwill allocated to Consumer Luminaires at December 31, 2013 amounts to EUR 106 million.
Additional information 2013
In addition, other units, areHome Monitoring is sensitive to fluctuations in the assumptions as set out above.
Based on the annualmost recent impairment test, it was noted that the headroom for the cash-generating unit Home Monitoring was EUR 7650 million. An increase of 280160 points in thepre-tax discounting rate, a 560390 basis points decline in the compound long-term sales growth rate or a 38%22% decrease in terminal value would, individually, cause its value in use to fall to the level of its carrying value. The goodwill allocated to Home Monitoring at December 31, 20132016 amounts to EUR 3534 million.
Based on the annual impairment test, it was noted that with regard to the headroom for the cash-generating unit Lumileds, the estimated recoverable amount approximates the carrying value of the cash- generating unit. Consequently, any adverse change in key assumptions would, individually, cause an impairment to be recognized. The goodwill allocated to Lumileds at December 31, 2013 amounts to EUR 127 million.
Please refer to note 2, Information by sector and main country for a specification of goodwill by sector.Annual Report 2016 157
Group financial statements 10.10
Intangible assets excluding goodwill
The changes were as follows:
| other intangible assets | product development | software | total | |||||||||||||
Balance as of January 1, 2013: | ||||||||||||||||
Cost | 5,868 | 1,584 | 369 | 7,821 | ||||||||||||
Amortization/impairments | (2,972 | ) | (817 | ) | (301 | ) | (4,090 | ) | ||||||||
|
| |||||||||||||||
Book value | 2,896 | 767 | 68 | 3,731 | ||||||||||||
Changes in book value: | ||||||||||||||||
Additions | 19 | 357 | 30 | 406 | ||||||||||||
Acquisitions | 15 | — | — | 15 | ||||||||||||
Amortization | (387 | ) | (213 | ) | (37 | ) | (637 | ) | ||||||||
Impairments | (50 | ) | (33 | ) | (2 | ) | (85 | ) | ||||||||
Reversal of impairment | 5 | — | — | 5 | ||||||||||||
Divestments and transfers to assets classified as held for sale | (28 | ) | (9 | ) | (1 | ) | (38 | ) | ||||||||
Translation differences | (118 | ) | (25 | ) | (1 | ) | (144 | ) | ||||||||
Other | 8 | 1 | — | 9 | ||||||||||||
|
| |||||||||||||||
Total changes | (536 | ) | 78 | (11 | ) | (469 | ) | |||||||||
Balance as of December 31, 2013: | ||||||||||||||||
Cost | 5,533 | 1,761 | 344 | 7,638 | ||||||||||||
Amortization/impairments | (3,173 | ) | (916 | ) | (287 | ) | (4,376 | ) | ||||||||
|
| |||||||||||||||
Book Value | 2,360 | 845 | 57 | 3,262 | ||||||||||||
Philips Group
186 Annual Report 2013Intangible assets excluding goodwillin millions of EUR
11 Group financial statements 11.9 - 11.9
| other intangible assets | product development | software | total |
|
| |||||||||||||||||||||||||||||||
Balance as of January 1, 2012: | ||||||||||||||||||||||||||||||||||||
| other intangible assets | product development | product development construction in progress | software | total | ||||||||||||||||||||||||||||||||
|
| |||||||||||||||||||||||||||||||||||
Balance as of January 1, 2016: | ||||||||||||||||||||||||||||||||||||
Cost | 5,857 | 1,437 | 369 | 7,663 | 6,539 | 1,668 | 522 | 522 | 9,251 | |||||||||||||||||||||||||||
Amortization/impairments | (2,593 | ) | (793 | ) | (281 | ) | (3,667 | ) | (3,993 | ) | (1,167 | ) | (31 | ) | (367 | ) | (5,558 | ) | ||||||||||||||||||
|
|
|
| |||||||||||||||||||||||||||||||||
Book value | 3,264 | 644 | 88 | 3,996 | 2,546 | 501 | 491 | 155 | 3,693 | |||||||||||||||||||||||||||
Changes in book value: | ||||||||||||||||||||||||||||||||||||
Additions | 11 | 347 | 29 | 387 | 46 | — | 318 | 56 | 420 | |||||||||||||||||||||||||||
Acquisitions and purchase price allocation adjustments | 137 | — | — | 137 | ||||||||||||||||||||||||||||||||
Acquisitions | 37 | — | — | — | 37 | |||||||||||||||||||||||||||||||
Amortization | (455 | ) | (190 | ) | (44 | ) | (689 | ) | (351 | ) | (229 | ) | — | (55 | ) | (635 | ) | |||||||||||||||||||
Impairments | (17 | ) | (30 | ) | (2 | ) | (49 | ) | (1 | ) | (20 | ) | (4 | ) | (2 | ) | (27 | ) | ||||||||||||||||||
Translation differences | (42 | ) | (10 | ) | — | (52 | ) | |||||||||||||||||||||||||||||
Other | (2 | ) | 6 | (3 | ) | 1 | ||||||||||||||||||||||||||||||
Assets available for use | — | 270 | (270 | ) | — | — | ||||||||||||||||||||||||||||||
Translations differences | 37 | 15 | 7 | 5 | 64 | |||||||||||||||||||||||||||||||
|
|
|
| |||||||||||||||||||||||||||||||||
Total changes | (368 | ) | 123 | (20 | ) | (265 | ) | (232 | ) | 36 | 51 | 4 | (141 | ) | ||||||||||||||||||||||
Balance as of December 31, 2012: | ||||||||||||||||||||||||||||||||||||
Balance as of December 31, 2016: | ||||||||||||||||||||||||||||||||||||
Cost | 5,868 | 1,584 | 369 | 7,821 | 6,725 | 1,899 | 578 | 580 | 9,782 | |||||||||||||||||||||||||||
Amortization/impairments | (2,972 | ) | (817 | ) | (301 | ) | (4,090 | ) | (4,411 | ) | (1,362 | ) | (36 | ) | (421 | ) | (6,230 | ) | ||||||||||||||||||
|
|
|
| |||||||||||||||||||||||||||||||||
Book value | 2,896 | 767 | 68 | 3,731 | 2,314 | 537 | 542 | 159 | 3,552 | |||||||||||||||||||||||||||
|
| |||||||||||||||||||||||||||||||||||
Philips Group
Intangible assets excluding goodwillin millions of EUR
2015
|
| |||||||||||||||||||
other assets | product development | product development construction in progress | software | total | ||||||||||||||||
|
| |||||||||||||||||||
Balance as of January 1, 2015: | ||||||||||||||||||||
Cost | 5,721 | 1,447 | 406 | 446 | 8,020 | |||||||||||||||
Amortization/impairments | (3,371 | ) | (946 | ) | (18 | ) | (317 | ) | (4,652 | ) | ||||||||||
|
| |||||||||||||||||||
Book value | 2,350 | 501 | 388 | 129 | 3,368 | |||||||||||||||
Changes in book value: | ||||||||||||||||||||
Additions | 50 | — | 315 | 70 | 435 | |||||||||||||||
Acquisitions | 316 | — | — | — | 316 | |||||||||||||||
Amortization | (372 | ) | (230 | ) | — | (45 | ) | (647 | ) | |||||||||||
Impairments | (8 | ) | (26 | ) | (15 | ) | (3 | ) | (52 | ) | ||||||||||
Assets available for use | — | 226 | (226 | ) | — | — | ||||||||||||||
Translations differences | 210 | 30 | 29 | 4 | 273 | |||||||||||||||
|
| |||||||||||||||||||
Total changes | 196 | — | 103 | 26 | 325 | |||||||||||||||
Balance as of December 31, 2015: | ||||||||||||||||||||
Cost | 6,539 | 1,668 | 522 | 522 | 9,251 | |||||||||||||||
Amortization/impairments | (3,993 | ) | (1,167 | ) | (31 | ) | (367 | ) | (5,558 | ) | ||||||||||
|
| |||||||||||||||||||
Book value | 2,546 | 501 | 491 | 155 | 3,693 | |||||||||||||||
|
| |||||||||||||||||||
The additions for 20132016 contain internally generated assets of EUR 35752 million and(2015: EUR 30 million56 million) for product development and software respectively (2012: EUR 347 million, EUR 29 million).
The impairment charges in 2013 include an impairment charge of EUR 24 million in Imaging Systems, which relate to capitalized product development for EUR 7 million and other intangibles for EUR 17 million. The impairment charge is based on a trigger-based test on a specific business unit in Imaging Systems. A change in the business outlook coming from a slower than expected sales ramp up resulted in the mentioned impairment charge. The basis of the recoverable amount used in this test is the value in use and a pre-tax discount rate of 9,6% is applied. After the impairment charge the carrying value of the related intangible assets is zero.
The impairment charges in 2013 includes an impairment charge of EUR 32 million for customer relationships in Consumer Luminaires. The charge is based on a trigger-based test on specific mature markets following the initiated turnaround plan, reconsidering product ranges and growth rates. The basis of the recoverable amount used in this test is the value in use and a pre-tax discount rate of 11.4% is applied. After the impairment charge the carrying value of the related intangible assets is zero.
software. The acquisitions through business combinations in 20122016 mainly consist of the acquired intangible assets of Indal for EUR 134 million.Wellcentive.
The amortization of intangible assets is specified innote 3,6, Income from operations.
The impairment charges in 2012 for other intangibles mainly relates to brand names in Professional Lighting Solutions. As part of the rationalization of the go-to-market model in Professional Lighting Solutions, the Company decided to discontinue the use of several brands which resulted in the mentioned impairment charge. The impairment of product development of EUR 30 million relates to various projects in all three operating sectors.
158 Annual Report 2016
 Group financial statements 10.10
Other intangible assets consist of:
Philips Group
December 31, 2012 | December 31, 2013 | |||||||||||||||
| gross | amortization/ impairments | gross | amortization/ impairments | |||||||||||||
Brand names | 966 | (374 | ) | 909 | (424 | ) | ||||||||||
Customer relationships | 3,045 | (1,318 | ) | 2,856 | (1,447 | ) | ||||||||||
Technology | 1,759 | (1,202 | ) | 1,678 | (1,226 | ) | ||||||||||
Other | 98 | (78 | ) | 90 | (76 | ) | ||||||||||
|
| |||||||||||||||
| 5,868 | (2,972 | ) | 5,533 | (3,173 | ) | |||||||||||
Amortization of other intangible assetsin millions of EUR
2015 -2016
|
| |||||||||||||||
| Balance as of December 31, 2015 | Balance as of December 31, 2016 | |||||||||||||||
| gross | amortization/ impairments | gross | amortization/ impairments | |||||||||||||
|
| |||||||||||||||
Brand names | 1,102 | (582 | ) | 1,088 | (633 | ) | ||||||||||
Customer relationships | 3,324 | (1,925 | ) | 3,429 | (2,188 | ) | ||||||||||
Technology | 1,977 | (1,373 | ) | 2,074 | (1,491 | ) | ||||||||||
Other | 136 | (113 | ) | 134 | (99 | ) | ||||||||||
|
| |||||||||||||||
Other intangibles | 6,539 | (3,993 | ) | 6,725 | (4,411 | ) | ||||||||||
|
| |||||||||||||||
The estimated amortization expense for other intangible assets for each of the next five years is:
Philips Group
2014 | 310 | |||
2015 | 283 | |||
2016 | 253 | |||
2017 | 225 | |||
2018 | 217 |
Estimated amortization expense for other intangible assets
in years
2017 | 363 | |||
2018 | 329 | |||
2019 | 314 | |||
2020 | 273 | |||
2021 | 248 | |||
|
|
The expected useful lives of the intangible assets excluding goodwill are as follows:
Philips Group
Expected useful lives of intangible assets excluding goodwill
in years
Brand names | 2-20 | |||
Customer relationships | 2-25 | |||
Technology | 3-20 | |||
Other | 1-8 | |||
Software | ||||
Product development | ||||
The expected weighted average expected remaining life of other intangible assets is 10.37.9 years as of December 31, 2013 (2012: 11.22016 (2015: 8.4 years).
The capitalized product development costs for which amortization has not yet commenced amounted to EUR 356 million (2012: EUR 361 million).
At December 31, 20132016 the carrying amount of customer relationships of Sleep & Respiratory Care & Sleep Management was EUR 459427 million with a remaining amortization period of 10.2 years.7.2 years (2015: EUR 466 million; 8.2 years).
Non-current receivables include receivables with a remaining term of more than one year.
Annual Report 2013 187


 11 Group financial statements 11.9 - 11.9
Other non-current financial assets
The changes during 20132016 were as follows:
Philips Group
| available- for-sale financial assets | loans and receivables | held-to- maturity invest- ments | financial assets at fair value through profit or loss | total | ||||||||||||||||
Balance as of January 1, 2013 | 232 | 267 | 3 | 47 | 549 | |||||||||||||||
Changes: | ||||||||||||||||||||
Reclassifications | 6 | 37 | — | — | 43 | |||||||||||||||
Acquisitions/additions | 17 | 13 | 1 | — | 31 | |||||||||||||||
Sales/redemptions/reductions | (11 | ) | (6 | ) | — | (8 | ) | (25 | ) | |||||||||||
Impairment | (8 | ) | (2 | ) | — | — | (10 | ) | ||||||||||||
Transfer to assets classified as held for sale | (62 | ) | (30 | ) | — | — | (92 | ) | ||||||||||||
Value adjustments | 17 | 1 | — | (9 | ) | 9 | ||||||||||||||
Translation and exchange differences | 1 | (8 | ) | (1 | ) | (1 | ) | (9 | ) | |||||||||||
|
| |||||||||||||||||||
Balance as of December 31, 2013 | 192 | 272 | 3 | 29 | 496 | |||||||||||||||
Available-for-saleOthernon-current financial assetsin millions of EUR
2016
|
| |||||||||||||||||||
available- for-sale | loans and receivables | held-to- maturity | financial assets at fair value through profit or loss | total | ||||||||||||||||
|
| |||||||||||||||||||
Balance as of January 1, 2016 | 232 | 222 | 2 | 33 | 489 | |||||||||||||||
Changes: | ||||||||||||||||||||
Reclassifications | (56 | ) | (100 | ) | — | (156 | ) | |||||||||||||
Acquisitions/additions | 44 | 26 | — | 3 | 73 | |||||||||||||||
Sales/redemptions | (3 | ) | (22 | ) | (1 | ) | (26 | ) | ||||||||||||
Impairment | (27 | ) | — | — | (27 | ) | ||||||||||||||
Value adjustments | (19 | ) | (2 | ) | (8 | ) | (29 | ) | ||||||||||||
Other | 1 | 10 | — | — | 11 | |||||||||||||||
|
| |||||||||||||||||||
Balance as of December 31, 2016 | 172 | 134 | 2 | 27 | 335 | |||||||||||||||
|
| |||||||||||||||||||
Available-for-sale financial assets
The Company’s investments inavailable-for-sale financial assets mainly consist of investments in common stockshares of companies in various industries. An amount of EUR 62 million has been reclassified as assets heldThe line Acquisitions/additions mainly relates to capital calls for sale in relation to the agreed contribution to the Dutch Pension Fund (please refer to note 30, Post-employment benefits and note 36, Subsequent events).certain investment funds.
Loans and receivables
During 2013The reclassification line represents loans with face value EUR 30 million were transferred to assets held for sale in relation to the agreed contribution to the Dutch Pension Fund (please refer to note 30, Post-employment benefits and note 36, Subsequent events).
Financial assets at fair value through profit or loss
The reduction ofCurrent financial assets at fair value through profit and loss includes certain financial instruments that Philips received in exchangemainly related to loans to TPV Technology Limited for the transfer of its television activities. The initial valueamount of EUR 17 million was adjusted by EUR 11 million during 2012 and EUR 6 million in 2013 reported under Value adjustments. As of December 31, 2013 the fair value reported was nil. On January 20, 2014, Philips has signed a term sheet to transfer its remaining 30% stake in TP Vision, which will also impact the above commitments. For further information, please refer to note 36, Subsequent events.
In 2010 Philips sold its entire holding of common shares in NXP Semiconductors B.V. (NXP) to Philips Pension Trustees Limited (herein referred to as “UK Pension Fund”). As a result of this transaction the UK Pension Fund obtained the full legal title and ownership of the NXP shares, including the entitlement to any future dividends and the proceeds from any sale of shares. From the date of the transaction, the NXP shares became an integral part of the plan assets of the UK Pension Fund. The purchase agreement with the UK Pension Fund includes an arrangement that may entitle Philips to a cash payment from the UK Pension Fund on or after September 7, 2014, if the total value yielded by the NXP shares has increased by this date to a level in excess of a predetermined threshold, which at the time of the transaction was substantially above the transaction price, and the UK Pension Fund is in a surplus (on a swaps basis) on September 7, 2014. The arrangement qualifies as a financial instrument and is reported under Other non-current financial assets. The Trustees of the UK Pension Fund have been selling the NXP shares in a number of transactions since 2010. The remaining number of NXP shares were sold in the course of 2013 and the total sale proceeds of the NXP shares exceeded the predetermined threshold. However as of December 31, 2013 the UK Pension Fund was not in surplus (on the agreed swaps basis). The fair value of the arrangement was estimated to be EUR 14 million as of December 31, 2012. As of December 31, 2013 management’s best estimate of the fair value of the arrangement is EUR 7 million, based on the current funded status as of December 31, 2013 (swaps basis) and the economic and demographic risks of the UK Pension Fund. The change in fair value in 2013 is reported under Value adjustments in the table above and also recognized in Financial income and expense.91 million.
Othernon-current assets
Othernon-current assets in 2013 are comprised of2016 relates to prepaid pension costs of EUR 51 million (2012:(2015: EUR 73 million) and prepaid expenses of EUR 5891 million (2012:(2015: EUR 8765 million).
For further details see note 30, Post-employment benefits.Other current assets
Other current assets include EUR 228 million (2015: EUR 214 million) accrued income, mainly related to Diagnosis & Treatment businesses and Connected Care & Health Informatics businesses, and EUR 258 million (2015: EUR 230 million) prepaid expense mainly related to Diagnosis & Treatment businesses and Connected Care & Health Informatics businesses.
Annual Report 2016 159
Group financial statements 10.10

Inventories are summarized as follows:
Philips Group
| 2012 | 2013 | |||||||
Raw materials and supplies | 1,039 | 1,029 | ||||||
Work in process | 513 | 375 | ||||||
Finished goods | 1,943 | 1,836 | ||||||
|
| |||||||
| 3,495 | 3,240 | |||||||
During 2013, inventories associated with the Audio, Video, Multimedia and Accessories (AVM&A) business have been reclassified to Assets held for sale. For more details, please refer note 7, Discontinued operations and other assets classified as held for sale.Inventoriesin millions of EUR
2015 - 2016
|
| |||||||
| 2015 | 2016 | |||||||
|
| |||||||
Raw materials and supplies | 1,068 | 1,040 | ||||||
Work in process | 475 | 446 | ||||||
Finished goods | 1,920 | 1,906 | ||||||
|
| |||||||
Inventories | 3,463 | 3,392 | ||||||
|
| |||||||
The write-down of inventories to net realizable value amountedwas EUR 108 million in 2013 to2016 (2015: EUR 199 million (2012: EUR 273170 million). The write-down is included in cost of sales.
Other current assets Receivables
Other current assets include prepaid expenses ofNon-current receivables
Non-current receivables are associated mainly with customer financing in Diagnosis & Treatment businesses amounting to EUR 35447 million (2012:(2015: EUR 33758 million) and insurance receivables in Legacy Items in the US amounting to EUR 55 million (2015: EUR 59 million).
The accounts receivable, net, per sectorsegment are as follows:
Philips Group
| 2012 | 2013 | |||||||
Healthcare | 1,967 | 1,978 | ||||||
Consumer Lifestyle | 865 | 743 | ||||||
Lighting | 1,364 | 1,567 | ||||||
Innovation, Group & Services | 138 | 132 | ||||||
|
| |||||||
| 4,334 | 4,420 | |||||||
Accountsreceivables-netin millions of EUR
2015 - 2016
|
| |||||||
| 2015 | 2016 | |||||||
|
| |||||||
Personal Health | 1,143 | 1,266 | ||||||
Diagnosis & Treatment | 1,454 | 1,476 | ||||||
Connected Care & Health Informatics | 604 | 664 | ||||||
HealthTech Other | 78 | 81 | ||||||
Lighting | 1,448 | 1,477 | ||||||
Legacy Items | — | 28 | ||||||
|
| |||||||
Accountsreceivable-net | 4,727 | 4,992 | ||||||
|
| |||||||
The aging analysis of accounts receivable, net, is set out below:
Philips Group
| 2012 | 2013 | |||||||
current | 3,624 | 3,671 | ||||||
overdue 1-30 days | 272 | 287 | ||||||
overdue 31-180 days | 298 | 305 | ||||||
overdue > 180 days | 140 | 157 | ||||||
|
| |||||||
| 4,334 | 4,420 | |||||||
A large partAging analysisin millions of overdue tradeEUR
2015 - 2016
|
| |||||||
| 2015 | 2016 | |||||||
|
| |||||||
Current | 4,003 | 4,273 | ||||||
Overdue1-30 days | 237 | 267 | ||||||
Overdue31-180 days | 337 | 310 | ||||||
Overdue > 180 days | 150 | 142 | ||||||
|
| |||||||
Accountsreceivable-net | 4,727 | 4,992 | ||||||
|
| |||||||
The above net accounts receivable relates to public sector customers with slow payment approval processes. represent current and overdue but not impaired receivables.
The changes in the allowance for doubtful accounts receivable are as follows:
Philips Group
Allowance for doubtful accounts receivablein millions of EUR
2014 - 2016
|
| |||||||||||
| 2014 | 2015 | 2016 | ||||||||||
|
| |||||||||||
Balance as of January 1 | 204 | 227 | 301 | |||||||||
Additions charged to expense | 48 | 78 | 76 | |||||||||
Deductions from allowance1) | (46 | ) | (25 | ) | (64 | ) | ||||||
Other movements | 21 | 21 | 5 | |||||||||
|
| |||||||||||
Balance as of December 31 | 227 | 301 | 318 | |||||||||
|
| |||||||||||
| 1) | Write-offs for which an allowance was previously provided |
The allowance for doubtful accounts receivable has been primarily established for receivables that are past due.
188 Annual Report 2013
11 Group financial statements 11.9 - 11.9
The changesIncluded in the allowanceabove balances as per December 31, 2016 are allowances for doubtful accounts receivable are as follows:individually impaired receivables of EUR 289 million (2015: EUR 272 million; 2014: EUR 200 million).
| 2011 | 2012 | 2013 | ||||||||||
Balance as of January 1 | 264 | 233 | 202 | |||||||||
Additions charged to income | 20 | 11 | 24 | |||||||||
Deductions from allowance1) | (31 | ) | (43 | ) | (23 | ) | ||||||
Other movements | (20 | ) | 1 | (21 | ) | |||||||
|
| |||||||||||
Balance as of December 31 | 233 | 202 | 182 | |||||||||
|
Common shares
As of December 31, 2013,2016, the issued and fully paid share capital consists of 937,845,789929,644,864 common shares, each share having a par value of EUR 0.20.
In June 2013, Philips settled a dividend of EUR 0.75 per common share, representing a total value of EUR 678 million. Shareholders could elect for a cash dividend or a share dividend. Approximately 59.8% of the shareholders elected for a share dividend, resulting in the issuance of 18,491,337 new common shares. The settlement of the cash dividend resulted in a payment of EUR 272 million.
The following table shows the movements in the outstanding number of shares; (December 31, 2015: 931,130,387; December 31, 2014: 934,819,413).
Share movement schedule
| 2012 | 2013 | |||||||
Balance as of January 1 | 926,094,902 | 914,591,275 | ||||||
Dividend distributed | 30,522,107 | 18,491,337 | ||||||
Purchase of treasury shares | (46,870,632 | ) | (27,811,356 | ) | ||||
Re-issuance of treasury shares | 4,844,898 | 8,066,511 | ||||||
Balance as of December 31 | 914,591,275 | 913,337,767 | ||||||
PreferenceOptions, restricted and performance shares
The ‘Stichting Preferente Aandelen Philips’ has been granted the right to acquire preference shares in the Company. Such right has not been exercised. As a means to protect the Company and its stakeholders against an unsolicited attempt to acquire (de facto) control of the Company, the General Meeting of Shareholders in 1989 adopted amendments to the Company’s articles of association that allow the Board of Management and the Supervisory Board to issue (rights to acquire) preference shares to a third party. As of December 31, 2013, no preference shares have been issued.
Option rights/restricted shares
The Company has granted stock options on its common shares and rights to receive common shares in the future (seenote 31,27, Share-based compensation)compensation).
Treasury shares
In connection with the Company’s share repurchase programs, shares which have been repurchased and are held in treasury for (i) delivery upon exercise of options, performance and restricted share programs and employee share purchase programs, and (ii) capital reduction purposes, are accounted for as a reduction of shareholders’ equity. Treasury shares are recorded at cost, representing the market price on the acquisition date. When issued, shares are removed from treasury shares on afirst-in,first-out (FIFO) basis.
AnyWhen treasury shares are reissued under the Company’s option plans, the difference between the cost and the cash received at the time treasury shares are issued, is recorded in retained earnings. When treasury shares are reissued under the Company’s share plans, the difference between the market price of the shares issued and the cost is recorded in retained earnings, the market price is recorded in capital in excess of par value.
Dividend withholding tax in connection with the Company’s purchase of treasury shares for capital reduction purposes is recorded in retained earnings.
The following table shows the movements in the outstanding number of shares over the last three years:
160 Annual Report 2016
Group financial statements 10.10
Philips Group
Outstanding number of sharesin number of shares
2014 - 2016
|
| |||||||||||
| 2014 | 2015 | 2016 | ||||||||||
|
| |||||||||||
Balance as of January 1 | 913,337,767 | 914,388,869 | 917,103,586 | |||||||||
Dividend distributed | 18,811,534 | 17,671,990 | 17,344,462 | |||||||||
Purchase of treasury shares | (28,537,921 | ) | (20,296,016 | ) | (25,193,411 | ) | ||||||
Re-issuance of treasury shares | 10,777,489 | 5,338,743 | 13,181,926 | |||||||||
Balance as of December 31 | 914,388,869 | 917,103,586 | 922,436,563 | |||||||||
|
| |||||||||||
The following transactions took place resulting from employee option and share plans:
Philips Group
| 2012 | 2013 | |||||||
Shares acquired | 5,147 | 3,984 | ||||||
Average market price | EUR 17.86 | EUR 22.51 | ||||||
Amount paid | EUR 0 million | EUR 0 million | ||||||
Shares delivered | 4,844,898 | 8,066,511 | ||||||
Average market price | EUR 24.39 | EUR 28.35 | ||||||
Amount received | EUR 118 million | EUR 229 million | ||||||
Total shares in treasury at year-end | 28,712,954 | 20,650,427 | ||||||
Total cost | EUR 847 million | EUR 618 million | ||||||
Employee option and share plan transactions
2014 - 2016
|
| |||||||||||
| 2014 | 2015 | 2016 | ||||||||||
|
| |||||||||||
Shares acquired | 7,254,606 | 8,601,426 | ||||||||||
Average market price | EUR 24.53 | EUR 24.73 | ||||||||||
Amount paid | EUR 178 million | EUR 213 million | ||||||||||
Shares delivered | 10,777,489 | 5,338,743 | 13,181,926 | |||||||||
Average price (FIFO) | EUR 30.26 | EUR 30.35 | EUR 25.86 | |||||||||
Cost of delivered shares | EUR 326 million | EUR 162 million | EUR 341 million | |||||||||
Total shares in treasury atyear-end | 17,127,544 | 11,788,801 | 7,208,301 | |||||||||
Total cost | EUR 470 million | EUR 308 million | EUR 181 million | |||||||||
|
| |||||||||||
In order to reduce share capital, the following transactions took place:
Philips Group
| 2012 | 2013 | |||||||
Shares acquired | 46,865,485 | 27,807,372 | ||||||
Average market price | EUR 16.41 | EUR 22.69 | ||||||
Amount paid | EUR 769 million | EUR 631 million | ||||||
Reduction of capital stock | 82,364,590 | 37,778,510 | ||||||
Total shares in treasury at year-end | 13,828,733 | 3,857,595 | ||||||
Total cost | EUR 256 million | EUR 100 million | ||||||
Share capital transactions
2014 - 2016
|
| |||||||||||
| 2014 | 2015 | 2016 | ||||||||||
|
| |||||||||||
Shares acquired | 21,283,315 | 20,296,016 | 16,591,985 | |||||||||
Average market price | EUR 23.95 | EUR 24.39 | EUR 23.84 | |||||||||
Amount paid | EUR 510 million | EUR 495 million | EUR 396 million | |||||||||
Reduction of capital stock (shares) | 21,837,910 | 21,361,016 | 18,829,985 | |||||||||
Reduction of capital stock | EUR 533 million | EUR 517 million | EUR 450 million | |||||||||
Total shares in treasury atyear-end | 3,303,000 | 2,238,000 | ||||||||||
Total cost | EUR 77 million | EUR 55 million | ||||||||||
|
| |||||||||||
Share purchase transactions related to employee option and share plans, as well as transactions related to the reduction of share capital, involved a cash outflow of EUR 606 million, which includes the impact of taxes. A cash inflow of EUR 80 million from treasury shares mainly includes settlements of share-based compensation plans.
Share call options
During 2016 Philips bought EUR and USD-denominated call options to hedge commitments under share-based compensation plans.
ForEUR-denominated call options, option premiums amounting to EUR 64 million (involving 9,393,779 options) were deducted from Retained earnings and were settled in Royal Philips shares held by the Company representing a historical cost of EUR 77 million based on a FIFO method (involving 2,667,203 shares).
ForUSD-denominated call options, option premiums amounting to EUR 35 million (involving 5,635,360 options) were deducted from Retained earnings and were settled in Royal Philips shares held by the Company representing a historical cost of EUR 32 million based on a FIFO method (involving 1,375,803 shares).
The difference between the option premiums and the historical cost of Royal Philips shares was recorded in Retained earnings. Subsequently, in 2016, the Company sold 837,913EUR-denominated call options against the same number of Royal Philips shares and an additional EUR 13 million cash payment to the buyer of the call options.
Annual Report 2016 161
Group financial statements 10.10
Philips Group
Outstanding call options
2016
|
| |||||||||||
| exercise price | options | intrinsic value in millions | weighted average remaining contractual term | |||||||||
|
| |||||||||||
EUR-denominated | ||||||||||||
10-15 | 2,530,968 | 37 | 4.6 yrs | |||||||||
15-20 | 1,063,968 | 15 | 5.1 yrs | |||||||||
20-25 | 4,960,930 | 30 | 3.3 yrs | |||||||||
|
| |||||||||||
Outstanding share call options | 8,555,866 | 82 | 3.9 yrs | |||||||||
USD-denominated | ||||||||||||
15-20 | 1,896,597 | 22 | 4.6 yrs | |||||||||
20-25 | 424,322 | 4 | 5.0 yrs | |||||||||
25-30 | 1,822,875 | 2 | 4.3 yrs | |||||||||
30-35 | 1,491,566 | — | 3.0 yrs | |||||||||
|
| |||||||||||
Outstanding share call options | 5,635,360 | 28 | 4.1 yrs | |||||||||
|
| |||||||||||
Dividend distribution
2016
In June 2016, Philips settled a dividend of EUR 0.80 per common share, representing a total value of EUR 732 million including costs. Shareholders could elect for a cash dividend or a share dividend. Approximately 55% of the shareholders elected for a share dividend, resulting in the issuance of 17,344,462 new common shares. The settlement of the cash dividend involved an amount of EUR 330 million (including costs).
A proposal will be submitted to the 2017 Annual General Meeting of Shareholders to pay a dividend of EUR 0.80 per common share, in cash or shares at the option of the shareholder fromshareholders, against the 2013 net income.income of the Company for 2016.
2015
In June 2015, Philips settled a dividend of EUR 0.80 per common share, representing a total value of EUR 730 million including costs. Shareholders could elect for a cash dividend or a share dividend. Approximately 59% of the shareholders elected for a share dividend, resulting in the issuance of 17,671,990 new common shares. The settlement of the cash dividend involved an amount of EUR 298 million (including costs).
2014
In June 2014, Philips settled a dividend of EUR 0.80 per common share, representing a total value of EUR 729 million including costs. Shareholders could elect for a cash dividend or a share dividend. Approximately 60% of the shareholders elected for a share dividend, resulting in the issuance of 18,811,534 new common shares. The settlement of the cash dividend involved an amount of EUR 293 million (including costs).
Limitations in the distribution of shareholders’ equity
PursuantAs at December 31, 2016, pursuant to Dutch law, certain limitations exist relating to the distribution of shareholders’ equity of EUR 1,609 million (2012: EUR 1,480 million).2,181 million. Such limitations relate to common shares of EUR 188186 million, (2012: EUR 191 million) as well as to legal reserves required by Dutch law included under retained earnings of EUR 1,319715 million, (2012: EUR 1,161 million), revaluation reserves of EUR 23 million (2012: EUR 54 million), available-for-sale financial assets EUR 55 million (2012: EUR 54 million) and cash flow hedges EUR 24 million (2012: EUR 20 million).
The unrealized losses related to currency translation differences of EUR 5691,234 million, (2012:available-for-sale financial assets of EUR 93 million), although qualifying as a legal reserve, reduce the distributable amount by their nature.36 million and unrealized gains related to cash flow hedges of EUR 10 million.
The legal reserve required by Dutch law of EUR 1,319715 million included under retained earnings relates to any legal or economic restrictions on the ability of affiliated companies to transfer funds to the parent company in the form of dividends.
Non-controlling interestsAs at December 31, 2015, these limitations in distributable amounts were EUR 2,274 million and related to common shares of EUR 186 million, as well as to legal reserves required by Dutch law included under retained earnings of EUR 958 million, revaluation reserve of EUR 4 million, unrealized currency translation differences of EUR 1,058 million,available-for-sale financial assets of EUR 56 million and unrealized gains related to cash flow hedges of EUR 12 million.
Non-controlling interests
Non-controlling interests represent the claims thatrelate to minority stakes held by third parties have on equity ofin consolidated group companies that are not wholly-owned by the Company. Thecompanies. As of December 31, 2016,Non-controlling interests mainly relate to Philips Lighting(Non-controlling interest 28.775%) and General Lighting Company has no material non-controlling interests. The (Non-controlling interest 49%). For further details reference is made tonote 5, Interests in entities.
Net income attributable to non-controllingNon-controlling interests amounted to EUR 343 million in 2013 (2012:(2015: EUR 514 million).
In 2013 Philips reduced its non-controlling interest by EUR 19 million due to the sale of one of its Healthcare subsidiaries in China in which a local shareholder held an ownership percentage of 49%.
Objectives, policies and processes for managing capital
Philips manages capital based upon the GAAP measures, net cash provided by operating activities and net cash used for investing activities and, the non-GAAP measures net operating capital (NOC), and net debt1). The definition of thesenon-GAAP measures and cash flows before financing activities.a reconciliation to the GAAP measures is included below.
The Company believes that an understanding of the Philips Group’s financial condition is enhanced by the disclosure of net operating capital (NOC),NOC, as this figure is used by Philips’ management to evaluate the capital efficiency of the Philips Group and its operating sectors.segments. NOC is defined as: total assets excluding assets from discontinued operationsclassified as held for sale less: (a) cash
Annual Report 2013 189
11 Group financial statements 11.9 - 11.9
and cash equivalents, (b) deferred tax assets, (c) other (non-)non-current financial assets and current financial assets, (d) investments in associates, and after deduction of: (e) long-term
162 Annual Report 2016
Group financial statements 10.10
provisions excluding deferred tax liabilities,and short-term provisions, (f) accounts and notes payable, (g) accrued liabilities, (h) current/income tax payable,(i) non-current derivative financial liabilities and (i) trading securities.current derivative financial liabilities and (j) othernon-current liabilities and other current liabilities.
Net debt1) is defined as the sum of long-long and short-term debt minus cash and cash equivalents. The net debt1) position as a percentage of the sum of group equity (shareholders’ equity andnon-controlling interests) and net debt1) is presented to express the financial strength of the Company. This measure is widely used by Treasury management of the Company and investment analysts and is therefore included in the disclosure. Our net debt1) position is managed in such a way that we expect to continuously meet our objective to retain our target at A3 rating (Moody’s) and A- rating (Standard and Poor’s).a strong investment grade credit rating. Furthermore, the Group’s objectiveaim when managing the net debt1) position is to fulfill our commitment todividend stability and a stable dividend policy with apay-out ratio of 40% to 50% target pay-out fromof continuing net income.
Cash flows before financing activities, being the sum of net cash from operating activities and net cash from investing activities, are presented separately to facilitate the reader’s understanding of the Company’s funding requirements.Philips Group
NOCNet operating capital compositionin millions of EUR
2014 - 2016
|
| |||||||||||||||||||||||
| 2014 | 2015 | 2016 | ||||||||||||||||||||||
| 2011 | 2012 | 2013 |
|
| ||||||||||||||||||||
Intangible assets | 11,012 | 10,679 | 9,766 | 10,526 | 12,216 | 12,450 | ||||||||||||||||||
Property, plant and equipment | 3,014 | 2,959 | 2,780 | 2,095 | 2,322 | 2,155 | ||||||||||||||||||
Remaining assets | 9,393 | 8,921 | 8,699 | |||||||||||||||||||||
Remaining assets1) | 9,041 | 9,423 | 9,766 | |||||||||||||||||||||
Provisions | (2,680 | ) | (2,956 | ) | (2,554 | ) | (4,517 | ) | (4,243 | ) | (3,606 | ) | ||||||||||||
Other liabilities | (10,357 | ) | (10,287 | ) | (8,453 | ) | ||||||||||||||||||
Other liabilities2) | (8,307 | ) | (8,622 | ) | (8,992 | ) | ||||||||||||||||||
|
|
|
| |||||||||||||||||||||
Net operating capital | 10,382 | 9,316 | 10,238 | 8,838 | 11,096 | 11,773 | ||||||||||||||||||
|
| |||||||||||||||||||||||
| 1) | Remaining assets are comprised ofnon-current receivables,non-current derivative financial assets, othernon-current assets, inventories, other current assets, current derivative financial assets, income tax receivable and receivables. |
| 2) | Other liabilities are comprised ofnon-current derivative financial liabilities, othernon-current liabilities, derivative financial liabilities, income tax payable, accounts and notes payable, accrued liabilities and other current liabilities. |
Philips Group
Composition of net debt toand group equity2) in millions of EUR unless otherwise stated
2014 - 2016
|
| |||||||||||||||||||||||
| 2014 | 2015 | 2016 | ||||||||||||||||||||||
| 2011 | 2012 | 2013 |
|
| ||||||||||||||||||||
Long-term debt | 3,278 | 3,725 | 3,309 | 3,712 | 4,095 | 4,021 | ||||||||||||||||||
Short-term debt | 582 | 809 | 592 | 392 | 1,665 | 1,585 | ||||||||||||||||||
|
|
|
| |||||||||||||||||||||
Total debt | 3,860 | 4,534 | 3,901 | 4,104 | 5,760 | 5,606 | ||||||||||||||||||
Cash and cash equivalents | 3,147 | 3,834 | 2,465 | 1,873 | 1,766 | 2,334 | ||||||||||||||||||
|
|
|
| |||||||||||||||||||||
Net debt (cash)1) | 713 | 700 | 1,436 | |||||||||||||||||||||
Net debt1) | 2,231 | 3,994 | 3,272 | |||||||||||||||||||||
Shareholders’ equity | 12,328 | 11,151 | 11,214 | 10,867 | 11,662 | 12,601 | ||||||||||||||||||
Non-controlling interests | 34 | 34 | 13 | 101 | 118 | 907 | ||||||||||||||||||
|
|
|
| |||||||||||||||||||||
Group equity | 12,362 | 11,185 | 11,227 | 10,968 | 11,780 | 13,508 | ||||||||||||||||||
Net debt and group equity | 13,075 | 11,885 | 12,663 | |||||||||||||||||||||
Net debt divided by net debt and group equity (in %) | 5 | 6 | 11 | |||||||||||||||||||||
Group equity divided by net debt and group equity (in %) | 95 | 94 | 89 | |||||||||||||||||||||
Net debt and group equity2) | 13,199 | 15,774 | 16,780 | |||||||||||||||||||||
Net debt divided by net debt and group equity (in %)2) | 17 | % | 25 | % | 19 | % | ||||||||||||||||||
Group equity divided by net debt and group equity (in %)2) | 83 | % | 75 | % | 81 | % | ||||||||||||||||||
Net debt and group equity ratio2) | 17:83 | 25:75 | 19:81 | |||||||||||||||||||||
|
| |||||||||||||||||||||||
| 1) | Total debt less cash and cash equivalents |
| 2) | Non-GAAP financial measure. For the definition and reconciliation to the most directly comparable GAAP measure, refer tochapter 4, Reconciliation of non-GAAP information, of this report |
CompositionThe decline in net debt1) in 2016, was mainly driven by an improved cash position of cash flowsthe Company. In 2015, total debt increased by EUR 1,656 million. New borrowings of EUR 1,335 million were mainly due to a short-term bridge loan used for the Volcano acquisition while repayments amounted to EUR 104 million. Other changes resulting from consolidation and currency effects led to an increase of EUR 425 million.
Royal Philips has a USD 2.5 billion Commercial Paper Programme and a EUR 1.8 billion committed revolving credit facility that can be used for general group purposes and as a backstop of its Commercial Paper Programme and will mature in February 2018. As of December 31, 2016, Royal Philips did not have any loans outstanding under either facility. Royal Philips’ debt instruments and the conditions applicable thereto, which include, but are not limited to, the aforementioned undrawn revolving credit facility, certain bank facilities, the aforementioned Commercial Paper Programme and the indentures applicable to the USD Bonds contain customary and general conditions. These conditions apply to Royal Philips and its subsidiaries (entities which are (in)directly controlled by Royal Philips or of which Royal Philips (in)directly owns more than 50% of the voting stock). In some instances, such conditions are limited to material subsidiaries of Royal Philips (i.e. subsidiaries that exceed certain
| 2011 | 2012 | 2013 | ||||||||||
Cash flows from operating activities | 760 | 2,082 | 1,138 | |||||||||
Cash flows from investing activities | (1,275 | ) | (925 | ) | (997 | ) | ||||||
|
| |||||||||||
Cash flows before financing activities | (515 | ) | 1,157 | 141 | ||||||||
| 1) | Non-GAAP financial measure. For the definition and reconciliation to the most directly comparable GAAP measure, refer tochapter 4, Reconciliation of non-GAAP information, of this report |
190 Annual Report 20132016 163
11 Group financial statements 11.9 - 11.910.10
Long-term debtquantitative thresholds). As per 31 December 2016, Philips Lighting and/or its subsidiaries do, in some instances, qualify as such (material) subsidiaries covered by such conditions. An example of such condition is the prohibition to any subsidiary of Royal Philips, including Philips Lighting and short-term debtits subsidiaries, from incurring any financial indebtedness outside of the group, subject to aso-called “general basket” exemption of 30% of shareholders’ equity. A material violation of this condition constitutes an event of default under the aforementioned credit/ bank facilities.
Furthermore, nonpayment on the due date or acceleration of financial indebtedness of a material subsidiary, such as Philips Lighting with respect to the IPO Financing or cancellation or suspension of any commitment thereunder as a result of an event of default, in each case of at least EUR 40 million (in case of the undrawn revolving credit facility) or EUR 50 million (in case of a EUR 200 million drawn bank facility) also constitutes an event of default under those facilities.
As per 31 December 2016 Royal Philips was not in breach of the aforementioned conditions.
In May 2016, Philips Lighting entered into a five-year term loan facility agreement. The amounts of the term facility are EUR 740 million and USD 500 million and have been fully drawn to replace intra-group financing from Royal Philips.
In addition, Philips Lighting has a five-year committed revolving credit facility of EUR 500 million which will mature in May 2021. As of December 31, 2016, Philips Lighting did not have any amounts outstanding under this facility.
Philips Lighting’s Term and Revolving Credit Facilities Agreement include a financial covenant which provides that Philips Lighting must maintain a net leverage ratio not greater than 3:1 for any test period ending on or after December 31, 2016. As at 31 December 2016, this ratio was 0.5 which is compliant with the conditions of the covenant. In addition, the Term and Revolving Credit Facilities Agreement also contains customary undertakings. These undertakings include, among others, a negative pledge that provides that (subject to certain exceptions) no member of the Philips Lighting group may grant security over Philips Lighting’s assets without the consent of the lenders, and a restriction on subsidiaries of Philips Lighting (other than the obligors) incurring additional financial indebtedness. There are also restrictions (subject to certain exceptions and thresholds) on engaging in acquisitions, disposals and reorganizations. The facilities are guaranteed by Philips Lighting and certain subsidiaries of Philips Lighting incorporated in Belgium, France, Germany, Hungary, the Netherlands, the People’s Republic of China, Poland, Spain, the United Kingdom and the United States.
Long-term debt
Philips Group
| (range of) interest rates | average interest | amount outstanding 2013 | due in 1 year | due after 1 year | due after 5 years | average remaining term (in years) | amount outstanding 2012 | |||||||||||||||||||||||||
USD bonds | 3.8 - 7.8 | % | 5.6 | % | 2,958 | — | 2,958 | 2,059 | 13.7 | 3,198 | ||||||||||||||||||||||
Convertible debentures | 0 - 0 | % | — | — | — | — | — | — | 12 | |||||||||||||||||||||||
Private financing | 0 - 0 | % | — | — | — | — | — | — | 2 | |||||||||||||||||||||||
Bank borrowings | 0 - 7.8 | % | 2.0 | % | 466 | 260 | 206 | 203 | 3.6 | 469 | ||||||||||||||||||||||
Other long-term debt | 0 - 19.0 | % | 4.4 | % | 48 | 48 | — | — | 1.0 | 52 | ||||||||||||||||||||||
|
| |||||||||||||||||||||||||||||||
| 3,472 | 308 | 3,164 | 2,262 | 3,733 | ||||||||||||||||||||||||||||
Finance leases | 0.7 - 15.1 | % | 3.8 | % | 199 | 54 | 145 | 53 | 6.3 | 243 | ||||||||||||||||||||||
|
| |||||||||||||||||||||||||||||||
| 5.0 | % | 3,671 | 362 | 3,309 | 2,315 | 3,976 | ||||||||||||||||||||||||||
Corresponding data of previous year | 5.2 | % | 3,976 | 251 | 3,725 | 3,357 | 3,417 | |||||||||||||||||||||||||
Long-term debtin millions of EUR unless otherwise stated
2015 - 2016
|
| |||||||||||||||||||||||||||||||
| (range of) interest rates | average rate of interest | amount outstanding in 2016 | amount due in 1 year | amount due after 1 year | amount due after 5 years | average remaining term (in years) | amount outstanding in 2015 | |||||||||||||||||||||||||
|
| |||||||||||||||||||||||||||||||
USD bonds | 3.8 - 7.8 | % | 5.5 | % | 3,608 | 1,184 | 2,424 | 2,424 | 9.6 | 3,733 | ||||||||||||||||||||||
Bank borrowings | 0.0-11.0 | % | 1.0 | % | 1,470 | 69 | 1,401 | 1 | 4.3 | 259 | ||||||||||||||||||||||
Other long-term debt | 0.0 - 7.0 | % | 4.0 | % | 39 | 37 | 2 | 1 | 1.3 | 42 | ||||||||||||||||||||||
|
| |||||||||||||||||||||||||||||||
Institutional financing | 5,117 | 1,290 | 3,827 | 2,426 | 4,034 | |||||||||||||||||||||||||||
Finance leases | 0 - 21.1 | % | 3.0 | % | 279 | 85 | 194 | 28 | 3.5 | 211 | ||||||||||||||||||||||
|
| |||||||||||||||||||||||||||||||
Long-term debt | 4.1 | % | 5,396 | 1,375 | 4,021 | 2,454 | 7.8 | 4,245 | ||||||||||||||||||||||||
Corresponding data of previous year | 5.2 | % | 4,245 | 150 | 4,095 | 2,831 | 10.7 | 3,860 | ||||||||||||||||||||||||
|
| |||||||||||||||||||||||||||||||
164 Annual Report 2016
Group financial statements 10.10
The following amounts of long-term debt as of December 31, 2013,2016, are due in the next five years:
Philips Group
2014 | 362 | |||
2015 | 42 | |||
2016 | 26 | |||
2017 | 16 | |||
2018 | 910 | |||
|
| |||
Total | 1,356 | |||
Corresponding amount of previous year | 619 |
Long-term debts due in the next five years in millions of EUR
2015 - 2016
| effective rate | 2012 | 2013 | ||||||||||
| Unsecured USD Bonds | ||||||||||||
Due 5/15/25; 7 3/4% | 7.429 | % | 75 | 72 | ||||||||
Due 6/01/26; 7 1/5% | 6.885 | % | 126 | 120 | ||||||||
Due 8/15/13; 7 1/4% | 6.382 | % | 108 | — | ||||||||
Due 5/15/25; 7 1/8% | 6.794 | % | 78 | 74 | ||||||||
Due 3/11/18; 5 3/4%1) | 6.066 | % | 948 | 907 | ||||||||
Due 3/11/38; 6 7/8%1) | 7.210 | % | 758 | 726 | ||||||||
Due 3/15/22; 3.750%1) | 3.906 | % | 758 | 726 | ||||||||
Due 3/15/42; 5.000%1) | 5.273 | % | 379 | 363 | ||||||||
Adjustments2) | (32 | ) | (30 | ) | ||||||||
|
| |||||||||||
| 3,198 | 2,958 | |||||||||||
2017 | 1,375 | |||
2018 | 115 | |||
2019 | 106 | |||
2020 | 78 | |||
2021 | 1,268 | |||
|
| |||
Long term debt | 2,942 | |||
Corresponding amount of previous year | 1,414 | |||
|
|
Philips Group
Unsecured USD Bonds in millions of EUR unless otherwise stated
2015 - 2016
|
| |||||||||||
| effective rate | 2015 | 2016 | ||||||||||
|
| |||||||||||
Due 5/15/25; 7 3/4% | 7.429 | % | 91 | 60 | ||||||||
Due 6/01/26; 7 1/5% | 6.885 | % | 152 | 130 | ||||||||
Due 5/15/25; 7 1/8% | 6.794 | % | 94 | 80 | ||||||||
Due 3/11/18; 5 3/4%1)2) | 6.066 | % | 1,144 | 1,187 | ||||||||
Due 3/11/38; 6 7/8%2) | 7.210 | % | 915 | 758 | ||||||||
Due 3/15/22; 3 3/4%2) | 3.906 | % | 915 | 949 | ||||||||
Due 3/15/42; 5%2) | 5.273 | % | 458 | 475 | ||||||||
Adjustments3) | (36 | ) | (31 | ) | ||||||||
|
| |||||||||||
Unsecured USD Bonds | 3,733 | 3,608 | ||||||||||
|
| |||||||||||
| 1) | In December 2016, Royal Philips has delivered a notice of redemption for the bond due in 2018 in the aggregate principal amount of USD 1,250 million for redemption in January 2017. |
| 2) | The provisions applicable to these bonds, issued in March 2008 and in March 2012, contain a ‘Change of Control Triggering Event’. If the Company would experience such an event with respect to a series of corporate bonds, the Company may be required to offer to purchase the bonds of the series at a purchase price equal to 101% of the principal amount, plus accrued and unpaid interest, if any. |
Adjustments relate to issued bond discounts, transaction costs and fair value adjustments for interest rate derivatives |
Secured liabilitiesIn October 2016, the principal amounts of USD bonds due 2025, 2026, 2038 were partially redeemed, which involved an aggregated amount of USD 285 million. This resulted in financial charges of EUR 91 million paid in 2016.
In 2013, noneDecember 2016, Royal Philips delivered a notice of redemption to the holders of the long-term and short-term debt was secured by collateral (2012:outstanding 5.750% Notes due 2018 in the aggregate principal amount of USD 1,250 million for redemption in January 2017. This resulted in financial charges of EUR nil million).62 million in 2016.
For further information, refer tonote 31, Subsequent events
Short-term debt
Philips Group
| 2012 | 2013 | |||||||
Short-term bank borrowings | 533 | 207 | ||||||
Other short-term loans | 25 | 23 | ||||||
Current portion of long-term debt | 251 | 362 | ||||||
|
| |||||||
| 809 | 592 | |||||||
Short-term debt in millions of EUR
2015 - 2016
|
| |||||||
| 2015 | 2016 | |||||||
|
| |||||||
Short-term bank borrowings | 1,510 | 207 | ||||||
Other short-term loans | 5 | 3 | ||||||
Current portion of long-term debt | 150 | 1,375 | ||||||
|
| |||||||
Short-term debt | 1,665 | 1,585 | ||||||
|
| |||||||
During 2013,2016, the weighted average interest rate on the bank borrowings was 6.4% (2012: 7.8%5.4% (2015: 1.6%).
In The increase was mainly driven by the Netherlands, the Company issued personnel debentures with a 5- year right of conversion into common shares of Koninklijke Philips NV. Convertible personnel debentures may not be converted within a period of 3 years after the date of issue. These convertible personnel debentures were available to most employees in the Netherlands and were purchased by them with their own funds and were redeemable on demand. The convertible personnel debentures become non-convertible debentures at the endrepayment of the conversion period.
Although convertible debentures have the character of long-term financing, the total outstanding amounts have been classified as current portion of long-term debt. At December 31, 2013 the conversion period ended, so none were outstanding (2012: EUR 12 million). The conversion price varied between EUR 14.2 and EUR 24.6bridge loan with various conversion periods ending between January 1, 2013 and December 31, 2013. As of January 1, 2009, Philips no longer issues these debentures.
Furthermore, Philips has a USD 2.5 billion Commercial Paper Program and a EUR 1.8 billion revolving credit facility that can below interest rate used for general corporate purposes and as a backstop of its commercial paper program. In January 2013, the EUR 1.8 billion facility was extended by 2 years until February 18, 2018. As of December 31, 2013 Philips did not have any loans outstanding under either facility.
Annual Report 2013 191
 11 Group financial statements 11.9 - 11.9
Volcano acquisition.
Philips Group
| 2012 | 2013 | |||||||||||||||
| long- term | short- term | long- term | short- term | |||||||||||||
Provisions for defined-benefit plans (see note 30) | 808 | 52 | 754 | 51 | ||||||||||||
Other postretirement benefits (see note 30) | 233 | 17 | 200 | 14 | ||||||||||||
Postemployment benefits and obligatory severance payments | 56 | 26 | 41 | 25 | ||||||||||||
Product warranty | 90 | 229 | 59 | 207 | ||||||||||||
Environmental provisions | 330 | 45 | 249 | 62 | ||||||||||||
Restructuring-related provisions | 108 | 277 | 75 | 128 | ||||||||||||
Onerous contract provisions | 67 | 61 | 40 | 53 | ||||||||||||
Other provisions | 427 | 130 | 485 | 111 | ||||||||||||
|
| |||||||||||||||
| 2,119 | 837 | 1,903 | 651 | |||||||||||||
Post-employment benefits and obligatory severance paymentsProvisions in millions of EUR
The provision for post-employment benefits covers benefits provided to former or inactive employees after employment but before retirement, including salary continuation, supplemental unemployment benefits and disability-related benefits.2015 - 2016
| 2011 | 2012 | 2013 | ||||||||||
Balance as of January 1 | 116 | 104 | 82 | |||||||||
Changes: | ||||||||||||
Additions | 29 | 12 | 15 | |||||||||
Utilizations | (41 | ) | (37 | ) | (29 | ) | ||||||
Translation differences | — | 1 | (1 | ) | ||||||||
Changes in consolidation | — | 2 | (1 | ) | ||||||||
|
| |||||||||||
Balance as of December 31 | 104 | 82 | 66 | |||||||||
|
| |||||||||||||||||||||||
| 2015 | 2016 | |||||||||||||||||||||||
|
| |||||||||||||||||||||||
| long- term | short- term | total | long- term | short- term | total | |||||||||||||||||||
|
| |||||||||||||||||||||||
Post-employment benefit (see note 20)1) | 2,140 | — | 2,140 | 1,996 | — | 1,996 | ||||||||||||||||||
Product warranty | 67 | 222 | 289 | 66 | 193 | 259 | ||||||||||||||||||
Environmental provisions | 278 | 57 | 335 | 252 | 69 | 321 | ||||||||||||||||||
Restructuring-related provisions | 69 | 228 | 297 | 27 | 174 | 201 | ||||||||||||||||||
Litigation provisions | 518 | 60 | 578 | 40 | 56 | 96 | ||||||||||||||||||
Other provisions | 399 | 205 | 604 | 545 | 188 | 733 | ||||||||||||||||||
|
| |||||||||||||||||||||||
Provisions | 3,471 | 772 | 4,243 | 2,926 | 680 | 3,606 | ||||||||||||||||||
|
| |||||||||||||||||||||||
The provision for obligatory severance payments covers the Company commitment to pay employees a lump sum upon the employee’s dismissal or resignation. In the event that a former employee has passed away, the Company may have a commitment to pay a lump sum to the deceased employee’s relatives. The Company expects the provision will be utilized mostly within the next three years.
| 1) | Adjusted to reflect a reclassification of net defined-benefit obligations into Long-term provisions as referred to innote 1, Significant accounting policies. |
Product warranty
The provisionprovisions for product warranty reflectsreflect the estimated costs of replacement andfree-of-charge services that will be incurred by the Company with respect to products sold. The Company expects the provision willprovisions to be utilized mainly within the next year. The changes in the provision
Philips Group
Provisions for product warranty are as follows: in millions of EUR
2014 - 2016
|
| |||||||||||||||||||||||
| 2014 | 2015 | 2016 | ||||||||||||||||||||||
| 2011 | 2012 | 2013 |
|
| ||||||||||||||||||||
Balance as of January 1 | 404 | 378 | 319 | 266 | 302 | 289 | ||||||||||||||||||
Changes: | ||||||||||||||||||||||||
Additions | 444 | 370 | 350 | 332 | 327 | 325 | ||||||||||||||||||
Utilizations | (470 | ) | (427 | ) | (363 | ) | (316 | ) | (357 | ) | (357 | ) | ||||||||||||
Transfer to assets classified as held for sale | — | — | (24 | ) | ||||||||||||||||||||
Translation differences | 1 | (4 | ) | (16 | ) | |||||||||||||||||||
Changes in consolidation | (1 | ) | 2 | — | ||||||||||||||||||||
Translation differences and other | 20 | 17 | 2 | |||||||||||||||||||||
|
|
|
| |||||||||||||||||||||
Balance as of December 31 | 378 | 319 | 266 | 302 | 289 | 259 | ||||||||||||||||||
|
| |||||||||||||||||||||||
Environmental provisions
The environmental provisions include accrued lossescosts recorded with respect to environmental remediation. Approximately half of this provision is expected to be utilized within the next five years. The remaining portion relates to longer-term remediation activities.
The changes in this provision are as follows:
| 2011 | 2012 | 2013 | ||||||||||
Balance as of January 1 | 250 | 305 | 375 | |||||||||
Changes: | ||||||||||||
Additions | 48 | 48 | 30 | |||||||||
Utilizations | (15 | ) | (22 | ) | (21 | ) | ||||||
Releases | (15 | ) | (1 | ) | (16 | ) | ||||||
Changes in discount rate | 25 | 18 | (40 | ) | ||||||||
Accretion | 6 | 6 | �� | 6 | ||||||||
Translation differences | 6 | (4 | ) | (8 | ) | |||||||
Purchase price allocation adjustment | — | — | (15 | ) | ||||||||
Changes in consolidation | — | 25 | — | |||||||||
|
| |||||||||||
Balance as of December 31 | 305 | 375 | 311 | |||||||||
The decrease of provision due to changes in discount rate in 2013 relates to an overall increase of the market rates used in discounting.
For more details on the main assumptions underlying environmental provisions reference is made to note 26, Contingent assets and liabilities.
Restructuring-related provisions
The most significant projects in 2013
various countries. In 2013, the most significant restructuring projects related to Lighting and were driven by the industrial footprint rationalization.
In Healthcare, the largest projects were undertaken in Customer Services, Home Healthcare Solutions and Imaging Systems in the United States, Italysubsidiaries of the Company have been named as potentially responsible parties in state and the Netherlands to reduce the operating costs and simplify the organization.
Consumer Lifestyle restructuring charges were mainly related to Personal Care (primarily in the Netherlands and Austria) and Coffee (mainly Italy).
Restructuring projects at Lighting centered on Luminaires businesses and Light Sources & Electronics, the largest of which took place in the United States, France and Belgium.
Innovation, Group & Services restructuring projects mainly focused on the Financial Operations Service Unit, primarily in Italy, France and the United States.
The Company expects the provision will be utilized mainly within the next year. The movements in the provisions and liabilitiesfederal proceedings for restructuring in 2013 are presented by sector as follows:
| Dec. 31, 2012 | addi- tions | utilized | released | other changes1) | Dec. 31, 2013 | |||||||||||||||||||
Healthcare | 77 | 14 | (50 | ) | (23 | ) | (1 | ) | 17 | |||||||||||||||
Consumer Lifestyle | 48 | 11 | (27 | ) | (10 | ) | (1 | ) | 21 | |||||||||||||||
Lighting | 198 | 64 | (110 | ) | (19 | ) | (3 | ) | 130 | |||||||||||||||
IG&S | 62 | 16 | (30 | ) | (15 | ) | 2 | 35 | ||||||||||||||||
|
| |||||||||||||||||||||||
| 385 | 105 | (217 | ) | (67 | ) | (3 | ) | 203 | ||||||||||||||||
|
The most significant projects in 2012
In 2012, the most significant restructuring projects related to Lighting and Healthcare and were driven by our change program Accelerate!.
192 Annual Report 2013
11 Group financial statements 11.9 - 11.9
In Healthcare, the largest projects were undertaken in Imaging Systems and Patient Care & Clinical Informatics in various locations in the United States, the Netherlands and Germany to reduce the operating costs and simplify the organization.
Consumer Lifestyle restructuring charges were mainly related to Lifestyle Entertainment (primarily in Hong Kong and the United States) and Coffee (mainly Italy).
Restructuring projects at Lighting centered on Luminaires businesses and Light Sources & Electronics, the largest of which took place in the Netherlands, Belgium and in various locations in the US.
Innovation, Group & Services restructuring projects focused on the IT and Financial Operations Service Units (primarily in the Netherlands), Group & Regional Overheads (mainly in the Netherlands and Italy) and Philips Innovation Services (in the Netherlands and Belgium).
The movements in the provisions and liabilities for restructuring in 2012 are presented by sector as follows:
| Dec. 31, 2011 | addi- tions | utilized | released | other changes1) | Dec. 31, 2012 | |||||||||||||||||||
Healthcare | 18 | 100 | (29 | ) | (7 | ) | (5 | ) | 77 | |||||||||||||||
Consumer Lifestyle | 39 | 58 | (41 | ) | (8 | ) | — | 48 | ||||||||||||||||
Lighting | 52 | 225 | (61 | ) | (16 | ) | (2 | ) | 198 | |||||||||||||||
IG&S | 60 | 67 | (47 | ) | (10 | ) | (8 | ) | 62 | |||||||||||||||
|
| |||||||||||||||||||||||
| 169 | 450 | (178 | ) | (41 | ) | (15 | ) | 385 | ||||||||||||||||
|
The most significant projects in 2011
In 2011, the most significant restructuring projects related to Lighting and Innovation, Group & Services were driven by our change program Accelerate!.
In Healthcare, the largest projects were undertaken in Home Healthcare Solutions, Imaging Systems and Patient Care & Clinical Informatics in various locations in the United States to reduce the operating costs and simplify the organization.
Consumer Lifestyle restructuring charges mainly relate to our remaining Television operations in Europe.
Restructuring projects at Lighting are driven by our change program Accelerate!. In addition projects centered on the Luminaires business and Light Sources & Electronics, the largest of which took place in Brazil, the Netherlands and in various locations in the US.
Innovation, Group & Services restructuring projects focused on the Global Service Units (primarily in the Netherlands), Group & Regional Overheads (mainly the Netherlands, Brazil and Italy) and Philips Design (Netherlands).
The movements in the provisions and liabilities for restructuring in 2011 are presented by sector as follows:
| Dec. 31, 2010 | addi- tions | utilized | released | other changes1) | Dec. 31, 2011 | |||||||||||||||||||
Healthcare | 33 | 16 | (17 | ) | (14 | ) | — | 18 | ||||||||||||||||
Consumer Lifestyle | 75 | 25 | (56 | ) | (6 | ) | 1 | 39 | ||||||||||||||||
Lighting | 70 | 44 | (47 | ) | (13 | ) | (2 | ) | 52 | |||||||||||||||
IG&S | 48 | 37 | (15 | ) | (14 | ) | 4 | 60 | ||||||||||||||||
|
| |||||||||||||||||||||||
| 226 | 122 | (135 | ) | (47 | ) | 3 | 169 | |||||||||||||||||
|
Onerous contract provisions
The onerous contract provisions include provisions for the loss recognized upon signing the agreement with TPV Technology Limited for the Television business of EUR 7 million (2012: EUR 24 million), provisions for unfavorable supply contracts as part of divestment transactions of EUR 38 million (2012: EUR 60 million), onerous (sub)lease contracts of EUR 38 million (2012: EUR 35 million) and expected losses on existing projects/ orders of EUR 10 million (2012: EUR 9 million).
The Company expects the provision will be utilized mostly within the next three years. The changes in the provision for onerous contract are as follows:
| 2011 | 2012 | 2013 | ||||||||||
Balance as of January 1 | — | 248 | 128 | |||||||||
Changes: | ||||||||||||
Additions | 270 | 142 | 34 | |||||||||
Utilizations | (22 | ) | (277 | ) | (64 | ) | ||||||
Releases | — | (6 | ) | (4 | ) | |||||||
Reclassification | — | 21 | (1 | ) | ||||||||
|
| |||||||||||
Balance as of December 31 | 248 | 128 | 93 | |||||||||
Other provisions
The main elements of other provisions are: provision for employee jubilee funds totaling EUR 76 million (2012: EUR 76 million), self-insurance liabilities of EUR 56 million (2012: EUR 61 million), liabilities related to business combinations totaling EUR 9 million (2012: EUR 36 million), provisions for rights of return of EUR 45 million (2012: EUR 45 million), provisions in respect of outstanding litigation totaling EUR 236 million (2012: EUR 238 million), provision for possible taxes/social security of EUR 65 million (2012: EUR 28 million) and provision for decommissioning costs of EUR 33 million (2012: EUR nil million).
In 2013, EUR 20 million of releases related to provision for business combinations.
The reclassification in 2013 includes mainly liabilities related to decommissioning costs reclassified to provisions from other (non)current liabilities and possible taxes transferred to provisions from other non- current financial assets. The reclassification in 2012 includes mainly liabilities for rights of return which were recognized in previous years in accrued liabilities.
There are provisions in respect of certain outstanding litigation within various operations, of which management expects the outcomes of these disputes to be resolved within the forthcoming five years. The actual outcome of these disputes and the timing of the resolution cannot be estimated by the Company at this time. The further information ordinarily required by IAS 37, ‘Provisions, contingent liabilities and contingent assets’ has not been disclosed on the grounds that it can be expected to seriously prejudice the outcome of the disputes.
Less than a half of provision for employee jubilee funds and provision for possible taxes/social security is expected to be utilized within next five years. Provision for self-insurance liabilities and provision for decommissioning costs are expected to be used mainly within the next five years. All other provisions are expected to be utilized within the next three years, except for provision for rights of return, which the Company expects to use within the next year.
| 2011 | 2012 | 2013 | ||||||||||
Balance as of January 1 | 310 | 389 | 557 | |||||||||
Changes: | ||||||||||||
Additions | 201 | 396 | 190 | |||||||||
Utilizations | (138 | ) | (260 | ) | �� | (148 | ) | |||||
Releases | (9 | ) | (27 | ) | (55 | ) | ||||||
Reclassification | — | 67 | 84 | |||||||||
Liabilities directly associated with assets held for sale | (6 | ) | — | (3 | ) | |||||||
Translation differences | (4 | ) | (9 | ) | (29 | ) | ||||||
Changes in consolidation | 35 | 1 | — | |||||||||
|
| |||||||||||
Balance as of December 31 | 389 | 557 | 596 | |||||||||
Annual Report 2013 193


 11 Group financial statements 11.9 - 11.9
Other non-current liabilities are summarized as follows:
| 2012 | 2013 | |||||||
Accrued pension costs | 1,166 | 813 | ||||||
Income tax payable | — | 1 | ||||||
Decommissioning cost | 23 | — | ||||||
Deferred income | 194 | 214 | ||||||
Other tax liability | 488 | 443 | ||||||
Other liabilities | 134 | 97 | ||||||
|
| |||||||
| 2,005 | 1,568 | |||||||
The decrease in the accrued pension costs is mainly attributable to the US defined benefit plan. See also note 30, Post-employment benefits.
In 2013, liabilities related to decommissioning cost were reclassified from (non)current liabilities to other provisions.
For further details on tax related liabilities refer to note 5, Income taxes.
Accrued liabilities are summarized as follows:
| 2012 | 2013 | |||||||
Personnel-related costs: | ||||||||
- Salaries and wages | 590 | 560 | ||||||
- Accrued holiday entitlements | 192 | 184 | ||||||
- Other personnel-related costs | 148 | 130 | ||||||
Fixed-asset-related costs: | ||||||||
- Gas, water, electricity, rent and other | 69 | 61 | ||||||
Distribution costs | 114 | 104 | ||||||
Sales-related costs: | ||||||||
- Commission payable | 52 | 24 | ||||||
- Advertising and marketing-related costs | 149 | 159 | ||||||
- Other sales-related costs | 118 | 98 | ||||||
Material-related costs | 186 | 175 | ||||||
Interest-related accruals | 75 | 57 | ||||||
Deferred income | 824 | 812 | ||||||
Other accrued liabilities | 654 | 466 | ||||||
|
| |||||||
| 3,171 | 2,830 | |||||||
Other current liabilities are summarized as follows:
| 2012 | 2013 | |||||||
Advances received from customers on orders not covered by work in process | 308 | 240 | ||||||
Other taxes including social security premiums | 176 | 193 | ||||||
Other liabilities | 1,071 | 649 | ||||||
|
| |||||||
| 1,555 | 1,082 | |||||||
Other liabilities include EUR 530 million (2012: EUR 442 million) accrued customer rebates that cannot be offset with accounts receivables for those customers.
On December 5, 2012 the Company announced that it received a fine of EUR 313 million from the European Commission following an investigation into alleged violation of competition rules in the Cathode-Ray Tubes (CRT) industry. In addition, the European Commission has ordered Philips and LG Electronics to be jointly and severally liable to pay a fine of EUR 392 million for an alleged violation of competition rules by LG. Philips Displays (LPD), a 50/50 joint venture between the Company and LG Electronics. In 2006, LPD went bankrupt. The aggregate of the amount of EUR 313 million and EUR 196 million (being 50% of the fine related to LPD) has been recorded under Other liabilities in December 2012 and paid in Q1 2013.
Contractual cash obligations at December 31, 20131)
| payments due by period | ||||||||||||||||||||
| total | less than 1 year | 1-3 years | 3-5 years | after 5 years | ||||||||||||||||
Long-term debt2) | 3,472 | 308 | 2 | 900 | 2,262 | |||||||||||||||
Finance lease obligations | 241 | 61 | 78 | 34 | 68 | |||||||||||||||
Short-term debt | 230 | 230 | — | — | — | |||||||||||||||
Operating leases | 1,017 | 237 | 316 | 182 | 282 | |||||||||||||||
Derivative liabilities | 337 | 112 | 93 | 92 | 40 | |||||||||||||||
Interest on debt3) | 2,421 | 185 | 346 | 315 | 1,575 | |||||||||||||||
Purchase obligations4) | 184 | 81 | 76 | 26 | 1 | |||||||||||||||
Trade and other payables | 2,462 | 2,462 | — | — | — | |||||||||||||||
|
| |||||||||||||||||||
| 10,364 | 3,676 | 911 | 1,549 | 4,228 | ||||||||||||||||
|
|
|
|
The long-term operating lease commitments are mainly related to the rental of buildings. A number of these leases originate from sale-and- leaseback arrangements. Operating lease payments under sale-and- leaseback arrangements for 2013 totaled EUR 42 million (2012: EUR 35 million).
The remaining minimum payments from operating leases originating from sale-and-leaseback arrangements are as follows:
2014 | 42 | |||
2015 | 37 | |||
2016 | 36 | |||
2017 | 35 | |||
2018 | 34 | |||
Thereafter | 171 |
194 Annual Report 2013
11 Group financial statements 11.9 - 11.9
Finance lease liabilities
| 2012 | 2013 | |||||||||||||||||||||||
| future mini- mum lease pay- ments | interest | present value of mini- mum lease pay- ments | future mini- mum lease pay- ments | interest | present value of mini- mum lease pay- ments | |||||||||||||||||||
Less than one year | 73 | 7 | 65 | 61 | 7 | 54 | ||||||||||||||||||
Between one and five years | 137 | 25 | 113 | 112 | 20 | 92 | ||||||||||||||||||
More than five years | 88 | 23 | 65 | 68 | 15 | 53 | ||||||||||||||||||
|
| |||||||||||||||||||||||
| 298 | 55 | 243 | 241 | 42 | 199 | |||||||||||||||||||
Philips entered into contracts with several venture capitalists where it committed itself to make, under certain conditions, capital contributions to investment funds to an aggregated amount of EUR 40 million (2012: EUR 48 million) until June 30, 2021. As at December 31, 2013 capital contributions already made to these investment funds are recorded as available-for-sale financial assets within Other non-current financial assets.
Based on its 30% share in the TP Vision venture, Philips had various commitments to provide further funding to the TP Vision venture at December 31, 2013 (see note 32, Related-party transactions).
On 20 January 2014, Philips has signed a term sheet to transfer its remaining 30% stake in the TP Vision venture, which will also impact the above commitments (see note 36, Subsequent events).
See also note 7, Discontinued operations and other assets classified as held for sale for further details on the Television business divestment.
Contingent assets and liabilities
Contingent assets
In 1996, CIEM (Labor Union of Manaus) representing, among other companies Philips Brazil, filed a fiscal claim against Manaus Free Trade Zone Superintendence (SUFRAMA), in order to obtain a judicial declaration of the illegality and unconstitutionality of the Public Price tax, charged by SUFRAMA. The Lower Court ruled favorable for Philips.
In September 2007, Philips requested the Settlement of Declaratory Judgment, in order to refund the amounts unduly paid to SUFRAMA during 1992 to 1999. In August 2011, a ruling was issued to approve Philips credit for the amount of EUR 36 million (BRL 118 million). The estimated amount as of year-end 2013 is EUR 40 million (BRL 130 million), the increase explained by interest.
In December 2008, SUFRAMA filed the appeal against the decision issued in the records of the Settlement of Declaratory Judgment. The Regional Court unanimously upheld the Lower Court decision to reject SUFRAMA’s appeal. SUFRAMA filed two appeals against the Regional Court decision. One to the Superior Court of Justice (STJ) and the other to Supreme Court. Both appeals were denied. SUFRAMA filed a Bill of Review against the decision that denied both appeals. The appeal was admitted in STJ. The judgment is pending since October 2013. Final decision is expected in two years.
Contingent liabilities
Guarantees
Philips’ policy is to provide guarantees and other letters of support only in writing. Philips does not stand by other forms of support. At the end of 2013, the total fair value of guarantees recognized by Philips in other non- current liabilities amounted to less than EUR 1 million. The following table outlines the total outstanding off-balance sheet credit-related guarantees and business-related guarantees provided by Philips for the benefit of unconsolidated companies and third parties as at December 31, 2013.
Expiration per period
in millions of euros
| business- related guarantees | credit- related guarantees | total | ||||||||||
| 2013 | ||||||||||||
Total amounts committed | 292 | 41 | 333 | |||||||||
Less than one year | 107 | 19 | 126 | |||||||||
Between one and five years | 117 | 7 | 124 | |||||||||
After five years | 68 | 15 | 83 | |||||||||
| 2012 | ||||||||||||
Total amounts committed | 295 | 27 | 322 | |||||||||
Less than one year | 113 | 11 | 124 | |||||||||
Between one and five years | 114 | — | 114 | |||||||||
After five years | 68 | 16 | 84 | |||||||||
Environmental remediation
The Company and its subsidiaries are subject to environmental laws and regulations. Under these laws, the Company and/or its subsidiaries may be required to remediate the effects of certain chemicals on the environment. The Company accrues for losses associated with environmental obligations when such losses are probable and reliably estimable. Such amounts are recognized on a discounted basis since they reflect the present value of estimated future cash flows.
Provisions for environmental remediation can change significantly due to the emergence of additional information regarding the extent or nature of the contamination, the need to utilize alternative technologies, actions by regulatory authorities andas well as changes in judgments assumptions, and discount rates.
Annual Report 2016 165
Group financial statements 10.10
Philips Group
Environmental provisions in millions of EUR
2014 - 2016
|
| |||||||||||
| 2014 | 2015 | 2016 | ||||||||||
|
| |||||||||||
Balance as of January 1 | 311 | 360 | 335 | |||||||||
Changes: | ||||||||||||
Additions | 29 | 27 | 18 | |||||||||
Utilizations | (23 | ) | (24 | ) | (24 | ) | ||||||
Releases | (15 | ) | (36 | ) | (36 | ) | ||||||
Changes in discount rate | 30 | (7 | ) | 11 | ||||||||
Accretion | 8 | 7 | 7 | |||||||||
Translation differences and other | 20 | 8 | 10 | |||||||||
|
| |||||||||||
Balance as of December 31 | 360 | 335 | 321 | |||||||||
|
| |||||||||||
The release of the provisions in 2016 originates from additional insights in relation to factors like the estimated cost of remediation, changes in regulatory requirements and efficiencies in completion of various site work phases.
For more details on the environmental remediation reference is made tonote 25, Contingent assets and liabilities.
Approximately half of these provisions are expected to be utilized within the next five years. The remaining portion relates to longer-term remediation activities.
Restructuring-related provisions
Philips Group
Restructuring-related provisions in millions of EUR
2016
|
| |||||||||||||||||||||||
| Jan. 1, 2016 | additions | utilizations | releases | other changes1) | Dec. 31, 2016 | |||||||||||||||||||
|
| |||||||||||||||||||||||
Personal Health | 32 | 7 | (29 | ) | (2 | ) | (3 | ) | 5 | |||||||||||||||
Diagnosis & Treatment | 28 | 11 | (19 | ) | (6 | ) | (1 | ) | 13 | |||||||||||||||
Connected Care & Health Informatics | 21 | 11 | (14 | ) | (6 | ) | 1 | 13 | ||||||||||||||||
HealthTech Other | 38 | 35 | (16 | ) | (19 | ) | (1 | ) | 37 | |||||||||||||||
Lighting | 178 | 95 | (118 | ) | (27 | ) | 5 | 133 | ||||||||||||||||
Legacy Items | — | (1 | ) | (1 | ) | (1 | ) | 3 | — | |||||||||||||||
|
| |||||||||||||||||||||||
Philips Group | 297 | 158 | (197 | ) | (61 | ) | 4 | 201 | ||||||||||||||||
|
| |||||||||||||||||||||||
| 1) | Other changes primarily relate to translation differences and reclassifications to liabilities associated with assets held for sale. |
In 2016, restructuring projects at HealthTech Other mainly took place in the Netherlands.
In 2016 the most significant restructuring projects were related to manufacturing footprint rationalization and simplification of the business structure in Lighting. The restructuring projects mainly took place in France and Belgium. The release of the provisions mainly originates from lower than expected severance payments from the manufacturing footprint rationalization projects.
The Company and/or its subsidiaries have recognized environmental remediationexpects the provisions will be utilized mainly within the next year.
2015
The movements in the provisions for sitesrestructuring in various countries. In the United States, subsidiaries of the Company have been named2015 by segment are presented as potentially responsible parties in state and federal proceedings for the clean-up of certain sites.follows:
Philips Group
Legal proceedingsRestructuring-related provisions in millions of EUR
2015
|
| |||||||||||||||||||||||
| Jan. 1, 2015 | addi- tions | utilizations | releases | other changes1) | Dec. 31, 2015 | |||||||||||||||||||
|
| |||||||||||||||||||||||
Personal Health | 13 | 30 | (7 | ) | (4 | ) | — | 32 | ||||||||||||||||
Diagnosis & Treatment | 29 | 30 | (24 | ) | (7 | ) | — | 28 | ||||||||||||||||
Connected Care & Health Informatics | 16 | 20 | (12 | ) | (3 | ) | — | 21 | ||||||||||||||||
HealthTech Other | 87 | 25 | (32 | ) | (41 | ) | (1 | ) | 38 | |||||||||||||||
Lighting | 235 | 89 | (114 | ) | (33 | ) | 1 | 178 | ||||||||||||||||
Legacy Items | — | — | — | — | — | — | ||||||||||||||||||
|
| |||||||||||||||||||||||
Philips Group | 380 | 194 | (189 | ) | (88 | ) | — | 297 | ||||||||||||||||
|
| |||||||||||||||||||||||
| 1) | Other changes primarily relate to translation differences and transfers between segments |
In 2015, restructuring projects at Diagnosis & Treatment businesses, Connected Care & Health Informatics and HealthTech Other mainly took place in the US and France.
Personal Health restructuring projects were mainly in Italy.
The most significant restructuring projects were mainly related to the industrial footprint rationalization projects in Lighting, the largest of which took place in France and Indonesia.
HealthTech Other restructuring projects were mainly related to Group and Regional organizations and centered primarily in France and the Netherlands.
The release mainly results from unforeseen changes to the IT restructuring plan in 2015.
166 Annual Report 2016
Group financial statements 10.10
2014
The movements in the provisions for restructuring in 2014 are presented by segment as follows:
Philips Group
Restructuring-related provisions in millions of EUR
2014
|
| |||||||||||||||||||||||
| Jan. 1, 2014 | addi- tions | utilizations | releases | other changes1) | Dec. 31, 2014 | |||||||||||||||||||
|
| |||||||||||||||||||||||
Personal Health | 22 | 9 | (11 | ) | (7 | ) | — | 13 | ||||||||||||||||
Diagnosis & Treatment | 10 | 39 | (15 | ) | (6 | ) | 1 | 29 | ||||||||||||||||
Connected Care & Health Informatics | 6 | 24 | (10 | ) | (4 | ) | — | 16 | ||||||||||||||||
HealthTech Other | 19 | 83 | (12 | ) | (4 | ) | 1 | 87 | ||||||||||||||||
Lighting | 146 | 209 | (94 | ) | (17 | ) | (9 | ) | 235 | |||||||||||||||
Legacy Items | — | — | — | 1 | (1 | ) | — | |||||||||||||||||
|
| |||||||||||||||||||||||
Philips Group | 203 | 364 | (142 | ) | (37 | ) | (8 | ) | 380 | |||||||||||||||
|
| |||||||||||||||||||||||
| 1) | Other changes primarily relate to translation differences and transfers between segments |
In 2014, restructuring projects at Diagnosis & Treatment businesses and Connected Care & Health Informatics businesses mainly took place in the US and the Netherlands.
Personal Health businesses restructuring projects were mainly in the Netherlands.
The most significant restructuring projects related to Lighting and HealthTech Other and were driven by industrial footprint rationalization and the Accelerate! transformation program.
Restructuring projects at Lighting mainly took place in Belgium, the Netherlands and France.
HealthTech Other restructuring projects were mainly related to IT and group and country overheads and centered primarily on the Netherlands, US and Belgium.
Litigation provisions
The Company and certain of its group companies and former group companies are involved as a party in legal proceedings, including regulatory and other governmental proceedings, including discussions on potential remedial actions, relating to such matters as competition issues, commercial transactions, product liability, participations and environmental pollution.proceedings.
In respectPhilips Group
Litigation provisions in millions of antitrust laws, the Company and certain of its (former) group companies are involved in investigations by competition law authorities in several jurisdictions and are engaged in litigation in this respect. Philips is oneEUR
2014 - 2016
|
| |||||||||||
| 2014 | 2015 | 2016 | ||||||||||
|
| |||||||||||
Balance as of January 1 | 236 | 653 | 578 | |||||||||
Changes: | ||||||||||||
Additions | 563 | 66 | 31 | |||||||||
Utilizations | (32 | ) | (25 | ) | (297 | ) | ||||||
Releases | (23 | ) | (25 | ) | (98 | ) | ||||||
Reclassifications | (138 | ) | (161 | ) | (141 | ) | ||||||
Changes in discount rate | — | 8 | 5 | |||||||||
Accretion | 6 | 12 | 8 | |||||||||
Translation differences | 41 | 50 | 10 | |||||||||
|
| |||||||||||
Balance as of December 31 | 653 | 578 | 96 | |||||||||
|
| |||||||||||
The most significant proceedings
The majority of the companies that were inspected by officials ofmovements in the European Commission in December 2013. The European Commission is looking into potential restrictions on online sales of consumer electronic productsabove schedule related to the Masimo Corporation (Masimo) patent litigation and small domestic appliances. Philips is fully cooperating with the European Commission.
Since the ultimate disposition of asserted claims and proceedings and investigations cannot be predicted with certainty, an adverse outcome could have a material adverse effect on the Company’s consolidated financial position, results of operations and cash flows.
Provided below are disclosures of the more significant cases:Cathode Ray Tube (CRT) antitrust litigation.
Cathode-Ray Tubes (CRT)Masimo Corporation (Masimo) patent litigation
On November 21, 2007, the Company announced that competition law authoritiesOctober 1, 2014, a jury awarded USD 467 million to Masimo Corporation (Masimo) in several jurisdictions had commenced investigations into possible anticompetitive activities in the Cathode-Ray Tubes, or CRT industry. On December 5, 2012, the European Commission issued a decision imposing fines on (former) CRT manufacturers including the Company. The European Commission imposed a fine of EUR 313 million on the Company and a fine of EUR 392 million jointly and severally on the Company and LG Electronics, Inc. In total a payable of EUR 509 million was recognized and the fine was paid in the first quarter of 2013. The Company has appealed the decision of the European Commission. The
Annual Report 2013 195
11 Group financial statements 11.9 - 11.9
authorities in Brazil and Hungary are continuing to pursue the matter against Philips and other defendants. Philips will respond to these allegations in 2014.
Subsequent to the public announcement of these investigations in 2007, certain Philips group companies were named as defendants in over 50 class action antitrust complaints filed in various federal district courts in the United States. These actions allege anticompetitive conduct by manufacturers of CRTs and seek treble damages on behalf of direct and indirect purchasers of CRTs and products incorporating CRTs. These complaints assert claims under federal antitrust law, as well as various state antitrust and unfair competition laws and may involve joint and several liability among the named defendants. These actions have been consolidated by the Judicial Panel for Multidistrict Litigation for pretrial proceedings intrial held before the United States District Court for the Northern District of California.Delaware. The decision by the jury completed an initial phase of a three-phase trial regarding a first lawsuit started by Masimo against the Company in 2009. A second lawsuit was started by Masimo against the Company in 2016. Between the two lawsuits, claims were raised by the parties against each other relating to patent infringement and antitrust violations in the field of pulse oximetry.
In 2012 a settlement agreement was approved betweenOn November 5, 2016, the Company and counsel for direct purchaser plaintiffs fully resolvingMasimo entered into a wide-ranging, multi-year business partnership involving both companies’ innovations in patient monitoring and therapy solutions, ending all claimspending lawsuits between the two companies, including releasing the Company from paying the USD 467 million jury verdict.
The Company and Masimo also have agreed to:
a USD 300 million cash payment by Philips to Masimo;
aone-time donation to the Masimo Foundation of USD 5 million to support the Masimo Foundation’s project on patient safety and better outcomes;
commitments of the direct purchaser class and obtaining a complete release by class members. Sixteen individual plaintiffs, principally large retailers of CRT products who sought exclusion from the direct purchaser class settlement, filed separate “opt-out” actions against Philips and other defendants based on the same substantive allegations as the putative class plaintiff complaints. These cases are consolidated for pre-trial purposes with the putative class actions in the Northern District of California and discovery is being coordinated. Philips’ motions to dismiss the complaints of the individual plaintiffs have been denied. Trials on the individual claims have not yet been scheduled.
On September 24, 2013 a class of indirect purchasers was certified pursuant to F.R.C.P. 23. Discovery is proceeding in the indirect purchaser action and a trial on these claims is currently scheduled for 2015. Philips intends to continue to vigorously defend these indirect purchaser and individual lawsuits.
In addition, the state attorneys general of California, Florida, Illinois, Oregon and Washington filed actions against Philips and other defendants seeking to recover damages on behalf of the states and, in parens patriae capacity, their consumers. In 2012 the Florida complaint was withdrawn. In 2013 a settlement agreement with the state attorney general of California has been approved. The actions brought by the state attorneys general of Illinois, Oregon and Washington are pending in the respective state courts of the plaintiffs. The Courts have not set trial dates and there is no timetable for the resolution of these cases. Philips intends to continue to vigorously defend these remaining lawsuits.
Certain Philips group companies have also been named as defendants, in proposed class proceedings in Ontario, Quebec and British Columbia, Canada, along with numerous other participants in the industry. At this time, no statement of defense has been filed, no certification motion has been scheduled and no class proceeding has been certified as against the Philips defendants. Philips intends to vigorously oppose these claims.
Due to the considerable uncertainty associated with certain of these matters, on the basis of current knowledge, the Company has concluded that potential losses cannot be reliably estimated with respect to these matters. These investigationssales targets, marketing and product integration over the coming years of about USD 136 million.
Entering into the agreements resulted in a payment of USD 305 million (EUR 280 million) in November 2016, a release of litigation could haveprovisions of USD 86 million (EUR 79 million) and a materially adverse effect on the Company’s consolidatedliability reclassification from litigation provisions to other provisions of USD 136 million (EUR 125 million).
Annual Report 2016 167
Group financial position, results of operationsstatements 10.10
The additions in 2014 and cash flows.utilizations and reclassifications in 2016 mainly related to Masimo. Reclassifications include reclassification from litigation provisions to other provisions.
Cathode Ray Tube (CRT) antitrust litigation
In addition2014, the majority of the remaining additions and remaining ending balance as of December 31, 2014 related to the above cases, in 2006 Italian investor Mr. Carlo Vichi filed a claim against Philips for the repayment of a 2002 EUR 200 million loan (plus interest and damages) that was given to an affiliatecertain parts of the CRT joint venture LG.Philips Displays (“LPD”) that went bankrupt in January of 2006. Oneantitrust litigation for which the Company concluded it was able to make a reliable estimate of the issuescash outflow or was able to reach a settlement.
In 2014, the reclassifications in the caseschedule above related to certain parts of the CRT antitrust litigation where the Company was whether LPD’s alleged participationable to reach a settlement. Settlements in excess of provisions recognized previously were recognized as an increase of other current liabilities. These settlements were subsequently paid out in 2015.
In 2014, as a result of the aforementioned changes in estimates for the CRT antitrust litigation, the results of other business expenses of EUR 271 million mainly related to certain parts of the CRT antitrust litigation for which the Company concluded it was able to make a reliable estimate of the cash outflow or where the Company was able to reach a settlement.
In 2015, the majority of reclassifications related to the transfer to other liabilities for certain parts of the CRT antitrust litigation for which the Company was able to reach a settlement. These settlements were subsequently paid out in 2015.
In 2016, the remaining reclassifications relate to the transfer to other liabilities for several small CRT cases for which the Company was able to reach a settlement. These settlements were subsequently partially paid out in 2016.
For more details reference is made tonote 25, Contingent assets and liabilities.
Other
The translation differences in the CRT cartel as determinedschedule above are mainly explained by the European Commission was a matter that should have been disclosed to Mr. Vichi. The trialmovements in the case took placeUSD/EUR rate which impacted the litigation provisions denominated in December 2012 and after a period of post-trial briefing, the Delaware Chancery Court ruled in favor of Philips on February 18, 2014. The decision is subject to appeal to the Delaware Supreme Court.USD.
Optical Disc Drive (ODD)
On October 27, 2009, the Antitrust Division of the United States Department of Justice confirmed that it had initiated an investigation into possible anticompetitive practices in the Optical Disc Drive (ODD) industry. Philips Lite-On Digital Solutions Corp. (PLDS), a joint venture owned by the Company and Lite-On IT Corporation, as an ODD market participant, is included in this investigation. PLDS and the Company have been accepted under the Corporate Leniency program of the US Department of Justice and have continued to cooperate with the authorities in these investigations. On this basis, theThe Company expects to be immuneuse the provisions mainly within the next three years.
Other provisions
Philips Group
Other provisionsin millions of EUR
2014 - 2016
|
| |||||||||||
| 2014 | 2015 | 2016 | ||||||||||
|
| |||||||||||
Balance as of January 1 | 519 | 575 | 604 | |||||||||
Changes: | ||||||||||||
Additions | 213 | 198 | 183 | |||||||||
Utilizations | (153 | ) | (186 | ) | (167 | ) | ||||||
Releases | (37 | ) | (35 | ) | (61 | ) | ||||||
Reclassification | 17 | 14 | 142 | |||||||||
Accretion | 6 | 7 | 8 | |||||||||
Translation differences and other | 10 | 31 | 24 | |||||||||
|
| |||||||||||
Balance as of December 31 | 575 | 604 | 733 | |||||||||
|
| |||||||||||
The main elements of other provisions are:
provisions for possible taxes/social security of EUR 131 million (2015: EUR 99 million);
onerous contract provisions for unfavorable supply contracts as part of divestment transactions, onerous (sub)lease contracts and expected losses on existing projects /orders totaling EUR 85 million (2015: EUR 106 million);
provisions for employee jubilee funds EUR 84 million (2015: EUR 71 million);
self-insurance provisions of EUR 77 million (2015: EUR 70 million);
provisions for decommissioning costs of EUR 48 million (2015: EUR 52 million);
provisions for rights of return of EUR 46 million (2015: EUR 52 million);
provisions for other employee benefits and obligatory severance payments of EUR 38 million (2015: EUR 47 million);
a reclassification from governmental fines.
In July 2012, the European Commission issued a Statement of Objections addressed to (former) ODD suppliers including the Company. The European Commission granted the Company immunity from fines, conditional upon the Company’s continued cooperation. The Company respondedlitigation provisions which is linked to the Statement of Objections bothagreement with Masimo (see Litigation provisions in writing and at an oral hearing. PLDS is also subjectthis note).
Other provisions are expected to similar investigations outsidebe utilized mainly within the US and Europe relating to the ODD market. Where relevant, the Company is cooperating with the authorities.
Subsequent to the public announcement of these investigations in 2009, the Company, PLDS and Philips & Lite-On Digital Solutions USA, Inc. (PLDS USA), among other industry participants, were named as defendants in numerous class action antitrust complaints filed in various federal district courts in the United States. These actions allege anticompetitive conduct by manufacturers of ODDs and seek treble damages on behalf of direct and indirect purchasers of ODDs and products incorporating ODDs. These complaints assert claims under federal antitrust law, as well as various state antitrust and unfair competition laws and may involve joint and several liability among the named defendants. These actions have been consolidated for pre-trial proceedings in the United States District Court for the Northern District of California.
Consolidated Amended Complaints were filed by direct and indirect purchasers. The defendants’ motions to dismiss these Complaints were denied and Philips has filed Answers to the Complaints. Discovery is proceeding. Plaintiffs filed motions seeking to certify the putative classes of direct and indirect purchasers under F.R.C.P. Rule 23 in May 2013, and Defendants have filed responses opposing class certification. Plaintiffs are scheduled to file reply briefs in February 2014, and oral argument will be scheduled after briefing is complete. In addition,next five individual entities have filed separate actions against the Company, PLDS, PLDS USA and other defendants. The allegations contained in these individual complaints are substantially identical to the allegations in the direct purchaser class complaints. The Company is in the process of submitting answers to these various individual complaints. All of these matters have been consolidated into the action in the Northern District of California for pre-trial purposes and discovery is being coordinated. The Company intends to vigorously defend all of the civil actions in the US courts.
Also, in June 2013, the State of Florida filed a separate complaint in the Northern District of California against the Company, PLDS, PLDS USA and other defendants containing largely the same allegations as the class and individual complaints. Florida seeks to recover damages sustained in its capacity as a buyer of ODDs and, in its parens patriae capacity, on behalf of its citizens. This case has been joined with the ODD class action cases in the Northern District of California for pre-trial purposes. The Company intends to seek dismissal of the Florida complaint. The Company and certain Philips group companies have also been named as defendants, in proposed class proceedings in Ontario, Quebec, British Columbia, and Manitoba, Canada along with numerous other participants in the industry. These complaints assert claims against various ODD manufacturers under federal competition laws as well as tort laws and may involve joint and several liability among the named defendants. Philips intends to vigorously defend these lawsuits.
Due to the considerable uncertainty associated with these matters, on the basis of current knowledge, the Company has concluded that potential losses cannot be reliably estimated with respect to these matters. These investigations and litigation could have a materially adverse effect on the Company’s consolidated financial position, results of operations and cash flows.
Smart card chips
Philips is part of an investigation by the European Commission into alleged anti-competitive conduct in the period September 2003 to September 2004 relating to the former Philips smart card chips business. This business was part of Philips’ former Product Division Semiconductors, which was divested in 2006. The European Commission issued its Statement of Objections on April 22, 2013. The Company responded to the Statement of Objections both in writing and at a hearing. Based on our current knowledge, the Company does not believe that this investigation will have a materially adverse effect on the Company’s consolidated financial position.years, except for:
196 Annual Report 2013provisions for employee jubilee funds of which less than half are expected to be utilized within the next five years;
11 Group financial statements 11.9 - 11.9
provisions for rights of return to be utilized mainly within the next year;
provisions for contingent consideration to be utilized within the next year.
Cash from (used for) derivatives and current financial assets
A total of EUR 93 million cash was paid with respect to foreign exchange derivative contracts related to financing activities (2012: EUR 47 million outflow; 2011: EUR 25 million inflow).
A total of EUR 8 million was paid with respect to current financial assets (2012: EUR 1 million inflow; 2011: EUR 1 million inflow).
Purchase and proceeds from non-current financial assets
In 2013, there were no significant cash flows resulting from investing activities.
In 2012, the cash outflow was mainly due to loans provided to TPV Technology Limited and TP Vision venture in connection with the divestment of the Television business (EUR 151 million in aggregate).
In 2011, the sale of Philips’ interest in TCL Corporation (TCL) and Digimarc generated cash totaling EUR 79 million.
Assets in lieu of cash from sale of businesses
In 2013, there were no transactions related to the sale of businesses that involved assets in lieu of cash.
In 2012, Philips received certain financial instruments in exchange for the transfer of its television business. At the date of this transaction the fair value of these financial instruments involved an amount of EUR 17 million.
In 2011, the Company entered into four transactions with different venture capital partners where certain incubator activities were transferred in exchange for shares in separately established investment entities. The investment entities represented a value of EUR 18 million at the date that these transactions were closed.
Employee post-employment plans have been established in many countries in accordance with the legal requirements, customs and the local practice in the countries involved.
Most employees that take part in a Company pension plan are covered by defined-contribution (DC) pension plans. The Company also sponsors a number of defined-benefit (DB) pension plans. The benefits
168 Annual Report 2016
Group financial statements 10.10
provided by these plans are based on employees’ years of service and compensation levels. The Company also sponsors a limited number of defined-benefitDB retiree medical plans. The benefits provided by these plans are typically coveringcover a part of the healthcare insurance costs after retirement. Most employees that take part in a Company pension plan however are covered by defined-contribution (DC) pension plans.
The largest defined-benefitDB pension plans in 2016 are in;
The Netherlands,
The United Kingdom (UK) and
Thein the United States (US).and Germany.
Together theseThese plans account for more than 90%approximately 80% of the total defined- benefitdefined-benefit obligation (DBO) and plan assets.
The Netherlands
The pension plan in the Netherlands is of a defined-benefit nature. The annual accrual rate in this career average pay plan that covers all employees covered under the Collective Labour Agreement is 1.85% of the pension salary. Executives are in a ‘hybrid plan’ with an accrual rate of 1.25% per service year next to a DC contribution, the level of which depends on the executive grade. Both plans are executed by the Company Pension Fund.
Indexation of benefits is conditional and depends among others on the statutory and regulatory funding ratio of the Fund. The Company is required to fund the annual service cost plus surcharges for solvency requirements, costs and a contribution for indexation. The Company is required to pay additional surcharges in case the funded status of the Company Pension Fund drops below an agreed level. The Company is entitled to discounts and refunds if the funded status of the Company Pension Fund exceeds an agreed surplus level.
Following the new Collective Labour Agreement with the respective trade unions in 2013 a new funding agreement has been agreed with the Trustees of the Company Pension Fund. Under the new funding agreement, which becomes effective January 1, 2014, the Company has no further financial obligation to the Pension Fund other than to pay an agreed fixed contribution for the annual accrual of active members. Although the new funding agreement will de-risk the plan, the annual premium can be subject to variability after five years due to potential discounts and as a result, the plan continues to be accounted for as a defined benefit plan. The other changes in the plan are a new pensionable age of 67 (was 65) and the introduction of an employee contribution. These changes had practically no impact on the existing defined benefit obligation. For further details we refer to note 36, Subsequent events.
United Kingdom
The UK plan is executed by a Company Pension Fund. In the UK plan the accrual of new benefits ceased in 2011. A legally mandatory indexation for accrued benefits still applies. The Company does not pay regular contributions, other than an agreed portion of the administration costs.
The UK plan assets until September 2013 contained a high concentration of NXP shares. The NXP shares were transferred to the Fund by the Company in 2010 as part of a recovery plan and have by now all been sold by the UK Fund. In 2013 the Trustee of the UK Fund entered into a bulk insurance contract - a buy-in - which provides for payment in respect of a part of the Fund’s pensioners. The asset value related to this buy-in included in the UK plan assets equals the defined-benefit obligation of the related pensioners and is EUR 508 million per December 31, 2013.
United States
The US defined-benefit plan covers certain hourly workers and salaried workers hired before January 1, 2005.
The accrual for salaried workers in the US plan will end per December 31, 2015. The announcement in 2013 of this delayed freeze in the US plan triggered a past service cost gain of EUR 78 million. In the same US plan in 2013 a large group of terminated vested employees accepted a lump-sum offering thus lowering the plan assets and liabilities. The related settlement result was a loss of EUR 31 million.
pension plans are closed plans without further pension accrual. Indexation of benefits is not mandatory. The Company pays contributions for the annual service costs as well as additional contributions to cover a deficit. The assets of the US planfunded pension plans are in a TrustTrusts governed by Trustees. The excess pension plans that covered accrual above the maximum salary of the funded plan are unfunded. De-risking contributions to the funded plans in 2016 amounted to EUR 242 million.
During 2016, in line with the split of the Company, two new Trusts were created covered by ERISA section 4044, which ensures an appropriate split of the plan assets, among others based on the maturity of the respective plans. A group of active employees who opted for a settlement of their rights via a lump sum or via the purchase of an insured annuity contract remained in the original Trust. To enable the settlements the Company provided for additional funding to the original Trust of EUR 14 million on top of thede-risking contributions. The difference between the related DBO and the lump sums paid and the annuity purchase price at transfer date was a EUR 2 million gain which is recognized as a settlement income in the income statement.
In 2016 the Company adopted the new mortality table RP2014-MP2016 for all US plans except for the unfunded excess plan where RP2006-MP2016 + white collar adjustment is the new table adopted. The new tables lowered the DBO by EUR 45 million. The new table published by the US Society of Actuaries adds 5 years of extra observation compared to MP2014 (the previous mortality table) and reconfirmed that the actual improvement in longevity is lower than assumed earlier.
Germany
The Company has several DB plans in Germany which for the largest part are unfunded, meaning that after retirement the Company is responsible for the annuity payments to retirees.
Due to the relatively high level of social security, the Company pension plans mainly provide benefits for the higher earners. Although the benefit design is of a DC type the German plans even when externally funded are accounted for as DB plans due to a minimum return requirement.
Company pension commitments in Germany are covered against employer bankruptcy via the “Pensions Sicherungs Verein” which charges a fee to all companies providing pension promises in a year a claim is paid.
Philips is one of the sponsors of Philips Pensionskasse VVaG in Germany, which is a multi-employer plan. The plan is accounted for as a DC plan.
Pension-related claim in the UK
In 2016 the UK Trustees and the Company succeeded in settling a pension-related legal claim against third parties. The Company and the Fund in the financing of thebuy-out in 2015 already anticipated a future claim being awarded. As a result of this settlement the Company received EUR 46 million, recognized as a pension settlement gain in 2016.
This legal settlement did not affect part or all of the benefits provided under the respective plans, as all further legal or constructive obligations for these benefits were already eliminated during the plan settlements in 2015.
Significant events in 2015
2015 included settlement costs of EUR 329 million mainly related to the settlement of the UK plan, results of otherde-risking actions in the UK prior to the settlement and the settlement of parts of the US pension plan. Past-service costs of EUR 14 million were recognized related tode-risking actions taken in the UK prior to the settlement of the plan, including a past-service cost for GMP Equalization in the same UK plan. Some smaller plan changes in other countries resulted in a small past-service cost gain.
The classification of the pension plan in the Netherlands changed in 2015 from a DB plan into a DC plan, triggering a settlement of the plan which at the time had a surplus of EUR 20 million. As the surplus was not recognized on the balance sheet due to the asset ceiling and because no further payments were made directly related to the settlement, as per the Company’s accounting policy, the Company did not recognize a settlement result in the income statement but in remeasurements for pensions in the Consolidated statements of Comprehensive Income.
Risks related to defined-benefit plans
TheseThe remaining defined-benefit plans expose the Company to various demographic and economic risks such as longevity risk, investment risks, currency and interest rate risk and in some cases inflation risk. The latter plays a role in the assumed wage increase andbut more importantly in the UK plansome countries like Germany where indexation of pensions is mandatory. Pension fund Trustees are responsible for and have full discretion over the investment strategy of the plan assets. In general Trustees manage pension fund risks by diversifying the investments of plan assets and by (partially) matching interest rate risk of liabilities.
Annual Report 2016 169
Group financial statements 10.10
The Company has an active deriskingde-risking strategy in which it constantly looks for opportunities to reduce the risks associated with its defined benefitdefined-benefit plans. Liability drivenLiability-driven investment strategies, lump sumcash-out options,buy-ins,buy-outs and the above mentioneda change in the funding of the Dutch planto DC are examples of thatthe strategy.
The larger plans are either governed by independent Boards or by Trustees who have a legal obligation to evenly balance the interests of all stakeholders and operate under the local regulatory framework.
Balance sheet positions
The net balance sheet position presented in this note can be explained as follows:
The surpluses in our plans in The Netherlands, UK as well some other countries are not recognized as a net defined benefit asset because in The Netherlands the current surplus will not bring sufficient future economic benefits to the Company (asset ceiling restrictions) whereas the regulatory framework in the other countries involved explicitly prohibits refunds to the employer.
The deficit of the US defined-benefit plan presented under other liabilities and the provisions of the unfunded plans therefore count for the largest part of the net balance sheet position.
The measurement date for all defined-benefit plans is December 31.
Annual Report 2013 197
11 Group financial statements 11.9 - 11.9
Summary of pre-tax costs for post-employment benefits
The below table contains the total of current- and past service costs, admin costs and settlement results as included in operating cost and the interest cost as included in financial income and expense.
| 2011 | 2012 | 2013 | ||||||||||
Defined-benefit plans | 253 | 290 | 297 | |||||||||
included in operating cost | 155 | 205 | 223 | |||||||||
included in financial expense | 93 | 85 | 71 | |||||||||
included in discontinued operations | 5 | — | 3 | |||||||||
Defined-contribution plans including multi-employer plans | 123 | 144 | 142 | |||||||||
included in operating cost | 117 | 139 | 139 | |||||||||
included in discontinued operations | 6 | 5 | 3 | |||||||||
Defined-benefit plans: Pensions
Movements in the net liabilities and - assets for defined benefit pension plans:
| 2012 | 2013 | |||||||||||||||||||||||
| Netherlands | other | total | Netherlands | other | total | |||||||||||||||||||
Defined-benefit obligation at the beginning of year | 13,294 | 8,920 | 22,214 | 14,433 | 9,021 | 23,454 | ||||||||||||||||||
Service cost | 170 | 81 | 251 | 183 | 77 | 260 | ||||||||||||||||||
Interest cost | 502 | 388 | 890 | 467 | 351 | 818 | ||||||||||||||||||
Employee contributions | — | 4 | 4 | — | 4 | 4 | ||||||||||||||||||
Actuarial (gains) / losses | ||||||||||||||||||||||||
– demographic assumptions | 133 | 64 | 197 | 205 | 17 | 222 | ||||||||||||||||||
– financial assumptions | 1,151 | 358 | 1,509 | (214 | ) | (385 | ) | (599 | ) | |||||||||||||||
– experience adjustment | (76 | ) | 8 | (68 | ) | (75 | ) | (32 | ) | (107 | ) | |||||||||||||
(Negative) past service cost | (25 | ) | (6 | ) | (31 | ) | (1 | ) | (80 | ) | (81 | ) | ||||||||||||
Divestments | — | (13 | ) | (13 | ) | — | (3 | ) | (3 | ) | ||||||||||||||
Settlements | — | (294 | ) | (294 | ) | — | (279 | ) | (279 | ) | ||||||||||||||
Benefits paid | (716 | ) | (465 | ) | (1,181 | ) | (704 | ) | (462 | ) | (1,166 | ) | ||||||||||||
Exchange rate differences | — | (36 | ) | (36 | ) | — | (318 | ) | (318 | ) | ||||||||||||||
Miscellaneous | — | 12 | 12 | — | — | — | ||||||||||||||||||
|
| |||||||||||||||||||||||
Defined-benefit obligation at end of year | 14,433 | 9,021 | 23,454 | 14,294 | 7,911 | 22,205 | ||||||||||||||||||
Present value of funded obligations at end of year | 14,426 | 8,168 | 22,594 | 14,288 | 7,112 | 21,400 | ||||||||||||||||||
Present value of unfunded obligations at end of year | 7 | 853 | 860 | 6 | 799 | 805 | ||||||||||||||||||
| 2012 | 2013 | |||||||||||||||||||||||
| Netherlands | other | total | Netherlands | other | total | |||||||||||||||||||
Fair value of plan assets at beginning of year | 13,946 | 7,303 | 21,249 | 15,203 | 7,588 | 22,791 | ||||||||||||||||||
Interest income on plan assets | 531 | 337 | 868 | 496 | 317 | 813 | ||||||||||||||||||
Admin expenses paid | (4 | ) | (5 | ) | (9 | ) | (9 | ) | (5 | ) | (14 | ) | ||||||||||||
Return on plan assets excluding interest income | 1,237 | 460 | 1,697 | (426 | ) | (338 | ) | (764 | ) | |||||||||||||||
Employee contributions | — | 4 | 4 | — | 4 | 4 | ||||||||||||||||||
Employer contributions | 209 | 216 | 425 | 283 | 187 | 470 | ||||||||||||||||||
Divestments | — | (1 | ) | (1 | ) | — | (1 | ) | (1 | ) | ||||||||||||||
Settlements | — | (294 | ) | (294 | ) | — | (311 | ) | (311 | ) | ||||||||||||||
Benefits paid | (716 | ) | (407 | ) | (1,123 | ) | (704 | ) | (407 | ) | (1,111 | ) | ||||||||||||
Exchange rate differences | — | (25 | ) | (25 | ) | — | (306 | ) | (306 | ) | ||||||||||||||
|
| |||||||||||||||||||||||
Fair value of plan assets at end of year | 15,203 | 7,588 | 22,791 | 14,843 | 6,728 | 21,571 | ||||||||||||||||||
|
| |||||||||||||||||||||||
Funded status | 770 | (1,433 | ) | (663 | ) | 549 | (1,183 | ) | (634 | ) | ||||||||||||||
Unrecognized net assets | (777 | ) | (586 | ) | (1,363 | ) | (555 | ) | (428 | ) | (983 | ) | ||||||||||||
|
| |||||||||||||||||||||||
Net balance sheet position | (7 | ) | (2,019 | ) | (2,026 | ) | (6 | ) | (1,611 | ) | (1,617 | ) | ||||||||||||
198 Annual Report 2013
11 Group financial statements 11.9 - 11.9
The classification of the net balance is as follows:
| 2012 | 2013 | |||||||||||||||||||||||
| Netherlands | other | total | Netherlands | other | total | |||||||||||||||||||
Prepaid pension costs under other non-current assets | — | 7 | 7 | — | 5 | 5 | ||||||||||||||||||
Accrued pension costs under other liabilities | — | (1,173 | ) | (1,173 | ) | — | (817 | ) | (817 | ) | ||||||||||||||
Provision for pensions under provisions | (7 | ) | (853 | ) | (860 | ) | (6 | ) | (799 | ) | (805 | ) | ||||||||||||
|
| |||||||||||||||||||||||
| (7 | ) | (2,019 | ) | (2,026 | ) | (6 | ) | (1,611 | ) | (1,617 | ) | |||||||||||||
Changes in the effect of the asset ceiling
| 2012 | 2013 | |||||||||||||||||||||||
| Netherlands | other | total | Netherlands | other | total | |||||||||||||||||||
Unrecognized assets at the beginning of year | 660 | 399 | 1,059 | 777 | 586 | 1,363 | ||||||||||||||||||
Interest on unrecognized assets | 26 | 25 | 51 | 25 | 31 | 56 | ||||||||||||||||||
Remeasurements | 91 | 173 | 264 | (247 | ) | (155 | ) | (402 | ) | |||||||||||||||
Exchange rate differences | — | (11 | ) | (11 | ) | — | (34 | ) | (34 | ) | ||||||||||||||
|
| |||||||||||||||||||||||
Unrecognized assets at the end of year | 777 | 586 | 1,363 | 555 | 428 | 983 | ||||||||||||||||||
Plan assets allocation
The asset allocation in the Company’s pension plans at December 31 was as follows:
| 2012 | 2013 | |||||||||||||||
| Netherlands | other | Netherlands | other | |||||||||||||
Matching portfolio: | ||||||||||||||||
- Debt securities | 11,734 | 6,106 | 11,238 | 4,282 | ||||||||||||
Return portfolio: | ||||||||||||||||
- Equity securities | 2,366 | 1,083 | 2,524 | 910 | ||||||||||||
- Real estate | 683 | 19 | 790 | 9 | ||||||||||||
- Other | 420 | 380 | 291 | 1,527 | ||||||||||||
|
| |||||||||||||||
| 15,203 | 7,588 | 14,843 | 6,728 | |||||||||||||
The assets in 2013 contain 14% (2012: 11%) unquoted assets, the increase compared to 2012 mainly related to the buy-in value in the UK plan. Plan assets in 2013 do not include property occupied by or financial instruments issued by the Company
Assumptions
The mortality tables used for the Company’s major schemes are:
Netherlands: Prognosis table 2012-2062 including experience rating TW2012.
United Kingdom retirees: SAPS 2002- Core CMI 2011 projection
United States: RP2000 CH Fully Generational
The weighted averages of the assumptions used to calculate the defined- benefit obligations as of December 31 were as follows:
| 2012 | 2013 | |||||||||||||||
| Netherlands | other | Netherlands | other | |||||||||||||
Discount rate | 3.3 | % | 4.1 | % | 3.4 | % | 4.5 | % | ||||||||
Rate of compensation increase | * | 3.3 | % | * | 3.2 | % | ||||||||||
The (average) duration of the DBO of the pension plans is 15 years for the Netherlands (2012: 14 years) and 11 years for other countries (2012: 11 years).
Defined-benefit plans: retiree medical plans
Movements in the net liability for retiree medical plans:
| 2012 | 2013 | |||||||
Defined-benefit obligation at the beginning of year | 269 | 250 | ||||||
Service cost | 1 | 1 | ||||||
Interest cost | 12 | 10 | ||||||
Actuarial (gains) or losses arising from: | ||||||||
– financial assumptions | 1 | (17 | ) | |||||
Past service cost | (25 | ) | — | |||||
Benefits paid | (17 | ) | (15 | ) | ||||
Exchange rate differences | (6 | ) | (16 | ) | ||||
Miscellaneous | 15 | — | ||||||
|
| |||||||
Defined-benefit obligation at end of year | 250 | 213 | ||||||
Present value of funded obligations at end of year | — | — | ||||||
Present value of unfunded obligations at end of year | 250 | 213 | ||||||
Funded status | (250 | ) | (213 | ) | ||||
|
| |||||||
Net balances | (250 | ) | (213 | ) | ||||
Classification of the net balance is as follows: | ||||||||
Provision for other postretirement benefits | (250 | ) | (213 | ) | ||||
Annual Report 2013 199
 11 Group financial statements 11.9 - 11.9
The weighted average assumptions used to calculate the defined benefit obligations for retiree medical plans as of December 31 were as follows:
| 2012 | 2013 | |||||||
Discount rate | 4.5 | % | 4.8 | % | ||||
Compensation increase (where applicable) | — | — | ||||||
Assumed healthcare cost trend rates at December 31:
| 2012 | 2013 | |||||||
Healthcare cost trend rate assumed for next year | 7.5 | % | 7.5 | % | ||||
Rate that the cost trend rate will gradually reach | 5.2 | % | 5.2 | % | ||||
Year of reaching the rate at which it is assumed to remain | 2019 | 2019 | ||||||
The average duration of the DBO of the retiree medical plans is 9 years (2012: 8 years).
Investment policy in our largest pension plans
It must be acknowledged thatThe trustees of the Philips pension plans are responsible for and have full discretion over the investment strategy of the plan assets.
The objective of the liability hedging portfolio of the Philips pension plan in the Netherlands is to match part of the interest rate sensitivity of the plan’s inflation-linked pension liabilities (based on a 2% inflation assumption). The liability hedging portfolio is mainly invested in euro- denominated government bonds, investment grade debt securities and long-duration interest rate swaps. The size of the liability hedging portfolio is targeted to be at least 64% of the fair value of the plan’s inflation-linked pension liabilities. The objective of the return portfolio is to maximize investment returns within well-specified risk constraints.
The Philips pension plan in the United Kingdom operates a fixed income portfolio that aims to fully hedge the interest rate and inflation rate sensitivities of the fair value of the plan’s pension liabilities. Part of the portfolio is invested in a buy-in policy, in which an insurance company guarantees all future benefit payments to the plan, thereby matching the investment and longevity risks of the pension liabilities covered in the buy-in policy.
The plan assets of the Philips pension planplans in the United StatesUS are invested in a well diversified portfolio.portfolios. The interest rate sensitivity of the fixed income portfolio is closely aligned to that of the plan’s pension liabilities. Any contributions from the sponsoring company are used to further increase the fixed income part of the assets. As part of the investment strategy, any additional investment returns of the return portfolio are used to further decrease the interest rate mismatch between the plan assets and the pension liabilities.
Balance sheet positions
The net balance sheet position presented in this note can be explained as follows:
The surplus in our plan in Brazil is not recognized as a net defined-benefit asset because in Brazil the regulatory framework prohibits refunds to the employer.
The deficits of the externally funded US defined-benefit plans and the unfunded plans in the US and Germany account for the largest part of the net balance sheet position.
The measurement date for all DB plans is December 31.
Summary ofpre-tax costs for post-employment benefits and reconciliations
The below table contains the total of current and past service costs, administration costs and settlement results as included in Income from operations and the interest cost as included in Financial expenses.
Philips Group
Pre-tax costs for post-employment benefitsin millions of EUR
2014 - 2016
|
| |||||||||||
| 2014 | 2015 | 2016 | ||||||||||
|
| |||||||||||
Defined-benefit plans | 245 | 561 | 53 | |||||||||
included in income from operations | 182 | 487 | (13 | )1) | ||||||||
included in financial expense | 59 | 72 | 66 | |||||||||
included in Discontinued operations | 4 | 2 | — | |||||||||
Defined-contribution plans including multi-employer plans | 148 | 299 | 382 | |||||||||
included in income from operations | 144 | 293 | 382 | |||||||||
included in Discontinued operations | 4 | 6 | — | |||||||||
|
| |||||||||||
| 1) | The net income mainly relates to the settlement of the pension related legal claim in the UK as described earlier in the note. |
170 Annual Report 2016
Group financial statements 10.10
Reconciliations for the net liabilities and assets for post-employment defined-benefit plans:
Philips Group
Defined-benefit obligationsin millions of EUR
2015 – 2016
|
| |||||||||||||||||||||||
| 2015 | 2016 | |||||||||||||||||||||||
|
| |||||||||||||||||||||||
| Pensions | Retiree medical | total | Pensions | Retiree medical | total | |||||||||||||||||||
|
| |||||||||||||||||||||||
Balance as of January 1 | 27,081 | 241 | 27,322 | 4,527 | 230 | 4,757 | ||||||||||||||||||
Service cost | 137 | — | 137 | 43 | 1 | 44 | ||||||||||||||||||
Interest cost | 465 | 12 | 477 | 177 | 12 | 189 | ||||||||||||||||||
Employee contributions | 9 | — | 9 | 5 | — | 5 | ||||||||||||||||||
Actuarial (gains) / losses | ||||||||||||||||||||||||
– demographic assumptions | — | — | — | (42 | ) | (3 | ) | (45 | ) | |||||||||||||||
– financial assumptions | 1,525 | (2 | ) | 1,523 | 195 | 13 | 208 | |||||||||||||||||
– experience adjustment | (149 | ) | (17 | ) | (166 | ) | 8 | (15 | ) | (7 | ) | |||||||||||||
(Negative) past service cost | 14 | — | 14 | (8 | ) | — | (8 | ) | ||||||||||||||||
Acquisitions | — | — | — | — | — | — | ||||||||||||||||||
Divestments | (12 | ) | — | (12 | ) | — | — | — | ||||||||||||||||
Settlements | (24,390 | ) | — | (24,390 | ) | (85 | ) | — | (85 | ) | ||||||||||||||
Benefits paid | (787 | ) | (13 | ) | (800 | ) | (303 | ) | (12 | ) | (315 | ) | ||||||||||||
Exchange rate differences | 635 | 9 | 644 | 185 | 8 | 193 | ||||||||||||||||||
Miscellaneous | (1 | ) | — | (1 | ) | 51 | — | 51 | ||||||||||||||||
|
| |||||||||||||||||||||||
Balance as of December 31 | 4,527 | 230 | 4,757 | 4,753 | 234 | 4,987 | ||||||||||||||||||
Present value of funded obligations at December 31 | 3,635 | — | 3,635 | 3,850 | — | 3,850 | ||||||||||||||||||
Present value of unfunded obligations at December 31 | 892 | 230 | 1,122 | 903 | 234 | 1,137 | ||||||||||||||||||
|
| |||||||||||||||||||||||
Philips Group Plan assets in millions of EUR 2015 - 2016
| ||||||||||||||||||||||||
|
| |||||||||||||||||||||||
| 2015 | 2016 | |||||||||||||||||||||||
|
| |||||||||||||||||||||||
| Pensions | Retiree medical | total | Pensions | Retiree medical | total | |||||||||||||||||||
|
| |||||||||||||||||||||||
Balance as of January 1 | 25,863 | — | 25,863 | 2,710 | — | 2,710 | ||||||||||||||||||
Interest income on plan assets | 434 | — | 434 | 137 | — | 137 | ||||||||||||||||||
Admin expenses paid | (9 | ) | — | (9 | ) | (3 | ) | — | (3 | ) | ||||||||||||||
Return on plan assets excluding interest income | 918 | — | 918 | 41 | — | 41 | ||||||||||||||||||
Employee contributions | 9 | — | 9 | 5 | — | 5 | ||||||||||||||||||
Employer contributions | 547 | — | 547 | 246 | — | 246 | ||||||||||||||||||
Divestments | (7 | ) | — | (7 | ) | — | — | — | ||||||||||||||||
Settlements | (24,840 | ) | — | (24,840 | ) | (33 | ) | — | (33 | ) | ||||||||||||||
Benefits paid | (725 | ) | — | (725 | ) | (239 | ) | — | (239 | ) | ||||||||||||||
Exchange rate differences | 520 | — | 520 | 180 | — | 180 | ||||||||||||||||||
Miscellaneous | — | — | — | 51 | — | 51 | ||||||||||||||||||
|
| |||||||||||||||||||||||
Balance as of December 31 | 2,710 | — | 2,710 | 3,095 | — | 3,095 | ||||||||||||||||||
| — | — | |||||||||||||||||||||||
Funded status | (1,817 | ) | (230 | ) | (2,047 | ) | (1,658 | ) | (234 | ) | (1,892 | ) | ||||||||||||
Unrecognized net assets | (90 | ) | — | (90 | ) | (105 | ) | — | (105 | ) | ||||||||||||||
|
| |||||||||||||||||||||||
Net balance sheet position | (1,907 | ) | (230 | ) | (2,137 | ) | (1,763 | ) | (234 | ) | (1,997 | ) | ||||||||||||
|
| |||||||||||||||||||||||
Annual Report 2016 171
Group financial statements 10.10
The classification of the net balance is as follows:
Philips Group
Net balance of defined-benefit pension plans in millions of EUR
2015 - 2016
|
| |||||||||||||||||||||||
| 2015 | 2016 | |||||||||||||||||||||||
|
| |||||||||||||||||||||||
| Pensions | Retiree medical | total | Pensions | Retiree medical | total | |||||||||||||||||||
|
| |||||||||||||||||||||||
Prepaid pension costs under other non-current assets | 3 | — | 3 | 1 | — | 1 | ||||||||||||||||||
Provision for pensions under provisions1) | (1,910 | ) | (230 | ) | (2,140 | ) | (1,762 | ) | (234 | ) | (1,996 | ) | ||||||||||||
Provision for pensions under AHFS | (2 | ) | — | (2 | ) | |||||||||||||||||||
|
| |||||||||||||||||||||||
Net balance of defined-benefit plans | (1,907 | ) | (230 | ) | (2,137 | ) | (1,763 | ) | (234 | ) | (1,997 | ) | ||||||||||||
|
| |||||||||||||||||||||||
| 1) | Adjusted to reflect a reclassification of net defined-benefit obligations into Long-term provisions. Seenote 1, Significant accounting policies |
Philips Group
Changes in the effect of the asset ceilingin millions of EUR
2015 - 2016
|
| |||||||
| 2015 | 2016 | |||||||
|
| |||||||
Balance as of January 1 | 792 | 90 | ||||||
Interest on unrecognized assets | 29 | 14 | ||||||
Remeasurements | (733 | ) | (21 | ) | ||||
Exchange rate differences | 2 | 22 | ||||||
|
| |||||||
Balance as of December 31 | 90 | 105 | ||||||
|
| |||||||
Plan assets allocation
The asset allocation in the Company’s pension plans at December 31 was as follows:
Philips Group
Plan assets allocation in millions of EUR
2015 - 2016
|
| |||||||
| 2015 | 2016 | |||||||
|
| |||||||
- Debt securities | 1,523 | 1,646 | ||||||
- Equity securities | 740 | 902 | ||||||
- Real estate | 9 | 2 | ||||||
- Other | 438 | 545 | ||||||
|
| |||||||
Total assets | 2,710 | 3,095 | ||||||
|
| |||||||
The assets in 2016 contain 58% (2015: 51%) unquoted assets. Plan assets in 2016 do not include property occupied by or financial instruments issued by the Company.
Assumptions
The mortality tables used for the Company’s major schemes are:
US: RP2014 HA/EE Fully Generational scaled with MP2016; RP2006-MP2016 + white collar adjustment for the unfunded excess plans.
Germany: Richttafeln 2005 Generational K.Heubeck
The weighted averages of the assumptions used to calculate the defined-benefit obligations as of December 31 were as follows:
Philips Group
Assumptions used for defined-benefit obligations in %
2015 - 2016
|
| |||||||
| 2015 | 2016 | |||||||
|
| |||||||
Discount rate | 4.0 | % | 3.8 | % | ||||
Inflation rate | 2.4 | % | 2.6 | % | ||||
Rate of compensation increase | 2.7 | % | 3.3 | % | ||||
|
| |||||||
The average duration of the defined-benefit obligation of the pension plans is 11 years (2015: 10 years).
Cost trend rates retiree medical plans
Assumed healthcare cost trend rates at December 31:
Philips Group
Assumed healthcare cost trend rates in %
2015 - 2016
|
| |||||||
| 2015 | 2016 | |||||||
|
| |||||||
Healthcare cost trend rate assumed for next year | 7.5 | % | 8.4 | % | ||||
Rate that the cost trend rate will gradually reach | 5.3 | % | 5.4 | % | ||||
Year of reaching the rate at which it is assumed to remain | 2025 | 2028 | ||||||
|
| |||||||
The average duration of the defined-benefit obligation of the retiree medical plans is 9 years (2015: 8 years).
Cash flows and costs in 20142017
PhilipsThe Company expects considerable cash outflows in relation to employeepost-employment benefits which are estimated to amount to EUR 626506 million in 2014,2017, consisting of of:
EUR 41749 million employer contributions to defined benefitfunded DB pension plans (US: EUR 14015 million, DE: EUR 23 million, Other: EUR 11 million);
EUR 382 million employer contributions to defined contributionDC pension plans (NL: EUR 52204 million, expectedUS: EUR 114 million, Other: EUR 64 million);
EUR 57 million cash outflows in relation to unfunded DB pension plans and(US: EUR 178 million, DE: EUR 37 million, Other: EUR 12 million) and
EUR 18 million in relation to unfunded retiree medical plans. The employer contributions to defined benefit pension plans are expected to amount to(US: EUR 22312 million, for the Netherlands andOther EUR 194 million for other countries. The Company continues to fund a part of the existing deficit in the US pension plan in 2014, which amount is included in the amounts aforementioned. 6 million).
For the funding of the deficit in the US plan the Group adheres to the minimum funding requirements of the US Pension Protection Act. The UK plan is currently in a surplus on a regulatory basis and does not require any funding in 2014 other than the agreed administration cost.
The funding of the pension fund in the Netherlands for 2014 consists of a fixed percentage of payroll which applies for a period of 5 years. The additional contribution to the pension fund for the Netherlands is not included in the above figures. For further details we refer to note 36, Subsequent events. It is noted that the (majority of the) contribution will need to be written off through Other comprehensive income due to the asset ceiling restrictions in the pension plan in the Netherlands.
The service and administration cost for 20142017 is expected to amount to EUR 25641 million consisting of EUR 255 millionfully for defined-benefit pension plans and EUR 1 million for defined-benefit retiree medical plans. The net interest expense for 20142017 is expected to amount to EUR 5462 million, consisting of EUR 4350 million for defined-benefitDB pension plans and EUR 1112 million for defined-benefitDB retiree medical plans. The cost for defined- contributionDC pension plans in 20142017 is expectedequal to amount to EUR 140 million.the DC cash flow.
172 Annual Report 2016

 Group financial statements 10.10
Sensitivity analysis
The table below illustrates the approximate impact on the defined-benefit obligation if the Company were to changeDBO from movements in key assumptions. The DBO was recalculated using a change in the assumptions of 1% which overall is considered a reasonably possible change. The impact on the DBO because of changes in discount rate is normally accompanied by offsetting movements in plan assets, especially when using matching strategies.
Philips Group
| Defined benefit obligation | ||||||||||||
| 2013 | ||||||||||||
| Pension Netherlands | Pension other | Retiree medical | ||||||||||
| Increase | ||||||||||||
Discount rate (1% movement) | (1,708 | ) | (822 | ) | (12 | ) | ||||||
Wage increase (1% movement) | 165 | 28 | — | |||||||||
Inflation (1% movement) | 979 | 461 | — | |||||||||
Longevity (see explanation) | 355 | 232 | 7 | |||||||||
Medical benefit level (1% price increase) | — | — | 12 | |||||||||
| Decrease | ||||||||||||
Discount rate (1% movement) | 2,158 | 962 | 16 | |||||||||
Wage increase (1% movement) | (147 | ) | (26 | ) | — | |||||||
Inflation (1% movement) | (876 | ) | (418 | ) | — | |||||||
LongevitySensitivity of key assumptions in millions of EUR
2016
|
| |||||||
| Defined benefit obligation | ||||||||
| Retiree | ||||||||
| Pensions | medical | |||||||
|
| |||||||
| Increase | ||||||||
Discount rate (1% movement) | (524 | ) | (20 | ) | ||||
Wage change (1% movement) | 27 | |||||||
Inflation (1% movement) | 139 | |||||||
Longevity (see explanation) | 134 | 10 | ||||||
Healthcare cost trend (1% increase) | 19 | |||||||
| Decrease | ||||||||
Discount rate (1% movement) | 622 | 22 | ||||||
Wage change (1% movement) | (23 | ) | ||||||
Inflation (1% movement) | (126 | ) | ||||||
|
| |||||||
Philips Group
Sensitivity of key assumptions in millions of EUR
2015
|
| |||||||
| Defined benefit obligation | ||||||||
| Retiree | ||||||||
| Pensions | medical | |||||||
|
| |||||||
| Increase | ||||||||
Discount rate (1% movement) | (468 | ) | (18 | ) | ||||
Wage change (1% movement) | 23 | |||||||
Inflation (1% movement) | 115 | |||||||
Longevity (see explanation) | 80 | 7 | ||||||
Healthcare cost trend (1% increase) | 13 | |||||||
| Decrease | ||||||||
Discount rate (1% movement) | 550 | 20 | ||||||
Wage change (1% movement) | (20 | ) | ||||||
Inflation (1% movement) | (104 | ) | ||||||
|
| |||||||
The mortality table (i.e. longevity) also impacts post-employment benefit liabilities.the DBO. The above sensitivity table illustrates the impact on the defined-benefit obligationDBO of a further 10% decrease in the assumed rates of mortality for the Company’s major schemes. A 10% decrease in assumed mortality rates equals improvement of life expectancy by 0.5 - 1 year.
Changes in assumed health carehealthcare cost trend rates can have a significant effect on the amounts reported for the retiree medical plans. A one percentage-point1%-point increase in medical benefit levelthe healthcare cost trend rate is therefore included in the above table as a likely scenario.
Accrued liabilities are summarized as follows:
Philips Pension FundGroup
Accrued liabilities in millions of EUR
2015 - 2016
|
| |||||||
| 2015 | 2016 | |||||||
|
| |||||||
Personnel-related costs: | ||||||||
- Salaries and wages | 567 | 684 | ||||||
- Accrued holiday entitlements | 180 | 154 | ||||||
- Other personnel-related costs | 148 | 108 | ||||||
Fixed-asset-related costs: | ||||||||
- Gas, water, electricity, rent and other | 53 | 52 | ||||||
Communication and IT costs | 46 | 75 | ||||||
Distribution costs | 107 | 123 | ||||||
Sales-related costs: | ||||||||
- Commission payable | 20 | 22 | ||||||
- Advertising and marketing-related costs | 168 | 183 | ||||||
- Other sales-related costs | 54 | 55 | ||||||
Material-related costs | 147 | 142 | ||||||
Interest-related accruals | 69 | 68 | ||||||
Deferred income | 932 | 957 | ||||||
Other accrued liabilities1) | 324 | 411 | ||||||
|
| |||||||
Accrued liabilities | 2,815 | 3,034 | ||||||
|
| |||||||
| 1) | Adjusted to reflect a reclassification of net defined-benefit obligations into Long-term provisions.See note 1, Significant accounting policies |
Deferred income is mainly related to Diagnosis & Treatment businesses and Connected Care & Health Informatics businesses, in both 2016 and 2015.
Othernon-current liabilities
Othernon-current liabilities are summarized as follows:
Philips Group
Othernon-current liabilities in millions of EUR
2015 - 2016
|
| |||||||
| 2015 | 2016 | |||||||
|
| |||||||
Deferred income | 257 | 251 | ||||||
Other tax liability | 454 | 395 | ||||||
Other liabilities | 101 | 73 | ||||||
|
| |||||||
Othernon-current liabilities1) | 812 | 719 | ||||||
|
| |||||||
| 1) | Adjusted to reflect a reclassification of net defined-benefit obligations previously reported as Accrued pension costs into Long-term provisions. Seenote 1, Significant accounting policies |
For further details on tax related liabilities refer tonote 8, Income taxes.
Annual Report 2016 173
Group financial statements 10.10
Other current liabilities
Other current liabilities are summarized as follows:
Philips Group
Other current liabilities in millions of EUR
2015 - 2016
|
| |||||||
| 2015 | 2016 | |||||||
|
| |||||||
Accrued customer rebates that cannot be offset with accounts receivables for those customers | 544 | 593 | ||||||
Advances received from customers on orders not covered by work in process | 375 | 451 | ||||||
Other taxes including social security premiums | 177 | 208 | ||||||
Other liabilities | 177 | 120 | ||||||
|
| |||||||
Other current liabilities | 1,273 | 1,372 | ||||||
|
| |||||||
The other liabilities per December 31, 2016 include reclassifications from litigation provisions to liabilities due to settlements reached. For more details reference is made to Litigation provisions innote 19, Provisions and to Legal proceedings innote 25, Contingent assets and liabilities. The decrease of the balance of other liabilities as per December 31, 2016 mainly relates topay-out of these liabilities as per December 31, 2015.
Cash flow statement supplementary information
Cash used for derivatives and current financial assets
In 2016, a total of EUR 132 million cash was paid with respect to foreign exchange derivative contracts related to activities for liquidity management and funding (2015: EUR 193 million outflow; 2014: EUR 13 million outflow).
Purchase and proceeds fromnon-current financial assets
In 2016, the net cash outflow of EUR 45 million was mainly due to the acquisition of stakes in Abraaj Growth Markets Fund.
In 2015, the net cash inflow of EUR 32 million was mainly due to the sale of stakes in Silicon & Software Systems and other equity interests.
In 2014, the net cash inflow of EUR 26 million was mainly due to the sale of stakes in Neusoft, Chimei Innolux, and Sapiens, offset by loans provided to TPV Technology Limited.
Bank error
On December 30, 2016 a financial institution erroneously transferred EUR 150 million of cash to the Philips Lighting bank account. On January 2, 2017 the transfer was reversed by all parties involved for the full amount with retrospective effect to December 30, 2016. As the transaction lacks economic substance and Philips Lighting never had any exposure or benefit, the transaction has not been accounted for in these financial statements.
Philips Group
Contractual cash obligations1,2) in millions of EUR
2016
|
| |||||||||||||||||||
| payments due by period | ||||||||||||||||||||
| total | less than 1 year | 1-3 years | 3-5 years | after 5 years | ||||||||||||||||
|
| |||||||||||||||||||
Long-term debt3) | 5,117 | 1,290 | 104 | 1,297 | 2,426 | |||||||||||||||
Finance lease obligations | 307 | 93 | 127 | 54 | 33 | |||||||||||||||
Short-term debt | 210 | 210 | — | — | — | |||||||||||||||
Operating lease obligations | 942 | 227 | 300 | 195 | 220 | |||||||||||||||
Derivative liabilities | 841 | 280 | 410 | — | 151 | |||||||||||||||
Interest on debt4) | 2,229 | 184 | 306 | 295 | 1,444 | |||||||||||||||
Purchase obligations5) | 260 | 108 | 73 | 33 | 46 | |||||||||||||||
Trade and other payables | 2,848 | 2,848 | — | — | — | |||||||||||||||
|
| |||||||||||||||||||
Contractual cash obligations | 12,754 | 5,240 | 1,320 | 1,874 | 4,320 | |||||||||||||||
|
| |||||||||||||||||||
| 1) | Obligations in this table are undiscounted |
| 2) | This table excludes pension contribution commitments and income tax liabilities in respect of tax risks because it is not possible to make a reasonably reliable estimate of the actual period of cash settlement |
| 3) | Long-term debt includes short-term portion of long-term debt and excludes finance lease obligations |
| 4) | Approximately 30% of the debt bears interest at a floating rate |
| 5) | Philips has commitments related to the ordinary course of business which in general relate to contracts and purchase order commitments for less than 12 months. In the table, only the commitments for multiple years are presented, including their short-term portion |
Philips Group
Contractual cash obligations1,2) in millions of EUR
2015
|
| |||||||||||||||||||
| payments due by period | ||||||||||||||||||||
| total | less than 1 year | 1-3 years | 3-5 years | after 5 years | ||||||||||||||||
|
| |||||||||||||||||||
Long-term debt3) | 4,034 | 84 | 1,152 | 1 | 2,797 | |||||||||||||||
Finance lease obligations | 242 | 72 | 92 | 36 | 42 | |||||||||||||||
Short-term debt | 1,515 | 1,515 | — | — | — | |||||||||||||||
Operating lease obligations | 952 | 243 | 280 | 162 | 267 | |||||||||||||||
Derivative liabilities | 995 | 253 | 383 | 156 | 203 | |||||||||||||||
Interest on debt4) | 2,767 | 221 | 438 | 334 | 1,774 | |||||||||||||||
Purchase obligations5) | 175 | 68 | 69 | 30 | 8 | |||||||||||||||
Trade and other payables | 2,673 | 2,673 | — | — | — | |||||||||||||||
|
| |||||||||||||||||||
Contractual cash obligations | 13,353 | 5,129 | 2,414 | 719 | 5,091 | |||||||||||||||
|
| |||||||||||||||||||
| 1) | Obligations in this table are undiscounted |
| 2) | This table excludes pension contribution commitments and income tax liabilities in respect of tax risks because it is not possible to make a reasonably reliable estimate of the actual period of cash settlement |
| 3) | Long-term debt includes short-term portion of long-term debt and excludes finance lease obligations |
| 4) | Approximately 32% of the debt bears interest at a floating rate. Majority of the interest payments on variable interest rate loans in the table above reflect market forward interest rates at the period end and these amounts may change as market interest rate changes |
| 5) | Philips has commitments related to the ordinary course of business which in general relate to contracts and purchase order commitments for less than 12 months. In the table, only the commitments for multiple years are presented, including their short-term portion |
174 Annual Report 2016
 Group financial statements 10.10
Certain Philips suppliers factor their trade receivables from Philips with third parties through supplier finance arrangements. At December 31, 2016 approximately EUR 360 million of the Philips accounts payable were known to have been sold onward under such arrangements whereby Philips confirms invoices. Philips continues to recognize these liabilities as trade payables and will settle the liabilities in line with the original payment terms of the related invoices.
The Company has entered into contracts with venture capitalists where it committed itself to make, under certain conditions, capital contributions to its investment funds to an aggregated amount of EUR 90 million (2015: EUR 22 million) until June 30, 2021. As at December 31, 2016 capital contributions already made to these investment funds are recorded asavailable-for-sale financial assets within Othernon-current financial assets.
The operating lease obligations are mainly related to the rental of buildings. A number of these leases originate fromsale-and-leaseback arrangements. Operating lease payments undersale-and-leaseback arrangements for 2016 totaled EUR 36 million (2015: EUR 36 million).
The remaining minimum payments undersale-and-leaseback arrangements included in operating lease obligations above are as follows:
Philips Group
Operating lease - minimum payments undersale-and-leaseback arrangementsin millions of EUR
2016
2017 | 36 | |||
2018 | 34 | |||
2019 | 33 | |||
2020 | 29 | |||
2021 | 27 | |||
Thereafter | 91 | |||
|
|
Finance lease liabilities
The below table discloses the reconciliation between the total of future minimum lease payments and their present value.
Philips Group
Finance lease liabilities in millions of EUR
2015 - 2016
| 2015 | 2016 | |||||||||||||||||||||||
| future mini- mum lease pay- ments | interest | present mum | future mini- mum lease pay- ments | interest | present mum | |||||||||||||||||||
Less than one year | 72 | 6 | 66 | 93 | 8 | 85 | ||||||||||||||||||
Between one and five years | 128 | 17 | 111 | 181 | 15 | 166 | ||||||||||||||||||
More than five years | 42 | 8 | 34 | 33 | 5 | 28 | ||||||||||||||||||
|
| |||||||||||||||||||||||
Finance lease | 242 | 31 | 211 | 307 | 28 | 279 | ||||||||||||||||||
|
| |||||||||||||||||||||||
Contingent assets and liabilities
Contingent assets
Zoll
In June 2010, Philips filed a patent infringement lawsuit against Zoll Medical Corporation claiming that its defibrillator related patents were infringed by Zoll’s Automatic External Defibrillator (AED) products. Zoll filed a countersuit claiming patent infringement by Philips’ Advanced Life Support (ALS) products and a method for testing defibrillator electrodes.
In December 2013, the liability phase of the Zoll lawsuit was tried before a jury in the Netherlands
In relationUnited States District Court for the District Massachusetts. Philips and Zoll were both held to infringe each other’s patents. The Zoll liability judgment was appealed by both parties to the fraudUnited States Court of Appeal for the Federal Circuit (CAFC) in August 2014. In a July 28, 2016 decision, the Dutch real estate sector uncovered in 2007, Philipsliability judgment wasaffirmed-in-part,reversed-in-part andvacated-in-part by the Philips Pension Fund in the Netherlands have jointly and amicably assessed any residual damages in 2013.CAFC. In view of the new pension agreement, which includesCAFC decision, Philips continues to expect a new funding structure, effective as of January 1, 2014, Philips decided to make a special cash contributionnet difference in 2013 to ensure that any potential financial issues from the past, including this real estate fraud, were cleared. As a result of this special contribution the real estate case has been closed.
The purposedamages in its favor. Resolution of the share-based compensation plansamount ultimately owed to Philips is contingent upon a damages trial now scheduled to begin on July 24, 2017.
Contingent liabilities
Guarantees
Philips’ policy is to alignprovide guarantees and other letters of support only in writing. Philips does not stand by other forms of support. At the interestsend of management with those2016, the total fair value of shareholdersguarantees recognized on the balance sheet amounted to EUR nil million (December 31, 2015: EUR nil million). Remainingoff-balance-sheet business and credit-related guarantees provided on behalf of third parties and associates decreased by providing incentivesEUR 9 million during 2016 to improve the Company’s performance on a long-term basis, thereby increasing shareholder value.EUR 28 million (December 31, 2015: EUR 37 million).
Annual Report 2016 175
Group financial statements 10.10
Environmental remediation
The Company hasand its subsidiaries are subject to environmental laws and regulations. Under these laws, the following plans:Company and/or its subsidiaries may be required to remediate the effects of certain chemicals on the environment.
Legal proceedings
optionsThe Company and certain of its group companies and former group companies are involved as a party in legal proceedings, regulatory and other governmental proceedings, including discussions on its common shares;
rightspotential remedial actions, relating to receive common sharessuch matters as competition issues, commercial transactions, product liability, participations and environmental pollution.
While it is not feasible to predict or determine the ultimate outcome of all pending or threatened legal proceedings, regulatory and governmental proceedings, the Company is of the opinion that the cases described below may have, or have had in the futurerecent past, a significant impact on the Company’s consolidated financial position, results of operations and cash flows.
Cathode Ray Tubes (CRT)
On November 21, 2007, the Company announced that competition law authorities in several jurisdictions had commenced investigations into possible anticompetitive activities in the Cathode Ray Tubes, or CRT industry. On December 5, 2012, the European Commission issued a decision imposing fines on (former) CRT manufacturers including the Company. The European Commission imposed a fine of EUR 313 million on the Company and a fine of EUR 392 million jointly and severally on the Company and LG Electronics, Inc. In total a payable of EUR 509 million was recognized in 2012 and the fine was paid in the first quarter of 2013. The Company appealed the decision of the European Commission with the General Court which appeal was denied on September 9, 2015. On November 23, 2015 the Company lodged an appeal against the decision of the General Court with the European Court of Justice.
United States
Subsequent to the public announcement of these investigations in 2007, certain Philips Group companies were named as defendants in class action antitrust complaints by direct and indirect purchasers of CRTs filed in various federal district courts in the United States. These actions alleged anticompetitive conduct by manufacturers of CRTs and sought treble damages on a joint and several liability basis. In addition, sixteen individual plaintiffs, principally large retailers of CRT products who opted out of the direct purchaser class, filed separate complaints against the Company and other defendants based on a service condition (restricted shares);
rights to receive common shares in the future based on performance and service conditions (performance shares).
200 Annual Report 2013
11 Group financial statements 11.9 - 11.9
Restricted shares and options were granted to members of the Board of Management and other members of the Executive Committee, executives and certain selected employees. Options were last granted in January 2013. Restricted shares are still granted to new employees or certain selected employees.
Furthermore, in January 2012 and 2013, as part of the Accelerate! program, the Company has granted the following:
options on its common shares (Accelerate! options);
rights to receive common shares in the future (Accelerate! shares).
These Accelerate! options and shares were granted to a group of approximately 500 key employees below the level of Board of Management in January 2012 and to the Board of Management in January 2013.
In May 2013 a new long-term incentive plan was approved at the Annual General Meeting of Shareholders granting performance shares to members of the Board of Management and other members of the Executive Committee, executives and certain selected employees.
USD-denominated options, restricted and performance shares are granted to employeessame substantive allegations. All these actions have been consolidated forpre-trial proceedings in the United States only.
Share-based compensation costs were EUR 109 million (EUR 91 million, netDistrict Court for the Northern District of tax), EUR 86 million (EUR 75 million, net of tax) and EUR 55 million (EUR 57 million, net of tax) in 2013, 2012 and 2011, respectively.California.
Option plansThe Company reached settlements with both the direct purchaser plaintiffs and indirect purchaser plaintiffs fully resolving all claims of the direct and indirect purchaser class. The direct purchaser settlement was approved by the court in 2012, while the indirect purchaser settlement was approved by the United States District Court for the Northern District of California in 2016 and is now pending before the Ninth Circuit Court of Appeals. In the past years the Company also reached settlements with a number of the individual plaintiffs resolving all claims by those retailers on a global basis. The settlements reached to date represent the vast majority of CRT sales attributed to the Company by the individual plaintiffs. In effect, all cases originally scheduled for trial in the Northern District of California have now been resolved, leaving unresolved certain of the cases that were consolidated in the California case forpre-trial purposes that have to be transferred back to their original venue for further proceedings. Trial dates have not yet been set for those cases.
In addition, the state attorneys general of California, Florida, Illinois, Oregon and Washington filed actions against the Company and other defendants seeking to recover damages on behalf of the states and, acting as parens patriae, their consumers. In 2012 the Florida complaint was withdrawn. In 2013 a settlement agreement was reached with the state attorney general of California that has been approved subject to review by the California Court of Appeal. In 2016, settlements were reached with the state attorneys general of Illinois and Oregon which settlements are awaiting final approval in their respective state courts. The action brought by the state attorney of Washington is pending; a trial date has not been set.
Canada
In 2007, certain Philips Group companies were also being named as defendants in proposed class proceedings in Ontario, Quebec and British Columbia, Canada, along with numerous other participants in the industry. After years of inactivity, in 2014, plaintiffs in the Ontario action initiated the class certification proceedings leading to class certification in the second half of 2016.
Other civil claims related to CRT
In 2014, the Company was named as a defendant in a consumer class action lawsuit filed in Israel in which damages are claimed against several defendants based on alleged anticompetitive activities in the CRT industry. In addition, an electronics manufacturer filed a claim against the Company and several co- defendants with a court in the Netherlands, also seeking compensation for the alleged damage sustained as a result from the alleged anticompetitive activities in the CRT industry. In 2015, the Company became involved in further civil CRT antitrust litigation with previous CRT customers in the United Kingdom, Germany, Brazil and Denmark. In all cases the same substantive allegations about anticompetitive activities
176 Annual Report 2016
Group financial statements 10.10
in the CRT industry are made and damages are sought. The Company has received indications that more civil claims may be filed in due course.
Except for what has been provided or accrued for as disclosed innote 19, Provisions andnote 22, Other liabilities, the Company has concluded that due to the considerable uncertainty associated with certain of these matters, on the basis of current knowledge, potential losses cannot be reliably estimated with respect to these matters.
Optical Disc Drive (ODD)
On October 27, 2009, the Antitrust Division of the United States Department of Justice confirmed that it had initiated an investigation into possible anticompetitive practices in the Optical Disc Drive (ODD) industry. PhilipsLite-On Digital Solutions Corp. (PLDS), a joint venture owned by the Company andLite-On IT Corporation, as an ODD market participant, is included in this investigation. PLDS and the Company have been accepted under the Corporate Leniency program of the US Department of Justice and have continued to cooperate with the authorities in these investigations. On this basis, the Company expects to be immune from governmental fines.
In July 2012, the European Commission issued a Statement of Objections addressed to (former) ODD suppliers including the Company and PLDS. The European Commission granted the Company and PLDS immunity from fines, conditional upon the Company’s continued cooperation. The Company responded to the Statement of Objections both in writing and at an oral hearing. On October 21, 2015 the European Commission issued its fining decisions in which it granted immunity to the Company,Lite-On IT Corporation and PLDS.
The antitrust authority in one remaining jurisdiction is still investigating the matter.
Subsequent to the public announcement of these investigations in 2009, the Company, PLDS and Philips &Lite-On Digital Solutions USA, Inc. (PLDS USA), among other industry participants, were named as defendants in numerous class action antitrust complaints filed in various federal district courts in the United States. These actions allege anticompetitive conduct by manufacturers of ODDs and seek treble damages on behalf of direct and indirect purchasers of ODDs and products incorporating ODDs. These actions have been consolidated forpre-trial proceedings in the United States District Court for the Northern District of California. Initially the plaintiffs’ applications for certification of both the direct and indirect purchaser classes were denied.
In September 2015, PLDS entered into a settlement agreement with the direct purchaser plaintiffs under which the Company was released from the direct purchaser claims. In December 2016, PLDS reached a settlement with the indirect purchaser plaintiffs which is subject to court approval. Under the Company’s plans, optionssettlement, the Company will be released from the indirect purchaser claims.
In addition, various individual entities have filed separate actions against the Company, PLDS, PLDS USA and other defendants. The allegations contained in these individual complaints are granted at fair market valuesubstantially identical to the allegations in the direct purchaser class complaints. All of these matters have been consolidated into the action in the Northern District of California forpre-trial purposes and discovery is being coordinated.
Also, in June 2013, the State of Florida filed a separate complaint in the Northern District of California against the Company, PLDS, PLDS USA and other defendants containing largely the same allegations as the class and individual complaints. Florida seeks to recover damages sustained in its capacity as a buyer of ODDs and, in itsparens patriaecapacity, on behalf of its citizens. In December 2016, PLDS reached a settlement with the datestate attorney general of grant.Florida, which settlement is subject to court approval. Pursuant to the settlement agreement, the Company is also released from the Florida state attorney general’s claim.
The Company granted optionsand certain Philips Group companies have also been named as defendants, in proposed class proceedings in Ontario, Quebec, British Columbia, Manitoba and Saskatchewan, Canada along with numerous other participants in the industry. These complaints assert claims against various ODD manufacturers under federal competition laws as well as tort laws and may involve joint and several liability among the named defendants. Philips intends to vigorously defend these lawsuits. Plaintiffs in the British Columbia case have proceeded with their application to certify that expire after 10 years. Generally, these options vest after 3 years, provided the granteeproceeding as a class action. The hearing was held in January 2015. The Court’s decision on class certification is still employedpending.
Furthermore, in the second half of 2016 the Company was named as defendant in a class action in Israel based on allegations similar to the class actions in the United States.
Due to the considerable uncertainty associated with these matters, on the Company. A limited numberbasis of options grantedcurrent knowledge, the Company has concluded that potential losses cannot be reliably estimated with respect to certain employeesthese matters.
Consumer Electronics products and small Domestic Appliances
Several companies, among which the Company, are involved in an investigation by the European Commission into alleged restrictions of acquired businesses may contain accelerated vesting. Asonline sales of consumer electronic products and small domestic appliances. This investigation commenced in December 31, 2013 there are no non-vested options which contain non-market performance conditions.
The fair valueswhen Philips was one of the Company’s 2013, 2012 and 2011 option grants were estimated using a Black-Scholes option valuation model and the following weighted average assumptions:
EUR-denominated | 2011 | 2012 | 2013 | |||||||||
Risk-free interest rate | 2.89 | % | 1.87 | % | 1.20 | % | ||||||
Expected dividend yield | 3.3 | % | 4.7 | % | 4.5 | % | ||||||
Expected option life | 6.5 yrs | 6.5 yrs | 6.5 yrs | |||||||||
Expected share price volatility | 30 | % | 32 | % | 33 | % | ||||||
| USD-denominated | ||||||||||||
Risk-free interest rate | 2.78 | % | 1.23 | % | 1.32 | % | ||||||
Expected dividend yield | 3.6 | % | 4.5 | % | 4.6 | % | ||||||
Expected option life | 6.5 yrs | 6.5 yrs | 6.5 yrs | |||||||||
Expected share price volatility | 34 | % | 38 | % | 39 | % | ||||||
The fair valuecompanies that was inspected by officials of the Company’s 2013 and 2012 Accelerate! option grants were estimated using a Black-Scholes option valuation model and the following assumptions:
EUR-denominated | 2012 | 2013 | ||||||
Risk-free interest rate | 1.52 | % | 0.89 | % | ||||
Expected dividend yield | 4.3 | % | 3.9 | % | ||||
Expected option life | 6.5 yrs | 6.5 yrs | ||||||
Expected share price volatility | 32 | % | 32 | % | ||||
| USD-denominated | ||||||||
Risk-free interest rate | 1.19 | % | — | |||||
Expected dividend yield | 4.0 | % | — | |||||
Expected option life | 6.5 yrs | — | ||||||
Expected share price volatility | 38 | % | — | |||||
The assumptions were used for these calculations only and do not necessarily represent an indication of Management’s expectations of future developments.
The Black-Scholes option valuation model was developed for use in estimating the fair value of traded options which have no vesting restrictions and are fully transferable. In addition, option valuation models require the input of subjective assumptions, including the expected price volatility.
The Company has based its volatility assumptions on historical experience for a period equal to the expected life of the options. The expected life of the options is also based upon historical experience.
The Company’s employee stock options have characteristics significantly different from those of traded options, and changes in the assumptions can materially affect the fair value estimate.
The following tables summarize information about the Company’s options as of December 31, 2013 and changes during the year:
Option plans (excluding Accelerate! options)
EUR-denominated
options | weighted average exercise price | |||||||
Outstanding at January 1, 2013 | 23,109,265 | 21.43 | ||||||
Granted | 35,193 | 22.28 | ||||||
Exercised | 2,664,550 | 18.45 | ||||||
Forfeited | 1,807,077 | 23.74 | ||||||
Expired | 15,003 | 22.12 | ||||||
|
| |||||||
Outstanding at December 31, 2013 | 18,657,828 | 21.63 | ||||||
|
| |||||||
Exercisable at December 31, 2013 | 11,657,060 | 23.99 | ||||||
The exercise prices range from EUR 12.63 to EUR 32.04. The weighted average remaining contractual term for options outstanding and options exercisable at December 31, 2013, was 5.3 years and 3.8 years, respectively. The aggregate intrinsic value of the options outstanding and options exercisable at December 31, 2013, was EUR 104 million and EUR 41 million, respectively.
The weighted average grant-date fair value of options granted during 2013, 2012, and 2011 was EUR 4.21, EUR 2.84 and EUR 4.82, respectively. The total intrinsic value of options exercised during 2013, 2012, and 2011 was approximately EUR 15 million, EUR 3 million and EUR 1 million, respectively.European
Annual Report 2013 2012016 177
11 Group financial statements 11.9 - 11.9
Option plans (excluding Accelerate! options)
USD-denominated
| options | weighted average exercise price | |||||||
Outstanding at January 1, 2013 | 16,606,652 | 29.04 | ||||||
Granted | 22,275 | 28.69 | ||||||
Exercised | 1,969,901 | 23.27 | ||||||
Forfeited | 1,209,456 | 30.66 | ||||||
Expired | — | — | ||||||
|
| |||||||
Outstanding at December 31, 2013 | 13,449,570 | 29.74 | ||||||
|
| |||||||
Exercisable at December 31, 2013 | 8,313,489 | 33.26 | ||||||
The exercise prices range from USD 16.76 to USD 44.15. The weighted average remaining contractual term for options outstanding and options exercisable at December 31, 2013, was 5.4 years and 3.9 years, respectively. The aggregate intrinsic value of the options outstanding and options exercisable at December 31, 2013, was USD 106 million and USD 40 million, respectively.
The weighted average grant-date fair value of options granted during 2013, 2012 and 2011 was USD 6.70, USD 4.56 and USD 7.47, respectively. The total intrinsic value of options exercised during 2013, 2012 and 2011 was USD 17 million, USD 4 million and USD 4 million.
At December 31, 2013, a total of EUR 9 million of unrecognized compensation costs relate to non-vested EUR and USD denominated options. These costs are expected to be recognized over a weighted- average period of 1.0 years. Cash received from exercises under the Company’s option plans amounted to EUR 84 million, EUR 19 million and EUR 20 million in 2013, 2012, and 2011, respectively. The actual tax deductions realized as a result of option exercises totaled approximately EUR 5 million, EUR 1 million and EUR 1 million, in 2013, 2012, and 2011, respectively.
The outstanding options are categorized in exercise price ranges as follows:
Option plans (excluding Accelerate! options)
exercise price | options | intrinsic millions | weighted average remaining contractual term | |||||||||
EUR-denominated | ||||||||||||
10-15 | 4,967,645 | 61 | 7.4 yrs | |||||||||
15-20 | 1,104,222 | 9 | 2.5 yrs | |||||||||
20-25 | 8,547,886 | 33 | 5.6 yrs | |||||||||
25-30 | 1,693,773 | 1 | 2.3 yrs | |||||||||
30-35 | 2,344,302 | — | 3.3 yrs | |||||||||
|
| |||||||||||
| 18,657,828 | 104 | 5.3 yrs | ||||||||||
USD-denominated | ||||||||||||
15-20 | 3,406,981 | 62 | 7.6 yrs | |||||||||
20-25 | 335,769 | 5 | 7.8 yrs | |||||||||
25-30 | 3,220,919 | 26 | 5.3 yrs | |||||||||
30-35 | 2,943,429 | 12 | 4.7 yrs | |||||||||
35-40 | 1,813,212 | 1 | 4.2 yrs | |||||||||
40-55 | 1,729,260 | — | 3.3 yrs | |||||||||
|
| |||||||||||
| 13,449,570 | 106 | 5.4 yrs | ||||||||||
The aggregate intrinsic value in the tables and text above represents the total pre-tax intrinsic value (the difference between the Company’s closing share price on the last trading day of 2013 and the exercise price, multiplied by the number of in-the-money options) that would have been received by the option holders if the options had been exercised on December 31, 2013.
The following table summarizes information about the Company’s Accelerate! options as of December 31, 2013 and changes during the year:
Accelerate! options
options | weighted average exercise price | |||||||
EUR-denominated | ||||||||
Outstanding at January 1, 2013 | 2,927,000 | 15.24 | ||||||
Granted | 152,000 | 22.43 | ||||||
Forfeited | 225,000 | 15.24 | ||||||
|
| |||||||
Outstanding at December 31, 2013 | 2,854,000 | 15.62 | ||||||
Exercisable at December 31, 2013 | 2,722,000 | 15.29 | ||||||
USD-denominated | ||||||||
Outstanding at January 1, 2013 | 860,000 | 20.02 | ||||||
Granted | — | — | ||||||
Forfeited | 65,000 | 20.02 | ||||||
|
| |||||||
Outstanding at December 31, 2013 | 795,000 | 20.02 | ||||||
Exercisable at December 31, 2013 | 795,000 | 20.02 | ||||||
The exercise price of the Accelerate! options granted in 2012 are EUR 15.24 and USD 20.02 and in 2013 EUR 22.43. The weighted average remaining contractual term for EUR and USD Accelerate! options outstanding and exercisable at December 31, 2013 was 8.1 years. The aggregate intrinsic value of the Accelerate! options outstanding at December 31, 2013, was EUR 31 million and USD 13 million, respectively.
The grant-date fair value of Accelerate! options granted during 2013 was EUR 4.41 per option. At December 31, 2013 there are no unrecognized compensation costs related to both EUR and USD Accelerate! options. At December 31, 2013 all performance targets under the Accelerate! program, which were based on the 2013 mid-term financial targets, have been met.
Restricted and Accelerate! shares
The fair value of restricted and Accelerate! shares is equal to the fair value of the share at grant date less the present value, using the risk-free interest rate, of dividends which will not be received up to the vesting date.
The Company issues restricted shares that, in general, vest in equal annual installments over a three-year period, starting one year after the date of grant. For grants up to and including January 2013 the Company granted 20% additional (premium) shares, provided the grantee still holds the shares after three years from the delivery date and the grantee is still with the Company on the respective delivery dates.
202 Annual Report 2013
11 Group financial statements 11.9 - 11.9
A summary of the status of the Company’s restricted shares as of December 31, 2013 and changes during the year are presented below:
Restricted shares (excluding Accelerate! shares)1)
shares | weighted date fair value | |||||||
EUR-denominated | ||||||||
Outstanding at January 1, 2013 | 1,954,985 | 16.45 | ||||||
Granted | 85,296 | 21.90 | ||||||
Vested/Issued | 885,733 | 18.07 | ||||||
Forfeited | 89,379 | 16.01 | ||||||
|
| |||||||
Outstanding at December 31, 2013 | 1,065,169 | 15.31 | ||||||
USD-denominated | ||||||||
Outstanding at January 1, 2013 | 1,924,156 | 20.99 | ||||||
Granted | 114,127 | 31.48 | ||||||
Vested/Issued | 795,668 | 23.14 | ||||||
Forfeited | 102,369 | 20.18 | ||||||
|
| |||||||
Outstanding at December 31, 2013 | 1,140,246 | 20.33 | ||||||
|
At December 31, 2013, a total of EUR 16 million of unrecognized compensation costs relate to non-vested restricted shares. These costs are expected to be recognized over a weighted-average period of 1.8 years.
A summary of the status of the Company’s Accelerate! shares as of December 31, 2013 and changes during the year are presented below:
Accelerate! shares
shares | weighted date fair value | |||||||
EUR-denominated | ||||||||
Outstanding at January 1, 2013 | 2,927,000 | 13.75 | ||||||
Granted | 152,000 | 21.68 | ||||||
Forfeited | 225,000 | 13.75 | ||||||
Vested | 2,854,000 | 14.17 | ||||||
|
| |||||||
Outstanding at December 31, 2013 | — | — | ||||||
USD-denominated | ||||||||
Outstanding at January 1, 2013 | 860,000 | 18.05 | ||||||
Granted | — | — | ||||||
Forfeited | 65,000 | 18.05 | ||||||
Vested | 795,000 | 18.05 | ||||||
|
| |||||||
Outstanding at December 31, 2013 | — | — | ||||||
On January 28, 2014 the Supervisory Board resolved that all performance targets under the Accelerate! program, which were based on the 2013 mid- term financial targets, have been met. This means that in accordance with IFRS accounting requirements the Accelerate! shares vested and that at December 31, 2013 there are no unrecognized compensation costs to both EUR and USD Accelerate! shares. After delivery an additional two-year holding period applies, except for Accelerate! shares granted to the Board of Management of which after delivery an additional four-year holding period applies.
Performance shares
The performance is measured over a three-year performance period. The performance shares have two performance conditions, relative Total Shareholders’ Return compared to a peer group of 21 companies and adjusted Earnings Per Share growth. The performance shares vest three years after the grant date. The number of performance shares that will vest is dependent on achieving the two performance conditions, which are equally weighted, and provided that the grantee is still employed with the Company.
The fair value of the performance shares is measured based on Monte- Carlo simulation and the following weighted average assumptions:
| ||||
| ||||
| ||||
| ||||
| ||||
| ||||
| ||||
The Company has based its volatility assumptions on historical experience measured over a ten-year period.
A summary of the status of the Company’s performance share plans as of December 31, 2013 and changes during the year are presented below:
shares | weighted average grant- date fair value | |||||||
EUR-denominated | ||||||||
Granted | 3,509,518 | 23.53 | ||||||
Forfeited | 66,595 | 23.45 | ||||||
Outstanding at December 31, 2013 | 3,442,923 | 23.53 | ||||||
USD-denominated | ||||||||
Granted | 2,419,445 | 30.77 | ||||||
Forfeited | 121,219 | 30.70 | ||||||
Outstanding at December 31, 2013 | 2,298,226 | 30.77 | ||||||
At December 31, 2013, a total of EUR 116 million of unrecognized compensation costs relate to non-vested performance shares. These costs are expected to be recognized over a weighted-average period of 2.3 years.
Other plans
Employee share purchase plan
Under the terms of employee stock purchase plans established by the Company in various countries, substantially all employees in those countries are eligible to purchase a limited number of Philips shares at discounted prices through payroll withholdings, of which the maximum ranges from 10% to 20% of total salary. Generally, the discount provided to the employees is in the range of 10% to 20%. A total of 1,425,048 shares were bought by employees in 2013 under the plan at an average price of EUR 21.92 (2012: 1,906,183 shares at EUR 15.69; 2011: 1,851,718 shares at EUR 17.93).
Convertible personnel debentures
In the Netherlands, the Company issued personnel debentures with a 2- year right of conversion into its common shares starting three years after the date of issuance, with a conversion price equal to the share price on that date. The last issuance of this particular plan was in December 2008. From 2009 onwards, employees in the Netherlands are able to join an employee share purchase plan as described in the previous paragraph. In
Annual Report 2013 203
 11 Group financial statements 11.9 - 11.9

2013, 509,195 shares were issuedCommission. In February 2017, the European Commission opened its formal proceedings. Philips is fully cooperating with the European Commission.
Due to the considerable uncertainty associated with this matter, on the basis of current knowledge, the Company has concluded that potential losses cannot be reliably estimated with respect to these matters.
Miscellaneous
As part of the divestment of the Television and Audio, Video, Multimedia & Accessories businesses in conjunction2012 and 2014, the Company transferred economic ownership and control in some legal entities or divisions thereof, while retaining (partial) legal ownership. Considering the current challenging business environment, the Company might face employee and operational liabilities in case of certain adverse events. Given the uncertain nature of the relevant events and liabilities, it is not practicable to provide information on the estimate of the financial effect, if any, or timing. The outcome of the uncertain events could have a material impact on the Company’s consolidated financial position, results of operations and cash flows.
The Company is currently in advanced discussions on resolving a civil matter with conversions at an average pricethe US Department of EUR 14.21 (2012: 270,827 shares at an average priceJustice representing the US Food and Drug Administration (FDA), arising from past inspections by the FDA in and prior to 2015. The discussions focus primarily on the Company’s compliance with the FDA’s Quality System Regulations in the Company’s Emergency Care and Resuscitation (ECR) business in the United States. While discussions have not yet concluded, the Company anticipates that the actions necessary to address the FDA’s compliance concerns will have a meaningful impact on the operations of EUR 14.22; 2011: 1,079 shares at an average price of EUR 24.66).its ECR business.
In the normal course of business, Philips purchases and sells goods and services from/to various related parties in which Philips typically holds a 50% or less equity interest and has significant influence. These transactions are generally conducted with terms comparable to transactions with third parties.
For details of these parties in which Philips typically holds a 50% or less equity interest, refer to the Investments in associates section ofnote 5, Interests in entities.
| 2011 | 2012 | 2013 | ||||||||||
Sales of goods and services | 278 | 288 | 305 | |||||||||
Purchases of goods and services | 117 | 130 | 143 | |||||||||
Receivables from related parties | 19 | 13 | 39 | |||||||||
Payables to related parties | 6 | 4 | 4 | |||||||||
Based onPhilips Group
Related-party transactionsin millions of EUR
2014 - 2016
|
| |||||||||||
| 2014 | 2015 | 2016 | ||||||||||
|
| |||||||||||
Sales of goods and services | 215 | 222 | 207 | |||||||||
Purchases of goods and services | 85 | 87 | 81 | |||||||||
Receivables from related parties | 14 | 16 | 33 | |||||||||
Payables to related parties | 4 | 4 | 3 | |||||||||
|
| |||||||||||
In addition to the table above, as part of its 30% shareoperations in the TP Vision venture,US, Philips had various commitmentssoldnon-recourse third-party receivables to provide further fundingPMC US amounting to the TP Vision venture at December 31, 2013:
A subordinated shareholder loan of EUR 51139 million (fully drawn) can be extended depending on the venture’s funding needs.in 2016 (2015: EUR 21 million of this loan is due in April 2015 and129 million; 2014: EUR 30 million due in April 2017,
A senior 12-month EUR 30 million bridge loan facility (undrawn) to the venture can be extended up to April 2017 depending on the venture’s funding needs,
A committed EUR 60 million loan facility (undrawn) that can be extended up to April 2018, depending on the venture’s funding needs.
On 20 January 2014, Philips has signed a term sheet to transfer its remaining 30% stake in the TP Vision venture, which will also impact the above commitments (note 36, Subsequent events)123 million).
See also, note 7, Discontinued operations and other assets classified as held for sale for further details on the Television business divestment.
In light of the composition of the Executive Committee, during 2012 and 2013, the Company consideredconsiders the members of the Executive Committee and the Supervisory boardBoard to be the key management personnel as defined in IAS 24 ‘Related parties’. In 2011, the Company considered the members of the Board of Management and the Supervisory Board to be the key management personnel.
For remuneration details of the Executive Committee, the Board of Management and the Supervisory Board seenote 33,28, Information on remuneration.
For employee benefit plans seenote 30,20, Post-employment benefits.
The purpose of the share-based compensation plans is to align the interests of management with those of shareholders by providing incentives to improve the Company’s performance on a long-term basis, thereby increasing shareholder value.
The Company has the following plans:
performance shares: rights to receive common shares in the future based on performance and service conditions;
restricted shares: rights to receive common shares in the future based on a service condition; and
options on its common shares, including the 2012 and 2013 Accelerate! grant.
Since 2013 the Board of Management and other members of the Executive Committee are only granted performance shares. Restricted shares are granted to executives, certain selected employees and new employees. Prior to 2013 options were also granted.
Furthermore, as part of the Accelerate! program, the Company has granted options (Accelerate! options) to a group of approximately 500 key employees below the level of Board of Management in January 2012 and to the Board of Management in January 2013.
Under the terms of employee stock purchase plans established by the Company in various countries, employees are eligible to purchase a limited number of Philips shares at discounted prices through payroll withholdings.
Share-based compensation costs were EUR 119 million (2015: EUR 99 million, 2014: EUR 85 million). This includes the employee stock purchase plan of 5 million, which is not a share-based compensation that affects equity. The share-based compensation costs for staff belonging to the combined businesses of Lumileds and Automotive of EUR 6 million are included in Discontinued operations. In the consolidated
178 Annual Report 2016
Group financial statements 10.10
statements of changes in equity EUR 119 million is recognized in 2016 related to the share-based compensation plans. The amount recognized as an expense is adjusted for forfeiture.USD-denominated performance shares, restricted shares and options are granted to employees in the United States only.
Performance shares
The performance is measured over a three-year performance period. The performance shares have two performance conditions, relative Total Shareholders’ Return compared to a peer group of 20 companies (2015: 21 companies, 2014: 21 companies) and adjusted Earnings Per Share growth. The performance shares vest three years after the grant date. The number of performance shares that will vest is dependent on achieving the two performance conditions, which are equally weighted, and provided that the grantee is still employed with the Company.
The amount recognized as an expense is adjusted for actual performance of adjusted Earnings Per Share growth since this is anon-market performance condition. It is not adjusted fornon-vesting or extra vesting of performance shares due to a relative Total Shareholders’ Return performance that differs from the performance anticipated at the grant date, since this is a market-based performance condition.
The fair value of the performance shares is measured based on Monte-Carlo simulation, which takes into account dividend payments between the grant date and the vesting date by including reinvested dividends, the market conditions expected to impact relative Total Shareholders’ Return performance in relation to selected peers, and the following weighted-average assumptions:
Philips Group
Assumptions used in Monte-Carlo simulation for valuation in %
2016
| 2016 | ||||
| EUR-denominated | ||||
Risk-free interest rate | (0.45 | )% | ||
Expected dividend yield | 3.4 | % | ||
Expected share price volatility | 26 | % | ||
| USD-denominated | ||||
Risk-free interest rate | (0.45 | )% | ||
Expected dividend yield | 3.4 | % | ||
Expected share price volatility | 29 | % | ||
The assumptions were used for these calculations only and do not necessarily represent an indication of Management’s expectation of future developments for other purposes. The Company has based its volatility assumptions on historical experience measured over aten-year period.
A summary of the status of the Company’s performance share plans as of December 31, 2016 and changes during the year are presented below:
Philips Group
Performance share plans
2016
|
| |||||||
| shares1) | weighted average grant-date fair value | |||||||
|
| |||||||
| EUR-denominated | ||||||||
Outstanding at January 1, 2016 | 8,394,982 | 24.83 | ||||||
Granted | 2,589,991 | 24.86 | ||||||
Vested/Issued | 2,272,590 | 23.54 | ||||||
Forfeited | 910,120 | 24.80 | ||||||
|
| |||||||
Outstanding at December 31, 2016 | 7,802,263 | 25.21 | ||||||
| USD-denominated | ||||||||
Outstanding at January 1, 2016 | 5,774,700 | 30.35 | ||||||
Granted | 1,673,886 | 28.36 | ||||||
Vested/Issued | 1,660,640 | 30.79 | ||||||
Forfeited | 669,017 | 30.34 | ||||||
|
| |||||||
Outstanding at December 31, 2016 | 5,118,929 | 29.56 | ||||||
|
| |||||||
| 1) | Excludes dividend declared on outstanding shares between grant date and vesting date that will be issued in shares(EUR-denominated: 548,830 shares andUSD-denominated: 362,334 shares). |
At December 31, 2016, a total of EUR 124 million of unrecognized compensation costs relate tonon-vested performance shares. These costs are expected to be recognized over a weighted-average period of 1.8 years.
Restricted shares
The fair value of restricted shares is equal to the share price at grant date.
The Company issues restricted shares that, in general, have a 3 year cliff-vesting period. For grants up to and including January 2013 the Company granted 20% additional (premium) shares, provided the grantee still holds the shares after three years from the delivery date and the grantee is still with the Company on the respective delivery dates. As of December 31, 2016 all restricted share plans granted before 2013 have vested except their premium shares.
Annual Report 2016 179
Group financial statements 10.10
A summary of the status of the Company’s restricted shares as of December 31, 2016 and changes during the year are presented below:
Philips Group
Restricted shares
2016
|
| |||||||
| shares1)2) | weighted average grant-date fair value | |||||||
|
| |||||||
| EUR-denominated | ||||||||
Outstanding at January 1, 2016 | 1,008,675 | 25.02 | 3) | |||||
Granted | 1,171,449 | 24.09 | ||||||
Vested/Issued | 436,326 | 24.95 | ||||||
Forfeited | 76,838 | 24.67 | ||||||
|
| |||||||
Outstanding at December 31, 2016 | 1,666,960 | 24.40 | ||||||
| USD-denominated | ||||||||
Outstanding at January 1, 2016 | 758,409 | 28.79 | 3) | |||||
Granted | 1,297,750 | 27.38 | ||||||
Vested/Issued | 201,062 | 28.81 | ||||||
Forfeited | 143,194 | 28.09 | ||||||
|
| |||||||
Outstanding at December 31, 2016 | 1,711,903 | 27.78 | ||||||
|
| |||||||
| 1) | Excludes dividend declared on outstanding shares between grant date and vesting date that will be issued in shares(EUR-denominated: 79,499 shares andUSD-denominated: 73,292 shares). |
| 2) | Excludes premium shares on Restricted shares granted before 2013. (20% additional (premium) shares that may be received if shares delivered under the plan are not sold for a three-year period). |
| 3) | The weighted average grant-date fair value was updated for outstanding shares at January 1, 2016 due to an update in the fair value calculation of restricted shares. |
At December 31, 2016, a total of EUR 42 million of unrecognized compensation costs relate tonon-vested restricted shares. These costs are expected to be recognized over a weighted-average period of 1.5 years.
Option plans
The Company granted options that expire after 10 years. These options vest after 3 years, provided that the grantee is still employed with the Company. All outstanding options have vested as of December 31, 2016.
The following tables summarize information about the Company’s options as of December 31, 2016 and changes during the year:
Philips Group
Options onEUR-denominated listed share
2016
|
| |||||||
| options | weighted average exercise price | |||||||
|
|
|
| |||||
Outstanding at January 1, 2016 | 11,647,314 | 22.23 | ||||||
Exercised | 2,784,387 | 18.69 | ||||||
Forfeited | 501,159 | 27.59 | ||||||
Expired | 1,309,703 | 26.27 | ||||||
|
| |||||||
Outstanding at December 31, 2016 | 7,052,065 | 22.49 | ||||||
|
| |||||||
Exercisable at December 31, 2016 | 7,052,065 | 22.49 | ||||||
|
| |||||||
The exercise prices range from EUR 12.63 to EUR 32.04. The weighted average remaining contractual term for options outstanding and options exercisable at December 31, 2016, was 2.9 years. The aggregate intrinsic value of the options outstanding and options exercisable at December 31, 2016, was EUR 49 million.
The total intrinsic value of options exercised during 2016 was EUR 20 million (2015: EUR 21 million, 2014: EUR 11 million).
Philips Group
Options onUSD-denominated listed share
2016
|
| |||||||
| options | weighted average exercise price | |||||||
|
| |||||||
Outstanding at January 1, 2016 | 9,676,807 | 30.62 | ||||||
Exercised | 724,260 | 19.79 | ||||||
Forfeited | 387,222 | 34.71 | ||||||
Expired | 840,104 | 32.04 | ||||||
|
| |||||||
Outstanding at December 31, 2016 | 7,725,221 | 31.27 | ||||||
|
| |||||||
Exercisable at December 31, 2016 | 7,725,221 | 31.27 | ||||||
|
| |||||||
The exercise prices range from USD 16.76 to USD 44.15. The weighted average remaining contractual term for options outstanding and options exercisable at December 31, 2016, was 2.9 years. The aggregate intrinsic value of the options outstanding and options exercisable at December 31, 2016, was USD 22 million.
The total intrinsic value of options exercised during 2016 was USD 6 million (2015: USD 8 million, 2014: USD 9 million).
At December 31, 2016 there were no unrecognized compensation costs related to outstanding options. Cash received from exercises under the Company’s option plans amounted to EUR 65 million in 2016 (2015: EUR 72 million, 2014: EUR 77 million). The actual tax deductions realized as a result of option exercises totaled approximately EUR 2 million in 2016 (2015: EUR 3 million, 2014: EUR 3 million).
180 Annual Report 2016
 Group financial statements 10.10
The outstanding options as of December 31, 2016 are categorized in exercise price ranges as follows:
Philips Group
Outstanding options
2016
|
| |||||||||||
| exercise price | options | intrinsic value in millions | weighted average remaining contractual term | |||||||||
|
| |||||||||||
EUR-denominated | ||||||||||||
10-15 | 1,784,149 | 26 | 4.7 yrs | |||||||||
15-20 | 55,530 | 1 | 4.8 yrs | |||||||||
20-25 | 3,573,585 | 22 | 3.3 yrs | |||||||||
25-30 | 1,683 | 0.1 yrs | ||||||||||
30-35 | 1,637,118 | 0.3 yrs | ||||||||||
|
| |||||||||||
Outstanding options | 7,052,065 | 49 | 2.9 yrs | |||||||||
USD-denominated | ||||||||||||
15-20 | 1,679,475 | 20 | 4.6 yrs | |||||||||
20-25 | 106,797 | 1 | 4.7 yrs | |||||||||
25-30 | 1,762,125 | 2 | 4.3 yrs | |||||||||
30-35 | 1,470,263 | 2.9 yrs | ||||||||||
35-40 | 1,337,625 | 1.2 yrs | ||||||||||
40-55 | 1,368,936 | 0.3 yrs | ||||||||||
|
| |||||||||||
Outstanding options | 7,725,221 | 23 | 2.9 yrs | |||||||||
|
| |||||||||||
The aggregate intrinsic value in the tables and text above represents the totalpre-tax intrinsic value (the difference between the Company’s closing share price on the last trading day of 2016 and the exercise price, multiplied by the number ofin-the-money options) that would have been received by the option holders if the options had been exercised on December 31, 2016.
The following table summarizes information about the Company’s Accelerate! options as of December 31, 2016 and changes during the year:
Philips Group
Accelerate! options
2016
|
| |||||||
| options | weighted average exercise price | |||||||
|
| |||||||
EUR-denominated | ||||||||
Outstanding at January 1, 2016 | 1,304,500 | 16.08 | ||||||
Exercised | 439,200 | 16.20 | ||||||
Forfeited | 5,000 | 15.24 | ||||||
|
| |||||||
Outstanding at December 31, 2016 | 860,300 | 16.02 | ||||||
|
| |||||||
Exercisable at December 31, 2016 | 860,300 | 16.02 | ||||||
USD-denominated | ||||||||
Outstanding at January 1, 2016 | 347,800 | 20.02 | ||||||
Exercised | 90,000 | 20.02 | ||||||
Forfeited | — | |||||||
|
| |||||||
Outstanding at December 31, 2016 | 257,800 | 20.02 | ||||||
|
| |||||||
Exercisable at December 31, 2016 | 257,800 | 20.02 | ||||||
|
| |||||||
The exercise prices of the Accelerate! options are EUR 15.24 and EUR 22.43 forEUR-denominated options and is USD 20.02 forUSD-denominated options. The weighted average remaining contractual term forEUR-denominated Accelerate! options outstanding and exercisable at December 31, 2016 was 5.2 years. The weighted average remaining contractual term forUSD-Accelerate! options outstanding and exercisable at December 31, 2016 was 5.1 years. The aggregate intrinsic value of theEUR-denominated Accelerate! options outstanding and exercisable at December 31, 2016, was EUR 11 million. The aggregate intrinsic value of theUSD-denominated Accelerate! options outstanding and exercisable at December 31, 2016, was USD 3 million.
The total intrinsic value of Accelerate! options exercised during 2016 was EUR 4 million forEUR-denominated options (2015: EUR 5 million) and USD 1 million forUSD-denominated options (2015: USD 1 million).
Cash received from exercises forEUR-denominated andUSD-denominated Accelerate! options amounted to EUR 9 million in 2016 (2015: EUR 9 million). The actual tax deductions realized as a result of Accelerate! USD options exercises totaled approximately EUR 0.3 million in 2016 (2015: EUR 0.3 million).
Remuneration of the Executive Committee
In 2013,2016, the total remuneration costs relating to the members of the Executive Committee (including(consisting of 12 members, including the members of the Board of Management) amounted to EUR 24,773,537 (2012:22,433,827 (2015: EUR 18,585,112)15,098,023, 2014: EUR 16,878,909) consisting of the elements in the table below.
Annual Report 2016 181
Group financial statements 10.10
Philips Group
Remuneration costs of the Executive Committee1)in EUR
in euros2014 - 2016
| 2012 | 2013 | |||||||
Salary | 5,640,090 | 6,011,557 | ||||||
Annual incentive1) | 4,839,949 | 4,422,732 | ||||||
Performance shares2) | 1,049,205 | 6,478,554 | ||||||
Stock options2) | 1,194,444 | 2,020,040 | ||||||
Restricted share rights2) | 1,566,448 | 1,115,504 | ||||||
Pension costs | 2,054,516 | 2,277,705 | ||||||
Other compensation3) | 2,240,460 | 2,447,445 | ||||||
|
| |||||||||||
| 2014 | 2015 | 2016 | ||||||||||
|
| |||||||||||
Base salary/Base compensation | 6,513,027 | 5,974,928 | 6,388,667 | |||||||||
Annual incentive2) | 1,526,658 | 2,705,560 | 5,746,347 | |||||||||
Performance shares3) | 3,357,142 | 2,740,004 | 5,943,782 | |||||||||
Stock options3) | 583,755 | 88,775 | — | |||||||||
Restricted share rights3) | 409,809 | 91,339 | 764,311 | |||||||||
Pension allowances4) | — | 2,193,409 | 1,854,129 | |||||||||
Pension scheme costs | 2,458,759 | 209,462 | 180,077 | |||||||||
Other compensation5) | 2,029,759 | 1,094,546 | 1,556,514 | |||||||||
|
| |||||||||||
| 1) | The Executive Committee consisted of 12 members as per December 31, 2016 (2015: 8 members; 2014: 9 members) |
| 2) | The annual incentives are related to the performance in the year reported which are paid out in the subsequent year |
Costs of performance shares, stock options and restricted share rights are based on accounting standards (IFRS) and do not reflect the value of stock options at the end of the lock up period and the value of performance shares and restricted share rights at the vesting/release |
Pension allowances are gross taxable allowances paid to the Executive Committee members in the Netherlands. These allowances are part of the pension arrangement |
| 5) | The stated |
At December 31, 2013,2016, the members of the Executive Committee (including the members of the Board of Management) held 1,479,498 (2012: 1,376,913)750,631 (2015: 843,461; 2014: 1,050,080) stock options at a weighted average exercise price of EUR 18.69 (2012:21.17 (2015: EUR 18.23)18.67; 2014: EUR 18.53).
Remuneration of the Board of Management
In 2013,2016, the total remuneration costs relating to the members of the Board of Management amounted to EUR 10,928,951 (2012:8,904,859 (2015: EUR 7,301,334; 2011:6,612,092; 2014: EUR 10,844,833).6,635,334), see table below.
At December 31, 2013,2016, the members of the Board of Management held 586,500476,200 stock options (2012: 454,500; 2011: 1,072,431)(2015: 479,881; 2014: 586,500) at a weighted average exercise price of EUR 19.60. (2012:19.47 (2015: EUR 18.78; 2011:19.52; 2014: EUR 23.01)19.60).
204 Annual Report 2013
11Philips Group financial statements 11.9 - 11.9
Remuneration costs of individual members of the Board of Managementin EUR
in euros2014 - 2016
salary | annual incentive1) | performance shares2) | stock options2) | restricted share rights2) | pension costs | other compensation3) | ||||||||||||||||||||||
| 20134) | ||||||||||||||||||||||||||||
F.A. van Houten | 1,100,000 | 1,081,520 | 1,594,675 | 461,215 | 190,441 | 468,407 | 75,906 | |||||||||||||||||||||
R.H. Wirahadiraksa | 656,250 | 497,745 | 1,040,393 | 307,699 | 128,856 | 263,451 | 35,732 | |||||||||||||||||||||
P.A.J. Nota | 618,750 | 561,713 | 1,025,153 | 352,608 | 146,626 | 253,605 | 68,206 | |||||||||||||||||||||
|
| |||||||||||||||||||||||||||
| 2,375,000 | 2,140,978 | 3,660,221 | 1,121,522 | 465,923 | 985,463 | 179,844 | ||||||||||||||||||||||
| 20124) | ||||||||||||||||||||||||||||
F.A. van Houten | 1,100,000 | 1,279,520 | — | 209,589 | 315,760 | 422,845 | 47,154 | |||||||||||||||||||||
R.H. Wirahadiraksa | 600,000 | 523,440 | — | 149,067 | 217,020 | 243,438 | 34,961 | |||||||||||||||||||||
P.A.J. Nota | 600,000 | 556,200 | — | 188,029 | 253,836 | 247,883 | 60,754 | |||||||||||||||||||||
S.H. Rusckowski (Jan. - Apr.) | 233,333 | 178,500 | — | (200,400 | ) | (209,638 | ) | 90,211 | 159,833 | |||||||||||||||||||
|
| |||||||||||||||||||||||||||
| 2,533,333 | 2,537,660 | — | 346,285 | 576,978 | 1,004,377 | 302,701 | ||||||||||||||||||||||
| 2011 | ||||||||||||||||||||||||||||
F.A. van Houten (Apr. - Dec.) | 825,000 | 363,000 | — | 125,957 | 253,926 | 297,179 | 39,709 | |||||||||||||||||||||
R.H. Wirahadiraksa (Apr. - Dec.) | 450,000 | 148,500 | — | 105,477 | 180,686 | 170,299 | 72,125 | |||||||||||||||||||||
G.H.A. Dutiné | 650,000 | 214,500 | — | 462,263 | 334,186 | 245,018 | 143,774 | |||||||||||||||||||||
P.A.J. Nota (Apr. - Dec.) | 450,000 | 148,500 | — | 131,159 | 255,159 | 168,532 | 67,067 | |||||||||||||||||||||
S.H. Rusckowski | 687,500 | 231,000 | — | 211,915 | 341,856 | 254,975 | 336,773 | |||||||||||||||||||||
G.J. Kleisterlee (Jan. - March) | 275,000 | 92,400 | — | 375,736 | 29,973 | (48,117 | )5) | 105,679 | ||||||||||||||||||||
P-J. Sivignon (Jan. - March) | 178,750 | 45,045 | — | 213,435 | 7,041 | 68,830 | 9,340 | |||||||||||||||||||||
R.S. Provoost (Jan. - Sept.) | 512,500 | 132,300 | — | 213,434 | 69,545 | 175,301 | 22,606 | |||||||||||||||||||||
|
| |||||||||||||||||||||||||||
| 4,028,750 | 1,375,245 | — | 1,839,376 | 1,472,372 | 1,332,017 | 797,073 | ||||||||||||||||||||||
|
| |||||||||||||||||||||||||||||||||||
| base compensation/ salary | annual incentive1) | performance shares2) | stock options2) | restricted share rights2) | pension allowances3) | pension scheme costs | other compensation4) | total costs | ||||||||||||||||||||||||||||
|
| |||||||||||||||||||||||||||||||||||
| 2016 | ||||||||||||||||||||||||||||||||||||
F.A. van Houten | 1,197,500 | 1,354,227 | 1,423,538 | — | 12,041 | 536,195 | 24,838 | 126,703 | 4,675,042 | |||||||||||||||||||||||||||
A. Bhattacharya | 650,000 | 540,072 | 362,758 | — | 3,341 | 201,524 | 24,838 | 73,642 | 1,856,175 | |||||||||||||||||||||||||||
P.A.J. Nota | 702,500 | 619,745 | 683,101 | — | 9,251 | 277,649 | 24,838 | 56,558 | 2,373,642 | |||||||||||||||||||||||||||
|
| |||||||||||||||||||||||||||||||||||
| 2,550,000 | 2,514,044 | 2,469,397 | — | 24,633 | 1,015,368 | 74,514 | 256,903 | 8,904,859 | ||||||||||||||||||||||||||||
2015 F.A. van Houten | 1,168,750 | 768,920 | 1,273,940 | 17,713 | 28,279 | 529,387 | 25,241 | 78,035 | 3,890,265 | |||||||||||||||||||||||||||
A. Bhattacharya | 23,551 | 11,937 | 8,968 | — | 183 | 7,315 | 886 | 998 | 53,838 | |||||||||||||||||||||||||||
R.H. Wirahadiraksa | 664,583 | 239,250 | (652,049 | ) | 12,045 | (37,210 | ) | 290,772 | 24,002 | 29,477 | 570,870 | |||||||||||||||||||||||||
P.A.J. Nota | 672,500 | 383,112 | 605,749 | 12,045 | 21,964 | 270,529 | 26,302 | 104,918 | 2,097,119 | |||||||||||||||||||||||||||
|
| |||||||||||||||||||||||||||||||||||
| 2,529,384 | 1,403,219 | 1,236,608 | 41,803 | 13,216 | 1,098,003 | 76,431 | 213,428 | 6,612,092 | ||||||||||||||||||||||||||||
| 2014 | ||||||||||||||||||||||||||||||||||||
F.A. van Houten | 1,137,500 | 349,600 | 860,564 | 101,344 | 76,951 | — | 485,655 | 86,554 | 3,098,168 | |||||||||||||||||||||||||||
R.H. Wirahadiraksa | 712,500 | 156,600 | 446,337 | 68,914 | 52,965 | — | 298,995 | 35,909 | 1,772,220 | |||||||||||||||||||||||||||
P.A.J. Nota | 643,750 | 258,180 | 406,358 | 68,914 | 57,200 | — | 267,037 | 63,507 | 1,764,946 | |||||||||||||||||||||||||||
|
| |||||||||||||||||||||||||||||||||||
| 2,493,750 | 764,380 | 1,713,259 | 239,172 | 187,116 | — | 1,051,687 | 185,970 | 6,635,334 | ||||||||||||||||||||||||||||
| 1) | The annual incentives are related to the performance in the year reported which are paid out in the subsequent year. For more details on the annual incentives, seesub-section |
| 2) | Costs of performance shares, stock options and restricted share rights |
| 3) | Pension allowances are gross taxable allowances paid to members of the Board of Management. These allowances are part of the pension arrangement as agreed upon in the services contracts. |
| 4) | The stated amounts mainly concern (share of) allowances to members of the Board of Management that can be considered as remuneration. In a situation where such a share of an allowance can be considered as (indirect) remuneration (for example, private use of the company car), then the share is both valued and accounted for here. The method employed by the fiscal authorities |
|
|
For further information on remuneration costs, seesub-section 9.2.4, 8.2.4, Remuneration costs, of this report.
182 Annual Report 2013 2052016
11 Group financial statements 11.9 - 11.910.10
The tables below give an overview of the holding of the members of the Board of Management under the performance share plans restricted share rights plan and the stock option plans of the Company:Company, held by the members of the Board of Management:
Philips Group
Number of performance shares (holdings) in number of shares
2016
January 1, 2013 | awarded | awarded dividend shares 2013 | December 31, | |||||||||||||
F.A. van Houten | — | 62,559 | 2,112 | 64,671 | ||||||||||||
| — | 55,000 | 1) | — | 55,000 | ||||||||||||
R.H. Wirahadiraksa | — | 31,991 | 1,080 | 33,071 | ||||||||||||
| — | 38,500 | 1) | — | 38,500 | ||||||||||||
P.A.J. Nota | — | 29,621 | 1,000 | 30,621 | ||||||||||||
| — | 38,500 | 1) | — | 38,500 | ||||||||||||
|
| |||||||||||||||
| — | 256,171 | 4,192 | 260,363 | |||||||||||||
|
Number of restricted share rights (holdings)
January 1, | awarded | released | December 31, | potential shares | ||||||||||||||||
F.A. van Houten | 35,035 | 1) | — | 15,034 | 20,001 | 9,024 | ||||||||||||||
R.H. Wirahadiraksa | 24,045 | 1) | — | 10,443 | 13,602 | 6,935 | ||||||||||||||
P.A.J. Nota | 26,070 | 1) | — | 12,468 | 13,602 | 7,482 | ||||||||||||||
|
| |||||||||||||||||||
| 85,150 | — | 37,945 | 47,205 | 23,441 | ||||||||||||||||
|
Stock options (holdings)
|
| |||||||||||||||||||||||||||||||||||||||||||||||||||||||
| January 1, 2016 | awarded 2016 | awarded dividend shares 2016 | realized 2016 | December 31, 2016 | vesting date | |||||||||||||||||||||||||||||||||||||||||||||||||||
January 1, 2013 | granted | exercised | expired | December 31, 2013 | grant price (in euros) | share (closing) price on exercise date | expiry date |
|
| |||||||||||||||||||||||||||||||||||||||||||||||
F.A. van Houten | 20,400 | 1) | — | — | — | 20,400 | 22.88 | — | 10.18.2020 | 69,097 | — | — | 58,732 | — | 05.03.2016 | |||||||||||||||||||||||||||||||||||||||||
| 75,000 | — | — | — | 75,000 | 20.90 | — | 04.18.2021 | 63,117 | — | 2,182 | — | 65,299 | 04.28.2017 | |||||||||||||||||||||||||||||||||||||||||||
| 75,000 | — | — | — | 75,000 | 14.82 | — | 04.23.2022 | 56,677 | — | 1,959 | — | 58,636 | 05.05.2018 | |||||||||||||||||||||||||||||||||||||||||||
| — | 55,000 | 2) | — | — | 55,000 | 22.43 | — | 01.29.2023 | — | 59,287 | 2,049 | — | 61,336 | 04.29.2019 | ||||||||||||||||||||||||||||||||||||||||||
R.H. Wirahadiraksa | 10,800 | 1) | — | — | — | 10,800 | 23.11 | — | 04.14.2018 | |||||||||||||||||||||||||||||||||||||||||||||||
| 12,000 | 1) | — | — | — | 12,000 | 12.63 | — | 04.14.2019 | ||||||||||||||||||||||||||||||||||||||||||||||||
| 16,500 | 1) | — | — | — | 16,500 | 24.90 | — | 04.19.2020 | ||||||||||||||||||||||||||||||||||||||||||||||||
A. Bhattacharya | 13,086 | 1) | — | — | 11,123 | — | 05.03.2016 | |||||||||||||||||||||||||||||||||||||||||||||||||
| 51,000 | — | — | — | 51,000 | 20.90 | — | 04.18.2021 | 11,434 | 1) | — | 396 | — | 11,830 | 04.28.2017 | ||||||||||||||||||||||||||||||||||||||||||
| 51,000 | — | — | — | 51,000 | 14.82 | — | 04.23.2022 | 12,059 | 1) | — | 417 | — | 12,476 | 05.05.2018 | ||||||||||||||||||||||||||||||||||||||||||
| — | 38,500 | 2) | — | — | 38,500 | 22.43 | — | 01.29.2023 | — | 26,650 | 921 | — | 27,571 | 04.29.2019 | ||||||||||||||||||||||||||||||||||||||||||
P.A.J. Nota | 40,800 | 1) | — | — | — | 40,800 | 22.88 | — | 10.18.2020 | 32,717 | — | — | 27,809 | — | 05.03.2016 | |||||||||||||||||||||||||||||||||||||||||
| 51,000 | — | — | — | 51,000 | 20.90 | — | 04.18.2021 | 29,729 | — | 1,028 | — | 30,757 | 04.28.2017 | |||||||||||||||||||||||||||||||||||||||||||
| 51,000 | — | — | — | 51,000 | 14.82 | — | 04.23.2022 | 27,333 | — | 945 | — | 28,278 | 05.05.2018 | |||||||||||||||||||||||||||||||||||||||||||
| — | 38,500 | 2) | — | — | 38,500 | 22.43 | — | 01.29.2023 | — | 29,110 | 1,006 | — | 30,116 | 04.29.2019 | ||||||||||||||||||||||||||||||||||||||||||
|
|
|
| |||||||||||||||||||||||||||||||||||||||||||||||||||||
Performance shares (holdings) | 315,249 | 115,047 | 10,903 | 97,664 | 326,299 | |||||||||||||||||||||||||||||||||||||||||||||||||||
| 454,500 | 132,000 | — | — | 586,500 |
|
| ||||||||||||||||||||||||||||||||||||||||||||||||||
| 1) | Awarded before date of appointment as a member of the Board of Management |
Philips Group
Stock options (holdings) in number of shares
2016
|
| |||||||||||||||||||||||||||||||
| January 1, 2016 | granted | exercised | expired | December 31, 2016 | grant price (in euros) | share (closing) price on exercise date | expiry date | |||||||||||||||||||||||||
|
| |||||||||||||||||||||||||||||||
F.A. van Houten | 20,400 | 1) | — | — | — | 20,400 | 22.88 | — | 10.18.2020 | |||||||||||||||||||||||
| 75,000 | — | — | — | 75,000 | 20.90 | — | 04.18.2021 | |||||||||||||||||||||||||
| 75,000 | — | — | — | 75,000 | 14.82 | — | 04.23.2022 | |||||||||||||||||||||||||
| 55,000 | — | — | — | 55,000 | 22.43 | — | 01.29.2023 | |||||||||||||||||||||||||
A. Bhattacharya | 3,681 | 1) | — | — | 3,681 | 1) | — | 26.28 | — | 04.18.2016 | ||||||||||||||||||||||
| 16,500 | 1) | — | — | — | 16,500 | 22.88 | — | 10.18.2020 | ||||||||||||||||||||||||
| 16,500 | 1) | — | — | — | 16,500 | 20.90 | — | 04.18.2021 | ||||||||||||||||||||||||
| 20,000 | 1) | — | — | — | 20,000 | 15.24 | — | 01.30.2022 | ||||||||||||||||||||||||
| 16,500 | 1) | — | — | — | 16,500 | 14.82 | — | 04.23.2022 | ||||||||||||||||||||||||
P.A.J. Nota | 40,800 | 1) | — | — | — | 40,800 | 22.88 | — | 10.18.2020 | |||||||||||||||||||||||
| 51,000 | — | — | — | 51,000 | 20.90 | — | 04.18.2021 | |||||||||||||||||||||||||
| 51,000 | — | — | — | 51,000 | 14.82 | — | 04.23.2022 | |||||||||||||||||||||||||
| 38,500 | — | — | — | 38,500 | 22.43 | — | 01.29.2023 | |||||||||||||||||||||||||
|
| |||||||||||||||||||||||||||||||
Stock options (holdings) | 479,881 | — | — | 3,681 | 476,200 | |||||||||||||||||||||||||||
|
| |||||||||||||||||||||||||||||||
|
Under the Long-Term Incentive Plan operative until 2013, members of the Board of Management were granted restricted share rights. During 2015 the last release of these restricted share rights took place. However, if the shares from the restricted share rights release were kept for another 3 years, members of the Board of Management receivedso-called ‘premium shares’. As at December 31, 2016, awarded premium shares amounted to 4,002 for F.A. van Houten, 419 for A. Bhattacharya and 1,797 for P.A.J. Nota (all to be released in 2017 and 2018). The premium shares to A. Bhattacharya result from restricted share rights grants awarded before date of appointment as a member of the Board of Management.
206 Annual Report 2013
11 Group financial statements 11.9 - 11.9
Seenote 31,27, Share-based compensation for further information on performance shares, stock options and restricted share rights as well sub- section 9.2.7,sub-section 8.2.7, 2016 Long-Term Incentive Plan, of this report.
Annual Report 2016 183
Group financial statements 10.10
The accumulated annual pension entitlements and the pension costs of individual members of the Board of Management are as follows (in euros)EUR):
Philips Group
Accumulated annual pension entitlements and pension-related costs in EUR
2016
|
| |||||||||||||||||||||||
| age at December 31, 2016 | accumulated annual pension as of December 31, 20161) | total pension | ||||||||||||||||||||||
age at | accumulated annual pension as of December 31, 20131) | pension costs2,3) |
|
| ||||||||||||||||||||
F.A. van Houten | 53 | 60,203 | 468,407 | 56 | 293,351 | 561,033 | ||||||||||||||||||
R.H. Wirahadiraksa | 53 | 33,208 | 263,451 | |||||||||||||||||||||
A. Bhattacharya | 55 | 23,882 | 226,362 | |||||||||||||||||||||
P.A.J. Nota | 49 | 24,785 | 253,605 | 52 | 44,062 | 302,487 | ||||||||||||||||||
|
|
|
| |||||||||||||||||||||
Pension costs | 1,089,882 | |||||||||||||||||||||||
| 985,463 |
|
| ||||||||||||||||||||||
| 1) |
|
| 2) |
|
|
When pension rights are granted to members of the Board of Management, necessary payments(ifpayments (if insured) and all necessary provisions are made in accordance with the applicable accounting principles. In 2013,2016, no (additional) pension benefits were granted to former members of the Board of Management.
Remuneration of the Supervisory Board
The remuneration of the members of the Supervisory Board amounted to EUR 747,000 (2012:1,037,209 (2015: EUR 799,500; 2011:1,083,667; 2014: EUR 803,250); former816,668). Former members received no remuneration.
At December 31, 2013,2016 the members of the Supervisory Board held no stock options.
Annual Report 2013 207
 11 Group financial statements 11.9 - 11.9
The individual members of the Supervisory Board received, by virtue of the positions they held, the following remuneration (in euros)EUR):
Philips Group
Remuneration of the Supervisory Board in EUR
2014 - 2016
| membership | committees | other compensation1) | total |
|
| |||||||||||||||||||||||||||
| 20132) | ||||||||||||||||||||||||||||||||
J. van der Veer | 110,000 | 20,500 | 5,000 | 135,500 | ||||||||||||||||||||||||||||
J.J. Schiro | 65,000 | 18,500 | 8,000 | 91,500 | ||||||||||||||||||||||||||||
| membership | committees | other compensation1) | total | |||||||||||||||||||||||||||||
|
| |||||||||||||||||||||||||||||||
| 20162) | ||||||||||||||||||||||||||||||||
J.A. van der Veer | 135,000 | 26,667 | 7,000 | 168,667 | ||||||||||||||||||||||||||||
C. Poon | 90,000 | 32,500 | 22,000 | 144,500 | ||||||||||||||||||||||||||||
C.J.A. van Lede(Jan.-May)3) | 33,333 | 4,375 | 2,000 | 39,708 | ||||||||||||||||||||||||||||
E. Kist(Jan.-May) | 40,000 | 4,167 | 2,000 | 46,167 | ||||||||||||||||||||||||||||
H. von Prondzynski | 80,000 | 25,000 | 19,500 | 124,500 | ||||||||||||||||||||||||||||
J.P. Tai | 80,000 | 34,167 | 32,000 | 146,167 | ||||||||||||||||||||||||||||
N. Dhawan | 80,000 | 13,000 | 27,000 | 120,000 | ||||||||||||||||||||||||||||
O. Gadiesh | 80,000 | 13,000 | 19,500 | 112,500 | ||||||||||||||||||||||||||||
D.E.I. Pyott | 80,000 | 23,000 | 32,000 | 135,000 | ||||||||||||||||||||||||||||
|
| |||||||||||||||||||||||||||||||
| 698,333 | 175,876 | 163,000 | 1,037,209 | |||||||||||||||||||||||||||||
| 20152) | ||||||||||||||||||||||||||||||||
J.A. van der Veer | 135,000 | 31,667 | 7,000 | 173,667 | ||||||||||||||||||||||||||||
C. Poon | 90,000 | 17,500 | 15,000 | 122,500 | ||||||||||||||||||||||||||||
C.J.A. van Lede | 65,000 | 10,000 | 5,000 | 80,000 | 80,000 | 14,333 | 7,000 | 101,333 | ||||||||||||||||||||||||
E. Kist | 65,000 | 8,000 | 5,000 | 78,000 | 80,000 | 10,000 | 2,000 | 92,000 | ||||||||||||||||||||||||
H. von Prondzynski | 65,000 | 10,000 | 5,000 | 80,000 | 80,000 | 26,833 | 19,500 | 126,333 | ||||||||||||||||||||||||
C. Poon | 65,000 | 14,000 | 11,000 | 90,000 | ||||||||||||||||||||||||||||
J.P. Tai | 65,000 | 15,000 | 20,000 | 100,000 | 80,000 | 29,167 | 35,000 | 144,167 | ||||||||||||||||||||||||
N. Dhawan | 65,000 | 10,000 | 17,000 | 92,000 | 80,000 | 13,000 | 20,000 | 113,000 | ||||||||||||||||||||||||
O. Gadiesh | 80,000 | 13,000 | 17,000 | 110,000 | ||||||||||||||||||||||||||||
D.E.I. Pyott(May-Dec.) | 80,000 | 8,667 | 12,000 | 100,667 | ||||||||||||||||||||||||||||
|
|
|
| |||||||||||||||||||||||||||||
| 565,000 | 106,000 | 76,000 | 747,000 | 785,000 | 164,167 | 134,500 | 1,083,667 | |||||||||||||||||||||||||
| 2012 | ||||||||||||||||||||||||||||||||
J. van der Veer | 110,000 | 20,500 | 5,000 | 135,500 | ||||||||||||||||||||||||||||
J.M. Thompson (Jan. - Apr.) | 32,500 | 4,667 | 11,000 | 48,167 | ||||||||||||||||||||||||||||
| 20142) | ||||||||||||||||||||||||||||||||
J.A. van der Veer | 110,000 | 20,500 | 2,000 | 132,500 | ||||||||||||||||||||||||||||
J.J. Schiro(Jan.-Aug.) | 65,000 | 12,334 | 2,000 | 79,334 | ||||||||||||||||||||||||||||
C. Poon | 65,000 | 14,000 | 17,000 | 96,000 | ||||||||||||||||||||||||||||
C.J.A. van Lede | 65,000 | 10,834 | 5,000 | 80,834 | 65,000 | 10,000 | 2,000 | 77,000 | ||||||||||||||||||||||||
E. Kist | 65,000 | 10,333 | 5,000 | 80,333 | 65,000 | 8,000 | 2,000 | 75,000 | ||||||||||||||||||||||||
J.J. Schiro | 65,000 | 17,000 | 17,000 | 99,000 | ||||||||||||||||||||||||||||
H. von Prondzynski | 65,000 | 10,000 | 5,000 | 80,000 | 65,000 | 15,167 | 2,000 | 82,167 | ||||||||||||||||||||||||
C. Poon | 65,000 | 12,666 | 14,000 | 91,666 | ||||||||||||||||||||||||||||
J.P. Tai | 65,000 | 13,333 | 17,000 | 95,333 | 65,000 | 15,000 | 23,000 | 103,000 | ||||||||||||||||||||||||
N. Dhawan (Apr. - Dec.) | 65,000 | 6,667 | 17,000 | 88,667 | ||||||||||||||||||||||||||||
N. Dhawan | 65,000 | 10,000 | 23,000 | 98,000 | ||||||||||||||||||||||||||||
O. Gadiesh(May-Dec.) | 65,000 | 6,667 | 2,000 | 73,667 | ||||||||||||||||||||||||||||
|
|
|
| |||||||||||||||||||||||||||||
| 597,500 | 106,000 | 96,000 | 799,500 | 630,000 | 111,668 | 75,000 | 816,668 | |||||||||||||||||||||||||
| 2011 | ||||||||||||||||||||||||||||||||
J. van der Veer | 98,750 | 19,375 | 2,000 | 120,125 | ||||||||||||||||||||||||||||
J-M. Hessels (Jan. - March) | 55,000 | 5,125 | 2,000 | 62,125 | ||||||||||||||||||||||||||||
J.M. Thompson | 65,000 | 14,000 | 20,000 | 99,000 | ||||||||||||||||||||||||||||
C.J.A. van Lede | 65,000 | 12,500 | 2,000 | 79,500 | ||||||||||||||||||||||||||||
E. Kist | 65,000 | 15,000 | 2,000 | 82,000 | ||||||||||||||||||||||||||||
J.J. Schiro | 65,000 | 14,000 | 17,000 | 96,000 | ||||||||||||||||||||||||||||
H. von Prondzynski | 65,000 | 10,000 | 2,000 | 77,000 | ||||||||||||||||||||||||||||
C. Poon | 65,000 | 10,000 | 20,000 | 95,000 | ||||||||||||||||||||||||||||
J.P. Tai (Apr, - Dec.) | 65,000 | 7,500 | 20,000 | 92,500 | ||||||||||||||||||||||||||||
|
|
|
| |||||||||||||||||||||||||||||
| 608,750 | 107,500 | 87,000 | 803,250 | |||||||||||||||||||||||||||||
| 1) | The amounts mentioned under other compensation relate to the fee for intercontinental travel, inter-European travel (effective 2015) and the entitlement of EUR 2,000 under the Philips product arrangement |
| 2) | As of 2013, part of the |
| 3) | After the separation of the Company, Mr van Lede joined the Supervisory Board of Philips Lighting. |
184 Annual Report 2016
 Group financial statements 10.10
Supervisory Board members’ and Board of Management members’ interests in Philips shares
Members of the Supervisory Board and of the Board of Management are not allowed to hold any interests in derivativederivatives of Philips securities.
Philips Group
Shares held by Board membersNumber1) in number of shares1)
2016
| December 31, 2012 | December 31, 2013 | |||||||
J. van der Veer | 16,624 | 17,192 | ||||||
H. von Prondzynski | 3,290 | 3,402 | ||||||
J.P. Tai | 1,053 | 2,175 | ||||||
F.A. van Houten | 21,048 | 37,258 | ||||||
R.H. Wirahadiraksa | 16,060 | 27,879 | ||||||
P.A.J. Nota | 11,757 | 24,937 | ||||||
|
| |||||||
| December 31, 2015 | December 31, 2016 | |||||||
|
| |||||||
J. van der Veer | 18,366 | 18,366 | ||||||
H. von Prondzynski | 3,633 | 3,758 | ||||||
J.P. Tai | 3,716 | 3,844 | ||||||
F.A. van Houten | 121,762 | 189,824 | ||||||
A. Bhattacharya | 29,415 | 42,913 | ||||||
P.A.J. Nota | 66,133 | 89,798 | ||||||
|
| |||||||
| 1) | Reference date for board membership is December 31, |
Fair value of financial assets and liabilities
The estimated fair value of financial instruments has been determined by the Company using available market information and appropriate valuation methods. The estimates presented are not necessarily indicative of the amounts that will ultimately be realized by the Company upon maturity or disposal. The use of different market assumptions and/or estimation methods may have a material effect on the estimated fair value amounts.
For cash and cash equivalents, current receivables, accounts payable, interest accrual and short-term debts, the carrying amounts approximate fair value because of the short maturity of these instruments, and therefore fair value information is not included in the table below.
The fair value of Philips’ debt is estimated on the basis of the quoted market prices for certain issues, or on the basis of discounted cash flow analysis based upon market rates plus Philips’ spread for the particular tenors of the borrowing arrangement. Accrued interest is not included within the carrying amount or estimated fair value of debt.
The following table shows the carrying amounts and fair values of financial assets and financial liabilities, including their levels in the fair value hierarchy. It does not include fair value information for financial assets and financial liabilities not measured at fair value if the carrying amount is a reasonable approximation of fair value.
208
Annual Report 20132016 185
11 Group financial statements 11.9 - 11.910.10
Philips Group
| December 31, 2012 | December 31, 2013 | |||||||||||||||
| carrying amount | estimated fair value | carrying amount | estimated fair value | |||||||||||||
Financial assets | ||||||||||||||||
Carried at fair value: | ||||||||||||||||
Available-for-sale financial assets-non-current | 153 | 153 | 96 | 96 | ||||||||||||
Available-for-sale financial assets-current | — | — | 10 | 10 | ||||||||||||
Securities classified as assets held for sale | — | — | 62 | 62 | ||||||||||||
Fair value through profit and loss-non-current | 47 | 47 | 29 | 29 | ||||||||||||
Derivative financial instruments | 137 | 137 | 150 | 150 | ||||||||||||
|
| |||||||||||||||
| 337 | 337 | 347 | 347 | |||||||||||||
Carried at (amortized) cost: | ||||||||||||||||
Cash and cash equivalents | 3,834 | 2,465 | ||||||||||||||
Loans and receivables: | ||||||||||||||||
Non-current loans and receivables | 140 | 140 | 143 | 143 | ||||||||||||
Other non-current loans and receivables | 127 | 129 | ||||||||||||||
Loans classified as assets held for sale | — | 30 | ||||||||||||||
Receivables-current | 4,585 | 4,678 | ||||||||||||||
Receivables-non-current | 176 | 176 | 144 | 144 | ||||||||||||
Held-to-maturity investments | 3 | 3 | ||||||||||||||
Available-for-sale financial assets | 79 | 96 | ||||||||||||||
|
| |||||||||||||||
| 8,944 | 316 | 7,688 | 287 | |||||||||||||
Financial liabilities | ||||||||||||||||
Carried at fair value: | ||||||||||||||||
Fair value through profit and loss-non-current | (11 | ) | (11 | ) | (13 | ) | (13 | ) | ||||||||
Derivative financial instruments | (517 | ) | (517 | ) | (368 | ) | (368 | ) | ||||||||
Carried at (amortized) cost: | ||||||||||||||||
Accounts payable | (2,839 | ) | (2,462 | ) | ||||||||||||
Interest accrual | (75 | ) | (57 | ) | ||||||||||||
Debt (Corporate bond and finance lease) | (3,412 | ) | (4,162 | ) | (3,157 | ) | (3,545 | ) | ||||||||
Debt (Bank loans, overdrafts etc.) | (1,122 | ) | (744 | ) | ||||||||||||
|
| |||||||||||||||
| (7,448 | ) | (4,162 | ) | (6,420 | ) | (3,545 | ) | |||||||||
Fair value of financial assets and liabilities in millions of EUR
2015 - 2016
|
| |||||||||||||||
| Balance as of December 31, 2015 | Balance as of December 31, 2016 | |||||||||||||||
|
| |||||||||||||||
| carrying amount | estimated fair value | carrying amount | estimated fair value | |||||||||||||
|
| |||||||||||||||
Financial assets | ||||||||||||||||
Carried at fair value: | ||||||||||||||||
Available-for-sale financial assets | 232 | 232 | 172 | 172 | ||||||||||||
Securities classified as assets held for sale | (1 | ) | (1 | ) | 1 | 1 | ||||||||||
Fair value through profit and loss | 33 | 33 | 27 | 27 | ||||||||||||
Derivative financial instruments | 161 | 161 | 160 | 160 | ||||||||||||
|
| |||||||||||||||
Financial assets carried at fair value | 425 | 360 | ||||||||||||||
Carried at (amortized) cost: | ||||||||||||||||
Cash and cash equivalents | 1,766 | 2,334 | ||||||||||||||
Loans and receivables: | ||||||||||||||||
Loans - current | 12 | 101 | 101 | |||||||||||||
Non-current loans and receivables | 88 | 88 | ||||||||||||||
Othernon-current loans and receivables | 134 | 134 | ||||||||||||||
Loans classified as assets held for sale | 2 | |||||||||||||||
Receivables - current | 4,982 | 5,327 | ||||||||||||||
Receivables -non-current | 191 | 155 | ||||||||||||||
Held-to-maturity investments | 2 | 2 | ||||||||||||||
|
| |||||||||||||||
Financial assets carried at (amortized) costs | 7,177 | 8,053 | ||||||||||||||
Financial liabilities | ||||||||||||||||
Carried at fair value: | ||||||||||||||||
Derivative financial instruments | (933 | ) | (933 | ) | (873 | ) | (873 | ) | ||||||||
|
| |||||||||||||||
Financial liabilities carried at fair value | (933 | ) | (873 | ) | ||||||||||||
Carried at (amortized) cost: | ||||||||||||||||
Accounts payable | (2,673 | ) | (2,848 | ) | ||||||||||||
Interest accrual | (69 | ) | (68 | ) | ||||||||||||
Debt (Corporate bond, finance lease and bank loans) | (3,944 | ) | (4,294 | ) | (5,095 | ) | (5,474 | ) | ||||||||
Debt (Other bank loans, overdrafts etc.) | (1,816 | ) | (511 | ) | ||||||||||||
|
| |||||||||||||||
Financial liabilities carried at (amortized) costs | (8,502 | ) | (8,522 | ) | ||||||||||||
|
| |||||||||||||||
Philips Group
Fair value hierarchy in millions of EUR
2016
|
| |||||||||||||||
| level 1 | level 2 | level 3 | total | |||||||||||||
|
| |||||||||||||||
Balance as of December 31, 2016 | ||||||||||||||||
Available-for-sale financial assets | 36 | 29 | 107 | 172 | ||||||||||||
Securities classified as assets held for sale | — | — | 1 | 1 | ||||||||||||
Financial assets designated at fair value through profit and loss | — | 24 | 3 | 27 | ||||||||||||
Derivative financial instruments - assets | — | 160 | — | 160 | ||||||||||||
Current loans and receivables | — | 101 | — | 101 | ||||||||||||
|
| |||||||||||||||
Total financial assets | 36 | 314 | 111 | 461 | ||||||||||||
Derivative financial instruments - liabilities | — | (873 | ) | — | (873 | ) | ||||||||||
Debt | (3,990 | ) | (1,484 | ) | — | (5,474 | ) | |||||||||
|
| |||||||||||||||
Total financial liabilities | (3,990 | ) | (2,357 | ) | — | (6,347 | ) | |||||||||
Balance as of December 31, 2015 | ||||||||||||||||
Available-for-sale financial assets | 76 | 68 | 88 | 232 | ||||||||||||
Securities classified as assets held for sale | (1 | ) | — | — | (1 | ) | ||||||||||
Financial assets designated at fair value through profit and loss | — | 33 | — | 33 | ||||||||||||
Derivative financial instruments - assets | — | 161 | — | 161 | ||||||||||||
Non-current loans and receivables | — | 88 | — | 88 | ||||||||||||
|
| |||||||||||||||
Total financial assets | 75 | 350 | 88 | 513 | ||||||||||||
Derivative financial instruments - liabilities | — | (933 | ) | — | (933 | ) | ||||||||||
Debt | (4,084 | ) | (210 | ) | — | (4,294 | ) | |||||||||
|
| |||||||||||||||
Total financial liabilities | (4,084 | ) | (1,143 | ) | — | (5,227 | ) | |||||||||
|
| |||||||||||||||
186 Annual Report 2016
Group financial statements 10.10
The table belowabove represents categorization of measurement of the estimated fair values of financial assets and liabilities.
| Fair value hierarchy | ||||||||||||||||
| level 1 | level 2 | level 3 | total | |||||||||||||
December 31, 2013 | ||||||||||||||||
Available-for-sale financial assets - non-current | 42 | — | 54 | 96 | ||||||||||||
Available-for-sale financial assets - current | 6 | 4 | — | 10 | ||||||||||||
Securities classified as assets held for sale | 62 | — | — | 62 | ||||||||||||
Financial assets designated at fair value through profit and loss - non-current | 22 | — | 7 | 29 | ||||||||||||
Derivative financial instruments - assets | — | 150 | — | 150 | ||||||||||||
Non-current loans and receivables including guarantee deposits | — | 143 | — | 143 | ||||||||||||
Receivables - non-current | — | 144 | — | 144 | ||||||||||||
|
| |||||||||||||||
Total financial assets | 132 | 441 | 61 | 634 | ||||||||||||
Financial liabilities designated at fair value through profit and loss - non-current | — | — | (13 | ) | (13 | ) | ||||||||||
Derivative financial instruments - liabilities | — | (368 | ) | — | (368 | ) | ||||||||||
Debt | (3,345 | ) | (200 | ) | — | (3,545 | ) | |||||||||
|
| |||||||||||||||
Total financial liabilities | (3,345 | ) | (568 | ) | (13 | ) | (3,926 | ) | ||||||||
December 31, 2012 | ||||||||||||||||
Available-for-sale financial assets - non-current | 110 | — | 43 | 153 | ||||||||||||
Financial assets designated at fair value through profit and loss - non-current | 28 | — | 19 | 47 | ||||||||||||
Derivative financial instruments - assets | 137 | — | 137 | |||||||||||||
Non-current loans and receivables including guarantee deposits | — | 140 | — | 140 | ||||||||||||
Receivables - non-current | — | 176 | — | 176 | ||||||||||||
|
| |||||||||||||||
Total financial assets | 138 | 453 | 62 | 653 | ||||||||||||
Financial liabilities designated at fair value through profit and loss - non-current | — | — | (11 | ) | (11 | ) | ||||||||||
Derivative financial instruments - liabilities | — | (517 | ) | — | (517 | ) | ||||||||||
Debt | (3,948 | ) | (214 | ) | — | (4,162 | ) | |||||||||
|
| |||||||||||||||
Total financial liabilities | (3,948 | ) | (731 | ) | (11 | ) | (4,690 | ) | ||||||||
Specific valuation techniques used to value financial instruments include:
Level 1
Instruments included in level 1 are comprised primarily of listed equity investments classified as available-for-saleavailable-for- sale financial assets, investees and financial assets designated at fair value through profit and loss.
The fair value of financial instruments traded in active markets is based on quoted market prices at the balance sheet date. A market is regarded as active if quoted prices are readily and regularly available from an exchange, dealer, broker, industry group, pricing service, or regulatory agency, and those prices represent actual and regularly occurring market transactions on an arm’s length basis.
Annual Report 2013 209
 11 Group financial statements 11.9 - 11.9
Level 2
The fair value of financial instruments that are not traded in an active market (for example, over-the-counterover-the- counter derivatives or convertible bond instruments) are determined by using valuation techniques. These valuation techniques maximize the use of observable market data where it is available and rely as little as possible on entity-specific estimates. If all significant inputs required to fair value an instrument are based on observable market data, the instrument is included in level 2.
The fair value of derivatives is calculated as the present value of the estimated future cash flows based on observable interest yield curves, basis spread and foreign exchange rates.
The valuation of convertible bond instruments uses observable market quoted data for the options and present value calculations using observable yield curves for the fair value of the bonds.
Level 3
If one or more of the significant inputs are not based on observable market data, such as third-party pricing information without adjustments, the instrument is included in level 3.
The arrangement with the UK Pension Fund in conjunction with the sale of NXP is a financial instrument carried at fair value classified as level 3. At the end of 2013, the fair value of this instrument is estimated to be EUR 7 million with the changes of fair value recorded to financial income and expense. Please refer to note 14, Other non-current financial assets for more details.
Furthermore, deferred consideration and loan extension options to TP Vision are also included in level 3. On January 20, 2014, Philips has signed a term sheet to transfer its remaining 30% stake in TP Vision, which will also impact the above commitments. For further information, please refer to note 36, Subsequent events.
The table below shows the reconciliation from the beginning balance to the end balance for fair value measured in Level 3 of the fair value hierarchy.
| financial assets | financial liabilities | |||||||
Balance at January 1, 2013 | 62 | (11 | ) | |||||
Total gains and losses recognized in: | ||||||||
- profit or loss | (12 | ) | (2 | ) | ||||
- other comprehensive income | 11 | — | ||||||
|
| |||||||
Balance at December 31, 2013 | 61 | (13 | ) | |||||
Philips hasGroup
Reconciliation of the following balances related to its derivative activities. Thesefair value hierarchyin millions of EUR
2016
| financial assets | ||||
Balance as of January 1, 2016 | 88 | |||
Gains and losses recognized in: | ||||
- in profit or loss | (3 | ) | ||
- in other comprehensive income | (18 | ) | ||
Purchase | 47 | |||
Sales | (3 | ) | ||
Balance as of December 31, 2016 | 111 | |||
The section below elaborates on transactions in derivatives. Transactions in derivatives are subject to master netting andset-off agreements. In the case of certain termination events, under the terms of the Master Agreement, Philips can terminate the outstanding transactions and aggregate their positive and negative values to arrive at a single net termination sum (orclose-out amount). This contractual right is subject to the following:
The right may be limited by local law if the counterparty is subject to bankruptcy proceedings;
The right applies on a bilateral basis.
Philips Group
Financial assets subject to offsetting, enforceable master netting arrangements or similar agreementsin millions of EUR
2015 - 2016
|
| |||||||||||||||
| 2012 | 2013 | 2015 | 2016 | |||||||||||||
|
| |||||||||||||||
Derivatives | ||||||||||||||||
Gross amounts of recognized financial assets | 137 | 150 | 161 | 160 | ||||||||||||
Gross amounts of recognized financial liabilities offset in the statement of financial position | — | — | ||||||||||||||
Net amounts of financial assets presented in the statement of financial position | 137 | 150 | ||||||||||||||
Gross amounts of recognized financial liabilities offset in the balance sheet | — | — | ||||||||||||||
|
| |||||||||||||||
Related amounts not offset in the statement of financial position | ||||||||||||||||
Net amounts of financial assets presented in the balance sheet | 161 | 160 | ||||||||||||||
Related amounts not offset in the balance sheet | ||||||||||||||||
Financial instruments | (67 | ) | (85 | ) | (81 | ) | (92 | ) | ||||||||
Cash collateral received | — | — | — | — | ||||||||||||
|
|
|
| |||||||||||||
Net amount | 70 | 65 | 80 | 68 | ||||||||||||
|
| |||||||||||||||
Philips Group
Financial liabilities subject to offsetting, enforceable master netting arrangements or similar agreements in millions of EUR 2015 - 2016
|
| |||||||||||||||
| 2012 | 2013 | 2015 | 2016 | |||||||||||||
|
| |||||||||||||||
Derivatives | ||||||||||||||||
Gross amounts of recognized financial liabilities | (517 | ) | (368 | ) | (933 | ) | (873 | ) | ||||||||
Gross amounts of recognised financial assets offset in the statement of financial position | — | — | ||||||||||||||
Net amounts of financial liabilities presented in the statement of financial position | (517 | ) | (368 | ) | ||||||||||||
Gross amounts of recognized financial assets offset in the balance sheet | — | — | ||||||||||||||
|
| |||||||||||||||
Related amounts not offset in the statement of financial position | ||||||||||||||||
Net amounts of financial liabilities presented in the balance sheet | (933 | ) | (873 | ) | ||||||||||||
Related amounts not offset in the balance sheet | ||||||||||||||||
Financial instruments | 67 | 85 | 81 | 92 | ||||||||||||
Cash collateral received | — | — | — | — | ||||||||||||
|
|
|
| |||||||||||||
Net amount | (450 | ) | (283 | ) | (852 | ) | (781 | ) | ||||||||
|
| |||||||||||||||
Annual Report 2016 187
Group financial statements 10.10
Details of treasury / other financial risks
Philips is exposed to several types of financial risk.risks. This note further analyzes financial risks. Philips does not purchase or hold derivative financial instruments for speculative purposes. Information regarding financial instruments is included innote 34,29, Fair value of financial assets and liabilities.
Liquidity risk
Liquidity risk is the risk that an entity will encounter difficulty in meeting obligations associated with financial liabilities.
Liquidity risk for the group is monitored through the Treasury liquidity committee, which tracks the development of the actual cash flow position for the group and uses input from a number of sources in order to forecast the overall liquidity position on both on a short and long termlong-term basis. Group Treasury invests surplus cash in money market deposits with appropriate maturities to ensure sufficient liquidity is available to meet liabilities when due.
The rating of the Company’s debt by major rating services may improve or deteriorate. As a result, Philips’ future borrowing capacity may be influenced and its financing costs may fluctuate. Philips has various sources to mitigate the liquidity risk for the group. At December 31, 2013,2016, Philips had EUR 2,4652,334 million in cash and cash equivalents (2012:(2015: EUR 3,8341,766 million), within which short-term deposits of EUR 1,7141,299 million (2012:(2015: EUR 3,177855 million) and other liquid assets of EUR 1853 million (2012:(2015: EUR 120171 million). Philips pools cash from subsidiaries to the extent legally and economically feasible; cash not pooled remains available for Company’s operational or investment needs by the Company.needs.
210 Annual Report 2013
11 Group financial statements 11.9 - 11.9
Furthermore, Royal Philips has a USD 2.5 billion Commercial Paper Program and a EUR 1.8 billion revolving credit facility that can be used for general group purposepurposes and as a backstop for its commercial paper program. In January 2013 the EUR 1.8 billion facility was extended by 2 years until February 18, 2018. The facility has no financial covenants and repetitive material adverse change clauses and can be used for general group purposes. As of December 31, 2013,2016, Royal Philips did not have any amounts outstanding under any of these facilities. A description of Philips’ credit facilities, including any covenants, can be found in note18, Debt.
Additionally, Philips also held EUR 6536 million of equity investments inavailable-for-sale financial assets (fair value at December 31, 2013)2016).
Currency risk
Currency risk is the risk that reported financial performance or the fair value or future cash flows of a financial instrument will fluctuate because of changes in foreign exchange rates. CurrencyPhilips operates in many countries and currencies and therefore currency fluctuations may impact Philips’ financial results. Philips is exposed to currency risk in the following areas:
Transaction exposures, related to forecastedanticipated sales and purchases andon-balance-sheet receivables/payables resulting from such transactions
Translation exposure of net income in foreign entities
Translation exposure of foreign-currency intercompany and external debt and deposits
Translation exposure of foreign-currency-denominatednet income in foreign entities
Translation exposure of foreign-currency- denominated equity invested in consolidated companies
Translation exposure to equity interests in non-functional-currencynon- functional-currency investments in associates andavailable-for-sale financial assets.
It is Philips’ policy that significant transactionto reduce the potentialyear-on-year volatility caused by foreign-currency movements on its net earnings by hedging the anticipated net exposure of foreign currencies resulting from foreign-currency sales and purchases. In general, net anticipated exposures for the Group are hedged by the businesses. Accordingly, all businesses are requiredduring a period of 15 months in layers of 20% up to identifya maximum hedge of 80%, using forwards and measure their exposures resulting from material transactions denominated in currencies other than their own functional currency.currency options. Philips’ policy generally requires significant committed foreign currency exposures to be fully hedged, generally using forwards. Anticipated transactionsHowever, not every foreign currency can or shall be hedged as there may be hedged using forwardsregulatory barriers or options prohibitive hedging cost preventing Philips from effectively and/or a combination thereof. The amount hedged as a proportion of the total anticipated exposure identified varies per business and is a function of the ability to project cash flows, the time horizon for the cash flows and the way in which the businesses can adapt to changing levels of foreign-currency exchange rates.efficiently hedging its currency exposures. As a result, hedging activities cannot and will not eliminate all currency risks for theseanticipated and committed transaction exposures.
During 2015 Philips has changed its hedging policy with regard to anticipated transaction exposures. Generally,The previous hedging policy focused on protecting against changes in value of forecasted individual transactions and cash flows. Under the maximum tenorprevious policy the hedging ratio and period were set by individual businesses based on their ability to forecast cash flows, the time horizon for the cash flows and their ability to adapt to changing levels of these hedges is 18 months.foreign currency rates.
188 Annual Report 2016
Group financial statements 10.10
The following table outlines the estimated nominal value in millions of eurosEUR for committed and anticipated transaction exposure and related hedges for Philips’ most significant currency exposures consolidated as of December 31, 2013:2016:
Philips Group
Estimated transaction exposure and related hedges
in millions of eurosEUR
2016
| maturity 0-60 days | maturity over 60 days | |||||||||||||||
| exposure | hedges | exposure | hedges | |||||||||||||
December 31, 2013 | ||||||||||||||||
Receivables | ||||||||||||||||
Functional vs. exposure currency | ||||||||||||||||
EUR vs. USD | 387 | (364 | ) | 1,718 | (1,169 | ) | ||||||||||
USD vs. EUR | 191 | (166 | ) | 695 | (354 | ) | ||||||||||
EUR vs. GBP | 83 | (71 | ) | 284 | (158 | ) | ||||||||||
USD vs. JPY | 46 | (42 | ) | 217 | (113 | ) | ||||||||||
EUR vs. JPY | 39 | (39 | ) | 166 | (116 | ) | ||||||||||
EUR vs. CNY | 18 | (18 | ) | 73 | (41 | ) | ||||||||||
USD vs. AUD | 16 | (12 | ) | 65 | (33 | ) | ||||||||||
EUR vs. CHF | 21 | (18 | ) | 57 | (33 | ) | ||||||||||
USD vs. CAD | 10 | (8 | ) | 63 | (33 | ) | ||||||||||
GBP vs USD | 12 | (12 | ) | 57 | (33 | ) | ||||||||||
Others | 148 | (124 | ) | 296 | (156 | ) | ||||||||||
Total 2013 | 971 | (874 | ) | 3,691 | (2,239 | ) | ||||||||||
Total 2012 | 1,098 | (998 | ) | 4,037 | (2,453 | ) | ||||||||||
Payables | ||||||||||||||||
Functional vs. exposure currency | ||||||||||||||||
EUR vs. USD | (171 | ) | 253 | (831 | ) | 518 | ||||||||||
USD vs. CNY | (70 | ) | 70 | (162 | ) | 92 | ||||||||||
EUR vs. PLN | (30 | ) | 24 | (102 | ) | 36 | ||||||||||
EUR vs. GBP | (23 | ) | 18 | (81 | ) | 46 | ||||||||||
USD vs. SGD | (14 | ) | 12 | (26 | ) | 19 | ||||||||||
INR vs. USD | (21 | ) | 21 | (16 | ) | 16 | ||||||||||
IDR vs. USD | (24 | ) | 14 | (12 | ) | 7 | ||||||||||
EUR vs. RON | (3 | ) | 3 | (28 | ) | 15 | ||||||||||
BRL vs. USD | (14 | ) | 11 | (15 | ) | 8 | ||||||||||
USD vs. EUR | (5 | ) | 4 | (18 | ) | 9 | ||||||||||
Others | (82 | ) | 72 | (106 | ) | 65 | ||||||||||
Total 2013 | (457 | ) | 502 | (1,397 | ) | 831 | ||||||||||
Total 2012 | (622 | ) | 560 | (1,875 | ) | 1,050 | ||||||||||
| Receivables | Payables | |||||||||||||||
| exposure | hedges | exposure | hedges | |||||||||||||
Balance as of December 31, 2016 | ||||||||||||||||
Exposure currency | ||||||||||||||||
USD | 1,330 | (869 | ) | (804 | ) | 629 | ||||||||||
JPY | 843 | (375 | ) | (7 | ) | 7 | ||||||||||
GBP | 367 | (203 | ) | (20 | ) | 20 | ||||||||||
AUD | 309 | (160 | ) | — | — | |||||||||||
CAD | 281 | (129 | ) | (10 | ) | 10 | ||||||||||
CHF | 151 | (70 | ) | — | — | |||||||||||
PLN | 127 | (65 | ) | (23 | ) | 23 | ||||||||||
SEK | 99 | (45 | ) | (1 | ) | 1 | ||||||||||
CZK | 56 | (27 | ) | — | — | |||||||||||
CNY | 92 | (73 | ) | (744 | ) | 524 | ||||||||||
Others | 556 | (396 | ) | (155 | ) | 130 | ||||||||||
|
| |||||||||||||||
Total 2016 | 4,211 | (2,412 | ) | (1,764 | ) | 1,344 | ||||||||||
Total 2015 | 4,215 | (2,949 | ) | (1,959 | ) | 1,528 | ||||||||||
|
| |||||||||||||||
The derivatives related to transactions are, for hedge accounting purposes, split into hedges of on-balance-sheeton-balance- sheet accounts receivable/payable and forecasted sales and purchases. Changes in the value of on-balance-sheeton- balance-sheet foreign-currency accounts receivable/payable, as well as the changes in the fair value of the hedges related to these exposures, are reported in the income statement under costs of sales. Hedges related to forecasted transactions, where hedge accounting is applied, are accounted for as cash flow hedges. The results from such hedges are deferred in other comprehensive income within equity to the extent that the hedge is effective. As of December 31, 2013,2016, a gain of EUR 2410 million was deferred in equity as a result of these hedges. The result deferred in equity will be released to earnings mostly during 20142017 at the time when the related hedged transactions affect the income statement. During 2013,2016, a net gainloss of EUR 5 million was recorded in the consolidated statement of income as a result of ineffectiveness on certain anticipated cash flow hedges.
Annual Report 2013 211
11 Group financial statements 11.9 - 11.9
The total net fair value of hedges related to transaction exposure as of December 31, 20132016, was an unrealized asset of EUR 4415 million. An instantaneous 10% increase in the value of the euroEUR against all currencies would lead to a decreasean increase of EUR 6898 million in the value of the derivatives; including a EUR 58 million decrease related to foreign exchange transactions of the US dollar against the euro, a EUR 15 million decrease related to foreign exchange transactions of the Japanese yen against euro, a EUR 15 million decrease related to foreign exchange transactions of the Pound sterling, partially offset by a EUR 46 million increase related to foreign exchange transactions of the euroUSD against the US dollar.EUR, a EUR 18 million increase related to foreign exchange transactions of the JPY against the EUR, a EUR 10 million increase related to foreign exchange transactions of the GBP against the EUR and a EUR 5 million increase related to foreign exchange transactions of the AUD against the EUR.
The EUR 6898 million decreaseincrease includes a lossgain of EUR 1918 million that would impact the income statement, which would largely offset the opposite revaluation effect on the underlying accounts receivable and payable, and the remaining lossgain of EUR 4980 million would be recognized in equity to the extent that the cash flow hedges were effective.
The total net fair value of hedges related to transaction exposure as of December 31, 20122015, was an unrealized asset of EUR 2517 million. An instantaneous 10% increase in the value of the euroEUR against all currencies would lead to a decreasean increase of EUR 6966 million in the value of the derivatives; including a EUR 9625 million increase related to foreign exchange transactions of the USD against the EUR, a EUR 18 million increase related to foreign exchange transactions of the GBP against the EUR, a EUR 14 million increase related to foreign exchange transactions of the JPY, and a EUR 7 million increase related to PLN. This was partially offset by a EUR 34 million decrease related to foreign exchange transactions of the US dollarEUR against the euro, a EUR 17 million decrease related to foreign exchange transactions of the Japanese yen against euro, a EUR 8 million decrease related to foreign exchange transactions of the Pound sterling, partially offset by a EUR 69 million increase related to foreign exchange transactions of the euro against the US dollar.USD.
Foreign exchange exposure also arises as a result of inter-company loans and deposits. Where the Company enters into such arrangements, the financing is generally provided in the functional currency of the subsidiary entity. The currency of the Company’s external funding and liquid assets is matched with the required financing of subsidiaries, either directly through external foreign currency loans and deposits, or synthetically by using foreign exchange derivatives, including cross currency interest rate swaps and foreign exchange forward contracts. In certain cases where group companies may also have external foreign currency debt or liquid assets, these exposures are also hedged through the use of foreign exchange derivatives. Changes in the fair value of hedges related to this exposure are either recognized within financial income and expenses in the statements of income, accounted for as cash flow hedges, or where such loans would be considered part of the net investment in the subsidiary, then net investment hedging would be applied. Translation exposure of foreign-currency equity invested in consolidated entities may be hedged. If a hedge is entered into, it is accounted for as a net investment hedge. Net current-period change, before tax, of the currency translation reserve of EUR 1,234 million relates to the positive impact of the weaker EUR against the foreign currencies of countries in which Philips’ operations are located, partially offset by net investment hedging instruments. The change in currency translation reserve was mostly related to development of the USD.
As of December 31, 2013 cross currency2016, cross-currency interest rate swaps with a fair value liability of EUR 726 million and external bond funding for a nominal value of USD 3,774
Annual Report 2016 189
Group financial statements 10.10
million were designated as net investment hedges of our financing investments in foreign operations. During 2016 a total gain of EUR 0.2 million was recognized in the income statement as ineffectiveness on net investment hedges. The total net fair value of these financing derivatives as of December 31, 2016, was a liability of EUR 728 million. An instantaneous 10% increase in the value of the EUR against all currencies would lead to an increase of EUR 53 million in the value of the derivatives, including a EUR 62 million increase related to the USD.
As of December 31, 2015, cross-currency interest rate swaps and foreign exchange forward contracts with a fair value liability of EUR 261812 million and external bond funding for a nominal value of USD 4,059 million were designated as net investment hedges of our financing investments in foreign operations. During 20132015 a total gain of EUR 20.1 million was recognized in the income statement as ineffectiveness on net investment hedges. The total net fair value of these financing derivatives as of December 31, 2013,2015, was a liability of EUR 260794 million. An instantaneous 10% increase in the value of the euroEUR against all currencies would lead to an increase of EUR 245187 million in the value of the derivatives, including a EUR 272210 million increase related to the US dollar.USD.
Philips does not currently hedge the foreign exchange exposure arising from equity interests in non-functional-currencynon- functional-currency investments in associates andavailable-for-sale financial assets.
Interest rate risk
Interest rate risk is the risk that the fair value or future cash flows of a financial instrument will fluctuate because of changes in market interest rates. Philips had outstanding debt of EUR 3,9015,606 million, which created an inherent interest rate risk. Failure to effectively hedge this risk could negatively impact financial results. Atyear-end, Philips held EUR 2,4652,334 million in cash and cash equivalents, and had total long-term debt of EUR 3,3094,021 million and total short-term debt of EUR 5921,585 million. At December 31, 2013,2016, Philips had a ratio of fixed-rate long-term debt to total outstanding debt of approximately 80%70%, compared to 72%68% one year earlier.
A sensitivity analysis conducted as of January 20142017 shows that if long-term interest rates were to decrease instantaneously by 1% from their level of December 31, 2013,2016, with all other variables (including foreign exchange rates) held constant, the fair value of the long-term debt would increase by approximately EUR 317260 million. If there was an increase of 1% in long-term interest rates, this would reduce the market value of the long-term debt by approximately EUR 251259 million.
If interest rates were to increase instantaneously by 1% from their level of December 31, 2013,2016, with all other variables held constant, the annualized net interest expense would decrease by approximately EUR 187 million. This impact was based on the outstanding net cash position at December 31, 2013.2016.
A sensitivity analysis conducted as of January 20132016 shows that if long-term interest rates were to decrease instantaneously by 1% from their level of December 31, 2012,2015, with all other variables (including foreign exchange rates) held constant, the fair value of the long-term debt would increase by approximately EUR 422303 million. If there was an increase of 1% in long-term interest rates, this would reduce the market value of the long-term debt by approximately EUR 339302 million.
If interest rates were to increase instantaneously by 1% from their level of December 31, 2012,2015, with all other variables held constant, the annualized net interest expense would decreaseincrease by approximately EUR 251 million. This impact was based on the outstanding net cash position at December 31, 2012.2015.
Equity price risk
Equity price risk is the risk that the fair value or future cash flows of a financial instrument will fluctuate because of changes in equity prices.
Philips is a shareholder in severalsome publicly listed companies, including Chimei Innolux, Shenyang Neusoft Corporation Ltd, and TPV Technology Ltd.Corindus Vascular Robotics. As a result, Philips is exposed to potential financial loss through movements in their share prices. The aggregate equity price exposure in its main available-for-salesuch financial assets amounted to approximately EUR 6535 million atyear-end 2013 (2012: 2016 (2015: EUR 120 million including investments in associates shares that were sold during 2012) and a further EUR 62 million that has been reclassified as assets held for sale in relation to the agreed contribution to the Dutch Pension Fund (please refer to note 36, Subsequent events)75 million). Philips does not hold derivatives in its own stockshares or in the above-mentioned listed companies. Philips is also a shareholderhas shareholdings in several privately-owned companies amounting to EUR 50105 million. As a result, Philips is exposed to potential value adjustments.
As part of the sale of shares in NXP to Philips Pension Trustees Limited there was an arrangement that may entitle Philips to a cash payment from the UK Pension Fund on or after September 7, 2014 if the value of the NXP shares has increased by this date to a level in excess of a predetermined threshold, which at the time of the transaction was substantially above the transaction price, and the UK Pension Fund is in surplus (on the regulatory funding basis) on September 7, 2014.
Commodity price risk
Commodity price risk is the risk that the fair value or future cash flows of a financial instrument will fluctuate because of changes in commodity prices.
Philips is a purchaser of certain base metals, precious metals and energy. Philips hedges certain commodity price risks using derivative instruments to minimize significant, unanticipated earnings fluctuations caused by commodity price volatility. The commodity price derivatives that Philips enters into are accounted for as cash flow hedges to offset forecasted purchases. As of December 2013,2016, Philips does not have any outstanding commodity derivatives.
As of December 2015, a loss of EUR 2.20.2 million was deferred in equity as a result of these hedges. A 10% increase in the market price of all commodities as of December 31, 20132015, would increase the fair value of the derivatives by less than EUR 1.40.1 million.
As of December 2012, a loss of EUR 0.3 million was deferred in equity as a result of these hedges. A 10% increase in the market price of all commodities as of December 31, 2012 would increase the fair value of the derivatives by EUR 2 million.
190 Annual Report 2016
Group financial statements 10.10
Credit risk
Credit risk represents the loss that would be recognized at the reporting date, if counterparties failed completely to perform their payment obligations as contracted. Credit risk is present within Philips trade receivables. To have better insights into the credit exposures, Philips performs ongoing evaluations of the financial andnon-financial condition of its customers and adjusts credit limits when appropriate. In instances where the creditworthiness of a customer is determined not to be sufficient to grant the credit limit required, there are a number of mitigation tools that can be utilized to close the gap, including reducing payment terms, cash on delivery,pre-payments and pledges on assets.
Philips invests available cash and cash equivalents with various financial institutions and is exposed to credit risk with these counterparties. Philips is also exposed to credit risks in the event ofnon-performance by financial
212 Annual Report 2013
11 Group financial statements 11.9 - 11.9
institutions with respect to financial derivative instruments. Philips actively manages concentration risk and on a daily basis measures the potential loss under certain stress scenarios, should a financial institution default. These worst-case scenario losses are monitored and limited by the Company.
The Company does not enter into any financial derivative instruments to protect against default by financial institutions. However, where possible the Company requires all financial institutions with whomwhich it deals in derivative transactions to complete legally enforceable netting agreements under an International Swap Dealers Association master agreement or otherwise prior to trading, and whenever possible, to have a strong credit rating from Standard & Poor’s and Moody’s Investor Services. Philips also regularly monitors the development of the credit risk of its financial counterparties. Wherever possible, cash is invested and financial transactions are concluded with financial institutions with strong credit ratings or with governments or government-backed institutions.
BelowThe table below shows the credit ratings of theA-rated financial institutionsinstructions with which Philips hadhas cash at hand and short-term deposits above EUR 25 million as of December 31, 2013:2016. The remaining cash at hand and deposits are mainly with BBB+ counterparty banks.
Philips Group
Credit risk with number ofA-rated counterparties
for deposits above EUR 25 million
2016
| 25-100 million | 100-500 million | 500-2,000 million | ||||||||||
AA-rated governments | — | 2 | — | |||||||||
AA-rated government banks | — | 1 | — | |||||||||
AAA-rated bank counterparties | — | — | — | |||||||||
AA-rated bank counterparties | 1 | 2 | — | |||||||||
A-rated bank counterparties | 1 | 3 | — | |||||||||
|
| |||||||||||
| 2 | 8 | — | ||||||||||
|
| |||||||||||
| 25-100 million | 100-500 million | 500 million and above | ||||||||||
|
| |||||||||||
A rated bank counterparties | 3 | 3 | 1 | |||||||||
|
| |||||||||||
| 3 | 3 | 1 | ||||||||||
|
| |||||||||||
For an overview of the overall maximum credit exposure of the group’s financial assets, please refer tonote 34,29, Fair value of financial assets and liabilities for details of carrying amounts and fair value.
Country risk
Country risk is the risk that political, legal, or economic developments in a single country could adversely impact our performance. The country risk per country is defined as the sum of the equity of all subsidiaries and associated companies in country cross-border transactions, such as intercompany loans, accounts receivable from third parties and intercompany accounts receivable. The country risk is monitored on a regular basis.
As of December 31, 2013,2016, the Company had country risk exposure of EUR 7.810.5 billion in the United States, EUR 2.5 billion in Belgium and EUR 1.51.8 billion in China (including Hong Kong)., EUR 1.3 billion in Netherlands and EUR 756 million in Singapore. Other countries higher than EUR 500 million are United KingdomGermany (EUR 673775 million), Japan (EUR 608671 million), United Kingdom (EUR 625 million), Belgium (EUR 523 million) and the NetherlandsPoland (EUR 517508 million). Countries where the risk exceeded EUR 300 million but was less than EUR 500 million are Poland, GermanyMalaysia, Saudi Arabia and Malaysia.India. The degree of risk of a country is taken into account when new investments are considered. The Company does not, however, use financial derivative instruments to hedge country risk.
Other insurable risks
Philips is covered for a broad range of losses by global insurance policies in the areas of property damage/business interruption, general and product liability, transport, directors’ and officers’ liability, employment practice liability, crime and aviation product liability.cyber security. The counterparty risk related to the insurance companies participating in the above mentionedabove-mentioned global insurance policies areis actively managed. As a rule, Philips only selects insurance companies with aan S&P credit rating of at leastA-. Throughout the year the counterparty risk is monitored on a regular basis.
To lower exposures and to avoid potential losses, Philips has a global Risk Engineering program in place. The main focus of this program is on property damage and business interruption risks including company interdependencies. Regularon-site assessments take place at Philips locations and business criticalbusiness-critical suppliers by risk engineers of the insurer in order to provide an accurate assessment of the potential loss and its impact. The results of these assessments are shared across the Company’s stakeholders.On-site assessments are carried out against the predefined Risk Engineering standards which are agreed between Philips and the insurers. Recommendations are made in a Risk Improvement report and are monitored centrally. This is the basis for decision-making by the local management of the business as to which recommendations will be implemented.
For all policies, deductibles are in place, which vary from EUR 250,0000.25 million to EUR 2,500,0005 million per occurrence and this variance is designed to differentiate between the existing risk categories within Philips. Above this first layer of working deductibles, Philips operates its
Annual Report 2016 191
Group financial statements 10.10
ownre-insurance captive, which during 20132016 retained EUR 2.5 million per occurrence for property damage and business interruption losses and EUR 5 million in the aggregate per year. For general and product liability claims, the captive retained EUR 1.5 million per claim and EUR 6 million in the aggregate. New contracts were signed on December 31, 2013,2016, for the coming year, whereby there-insurance captive retentions remained unchanged.
Dutch pension plan contributionNew credit facility
In January 2017, Philips entered into a USD 1 billion and EUR 300 million credit facility with a consortium of international banks. Under this credit facility Philips drew USD 1 billion in January; the facility was used for the early redemption of 5.750% Notes due 2018 in the aggregate principal amount of USD 1,250 million. The maturity date of the new facility is December 29, 2017, however Philips expects to prepay this facility in the course of 2017.
Offering of Philips Lighting shares
On July 1, 2013,February 9, 2017 Royal Philips announced that it had reachedcompleted an agreement with the Dutch trade unions onaccelerated book build offering to institutional investors of 26 million shares in Philips Lighting at a new collective labor agreement that covers the period January 1, 2013 till December 31, 2014. The new agreement includes changesprice of EUR 23.40 per share realizing total proceeds of EUR 608 million. This transaction reduced Royal Philips’ stake in the plan rules and the funding agreement with the Dutch pension plan, which is the company’s largest Defined Benefit pension plan. The plan changes have become effective as of January 1, 2014 and the new funding agreement has been signed by the Trustees of the Dutch pension plan. Philips Lighting’s outstanding share capital from 71.225% to 53.892%.
As part of this transaction, Philips Lighting repurchased 3.5 million shares in the offering and intends to cancel these changes, Philips agreed to make a EUR 600 million contribution to the Dutch pension plan, of which EUR 240 million has been settled in cash on February 19, 2014. During 2014 and 2015, the remaindershares. After cancellation of the consideration will be settled through the transfer of assets and cash proceeds from the sale of assets which are currently owned by Philips. The (majority of the) contribution will need to be written off through other comprehensive income due to the asset ceiling restrictions3.5 million shares that Philips Lighting has acquired in the plan.
Healthcare facilityoffering, Royal Philips’ shareholding in Cleveland, Ohio
In our healthcare facility in Cleveland, Ohio, certain issues in the general area of manufacturing process controls were identified during an ongoing US Food and Drug Administration (FDA) inspection. To address these issues, on January 10, 2014 we started a voluntary, temporary suspension of new production at the facility, primarily to strengthen manufacturing process controls. Currently, there is no indication of product safety issues. This action is estimated to have a negative impact on the sector’s operational results of approximately EUR 60 to 70 million in the first half of 2014, of which we expect to recover a substantial part in the second half of 2014.
Transfer of the remaining 30%-stake in TP Vision Holding to TPV
Technology Limited (TPV)
On January 20, 2014 Philips announced that it has signed a term sheet to transfer the remaining 30% stake in the TP Vision venture to TPV Technology Limited. The signing of definitive agreementsLighting is expected to take place in the first quarterrepresent 55.180% of 2014, with completion expected in the second half of 2014, subject to certain regulatory and TPV shareholder approvals. After completion, TPV will fully own TP Vision, which will enable further integration with TPV’s TV business.
The remaining 30% stake in the TP Vision venture will be transferred for a deferred purchase price and allPhilips Lighting’s outstanding loans and stand-by facilities between Philips and the TP Vision venture will be transferred to TPV. The brand license agreement between Philips and the TP Vision venture will remain in place, with an annual royalty of 2.2% of sales payable by the TP Vision venture to Philips. The minimum annual royalty has been reduced from EUR 50 million to EUR 40 million. The agreement includes a EUR 50 million transaction-related payment, which Philips has accounted for in the fourth quarter of 2013 under Results relating to investments in associates (see note 6, Interests in entities).
LTI coverage program
To cover Philips’ outstanding obligations resulting from past and present long-term incentive and employee stock purchase programs dating back to 2004, Philips will repurchase up to 12 million additional Philips shares on NYSE Euronext Amsterdam, to be executed during 2014. The shares repurchased will be held by Philips as treasury shares until they are distributed to participants.
Philips started this program as of January 28, 2014 and will enter into subsequent discretionary management agreements with one or more banks to repurchase Philips shares within the limits of relevant laws and regulations (in particular EC Regulation 2273/2003) and Philips’ articles of association. All transactions are published on Philips’ website (www.philips.com/investor) on a weekly basis.share capital.
192 Annual Report 2013 2132016
11 GroupCompany financial statements 11.9 - 11.9
The LTI coverage program is over and above the existing EUR 1.5 billion share repurchase program for cancellation purposes which started on October 21, 2013.
214 Annual Report 2013
11 Group financial statements 11.10 - 11.10
11.10 Independent auditors’ report – Group
Report of Independent Registered Public Accounting Firm
To the Supervisory Board and Shareholders of Koninklijke Philips N.V.:
We have audited the accompanying consolidated balance sheets of Koninklijke Philips N.V. and subsidiaries as of December 31, 2013 and 2012, and the related consolidated statements of income, comprehensive income, cash flows, and changes in equity for each of the years in the three-year period ended December 31, 2013. These consolidated financial statements are the responsibility of the Koninklijke Philips N.V.’s management. Our responsibility is to express an opinion on these consolidated financial statements based on our audits.
We conducted our audits in accordance with the standards of the Public Company Accounting Oversight Board (United States). Those standards require that we plan and perform the audit to obtain reasonable assurance about whether the financial statements are free of material misstatement. An audit includes examining, on a test basis, evidence supporting the amounts and disclosures in the financial statements. An audit also includes assessing the accounting principles used and significant estimates made by management, as well as evaluating the overall financial statement presentation. We believe that our audits provide a reasonable basis for our opinion.
In our opinion, the consolidated financial statements referred to above present fairly, in all material respects, the financial position of Koninklijke Philips N.V. and subsidiaries as of December 31, 2013 and 2012, and the results of their operations and their cash flows for each of the years in the three-year period ended December 31, 2013, in conformity with International Financial Reporting Standards as issued by the International Accounting Standards Board.
We also have audited, in accordance with the standards of the Public Company Accounting Oversight Board (United States), Koninklijke Philips N.V. and subsidiaries’ internal control over financial reporting as of December 31, 2013, based on criteria established in Internal Control — Integrated Framework (1992) issued by the Committee of Sponsoring Organizations of the Treadway Commission (COSO), and our report dated February 25, 2014, expressed an unqualified opinion on the effectiveness of the Koninklijke Philips N.V. and subsidiaries’ internal control over financial reporting.
/s/ KPMG Accountants N.V.
Amsterdam, The Netherlands
February 25, 2014
Annual Report 2013 215
1211 Company financial statements 12 - 12
12 Company financial statements
Introduction
Statutory financial statements
The sections Group financial statements and Company financial statements contain the statutory financial statements of Koninklijke Philips N.V. (the Company).
A description of the Company’s activities and group structure is included in the Consolidated Financial Statements.Group financial statements.
Accounting policies applied
The financial statements of the Company included in this section are prepared in accordance with Part 9 of Book 2 of the Dutch Civil Code. Section 2:362 (8), Book 2, of the Dutch Civil Code, allows companies that apply IFRS as adoptedendorsed by the European Union in their consolidated financial statements to use the same measurement principles in their company financial statements. The Company has prepared these Company financial statements using this provision.
The accounting policies are described innote 1, Significant accounting policies.policies of the Group financial Statements and are deemed incorporated and repeated herein by reference.
Investments in group companies in the Company financial statements are accounted for using the equity method in these Company financial statements.method.
Presentation of Company financial statements
The structure of the Company balance sheets isand Company statements of income are aligned as much as possible with the Consolidated balance sheetsstatements in order to achieve optimal transparency between the Group financial statements and the Company financial statements. Consequently, the presentation of the Company balance sheetsstatements deviates from Dutch regulations.
The Company balance sheet has been prepared before the appropriation of result.
The Company statement of income has been prepared in accordance with Section 2:402 of the Dutch Civil Code, which allows a simplified Statement of income in the Company financial statements in the event that a comprehensive Statement of income is included in the consolidated Group financial statements.
Additional information
For ‘Additional information’ within the meaning of Section 2:392 of the Dutch Civil Code, please refer tosection 11.5, Independent auditor’s report—Group, section 12.5, Independent auditor’s report—Company,report, of this report, and section 4.4, Proposed distribution to shareholders, of this report.
Adjustments
Prior-period financial statements have been restated following the adoption of IAS 19R, which mainly relates to accounting for pensions.
216 Annual Report 20132016 193
12 Company financial statements 12.1 - 12.111.1
Koninklijke Philips N.V.
Statements of incomein millions of EUR
For the year ended December 31
|
| |||||||||
| 2015 | 2016 | |||||||||
|
| |||||||||
| 489 | 422 | ||||||||
Cost of sales | (38 | ) | (34 | ) | ||||||
|
| |||||||||
Gross margin | 451 | 388 | ||||||||
Selling expenses | (26 | ) | (17 | ) | ||||||
General and administrative expenses | (26 | ) | (21 | ) | ||||||
Impairment of goodwill | 3 | — | ||||||||
| 102 | 65 | ||||||||
Other business expenses | 3 | (6 | ) | |||||||
|
| |||||||||
| 507 | 409 | ||||||||
| 472 | 448 | ||||||||
| (317 | ) | (466 | ) | ||||||
|
| |||||||||
Income before taxes | 662 | 391 | ||||||||
| 26 | (142 | ) | |||||||
|
| |||||||||
Income after tax | 688 | 249 | ||||||||
Results relating to investments in associates | 23 | 4 | ||||||||
Net income (loss) from affiliated companies | (66 | ) | 1,195 | |||||||
|
| |||||||||
Net income | 645 | 1,448 | ||||||||
|
| |||||||||
194 Annual Report 2016
Company financial statements 11.2
12.111.2 Balance sheets before appropriation of results
Balance sheets of Koninklijke Philips N.V. as of December 31
Balance sheetsin millions of eurosEUR unless otherwise stated
As of December 31
|
| |||||||||||||||||||||||||||||||||
| 2015 | 2016 | |||||||||||||||||||||||||||||||||
| 2012 | 2013 |
|
| |||||||||||||||||||||||||||||||
| Assets | Assets | |||||||||||||||||||||||||||||||||
Non-current assets: | Non-current assets: | |||||||||||||||||||||||||||||||||
Property, plant and equipment | 2 | 18 | Property, plant and equipment | 1 | 1 | |||||||||||||||||||||||||||||
| 9 | 55 |
| 81 | 80 | |||||||||||||||||||||||||||||
| 16,597 | 19,535 |
| 21,176 | 22,067 | |||||||||||||||||||||||||||||
Non-current receivables | 49 | 32 | Non-current receivables | 88 | 79 | |||||||||||||||||||||||||||||
Deferred tax assets | 212 | 161 | Deferred tax assets | 766 | 548 | |||||||||||||||||||||||||||||
| 325 | 283 |
| 279 | 148 | |||||||||||||||||||||||||||||
| 17,194 | 20,084 |
|
| |||||||||||||||||||||||||||||||
Totalnon-current assets | Totalnon-current assets | 22,391 | 22,923 | |||||||||||||||||||||||||||||||
Current assets: | Current assets: | |||||||||||||||||||||||||||||||||
Current financial assets | Current financial assets | 10 | 91 | |||||||||||||||||||||||||||||||
| 7,988 | 7,500 |
| 8,298 | 8,458 | |||||||||||||||||||||||||||||
Assets classified as held for sale | — | 45 | ||||||||||||||||||||||||||||||||
Cash and cash equivalents | 2,879 | 1,282 | Cash and cash equivalents | 730 | 756 | |||||||||||||||||||||||||||||
| 10,867 | 8,827 |
|
| |||||||||||||||||||||||||||||||
Total current assets | Total current assets | 9,038 | 9,305 | |||||||||||||||||||||||||||||||
|
|
|
| |||||||||||||||||||||||||||||||
| 28,061 | 28,911 | |||||||||||||||||||||||||||||||||
Total assets | Total assets | 31,429 | 32,228 | |||||||||||||||||||||||||||||||
Liabilities and shareholders’ equity | Liabilities and shareholders’ equity | |||||||||||||||||||||||||||||||||
|
| |||||||||||||||||||||||||||||||||
Preference shares, par value EUR 0.20 per share: | Preference shares, par value EUR 0.20 per share: | |||||||||||||||||||||||||||||||||
- Authorized: 2,000,000,000 shares (2012: 2,000,000,000 shares) | ||||||||||||||||||||||||||||||||||
- Authorized: 2,000,000,000 shares (2015: 2,000,000,000 shares) | - Authorized: 2,000,000,000 shares (2015: 2,000,000,000 shares) | |||||||||||||||||||||||||||||||||
- Issued: none | - Issued: none | |||||||||||||||||||||||||||||||||
Common shares, par value EUR 0.20 per share: | Common shares, par value EUR 0.20 per share: | |||||||||||||||||||||||||||||||||
- Authorized: 2,000,000,000 shares (2012: 2,000,000,000 shares) | ||||||||||||||||||||||||||||||||||
- Issued and fully paid: 937,845,789 shares (2012: 957,132,962 shares) | 191 | 188 | ||||||||||||||||||||||||||||||||
- Authorized: 2,000,000,000 shares (2015: 2,000,000,000 shares) | - Authorized: 2,000,000,000 shares (2015: 2,000,000,000 shares) | |||||||||||||||||||||||||||||||||
- Issued and fully paid: 929,644,864 shares (2015: 931,130,387 shares) | - Issued and fully paid: 929,644,864 shares (2015: 931,130,387 shares) | 186 | 186 | |||||||||||||||||||||||||||||||
Capital in excess of par value | 1,304 | 1,796 | Capital in excess of par value | 2,669 | 3,083 | |||||||||||||||||||||||||||||
Legal reserve: revaluation | 54 | 23 | Legal reserve: revaluation | 4 | — | |||||||||||||||||||||||||||||
Legal reserve: available-for-sale financial assets | 54 | 55 | Legal reserve:available-for-sale financial assets | 56 | 36 | |||||||||||||||||||||||||||||
Legal reserve: cash flow hedges | 20 | 24 | Legal reserve: cash flow hedges | 12 | 10 | |||||||||||||||||||||||||||||
Legal reserve: affiliated companies | 1,161 | 1,319 | Legal reserve: affiliated companies | 958 | 715 | |||||||||||||||||||||||||||||
Legal reserve: currency translation differences | (93 | ) | (569 | ) | Legal reserve: currency translation differences | 1,058 | 1,234 | |||||||||||||||||||||||||||
Retained earnings | 9,598 | 7,927 | Retained earnings | 6,437 | 6,070 | |||||||||||||||||||||||||||||
| (35 | ) | 1,169 | Net income1) | 645 | 1,448 | ||||||||||||||||||||||||||||
Treasury shares, at cost: 24,508,022 shares (2012: 42,541,687 shares) | (1,103 | ) | (718 | ) | ||||||||||||||||||||||||||||||
Treasury shares, at cost: 7,208,301 shares (2015: 14,026,801 shares) | Treasury shares, at cost: 7,208,301 shares (2015: 14,026,801 shares) | (363 | ) | (181 | ) | |||||||||||||||||||||||||||||
| 11,151 | 11,214 |
|
| |||||||||||||||||||||||||||||||
Total equity | Total equity | 11,662 | 12,601 | |||||||||||||||||||||||||||||||
Non-current liabilities: | Non-current liabilities: | |||||||||||||||||||||||||||||||||
| 3,539 | 3,158 |
| 3,933 | 2,602 | |||||||||||||||||||||||||||||
Long-term provisions | 10 | 16 | Long-term provisions | 5 | 7 | |||||||||||||||||||||||||||||
Deferred tax liabilities | 19 | 15 | Deferred tax liabilities | 12 | 11 | |||||||||||||||||||||||||||||
Other non-current liabilities | 139 | 161 | Othernon-current liabilities | 789 | 667 | |||||||||||||||||||||||||||||
| 3,707 | 3,350 |
|
| |||||||||||||||||||||||||||||||
Totalnon-current liabilities | Totalnon-current liabilities | 4,739 | 3,287 | |||||||||||||||||||||||||||||||
Current liabilities: | Current liabilities: | |||||||||||||||||||||||||||||||||
| 11,742 | 13,645 |
| 14,528 | 15,815 | |||||||||||||||||||||||||||||
| 1,461 | 702 |
| 500 | 525 | |||||||||||||||||||||||||||||
| 13,203 | 14,347 |
|
| |||||||||||||||||||||||||||||||
| ||||||||||||||||||||||||||||||||||
Total current liabilities | Total current liabilities | 15,028 | 16,340 | |||||||||||||||||||||||||||||||
Liabilities and shareholders’ equity | Liabilities and shareholders’ equity | 31,429 | 32,228 | |||||||||||||||||||||||||||||||
|
|
|
| |||||||||||||||||||||||||||||||
| 28,061 | 28,911 | |||||||||||||||||||||||||||||||||
| 1) | Prepared before appropriation of results |
Annual Report 2013 2172016 195
12 Company financial statements 12.2 - 12.311.3
Statements of income of Koninklijke Philips N.V. for the years ended December 31
in millions of euros
| 2012 | 2013 | |||||||
Net income from affiliated companies | 375 | 1,276 | ||||||
Other net income | (410 | ) | (107 | ) | ||||
|
| |||||||
| (35 | ) | 1,169 | |||||
12.311.3 Statement of changes in equity
Statement of changes in equity of Koninklijke Philips N.V.
Statementofchangesinequityin millions of eurosEUR unless otherwise stated
For the year ended December 31
| legal reserves |
|
| ||||||||||||||||||||||||||||||||||||||||||||||||||||||||||||||||||||||||||||||||||||||
com- mon shares | capital in excess of par value | revalua- tion | available- for-sale financial assets | cash flow hedges | affiliated compa- nies | currency translation differences | retained earnings | net income | treasury shares at cost | share- holders’ equity | com- mon | capital in excess of par value | Revalua- tion | available- for-sale | cash flow hedges | affiliated nies | currency translation differences | retained earnings | net income | treasury shares | share- holders’ | |||||||||||||||||||||||||||||||||||||||||||||||||||||||||||||||||||
Balance as of January 1, 2013 | 191 | 1,304 | 54 | 54 | 20 | 1,161 | (93 | ) | 9,598 | (35 | ) | (1,103 | ) | 11,151 | ||||||||||||||||||||||||||||||||||||||||||||||||||||||||||||||||||||||||||
| legal reserves | ||||||||||||||||||||||||||||||||||||||||||||||||||||||||||||||||||||||||||||||||||||||||
Balance as of January 1, 2016 | 186 | 2,669 | 4 | 56 | 12 | 958 | 1,058 | 6,437 | 645 | (363 | ) | 11,662 | ||||||||||||||||||||||||||||||||||||||||||||||||||||||||||||||||||||||||||||
Appropriation of prior year result | (35 | ) | 35 | 645 | (645 | ) | ||||||||||||||||||||||||||||||||||||||||||||||||||||||||||||||||||||||||||||||||||
Net income | 1,169 | 1,169 | 1,448 | 1,448 | ||||||||||||||||||||||||||||||||||||||||||||||||||||||||||||||||||||||||||||||||||||
Release revaluation reserve | (31 | ) | 31 | — | (4 | ) | 4 | — | ||||||||||||||||||||||||||||||||||||||||||||||||||||||||||||||||||||||||||||||||
Net current period change | (5 | ) | 68 | 158 | (427 | ) | (96 | ) | (302 | ) | ||||||||||||||||||||||||||||||||||||||||||||||||||||||||||||||||||||||||||||||
Net current period change1) | (44 | ) | 2 | (243 | ) | 174 | 300 | 189 | ||||||||||||||||||||||||||||||||||||||||||||||||||||||||||||||||||||||||||||||||
Income tax on net current period change | (2 | ) | (35 | ) | (37 | ) | — | (9 | ) | 2 | (7 | ) | ||||||||||||||||||||||||||||||||||||||||||||||||||||||||||||||||||||||||||||
Reclassification into income | 6 | (62 | ) | (14 | ) | (70 | ) | 24 | 5 | — | 29 | |||||||||||||||||||||||||||||||||||||||||||||||||||||||||||||||||||||||||||||
Dividend distributed | 4 | 402 | (678 | ) | (272 | ) | 4 | 398 | (732 | ) | (330 | ) | ||||||||||||||||||||||||||||||||||||||||||||||||||||||||||||||||||||||||||||
Cancellation of treasury shares | (7 | ) | (780 | ) | 787 | — | (4 | ) | (446 | ) | 450 | — | ||||||||||||||||||||||||||||||||||||||||||||||||||||||||||||||||||||||||||||
Purchase of treasury shares | (38 | ) | (631 | ) | (669 | ) | (589 | ) | (589 | ) | ||||||||||||||||||||||||||||||||||||||||||||||||||||||||||||||||||||||||||||||
Re-issuance of treasury shares | (36 | ) | (75 | ) | 229 | 118 | (122 | ) | (35 | ) | 231 | 74 | ||||||||||||||||||||||||||||||||||||||||||||||||||||||||||||||||||||||||||||
Share call options | (103 | ) | 90 | (13 | ) | |||||||||||||||||||||||||||||||||||||||||||||||||||||||||||||||||||||||||||||||||||
Share-based compensation plans | 105 | 105 | 119 | 119 | ||||||||||||||||||||||||||||||||||||||||||||||||||||||||||||||||||||||||||||||||||||
Income tax on share-based compensation plans | 21 | 21 | 19 | 19 | ||||||||||||||||||||||||||||||||||||||||||||||||||||||||||||||||||||||||||||||||||||
|
|
|
| |||||||||||||||||||||||||||||||||||||||||||||||||||||||||||||||||||||||||||||||||||||
Balance as of December 31, 2013 | 188 | 1,796 | 23 | 55 | 24 | 1,319 | (569 | ) | 7,927 | 1,169 | (718 | ) | 11,214 | |||||||||||||||||||||||||||||||||||||||||||||||||||||||||||||||||||||||||||
Balance as of December 31, 2016 | 186 | 3,083 | — | 36 | 10 | 715 | 1,234 | 6,070 | 1,448 | (181 | ) | 12,601 | ||||||||||||||||||||||||||||||||||||||||||||||||||||||||||||||||||||||||||||
|
| |||||||||||||||||||||||||||||||||||||||||||||||||||||||||||||||||||||||||||||||||||||||
| 1) | The net current period change includes the impact of the IPO of Philips Lighting, which had a positive impact on Shareholders’ equity of EUR 109 million. |
218196 Annual Report 20132016
12


 Company financial statements
 12.4 - 12.411.4


All amounts in millions of euros unless otherwise stated
Notes to the Company financial statements
Sales relates to external sales and mainly comprises license income from intellectual property rights owned by the Company.
Other business income mainly relates to income from transactions with group companies regarding overhead services and brand license agreements.
Koninklijke Philips N.V.
Sales and costs by naturein millions of EUR
2015 - 2016
|
| |||||||
| 2015 | 2016 | |||||||
|
| |||||||
Sales | 489 | 422 | ||||||
Costs of materials used | (7 | ) | (6 | ) | ||||
Employee benefit expenses | (14 | ) | (13 | ) | ||||
Depreciation and amortization | (23 | ) | (14 | ) | ||||
Advertising and promotion | (11 | ) | (7 | ) | ||||
Other operational costs | (36 | ) | (31 | ) | ||||
Impairment of goodwill | 3 | — | ||||||
Other business income (expenses) | 106 | 58 | ||||||
|
| |||||||
Income from operations | 507 | 409 | ||||||
|
| |||||||
For a summary of the audit fees related to the Philips Group, please refer to the Group Financial statementsnote 6, Income from operations, which is deemed incorporated and repeated herein by reference.
Financial income mainly consists of interest received from intercompany financing transactions. Interest received from third parties was EUR 21 million (2015: EUR 20 million).
Financial expense mainly relates to interest charges on external debt (please refer tonote L, Debt). In 2016, there are also included financial expenses related to the early redemption of USD bonds in October 2016 and January 2017 of EUR 91 million and EUR 62 million respectively.
Koninklijke Philips N.V. is head of the fiscal unity that exists for Dutch corporate income tax purposes.
The income tax expense of EUR 142 million reported in the Company Statements of income represents the consolidated amount of current and deferred tax expense for all members of the fiscal unity. The effective tax rate increased in 2016 compared to 2015, mainly due to changes in the contribution of income of members of the fiscal unity to the total taxable result of the fiscal unity, compared to the Company’s contribution.
At December 31, 2016, net operating loss and tax credit carryforwards for which no deferred tax assets have been recognized in the balance sheet amount to EUR 29 million.
The number of persons employed by the Company at theyear-end 2016 was 8 (2015: 7). For the remuneration of past and present members of both the Board of Management and the Supervisory Board, please refer tonote 28, Information on remuneration, which is deemed incorporated and repeated herein by reference.
Intangible assets includes mainly licenses and patents. The changes during 20132016 are as follows;
Koninklijke Philips N.V.
Intangible assetsin millions of EUR
2016
Balance as of January 1, | ||||
Cost | ||||
Amortization/impairments | ( | ) | ||
|
| |||
Book value | ||||
Changes in book value: | ||||
Reclassifications | ) | |||
Additions | ||||
Amortization | ( | ) | ||
|
| |||
Total changes | ) | |||
Balance as of December 31, | ||||
Cost | ||||
Amortization/impairments | ( | ) | ||
|
| |||
Book value | ||||
The investments in group companies and associates are presented as financial fixed assets in the balance sheet using the equity method. Goodwill paid upon acquisition of investments in group companies or associates is included in the net equity value of the investment and is not shown separately on the face of the balance sheet.
Loans are provided to group companies and associates and are stated at amortized cost, less impairment.
| investments in group companies | investments in associates | loans | total | |||||||||||||
Balance as of January 1, 2013 | 10,407 | 87 | 6,103 | 16,597 | ||||||||||||
Changes: | ||||||||||||||||
Reclassification | — | (3 | ) | — | (3 | ) | ||||||||||
Acquisitions/additions | 2,632 | — | 529 | 3,161 | ||||||||||||
Sales/redemptions | (131 | ) | (2 | ) | (524 | ) | (657 | ) | ||||||||
Net income from affiliated companies | 1,309 | (8 | ) | — | 1,301 | |||||||||||
Dividends received | (340 | ) | — | — | (340 | ) | ||||||||||
Translation differences | (458 | ) | (3 | ) | (235 | ) | (696 | ) | ||||||||
Other | 172 | — | — | 172 | ||||||||||||
|
| |||||||||||||||
Balance as of December 31, 2013 | 13,591 | 71 | 5,873 | 19,535 | ||||||||||||
A list of investments in group companies, prepared in accordance with the relevant legal requirements (Dutch Civil Code, Book 2, Sections 379 and 414), is deposited at the Chamber of Commerce in Eindhoven, The Netherlands.
In December 2013, investments
Annual Report 2016 197
Company financial statements 11.4


Koninklijke Philips N.V.
Financial fixed assetsin group companies increased bymillions of EUR 2,111 million due
2016
|
| |||||||||||||||
| investments in group companies | investments in associates | loans | total | |||||||||||||
|
| |||||||||||||||
Balance as of January 1, 2016 | 11,834 | 73 | 9,269 | 21,176 | ||||||||||||
Changes: | ||||||||||||||||
Acquisitions/additions | 4,099 | 3 | 48 | 4,150 | ||||||||||||
Sales/redemptions | (2,966 | ) | — | (1,427 | ) | (4,393 | ) | |||||||||
Net income from affiliated companies | 1,195 | 4 | — | 1,199 | ||||||||||||
Dividends received | (493 | ) | (27 | ) | — | (520 | ) | |||||||||
Translation differences | 277 | 4 | 174 | 455 | ||||||||||||
|
| |||||||||||||||
Balance as of December 31, 2016 | 13,946 | 57 | 8,064 | 22,067 | ||||||||||||
|
| |||||||||||||||
Prior to the purchaseIPO of 25%Philips Lighting, the Company completed an internal legal restructuring whereby all lighting activities were concentrated in Philips Lighting. The movements in Acquisitions/additions and Sales/ redemptions reflect the impact of a group company which was previously owned by another group company. This transaction was executed in view of our continued effort to restructure and optimize our foreign based intra-group finance activities. In addition, investments in group companies also increased by EUR 517 millionthis restructuring. The restructuring qualifies as a result of capital injections. These transactions reflect mosttransaction under common control and therefore did not affect results or equity of the increaseCompany.
Included in Sales/redemptions is the line Acquisitions/additions.
divestment of 28.775% of the shares of Philips Lighting during the IPO completed in May and June 2016, representing an amount of EUR 700 million. Please refer tonote 5, Interests in entities.
Other non-current financial assets
The changes during 2016 were as follows:
| available- for-sale financial assets | loans and receivables | financial assets at fair value through profit and loss | total | |||||||||||||
Balance as of January 1, 2013 | 84 | 221 | 20 | 325 | ||||||||||||
Changes: | ||||||||||||||||
Reclassifications | 3 | — | — | 3 | ||||||||||||
Acquisitions/additions | 9 | — | — | 9 | ||||||||||||
Sales/redemptions/reductions | — | (1 | ) | — | (1 | ) | ||||||||||
Impairments | (7 | ) | (1 | ) | — | (8 | ) | |||||||||
Transfer to assets classified as held for sale | (15 | ) | (30 | ) | — | (45 | ) | |||||||||
Value adjustments | 12 | 1 | (13 | ) | — | |||||||||||
|
| |||||||||||||||
Balance as of December 31, 2013 | 86 | 190 | 7 | 283 | ||||||||||||
Koninklijke Philips N.V.
Available-for-saleOthernon-current financial assetsin millions of EUR
2016
|
| |||||||||||||||
| available - for-sale financial assets | loans and receivables | financial assets at fair value through profit and loss | total | |||||||||||||
|
| |||||||||||||||
Balance as of January 1, 2016 | 132 | 138 | 9 | 279 | ||||||||||||
Changes: | ||||||||||||||||
Reclassifications | (4 | ) | (100 | ) | — | (104 | ) | |||||||||
Acquisitions/additions | 40 | — | — | 40 | ||||||||||||
Sales/redemptions/reductions | (3 | ) | (15 | ) | — | (18 | ) | |||||||||
Impairments | (27 | ) | — | — | (27 | ) | ||||||||||
Value adjustments | (20 | ) | 7 | (9 | ) | (22 | ) | |||||||||
|
| |||||||||||||||
Balance as of December 31, 2016 | 118 | 30 | — | 148 | ||||||||||||
|
| |||||||||||||||
Available-for-sale financial assets
The Company’s investments inavailable-for-sale financial assets mainly consist of investments in common stockshares of companies in various industries. An amount of EUR 15 million has been reclassifiedThe line additions/acquisitions mainly relates to assets heldcapital calls for sale in relation to the agreed contribution to the Philips Pension Fund (please refer to note 30, Post-employment benefits and note 36, Subsequent events).certain investment funds.
Loans and receivables
During 2013The reclassification line represents loans with face value EUR 30 million were transferred to Current financial assets held for saleand mainly relates to loans to TPV Technology Limited in relation to the agreed contribution to the Philips Pension Fund (please refer to note 30, Post-employment benefits and note 36, Subsequent events).
Financial assets at fair value through profit and loss
Included in this category are certain financial instruments that Philips received in exchange for the transfer of its television activities. The initial valueamount of EUR 17 million was adjusted by EUR 11 million during 2012 and EUR 6 million in 2013 reported under Value adjustments. As of December 31, 2013 the fair value reported was nil. For more information please refer to note 36, Subsequent events.
In 2010, Philips sold its entire holding of common shares in NXP Semiconductors B.V. (NXP) to Philips Pension Trustees Limited (herein referred to as “UK Pension Fund”). As a result of this transaction the UK Pension Fund obtained the full legal title and ownership of the NXP shares, including the entitlement to any future dividends and the proceeds from any sale of shares. From the date of the transaction the NXP shares became an integral part of the plan assets of the UK Pension Fund. The purchase agreement with the UK Pension Fund includes an arrangement that may entitle Philips to a cash payment from the UK Pension Fund on or after September 7, 2014, if the total value yielded by the NXP shares has increased by this date to a level in excess of a predetermined threshold, which at the time of the transaction was substantially above the transaction price, and the UK Pension Fund is in a surplus (on a swaps basis) on September 7, 2014. The arrangement qualifies as a financial instrument and is reported under Other non-current financial assets. The Trustees of the UK Pension Fund have been selling the NXP shares in a number of transactions since 2010. The remaining number of NXP shares were sold in the course of 2013 and the total sale proceeds of the NXP shares exceeded the predetermined threshold. However, as of December 31,
Annual Report 2013 219

 12 Company financial statements 12.4 - 12.4
2013 the UK Pension Fund was not in surplus (on the agreed swaps basis). The fair value of the arrangement was estimated to be EUR 14 million as of December 31, 2012. As of December 31, 2013 management’s best estimate of the fair value of the arrangement is EUR 7 million, based on the current funded status as of December 31, 2013 (swaps basis) and the economic and demographic risks of the UK Pension Fund. The change in fair value in 2013 is reported under Value adjustments in the table above.91 million.
Koninklijke Philips N.V.
| 2012 | 2013 | |||||||
Trade accounts receivable | 83 | 80 | ||||||
Affiliated companies | 7,690 | 7,177 | ||||||
Other receivables | 23 | 5 | ||||||
Advances and prepaid expenses | 16 | 28 | ||||||
Derivative instruments—assets | 176 | 210 | ||||||
|
| |||||||
| 7,988 | 7,500 | |||||||
Receivablesin millions of EUR
2015 - 2016
|
| |||||||
| 2015 | 2016 | |||||||
|
| |||||||
Trade accounts receivable | 91 | 86 | ||||||
Affiliated companies | 7,966 | 8,176 | ||||||
Other receivables | 64 | 50 | ||||||
Advances and prepaid expenses | 19 | 12 | ||||||
Derivative instruments—assets | 158 | 134 | ||||||
|
| |||||||
Receivables | 8,298 | 8,458 | ||||||
|
| |||||||
Common shares
As of December 31, 2013,2016, the issued and fully paid share capital consists of 937,845,789929,644,864 common shares, each share having a par value of EUR 0.20.
In June 2013, Philips settled a dividend of EUR 0.75 per common share, representing a total value of EUR 678 million. Shareholders could elect for a cash dividend or a share dividend. Approximately 59.8% of the shareholders elected for a share dividend, resulting in the issuance of 18,491,337 new common shares. The settlement of the cash dividend resulted in a payment of EUR 272 million.
The following table shows the movements in the outstanding number of shares;shares:
Koninklijke Philips N.V.
Share movement scheduleOutstanding number of sharesin number of shares
2015 - 2016
|
| |||||||||||||||
| 2015 | 2016 | |||||||||||||||
| 2012 | 2013 |
|
| |||||||||||||
Balance as of January 1 | 926,094,902 | 914,591,275 | 914,388,869 | 917,103,586 | ||||||||||||
Dividend distributed | 30,522,107 | 18,491,337 | 17,671,990 | 17,344,462 | ||||||||||||
Purchase of treasury shares | (46,870,632 | ) | (27,811,356 | ) | (20,296,016 | ) | (25,193,411 | ) | ||||||||
Re-issuance of treasury shares | 4,844,898 | 8,066,511 | 5,338,743 | 13,181,926 | ||||||||||||
|
| |||||||||||||||
Balance as of December 31 | 914,591,275 | 913,337,767 | 917,103,586 | 922,436,563 | ||||||||||||
|
| |||||||||||||||
Preference shares
The ‘Stichting Preferente Aandelen Philips’ has been granted the right to acquire preference shares in the Company. Such right has not been exercised. As a means to protect the Company and its stakeholders against an unsolicited attempt to (de facto) take over control of the Company, the General Meeting of Shareholders in 1989 adopted amendments to the Company’s articles of association that allow the Board of Management and the Supervisory Board to issue (rights to acquire) preference shares to a third party. As of December 31, 2013,2016, no preference shares have been issued.
198 Annual Report 2016
Company financial statements 11.4
Option rights/Options, restricted and performance shares
The Company has granted stock options on its common shares and rights to receive common shares in the future. Please refer tonote 31,27, Share-based compensation, which is deemed incorporated and repeated herein by reference.
Treasury shares
In connection with the Company’s share repurchase programs, shares which have been repurchased and are held in treasury for (i) delivery upon exercise of options, performance and restricted share programs and employee share purchase programs, and (ii) capital reduction purposes, are accounted for as a reduction of shareholders’ equity. Treasury shares are recorded at cost, representing the market price on the acquisition date. When issued, shares are removed from treasury shares on a FIFO basis.
AnyWhen treasury shares are reissued under the Company’s option plans, the difference between the cost and the cash received at the time treasury shares are issued, is recorded in retained earnings. When treasury shares are reissued under the Company’s share plans, the difference between the market price of the shares issued and the cost is recorded in retained earnings, the market price is recorded in capital in excess of par value.
Dividend withholding tax in connection with the Company’s purchase of treasury shares for capital reduction purposes is recorded in retained earnings.
The following transactions took place resulting from employee option and share plans:
Koninklijke Philips N.V.
| 2012 | 2013 | |||||||
Shares acquired | 5,147 | 3,984 | ||||||
Average market price | EUR 17.86 | EUR 22.51 | ||||||
Amount paid | EUR 0 million | EUR 0 million | ||||||
Shares delivered | 4,844,898 | 8,066,511 | ||||||
Average market price | EUR 24.39 | EUR 28.35 | ||||||
Amount received | EUR 118 million | EUR 229 million | ||||||
Total shares in treasury at year-end | 28,712,954 | 20,650,427 | ||||||
Total cost | EUR 847 million | EUR 618 million | ||||||
Employee option and share plan transactions
2015 - 2016
|
| |||||||
| 2015 | 2016 | |||||||
|
| |||||||
Shares acquired | 8,601,426 | |||||||
Average market price | EUR 24.73 | |||||||
Amount paid | EUR 213 million | |||||||
Shares delivered | 5,338,743 | 13,181,926 | ||||||
Average price (FIFO) | EUR 30.35 | EUR 25.86 | ||||||
Cost of delivered shares | EUR 162 million | EUR 341 million | ||||||
Total shares in treasury atyear-end | 11,788,801 | 7,208,301 | ||||||
Total cost | EUR 308 million | EUR 181 million | ||||||
|
| |||||||
In order to reduce share capital, the following transactions took place:
Koninklijke Philips N.V.
| 2012 | 2013 | |||||||
Shares acquired | 46,865,485 | 27,807,372 | ||||||
Average market price | EUR 16.41 | EUR 22.69 | ||||||
Amount paid | EUR 769 million | EUR 631 million | ||||||
Reduction of capital stock | 82,364,590 | 37,778,510 | ||||||
Total shares in treasury at year-end | 13,828,733 | 3,857,595 | ||||||
Total cost | EUR 256 million | EUR 100 million | ||||||
Share capital transactions
2015 - 2016
|
| |||||||
| 2015 | 2016 | |||||||
|
| |||||||
Shares acquired | 20,296,016 | 16,591,985 | ||||||
Average market price | EUR 24.39 | EUR 23.84 | ||||||
Amount paid | EUR 495 million | EUR 396 million | ||||||
Reduction of capital stock (shares) | 21,361,016 | 18,829,985 | ||||||
Reduction of capital stock | EUR 517 million | EUR 450 million | ||||||
Total shares in treasury atyear-end | 2,238,000 | |||||||
Total cost | EUR 55 million | |||||||
|
| |||||||
Share purchase transactions related to employee option and share plans, as well as transactions related to the reduction of share capital involved a cash outflow of EUR 606 million, which includes the impact of taxes. Settlements of share-based compensation plans involved a cash inflow of EUR 80 million.
Share call options
During 2016 Philips bought EUR and USD- denominated call options to hedge commitments under share-based compensation plans.
ForEUR-denominated call options, option premiums amounting to EUR 64 million (involving 9,393,779 options) were deducted from Retained earnings and were settled in Royal Philips shares held by the Company representing a historical cost of EUR 77 million based on a FIFO method (involving 2,667,203 shares).
ForUSD-denominated call options, option premiums amounting to EUR 35 million (involving 5,635,360 options) were deducted from Retained earnings and were settled in Royal Philips shares held by the Company representing a historical cost of EUR 32 million based on a FIFO method (involving 1,375,803 shares).
The difference between the option premiums and the historical cost of Royal Philips shares was recorded in Retained earnings. Subsequently, in 2016 the Company sold 837,913 EUR call options against the same number of Royal Philips shares and an additional EUR 13 million cash payment to the buyer of the call options.
Annual Report 2016 199
Company financial statements 11.4
Koninklijke Philips N.V.
Outstanding call options
2016
|
| |||||||||||
| exercise price | options | intrinsic value in millions | weighted average remaining contractual term | |||||||||
|
| |||||||||||
EUR-denominated | ||||||||||||
10-15 | 2,530,968 | 37 | 4.6 yrs | |||||||||
15-20 | 1,063,968 | 15 | 5.1 yrs | |||||||||
20-25 | 4,960,930 | 30 | 3.3 yrs | |||||||||
|
| |||||||||||
Outstanding share call options | 8,555,866 | 82 | 3.9 yrs | |||||||||
USD-denominated | ||||||||||||
15-20 | 1,896,597 | 22 | 4.6 yrs | |||||||||
20-25 | 424,322 | 4 | 5.0 yrs | |||||||||
25-30 | 1,822,875 | 2 | 4.3 yrs | |||||||||
30-35 | 1,491,566 | — | 3.0 yrs | |||||||||
|
| |||||||||||
Outstanding share call options | 5,635,360 | 28 | 4.1 yrs | |||||||||
|
| |||||||||||
Dividend distribution
A proposal will be submitted to the 2014 General Meeting of Shareholders to payIn June 2016, Philips settled a dividend of EUR 0.80 per common share, inrepresenting a total value of EUR 732 million including costs. Shareholders could elect for a cash dividend or shares at the optiona share dividend. Approximately 55% of the shareholder, fromshareholders elected for a share dividend, resulting in the 2013 net income.issuance of 17,344,462 new common shares. The settlement of the cash dividend involved an amount of EUR 330 million (including costs).
Legal reserves
As of December 31, 2013,2016, legal reserves relate to unrealized gains onavailable-for-sale financial assets of EUR 36 million (2015: EUR 56 million), unrealized gains on cash flow hedges of EUR 10 million (2015: EUR 12 million unrealized losses), ‘affiliated companies’ of EUR 715 million (2015: EUR 958 million) and unrealized currency translation gains of EUR 1,234 million (2015: EUR 1,058 million unrealized losses). Last year’s legal reserves also included EUR 4 million related to the revaluation of assets and liabilities of acquired companies in the context of multi-stage acquisitions, which were nil as of EUR 23 million (2012: EUR 54 million), unrealized gains on available-for-sale financial assets of EUR 55 million (2012: EUR 54 million), unrealized gains on cash flow hedges of EUR 24 million (2012: EUR 20 million), ‘affiliated companies’ of EUR 1,319 million (2012: EUR 1,161 million) and unrealized currency translation losses of EUR 569 million (2012: EUR 93 million).December 31, 2016.
The item ‘affiliated companies’ relates to the ‘wettelijke reserve deelnemingen’, which is required by Dutch law. This reserve relates to any legal or economic restrictions on the ability of affiliated companies to transfer funds to the parent company in the form of dividends.
Limitations in the distribution of shareholders’ equity
Pursuant to Dutch law, limitations exist relating to the distribution of shareholders’ equity of EUR 1,6092,181 million (2012: EUR 1,480 million). Asas at December 31, 2013, such2016. Such limitations relate to common shares of EUR 188186 million, (2012: EUR 191 million) as well as available-for-sale financial assets of EUR 36 million, unrealized gains related to cash flow hedges of EUR 10 million, unrealized currency translation gains of EUR 1,234 million and ‘affiliated companies’ of EUR 715 million.
As at December 31, 2015 the limitations on distributable amounts were EUR 2,274 million and related common shares of EUR 186 million, as well as legal reserves included under ‘revaluation’ of EUR 234 million, (2012: EUR 54 million), available-for-sale financial assets of EUR 5556 million, (2012: EUR 54 million), unrealized gains onrelated to cash flow hedges of EUR 2412 million, (2012:unrealized currency gains of EUR 20 million)1,058 million and ‘affiliated companies’ of EUR 1,319 million (2012: EUR 1,161 million).
The unrealized losses related to currency translation differences of EUR 569 million (2012: EUR 93 million), although qualifying as a legal reserve, reduce the distributable amount by their nature.958 million.
220200 Annual Report 20132016
12

 Company financial statements
 12.4 - 12.411.4


Long-term debt and short-term debt Debt
Long-term debt
Koninklijke Philips N.V.
| (range of) interest rates | average interest rate | amount outstanding | due in 1 year | due after 1 year | due after 5 years | average remaining term (in years) | amount outstanding 2012 | |||||||||||||||||||||||||
USD bonds | 3.8 - 7.8 | % | 5.6 | % | 2,958 | — | 2,958 | 2,059 | 13.7 | 3,198 | ||||||||||||||||||||||
Convertible debentures | 12 | |||||||||||||||||||||||||||||||
Private financing | 2 | |||||||||||||||||||||||||||||||
Intercompany financing | 0.0 - 2.3 | % | 0.7 | % | 2,296 | 2,296 | — | — | 0.6 | 442 | ||||||||||||||||||||||
Bank borrowings | 1.5 - 2.2 | % | 1.9 | % | 450 | 250 | 200 | 200 | 3.6 | 450 | ||||||||||||||||||||||
Other long-term debt | 1.8 - 19.0 | % | 4.5 | % | 47 | 47 | — | — | 1.0 | 49 | ||||||||||||||||||||||
|
| |||||||||||||||||||||||||||||||
| 5,751 | 2,593 | 3,158 | 2,259 | 4,153 | ||||||||||||||||||||||||||||
Corresponding data previous year | 4,153 | 614 | 3,539 | 3,289 | 4,030 | |||||||||||||||||||||||||||
Long-term debtin millions of EUR, unless otherwise stated
2015 - 2016
|
| |||||||||||||||||||||||||||||||
| (range of) interest rates | average interest rate | amount outstanding in 2016 | amount due in 1 year | amount due year | amount due after 5 years | average remaining term (in years) | amount outstanding in 2015 | |||||||||||||||||||||||||
|
| |||||||||||||||||||||||||||||||
USD bonds | 3.8 - 7.8 | % | 5.5 | % | 3,608 | 1,184 | 2,424 | 2,424 | 10 | 3,733 | ||||||||||||||||||||||
Intercompany financing | 0.6 - 4.3 | % | 3.2 | % | 584 | 584 | 1,660 | |||||||||||||||||||||||||
Bank borrowings | 0.9 - 1.1 | % | 1.1 | % | 200 | 22 | 178 | 3 | 200 | |||||||||||||||||||||||
Other long-term debt | 1.7 - 7.0 | % | 4.2 | % | 37 | 37 | 1 | 39 | ||||||||||||||||||||||||
|
| |||||||||||||||||||||||||||||||
| 4,429 | 1,827 | 2,602 | 2,424 | 5,632 | ||||||||||||||||||||||||||||
Corresponding data previous year | 5,632 | 1,699 | 3,933 | 2,795 | 6,623 | |||||||||||||||||||||||||||
|
| |||||||||||||||||||||||||||||||
The following amounts of the long-term debt as of December 31, 2013,2016, are due in the next five years:
Koninklijke Philips N.V.
2014 | 2,593 | |||
2015 | — | |||
2016 | — | |||
2017 | — | |||
2018 | 899 | |||
|
| |||
| 3,492 | ||||
Corresponding amount previous year | 864 |
Long-term debt due in the next five yearsin millions of EUR
2016
2017 | 1,827 | |||
2018 | 44 | |||
2019 | 44 | |||
2020 | 45 | |||
2021 | 45 | |||
|
| |||
Long-term debt | 2,005 | |||
Corresponding amount previous year | 2,837 | |||
|
|
In October 2016, the principal amounts of USD bonds due 2025, 2026, 2038 were partially redeemed, which involved an aggregated amount of USD 285 million. This resulted in financial charges of EUR 91 million paid in 2016.
In December 2016, Royal Philips delivered a notice of redemption to the holders of the outstanding 5.750% Notes due 2018 in the aggregate principal amount of USD 1,250 million for redemption in January 2017. This resulted in financial charges of EUR 62 million in 2016. Please refer tonote 18, Debt
For further information, refer tonote O, Subsequent events.
Short-term debt
Short-term debt includesmainly relates to the current portion of outstanding external and intercompany long-term debt of EUR 2,5931,827 million (2012:(2015: EUR 6141,699 million), other debt to group companies totaling EUR 10,97613,976 million (2012:(2015: EUR 11,01511,578 million) and short-term bank borrowings of EUR 767 million (2012:(2015: EUR 1131,245 million).
Koninklijke Philips N.V.
| 2012 | 2013 | |||||||
Income tax payable | 78 | 4 | ||||||
Other short-term liabilities | 538 | 53 | ||||||
Accrued expenses | 253 | 174 | ||||||
Derivative instruments—liabilities | 592 | 471 | ||||||
|
| |||||||
| 1,461 | 702 | |||||||
In 2012, Other short-termcurrent liabilities included a payable amountin millions of EUR 509 million related to a fine from the European Commission following an investigation into alleged violation of competition rules in the Cathode-Ray Tubes (CRT) industry. The payable amount represented the aggregate of EUR 313 million paid by the Company and EUR 196 million, being 50% of the fine related to LPD. This amount was paid in 2013 and is therefore reflected in the reduction of other short-term liabilities compared with 2012.
2015 - 2016
|
| |||||||
| 2015 | 2016 | |||||||
|
| |||||||
Other short-term liabilities | 59 | 12 | ||||||
Accrued expenses | 127 | 181 | ||||||
Derivative instruments—liabilities | 314 | 332 | ||||||
|
| |||||||
Other current liabilities | 500 | 525 | ||||||
|
| |||||||
Net income in 2013 amounted to a profit of EUR 1,169 million (2012: a loss of EUR 35 million). The increase of net results in 2013 compared to 2012 is especially due to the financial performance of affiliated companies.
The number of persons employed by the Company at year-end 2013 was 10 (2012: 10) and included the members of the Board of Management and certain leaders from functions, businesses and markets, together referred to as the Executive Committee.
For the remuneration of past and present members of both the Board of Management and the Supervisory Board, please refer to note 33, Information on remuneration, which is deemed incorporated and repeated herein by reference.
Contractual obligations and contingent liabilities not appearing in the balance sheet
PhilipsThe Company has entered into contracts with several venture capitalists where it committed itself to make, under certain conditions, capital contributions to their investment funds to an aggregated amount of EUR 4090 million (2012:(2015: EUR 4822 million) until June 30, 2021. As at December 31, 20132016 capital contributions already made to thesethis investment funds are recorded as available-for-saleavailable-for- sale financial assets within Othernon-current financial assets. Furthermore, Philips made commitments to third parties in 2013 of EUR 16 million (2012: EUR 25 million) with respect to sponsoring activities. The amounts are due before 2016.
General guarantees as referred to in Section 403, Book 2, of the Dutch Civil Code, have been given by the Company on behalf of several group companies in the Netherlands. The liabilities of these companies to third parties and investments in associates totaled EUR 1,2551,170 million as ofyear-end 2013 (2012: 2016 (2015: EUR 1,4161,374 million).
Guarantees totaling EUR 255667 million (2012:(2015: EUR 284698 million) have also been given on behalf of other group companies andcompanies. As at December 31, 2016 there have been no credit guarantees totaling EUR 15 million (2012: EUR 4 million)given on behalf of unconsolidated companies and third parties. parties (2015: nil).
The Company is the head of a fiscal unity that contains the most significant Dutch wholly-owned group companies. The Company is therefore jointly and severally liable for the tax liabilities of the tax entity as a whole. For additional information, please refer to
Annual Report 2016 201
Company financial statements 11.4

note 26,25, Contingent assets and liabilities, which is deemed incorporated and repeated herein by reference.
For a summary of the audit fees, please refer to the Group Financial statements, note 3, Income from operations, which is deemed incorporated and repeated herein by reference.
Dutch pension plan contributionNew credit facility
In January 2017, Philips entered into a USD 1 billion and EUR 300 million credit facility with a consortium of international banks. Under this credit facility Philips drew USD 1 billion in January; the facility was used for the early redemption of 5.750% Notes due 2018 in the aggregate principal amount of USD 1,250 million. The maturity date of the new facility is December 29, 2017, however Philips expects to prepay this facility in the course of 2017.
Offering of Philips Lighting shares
On July 1 2013,February 9, 2017 Royal Philips announced that it had reachedcompleted an agreement with the Dutch trade unions onaccelerated book build offering to institutional investors of 26 million shares in Philips Lighting at a new collective labor agreement that covers the period January 1, 2013 till December 31, 2014. The new agreement includes changesprice of EUR 23.40 per share realizing total proceeds of EUR 608 million. This transaction reduced Royal Philips’ stake in the plan rules and the funding agreement with the Dutch pension plan, which is the company’s largest Defined Benefit pension plan. The plan changes have become effective as of January 1, 2014 and the new funding agreement has been signed by the Trustees of the Dutch pension plan. Philips Lighting’s outstanding share capital from 71.225% to 53.892%.
As part of this transaction, Philips Lighting repurchased 3.5 million shares in the offering and intends to cancel these changes,shares. After cancellation of the 3.5 million shares that Philips agreedLighting has acquired in the offering, Royal Philips’ shareholding in Philips Lighting is expected to makerepresent 55.180% of Philips Lighting’s outstanding share capital.
Appropriation of profits and profit distributions
Pursuant to article 34 of the articles of association of the Company, a EUR 600 million contribution to the Dutch pension plan,dividend will first be declared on preference shares out of which EUR 240 million has been settled in cash on February 19, 2014. During 2014 and 2015, thenet income. The remainder of the considerationnet income, after reservations made with the approval of the Supervisory Board, shall be available for distribution to holders of common shares subject to shareholder approval afteryear-end. As of December 31, 2016, the issued share capital consists only of common shares. No preference shares have been issued. Article 33 of the articles of association of the Company gives the Board of Management the power to determine what portion of the net income shall be retained by way of reserve, subject to the approval of the Supervisory Board.
A proposal will be settled through the transfer of assets and cash proceeds from the sale of assets which are currently owned by Philips. The (majority of the) contribution will need to be written off through other comprehensive income duesubmitted to the asset ceiling restrictions2017 Annual General Meeting of Shareholders to pay a dividend of EUR 0.80 per common share, in cash or shares at the plan.option of the shareholders, against the net income of the Company for 2016.
202 Annual Report 2013 2212016
12 Company financial statements 12.5 - 12.511.5
Healthcare facility in Cleveland, Ohio
In our healthcare facility in Cleveland, Ohio, certain issues in the general area of manufacturing process controls were identified during an ongoing US Food and Drug Administration (FDA) inspection. To address these issues, on January 10 we started a voluntary, temporary suspension of new production at the facility, primarily to strengthen manufacturing process controls. Currently, there is no indication of product safety issues. This action is estimated to have a negative impact on the sector’s Adjusted IFO of approximately EUR 60 to 70 million in the first half of 2014, of which we expect to recover a substantial part in the second half of 2014.
Transfer of the remaining 30%-stake in TP Vision Holding to TPV Technology
On January 20, 2014 Philips announced that it has signed a term sheet to transfer the remaining 30% stake in the TP Vision venture to TPV Technology Limited. The signing of definitive agreements is expected to take place in the first quarter of 2014, with completion expected in the second half of 2014, subject to certain regulatory and TPV shareholder approvals. After completion, TPV will fully own TP Vision, which will enable further integration with TPV’s TV business.
The remaining 30% stake in the TP Vision venture will be transferred for a deferred purchase price and all outstanding loans and stand-by facilities between Philips and the TP Vision venture will be transferred to TPV. The brand license agreement between Philips and the TP Vision venture will remain in place, with an annual royalty of 2.2% of sales payable by the TP Vision venture to Philips. The minimum annual royalty has been reduced from EUR 50 million to EUR 40 million. The agreement includes a EUR 50 million transaction-related payment, which Philips has accounted for in the fourth quarter of 2013 under Results relating to investments in associates (see note 6, Interests in entities).
LTI coverage program
To cover Philips’ outstanding obligations resulting from past and present long-term incentive and employee stock purchase programs dating back to 2004, Philips will repurchase up to 12 million additional Philips shares on NYSE Euronext Amsterdam, to be executed during 2014. The shares repurchased will be held by Philips as treasury shares until they are distributed to participants.
Philips started this program as of January 28, 2014 and will enter into subsequent discretionary management agreements with one or more banks to repurchase Philips shares within the limits of relevant laws and regulations (in particular EC Regulation 2273/2003) and Philips’ articles of association. All transactions are published on Philips’ website (www.philips.com/investor) on a weekly basis.
The LTI coverage program is over and above the existing EUR 1.5 billion share repurchase program for cancellation purposes which started on October 21, 2013.
February 25, 2014
The Supervisory Board
The Board of Management
12.511.5 Independent auditor’s report—Companyreport
Independent auditor’s report
To theTo: The Supervisory Board and Shareholders of Koninklijke Philips N.V.:
Report on the Companyaudit of the financial statements 2016
Our opinion
We have audited the accompanying Company financial statements 2013 which are part of the financial statements2016 of Koninklijke Philips N.V. (the Company), based in Eindhoven, the Netherlands, and compriseNetherlands. The financial statements include the Company balance sheets as at December 31, 2013, the Company statements of income, and changes in equity for the year then ended and notes, comprising a summary of the accounting policies and other explanatory information in section 12 and 12.4.
Management’s responsibility
The Board of Management is responsible for the preparation and fair presentation of these Companyconsolidated financial statements and the preparation of the Management report, both in accordance with Part 9 of Book 2 of the Dutch Civil Code. Furthermore, management is responsible for such internal control as it determines is necessary to enable the preparation of the Company financial statements that are free from material misstatement, whether due to fraud or error.
Auditor’s responsibility
Our responsibility is to express an opinion on these Company financial statements based on our audit. We conducted our audit in accordance with Dutch law, including the Dutch Standards on Auditing. This requires that we comply with ethical requirements and plan and perform the audit to obtain reasonable assurance about whether the Company financial statements are free from material misstatement.
An audit involves performing procedures to obtain audit evidence about the amounts and disclosures in the Company financial statements. The procedures selected depend on the auditor’s judgment, including the assessment of the risks of material misstatement of the Company financial statements, whether due to fraud or error. In making those risk assessments, the auditor considers internal control relevant to the entity’s preparation and fair presentation of the Company financial statements in order to design audit procedures that are appropriate in the circumstances, but not for the purpose of expressing an opinion on the effectiveness of the entity’s internal control. An audit also includes evaluating the appropriateness of accounting policies used and the reasonableness of accounting estimates made by management, as well as evaluating the overall presentation of the Companycompany financial statements.
We believe that the audit evidence we have obtained is sufficient and appropriate to provide a basis for our audit opinion.
Opinion
In our opinion, opinion:
the Companyaccompanying consolidated financial statements give a true and fair view of the financial position of Koninklijke Philips N.V. as at December 31, 20132016 and of its result and its cash flows for 2016 in accordance with International Financial Reporting Standards as adopted by the European Union(EU-IFRS) and with Part 9 of Book 2 of the Dutch Civil Code;
the accompanying company financial statements give a true and fair view of the financial position of Koninklijke Philips N.V. as at December 31, 2016 and of its result for the year then ended2016 in accordance with Part 9 of Book 2 of the Dutch Civil Code.
The consolidated financial statements comprise:
the consolidated balance sheet as at December 31, 2016;
the following statements for 2016: the consolidated statements of income, comprehensive income, cash flows and changes in equity; and
the notes comprising a summary of the significant accounting policies and other explanatory information.
The company financial statements comprise:
the company balance sheet as at December 31, 2016;
the company statements of income and changes in equity for 2016; and
the notes comprising a summary of the accounting policies and other explanatory information.
Basis for our opinion
We conducted our audit in accordance with Dutch law, including the Dutch Standards on Auditing. Our responsibilities under those standards are further described in the ‘Our responsibilities for the audit of the financial statements’ section of our report.
We are independent of Koninklijke Philips N.V. in accordance with the “Verordening inzake de onafhankelijkheid van accountants bij assurance- opdrachten” (ViO, code of Ethics for Professional Accountants, a regulation with respect to independence) and other relevant independence regulations in the Netherlands. Furthermore, we have complied with the “Verordening gedrags- en beroepsregels accountants” (VGBA, Dutch Code of Ethics).
We believe the audit evidence we have obtained is sufficient and appropriate to provide a basis for our opinion.
Materiality
| Materiality | EUR 60 million | |
| Benchmark applied | 5% income before taxes | |
| Explanation | Based on our professional judgment we consider an earnings-based measure as the most appropriate basis to determine materiality. We have assessed the benchmark amount, taken into account the impact of certain items such as Philips Lighting separation costs and effects of certain claim settlements on income before taxes. Based on the actual result the materiality exceeds the initial planning materiality of EUR 60 million as set in the course of our planning phase. We continued to apply the materiality initially set. | |
We have also taken misstatements into account and/or possible misstatements that in our opinion are material for the users of the financial statements for qualitative reasons.
We agreed with the Supervisory Board that misstatements in excess of EUR 3 million, which are identified during the audit, would be reported to them, as well as smaller misstatements that in our view should be reported on qualitative grounds.
Scope of the group audit
Koninklijke Philips N.V. (the Company) is at the head of a group of entities. The consolidated financial statements of Koninklijke Philips N.V. represents the financial information of this group.
Following our assessment of the risk of material misstatement to Koninklijke Philips N.V.’s consolidated financial statements, we have selected 12 components which required an audit of the complete financial information (Full Scope Components) and 36 components requiring audit procedures on specific account balances or specified audit procedures that we considered had the potential for the greatest impact on the significant accounts in the financial statements either because of the size of these accounts or their risk profile (Specific- or Specified Scope Components). We performed audit procedures on certain accounting areas managed centrally, such as goodwill. In addition, the central team has been involved in the audit procedures on revenue recognition, tax and legal claims, litigation and contingencies.
Where this did not give adequate quantitative coverage of significant account balances, we used our judgment to scope additional procedures on account balances or requested the component auditors to perform additional specified procedures (Specified Procedures). As a result of our scoping of the complete
Annual Report 2016 203
Company financial statements 11.5
financial information, specific account balances and the performance of audit procedures at different levels in the organization, our actual coverage varies per account balance and the depth of our audit procedures per account balance varies depending on our risk assessment.
Of the remaining components, we performed selected other procedures, including analytical review and detailed testing to respond to any potential risks of material misstatements to the financial statements.
Accordingly, our audit coverage per account balance included in the key audit matters stated below, can be summarized as follows:
Goodwillin %
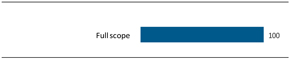
Deferred tax assetsin %
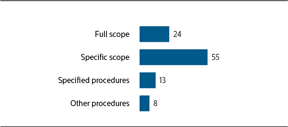
Other tax liabilityin %
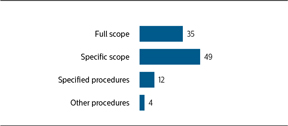
Legal claims, litigation and contingenciesin %
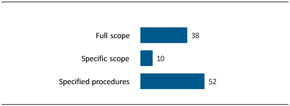
Revenuein %
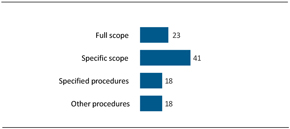
Involvement with component teams
Component materiality was determined by our judgment, based on the relative size of the component and our risk assessment. Component materiality did not exceed EUR 30 million and the majority of our component auditors applied a component materiality that is significantly less than this threshold.
Component auditors visited the Netherlands in 2016 to attend our global audit conference, to discuss the Group audit, risks, audit approach and instructions. In addition, we sent detailed instructions to all component auditors, covering the significant areas that should be covered and set out the information required to be reported to us. Based on our risk assessment, we visited component locations in the U.S.A., China, the Netherlands, Japan, Panama, Hong Kong, Germany, Russia, Italy, India, and Singapore. These visits encompassed some, or all, of the following activities:co-developing the significant risk area audit approach, reviewing key local working papers and conclusions, meeting with local and regional leadership teams, obtaining an understanding of key control processes including centralised entity level control processes and attending closing meetings. We interacted regularly with the component teams where appropriate during various stages of the audit, attended in person or via conference call, Full Scope Component and certain Specific Scope Component closing meetings, reviewed key working papers and were responsible for the scope and direction of the audit process. For the audit of Lumileds and the Automotive businesses, classified as discontinued operations, we have used the work ofnon-EY auditors.
By performing the procedures mentioned above at group entities, together with additional procedures at group level, we have been able to obtain sufficient and appropriate audit evidence about the Group’s financial information to provide an opinion on the consolidated financial statements.
Our key audit matters
Key audit matters are those matters that, in our professional judgment, were of most significance in our audit of the financial statements. We have communicated the key audit matters to the Supervisory Board. The key audit matters are not a comprehensive reflection of all matters discussed.
Key audit matters were addressed in the context of our audit of the financial statements as a whole and in forming our opinion thereon, and we do not provide a separate opinion on these matters.
204 Annual Report 2016
Company financial statements 11.5
Company separation
| Key audit matter | In 2016 the Company established two separate entities focused on HealthTech and Lighting. To accomplish the separation, businesses, assets and liabilities of Lighting have been transferred from HealthTech legal entities to new or existing Lighting legal entities and vice versa. This occurred through several legal transaction steps, including local business transfers and legal demergers. Following the separation, the reporting structure of the Company changed resulting into revised segment reporting. At the same time, the former Innovation, Group Services segment was split and allocated between Philips and Philips Lighting. There is an increased risk in relation to the proper accounting of the separation, such as the impact of potential local tax consequences, completeness and measurement of transaction costs as expenses and correct allocation of Innovation, Group Services segment to the new segments. Further reference is made tonote 5, Interests in entities. | |
| Our audit approach | Our audit procedures included, amongst others, meetings with project management to understand the separation process and its impact on the Company’s assets, liabilities and equity. Furthermore we assessed the appropriateness of the accounting of the separation and the related transaction costs based on supporting documentation, including the master separation agreement and underlying service level agreements. We also verified the reconciliation of the total assets and liabilities to the allocated assets and liabilities per the respective entities and segments and tested the appropriate accounting of the separation based on the local business transfer agreement. We assessed the impact of the separation on (deferred) tax positions as part of our audit procedures on these accounts as further detailed in the related key audit matter below. | |
Valuation of goodwill
| Key audit matter | At December 31, 2016, the total carrying value of goodwill amounted to EUR 8,898 million, representing 27.5% of the group’s total assets. Goodwill is allocated to (groups of) Cash Generating Units (CGU’s) for which management is required to test the carrying value of goodwill for impairment annually or more frequently if there is a triggering event for testing. We focused on this area given the significant judgement and complexity of valuation methodologies used to determine whether the carrying value of goodwill is appropriate, which includes the assumptions used within models to support the recoverable amount of goodwill. Further reference is made tonote 11, Goodwill. | |
| Our audit approach | As part of our audit we assessed and tested the assumptions, methodologies and data used by the Company in their valuation model, by comparing them to external data such as expected inflation rates, discount rates and implied growth rates. Additionally, we validated that the cash flow projections used in the valuation are consistent with the information approved by the Executive Committee and have evaluated the historical accuracy of management’s estimates that drive the assessment, such as business plans and expected growth rates. We performed sensitivity analysis by stress testing key assumptions in the model to consider the degree to which these assumptions would need to change before an impairment charge would have to be recognized. We included in our team a valuation expert to assist us in these audit activities. These procedures were performed for all CGU’s. | |
| Our main focus was on the CGU’s Sleep & Respiratory Care (Personal Health businesses), Image Guided Therapy (Diagnosis & Treatment businesses), Patient Care & Monitoring Solutions (Connected Care & Health Informatics businesses) and Professional (Lighting) as these represent the majority of the goodwill balance of the Group at December 31, 2016. | ||
We have also tested the effectiveness of the Company’s internal controls around the valuation of goodwill. We also assessed the adequacy of the Company’s disclosure around goodwill as included innote 11, Goodwill. | ||
Annual Report 2016 205
Company financial statements 11.5
Taxes - Valuation of deferred tax assets and liability for tax risks
| Key audit matter | The accounting for deferred tax assets and tax risk liabilities were significant to our audit since the Company has extensive international operations and makes judgements and estimates in relation to the realization of deferred tax assets and tax risk positions resulting in the recognition of other tax liabilities. In addition to the assessment of the realization of deferred tax assets and recognition of tax liabilities in the normal course of business, the value of the deferred tax assets and liabilities is also impacted by the Philips Lighting separation. | |
| At December 31, 2016, the deferred tax assets are valued at EUR 2,792 million and the other tax liability related to tax risks is valued at EUR 395 million. Further reference is made tonote 8, Income taxes andnote 22, Other liabilities. | ||
| Our audit approach | With the involvement of our tax experts we evaluated the tax accounting in various jurisdictions in which the Company operates, taking into account the impact of the local tax jurisdiction and including effects resulting from the separation. | |
| With regard to deferred tax assets, we tested management’s assumptions used to determine the probability that deferred tax assets recognized in the balance sheet will be recovered. This is based upon forecasted taxable income in the countries where the deferred tax assets originated and the periods when the deferred tax assets can be utilized. We used, amongst others, forecasts and tax laws. The forecasts were evaluated by us and we assessed the historical accuracy of management’s assumptions. | ||
| We evaluated and challenged the Company’s judgements in respect of estimates of tax exposures, considering ongoing local tax authority audits, legislative developments and relevant historical and recent judgements. We tested the Company’s internal controls around the recording and continuousre-assessment of the deferred tax assets and tax liabilities. | ||
We compared information provided by management to corroborative or contradictory information where possible, such as previous history in certain countries. We also assessed the adequacy of the Company’s disclosures included innote 8, Income taxes andnote 22, Other liabilities. | ||
Revenue recognition – multiple element sales contracts and sales promotions
| Key audit matter | Sales contracts for certain transactions primarily entered into in the Diagnosis & Treatment businesses and the Connected Care & Health Informatics businesses involve multiple elements. Those multiple elements, or separately identifiable components, are recognized based on their relative fair value and achievement of revenue recognition criteria. This gives rise to the risk that sales could be misstated due to the complexity of the multi-element contracts and the incorrect determination of the relative fair value elements and timing of the related revenue recognition. | |
| In addition, primarily in the Personal Health businesses the Company has sales promotions related agreements with distributors and retailers whereby discounts and rebates are provided according to the quantity of goods sold and promotional and marketing activity performed. The agreements of these sales promotions can include a number of characteristics that require judgement to be applied in determining the appropriate accounting treatment based on the terms of respective agreements. Management must estimate the sales related accruals (rebates, marketing and promotional support, coupon and stock protection) as at the balance sheet date based on forecast information over the term of the promotion. There may also be incentives to change the timing of when sales related accruals within the Personal Health businesses are recognized to meet internal targets. Further reference is made tonote 2, Information by segment and main country. | ||
| Our audit approach | Our audit procedures included, amongst others, assessing the appropriateness of the Company’s revenue recognition accounting policies and testing the effectiveness of the Company’s controls over the fair value determination of multi-element sales contracts and sales promotions to assess the correct value and timing of revenue recognition. Furthermore, we assessed the accuracy of the sales recorded by inspection of selected sales contracts, external confirmations, review of installation hours reported after recognition of revenue and inspection of hand over certificates. | |
With respect to the sales related accruals, our procedures included testing management’s controls around the completeness and accuracy of the sales promotions agreements recognized in the accounting system, challenging management’s assumptions used in determining the sales related accruals through discussions with management and performing specific substantive procedures, including: - On a sample basis agreed the recorded amounts to contractual evidence; - Performed a retrospective review of actual expenses verifying there were no significant differences to prior period sales related accruals; and - Testedcut-off through assessing the sales promotion obligations around theyear-end. | ||
We also assessed the adequacy of the sales disclosures contained innote 2, Information by segment and main country. | ||
206 Annual Report 2016
Company financial statements 11.5
Contingent liabilities and provisions from (legal) claims, proceedings and investigations | ||
| Key audit matter | The Company and certain of its group companies and former group companies are involved as a party in legal proceedings, including regulatory and other governmental proceedings as well as investigations by authorities, such as for example the patent infringement lawsuit by Masimo Corporation, several CRT antitrust litigations and a civil matter with the US Department of Justice relating to the external defibrillator business in the US. | |
| This area is significant to our audit, since the accounting and disclosure for (contingent) legal liabilities is complex and judgmental (due to the difficulty in predicting the outcome of the matter and estimating the potential impact if the outcome is unfavorable), and the amounts involved are, or can be, material to the financial statements as a whole. Further reference is made tonote 19, Provisions andnote 25, Contingent assets and liabilities. | ||
| Our audit approach | Our audit procedures included, amongst others, testing the effectiveness of the Company’s internal controls around the identification and evaluation of claims, proceedings and investigations at different levels in the group, and the recording and continuousre-assessment of the related (contingent) liabilities and provisions and disclosures. We inquired with both legal and financial staff in respect of ongoing investigations or claims, proceedings and investigations, inspected relevant correspondence, inspected the minutes of the meetings of the Audit Committee, Supervisory Board and Executive Committee, requested a confirmation letter from the group’sin-house legal counsel and obtained external legal confirmation letters from a selection of external legal counsels. For claims settled during the year, such as Medsage and Masimo, we vouched the cash payments, as appropriate and read the related settlement agreements in order to verify whether the settlements were properly accounted for. | |
We also assessed the adequacy of Company’s disclosure regarding (contingent) liabilities from legal proceedings and investigations as contained innote 19, Provisions andnote 25, Contingent assets and liabilities. | ||
Accounting for Discontinued operations
| Key audit matter | Following the planned sale of the majority interest of Lumileds and future sell-down of Philips Lighting shares, the accounting of discontinued operations has been an attention area in our audit. The Lumileds business is accounted for as discontinued operation since the fourth quarter of 2014 and Philips Lighting could potentially become a discontinued operation once loss of control is highly probable in the near future. Further reference is made tonote 3, Discontinued operations and other assets classified as held for sale. | |
| Our audit approach | Our audit procedures included, amongst others, testing the effectiveness of the Company’s internal controls around the appropriate accounting, assessing the appropriateness of the Company’s accounting policies in relation to discontinued operations and assessment of compliance with the respective accounting policies. We met with the Board of Management and Audit Committee of the Supervisory Board and other executive management representatives on a regular basis to understand the status of the planned sale of the majority interest of Lumileds and the future sell-down of Philips Lighting shares. We assessed management’s evaluation of continued classification as discontinued operations of Lumileds and the accounting of Lighting including the adequacy of Company’s disclosure included innote 3, Discontinued operations and other assets classified as held for sale. | |
Initial audit engagement
| Key audit matter | There are additional considerations involved in performing initial audit engagements. Additional planning activities and considerations are required to establish an appropriate audit strategy and audit plan. | |
| Our audit approach | After being appointed as the Company’s auditors effective for the year 2016, we developed a comprehensive transition plan in October 2015, which included specific planning activities, to ensure an effective transition from the predecessor auditor. The specific planning activities included, but were not limited to, obtaining an initial understanding of the Company and its business, including background information, strategy, business risks, IT landscape and its financial reporting and internal controls framework, to assist us in performing our risk assessment procedures. We have assessed the opening balances and the selection and consistent application of accounting policies by discussing the audit with the predecessor auditor and reviewing the predecessor auditor’s file. Furthermore, in January 2016, we attended closing meetings and Audit Committee meetings related to the 2015 audit. The foregoing has been used as a basis for our 2016 audit plan. We discussed and agreed our 2016 audit plan with the Audit Committee and Executive Committee of Koninklijke Philips N.V. in April 2016 and have provided status updates, progress reports and key audit matters from our audit process on a regular basis. | |
Report on other information included in the annual report
In addition to the financial statements and our auditor’s report thereon, the annual report contains other information that consists of:
The management board’s report
Other information pursuant to Part 9 of Book 2 of the Dutch Civil Code
Sustainability statements
Five year key financial and sustainability information
Investor relations information
Annual Report 2016 207
Company financial statements 11.5
Based on the following procedures performed, we conclude that the other information:
Is consistent with the financial statements and does not contain material misstatements
Contains the information as required by Part 9 of Book 2 of the Dutch Civil Code
We have read the other information. Based on our knowledge and understanding obtained through our audit of the financial statements or otherwise, we have considered whether the other information contains material misstatements. By performing these procedures, we comply with the requirements of Part 9 of Book 2 of the Dutch Civil Code and the Dutch Standard 720. The scope of the procedures performed on the other information is less than the scope of those performed in our audit of the financial statements.
Management is responsible for the preparation of the other information, including the management board’s report in accordance with Part 9 of Book 2 of the Dutch Civil Code and other information pursuant to Part 9 of Book 2 of the Dutch Civil Code.
Report on other legal and regulatory requirements
Pursuant toEngagement
Following the legal requirements under Section 2:393 sub 5 at e and fappointment by the Annual General Meeting of Shareholders on May 7, 2015, we were engaged by the Supervisory Board on October 22, 2015 as auditor of Koninklijke Philips N.V. as of the Dutch Civil Code, weaudit for the year 2016 and have no deficiencies to reportoperated as a resultstatutory auditor since that date.
Description of our examination whetherresponsibilities for the financial statements
Responsibilities of the Board of Management report as defined inand the introduction paragraphSupervisory Board for the financial statements
The Board of section 11 GroupManagement is responsible for the preparation and fair presentation of the financial statements to the extent we can assess, has been prepared in accordance withEU-IFRS and Part 9 of Book 2 of this Code,the Dutch Civil Code. Furthermore, the Board of Management is responsible for such internal control as the Board of Management determines is necessary to enable the preparation of the financial statements that are free from material misstatement, whether due to fraud or error.
As part of the preparation of the financial statements, management is responsible for assessing the Company’s ability to continue as a going concern. Based on the financial reporting frameworks mentioned, the Board of Management should prepare the financial statements using the going concern basis of accounting unless the Board of Management either intends to liquidate the Company or to cease operations, or has no realistic alternative but to do so. The Board of Management should disclose events and whethercircumstances that may cast significant doubt on the informationCompany’s ability to continue as required under Section 2:392 sub 1 at b - ha going concern in the financial statements.
The Supervisory Board is responsible for overseeing the Company’s financial reporting process.
Our responsibilities for the audit of the financial statements
Our objective is to plan and perform the audit assignment in a manner that allows us to obtain sufficient and appropriate audit evidence for our opinion.
Our audit has been annexed. Further,performed with a high, but not absolute, level of assurance, which means we reportmay not have detected all material errors and fraud.
Misstatements can arise from fraud or error and are considered material if, individually or in the aggregate, they could reasonably be expected to influence the economic decisions of users taken on the basis of these financial statements. The materiality affects the nature, timing and extent of our audit procedures and the evaluation of the effect of identified misstatements on our opinion.
We have exercised professional judgment and have maintained professional scepticism throughout the audit, in accordance with Dutch Standards on Auditing, ethical requirements and independence requirements.
Our audit included:
Identifying and assessing the risks of material misstatement of the financial statements, whether due to fraud or error, designing and performing audit procedures responsive to those risks, and obtaining audit evidence that is sufficient and appropriate to provide a basis for our opinion. The risk of not detecting a material misstatement resulting from fraud is higher than for one resulting from error, as fraud may involve collusion, forgery, intentional omissions, misrepresentations, or the Managementoverride of internal control.
Obtaining an understanding of internal control relevant to the audit in order to design audit procedures that are appropriate in the circumstances.
Evaluating the appropriateness of accounting policies used and the reasonableness of accounting estimates and related disclosures made by management.
Concluding on the appropriateness of management’s use of the going concern basis of accounting, and based on the audit evidence obtained, whether a material uncertainty exists related to events or conditions that may cast significant doubt on the Company’s ability to continue as a going concern. If we conclude that a material uncertainty exists, we are required to draw attention in our auditor’s report to the extent we can assess, is consistent withrelated disclosures in the financial statements or,
208 Annual Report 2016
Company financial statements as required by Section 2:391 sub 411.5
| if such disclosures are inadequate, to modify our opinion. Our conclusions are based on the audit evidence obtained up to the date of our auditor’s report. However, future events or conditions may cause a company to cease to continue as a going concern. |
Evaluating the overall presentation, structure and content of the Dutch Civil Code.financial statements, including the disclosures.
Evaluating whether the financial statements represent the underlying transactions and events in a manner that achieves fair presentation.
Because we are ultimately responsible for the opinion, we are also responsible for directing, supervising and performing the group audit. In this respect we have determined the nature and extent of the audit procedures to be carried out for group entities. Depending on the size and/or the risk profile, the organisation of the group and the effectiveness of group-wide controls, changes in the business environment and other relevant factors, we selected group entities for which an audit or review had to be carried out on the complete set of financial information or specific items.
We communicate with the Supervisory Board regarding, among other matters, the planned scope and timing of the audit and significant audit findings, including any significant findings in internal control that we identify during our audit.
We provide the Supervisory Board with a statement that we have complied with relevant ethical requirements regarding independence, and to communicate with them all relationships and other matters that may reasonably be thought to bear on our independence, and where applicable, related safeguards.
From the matters communicated with the Supervisory Board, we determine those matters that were of most significance in the audit of the financial statements of the current period and are therefore the key audit matters. We describe these matters in our auditor’s report unless law or regulation precludes public disclosure about the matter or when, in extremely rare circumstances, not communicating the matter is in the public interest.
Amsterdam, The Netherlands
February��25, 2014February 21, 2017
KPMGErnst & Young Accountants N.V.LLP
J.F.C. van Everdingen RA/s/ C.B. Boogaart
222 Annual Report 20132016 209
13 SustainabilityCompany financial statements 13 - 1312
1312 Sustainability statements
12.1 Approach to sustainability reporting
Philips has a long tradition of sustainability reporting, beginning in 1999 when we publishedwith our first environmental annual report.Annual Report published in 1999. This was expanded in 2003, with the launch of our first sustainability annual report, which provided details of our social and economic performanceAnnual Report. As a next step, in addition to our environmental results.
In 2008, we decided to publish an integrated financial, social and environmental report, reflectingreport. For more information, please refer to the progress we have made embedding sustainability in our way of doing business. This is also supported by the inclusion of sustainability in the Philips Mission, Vision and the company strategy.company’s website.
This is our sixthninth annual integrated financial, social and environmental report.report which has been prepared in line with the International Integrated Reporting Council (IIRC) Integrated Reporting (IR) framework and includes a visualization of ourvalue creation process.
Philips Lighting’s results are consolidated in this report but are also available in their Annual Report.
Royal Philips and Philips Lighting publish their integrated Annual Report with the highest (reasonable) assurance level on the financial, social and environmental performance. With that overall reasonable assurance level Philips is a frontrunner in this field.
12.1.1 Tracking trends
We continuously follow external trends continuously to determine the issues most relevant for our company and those where we can make a positive contribution to society at large. In addition to our own research, we make use of a variety of sources, including the United Nations Environmental Programme (UNEP), World Bank, World Economic Forum, World Health Organization, and the World Business Council for Sustainable Development (WBCSD), World Economic Forum and World Health Organization.. Our work also involves tracking topics of concern to governments,non-governmental organizations (NGO), regulatory bodies, academia, and non-governmental organizations, and following the resulting media coverage.
12.1.2 Stakeholders
We seek to engagederive significant value from our diverse stakeholders across all our activities and engage with, listen to gain their feedback on specific areas of our business.and learn from them. Working in partnerships is crucial in delivering on our vision to make the world healthier and more sustainable through innovation. We incorporate their feedback on specific areas of our business into our planning and actions. In addition, to engagement with our customers, our suppliers, employees, local communities and governments, we participate in meetings and task forces as a member of organizations including the WBCSD, World Economic Forum, WBCSD, Electronic Industry Citizenship Coalition (EICC), Carbon Disclosure Project Supply Chain, European Committee of Domestic Equipment Manufacturers (CECED), Federation of National Manufacturers Associations for Luminaires and Electrotechnical Components for Luminaires in the European Union (CELMA), European Coordination Committee of the Radiological, Electromedical and Healthcare IT Industry (COCIR), Digital Europe, European Lamp Companies Federation (ELC), European Roundtable of Industrialists (ERT), National Electrical Manufacturers Association (NEMA), Environmental Leadership Council of the Information Technology Industry Council (ELC ITIC), Consumer Electronics Association (CEA), Association of Home Appliance Manufacturers (AHAM), Healthcare Plastics Recycling Council (HPRC) and the Ellen MacArthur Foundation.Foundation, and the European Partnership for Responsible Minerals.
A multi-stakeholder project with the Sustainable Trade Initiative (IDH), a number of NGOs, and electronicelectronics companies was started in 2011 and continuedexpanded in 2013.2014 and 2015 to include suppliers in the Yangtze river delta. The program focuses on improving working circumstancesconditions in the electronics industry in China.
Furthermore, we engaged with the leading Dutch labor union (FNV) and a number of NGOs, including Enough, GoodElectronics, MakeITfair, the Chinese Institute of Public and Environmental Affairs, SOMO, Amnesty International, Greenpeace and Friends of the Earth.Earth as well as a variety of investors and analysts.
Our sustainabilitye-mail account(philips.sustainability@philips.com) enables stakeholders to share their issues, comments and questions with the sustainability team. The table below provides an overview of the different stakeholder groups, examples of those stakeholders and the topics discussed, used for our materiality analysis.
Stakeholder overview(non-exhaustive)
Examples | Processes | |||
| Employees | - European Works Council - Individual employees | Regular meetings, quarterly My Accelerate! Surveys, employee development process, quarterly update webinars. For more information refer tosection 2.2, Social performance, of this report. | ||
| Customers | - Hospitals - Retailers - Consumers | Joint (research) projects, business development, Lean value chain projects, consumer panels, Net Promoter Scores, Philips Customer Care centers, Training centers, social media | ||
| Suppliers | - Chinese suppliers in the Supplier Development program - HP, Randstad | Supplier development activities (including topical training sessions), supplier forums, supplier website, participation in industry working groups like COCIR and EICC. For more information refer tosub-section 12.3.8, Supplier indicators, of this report. | ||
Governments, municipalities, etc. | - European Union - Authorities in Indonesia, Singapore | Topical meetings, annual Innovation Experience, research projects, policy and legislative developments, business development | ||
| NGOs | - UNICEF, International Red Cross - Friends of the Earth, Greenpeace | Topical meetings, cross-segment (multi-stakeholder) projects, joint (research) projects, social investment program and Philips Foundation | ||
| Investors | - Mainstream investors - ESG investors | Webinars, roadshows, capital markets day,investor relations andsustainability accounts | ||
210 Annual Report 2016
Sustainability statements 12.1.3
12.1.3 Reporting standards
In thisWe have prepared the integrated annual report we have followed relevant best practice standards and international guidelines while reporting on our sustainability performance. Most important are the Global Reporting Initiative’s (GRI) new G4 Sustainability Reporting Guidelines as well asin line with the International Integrated Reporting Council (IIRC) Integrated Reporting <IR> framework.framework.
For the sustainability information included in the integrated annual report we followed the Global Reporting Initiative (GRI) Standards-Option Comprehensive. A detailed overview of the G4GRI Comprehensive Indicators is provided at the end of this section.
Sustainability is integrated in our company strategy and embeddedindicators can be found in the organization. We have tried to reflectGRI content index on oursustainability website. Next, we developed additional company specific indicators. The information on definition and measurement can be found in this “integrated thinking” while writing this report, in line with the <IR> framework.chapter.
We signed on to the United Nations Global Compact in March 2007 joining thousands of companies from all regions of the world as well as international labor and civil society organizations to advance 10 universal principles in the areas of human rights, labor, the environment and anti- corruption. Our General Business Principles, Sustainability and Environmental Policies, and our Supplier Sustainability Declaration are the cornerstones that enable us to live up to the standards set by the Global Compact. This is closely monitored and reported, as illustrated throughout this report, which is also our annual Communication on Progress (COP) submitted to the UN Global Compact Office.
At the World Economic Forum in January 2017 Philips signed the Compact forResponsive and Responsible Leadership. The Compact is an initiative to promote and align the long-term sustainability of corporations and the long-term goals of society, with an inclusive approach for all stakeholders.
We use this report to communicate on our progress towards the relevant Sustainable Development Goals (SDGs), in particular SDG 3 (“Ensure healthy lives and promote well-being for all at all ages”) and SDG 12 (“Ensure sustainable consumption and production patterns”). Please refer tosub-section 12.3.7, Stakeholder Engagement, of this report for more details.
More information about Philips Lighting’s commitments to the SDGs can be found in their Annual Report.
12.1.4 Material aspectstopics and our focus
Based on ongoing trend analysis, stakeholder input and media analysis, weWe identify the key material aspects forenvironmental, social, and governance topics which have the greatest impact on our company from a sustainability perspective. We have mappedbusiness and the aspects in the table below, taking into account the:
greatest level of concern to society at largestakeholders along our value chain. Assessing these topics enables us to prioritize and stakeholders, versus
significance offocus upon the environmentalmost material topics and social impact on and by Philips through our operations and products/solutions.
This is a dynamic process, as we continuously monitor the world around us. We developeffectively address these in our policies and programsprograms.
Our materiality assessment is based on our findings.an ongoing trend analysis, media search, and stakeholder input. The results for Royal Philips are reflected in the materiality matrix below. Those for Philips Lighting can be found in the Philips Lighting Annual Report. The scores are based on Philips’ assessment. Our materiality assessment has been conducted in the context of the GRI Sustainable Reporting Standards and the results have been reviewed and approved by the Philips Sustainability Board. As a result of the exclusion of Philips Lighting, a number of aspects have changed in terms of materiality in the table below (compared to 2015), for example, health related aspects have become more material.
Annual Report 2013 2232016 211
13 Sustainability statements 13 - 1312.1.4
Materiality matrix
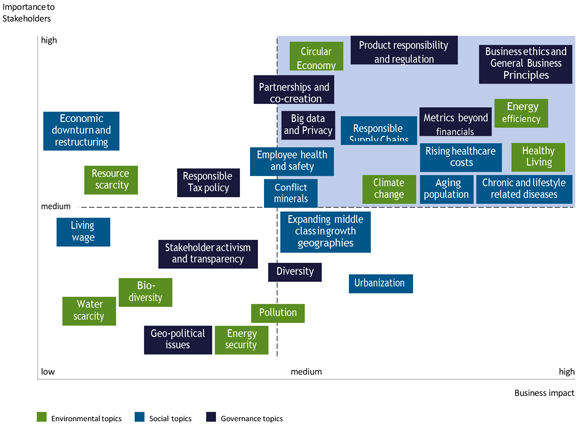
Key material aspectstopics
| Reference1) | ||||
Environmental | Boundaries | |||
- Climate change |
section
| Supply chain, operations, use phase | ||
- Energy efficiency |
section
| Supply chain, operations, use phase | ||
- | ||||
|
| Supply chain, operations, use phase | ||
212 Annual Report 2016
Sustainability statements 12.1.4
|
| |||||||
| ||||||||
| ||||||||
| Reference1) | ||||||||
Societal | Boundaries | |||||||
|
| |||||||
- Rising healthcare costs | chapter 1, Message from the CEO, of this report
| Use phase | ||||||
- Healthy Living | chapter 1, Message from the CEO, of this report sub-section 3.2.1, About Diagnosis & Treatment businesses, of this report sub-section 3.3.1, About Connected Care & Health Informatics businesses, of this report sub-section 3.1.1, About Personal Health businesses, of this report | Use phase | ||||||
- Chronic and lifestyle related diseases | chapter 1, Message from the CEO, of this report
sub-section 3.1.1, About Personal Health businesses, of this report | Use phase | ||||||
- | chapter 1, Message from the CEO, of this report
| |||||||
|
| Use phase | ||||||
- Responsible Supply Chains | section chapter | |||||||
|
| |||||||
|
| Supply chain | ||||||
- Employee health and safety | Supply chain, operations | |||||||
- | Supply chain | |||||||
224 Annual Report 2013
13 Sustainability statements 13 - 13
| Reference1) | ||||
Governance | Boundaries | |||
| ||||
- Business ethics and General Business Principles | section | |||
| sub-section
| |||
|
| Supply chain, operations, use phase | ||
- | sub-section
| Supply chain, | ||
- Metrics beyond financials | section section chapter | Supply chain, operations, use phase | ||
- Product responsibility and regulation | section sub-section sub-section sub-section | Supply chain, operations, use phase | ||
- | section sub-section sub-section 3.2.1, About Diagnosis & Treatment businesses, of this report sub-section 3.3.1, About Connected Care & Health Informatics businesses, of this report | |||
With the exception ofsection |
Annual Report 2016 213
Sustainability statements 12.1.5
12.1.5 Programs and targets
Our sustainabilityRoyal Philips HealthTech businesses
Sustainability commitments are grouped under the label EcoVision, comprising the following elements:
2016
| target 2015 | baseline year | |||||||
Green Product Sales | 50% of total sales | |||||||
Lives Improved | 2 billion | |||||||
Green Innovation | ||||||||
- Investments | EUR 2 billion (cumulative) | 2010 | ||||||
- Energy Efficiency | 49 Lumen/Watt (up 50%) | 2009 | ||||||
- Materials | ||||||||
- Collection & Recycling | 45,000 tonnes (up 100%) | 2009 | ||||||
- Recycled content | 15,000 tonnes (up 100%) | 2009 | ||||||
Green Operations | ||||||||
- CO2reduction | 40% | 2007 | ||||||
- Health & Safety |
| 0.26 Lost Workday Injury Cases per 100 FTE |
| |||||
Supplier Sustainability1) | 72% compliant | |||||||
| ||||||
| baseline year 2015 | target 2020 | 2016 actual | ||||
| ||||||
Lives Improved | 2.0 billion | 2.5 billion | 2.1 billion | |||
Circular revenues | 7% | 15% | 9% | |||
Green revenues | 56% | 70% | 59% | |||
Operational carbon footprint | 757 Ktonnes | 0 Ktonnes | 821 Ktonnes | |||
Operational waste recycling | 78% | 90% | 79% | |||
- Hazardous substances emissions | 1,419 kilos | 50% reduction | 1,099 kilos | |||
- Total Recordable Case (TRC) rate | 0.39 | 0.29 | 0.37 | |||
Supplier Sustainability | 33% RSL compliant | 85% RSL compliant | 59% RSL compliant | |||
Supplier Sustainability1) | New development program tested | 300 companies in development program | 93 companies in development program | |||
| ||||||
| 1) | For more information seesub-section |
With the new5-year ‘Healthy people, sustainable planet’ program, new sustainability commitments were introduced, more detailed targets can be found in the respective sections.
More details on the Philips Lighting sustainability program can be found in their report.
All of our programs are guided by the Philips General Business Principles, which provide the framework for all of our business decisions and actions.
12.1.6 Boundaries of sustainability reporting
Our sustainability performance reporting encompasses the consolidated Philips Group activities in the Social and Environmental Performance sections, following the consolidation criteria detailed in this section. As a result of impact assessments of our value chain we have identified the material topics, determined their relative impact in the value chain (supply chain, our own operations, and use phase of our products) and reportreported for each topic on the relevant parts of the value chain. More details on our impact are provided in the relevant sections.sections in these Sustainability Statements and in the Philips Lighting Investor Relationswebsite.
The consolidated selected financial information in this sustainability statements section has been derived from the Group Financial Statements, which are based on IFRS.
12.1.7 Comparability and completeness
We used expert opinions and estimates for some parts of the Key Performance Indicator calculations. There is therefore an inherent uncertainty in our calculations.
The figures reported are Philips’ best estimate. As our insight increases, we may enhance the methodology in the future.
TheSocial data cover all employees, including temporary employees, but exclude contract workers. Due to the implementation of new HRM systems, we are able to provide more specific exit information on Philips employees from 2014 onwards.
Until 2016, Philips reported on Green Product definition has changed in 2013 for Lighting; withsales. Due to the phase-out of incandescent lamps, the Eco Halogen lamp became the reference product for many lamps and was not includedchange in our businesses, we changed this in 2016 to Green Product sales any longer. This hadRevenues, which includes products and solutions (refer to the definition in 12.1.8). Revenues for 2014 and 2015 have been restated to reflect this change.
In 2016, emission factors for CO2 were not updated. In 2015 however, the emission factor set for consumed electricity was updated to the IEA 2015 publications. Also, the emission factors for natural gas were implemented according to DEFRA (UK Department of Environment, Food and Rural Affairs). Lastly, all scope 3 emission factors for business travel and logistics were updated from a downward impact on the Green Product sales of Lighting of some 4%. At the same time it was decidedbespoke emission factor set to include sustainable services provided by the business group Professional Lighting Solutions (PLS) in the Green Product definition Lighting. ThisDEFRA guidance as well. The latter has had an upward impact of 1,5%effect on our scope 3 emissions, ranging from 15% to 32% in the Green Product sales of this sector.years2007-2015.
The emissions of substances data is based on measurements and estimates at manufacturing site level. There is therefore an inherent uncertainty in our calculations. The figures reported are Philips’ best estimate. As our insight increases, we may enhance the methodology in the future.
IntegrationThe integration of newly acquired activities is scheduled according to a defined integration timetable (in principle, the first full reporting year after the year of acquisition) and subject to the integration agenda. Data for activities that are divested during the reporting year are not included in full-year reporting. Environmental data are reported for manufacturing sites with more than 50 industrial employees.
Social data cover all employees, including temporary employees, but exclude contract workers. Due to the implementation of new HRM systems, we are able to provide exit diversity information on Philips employees as from 2012. Historical comparisons may not be available, however.
Annual Report 2013 225
13 Sustainability statements 13 - 13
Health and safety data is reported for units with over 50 FTEs (full-time equivalents) and is voluntary for smaller units. New acquisitions must report, in principle, the first year after acquisition and subject to the integration agenda. Data for activities that are divested during the reporting year are not included in full-year reporting.
In line with the discontinuedDiscontinued operations presentation in the Group financial statements regarding the Audio, Video, MultimediaLumileds and Accessories (AVM&A)Automotive business, we have excluded the AVM&Athis data from the consolidated Sustainability data. Where the impact of the exclusion was material, we clearly disclosed the impact.
Prior-period financial statements have been restated for the treatment of Audio, Video, Multimedia and Accessories as discontinued operations and the adoption of IAS 19R, which mainly relates to accounting for pensions.
12.1.8 Data definitions and scope
Lives improved energy efficiency and materials
The key performance indicatorsKey Performance Indicators on ‘lives improved’, ‘energy efficiency’ and ‘materials’ and the scope are defined in the respective methodology documents that can be found at www.philips.com/sustainability.Methodology for calculating Lives Improved. We used opinions from Philips experts and estimates for some parts of the Lives Improved calculations. There is therefore an inherent uncertainty in our calculations. The figures reported are Philips’ best possible estimate.
214 Annual Report 2016
Sustainability statements 12.1.8
Health and safety
Health and safety data is reported by sites with over 50 FTEs (full-time equivalents) and is voluntary for smaller locations. Health and safety data are reported and validated each month via an online centralized IT tool. As of 2016, the Total Recordable Cases (TRC) rate is defined as a KPI, cases where the injured employee is unable to work one or more days, or had medical treatment or sustained an industrial illness. For data comparability reasons, we also provide the Lost Workday Injury Cases (LWIC) rate, work-related injuries and illnesses that predominantly occur in manufacturing operations and Field Services Organizations where the incident leads to at least one lost workday. Fatalities are reported for staff, contractors and visitors.
General Business Principles
Alleged GBP violations are registered in our intranet-based reporting and validation tool.
Supplier audits
Supplier audits are primarily focused on identified risk suppliers, based on identified risk countries and on a spend of more than EUR 1 million (new suppliers EUR 100,000 and no threshold for high risk suppliers).
Based on the Maplecroft Human Rights Risk Indexes, risk countries for Supply Management in 2016 were: Brazil, China, India, Indonesia, Mexico, Russia and Ukraine.
Suppliers of new ventures are included to the extent that the integration process of these ventures has been finalized. The normative integration period is two years after closure of the new venture.
Green ProductsRevenues
Green ProductsRevenues are revenues generated through products or solutions that offer a significant environmental improvement in one or more Green Focal Areas: Energy efficiency, Packaging, Hazardous substances, Weight, Recycling and disposalCircularity and Lifetime reliability. The life cyclelifecycle approach is used to determine a product’s overall environmental improvement. It calculates the environmental impact of a product over its total life cycle (raw materials, manufacturing, product use and disposal).
Green Productsproducts and solutions need to prove leadership in at least one Green Focal Area compared to industry standards, which is defined by a sector specific peer group. This is done either by outperforming reference products (which can be a competitor or predecessor product in the particular product family) by at least 10%, outperforming product-specificeco-requirements or by being awarded with a recognizedeco-performance label. Because of different product portfolios, sectorssegments have specified additional criteria for Green Products,products and solutions, including product-specific minimum requirements where relevant.
Circular Revenues
Circular Revenues are defined by revenues generated through products and solutions that meet specific Circular Economy requirements, for example by containing at least 30% recycled plastics (Personal Health), where Philips remains the owner, or where the product has been refurbished.
Sustainable Innovation
Sustainable Innovation is the Research & Development spend related to the development of new generations of products and solutions that address the United Nations Sustainable Development Goals 3 (“to ensure healthy lives and promote well-being for all at all ages”) or 12 (“to ensure sustainable consumption and production patterns”).
Green Innovation
Green Innovation compriseis a subset of Sustainable Innovation and is defined as all R&D activities directly contributing to the development of Green Products and Solutions or Green Technologies. A wide setTechnologies; it contributes to SDG 12. This means all products, systems or services that demonstrate a measurable positive impact on energy efficiency (10% or greater than previous products or legal requirements), and preferably also in one or more green focal areas: Circularity, Weight & Materials, Packaging, and Substances. Green Innovation for Lighting is calculated by multiplying the total R&D spend by percentages for sustainable innovation per Business Group (LED 100%, Professionals 95%, Home is 97% and Lamps 15%). These percentages are an assessment of additional criteriathe contribution of R&D projects to sustainable innovation and boundaries have been definedare calculated based on prior-year innovation budgets. As part of this assessment we applied the assumptions that the prior-year percentages are still applicable for this reporting year and that all innovation in LED andLED-related products and services are considered as the basis for internal and external validation.sustainable.
Environmental data
All environmental data from manufacturing operations, except process chemicals, are reported on a half-yearquarterly basis in our sustainability reporting and validation tool, according to defined company guidelines that include definitions, procedures and calculation methods. Process chemicals are reported on ahalf-yearly basis.
Internal validation processes are followedhave been implemented and peer audits performed to ensure consistent data quality and to assess the robustness of data reporting systems.
These environmental data from manufacturing are tracked and reported to measure progress against our Green operations programSustainable Operations targets.
Reporting on ISO 14001 certification is based on manufacturing units reporting in the sustainability reporting system.
Annual Report 2016 215
Sustainability statements 12.1.8
Operational carbon footprint
The Philips operational carbon footprint (Scope 1, 2 and 3) is calculated on a half-yearly basis and includes:
Industrial sites – manufacturing and assembly sites
Non-industrial sites – offices, warehouses, IT centers and R&D facilities
Business travel – lease and rental cars and airplane travel
Logistics – air, sea and road transport
All emission factors used to transform input data (for example, amount of tonne-kilometers transported) into CO2 emissions are fromreports in line with the Greenhouse Gas Protocol (GHGP), except for business travel, where the service providers supplied CO2 data based on their own verified methodology.. The GHGP distinguishes three scopes. It is mandatoryscopes, as described below. The GHGP requires businesses to report on the first two scopes to comply with the GHGP reporting standards. As per the updated GHGP Scope 2 reporting guidance, from 2015 onward our scope 2 emissions reporting includes both themarket-based method and the location-based method. The market-based method of reporting will serve as our reference for calculating our total operational carbon footprint.
| • | Scope 1 – direct CO2 emissions – is reported on in full, with details of direct emissions from our industrial andnon-industrial |
| • | Scope 2 – indirect CO2 emissions |
The location-based method of scope 2 reporting reflects the average emissions intensity of grids on which energy consumption occurs (using mostlygrid-average emission factor data). For this method our emission factors derive from the International Energy Agency (IEA) 2015 and are based on grid averages.
| • | The market-based method of scope 2 reporting allows use of an emission factor that is specific to the energy purchased. Emissions intensity of consumed energy can differ based on contractual instruments used. For example,so-called ‘green electricity contracts’ guarantee the purchaser will be supplied with electricity coming from renewable sources which typically lower emissions per energy unit generated. In the market-based method Philips will account for renewable electricity with an emission factor of 0 grams CO2 per kWh. All renewable electricity claimed by Philips is sourced from the same energy market where the electricity-consuming operations are located, and is tracked and redeemed, retired, or cancelled solely on behalf of Philips. All certificates were obtained through procurement ofGreen-e certified Renewable Energy Certificates (RECs) in the United States and European Guarantees of Origin from the Association of Issuing Bodies (AIB) of the European Energy Certificate System (EECS). |
| • | Scope 3 – other CO2 emissions related to activities not owned or controlled by the Group – is reported on for our business travel and distribution activities. |
HealthThe Philips operational carbon footprint (Scope 1, 2 and safety
Health3) is calculated on a quarterly basis and safety data are reported and validated monthly. The focus is on reporting work-related injuries, which predominantly occur in manufacturing operations. The annual number of cases leading to at least one lost workday is reported per 100 FTEs (full-time equivalents). Fatalities are reported for staff, contractors and visitors and include commuting accidents.
General Business Principles
Alleged GBP violations are registered in our intranet-based reporting and validation tool.
Supplier audits
Supplier audits are primarily focused on identified risk suppliers, based on identified risk countries and on spend of more than EUR 1 million (new suppliers EUR 100,000 and no threshold for high risk suppliers).includes the emissions from our:
Based on the Maplecroft Human Rights Risk Indexes, risk countries for Supply Management in 2013 were: Brazil, China, India, Indonesia, Mexico, Ukraine,Industrial sites – manufacturing and Vietnam.assembly sites
SuppliersNon-industrial sites – offices, warehouses, IT centers and R&D facilities
Business travel – lease and rental cars and airplane travel
Logistics – air, ocean and road transport
All emission factors used to transform input data (for example, amount of new ventures are includedtonne-kilometers transported) into CO2 emissions have been updated from the previously used DEFRA (UK Department for Environment, Food & Rural Affairs) 2007 and bespoke emission factors to the extent thatapplicable DEFRA 2015 emission factors for each year respectively. The total CO2 emission resulting from these calculations serve as input for scope 1, 2 and 3.
Commuting by our employees, upstream distribution (before suppliers ship to us), outsourced activities and emissions resulting from product use by our customers are not included in our operational carbon footprint. The calculations for business travel by lease car are based on actual fuel usage and for travel by rental car they are based on distance travelled. Taxis and chauffeur driven cars used for business travel are not included in the integration processcalculations. Emissions from business travel by airplane are calculated by the supplier based on mileage flown and emission factors from DEFRA, distinguishing between short, medium and long-haul flights. Furthermore, emissions from air freight for distribution are calculated based on the amount of these ventures has been finalized. Normative integration period is two years after closuretonne-kilometers transported between airports (distinguishing between short, medium and long-haul flights), including an estimate (based on actual data of the new venture.lanes with the largest volumes) for trucking from sites and distribution centers to airports and vice versa. Express shipments are generally a mix of road and air transport, depending on the distance.
It is therefore assumed that shipments across over less than 600 km are transported by road and the rest by air (those emissions by air are calculated in the same way as air freight). For sea transport, only data on transported volume were available so an estimate had to be made about the average weight of a container. Transportation to and from ports is not registered. This fore and aft part of sea transport was estimated to be around 3% of the total distance (based on actual data of the lanes with the largest volumes), consisting of a mix of modalities, and was added to the total emissions accordingly. CO2 emissions from road transport were also calculated based on tonne-kilometers. Return travel of vehicles is not included in the data for sea and road distribution.
216 �� Annual Report 2016
Sustainability statements 12.1.8
Employee Engagement Index (EEI)
The Employee Engagement Index (EEI) is the single measure of the overall level of employee engagement at Philips. It is a combination of perceptions and attitudes related to employee satisfaction, commitment and advocacy.
The reported 2016 figure is based on My Accelerate Survey in Royal Philips HealthTech businesses. This survey is conducted by Expert Training Systems (ETS). The total score of the employee engagement is an average of quarterly results of the survey. The results are calculated by taking the average of the answered questions of the surveys.
12.1.9 Sustainability governance
Sustainability is strongly embedded in our core business processes, like innovation (EcoDesign), sourcing (Supplier Sustainability Involvement Program), manufacturing (Green Manufacturing 2015)(Sustainable Operations) and Logistics (Green Logistics) and projects like the Circular Economy initiative.
TheIn Royal Philips, the Sustainability Board is the highest governing sustainability body in Philips,and is chaired by Jim Andrew,the Chief Strategy and Innovation Officer and member of the Executive Committee. Three other Executive Committee members sit inon the Sustainability Board
226 Annual Report 2013
13 Sustainability statements 13 - 13.2.1
jointly together with sectorsegment and functional executives. The Sustainability Board convenes four times per year, defines Philips’ sustainability strategy and programs, monitors progress and takes corrective action where needed.
Progress on Sustainability is communicated internally on a quarterly basis to Philips staffemployees and at least annually in the Executive Committee and Supervisory Board. Please refer to the Philips Lighting Annual Report to learn about their sustainability governance.
12.1.10 External assurance
KPMGEY has provided reasonable assurance on whether the information inchapter 13,12, Sustainability statements, of this report andsection 4.2,2.2, Social performance, of this report andsection 4.3,2.3, Environmental performance, of this report presents fairly, in all material respects, the sustainability performance in accordance with the reporting criteria. WePlease refer tosection 13.4, Independent assurance12.5, Assurance report of the independent auditor, of this report.
This section provides summarized information on contributions made on an accruals basis to the most important economic stakeholders as a basis to drive economic growth. For a full understanding of each of these indicators, see the specific financial statements and notes in this report.
Philips Group
Distribution of direct economic benefits
in millions of eurosEUR
2014 - 2016
|
| |||||||||||||||||||||||
| 2014 | 2015 | 2016 | ||||||||||||||||||||||
| 2011 | 2012 | 2013 |
|
| ||||||||||||||||||||
Suppliers: goods and services | 12,732 | 14,466 | 13,641 | 13,185 | 14,388 | 13,904 | ||||||||||||||||||
Employees: salaries and wages | 4,668 | 5,499 | 4,983 | 5,018 | 5,533 | 5,832 | ||||||||||||||||||
Shareholders: distribution from retained earnings | 711 | 687 | 678 | 729 | 730 | 732 | ||||||||||||||||||
Government: corporate income taxes | 251 | 185 | 466 | 26 | 239 | 327 | ||||||||||||||||||
Capital providers: net interest | 302 | 325 | 268 | 251 | 302 | 327 | ||||||||||||||||||
|
| |||||||||||||||||||||||
Total purchased goods and services as included in cost of sales amounted to EUR 13.613.9 billion, representing 58%57% of total revenues of the Philips Group. Of this amount, 70%approximately 69% was spent with global suppliers, the remainder with local suppliers. Compared to 2012, spending decreased significantly mainly as a result of Bill of Material savings.
In 2013, the2016, salaries and wages totaled EUR 4.985.8 billion. This amount is some EUR 500300 million lowerhigher than in 2012,2015, mainly caused by a reduction in headcountthe increased number of employees and lower restructuring costs.currency effects. Seenote 3,6, Income from operations for more information.
Dividend distributed toPhilips’ shareholders were given EUR 732 million in the form of a dividend, the cash portion of which amounted to EUR 678 million, comparable to 2012.330 million.
Income taxes amounted to EUR 466327 million, compared to EUR 185239 million in 2012.2015. The effective income tax rate was 28.1%, compared to 58.0% in 2012. Excludinglower than the non-tax-deductible European Commission fine and charges related to various legal matters in 2012, the effective tax rate in 2012 was 25.5%. The 2.6 percentage points increase in 2013 was mainly related to a higher weighted average statutory income tax rate in 20132016, mainly due to a change in the country mixrecognition of profitdeferred tax assets and loss, which wasnon-taxable income, largely attributable to favorable tax regulations relating to R&D investments. These effects were partly offset by lower valuation allowances.non-deductible expenses.
For a further understanding, seenote 5,8, Income taxes.taxes.
Philips supports global initiatives of the OECD (Organization for Economic Cooperation and Development) and UN (United Nations) to promote tax transparency and responsible tax management, taking into account the interest of various stakeholders, such as governments, shareholders, customers and the communities in which Philips operates. For more information, please refer toPhilips’ Tax Principles.
In 2016, both Royal Philips HealthTech businesses and Philips Lighting launched their next5-year sustainability programs. This section provides additional information on (some of) the socialSocial performance parameters reported insection 4.2,2.2, Social performance, of this reportreport.
13.2.112.3.1 Building employability
Other programs
At Philips, our vision to offer the best place to work for people who share our passion is not limited to employees on our payroll. In the Netherlands, for example, we run a special employment program, WGP
Annual Report 2016 217
Sustainability statements 12.3.1
(Werkgelegenheidsplan, or Philips Employment Scheme), to offer vulnerable groups of external jobseekers a work experience placement, usually combined with training. Since the scheme’s launch in 1983, nearly 13,000 people have participated, and around 70% found a regular job after taking part in the program. In 2016, Philips employed 140 people via the WGP program, including 25 people with autism. As we move into 2017, we will continue to offer an environment for all of our people to thrive and grow.
12.3.2 People development
Our talent development focuses on all aspects of the 70:20:10 learning framework.
70% Learning through critical career experiences
Philips is on a multi-year journey to evolve our culture to focus on experience-based career development, giving our people the opportunity to identify and gain the experiences necessary to support our health technology strategy and strengthen their employability. By identifying the roles and experiences critical to our business strategy, we clarify development areas and transferrable skills in support of cross-functional, lateral, traditional, as well asnon-traditional career opportunities for our people.
As of 2016, our people are able to view the succession plans in which they are included. In 2017 we will continue on our journey towards an experience-based careers culture through:
Enabling and empowering our people with real-time, integrated tools and resources to plan and manage their career
Building awareness of experience-based careers for our people through stories and communications, prioritizing critical roles and capabilities that are directly in support of our health technology strategy
Facilitated‘gig-board’ of extra-curricular roles to increase flexible teaming across organization structures and provide opportunity for further development within existing roles
20% Guidance through coaching and mentoring
In 2016, Philips University launched a program for leaders to help them get the most out of our people, help them grow, and have meaningful career conversations. In 2017 we will drive further initiatives focused on:
Strengthening theemployee-and-manager career partnership with clear accountabilities
Equipping managers as effective career coaches who will have transparent career dialogues with their team, with differentiated development for deep specialists and broad leaders
10% Learning through formal learning
In 2016, more than 1,900 new courses were made available by Philips University. Byyear-end, over 86,000 employees had enrolled for courses with Philips University. In total, some 1.2 million hours were spent on training through Philips University in 2016, with some 580,000 training completions.
12.3.3 Employee volunteering
In North America, thePhilips Cares program provides ways for employees to work together to improve people’s lives by creating healthy, sustainable communities. This can take many forms: from helping a child to excel in math, or providing safety and energy-efficient home improvements for the disadvantaged, to raising awareness about the importance of cardiac health. In 2016 alone, more than 9,500 employee volunteers participated in community outreach projects that suited their needs, schedules, and passions individually as well as through partnerships with organizations such as the American Heart Association, International Medical Equipment Collaborative (IMEC), and the March of Dimes.
Since Q4 2016, all of our employees are now able to take 1 day per year to support charitable endeavors through volunteering. For example, in the Benelux 70 of our people were trained in resuscitation (CPR) by the Dutch Hartstichting (heart foundation), enabling them to provide support in the critical first period of a cardiac arrest.
12.3.4 Health and Safety performance
In 2016, we recorded 174 LWIC, i.e. occupational injury cases where the injured person is unable to work one or more days after the injury. This represents a significant decrease compared with 213 in 2015. The LWIC rate decreased to 0.18 per 100 FTEs, compared with 0.21 in 2015. The number of Lost Workdays caused by injuries decreased by 1,253 days (16%) to 6,728 days in 2016.
Additionally, in 2016, we recorded 395 TRC’s, i.e. cases where the injured employee is unable to work one or more days, or had medical treatment or sustained an industrial illness.
In 2016, we focused our efforts not only on traditional process and equipment safety improvements, but also on a proactive cultural transformation through Behavior Based Safety (BBS). BBS requires a fundamental shift in how we think and act about Health and Safety before an injury occurs. Our new company program, based on an internal best practice, was deployed and implemented globally across many factories in 2016 including those in China, Asia Pacific and the USA. We believe this program will continue to drive down our workplace injuries and be a key pillar towards reaching our goal of a 25% reduction in total injuries by 2020.
218 Annual Report 2016
Sustainability statements 12.3.4
Philips Group
Lost workday injuriesper 100 FTEs
2012 - 2016
|
| |||||||||||||||||||
| 2012 | 2013 | 2014 | 2015 | 2016 | ||||||||||||||||
|
| |||||||||||||||||||
Personal Health | 0.39 | 0.33 | 0.16 | 0.16 | 0.15 | |||||||||||||||
Diagnosis & Treatment | 0.22 | 0.23 | 0.27 | 0.20 | 0.36 | |||||||||||||||
Connected Care & Health Informatics | 0.16 | 0.05 | 0.18 | 0.16 | 0.15 | |||||||||||||||
HealthTech Other | 0.14 | 0.12 | 0.11 | 0.13 | 0.10 | |||||||||||||||
Lighting | 0.47 | 0.42 | 0.37 | 0.34 | 0.22 | |||||||||||||||
Continuing operations | 0.31 | 0.27 | 0.23 | 0.21 | 0.18 | |||||||||||||||
Discontinued operations | 0.55 | 0.37 | 0.25 | 0.27 | 0.32 | |||||||||||||||
|
| |||||||||||||||||||
Philips Group | 0.31 | 0.28 | 0.23 | 0.22 | 0.19 | |||||||||||||||
|
| |||||||||||||||||||
Philips Group
Total recordable casesper 100 FTEs
2016
| 2016 | ||||
Personal Health | 0.33 | |||
Diagnosis & Treatment | 0.65 | |||
Connected Care & Health Informatics | 0.67 | |||
HealthTech Other | 0.27 | |||
Lighting | 0.50 | |||
Continuing operations | 0.41 | |||
Discontinued operations | 0.44 | |||
Philips Group | 0.41 | |||
Diagnosis & Treatment businesses
In the Diagnosis & Treatment businesses segment Health and Safety showed a decrease in performance in 2016 with 40 LWIC compared to 21 in 2015. The LWIC rate increased to 0.36 compared to 0.20 in 2015. The total number of recordable cases for the Diagnosis & Treatment businesses segment was 73 in 2016.
Connected Care & Health Informatics businesses
Health and Safety performance in the Connected Care & Health Informatics businesses segment continued to improve in 2016 with 5 LWIC in 2016 compared to 6 in 2015. Correspondingly, the LWIC rate decreased to 0.15 in 2016 compared to 0.16 in 2015. This was primarily driven by our global patient monitoring businesses. The total number of recordable cases for the Connected Care & Health Informatics businesses segment was 23 in 2016.
Personal Health businesses
The Personal Health businesses segment showed stable performance in Health and Safety with 21 LWIC in 2016, the same number as in 2015. The LWIC rate improved from 0.16 in 2015 to 0.15 in 2016. The Personal Health businesses segment had 46 recordable cases in 2016.
Lighting
Lighting showed an overall improvement while recording 71 LWIC compared to 119 in 2015. As a result the LWIC rate improved to 0.22 (0.34 in 2015). In 2016, Lighting had 156 reportable cases. Lighting introduced a new safety program in 2015 focusing on preventing injuries.
12.3.5 General Business Principles
The analysis is based upon 335A total of 503 concerns were reported over the course of 2016 via the formalPhilips Ethics Line and through our network of GBP procedureCompliance Officers, of which 164 related to Philips Lighting. The previous reporting period (2015) saw a total of 447 concerns, 135 of which related to Philips Lighting. Overall, we saw an increase of 13% in 2013 relating to alleged violationsthe total number of reports (11% for Royal Philips versus 21% for Philips Lighting).
This is a continuation of the upward trend reported since 2014, the year in which Philips updated its General Business Principles (GBP), compared to 374 in 2012.
The decreaseand deployed the related communication campaign, although the overall increase in the overallnumber of complaints reported has slightly declinedyear-on-year (2015: 14%). We believe this trend is in line with our multi-year efforts to encourage our employees to speak up, and we are now approaching a normalized level of reported concerns annually. The relatively larger increase in the number of concerns reportedthat relate to Philips Lighting is expected to relate, at least in part, to the separation event and the related corporate activities.
The upward trend in the number of concerns can mainlyprimarily be attributed to a decreasesignificantly more concerns being reported in the Americas. We see a slight decreaseNorth American (NA) region, making up 38% of the total number of reports in percentage2016 (2015: 31%). The number of reported concerns in North America, which accounted for 43% of all concerns (2012: 47%), and a continued decrease in concerns reported in Latin America (2013: 17%; 2012: 21%, 2011: 32%). Europe and the Middle East show a stable 15%once again declinedyear-on-year to 19% of the total number of reported concerns (2012: 15%). Only thecomplaints, compared with 25% in 2015. In percentage terms, Europe, Middle East & Africa (EMEA) and Asia Pacific (APAC) remained quite stable, representing 20% and 23% of the total number of complaints respectively (2015: 21% and 20%).
In keeping with a trend that became visible in 2015, we again saw a more even distribution in reporting across the four regions. While the Americas were historically dominant in terms of number of cases reported, EMEA and APAC have now reached the same level as Latin America. We believe this to be as a result of significant communication efforts in addition to our Global GBP Communications campaign, especially in the APAC region, which accounted for 25%improving employees’ awareness of all concerns, shows a notable and continuing increase in reports (2012: 18%). The continuing dominance in North America we believe is due to a corporate culture in which employees are very much aware of compliance issues, their rights with regard to the GBP, and the opportunities for reporting potential violations. The continuing increase facilities available to them.
Annual Report 2016 219
Sustainability statements 12.3.5
Philips Group
Breakdown of reported GBP concernsin the Asia Pacific region we believe is the consequencenumber of our efforts in that region to strengthen our corporate culture in the area of ethics and compliance.reports
2013 - 2016
|
| |||||||||||||||
| 2013 | 2014 | 2015 | 2016 | |||||||||||||
|
| |||||||||||||||
Health & Safety | 3 | 10 | 9 | 16 | ||||||||||||
Treatment of employees | 203 | 203 | 242 | 276 | ||||||||||||
- Collective bargaining | 5 | — | — | 2 | ||||||||||||
- Equal and fair treatment | 80 | 72 | 44 | 73 | ||||||||||||
- Employee development | 4 | — | 2 | 15 | ||||||||||||
- Employee privacy | 1 | 3 | 8 | 4 | ||||||||||||
- Employee relations | 5 | 6 | — | 20 | ||||||||||||
- Respectful treatment | 84 | 93 | 111 | 107 | ||||||||||||
- Remuneration | 15 | 11 | 9 | 11 | ||||||||||||
- Right to organize | — | — | — | — | ||||||||||||
- Working hours | 3 | 5 | 2 | 8 | ||||||||||||
- HR other | 6 | 13 | 66 | 36 | ||||||||||||
Legal | 9 | 30 | 35 | 32 | ||||||||||||
Business Integrity | 109 | 110 | 138 | 144 | ||||||||||||
Supply management | 5 | 6 | 6 | 13 | ||||||||||||
IT | 6 | 7 | 4 | 10 | ||||||||||||
Other | — | 27 | 13 | 12 | ||||||||||||
|
| |||||||||||||||
Total | 335 | 393 | 447 | 503 | ||||||||||||
|
| |||||||||||||||
Most common types of concerns reported concerns
Treatment of employees
TheAs in previous years, the most commoncommonly reported type of concern remains related to the category Treatment of employeesemployees. In 2016 there were 276 reports in this category, which represented 61% of all reports (2012:compared to 242 in 2015. This represents 55%). As in 2012, the vast majority of the Treatmenttotal number of employees concerns, (81%which is a slight increase from 2015 (54%) remains related to two issues –.
Two subcategories, Respectful treatment and Equal and fair treatment, and Respectful treatment.
Concerns regarding Equal and fair treatment – primarily favoritism, discrimination and unfair treatment – originated principally in the US. Ofmake up just over 65% of the concerns reported in the US, 39% related to equal and fair treatment, whereas that figure was 24% for Philips.
Most concerns regarding lackTreatment of employees. The Respectful treatment – primarilycategory generally relates to concerns about verbal abuse, (sexual) harassment, and hostile work environment – again comeenvironments. Equal and fair treatment primarily addresses favoritism, and matters of discrimination and unfair treatment in the workplace. 79% of the cases in these categories originated from the US. Of the concerns reportedAmericas, which is slightly more than in the US, 33% related to respectful treatment; compared to 25% for Philips as a whole.2015 (76%).
Business integrity
InThe second place, with 33%most reported type of concern relates to Business Integrity, which made up 29% of the total number of reports, arecases reported. This is slightly less than in 2015, when the percentage was 31%. These concerns reported inoriginated from the Business integrity category (2012: 32%APAC region (45%). Most concerns (60%, followed by EMEA (33%), Latin America (14%) in this category originate in the Asia Pacific region. Followed by the regionsand North America and Europe and Middle East (both 17%) and Latin America (7%(8%).
More information on these categories can be found in the GBP Directives on www.philips.com/gbp.
Breakdown of reported GBP concerns
| 2009 | 2010 | 2011 | 2012 | 2013 | ||||||||||||||||
Health & Safety | 6 | 3 | 2 | 11 | 3 | |||||||||||||||
|
| |||||||||||||||||||
Treatment of employees | 162 | 184 | 132 | 205 | 203 | |||||||||||||||
- Collective bargaining | — | 1 | — | 1 | 5 | |||||||||||||||
- Equal and fair treatment | 63 | 64 | 41 | 72 | 80 | |||||||||||||||
- Employee development | 3 | 1 | — | — | 4 | |||||||||||||||
- Employee privacy | 2 | 2 | 1 | 1 | 1 | |||||||||||||||
- Employee relations | 15 | 4 | 1 | 2 | 5 | |||||||||||||||
- Respectful treatment | 53 | 96 | 71 | 102 | 84 | |||||||||||||||
- Remuneration | 22 | 12 | 6 | 15 | 15 | |||||||||||||||
- Right to organize | — | — | — | 1 | — | |||||||||||||||
- Working hours | 4 | 4 | 2 | — | 3 | |||||||||||||||
- HR other | — | — | 10 | 11 | 6 | |||||||||||||||
|
| |||||||||||||||||||
Legal | 4 | 13 | 10 | 19 | 9 | |||||||||||||||
|
| |||||||||||||||||||
Business Integrity | 88 | 112 | 107 | 119 | 109 | |||||||||||||||
|
| |||||||||||||||||||
Supply management | 4 | 4 | 3 | 3 | 5 | |||||||||||||||
|
| |||||||||||||||||||
IT | — | — | — | — | 6 | |||||||||||||||
|
| |||||||||||||||||||
Other | 54 | 22 | 15 | 17 | — | |||||||||||||||
|
| |||||||||||||||||||
Total | 318 | 338 | 269 | 374 | 335 | |||||||||||||||
Substantiated versus Substantiated/unsubstantiated concerns
Although 89 ofOf the 335 GBP concerns503 cases reported in 20132016, 137 are still pending (especiallyclosure, in particular those lodged duringthat were filed towards the last three monthsend of the year), theyear. The table of investigated concerns providesbelow gives an initial indicationoverview of the number of reported concerns that were substantiated concerns(i.e. found to constitute a breach of our General Business Principles) by the subsequent investigation.
Of the 366 reports investigated (267 in 2015), 115 were substantiated, which represents 31% of the total reported and closed (34% in 2015). This is also shown in the table below. Notably, while in 2015 39% of the Treatment of employee cases were substantiated, this percentage dropped to 28% in 2016 (2014: 22%, 2013: 20%). On the other hand, 40% of the Business Integrity reports were closed as substantiated in 2016, compared with 21% in 2015 (2014: 36%, 2013: 50%).
In addition to the above, 174 concerns that were still open at the end of 2015 were closed during 2016. 37% of these concerns were substantiated after investigation.
Of the 179 closed concerns that were substantiated, 100 were followed up with disciplinary measures varying from termination of employment and written warnings to training and coaching. In other cases, corrective action was taken, which varied from strengthening the business processes to increasing awareness of the expected standard of business conduct.
12.3.6 The Philips Foundation
The Philips Foundation was established in 2014 and is a registered charity that strives to improve the lives of people in communities in need. The Philips Foundation seeks to make use of the expertise of partners, visionaries and innovators and the innovation capabilities of Philips to create lasting impact. In 2016, the Philips Foundation continued to build its portfolio of projects and partners in the areas of community
Philips Group
Classification of the new concerns investigatedin number of concerns which, upon investigation, could not be substantiated.reports
Out2014 - 2016
|
| |||||||||||||||||||||||
| 2014 | 2015 | 2016 | ||||||||||||||||||||||
|
| |||||||||||||||||||||||
| substantiated | unsubstantiated | substantiated | unsubstantiated | substantiated | unsubstantiated | |||||||||||||||||||
|
| |||||||||||||||||||||||
Health & Safety | 1 | 7 | 3 | 4 | 3 | 4 | ||||||||||||||||||
Treatment of employees | 32 | 112 | 62 | 95 | 64 | 164 | ||||||||||||||||||
Legal | 4 | 9 | 4 | 9 | 5 | 14 | ||||||||||||||||||
Business Integrity | 25 | 45 | 16 | 62 | 38 | 56 | ||||||||||||||||||
Supply Management | 1 | — | — | 1 | 1 | 7 | ||||||||||||||||||
IT | 2 | — | — | 2 | 1 | 3 | ||||||||||||||||||
Other | 4 | 18 | 1 | 8 | 3 | 3 | ||||||||||||||||||
|
| |||||||||||||||||||||||
Total | 69 | 191 | 86 | 181 | 115 | 251 | ||||||||||||||||||
|
| |||||||||||||||||||||||
220 Annual Report 2016
Sustainability statements 12.3.6
development and social entrepreneurship, as well as in our approach towards disaster relief. Royal Philips and Philips Lighting supported the program of the 246 concerns investigated,Philips Foundation with a donation of EUR 10 million in 2016 and provided the operating staff, paymentin-kind and the expert support of skilled employees who support the Foundation’s program for part of their time.
A highlight of the year was the launch of a partnership with Ashoka, one of the world’s largest networks of social entrepreneurs, that identifies and invests in social entrepreneurs helping them to bring their ideas for solving social problems to scale. Through a six month ‘globalizer’ program, 12 social entrepreneurs were supported by advisory teams – involving 24 Philips volunteers to build their impact scaling plan. This culminated in athree-day summit where the social entrepreneurs were able to pitch their impact plans to a large group of senior experts, such as social investors, public sector representatives and Philips executives.
We additionally worked on strengthening our partnerships with the Red Cross and UNICEF. The partnership with the Red Cross focuses on exploring innovations that could assist in providing immediate relief to people in regions affected by humanitarian crises including natural disasters. We are working with the Netherlands Red Cross and the Ivory Coast Red Cross on a project in Ivory Coast to strengthen the resilience of a community in the Blolequin region with a focus on the health of mothers and children. The Philips Foundation and UNICEF have partnered to develop healthcare innovations for the first 1,000 days of children’s lives. We are supporting UNICEF’s Global Innovation Center and are a lead partner in the Kenya Maker for Maternal, Newborn and Child Health Project in Nairobi, which focuses on developing and deploying solutions that improve access to healthcare for mothers and their children inlow-resource settings.
In addition, 36 local projects have been approved to be set up throughout the world. These projects are organized via the local Philips organization and NGO partner and funded by the Philips Foundation. These projects offer employee engagement opportunities including skilled expert volunteering. Employee donations were also a large part of the Philips Foundation’s response to the earthquakes in Ecuador, Japan and Italy as well as Hurricane Matthew in the USA. Along with ourco-creation projects we were able to respond to disasters around the world via our partnership with the Red Cross and global fundraisers, through which we raised a total of more than EUR 80,000 – a combination of employee donations and foundation matching.
More information about the Philips Foundation, its purpose and scope as well as the Philips Foundation Annual Report 2015 can be foundhere.
Examples of innovation projects supported by the Philips Foundation
The Philips Foundation, CurArte Foundation and Hospital Vall d’Hebrón teamed up to create‘Imatgina’, an advanced patient-centric initiative in pediatric radiology that aims to improve the experience children have during diagnostic imaging tests. The goal of the initiative is to enhance the experience for children by creating a friendly atmosphere that dispels the uncertainty and fear usually associated with these types of procedures. It is estimated that the project will improve the lives of over 7,000 children on an annual basis.
Every day in rural Uganda, 555 birth complications occur, which lead to the death of over 6,000 Ugandan women a year. Although ultrasound has proven to be instrumental in the early identification of these complications, its high cost and the lack of trained personnel mean that it was found that roughly one quarter (28%) were justified, comparableis not widely available in rural areas. The Philips Foundation and Philips teamed up with 2012 (26%)Imaging the World (ITW) to identify and implement sustainable business models in the healthcare ecosystem of rural Uganda. Establishing sustainable and increased sources of funding will allow ITW to create new health clinics and impact the lives of an additional 35,000 Ugandan women and babies a year.
12.3.7 Stakeholder Engagement
Our engagements with various partners and stakeholders is essential to our vision of making the world healthier and sustainable through innovation. Some of our partnership engagements are described below.
Global partnerships
World Economic Forum
Philips is proud to continue as a strategic partner and active member of the World Economic Forum (WEF), an independent international organization committed to improving the state of the world by engaging leaders in partnerships to shape global, regional and industry agendas. We supported and participated in a wide range of initiatives and projects through the year – regional WEF events, as well as the participation in International Business Council of the World Economic Forum.
Further to our various engagements with WEF, Frans van Houten has been selected to serve as a Stewardship Board Member of a key WEF initiative on shaping the “Future of Health and Healthcare”. The initiative will focus on managing the risk and impact of future epidemics addressing the shortfall in the world’s ability to respond to public health emergencies by developing a multifaceted cross-industry, cross-sectorial approach.
Annual Report 2013 2272016 221
13 Sustainability statements 13.2.1 - 13.2.212.3.7
With regardGlobal Alliance for Vaccines and Immunization
Philips and the Global Alliance for Vaccines and Immunization (Gavi), are partnering to concerns regarding Treatmentimprove the quality of employees, there wasimmunization data and its collection in primary and community healthcare. The partnership will be piloting the project in Uganda. The goal of the partnership is to gather accurate data which both organizations believe is essential to improve patient outcomes, provide access to care and reduce costs. Good data is key to strengthening health systems around the world.
World Heart Federation
Philips announced a notable increasenew partnership with the World Heart Federation (WHF) in 2016 to help people better manage their heart health. Aligned with the WHF’s ‘power your life’ campaign, Philips aims to encourage people to take personal responsibility for leading heart-healthy lives and to raise awareness about cardiovascular disease.
Thought leadership
Future Health Index
Philips launched a new report, the Future Health Index (FHI) in 2016, an extensive global study which explores how 13 countries around the world are positioned to meet long-term global health challenges through integration and connected care technologies. The Future Health Index measures readiness to address these challenges by examining perceptions about the accessibility and level of integration of healthcare services, and the adoption of connected care technology throughout national healthcare systems.
Digital transformation of health and care
Philips is a champion of the EU Blueprint on digital transformation of health and care for the ageing society. Philips will continue its engagement in the numberBlueprint through deploying digital innovation across the EU. We believe that this will contribute to development of justified concernsvalue-based care models for the benefit of citizens/patients and sustainability of health systems.
Working on global issues
Sustainable Development Goals
Philips aspires to 20%be a major private sector contributor to the Sustainable Development Goals (SDGs) that were launched during the UN General Assembly in New York in September 2015. The United Nations Sustainable Development Goals 3 (“’to ensure healthy lives and promote well-being for all at all ages”) and 12 (“to ensure sustainable consumption and production patterns”) are drivers and outcomes of sustainable development and Philips is committed to working closely with all relevant stakeholders to develop solutions to address these.
Strengthening primary care and enabling community development
Working in collaboration with the United Nations Population Fund (UNFPA), Royal Philips plans to inaugurate a Community Life Center (CLC) in Mandera, a County in North-Eastern Kenya with one of the total numberworld’s highest maternal mortality rates - 3,795 per 100,000 live births. The project supported by the County Government of concernsMandera is the second of its kind in this category, backthe world; Philips inaugurated the first CLC in Kiambu County, Kenya in 2014. The CLC will deliver crucial primary healthcare and enhance community development in Mandera.
Access to primary healthcare in Africa is a complex and complicated issue, therefore a sustainable solution needs to address a wide range of issues collectively. Issues range from unavailability of qualified healthcare workers to the levellack of 2011 (2012: 13%, 2011: 21%).
In the other major category, i.e. the investigated concerns in the Business integrity category, the percentage of concerns that was justified increased considerably to 50% (2012: 42%).
A range of disciplinaryelectricity, water and corrective measures have been implemented as a result of established violationsbasic healthcare technology. The creation of the General Business Principles, ranging from dismissalCLC concept enabled Philips to realize its vision to drastically improve primary healthcare in Africa.
Grand Challenges Canada on childhood pneumonia
Philips and written warningsGrand Challenges Canada (GCC) are collaborating on an innovative project to awareness training sessionsaid and organizational measures.improve the diagnosis of childhood pneumonia in low resource settings.
ClassificationRoyal Philips received a repayable grant to scale the manufacturing and distribution of the concerns investigatedPhilips Children’s Automated Respiration Monitor (also known as ChARM) to make it affordable and accessible for community-based health workers inlow-resource settings throughout the world. ChARM has the potential to assist community health workers in establishing a more accurate measurement of a sick child’s breathing rate to help improve the diagnosis of pneumonia and potentially prevent some of the 922,000 childhood deaths caused by pneumonia each year.
| 2011 | 2012 | 2013 | ||||||||||||||||||||||
| category | substantiated | unsubstantiated | substantiated | unsubstantiated | substantiated | unsubstantiated | ||||||||||||||||||
Health & Safety | — | 2 | 2 | 7 | — | 2 | ||||||||||||||||||
Treatment of employees | 18 | 68 | 22 | 150 | 33 | 136 | ||||||||||||||||||
Legal | — | 5 | 5 | 8 | 2 | 2 | ||||||||||||||||||
Business Integrity | 33 | 43 | 37 | 51 | 32 | 32 | ||||||||||||||||||
Supply Management | 2 | 1 | 1 | — | — | 3 | ||||||||||||||||||
IT | — | — | — | — | 3 | 1 | ||||||||||||||||||
Other | 3 | 5 | 11 | 4 | — | — | ||||||||||||||||||
|
| |||||||||||||||||||||||
Total | 56 | 124 | 78 | 220 | 70 | 176 | ||||||||||||||||||
13.2.2 Supplier indicatorsGlobal Financing Facility
In addition2016 Philips committed to supporting the Global Financing Facility (GFF) through our own sustainability activities,expertise in innovation and our core competencies in growing primary-care capacity. The GFF brings together a broad range of partners to promote the sustainable solutions needed to achieve universal coverage of health care. By creating the right financial and technical conditions for innovation, as a common objective we also engagebelieve our suppliersinvolvement will achieve greater impact and their suppliers toward better sustainability practices. To that end, we are active in various supply chain initiatives around the world.health outcomes through collaboration.
12.3.8 Supplier indicators
Philips has a direct business relationship with approximately 10,0008,500 product and component suppliers and 30,00022,000 service providers. Givenproviders, and in many cases the size and complexity ofsustainability issues deeper in our supply chain require us to intervene beyond tier 1 of the chain.
222 Annual Report 2016
Sustainability statements 12.3.8
Supplier sustainability strategy
Through a structured annual strategic process combined with a multi-stakeholder dialogue we need toidentified our key focus areas as described below:
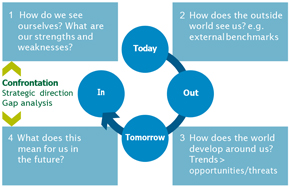
This process resulted in 2016 into five strategic programs for our efforts. Therefore, we developed an approach based onSustainable Supply Chain:
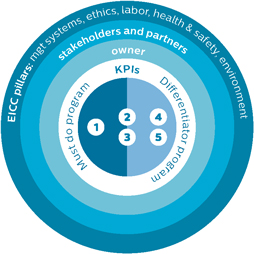
| Key programs | ||
| 1Supplier sustainability compliance | (SSC) | |
| 2Supplier sustainability performance | (SSP) | |
| 3Responsible sourcing | (RS) | |
| 4Circular procurement | (CP) | |
| 5Environmental footprint China | (EFP) |
Enablers
ONE database and dashboard
Standardized metrics (KPIs)
Communication plan
Multi-stakeholder dialogue
Industry collaboration
Training plan
Risk mapping (BOM, materials, suppliers)
1. Supplier Sustainability Compliance
Two core policy documents form the supplier’s sustainability risk profile related to spend, country of production, business risk and typebasis of supplier relationship. The risk profile is used to select suppliers for inclusion in our sustainability audit program, conflict minerals, hazardous substance management and IDH Electronics program.
Philipscompliance: the Supplier Sustainability Declaration (SSD) and the Regulated Substances List (RSL).
Supplier Sustainability Declaration (SSD)
The SSD sets out the standards and behaviors Philips Supplier Sustainability Declarationrequires from its suppliers. The SSD is based on the EICCElectronics Industry Citizenship Coalition (EICC) Code of Conduct and covers the topics Health & Safety, Labor, Environment, Ethics and Management systems.
Regulated Substances List (RSL)
The RSL specifies which chemical substances are regulated by legislation. Suppliers are required to follow all the requirements stated in line with our General Business Principles, we added requirements on Freedom of Associationthe RSL. Substances can either be marked as restricted or declarable.
Following the SSD and Collective Bargaining. The topics covered include laborRSL, Philips further specifies contractual and human rights, worker health and safety, environmental impact, ethics, and management systems. We monitor supplier compliancetransparency requirements. Suppliers are obliged to contractually commit to the DeclarationSSD and RSL andupon request provide additional information and evidence.
2. Supplier Sustainability Performance (SSP)
Since 2006, our supplier sustainability audits have been executed by third party auditors.
Due to insights gained through a thorough analysis of the audit program and the data it generated in the past 10 years our main conclusions were:
The audit process consists of a third party audit to verify the SSD compliance, it focuses on closing the identified “Non Conformities” and repeats every 3 years. The frequency of checks is not sufficient and the system does not lead to long lasting improvements of regular audits.
In 2012 we updated the Philips Supplier Sustainability Declaration, in linesustainability performance or compliance rate of our suppliers.
Training and capacity-building programs are focused on general sharing of information and not necessarily on driving change or improvements. They do not always meet individual supplier needs.
To secure business continuity, suppliers try to pass the audit with the least possible effort rather than making lasting improvements.
Years of an audit culture which did not focus on long-lasting improvements has led to audit fatigue due to too many audits demanded by other customers.
Based on the above conclusions, Philips identified a need for change and developed a new version“beyond audit” approach which:
Understands that suppliers may have initial deviations from the SSD and RSL.
Accepts that suppliers each have their own organizational – and sustainability maturity level and need an individual improvement plan.
Annual Report 2016 223
Sustainability statements 12.3.8
Is continuousand creates a cultural change leading toward long-term improvements.
Ultimately leads toone-cross-industry standard for supplier sites and will therefore remove the audit burden.
The new SSP approach has been piloted in 2016 on a sample of 93 suppliers in China with the following results:
90% of the suppliers completed a Self-Assessment Questionnaire (SAQ), 57% of which were validated by Philips sustainability experts.
Followed by a site assessment at 20 supplier sites.
Through joint efforts an improvement Plan (IP) was developed and agreed upon with these 20 suppliers.
These 20 suppliers started executing the Improvement Plan, while Philips provides support and monitors progress on a regular basis.
The following observations were made after analyzing the first phase of the pilot:
Higher level of commitment and ownership from suppliers (also at top management level).
Change in mindset towards continuous improvement and transparency.
Suppliers are disclosing more areas for improvement than it would be possible to identify through an audit only.
Suppliers are moving away from quick fixes and towards lasting improvements.
Three key focus areas of SSP
We are primarily focusing on 3 areas: Health and Safety, remuneration and benefits, and workforce turnover.
Process Chemicals
Philips is an active member of the EICC Codeproject team on process chemicals, for further details on the strategy and approach of Conduct.this project see theEICC position paper. In 2013,addition to this project team we rolled-outhave addressed the updated Declaration viatopic of process chemicals in the new purchasing contracts signed with suppliers,SSP approach and via all trainingswe aim to identify if and audits done per January 1, 2013. The updated Declaration includes 4 entirely new provisions, and 14 updates to existing provisions. The new provisionshow the manufacturing sites are related to responsible sourcingmanaging process chemicals.
Summary of minerals, protection of privacy, non-retaliation, and supplier responsibility to monitor code compliance at next tier suppliers.
The Declaration requires suppliers to cascade the EICC Code down to their next tier suppliers. Suppliers must regard the Code as a total supply chain initiative and at a minimum, also require its next tier suppliers to acknowledge and implement the Code. This roll-out to deeper levels in the supply chain is reviewed during the on-site audits, where it is assessed how requirements have been communicated to the next tier suppliers and whether there is an effective process in place to ensure that the next tier suppliers implement the Code.
Risk suppliers with who we have a direct business relationship are included in the supplier sustainability audit program, and most of these are tier 1 suppliers. However, sometimes Philips also selects and prescribes the tier 2 suppliers, in which case these tier 2 suppliers will also be included in the audit program.
Supplier2016 Sustainability Audit Program
We monitor supplier compliance with the Declaration through a system of regular audits. During these audits, an independent external party visits the supplier’s site for several man-days to hold interviews with workers and management, do a factory tour, and review documentation. Based on their risk profile, 572 risk suppliers are included in the supplier audit and development program; the majority of these are in China. During the audits, compliance with all sections of the Declaration is reviewed. In the event of non-compliance (NC) we require suppliers to make a corrective action plan, and we monitor its implementation until all major NCs are resolved. Full-scope audits are conducted in a 3-year cycle; to date we have audited 90% of all identified risk suppliers.
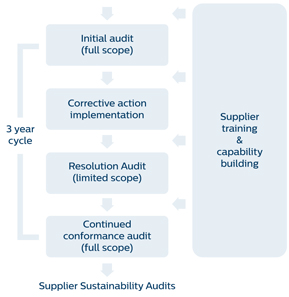
2013 Audits
In 20132016, we audited 200226 of our current risk suppliers, including 131150 continued conformance audits with suppliers that we had already audited in 2010. Risk suppliers from recently acquired companies are also included, and this year we audited 27 suppliers from the acquisitions of Povos and Preethi.2013. As in previous years, the majority of the audits were done in China. Also in Brazil, India and Mexico audits were done, as well as a small number of audits in Indonesia, Ukraine and Vietnam. With these audits we directly or indirectly impacted over 110,000almost 180,000 workers employed at the production sites that were audited.
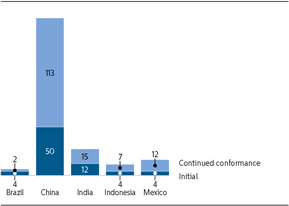
On top of the audits with current risk suppliers, we also audited 5928 potential suppliers during the supplier selection process. These potential suppliers need to close anyzero-tolerance issues before they can start delivering to Philips. Below we report on the findings at existing suppliers only; findings at potential suppliers are not included in this report since these suppliers are not (yet) part of Philips’ supply base.
228 Annual Report 2013
13 Sustainability statements 13.2.2 - 13.2.2
To track improvements Philips measures the ‘compliance rate’ for the identified risk suppliers, being the percentage of risk suppliers was audited within the last 3 years and don’twho do not have – or have resolved all – major NCs. During 20132016 we achieved a compliance rate of 77% (2012: 75%90% (2015: 86%).
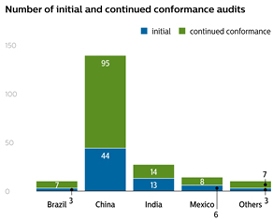
Per January 2013 we rolled out an updated version of the Philips Supplier Sustainability Declaration and audit checklist. Philips follows the EICC classification for distinguishing major and minor NCs, and in the new audit checklist the classification of what is a major and what is a minor NC changed for several topics. This explains some of the differences in audit findings 2013 compared to 2012.
Audit findings
BelowThe table below shows the results of the full scope audits done during 2013. When the audit reveals2016; potential suppliers are not included. Most frequent areas ofnon-compliance we request suppliers to implement corrective actions and our sustainability experts and independent third party auditors monitor the implementation during resolution audits. The results of the resolution audits are not included in the table below.
Positive trends compared to last year2016:
Certified Management System (ISO9001, ISO14001, and OHSAS18001)
Emergency Preparedness
Above topics belong to the most frequently observed areas of non- compliance and therefore, during our supplier development activities and visits we have paid more attention to these topics in 2013.
Negative trends compared to last year
Above increases we believe are mostly the result of more stringent criteria in the new EICC audit checklist.
Management systems
There may be areas where our audits reveal compliance in actual practice, but the related underlying management systems to safeguard continued compliance may not be sufficient. Therefore, also management systems are reviewed during the audits. Although the 2013 audits show improvements compared to previous years, we see this as a continued weak area at suppliers where further capacity building is necessary. Related to management systems the most frequently observed NCs are a lack of third-party certified management systems, supplier responsibility (EICC Code requirements have not been communicated to the next tier suppliers), insufficient management accountability and responsibility, and absence of improvement objectives.
Annual Report 2013 229
13 Sustainability statements 13.2.2 - 13.2.2
Philips Group
Summary of 2013 initial and continued conformance2016 audit findings per region
suppliers with one or more major non-compliances per category (in % of suppliers audited in 2013)
“<10%” means that <10% of the supplier audits done in 2013 showed areas of non-compliance for a certain topic
| China | Asia excl. China | LATAM | EMEA | Total | ||||||||||||||||
No. of audits | 139 | 35 | 24 | 2 | 200 | |||||||||||||||
Initial audits | 44 | 15 | 9 | 1 | 69 | |||||||||||||||
Continued conformance audits | 95 | 20 | 15 | 1 | 131 | |||||||||||||||
Average number of non-compliances per audit | 11 | 18 | 9 | 11 | 12 | |||||||||||||||
Workers employed at sites audited | 88,775 | 13,008 | 8,067 | 516 | 110,336 | |||||||||||||||
Labor | ||||||||||||||||||||
Freely Chosen Employment1) | 10-25 | % | 50-75 | % | 10-25 | % | — | 10-25 | % | |||||||||||
Child labor prohibition/young worker management2) | 10-25 | % | <10 | % | <10 | % | — | 10-25 | % | |||||||||||
Working hours | 50-75 | % | 50-75 | % | <10 | % | — | 50-75 | % | |||||||||||
Wages and Benefits | 50-75 | % | 25-50 | % | — | 50-75 | % | 25-50 | % | |||||||||||
Humane Treatment | <10 | % | <10 | % | <10 | % | — | <10 | % | |||||||||||
Non-discrimination | <10 | % | — | — | — | <10 | % | |||||||||||||
Freedom of association | — | 10-25 | % | <10 | % | — | <10 | % | ||||||||||||
Health & Safety | ||||||||||||||||||||
Occupational Safety | 25-50 | % | 25-50 | % | <10 | % | 50-75 | % | 25-50 | % | ||||||||||
Emergency Preparedness | 25-50 | % | 50-75 | % | 25-50 | % | >75 | % | 25-50 | % | ||||||||||
Occupational Injury and Illness | 25-50 | % | 25-50 | % | 10-25 | % | 50-75 | % | 25-50 | % | ||||||||||
Industrial Hygiene | 25-50 | % | 25-50 | % | <10 | % | >75 | % | 25-50 | % | ||||||||||
Physically demanding work | <10 | % | <10 | % | 10-25 | % | — | <10 | % | |||||||||||
Machine safeguarding | 10-25 | % | <10 | % | — | 50-75 | % | 10-25 | % | |||||||||||
Food Sanitation and Housing | 10-25 | % | 10-25 | % | 10-25 | % | 50-75 | % | 10-25 | % | ||||||||||
Environment | ||||||||||||||||||||
Environmental Permits and Reporting | 10-25 | % | 25-50 | % | 10-25 | % | >75 | % | 10-25 | % | ||||||||||
Pollution prevention and resource reduction | <10 | % | 25-50 | % | 10-25 | % | — | <10 | % | |||||||||||
Hazardous substances | 25-50 | % | 25-50 | % | — | 50-75 | % | 25-50 | % | |||||||||||
Waste water and solid waste | <10 | % | <10 | % | 10-25 | % | 50-75 | % | <10 | % | ||||||||||
Air emissions | 10-25 | % | <10 | % | 10-25 | % | — | 10-25 | % | |||||||||||
Product content restrictions | — | — | — | — | — | |||||||||||||||
Management systems | ||||||||||||||||||||
Certified management system (SA8000, etc.) | 50-75 | % | >75 | % | 50-75 | % | >75 | % | 50-75 | % | ||||||||||
Company commitment | 10-25 | % | 25-50 | % | 10-25 | % | — | 10-25 | % | |||||||||||
Management accountability and responsibility | 25-50 | % | 50-75 | % | 25-50 | % | 50-75 | % | 25-50 | % | ||||||||||
Legal and customer requirements | 10-25 | % | 25-50 | % | 25-50 | % | — | 10-25 | % | |||||||||||
Risk assessment and risk management | 25-50 | % | 50-75 | % | 10-25 | % | >75 | % | 25-50 | % | ||||||||||
Improvement objectives | 25-50 | % | 50-75 | % | 25-50 | % | — | 25-50 | % | |||||||||||
Training | 10-25 | % | 50-75 | % | 25-50 | % | — | 25-50 | % | |||||||||||
Communication | 10-25 | % | 25-50 | % | 10-25 | % | — | 25-50 | % | |||||||||||
Worker feedback and participation | 10-25 | % | 25-50 | % | 10-25 | % | — | 10-25 | % | |||||||||||
Audits and assessments | 25-50 | % | 50-75 | % | 25-50 | % | — | 25-50 | % | |||||||||||
Corrective action process | 25-50 | % | 25-50 | % | 25-50 | % | — | 25-50 | % | |||||||||||
Documentation and records | 10-25 | % | 25-50 | % | <10 | % | — | 10-25 | % | |||||||||||
Supplier responsibility | 25-50 | % | 50-75 | % | 25-50 | % | — | 25-50 | % | |||||||||||
Ethics | ||||||||||||||||||||
Business Integrity | 25-50 | % | 25-50 | % | 25-50 | % | — | 25-50 | % | |||||||||||
No improper advantage | <10 | % | <10 | % | 25-50 | % | — | <10 | % | |||||||||||
Disclosure of information | <10 | % | <10 | % | — | — | <10 | % | ||||||||||||
Protection of Intellectual Property | <10 | % | 25-50 | % | <10 | % | — | <10 | % | |||||||||||
Fair business, advertising and competition | 10-25 | % | <10 | % | 10-25 | % | — | <10 | % | |||||||||||
Protection of identity | <10 | % | 25-50 | % | 10-25 | % | — | <10 | % | |||||||||||
Responsible sourcing of minerals | <10 | % | <10 | % | — | — | <10 | % | ||||||||||||
230 Annual Report 2013
13 Sustainability statements 13.2.2 - 13.2.2
| |||||||||||||||||||||||||||||||||||||||||||||||||||||||||||||||||||||||||||||||||||||||||||||||||||||||||||||||||||||||||||||||||||||||||||||||||||||||||||||||||||||||||||||||||||||||||||||||||||||||||||||||||
| |||||||||||||||||||||||||||||||||||||||||||||||||||||||||||||||||||||||||||||||||||||||||||||||||||||||||||||||||||||||||||||||||||||||||||||||||||||||||||||||||||||||||||||||||||||||||||||||||||||||||||||||||
| |||||||||||||||||||||||||||||||||||||||||||||||||||||||||||||||||||||||||||||||||||||||||||||||||||||||||||||||||||||||||||||||||||||||||||||||||||||||||||||||||||||||||||||||||||||||||||||||||||||||||||||||||
| |||||||||||||||||||||||||||||||||||||||||||||||||||||||||||||||||||||||||||||||||||||||||||||||||||||||||||||||||||||||||||||||||||||||||||||||||||||||||||||||||||||||||||||||||||||||||||||||||||||||||||||||||
|
|
Implementing corrective actions
On average we see 12 major NCs per supplier audit, and work with each supplier to resolve these NCs within 90 days where possible. Goal is to improve the conditions in the supplier factories. Therefore, we focus on training, supplier development and implementation of corrective action plans with those suppliers. In exceptional cases where the supplier is unwilling to improve, we will decide to end the business relationship, which we did for 15 suppliers in 2013.
If Philips notices that there is a delay in the realization of the corrective action plan by the supplier, Philips uses a stratified approach for consequence management. Depending on the root cause why the supplier is not taking sufficient corrective actions, Philips can decide to: send a formal warning to the supplier; allocate no new projects; allocate no new orders; or stop doing business.
Audit progress and targets
More information on the Supplier Sustainability InvolvementAudit Program the Philips Supplier Sustainability Declaration and audit approach can be found at www.philips.com/suppliers.
Supplier training and capacity building
Based on many years of experience with the audit program, we know that a combination of audits, capacity building, consequence management and structural attention from management is crucial to realize structural and lasting changes at supplier production sites.
Developing risk suppliers
Since 2012 we are extending our capacity building initiatives which are offered to help suppliers improve their practices. We organize classroom training sessions, Philips sustainability experts regularly visit suppliers to provide on-site consultancy and training, and we invite suppliers to participate in trainings provided by the EICC.
This is what we did different in 2013 training sessions, to improve the impact of the supplier trainings and audit results:
In China we invited suppliers for classroom training sessions which were attended by over 190 active and potential suppliers, representing a workforce of more than 120,000 factory workers in total. Next to basic training on the EICC Code of Conduct, dedicated trainings were provided for areas where we often see weak performance during the audits, e.g. fire safety, working hours, and management systems.
We continued our training programs for Philips buyers and quality managers, supporting them to further integrate sustainability in their daily work with suppliers.
Supplier training and capacity buildinghere.
Sustainable Trade Initiative IDH
Since 2011 Philips has been an active initiator and participant in the IDH Electronics Program, a multi-stakeholder initiative sponsored by the Dutch government to accelerate sustainable trade by building partnerships between leading multinationals, civil society organizations, governments, and other stakeholders.
The IDH Electronics Program aims to support the development of sustainable and innovative workforce management practices for over 75 suppliers. Unlike other CSR programs that have been implemented previously in the industry, this program steers away from traditional auditing methods and seeks to make a significant impact by building and up-scaling the skills of both workers and management. By promoting worker-management dialogue and helping to develop employees’ skills and careers, the program strives to reduce employee turnover and wastage, improve energy efficiency and improve the overall performance of supplier factories. The goal is to improve working conditions for more than 500,000 employees in the electronics sector.
Participating suppliers are given an ‘Entry Point Assessment’ to identify issues that affect both factory management and employees, such as worker-management communication, occupational health and safety,
224 Annual Report 2013 2312016
13 Sustainability statements 13.2.2 - 13.2.212.3.8
production, performance management3. Responsible Sourcing of Minerals
The supply chains of minerals are long and environmental issues. This is then used to develop a tailor-made action plan with each supplier, based on improved dialoguecomplex. There are typically 7+ tiers between management and employees. Suppliers receive support over a period of up to 24 months, and the cost of the program is shared between the supplier,end-user companies like Philips and the IDH.
In 2013, IDH was extended frommines where the Pearl River Delta Area to include the Yangtze River Delta area. As of year-end 2013, the program covers 52 suppliers to Philips, Apple, Nokia, Dell and Hewlett-Packard. A total of 15 Philips suppliersminerals are now involved in the program, seven in the Yangtze River Delta area and eight in the Pearl River Delta Area, covering around 17,000 employees. Together with other branded goods manufacturers, we are going beyond a supplier audit. In order to ensure a worthwhile output we are also working together with suppliers and the IDH program team to identify the top three improvement actions, and we are monitoring progress closely. Suppliers such as ‘company B’ are starting to see the benefits of this program.
IDHbeing extracted.
IDH case study
B is a company based in Hong Kong, which has an electronics factory located in Dongguan, China. As a Philips supplier, B has been involved in the IDH Electronics Program since January 2013.
B has implemented a series of improvement plans in different areas, including worker-management communication, workers’ welfare and pay, health and safety, factory facilities and production. These improvement actions have resulted in increased productivity and greater employee satisfaction.
To improve worker-management communication, for example, B has set up a factory improvement team made up of front-line production workers, departmental representatives and managerial staff. B’s management believes that talking directly to front-line workers gives a more accurate picture of what is going on in the company than hear-say reports that are passed up through the organizational hierarchy. The team structure helps to facilitate B’s cultural values of mutual respect and open communication.
In the coming years B’s management will continue their active cooperation and dialogue with employees. Challenges will be identified jointly through constructive dialogue facilitated by the IDH Program.
Issues further down the chain
Conflict minerals
In line with Philips’ commitment to supply chain sustainability, we feel obliged to implement measures in our chain to ensure that our products are not directly or indirectly funding human atrocities in the Democratic Republic of the Congo (DRC). We are concerned about the situation in eastern DRC where proceeds from the extractives sector are used to finance rebel conflicts in the region. Philips is committed to address this issue, even though it does not directly source minerals from mines in in the DRC. Theconflict-affected and high-risk regions, and the supply chain for thethese metals of concern consists of many tiers, including mines, traders, exporters, smelters, refiners, alloy producers and component manufacturers, before reaching Philips’ direct suppliers.
Mining in these regions often takes place in an artisanal form which often means it is informal and unregulated. Artisanal miners can become victims to exploitation by various militia and armed groups. This increases the risk of human rights violations (forced labor, child labor or widespread sexual violence), unsafe working conditions or environmental concerns.
Philips addresses the complexities of the minerals supply chains through a continuous due diligence process combined with multi-stakeholder initiatives for responsible sourcing of minerals.
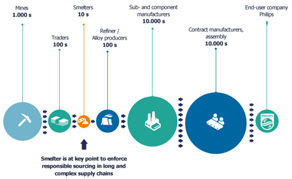
Due diligence approach
OECD Five-Step Framework for Risk-Based Due Diligence in the Mineral Supply Chain
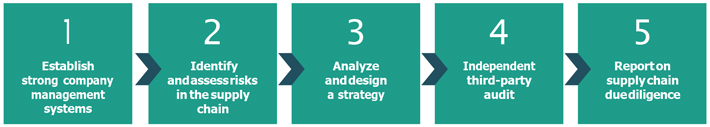
Multi-stakeholder initiatives
Working together with other stakeholders to apply leverage
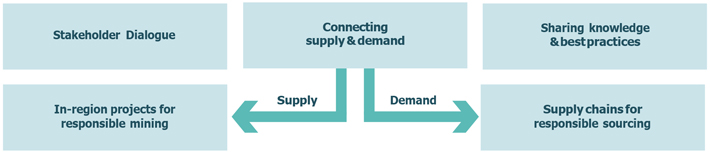
Conflict minerals due diligence
Philips hasannually investigates its supply chain to identify smelters of tin, tantalum, tungsten and gold in its supply chain and we have committed not to purchase raw materials, subassemblies, or supplies which we knoware found to contain conflict minerals that directly or indirectly finance or benefit armed groups in the DRC or an adjoining country. Philips works towards the following goals:
Minimize trade in conflict minerals that benefit armed groups in the DRC or an adjoining country
Enable legitimate minerals from the region to enter global supply chains, thereby supporting the Congolese economy and the local communities that depend on these exports.
What are conflict minerals?
Conflict minerals are defined in the US Dodd-Frank Act as tin, tantalum, tungsten and gold. They can come from many sources around the world, including mines in the DRC which are estimated to provide approximately 18% of global tantalum production, 4% of tin, 3% of tungsten, and 2% of gold. These minerals may end up in many different products such as cars, planes, chemicals, jewelry, packaging, and electronics equipment.minerals.
Collaboration with different stakeholders
We believe that industry collaboration and stakeholder dialogue are key to creating impact at these deeper levels of our supply chain. Since 2008 Philips is actively contributing to theapplies collective cross-industry leverage through active engagement via Conflict Free Sourcing Initiative a joint effort founded by a coalition of leading electronics companies from the industry organizations EICC and GeSI (formerly called the “EICC-GeSI Extractives Work Group”)(CFSI). Over 120 companies participate in this initiative today, and we have formed partnerships with other leadership groups from across industries, government and civil society. The Conflict Free Sourcing Initiative provides information on conflict-free smelters and refiners, common tools and standards to collect supply chain information, and forums for exchanging best practices. It is amulti-sector, multi-stakeholder network, and reduces the need for duplication of efforts across the many sectors that are using these minerals. See also www.conflictfreesmelter.org
As we have been doing for years, we continued in 2013 our engagement with relevant stakeholders including the European Parliament, other industry organizations and local as well as international NGOs in Europe and the U.S. to see how we can resolve the issue. To assist in developing a due diligence standard for conflict minerals, we participated in the multi-stakeholder OECD-hosted program for the implementation of the “OECD Due Diligence Guidance for Responsible Supply Chains of Minerals fromConflict-Affected and High-Risk Areas”.
Supply chain due diligence
In 2013 we continued our work with 349 priority suppliers to raise awareness and conduct supply chain investigations into the country of origin for the metals. These suppliers cover more than 80% of the relevant purchasing spend. Using the standard Conflict Minerals Reporting
232 Annual Report 2013
13 Sustainability statements 13.2.2 - 13.2.2
Template we requested our suppliers to report back their progress and to disclose which smelters are used in their supply chains to produce the metals.
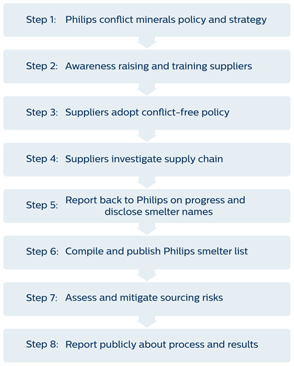
Progress on smelter identification
Philips suppliers have provided the names of several hundred possible smelters and we are working to confirm which of these actually are smelters. For all four metals together we now identified 191 confirmed smelters in our supply chain, of which the majority is located in Asia. 29% of these successfully passed their Conflict FreeConflict-Free Smelter (CFS) assessment, thereby confirming their conflict-free status. None of the smelters identified in our supply chain is known to source minerals that benefit armed groups in the DRC, and our suppliers reported back that they provide us with conflict-free products. Nevertheless, we continue to urge smelters to confirm their status via independent third party assessments.
Philips was the first company to publish its smelter list on internet in 2012. In doing so we created transparency at deeper levels in our supply chain of those actors that we believe hold the key towards effectively addressing the concerns around conflict minerals. In 2013 we updated the smelter list with new information received from our suppliers, and we will continue to do so as more information becomes available over time.
Conflict-free smelter program
Smelters mix minerals from many sources and refine it into metal used in our industry. The smelter is at a key point in the supply chain to enforce responsible sourcing by implementing due diligence in selecting their mineral sources. The EICC-GeSI CFS program makes it possible to identifyProgram (CFSP) identifies smelters that can demonstrate through an independent third party assessmentthird-party audit that the minerals they procure did not originate from sources that contribute toare conflict in the DRC. After having identified smelters in our supply chain,free. Philips started to invite these smelters to participate in the CFS program.
A list of CFS compliant smelters for tin, tantalum and gold has been published, and assessments for tungsten smelters are under way. As sufficient conflict-free smelters for all four metals become available, Philips plans to directis actively directing its supply chain towards these smelters. Seewww.conflictfreesmelter.org for more details.
The Philips Conflict Free Tin Initiative
In September 2012,Minerals due diligence framework, measures and outcomes are described in the Conflict Free Tin Initiative was launched, introducingMinerals Report that we file annually with SEC. The Report is audited by an independent third party and made publicly available on Philips’website.
Multi-stakeholder initiatives for responsible sourcing of minerals
We believe that a tightly controlled conflict-free supply chainmulti-stakeholder collaboration in responsible sourcing of minerals is the most viable approach in addressing the complexities of minerals value chains.
European Partnership for tin, fromResponsible Minerals (EPRM)
EPRM is a mine in the Democratic Republic of Congo (DRC) all the way to an end-product. Philips is one of the industry partners brought together by the Dutch government that initiated this conflict-free sourcing program in eastern DRC. In an effort to preventfive-year multi-stakeholder partnership between governments, companies, and civil society actors working toward more sustainable minerals from financing war, many companies worldwide have refrained from purchasing minerals from the DRC, leading to a de facto embargo and a collapse of the local economy.
The easiest route would have been to simply abandon sources from the DRC and nearby countries (forbidding suppliers from sourcing there) and to rely instead on supplies from conflict-free regions. However, we decided against that approach. Instead of avoiding the DRC, we took the more difficult road, supporting conflict-free sources within the region.
Conflict minerals
For more details, see www.philips.com/suppliers and the published Philips position paper on Conflict Minerals.
Annual Report 2013 2332016 225
13 Sustainability statements 13.2.2 - 13.3.112.3.8
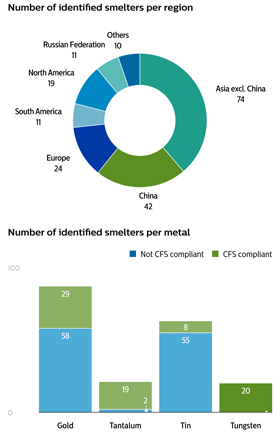
Tin mining in Indonesia
The islands of Bangka and Belitung, Indonesia are oneproduces roughlyone-third of the world’s principal tin-producing regions. Recently concerns have been raised about environmental devastationtin supply, of which the vast majority comes from the islands Bangka and unsafe working conditions relatedBelitung.
In 2015, a Roadmap to sustainable tin mining was created in collaboration with the illegal mininglocal industry and government, defining improvement areas for onshore land reclamation and offshorelow-impact mining.
In 2016, the first implementation pilot projects of tinthe Roadmap were kicked off, governed by the local steering committee.
Dutch Covenant on Gold
Leaders of different industries using gold in this region. To evaluate possibilitiesThe Netherlands together with the Dutch government and NGOs look for addressing these concerns, ways to make gold supply chains more responsible. Through 2016, the group has engaged in knowledge sharing to understand all specifics of the gold supply chain and to identify the right approach for the parties to address the most severe issues.
Mica Working Group
Mica is mainly used as a pearlescent pigment in coatings and cosmetics, and in the electronics sector it is used as an electrical insulator.
In 2016, Terre des Hommes in collaboration with SOMO published a report“Beauty and a Beast” which showed the widespread problem in the mica industry in Jharkhand/Bihar (India) and gaps in the due diligence of end user companies.
Philips teameddecided to team up with Terre des Hommes in order to bring other frontrunner companies,mica users from all industries together to start a Mica Working Group with Terre des Hommes, Philips, the tin industryDutch Ministry of Foreign Affairs and civil societya group of 15 companies.
“Terre des Hommes Netherlands is pleased to partner with Philips in order to set up the Mica Working Group. Our report “Beauty and a Beast, child labor in India for sparkling cars and cosmetics” shows the challenges of mica mining and the need for immediate interventions. Philips became aware of the issue and immediately demonstrated its leadership in CSR by taking the initiative to bring partners from various industries together. Philips’ engagement in other responsible sourcing initiatives definitely supported the Mica Working Group to move forward. We are confident that this multi-stakeholder initiative will lead to a transparent, traceable and child labor free mica supply chain”
Terre des Hommes
NGO
4. Circular Procurement
Philips’ ambition is to increase its circular value proposition and it has set a 2020 target of 15% circular revenues. Procurement can play a leading role in Philips’ transition towards a circular economy in order to achieve the 2020 target or even exceed this.
Topics where Procurement is actively involved are:
Circular procurement in the new IDH Indonesian Tin Working Group, coordinated byprocurement policy. The next step is to define a circular procurement strategy and a clear long-term ambition.
The implementation of a governance structure beyond the Dutch Sustainable Trade Initiative IDH. We co-funded a situational analysis and sustainability assessment commissioned by this working groupprocurement organization to better understand the situation and the potential ways for downstream companies to take constructive action.
Other initiatives in our supply chain
Carbon footprint of our supply chain
Society has a pressing need to manage and reduce CO2 emissions overcover the whole value chain including at supplier level. Therefore 80is part of the largestinternal Circular Economy Excellence network.
Execution of an analysis of internal and external circular service models to improve collaboration.
“In 2016 Philips and HP have further strengthened their business relationship by specifying and delivering an ITpay-per-device model which will cover more than 100,000 IT assets across 50 countries. Thisdevice-as-a-service solution supports both companies’ efforts towards a shared circular economy. Philips stands out in truly understanding the importance of managing its IT requirements in order to realise both maximum value and minimize environmental impact from IT products. HP is proud to be Philips’ partner of choice for IT asset management and will continue to collaborate on shared circular economy objectives.”
Dr. Kirstie McIntyre
HP Social and Environmental Responsibility Director
226 Annual Report 2016
Sustainability statements 12.3.8
HP Case Study
Philips has used HP Asset Recovery Services since 2011 to comprehensively manage end of life IT assets worldwide, with data wiping, remarketing and recycling to mitigate security and privacy risk and ensure compliance. Over that time HP Asset Recovery Services have managed 80,000 assets across 24 countries, remarketing 90% of them.
5. Environmental Footprint China
In order to minimize our impact, we are supporting our Chinese suppliers to reduce their environmental footprint and at the same time to contribute to Philips’ sustainability strategy.
Achievements in 2016
Environmental footprint training for 120 suppliers by Philips have been invitedSupplier Sustainability team.
Philips actively participated in the Sino-Dutch Sustainable Supply Chain Management Program held by the Dutch Consulate in Zhejiang and Jiangsu province.
Customer engagement (Starbucks) the supplier has established a new waste water treatment facility to report their carbonensure waste water discharging in accordance with regulatory requirements.
Environmental footprint data reported for improving performance by 20 suppliers as part of the Carbon Disclosure Project (CDP) Supply Chain program. 69 suppliers completed the full questionnaire, showing increased performance with respect to climate change. This year, Philips became a founding memberSSP on-site development.
Energy savings via Supplier Development program - energy savings will be achieved upon implementation of the CDP Action Exchange program, connecting our suppliersidentified improvement actions.
Collaboration with IPE, a Chinese NGO
The Institute of Public and Environmental Affairs (IPE) is a registerednon-profit organization based in Beijing. IPE has developed two pollution databases (water and air) to globally recognized solutions providersmonitor corporate environmental performance and to facilitate public participation in environmental governance. For more information please refer to IPE website.
SA is a Philips supplier located in Shenzhen . In April 2016, environmental issues were identified in the fieldwaste water discharge system of energy-efficient technology, helping them in their search for innovative solutionsthis supplier. This was reported via the IPE Pollution Map.
Philips experts immediately contacted the supplier account manager, an IPE expert and the supplier to reduce their future emissions, for instance by applying LED lighting technology.
Substance managementidentify the root-cause and work out an improvement plan. With multi-stakeholder engagement, SA had the IPE Green Choice Alliance audit and closed the issue with suppliers
We work with suppliers to eliminate and minimize the use of hazardous substances in our products and production processes. Since regulatory requirements affecting electronics frequently change, we structurally collect information from suppliers in an online tool (BOMcheck) since 2010, in particular for those suppliers that provide materials which could represent a risk in terms of compliance, e.g. soft plastics, complex materials, and ROHS-relevant materials. Philips validates the substance declarations received from suppliers to ensure that the products we put on the market are compliant with the Philips Regulated Substances List and all relevant legislation. During 2013 we collected and validated substance declarations for nearly 95% of all relevant components and products.50 environmental protection NGOs as witnesses.
13.312.4 Environmental statements
This section provides additional information on (some of) the environmental performance parameters reported insection 4.3,2.3, Environmental performance, of this report.
13.3.1 EcoVision12.4.1 Circular Economy
Our latest EcoVision program, includes key performance indicators in relation to Green Product sales, Improving people’s lives, Green Innovation, Green Operations, Health & Safety, Employee Engagement and Supplier Sustainability.
Improving people’s lives
At Philips, we strive to make the world healthier and more sustainable through innovation. Our goal is to improve the lives of 3 billion peopleThe transition from a year by 2025.
Through Philips products and solutions that directly support the curative or preventive side of people’s health, we improved the lives of 630 million people in 2013, driven by our Healthcare sector. Additionally, our well-being products that help people live a healthy life, and our Green Products that contributelinear to a healthy ecosystem, improvedcircular economy is essential to create a sustainable world. A circular economy aims to decouple economic growth from the livesuse of 290 millionnatural resources and 1.49 billion people respectively. After the elimination of double counts – people touched multiple times – we arrived at 1.8 billion lives. This is an increase of 100 million compared to our total baseline of 1.7 billion people a year, established in 2012.
Examples of products in the ‘well-being’ category that help people live a healthier life are juicers, blenders, air fryers, but also mother and childcare products. Examples of Green Products, products offering a significant environmental improvement in one orecosystems by using these resources more Green Focal Areas, can be found in sub-section 4.3.2, Green Product sales, of this report. Further details on this parameter and the methodology can be found in the document ‘Improving people’s lives’.effectively.
Operational carbon footprint and energy efficiency
Operational energy efficiency and carbon footprint: 2013 detailsThe circular economy program
The 2013 results can be attributed to several factors:circular economy program at Philips ran for the fourth year in 2016 and consists of four strategic pillars:
|
|
|
|
Philips leverages partnerships with the Ellen MacArthur Foundation, Circle Economy Netherlands, World Economic Forum, US Chamber of Commerce Foundation and The Guardian. For example, through the leadership of our CEO and supported by the circular economy program, Philips teamed up with the World Economic Forum to establish a public-private platform to accelerate the circular economy, launched in Davos in January 2017.
234 In many Philips Business Groups circular economy projects have started. These are either linked to customer access over ownership (pay for performance), business model innovations (from transactions to
Annual Report 20132016 227
13 Sustainability statements 13.3.1 - 13.3.312.4.1
relationships via service and solution models) or reverse cycles (remanufacturing, refurbishment and parts harvesting).
Circular Revenues
In 2016, at Royal Philips, a new internal KPI was developed and deployed: Circular Revenues. The Circular Revenues percentage captures our revenues of validated circular products, services, and solutions, as a % of total Philips revenues. The validation is done against the following Philips circularity requirements which might be further refined in the future:
1. Performance and Access-based models
Revenues from contracts that include the condition that Philips has individualend-of-life responsibility for the product
2. Refurbished, Reconditioned & Remanufactured products/systems
Revenues from selling refurbished, reconditioned or remanufactured products/systems withre-used components >30% by total weight of product/ system
3. Refurbished, Reconditioned & Remanufactured components
Revenue from harvested components that have either been refurbished, reconditioned or remanufactured. The harvested component must contain >30%re-used parts or materials by total component weight. The component can either be a standalone component or part of a new product/system. The commercial value of the components is considered irrespective of whether it is part of a service, warranty or a sale.
4. Upgrades/refurbishment on site or remote
Revenue from upgrades of existing hardware and software either on site or remotely
5. Products with recycled plastics content
Revenues from products with a recycled plastics content of >25% by total weight of eligible plastics
We set the ambition that by 2020 a total of 15% of our revenues will come from circular propositions. This is double the rate of 7% baseline achieved in 2015. The result for 2016 is 9%. The main contributing revenue streams are for:
Personal Health businesses
Revenues from our B2C products that contain a large amount of recycled plastics, such as our businesses in coffee and domestic appliances
Diagnosis & Treatment businesses
Our Diamond Select offer of refurbished imaging systems for sale, upgrading of systems at customer premises to enhance performance and extend lifetime, repair and reuse of spare parts
Connected Care & Health Informatics businesses
A number of Philips businesses based on subscription models, such as for example the Philips Lifeline business and others
Closing material loops
In addition to tracking circular revenue, we are also further working to gain transparency over the material flows connected with the Philips businesses. In 2016 Philips put a total of some 242,000 tonnes of products on the market. This assessment is based on sales data combined with product-specific weights. 85% of the total product weight was delivered through our B2C businesses in Personal Health and 15% through our B2B businesses (Diagnosis & Treatment businesses and Connected Care & Health Informatics businesses).
We can account for some 19,000 tonnes or approximately 10% of those products being collected,re-used or recycled globally in 2015. Europe has advanced collection systems in place. In these countries we have an average return rate of around40-50%. National legislation is required to create the level playing field needed to set up efficient recycling systems beyond the EU. The main pathways and quantities for materialre-use in 2015 were:
Trade-in and return for resale as refurbished products and for spare parts harvesting (Diagnosis & Treatment and Connected Care & Health Informatics) some 2,400 tonnes, largely unchanged from 2014.
Collective collection and recycling schemes according to the EU Waste Electrical and Electronic Equipment (WEEE) collection schemes. Those products are broken down into the main material fractions and provided to the market via our recycling partners
800 tonnes from Diagnosis & Treatment and Connected Care & Health Informatics field returns, following the WEEE category 8 classification, indicating a slight decrease compared to the previous year (900 tonnes)
16,000 tonnes from Personal Health, following the WEEE category 2 classification
On the demand side, the Personal Health businesses havere-integrated significantly more recycled plastics in new products than last year, closing the material loop for some 1,440 tonnes of plastics, up from 900 tonnes in 2015.
More information can be found on thecircular economy website.
At Philips Lighting, circular economy activities are covered as part of their Green Revenues.
228 Annual Report 2016
Sustainability statements 12.4.2
Operational carbon footprint for logistics
in kilotonnes CO2-equivalent
| 2009 | 2010 | 2011 | 2012 | 2013 | ||||||||||||||||
Air transport | 308 | 345 | 328 | 309 | 326 | |||||||||||||||
Road transport | 174 | 160 | 176 | 105 | 108 | |||||||||||||||
Sea transport | 145 | 167 | 153 | 132 | 141 | |||||||||||||||
|
|
|
| |||||||||||||||||
Philips Group | 627 | 672 | 657 | 546 | 575 | |||||||||||||||
13.3.212.4.2 Biodiversity
Philips recognizes the importance of healthy ecosystems and rich biodiversity for our company, our employees, and society as a whole. We aim to minimize any negative impacts and actively promote ecosystem restoration activities including biodiversity restoration projects with social components, sustainable development, poverty relief,activities.
The Philips Biodiversity policy was issued in 2014 and carbon offsetting.
In 2013 Philipsprogress was made significant steps forward inon biodiversity management, both on sites (e.g. impact measurement), on natural capital valuation and on theat management level. The stepsMost initiatives were led by the Philips Leadersenvironmental coordinators at our sites, for Nature (LFN) team, site management, local sustainability organizations worldwide, sustainability managers,example at our Best and Group SustainabilityDrachten sites in Eindhoven, the Netherlands. We made intensive use of the internal company-wide social network platform to create and share activities and achievements including training programs. We continued our global partnership with the International Union for the Conservation of Nature (IUCN)The Netherlands, Committee and our participation in the IUCN LFN program which brings companies, NGOs and government together to workserve as role models on the topic of business and biodiversity.
Our projectsPhilips participated in 2013 included improving our understanding2015 in the development of biodiversity by organizing together with the IUCN a very well-attended Business & Ecosystems Training (BET) on the topics of Natural Capital Ecosystem ServicesProtocol and Biodiversityvolunteered as a pilot company. These activities continued in 2016. The environmental impact of the Royal Philips sites is limited as they are not very energy-intensive and the link to business. We worked on actively preserving biodiversity in and around our industrial sites with local communities and environmental organizations. In the Netherlands, the Drachten Consumer Lifestyle and Best Healthcare plants restructured their sites for optimal restorationdo not emit large quantities of biodiversity and employee well-being. Other examples are a large-scale employee-led biodiversity initiative in Reedsville, Pennsylvania; and conservation efforts in the Miribel (France), Ketrzyn Farel and Pila (Poland), San Jose (USA), Varginha (Brazil), and Pune (India) sites for example. In addition Philips employees established a community garden at theHigh-Tech Campus in Eindhoven (the Netherlands). A diverse team organized several internal and external events for the Netherlands sustainability day in October 2013 – including an introduction to the Circular Economy program and a product disassembly workshop. Finally, Philips co-hosted the “Mind Your Business” event with PwC and the Netherlands Ministry of Economic Affairs on ‘The transition to a bio-based economy – the role of government, thehigh-impact substances. The impact of/for companies, and partnerships/networks – the necessity of joint projects and knowledge sharing’.
We also conducted a biodiversity survey and water risk investigation of our industrial sites. The biodiversity survey results have enabled us to build a knowledge basesupply chain however is significantly higher than our own impact. For this reason, we used the identifiedhot-spots in our supply chain as input for our CDP Supply Chain program. More information on that program can be found insub-section 12.3.8, Supplier indicators, of endangered and resident species, nature reserves and wildlife corridors, biodiversity initiatives and partnerships at Philips industrial sites. This will enable us to prepare biodiversity guidelines for sites.
Philips commissioned Trucost, in 2013, to perform an Environmental Profit and Loss (EP&L) analysis using 2012 data to help identify natural capital dependency “hot spots” and place a financial value on Philips environmental impacts. The preliminary results show that between 2007 and 2012 Philips was able to decrease its exposure to natural capital risks and hence be better positioned to succeed in a natural capital constrained economy. Together with the WBCSD we will further develop the EP&L concept and methodology, including the environmental benefits.
To build and expand the Philips biodiversity strategy Philips has developed a biodiversity policy.this report.
13.3.3 Green12.4.3 Sustainable Operations
In 2010, we decided to group all activitiesThe Royal Philips HealthTech businesses and Philips Lighting Sustainable Operations programs related to improving the environmental performance of our manufacturing facilities (including chemicals management) under the Green Manufacturing 2015 program, which we renamed to Green Operations. The program focusesfocus on most contributors to climate change, but also addressesaddress water, recycling of waste and chemical substances.
In the courseFor an overview of 2013 we implemented an improved process to report chemicals used in processes in more detail. Based on the new insights gained, we included a few additional substances to our reporting scope in 2013. These substances do not have a material impact on our reported data. New chemicals on which we will focus our reduction efforts and new reduction targets will be incorporated in the next Green Operations program.Philips’ industrial sites, please visit: Philips industrial sites.
Royal Philips HealthTech businesses
Green Operations
in % unless otherwise stated2016
| 2007 | 2013 | 2015 | ||||||||||
| baseline year | actual1) | target1) | ||||||||||
Total CO2from manufacturing | | 865 kilotonnes CO2 - equivalent | | (19 | ) | (25 | ) | |||||
Water | 4.2 million m | 3 | 20 | (10 | ) | |||||||
Materials provided for recycling via external contractor per total waste | 79 | 81 | 80 | |||||||||
Restricted substances: | ||||||||||||
Benzene emission | 52 kg | (100 | ) | achieved | ||||||||
Mercury emission | 185 kg | (96 | ) | (100 | ) | |||||||
CFCs, HCFCs | 156 kg | (100 | ) | achieved | ||||||||
Hazardous substances | ||||||||||||
Lead emission | 1,838 kg | (100 | ) | achieved | ||||||||
PFCs | 1,534 kg | 248 | (35 | ) | ||||||||
Toluene emission | 2,210 kg | (46 | ) | (90 | ) | |||||||
Xylene emission | 4,506 kg | 525 | (90 | ) | ||||||||
Styrene | 80,526 kg | (93 | ) | achieved | ||||||||
Antimony, Arsenic and their compounds | 18 kg | (100 | ) | achieved | ||||||||
|
| |||||||||||
baseline year 2015 | target 20201) | 2016 actual | ||||||||||
|
| |||||||||||
Total CO2 from manufacturing | 84 Ktonnes | 0 Ktonnes | 85 Ktonnes | |||||||||
Water | 978,500 m3 | 10% reduction | 963,000 m3 | |||||||||
Zero waste to landfill | 3.2 kilotonnes | 0 tonnes | 2.9 kilotonnes | |||||||||
Operational waste recycling | 78% | 90% | 79% | |||||||||
Hazardous substances emissions | 1,419 kilos | 50% reduction | 1,099 kilos | |||||||||
VOC emissions | 169 tonnes | 10% reduction | 129 tonnes | |||||||||
|
| |||||||||||
| 1) | Against the base year |
Energy use in manufacturing
Total energy usage in manufacturing amounted to 14,1608,987 terajoules in 2013,2016, a decrease of 7% compared to 2015. Philips Lighting consumed about 66% of the total and realized a 13%year-on-year reduction, which Lighting consumes about 79%. Compared to 2012, energy consumption at Philips went down by 2%. This was mainly driven by new acquisitions reporting for the first time, organizational changesa reduction of energy-intensive operations and energy efficiency improvements in the factories. The Connected Care & Health Informatics businesses realized a decrease in energy consumption of 5% due to operational changes. Energy consumption in the Diagnosis & Treatment businesses increased by 8%, which was mainly due to the inclusion of two newly acquired sites. In the Personal Health businesses, site expansions and changed demand caused an increase in energy consumption, which was partly offset by energy efficiency improvements. The energy of discontinued operations amounted to 2,231 terajoules in 2016 (2015: 2,179 terajoules).
Philips Group
Total energy consumption in manufacturingin terajoules
in terajoules2012 - 2016
| 2009 | 2010 | 2011 | 2012 | 2013 | ||||||||||||||||
Healthcare | 1,670 | 1,545 | 1,541 | 1,798 | 1,794 | |||||||||||||||
Consumer Lifestyle | 1,188 | 1,274 | 1,252 | 1,104 | 1,142 | |||||||||||||||
Lighting | 11,535 | 11,580 | 11,189 | 11,519 | 11,224 | |||||||||||||||
Innovation, Group & Services | 28 | 27 | — | — | — | |||||||||||||||
|
| |||||||||||||||||||
Philips Group | 14,421 | 14,426 | 13,982 | 14,421 | 14,160 | |||||||||||||||
|
| |||||||||||||||||||
| 2012 | 2013 | 2014 | 2015 | 2016 | ||||||||||||||||
|
| |||||||||||||||||||
Personal Health | 1,329 | 1,369 | 1,352 | 1,389 | 1,436 | |||||||||||||||
Diagnosis & Treatment | 1,248 | 1,238 | 1,202 | 1,214 | 1,316 | |||||||||||||||
Connected Care & Health Informatics | 325 | 329 | 334 | 336 | 318 | |||||||||||||||
Lighting | 9,112 | 9,027 | 8,369 | 6,763 | 5,917 | |||||||||||||||
|
| |||||||||||||||||||
Philips Group | 12,014 | 11,963 | 11,257 | 9,702 | 8,987 | |||||||||||||||
|
| |||||||||||||||||||
Operational carbon footprint and energy efficiency - 2016 details
Becoming carbon-neutral in our operations by 2020 is one of the key targets, after already reducing our operational carbon footprint very significantly during the past years (40% decrease in CO2 emissions in 2015 compared to our 2007 base year). Our carbon footprint decreased by 5% compared to 2015, resulting in a total of 1,344 kilotonnes CO2.
The 2016 results can be attributed to several factors:
| • | Accounting for 24% of the total footprint, total CO2 emissions from manufacturing decreased by 17% due to operational changes resulting in decreased energy usage and a lower load (mainly in Philips Lighting); additionally the share coming from renewable sources increased. |
| • | CO2 emissions fromnon-industrial operations (offices, warehouses, etc.), representing 8% of the total emissions, increased this year due to increased overall floor space in ournon-industrial real estate portfolio. This resulted in a 3% carbon emission increase compared to 2015. In 2017, we will continue to focus on the most efficient use of facility space and increase the share of purchased electricity from renewable sources. |
| • | The total CO2 emissions related to business travel, accounting for 14% of our carbon footprint, showed a decrease of 4% compared to 2015. The reductions achieved with business flights and our lease cars was partially mitigated by an increase in our rental car emissions. |
| • | Overall CO2 emissions from logistics, representing 53% of the total, showed no overall change compared to 2015. We recorded an increase in emissions from air and road freight in Royal Philips, which was mitigated by a decrease in Philips Lighting. |
Annual Report 2016 229
Sustainability statements 12.4.3
This increase in air freight combined with reduced emissions from parcel, road and ocean freight resulted in no overall change in our logistics emissions.
Philips Group
Operational carbon footprint for logistics
in kilotonnes CO2-equivalent
2012 - 2016
|
| |||||||||||||||||||
| 2012 | 2013 | 2014 | 2015 | 2016 | ||||||||||||||||
|
| |||||||||||||||||||
Air transport | 366 | 385 | 348 | 429 | 448 | |||||||||||||||
Road transport | 169 | 174 | 164 | 118 | 117 | |||||||||||||||
Ocean transport | 210 | 227 | 208 | 171 | 153 | |||||||||||||||
|
| |||||||||||||||||||
Philips Group | 745 | 786 | 720 | 718 | 718 | |||||||||||||||
|
| |||||||||||||||||||
Carbon emissions in manufacturing
The greenhouse gas emissions of our manufacturing operations totaled 705323 kilotonnes CO2-equivalent in 2013, 2% higher2016, 13% lower than in 2012.2015. This iswas the result of new acquisitions reporting fordecreased energy usage in manufacturing and operational changes. Direct CO2 emissions represented 56% of the first time and increased usage of specific process chemicals.total, which decreased by 10%. Indirect CO2 emissions overall decreased, mainly as a resultrepresented 38%, an decrease of increased usage18% due to lower electricity consumption. The carbon emissions of electricity generated by renewable sources.discontinued operations amounted to 175 kilotonnes CO2-equivalent in 2016 (2015: 145 kilotonnes CO2-equivalent).
Annual Report 2013 235
13 Sustainability statements 13.3.2 - 13.3.3
Philips Group
Total carbon emissions in manufacturing
in kilotonnes CO2-equivalent
2012 - 2016
| 2009 | 2010 | 2011 | 2012 | 2013 | ||||||||||||||||
Direct CO21) | 295 | 299 | 294 | 294 | 281 | |||||||||||||||
Indirect CO2 | 443 | 317 | 273 | 310 | 293 | |||||||||||||||
Other greenhouse gases | 54 | 34 | 40 | 60 | 104 | |||||||||||||||
From glass production | 24 | 25 | 28 | 27 | 27 | |||||||||||||||
|
| |||||||||||||||||||
Philips Group2) | 816 | 675 | 635 | 691 | 705 | |||||||||||||||
|
| |||||||||||||||||||
| 2012 | 2013 | 2014 | 2015 | 2016 | ||||||||||||||||
|
| |||||||||||||||||||
Direct CO21) | 278 | 276 | 253 | 200 | 181 | |||||||||||||||
Indirect CO2 | 252 | 208 | 185 | 148 | 122 | |||||||||||||||
Other greenhouse gases | 6 | 7 | 6 | 6 | 4 | |||||||||||||||
From glass production | 27 | 27 | 24 | 17 | 16 | |||||||||||||||
|
| |||||||||||||||||||
Philips Group2) | 563 | 518 | 468 | 371 | 323 | |||||||||||||||
|
| |||||||||||||||||||
| 1) | From energy |
| 2) | Excludingnon-reporting |
CO2 emissions decreased at Healthcare due to energy efficiency improvements and increased use of electricity generated by renewable sources, this was however partly mitigated by new acquisitions reporting for the first time. Lighting increased its CO2 emissions due to the increased use of specific process chemicals, mitigated by electricity generated by renewable sources.Philips Group
Total carbon emissions in manufacturing per sectorsegment
in kilotonnes CO2-equivalent
2012 - 2016
| 2009 | 2010 | 2011 | 2012 | 2013 | ||||||||||||||||
Healthcare | 118 | 57 | 54 | 70 | 58 | |||||||||||||||
Consumer Lifestyle | 53 | 42 | 39 | 38 | 38 | |||||||||||||||
Lighting | 644 | 575 | 542 | 583 | 609 | |||||||||||||||
Innovation, Group & Services | 1 | 1 | — | — | — | |||||||||||||||
|
| |||||||||||||||||||
Philips Group | 816 | 675 | 635 | 691 | 705 | |||||||||||||||
|
| |||||||||||||||||||
| 2012 | 2013 | 2014 | 2015 | 2016 | ||||||||||||||||
|
| |||||||||||||||||||
Personal Health | 54 | 50 | 45 | 49 | 59 | |||||||||||||||
Diagnosis & Treatment | 52 | 35 | 31 | 28 | 22 | |||||||||||||||
Connected Care & Health Informatics | 14 | 9 | 8 | 7 | 4 | |||||||||||||||
Lighting | 443 | 424 | 384 | 287 | 238 | |||||||||||||||
|
| |||||||||||||||||||
Philips Group | 563 | 518 | 468 | 371 | 323 | |||||||||||||||
|
| |||||||||||||||||||
Restricted substancesCO
2 emissions decreased significantly at Philips Lighting due to reduced energy usage resulting from operational changes and energy efficiency improvements. Emissions at the Diagnosis & Treatment businesses decreased due to an increase in use of restricted substances totaled 9 kiloselectricity generated by renewable sources, partially offset by two newly acquired sites. The Connected Care & Health Informatics businesses segment decreased its CO2 emissions due to lower energy consumption. At the Personal Health businesses, CO2 emissions increased due to a decrease in 2013, a significant decrease comparedthe use of electricity generated by renewable sources. In December 2016, the Los Mirasoles windfarm in the US started to 2012 mainly asproduce electricity. As a result, all our US operations will be powered by wind energy in 2017, a clear step towards our ambition to become carbon-neutral in our operations by 2020.
Hazardous substances emissions
In the ‘Healthy people, sustainable planet’ program, new chemical reduction targets have been defined, on the most relevant categories of substances for Royal Philips, being hazardous substance emissions as well as VOC (Volatile Organic Compounds) emissions. As part of the continued reduction in mercury emissions in Lighting, and more accurate measurements. With the Green Operations program we continue to focus on a selectiondeployment of the most importantnew program, reduction targets at our industrial sites are being agreed. For more information on Philips Lighting’s emissions please refer to their Annual Report.
Royal Philips HealthTech businesses
Hazardous substances emissionsin our processes.
Restricted substanceskilos
in kilos2015 - 2016
| 2009 | 2010 | 2011 | 2012 | 2013 | ||||||||||||||||
Benzene and Benzene compounds | 136 | 101 | 55 | — | — | |||||||||||||||
Mercury and Mercury Compounds | 122 | 83 | 51 | 54 | 8 | |||||||||||||||
CFCs/HCFCs1) | 14 | 4 | 5 | 1 | 1 | |||||||||||||||
|
| |||||||||||||||||||
Total | 272 | 188 | 111 | 55 | 9 | |||||||||||||||
Personal Health Diagnosis & Treatment Connected Care & Health Informatics HealthTech In 2016, emissions of hazardous substances decreased by 23%, mainly caused by reduced usage of harmful chemicals at a Diagnosis & Treatment businesses site and a Personal Health businesses site and changing processes at multiple sites in all segments. | |||||||||||||||||||||||||||||||||||||||||||||||||||||||||||||||||||||||||||||||||||||||||||
BenzeneVOC emissions
LightingRoyal Philips HealthTech businesses
VOC emissions in tonnes
2015 - 2016
|
| |||||||
| 2015 | 2016 | |||||||
|
| |||||||
Personal Health | 138 | 92 | ||||||
Diagnosis & Treatment | 29 | 35 | ||||||
Connected Care & Health Informatics | 2 | 2 | ||||||
|
| |||||||
HealthTech | 169 | 129 | ||||||
|
| |||||||
VOC emissions reduced significantly in 2016 (by 24%) to 129 tonnes. This decrease was the only sector that used benzene in manufacturing, but has been successful in 2012mainly driven by a number of industrial sites in the phase-outPersonal Health businesses segment, which changed their lacquering processes, as well as changes in the product mix. This was slightly offset by the inclusion of benzene.
Mercury
Mercury is used exclusively by Lighting. Emissions decreased from 54 kgtwo newly acquired industrial sites in 2012 to 8 kg in 2013, due to continued emissions reductions activities and improved measurements.
Sustainability world map
CFCs/HCFCs
In 2013 total emissions from CFCs/HCFCs remained at 1 kg.
Hazardous substances
Targets have been set on a selected number of hazardous substances.
Hazardous substances
in kilos
| 2009 | 2010 | 2011 | 2012 | 2013 | ||||||||||||||||
Lead and lead compounds | 1,958 | 108 | 44 | 73 | 1 | |||||||||||||||
PFCs (Per Fluorinated Compounds) | 2,535 | 1,507 | 1,842 | 2,560 | 5,331 | |||||||||||||||
Toluene | 2,160 | 6,745 | 5,745 | 6,184 | 1,190 | |||||||||||||||
Xylene | 4,619 | 30,491 | 37,889 | 18,947 | 28,176 | |||||||||||||||
Styrene | 21,567 | 22,920 | 19,920 | 42,329 | 5,753 | |||||||||||||||
Antimony, Arsenic and their compounds | 30 | 24 | 37 | — | — | |||||||||||||||
|
| |||||||||||||||||||
Total | 32,869 | 61,795 | 65,477 | 70,093 | 40,451 | |||||||||||||||
Lead and lead compounds
The strong decrease in 2013 was mainly due to more accurate calculations based on the improved reporting process.
PFCs
The increase in 2013 to 5,331 kg was caused by Lumileds sites where PFCs are used as process chemicals.
Toluene
The emission of toluene, mainly used in wet lacquers, decreased by 81% in 2013 largely as a result of phase-out programs in Consumer Lifestyle.
Xylene
The use of xylene increased by 49% due to increased production at Consumer Lifestyle sites.
Styrene
Styrene is mainly used in Lighting. In 2013, the emission of styrene decreased significantly due to more accurate calculations based on the improved reporting process.
Antimony, Arsenic and their compounds
Lighting was successful in phasing-out these substances.Diagnosis & Treatment businesses segment.
ISO 14001 certification
Most of the Royal Philips manufacturing sites are certified under the umbrella certificates for the Diagnosis & Treatment, Connected Care & Health Informatics and Personal Health businesses segments. Philips Lighting also has an umbrella certificate. In 2013, 80%2016, 82% of reporting manufacturing sites were certified. Thiscertified, a 4% increase compared to 2015. Two sites were newly
230 Annual Report 2016
Sustainability statements 12.4.3
certified this year in the previous year is attributablePersonal Health businesses segment, and the two sites in the Diagnosis & Treatment businesses segment that started to new acquisitions being certified for the first time. The sectors have programs in place to address certification at new sites.report were not yet certified.
Philips Group
ISO 14001 certification
as a % of all reporting organizations
2012 – 2016
| 2009 | 2010 | 2011 | 2012 | 2013 | ||||||||||||||||
Philips Group | 92 | 95 | 89 | 71 | 80 | |||||||||||||||
|
| |||||||||||||||||||
| 2012 | 2013 | 2014 | 2015 | 2016 | ||||||||||||||||
|
| |||||||||||||||||||
Philips Group | 69 | 79 | 79 | 78 | 82 | |||||||||||||||
|
| |||||||||||||||||||
Environmental Incidentsincidents
In 2013, 3 incidents2016, the Personal Health businesses reported one environmental incident with noise and four non-compliances. One was related to noise, followed by a technical project to meet the requirements; two were reported by Healthcare related to waste water and a leakage. Consumer Lifestyle reported 1storm water permits which werefollowed-up by corrective actions; and one administrative incident was related to emissions to air and Lightingwaste. The Diagnosis & Treatment businesses reported 3 incidentsone environmental incident with an oil spill which did not result in soil pollution. The Connected Care & Health Informatics businesses reported one environmentalnon-compliance which was related to waste water andwater. Philips Lighting did not experience any environmental incidents but reported fournon-compliances, of which one resulted in a leakage. There were no fines reported in our sustainability reporting tool in connection with anynon-material fine (manufacturing site exceeding the usage limit of the incidents.its emergency generator).
236 Annual Report 20132016 231
13 Sustainability statements 13.3.3 - 13.3.312.4.3
Sustainability world map
To find out about our Health and Safety, Waste, Water and Emissions metrics at global, regional and market level, go towww.results.philips.com/interactive-worldmap
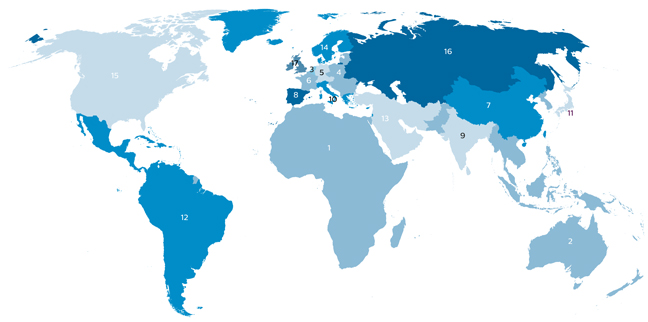
| Total waste | Emissions (kg) | |||||||||||||||||||||||||||||||
| Markets | Manufacturing sites | Lost Workday Injury rate* | CO2 emitted (Tonnes CO2) | Waste (Tonnes) | Recycled (%) | Water (m3) | Restricted substances | Hazardous substances | ||||||||||||||||||||||||
1. Africa | 0 | 0.33 | — | — | — | — | — | — | ||||||||||||||||||||||||
2. ASEAN | 7 | 0.09 | 251,450 | 7,827 | 57 | % | 1,276,133 | 4 | 5,520 | |||||||||||||||||||||||
3. Benelux | 13 | 0.31 | 32,176 | 20,057 | 89 | % | 590,061 | 1 | 177 | |||||||||||||||||||||||
4. Central & East Europe | 8 | 0.32 | 72,092 | 18,628 | 85 | % | 491,337 | 0 | 22,045 | |||||||||||||||||||||||
5. DACH | 4 | 0.46 | 5,515 | 2,926 | 90 | % | 191,435 | 1 | 3 | |||||||||||||||||||||||
6. France | 4 | 1.15 | 3,119 | 747 | 76 | % | 19,179 | 0 | 36 | |||||||||||||||||||||||
7. Greater China | 13 | 0.16 | 119,750 | 7,625 | 86 | % | 988,721 | 1 | 1,724 | |||||||||||||||||||||||
8. Iberia** | 2 | 1.22 | — | — | — | — | — | — | ||||||||||||||||||||||||
9. Indian Subcontinent | 5 | 0.11 | 69,491 | 7,316 | 100 | % | 267,278 | 0 | 24 | |||||||||||||||||||||||
10. Italy, Israel and Greece | 4 | 0.76 | 5,461 | 1,614 | 66 | % | 26,622 | 0 | 4,738 | |||||||||||||||||||||||
11. Japan | 0 | 0.00 | — | — | — | — | — | — | ||||||||||||||||||||||||
12. Latin America | 6 | 0.14 | 188 | 1,282 | 93 | % | 27,126 | 0 | 780 | |||||||||||||||||||||||
13. Middle East & Turkey | 0 | 0.14 | — | — | — | — | — | — | ||||||||||||||||||||||||
14. Nordics | 2 | 0.28 | 15 | 57 | 99 | % | 1,249 | 0 | 0 | |||||||||||||||||||||||
15. North America | 40 | 0.28 | 141,559 | 21,937 | 70 | % | 1,140,441 | 2 | 5,366 | |||||||||||||||||||||||
16. Russia and Central Asia | 0 | 0.00 | — | — | — | — | — | — | ||||||||||||||||||||||||
17. UK & Ireland | 3 | 0.37 | 3,808 | 1,918 | 85 | % | 24,780 | 0 | 38 | |||||||||||||||||||||||
| Philips Group | Total waste | Emissions2) | ||||||||||||||||||||||||||||||||||||||
| Market | Manufacturing sites | Total recordable case rate1) | CO2 emitted (Tonnes CO2) | Waste (Tonnes) | Recycled (%) | Water (m3) | Hazardous substances (kg) | VOC (Tonnes) | ||||||||||||||||||||||||||||||||
Africa | — | 0.00 | — | — | — | — | — | — | ||||||||||||||||||||||||||||||||
ASEAN and the Pacific | 1 | 0.12 | 21,307 | 1,463 | 91% | 74,738 | 5 | 25 | ||||||||||||||||||||||||||||||||
Benelux | 6 | 0.22 | 10,757 | 8,726 | 80% | 235,372 | 157 | 12 | ||||||||||||||||||||||||||||||||
Central & Eastern Europe | 7 | 0.30 | 61,274 | 7,019 | 81% | 243,260 | 92 | 20 | ||||||||||||||||||||||||||||||||
Germany, Austria and Switzerland | 4 | 0.50 | 7,616 | 3,050 | 89% | 53,264 | 389 | 6 | ||||||||||||||||||||||||||||||||
France | 2 | 0.76 | 1,284 | 5,123 | 95% | 182,370 | — | — | ||||||||||||||||||||||||||||||||
Greater China | 11 | 0.14 | 75,592 | 6,663 | 90% | 977,947 | 311 | 27 | ||||||||||||||||||||||||||||||||
Iberia | 2 | 0.66 | 2,398 | 2,042 | 82% | 47,291 | — | — | ||||||||||||||||||||||||||||||||
Indian Subcontinent | 5 | 0.10 | 65,148 | 2,552 | 96% | 57,174 | 6 | 4 | ||||||||||||||||||||||||||||||||
Italy, Israel and Greece | 4 | 0.53 | 6,829 | 2,117 | 76% | 22,529 | 15 | 5 | ||||||||||||||||||||||||||||||||
Japan | — | 0.20 | — | — | — | — | — | — | ||||||||||||||||||||||||||||||||
Latin America | 11 | 0.35 | 12,927 | 8,107 | 82% | 173,474 | — | 8 | ||||||||||||||||||||||||||||||||
Middle East & Turkey3) | 3 | 0.27 | — | — | — | — | — | — | ||||||||||||||||||||||||||||||||
Nordics | — | 0.20 | — | — | — | — | — | — | ||||||||||||||||||||||||||||||||
North America | 24 | 0.94 | 48,193 | 16,799 | 76% | 337,998 | 47 | 18 | ||||||||||||||||||||||||||||||||
Russia and Central Asia | — | 0.00 | — | — | — | — | — | — | ||||||||||||||||||||||||||||||||
UK & Ireland | 2 | 0.06 | 9,096 | 1,102 | 85% | 8,501 | 77 | 4 | ||||||||||||||||||||||||||||||||
Includes manufacturing andnon-manufacturing sites |
HealthTech |
| 3) | Three manufacturing sites did not start |
232 Annual Report 2013 2372016
13 Sustainability statements 13.4 - 13.412.5
13.4 Independent assurance12.5 Assurance report of the independent auditor
To theTo: The Supervisory Board and Shareholders of Koninklijke Philips N.V.:
Our Opinion
We were engaged byhave audited the Supervisory BoardSustainability Information in the annual report of Koninklijke Philips N.V. (further ‘Philips’) to provide assurance on(the Company), based in Eindhoven, the informationNetherlands for the year ended December 31, 2016. The scope of our audit engagement is described in Section “Our Scope”. An audit engagement is aimed at obtaining reasonable assurance.
In our opinion, the Sustainability Information in the chapter Sustainability statements and the sections Social performance and Environmental performance in the Annual Report 2013 (further ‘The Sustainability Information’). The Board of Management is responsible for the preparation of The Sustainability Information, including the identification of material issues. Our responsibility is to issue an assuranceannual report based on the engagement outlined below.
Scope
Our assurance engagement was designed to provide reasonable assurance on whether The Sustainability Information is presented fairly,2016 presents, in all material respects, a reliable and adequate view of:
the policy and business operations with regard to sustainability; and
the thereto related events and achievements for the year ended December 31, 2016
in accordance with the GRI Standards of Global Reporting Initiative (GRI) (option Comprehensive) and the supplemental internally applied reporting criteria.criteria as disclosed in section 12.1 Approach to sustainability reporting in chapter 12 Sustainability statements of the annual report 2016.
Basis for our opinion
We have performed our audit on the Sustainability Information in accordance with Dutch law, including Dutch Standard 3810N “Assurance engagements relating to sustainability reports”. Dutch Standard 3810N is a subject specific standard under the International Standard on Assurance Engagements (ISAE) 3000 “Assurance Engagements Other Than Audits or Reviews of Historical Financial Information”. Our responsibilities under this standard are further described in the Section “Our responsibilities for the audit of the Sustainability Information”.
We believe that the audit evidence we have obtained is sufficient and appropriate to provide a basis for our opinion.
Our Independence
We are independent of the Company in accordance with the “Verordening inzake de onafhankelijkheid van accountants bij assurance-opdrachten” (ViO) (Code of Ethics for Professional Accountants, a Dutch regulation with respect to independence) and other relevant independence regulations in the Netherlands. This includes that we do not perform any activities that could result in a conflict of interest with our independent assurance engagement. Furthermore, we have complied with the “Verordening gedrags- en beroepsregels accountants” (VGBA, Dutch Code of Ethics).
Our Scope
The Sustainability Information comprises chapter 12 Sustainability statements and sections 2.2 Social performance and 2.3 Environmental performance of the annual report 2016 and provides a representation of the Company’s policy, the related business operations, events and achievements relating to sustainability during 2016.
The Sustainability Information includes prospective information such as ambitions, strategy, plans, expectations and estimates. Inherent to this information is that the actual results may differ in the future and are therefore uncertain. We do not provide any assurance on the achievability and feasibility of this prospective information.
The references, excluding “Methodology for calculating Lives Improved” and “GRI content index”, in the Sustainability Information (www.philips.com, external websites, interviews and other documents) are outside the scope of our assurance engagement.
We have read the information on sustainability in the rest of the objectives, targetsannual report 2016 and expectations of Philips.
Reporting criteria and assurance standard
Philips appliesto the extent we can identify this information is consistent with the Sustainability Reporting Guidelines G4Information in scope of our audit.
Responsibilities of management for the Sustainability Information
Management of the Global Reporting Initiative supported byCompany is responsible for the preparation of the Sustainability Information in accordance with the GRI Standards (option Comprehensive) and the supplemental internally developed guidelinesapplied reporting criteria as describeddisclosed in section 12.1 Approach to sustainability reporting in the chapter 12 Sustainability statements of this Annual Report. Itthe annual report 2016. This responsibility includes the identification of stakeholders and the determination of material aspects. The choices made by management regarding the scope of the Sustainability Information and the reporting policy of the Company is importantsummarized in section 12.1 Approach to viewsustainability reporting.
Furthermore, management is responsible for such internal control as it determines is necessary to enable the performance datapreparation of the Sustainability Information that is free from material misstatement, whether due to fraud or errors.
Our responsibilities for the audit of the Sustainability Information
Our responsibility is to plan and perform the audit engagement in a manner that allows us to obtain sufficient and appropriate audit evidence for our opinion.
Reasonable assurance is a high, but not absolute level of assurance, which means we may not have detected all material errors and fraud. Misstatements can arise from fraud or errors and are considered material if, individually or in the contextaggregate, they could reasonably
Annual Report 2016 233
Sustainability statements 12.5
be expected to influence the economic decisions of these criteria.users taken on the basis of the Sustainability Information. The materiality affects the nature, timing and extent of our audit procedures and the evaluation of the effect of identified misstatements on our opinion.
We conducted our engagementapply the “Nadere voorschriften accountantskantoren ter zake van assurance opdrachten (RA/AA)” and accordingly maintain a comprehensive system of quality control including documented policies and procedures regarding compliance with ethical requirements, professional standards and applicable legal and regulatory requirements.
We have exercised professional judgement and have maintained professional skepticism throughout the audit, in accordance with the Dutch Standard 3410N: Assurance engagements relating to sustainability reports3810N, ethical requirements and which is a specific part of the International Standard for Assurance Engagement (ISAE 3000): Assurance Engagement other than Audits or Reviews of Historical Financial Information, issued by the International Auditing and Assurance Standards Board. This standard requires, among others, that the assurance team possesses the specific knowledge, skills and professional competencies needed to provide assurance on sustainability information, and that they comply with the requirements of the Code of Ethics for Professional Accountants of the International Federation of Accountants to ensure their independence.
Work undertakenindependence requirements.
Our proceduresaudit included performing a risk assessment (part of which was a media search), assessingamongst others:
Evaluating the appropriateness of the accounting policies used, evaluatingreporting policy, its consistent application, including the evaluation of the results of the stakeholders’ dialogue, the reasonableness of management’s estimates and the related disclosures made by management.
Performing an external environment analysis and obtaining insight into relevant social themes and issues and the characteristics of the organization.
Identifying and assessing the risks of material misstatement of the Sustainability Information, whether due to errors or fraud, designing and performing audit procedures responsive to those risks, and obtaining audit evidence that is sufficient and appropriate to provide a basis for our opinion. The risk of not detecting a material misstatement resulting from fraud is higher than for one resulting from errors, as fraud may involve collusion, forgery, intentional omissions, misrepresentations, or the override of internal control.
Interviewing management and relevant staff responsible for the sustainability’s strategy, policy and achievements.
Interviewing relevant staff at corporate level responsible for providing the information in the Sustainability Information, carrying out internal control procedures on the data and consolidating the data in the Sustainability Information.
Evaluating the design and implementation and testing the operating effectiveness of the reporting systems and processes for collectingrelated to the Sustainability Information.
Evaluating the underlying transactions and processingevents.
Visits to production sites to evaluate the qualitativesource data and quantitative information in The Sustainability Information (includingto evaluate the design and implementation of thesecontrol, including validation procedures, at a number of sites),local level.
Testing relevant data and evaluating the overall presentation of sustainability information within our scope. Also we held interviews with relevant managementinternal and testedexternal documentation, on a sample basis, to determine whether the information is supported by sufficient evidence.
Additionally we determined, to the extent we can assess, whether the information concerning sustainability in the other sectionsreliability of the Annual Report 2013 is consistent with the information in The Sustainability Information.
Opinion
In our opinion, The Sustainability Information presents fairly, in all material respects, the sustainability performance of Philips in accordance with the reporting criteria.
We also report, to the extent we can assess, that the information on sustainability in the restAn analytical review of the Annual Report 2013 is consistent with information in Thedata and trends submitted for consolidation at corporate level.
Evaluating the overall presentation, structure and content of the Sustainability Information.
Amsterdam, The Netherlands
February 25, 201421, 2017
KPMGErnst & Young Accountants N.V.LLP
J.F.C. van Everdingen RASubject matter expert sustainability
J. Niewold
Independent auditor
C.B. Boogaart
238234 Annual Report 20132016
Five-year overview 13 Sustainability statements 13.5 - 13.5
13.5 Global Reporting Initiative (GRI) table 4.013 Five-year overview
KPMG has audited Chapter 11Philips Group financial statements and Chapter 12 Company financial statements, as well as sections 4.2 Social performance, 4.3 Environmental performance and Chapter 13 Sustainability statements. Where
General data in the table cross-reference is made to these parts, the information is included in the scopemillions of one of these audits. For the other information in the report, KPMG has assessed whether this information is consistent with the information in the aforementioned parts. Where there is no cross-reference to a section in the Report, assurance is not applicable. Please refer to sections 11.10, 12.5 and 13.4 for the independent auditor’s reports.EUR unless otherwise stated
2012 - 2016
|
| |||||||||||||||||||
| 2012 | 2013 | 2014 | 2015 | 2016 | ||||||||||||||||
|
| |||||||||||||||||||
Sales | 22,234 | 21,990 | 21,391 | 24,244 | 24,516 | |||||||||||||||
% increase over previous year | 12 | % | (1 | )% | (3 | )% | 13 | % | 1 | % | ||||||||||
Income from operations (EBIT) (loss) | 592 | 1,855 | 486 | 992 | 1,882 | |||||||||||||||
Financial income and expenses - net | (329 | ) | (330 | ) | (301 | ) | (369 | ) | (493 | ) | ||||||||||
Income (loss) from continuing operations | (166 | ) | 1,034 | 221 | 414 | 1,075 | ||||||||||||||
Income (loss) from continuing operations attributable to shareholders | (171 | ) | 1,031 | 225 | 400 | 1,032 | ||||||||||||||
Income (loss) from Discontinued operations | 136 | 138 | 190 | 245 | 416 | |||||||||||||||
Net income (loss) | (30 | ) | 1,172 | 411 | 659 | 1,491 | ||||||||||||||
Net income (loss) attributable to shareholders | (35 | ) | 1,169 | 415 | 645 | 1,448 | ||||||||||||||
Net assets | 11,185 | 11,227 | 10,968 | 11,780 | 13,508 | |||||||||||||||
Total employees atyear-end (FTEs) | 118,087 | 116,082 | 113,678 | 112,959 | 114,731 | |||||||||||||||
|
| |||||||||||||||||||
Annual Report 2013 239Philips Group
13 Sustainability statements 13.52012 - 13.5
General Standard Disclosures
|
| |||||||||||||||||||
| 2012 | 2013 | 2014 | 2015 | 2016 | ||||||||||||||||
|
| |||||||||||||||||||
Income from operations (EBIT) | 592 | 1,855 | 486 | 992 | 1,882 | |||||||||||||||
as a % of sales | 2.7 | % | 8.4 | % | 2.3 | % | 4.1 | % | 7.7 | % | ||||||||||
Adjusted income from operations1) | 1,003 | 2,276 | 821 | 1,372 | 2,235 | |||||||||||||||
as a % of sales | 4.5 | % | 10.4 | % | 3.8 | % | 5.7 | % | 9.1 | % | ||||||||||
Income taxes | (218 | ) | (466 | ) | (26 | ) | (239 | ) | (327 | ) | ||||||||||
as a % of income before taxes | (82.9 | )% | (30.6 | )% | (14.1 | )% | (38.4 | )% | (23.5 | )% | ||||||||||
Income (loss) from continuing operations | (166 | ) | 1,034 | 221 | 414 | 1,075 | ||||||||||||||
Net income (loss) | (30 | ) | 1,172 | 411 | 659 | 1,491 | ||||||||||||||
|
| |||||||||||||||||||
| 1) |
| |||||
| ||||||
| ||||||
| ||||||
| ||||||
| ||||||
| ||||||
| ||||||
| ||||||
| ||||||
| ||||||
| ||||||
240 Annual Report 2013
13 Sustainability statements 13.5 - 13.5
| ||||||
| ||||||
| ||||||
| ||||||
| ||||||
| ||||||
| ||||||
| ||||||
| ||||||
|
| |||||
| ||||||
Annual Report 2013 241
13 Sustainability statements 13.5 - 13.5
| ||||||
| ||||||
| ||||||
| ||||||
| ||||||
| ||||||
| ||||||
| ||||||
| ||||||
| ||||||
| ||||||
Philips Group
242 Annual Report 2013Capital employed in millions of EUR unless otherwise stated
13 Sustainability statements 13.52012 - 13.5
| ||||||
| ||||||
| ||||||
| ||||||
| ||||||
| ||||||
| ||||||
| ||||||
| ||||||
| ||||||
| ||||||
Annual Report 2013 243
| ||||||
| ||||||
| ||||||
| ||||||
| ||||||
| ||||||
| ||||||
| ||||||
| ||||||
244 Annual Report 2013
13 Sustainability statements 13.5 - 13.5
| ||||||
| ||||||
| ||||||
| ||||||
| ||||||
| ||||||
| ||||||
| ||||||
| ||||||
| ||||||
| ||||||
| ||||||
| ||||||
| ||||||
| ||||||
| ||||||
Annual Report 2013 245
13 Sustainability statements 13.5 - 13.5
| ||||||
| ||||||
| ||||||
| ||||||
| ||||||
| ||||||
246 Annual Report 2013
13 Sustainability statements 13.5 - 13.5
| ||||||
| ||||||
| ||||||
| ||||||
| ||||||
| ||||||
| ||||||
| ||||||
| ||||||
| ||||||
Annual Report 2013 247
13 Sustainability statements 13.5 - 13.5
| ||||||
| ||||||
| ||||||
| ||||||
248 Annual Report 2013
13 Sustainability statements 13.5 - 13.5
| ||||||
| ||||||
| ||||||
| ||||||
| ||||||
| ||||||
Annual Report 2013 249
13 Sustainability statements 13.5 - 13.5
| ||||||
| ||||||
| ||||||
| ||||||
| ||||||
Disclosure of management approach
250 Annual Report 2013
14 Reconciliation of non-GAAP information 14 - 14
��
14 Reconciliation of non-GAAP information
Explanation of Non-GAAP measures
Koninklijke Philips N.V. (the ‘Company’) believes that an understanding of sales performance is enhanced when the effects of currency movements and acquisitions and divestments (changes in consolidation) are excluded. Accordingly, in addition to presenting ‘nominal growth’, ‘comparable growth’ is provided.
Comparable sales exclude the effects of currency movements and changes in consolidation. As indicated in the Significant accounting policies, sales and income are translated from foreign currencies into the Company’s reporting currency, the euro, at the exchange rate on transaction dates during the respective years. As a result of significant currency movements during the years presented, the effects of translating foreign currency sales amounts into euros could have a material impact. Therefore, these impacts have been excluded in arriving at the comparable sales in euros. Currency effects have been calculated by translating previous years’ foreign currency sales amounts into euros at the following year’s exchange rates in comparison with the sales in euros as historically reported. Years under review were characterized by a number of acquisitions and divestments, as a result of which activities were consolidated or deconsolidated. The effect of consolidation changes has also been excluded in arriving at the comparable sales. For the purpose of calculating comparable sales growth, when a previously consolidated entity is sold or contributed to a venture that is not consolidated by the Company, relevant sales are excluded from impacted prior-year periods. Similarly, when an entity is acquired, relevant sales are excluded from impacted periods.
The Company uses the term IFO and Adjusted IFO to evaluate the performance of the Philips Group and its operating sectors. The term IFO has the same meaning as Income from operations (IFO). Referencing Adjusted IFO will make the underlying performance of our businesses more transparent by factoring out the amortization of acquired intangible assets. Adjusted income from operations represents income from operations before amortization and impairment of intangible assets generated in acquisitions (excluding software and capitalized development expenses).
The Company believes that an understanding of the Philips Group’s financial condition is enhanced by the disclosure of net operating capital (NOC), as this figure is used by Philips’ management to evaluate the capital efficiency of the Philips Group and its operating sectors. NOC is defined as: total assets excluding assets classified as held for sale less: (a) cash and cash equivalents, (b) deferred tax assets, (c) other non-current financial assets and current financial assets, (d) investments in associates, and after deduction of: (e) provisions (f) accounts and notes payable, (g) accrued liabilities, (h) other non-current liabilities and other current liabilities.
Net debt is defined as the sum of long- and short-term debt minus cash and cash equivalents. The net debt position as a percentage of the sum of group equity (shareholders’ equity and non-controlling interests) and net debt is presented to express the financial strength of the Company. This measure is widely used by management and investment analysts and is therefore included in the disclosure. Our net debt position is managed in such a way that we expect to continiously meet our objective to retain an A3 rating (Moody’s) and A- rating (Standard and Poor’s). Furthermore, the Group’s objective when managing the net debt position is to fulfill our commitment to a stable dividend policy with a 40% to 50% pay-out of continuing net income.
Cash flows before financing activities, being the sum of net cash from operating activities and net cash from investing activities, and free cash flow, being net cash from operating activities minus net capital expenditures, are presented separately to facilitate the reader’s understanding of the Company’s funding requirements.
Net capital expenditures comprise of purchase of intangible assets, proceeds from sale of intangible assets, expenditures on development assets, capital expenditures on property, plant and equipment and proceeds from sales of property, plant and equipment. This measure is widely used by management to calculate free cash flow.
Adjustments
Prior-period financial statements have been restated for the treatment of Audio, Video, Multimedia and Accessories as discontinued operations (see note 7, Discontinued operations and other assets classified as held for sale) and the adoption of IAS 19R, which mainly relates to pension reporting (see note 30, Post-employment benefits)
Annual Report 2013 251
14 Reconciliation of non-GAAP information 14 - 14
Sales growth composition per sector
in %
| comparable growth | currency effects | consolidation changes | nominal growth | |||||||||||||
| 2013 versus 2012 | ||||||||||||||||
Healthcare | 0.8 | (4.6 | ) | (0.3 | ) | (4.1 | ) | |||||||||
Consumer Lifestyle | 10.0 | (3.4 | ) | 0.0 | 6.6 | |||||||||||
Lighting | 3.2 | (3.5 | ) | 0.0 | (0.3 | ) | ||||||||||
Innovation, Group & Services | (2.0 | ) | (0.5 | ) | 5.7 | 3.2 | ||||||||||
|
| |||||||||||||||
Philips Group | 3.3 | (3.9 | ) | 0.1 | (0.5 | ) | ||||||||||
| 2012 versus 2011 | ||||||||||||||||
Healthcare | 6.4 | 6.4 | 0.0 | 12.8 | ||||||||||||
Consumer Lifestyle | 8.7 | 4.4 | 1.4 | 14.5 | ||||||||||||
Lighting | 3.8 | 4.6 | 2.1 | 10.5 | ||||||||||||
Innovation, Group & Services | 0.3 | 1.7 | (4.4 | ) | (2.5 | ) | ||||||||||
|
| |||||||||||||||
Philips Group | 5.7 | 5.2 | 0.8 | 11.7 | ||||||||||||
| 2011 versus 2010 | ||||||||||||||||
Healthcare | 5.3 | (2.5 | ) | 0.1 | 2.9 | |||||||||||
Consumer Lifestyle | 11.0 | (1.8 | ) | 4.5 | 13.7 | |||||||||||
Lighting | 6.2 | (2.4 | ) | (2.7 | ) | 1.1 | ||||||||||
Innovation, Group & Services | (12.9 | ) | (0.9 | ) | (9.0 | ) | (22.8 | ) | ||||||||
|
| |||||||||||||||
Philips Group | 5.8 | (2.3 | ) | (0.7 | ) | 2.8 | ||||||||||
Sales growth composition per geographic cluster
in %
| comparable growth | currency effects | consolidation changes | nominal growth | |||||||||||||
| 2013 versus 2012 | ||||||||||||||||
Western Europe | 0.1 | (0.6 | ) | 0.5 | 0.0 | |||||||||||
North America | (2.4 | ) | (3.1 | ) | (0.2 | ) | (5.7 | ) | ||||||||
Other mature geographies | 5.0 | (12.3 | ) | 0.0 | (7.3 | ) | ||||||||||
|
| |||||||||||||||
Total mature geographies | (0.5 | ) | (3.4 | ) | 0.1 | (3.8 | ) | |||||||||
Growth geographies | 10.7 | (5.1 | ) | 0.0 | 5.6 | |||||||||||
|
| |||||||||||||||
Philips Group | 3.3 | (3.9 | ) | 0.1 | (0.5 | ) | ||||||||||
| 2012 versus 2011 | ||||||||||||||||
Western Europe | (0.9 | ) | 1.1 | 2.5 | 2.7 | |||||||||||
North America | 2.7 | 8.7 | (0.7 | ) | 10.7 | |||||||||||
Other mature geographies | 11.8 | 9.2 | (0.1 | ) | 20.9 | |||||||||||
|
| |||||||||||||||
Total mature geographies | 2.4 | 5.6 | 0.7 | 8.7 | ||||||||||||
Growth geographies | 12.5 | 4.3 | 1.2 | 18.0 | ||||||||||||
|
| |||||||||||||||
Philips Group | 5.7 | 5.2 | 0.8 | 11.7 | ||||||||||||
| 2011 versus 2010 | ||||||||||||||||
Western Europe | (0.7 | ) | 0.3 | (1.9 | ) | (2.3 | ) | |||||||||
North America | 5.2 | (4.9 | ) | 0.3 | 0.6 | |||||||||||
Other mature geographies | 6.9 | 2.7 | (2.0 | ) | 7.6 | |||||||||||
|
| |||||||||||||||
Total mature geographies | 2.9 | (1.8 | ) | (0.9 | ) | 0.2 | ||||||||||
Growth geographies | 12.4 | (3.3 | ) | (0.3 | ) | 8.8 | ||||||||||
|
| |||||||||||||||
Philips Group | 5.8 | (2.3 | ) | (0.7 | ) | 2.8 | ||||||||||
252 Annual Report 2013
14 Reconciliation of non-GAAP information 14 - 14
Composition of net debt to group equity
| 2011 | 2012 | 2013 | ||||||||||
Long-term debt | 3,278 | 3,725 | 3,309 | |||||||||
Short-term debt | 582 | 809 | 592 | |||||||||
|
| |||||||||||
Total debt | 3,860 | 4,534 | 3,901 | |||||||||
Cash and cash equivalents | 3,147 | 3,834 | 2,465 | |||||||||
|
| |||||||||||
Net debt (cash)1) | 713 | 700 | 1,436 | |||||||||
Shareholders’ equity | 12,328 | 11,151 | 11,214 | |||||||||
Non-controlling interests | 34 | 34 | 13 | |||||||||
|
| |||||||||||
Group equity | 12,362 | 11,185 | 11,227 | |||||||||
Net debt and group equity | 13,075 | 11,885 | 12,663 | |||||||||
Net debt divided by net debt and group equity (in %) | 5 | 6 | 11 | |||||||||
Group equity divided by net debt and group equity (in %) | 95 | 94 | 89 | |||||||||
|
| |||||||||||||||||||
| 2012 | 2013 | 2014 | 2015 | 2016 | ||||||||||||||||
|
| |||||||||||||||||||
Cash and cash equivalents | 3,834 | 2,465 | 1,873 | 1,766 | 2,334 | |||||||||||||||
Receivables and other current assets | 5,128 | 5,220 | 5,591 | 5,655 | 6,169 | |||||||||||||||
Assets classified as held for sale | 43 | 507 | 1,613 | 1,809 | 2,180 | |||||||||||||||
Inventories | 3,495 | 3,240 | 3,314 | 3,463 | 3,392 | |||||||||||||||
Non-current financial assets/investments in associates | 726 | 657 | 619 | 670 | 525 | |||||||||||||||
Non-current receivables/assets | 2,217 | 1,924 | 2,721 | 3,075 | 3,098 | |||||||||||||||
Property, plant and equipment | 2,959 | 2,780 | 2,095 | 2,322 | 2,155 | |||||||||||||||
Intangible assets | 10,679 | 9,766 | 10,526 | 12,216 | 12,450 | |||||||||||||||
|
| |||||||||||||||||||
Total assets | 29,081 | 26,559 | 28,352 | 30,976 | 32,303 | |||||||||||||||
Property, plant and equipment: | ||||||||||||||||||||
Capital expenditures for the year | 479 | 482 | 437 | 522 | 443 | |||||||||||||||
Depreciation for the year | 588 | 521 | 592 | 582 | 606 | |||||||||||||||
Capital expenditures: depreciation | 0.8 | 0.9 | 0.7 | 0.9 | 0.7 | |||||||||||||||
Inventories as a % of sales1) | 14.1 | % | 13.7 | % | 15.3 | % | 14.3 | % | 13.8 | % | ||||||||||
Outstanding trade receivables, in days sales2) | 50 | 53 | 56 | 56 | 57 | |||||||||||||||
|
| |||||||||||||||||||
| 1) |
|
Composition of cash flows
| 2011 | 2012 | 2013 | ||||||||||
Cash flows from operating activities | 760 | 2,082 | 1,138 | |||||||||
Cash flows from investing activities | (1,275 | ) | (925 | ) | (997 | ) | ||||||
|
| |||||||||||
Cash flows before financing activities | (515 | ) | 1,157 | 141 | ||||||||
Cash flows from operating activities | 760 | 2,082 | 1,138 | |||||||||
Net capital expenditures: | (857 | ) | (455 | ) | (966 | ) | ||||||
Purchase of intangible assets | (69 | ) | (34 | ) | (49 | ) | ||||||
Proceeds from sale of intangible assets | — | 160 | — | |||||||||
Expenditures on development assets | (276 | ) | (345 | ) | (357 | ) | ||||||
Capital expenditures on property, plant and equipment | (640 | ) | (661 | ) | (587 | ) | ||||||
Proceeds from disposals of property, plant and equipment | 128 | 425 | 27 | |||||||||
|
| |||||||||||
Free cash flows | (97 | ) | 1,627 | 172 | ||||||||
| 2) | Calculated based upon the values excluding accounts receivable and sales related to acquisitions, divestments and Discontinued operations |
Annual Report 2013 2532016 235
14 Reconciliation of non-GAAP information 14 - 14Five-year overview 13
Philips Group
Adjusted IFO to Income from operations (or IFO)Financial structurein millions of EUR unless otherwise stated
2012 - 2016
| Philips Group | Healthcare | Consumer Lifestyle | Lighting | Innovation, Group & Services | ||||||||||||||||
| 2013 | ||||||||||||||||||||
Adjusted IFO | 2,451 | 1,512 | 483 | 695 | (239 | ) | ||||||||||||||
Amortization of intangible assets1) | (432 | ) | (195 | ) | (54 | ) | (180 | ) | (3 | ) | ||||||||||
Impairment of goodwill | (28 | ) | (2 | ) | — | (26 | ) | — | ||||||||||||
|
| |||||||||||||||||||
Income from operations (or IFO) | 1,991 | 1,315 | 429 | 489 | (242 | ) | ||||||||||||||
| 2012 | ||||||||||||||||||||
Adjusted IFO | 1,106 | 1,226 | 456 | 128 | (704 | ) | ||||||||||||||
Amortization of intangible assets1) | (458 | ) | (200 | ) | (56 | ) | (194 | ) | (8 | ) | ||||||||||
|
| |||||||||||||||||||
Income from operations (or IFO) | 648 | 1,026 | 400 | (66 | ) | (712 | ) | |||||||||||||
| 2011 | ||||||||||||||||||||
Adjusted IFO | 1,435 | 1,080 | 153 | 399 | (197 | ) | ||||||||||||||
Amortization of intangible assets1) | (559 | ) | (229 | ) | (44 | ) | (276 | ) | (10 | ) | ||||||||||
Impairment of goodwill | (1,355 | ) | (824 | ) | — | (531 | ) | — | ||||||||||||
|
| |||||||||||||||||||
Income from operations (or IFO) | (479 | ) | 27 | 109 | (408 | ) | (207 | ) | ||||||||||||
|
| |||||||||||||||||||
| 2012 | 2013 | 2014 | 2015 | 2016 | ||||||||||||||||
|
| |||||||||||||||||||
Other liabilities1) | 9,208 | 7,713 | 8,414 | 8,786 | 9,058 | |||||||||||||||
Liabilities directly associated with assets held for sale | 27 | 348 | 349 | 407 | 525 | |||||||||||||||
Debt | 4,534 | 3,901 | 4,104 | 5,760 | 5,606 | |||||||||||||||
Provisions1) | 4,127 | 3,370 | 4,517 | 4,243 | 3,606 | |||||||||||||||
|
|
|
| |||||||||||||||||
Total provisions and liabilities | 17,896 | 15,332 | 17,384 | 19,196 | 18,795 | |||||||||||||||
Shareholders’ equity | 11,151 | 11,214 | 10,867 | 11,662 | 12,601 | |||||||||||||||
Non-controlling interests | 34 | 13 | 101 | 118 | 907 | |||||||||||||||
|
| |||||||||||||||||||
Group equity and liabilities | 29,081 | 26,559 | 28,352 | 30,976 | 32,303 | |||||||||||||||
Net debt: group equity ratio2)3) | 6:94 | 11:89 | 17:83 | 25:75 | 19:81 | |||||||||||||||
Market capitalization atyear-end | 18,200 | 24,340 | 22,082 | 21,607 | 26,751 | |||||||||||||||
|
| |||||||||||||||||||
| 1) | Adjusted to reflect a reclassification of net defined-benefit obligations into Long-term provisions. Seenote 1, Significant accounting policies. |
| 2) | For details on the calculation of net debt and group equity ratio, refer tonote 17, Equity. |
| 3) | Non-GAAP financial measure. For the definition and reconciliation to the most directly comparable GAAP measure, refer to chapter 4, Reconciliation of non-GAAP information, of this report. |
Philips Group
Key figures per sharein EUR unless otherwise stated
2012 - 2016
|
| |||||||||||||||||||
| 2012 | 2013 | 2014 | 2015 | 2016 | ||||||||||||||||
|
| |||||||||||||||||||
Sales per common share | 24.11 | 24.14 | 23.37 | 26.46 | 26.71 | |||||||||||||||
Weighted average amount of shares outstanding: | ||||||||||||||||||||
- basic1) | 922,101 | 911,072 | 915,193 | 916,087 | 918,016 | |||||||||||||||
- diluted1) | 927,222 | 922,072 | 922,714 | 923,625 | 928,789 | |||||||||||||||
Basic earnings per common share: | ||||||||||||||||||||
Income (loss) from continuing operations attributable to shareholders per share | (0.19 | ) | 1.13 | 0.25 | 0.44 | 1.12 | ||||||||||||||
Net income (loss) attributable to shareholders | (0.04 | ) | 1.28 | 0.45 | 0.70 | 1.58 | ||||||||||||||
Diluted earnings per common share: | ||||||||||||||||||||
Income (loss) from continuing operations attributable to shareholders per share | (0.19 | ) | 1.12 | 0.24 | 0.43 | 1.11 | ||||||||||||||
Net income (loss) attributable to shareholders | (0.04 | ) | 1.27 | 0.45 | 0.70 | 1.56 | ||||||||||||||
Dividend distributed per common share | 0.75 | 0.75 | 0.80 | 0.80 | 0.80 | |||||||||||||||
Total shareholder return per common share | 4.37 | 7.50 | (1.70 | ) | 0.21 | 6.24 | ||||||||||||||
Shareholders’ equity per common share | 12.19 | 12.28 | 11.88 | 12.72 | 13.66 | |||||||||||||||
Price/earnings ratio | (104.74 | ) | 23.58 | 96.60 | 53.55 | 25.89 | ||||||||||||||
Share price atyear-end | 19.90 | 26.65 | 24.15 | 23.56 | 29.00 | |||||||||||||||
Highest closing share price during the year | 20.33 | 26.78 | 28.10 | 27.65 | 29.07 | |||||||||||||||
Lowest closing share price during the year | 13.76 | 20.26 | 20.98 | 20.79 | 20.95 | |||||||||||||||
Average share price | 16.92 | 23.33 | 24.00 | 24.51 | 24.75 | |||||||||||||||
Amount of common shares outstanding at year-end1) | 914,591 | 913,338 | 914,389 | 917,104 | 922,437 | |||||||||||||||
|
| |||||||||||||||||||
| 1 | In thousands of |
254236 Annual Report 20132016
14 Reconciliation of non-GAAP information 14 - 14Five-year overview 13
Philips Group
Net operating capital to total assetsSustainability
2012 - 2016
| Philips Group | Healthcare | Consumer Lifestyle | Lighting | Innovation, Group & Services | ||||||||||||||||
| 2013 | ||||||||||||||||||||
Net operating capital (NOC) | 10,238 | 7,437 | 1,261 | 4,462 | (2,922 | ) | ||||||||||||||
Exclude liabilities comprised in NOC: | ||||||||||||||||||||
- payables/liabilities | 8,453 | 2,541 | 1,275 | 1,672 | 2,965 | |||||||||||||||
- intercompany accounts | — | 124 | 75 | 105 | (304 | ) | ||||||||||||||
- provisions | 2,554 | 278 | 221 | 452 | 1,603 | |||||||||||||||
Include assets not comprised in NOC: | ||||||||||||||||||||
- investments in associates | 161 | 85 | — | 20 | 56 | |||||||||||||||
- current financial assets | 10 | — | — | — | 10 | |||||||||||||||
- other non-current financial assets | 496 | — | — | — | 496 | |||||||||||||||
- deferred tax assets | 1,675 | — | — | — | 1,675 | |||||||||||||||
- liquid assets | 2,465 | — | — | — | 2,465 | |||||||||||||||
|
| |||||||||||||||||||
| 26,052 | 10,465 | 2,832 | 6,711 | 6,044 | ||||||||||||||||
Assets classified as held for sale | 507 | |||||||||||||||||||
|
| |||||||||||||||||||
Total assets | 26,559 | |||||||||||||||||||
| 2012 | ||||||||||||||||||||
Net operating capital (NOC) | 9,316 | 7,976 | 1,205 | 4,635 | (4,500 | ) | ||||||||||||||
Exclude liabilities comprised in NOC: | ||||||||||||||||||||
- payables/liabilities | 10,287 | 2,760 | 1,718 | 1,695 | 4,114 | |||||||||||||||
- intercompany accounts | — | 71 | 42 | 37 | (150 | ) | ||||||||||||||
- provisions | 2,956 | 355 | 315 | 581 | 1,705 | |||||||||||||||
Include assets not comprised in NOC: | ||||||||||||||||||||
- investments in associates | 177 | 86 | — | 22 | 69 | |||||||||||||||
- other non-current financial assets | 549 | — | — | — | 549 | |||||||||||||||
- deferred tax assets | 1,919 | — | — | — | 1,919 | |||||||||||||||
- liquid assets | 3,834 | — | — | — | 3,834 | |||||||||||||||
|
| |||||||||||||||||||
| 29,038 | 11,248 | 3,280 | 6,970 | 7,540 | ||||||||||||||||
Assets classified as held for sale | 43 | |||||||||||||||||||
|
| |||||||||||||||||||
Total assets | 29,081 | |||||||||||||||||||
| 2011 | ||||||||||||||||||||
Net operating capital (NOC) | 10,382 | 8,418 | 874 | 4,965 | (3,875 | ) | ||||||||||||||
Exclude liabilities comprised in NOC: | ||||||||||||||||||||
- payables/ liabilities | 10,357 | 2,697 | 2,292 | 1,593 | 3,775 | |||||||||||||||
- intercompany accounts | — | 103 | 74 | 51 | (228 | ) | ||||||||||||||
- provisions | 2,680 | 287 | 551 | 283 | 1,559 | |||||||||||||||
Include assets not comprised in NOC: | ||||||||||||||||||||
- investments in associates | 203 | 86 | 3 | 23 | 91 | |||||||||||||||
- other non-current financial assets | 346 | — | — | — | 346 | |||||||||||||||
- deferred tax assets | 1,731 | — | — | — | 1,731 | |||||||||||||||
- liquid assets | 3,147 | — | — | — | 3,147 | |||||||||||||||
|
| |||||||||||||||||||
| 28,846 | 11,591 | 3,794 | 6,915 | 6,546 | ||||||||||||||||
Assets classified as held for sale | 551 | |||||||||||||||||||
|
| |||||||||||||||||||
Total assets | 29,397 | |||||||||||||||||||
|
| |||||||||||||||||||
| 2012 | 2013 | 2014 | 2015 | 2016 | ||||||||||||||||
|
| |||||||||||||||||||
Lives improved, in billions | 1.6 | 1.7 | 1.9 | 2.0 | 2.1 | |||||||||||||||
Green Revenues, as a % of total sales | 46 | % | 50 | % | 59 | % | 61 | % | 64 | % | ||||||||||
Green Innovation, in millions of euros | 453 | 405 | 463 | 495 | 558 | |||||||||||||||
Operational carbon footprint, in kilotonnes CO2-equivalent | 1,640 | 1,678 | 1,521 | 1,417 | 1,344 | |||||||||||||||
Operational energy efficiency, in terajoules per million euro sales | 1.35 | 1.40 | 1.34 | 1.11 | 1.01 | |||||||||||||||
Total energy consumption in manufacturing, in terajoules1) | 12,014 | 11,963 | 11,257 | 9,702 | 8,987 | |||||||||||||||
Total carbon emissions in manufacturing, in kilotonnes CO2-equivalent | 563 | 518 | 468 | 371 | 323 | |||||||||||||||
Water intake, in thousands m3 | 3,137 | 3,289 | 3,103 | 2,727 | 2,414 | |||||||||||||||
Total waste, in kilotonnes1) | 80.6 | 75.9 | 75.0 | 68.5 | 64.8 | |||||||||||||||
Materials provided for recycling via external contractor per total waste, in % | 77 | % | 79 | % | 80 | % | 83 | % | 83 | % | ||||||||||
Restricted substances, in kilos | 67 | 37 | 29 | 26 | 7 | |||||||||||||||
Hazardous substances, in kilos | 67,530 | 35,118 | 28,310 | 25,101 | 12,412 | |||||||||||||||
ISO 14001 certification, as a % of all reporting organizations1) | 69 | % | 79 | % | 79 | % | 78 | % | 82 | % | ||||||||||
Employee Engagement Index, % favorable | 79 | % | 75 | % | 72 | % | 71 | % | 74 | % | ||||||||||
Female executives, in % of total | 14 | % | 15 | % | 18 | % | 19 | % | 18 | % | ||||||||||
Lost Workday Injuries, per 100 FTEs | 0.31 | 0.27 | 0.23 | 0.21 | 0.18 | |||||||||||||||
Fatalities | 7 | 3 | 1 | — | 2 | |||||||||||||||
Initial and continual conformance audits, number of audits | 159 | 200 | 203 | 195 | 226 | |||||||||||||||
Suppliers audits, compliance rate, in % | 75 | % | 77 | % | 86 | % | 86 | % | 89 | % | ||||||||||
|
| |||||||||||||||||||
| 1) | In manufacturing excluding new acquisitions |
Annual Report 2013 2552016 237
15 Five-year overview 15 - 1513.1
1513.1 Five-year overview (condensed)
all amounts in millions of euros unless otherwise stated
Prior-period financial statements have been restated for the treatment of Audio, Video, Multimedia and Accessories as discontinued operations (see note 7, Discontinued operations and other assets classified as held for sale) and the adoption of IAS 19R, which mainly relates to pension reporting (see note 1, Significant accounting policies).
Due to factors such as acquisitions and divestments, the amounts, percentages and ratios are not directly comparable.
Philips Group
GeneralSelected financial datain millions of EUR unless otherwise stated
2012 - 2016
|
| |||||||||||||||||||||||||||||||||||||||||||||||
| 2012 | 2013 | 2014 | 2015 | 2016 | 2016 | |||||||||||||||||||||||||||||||||||||||||||
|
| |||||||||||||||||||||||||||||||||||||||||||||||
| 2009 EUR | 2010 EUR | 2011 EUR | 2012 EUR | 2013 EUR | 2013 USD1) | EUR | EUR | EUR | EUR | EUR | USD1) | |||||||||||||||||||||||||||||||||||||
|
| |||||||||||||||||||||||||||||||||||||||||||||||
Sales | 18,149 | 20,415 | 20,992 | 23,457 | 23,329 | 32,156 | 22,234 | 21,990 | 21,391 | 24,244 | 24,516 | 25,820 | ||||||||||||||||||||||||||||||||||||
Income from operations (IFO) (loss) | 377 | 1,721 | (479 | ) | 648 | 1,991 | 2,744 | |||||||||||||||||||||||||||||||||||||||||
Income from operations (EBIT) (loss) | 592 | 1,855 | 486 | 992 | 1,882 | 1,982 | ||||||||||||||||||||||||||||||||||||||||||
Financial income and expenses - net | (280 | ) | (175 | ) | (331 | ) | (329 | ) | (330 | ) | (455 | ) | (329 | ) | (330 | ) | (301 | ) | (369 | ) | (493 | ) | (519 | ) | ||||||||||||||||||||||||
Income (loss) from continuing operations | 173 | 1,157 | (1,046 | ) | (77 | ) | 1,170 | 1,613 | (166 | ) | 1,034 | 221 | 414 | 1,075 | 1,132 | |||||||||||||||||||||||||||||||||
Income (loss) from continuing operations attributable to shareholders | 159 | 1,151 | (1,050 | ) | (82 | ) | 1,167 | 1,609 | (171 | ) | 1,031 | 225 | 400 | 1,032 | 1,087 | |||||||||||||||||||||||||||||||||
Income (loss) from discontinued operations | 86 | 144 | (410 | ) | 47 | 2 | 3 | |||||||||||||||||||||||||||||||||||||||||
Income (loss) from Discontinued operations | 136 | 138 | 190 | 245 | 416 | 438 | ||||||||||||||||||||||||||||||||||||||||||
Net income (loss) | 259 | 1,301 | (1,456 | ) | (30 | ) | 1,172 | 1,615 | (30 | ) | 1,172 | 411 | 659 | 1,491 | 1,570 | |||||||||||||||||||||||||||||||||
Net income (loss) attributable to shareholders | 245 | 1,295 | (1,460 | ) | (35 | ) | 1,169 | 1,611 | (35 | ) | 1,169 | 415 | 645 | 1,448 | 1,525 | |||||||||||||||||||||||||||||||||
Total assets | 30,897 | 32,712 | 29,397 | 29,081 | 26,559 | 36,608 | 29,081 | 26,559 | 28,352 | 30,976 | 32,303 | 34,022 | ||||||||||||||||||||||||||||||||||||
Net assets | 14,631 | 15,067 | 12,362 | 11,185 | 11,227 | 15,475 | 11,185 | 11,227 | 10,968 | 11,780 | 13,508 | 14,227 | ||||||||||||||||||||||||||||||||||||
Financial structure | ||||||||||||||||||||||||||||||||||||||||||||||||
Debt | 4,267 | 4,658 | 3,860 | 4,534 | 3,901 | 5,377 | 4,534 | 3,901 | 4,104 | 5,760 | 5,606 | 5,904 | ||||||||||||||||||||||||||||||||||||
Provisions | 2,476 | 2,377 | 2,680 | 2,956 | 2,554 | 3,520 | 4,127 | 3,370 | 4,517 | 4,243 | 3,606 | 3,798 | ||||||||||||||||||||||||||||||||||||
Shareholders’ equity | 14,582 | 15,021 | 12,328 | 11,151 | 11,214 | 15,457 | 11,151 | 11,214 | 10,867 | 11,662 | 12,601 | 13,271 | ||||||||||||||||||||||||||||||||||||
Non-controlling interests | 49 | 46 | 34 | 34 | 13 | 18 | 34 | 13 | 101 | 118 | 907 | 955 | ||||||||||||||||||||||||||||||||||||
Key figures per share | ||||||||||||||||||||||||||||||||||||||||||||||||
Weighted average shares outstanding: | ||||||||||||||||||||||||||||||||||||||||||||||||
- basic2) | 927,709 | 941,691 | 952,809 | 922,101 | 911,072 | 911,072 | 922,101 | 911,072 | 915,193 | 916,087 | 918,016 | 918,016 | ||||||||||||||||||||||||||||||||||||
- diluted2) | 931,264 | 949,554 | 957,293 | 927,222 | 922,072 | 922,072 | 927,222 | 922,072 | 922,714 | 923,625 | 928,789 | 928,789 | ||||||||||||||||||||||||||||||||||||
Amount of common shares outstanding atyear-end2) | 914,591 | 913,338 | 914,389 | 917,104 | 922,437 | 922,437 | ||||||||||||||||||||||||||||||||||||||||||
Basic earnings per common share3) | ||||||||||||||||||||||||||||||||||||||||||||||||
Income (loss) from continuing operations attributable to shareholders | 0.17 | 1.22 | (1.10 | ) | (0.09 | ) | 1.28 | 1.76 | (0.19 | ) | 1.13 | 0.25 | 0.44 | 1.12 | 1.18 | |||||||||||||||||||||||||||||||||
Net income (loss) attributable to shareholders | 0.26 | 1.38 | (1.53 | ) | (0.04 | ) | 1.28 | 1.76 | (0.04 | ) | 1.28 | 0.45 | 0.70 | 1.58 | 1.66 | |||||||||||||||||||||||||||||||||
Diluted earnings per common share3) | ||||||||||||||||||||||||||||||||||||||||||||||||
Income (loss) from continuing operations attributable to shareholders | 0.17 | 1.21 | (1.10 | ) | (0.09 | ) | 1.27 | 1.75 | (0.19 | ) | 1.12 | 0.24 | 0.43 | 1.11 | 1.17 | |||||||||||||||||||||||||||||||||
Net income (loss) attributable to shareholders | 0.26 | 1.36 | (1.53 | ) | (0.04 | ) | 1.27 | 1.75 | (0.04 | ) | 1.27 | 0.45 | 0.70 | 1.56 | 1.64 | |||||||||||||||||||||||||||||||||
Dividend distributed per common share | 0.75 | 0.75 | 0.80 | 0.80 | 0.80 | 0.84 | ||||||||||||||||||||||||||||||||||||||||||
|
| |||||||||||||||||||||||||||||||||||||||||||||||
| 1) | For the convenience of the reader, the euro amounts have been converted into US dollars at the exchange rate used for balance sheet purposes at December 31, |
| 2) | In thousands of shares |
| 3) | In euros or US dollars as indicated in the header |
256238 Annual Report 20132016
16 Investor Relations 16 - 16.114
16.114.1 Key financials and dividend policy
Prior-period financial statements have been restated for the treatment of Audio, Video, Multimedia and Accessories as discontinued operations (see note 7, Discontinued operations and other assets classified as held for sale) and the adoption of IAS 19R, which mainly relates to pension reporting (see note 30, Post-employment benefits).
Key financials
Net income attributable to shareholders of theKoninklijke Philips GroupN.V. in 2013 showed a gain of2016 was EUR 1,1691,448 million, or EUR 1.271.56 per common share (diluted; basic EUR 1.281.58 per common share). This compares to a loss of EUR 35645 million, or EUR 0.040.70 per common share (diluted; basic EUR 0.040.70 per common share), in 2012.2015.
Philips Group
Net income attributable to shareholdersin millions of EUR
2012 - 2016
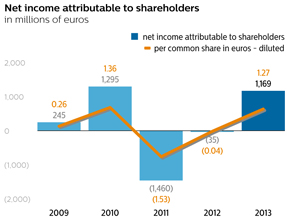
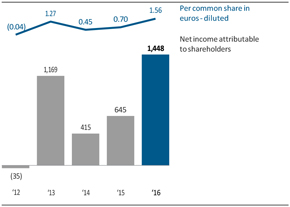
Philips Group
Income from operations (EBIT) and Adjusted income from
operations1)in millions of EUR
2012 - 2016
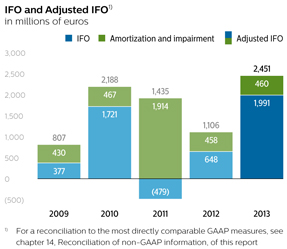
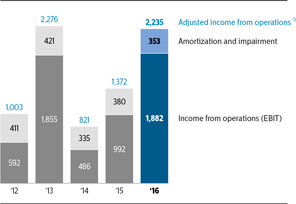
| 1) | Non-GAAP financial measure. For the definition and reconciliation to the most directly comparable GAAP measure, refer tochapter 4, Reconciliation ofnon-GAAP information, of this report |
Philips Group
Total of Net cash provided by operating activities and Net
capital expendituresin millions of EUR
2012 - 2016
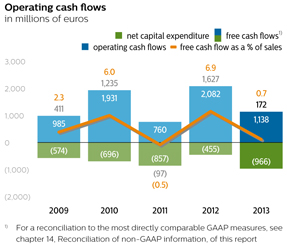
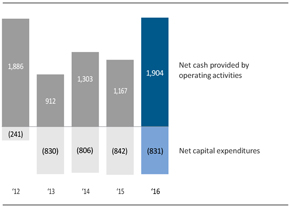
Dividend policy
We are committed to a stablePhilips’ dividend policy withis aimed at dividend stability and apay-out ratio of 40% to 50% target pay-out of continuing net income.
Continuing net income after adjustments.
Net income after adjustments is the base figure used to calculate the dividend payoutpay-out for the year. For 2013,2016, the key exclusions from net income to arrive at continuing net income after adjustments are the following: the results related to the Television and Audio, Video, Multimedia and Accessories businesses of Consumer Lifestyle that are shown as discontinuedDiscontinued operations, the gainsincome from a pension settlement, a charge related to past-service pension costs in the US and the settlement loss arising from a lump sum offering to terminated vested employees in the US pension plan, as well as the impairment of goodwill in Lighting and of other intangible assets in Healthcare and Lighting.
Annual Report 2013 257
16 Investor Relations 16.1 - 16.1
Restructuring and acquisition-related charges and the resultcurrency revaluation of the sale ofprovision for the 30% stakeMasimo litigation, financial charges related to bond redemptions, and a release in investment in associate TP Visionfinancial income and expense related to the Masimo settlement. Restructuring, acquisition-related and separation related charges are also excluded.
Proposed distribution
A proposal will be submitted to the 2014 Annual General Meeting of Shareholders, to be held on May 11, 2017, to declare a dividenddistribution of EUR 0.80 per common share (up to EUR 740745 million), in cash or in shares at the option of the shareholder, against the net income for 2013.2016.
If the above dividend proposal is adopted, the shares will be tradedex-dividend as of May 12, 2017 and May 15, 2017 at the New York Stock Exchange and Euronext Amsterdam, respectively. In compliance with the listing requirements of the New York Stock Exchange and the stock market of Euronext Amsterdam, the dividend record date will be May 16, 2017.
Shareholders will be given the opportunity to make their choice between cash and shares between May 8, 2014,17, 2017 and May 30, 2014.June 9, 2017. If no choice is made during this election period the dividend will be paid in shares.cash. On May 30, 2014June 9, 2017 after close of trading, the number of share dividend rights entitled to one new common share will be determined based on the volume weightedvolume-weighted average
Annual Report 2016 239
Investor Relations 14.1
price of all traded common shares of Koninklijke Philips N.V. at NYSE Euronext Amsterdam on 28, 29June 7, 8 and 30 May, 2014.9, 2017. The Companycompany will calculate the number of share dividend rights entitled to one new common share (the ratio), such that the gross dividend in shares will be approximately equal to the gross dividend in cash. On June 3, 2014 theThe ratio and the number of shares to be issued will be announced.announced on June 13, 2017. Payment of the dividend and delivery of new common shares, with settlement of fractions in cash, if required, will take place from June 4, 2014.14, 2017. The distribution of dividend in cash to holders of New York registryRegistry shares will be made in USD at the USD/EUR rate fixed byas per WM/ Reuters FX Benchmark 2 PM CET fixing of June 12, 2017.
Further details will be given in the European Central Bank on June 2, 2014.agenda for the 2017 Annual General Meeting of Shareholders. All dates mentioned remain provisional until then.
Dividend in cash is in principle subject to 15% Dutch dividend withholding tax, which will be deducted from the dividend in cash paid to the shareholders. Dividend in shares paid out of net income and retained earnings is subject to 15% dividend withholding tax, but only in respect of the par value of the shares (EUR 0.20 per share). Shareholders are advised to consult their own tax advisor on the applicable situation with respect to taxes on the dividend received.
In 2013,2016, a dividend of EUR 0.750.80 per common share was paid in cash or shares, at the option of the shareholder. For 59.8%55.0% of the shares, an election was madethe shareholders elected for a share dividend, resulting in the issuanceissue of 18,491,33717,344,462 new common shares, leading to a 2.1% percent1.9% dilution. EUR 271,991,204330 million was paid in cash. For additional information, see See alsosection 4.4,2.4, Proposed distribution to shareholders, of this report.
| ex-dividend date | record date | payment date | ||||||||||
Euronext Amsterdam | May | May | June | |||||||||
New York | May | May | June | |||||||||
Philips Group
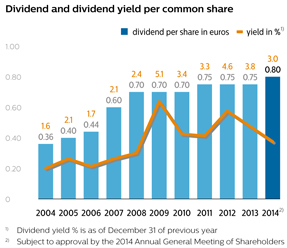
2007 - 2017
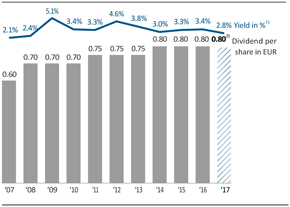
| 1) | Dividend yield % is as of December 31 of previous year |
| 2) | Subject to approval by the Annual General Meeting of Shareholders in 2017 |
Information for investors in New York Registry shares program
Dividends and distributions per common share
The following table sets forth in euros the gross dividends on the common shares in the fiscal years indicated (from prior-year profit distribution) and such amounts as converted into US dollars and paid to holders of shares of the New York registry:Registry:
Philips Group
Gross dividends on the common shares
2012 - 2016
|
| |||||||||||||||||||||||||||||||||||||||
| 2012 | 2013 | 2014 | 2015 | 2016 | ||||||||||||||||||||||||||||||||||||
| 2009 | 2010 | 2011 | 2012 | 2013 |
|
| ||||||||||||||||||||||||||||||||||
in EUR | 0.70 | 0.70 | 0.75 | 0.75 | 0.75 | 0.75 | 0.75 | 0.80 | 0.80 | 0.80 | ||||||||||||||||||||||||||||||
in USD | 0.94 | 0.93 | 1.11 | 0.94 | 0.98 | 0.94 | 0.98 | 1.09 | 0.89 | 0.90 | ||||||||||||||||||||||||||||||
|
| |||||||||||||||||||||||||||||||||||||||
Exchange rates USD : EUR
The following two tables set forth, for the periods and dates indicated, certain information concerning the exchange rate for US dollars into euros based on the Noon Buying Rate in New York City for cable transfers in foreign currencies as certified for customs purposes by the Federal Reserve Bank of New York (the “Noon Buying Rate”). The Noon Buying Rate on February 14, 201410, 2017 was EUR 0.73050.9389 per USD 1.
Exchange rate (based on the “Noon Buying Rate”)
258EUR per USD
2012 - 2016
|
| |||||||||||||||
| period end | average | high | low | |||||||||||||
|
| |||||||||||||||
2012 | 0.7584 | 0.7782 | 0.8290 | 0.7428 | ||||||||||||
2013 | 0.7257 | 0.7532 | 0.7828 | 0.7238 | ||||||||||||
2014 | 0.8264 | 0.7533 | 0.8264 | 0.7180 | ||||||||||||
2015 | 0.9209 | 0.9018 | 0.9502 | 0.8323 | ||||||||||||
2016 | 0.9477 | 0.9037 | 0.9639 | 0.8684 | ||||||||||||
|
| |||||||||||||||
240 Annual Report 20132016
16 Investor Relations 16.1 - 16.214.1
Exchange rate per month (based on the “Noon Buying Rate”)
| EUR per USD | ||||||||||||||||
| period end | average | high | low | |||||||||||||
2008 | 0.7184 | 0.6844 | 0.8035 | 0.6246 | ||||||||||||
2009 | 0.6977 | 0.7187 | 0.7970 | 0.6623 | ||||||||||||
2010 | 0.7536 | 0.7579 | 0.8362 | 0.6879 | ||||||||||||
2011 | 0.7708 | 0.7186 | 0.7736 | 0.6723 | ||||||||||||
2012 | 0.7584 | 0.7782 | 0.8290 | 0.7428 | ||||||||||||
2013 | 0.7257 | 0.7532 | 0.7828 | 0.7238 | ||||||||||||
EUR per USD
2016 - 2017
| highest rate | lowest rate | |||||||
August, 2013 | 0.7578 | 0.7448 | ||||||
September, 2013 | 0.7622 | 0.7387 | ||||||
October, 2013 | 0.7413 | 0.7241 | ||||||
November, 2013 | 0.7487 | 0.7350 | ||||||
December, 2013 | 0.7379 | 0.7238 | ||||||
January, 2014 | 0.7407 | 0.7309 | ||||||
Philips publishes its financial statements in euros while a substantial portion of its net assets, earnings and sales are denominated in other currencies. Philips conducts its business in more than 50 different currencies.
|
| |||||||
| highest rate | lowest rate | |||||||
|
| |||||||
August, 2016 | 0.9027 | 0.8823 | ||||||
September, 2016 | 0.8962 | 0.8872 | ||||||
October, 2016 | 0.9203 | 0.8919 | ||||||
November, 2016 | 0.9470 | 0.8992 | ||||||
December, 2016 | 0.9639 | 0.9295 | ||||||
January, 2017 | 0.9601 | 0.9264 | ||||||
|
| |||||||
Unless otherwise stated, for the convenience of the reader, the translations of euros into US dollars appearing in this reportsection have been made based on the closing rate on December 31, 20132016 (USD 1 = EUR 0.7255)0.9495). This rate is not materially different from the Noon Buying Rate on such date (USD 1 = EUR 0.7257)0.9477).
The following table sets out the exchange rate for US dollars into euros applicable for translation of Philips’ financial statements for the periods specified.
Exchange rate (based on Philips’ consolidation rate)
| EUR per USD | ||||||||||||||||
| period end | average | high | low | |||||||||||||
2008 | 0.7096 | 0.6832 | 0.7740 | 0.6355 | ||||||||||||
2009 | 0.6945 | 0.7170 | 0.7853 | 0.6634 | ||||||||||||
2010 | 0.7485 | 0.7540 | 0.8188 | 0.7036 | ||||||||||||
2011 | 0.7728 | 0.7192 | 0.7728 | 0.6721 | ||||||||||||
2012 | 0.7582 | 0.7776 | 0.8166 | 0.7500 | ||||||||||||
2013 | 0.7255 | 0.7527 | 0.7805 | 0.7255 | ||||||||||||
EUR per USD
2012 - 2016
|
| |||||||||||||||
| period end | average | high | low | |||||||||||||
|
| |||||||||||||||
2012 | 0.7582 | 0.7776 | 0.8166 | 0.7500 | ||||||||||||
2013 | 0.7255 | 0.7527 | 0.7805 | 0.7255 | ||||||||||||
2014 | 0.8227 | 0.7527 | 0.8227 | 0.7201 | ||||||||||||
2015 | 0.9151 | 0.9007 | 0.9410 | 0.8796 | ||||||||||||
2016 | 0.9495 | 0.9078 | 0.9495 | 0.8812 | ||||||||||||
|
| |||||||||||||||
Market capitalization
Philips’ market capitalization was EUR 24.326.8 billion atyear-end 2013. The highest 2016. On December 31, 2016, the closing price for Philips’ shares during 2013 in Amsterdam was EUR 26.78 on December 27, 201329.00 and the lowest wasnumber of common shares outstanding (after deduction of treasury shares) amounted to 922 million.
Philips Group
Market capitalizationin billions of EUR 20.26 on January 4, 2013. The highest closing price for Philips’ shares during 2013 in New York was USD 36.97 on December 31, 2013 and the lowest was USD 26.60 on January 4, 2013.
2012 - 2016
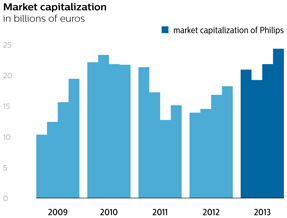
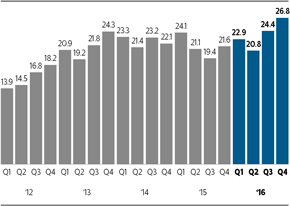
Share capital structure
During 2013,2016, Philips’ issued share capital decreased by approximately 191 million common shares to a level of 938approximately 930 million common shares. The main
reasons for this are the cancellation of 37,778,51018,829,985 Philips shares acquired pursuant to the EUR 21.5 billion share repurchase program (which was completed in October 2016) and the issuance of 18,491,33717,344,462 shares related to the elective dividend. The basicnumber of common shares issued and outstanding decreasedincreased from 915917 million at the end of December 2012 to 913 million at the end of 2013. As of December 31, 2013,2015 to 922 million on December 31, 2016. On December 31, 2016, the shares held in treasury amounted to 25approximately 7 million, shares,all of which 21 million are held by Philips to cover long-term incentive and employee stock purchase plans.
The Dutch Act on Financial Supervision imposes an obligation on persons holding certain interests to disclose (inter alia) percentage holdings in the capital and/or voting rights in the Company when such holdings reach, exceed or fall below 3, 5, 10, 15, 20, 25, 30, 40, 50, 60, 75 and 95 percent (as a result of an acquisition or disposal by a person, or as a result of a change in the company’s total number of voting rights or capital issued). Certain cash settled derivatives (settled in kind or in cash) are also taken into account when calculating the capital interest. Pursuant to new legislation, effective July 1, 2013, theThe statutory obligation to disclose capital interest does not
Annual Report 2013 259
16 Investor Relations 16.2 - 16.2
only relate to gross long positions, but also to gross short positions. Required disclosures must be made to the Netherlands Authority for the Financial Markets (AFM) without delay. The AFM then notifies the Company of such disclosures to the Company and includes them in a register which is published on the AFM’s website. Furthermore, an obligation to disclose (net) short positions is set out in the EU Regulation on Short Selling.
On July 1, 2013The AFM register shows the Company receivedfollowing notification fromof substantial holdings and/or voting rights at or above the AFM that it had received disclosures under the Dutch Act on Financial Supervision of a3% threshold: BlackRock, Inc.: substantial holding of 4.3% by Dodge & Cox International Stock Fund. On August 14, 2013 the Company received notification from the AFM that it had received disclosures under the Dutch Act on Financial Supervision of a total shareholding of 3.01%5.03% and 3.45%6.19% of the voting rights by BlackRock Inc. On January 3, 2014 the Company received notification from the AFM that it had received disclosures under the Dutch Act(January 5, 2017).
The following shareholder portfolio information is based on Financial Supervision of a substantial holding of 3.08% by Norges Bank.
Based on a survey in December 2013 and information provided by several large custodians the following shareholder portfolio information is includedand a survey conducted in the graphs December 2016.
Philips Group
Shareholders by region and Shareholders by style.(approximated)1)in %
2016
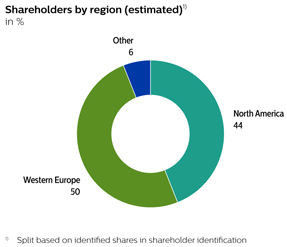
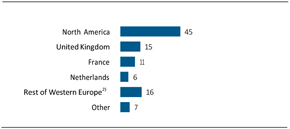
| 1) | Split based on identified shares in shareholder identification |
| 2) | Includes countries in Western Europe with a shareholding of less than 5 % |
Annual Report 2016 241
Investor Relations 14.2
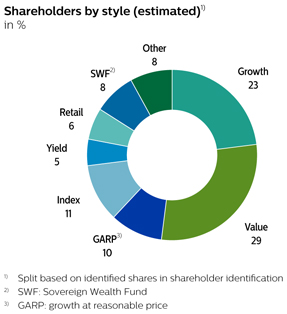
Shareholders by style (approximated)1)in %
2016
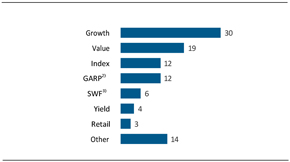
| 1) | Split based on identified shares in shareholder identification |
| 2) | Growth at a reasonable price |
| 3) | Sovereign Wealth Funds |
Share repurchase programs
Share repurchases for capital reduction purposes
By the end of Q2 2013, Philips completed the EUR 2 billion share repurchase program that started in July 2011. On September 17, 2013, Royal Philips announced a new EUR 1.5 billion share repurchase program. This program started on October 21, 2013 and is to bewas completed over the next two to three years. By the endby October 20, 2016. The shares repurchased under this program were held by Philips as treasury shares until they were cancelled. As of 2013, Philips had completed 7% of the EUR 1.5 billion share repurchase program.December 31, 2016 all treasury shares that were repurchased under this program were cancelled.
Share repurchases related toLong-Term Incentive (LTI) and employee stock purchase programs
To cover Philips’ outstanding obligations resulting from past and present long-term incentive and employee stock purchase(LTI) programs, dating back to 2004, Philips will repurchase up to 12 million additionalrepurchases Philips shares from time to time, on NYSE
Euronext Amsterdam to be executed during 2014.or otherwise. The shares repurchased to such LTI positions will be held by Philips as treasury shares until theythese are distributed to participants. In order to repurchase shares for covering LTI programs, Philips started this program on January 28, 2014 and willmay enter into subsequent discretionary management agreements with one or more banks to repurchase Philips shares within the limits of relevant laws and regulations (in particular ECthe EU Market Abuse Regulation 2273/2003) and Philips’ articlesArticles of association.Association.
In 2016, Philips repurchased a total of 8.6 million shares for LTI coverage. During 2017, Philips may continue with additional repurchases, the size of which will depend on the movement of the Philips share price.
Further details on the share repurchase programs can be found on the Investor Relations website. For more information seechapter 10,9, Corporate governance, of this report.
260 Annual Report 2013
16 Investor Relations 16.2 - 16.3
Impact of share repurchases on share count
in thousandsIn 2016 Philips purchased call options on Philips’ shares matching the majority of sharesthe options granted to employees until 2013. As of December 31, 2016 Philips held 14.1 million call options as a hedge of 15.9 million remaining options granted to employees.
| 2009 | 2010 | 2011 | 2012 | 2013 | ||||||||||||||||
Shares issued | 972,412 | 986,079 | 1,008,975 | 957,133 | 937,846 | |||||||||||||||
Shares in treasury | 44,955 | 39,573 | 82,880 | 42,542 | 24,508 | |||||||||||||||
Shares outstanding | 927,457 | 946,506 | 926,095 | 914,591 | 913,338 | |||||||||||||||
Shares repurchased | 2 | 15 | 47,508 | 46,871 | 27,811 | |||||||||||||||
Shares cancelled | — | — | — | 82,365 | 37,779 | |||||||||||||||
A total of 24,508,0227,208,301 shares were held in treasury by the Company at December 31, 2013 (2012: 42,541,6872016 (2015: 14,026,801 shares). As of that date, a total of 4433.5 million rights to acquire shares (underunder long-term incentive plans)plans were outstanding (2012: 52(2015: 39.1 million).
Philips Group
| Period | total number of shares purchased | average price paid per share in EUR | total number of shares purchased as part of publicly announced programs | maximum EUR amount of shares that may yet be purchased under the programs | ||||||||||||
January, 2013 | 2,806,796 | 21.38 | 2,806,796 | 471,195,448 | ||||||||||||
February, 2013 | 6,340,305 | 22.55 | 6,339,803 | 328,260,385 | ||||||||||||
March, 2013 | 2,368,862 | 23.12 | 2,367,018 | 273,523,670 | ||||||||||||
April, 2013 | 4,552,000 | 22.10 | 4,552,000 | 172,938,033 | ||||||||||||
May, 2013 | 5,119,261 | 22.12 | 5,117,783 | 59,707,937 | ||||||||||||
June, 2013 | 2,766,495 | 21.58 | 2,766,377 | — | ||||||||||||
July, 2013 | — | — | — | — | ||||||||||||
August, 2013 | 35 | 21.05 | — | — | ||||||||||||
September, 2013 | — | — | — | — | ||||||||||||
October, 2013 | 766,047 | 25.85 | 766,040 | 1,480,195,100 | ||||||||||||
November, 2013 | 1,434,010 | 26.10 | 1,434,010 | 1,442,763,231 | ||||||||||||
December, 2013 | 1,657,545 | 25.70 | 1,657,545 | 1,400,158,416 | ||||||||||||
Impact of share repurchases on share countin thousands of shares
2012 - 2016
|
| |||||||||||||||||||
| 2012 | 2013 | 2014 | 2015 | 2016 | ||||||||||||||||
|
| |||||||||||||||||||
Shares issued | 957,133 | 937,846 | 934,820 | 931,131 | 929,645 | |||||||||||||||
Shares in treasury | 42,542 | 24,508 | 20,431 | 14,027 | 7,208 | |||||||||||||||
Shares outstanding | 914,591 | 913,338 | 914,389 | 917,104 | 922,437 | |||||||||||||||
Shares repurchased | 46,871 | 27,811 | 28,538 | 20,296 | 25,193 | |||||||||||||||
Shares cancelled | 82,365 | 37,779 | 21,838 | 21,361 | 18,830 | |||||||||||||||
|
| |||||||||||||||||||
Philips Group
Total number of shares repurchased
2016
|
| |||||||||||||||||||||||
share reduction | average price EUR | share program | average price EUR | total number of shares | average price EUR | |||||||||||||||||||
|
| |||||||||||||||||||||||
January, 2016 | 1,648,906 | 22.79 | 57,094 | 23.92 | 1,706,000 | 22.83 | ||||||||||||||||||
February, 2016 | 1,974,965 | 22.67 | 1,014,035 | 22.63 | 2,989,000 | 22.65 | ||||||||||||||||||
March, 2016 | 1,703,020 | 24.42 | 1,059,980 | 24.31 | 2,763,000 | 24.38 | ||||||||||||||||||
April, 2016 | 2,195,278 | 24.35 | 1,158,953 | 24.32 | 3,354,231 | 24.34 | ||||||||||||||||||
May, 2016 | 1,474,221 | 23.27 | 480,216 | 23.23 | 1,954,437 | 23.26 | ||||||||||||||||||
June, 2016 | 2,121,090 | 22.69 | 593,910 | 22.69 | 2,715,000 | 22.69 | ||||||||||||||||||
July, 2016 | 2,047,077 | 23.25 | 929,385 | 22.76 | 2,976,462 | 23.10 | ||||||||||||||||||
August, 2016 | 1,171,365 | 24.92 | 643,418 | 25.00 | 1,814,783 | 24.95 | ||||||||||||||||||
September, 2016 | 1,200,653 | 25.94 | 439,347 | 25.94 | 1,640,000 | 25.94 | ||||||||||||||||||
October, 2016 | 1,055,410 | 26.34 | 634,088 | 26.54 | 1,689,498 | 26.41 | ||||||||||||||||||
November, 2016 | — | — | 679,000 | 27.16 | 679,000 | 27.16 | ||||||||||||||||||
December, 2016 | — | — | 912,000 | 28.39 | 912,000 | 28.39 | ||||||||||||||||||
|
| |||||||||||||||||||||||
| 1) | The program was completed |
242 Annual Report 2016
Investor Relations 14.3
Philips’ existing long-term debt is rated A3BBB+ (with stable outlook)2) by Moody’sStandard & Poor’s and A-Baa1 (with stable outlook)1) by Standard & Poor’s. ItMoody’s. As part of its capital allocation policy, Philips is Philips’ objectivecommitted to manage its financial ratios to be in line with an A3/A-a strong investment grade credit rating. There is no assurance that Philips will be able to achieve this goal. Ratings are subject to change at any time. OutstandingAdverse changes in the Company’s ratings will not trigger any acceleration in the outstanding long-term bonds anddebt nor automatic withdrawal of the committed credit facilities do not have a repetitive material adverse change clause, financial covenants or credit rating-related acceleration possibilities.facilities.
Philips Group
Credit rating summary
2016
| long-term | short-term | outlook | ||||||||||
Standard | A-2 | Stable | ||||||||||
Moody’s | P-2 | Stable | ||||||||||
|
|
Annual Report 2013 261
16 Investor Relations 16.4 - 16.4
16.414.4 Performance in relation to marketindices
The common shares of the Company are listed on the stock market of NYSE Euronext Amsterdam. The New York Registry Shares of the Company, representing common shares of the Company, are listed on the New York Stock Exchange. The principal market for the common shares is NYSE Euronext Amsterdam. For the New York Registry Shares it is the New York Stock Exchange.
The following table shows the high and low closing sales prices of the common shares on the stock market of NYSE Euronext Amsterdam as reported in the Official Price List and the high and low closing sales prices of the New York Registry Shares on the New York Stock Exchange:
Philips Group
| Euronext Amsterdam (EUR) | New York stock exchange (USD) | |||||||||||||||||||
| high | low | high | low | |||||||||||||||||
2009 | 21.03 | 10.95 | 30.19 | 13.98 | ||||||||||||||||
2010 | 1st quarter | 25.28 | 20.34 | 33.48 | 28.26 | |||||||||||||||
| 2nd quarter | 26.94 | 22.83 | 35.90 | 28.09 | ||||||||||||||||
| 3rd quarter | 26.23 | 21.32 | 33.32 | 26.84 | ||||||||||||||||
| 4th quarter | 24.19 | 20.79 | 33.90 | 27.10 | ||||||||||||||||
2011 | 1st quarter | 25.34 | 21.73 | 33.81 | 29.81 | |||||||||||||||
| 2nd quarter | 22.84 | 16.33 | 32.44 | 23.36 | ||||||||||||||||
| 3rd quarter | 17.84 | 12.23 | 25.74 | 16.87 | ||||||||||||||||
| 4th quarter | 16.28 | 12.77 | 22.54 | 17.22 | ||||||||||||||||
2012 | 1st quarter | 16.56 | 14.48 | 21.51 | 18.34 | |||||||||||||||
| 2nd quarter | 15.57 | 13.76 | 20.26 | 17.32 | ||||||||||||||||
| 3rd quarter | 19.49 | 15.51 | 24.89 | 19.11 | ||||||||||||||||
| 4th quarter | 20.33 | 18.27 | 26.81 | 23.52 | ||||||||||||||||
2013 | 1st quarter | 23.67 | 20.26 | 31.72 | 26.60 | |||||||||||||||
| 2nd quarter | 23.48 | 20.36 | 30.65 | 26.75 | ||||||||||||||||
| 3rd quarter | 25.32 | 20.89 | 33.60 | 27.28 | ||||||||||||||||
| 4th quarter | 26.78 | 23.17 | 36.97 | 31.36 | ||||||||||||||||
August, 2013 | 24.58 | 22.90 | 32.45 | 30.62 | ||||||||||||||||
September, 2013 | 25.32 | 23.83 | 33.60 | 31.57 | ||||||||||||||||
October, 2013 | 26.08 | 23.17 | 35.69 | 31.36 | ||||||||||||||||
November, 2013 | 26.50 | 25.70 | 35.76 | 34.81 | ||||||||||||||||
December, 2013 | 26.78 | 24.64 | 36.97 | 33.92 | ||||||||||||||||
January, 2014 | 28.10 | 25.52 | 38.36 | 34.61 | ||||||||||||||||
High and low closing price of common shares
2012 - 2017
|
| |||||||||||||||||||
| Euronext Amsterdam (EUR) | New York Stock Exchange (USD) | |||||||||||||||||||
|
|
|
| |||||||||||||||||
| high | low | high | low | |||||||||||||||||
|
| |||||||||||||||||||
January, 2017 | 29.40 | 27.14 | 30.74 | 29.10 | ||||||||||||||||
December, 2016 | 29.07 | 26.60 | 30.57 | 28.22 | ||||||||||||||||
November, 2016 | 27.90 | 26.50 | 30.55 | 28.61 | ||||||||||||||||
October, 2016 | 27.73 | 26.12 | 30.19 | 28.43 | ||||||||||||||||
September, 2016 | 26.70 | 25.25 | 29.97 | 28.34 | ||||||||||||||||
August, 2016 | 26.18 | 23.51 | 29.11 | 26.28 | ||||||||||||||||
2016 | 4th quarter | 29.07 | 26.12 | 30.57 | 28.22 | |||||||||||||||
| 3rd quarter | 26.70 | 21.58 | 29.97 | 24.05 | ||||||||||||||||
| 2nd quarter | 25.20 | 21.01 | 28.58 | 23.29 | ||||||||||||||||
| 1st quarter | 25.13 | 20.95 | 28.58 | 23.68 | ||||||||||||||||
2015 | 4th quarter | 25.88 | 21.09 | 27.29 | 23.66 | |||||||||||||||
| 3rd quarter | 25.71 | 20.79 | 28.23 | 23.19 | ||||||||||||||||
| 2nd quarter | 27.65 | 22.82 | 30.08 | 25.46 | ||||||||||||||||
| 1st quarter | 27.40 | 23.16 | 30.31 | 27.54 | ||||||||||||||||
2014 | 4th quarter | 24.68 | 20.98 | 31.02 | 26.36 | |||||||||||||||
| 3rd quarter | 25.27 | 22.11 | 32.39 | 29.80 | ||||||||||||||||
| 2nd quarter | 25.86 | 22.22 | 35.95 | 30.35 | ||||||||||||||||
| 1st quarter | 28.10 | 23.88 | 38.36 | 33.13 | ||||||||||||||||
2013 | 4th quarter | 26.78 | 23.17 | 36.97 | 31.36 | |||||||||||||||
| 3rd quarter | 25.32 | 20.89 | 33.60 | 27.28 | ||||||||||||||||
| 2nd quarter | 23.48 | 20.36 | 30.65 | 26.75 | ||||||||||||||||
| 1st quarter | 23.67 | 20.26 | 31.72 | 26.60 | ||||||||||||||||
2012 | 20.33 | 18.27 | 26.81 | 23.52 | ||||||||||||||||
|
| |||||||||||||||||||
262 Annual Report 20132016 243
16 Investor Relations 16.4 - 16.414.4
Euronext Amsterdam
Philips Group
Share price development in Euronext Amsterdamin EUR
in euros2015 - 2016
| ||||||||||||||||||||||||||||||||||||||||||||||||||||||||||||||||||||||||||||||||||||||||||||||||
| PHIA | Jan | Feb | Mar | Apr | May | Jun | Jul | Aug | Sep | Oct | Nov | Dec | Jan | Feb | Mar | Apr | May | Jun | Jul | Aug | Sep | Oct | Nov | Dec | ||||||||||||||||||||||||||||||||||||||||||||||||||||||||||||||||||||||||
2013 | ||||||||||||||||||||||||||||||||||||||||||||||||||||||||||||||||||||||||||||||||||||||||||||||||
2016 | ||||||||||||||||||||||||||||||||||||||||||||||||||||||||||||||||||||||||||||||||||||||||||||||||
High | 23.13 | 23.31 | 23.67 | 23.48 | 22.90 | 21.81 | 24.41 | 24.58 | 25.32 | 26.08 | 26.50 | 26.78 | 24.50 | 24.33 | 25.13 | 25.20 | 24.33 | 24.11 | 24.39 | 26.18 | 26.70 | 27.73 | 27.90 | 29.07 | ||||||||||||||||||||||||||||||||||||||||||||||||||||||||||||||||||||||||
Low | 20.26 | 21.23 | 21.56 | 20.54 | 20.45 | 20.36 | 20.89 | 22.90 | 23.83 | 23.17 | 25.70 | 24.64 | 22.15 | 20.95 | 23.56 | 23.55 | 22.57 | 21.01 | 21.58 | 23.51 | 25.25 | 26.12 | 26.50 | 26.60 | ||||||||||||||||||||||||||||||||||||||||||||||||||||||||||||||||||||||||
Average | 21.34 | 22.26 | 22.93 | 22.15 | 21.97 | 21.29 | 22.81 | 24.00 | 24.54 | 24.68 | 26.14 | 25.81 | 22.98 | 22.47 | 24.37 | 24.50 | 23.34 | 22.80 | 23.15 | 25.05 | 26.08 | 26.67 | 27.20 | 28.18 | ||||||||||||||||||||||||||||||||||||||||||||||||||||||||||||||||||||||||
Average daily volume1) | 5.50 | 6.11 | 6.09 | 6.57 | 6.17 | 5.90 | 5.33 | 3.81 | 6.32 | 5.41 | 3.90 | 4.99 | 10.58 | 8.31 | 6.81 | 5.96 | 5.58 | 6.67 | 5.94 | 5.41 | 5.92 | 5.73 | 6.94 | 5.27 | ||||||||||||||||||||||||||||||||||||||||||||||||||||||||||||||||||||||||
2012 | ||||||||||||||||||||||||||||||||||||||||||||||||||||||||||||||||||||||||||||||||||||||||||||||||
2015 | ||||||||||||||||||||||||||||||||||||||||||||||||||||||||||||||||||||||||||||||||||||||||||||||||
High | 16.56 | 16.42 | 16.26 | 15.32 | 15.26 | 15.57 | 17.90 | 18.86 | 19.49 | 20.11 | 20.21 | 20.33 | 26.80 | 26.77 | 27.40 | 27.65 | 25.44 | 24.94 | 25.32 | 25.71 | 23.29 | 24.59 | 25.88 | 25.49 | ||||||||||||||||||||||||||||||||||||||||||||||||||||||||||||||||||||||||
Low | 14.48 | 15.45 | 14.95 | 13.76 | 14.00 | 13.87 | 15.51 | 18.09 | 18.16 | 18.27 | 19.47 | 19.83 | 23.16 | 24.54 | 25.98 | 25.66 | 24.24 | 22.82 | 22.38 | 21.94 | 20.79 | 21.09 | 24.40 | 23.19 | ||||||||||||||||||||||||||||||||||||||||||||||||||||||||||||||||||||||||
Average | 15.31 | 15.80 | 15.55 | 14.51 | 14.49 | 14.67 | 16.47 | 18.46 | 18.80 | 18.95 | 19.95 | 20.05 | 24.49 | 25.45 | 26.64 | 26.96 | 24.96 | 23.94 | 23.97 | 24.19 | 22.11 | 22.71 | 25.05 | 24.06 | ||||||||||||||||||||||||||||||||||||||||||||||||||||||||||||||||||||||||
Average daily volume1) | 6.77 | 5.53 | 5.54 | 8.05 | 6.91 | 6.10 | 6.15 | 4.68 | 5.60 | 4.97 | 4.89 | 3.88 | 9.26 | 5.64 | 5.86 | 7.66 | 6.96 | 8.79 | 7.30 | 6.88 | 6.75 | 6.00 | 6.08 | 6.05 | ||||||||||||||||||||||||||||||||||||||||||||||||||||||||||||||||||||||||
|
| |||||||||||||||||||||||||||||||||||||||||||||||||||||||||||||||||||||||||||||||||||||||||||||||
| 1) | In millions of shares |
New York Stock Exchange
Philips Group
Share price development in New York Stock Exchangein USD
in US dollars2015 - 2016
| ||||||||||||||||||||||||||||||||||||||||||||||||||||||||||||||||||||||||||||||||||||||||||||||||
| PHG | Jan | Feb | Mar | Apr | May | Jun | Jul | Aug | Sep | Oct | Nov | Dec | Jan | Feb | Mar | Apr | May | Jun | Jul | Aug | Sep | Oct | Nov | Dec | ||||||||||||||||||||||||||||||||||||||||||||||||||||||||||||||||||||||||
2013 | ||||||||||||||||||||||||||||||||||||||||||||||||||||||||||||||||||||||||||||||||||||||||||||||||
2016 | ||||||||||||||||||||||||||||||||||||||||||||||||||||||||||||||||||||||||||||||||||||||||||||||||
High | 31.16 | 31.72 | 30.72 | 30.65 | 29.21 | 29.19 | 32.47 | 32.45 | 33.60 | 35.69 | 35.76 | 36.97 | 26.68 | 26.57 | 28.58 | 28.58 | 27.62 | 27.11 | 26.74 | 29.11 | 29.97 | 30.19 | 30.55 | 30.57 | ||||||||||||||||||||||||||||||||||||||||||||||||||||||||||||||||||||||||
Low | 26.60 | 27.82 | 28.23 | 26.88 | 26.75 | 26.94 | 27.28 | 30.62 | 31.57 | 31.36 | 34.81 | 33.92 | 24.04 | 23.68 | 26.08 | 26.74 | 24.97 | 23.29 | 24.05 | 26.28 | 28.34 | 28.43 | 28.61 | 28.22 | ||||||||||||||||||||||||||||||||||||||||||||||||||||||||||||||||||||||||
Average | 28.41 | 29.68 | 29.71 | 28.84 | 28.37 | 28.12 | 29.91 | 31.92 | 32.86 | 33.63 | 35.22 | 35.48 | 24.94 | 24.98 | 27.21 | 27.76 | 26.29 | 25.67 | 25.58 | 28.04 | 29.20 | 29.35 | 29.31 | 29.70 | ||||||||||||||||||||||||||||||||||||||||||||||||||||||||||||||||||||||||
Average daily volume1) | 0.85 | 0.77 | 0.82 | 0.77 | 0.80 | 0.93 | 0.86 | 0.44 | 0.66 | 0.66 | 0.39 | 0.39 | 1.72 | 1.73 | 1.71 | 1.26 | 1.00 | 1.23 | 1.98 | 1.92 | 1.41 | 1.10 | 1.41 | 1.45 | ||||||||||||||||||||||||||||||||||||||||||||||||||||||||||||||||||||||||
2012 | ||||||||||||||||||||||||||||||||||||||||||||||||||||||||||||||||||||||||||||||||||||||||||||||||
2015 | ||||||||||||||||||||||||||||||||||||||||||||||||||||||||||||||||||||||||||||||||||||||||||||||||
High | 21.47 | 21.36 | 21.51 | 20.26 | 20.00 | 19.67 | 22.11 | 23.30 | 24.89 | 26.23 | 26.01 | 26.81 | 30.31 | 30.10 | 29.80 | 30.08 | 28.77 | 27.99 | 27.81 | 28.23 | 25.86 | 26.94 | 27.29 | 27.14 | ||||||||||||||||||||||||||||||||||||||||||||||||||||||||||||||||||||||||
Low | 18.34 | 20.24 | 19.58 | 17.98 | 17.68 | 17.32 | 19.11 | 22.00 | 22.99 | 23.52 | 24.80 | 25.91 | 27.54 | 27.80 | 27.83 | 28.57 | 27.29 | 25.46 | 24.87 | 24.79 | 23.19 | 23.66 | 26.05 | 25.41 | ||||||||||||||||||||||||||||||||||||||||||||||||||||||||||||||||||||||||
Average | 19.73 | 20.85 | 20.57 | 19.10 | 18.57 | 18.41 | 20.26 | 22.84 | 24.20 | 24.48 | 25.51 | 26.27 | 28.49 | 28.96 | 28.85 | 29.17 | 27.90 | 26.83 | 26.35 | 26.84 | 24.75 | 25.50 | 26.82 | 26.21 | ||||||||||||||||||||||||||||||||||||||||||||||||||||||||||||||||||||||||
Average daily volume1) | 1.64 | 0.93 | 1.32 | 1.80 | 1.03 | 0.83 | 0.63 | 0.54 | 0.82 | 0.64 | 0.77 | 0.62 | 1.34 | 0.80 | 0.77 | 1.56 | 1.16 | 1.73 | 2.04 | 1.77 | 1.60 | 1.21 | 0.93 | 0.90 | ||||||||||||||||||||||||||||||||||||||||||||||||||||||||||||||||||||||||
|
| |||||||||||||||||||||||||||||||||||||||||||||||||||||||||||||||||||||||||||||||||||||||||||||||
| 1) | In millions of shares |
Annual Report 2013 263
16 Investor Relations 16.4 - 16.4
Philips Group
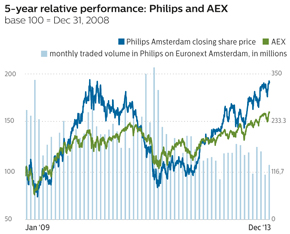

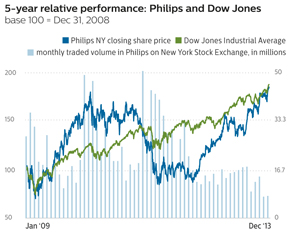
Share listings | Amsterdam, New York | |||
Ticker code | PHIA, PHG | |||
No. of shares issued at Dec. 31, | ||||
No. of shares outstanding issued at Dec. 31, | ||||
Market capitalization atyear-end | EUR | |||
Industry classification | ||||
MSCI: Capital Goods | 20105010 | |||
ICB: | ||||
Members of indices | ||||
AEX, NYSE, DJSI, and others | ||||
264244 Annual Report 20132016
16 Investor Relations 16.5 - 16.514.4
Philips Group
16.5 Philips’ acquisitionsRelative performance: Philips and AEX (indexed)
2016
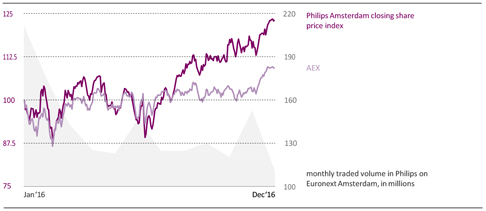
Philips made no announcements of acquisitions in 2013Group
Relative performance: Philips and 2012.Dow Jones Industrial Average (indexed)
2016
Philips Group Relative performance: Philips and unweighted peer group index (indexed)1) 2016 | ||||||
| ||||||
| ||||||
| ||||||
| ||||||
| ||||||
| ||||||
| ||||||
| 1) |
|
| 2) |
|
| ||||||
| ||||||
| ||||||
| ||||||
| ||||||
| ||||||
| ||||||
| ||||||
| ||||||
| ||||||
| ||||||
| ||||||
|
Annual Report 2013 2652016 245
16 Investor Relations 16.6 - 16.714.5
| Financial calendar | ||||
Annual General Meeting of Shareholders | ||||
Record date Annual General Meeting of Shareholders | April | |||
Annual General Meeting of Shareholders | May | |||
Quarterly reports | ||||
First quarter results | April | |||
Second quarter results | July | |||
Third quarter results | October | |||
Fourth quarter results | January | |||
| ||||
| ||||
| 1) | Subject to final confirmation |
Shareholder services
Holders of shares listed on Euronext Amsterdam
Philips offers a dynamic print manager that facilitates the creation of a customized PDF. Non-US shareholders and othernon-US interested parties can make inquiries about the Annual Report 20132016 to:
Royal Philips
Annual Report Office
Philips Center, HBT 12
P.O. Box 77900
1070 MX Amsterdam, The Netherlands
E-mail:annual.report@philips.com
Communications concerning share transfers, lost certificates, dividends and change of address should be directed to:
ABN AMRO Bank N.V.
Department Equity Capital Markets/Corporate Broking
HQ7050
Gustav Mahlerlaan 10, 1082 PP Amsterdam
The Netherlands
Telephone: +31-20-34+31-20-34 42000
Fax: +31-20-62+31-20-62 88481
E-mail:corporate.broking@nl.abnamro.com
Holders of New York Registry shares
Philips offers a dynamic print manager that facilitates the creation of a customized PDF. Holders of New York Registry shares and other interested parties in the US can make inquiries about the Annual Report 20132016 to:
Citibank Shareholder Service
P.O. Box 43077 Providence, Rhode Island 02940-3077
Telephone:1-877-CITI-ADR (toll-free)
Telephone:1-781-575-4555 (outside of US)
Fax:1-201-324-3284
Website:www.citi.com/dr
E-mail:citibank@shareholders-online.com
Communications concerning share transfers, lost certificates, dividends and change of address should be directed to Citibank. The Annual Report on Form20-F is filed electronically with the US Securities and Exchange Commission.
266 Annual Report 2013
16 Investor Relations 16.7 - 16.7
International direct investment program
Philips offers a dividend reinvestment and direct stockshare purchase plan designed for the US market. This program provides existing shareholders and interested investors with an economical and convenient way to purchase and sell Philips New York Registry shares and to reinvest cash dividends. Philips does not administer or sponsor the program and assumes no obligation or liability for the operation of the plan. For further information on this program and for enrollment forms, contact:
Citibank Shareholder Service
Telephone:1-877-248-4237(1-877-CITI-ADR)
Monday through Friday 8:30 AM EST
through 6:00 PM EST
Websitewww.citi.com/dr
E-mail:citibank@shareholders-online.com
or by writing to:
Citibank Shareholder Service
International Direct Investment Program
P.O. Box 2502, Jersey City, NJ07303-2502
20142017 Annual General Meeting of Shareholders
The Agenda and the explanatory notes ofto the Agenda for the 2014 Annual General Meeting of Shareholders areon May 11, 2017, will be published on the Company’s website.
For the 2017 Annual General Meeting of Shareholders, on May 1, 2014, a record date of April 3, 201413, 2017 will apply. Those persons who, on April 3, 2014that date, hold shares in the Company, and are registered as such in one of the registers designated by the Board of Management for the Annual General Meeting of Shareholders, will be entitled to participate in, and vote at, the meeting.
The Dutch Shareholders Communication Channel decided to terminate its activities as per the end of 2013. Their decision follows the entry into force of new legislation on July 1, 2013 which provides a legal basis in Dutch law for shareholder communication.
Investor relationsRelations activities
From time to time the Company engages in communicationscommunicates with investors via road shows, one-on-one meetings, group meetings, broker conferences and capital markets days.a Capital Markets Day, announced in advance on the Company’s website. The purpose of these meetingsengagements is to inform the market onof the results, strategy and decisions made, as well as to receive feedback from shareholders. Also,Furthermore, the Company engages in bilateral communications with investors. These communications take place either at the initiative of the Company or at the initiative of investors. During these communications theThe Company is generally represented by its Investor Relations department. However,department during these interactions, however, on a limited number of occasions the Investor Relations department is accompanied by one or more members of the Board of Management.senior management. The subject matter of the bilateral communications ranges from individual queries from investors to more elaborate discussions following disclosures that the Company has made, such as its annual and quarterly reports. TheAlso here, the Company is strict in its compliance with applicable rules and regulations on fair andnon-selective disclosure and equal treatment of shareholders.
246 Annual Report 2016
Investor Relations 14.6
More information on the activities of Investor Relations can be found in chapter 10,9, Corporate governance, of this report.
Analysts’ coverage
Philips is covered by approximately 3524 analysts who frequently issue reports on the company.
Annual Report 2013 267
16 Investor Relations 16.7 - 16.8
For a list of our current analysts, please refer to:www.philips.com/a-w/about/investor/shareholder-info/analyst-coverage.html
How to reach us
Investor Relations contact
Royal Philips
Philips Center, HBT 14
P.O. Box 77900
1070 MX Amsterdam, The Netherlands
Telephone: +31-20-59 77222
Website: www.philips.com/investor
E-mail:investor.relations@philips.com
Robin Jansen
Head of Investor Relations
Telephone: +31-20-59 77222
Vanessa Bruinsma-Kleijkers
Investor Relations Manager
Telephone: +31-20-59 77447
Leandro Mazzoni
Investor Relations Manager
Telephone: +31-20-59 77055
The registered office of Royal Philips is
High Tech Campus 5
5656 AE Eindhoven, The Netherlands
Switch board, telephone: +31-40-27+31-40-27 91111
Investor Relations contact
Royal Philips
Philips Center
P.O. Box 77900
1070 MX Amsterdam, The Netherlands
Telephone:+31-20-59 77222
Website:www.philips.com/investor
E-mail:investor.relations@philips.com
Pim Preesman
Head of Investor Relations
Telephone:+31-20-59 77222
Ksenija Gonciarenko
Investor Relations Manager
Telephone:+31-20-59 77055
Sustainability contact
Philips Group Sustainability
High Tech Campus 5 (room 2.56)2.67)
5656 AE Eindhoven, The Netherlands
Telephone: +31-40-27+31-40-27 83651
Fax: +31-40-27 86161
Website:www.philips.com/sustainability
E-mail:philips.sustainability@philips.com
Corporate CommunicationsGroup Press Office contact
Royal Philips
Philips Center, HBT 19
P.O. Box 77900Amstelplein 2
1070 MX1096 BC Amsterdam, The Netherlands
E-mail:corporate.communications@philips.comgroup.communications@philips.com
For media contacts please refer to:
www.newscenter.philips.com/main/standard/news/contacts
Dutch Taxationtaxation
The statements below are only a general summary of certain material Dutch tax consequences for holders of common shares that arenon-residents of the Netherlands based on present Dutch tax laws and the Tax Convention of December 18, 1992, as amended by the protocol that entered into force on December 28, 2004, between the United States of America and the Kingdom of the Netherlands (the U.S.US Tax Treaty) and are not to be read as extending by implication to matters not specifically referred to herein. As to individual tax consequences, investors in the common shares should consult their own professional tax advisor.
With respect to aA holder of common shares that is an individual who receives income or derives capital gains from the common shares and this income received or capital gains derived are attributable to past, present or future employment activities of such holder, the income of which is taxable in the Netherlands, the Dutch tax position is not discussed in this summary.Netherlands.
Dividend withholding tax
In general, a distribution to shareholders by a company resident in the Netherlands (such as the Company) is subject to a withholding tax imposed by the Netherlands at a rate of 15%. Share dividends paid out of the Company’spaid-in share premium recognized for Dutch tax purposes are not subject to the above mentionedabove-mentioned withholding tax. Share dividends paid out of the Company’s retained earnings are subject to dividend withholding tax on the nominal value of the shares issued. Pursuant to the provisions of the U.S.US Tax Treaty, a reduced rate may be applicable in respect of dividends paid by the Company to a beneficial owner holding directly 10% or more of the voting power of the Company, if such owner is a company resident ofin the United States (as defined in the U.S.US Tax Treaty) and entitled to the benefits of the U.S.US Tax Treaty.
Pursuant to Dutch anti-dividend stripping legislation, a holder of common shares who is the recipient of dividends will generally not be considered the beneficial owner of the dividends if (i) as a consequence of a combination of transactions, a person other than the recipient whollybenefits, in full or partly benefitsin part, directly or indirectly, from the dividends; (ii) whereby such other person retains, directly or indirectly, an interest similar to that in the common shares on which the dividends were paid; and
268 Annual Report 2013
16 Investor Relations 16.8 - 16.8
(iii) that other person is entitled to a credit, reduction or refund of dividend withholding tax that is less than that of the recipient.
Dividends paid to qualifying exempt US pension trusts and qualifying exempt US organizations are, under certain conditions, exempt from Dutch withholding tax under the U.S.US Tax Treaty. Qualifying exempt US pension trusts normally remain subject to withholding at the rate of 15% and are required to file for a refund of the tax withheld. Only if certain conditions are fulfilled, such pension trusts may be eligible for relief at source upon
Annual Report 2016 247
Investor Relations 14.7
payment of the dividend. However, for qualifying exempt US organizations no relief at source upon payment of the dividend is currently available; such exempt US organizations should apply for a refund of the 15% withholding tax withheld. Further, under certain circumstances, certain exempt organizations (e.g. pension funds) may be eligible for a refund of Dutch withholding tax upon their request pursuant to Dutch tax law. Under proposed Dutch tax law (not yet entered into force as per January 1, 2017), provided certain conditions are met, such (US) organizations may be eligible for relief at source upon request.
Upon request and under certain conditions, certain qualifyingnon-resident individual and corporate holders of common shares resident in EU/EEA member states or in a qualifyingnon-EU/EEA state may be eligible for a refund of Dutch dividend withholding tax to the extent that the withholding tax levied is higher than the personal and corporate income tax which would have been due if they were resident in the Netherlands.
The Company may, with respect to certain dividends received from qualifyingnon-Dutch subsidiaries, credit taxes withheld from those dividends against the Dutch withholding tax imposed on certain qualifying dividends that are redistributed by the Company, up to a maximum of the lesser of:
3% of the amount of qualifying dividends redistributed by the Company; and
3% of the gross amount of certain qualifying dividends received by the Company.
The reduction is applied to the Dutch dividend withholding tax that the Company must pay to the Dutch tax authorities and not to the Dutch dividend withholding tax that the Company must withhold.
Income and capital gains
Income and capital gains derived from the common shares by anon-resident individual ornon-resident corporate shareholder are generally not subject to Dutch income or corporation tax, unless (i) such income and gains are attributable to a (deemed) permanent establishment or (deemed) permanent representative in the Netherlands of the shareholder;Netherlands; or (ii) the shareholder is entitled to a share in the profits of an enterprise or (in the case of anon-resident corporate shareholder only) a co-entitlement to the net worth of an enterprise that is effectively managed in the Netherlands (other than by way of securities) and to which enterprise the common shares are attributable; or (iii) such income and capital gains are derived from a direct, indirect or deemed substantial participation in the share capital of athe company (such substantial participation not being a business asset), and, in the case of anon-resident corporate shareholder only, it being held with the primary aim or one of the primary aims to avoid the levy of income tax or dividend withholding tax from another person;person and is not put in place without valid commercial reasons that reflect economic reality; or (iv) in the case of anon-resident corporate shareholder, such shareholder is a resident of Aruba, Curacao or Saint Martin with a permanent establishment or permanent representative in Bonaire, Eustatius or Saba to which the common shares are attributable while the profits of such shareholderand certain conditions are taxable in the Netherlands pursuant to article 17(3)(c) of the Dutch Corporate Income Tax Act 1969;met; or (v) in the case of anon-resident individual, (a) such individual derives income or capital gains from the common shares that are taxable as benefits from ‘miscellaneous activities’ in the Netherlands (resultaat uit overige werkzaamheden, as defined in the Dutch Income Tax Act 2001), which includes the performance of activities with respect to the ordinarycommon shares that exceed regular portfolio management; or (b) such individual has elected to be treated as a Dutch resident.management.
In general, a holder of common shares has a substantial participation if he holds either directly or indirectly and either independently or jointly with his partner (as defined in the Dutch Income Tax Act 2001), the ownership of, or certain other rights over, at least 5% of the total issued share capital or total issued particular class of shares of the Company or rights to acquire direct or indirect shares, whether or not already issued, that represent at any time 5% or more of the total issued capital (or the total issued particular class of shares) or the ownership of certain profit participating certificates that relate to 5% or more of the annual profit or to 5% or more of the liquidation proceeds. A shareholder will also have a substantial participation in the Company if one or more of certain relatives of the shareholder hold a substantial participation in the Company. A deemed substantial participation amongst others exists if (part of) a substantial participation has been disposed of, or is deemed to have been disposed of, on a non-recognition basis.
Estate and gift taxes
No estate, inheritance or gift taxes are imposed by the Netherlands on the transfer or deemed transfer of common shares by way of gift by or on the death of a shareholder if, at the time of the death of the shareholder or the gift of the common shares (as the case may be), such shareholder is not a (deemed) resident of the Netherlands.
Inheritance or gift taxes (as the case may be) are due, however, if such shareholder:
Annual Report 2013 269
16 Investor Relations 16.8 - 16.8
has Dutch nationality and has been a resident of the Netherlands at any time during the ten years preceding the time of thetheir death or gift; or
has nodoes not have Dutch nationality but has been a resident of the Netherlands at any time during the twelve months preceding the time of the gift (for Netherlands gift taxes only).
United States Federal Taxation
This section describes the material United States federal income tax consequences to a US holder (as defined below) of owning common shares. It applies only if the common shares are held as capital assets for
248 Annual Report 2016
Investor Relations 14.7
tax purposes. This section does not apply to a member of a special class of holders subject to special rules, including:
a dealer in securities,
a trader in securities that elects to use amark-to-market method of accounting for securities holdings,
atax-exempt organization,
a life insurance company,
a person liable for alternative minimum tax,
a person thatwho actually or constructively owns 10% or more of our voting stock,
a person thatwho holds common shares as part of a straddle or a hedging or conversion transaction,
a person thatwho purchases or sells common shares as part of a wash sale for tax purposes, or
a person whose functional currency is not the US dollar.
This section is based on the Internal Revenue Code of 1986, as amended, its legislative history, existing and proposed regulations, published rulings and court decisions, all as currently in effect, as well as on the U.S.US Tax Treaty. These laws and regulations are subject to change, possibly on a retroactive basis.
If a partnership holds the common shares, the United States federal income tax treatment of a partner will generally depend on the status of the partner and the tax treatment of the partnership. A partner in a partnership holding the common shares should consult its tax advisor with regard to the United States federal income tax treatment of an investment in the common shares.
A US holder is defined as a beneficial owner of common shares that is:
a citizen or resident of the United States,
a domestic corporation,
an estate whose income is subject to United States federal income tax regardless of its source, or
a trust if a United States court can exercise primary supervision over the trust’s administration and one or more United States persons are authorized to control all substantial decisions of the trust.
A US holder should consult its own tax advisor regarding the United States federal, state and local and other tax consequences of owning and disposing of common shares in its particular circumstances.
This discussion addresses only United States federal income taxation.
Taxation of Dividends
Under the United States federal income tax laws, the gross amount of any dividend paid in stock or cash out of our current or accumulated earnings and profits (as determined for United States federal income tax purposes) is subject to United States federal income taxation. For anon-corporate US holder, dividends paid that constitute qualified dividend income will be taxable at a maximum tax rate of 20%the preferential rates applicable to long-term capital gains, provided that thenon-corporate US holder holds the common shares for more than 60 days during the121-day period beginning 60 days before theex-dividend date and provided it meets other holding period requirements. Dividends paid with respect to the common shares generally will be qualified dividend income 1)1). A US holder must include any Dutch tax withheld from the dividend payment in this gross amount even though it does not in fact receive it. The dividend is taxable to a US holder when it receives the dividend, actually or constructively. The dividend will not be eligible for the dividends-received deduction generally allowed to United States corporations in respect of dividends received from other United States corporations. TheFor dividend payments made in euro, the amount of the dividend distribution that a US holder must include in its income will be the US dollar value of the Euroeuro payments made, determined at the spot Euro/euro/ US dollar rate on the date the dividend distribution is includiblecan be included in its income, regardless of whether the payment is in fact converted into US dollars. Generally, any gain or loss resulting from currency exchange fluctuations during the period from the date a US holder includes the dividend payment in income to the date a US holder converts the payment into US dollars will be treated as ordinary income or loss and will not be eligible for the special tax rate applicable to qualified dividend income. The gain or loss generally will be income or loss from sources within the United States for foreign tax credit limitation purposes. Distributions in excess of current and accumulated earnings and profits, as determined for
270 Annual Report 2013
16 Investor Relations 16.8 - 16.8
United States federal income tax purposes, will be treated as anon-taxable return of capital to the extent of a US holder’s basis in the common shares and thereafter as capital gain. However, we do not expect to calculate earnings and profits in accordance with United States federal income tax principles. Accordingly, US holders should expect to generally treat distributions we make as dividends.
Subject to certain limitations, the Dutch tax withheld in accordance with the U.S.US Tax Treaty and paid over to the Netherlands will be creditable or deductible against a US holder’s United States federal income tax liability. However, Dutch withholding tax may not be creditable or deductible to the extent that we reduce (as described above under “Dutch taxation - Dividend withholding tax”) the amount of withholding tax paid over to the Netherlands by crediting taxes withheld from certain dividends received by us. Special rules apply in determining the foreign tax credit limitation with respect to dividends that are subject to the maximum 20%preferential tax rate.rates. To the extent a refund of the tax withheld is available under Dutch law, or under the U.S.US Tax Treaty, the amount of tax withheld that is refundable will not be eligible for credit against United States federal income tax liability. Dividends will be income from sources outside the United States, and depending on a holder’s circumstances, will generally be either “passive”
Annual Report 2016 249
Investor Relations 14.7
“passive” or “general” income for the purposes of computing the foreign tax credit allowable to the holder.
Taxation of Capital Gains
A US holder that sells or otherwise disposes of its common shares will recognize capital gain or loss for United States federal income tax purposes equal to the difference between the US dollar value of the amount that it realizes and its tax basis, determined in US dollars, in its common shares. Capital gain of a non-corporate US holder is generally taxed at a maximumpreferential tax rate of 20%rates where the holder has a holding period greater than one year2)2). The gain or loss will generally be income or loss from sources within the United States for foreign tax credit limitation purposes.
PFIC Rules
We do not believe that the common shares will be treated as stock of a passive foreign investment company, or PFIC, for United States federal income tax purposes, but this conclusion is a factual determination that is made annually and thus is subject to change. If we are treated as a PFIC, unless a US holder elects to be taxed annually on amark-to-market basis with respect to the common shares, gain realized on the sale or other disposition of the common shares would in general not be treated as capital gain. Instead a US holder would be treated as if it had realized such gain and certain “excess distributions” ratably over the holding period for the common shares and would be taxed at the highest tax rate in effect for each such year to which the gain was allocated, in addition to which an interest charge in respect of the tax attributable to each such year would apply. Any dividends received by a US holder will not be eligible for the special tax rates applicable to qualified dividend income if we are treated as a PFIC with respect to such US holder either in the taxable year of the distribution or the preceding taxable year, but instead will be taxable at rates applicable to ordinary income and subject to the excess distribution regime described above.
| 1) | In addition, a US holder that is an individual or estate, or a trust that does not fall into a special class of trusts that is exempt from such tax, is subject to a 3.8% tax on the lesser of (1) the US holder’s “net investment income” for the relevant taxable year and (2) the excess of the US holder’s modified adjusted gross income for the taxable year over a certain threshold (the “Medicare tax”). A US holder’s net investment income generally includes its dividend income. |
| 2) | In addition, the gain or loss is generally included in a US holder’s net investment income, which may be subject to a 3.8% tax as described in the discussion of the Medicare tax under the heading – “Taxation of Dividends”. |
Annual Report 2013 271
16 Investor Relations 16.9 - 16.9
16.914.8 New York Registry Shares
Fees and Charges Payable by a Holder of New York Registry Shares
Citibank, N.A., as the US registrar, transfer agent, paying agent and shareholder servicing agent (“Agent”) under Philips’ New York Registry Share program (the “Program”), collects fees for delivery and surrender of New York Registry Shares directly from investors depositing ordinary shares or surrendering New York Registry Shares for the purpose of withdrawal or from intermediaries acting for them. The Agent collects fees for making distributions to investors by deducting those fees from the amounts distributed or by selling a portion of the distributable property to pay the fees.
The charges of the Agent payable by investors are as follows:
The New York Transfer Agent charges shareholders a fee of up to USD 5.00 per 100 shares for the exchange of New York Registry shares for ordinary shares and vice versa.
Fees and Payments made by the Agent to PhilipsGreen Innovation
The Agent has agreed to reimburse certain expensesGreen Innovation is a subset of Philips relatedSustainable Innovation and is defined as all R&D activities directly contributing to the Programdevelopment of Green Products and incurredSolutions or Green Technologies; it contributes to SDG 12. This means all products, systems or services that demonstrate a measurable positive impact on energy efficiency (10% or greater than previous products or legal requirements), and preferably also in one or more green focal areas: Circularity, Weight & Materials, Packaging, and Substances. Green Innovation for Lighting is calculated by multiplying the total R&D spend by percentages for sustainable innovation per Business Group (LED 100%, Professionals 95%, Home is 97% and Lamps 15%). These percentages are an assessment of the contribution of R&D projects to sustainable innovation and are calculated based on prior-year innovation budgets. As part of this assessment we applied the assumptions that the prior-year percentages are still applicable for this reporting year and that all innovation in LED andLED-related products and services are considered as sustainable.
Environmental data
All environmental data from manufacturing operations, except process chemicals, are reported on a quarterly basis in our sustainability reporting and validation tool, according to company guidelines that include definitions, procedures and calculation methods. Process chemicals are reported on ahalf-yearly basis.
Internal validation processes have been implemented and peer audits performed to ensure consistent data quality and to assess the robustness of data reporting systems.
These environmental data from manufacturing are tracked and reported to measure progress against our Sustainable Operations targets.
Reporting on ISO 14001 certification is based on manufacturing units reporting in the sustainability reporting system.
Annual Report 2016 215
Sustainability statements 12.1.8
Operational carbon footprint
Philips reports in connectionline with the Program. InGreenhouse Gas Protocol (GHGP). The GHGP distinguishes three scopes, as described below. The GHGP requires businesses to report on the year ended December 31, 2013first two scopes to comply with the Agent reimbursed to Philips, or paid amounts on Philips behalf to third parties, a total sum of EUR 763,913.
The table below sets forthGHGP reporting standards. As per the types of expenses thatupdated GHGP Scope 2 reporting guidance, from 2015 onward our scope 2 emissions reporting includes both the Agent has agreed to reimbursemarket-based method and the amounts reimbursed in the year ended December 31, 2013:
Categorylocation-based method. The market-based method of Expense Reimbursed to Philipsreporting will serve as our reference for calculating our total operational carbon footprint.
in euros
amount Reimbursed in the year ended December 31, 2013
| ||||
| ||||
| • | Scope 1 – direct CO2 emissions – is reported on in full, with details of direct emissions from our industrial andnon-industrial sites. Emissions from industrial sites, which consist of direct emissions resulting from processes and fossil fuel combustion on site, are reported in the sustainability reporting system. Energy use and CO2 emissions fromnon-industrial sites are based on actual data where available. If this is not the case, they are estimated based on average energy usage per square meters, taking the geographical location and building type of the site into account. | |||
|
|
The location-based method of scope 2 reporting reflects the average emissions intensity of grids on which energy consumption occurs (using mostlygrid-average emission factor data). For this method our emission factors derive from the International Energy Agency (IEA) 2015 and are based on grid averages.
| • | The market-based method of scope 2 reporting allows use of an emission factor that is specific to the energy purchased. Emissions intensity of consumed energy can differ based on contractual instruments used. For example,so-called ‘green electricity contracts’ guarantee the purchaser will be supplied with electricity coming from renewable sources which typically lower emissions per energy unit generated. In the market-based method Philips will account for renewable electricity with an emission factor of 0 grams CO2 per kWh. All renewable electricity claimed by Philips is sourced from the same energy market where the electricity-consuming operations are located, and is tracked and redeemed, retired, or cancelled solely on behalf of Philips. All certificates were obtained through procurement ofGreen-e certified Renewable Energy Certificates (RECs) in the United States and European Guarantees of Origin from the Association of Issuing Bodies (AIB) of the European Energy Certificate System (EECS). |
| • | Scope 3 – other CO2 emissions related to activities not owned or controlled by the Group – is reported on for our business travel and distribution activities. |
The Agent has also agreed to waive certain fees for standard costs associated withPhilips operational carbon footprint (Scope 1, 2 and 3) is calculated on a quarterly basis and includes the administration of the program.
The table below sets forth those expenses that the Agent paid directly to third parties in the year ended December 31, 2013.
Category of Expense paid directly to third parties
in eurosemissions from our:
Industrial sites – manufacturing and assembly sites Non-industrial sites – offices, warehouses, IT centers and R&D facilities Business travel – lease and rental cars and airplane travel Logistics – air, ocean and road transport All emission factors used to transform input data (for example, amount | ||||
| ||||
| ||||
| ||||
| ||||
| ||||
Under certain circumstances, including removal of the Agent or termination of the Program by Philips, Philips is required to repay the Agent certain amounts reimbursed and/or expenses paid to or on behalf of Philips.
272 Annual Report 2013
17 Definitions and abbreviations 17 - 17
17 Definitions and abbreviations
Base of the Pyramid
The base of the pyramid is the largest, but poorest socio-economic group. In global terms, this is the 4 billion people who live on less than USD 2.50 per day.
BMC
Business Market Combination - As a diversified technology group, Philips has a wide portfolio of categories/business innovation units which are grouped in business groups based primarily on technology or customer needs. Philips has physical market presence in over 100 countries, which are groupedtonne-kilometers transported) into 17 market clusters. Our primary operating modus is the Business Market matrix comprising Business Groups and Markets. These Business Market Combinations (BMCs) drive business performance on a granular level at which plans are agreed between global businesses and local market teams.
Brominated flame retardants (BFR)
Brominated flame retardants are a group of chemicals that have an inhibitory effect on the ignition of combustible organic materials. Of the commercialized chemical flame retardants, the brominated variety are most widely used.
Compound annual growth rate (CAGR)
The CAGR is the average Comparable Sales calculated over a period of more than one year. Compound comparable sales exclude the effect of currency movements and acquisitions and divestments (changes in consolidation) over the total period. Philips believes that CAGR information enhances understanding of sales performance over a period longer than a year.
CO2-equivalent
CO2-equivalent or emissions have been updated from the previously used DEFRA (UK Department for Environment, Food & Rural Affairs) 2007 and bespoke emission factors to the applicable DEFRA 2015 emission factors for each year respectively. The total CO2 emission resulting from these calculations serve as input for scope 1, 2 and 3.
Commuting by our employees, upstream distribution (before suppliers ship to us), outsourced activities and emissions resulting from product use by our customers are not included in our operational carbon dioxide equivalent is a quantity that describes,footprint. The calculations for a given mixturebusiness travel by lease car are based on actual fuel usage and amount of greenhouse gas,for travel by rental car they are based on distance travelled. Taxis and chauffeur driven cars used for business travel are not included in the calculations. Emissions from business travel by airplane are calculated by the supplier based on mileage flown and emission factors from DEFRA, distinguishing between short, medium and long-haul flights. Furthermore, emissions from air freight for distribution are calculated based on the amount of CO2tonne-kilometers transported between airports (distinguishing between short, medium and long-haul flights), including an estimate (based on actual data of the lanes with the largest volumes) for trucking from sites and distribution centers to airports and vice versa. Express shipments are generally a mix of road and air transport, depending on the distance.
It is therefore assumed that would haveshipments across over less than 600 km are transported by road and the rest by air (those emissions by air are calculated in the same global warming potential (GWP), when measured overway as air freight). For sea transport, only data on transported volume were available so an estimate had to be made about the average weight of a specified timescale (generally 100 years).
Cash flow before financing activities
The cash flow before financing activitiescontainer. Transportation to and from ports is the sumnot registered. This fore and aft part of net cash flow from operating activities and net cash flow from investing activities.
Chlorofluorocarbon (CFC)
A chlorofluorocarbon is an organic compound that contains carbon, chlorine and fluorine, produced as a volatile derivative of methane and ethane. CFCs were originally developed as refrigerants during the 1930s.
Comparable sales
Comparable sales exclude the effect of currency movements and acquisitions and divestments (changes in consolidation). Philips believes that comparable sales information enhances understanding of sales performance.
Continuing net income
This equals recurring net income from continuing operations, or net income excluding discontinued operations and excluding material non-recurring items.
Dividend yield
The dividend yield is the annual dividend payment divided by Philips’ market capitalization. All referencessea transport was estimated to dividend yield are as of December 31be around 3% of the previous year.
total distance (based on actual data of the lanes with the largest volumes), consisting of a mix of modalities, and was added to the total emissions accordingly. COEBITA2 emissions from road transport were also calculated based on tonne-kilometers. Return travel of vehicles is not included in the data for sea and road distribution.
Earnings before interest, tax and amortization (EBITA) represents income from continuing operations excluding results attributable to non-controlling interest holders, results relating to investments in associates, income taxes, financial income and expenses, amortization and impairment on intangible assets (excluding software and capitalized development expenses). Philips believes that EBITA information makes the underlying performance of its businesses more transparent by factoring out the amortization of these intangible assets, which arises when acquisitions are consolidated. In our
216 �� Annual Report on form 20-F this definition is referred to as Adjusted IFO.2016
EBITA per common share
Sustainability statements 12.1.8
EBITA divided by the weighted average number of shares outstanding (basic). The same principle is used for the definition of net income per common share, replacing EBITA.
Electronic Industry Citizenship Coalition (EICC)
The Electronic Industry Citizenship Coalition was established in 2004 to promote a common code of conduct for the electronics and information and communications technology (ICT) industry. EICC now includes more than 40 global companies and their suppliers.
Employee Engagement Index (EEI)
The Employee Engagement Index (EEI) is the single measure of the overall level of employee engagement at Philips. It is a combination of perceptions and attitudes related to employee satisfaction, commitment and advocacy.
The reported 2016 figure is based on My Accelerate Survey in Royal Philips HealthTech businesses. This survey is conducted by Expert Training Systems (ETS). The total score of the employee engagement is an average of quarterly results of the survey. The results are calculated by taking the average of the answered questions of the surveys.
Energy-using Products (EuP)12.1.9 Sustainability governance
An energy-using productSustainability is strongly embedded in our core business processes, like innovation (EcoDesign), sourcing (Supplier Sustainability Program), manufacturing (Sustainable Operations) and Logistics (Green Logistics) and projects like the Circular Economy initiative.
In Royal Philips, the Sustainability Board is the highest governing sustainability body and is chaired by the Chief Strategy and Innovation Officer and member of the Executive Committee. Three other Executive Committee members sit on the Sustainability Board together with segment and functional executives. The Sustainability Board convenes four times per year, defines Philips’ sustainability strategy and programs, monitors progress and takes corrective action where needed.
Progress on Sustainability is communicated internally on a quarterly basis to Philips employees and at least annually in the Executive Committee and Supervisory Board. Please refer to the Philips Lighting Annual Report to learn about their sustainability governance.
12.1.10 External assurance
EY has provided reasonable assurance on whether the information inchapter 12, Sustainability statements, of this report andsection 2.2, Social performance, of this report andsection 2.3, Environmental performance, of this report presents fairly, in all material respects, the sustainability performance in accordance with the reporting criteria. Please refer tosection 12.5, Assurance report of the independent auditor, of this report.
This section provides summarized information on contributions made on an accruals basis to the most important economic stakeholders as a basis to drive economic growth. For a full understanding of each of these indicators, see the specific financial statements and notes in this report.
Philips Group
Distribution of direct economic benefitsin millions of EUR
2014 - 2016
|
| |||||||||||
| 2014 | 2015 | 2016 | ||||||||||
|
| |||||||||||
Suppliers: goods and services | 13,185 | 14,388 | 13,904 | |||||||||
Employees: salaries and wages | 5,018 | 5,533 | 5,832 | |||||||||
Shareholders: distribution from retained earnings | 729 | 730 | 732 | |||||||||
Government: corporate income taxes | 26 | 239 | 327 | |||||||||
Capital providers: net interest | 251 | 302 | 327 | |||||||||
|
| |||||||||||
Total purchased goods and services as included in cost of sales amounted to EUR 13.9 billion, representing 57% of total revenues of the Philips Group. Of this amount, approximately 69% was spent with global suppliers, the remainder with local suppliers.
In 2016, salaries and wages totaled EUR 5.8 billion. This amount is some EUR 300 million higher than in 2015, mainly caused by the increased number of employees and currency effects. Seenote 6, Income from operations for more information.
Philips’ shareholders were given EUR 732 million in the form of a dividend, the cash portion of which amounted to EUR 330 million.
Income taxes amounted to EUR 327 million, compared to EUR 239 million in 2015. The effective income tax rate was lower than the weighted average statutory income tax rate in 2016, mainly due to recognition of deferred tax assets andnon-taxable income, largely attributable to favorable tax regulations relating to R&D investments. These effects were partly offset by non-deductible expenses.
For a further understanding, seenote 8, Income taxes.
Philips supports global initiatives of the OECD (Organization for Economic Cooperation and Development) and UN (United Nations) to promote tax transparency and responsible tax management, taking into account the interest of various stakeholders, such as governments, shareholders, customers and the communities in which Philips operates. For more information, please refer toPhilips’ Tax Principles.
In 2016, both Royal Philips HealthTech businesses and Philips Lighting launched their next5-year sustainability programs. This section provides additional information on (some of) the Social performance parameters reported insection 2.2, Social performance, of this report.
12.3.1 Building employability
Other programs
At Philips, our vision to offer the best place to work for people who share our passion is not limited to employees on our payroll. In the Netherlands, for example, we run a special employment program, WGP
Annual Report 2016 217
Sustainability statements 12.3.1
(Werkgelegenheidsplan, or Philips Employment Scheme), to offer vulnerable groups of external jobseekers a work experience placement, usually combined with training. Since the scheme’s launch in 1983, nearly 13,000 people have participated, and around 70% found a regular job after taking part in the program. In 2016, Philips employed 140 people via the WGP program, including 25 people with autism. As we move into 2017, we will continue to offer an environment for all of our people to thrive and grow.
12.3.2 People development
Our talent development focuses on all aspects of the 70:20:10 learning framework.
70% Learning through critical career experiences
Philips is on a multi-year journey to evolve our culture to focus on experience-based career development, giving our people the opportunity to identify and gain the experiences necessary to support our health technology strategy and strengthen their employability. By identifying the roles and experiences critical to our business strategy, we clarify development areas and transferrable skills in support of cross-functional, lateral, traditional, as well asnon-traditional career opportunities for our people.
As of 2016, our people are able to view the succession plans in which they are included. In 2017 we will continue on our journey towards an experience-based careers culture through:
Enabling and empowering our people with real-time, integrated tools and resources to plan and manage their career
Building awareness of experience-based careers for our people through stories and communications, prioritizing critical roles and capabilities that are directly in support of our health technology strategy
Facilitated‘gig-board’ of extra-curricular roles to increase flexible teaming across organization structures and provide opportunity for further development within existing roles
20% Guidance through coaching and mentoring
In 2016, Philips University launched a program for leaders to help them get the most out of our people, help them grow, and have meaningful career conversations. In 2017 we will drive further initiatives focused on:
Strengthening theemployee-and-manager career partnership with clear accountabilities
Equipping managers as effective career coaches who will have transparent career dialogues with their team, with differentiated development for deep specialists and broad leaders
10% Learning through formal learning
In 2016, more than 1,900 new courses were made available by Philips University. Byyear-end, over 86,000 employees had enrolled for courses with Philips University. In total, some 1.2 million hours were spent on training through Philips University in 2016, with some 580,000 training completions.
12.3.3 Employee volunteering
In North America, thePhilips Cares program provides ways for employees to work together to improve people’s lives by creating healthy, sustainable communities. This can take many forms: from helping a child to excel in math, or providing safety and energy-efficient home improvements for the disadvantaged, to raising awareness about the importance of cardiac health. In 2016 alone, more than 9,500 employee volunteers participated in community outreach projects that suited their needs, schedules, and passions individually as well as through partnerships with organizations such as the American Heart Association, International Medical Equipment Collaborative (IMEC), and the March of Dimes.
Since Q4 2016, all of our employees are now able to take 1 day per year to support charitable endeavors through volunteering. For example, in the Benelux 70 of our people were trained in resuscitation (CPR) by the Dutch Hartstichting (heart foundation), enabling them to provide support in the critical first period of a cardiac arrest.
12.3.4 Health and Safety performance
In 2016, we recorded 174 LWIC, i.e. occupational injury cases where the injured person is unable to work one or more days after the injury. This represents a significant decrease compared with 213 in 2015. The LWIC rate decreased to 0.18 per 100 FTEs, compared with 0.21 in 2015. The number of Lost Workdays caused by injuries decreased by 1,253 days (16%) to 6,728 days in 2016.
Additionally, in 2016, we recorded 395 TRC’s, i.e. cases where the injured employee is unable to work one or more days, or had medical treatment or sustained an industrial illness.
In 2016, we focused our efforts not only on traditional process and equipment safety improvements, but also on a proactive cultural transformation through Behavior Based Safety (BBS). BBS requires a fundamental shift in how we think and act about Health and Safety before an injury occurs. Our new company program, based on an internal best practice, was deployed and implemented globally across many factories in 2016 including those in China, Asia Pacific and the USA. We believe this program will continue to drive down our workplace injuries and be a key pillar towards reaching our goal of a 25% reduction in total injuries by 2020.
218 Annual Report 2016
Sustainability statements 12.3.4
Philips Group
Lost workday injuriesper 100 FTEs
2012 - 2016
|
| |||||||||||||||||||
| 2012 | 2013 | 2014 | 2015 | 2016 | ||||||||||||||||
|
| |||||||||||||||||||
Personal Health | 0.39 | 0.33 | 0.16 | 0.16 | 0.15 | |||||||||||||||
Diagnosis & Treatment | 0.22 | 0.23 | 0.27 | 0.20 | 0.36 | |||||||||||||||
Connected Care & Health Informatics | 0.16 | 0.05 | 0.18 | 0.16 | 0.15 | |||||||||||||||
HealthTech Other | 0.14 | 0.12 | 0.11 | 0.13 | 0.10 | |||||||||||||||
Lighting | 0.47 | 0.42 | 0.37 | 0.34 | 0.22 | |||||||||||||||
Continuing operations | 0.31 | 0.27 | 0.23 | 0.21 | 0.18 | |||||||||||||||
Discontinued operations | 0.55 | 0.37 | 0.25 | 0.27 | 0.32 | |||||||||||||||
|
| |||||||||||||||||||
Philips Group | 0.31 | 0.28 | 0.23 | 0.22 | 0.19 | |||||||||||||||
|
| |||||||||||||||||||
Philips Group
Total recordable casesper 100 FTEs
2016
| 2016 | ||||
Personal Health | 0.33 | |||
Diagnosis & Treatment | 0.65 | |||
Connected Care & Health Informatics | 0.67 | |||
HealthTech Other | 0.27 | |||
Lighting | 0.50 | |||
Continuing operations | 0.41 | |||
Discontinued operations | 0.44 | |||
Philips Group | 0.41 | |||
Diagnosis & Treatment businesses
In the Diagnosis & Treatment businesses segment Health and Safety showed a decrease in performance in 2016 with 40 LWIC compared to 21 in 2015. The LWIC rate increased to 0.36 compared to 0.20 in 2015. The total number of recordable cases for the Diagnosis & Treatment businesses segment was 73 in 2016.
Connected Care & Health Informatics businesses
Health and Safety performance in the Connected Care & Health Informatics businesses segment continued to improve in 2016 with 5 LWIC in 2016 compared to 6 in 2015. Correspondingly, the LWIC rate decreased to 0.15 in 2016 compared to 0.16 in 2015. This was primarily driven by our global patient monitoring businesses. The total number of recordable cases for the Connected Care & Health Informatics businesses segment was 23 in 2016.
Personal Health businesses
The Personal Health businesses segment showed stable performance in Health and Safety with 21 LWIC in 2016, the same number as in 2015. The LWIC rate improved from 0.16 in 2015 to 0.15 in 2016. The Personal Health businesses segment had 46 recordable cases in 2016.
Lighting
Lighting showed an overall improvement while recording 71 LWIC compared to 119 in 2015. As a result the LWIC rate improved to 0.22 (0.34 in 2015). In 2016, Lighting had 156 reportable cases. Lighting introduced a new safety program in 2015 focusing on preventing injuries.
12.3.5 General Business Principles
A total of 503 concerns were reported over the course of 2016 via the Philips Ethics Line and through our network of GBP Compliance Officers, of which 164 related to Philips Lighting. The previous reporting period (2015) saw a total of 447 concerns, 135 of which related to Philips Lighting. Overall, we saw an increase of 13% in the total number of reports (11% for Royal Philips versus 21% for Philips Lighting).
This is a productcontinuation of the upward trend reported since 2014, the year in which Philips updated its General Business Principles and deployed the related communication campaign, although the overall increase in the number of complaints reported has slightly declinedyear-on-year (2015: 14%). We believe this trend is in line with our multi-year efforts to encourage our employees to speak up, and we are now approaching a normalized level of reported concerns annually. The relatively larger increase in the number of concerns that uses, generates, transfers orrelate to Philips Lighting is expected to relate, at least in part, to the separation event and the related corporate activities.
The upward trend in the number of concerns can primarily be attributed to significantly more concerns being reported in the North American (NA) region, making up 38% of the total number of reports in 2016 (2015: 31%). The number of concerns reported in Latin America once again declinedyear-on-year to 19% of the total number of complaints, compared with 25% in 2015. In percentage terms, Europe, Middle East & Africa (EMEA) and Asia Pacific (APAC) remained quite stable, representing 20% and 23% of the total number of complaints respectively (2015: 21% and 20%).
In keeping with a trend that became visible in 2015, we again saw a more even distribution in reporting across the four regions. While the Americas were historically dominant in terms of number of cases reported, EMEA and APAC have now reached the same level as Latin America. We believe this to be as a result of significant communication efforts in addition to our Global GBP Communications campaign, especially in the APAC region, improving employees’ awareness of their rights with regard to the GBP, and the reporting facilities available to them.
Annual Report 2016 219
Sustainability statements 12.3.5
Philips Group
Breakdown of reported GBP concernsin number of reports
2013 - 2016
|
| |||||||||||||||
| 2013 | 2014 | 2015 | 2016 | |||||||||||||
|
| |||||||||||||||
Health & Safety | 3 | 10 | 9 | 16 | ||||||||||||
Treatment of employees | 203 | 203 | 242 | 276 | ||||||||||||
- Collective bargaining | 5 | — | — | 2 | ||||||||||||
- Equal and fair treatment | 80 | 72 | 44 | 73 | ||||||||||||
- Employee development | 4 | — | 2 | 15 | ||||||||||||
- Employee privacy | 1 | 3 | 8 | 4 | ||||||||||||
- Employee relations | 5 | 6 | — | 20 | ||||||||||||
- Respectful treatment | 84 | 93 | 111 | 107 | ||||||||||||
- Remuneration | 15 | 11 | 9 | 11 | ||||||||||||
- Right to organize | — | — | — | — | ||||||||||||
- Working hours | 3 | 5 | 2 | 8 | ||||||||||||
- HR other | 6 | 13 | 66 | 36 | ||||||||||||
Legal | 9 | 30 | 35 | 32 | ||||||||||||
Business Integrity | 109 | 110 | 138 | 144 | ||||||||||||
Supply management | 5 | 6 | 6 | 13 | ||||||||||||
IT | 6 | 7 | 4 | 10 | ||||||||||||
Other | — | 27 | 13 | 12 | ||||||||||||
|
| |||||||||||||||
Total | 335 | 393 | 447 | 503 | ||||||||||||
|
| |||||||||||||||
Most common types of concerns reported
Treatment of employees
As in previous years, the most commonly reported type of concern related to the category Treatment of employees. In 2016 there were 276 reports in this category, compared to 242 in 2015. This represents 55% of the total number of concerns, which is a slight increase from 2015 (54%).
Two subcategories, Respectful treatment and Equal and fair treatment, make up just over 65% of the concerns related to Treatment of employees. The Respectful treatment category generally relates to concerns about verbal abuse, (sexual) harassment, and hostile work environments. Equal and fair treatment primarily addresses favoritism, and matters of discrimination and unfair treatment in the workplace. 79% of the cases in these categories originated from the Americas, which is slightly more than in 2015 (76%).
Business integrity
The second most reported type of concern relates to Business Integrity, which made up 29% of the total cases reported. This is slightly less than in 2015, when the percentage was 31%. These concerns originated from the APAC region (45%), followed by EMEA (33%), Latin America (14%) and North America (8%).
Substantiated/unsubstantiated concerns
Of the 503 cases reported in 2016, 137 are still pending closure, in particular those that were filed towards the end of the year. The table below gives an overview of the number of reported concerns that were substantiated (i.e. found to constitute a breach of our General Business Principles) by the subsequent investigation.
Of the 366 reports investigated (267 in 2015), 115 were substantiated, which represents 31% of the total reported and closed (34% in 2015). This is also shown in the table below. Notably, while in 2015 39% of the Treatment of employee cases were substantiated, this percentage dropped to 28% in 2016 (2014: 22%, 2013: 20%). On the other hand, 40% of the Business Integrity reports were closed as substantiated in 2016, compared with 21% in 2015 (2014: 36%, 2013: 50%).
In addition to the above, 174 concerns that were still open at the end of 2015 were closed during 2016. 37% of these concerns were substantiated after investigation.
Of the 179 closed concerns that were substantiated, 100 were followed up with disciplinary measures energy (electricity, gas, fossil fuel). Examples are boilers, computers, televisions, transformers, industrial fans, industrial furnaces etc.varying from termination of employment and written warnings to training and coaching. In other cases, corrective action was taken, which varied from strengthening the business processes to increasing awareness of the expected standard of business conduct.
Free cash flow12.3.6 The Philips Foundation
Free cash flowThe Philips Foundation was established in 2014 and is a registered charity that strives to improve the lives of people in communities in need. The Philips Foundation seeks to make use of the expertise of partners, visionaries and innovators and the innovation capabilities of Philips to create lasting impact. In 2016, the Philips Foundation continued to build its portfolio of projects and partners in the areas of community
Philips Group
Classification of the new concerns investigatedin number of reports
2014 - 2016
|
| |||||||||||||||||||||||
| 2014 | 2015 | 2016 | ||||||||||||||||||||||
|
| |||||||||||||||||||||||
| substantiated | unsubstantiated | substantiated | unsubstantiated | substantiated | unsubstantiated | |||||||||||||||||||
|
| |||||||||||||||||||||||
Health & Safety | 1 | 7 | 3 | 4 | 3 | 4 | ||||||||||||||||||
Treatment of employees | 32 | 112 | 62 | 95 | 64 | 164 | ||||||||||||||||||
Legal | 4 | 9 | 4 | 9 | 5 | 14 | ||||||||||||||||||
Business Integrity | 25 | 45 | 16 | 62 | 38 | 56 | ||||||||||||||||||
Supply Management | 1 | — | — | 1 | 1 | 7 | ||||||||||||||||||
IT | 2 | — | — | 2 | 1 | 3 | ||||||||||||||||||
Other | 4 | 18 | 1 | 8 | 3 | 3 | ||||||||||||||||||
|
| |||||||||||||||||||||||
Total | 69 | 191 | 86 | 181 | 115 | 251 | ||||||||||||||||||
|
| |||||||||||||||||||||||
220 Annual Report 2016
Sustainability statements 12.3.6
development and social entrepreneurship, as well as in our approach towards disaster relief. Royal Philips and Philips Lighting supported the program of the Philips Foundation with a donation of EUR 10 million in 2016 and provided the operating staff, paymentin-kind and the expert support of skilled employees who support the Foundation’s program for part of their time.
A highlight of the year was the launch of a partnership with Ashoka, one of the world’s largest networks of social entrepreneurs, that identifies and invests in social entrepreneurs helping them to bring their ideas for solving social problems to scale. Through a six month ‘globalizer’ program, 12 social entrepreneurs were supported by advisory teams – involving 24 Philips volunteers to build their impact scaling plan. This culminated in athree-day summit where the social entrepreneurs were able to pitch their impact plans to a large group of senior experts, such as social investors, public sector representatives and Philips executives.
We additionally worked on strengthening our partnerships with the Red Cross and UNICEF. The partnership with the Red Cross focuses on exploring innovations that could assist in providing immediate relief to people in regions affected by humanitarian crises including natural disasters. We are working with the Netherlands Red Cross and the Ivory Coast Red Cross on a project in Ivory Coast to strengthen the resilience of a community in the Blolequin region with a focus on the health of mothers and children. The Philips Foundation and UNICEF have partnered to develop healthcare innovations for the first 1,000 days of children’s lives. We are supporting UNICEF’s Global Innovation Center and are a lead partner in the Kenya Maker for Maternal, Newborn and Child Health Project in Nairobi, which focuses on developing and deploying solutions that improve access to healthcare for mothers and their children inlow-resource settings.
In addition, 36 local projects have been approved to be set up throughout the world. These projects are organized via the local Philips organization and NGO partner and funded by the Philips Foundation. These projects offer employee engagement opportunities including skilled expert volunteering. Employee donations were also a large part of the Philips Foundation’s response to the earthquakes in Ecuador, Japan and Italy as well as Hurricane Matthew in the USA. Along with ourco-creation projects we were able to respond to disasters around the world via our partnership with the Red Cross and global fundraisers, through which we raised a total of more than EUR 80,000 – a combination of employee donations and foundation matching.
More information about the Philips Foundation, its purpose and scope as well as the Philips Foundation Annual Report 2015 can be foundhere.
Examples of innovation projects supported by the Philips Foundation
The Philips Foundation, CurArte Foundation and Hospital Vall d’Hebrón teamed up to create‘Imatgina’, an advanced patient-centric initiative in pediatric radiology that aims to improve the experience children have during diagnostic imaging tests. The goal of the initiative is to enhance the experience for children by creating a friendly atmosphere that dispels the uncertainty and fear usually associated with these types of procedures. It is estimated that the project will improve the lives of over 7,000 children on an annual basis.
Every day in rural Uganda, 555 birth complications occur, which lead to the death of over 6,000 Ugandan women a year. Although ultrasound has proven to be instrumental in the early identification of these complications, its high cost and the lack of trained personnel mean that it is not widely available in rural areas. The Philips Foundation and Philips teamed up with Imaging the World (ITW) to identify and implement sustainable business models in the healthcare ecosystem of rural Uganda. Establishing sustainable and increased sources of funding will allow ITW to create new health clinics and impact the lives of an additional 35,000 Ugandan women and babies a year.
12.3.7 Stakeholder Engagement
Our engagements with various partners and stakeholders is essential to our vision of making the world healthier and sustainable through innovation. Some of our partnership engagements are described below.
Global partnerships
World Economic Forum
Philips is proud to continue as a strategic partner and active member of the World Economic Forum (WEF), an independent international organization committed to improving the state of the world by engaging leaders in partnerships to shape global, regional and industry agendas. We supported and participated in a wide range of initiatives and projects through the year – regional WEF events, as well as the participation in International Business Council of the World Economic Forum.
Further to our various engagements with WEF, Frans van Houten has been selected to serve as a Stewardship Board Member of a key WEF initiative on shaping the “Future of Health and Healthcare”. The initiative will focus on managing the risk and impact of future epidemics addressing the shortfall in the world’s ability to respond to public health emergencies by developing a multifaceted cross-industry, cross-sectorial approach.
Annual Report 2016 221
Sustainability statements 12.3.7
Global Alliance for Vaccines and Immunization
Philips and the Global Alliance for Vaccines and Immunization (Gavi), are partnering to improve the quality of immunization data and its collection in primary and community healthcare. The partnership will be piloting the project in Uganda. The goal of the partnership is to gather accurate data which both organizations believe is essential to improve patient outcomes, provide access to care and reduce costs. Good data is key to strengthening health systems around the world.
World Heart Federation
Philips announced a new partnership with the World Heart Federation (WHF) in 2016 to help people better manage their heart health. Aligned with the WHF’s ‘power your life’ campaign, Philips aims to encourage people to take personal responsibility for leading heart-healthy lives and to raise awareness about cardiovascular disease.
Thought leadership
Future Health Index
Philips launched a new report, the Future Health Index (FHI) in 2016, an extensive global study which explores how 13 countries around the world are positioned to meet long-term global health challenges through integration and connected care technologies. The Future Health Index measures readiness to address these challenges by examining perceptions about the accessibility and level of integration of healthcare services, and the adoption of connected care technology throughout national healthcare systems.
Digital transformation of health and care
Philips is a champion of the EU Blueprint on digital transformation of health and care for the ageing society. Philips will continue its engagement in the Blueprint through deploying digital innovation across the EU. We believe that this will contribute to development of value-based care models for the benefit of citizens/patients and sustainability of health systems.
Working on global issues
Sustainable Development Goals
Philips aspires to be a major private sector contributor to the Sustainable Development Goals (SDGs) that were launched during the UN General Assembly in New York in September 2015. The United Nations Sustainable Development Goals 3 (“’to ensure healthy lives and promote well-being for all at all ages”) and 12 (“to ensure sustainable consumption and production patterns”) are drivers and outcomes of sustainable development and Philips is committed to working closely with all relevant stakeholders to develop solutions to address these.
Strengthening primary care and enabling community development
Working in collaboration with the United Nations Population Fund (UNFPA), Royal Philips plans to inaugurate a Community Life Center (CLC) in Mandera, a County in North-Eastern Kenya with one of the world’s highest maternal mortality rates - 3,795 per 100,000 live births. The project supported by the County Government of Mandera is the net cash flow from operating activities minus net capital expenditures.second of its kind in the world; Philips inaugurated the first CLC in Kiambu County, Kenya in 2014. The CLC will deliver crucial primary healthcare and enhance community development in Mandera.
Full-time equivalent employee (FTE)
Full-time equivalentAccess to primary healthcare in Africa is a waycomplex and complicated issue, therefore a sustainable solution needs to measureaddress a worker’swide range of issues collectively. Issues range from unavailability of qualified healthcare workers to the lack of electricity, water and basic healthcare technology. The creation of the CLC concept enabled Philips to realize its vision to drastically improve primary healthcare in Africa.
Grand Challenges Canada on childhood pneumonia
Philips and Grand Challenges Canada (GCC) are collaborating on an innovative project to aid and improve the diagnosis of childhood pneumonia in low resource settings.
Royal Philips received a repayable grant to scale the manufacturing and distribution of the Philips Children’s Automated Respiration Monitor (also known as ChARM) to make it affordable and accessible for community-based health workers inlow-resource settings throughout the world. ChARM has the potential to assist community health workers in establishing a more accurate measurement of a sick child’s breathing rate to help improve the diagnosis of pneumonia and potentially prevent some of the 922,000 childhood deaths caused by pneumonia each year.
Global Financing Facility
In 2016 Philips committed to supporting the Global Financing Facility (GFF) through our expertise in innovation and our core competencies in growing primary-care capacity. The GFF brings together a broad range of partners to promote the sustainable solutions needed to achieve universal coverage of health care. By creating the right financial and technical conditions for innovation, as a common objective we believe our involvement will achieve greater impact and better health outcomes through collaboration.
12.3.8 Supplier indicators
Philips has a direct business relationship with approximately 8,500 product and component suppliers and 22,000 service providers, and in many cases the sustainability issues deeper in our supply chain require us to intervene beyond tier 1 of the chain.
222 Annual Report 2016
Sustainability statements 12.3.8
Supplier sustainability strategy
Through a structured annual strategic process combined with a multi-stakeholder dialogue we identified our key focus areas as described below:
This process resulted in 2016 into five strategic programs for our Sustainable Supply Chain:
| Key programs | ||
| 1Supplier sustainability compliance | (SSC) | |
| 2Supplier sustainability performance | (SSP) | |
| 3Responsible sourcing | (RS) | |
| 4Circular procurement | (CP) | |
| 5Environmental footprint China | (EFP) |
Enablers
ONE database and dashboard
Standardized metrics (KPIs)
Communication plan
Multi-stakeholder dialogue
Industry collaboration
Training plan
Risk mapping (BOM, materials, suppliers)
1. Supplier Sustainability Compliance
Two core policy documents form the basis of supplier sustainability compliance: the Supplier Sustainability Declaration (SSD) and the Regulated Substances List (RSL).
Supplier Sustainability Declaration (SSD)
The SSD sets out the standards and behaviors Philips requires from its suppliers. The SSD is based on the Electronics Industry Citizenship Coalition (EICC) Code of Conduct and covers the topics Health & Safety, Labor, Environment, Ethics and Management systems.
Regulated Substances List (RSL)
The RSL specifies which chemical substances are regulated by legislation. Suppliers are required to follow all the requirements stated in the RSL. Substances can either be marked as restricted or declarable.
Following the SSD and RSL, Philips further specifies contractual and transparency requirements. Suppliers are obliged to contractually commit to the SSD and RSL andupon request provide additional information and evidence.
2. Supplier Sustainability Performance (SSP)
Since 2006, our supplier sustainability audits have been executed by third party auditors.
Due to insights gained through a thorough analysis of the audit program and the data it generated in the past 10 years our main conclusions were:
The audit process consists of a third party audit to verify the SSD compliance, it focuses on closing the identified “Non Conformities” and repeats every 3 years. The frequency of checks is not sufficient and the system does not lead to long lasting improvements of the sustainability performance or compliance rate of our suppliers.
Training and capacity-building programs are focused on general sharing of information and not necessarily on driving change or improvements. They do not always meet individual supplier needs.
To secure business continuity, suppliers try to pass the audit with the least possible effort rather than making lasting improvements.
Years of an audit culture which did not focus on long-lasting improvements has led to audit fatigue due to too many audits demanded by other customers.
Based on the above conclusions, Philips identified a need for change and developed a new “beyond audit” approach which:
Understands that suppliers may have initial deviations from the SSD and RSL.
Accepts that suppliers each have their own organizational – and sustainability maturity level and need an individual improvement plan.
Annual Report 2016 223
Sustainability statements 12.3.8
Is continuousand creates a cultural change leading toward long-term improvements.
Ultimately leads toone-cross-industry standard for supplier sites and will therefore remove the audit burden.
The new SSP approach has been piloted in 2016 on a sample of 93 suppliers in China with the following results:
90% of the suppliers completed a Self-Assessment Questionnaire (SAQ), 57% of which were validated by Philips sustainability experts.
Followed by a site assessment at 20 supplier sites.
Through joint efforts an improvement Plan (IP) was developed and agreed upon with these 20 suppliers.
These 20 suppliers started executing the Improvement Plan, while Philips provides support and monitors progress on a regular basis.
The following observations were made after analyzing the first phase of the pilot:
Higher level of commitment and ownership from suppliers (also at top management level).
Change in mindset towards continuous improvement and transparency.
Suppliers are disclosing more areas for improvement than it would be possible to identify through an audit only.
Suppliers are moving away from quick fixes and towards lasting improvements.
Three key focus areas of SSP
We are primarily focusing on 3 areas: Health and Safety, remuneration and benefits, and workforce turnover.
Process Chemicals
Philips is an active member of the EICC project team on process chemicals, for further details on the strategy and approach of this project see theEICC position paper. In addition to this project team we have addressed the topic of process chemicals in the new SSP approach and we aim to identify if and how the manufacturing sites are managing process chemicals.
Summary of 2016 Sustainability Audit Program
In 2016, we audited 226 of our current risk suppliers, including 150 continued conformance audits with suppliers that we had already audited in 2013. As in previous years, the majority of the audits were done in China. With these audits we directly or indirectly impacted almost 180,000 workers employed at the production sites that were audited.
On top of the audits with current risk suppliers, we also audited 28 potential suppliers during the supplier selection process. These potential suppliers need to close anyzero-tolerance issues before they can start delivering to Philips.
To track improvements Philips measures the ‘compliance rate’ for the identified risk suppliers, being the percentage of risk suppliers audited within the last 3 years who do not have or have resolved all major NCs. During 2016 we achieved a compliance rate of 90% (2015: 86%).
Audit findings
The table below shows the results of the full scope audits done during 2016; potential suppliers are not included. Most frequent areas ofnon-compliance in 2016:
Certified Management System (ISO9001, ISO14001, and OHSAS18001)
Emergency Preparedness
Wages and Benefits
Philips Group
Summary of 2016 audit findings per region
| China | Asia excl. China | LATAM | EMEA | Total | ||||||||||||||||
|
| |||||||||||||||||||
No. of audits | 163 | 38 | 22 | 3 | 226 | |||||||||||||||
Initial audits | 50 | 16 | 8 | 2 | 76 | |||||||||||||||
Continued conformance audits | 113 | 22 | 14 | 1 | 150 | |||||||||||||||
Average number of non-compliances per audit | 9 | 20 | 13 | 3 | 12 | |||||||||||||||
Workers employed at sites audited | 154,309 | 8,394 | 14,165 | 2,295 | 179,163 | |||||||||||||||
|
| |||||||||||||||||||
More information on the Supplier Sustainability Audit Program can be foundhere.
224 Annual Report 2016
Sustainability statements 12.3.8
3. Responsible Sourcing of Minerals
The supply chains of minerals are long and complex. There are typically 7+ tiers between theend-user companies like Philips and the mines where the minerals are being extracted.
Philips does not directly source minerals from mines in in the conflict-affected and high-risk regions, and the supply chain for these metals consists of many tiers, including traders, exporters, smelters, refiners, alloy producers and component manufacturers, before reaching Philips’ direct suppliers.
Mining in these regions often takes place in an artisanal form which often means it is informal and unregulated. Artisanal miners can become victims to exploitation by various militia and armed groups. This increases the risk of human rights violations (forced labor, child labor or widespread sexual violence), unsafe working conditions or environmental concerns.
Philips addresses the complexities of the minerals supply chains through a continuous due diligence process combined with multi-stakeholder initiatives for responsible sourcing of minerals.
Responsible Sourcing approach of Philips
Due diligence approach
OECD Five-Step Framework for Risk-Based Due Diligence in the Mineral Supply Chain
Multi-stakeholder initiatives
Working together with other stakeholders to apply leverage
Conflict minerals due diligence
Philips annually investigates its supply chain to identify smelters of tin, tantalum, tungsten and gold in its supply chain and we have committed not to purchase raw materials, subassemblies, or supplies which are found to contain conflict minerals.
Philips applies collective cross-industry leverage through active engagement via Conflict Free Sourcing Initiative (CFSI). The Conflict-Free Smelter Program (CFSP) identifies smelters that can demonstrate through an independent third-party audit that the minerals they procure are conflict free. Philips is actively directing its supply chain towards these smelters. Seewww.conflictfreesmelter.org for more details.
The Philips Conflict Minerals due diligence framework, measures and outcomes are described in the Conflict Minerals Report that we file annually with SEC. The Report is audited by an independent third party and made publicly available on Philips’website.
Multi-stakeholder initiatives for responsible sourcing of minerals
We believe that a multi-stakeholder collaboration in responsible sourcing of minerals is the most viable approach in addressing the complexities of minerals value chains.
European Partnership for Responsible Minerals (EPRM)
EPRM is a five-year multi-stakeholder partnership between governments, companies, and civil society actors working toward more sustainable minerals
Annual Report 2016 225
Sustainability statements 12.3.8
supply chains. Philips became a strategic, founding partner of EPRM in May 2016, being the first representative of the private sector to join the initiative.
Tin mining in Indonesia
Indonesia produces roughlyone-third of the world’s tin supply, of which the vast majority comes from the islands Bangka and Belitung.
In 2015, a Roadmap to sustainable tin mining was created in collaboration with the local industry and government, defining improvement areas for onshore land reclamation and offshorelow-impact mining.
In 2016, the first implementation pilot projects of the Roadmap were kicked off, governed by the local steering committee.
Dutch Covenant on Gold
Leaders of different industries using gold in The Netherlands together with the Dutch government and NGOs look for ways to make gold supply chains more responsible. Through 2016, the group has engaged in knowledge sharing to understand all specifics of the gold supply chain and to identify the right approach for the parties to address the most severe issues.
Mica Working Group
Mica is mainly used as a pearlescent pigment in coatings and cosmetics, and in the electronics sector it is used as an electrical insulator.
In 2016, Terre des Hommes in collaboration with SOMO published a report“Beauty and a Beast” which showed the widespread problem in the mica industry in Jharkhand/Bihar (India) and gaps in the due diligence of end user companies.
Philips decided to team up with Terre des Hommes in order to bring other mica users from all industries together to start a Mica Working Group with Terre des Hommes, Philips, the Dutch Ministry of Foreign Affairs and a group of 15 companies.
“Terre des Hommes Netherlands is pleased to partner with Philips in order to set up the Mica Working Group. Our report “Beauty and a Beast, child labor in India for sparkling cars and cosmetics” shows the challenges of mica mining and the need for immediate interventions. Philips became aware of the issue and immediately demonstrated its leadership in CSR by taking the initiative to bring partners from various industries together. Philips’ engagement in other responsible sourcing initiatives definitely supported the Mica Working Group to move forward. We are confident that this multi-stakeholder initiative will lead to a transparent, traceable and child labor free mica supply chain”
Terre des Hommes
NGO
4. Circular Procurement
Philips’ ambition is to increase its circular value proposition and it has set a 2020 target of 15% circular revenues. Procurement can play a leading role in Philips’ transition towards a circular economy in order to achieve the 2020 target or even exceed this.
Topics where Procurement is actively involved are:
Circular procurement in the procurement policy. The next step is to define a circular procurement strategy and a clear long-term ambition.
The implementation of a governance structure beyond the procurement organization to cover the whole value chain is part of the internal Circular Economy Excellence network.
Execution of an analysis of internal and external circular service models to improve collaboration.
“In 2016 Philips and HP have further strengthened their business relationship by specifying and delivering an ITpay-per-device model which will cover more than 100,000 IT assets across 50 countries. Thisdevice-as-a-service solution supports both companies’ efforts towards a shared circular economy. Philips stands out in truly understanding the importance of managing its IT requirements in order to realise both maximum value and minimize environmental impact from IT products. HP is proud to be Philips’ partner of choice for IT asset management and will continue to collaborate on shared circular economy objectives.”
Dr. Kirstie McIntyre
HP Social and Environmental Responsibility Director
226 Annual Report 2016
Sustainability statements 12.3.8
HP Case Study
Philips has used HP Asset Recovery Services since 2011 to comprehensively manage end of life IT assets worldwide, with data wiping, remarketing and recycling to mitigate security and privacy risk and ensure compliance. Over that time HP Asset Recovery Services have managed 80,000 assets across 24 countries, remarketing 90% of them.
5. Environmental Footprint China
In order to minimize our impact, we are supporting our Chinese suppliers to reduce their environmental footprint and at the same time to contribute to Philips’ sustainability strategy.
Achievements in 2016
Environmental footprint training for 120 suppliers by Philips Supplier Sustainability team.
Philips actively participated in the Sino-Dutch Sustainable Supply Chain Management Program held by the Dutch Consulate in Zhejiang and Jiangsu province.
Customer engagement (Starbucks) the supplier has established a new waste water treatment facility to ensure waste water discharging in accordance with regulatory requirements.
Environmental footprint data reported for improving performance by 20 suppliers as part of the SSP on-site development.
Energy savings via Supplier Development program - energy savings will be achieved upon implementation of the identified improvement actions.
Collaboration with IPE, a Chinese NGO
The Institute of Public and Environmental Affairs (IPE) is a registerednon-profit organization based in Beijing. IPE has developed two pollution databases (water and air) to monitor corporate environmental performance and to facilitate public participation in environmental governance. For more information please refer to IPE website.
SA is a Philips supplier located in Shenzhen . In April 2016, environmental issues were identified in the waste water discharge system of this supplier. This was reported via the IPE Pollution Map.
Philips experts immediately contacted the supplier account manager, an IPE expert and the supplier to identify the root-cause and work out an improvement plan. With multi-stakeholder engagement, SA had the IPE Green Choice Alliance audit and closed the issue with 50 environmental protection NGOs as witnesses.
This section provides additional information on (some of) the environmental performance parameters reported insection 2.3, Environmental performance, of this report.
12.4.1 Circular Economy
The transition from a linear to a circular economy is essential to create a sustainable world. A circular economy aims to decouple economic growth from the use of natural resources and ecosystems by using these resources more effectively.
The circular economy program
The circular economy program at Philips ran for the fourth year in 2016 and consists of four strategic pillars:
| 1. | Connect to stakeholders outside Philips |
| 2. | Internal employee engagement |
| 3. | Create proof points and metrics |
| 4. | Embed circular economy in Philips processes |
Philips leverages partnerships with the Ellen MacArthur Foundation, Circle Economy Netherlands, World Economic Forum, US Chamber of Commerce Foundation and The Guardian. For example, through the leadership of our CEO and supported by the circular economy program, Philips teamed up with the World Economic Forum to establish a public-private platform to accelerate the circular economy, launched in Davos in January 2017.
In many Philips Business Groups circular economy projects have started. These are either linked to customer access over ownership (pay for performance), business model innovations (from transactions to
Annual Report 2016 227
Sustainability statements 12.4.1
relationships via service and solution models) or reverse cycles (remanufacturing, refurbishment and parts harvesting).
Circular Revenues
In 2016, at Royal Philips, a new internal KPI was developed and deployed: Circular Revenues. The Circular Revenues percentage captures our revenues of validated circular products, services, and solutions, as a % of total Philips revenues. The validation is done against the following Philips circularity requirements which might be further refined in the future:
1. Performance and Access-based models
Revenues from contracts that include the condition that Philips has individualend-of-life responsibility for the product
2. Refurbished, Reconditioned & Remanufactured products/systems
Revenues from selling refurbished, reconditioned or remanufactured products/systems withre-used components >30% by total weight of product/ system
3. Refurbished, Reconditioned & Remanufactured components
Revenue from harvested components that have either been refurbished, reconditioned or remanufactured. The harvested component must contain >30%re-used parts or materials by total component weight. The component can either be a standalone component or part of a new product/system. The commercial value of the components is considered irrespective of whether it is part of a service, warranty or a sale.
4. Upgrades/refurbishment on site or remote
Revenue from upgrades of existing hardware and software either on site or remotely
5. Products with recycled plastics content
Revenues from products with a recycled plastics content of >25% by total weight of eligible plastics
We set the ambition that by 2020 a total of 15% of our revenues will come from circular propositions. This is double the rate of 7% baseline achieved in 2015. The result for 2016 is 9%. The main contributing revenue streams are for:
Personal Health businesses
Revenues from our B2C products that contain a large amount of recycled plastics, such as our businesses in coffee and domestic appliances
Diagnosis & Treatment businesses
Our Diamond Select offer of refurbished imaging systems for sale, upgrading of systems at customer premises to enhance performance and extend lifetime, repair and reuse of spare parts
Connected Care & Health Informatics businesses
A number of Philips businesses based on subscription models, such as for example the Philips Lifeline business and others
Closing material loops
In addition to tracking circular revenue, we are also further working to gain transparency over the material flows connected with the Philips businesses. In 2016 Philips put a total of some 242,000 tonnes of products on the market. This assessment is based on sales data combined with product-specific weights. 85% of the total product weight was delivered through our B2C businesses in Personal Health and 15% through our B2B businesses (Diagnosis & Treatment businesses and Connected Care & Health Informatics businesses).
We can account for some 19,000 tonnes or approximately 10% of those products being collected,re-used or recycled globally in 2015. Europe has advanced collection systems in place. In these countries we have an average return rate of around40-50%. National legislation is required to create the level playing field needed to set up efficient recycling systems beyond the EU. The main pathways and quantities for materialre-use in 2015 were:
Trade-in and return for resale as refurbished products and for spare parts harvesting (Diagnosis & Treatment and Connected Care & Health Informatics) some 2,400 tonnes, largely unchanged from 2014.
Collective collection and recycling schemes according to the EU Waste Electrical and Electronic Equipment (WEEE) collection schemes. Those products are broken down into the main material fractions and provided to the market via our recycling partners
800 tonnes from Diagnosis & Treatment and Connected Care & Health Informatics field returns, following the WEEE category 8 classification, indicating a slight decrease compared to the previous year (900 tonnes)
16,000 tonnes from Personal Health, following the WEEE category 2 classification
On the demand side, the Personal Health businesses havere-integrated significantly more recycled plastics in new products than last year, closing the material loop for some 1,440 tonnes of plastics, up from 900 tonnes in 2015.
More information can be found on thecircular economy website.
At Philips Lighting, circular economy activities are covered as part of their Green Revenues.
228 Annual Report 2016
Sustainability statements 12.4.2
12.4.2 Biodiversity
Philips recognizes the importance of healthy ecosystems and rich biodiversity for our company, our employees, and society as a whole. We aim to minimize any negative impacts and actively promote ecosystem restoration activities.
The Philips Biodiversity policy was issued in 2014 and progress was made on biodiversity management, both on sites (e.g. impact measurement), on natural capital valuation and at management level. Most initiatives were led by the environmental coordinators at our sites, for example at our Best and Drachten sites in The Netherlands, which serve as role models on the topic of biodiversity.
Philips participated in 2015 in the development of the Natural Capital Protocol and volunteered as a pilot company. These activities continued in 2016. The environmental impact of the Royal Philips sites is limited as they are not very energy-intensive and do not emit large quantities of high-impact substances. The impact of our supply chain however is significantly higher than our own impact. For this reason, we used the identifiedhot-spots in our supply chain as input for our CDP Supply Chain program. More information on that program can be found insub-section 12.3.8, Supplier indicators, of this report.
12.4.3 Sustainable Operations
The Royal Philips HealthTech businesses and Philips Lighting Sustainable Operations programs related to improving the environmental performance of our manufacturing facilities focus on most contributors to climate change, but also address water, recycling of waste and chemical substances.
For an overview of Philips’ industrial sites, please visit: Philips industrial sites.
Royal Philips HealthTech businesses
Green Operations
2016
|
| |||||||||||
baseline year 2015 | target 20201) | 2016 actual | ||||||||||
|
| |||||||||||
Total CO2 from manufacturing | 84 Ktonnes | 0 Ktonnes | 85 Ktonnes | |||||||||
Water | 978,500 m3 | 10% reduction | 963,000 m3 | |||||||||
Zero waste to landfill | 3.2 kilotonnes | 0 tonnes | 2.9 kilotonnes | |||||||||
Operational waste recycling | 78% | 90% | 79% | |||||||||
Hazardous substances emissions | 1,419 kilos | 50% reduction | 1,099 kilos | |||||||||
VOC emissions | 169 tonnes | 10% reduction | 129 tonnes | |||||||||
|
| |||||||||||
| 1) | Against the base year 2015 |
Energy use in manufacturing
Total energy usage in manufacturing amounted to 8,987 terajoules in 2016, a decrease of 7% compared to 2015. Philips Lighting consumed about 66% of the total and realized a 13%year-on-year reduction, which was mainly driven by a reduction of energy-intensive operations and energy efficiency improvements in the factories. The Connected Care & Health Informatics businesses realized a decrease in energy consumption of 5% due to operational changes. Energy consumption in the Diagnosis & Treatment businesses increased by 8%, which was mainly due to the inclusion of two newly acquired sites. In the Personal Health businesses, site expansions and changed demand caused an increase in energy consumption, which was partly offset by energy efficiency improvements. The energy of discontinued operations amounted to 2,231 terajoules in 2016 (2015: 2,179 terajoules).
Philips Group
Total energy consumption in manufacturingin terajoules
2012 - 2016
|
| |||||||||||||||||||
| 2012 | 2013 | 2014 | 2015 | 2016 | ||||||||||||||||
|
| |||||||||||||||||||
Personal Health | 1,329 | 1,369 | 1,352 | 1,389 | 1,436 | |||||||||||||||
Diagnosis & Treatment | 1,248 | 1,238 | 1,202 | 1,214 | 1,316 | |||||||||||||||
Connected Care & Health Informatics | 325 | 329 | 334 | 336 | 318 | |||||||||||||||
Lighting | 9,112 | 9,027 | 8,369 | 6,763 | 5,917 | |||||||||||||||
|
| |||||||||||||||||||
Philips Group | 12,014 | 11,963 | 11,257 | 9,702 | 8,987 | |||||||||||||||
|
| |||||||||||||||||||
Operational carbon footprint and energy efficiency - 2016 details
Becoming carbon-neutral in our operations by 2020 is one of the key targets, after already reducing our operational carbon footprint very significantly during the past years (40% decrease in CO2 emissions in 2015 compared to our 2007 base year). Our carbon footprint decreased by 5% compared to 2015, resulting in a project. An FTEtotal of 1.0 means that1,344 kilotonnes CO2.
The 2016 results can be attributed to several factors:
| • | Accounting for 24% of the total footprint, total CO2 emissions from manufacturing decreased by 17% due to operational changes resulting in decreased energy usage and a lower load (mainly in Philips Lighting); additionally the share coming from renewable sources increased. |
| • | CO2 emissions fromnon-industrial operations (offices, warehouses, etc.), representing 8% of the total emissions, increased this year due to increased overall floor space in ournon-industrial real estate portfolio. This resulted in a 3% carbon emission increase compared to 2015. In 2017, we will continue to focus on the most efficient use of facility space and increase the share of purchased electricity from renewable sources. |
| • | The total CO2 emissions related to business travel, accounting for 14% of our carbon footprint, showed a decrease of 4% compared to 2015. The reductions achieved with business flights and our lease cars was partially mitigated by an increase in our rental car emissions. |
| • | Overall CO2 emissions from logistics, representing 53% of the total, showed no overall change compared to 2015. We recorded an increase in emissions from air and road freight in Royal Philips, which was mitigated by a decrease in Philips Lighting. |
Annual Report 2016 229
Sustainability statements 12.4.3
This increase in air freight combined with reduced emissions from parcel, road and ocean freight resulted in no overall change in our logistics emissions.
Philips Group
Operational carbon footprint for logistics
in kilotonnes CO2-equivalent
2012 - 2016
|
| |||||||||||||||||||
| 2012 | 2013 | 2014 | 2015 | 2016 | ||||||||||||||||
|
| |||||||||||||||||||
Air transport | 366 | 385 | 348 | 429 | 448 | |||||||||||||||
Road transport | 169 | 174 | 164 | 118 | 117 | |||||||||||||||
Ocean transport | 210 | 227 | 208 | 171 | 153 | |||||||||||||||
|
| |||||||||||||||||||
Philips Group | 745 | 786 | 720 | 718 | 718 | |||||||||||||||
|
| |||||||||||||||||||
Carbon emissions in manufacturing
The greenhouse gas emissions of our manufacturing operations totaled 323 kilotonnes CO2-equivalent in 2016, 13% lower than in 2015. This was the person is equivalentresult of decreased energy usage in manufacturing and operational changes. Direct CO2 emissions represented 56% of the total, which decreased by 10%. Indirect CO2 emissions represented 38%, an decrease of 18% due to lower electricity consumption. The carbon emissions of discontinued operations amounted to 175 kilotonnes CO2-equivalent in 2016 (2015: 145 kilotonnes CO2-equivalent).
Philips Group
Total carbon emissions in manufacturing
in kilotonnes CO2-equivalent
2012 - 2016
|
| |||||||||||||||||||
| 2012 | 2013 | 2014 | 2015 | 2016 | ||||||||||||||||
|
| |||||||||||||||||||
Direct CO21) | 278 | 276 | 253 | 200 | 181 | |||||||||||||||
Indirect CO2 | 252 | 208 | 185 | 148 | 122 | |||||||||||||||
Other greenhouse gases | 6 | 7 | 6 | 6 | 4 | |||||||||||||||
From glass production | 27 | 27 | 24 | 17 | 16 | |||||||||||||||
|
| |||||||||||||||||||
Philips Group2) | 563 | 518 | 468 | 371 | 323 | |||||||||||||||
|
| |||||||||||||||||||
| 1) | From energy |
| 2) | Excludingnon-reporting industrial sites therefore different from Operational carbon footprint |
Philips Group
Total carbon emissions in manufacturing per segment
in kilotonnes CO2-equivalent
2012 - 2016
|
| |||||||||||||||||||
| 2012 | 2013 | 2014 | 2015 | 2016 | ||||||||||||||||
|
| |||||||||||||||||||
Personal Health | 54 | 50 | 45 | 49 | 59 | |||||||||||||||
Diagnosis & Treatment | 52 | 35 | 31 | 28 | 22 | |||||||||||||||
Connected Care & Health Informatics | 14 | 9 | 8 | 7 | 4 | |||||||||||||||
Lighting | 443 | 424 | 384 | 287 | 238 | |||||||||||||||
|
| |||||||||||||||||||
Philips Group | 563 | 518 | 468 | 371 | 323 | |||||||||||||||
|
| |||||||||||||||||||
CO2 emissions decreased significantly at Philips Lighting due to reduced energy usage resulting from operational changes and energy efficiency improvements. Emissions at the Diagnosis & Treatment businesses decreased due to an increase in use of electricity generated by renewable sources, partially offset by two newly acquired sites. The Connected Care & Health Informatics businesses segment decreased its CO2 emissions due to lower energy consumption. At the Personal Health businesses, CO2 emissions increased due to a full-time worker, whiledecrease in the use of electricity generated by renewable sources. In December 2016, the Los Mirasoles windfarm in the US started to produce electricity. As a result, all our US operations will be powered by wind energy in 2017, a clear step towards our ambition to become carbon-neutral in our operations by 2020.
Hazardous substances emissions
In the ‘Healthy people, sustainable planet’ program, new chemical reduction targets have been defined, on the most relevant categories of substances for Royal Philips, being hazardous substance emissions as well as VOC (Volatile Organic Compounds) emissions. As part of the deployment of the new program, reduction targets at our industrial sites are being agreed. For more information on Philips Lighting’s emissions please refer to their Annual Report.
Royal Philips HealthTech businesses
Hazardous substances emissions in kilos
2015 - 2016
|
| |||||||
| 2015 | 2016 | |||||||
|
| |||||||
Personal Health | 789 | 642 | ||||||
Diagnosis & Treatment | 604 | 428 | ||||||
Connected Care & Health Informatics | 26 | 29 | ||||||
|
| |||||||
HealthTech | 1,419 | 1,099 | ||||||
|
| |||||||
In 2016, emissions of hazardous substances decreased by 23%, mainly caused by reduced usage of harmful chemicals at a Diagnosis & Treatment businesses site and a Personal Health businesses site and changing processes at multiple sites in all segments.
VOC emissions
Royal Philips HealthTech businesses
VOC emissions in tonnes
2015 - 2016
|
| |||||||
| 2015 | 2016 | |||||||
|
| |||||||
Personal Health | 138 | 92 | ||||||
Diagnosis & Treatment | 29 | 35 | ||||||
Connected Care & Health Informatics | 2 | 2 | ||||||
|
| |||||||
HealthTech | 169 | 129 | ||||||
|
| |||||||
VOC emissions reduced significantly in 2016 (by 24%) to 129 tonnes. This decrease was mainly driven by a number of industrial sites in the Personal Health businesses segment, which changed their lacquering processes, as well as changes in the product mix. This was slightly offset by the inclusion of two newly acquired industrial sites in the Diagnosis & Treatment businesses segment.
ISO 14001 certification
Most of the Royal Philips manufacturing sites are certified under the umbrella certificates for the Diagnosis & Treatment, Connected Care & Health Informatics and Personal Health businesses segments. Philips Lighting also has an FTEumbrella certificate. In 2016, 82% of 0.5 signalsreporting manufacturing sites were certified, a 4% increase compared to 2015. Two sites were newly
230 Annual Report 2016
Sustainability statements 12.4.3
certified this year in the Personal Health businesses segment, and the two sites in the Diagnosis & Treatment businesses segment that the worker is only half-time.started to report were not yet certified.
Philips Group
Global Reporting Initiative (GRI)ISO 14001 certificationas a % of all reporting organizations
2012 – 2016
|
| |||||||||||||||||||
| 2012 | 2013 | 2014 | 2015 | 2016 | ||||||||||||||||
|
| |||||||||||||||||||
Philips Group | 69 | 79 | 79 | 78 | 82 | |||||||||||||||
|
| |||||||||||||||||||
Environmental incidents
In 2016, the Personal Health businesses reported one environmental incident with noise and four non-compliances. One was related to noise, followed by a technical project to meet the requirements; two were related to waste water and storm water permits which werefollowed-up by corrective actions; and one administrative incident was related to waste. The Diagnosis & Treatment businesses reported one environmental incident with an oil spill which did not result in soil pollution. The Connected Care & Health Informatics businesses reported one environmentalnon-compliance which was related to waste water. Philips Lighting did not experience any environmental incidents but reported fournon-compliances, of which one resulted in anon-material fine (manufacturing site exceeding the usage limit of its emergency generator).
Annual Report 2016 231
Sustainability statements 12.4.3
Sustainability world map
To find out about our Health and Safety, Waste, Water and Emissions metrics at global, regional and market level, go towww.results.philips.com/interactive-worldmap
| Philips Group | Total waste | Emissions2) | ||||||||||||||||||||||||||||||||||||||
| Market | Manufacturing sites | Total recordable case rate1) | CO2 emitted (Tonnes CO2) | Waste (Tonnes) | Recycled (%) | Water (m3) | Hazardous substances (kg) | VOC (Tonnes) | ||||||||||||||||||||||||||||||||
Africa | — | 0.00 | — | — | — | — | — | — | ||||||||||||||||||||||||||||||||
ASEAN and the Pacific | 1 | 0.12 | 21,307 | 1,463 | 91% | 74,738 | 5 | 25 | ||||||||||||||||||||||||||||||||
Benelux | 6 | 0.22 | 10,757 | 8,726 | 80% | 235,372 | 157 | 12 | ||||||||||||||||||||||||||||||||
Central & Eastern Europe | 7 | 0.30 | 61,274 | 7,019 | 81% | 243,260 | 92 | 20 | ||||||||||||||||||||||||||||||||
Germany, Austria and Switzerland | 4 | 0.50 | 7,616 | 3,050 | 89% | 53,264 | 389 | 6 | ||||||||||||||||||||||||||||||||
France | 2 | 0.76 | 1,284 | 5,123 | 95% | 182,370 | — | — | ||||||||||||||||||||||||||||||||
Greater China | 11 | 0.14 | 75,592 | 6,663 | 90% | 977,947 | 311 | 27 | ||||||||||||||||||||||||||||||||
Iberia | 2 | 0.66 | 2,398 | 2,042 | 82% | 47,291 | — | — | ||||||||||||||||||||||||||||||||
Indian Subcontinent | 5 | 0.10 | 65,148 | 2,552 | 96% | 57,174 | 6 | 4 | ||||||||||||||||||||||||||||||||
Italy, Israel and Greece | 4 | 0.53 | 6,829 | 2,117 | 76% | 22,529 | 15 | 5 | ||||||||||||||||||||||||||||||||
Japan | — | 0.20 | — | — | — | — | — | — | ||||||||||||||||||||||||||||||||
Latin America | 11 | 0.35 | 12,927 | 8,107 | 82% | 173,474 | — | 8 | ||||||||||||||||||||||||||||||||
Middle East & Turkey3) | 3 | 0.27 | — | — | — | — | — | — | ||||||||||||||||||||||||||||||||
Nordics | — | 0.20 | — | — | — | — | — | — | ||||||||||||||||||||||||||||||||
North America | 24 | 0.94 | 48,193 | 16,799 | 76% | 337,998 | 47 | 18 | ||||||||||||||||||||||||||||||||
Russia and Central Asia | — | 0.00 | — | — | — | — | — | — | ||||||||||||||||||||||||||||||||
UK & Ireland | 2 | 0.06 | 9,096 | 1,102 | 85% | 8,501 | 77 | 4 | ||||||||||||||||||||||||||||||||
| 1) | Includes manufacturing andnon-manufacturing sites |
| 2) | HealthTech |
| 3) | Three manufacturing sites did not start to report environmental data yet |
232 Annual Report 2016
Sustainability statements 12.5
12.5 Assurance report of the independent auditor
To: The Supervisory Board and Shareholders of Koninklijke Philips N.V.
Our Opinion
We have audited the Sustainability Information in the annual report of Koninklijke Philips N.V. (the Company), based in Eindhoven, the Netherlands for the year ended December 31, 2016. The scope of our audit engagement is described in Section “Our Scope”. An audit engagement is aimed at obtaining reasonable assurance.
In our opinion, the Sustainability Information in the annual report 2016 presents, in all material respects, a reliable and adequate view of:
the policy and business operations with regard to sustainability; and
the thereto related events and achievements for the year ended December 31, 2016
in accordance with the GRI Standards of Global Reporting Initiative (GRI) (option Comprehensive) and the supplemental internally applied reporting criteria as disclosed in section 12.1 Approach to sustainability reporting in chapter 12 Sustainability statements of the annual report 2016.
Basis for our opinion
We have performed our audit on the Sustainability Information in accordance with Dutch law, including Dutch Standard 3810N “Assurance engagements relating to sustainability reports”. Dutch Standard 3810N is a network-based organizationsubject specific standard under the International Standard on Assurance Engagements (ISAE) 3000 “Assurance Engagements Other Than Audits or Reviews of Historical Financial Information”. Our responsibilities under this standard are further described in the Section “Our responsibilities for the audit of the Sustainability Information”.
We believe that pioneered the world’s most widely usedaudit evidence we have obtained is sufficient and appropriate to provide a basis for our opinion.
Our Independence
We are independent of the Company in accordance with the “Verordening inzake de onafhankelijkheid van accountants bij assurance-opdrachten” (ViO) (Code of Ethics for Professional Accountants, a Dutch regulation with respect to independence) and other relevant independence regulations in the Netherlands. This includes that we do not perform any activities that could result in a conflict of interest with our independent assurance engagement. Furthermore, we have complied with the “Verordening gedrags- en beroepsregels accountants” (VGBA, Dutch Code of Ethics).
Our Scope
The Sustainability Information comprises chapter 12 Sustainability statements and sections 2.2 Social performance and 2.3 Environmental performance of the annual report 2016 and provides a representation of the Company’s policy, the related business operations, events and achievements relating to sustainability during 2016.
The Sustainability Information includes prospective information such as ambitions, strategy, plans, expectations and estimates. Inherent to this information is that the actual results may differ in the future and are therefore uncertain. We do not provide any assurance on the achievability and feasibility of this prospective information.
The references, excluding “Methodology for calculating Lives Improved” and “GRI content index”, in the Sustainability Information (www.philips.com, external websites, interviews and other documents) are outside the scope of our assurance engagement.
We have read the information on sustainability in the rest of the annual report 2016 and to the extent we can identify this information is consistent with the Sustainability Information in scope of our audit.
Responsibilities of management for the Sustainability Information
Management of the Company is responsible for the preparation of the Sustainability Information in accordance with the GRI Standards (option Comprehensive) and the supplemental internally applied reporting criteria as disclosed in section 12.1 Approach to sustainability reporting framework. GRIin chapter 12 Sustainability statements of the annual report 2016. This responsibility includes the identification of stakeholders and the determination of material aspects. The choices made by management regarding the scope of the Sustainability Information and the reporting policy of the Company is summarized in section 12.1 Approach to sustainability reporting.
Furthermore, management is responsible for such internal control as it determines is necessary to enable the preparation of the Sustainability Information that is free from material misstatement, whether due to fraud or errors.
Our responsibilities for the audit of the Sustainability Information
Our responsibility is to plan and perform the audit engagement in a manner that allows us to obtain sufficient and appropriate audit evidence for our opinion.
Reasonable assurance is a high, but not absolute level of assurance, which means we may not have detected all material errors and fraud. Misstatements can arise from fraud or errors and are considered material if, individually or in the aggregate, they could reasonably
Annual Report 2016 233
Sustainability statements 12.5
be expected to influence the economic decisions of users taken on the basis of the Sustainability Information. The materiality affects the nature, timing and extent of our audit procedures and the evaluation of the effect of identified misstatements on our opinion.
We apply the “Nadere voorschriften accountantskantoren ter zake van assurance opdrachten (RA/AA)” and accordingly maintain a comprehensive system of quality control including documented policies and procedures regarding compliance with ethical requirements, professional standards and applicable legal and regulatory requirements.
We have exercised professional judgement and have maintained professional skepticism throughout the audit, in accordance with the Dutch Standard 3810N, ethical requirements and independence requirements.
Our audit included amongst others:
Evaluating the appropriateness of the reporting policy, its consistent application, including the evaluation of the results of the stakeholders’ dialogue, the reasonableness of management’s estimates and the related disclosures made by management.
Performing an external environment analysis and obtaining insight into relevant social themes and issues and the characteristics of the organization.
Identifying and assessing the risks of material misstatement of the Sustainability Information, whether due to errors or fraud, designing and performing audit procedures responsive to those risks, and obtaining audit evidence that is sufficient and appropriate to provide a basis for our opinion. The risk of not detecting a material misstatement resulting from fraud is higher than for one resulting from errors, as fraud may involve collusion, forgery, intentional omissions, misrepresentations, or the override of internal control.
Interviewing management and relevant staff responsible for the sustainability’s strategy, policy and achievements.
Interviewing relevant staff at corporate level responsible for providing the information in the Sustainability Information, carrying out internal control procedures on the data and consolidating the data in the Sustainability Information.
Evaluating the design and implementation and testing the operating effectiveness of the reporting systems and processes related to the Sustainability Information.
Evaluating the underlying transactions and events.
Visits to production sites to evaluate the source data and to evaluate the design and implementation of control, including validation procedures, at local level.
Testing relevant data and internal and external documentation, on a sample basis, to determine the reliability of the Sustainability Information.
An analytical review of the data and trends submitted for consolidation at corporate level.
Evaluating the overall presentation, structure and content of the Sustainability Information.
Amsterdam, The Netherlands
February 21, 2017
Ernst & Young Accountants LLP
Subject matter expert sustainability
J. Niewold
Independent auditor
C.B. Boogaart
234 Annual Report 2016
Five-year overview 13
Philips Group
General data in millions of EUR unless otherwise stated
2012 - 2016
|
| |||||||||||||||||||
| 2012 | 2013 | 2014 | 2015 | 2016 | ||||||||||||||||
|
| |||||||||||||||||||
Sales | 22,234 | 21,990 | 21,391 | 24,244 | 24,516 | |||||||||||||||
% increase over previous year | 12 | % | (1 | )% | (3 | )% | 13 | % | 1 | % | ||||||||||
Income from operations (EBIT) (loss) | 592 | 1,855 | 486 | 992 | 1,882 | |||||||||||||||
Financial income and expenses - net | (329 | ) | (330 | ) | (301 | ) | (369 | ) | (493 | ) | ||||||||||
Income (loss) from continuing operations | (166 | ) | 1,034 | 221 | 414 | 1,075 | ||||||||||||||
Income (loss) from continuing operations attributable to shareholders | (171 | ) | 1,031 | 225 | 400 | 1,032 | ||||||||||||||
Income (loss) from Discontinued operations | 136 | 138 | 190 | 245 | 416 | |||||||||||||||
Net income (loss) | (30 | ) | 1,172 | 411 | 659 | 1,491 | ||||||||||||||
Net income (loss) attributable to shareholders | (35 | ) | 1,169 | 415 | 645 | 1,448 | ||||||||||||||
Net assets | 11,185 | 11,227 | 10,968 | 11,780 | 13,508 | |||||||||||||||
Total employees atyear-end (FTEs) | 118,087 | 116,082 | 113,678 | 112,959 | 114,731 | |||||||||||||||
|
| |||||||||||||||||||
Philips Group
Income in millions of EUR unless otherwise stated
2012 - 2016
|
| |||||||||||||||||||
| 2012 | 2013 | 2014 | 2015 | 2016 | ||||||||||||||||
|
| |||||||||||||||||||
Income from operations (EBIT) | 592 | 1,855 | 486 | 992 | 1,882 | |||||||||||||||
as a % of sales | 2.7 | % | 8.4 | % | 2.3 | % | 4.1 | % | 7.7 | % | ||||||||||
Adjusted income from operations1) | 1,003 | 2,276 | 821 | 1,372 | 2,235 | |||||||||||||||
as a % of sales | 4.5 | % | 10.4 | % | 3.8 | % | 5.7 | % | 9.1 | % | ||||||||||
Income taxes | (218 | ) | (466 | ) | (26 | ) | (239 | ) | (327 | ) | ||||||||||
as a % of income before taxes | (82.9 | )% | (30.6 | )% | (14.1 | )% | (38.4 | )% | (23.5 | )% | ||||||||||
Income (loss) from continuing operations | (166 | ) | 1,034 | 221 | 414 | 1,075 | ||||||||||||||
Net income (loss) | (30 | ) | 1,172 | 411 | 659 | 1,491 | ||||||||||||||
|
| |||||||||||||||||||
| 1) | Non-GAAP financial measure. For the definition and reconciliation to the most directly comparable GAAP measure, refer tochapter 4, Reconciliation ofnon-GAAP information, of this report |
Philips Group
Capital employed in millions of EUR unless otherwise stated
2012 - 2016
|
| |||||||||||||||||||
| 2012 | 2013 | 2014 | 2015 | 2016 | ||||||||||||||||
|
| |||||||||||||||||||
Cash and cash equivalents | 3,834 | 2,465 | 1,873 | 1,766 | 2,334 | |||||||||||||||
Receivables and other current assets | 5,128 | 5,220 | 5,591 | 5,655 | 6,169 | |||||||||||||||
Assets classified as held for sale | 43 | 507 | 1,613 | 1,809 | 2,180 | |||||||||||||||
Inventories | 3,495 | 3,240 | 3,314 | 3,463 | 3,392 | |||||||||||||||
Non-current financial assets/investments in associates | 726 | 657 | 619 | 670 | 525 | |||||||||||||||
Non-current receivables/assets | 2,217 | 1,924 | 2,721 | 3,075 | 3,098 | |||||||||||||||
Property, plant and equipment | 2,959 | 2,780 | 2,095 | 2,322 | 2,155 | |||||||||||||||
Intangible assets | 10,679 | 9,766 | 10,526 | 12,216 | 12,450 | |||||||||||||||
|
| |||||||||||||||||||
Total assets | 29,081 | 26,559 | 28,352 | 30,976 | 32,303 | |||||||||||||||
Property, plant and equipment: | ||||||||||||||||||||
Capital expenditures for the year | 479 | 482 | 437 | 522 | 443 | |||||||||||||||
Depreciation for the year | 588 | 521 | 592 | 582 | 606 | |||||||||||||||
Capital expenditures: depreciation | 0.8 | 0.9 | 0.7 | 0.9 | 0.7 | |||||||||||||||
Inventories as a % of sales1) | 14.1 | % | 13.7 | % | 15.3 | % | 14.3 | % | 13.8 | % | ||||||||||
Outstanding trade receivables, in days sales2) | 50 | 53 | 56 | 56 | 57 | |||||||||||||||
|
| |||||||||||||||||||
| 1) | Calculated based upon values excluding inventories and sales related to acquisitions and divestments for 2015 and 2016 |
| 2) | Calculated based upon the values excluding accounts receivable and sales related to acquisitions, divestments and Discontinued operations |
Annual Report 2016 235
Five-year overview 13
Philips Group
Financial structurein millions of EUR unless otherwise stated
2012 - 2016
|
| |||||||||||||||||||
| 2012 | 2013 | 2014 | 2015 | 2016 | ||||||||||||||||
|
| |||||||||||||||||||
Other liabilities1) | 9,208 | 7,713 | 8,414 | 8,786 | 9,058 | |||||||||||||||
Liabilities directly associated with assets held for sale | 27 | 348 | 349 | 407 | 525 | |||||||||||||||
Debt | 4,534 | 3,901 | 4,104 | 5,760 | 5,606 | |||||||||||||||
Provisions1) | 4,127 | 3,370 | 4,517 | 4,243 | 3,606 | |||||||||||||||
|
|
|
| |||||||||||||||||
Total provisions and liabilities | 17,896 | 15,332 | 17,384 | 19,196 | 18,795 | |||||||||||||||
Shareholders’ equity | 11,151 | 11,214 | 10,867 | 11,662 | 12,601 | |||||||||||||||
Non-controlling interests | 34 | 13 | 101 | 118 | 907 | |||||||||||||||
|
| |||||||||||||||||||
Group equity and liabilities | 29,081 | 26,559 | 28,352 | 30,976 | 32,303 | |||||||||||||||
Net debt: group equity ratio2)3) | 6:94 | 11:89 | 17:83 | 25:75 | 19:81 | |||||||||||||||
Market capitalization atyear-end | 18,200 | 24,340 | 22,082 | 21,607 | 26,751 | |||||||||||||||
|
| |||||||||||||||||||
| 1) | Adjusted to reflect a reclassification of net defined-benefit obligations into Long-term provisions. Seenote 1, Significant accounting policies. |
| 2) | For details on the calculation of net debt and group equity ratio, refer tonote 17, Equity. |
| 3) | Non-GAAP financial measure. For the definition and reconciliation to the most directly comparable GAAP measure, refer to chapter 4, Reconciliation of non-GAAP information, of this report. |
Philips Group
Key figures per sharein EUR unless otherwise stated
2012 - 2016
|
| |||||||||||||||||||
| 2012 | 2013 | 2014 | 2015 | 2016 | ||||||||||||||||
|
| |||||||||||||||||||
Sales per common share | 24.11 | 24.14 | 23.37 | 26.46 | 26.71 | |||||||||||||||
Weighted average amount of shares outstanding: | ||||||||||||||||||||
- basic1) | 922,101 | 911,072 | 915,193 | 916,087 | 918,016 | |||||||||||||||
- diluted1) | 927,222 | 922,072 | 922,714 | 923,625 | 928,789 | |||||||||||||||
Basic earnings per common share: | ||||||||||||||||||||
Income (loss) from continuing operations attributable to shareholders per share | (0.19 | ) | 1.13 | 0.25 | 0.44 | 1.12 | ||||||||||||||
Net income (loss) attributable to shareholders | (0.04 | ) | 1.28 | 0.45 | 0.70 | 1.58 | ||||||||||||||
Diluted earnings per common share: | ||||||||||||||||||||
Income (loss) from continuing operations attributable to shareholders per share | (0.19 | ) | 1.12 | 0.24 | 0.43 | 1.11 | ||||||||||||||
Net income (loss) attributable to shareholders | (0.04 | ) | 1.27 | 0.45 | 0.70 | 1.56 | ||||||||||||||
Dividend distributed per common share | 0.75 | 0.75 | 0.80 | 0.80 | 0.80 | |||||||||||||||
Total shareholder return per common share | 4.37 | 7.50 | (1.70 | ) | 0.21 | 6.24 | ||||||||||||||
Shareholders’ equity per common share | 12.19 | 12.28 | 11.88 | 12.72 | 13.66 | |||||||||||||||
Price/earnings ratio | (104.74 | ) | 23.58 | 96.60 | 53.55 | 25.89 | ||||||||||||||
Share price atyear-end | 19.90 | 26.65 | 24.15 | 23.56 | 29.00 | |||||||||||||||
Highest closing share price during the year | 20.33 | 26.78 | 28.10 | 27.65 | 29.07 | |||||||||||||||
Lowest closing share price during the year | 13.76 | 20.26 | 20.98 | 20.79 | 20.95 | |||||||||||||||
Average share price | 16.92 | 23.33 | 24.00 | 24.51 | 24.75 | |||||||||||||||
Amount of common shares outstanding at year-end1) | 914,591 | 913,338 | 914,389 | 917,104 | 922,437 | |||||||||||||||
|
| |||||||||||||||||||
| 1) | In thousands of shares |
236 Annual Report 2016
Five-year overview 13
Philips Group
Sustainability
2012 - 2016
|
| |||||||||||||||||||
| 2012 | 2013 | 2014 | 2015 | 2016 | ||||||||||||||||
|
| |||||||||||||||||||
Lives improved, in billions | 1.6 | 1.7 | 1.9 | 2.0 | 2.1 | |||||||||||||||
Green Revenues, as a % of total sales | 46 | % | 50 | % | 59 | % | 61 | % | 64 | % | ||||||||||
Green Innovation, in millions of euros | 453 | 405 | 463 | 495 | 558 | |||||||||||||||
Operational carbon footprint, in kilotonnes CO2-equivalent | 1,640 | 1,678 | 1,521 | 1,417 | 1,344 | |||||||||||||||
Operational energy efficiency, in terajoules per million euro sales | 1.35 | 1.40 | 1.34 | 1.11 | 1.01 | |||||||||||||||
Total energy consumption in manufacturing, in terajoules1) | 12,014 | 11,963 | 11,257 | 9,702 | 8,987 | |||||||||||||||
Total carbon emissions in manufacturing, in kilotonnes CO2-equivalent | 563 | 518 | 468 | 371 | 323 | |||||||||||||||
Water intake, in thousands m3 | 3,137 | 3,289 | 3,103 | 2,727 | 2,414 | |||||||||||||||
Total waste, in kilotonnes1) | 80.6 | 75.9 | 75.0 | 68.5 | 64.8 | |||||||||||||||
Materials provided for recycling via external contractor per total waste, in % | 77 | % | 79 | % | 80 | % | 83 | % | 83 | % | ||||||||||
Restricted substances, in kilos | 67 | 37 | 29 | 26 | 7 | |||||||||||||||
Hazardous substances, in kilos | 67,530 | 35,118 | 28,310 | 25,101 | 12,412 | |||||||||||||||
ISO 14001 certification, as a % of all reporting organizations1) | 69 | % | 79 | % | 79 | % | 78 | % | 82 | % | ||||||||||
Employee Engagement Index, % favorable | 79 | % | 75 | % | 72 | % | 71 | % | 74 | % | ||||||||||
Female executives, in % of total | 14 | % | 15 | % | 18 | % | 19 | % | 18 | % | ||||||||||
Lost Workday Injuries, per 100 FTEs | 0.31 | 0.27 | 0.23 | 0.21 | 0.18 | |||||||||||||||
Fatalities | 7 | 3 | 1 | — | 2 | |||||||||||||||
Initial and continual conformance audits, number of audits | 159 | 200 | 203 | 195 | 226 | |||||||||||||||
Suppliers audits, compliance rate, in % | 75 | % | 77 | % | 86 | % | 86 | % | 89 | % | ||||||||||
|
| |||||||||||||||||||
| 1) | In manufacturing excluding new acquisitions |
Annual Report 2016 237
Five-year overview 13.1
13.1 Five-year overview (condensed)
Due to factors such as acquisitions and divestments, the amounts, percentages and ratios are not directly comparable.
Philips Group
Selected financial datain millions of EUR unless otherwise stated
2012 - 2016
|
| |||||||||||||||||||||||
| 2012 | 2013 | 2014 | 2015 | 2016 | 2016 | |||||||||||||||||||
|
| |||||||||||||||||||||||
| EUR | EUR | EUR | EUR | EUR | USD1) | |||||||||||||||||||
|
| |||||||||||||||||||||||
Sales | 22,234 | 21,990 | 21,391 | 24,244 | 24,516 | 25,820 | ||||||||||||||||||
Income from operations (EBIT) (loss) | 592 | 1,855 | 486 | 992 | 1,882 | 1,982 | ||||||||||||||||||
Financial income and expenses - net | (329 | ) | (330 | ) | (301 | ) | (369 | ) | (493 | ) | (519 | ) | ||||||||||||
Income (loss) from continuing operations | (166 | ) | 1,034 | 221 | 414 | 1,075 | 1,132 | |||||||||||||||||
Income (loss) from continuing operations attributable to shareholders | (171 | ) | 1,031 | 225 | 400 | 1,032 | 1,087 | |||||||||||||||||
Income (loss) from Discontinued operations | 136 | 138 | 190 | 245 | 416 | 438 | ||||||||||||||||||
Net income (loss) | (30 | ) | 1,172 | 411 | 659 | 1,491 | 1,570 | |||||||||||||||||
Net income (loss) attributable to shareholders | (35 | ) | 1,169 | 415 | 645 | 1,448 | 1,525 | |||||||||||||||||
Total assets | 29,081 | 26,559 | 28,352 | 30,976 | 32,303 | 34,022 | ||||||||||||||||||
Net assets | 11,185 | 11,227 | 10,968 | 11,780 | 13,508 | 14,227 | ||||||||||||||||||
Debt | 4,534 | 3,901 | 4,104 | 5,760 | 5,606 | 5,904 | ||||||||||||||||||
Provisions | 4,127 | 3,370 | 4,517 | 4,243 | 3,606 | 3,798 | ||||||||||||||||||
Shareholders’ equity | 11,151 | 11,214 | 10,867 | 11,662 | 12,601 | 13,271 | ||||||||||||||||||
Non-controlling interests | 34 | 13 | 101 | 118 | 907 | 955 | ||||||||||||||||||
Weighted average shares outstanding: | ||||||||||||||||||||||||
- basic2) | 922,101 | 911,072 | 915,193 | 916,087 | 918,016 | 918,016 | ||||||||||||||||||
- diluted2) | 927,222 | 922,072 | 922,714 | 923,625 | 928,789 | 928,789 | ||||||||||||||||||
Amount of common shares outstanding atyear-end2) | 914,591 | 913,338 | 914,389 | 917,104 | 922,437 | 922,437 | ||||||||||||||||||
Basic earnings per common share3) | ||||||||||||||||||||||||
Income (loss) from continuing operations attributable to shareholders | (0.19 | ) | 1.13 | 0.25 | 0.44 | 1.12 | 1.18 | |||||||||||||||||
Net income (loss) attributable to shareholders | (0.04 | ) | 1.28 | 0.45 | 0.70 | 1.58 | 1.66 | |||||||||||||||||
Diluted earnings per common share3) | ||||||||||||||||||||||||
Income (loss) from continuing operations attributable to shareholders | (0.19 | ) | 1.12 | 0.24 | 0.43 | 1.11 | 1.17 | |||||||||||||||||
Net income (loss) attributable to shareholders | (0.04 | ) | 1.27 | 0.45 | 0.70 | 1.56 | 1.64 | |||||||||||||||||
Dividend distributed per common share | 0.75 | 0.75 | 0.80 | 0.80 | 0.80 | 0.84 | ||||||||||||||||||
|
| |||||||||||||||||||||||
| 1) | For the convenience of the reader, the euro amounts have been converted into US dollars at the exchange rate used for balance sheet purposes at December 31, 2016 (USD 1 = EUR 0.9494. The US dollar amounts are unaudited.) Please refer to section 14.1, Key financials and dividend, of this report for high and low exchange rates for the previous six months and exchange rates for the five most recent financial years |
| 2) | In thousands of shares |
| 3) | In euros or US dollars as indicated in the header |
238 Annual Report 2016
Investor Relations 14
14.1 Key financials and dividend
Key financials
Net income attributable to shareholders of Koninklijke Philips N.V. in 2016 was EUR 1,448 million, or EUR 1.56 per common share (diluted; basic EUR 1.58 per common share). This compares to EUR 645 million, or EUR 0.70 per common share (diluted; basic EUR 0.70 per common share), in 2015.
Philips Group
Net income attributable to shareholdersin millions of EUR
2012 - 2016
Philips Group
Income from operations (EBIT) and Adjusted income from
operations1)in millions of EUR
2012 - 2016
| 1) | Non-GAAP financial measure. For the definition and reconciliation to the most directly comparable GAAP measure, refer tochapter 4, Reconciliation ofnon-GAAP information, of this report |
Philips Group
Total of Net cash provided by operating activities and Net
capital expendituresin millions of EUR
2012 - 2016
Dividend policy
Philips’ dividend policy is aimed at dividend stability and apay-out ratio of 40% to 50% of net income after adjustments.
Net income after adjustments is the base figure used to calculate the dividendpay-out for the year. For 2016, the key exclusions to arrive at net income after adjustments are the following: the results that are shown as Discontinued operations, income from a pension settlement, a charge related to the currency revaluation of the provision for the Masimo litigation, financial charges related to bond redemptions, and a release in financial income and expense related to the Masimo settlement. Restructuring, acquisition-related and separation related charges are also excluded.
Proposed distribution
A proposal will be submitted to the Annual General Meeting of Shareholders, to be held on May 11, 2017, to declare a distribution of EUR 0.80 per common share (up to EUR 745 million), in cash or shares at the option of the shareholder, against the net income for 2016.
If the above dividend proposal is adopted, the shares will be tradedex-dividend as of May 12, 2017 and May 15, 2017 at the New York Stock Exchange and Euronext Amsterdam, respectively. In compliance with the listing requirements of the New York Stock Exchange and the stock market of Euronext Amsterdam, the dividend record date will be May 16, 2017.
Shareholders will be given the opportunity to make their choice between cash and shares between May 17, 2017 and June 9, 2017. If no choice is made during this election period the dividend will be paid in cash. On June 9, 2017 after close of trading, the number of share dividend rights entitled to one new common share will be determined based on the volume-weighted average
Annual Report 2016 239
Investor Relations 14.1
price of all traded common shares of Koninklijke Philips N.V. at Euronext Amsterdam on June 7, 8 and 9, 2017. The company will calculate the number of share dividend rights entitled to one new common share (the ratio), such that the gross dividend in shares will be approximately equal to the gross dividend in cash. The ratio and the number of shares to be issued will be announced on June 13, 2017. Payment of the dividend and delivery of new common shares, with settlement of fractions in cash, if required, will take place from June 14, 2017. The distribution of dividend in cash to holders of New York Registry shares will be made in USD at the USD/EUR rate as per WM/ Reuters FX Benchmark 2 PM CET fixing of June 12, 2017.
Further details will be given in the agenda for the 2017 Annual General Meeting of Shareholders. All dates mentioned remain provisional until then.
Dividend in cash is in principle subject to 15% Dutch dividend withholding tax, which will be deducted from the dividend in cash paid to the shareholders. Dividend in shares paid out of net income and retained earnings is subject to 15% dividend withholding tax, but only in respect of the par value of the shares (EUR 0.20 per share). Shareholders are advised to consult their tax advisor on the applicable situation with respect to taxes on the dividend received.
In 2016, a dividend of EUR 0.80 per common share was paid in cash or shares, at the option of the shareholder. For 55.0% of the shares, the shareholders elected for a share dividend, resulting in the issue of 17,344,462 new common shares, leading to a 1.9% dilution. EUR 330 million was paid in cash. See alsosection 2.4, Proposed distribution to shareholders, of this report.
| ex-dividend date | record date | payment date | ||||||||||
Euronext Amsterdam | May 15, 2017 | May 16, 2017 | June 14, 2017 | |||||||||
New York Stock Exchange | May 12, 2017 | May 16, 2017 | June 14, 2017 | |||||||||
Philips Group
Dividend and dividend yield per common share
2007 - 2017
| 1) | Dividend yield % is as of December 31 of previous year |
| 2) | Subject to approval by the Annual General Meeting of Shareholders in 2017 |
Information for investors in New York Registry shares program
Dividends and distributions per common share
The following table sets forth in euros the gross dividends on the common shares in the fiscal years indicated (from prior-year profit distribution) and such amounts as converted into US dollars and paid to holders of shares of the New York Registry:
Philips Group
Gross dividends on the common shares
2012 - 2016
|
| |||||||||||||||||||
| 2012 | 2013 | 2014 | 2015 | 2016 | ||||||||||||||||
|
| |||||||||||||||||||
in EUR | 0.75 | 0.75 | 0.80 | 0.80 | 0.80 | |||||||||||||||
in USD | 0.94 | 0.98 | 1.09 | 0.89 | 0.90 | |||||||||||||||
|
| |||||||||||||||||||
Exchange rates USD : EUR
The following two tables set forth, for the periods and dates indicated, certain information concerning the exchange rate for US dollars into euros based on the Noon Buying Rate in New York City for cable transfers in foreign currencies as certified for customs purposes by the Federal Reserve Bank of New York (the “Noon Buying Rate”). The Noon Buying Rate on February 10, 2017 was EUR 0.9389 per USD 1.
Exchange rate (based on the “Noon Buying Rate”)
EUR per USD
2012 - 2016
|
| |||||||||||||||
| period end | average | high | low | |||||||||||||
|
| |||||||||||||||
2012 | 0.7584 | 0.7782 | 0.8290 | 0.7428 | ||||||||||||
2013 | 0.7257 | 0.7532 | 0.7828 | 0.7238 | ||||||||||||
2014 | 0.8264 | 0.7533 | 0.8264 | 0.7180 | ||||||||||||
2015 | 0.9209 | 0.9018 | 0.9502 | 0.8323 | ||||||||||||
2016 | 0.9477 | 0.9037 | 0.9639 | 0.8684 | ||||||||||||
|
| |||||||||||||||
240 Annual Report 2016
Investor Relations 14.1
Exchange rate per month (based on the “Noon Buying Rate”)
EUR per USD
2016 - 2017
|
| |||||||
| highest rate | lowest rate | |||||||
|
| |||||||
August, 2016 | 0.9027 | 0.8823 | ||||||
September, 2016 | 0.8962 | 0.8872 | ||||||
October, 2016 | 0.9203 | 0.8919 | ||||||
November, 2016 | 0.9470 | 0.8992 | ||||||
December, 2016 | 0.9639 | 0.9295 | ||||||
January, 2017 | 0.9601 | 0.9264 | ||||||
|
| |||||||
Unless otherwise stated, for the convenience of the reader, the translations of euros into US dollars appearing in this section have been made based on the closing rate on December 31, 2016 (USD 1 = EUR 0.9495). This rate is not materially different from the Noon Buying Rate on such date (USD 1 = EUR 0.9477).
The following table sets out the exchange rate for US dollars into euros applicable for translation of Philips’ financial statements for the periods specified.
Exchange rate (based on Philips’ consolidation rate)
EUR per USD
2012 - 2016
|
| |||||||||||||||
| period end | average | high | low | |||||||||||||
|
| |||||||||||||||
2012 | 0.7582 | 0.7776 | 0.8166 | 0.7500 | ||||||||||||
2013 | 0.7255 | 0.7527 | 0.7805 | 0.7255 | ||||||||||||
2014 | 0.8227 | 0.7527 | 0.8227 | 0.7201 | ||||||||||||
2015 | 0.9151 | 0.9007 | 0.9410 | 0.8796 | ||||||||||||
2016 | 0.9495 | 0.9078 | 0.9495 | 0.8812 | ||||||||||||
|
| |||||||||||||||
Market capitalization
Philips’ market capitalization was EUR 26.8 billion atyear-end 2016. On December 31, 2016, the closing price for shares in Amsterdam was EUR 29.00 and the number of common shares outstanding (after deduction of treasury shares) amounted to 922 million.
Philips Group
Market capitalizationin billions of EUR
2012 - 2016
Share capital structure
During 2016, Philips’ issued share capital decreased by approximately 1 million common shares to approximately 930 million common shares. The main
reasons for this are the cancellation of 18,829,985 Philips shares acquired pursuant to the EUR 1.5 billion share repurchase program (which was completed in October 2016) and the issuance of 17,344,462 shares related to the elective dividend. The number of common shares issued and outstanding increased from 917 million at December 31, 2015 to 922 million on December 31, 2016. On December 31, 2016, the shares held in treasury amounted to approximately 7 million, all of which are held by Philips to cover long-term incentive and employee stock purchase plans.
The Dutch Act on Financial Supervision imposes an obligation on persons holding certain interests to disclose (inter alia) percentage holdings in the capital and/or voting rights in the Company when such holdings reach, exceed or fall below 3, 5, 10, 15, 20, 25, 30, 40, 50, 60, 75 and 95 percent (as a result of an acquisition or disposal by a person, or as a result of a change in the company’s total number of voting rights or capital issued). Certain derivatives (settled in kind or in cash) are also taken into account when calculating the capital interest. The statutory obligation to disclose capital interest does not only relate to gross long positions, but also to gross short positions. Required disclosures must be made to the Netherlands Authority for the Financial Markets (AFM) without delay. The AFM then notifies the Company of such disclosures and includes them in a register which is published on the AFM’s website. Furthermore, an obligation to disclose (net) short positions is set out in the EU Regulation on Short Selling.
The AFM register shows the following notification of substantial holdings and/or voting rights at or above the 3% threshold: BlackRock, Inc.: substantial holding of 5.03% and 6.19% of the voting rights (January 5, 2017).
The following shareholder portfolio information is based on information provided by several large custodians and a survey conducted in December 2016.
Philips Group
Shareholders by region (approximated)1)in %
2016
| 1) | Split based on identified shares in shareholder identification |
| 2) | Includes countries in Western Europe with a shareholding of less than 5 % |
Annual Report 2016 241
Investor Relations 14.2
Philips Group
Shareholders by style (approximated)1)in %
2016
| 1) | Split based on identified shares in shareholder identification |
| 2) | Growth at a reasonable price |
| 3) | Sovereign Wealth Funds |
Share repurchase programs
Share repurchases for capital reduction purposes
On September 17, 2013, Royal Philips announced a EUR 1.5 billion share repurchase program. This program started on October 21, 2013 and was completed by October 20, 2016. The shares repurchased under this program were held by Philips as treasury shares until they were cancelled. As of December 31, 2016 all treasury shares that were repurchased under this program were cancelled.
Share repurchases related toLong-Term Incentive (LTI) and employee stock purchase programs
To cover outstanding obligations resulting from past and present long-term incentive (LTI) programs, Philips repurchases Philips shares from time to time, on
Euronext Amsterdam or otherwise. The shares repurchased to such LTI positions will be held by Philips as treasury shares until these are distributed to participants. In order to repurchase shares for covering LTI programs, Philips may enter into discretionary management agreements with one or more banks within the limits of relevant laws and regulations (in particular the EU Market Abuse Regulation and Philips’ Articles of Association.
In 2016, Philips repurchased a total of 8.6 million shares for LTI coverage. During 2017, Philips may continue with additional repurchases, the size of which will depend on the movement of the Philips share price.
Further details on the share repurchase programs can be found on the Investor Relations website. For more information seechapter 9, Corporate governance, of this report.
In 2016 Philips purchased call options on Philips’ shares matching the majority of the options granted to employees until 2013. As of December 31, 2016 Philips held 14.1 million call options as a hedge of 15.9 million remaining options granted to employees.
A total of 7,208,301 shares were held in treasury by the Company at December 31, 2016 (2015: 14,026,801 shares). As of that date, a total of 33.5 million rights under long-term incentive plans were outstanding (2015: 39.1 million).
Philips Group
Impact of share repurchases on share countin thousands of shares
2012 - 2016
|
| |||||||||||||||||||
| 2012 | 2013 | 2014 | 2015 | 2016 | ||||||||||||||||
|
| |||||||||||||||||||
Shares issued | 957,133 | 937,846 | 934,820 | 931,131 | 929,645 | |||||||||||||||
Shares in treasury | 42,542 | 24,508 | 20,431 | 14,027 | 7,208 | |||||||||||||||
Shares outstanding | 914,591 | 913,338 | 914,389 | 917,104 | 922,437 | |||||||||||||||
Shares repurchased | 46,871 | 27,811 | 28,538 | 20,296 | 25,193 | |||||||||||||||
Shares cancelled | 82,365 | 37,779 | 21,838 | 21,361 | 18,830 | |||||||||||||||
|
| |||||||||||||||||||
Philips Group
Total number of shares repurchased
2016
|
| |||||||||||||||||||||||
share reduction | average price EUR | share program | average price EUR | total number of shares | average price EUR | |||||||||||||||||||
|
| |||||||||||||||||||||||
January, 2016 | 1,648,906 | 22.79 | 57,094 | 23.92 | 1,706,000 | 22.83 | ||||||||||||||||||
February, 2016 | 1,974,965 | 22.67 | 1,014,035 | 22.63 | 2,989,000 | 22.65 | ||||||||||||||||||
March, 2016 | 1,703,020 | 24.42 | 1,059,980 | 24.31 | 2,763,000 | 24.38 | ||||||||||||||||||
April, 2016 | 2,195,278 | 24.35 | 1,158,953 | 24.32 | 3,354,231 | 24.34 | ||||||||||||||||||
May, 2016 | 1,474,221 | 23.27 | 480,216 | 23.23 | 1,954,437 | 23.26 | ||||||||||||||||||
June, 2016 | 2,121,090 | 22.69 | 593,910 | 22.69 | 2,715,000 | 22.69 | ||||||||||||||||||
July, 2016 | 2,047,077 | 23.25 | 929,385 | 22.76 | 2,976,462 | 23.10 | ||||||||||||||||||
August, 2016 | 1,171,365 | 24.92 | 643,418 | 25.00 | 1,814,783 | 24.95 | ||||||||||||||||||
September, 2016 | 1,200,653 | 25.94 | 439,347 | 25.94 | 1,640,000 | 25.94 | ||||||||||||||||||
October, 2016 | 1,055,410 | 26.34 | 634,088 | 26.54 | 1,689,498 | 26.41 | ||||||||||||||||||
November, 2016 | — | — | 679,000 | 27.16 | 679,000 | 27.16 | ||||||||||||||||||
December, 2016 | — | — | 912,000 | 28.39 | 912,000 | 28.39 | ||||||||||||||||||
|
| |||||||||||||||||||||||
| 1) | The program was completed |
242 Annual Report 2016
Investor Relations 14.3
Philips’ existing long-term debt is rated BBB+ (with stable outlook) by Standard & Poor’s and Baa1 (with stable outlook) by Moody’s. As part of its capital allocation policy, Philips is committed to a strong investment grade credit rating. There is no assurance that Philips will be able to achieve this goal. Ratings are subject to change at any time. Adverse changes in the framework’s continuous improvementCompany’s ratings will not trigger any acceleration in the outstanding long-term debt nor automatic withdrawal of the committed credit facilities.
Philips Group
Credit rating summary
2016
| long-term | short-term | outlook | ||||||||||
Standard & Poor’s | BBB+ | A-2 | Stable | |||||||||
Moody’s | Baa1 | P-2 | Stable | |||||||||
14.4 Performance in relation to marketindices
The common shares of the Company are listed on the stock market of Euronext Amsterdam. The New York Registry Shares of the Company, representing common shares of the Company, are listed on the New York Stock Exchange. The principal market for the common shares is Euronext Amsterdam. For the New York Registry Shares it is the New York Stock Exchange.
The following table shows the high and application worldwide. GRI’s core goalslow closing prices of the common shares on the stock market of Euronext Amsterdam as reported in the Official Price List and the high and low closing prices of the New York Registry Shares on the New York Stock Exchange:
Philips Group
High and low closing price of common shares
2012 - 2017
|
| |||||||||||||||||||
| Euronext Amsterdam (EUR) | New York Stock Exchange (USD) | |||||||||||||||||||
|
|
|
| |||||||||||||||||
| high | low | high | low | |||||||||||||||||
|
| |||||||||||||||||||
January, 2017 | 29.40 | 27.14 | 30.74 | 29.10 | ||||||||||||||||
December, 2016 | 29.07 | 26.60 | 30.57 | 28.22 | ||||||||||||||||
November, 2016 | 27.90 | 26.50 | 30.55 | 28.61 | ||||||||||||||||
October, 2016 | 27.73 | 26.12 | 30.19 | 28.43 | ||||||||||||||||
September, 2016 | 26.70 | 25.25 | 29.97 | 28.34 | ||||||||||||||||
August, 2016 | 26.18 | 23.51 | 29.11 | 26.28 | ||||||||||||||||
2016 | 4th quarter | 29.07 | 26.12 | 30.57 | 28.22 | |||||||||||||||
| 3rd quarter | 26.70 | 21.58 | 29.97 | 24.05 | ||||||||||||||||
| 2nd quarter | 25.20 | 21.01 | 28.58 | 23.29 | ||||||||||||||||
| 1st quarter | 25.13 | 20.95 | 28.58 | 23.68 | ||||||||||||||||
2015 | 4th quarter | 25.88 | 21.09 | 27.29 | 23.66 | |||||||||||||||
| 3rd quarter | 25.71 | 20.79 | 28.23 | 23.19 | ||||||||||||||||
| 2nd quarter | 27.65 | 22.82 | 30.08 | 25.46 | ||||||||||||||||
| 1st quarter | 27.40 | 23.16 | 30.31 | 27.54 | ||||||||||||||||
2014 | 4th quarter | 24.68 | 20.98 | 31.02 | 26.36 | |||||||||||||||
| 3rd quarter | 25.27 | 22.11 | 32.39 | 29.80 | ||||||||||||||||
| 2nd quarter | 25.86 | 22.22 | 35.95 | 30.35 | ||||||||||||||||
| 1st quarter | 28.10 | 23.88 | 38.36 | 33.13 | ||||||||||||||||
2013 | 4th quarter | 26.78 | 23.17 | 36.97 | 31.36 | |||||||||||||||
| 3rd quarter | 25.32 | 20.89 | 33.60 | 27.28 | ||||||||||||||||
| 2nd quarter | 23.48 | 20.36 | 30.65 | 26.75 | ||||||||||||||||
| 1st quarter | 23.67 | 20.26 | 31.72 | 26.60 | ||||||||||||||||
2012 | 20.33 | 18.27 | 26.81 | 23.52 | ||||||||||||||||
|
| |||||||||||||||||||
Annual Report 2016 243
Investor Relations 14.4
Euronext Amsterdam
Philips Group
Share price development in Euronext Amsterdamin EUR
2015 - 2016
| ||||||||||||||||||||||||||||||||||||||||||||||||
| PHIA | Jan | Feb | Mar | Apr | May | Jun | Jul | Aug | Sep | Oct | Nov | Dec | ||||||||||||||||||||||||||||||||||||
2016 | ||||||||||||||||||||||||||||||||||||||||||||||||
High | 24.50 | 24.33 | 25.13 | 25.20 | 24.33 | 24.11 | 24.39 | 26.18 | 26.70 | 27.73 | 27.90 | 29.07 | ||||||||||||||||||||||||||||||||||||
Low | 22.15 | 20.95 | 23.56 | 23.55 | 22.57 | 21.01 | 21.58 | 23.51 | 25.25 | 26.12 | 26.50 | 26.60 | ||||||||||||||||||||||||||||||||||||
Average | 22.98 | 22.47 | 24.37 | 24.50 | 23.34 | 22.80 | 23.15 | 25.05 | 26.08 | 26.67 | 27.20 | 28.18 | ||||||||||||||||||||||||||||||||||||
Average daily volume1) | 10.58 | 8.31 | 6.81 | 5.96 | 5.58 | 6.67 | 5.94 | 5.41 | 5.92 | 5.73 | 6.94 | 5.27 | ||||||||||||||||||||||||||||||||||||
2015 | ||||||||||||||||||||||||||||||||||||||||||||||||
High | 26.80 | 26.77 | 27.40 | 27.65 | 25.44 | 24.94 | 25.32 | 25.71 | 23.29 | 24.59 | 25.88 | 25.49 | ||||||||||||||||||||||||||||||||||||
Low | 23.16 | 24.54 | 25.98 | 25.66 | 24.24 | 22.82 | 22.38 | 21.94 | 20.79 | 21.09 | 24.40 | 23.19 | ||||||||||||||||||||||||||||||||||||
Average | 24.49 | 25.45 | 26.64 | 26.96 | 24.96 | 23.94 | 23.97 | 24.19 | 22.11 | 22.71 | 25.05 | 24.06 | ||||||||||||||||||||||||||||||||||||
Average daily volume1) | 9.26 | 5.64 | 5.86 | 7.66 | 6.96 | 8.79 | 7.30 | 6.88 | 6.75 | 6.00 | 6.08 | 6.05 | ||||||||||||||||||||||||||||||||||||
|
| |||||||||||||||||||||||||||||||||||||||||||||||
| 1) | In millions of shares |
New York Stock Exchange
Philips Group
Share price development in New York Stock Exchangein USD
2015 - 2016
| ||||||||||||||||||||||||||||||||||||||||||||||||
| PHG | Jan | Feb | Mar | Apr | May | Jun | Jul | Aug | Sep | Oct | Nov | Dec | ||||||||||||||||||||||||||||||||||||
2016 | ||||||||||||||||||||||||||||||||||||||||||||||||
High | 26.68 | 26.57 | 28.58 | 28.58 | 27.62 | 27.11 | 26.74 | 29.11 | 29.97 | 30.19 | 30.55 | 30.57 | ||||||||||||||||||||||||||||||||||||
Low | 24.04 | 23.68 | 26.08 | 26.74 | 24.97 | 23.29 | 24.05 | 26.28 | 28.34 | 28.43 | 28.61 | 28.22 | ||||||||||||||||||||||||||||||||||||
Average | 24.94 | 24.98 | 27.21 | 27.76 | 26.29 | 25.67 | 25.58 | 28.04 | 29.20 | 29.35 | 29.31 | 29.70 | ||||||||||||||||||||||||||||||||||||
Average daily volume1) | 1.72 | 1.73 | 1.71 | 1.26 | 1.00 | 1.23 | 1.98 | 1.92 | 1.41 | 1.10 | 1.41 | 1.45 | ||||||||||||||||||||||||||||||||||||
2015 | ||||||||||||||||||||||||||||||||||||||||||||||||
High | 30.31 | 30.10 | 29.80 | 30.08 | 28.77 | 27.99 | 27.81 | 28.23 | 25.86 | 26.94 | 27.29 | 27.14 | ||||||||||||||||||||||||||||||||||||
Low | 27.54 | 27.80 | 27.83 | 28.57 | 27.29 | 25.46 | 24.87 | 24.79 | 23.19 | 23.66 | 26.05 | 25.41 | ||||||||||||||||||||||||||||||||||||
Average | 28.49 | 28.96 | 28.85 | 29.17 | 27.90 | 26.83 | 26.35 | 26.84 | 24.75 | 25.50 | 26.82 | 26.21 | ||||||||||||||||||||||||||||||||||||
Average daily volume1) | 1.34 | 0.80 | 0.77 | 1.56 | 1.16 | 1.73 | 2.04 | 1.77 | 1.60 | 1.21 | 0.93 | 0.90 | ||||||||||||||||||||||||||||||||||||
|
| |||||||||||||||||||||||||||||||||||||||||||||||
| 1) | In millions of shares |
Philips Group
Share information
Share listings | Amsterdam, New York | |||
Ticker code | PHIA, PHG | |||
No. of shares issued at Dec. 31, 2016 | 930 million | |||
No. of shares outstanding issued at Dec. 31, 2016 | 922 million | |||
Market capitalization atyear-end 2016 | EUR 26.8 billion | |||
Industry classification | ||||
MSCI: Capital Goods | 20105010 | |||
ICB: Medical Equipment | 4535 | |||
Members of indices | AEX, NYSE, DJSI, and others | |||
244 Annual Report 2016
Investor Relations 14.4
Philips Group
Relative performance: Philips and AEX (indexed)
2016
Philips Group
Relative performance: Philips and Dow Jones Industrial Average (indexed)
2016
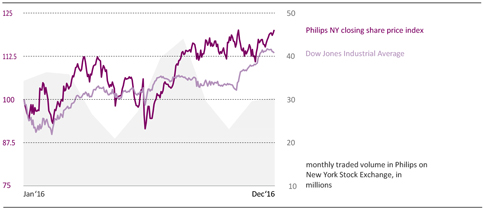
Philips Group
Relative performance: Philips and unweighted peer group index (indexed)1)
2016
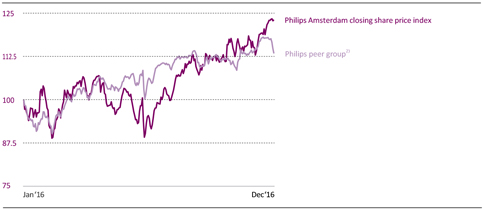
| 1) | The peer group companies are separately indexed, and then an unweighted average of these indexed values is used. |
| 2) | The peer group consists of: 3M, ABB, Danaher, Eaton, Electrolux, Emerson, General Electric, Hitachi, Honeywell, Johnson Control, Johnson & Johnson, Legrand, LG Electronics, Medtronic, Panasonic, Procter & Gamble, Schneider, Siemens, Smiths Group, Toshiba. The index shows the unweighted average closing share prices of the peer group. This graph is not linked to the TSR performance calculation as part of the Long-Term Incentive Plan. |
Annual Report 2016 245
Investor Relations 14.5
| Financial calendar | ||
Annual General Meeting of Shareholders | ||
Record date Annual General Meeting of Shareholders | April 13, 2017 | |
Annual General Meeting of Shareholders | May 11, 2017 | |
Quarterly reports | ||
First quarter results 2017 | April 24, 2017 | |
Second quarter results 2017 | July 24, 2017 | |
Third quarter results 2017 | October 23, 2017 | |
Fourth quarter results 2017 | January 23, 20181) | |
| 1) | Subject to final confirmation |
Shareholder services
Holders of shares listed on Euronext Amsterdam
Non-US shareholders and othernon-US interested parties can make inquiries about the Annual Report 2016 to:
Royal Philips
Annual Report Office
Philips Center, HBT 12
P.O. Box 77900
1070 MX Amsterdam, The Netherlands
E-mail:annual.report@philips.com
Communications concerning share transfers, lost certificates, dividends and change of address should be directed to:
ABN AMRO Bank N.V.
Department Equity Capital Markets/Corporate Broking
HQ7050
Gustav Mahlerlaan 10, 1082 PP Amsterdam
The Netherlands
Telephone:+31-20-34 42000
Fax:+31-20-62 88481
E-mail:corporate.broking@nl.abnamro.com
Holders of New York Registry shares
Holders of New York Registry shares and other interested parties in the US can make inquiries about the Annual Report 2016 to:
Citibank Shareholder Service
P.O. Box 43077 Providence, Rhode Island 02940-3077
Telephone:1-877-CITI-ADR (toll-free)
Telephone:1-781-575-4555 (outside of US)
Fax:1-201-324-3284
Website:www.citi.com/dr
E-mail:citibank@shareholders-online.com
Communications concerning share transfers, lost certificates, dividends and change of address should be directed to Citibank. The Annual Report on Form20-F is filed electronically with the US Securities and Exchange Commission.
International direct investment program
Philips offers a dividend reinvestment and direct share purchase plan designed for the US market. This program provides existing shareholders and interested investors with an economical and convenient way to purchase and sell Philips New York Registry shares and to reinvest cash dividends. Philips does not administer or sponsor the program and assumes no obligation or liability for the operation of the plan. For further information on this program and for enrollment forms, contact:
Citibank Shareholder Service
Telephone:1-877-248-4237(1-877-CITI-ADR)
Monday through Friday 8:30 AM EST
through 6:00 PM EST
Websitewww.citi.com/dr
E-mail:citibank@shareholders-online.com
or by writing to:
Citibank Shareholder Service
International Direct Investment Program
P.O. Box 2502, Jersey City, NJ07303-2502
2017 Annual General Meeting of Shareholders
The Agenda and the explanatory notes to the Agenda for the Annual General Meeting of Shareholders on May 11, 2017, will be published on the Company’s website.
For the 2017 Annual General Meeting of Shareholders, a record date of April 13, 2017 will apply. Those persons who, on that date, hold shares in the Company, and are registered as such in one of the registers designated by the Board of Management for the Annual General Meeting of Shareholders, will be entitled to participate in, and vote at, the meeting.
Investor Relations activities
From time to time the Company communicates with investors via road shows, broker conferences and a Capital Markets Day, announced in advance on the Company’s website. The purpose of these engagements is to inform the market of the results, strategy and decisions made, as well as to receive feedback from shareholders. Furthermore, the Company engages in bilateral communications with investors. These take place either at the initiative of the Company or at the initiative of investors. The Company is generally represented by its Investor Relations department during these interactions, however, on a limited number of occasions the Investor Relations department is accompanied by one or more members of the senior management. The subject matter of the bilateral communications ranges from individual queries from investors to more elaborate discussions following disclosures that the Company has made, such as its annual and quarterly reports. Also here, the Company is strict in its compliance with applicable rules and regulations on fair andnon-selective disclosure and equal treatment of shareholders.
246 Annual Report 2016
Investor Relations 14.6
More information on the activities of Investor Relations can be found in chapter 9, Corporate governance, of this report.
Analysts’ coverage
Philips is covered by approximately 24 analysts who frequently issue reports on the company. For a list of our current analysts, please refer to:www.philips.com/a-w/about/investor/shareholder-info/analyst-coverage.html
How to reach us
The registered office of Royal Philips is
High Tech Campus 5
5656 AE Eindhoven, The Netherlands
Switch board, telephone:+31-40-27 91111
Investor Relations contact
Royal Philips
Philips Center
P.O. Box 77900
1070 MX Amsterdam, The Netherlands
Telephone:+31-20-59 77222
Website:www.philips.com/investor
E-mail:investor.relations@philips.com
Pim Preesman
Head of Investor Relations
Telephone:+31-20-59 77222
Ksenija Gonciarenko
Investor Relations Manager
Telephone:+31-20-59 77055
Sustainability contact
Philips Group Sustainability
High Tech Campus 5 (room 2.67)
5656 AE Eindhoven, The Netherlands
Telephone:+31-40-27 83651
Website:www.philips.com/sustainability
E-mail:philips.sustainability@philips.com
Group Press Office contact
Royal Philips
Philips Center, HBT 19
Amstelplein 2
1096 BC Amsterdam, The Netherlands
E-mail:group.communications@philips.com
For media contacts please refer to:
www.newscenter.philips.com/main/standard/news/contacts
Dutch taxation
The statements below are only a general summary of certain material Dutch tax consequences for holders of common shares arenon-residents of the Netherlands based on present Dutch tax laws and the Tax Convention of December 18, 1992, as amended by the protocol that entered into force on December 28, 2004, between the United States of America and the Kingdom of the Netherlands (the US Tax Treaty) and are not to be read as extending by implication to matters not specifically referred to herein. As to individual tax consequences, investors in common shares should consult their own professional tax advisor.
A holder of common shares is an individual who receives income or derives capital gains from common shares and this income received or capital gains derived are attributable to past, present or future employment activities of such holder, the income of which is taxable in the Netherlands.
Dividend withholding tax
In general, a distribution to shareholders by a company resident in the Netherlands (such as the Company) is subject to a withholding tax imposed by the Netherlands at a rate of 15%. Share dividends paid out of the Company’spaid-in share premium recognized for Dutch tax purposes are not subject to the above-mentioned withholding tax. Share dividends paid out of the Company’s retained earnings are subject to dividend withholding tax on the nominal value of the shares issued. Pursuant to the provisions of the US Tax Treaty, a reduced rate may be applicable in respect of dividends paid by the Company to a beneficial owner holding directly 10% or more of the voting power of the Company, if such owner is a company resident in the United States (as defined in the US Tax Treaty) and entitled to the benefits of the US Tax Treaty.
Pursuant to Dutch anti-dividend stripping legislation, a holder of common shares who is the recipient of dividends will generally not be considered the beneficial owner of the dividends if (i) as a consequence of a combination of transactions, a person other than the recipient benefits, in full or in part, directly or indirectly, from the dividends; (ii) whereby such other person retains, directly or indirectly, an interest similar to that in the common shares on which the dividends were paid; and (iii) that other person is entitled to a credit, reduction or refund of dividend withholding tax that is less than that of the recipient.
Dividends paid to qualifying exempt US pension trusts and qualifying exempt US organizations are, under certain conditions, exempt from Dutch withholding tax under the US Tax Treaty. Qualifying exempt US pension trusts normally remain subject to withholding at the rate of 15% and are required to file for a refund of the tax withheld. Only if certain conditions are fulfilled, such pension trusts may be eligible for relief at source upon
Annual Report 2016 247
Investor Relations 14.7
payment of the dividend. However, for qualifying exempt US organizations no relief at source upon payment of the dividend is currently available; such exempt US organizations should apply for a refund of the 15% withholding tax withheld. Further, under certain circumstances, certain exempt organizations (e.g. pension funds) may be eligible for a refund of Dutch withholding tax upon their request pursuant to Dutch tax law. Under proposed Dutch tax law (not yet entered into force as per January 1, 2017), provided certain conditions are met, such (US) organizations may be eligible for relief at source upon request.
Upon request and under certain conditions, certain qualifyingnon-resident individual and corporate holders of common shares resident in EU/EEA member states or in a qualifyingnon-EU/EEA state may be eligible for a refund of Dutch dividend withholding tax to the extent that the withholding tax levied is higher than the personal and corporate income tax which would have been due if they were resident in the Netherlands.
The Company may, with respect to certain dividends received from qualifyingnon-Dutch subsidiaries, credit taxes withheld from those dividends against the Dutch withholding tax imposed on certain qualifying dividends that are redistributed by the Company, up to a maximum of the lesser of:
3% of the amount of qualifying dividends redistributed by the Company; and
3% of the gross amount of certain qualifying dividends received by the Company.
The reduction is applied to the Dutch dividend withholding tax that the Company must pay to the Dutch tax authorities and not to the Dutch dividend withholding tax that the Company must withhold.
Income and capital gains
Income and capital gains derived from the common shares by anon-resident individual ornon-resident corporate shareholder are generally not subject to Dutch income or corporation tax, unless (i) such income and gains are attributable to a (deemed) permanent establishment or (deemed) permanent representative in the Netherlands; or (ii) the shareholder is entitled to a share in the profits of an enterprise or (in the case of anon-resident corporate shareholder only) a co-entitlement to the net worth of an enterprise that is effectively managed in the Netherlands (other than by way of securities) and to which enterprise the common shares are attributable; or (iii) such income and capital gains are derived from a direct, indirect or deemed substantial participation in the share capital of the company (such substantial participation not being a business asset), and, in the case of anon-resident corporate shareholder only, it being held with the primary aim or one of the primary aims to avoid the levy of income tax or dividend withholding tax from another person and is not put in place without valid commercial reasons that reflect economic reality; or (iv) in the case of anon-resident corporate shareholder, such shareholder is a resident of Aruba, Curacao or Saint Martin with a permanent establishment or permanent representative in Bonaire, Eustatius or Saba to which the common shares are attributable and certain conditions are met; or (v) in the case of anon-resident individual, such individual derives income or capital gains from the common shares that are taxable as benefits from ‘miscellaneous activities’ in the Netherlands (resultaat uit overige werkzaamheden, as defined in the Dutch Income Tax Act 2001), which includes the performance of activities with respect to the common shares that exceed regular portfolio management.
In general, a holder of common shares has a substantial participation if he holds either directly or indirectly and either independently or jointly with his partner (as defined in the Dutch Income Tax Act 2001), the ownership of, or certain other rights over, at least 5% of the total issued share capital or total issued particular class of shares of the Company or rights to acquire direct or indirect shares, whether or not already issued, that represent at any time 5% or more of the total issued capital (or the total issued particular class of shares) or the ownership of certain profit participating certificates that relate to 5% or more of the annual profit or to 5% or more of the liquidation proceeds. A shareholder will also have a substantial participation in the Company if one or more of certain relatives of the shareholder hold a substantial participation in the Company. A deemed substantial participation amongst others exists if (part of) a substantial participation has been disposed of, or is deemed to have been disposed of, on a non-recognition basis.
Estate and gift taxes
No estate, inheritance or gift taxes are imposed by the Netherlands on the transfer or deemed transfer of common shares by way of gift by or on the death of a shareholder if, at the time of the death of the shareholder or the gift of the common shares (as the case may be), such shareholder is not a (deemed) resident of the Netherlands.
Inheritance or gift taxes (as the case may be) are due, however, if such shareholder:
has Dutch nationality and has been a resident of the Netherlands at any time during the ten years preceding the time of their death or gift; or
does not have Dutch nationality but has been a resident of the Netherlands at any time during the twelve months preceding the time of the gift (for Netherlands gift taxes only).
United States Federal Taxation
This section describes the material United States federal income tax consequences to a US holder (as defined below) of owning common shares. It applies only if the common shares are held as capital assets for
248 Annual Report 2016
Investor Relations 14.7
tax purposes. This section does not apply to a member of a special class of holders subject to special rules, including:
a dealer in securities,
a trader in securities that elects to use amark-to-market method of accounting for securities holdings,
atax-exempt organization,
a life insurance company,
a person liable for alternative minimum tax,
a person who actually or constructively owns 10% or more of our voting stock,
a person who holds common shares as part of a straddle or a hedging or conversion transaction,
a person who purchases or sells common shares as part of a wash sale for tax purposes, or
a person whose functional currency is not the US dollar.
This section is based on the Internal Revenue Code of 1986, as amended, its legislative history, existing and proposed regulations, published rulings and court decisions, all as currently in effect, as well as on the US Tax Treaty. These laws and regulations are subject to change, possibly on a retroactive basis.
If a partnership holds the common shares, the United States federal income tax treatment of a partner will generally depend on the status of the partner and the tax treatment of the partnership. A partner in a partnership holding the common shares should consult its tax advisor with regard to the United States federal income tax treatment of an investment in the common shares.
A US holder is defined as a beneficial owner of common shares that is:
a citizen or resident of the United States,
a domestic corporation,
an estate whose income is subject to United States federal income tax regardless of its source, or
a trust if a United States court can exercise primary supervision over the trust’s administration and one or more United States persons are authorized to control all substantial decisions of the trust.
A US holder should consult its own tax advisor regarding the United States federal, state and local and other tax consequences of owning and disposing of common shares in its particular circumstances.
This discussion addresses only United States federal income taxation.
Taxation of Dividends
Under the United States federal income tax laws, the gross amount of any dividend paid in stock or cash out of our current or accumulated earnings and profits (as determined for United States federal income tax purposes) is subject to United States federal income taxation. For anon-corporate US holder, dividends paid that constitute qualified dividend income will be taxable at the preferential rates applicable to long-term capital gains, provided that thenon-corporate US holder holds the common shares for more than 60 days during the121-day period beginning 60 days before theex-dividend date and provided it meets other holding period requirements. Dividends paid with respect to the common shares generally will be qualified dividend income1). A US holder must include any Dutch tax withheld from the mainstreamingdividend payment in this gross amount even though it does not in fact receive it. The dividend is taxable to a US holder when it receives the dividend, actually or constructively. The dividend will not be eligible for the dividends-received deduction generally allowed to United States corporations in respect of disclosuredividends received from other United States corporations. For dividend payments made in euro, the amount of the dividend distribution that a US holder must include in its income will be the US dollar value of the euro payments made, determined at the spot euro/ US dollar rate on environmental, socialthe date the dividend distribution can be included in its income, regardless of whether the payment is in fact converted into US dollars. Generally, any gain or loss resulting from currency exchange fluctuations during the period from the date a US holder includes the dividend payment in income to the date a US holder converts the payment into US dollars will be treated as ordinary income or loss and governance performance.will not be eligible for the special tax rate applicable to qualified dividend income. The gain or loss generally will be income or loss from sources within the United States for foreign tax credit limitation purposes. Distributions in excess of current and accumulated earnings and profits, as determined for United States federal income tax purposes, will be treated as anon-taxable return of capital to the extent of a US holder’s basis in the common shares and thereafter as capital gain. However, we do not expect to calculate earnings and profits in accordance with United States federal income tax principles. Accordingly, US holders should expect to generally treat distributions we make as dividends.
Subject to certain limitations, the Dutch tax withheld in accordance with the US Tax Treaty and paid over to the Netherlands will be creditable or deductible against a US holder’s United States federal income tax liability. However, Dutch withholding tax may not be creditable or deductible to the extent that we reduce (as described above under “Dutch taxation - Dividend withholding tax”) the amount of withholding tax paid over to the Netherlands by crediting taxes withheld from certain dividends received by us. Special rules apply in determining the foreign tax credit limitation with respect to dividends that are subject to the preferential tax rates. To the extent a refund of the tax withheld is available under Dutch law, or under the US Tax Treaty, the amount of tax withheld that is refundable will not be eligible for credit against United States federal income tax liability. Dividends will be income from sources outside the United States, and depending on a holder’s circumstances, will generally be either
Annual Report 2016 249
Investor Relations 14.7
“passive” or “general” income for the purposes of computing the foreign tax credit allowable to the holder.
Taxation of Capital Gains
A US holder that sells or otherwise disposes of its common shares will recognize capital gain or loss for United States federal income tax purposes equal to the difference between the US dollar value of the amount that it realizes and its tax basis, determined in US dollars, in its common shares. Capital gain of a non-corporate US holder is generally taxed at preferential tax rates where the holder has a holding period greater than one year2). The gain or loss will generally be income or loss from sources within the United States for foreign tax credit limitation purposes.
PFIC Rules
We do not believe that the common shares will be treated as stock of a passive foreign investment company, or PFIC, for United States federal income tax purposes, but this conclusion is a factual determination that is made annually and thus is subject to change. If we are treated as a PFIC, unless a US holder elects to be taxed annually on amark-to-market basis with respect to the common shares, gain realized on the sale or other disposition of the common shares would in general not be treated as capital gain. Instead a US holder would be treated as if it had realized such gain and certain “excess distributions” ratably over the holding period for the common shares and would be taxed at the highest tax rate in effect for each such year to which the gain was allocated, in addition to which an interest charge in respect of the tax attributable to each such year would apply. Any dividends received by a US holder will not be eligible for the special tax rates applicable to qualified dividend income if we are treated as a PFIC with respect to such US holder either in the taxable year of the distribution or the preceding taxable year, but instead will be taxable at rates applicable to ordinary income and subject to the excess distribution regime described above.
| 1) | In addition, a US holder that is an individual or estate, or a trust that does not fall into a special class of trusts that is exempt from such tax, is subject to a 3.8% tax on the lesser of (1) the US holder’s “net investment income” for the relevant taxable year and (2) the excess of the US holder’s modified adjusted gross income for the taxable year over a certain threshold (the “Medicare tax”). A US holder’s net investment income generally includes its dividend income. |
| 2) | In addition, the gain or loss is generally included in a US holder’s net investment income, which may be subject to a 3.8% tax as described in the discussion of the Medicare tax under the heading – “Taxation of Dividends”. |
Fees and Charges Payable by a Holder of New York Registry Shares
Citibank, N.A., as the US registrar, transfer agent, paying agent and shareholder servicing agent (“Agent”) under Philips’ New York Registry Share program (the “Program”), collects fees for delivery and surrender of New York Registry Shares directly from investors depositing ordinary shares or surrendering New York Registry Shares for the purpose of withdrawal or from intermediaries acting for them. The Agent collects fees for making distributions to investors by deducting those fees from the amounts distributed or by selling a portion of the distributable property to pay the fees.
The charges of the Agent payable by investors are as follows:
The New York Transfer Agent charges shareholders a fee of up to USD 5.00 per 100 shares for the exchange of New York Registry shares for ordinary shares and vice versa.
Green Innovation
Green Innovation is a subset of Sustainable Innovation and is defined as all R&D activities directly contributing to the development of Green Products and Solutions or Green Technologies; it contributes to SDG 12. This means all products, systems or services that demonstrate a measurable positive impact on energy efficiency (10% or greater than previous products or legal requirements), and preferably also in one or more green focal areas: Circularity, Weight & Materials, Packaging, and Substances. Green Innovation for Lighting is calculated by multiplying the total R&D spend by percentages for sustainable innovation per Business Group (LED 100%, Professionals 95%, Home is 97% and Lamps 15%). These percentages are an assessment of the contribution of R&D projects to sustainable innovation and are calculated based on prior-year innovation budgets. As part of this assessment we applied the assumptions that the prior-year percentages are still applicable for this reporting year and that all innovation in LED andLED-related products and services are considered as sustainable.
Environmental data
All environmental data from manufacturing operations, except process chemicals, are reported on a quarterly basis in our sustainability reporting and validation tool, according to company guidelines that include definitions, procedures and calculation methods. Process chemicals are reported on ahalf-yearly basis.
Internal validation processes have been implemented and peer audits performed to ensure consistent data quality and to assess the robustness of data reporting systems.
These environmental data from manufacturing are tracked and reported to measure progress against our Sustainable Operations targets.
Reporting on ISO 14001 certification is based on manufacturing units reporting in the sustainability reporting system.
Annual Report 2016 215
Sustainability statements 12.1.8
Operational carbon footprint
Philips reports in line with the Greenhouse Gas Protocol (GHGP). The GHGP distinguishes three scopes, as described below. The GHGP requires businesses to report on the first two scopes to comply with the GHGP reporting standards. As per the updated GHGP Scope 2 reporting guidance, from 2015 onward our scope 2 emissions reporting includes both themarket-based method and the location-based method. The market-based method of reporting will serve as our reference for calculating our total operational carbon footprint.
| • | Scope 1 – direct CO2 emissions – is reported on in full, with details of direct emissions from our industrial andnon-industrial sites. Emissions from industrial sites, which consist of direct emissions resulting from processes and fossil fuel combustion on site, are reported in the sustainability reporting system. Energy use and CO2 emissions fromnon-industrial sites are based on actual data where available. If this is not the case, they are estimated based on average energy usage per square meters, taking the geographical location and building type of the site into account. |
| • | Scope 2 – indirect CO2 emissions – is reported on in full, with details of indirect emissions from our industrial andnon-industrial sites. CO2 emissions resulting from purchased electricity, steam, heat and other indirect sources are reported in the sustainability reporting system. The indirect emissions of sites not yet reporting are calculated in the same manner as described in Scope 1. |
The location-based method of scope 2 reporting reflects the average emissions intensity of grids on which energy consumption occurs (using mostlygrid-average emission factor data). For this method our emission factors derive from the International Energy Agency (IEA) 2015 and are based on grid averages.
| • | The market-based method of scope 2 reporting allows use of an emission factor that is specific to the energy purchased. Emissions intensity of consumed energy can differ based on contractual instruments used. For example,so-called ‘green electricity contracts’ guarantee the purchaser will be supplied with electricity coming from renewable sources which typically lower emissions per energy unit generated. In the market-based method Philips will account for renewable electricity with an emission factor of 0 grams CO2 per kWh. All renewable electricity claimed by Philips is sourced from the same energy market where the electricity-consuming operations are located, and is tracked and redeemed, retired, or cancelled solely on behalf of Philips. All certificates were obtained through procurement ofGreen-e certified Renewable Energy Certificates (RECs) in the United States and European Guarantees of Origin from the Association of Issuing Bodies (AIB) of the European Energy Certificate System (EECS). |
| • | Scope 3 – other CO2 emissions related to activities not owned or controlled by the Group – is reported on for our business travel and distribution activities. |
The Philips operational carbon footprint (Scope 1, 2 and 3) is calculated on a quarterly basis and includes the emissions from our:
Industrial sites – manufacturing and assembly sites
Non-industrial sites – offices, warehouses, IT centers and R&D facilities
Business travel – lease and rental cars and airplane travel
Logistics – air, ocean and road transport
All emission factors used to transform input data (for example, amount of tonne-kilometers transported) into CO2 emissions have been updated from the previously used DEFRA (UK Department for Environment, Food & Rural Affairs) 2007 and bespoke emission factors to the applicable DEFRA 2015 emission factors for each year respectively. The total CO2 emission resulting from these calculations serve as input for scope 1, 2 and 3.
Commuting by our employees, upstream distribution (before suppliers ship to us), outsourced activities and emissions resulting from product use by our customers are not included in our operational carbon footprint. The calculations for business travel by lease car are based on actual fuel usage and for travel by rental car they are based on distance travelled. Taxis and chauffeur driven cars used for business travel are not included in the calculations. Emissions from business travel by airplane are calculated by the supplier based on mileage flown and emission factors from DEFRA, distinguishing between short, medium and long-haul flights. Furthermore, emissions from air freight for distribution are calculated based on the amount of tonne-kilometers transported between airports (distinguishing between short, medium and long-haul flights), including an estimate (based on actual data of the lanes with the largest volumes) for trucking from sites and distribution centers to airports and vice versa. Express shipments are generally a mix of road and air transport, depending on the distance.
It is therefore assumed that shipments across over less than 600 km are transported by road and the rest by air (those emissions by air are calculated in the same way as air freight). For sea transport, only data on transported volume were available so an estimate had to be made about the average weight of a container. Transportation to and from ports is not registered. This fore and aft part of sea transport was estimated to be around 3% of the total distance (based on actual data of the lanes with the largest volumes), consisting of a mix of modalities, and was added to the total emissions accordingly. CO2 emissions from road transport were also calculated based on tonne-kilometers. Return travel of vehicles is not included in the data for sea and road distribution.
216 �� Annual Report 2016
Sustainability statements 12.1.8
Employee Engagement Index (EEI)
The Employee Engagement Index (EEI) is the single measure of the overall level of employee engagement at Philips. It is a combination of perceptions and attitudes related to employee satisfaction, commitment and advocacy.
The reported 2016 figure is based on My Accelerate Survey in Royal Philips HealthTech businesses. This survey is conducted by Expert Training Systems (ETS). The total score of the employee engagement is an average of quarterly results of the survey. The results are calculated by taking the average of the answered questions of the surveys.
12.1.9 Sustainability governance
Sustainability is strongly embedded in our core business processes, like innovation (EcoDesign), sourcing (Supplier Sustainability Program), manufacturing (Sustainable Operations) and Logistics (Green Logistics) and projects like the Circular Economy initiative.
In Royal Philips, the Sustainability Board is the highest governing sustainability body and is chaired by the Chief Strategy and Innovation Officer and member of the Executive Committee. Three other Executive Committee members sit on the Sustainability Board together with segment and functional executives. The Sustainability Board convenes four times per year, defines Philips’ sustainability strategy and programs, monitors progress and takes corrective action where needed.
Progress on Sustainability is communicated internally on a quarterly basis to Philips employees and at least annually in the Executive Committee and Supervisory Board. Please refer to the Philips Lighting Annual Report to learn about their sustainability governance.
12.1.10 External assurance
EY has provided reasonable assurance on whether the information inchapter 12, Sustainability statements, of this report andsection 2.2, Social performance, of this report andsection 2.3, Environmental performance, of this report presents fairly, in all material respects, the sustainability performance in accordance with the reporting criteria. Please refer tosection 12.5, Assurance report of the independent auditor, of this report.
This section provides summarized information on contributions made on an accruals basis to the most important economic stakeholders as a basis to drive economic growth. For a full understanding of each of these indicators, see the specific financial statements and notes in this report.
Philips Group
Distribution of direct economic benefitsin millions of EUR
2014 - 2016
|
| |||||||||||
| 2014 | 2015 | 2016 | ||||||||||
|
| |||||||||||
Suppliers: goods and services | 13,185 | 14,388 | 13,904 | |||||||||
Employees: salaries and wages | 5,018 | 5,533 | 5,832 | |||||||||
Shareholders: distribution from retained earnings | 729 | 730 | 732 | |||||||||
Government: corporate income taxes | 26 | 239 | 327 | |||||||||
Capital providers: net interest | 251 | 302 | 327 | |||||||||
|
| |||||||||||
Total purchased goods and services as included in cost of sales amounted to EUR 13.9 billion, representing 57% of total revenues of the Philips Group. Of this amount, approximately 69% was spent with global suppliers, the remainder with local suppliers.
In 2016, salaries and wages totaled EUR 5.8 billion. This amount is some EUR 300 million higher than in 2015, mainly caused by the increased number of employees and currency effects. Seenote 6, Income from operations for more information.
Philips’ shareholders were given EUR 732 million in the form of a dividend, the cash portion of which amounted to EUR 330 million.
Income taxes amounted to EUR 327 million, compared to EUR 239 million in 2015. The effective income tax rate was lower than the weighted average statutory income tax rate in 2016, mainly due to recognition of deferred tax assets andnon-taxable income, largely attributable to favorable tax regulations relating to R&D investments. These effects were partly offset by non-deductible expenses.
For a further understanding, seenote 8, Income taxes.
Philips supports global initiatives of the OECD (Organization for Economic Cooperation and Development) and UN (United Nations) to promote tax transparency and responsible tax management, taking into account the interest of various stakeholders, such as governments, shareholders, customers and the communities in which Philips operates. For more information, please refer toPhilips’ Tax Principles.
In 2016, both Royal Philips HealthTech businesses and Philips Lighting launched their next5-year sustainability programs. This section provides additional information on (some of) the Social performance parameters reported insection 2.2, Social performance, of this report.
12.3.1 Building employability
Other programs
At Philips, our vision to offer the best place to work for people who share our passion is not limited to employees on our payroll. In the Netherlands, for example, we run a special employment program, WGP
Annual Report 2016 217
Sustainability statements 12.3.1
(Werkgelegenheidsplan, or Philips Employment Scheme), to offer vulnerable groups of external jobseekers a work experience placement, usually combined with training. Since the scheme’s launch in 1983, nearly 13,000 people have participated, and around 70% found a regular job after taking part in the program. In 2016, Philips employed 140 people via the WGP program, including 25 people with autism. As we move into 2017, we will continue to offer an environment for all of our people to thrive and grow.
12.3.2 People development
Our talent development focuses on all aspects of the 70:20:10 learning framework.
70% Learning through critical career experiences
Philips is on a multi-year journey to evolve our culture to focus on experience-based career development, giving our people the opportunity to identify and gain the experiences necessary to support our health technology strategy and strengthen their employability. By identifying the roles and experiences critical to our business strategy, we clarify development areas and transferrable skills in support of cross-functional, lateral, traditional, as well asnon-traditional career opportunities for our people.
As of 2016, our people are able to view the succession plans in which they are included. In 2017 we will continue on our journey towards an experience-based careers culture through:
Enabling and empowering our people with real-time, integrated tools and resources to plan and manage their career
Building awareness of experience-based careers for our people through stories and communications, prioritizing critical roles and capabilities that are directly in support of our health technology strategy
Facilitated‘gig-board’ of extra-curricular roles to increase flexible teaming across organization structures and provide opportunity for further development within existing roles
20% Guidance through coaching and mentoring
In 2016, Philips University launched a program for leaders to help them get the most out of our people, help them grow, and have meaningful career conversations. In 2017 we will drive further initiatives focused on:
Strengthening theemployee-and-manager career partnership with clear accountabilities
Equipping managers as effective career coaches who will have transparent career dialogues with their team, with differentiated development for deep specialists and broad leaders
10% Learning through formal learning
In 2016, more than 1,900 new courses were made available by Philips University. Byyear-end, over 86,000 employees had enrolled for courses with Philips University. In total, some 1.2 million hours were spent on training through Philips University in 2016, with some 580,000 training completions.
12.3.3 Employee volunteering
In North America, thePhilips Cares program provides ways for employees to work together to improve people’s lives by creating healthy, sustainable communities. This can take many forms: from helping a child to excel in math, or providing safety and energy-efficient home improvements for the disadvantaged, to raising awareness about the importance of cardiac health. In 2016 alone, more than 9,500 employee volunteers participated in community outreach projects that suited their needs, schedules, and passions individually as well as through partnerships with organizations such as the American Heart Association, International Medical Equipment Collaborative (IMEC), and the March of Dimes.
Since Q4 2016, all of our employees are now able to take 1 day per year to support charitable endeavors through volunteering. For example, in the Benelux 70 of our people were trained in resuscitation (CPR) by the Dutch Hartstichting (heart foundation), enabling them to provide support in the critical first period of a cardiac arrest.
12.3.4 Health and Safety performance
In 2016, we recorded 174 LWIC, i.e. occupational injury cases where the injured person is unable to work one or more days after the injury. This represents a significant decrease compared with 213 in 2015. The LWIC rate decreased to 0.18 per 100 FTEs, compared with 0.21 in 2015. The number of Lost Workdays caused by injuries decreased by 1,253 days (16%) to 6,728 days in 2016.
Additionally, in 2016, we recorded 395 TRC’s, i.e. cases where the injured employee is unable to work one or more days, or had medical treatment or sustained an industrial illness.
In 2016, we focused our efforts not only on traditional process and equipment safety improvements, but also on a proactive cultural transformation through Behavior Based Safety (BBS). BBS requires a fundamental shift in how we think and act about Health and Safety before an injury occurs. Our new company program, based on an internal best practice, was deployed and implemented globally across many factories in 2016 including those in China, Asia Pacific and the USA. We believe this program will continue to drive down our workplace injuries and be a key pillar towards reaching our goal of a 25% reduction in total injuries by 2020.
218 Annual Report 2016
Sustainability statements 12.3.4
Philips Group
Lost workday injuriesper 100 FTEs
2012 - 2016
|
| |||||||||||||||||||
| 2012 | 2013 | 2014 | 2015 | 2016 | ||||||||||||||||
|
| |||||||||||||||||||
Personal Health | 0.39 | 0.33 | 0.16 | 0.16 | 0.15 | |||||||||||||||
Diagnosis & Treatment | 0.22 | 0.23 | 0.27 | 0.20 | 0.36 | |||||||||||||||
Connected Care & Health Informatics | 0.16 | 0.05 | 0.18 | 0.16 | 0.15 | |||||||||||||||
HealthTech Other | 0.14 | 0.12 | 0.11 | 0.13 | 0.10 | |||||||||||||||
Lighting | 0.47 | 0.42 | 0.37 | 0.34 | 0.22 | |||||||||||||||
Continuing operations | 0.31 | 0.27 | 0.23 | 0.21 | 0.18 | |||||||||||||||
Discontinued operations | 0.55 | 0.37 | 0.25 | 0.27 | 0.32 | |||||||||||||||
|
| |||||||||||||||||||
Philips Group | 0.31 | 0.28 | 0.23 | 0.22 | 0.19 | |||||||||||||||
|
| |||||||||||||||||||
Philips Group
Total recordable casesper 100 FTEs
2016
| 2016 | ||||
Personal Health | 0.33 | |||
Diagnosis & Treatment | 0.65 | |||
Connected Care & Health Informatics | 0.67 | |||
HealthTech Other | 0.27 | |||
Lighting | 0.50 | |||
Continuing operations | 0.41 | |||
Discontinued operations | 0.44 | |||
Philips Group | 0.41 | |||
Diagnosis & Treatment businesses
In the Diagnosis & Treatment businesses segment Health and Safety showed a decrease in performance in 2016 with 40 LWIC compared to 21 in 2015. The LWIC rate increased to 0.36 compared to 0.20 in 2015. The total number of recordable cases for the Diagnosis & Treatment businesses segment was 73 in 2016.
Connected Care & Health Informatics businesses
Health and Safety performance in the Connected Care & Health Informatics businesses segment continued to improve in 2016 with 5 LWIC in 2016 compared to 6 in 2015. Correspondingly, the LWIC rate decreased to 0.15 in 2016 compared to 0.16 in 2015. This was primarily driven by our global patient monitoring businesses. The total number of recordable cases for the Connected Care & Health Informatics businesses segment was 23 in 2016.
Personal Health businesses
The Personal Health businesses segment showed stable performance in Health and Safety with 21 LWIC in 2016, the same number as in 2015. The LWIC rate improved from 0.16 in 2015 to 0.15 in 2016. The Personal Health businesses segment had 46 recordable cases in 2016.
Lighting
Lighting showed an overall improvement while recording 71 LWIC compared to 119 in 2015. As a result the LWIC rate improved to 0.22 (0.34 in 2015). In 2016, Lighting had 156 reportable cases. Lighting introduced a new safety program in 2015 focusing on preventing injuries.
12.3.5 General Business Principles
A total of 503 concerns were reported over the course of 2016 via the Philips Ethics Line and through our network of GBP Compliance Officers, of which 164 related to Philips Lighting. The previous reporting period (2015) saw a total of 447 concerns, 135 of which related to Philips Lighting. Overall, we saw an increase of 13% in the total number of reports (11% for Royal Philips versus 21% for Philips Lighting).
This is a continuation of the upward trend reported since 2014, the year in which Philips updated its General Business Principles and deployed the related communication campaign, although the overall increase in the number of complaints reported has slightly declinedyear-on-year (2015: 14%). We believe this trend is in line with our multi-year efforts to encourage our employees to speak up, and we are now approaching a normalized level of reported concerns annually. The relatively larger increase in the number of concerns that relate to Philips Lighting is expected to relate, at least in part, to the separation event and the related corporate activities.
The upward trend in the number of concerns can primarily be attributed to significantly more concerns being reported in the North American (NA) region, making up 38% of the total number of reports in 2016 (2015: 31%). The number of concerns reported in Latin America once again declinedyear-on-year to 19% of the total number of complaints, compared with 25% in 2015. In percentage terms, Europe, Middle East & Africa (EMEA) and Asia Pacific (APAC) remained quite stable, representing 20% and 23% of the total number of complaints respectively (2015: 21% and 20%).
In keeping with a trend that became visible in 2015, we again saw a more even distribution in reporting across the four regions. While the Americas were historically dominant in terms of number of cases reported, EMEA and APAC have now reached the same level as Latin America. We believe this to be as a result of significant communication efforts in addition to our Global GBP Communications campaign, especially in the APAC region, improving employees’ awareness of their rights with regard to the GBP, and the reporting facilities available to them.
Annual Report 2016 219
Sustainability statements 12.3.5
Philips Group
Breakdown of reported GBP concernsin number of reports
2013 - 2016
|
| |||||||||||||||
| 2013 | 2014 | 2015 | 2016 | |||||||||||||
|
| |||||||||||||||
Health & Safety | 3 | 10 | 9 | 16 | ||||||||||||
Treatment of employees | 203 | 203 | 242 | 276 | ||||||||||||
- Collective bargaining | 5 | — | — | 2 | ||||||||||||
- Equal and fair treatment | 80 | 72 | 44 | 73 | ||||||||||||
- Employee development | 4 | — | 2 | 15 | ||||||||||||
- Employee privacy | 1 | 3 | 8 | 4 | ||||||||||||
- Employee relations | 5 | 6 | — | 20 | ||||||||||||
- Respectful treatment | 84 | 93 | 111 | 107 | ||||||||||||
- Remuneration | 15 | 11 | 9 | 11 | ||||||||||||
- Right to organize | — | — | — | — | ||||||||||||
- Working hours | 3 | 5 | 2 | 8 | ||||||||||||
- HR other | 6 | 13 | 66 | 36 | ||||||||||||
Legal | 9 | 30 | 35 | 32 | ||||||||||||
Business Integrity | 109 | 110 | 138 | 144 | ||||||||||||
Supply management | 5 | 6 | 6 | 13 | ||||||||||||
IT | 6 | 7 | 4 | 10 | ||||||||||||
Other | — | 27 | 13 | 12 | ||||||||||||
|
| |||||||||||||||
Total | 335 | 393 | 447 | 503 | ||||||||||||
|
| |||||||||||||||
Most common types of concerns reported
Treatment of employees
As in previous years, the most commonly reported type of concern related to the category Treatment of employees. In 2016 there were 276 reports in this category, compared to 242 in 2015. This represents 55% of the total number of concerns, which is a slight increase from 2015 (54%).
Two subcategories, Respectful treatment and Equal and fair treatment, make up just over 65% of the concerns related to Treatment of employees. The Respectful treatment category generally relates to concerns about verbal abuse, (sexual) harassment, and hostile work environments. Equal and fair treatment primarily addresses favoritism, and matters of discrimination and unfair treatment in the workplace. 79% of the cases in these categories originated from the Americas, which is slightly more than in 2015 (76%).
Business integrity
The second most reported type of concern relates to Business Integrity, which made up 29% of the total cases reported. This is slightly less than in 2015, when the percentage was 31%. These concerns originated from the APAC region (45%), followed by EMEA (33%), Latin America (14%) and North America (8%).
Substantiated/unsubstantiated concerns
Of the 503 cases reported in 2016, 137 are still pending closure, in particular those that were filed towards the end of the year. The table below gives an overview of the number of reported concerns that were substantiated (i.e. found to constitute a breach of our General Business Principles) by the subsequent investigation.
Of the 366 reports investigated (267 in 2015), 115 were substantiated, which represents 31% of the total reported and closed (34% in 2015). This is also shown in the table below. Notably, while in 2015 39% of the Treatment of employee cases were substantiated, this percentage dropped to 28% in 2016 (2014: 22%, 2013: 20%). On the other hand, 40% of the Business Integrity reports were closed as substantiated in 2016, compared with 21% in 2015 (2014: 36%, 2013: 50%).
In addition to the above, 174 concerns that were still open at the end of 2015 were closed during 2016. 37% of these concerns were substantiated after investigation.
Of the 179 closed concerns that were substantiated, 100 were followed up with disciplinary measures varying from termination of employment and written warnings to training and coaching. In other cases, corrective action was taken, which varied from strengthening the business processes to increasing awareness of the expected standard of business conduct.
12.3.6 The Philips Foundation
The Philips Foundation was established in 2014 and is a registered charity that strives to improve the lives of people in communities in need. The Philips Foundation seeks to make use of the expertise of partners, visionaries and innovators and the innovation capabilities of Philips to create lasting impact. In 2016, the Philips Foundation continued to build its portfolio of projects and partners in the areas of community
Philips Group
Classification of the new concerns investigatedin number of reports
2014 - 2016
|
| |||||||||||||||||||||||
| 2014 | 2015 | 2016 | ||||||||||||||||||||||
|
| |||||||||||||||||||||||
| substantiated | unsubstantiated | substantiated | unsubstantiated | substantiated | unsubstantiated | |||||||||||||||||||
|
| |||||||||||||||||||||||
Health & Safety | 1 | 7 | 3 | 4 | 3 | 4 | ||||||||||||||||||
Treatment of employees | 32 | 112 | 62 | 95 | 64 | 164 | ||||||||||||||||||
Legal | 4 | 9 | 4 | 9 | 5 | 14 | ||||||||||||||||||
Business Integrity | 25 | 45 | 16 | 62 | 38 | 56 | ||||||||||||||||||
Supply Management | 1 | — | — | 1 | 1 | 7 | ||||||||||||||||||
IT | 2 | — | — | 2 | 1 | 3 | ||||||||||||||||||
Other | 4 | 18 | 1 | 8 | 3 | 3 | ||||||||||||||||||
|
| |||||||||||||||||||||||
Total | 69 | 191 | 86 | 181 | 115 | 251 | ||||||||||||||||||
|
| |||||||||||||||||||||||
220 Annual Report 2016
Sustainability statements 12.3.6
development and social entrepreneurship, as well as in our approach towards disaster relief. Royal Philips and Philips Lighting supported the program of the Philips Foundation with a donation of EUR 10 million in 2016 and provided the operating staff, paymentin-kind and the expert support of skilled employees who support the Foundation’s program for part of their time.
A highlight of the year was the launch of a partnership with Ashoka, one of the world’s largest networks of social entrepreneurs, that identifies and invests in social entrepreneurs helping them to bring their ideas for solving social problems to scale. Through a six month ‘globalizer’ program, 12 social entrepreneurs were supported by advisory teams – involving 24 Philips volunteers to build their impact scaling plan. This culminated in athree-day summit where the social entrepreneurs were able to pitch their impact plans to a large group of senior experts, such as social investors, public sector representatives and Philips executives.
We additionally worked on strengthening our partnerships with the Red Cross and UNICEF. The partnership with the Red Cross focuses on exploring innovations that could assist in providing immediate relief to people in regions affected by humanitarian crises including natural disasters. We are working with the Netherlands Red Cross and the Ivory Coast Red Cross on a project in Ivory Coast to strengthen the resilience of a community in the Blolequin region with a focus on the health of mothers and children. The Philips Foundation and UNICEF have partnered to develop healthcare innovations for the first 1,000 days of children’s lives. We are supporting UNICEF’s Global Innovation Center and are a lead partner in the Kenya Maker for Maternal, Newborn and Child Health Project in Nairobi, which focuses on developing and deploying solutions that improve access to healthcare for mothers and their children inlow-resource settings.
In addition, 36 local projects have been approved to be set up throughout the world. These projects are organized via the local Philips organization and NGO partner and funded by the Philips Foundation. These projects offer employee engagement opportunities including skilled expert volunteering. Employee donations were also a large part of the Philips Foundation’s response to the earthquakes in Ecuador, Japan and Italy as well as Hurricane Matthew in the USA. Along with ourco-creation projects we were able to respond to disasters around the world via our partnership with the Red Cross and global fundraisers, through which we raised a total of more than EUR 80,000 – a combination of employee donations and foundation matching.
More information about the Philips Foundation, its purpose and scope as well as the Philips Foundation Annual Report 2015 can be foundhere.
Examples of innovation projects supported by the Philips Foundation
The Philips Foundation, CurArte Foundation and Hospital Vall d’Hebrón teamed up to create‘Imatgina’, an advanced patient-centric initiative in pediatric radiology that aims to improve the experience children have during diagnostic imaging tests. The goal of the initiative is to enhance the experience for children by creating a friendly atmosphere that dispels the uncertainty and fear usually associated with these types of procedures. It is estimated that the project will improve the lives of over 7,000 children on an annual basis.
Every day in rural Uganda, 555 birth complications occur, which lead to the death of over 6,000 Ugandan women a year. Although ultrasound has proven to be instrumental in the early identification of these complications, its high cost and the lack of trained personnel mean that it is not widely available in rural areas. The Philips Foundation and Philips teamed up with Imaging the World (ITW) to identify and implement sustainable business models in the healthcare ecosystem of rural Uganda. Establishing sustainable and increased sources of funding will allow ITW to create new health clinics and impact the lives of an additional 35,000 Ugandan women and babies a year.
12.3.7 Stakeholder Engagement
Our engagements with various partners and stakeholders is essential to our vision of making the world healthier and sustainable through innovation. Some of our partnership engagements are described below.
Global partnerships
World Economic Forum
Philips is proud to continue as a strategic partner and active member of the World Economic Forum (WEF), an independent international organization committed to improving the state of the world by engaging leaders in partnerships to shape global, regional and industry agendas. We supported and participated in a wide range of initiatives and projects through the year – regional WEF events, as well as the participation in International Business Council of the World Economic Forum.
Further to our various engagements with WEF, Frans van Houten has been selected to serve as a Stewardship Board Member of a key WEF initiative on shaping the “Future of Health and Healthcare”. The initiative will focus on managing the risk and impact of future epidemics addressing the shortfall in the world’s ability to respond to public health emergencies by developing a multifaceted cross-industry, cross-sectorial approach.
Annual Report 2016 221
Sustainability statements 12.3.7
Global Alliance for Vaccines and Immunization
Philips and the Global Alliance for Vaccines and Immunization (Gavi), are partnering to improve the quality of immunization data and its collection in primary and community healthcare. The partnership will be piloting the project in Uganda. The goal of the partnership is to gather accurate data which both organizations believe is essential to improve patient outcomes, provide access to care and reduce costs. Good data is key to strengthening health systems around the world.
World Heart Federation
Philips announced a new partnership with the World Heart Federation (WHF) in 2016 to help people better manage their heart health. Aligned with the WHF’s ‘power your life’ campaign, Philips aims to encourage people to take personal responsibility for leading heart-healthy lives and to raise awareness about cardiovascular disease.
Thought leadership
Future Health Index
Philips launched a new report, the Future Health Index (FHI) in 2016, an extensive global study which explores how 13 countries around the world are positioned to meet long-term global health challenges through integration and connected care technologies. The Future Health Index measures readiness to address these challenges by examining perceptions about the accessibility and level of integration of healthcare services, and the adoption of connected care technology throughout national healthcare systems.
Digital transformation of health and care
Philips is a champion of the EU Blueprint on digital transformation of health and care for the ageing society. Philips will continue its engagement in the Blueprint through deploying digital innovation across the EU. We believe that this will contribute to development of value-based care models for the benefit of citizens/patients and sustainability of health systems.
Working on global issues
Sustainable Development Goals
Philips aspires to be a major private sector contributor to the Sustainable Development Goals (SDGs) that were launched during the UN General Assembly in New York in September 2015. The United Nations Sustainable Development Goals 3 (“’to ensure healthy lives and promote well-being for all at all ages”) and 12 (“to ensure sustainable consumption and production patterns”) are drivers and outcomes of sustainable development and Philips is committed to working closely with all relevant stakeholders to develop solutions to address these.
Strengthening primary care and enabling community development
Working in collaboration with the United Nations Population Fund (UNFPA), Royal Philips plans to inaugurate a Community Life Center (CLC) in Mandera, a County in North-Eastern Kenya with one of the world’s highest maternal mortality rates - 3,795 per 100,000 live births. The project supported by the County Government of Mandera is the second of its kind in the world; Philips inaugurated the first CLC in Kiambu County, Kenya in 2014. The CLC will deliver crucial primary healthcare and enhance community development in Mandera.
Access to primary healthcare in Africa is a complex and complicated issue, therefore a sustainable solution needs to address a wide range of issues collectively. Issues range from unavailability of qualified healthcare workers to the lack of electricity, water and basic healthcare technology. The creation of the CLC concept enabled Philips to realize its vision to drastically improve primary healthcare in Africa.
Grand Challenges Canada on childhood pneumonia
Philips and Grand Challenges Canada (GCC) are collaborating on an innovative project to aid and improve the diagnosis of childhood pneumonia in low resource settings.
Royal Philips received a repayable grant to scale the manufacturing and distribution of the Philips Children’s Automated Respiration Monitor (also known as ChARM) to make it affordable and accessible for community-based health workers inlow-resource settings throughout the world. ChARM has the potential to assist community health workers in establishing a more accurate measurement of a sick child’s breathing rate to help improve the diagnosis of pneumonia and potentially prevent some of the 922,000 childhood deaths caused by pneumonia each year.
Global Financing Facility
In 2016 Philips committed to supporting the Global Financing Facility (GFF) through our expertise in innovation and our core competencies in growing primary-care capacity. The GFF brings together a broad range of partners to promote the sustainable solutions needed to achieve universal coverage of health care. By creating the right financial and technical conditions for innovation, as a common objective we believe our involvement will achieve greater impact and better health outcomes through collaboration.
12.3.8 Supplier indicators
Philips has a direct business relationship with approximately 8,500 product and component suppliers and 22,000 service providers, and in many cases the sustainability issues deeper in our supply chain require us to intervene beyond tier 1 of the chain.
222 Annual Report 2016
Sustainability statements 12.3.8
Supplier sustainability strategy
Through a structured annual strategic process combined with a multi-stakeholder dialogue we identified our key focus areas as described below:
This process resulted in 2016 into five strategic programs for our Sustainable Supply Chain:
| Key programs | ||
| 1Supplier sustainability compliance | (SSC) | |
| 2Supplier sustainability performance | (SSP) | |
| 3Responsible sourcing | (RS) | |
| 4Circular procurement | (CP) | |
| 5Environmental footprint China | (EFP) |
Enablers
ONE database and dashboard
Standardized metrics (KPIs)
Communication plan
Multi-stakeholder dialogue
Industry collaboration
Training plan
Risk mapping (BOM, materials, suppliers)
1. Supplier Sustainability Compliance
Two core policy documents form the basis of supplier sustainability compliance: the Supplier Sustainability Declaration (SSD) and the Regulated Substances List (RSL).
Supplier Sustainability Declaration (SSD)
The SSD sets out the standards and behaviors Philips requires from its suppliers. The SSD is based on the Electronics Industry Citizenship Coalition (EICC) Code of Conduct and covers the topics Health & Safety, Labor, Environment, Ethics and Management systems.
Regulated Substances List (RSL)
The RSL specifies which chemical substances are regulated by legislation. Suppliers are required to follow all the requirements stated in the RSL. Substances can either be marked as restricted or declarable.
Following the SSD and RSL, Philips further specifies contractual and transparency requirements. Suppliers are obliged to contractually commit to the SSD and RSL andupon request provide additional information and evidence.
2. Supplier Sustainability Performance (SSP)
Since 2006, our supplier sustainability audits have been executed by third party auditors.
Due to insights gained through a thorough analysis of the audit program and the data it generated in the past 10 years our main conclusions were:
The audit process consists of a third party audit to verify the SSD compliance, it focuses on closing the identified “Non Conformities” and repeats every 3 years. The frequency of checks is not sufficient and the system does not lead to long lasting improvements of the sustainability performance or compliance rate of our suppliers.
Training and capacity-building programs are focused on general sharing of information and not necessarily on driving change or improvements. They do not always meet individual supplier needs.
To secure business continuity, suppliers try to pass the audit with the least possible effort rather than making lasting improvements.
Years of an audit culture which did not focus on long-lasting improvements has led to audit fatigue due to too many audits demanded by other customers.
Based on the above conclusions, Philips identified a need for change and developed a new “beyond audit” approach which:
Understands that suppliers may have initial deviations from the SSD and RSL.
Accepts that suppliers each have their own organizational – and sustainability maturity level and need an individual improvement plan.
Annual Report 2016 223
Sustainability statements 12.3.8
Is continuousand creates a cultural change leading toward long-term improvements.
Ultimately leads toone-cross-industry standard for supplier sites and will therefore remove the audit burden.
The new SSP approach has been piloted in 2016 on a sample of 93 suppliers in China with the following results:
90% of the suppliers completed a Self-Assessment Questionnaire (SAQ), 57% of which were validated by Philips sustainability experts.
Followed by a site assessment at 20 supplier sites.
Through joint efforts an improvement Plan (IP) was developed and agreed upon with these 20 suppliers.
These 20 suppliers started executing the Improvement Plan, while Philips provides support and monitors progress on a regular basis.
The following observations were made after analyzing the first phase of the pilot:
Higher level of commitment and ownership from suppliers (also at top management level).
Change in mindset towards continuous improvement and transparency.
Suppliers are disclosing more areas for improvement than it would be possible to identify through an audit only.
Suppliers are moving away from quick fixes and towards lasting improvements.
Three key focus areas of SSP
We are primarily focusing on 3 areas: Health and Safety, remuneration and benefits, and workforce turnover.
Process Chemicals
Philips is an active member of the EICC project team on process chemicals, for further details on the strategy and approach of this project see theEICC position paper. In addition to this project team we have addressed the topic of process chemicals in the new SSP approach and we aim to identify if and how the manufacturing sites are managing process chemicals.
Summary of 2016 Sustainability Audit Program
In 2016, we audited 226 of our current risk suppliers, including 150 continued conformance audits with suppliers that we had already audited in 2013. As in previous years, the majority of the audits were done in China. With these audits we directly or indirectly impacted almost 180,000 workers employed at the production sites that were audited.
On top of the audits with current risk suppliers, we also audited 28 potential suppliers during the supplier selection process. These potential suppliers need to close anyzero-tolerance issues before they can start delivering to Philips.
To track improvements Philips measures the ‘compliance rate’ for the identified risk suppliers, being the percentage of risk suppliers audited within the last 3 years who do not have or have resolved all major NCs. During 2016 we achieved a compliance rate of 90% (2015: 86%).
Audit findings
The table below shows the results of the full scope audits done during 2016; potential suppliers are not included. Most frequent areas ofnon-compliance in 2016:
Certified Management System (ISO9001, ISO14001, and OHSAS18001)
Emergency Preparedness
Wages and Benefits
Philips Group
Summary of 2016 audit findings per region
| China | Asia excl. China | LATAM | EMEA | Total | ||||||||||||||||
|
| |||||||||||||||||||
No. of audits | 163 | 38 | 22 | 3 | 226 | |||||||||||||||
Initial audits | 50 | 16 | 8 | 2 | 76 | |||||||||||||||
Continued conformance audits | 113 | 22 | 14 | 1 | 150 | |||||||||||||||
Average number of non-compliances per audit | 9 | 20 | 13 | 3 | 12 | |||||||||||||||
Workers employed at sites audited | 154,309 | 8,394 | 14,165 | 2,295 | 179,163 | |||||||||||||||
|
| |||||||||||||||||||
More information on the Supplier Sustainability Audit Program can be foundhere.
224 Annual Report 2016
Sustainability statements 12.3.8
3. Responsible Sourcing of Minerals
The supply chains of minerals are long and complex. There are typically 7+ tiers between theend-user companies like Philips and the mines where the minerals are being extracted.
Philips does not directly source minerals from mines in in the conflict-affected and high-risk regions, and the supply chain for these metals consists of many tiers, including traders, exporters, smelters, refiners, alloy producers and component manufacturers, before reaching Philips’ direct suppliers.
Mining in these regions often takes place in an artisanal form which often means it is informal and unregulated. Artisanal miners can become victims to exploitation by various militia and armed groups. This increases the risk of human rights violations (forced labor, child labor or widespread sexual violence), unsafe working conditions or environmental concerns.
Philips addresses the complexities of the minerals supply chains through a continuous due diligence process combined with multi-stakeholder initiatives for responsible sourcing of minerals.
Responsible Sourcing approach of Philips
Due diligence approach
OECD Five-Step Framework for Risk-Based Due Diligence in the Mineral Supply Chain
Multi-stakeholder initiatives
Working together with other stakeholders to apply leverage
Conflict minerals due diligence
Philips annually investigates its supply chain to identify smelters of tin, tantalum, tungsten and gold in its supply chain and we have committed not to purchase raw materials, subassemblies, or supplies which are found to contain conflict minerals.
Philips applies collective cross-industry leverage through active engagement via Conflict Free Sourcing Initiative (CFSI). The Conflict-Free Smelter Program (CFSP) identifies smelters that can demonstrate through an independent third-party audit that the minerals they procure are conflict free. Philips is actively directing its supply chain towards these smelters. Seewww.conflictfreesmelter.org for more details.
The Philips Conflict Minerals due diligence framework, measures and outcomes are described in the Conflict Minerals Report that we file annually with SEC. The Report is audited by an independent third party and made publicly available on Philips’website.
Multi-stakeholder initiatives for responsible sourcing of minerals
We believe that a multi-stakeholder collaboration in responsible sourcing of minerals is the most viable approach in addressing the complexities of minerals value chains.
European Partnership for Responsible Minerals (EPRM)
EPRM is a five-year multi-stakeholder partnership between governments, companies, and civil society actors working toward more sustainable minerals
Annual Report 2016 225
Sustainability statements 12.3.8
supply chains. Philips became a strategic, founding partner of EPRM in May 2016, being the first representative of the private sector to join the initiative.
Tin mining in Indonesia
Indonesia produces roughlyone-third of the world’s tin supply, of which the vast majority comes from the islands Bangka and Belitung.
In 2015, a Roadmap to sustainable tin mining was created in collaboration with the local industry and government, defining improvement areas for onshore land reclamation and offshorelow-impact mining.
In 2016, the first implementation pilot projects of the Roadmap were kicked off, governed by the local steering committee.
Dutch Covenant on Gold
Leaders of different industries using gold in The Netherlands together with the Dutch government and NGOs look for ways to make gold supply chains more responsible. Through 2016, the group has engaged in knowledge sharing to understand all specifics of the gold supply chain and to identify the right approach for the parties to address the most severe issues.
Mica Working Group
Mica is mainly used as a pearlescent pigment in coatings and cosmetics, and in the electronics sector it is used as an electrical insulator.
In 2016, Terre des Hommes in collaboration with SOMO published a report“Beauty and a Beast” which showed the widespread problem in the mica industry in Jharkhand/Bihar (India) and gaps in the due diligence of end user companies.
Philips decided to team up with Terre des Hommes in order to bring other mica users from all industries together to start a Mica Working Group with Terre des Hommes, Philips, the Dutch Ministry of Foreign Affairs and a group of 15 companies.
“Terre des Hommes Netherlands is pleased to partner with Philips in order to set up the Mica Working Group. Our report “Beauty and a Beast, child labor in India for sparkling cars and cosmetics” shows the challenges of mica mining and the need for immediate interventions. Philips became aware of the issue and immediately demonstrated its leadership in CSR by taking the initiative to bring partners from various industries together. Philips’ engagement in other responsible sourcing initiatives definitely supported the Mica Working Group to move forward. We are confident that this multi-stakeholder initiative will lead to a transparent, traceable and child labor free mica supply chain”
Terre des Hommes
NGO
4. Circular Procurement
Philips’ ambition is to increase its circular value proposition and it has set a 2020 target of 15% circular revenues. Procurement can play a leading role in Philips’ transition towards a circular economy in order to achieve the 2020 target or even exceed this.
Topics where Procurement is actively involved are:
Circular procurement in the procurement policy. The next step is to define a circular procurement strategy and a clear long-term ambition.
The implementation of a governance structure beyond the procurement organization to cover the whole value chain is part of the internal Circular Economy Excellence network.
Execution of an analysis of internal and external circular service models to improve collaboration.
“In 2016 Philips and HP have further strengthened their business relationship by specifying and delivering an ITpay-per-device model which will cover more than 100,000 IT assets across 50 countries. Thisdevice-as-a-service solution supports both companies’ efforts towards a shared circular economy. Philips stands out in truly understanding the importance of managing its IT requirements in order to realise both maximum value and minimize environmental impact from IT products. HP is proud to be Philips’ partner of choice for IT asset management and will continue to collaborate on shared circular economy objectives.”
Dr. Kirstie McIntyre
HP Social and Environmental Responsibility Director
226 Annual Report 2016
Sustainability statements 12.3.8
HP Case Study
Philips has used HP Asset Recovery Services since 2011 to comprehensively manage end of life IT assets worldwide, with data wiping, remarketing and recycling to mitigate security and privacy risk and ensure compliance. Over that time HP Asset Recovery Services have managed 80,000 assets across 24 countries, remarketing 90% of them.
5. Environmental Footprint China
In order to minimize our impact, we are supporting our Chinese suppliers to reduce their environmental footprint and at the same time to contribute to Philips’ sustainability strategy.
Achievements in 2016
Environmental footprint training for 120 suppliers by Philips Supplier Sustainability team.
Philips actively participated in the Sino-Dutch Sustainable Supply Chain Management Program held by the Dutch Consulate in Zhejiang and Jiangsu province.
Customer engagement (Starbucks) the supplier has established a new waste water treatment facility to ensure waste water discharging in accordance with regulatory requirements.
Environmental footprint data reported for improving performance by 20 suppliers as part of the SSP on-site development.
Energy savings via Supplier Development program - energy savings will be achieved upon implementation of the identified improvement actions.
Collaboration with IPE, a Chinese NGO
The Institute of Public and Environmental Affairs (IPE) is a registerednon-profit organization based in Beijing. IPE has developed two pollution databases (water and air) to monitor corporate environmental performance and to facilitate public participation in environmental governance. For more information please refer to IPE website.
SA is a Philips supplier located in Shenzhen . In April 2016, environmental issues were identified in the waste water discharge system of this supplier. This was reported via the IPE Pollution Map.
Philips experts immediately contacted the supplier account manager, an IPE expert and the supplier to identify the root-cause and work out an improvement plan. With multi-stakeholder engagement, SA had the IPE Green Choice Alliance audit and closed the issue with 50 environmental protection NGOs as witnesses.
This section provides additional information on (some of) the environmental performance parameters reported insection 2.3, Environmental performance, of this report.
12.4.1 Circular Economy
The transition from a linear to a circular economy is essential to create a sustainable world. A circular economy aims to decouple economic growth from the use of natural resources and ecosystems by using these resources more effectively.
The circular economy program
The circular economy program at Philips ran for the fourth year in 2016 and consists of four strategic pillars:
| 1. | Connect to stakeholders outside Philips |
| 2. | Internal employee engagement |
| 3. | Create proof points and metrics |
| 4. | Embed circular economy in Philips processes |
Philips leverages partnerships with the Ellen MacArthur Foundation, Circle Economy Netherlands, World Economic Forum, US Chamber of Commerce Foundation and The Guardian. For example, through the leadership of our CEO and supported by the circular economy program, Philips teamed up with the World Economic Forum to establish a public-private platform to accelerate the circular economy, launched in Davos in January 2017.
In many Philips Business Groups circular economy projects have started. These are either linked to customer access over ownership (pay for performance), business model innovations (from transactions to
Annual Report 2016 227
Sustainability statements 12.4.1
relationships via service and solution models) or reverse cycles (remanufacturing, refurbishment and parts harvesting).
Circular Revenues
In 2016, at Royal Philips, a new internal KPI was developed and deployed: Circular Revenues. The Circular Revenues percentage captures our revenues of validated circular products, services, and solutions, as a % of total Philips revenues. The validation is done against the following Philips circularity requirements which might be further refined in the future:
1. Performance and Access-based models
Revenues from contracts that include the condition that Philips has individualend-of-life responsibility for the product
2. Refurbished, Reconditioned & Remanufactured products/systems
Revenues from selling refurbished, reconditioned or remanufactured products/systems withre-used components >30% by total weight of product/ system
3. Refurbished, Reconditioned & Remanufactured components
Revenue from harvested components that have either been refurbished, reconditioned or remanufactured. The harvested component must contain >30%re-used parts or materials by total component weight. The component can either be a standalone component or part of a new product/system. The commercial value of the components is considered irrespective of whether it is part of a service, warranty or a sale.
4. Upgrades/refurbishment on site or remote
Revenue from upgrades of existing hardware and software either on site or remotely
5. Products with recycled plastics content
Revenues from products with a recycled plastics content of >25% by total weight of eligible plastics
We set the ambition that by 2020 a total of 15% of our revenues will come from circular propositions. This is double the rate of 7% baseline achieved in 2015. The result for 2016 is 9%. The main contributing revenue streams are for:
Personal Health businesses
Revenues from our B2C products that contain a large amount of recycled plastics, such as our businesses in coffee and domestic appliances
Diagnosis & Treatment businesses
Our Diamond Select offer of refurbished imaging systems for sale, upgrading of systems at customer premises to enhance performance and extend lifetime, repair and reuse of spare parts
Connected Care & Health Informatics businesses
A number of Philips businesses based on subscription models, such as for example the Philips Lifeline business and others
Closing material loops
In addition to tracking circular revenue, we are also further working to gain transparency over the material flows connected with the Philips businesses. In 2016 Philips put a total of some 242,000 tonnes of products on the market. This assessment is based on sales data combined with product-specific weights. 85% of the total product weight was delivered through our B2C businesses in Personal Health and 15% through our B2B businesses (Diagnosis & Treatment businesses and Connected Care & Health Informatics businesses).
We can account for some 19,000 tonnes or approximately 10% of those products being collected,re-used or recycled globally in 2015. Europe has advanced collection systems in place. In these countries we have an average return rate of around40-50%. National legislation is required to create the level playing field needed to set up efficient recycling systems beyond the EU. The main pathways and quantities for materialre-use in 2015 were:
Trade-in and return for resale as refurbished products and for spare parts harvesting (Diagnosis & Treatment and Connected Care & Health Informatics) some 2,400 tonnes, largely unchanged from 2014.
Collective collection and recycling schemes according to the EU Waste Electrical and Electronic Equipment (WEEE) collection schemes. Those products are broken down into the main material fractions and provided to the market via our recycling partners
800 tonnes from Diagnosis & Treatment and Connected Care & Health Informatics field returns, following the WEEE category 8 classification, indicating a slight decrease compared to the previous year (900 tonnes)
16,000 tonnes from Personal Health, following the WEEE category 2 classification
On the demand side, the Personal Health businesses havere-integrated significantly more recycled plastics in new products than last year, closing the material loop for some 1,440 tonnes of plastics, up from 900 tonnes in 2015.
More information can be found on thecircular economy website.
At Philips Lighting, circular economy activities are covered as part of their Green Revenues.
228 Annual Report 2016
Sustainability statements 12.4.2
12.4.2 Biodiversity
Philips recognizes the importance of healthy ecosystems and rich biodiversity for our company, our employees, and society as a whole. We aim to minimize any negative impacts and actively promote ecosystem restoration activities.
The Philips Biodiversity policy was issued in 2014 and progress was made on biodiversity management, both on sites (e.g. impact measurement), on natural capital valuation and at management level. Most initiatives were led by the environmental coordinators at our sites, for example at our Best and Drachten sites in The Netherlands, which serve as role models on the topic of biodiversity.
Philips participated in 2015 in the development of the Natural Capital Protocol and volunteered as a pilot company. These activities continued in 2016. The environmental impact of the Royal Philips sites is limited as they are not very energy-intensive and do not emit large quantities of high-impact substances. The impact of our supply chain however is significantly higher than our own impact. For this reason, we used the identifiedhot-spots in our supply chain as input for our CDP Supply Chain program. More information on that program can be found insub-section 12.3.8, Supplier indicators, of this report.
12.4.3 Sustainable Operations
The Royal Philips HealthTech businesses and Philips Lighting Sustainable Operations programs related to improving the environmental performance of our manufacturing facilities focus on most contributors to climate change, but also address water, recycling of waste and chemical substances.
For an overview of Philips’ industrial sites, please visit: Philips industrial sites.
Royal Philips HealthTech businesses
Green Operations
2016
|
| |||||||||||
baseline year 2015 | target 20201) | 2016 actual | ||||||||||
|
| |||||||||||
Total CO2 from manufacturing | 84 Ktonnes | 0 Ktonnes | 85 Ktonnes | |||||||||
Water | 978,500 m3 | 10% reduction | 963,000 m3 | |||||||||
Zero waste to landfill | 3.2 kilotonnes | 0 tonnes | 2.9 kilotonnes | |||||||||
Operational waste recycling | 78% | 90% | 79% | |||||||||
Hazardous substances emissions | 1,419 kilos | 50% reduction | 1,099 kilos | |||||||||
VOC emissions | 169 tonnes | 10% reduction | 129 tonnes | |||||||||
|
| |||||||||||
| 1) | Against the base year 2015 |
Energy use in manufacturing
Total energy usage in manufacturing amounted to 8,987 terajoules in 2016, a decrease of 7% compared to 2015. Philips Lighting consumed about 66% of the total and realized a 13%year-on-year reduction, which was mainly driven by a reduction of energy-intensive operations and energy efficiency improvements in the factories. The Connected Care & Health Informatics businesses realized a decrease in energy consumption of 5% due to operational changes. Energy consumption in the Diagnosis & Treatment businesses increased by 8%, which was mainly due to the inclusion of two newly acquired sites. In the Personal Health businesses, site expansions and changed demand caused an increase in energy consumption, which was partly offset by energy efficiency improvements. The energy of discontinued operations amounted to 2,231 terajoules in 2016 (2015: 2,179 terajoules).
Philips Group
Total energy consumption in manufacturingin terajoules
2012 - 2016
|
| |||||||||||||||||||
| 2012 | 2013 | 2014 | 2015 | 2016 | ||||||||||||||||
|
| |||||||||||||||||||
Personal Health | 1,329 | 1,369 | 1,352 | 1,389 | 1,436 | |||||||||||||||
Diagnosis & Treatment | 1,248 | 1,238 | 1,202 | 1,214 | 1,316 | |||||||||||||||
Connected Care & Health Informatics | 325 | 329 | 334 | 336 | 318 | |||||||||||||||
Lighting | 9,112 | 9,027 | 8,369 | 6,763 | 5,917 | |||||||||||||||
|
| |||||||||||||||||||
Philips Group | 12,014 | 11,963 | 11,257 | 9,702 | 8,987 | |||||||||||||||
|
| |||||||||||||||||||
Operational carbon footprint and energy efficiency - 2016 details
Becoming carbon-neutral in our operations by 2020 is one of the key targets, after already reducing our operational carbon footprint very significantly during the past years (40% decrease in CO2 emissions in 2015 compared to our 2007 base year). Our carbon footprint decreased by 5% compared to 2015, resulting in a total of 1,344 kilotonnes CO2.
The 2016 results can be attributed to several factors:
| • | Accounting for 24% of the total footprint, total CO2 emissions from manufacturing decreased by 17% due to operational changes resulting in decreased energy usage and a lower load (mainly in Philips Lighting); additionally the share coming from renewable sources increased. |
| • | CO2 emissions fromnon-industrial operations (offices, warehouses, etc.), representing 8% of the total emissions, increased this year due to increased overall floor space in ournon-industrial real estate portfolio. This resulted in a 3% carbon emission increase compared to 2015. In 2017, we will continue to focus on the most efficient use of facility space and increase the share of purchased electricity from renewable sources. |
| • | The total CO2 emissions related to business travel, accounting for 14% of our carbon footprint, showed a decrease of 4% compared to 2015. The reductions achieved with business flights and our lease cars was partially mitigated by an increase in our rental car emissions. |
| • | Overall CO2 emissions from logistics, representing 53% of the total, showed no overall change compared to 2015. We recorded an increase in emissions from air and road freight in Royal Philips, which was mitigated by a decrease in Philips Lighting. |
Annual Report 2016 229
Sustainability statements 12.4.3
This increase in air freight combined with reduced emissions from parcel, road and ocean freight resulted in no overall change in our logistics emissions.
Philips Group
Operational carbon footprint for logistics
in kilotonnes CO2-equivalent
2012 - 2016
|
| |||||||||||||||||||
| 2012 | 2013 | 2014 | 2015 | 2016 | ||||||||||||||||
|
| |||||||||||||||||||
Air transport | 366 | 385 | 348 | 429 | 448 | |||||||||||||||
Road transport | 169 | 174 | 164 | 118 | 117 | |||||||||||||||
Ocean transport | 210 | 227 | 208 | 171 | 153 | |||||||||||||||
|
| |||||||||||||||||||
Philips Group | 745 | 786 | 720 | 718 | 718 | |||||||||||||||
|
| |||||||||||||||||||
Carbon emissions in manufacturing
The greenhouse gas emissions of our manufacturing operations totaled 323 kilotonnes CO2-equivalent in 2016, 13% lower than in 2015. This was the result of decreased energy usage in manufacturing and operational changes. Direct CO2 emissions represented 56% of the total, which decreased by 10%. Indirect CO2 emissions represented 38%, an decrease of 18% due to lower electricity consumption. The carbon emissions of discontinued operations amounted to 175 kilotonnes CO2-equivalent in 2016 (2015: 145 kilotonnes CO2-equivalent).
Philips Group
Total carbon emissions in manufacturing
in kilotonnes CO2-equivalent
2012 - 2016
|
| |||||||||||||||||||
| 2012 | 2013 | 2014 | 2015 | 2016 | ||||||||||||||||
|
| |||||||||||||||||||
Direct CO21) | 278 | 276 | 253 | 200 | 181 | |||||||||||||||
Indirect CO2 | 252 | 208 | 185 | 148 | 122 | |||||||||||||||
Other greenhouse gases | 6 | 7 | 6 | 6 | 4 | |||||||||||||||
From glass production | 27 | 27 | 24 | 17 | 16 | |||||||||||||||
|
| |||||||||||||||||||
Philips Group2) | 563 | 518 | 468 | 371 | 323 | |||||||||||||||
|
| |||||||||||||||||||
| 1) | From energy |
| 2) | Excludingnon-reporting industrial sites therefore different from Operational carbon footprint |
Philips Group
Total carbon emissions in manufacturing per segment
in kilotonnes CO2-equivalent
2012 - 2016
|
| |||||||||||||||||||
| 2012 | 2013 | 2014 | 2015 | 2016 | ||||||||||||||||
|
| |||||||||||||||||||
Personal Health | 54 | 50 | 45 | 49 | 59 | |||||||||||||||
Diagnosis & Treatment | 52 | 35 | 31 | 28 | 22 | |||||||||||||||
Connected Care & Health Informatics | 14 | 9 | 8 | 7 | 4 | |||||||||||||||
Lighting | 443 | 424 | 384 | 287 | 238 | |||||||||||||||
|
| |||||||||||||||||||
Philips Group | 563 | 518 | 468 | 371 | 323 | |||||||||||||||
|
| |||||||||||||||||||
CO2 emissions decreased significantly at Philips Lighting due to reduced energy usage resulting from operational changes and energy efficiency improvements. Emissions at the Diagnosis & Treatment businesses decreased due to an increase in use of electricity generated by renewable sources, partially offset by two newly acquired sites. The Connected Care & Health Informatics businesses segment decreased its CO2 emissions due to lower energy consumption. At the Personal Health businesses, CO2 emissions increased due to a decrease in the use of electricity generated by renewable sources. In December 2016, the Los Mirasoles windfarm in the US started to produce electricity. As a result, all our US operations will be powered by wind energy in 2017, a clear step towards our ambition to become carbon-neutral in our operations by 2020.
Hazardous substances emissions
In the ‘Healthy people, sustainable planet’ program, new chemical reduction targets have been defined, on the most relevant categories of substances for Royal Philips, being hazardous substance emissions as well as VOC (Volatile Organic Compounds) emissions. As part of the deployment of the new program, reduction targets at our industrial sites are being agreed. For more information on Philips Lighting’s emissions please refer to their Annual Report.
Royal Philips HealthTech businesses
Hazardous substances emissions in kilos
2015 - 2016
|
| |||||||
| 2015 | 2016 | |||||||
|
| |||||||
Personal Health | 789 | 642 | ||||||
Diagnosis & Treatment | 604 | 428 | ||||||
Connected Care & Health Informatics | 26 | 29 | ||||||
|
| |||||||
HealthTech | 1,419 | 1,099 | ||||||
|
| |||||||
In 2016, emissions of hazardous substances decreased by 23%, mainly caused by reduced usage of harmful chemicals at a Diagnosis & Treatment businesses site and a Personal Health businesses site and changing processes at multiple sites in all segments.
VOC emissions
Royal Philips HealthTech businesses
VOC emissions in tonnes
2015 - 2016
|
| |||||||
| 2015 | 2016 | |||||||
|
| |||||||
Personal Health | 138 | 92 | ||||||
Diagnosis & Treatment | 29 | 35 | ||||||
Connected Care & Health Informatics | 2 | 2 | ||||||
|
| |||||||
HealthTech | 169 | 129 | ||||||
|
| |||||||
VOC emissions reduced significantly in 2016 (by 24%) to 129 tonnes. This decrease was mainly driven by a number of industrial sites in the Personal Health businesses segment, which changed their lacquering processes, as well as changes in the product mix. This was slightly offset by the inclusion of two newly acquired industrial sites in the Diagnosis & Treatment businesses segment.
ISO 14001 certification
Most of the Royal Philips manufacturing sites are certified under the umbrella certificates for the Diagnosis & Treatment, Connected Care & Health Informatics and Personal Health businesses segments. Philips Lighting also has an umbrella certificate. In 2016, 82% of reporting manufacturing sites were certified, a 4% increase compared to 2015. Two sites were newly
230 Annual Report 2016
Sustainability statements 12.4.3
certified this year in the Personal Health businesses segment, and the two sites in the Diagnosis & Treatment businesses segment that started to report were not yet certified.
Philips Group
ISO 14001 certificationas a % of all reporting organizations
2012 – 2016
|
| |||||||||||||||||||
| 2012 | 2013 | 2014 | 2015 | 2016 | ||||||||||||||||
|
| |||||||||||||||||||
Philips Group | 69 | 79 | 79 | 78 | 82 | |||||||||||||||
|
| |||||||||||||||||||
Environmental incidents
In 2016, the Personal Health businesses reported one environmental incident with noise and four non-compliances. One was related to noise, followed by a technical project to meet the requirements; two were related to waste water and storm water permits which werefollowed-up by corrective actions; and one administrative incident was related to waste. The Diagnosis & Treatment businesses reported one environmental incident with an oil spill which did not result in soil pollution. The Connected Care & Health Informatics businesses reported one environmentalnon-compliance which was related to waste water. Philips Lighting did not experience any environmental incidents but reported fournon-compliances, of which one resulted in anon-material fine (manufacturing site exceeding the usage limit of its emergency generator).
Annual Report 2016 231
Sustainability statements 12.4.3
Sustainability world map
To find out about our Health and Safety, Waste, Water and Emissions metrics at global, regional and market level, go towww.results.philips.com/interactive-worldmap
| Philips Group | Total waste | Emissions2) | ||||||||||||||||||||||||||||||||||||||
| Market | Manufacturing sites | Total recordable case rate1) | CO2 emitted (Tonnes CO2) | Waste (Tonnes) | Recycled (%) | Water (m3) | Hazardous substances (kg) | VOC (Tonnes) | ||||||||||||||||||||||||||||||||
Africa | — | 0.00 | — | — | — | — | — | — | ||||||||||||||||||||||||||||||||
ASEAN and the Pacific | 1 | 0.12 | 21,307 | 1,463 | 91% | 74,738 | 5 | 25 | ||||||||||||||||||||||||||||||||
Benelux | 6 | 0.22 | 10,757 | 8,726 | 80% | 235,372 | 157 | 12 | ||||||||||||||||||||||||||||||||
Central & Eastern Europe | 7 | 0.30 | 61,274 | 7,019 | 81% | 243,260 | 92 | 20 | ||||||||||||||||||||||||||||||||
Germany, Austria and Switzerland | 4 | 0.50 | 7,616 | 3,050 | 89% | 53,264 | 389 | 6 | ||||||||||||||||||||||||||||||||
France | 2 | 0.76 | 1,284 | 5,123 | 95% | 182,370 | — | — | ||||||||||||||||||||||||||||||||
Greater China | 11 | 0.14 | 75,592 | 6,663 | 90% | 977,947 | 311 | 27 | ||||||||||||||||||||||||||||||||
Iberia | 2 | 0.66 | 2,398 | 2,042 | 82% | 47,291 | — | — | ||||||||||||||||||||||||||||||||
Indian Subcontinent | 5 | 0.10 | 65,148 | 2,552 | 96% | 57,174 | 6 | 4 | ||||||||||||||||||||||||||||||||
Italy, Israel and Greece | 4 | 0.53 | 6,829 | 2,117 | 76% | 22,529 | 15 | 5 | ||||||||||||||||||||||||||||||||
Japan | — | 0.20 | — | — | — | — | — | — | ||||||||||||||||||||||||||||||||
Latin America | 11 | 0.35 | 12,927 | 8,107 | 82% | 173,474 | — | 8 | ||||||||||||||||||||||||||||||||
Middle East & Turkey3) | 3 | 0.27 | — | — | — | — | — | — | ||||||||||||||||||||||||||||||||
Nordics | — | 0.20 | — | — | — | — | — | — | ||||||||||||||||||||||||||||||||
North America | 24 | 0.94 | 48,193 | 16,799 | 76% | 337,998 | 47 | 18 | ||||||||||||||||||||||||||||||||
Russia and Central Asia | — | 0.00 | — | — | — | — | — | — | ||||||||||||||||||||||||||||||||
UK & Ireland | 2 | 0.06 | 9,096 | 1,102 | 85% | 8,501 | 77 | 4 | ||||||||||||||||||||||||||||||||
| 1) | Includes manufacturing andnon-manufacturing sites |
| 2) | HealthTech |
| 3) | Three manufacturing sites did not start to report environmental data yet |
232 Annual Report 2016
Sustainability statements 12.5
12.5 Assurance report of the independent auditor
To: The Supervisory Board and Shareholders of Koninklijke Philips N.V.
Our Opinion
We have audited the Sustainability Information in the annual report of Koninklijke Philips N.V. (the Company), based in Eindhoven, the Netherlands for the year ended December 31, 2016. The scope of our audit engagement is described in Section “Our Scope”. An audit engagement is aimed at obtaining reasonable assurance.
In our opinion, the Sustainability Information in the annual report 2016 presents, in all material respects, a reliable and adequate view of:
the policy and business operations with regard to sustainability; and
the thereto related events and achievements for the year ended December 31, 2016
in accordance with the GRI Standards of Global Reporting Initiative (GRI) (option Comprehensive) and the supplemental internally applied reporting criteria as disclosed in section 12.1 Approach to sustainability reporting in chapter 12 Sustainability statements of the annual report 2016.
Basis for our opinion
We have performed our audit on the Sustainability Information in accordance with Dutch law, including Dutch Standard 3810N “Assurance engagements relating to sustainability reports”. Dutch Standard 3810N is a subject specific standard under the International Standard on Assurance Engagements (ISAE) 3000 “Assurance Engagements Other Than Audits or Reviews of Historical Financial Information”. Our responsibilities under this standard are further described in the Section “Our responsibilities for the audit of the Sustainability Information”.
We believe that the audit evidence we have obtained is sufficient and appropriate to provide a basis for our opinion.
Our Independence
We are independent of the Company in accordance with the “Verordening inzake de onafhankelijkheid van accountants bij assurance-opdrachten” (ViO) (Code of Ethics for Professional Accountants, a Dutch regulation with respect to independence) and other relevant independence regulations in the Netherlands. This includes that we do not perform any activities that could result in a conflict of interest with our independent assurance engagement. Furthermore, we have complied with the “Verordening gedrags- en beroepsregels accountants” (VGBA, Dutch Code of Ethics).
Our Scope
The Sustainability Information comprises chapter 12 Sustainability statements and sections 2.2 Social performance and 2.3 Environmental performance of the annual report 2016 and provides a representation of the Company’s policy, the related business operations, events and achievements relating to sustainability during 2016.
The Sustainability Information includes prospective information such as ambitions, strategy, plans, expectations and estimates. Inherent to this information is that the actual results may differ in the future and are therefore uncertain. We do not provide any assurance on the achievability and feasibility of this prospective information.
The references, excluding “Methodology for calculating Lives Improved” and “GRI content index”, in the Sustainability Information (www.philips.com, external websites, interviews and other documents) are outside the scope of our assurance engagement.
We have read the information on sustainability in the rest of the annual report 2016 and to the extent we can identify this information is consistent with the Sustainability Information in scope of our audit.
Responsibilities of management for the Sustainability Information
Management of the Company is responsible for the preparation of the Sustainability Information in accordance with the GRI Standards (option Comprehensive) and the supplemental internally applied reporting criteria as disclosed in section 12.1 Approach to sustainability reporting in chapter 12 Sustainability statements of the annual report 2016. This responsibility includes the identification of stakeholders and the determination of material aspects. The choices made by management regarding the scope of the Sustainability Information and the reporting policy of the Company is summarized in section 12.1 Approach to sustainability reporting.
Furthermore, management is responsible for such internal control as it determines is necessary to enable the preparation of the Sustainability Information that is free from material misstatement, whether due to fraud or errors.
Our responsibilities for the audit of the Sustainability Information
Our responsibility is to plan and perform the audit engagement in a manner that allows us to obtain sufficient and appropriate audit evidence for our opinion.
Reasonable assurance is a high, but not absolute level of assurance, which means we may not have detected all material errors and fraud. Misstatements can arise from fraud or errors and are considered material if, individually or in the aggregate, they could reasonably
Annual Report 2016 233
Sustainability statements 12.5
be expected to influence the economic decisions of users taken on the basis of the Sustainability Information. The materiality affects the nature, timing and extent of our audit procedures and the evaluation of the effect of identified misstatements on our opinion.
We apply the “Nadere voorschriften accountantskantoren ter zake van assurance opdrachten (RA/AA)” and accordingly maintain a comprehensive system of quality control including documented policies and procedures regarding compliance with ethical requirements, professional standards and applicable legal and regulatory requirements.
We have exercised professional judgement and have maintained professional skepticism throughout the audit, in accordance with the Dutch Standard 3810N, ethical requirements and independence requirements.
Our audit included amongst others:
Evaluating the appropriateness of the reporting policy, its consistent application, including the evaluation of the results of the stakeholders’ dialogue, the reasonableness of management’s estimates and the related disclosures made by management.
Performing an external environment analysis and obtaining insight into relevant social themes and issues and the characteristics of the organization.
Identifying and assessing the risks of material misstatement of the Sustainability Information, whether due to errors or fraud, designing and performing audit procedures responsive to those risks, and obtaining audit evidence that is sufficient and appropriate to provide a basis for our opinion. The risk of not detecting a material misstatement resulting from fraud is higher than for one resulting from errors, as fraud may involve collusion, forgery, intentional omissions, misrepresentations, or the override of internal control.
Interviewing management and relevant staff responsible for the sustainability’s strategy, policy and achievements.
Interviewing relevant staff at corporate level responsible for providing the information in the Sustainability Information, carrying out internal control procedures on the data and consolidating the data in the Sustainability Information.
Evaluating the design and implementation and testing the operating effectiveness of the reporting systems and processes related to the Sustainability Information.
Evaluating the underlying transactions and events.
Visits to production sites to evaluate the source data and to evaluate the design and implementation of control, including validation procedures, at local level.
Testing relevant data and internal and external documentation, on a sample basis, to determine the reliability of the Sustainability Information.
An analytical review of the data and trends submitted for consolidation at corporate level.
Evaluating the overall presentation, structure and content of the Sustainability Information.
Amsterdam, The Netherlands
February 21, 2017
Ernst & Young Accountants LLP
Subject matter expert sustainability
J. Niewold
Independent auditor
C.B. Boogaart
234 Annual Report 2016
Five-year overview 13
Philips Group
General data in millions of EUR unless otherwise stated
2012 - 2016
|
| |||||||||||||||||||
| 2012 | 2013 | 2014 | 2015 | 2016 | ||||||||||||||||
|
| |||||||||||||||||||
Sales | 22,234 | 21,990 | 21,391 | 24,244 | 24,516 | |||||||||||||||
% increase over previous year | 12 | % | (1 | )% | (3 | )% | 13 | % | 1 | % | ||||||||||
Income from operations (EBIT) (loss) | 592 | 1,855 | 486 | 992 | 1,882 | |||||||||||||||
Financial income and expenses - net | (329 | ) | (330 | ) | (301 | ) | (369 | ) | (493 | ) | ||||||||||
Income (loss) from continuing operations | (166 | ) | 1,034 | 221 | 414 | 1,075 | ||||||||||||||
Income (loss) from continuing operations attributable to shareholders | (171 | ) | 1,031 | 225 | 400 | 1,032 | ||||||||||||||
Income (loss) from Discontinued operations | 136 | 138 | 190 | 245 | 416 | |||||||||||||||
Net income (loss) | (30 | ) | 1,172 | 411 | 659 | 1,491 | ||||||||||||||
Net income (loss) attributable to shareholders | (35 | ) | 1,169 | 415 | 645 | 1,448 | ||||||||||||||
Net assets | 11,185 | 11,227 | 10,968 | 11,780 | 13,508 | |||||||||||||||
Total employees atyear-end (FTEs) | 118,087 | 116,082 | 113,678 | 112,959 | 114,731 | |||||||||||||||
|
| |||||||||||||||||||
Philips Group
Income in millions of EUR unless otherwise stated
2012 - 2016
|
| |||||||||||||||||||
| 2012 | 2013 | 2014 | 2015 | 2016 | ||||||||||||||||
|
| |||||||||||||||||||
Income from operations (EBIT) | 592 | 1,855 | 486 | 992 | 1,882 | |||||||||||||||
as a % of sales | 2.7 | % | 8.4 | % | 2.3 | % | 4.1 | % | 7.7 | % | ||||||||||
Adjusted income from operations1) | 1,003 | 2,276 | 821 | 1,372 | 2,235 | |||||||||||||||
as a % of sales | 4.5 | % | 10.4 | % | 3.8 | % | 5.7 | % | 9.1 | % | ||||||||||
Income taxes | (218 | ) | (466 | ) | (26 | ) | (239 | ) | (327 | ) | ||||||||||
as a % of income before taxes | (82.9 | )% | (30.6 | )% | (14.1 | )% | (38.4 | )% | (23.5 | )% | ||||||||||
Income (loss) from continuing operations | (166 | ) | 1,034 | 221 | 414 | 1,075 | ||||||||||||||
Net income (loss) | (30 | ) | 1,172 | 411 | 659 | 1,491 | ||||||||||||||
|
| |||||||||||||||||||
| 1) | Non-GAAP financial measure. For the definition and reconciliation to the most directly comparable GAAP measure, refer tochapter 4, Reconciliation ofnon-GAAP information, of this report |
Philips Group
Capital employed in millions of EUR unless otherwise stated
2012 - 2016
|
| |||||||||||||||||||
| 2012 | 2013 | 2014 | 2015 | 2016 | ||||||||||||||||
|
| |||||||||||||||||||
Cash and cash equivalents | 3,834 | 2,465 | 1,873 | 1,766 | 2,334 | |||||||||||||||
Receivables and other current assets | 5,128 | 5,220 | 5,591 | 5,655 | 6,169 | |||||||||||||||
Assets classified as held for sale | 43 | 507 | 1,613 | 1,809 | 2,180 | |||||||||||||||
Inventories | 3,495 | 3,240 | 3,314 | 3,463 | 3,392 | |||||||||||||||
Non-current financial assets/investments in associates | 726 | 657 | 619 | 670 | 525 | |||||||||||||||
Non-current receivables/assets | 2,217 | 1,924 | 2,721 | 3,075 | 3,098 | |||||||||||||||
Property, plant and equipment | 2,959 | 2,780 | 2,095 | 2,322 | 2,155 | |||||||||||||||
Intangible assets | 10,679 | 9,766 | 10,526 | 12,216 | 12,450 | |||||||||||||||
|
| |||||||||||||||||||
Total assets | 29,081 | 26,559 | 28,352 | 30,976 | 32,303 | |||||||||||||||
Property, plant and equipment: | ||||||||||||||||||||
Capital expenditures for the year | 479 | 482 | 437 | 522 | 443 | |||||||||||||||
Depreciation for the year | 588 | 521 | 592 | 582 | 606 | |||||||||||||||
Capital expenditures: depreciation | 0.8 | 0.9 | 0.7 | 0.9 | 0.7 | |||||||||||||||
Inventories as a % of sales1) | 14.1 | % | 13.7 | % | 15.3 | % | 14.3 | % | 13.8 | % | ||||||||||
Outstanding trade receivables, in days sales2) | 50 | 53 | 56 | 56 | 57 | |||||||||||||||
|
| |||||||||||||||||||
| 1) | Calculated based upon values excluding inventories and sales related to acquisitions and divestments for 2015 and 2016 |
| 2) | Calculated based upon the values excluding accounts receivable and sales related to acquisitions, divestments and Discontinued operations |
Annual Report 2016 235
Five-year overview 13
Philips Group
Financial structurein millions of EUR unless otherwise stated
2012 - 2016
|
| |||||||||||||||||||
| 2012 | 2013 | 2014 | 2015 | 2016 | ||||||||||||||||
|
| |||||||||||||||||||
Other liabilities1) | 9,208 | 7,713 | 8,414 | 8,786 | 9,058 | |||||||||||||||
Liabilities directly associated with assets held for sale | 27 | 348 | 349 | 407 | 525 | |||||||||||||||
Debt | 4,534 | 3,901 | 4,104 | 5,760 | 5,606 | |||||||||||||||
Provisions1) | 4,127 | 3,370 | 4,517 | 4,243 | 3,606 | |||||||||||||||
|
|
|
| |||||||||||||||||
Total provisions and liabilities | 17,896 | 15,332 | 17,384 | 19,196 | 18,795 | |||||||||||||||
Shareholders’ equity | 11,151 | 11,214 | 10,867 | 11,662 | 12,601 | |||||||||||||||
Non-controlling interests | 34 | 13 | 101 | 118 | 907 | |||||||||||||||
|
| |||||||||||||||||||
Group equity and liabilities | 29,081 | 26,559 | 28,352 | 30,976 | 32,303 | |||||||||||||||
Net debt: group equity ratio2)3) | 6:94 | 11:89 | 17:83 | 25:75 | 19:81 | |||||||||||||||
Market capitalization atyear-end | 18,200 | 24,340 | 22,082 | 21,607 | 26,751 | |||||||||||||||
|
| |||||||||||||||||||
| 1) | Adjusted to reflect a reclassification of net defined-benefit obligations into Long-term provisions. Seenote 1, Significant accounting policies. |
| 2) | For details on the calculation of net debt and group equity ratio, refer tonote 17, Equity. |
| 3) | Non-GAAP financial measure. For the definition and reconciliation to the most directly comparable GAAP measure, refer to chapter 4, Reconciliation of non-GAAP information, of this report. |
Philips Group
Key figures per sharein EUR unless otherwise stated
2012 - 2016
|
| |||||||||||||||||||
| 2012 | 2013 | 2014 | 2015 | 2016 | ||||||||||||||||
|
| |||||||||||||||||||
Sales per common share | 24.11 | 24.14 | 23.37 | 26.46 | 26.71 | |||||||||||||||
Weighted average amount of shares outstanding: | ||||||||||||||||||||
- basic1) | 922,101 | 911,072 | 915,193 | 916,087 | 918,016 | |||||||||||||||
- diluted1) | 927,222 | 922,072 | 922,714 | 923,625 | 928,789 | |||||||||||||||
Basic earnings per common share: | ||||||||||||||||||||
Income (loss) from continuing operations attributable to shareholders per share | (0.19 | ) | 1.13 | 0.25 | 0.44 | 1.12 | ||||||||||||||
Net income (loss) attributable to shareholders | (0.04 | ) | 1.28 | 0.45 | 0.70 | 1.58 | ||||||||||||||
Diluted earnings per common share: | ||||||||||||||||||||
Income (loss) from continuing operations attributable to shareholders per share | (0.19 | ) | 1.12 | 0.24 | 0.43 | 1.11 | ||||||||||||||
Net income (loss) attributable to shareholders | (0.04 | ) | 1.27 | 0.45 | 0.70 | 1.56 | ||||||||||||||
Dividend distributed per common share | 0.75 | 0.75 | 0.80 | 0.80 | 0.80 | |||||||||||||||
Total shareholder return per common share | 4.37 | 7.50 | (1.70 | ) | 0.21 | 6.24 | ||||||||||||||
Shareholders’ equity per common share | 12.19 | 12.28 | 11.88 | 12.72 | 13.66 | |||||||||||||||
Price/earnings ratio | (104.74 | ) | 23.58 | 96.60 | 53.55 | 25.89 | ||||||||||||||
Share price atyear-end | 19.90 | 26.65 | 24.15 | 23.56 | 29.00 | |||||||||||||||
Highest closing share price during the year | 20.33 | 26.78 | 28.10 | 27.65 | 29.07 | |||||||||||||||
Lowest closing share price during the year | 13.76 | 20.26 | 20.98 | 20.79 | 20.95 | |||||||||||||||
Average share price | 16.92 | 23.33 | 24.00 | 24.51 | 24.75 | |||||||||||||||
Amount of common shares outstanding at year-end1) | 914,591 | 913,338 | 914,389 | 917,104 | 922,437 | |||||||||||||||
|
| |||||||||||||||||||
| 1) | In thousands of shares |
236 Annual Report 2016
Five-year overview 13
Philips Group
Sustainability
2012 - 2016
|
| |||||||||||||||||||
| 2012 | 2013 | 2014 | 2015 | 2016 | ||||||||||||||||
|
| |||||||||||||||||||
Lives improved, in billions | 1.6 | 1.7 | 1.9 | 2.0 | 2.1 | |||||||||||||||
Green Revenues, as a % of total sales | 46 | % | 50 | % | 59 | % | 61 | % | 64 | % | ||||||||||
Green Innovation, in millions of euros | 453 | 405 | 463 | 495 | 558 | |||||||||||||||
Operational carbon footprint, in kilotonnes CO2-equivalent | 1,640 | 1,678 | 1,521 | 1,417 | 1,344 | |||||||||||||||
Operational energy efficiency, in terajoules per million euro sales | 1.35 | 1.40 | 1.34 | 1.11 | 1.01 | |||||||||||||||
Total energy consumption in manufacturing, in terajoules1) | 12,014 | 11,963 | 11,257 | 9,702 | 8,987 | |||||||||||||||
Total carbon emissions in manufacturing, in kilotonnes CO2-equivalent | 563 | 518 | 468 | 371 | 323 | |||||||||||||||
Water intake, in thousands m3 | 3,137 | 3,289 | 3,103 | 2,727 | 2,414 | |||||||||||||||
Total waste, in kilotonnes1) | 80.6 | 75.9 | 75.0 | 68.5 | 64.8 | |||||||||||||||
Materials provided for recycling via external contractor per total waste, in % | 77 | % | 79 | % | 80 | % | 83 | % | 83 | % | ||||||||||
Restricted substances, in kilos | 67 | 37 | 29 | 26 | 7 | |||||||||||||||
Hazardous substances, in kilos | 67,530 | 35,118 | 28,310 | 25,101 | 12,412 | |||||||||||||||
ISO 14001 certification, as a % of all reporting organizations1) | 69 | % | 79 | % | 79 | % | 78 | % | 82 | % | ||||||||||
Employee Engagement Index, % favorable | 79 | % | 75 | % | 72 | % | 71 | % | 74 | % | ||||||||||
Female executives, in % of total | 14 | % | 15 | % | 18 | % | 19 | % | 18 | % | ||||||||||
Lost Workday Injuries, per 100 FTEs | 0.31 | 0.27 | 0.23 | 0.21 | 0.18 | |||||||||||||||
Fatalities | 7 | 3 | 1 | — | 2 | |||||||||||||||
Initial and continual conformance audits, number of audits | 159 | 200 | 203 | 195 | 226 | |||||||||||||||
Suppliers audits, compliance rate, in % | 75 | % | 77 | % | 86 | % | 86 | % | 89 | % | ||||||||||
|
| |||||||||||||||||||
| 1) | In manufacturing excluding new acquisitions |
Annual Report 2016 237
Five-year overview 13.1
13.1 Five-year overview (condensed)
Due to factors such as acquisitions and divestments, the amounts, percentages and ratios are not directly comparable.
Philips Group
Selected financial datain millions of EUR unless otherwise stated
2012 - 2016
|
| |||||||||||||||||||||||
| 2012 | 2013 | 2014 | 2015 | 2016 | 2016 | |||||||||||||||||||
|
| |||||||||||||||||||||||
| EUR | EUR | EUR | EUR | EUR | USD1) | |||||||||||||||||||
|
| |||||||||||||||||||||||
Sales | 22,234 | 21,990 | 21,391 | 24,244 | 24,516 | 25,820 | ||||||||||||||||||
Income from operations (EBIT) (loss) | 592 | 1,855 | 486 | 992 | 1,882 | 1,982 | ||||||||||||||||||
Financial income and expenses - net | (329 | ) | (330 | ) | (301 | ) | (369 | ) | (493 | ) | (519 | ) | ||||||||||||
Income (loss) from continuing operations | (166 | ) | 1,034 | 221 | 414 | 1,075 | 1,132 | |||||||||||||||||
Income (loss) from continuing operations attributable to shareholders | (171 | ) | 1,031 | 225 | 400 | 1,032 | 1,087 | |||||||||||||||||
Income (loss) from Discontinued operations | 136 | 138 | 190 | 245 | 416 | 438 | ||||||||||||||||||
Net income (loss) | (30 | ) | 1,172 | 411 | 659 | 1,491 | 1,570 | |||||||||||||||||
Net income (loss) attributable to shareholders | (35 | ) | 1,169 | 415 | 645 | 1,448 | 1,525 | |||||||||||||||||
Total assets | 29,081 | 26,559 | 28,352 | 30,976 | 32,303 | 34,022 | ||||||||||||||||||
Net assets | 11,185 | 11,227 | 10,968 | 11,780 | 13,508 | 14,227 | ||||||||||||||||||
Debt | 4,534 | 3,901 | 4,104 | 5,760 | 5,606 | 5,904 | ||||||||||||||||||
Provisions | 4,127 | 3,370 | 4,517 | 4,243 | 3,606 | 3,798 | ||||||||||||||||||
Shareholders’ equity | 11,151 | 11,214 | 10,867 | 11,662 | 12,601 | 13,271 | ||||||||||||||||||
Non-controlling interests | 34 | 13 | 101 | 118 | 907 | 955 | ||||||||||||||||||
Weighted average shares outstanding: | ||||||||||||||||||||||||
- basic2) | 922,101 | 911,072 | 915,193 | 916,087 | 918,016 | 918,016 | ||||||||||||||||||
- diluted2) | 927,222 | 922,072 | 922,714 | 923,625 | 928,789 | 928,789 | ||||||||||||||||||
Amount of common shares outstanding atyear-end2) | 914,591 | 913,338 | 914,389 | 917,104 | 922,437 | 922,437 | ||||||||||||||||||
Basic earnings per common share3) | ||||||||||||||||||||||||
Income (loss) from continuing operations attributable to shareholders | (0.19 | ) | 1.13 | 0.25 | 0.44 | 1.12 | 1.18 | |||||||||||||||||
Net income (loss) attributable to shareholders | (0.04 | ) | 1.28 | 0.45 | 0.70 | 1.58 | 1.66 | |||||||||||||||||
Diluted earnings per common share3) | ||||||||||||||||||||||||
Income (loss) from continuing operations attributable to shareholders | (0.19 | ) | 1.12 | 0.24 | 0.43 | 1.11 | 1.17 | |||||||||||||||||
Net income (loss) attributable to shareholders | (0.04 | ) | 1.27 | 0.45 | 0.70 | 1.56 | 1.64 | |||||||||||||||||
Dividend distributed per common share | 0.75 | 0.75 | 0.80 | 0.80 | 0.80 | 0.84 | ||||||||||||||||||
|
| |||||||||||||||||||||||
| 1) | For the convenience of the reader, the euro amounts have been converted into US dollars at the exchange rate used for balance sheet purposes at December 31, 2016 (USD 1 = EUR 0.9494. The US dollar amounts are unaudited.) Please refer to section 14.1, Key financials and dividend, of this report for high and low exchange rates for the previous six months and exchange rates for the five most recent financial years |
| 2) | In thousands of shares |
| 3) | In euros or US dollars as indicated in the header |
238 Annual Report 2016
Investor Relations 14
14.1 Key financials and dividend
Key financials
Net income attributable to shareholders of Koninklijke Philips N.V. in 2016 was EUR 1,448 million, or EUR 1.56 per common share (diluted; basic EUR 1.58 per common share). This compares to EUR 645 million, or EUR 0.70 per common share (diluted; basic EUR 0.70 per common share), in 2015.
Philips Group
Net income attributable to shareholdersin millions of EUR
2012 - 2016
Philips Group
Income from operations (EBIT) and Adjusted income from
operations1)in millions of EUR
2012 - 2016
| 1) | Non-GAAP financial measure. For the definition and reconciliation to the most directly comparable GAAP measure, refer tochapter 4, Reconciliation ofnon-GAAP information, of this report |
Philips Group
Total of Net cash provided by operating activities and Net
capital expendituresin millions of EUR
2012 - 2016
Dividend policy
Philips’ dividend policy is aimed at dividend stability and apay-out ratio of 40% to 50% of net income after adjustments.
Net income after adjustments is the base figure used to calculate the dividendpay-out for the year. For 2016, the key exclusions to arrive at net income after adjustments are the following: the results that are shown as Discontinued operations, income from a pension settlement, a charge related to the currency revaluation of the provision for the Masimo litigation, financial charges related to bond redemptions, and a release in financial income and expense related to the Masimo settlement. Restructuring, acquisition-related and separation related charges are also excluded.
Proposed distribution
A proposal will be submitted to the Annual General Meeting of Shareholders, to be held on May 11, 2017, to declare a distribution of EUR 0.80 per common share (up to EUR 745 million), in cash or shares at the option of the shareholder, against the net income for 2016.
If the above dividend proposal is adopted, the shares will be tradedex-dividend as of May 12, 2017 and May 15, 2017 at the New York Stock Exchange and Euronext Amsterdam, respectively. In compliance with the listing requirements of the New York Stock Exchange and the stock market of Euronext Amsterdam, the dividend record date will be May 16, 2017.
Shareholders will be given the opportunity to make their choice between cash and shares between May 17, 2017 and June 9, 2017. If no choice is made during this election period the dividend will be paid in cash. On June 9, 2017 after close of trading, the number of share dividend rights entitled to one new common share will be determined based on the volume-weighted average
Annual Report 2016 239
Investor Relations 14.1
price of all traded common shares of Koninklijke Philips N.V. at Euronext Amsterdam on June 7, 8 and 9, 2017. The company will calculate the number of share dividend rights entitled to one new common share (the ratio), such that the gross dividend in shares will be approximately equal to the gross dividend in cash. The ratio and the number of shares to be issued will be announced on June 13, 2017. Payment of the dividend and delivery of new common shares, with settlement of fractions in cash, if required, will take place from June 14, 2017. The distribution of dividend in cash to holders of New York Registry shares will be made in USD at the USD/EUR rate as per WM/ Reuters FX Benchmark 2 PM CET fixing of June 12, 2017.
Further details will be given in the agenda for the 2017 Annual General Meeting of Shareholders. All dates mentioned remain provisional until then.
Dividend in cash is in principle subject to 15% Dutch dividend withholding tax, which will be deducted from the dividend in cash paid to the shareholders. Dividend in shares paid out of net income and retained earnings is subject to 15% dividend withholding tax, but only in respect of the par value of the shares (EUR 0.20 per share). Shareholders are advised to consult their tax advisor on the applicable situation with respect to taxes on the dividend received.
In 2016, a dividend of EUR 0.80 per common share was paid in cash or shares, at the option of the shareholder. For 55.0% of the shares, the shareholders elected for a share dividend, resulting in the issue of 17,344,462 new common shares, leading to a 1.9% dilution. EUR 330 million was paid in cash. See alsosection 2.4, Proposed distribution to shareholders, of this report.
| ex-dividend date | record date | payment date | ||||||||||
Euronext Amsterdam | May 15, 2017 | May 16, 2017 | June 14, 2017 | |||||||||
New York Stock Exchange | May 12, 2017 | May 16, 2017 | June 14, 2017 | |||||||||
Philips Group
Dividend and dividend yield per common share
2007 - 2017
| 1) | Dividend yield % is as of December 31 of previous year |
| 2) | Subject to approval by the Annual General Meeting of Shareholders in 2017 |
Information for investors in New York Registry shares program
Dividends and distributions per common share
The following table sets forth in euros the gross dividends on the common shares in the fiscal years indicated (from prior-year profit distribution) and such amounts as converted into US dollars and paid to holders of shares of the New York Registry:
Philips Group
Gross dividends on the common shares
2012 - 2016
|
| |||||||||||||||||||
| 2012 | 2013 | 2014 | 2015 | 2016 | ||||||||||||||||
|
| |||||||||||||||||||
in EUR | 0.75 | 0.75 | 0.80 | 0.80 | 0.80 | |||||||||||||||
in USD | 0.94 | 0.98 | 1.09 | 0.89 | 0.90 | |||||||||||||||
|
| |||||||||||||||||||
Exchange rates USD : EUR
The following two tables set forth, for the periods and dates indicated, certain information concerning the exchange rate for US dollars into euros based on the Noon Buying Rate in New York City for cable transfers in foreign currencies as certified for customs purposes by the Federal Reserve Bank of New York (the “Noon Buying Rate”). The Noon Buying Rate on February 10, 2017 was EUR 0.9389 per USD 1.
Exchange rate (based on the “Noon Buying Rate”)
EUR per USD
2012 - 2016
|
| |||||||||||||||
| period end | average | high | low | |||||||||||||
|
| |||||||||||||||
2012 | 0.7584 | 0.7782 | 0.8290 | 0.7428 | ||||||||||||
2013 | 0.7257 | 0.7532 | 0.7828 | 0.7238 | ||||||||||||
2014 | 0.8264 | 0.7533 | 0.8264 | 0.7180 | ||||||||||||
2015 | 0.9209 | 0.9018 | 0.9502 | 0.8323 | ||||||||||||
2016 | 0.9477 | 0.9037 | 0.9639 | 0.8684 | ||||||||||||
|
| |||||||||||||||
240 Annual Report 2016
Investor Relations 14.1
Exchange rate per month (based on the “Noon Buying Rate”)
EUR per USD
2016 - 2017
|
| |||||||
| highest rate | lowest rate | |||||||
|
| |||||||
August, 2016 | 0.9027 | 0.8823 | ||||||
September, 2016 | 0.8962 | 0.8872 | ||||||
October, 2016 | 0.9203 | 0.8919 | ||||||
November, 2016 | 0.9470 | 0.8992 | ||||||
December, 2016 | 0.9639 | 0.9295 | ||||||
January, 2017 | 0.9601 | 0.9264 | ||||||
|
| |||||||
Unless otherwise stated, for the convenience of the reader, the translations of euros into US dollars appearing in this section have been made based on the closing rate on December 31, 2016 (USD 1 = EUR 0.9495). This rate is not materially different from the Noon Buying Rate on such date (USD 1 = EUR 0.9477).
The following table sets out the exchange rate for US dollars into euros applicable for translation of Philips’ financial statements for the periods specified.
Exchange rate (based on Philips’ consolidation rate)
EUR per USD
2012 - 2016
|
| |||||||||||||||
| period end | average | high | low | |||||||||||||
|
| |||||||||||||||
2012 | 0.7582 | 0.7776 | 0.8166 | 0.7500 | ||||||||||||
2013 | 0.7255 | 0.7527 | 0.7805 | 0.7255 | ||||||||||||
2014 | 0.8227 | 0.7527 | 0.8227 | 0.7201 | ||||||||||||
2015 | 0.9151 | 0.9007 | 0.9410 | 0.8796 | ||||||||||||
2016 | 0.9495 | 0.9078 | 0.9495 | 0.8812 | ||||||||||||
|
| |||||||||||||||
Market capitalization
Philips’ market capitalization was EUR 26.8 billion atyear-end 2016. On December 31, 2016, the closing price for shares in Amsterdam was EUR 29.00 and the number of common shares outstanding (after deduction of treasury shares) amounted to 922 million.
Philips Group
Market capitalizationin billions of EUR
2012 - 2016
Share capital structure
During 2016, Philips’ issued share capital decreased by approximately 1 million common shares to approximately 930 million common shares. The main
reasons for this are the cancellation of 18,829,985 Philips shares acquired pursuant to the EUR 1.5 billion share repurchase program (which was completed in October 2016) and the issuance of 17,344,462 shares related to the elective dividend. The number of common shares issued and outstanding increased from 917 million at December 31, 2015 to 922 million on December 31, 2016. On December 31, 2016, the shares held in treasury amounted to approximately 7 million, all of which are held by Philips to cover long-term incentive and employee stock purchase plans.
The Dutch Act on Financial Supervision imposes an obligation on persons holding certain interests to disclose (inter alia) percentage holdings in the capital and/or voting rights in the Company when such holdings reach, exceed or fall below 3, 5, 10, 15, 20, 25, 30, 40, 50, 60, 75 and 95 percent (as a result of an acquisition or disposal by a person, or as a result of a change in the company’s total number of voting rights or capital issued). Certain derivatives (settled in kind or in cash) are also taken into account when calculating the capital interest. The statutory obligation to disclose capital interest does not only relate to gross long positions, but also to gross short positions. Required disclosures must be made to the Netherlands Authority for the Financial Markets (AFM) without delay. The AFM then notifies the Company of such disclosures and includes them in a register which is published on the AFM’s website. Furthermore, an obligation to disclose (net) short positions is set out in the EU Regulation on Short Selling.
The AFM register shows the following notification of substantial holdings and/or voting rights at or above the 3% threshold: BlackRock, Inc.: substantial holding of 5.03% and 6.19% of the voting rights (January 5, 2017).
The following shareholder portfolio information is based on information provided by several large custodians and a survey conducted in December 2016.
Philips Group
Shareholders by region (approximated)1)in %
2016
| 1) | Split based on identified shares in shareholder identification |
| 2) | Includes countries in Western Europe with a shareholding of less than 5 % |
Annual Report 2016 241
Investor Relations 14.2
Philips Group
Shareholders by style (approximated)1)in %
2016
| 1) | Split based on identified shares in shareholder identification |
| 2) | Growth at a reasonable price |
| 3) | Sovereign Wealth Funds |
Share repurchase programs
Share repurchases for capital reduction purposes
On September 17, 2013, Royal Philips announced a EUR 1.5 billion share repurchase program. This program started on October 21, 2013 and was completed by October 20, 2016. The shares repurchased under this program were held by Philips as treasury shares until they were cancelled. As of December 31, 2016 all treasury shares that were repurchased under this program were cancelled.
Share repurchases related toLong-Term Incentive (LTI) and employee stock purchase programs
To cover outstanding obligations resulting from past and present long-term incentive (LTI) programs, Philips repurchases Philips shares from time to time, on
Euronext Amsterdam or otherwise. The shares repurchased to such LTI positions will be held by Philips as treasury shares until these are distributed to participants. In order to repurchase shares for covering LTI programs, Philips may enter into discretionary management agreements with one or more banks within the limits of relevant laws and regulations (in particular the EU Market Abuse Regulation and Philips’ Articles of Association.
In 2016, Philips repurchased a total of 8.6 million shares for LTI coverage. During 2017, Philips may continue with additional repurchases, the size of which will depend on the movement of the Philips share price.
Further details on the share repurchase programs can be found on the Investor Relations website. For more information seechapter 9, Corporate governance, of this report.
In 2016 Philips purchased call options on Philips’ shares matching the majority of the options granted to employees until 2013. As of December 31, 2016 Philips held 14.1 million call options as a hedge of 15.9 million remaining options granted to employees.
A total of 7,208,301 shares were held in treasury by the Company at December 31, 2016 (2015: 14,026,801 shares). As of that date, a total of 33.5 million rights under long-term incentive plans were outstanding (2015: 39.1 million).
Philips Group
Impact of share repurchases on share countin thousands of shares
2012 - 2016
|
| |||||||||||||||||||
| 2012 | 2013 | 2014 | 2015 | 2016 | ||||||||||||||||
|
| |||||||||||||||||||
Shares issued | 957,133 | 937,846 | 934,820 | 931,131 | 929,645 | |||||||||||||||
Shares in treasury | 42,542 | 24,508 | 20,431 | 14,027 | 7,208 | |||||||||||||||
Shares outstanding | 914,591 | 913,338 | 914,389 | 917,104 | 922,437 | |||||||||||||||
Shares repurchased | 46,871 | 27,811 | 28,538 | 20,296 | 25,193 | |||||||||||||||
Shares cancelled | 82,365 | 37,779 | 21,838 | 21,361 | 18,830 | |||||||||||||||
|
| |||||||||||||||||||
Philips Group
Total number of shares repurchased
2016
|
| |||||||||||||||||||||||
share reduction | average price EUR | share program | average price EUR | total number of shares | average price EUR | |||||||||||||||||||
|
| |||||||||||||||||||||||
January, 2016 | 1,648,906 | 22.79 | 57,094 | 23.92 | 1,706,000 | 22.83 | ||||||||||||||||||
February, 2016 | 1,974,965 | 22.67 | 1,014,035 | 22.63 | 2,989,000 | 22.65 | ||||||||||||||||||
March, 2016 | 1,703,020 | 24.42 | 1,059,980 | 24.31 | 2,763,000 | 24.38 | ||||||||||||||||||
April, 2016 | 2,195,278 | 24.35 | 1,158,953 | 24.32 | 3,354,231 | 24.34 | ||||||||||||||||||
May, 2016 | 1,474,221 | 23.27 | 480,216 | 23.23 | 1,954,437 | 23.26 | ||||||||||||||||||
June, 2016 | 2,121,090 | 22.69 | 593,910 | 22.69 | 2,715,000 | 22.69 | ||||||||||||||||||
July, 2016 | 2,047,077 | 23.25 | 929,385 | 22.76 | 2,976,462 | 23.10 | ||||||||||||||||||
August, 2016 | 1,171,365 | 24.92 | 643,418 | 25.00 | 1,814,783 | 24.95 | ||||||||||||||||||
September, 2016 | 1,200,653 | 25.94 | 439,347 | 25.94 | 1,640,000 | 25.94 | ||||||||||||||||||
October, 2016 | 1,055,410 | 26.34 | 634,088 | 26.54 | 1,689,498 | 26.41 | ||||||||||||||||||
November, 2016 | — | — | 679,000 | 27.16 | 679,000 | 27.16 | ||||||||||||||||||
December, 2016 | — | — | 912,000 | 28.39 | 912,000 | 28.39 | ||||||||||||||||||
|
| |||||||||||||||||||||||
| 1) | The program was completed |
242 Annual Report 2016
Investor Relations 14.3
Philips’ existing long-term debt is rated BBB+ (with stable outlook) by Standard & Poor’s and Baa1 (with stable outlook) by Moody’s. As part of its capital allocation policy, Philips is committed to a strong investment grade credit rating. There is no assurance that Philips will be able to achieve this goal. Ratings are subject to change at any time. Adverse changes in the Company’s ratings will not trigger any acceleration in the outstanding long-term debt nor automatic withdrawal of the committed credit facilities.
Philips Group
Credit rating summary
2016
| long-term | short-term | outlook | ||||||||||
Standard & Poor’s | BBB+ | A-2 | Stable | |||||||||
Moody’s | Baa1 | P-2 | Stable | |||||||||
14.4 Performance in relation to marketindices
The common shares of the Company are listed on the stock market of Euronext Amsterdam. The New York Registry Shares of the Company, representing common shares of the Company, are listed on the New York Stock Exchange. The principal market for the common shares is Euronext Amsterdam. For the New York Registry Shares it is the New York Stock Exchange.
The following table shows the high and low closing prices of the common shares on the stock market of Euronext Amsterdam as reported in the Official Price List and the high and low closing prices of the New York Registry Shares on the New York Stock Exchange:
Philips Group
High and low closing price of common shares
2012 - 2017
|
| |||||||||||||||||||
| Euronext Amsterdam (EUR) | New York Stock Exchange (USD) | |||||||||||||||||||
|
|
|
| |||||||||||||||||
| high | low | high | low | |||||||||||||||||
|
| |||||||||||||||||||
January, 2017 | 29.40 | 27.14 | 30.74 | 29.10 | ||||||||||||||||
December, 2016 | 29.07 | 26.60 | 30.57 | 28.22 | ||||||||||||||||
November, 2016 | 27.90 | 26.50 | 30.55 | 28.61 | ||||||||||||||||
October, 2016 | 27.73 | 26.12 | 30.19 | 28.43 | ||||||||||||||||
September, 2016 | 26.70 | 25.25 | 29.97 | 28.34 | ||||||||||||||||
August, 2016 | 26.18 | 23.51 | 29.11 | 26.28 | ||||||||||||||||
2016 | 4th quarter | 29.07 | 26.12 | 30.57 | 28.22 | |||||||||||||||
| 3rd quarter | 26.70 | 21.58 | 29.97 | 24.05 | ||||||||||||||||
| 2nd quarter | 25.20 | 21.01 | 28.58 | 23.29 | ||||||||||||||||
| 1st quarter | 25.13 | 20.95 | 28.58 | 23.68 | ||||||||||||||||
2015 | 4th quarter | 25.88 | 21.09 | 27.29 | 23.66 | |||||||||||||||
| 3rd quarter | 25.71 | 20.79 | 28.23 | 23.19 | ||||||||||||||||
| 2nd quarter | 27.65 | 22.82 | 30.08 | 25.46 | ||||||||||||||||
| 1st quarter | 27.40 | 23.16 | 30.31 | 27.54 | ||||||||||||||||
2014 | 4th quarter | 24.68 | 20.98 | 31.02 | 26.36 | |||||||||||||||
| 3rd quarter | 25.27 | 22.11 | 32.39 | 29.80 | ||||||||||||||||
| 2nd quarter | 25.86 | 22.22 | 35.95 | 30.35 | ||||||||||||||||
| 1st quarter | 28.10 | 23.88 | 38.36 | 33.13 | ||||||||||||||||
2013 | 4th quarter | 26.78 | 23.17 | 36.97 | 31.36 | |||||||||||||||
| 3rd quarter | 25.32 | 20.89 | 33.60 | 27.28 | ||||||||||||||||
| 2nd quarter | 23.48 | 20.36 | 30.65 | 26.75 | ||||||||||||||||
| 1st quarter | 23.67 | 20.26 | 31.72 | 26.60 | ||||||||||||||||
2012 | 20.33 | 18.27 | 26.81 | 23.52 | ||||||||||||||||
|
| |||||||||||||||||||
Annual Report 2016 243
Investor Relations 14.4
Euronext Amsterdam
Philips Group
Share price development in Euronext Amsterdamin EUR
2015 - 2016
| ||||||||||||||||||||||||||||||||||||||||||||||||
| PHIA | Jan | Feb | Mar | Apr | May | Jun | Jul | Aug | Sep | Oct | Nov | Dec | ||||||||||||||||||||||||||||||||||||
2016 | ||||||||||||||||||||||||||||||||||||||||||||||||
High | 24.50 | 24.33 | 25.13 | 25.20 | 24.33 | 24.11 | 24.39 | 26.18 | 26.70 | 27.73 | 27.90 | 29.07 | ||||||||||||||||||||||||||||||||||||
Low | 22.15 | 20.95 | 23.56 | 23.55 | 22.57 | 21.01 | 21.58 | 23.51 | 25.25 | 26.12 | 26.50 | 26.60 | ||||||||||||||||||||||||||||||||||||
Average | 22.98 | 22.47 | 24.37 | 24.50 | 23.34 | 22.80 | 23.15 | 25.05 | 26.08 | 26.67 | 27.20 | 28.18 | ||||||||||||||||||||||||||||||||||||
Average daily volume1) | 10.58 | 8.31 | 6.81 | 5.96 | 5.58 | 6.67 | 5.94 | 5.41 | 5.92 | 5.73 | 6.94 | 5.27 | ||||||||||||||||||||||||||||||||||||
2015 | ||||||||||||||||||||||||||||||||||||||||||||||||
High | 26.80 | 26.77 | 27.40 | 27.65 | 25.44 | 24.94 | 25.32 | 25.71 | 23.29 | 24.59 | 25.88 | 25.49 | ||||||||||||||||||||||||||||||||||||
Low | 23.16 | 24.54 | 25.98 | 25.66 | 24.24 | 22.82 | 22.38 | 21.94 | 20.79 | 21.09 | 24.40 | 23.19 | ||||||||||||||||||||||||||||||||||||
Average | 24.49 | 25.45 | 26.64 | 26.96 | 24.96 | 23.94 | 23.97 | 24.19 | 22.11 | 22.71 | 25.05 | 24.06 | ||||||||||||||||||||||||||||||||||||
Average daily volume1) | 9.26 | 5.64 | 5.86 | 7.66 | 6.96 | 8.79 | 7.30 | 6.88 | 6.75 | 6.00 | 6.08 | 6.05 | ||||||||||||||||||||||||||||||||||||
|
| |||||||||||||||||||||||||||||||||||||||||||||||
| 1) | In millions of shares |
New York Stock Exchange
Philips Group
Share price development in New York Stock Exchangein USD
2015 - 2016
| ||||||||||||||||||||||||||||||||||||||||||||||||
| PHG | Jan | Feb | Mar | Apr | May | Jun | Jul | Aug | Sep | Oct | Nov | Dec | ||||||||||||||||||||||||||||||||||||
2016 | ||||||||||||||||||||||||||||||||||||||||||||||||
High | 26.68 | 26.57 | 28.58 | 28.58 | 27.62 | 27.11 | 26.74 | 29.11 | 29.97 | 30.19 | 30.55 | 30.57 | ||||||||||||||||||||||||||||||||||||
Low | 24.04 | 23.68 | 26.08 | 26.74 | 24.97 | 23.29 | 24.05 | 26.28 | 28.34 | 28.43 | 28.61 | 28.22 | ||||||||||||||||||||||||||||||||||||
Average | 24.94 | 24.98 | 27.21 | 27.76 | 26.29 | 25.67 | 25.58 | 28.04 | 29.20 | 29.35 | 29.31 | 29.70 | ||||||||||||||||||||||||||||||||||||
Average daily volume1) | 1.72 | 1.73 | 1.71 | 1.26 | 1.00 | 1.23 | 1.98 | 1.92 | 1.41 | 1.10 | 1.41 | 1.45 | ||||||||||||||||||||||||||||||||||||
2015 | ||||||||||||||||||||||||||||||||||||||||||||||||
High | 30.31 | 30.10 | 29.80 | 30.08 | 28.77 | 27.99 | 27.81 | 28.23 | 25.86 | 26.94 | 27.29 | 27.14 | ||||||||||||||||||||||||||||||||||||
Low | 27.54 | 27.80 | 27.83 | 28.57 | 27.29 | 25.46 | 24.87 | 24.79 | 23.19 | 23.66 | 26.05 | 25.41 | ||||||||||||||||||||||||||||||||||||
Average | 28.49 | 28.96 | 28.85 | 29.17 | 27.90 | 26.83 | 26.35 | 26.84 | 24.75 | 25.50 | 26.82 | 26.21 | ||||||||||||||||||||||||||||||||||||
Average daily volume1) | 1.34 | 0.80 | 0.77 | 1.56 | 1.16 | 1.73 | 2.04 | 1.77 | 1.60 | 1.21 | 0.93 | 0.90 | ||||||||||||||||||||||||||||||||||||
|
| |||||||||||||||||||||||||||||||||||||||||||||||
| 1) | In millions of shares |
Philips Group
Share information
Share listings | Amsterdam, New York | |||
Ticker code | PHIA, PHG | |||
No. of shares issued at Dec. 31, 2016 | 930 million | |||
No. of shares outstanding issued at Dec. 31, 2016 | 922 million | |||
Market capitalization atyear-end 2016 | EUR 26.8 billion | |||
Industry classification | ||||
MSCI: Capital Goods | 20105010 | |||
ICB: Medical Equipment | 4535 | |||
Members of indices | AEX, NYSE, DJSI, and others | |||
244 Annual Report 2016
Investor Relations 14.4
Philips Group
Relative performance: Philips and AEX (indexed)
2016
Philips Group
Relative performance: Philips and Dow Jones Industrial Average (indexed)
2016
Philips Group
Relative performance: Philips and unweighted peer group index (indexed)1)
2016
| 1) | The peer group companies are separately indexed, and then an unweighted average of these indexed values is used. |
| 2) | The peer group consists of: 3M, ABB, Danaher, Eaton, Electrolux, Emerson, General Electric, Hitachi, Honeywell, Johnson Control, Johnson & Johnson, Legrand, LG Electronics, Medtronic, Panasonic, Procter & Gamble, Schneider, Siemens, Smiths Group, Toshiba. The index shows the unweighted average closing share prices of the peer group. This graph is not linked to the TSR performance calculation as part of the Long-Term Incentive Plan. |
Annual Report 2016 245
Investor Relations 14.5
| Financial calendar | ||
Annual General Meeting of Shareholders | ||
Record date Annual General Meeting of Shareholders | April 13, 2017 | |
Annual General Meeting of Shareholders | May 11, 2017 | |
Quarterly reports | ||
First quarter results 2017 | April 24, 2017 | |
Second quarter results 2017 | July 24, 2017 | |
Third quarter results 2017 | October 23, 2017 | |
Fourth quarter results 2017 | January 23, 20181) | |
| 1) | Subject to final confirmation |
Shareholder services
Holders of shares listed on Euronext Amsterdam
Non-US shareholders and othernon-US interested parties can make inquiries about the Annual Report 2016 to:
Royal Philips
Annual Report Office
Philips Center, HBT 12
P.O. Box 77900
1070 MX Amsterdam, The Netherlands
E-mail:annual.report@philips.com
Communications concerning share transfers, lost certificates, dividends and change of address should be directed to:
ABN AMRO Bank N.V.
Department Equity Capital Markets/Corporate Broking
HQ7050
Gustav Mahlerlaan 10, 1082 PP Amsterdam
The Netherlands
Telephone:+31-20-34 42000
Fax:+31-20-62 88481
E-mail:corporate.broking@nl.abnamro.com
Holders of New York Registry shares
Holders of New York Registry shares and other interested parties in the US can make inquiries about the Annual Report 2016 to:
Citibank Shareholder Service
P.O. Box 43077 Providence, Rhode Island 02940-3077
Telephone:1-877-CITI-ADR (toll-free)
Telephone:1-781-575-4555 (outside of US)
Fax:1-201-324-3284
Website:www.citi.com/dr
E-mail:citibank@shareholders-online.com
Communications concerning share transfers, lost certificates, dividends and change of address should be directed to Citibank. The Annual Report on Form20-F is filed electronically with the US Securities and Exchange Commission.
International direct investment program
Philips offers a dividend reinvestment and direct share purchase plan designed for the US market. This program provides existing shareholders and interested investors with an economical and convenient way to purchase and sell Philips New York Registry shares and to reinvest cash dividends. Philips does not administer or sponsor the program and assumes no obligation or liability for the operation of the plan. For further information on this program and for enrollment forms, contact:
Citibank Shareholder Service
Telephone:1-877-248-4237(1-877-CITI-ADR)
Monday through Friday 8:30 AM EST
through 6:00 PM EST
Websitewww.citi.com/dr
E-mail:citibank@shareholders-online.com
or by writing to:
Citibank Shareholder Service
International Direct Investment Program
P.O. Box 2502, Jersey City, NJ07303-2502
2017 Annual General Meeting of Shareholders
The Agenda and the explanatory notes to the Agenda for the Annual General Meeting of Shareholders on May 11, 2017, will be published on the Company’s website.
For the 2017 Annual General Meeting of Shareholders, a record date of April 13, 2017 will apply. Those persons who, on that date, hold shares in the Company, and are registered as such in one of the registers designated by the Board of Management for the Annual General Meeting of Shareholders, will be entitled to participate in, and vote at, the meeting.
Investor Relations activities
From time to time the Company communicates with investors via road shows, broker conferences and a Capital Markets Day, announced in advance on the Company’s website. The purpose of these engagements is to inform the market of the results, strategy and decisions made, as well as to receive feedback from shareholders. Furthermore, the Company engages in bilateral communications with investors. These take place either at the initiative of the Company or at the initiative of investors. The Company is generally represented by its Investor Relations department during these interactions, however, on a limited number of occasions the Investor Relations department is accompanied by one or more members of the senior management. The subject matter of the bilateral communications ranges from individual queries from investors to more elaborate discussions following disclosures that the Company has made, such as its annual and quarterly reports. Also here, the Company is strict in its compliance with applicable rules and regulations on fair andnon-selective disclosure and equal treatment of shareholders.
246 Annual Report 2016
Investor Relations 14.6
More information on the activities of Investor Relations can be found in chapter 9, Corporate governance, of this report.
Analysts’ coverage
Philips is covered by approximately 24 analysts who frequently issue reports on the company. For a list of our current analysts, please refer to:www.philips.com/a-w/about/investor/shareholder-info/analyst-coverage.html
How to reach us
The registered office of Royal Philips is
High Tech Campus 5
5656 AE Eindhoven, The Netherlands
Switch board, telephone:+31-40-27 91111
Investor Relations contact
Royal Philips
Philips Center
P.O. Box 77900
1070 MX Amsterdam, The Netherlands
Telephone:+31-20-59 77222
Website:www.philips.com/investor
E-mail:investor.relations@philips.com
Pim Preesman
Head of Investor Relations
Telephone:+31-20-59 77222
Ksenija Gonciarenko
Investor Relations Manager
Telephone:+31-20-59 77055
Sustainability contact
Philips Group Sustainability
High Tech Campus 5 (room 2.67)
5656 AE Eindhoven, The Netherlands
Telephone:+31-40-27 83651
Website:www.philips.com/sustainability
E-mail:philips.sustainability@philips.com
Group Press Office contact
Royal Philips
Philips Center, HBT 19
Amstelplein 2
1096 BC Amsterdam, The Netherlands
E-mail:group.communications@philips.com
For media contacts please refer to:
www.newscenter.philips.com/main/standard/news/contacts
Dutch taxation
The statements below are only a general summary of certain material Dutch tax consequences for holders of common shares arenon-residents of the Netherlands based on present Dutch tax laws and the Tax Convention of December 18, 1992, as amended by the protocol that entered into force on December 28, 2004, between the United States of America and the Kingdom of the Netherlands (the US Tax Treaty) and are not to be read as extending by implication to matters not specifically referred to herein. As to individual tax consequences, investors in common shares should consult their own professional tax advisor.
A holder of common shares is an individual who receives income or derives capital gains from common shares and this income received or capital gains derived are attributable to past, present or future employment activities of such holder, the income of which is taxable in the Netherlands.
Dividend withholding tax
In general, a distribution to shareholders by a company resident in the Netherlands (such as the Company) is subject to a withholding tax imposed by the Netherlands at a rate of 15%. Share dividends paid out of the Company’spaid-in share premium recognized for Dutch tax purposes are not subject to the above-mentioned withholding tax. Share dividends paid out of the Company’s retained earnings are subject to dividend withholding tax on the nominal value of the shares issued. Pursuant to the provisions of the US Tax Treaty, a reduced rate may be applicable in respect of dividends paid by the Company to a beneficial owner holding directly 10% or more of the voting power of the Company, if such owner is a company resident in the United States (as defined in the US Tax Treaty) and entitled to the benefits of the US Tax Treaty.
Pursuant to Dutch anti-dividend stripping legislation, a holder of common shares who is the recipient of dividends will generally not be considered the beneficial owner of the dividends if (i) as a consequence of a combination of transactions, a person other than the recipient benefits, in full or in part, directly or indirectly, from the dividends; (ii) whereby such other person retains, directly or indirectly, an interest similar to that in the common shares on which the dividends were paid; and (iii) that other person is entitled to a credit, reduction or refund of dividend withholding tax that is less than that of the recipient.
Dividends paid to qualifying exempt US pension trusts and qualifying exempt US organizations are, under certain conditions, exempt from Dutch withholding tax under the US Tax Treaty. Qualifying exempt US pension trusts normally remain subject to withholding at the rate of 15% and are required to file for a refund of the tax withheld. Only if certain conditions are fulfilled, such pension trusts may be eligible for relief at source upon
Annual Report 2016 247
Investor Relations 14.7
payment of the dividend. However, for qualifying exempt US organizations no relief at source upon payment of the dividend is currently available; such exempt US organizations should apply for a refund of the 15% withholding tax withheld. Further, under certain circumstances, certain exempt organizations (e.g. pension funds) may be eligible for a refund of Dutch withholding tax upon their request pursuant to Dutch tax law. Under proposed Dutch tax law (not yet entered into force as per January 1, 2017), provided certain conditions are met, such (US) organizations may be eligible for relief at source upon request.
Upon request and under certain conditions, certain qualifyingnon-resident individual and corporate holders of common shares resident in EU/EEA member states or in a qualifyingnon-EU/EEA state may be eligible for a refund of Dutch dividend withholding tax to the extent that the withholding tax levied is higher than the personal and corporate income tax which would have been due if they were resident in the Netherlands.
The Company may, with respect to certain dividends received from qualifyingnon-Dutch subsidiaries, credit taxes withheld from those dividends against the Dutch withholding tax imposed on certain qualifying dividends that are redistributed by the Company, up to a maximum of the lesser of:
3% of the amount of qualifying dividends redistributed by the Company; and
3% of the gross amount of certain qualifying dividends received by the Company.
The reduction is applied to the Dutch dividend withholding tax that the Company must pay to the Dutch tax authorities and not to the Dutch dividend withholding tax that the Company must withhold.
Income and capital gains
Income and capital gains derived from the common shares by anon-resident individual ornon-resident corporate shareholder are generally not subject to Dutch income or corporation tax, unless (i) such income and gains are attributable to a (deemed) permanent establishment or (deemed) permanent representative in the Netherlands; or (ii) the shareholder is entitled to a share in the profits of an enterprise or (in the case of anon-resident corporate shareholder only) a co-entitlement to the net worth of an enterprise that is effectively managed in the Netherlands (other than by way of securities) and to which enterprise the common shares are attributable; or (iii) such income and capital gains are derived from a direct, indirect or deemed substantial participation in the share capital of the company (such substantial participation not being a business asset), and, in the case of anon-resident corporate shareholder only, it being held with the primary aim or one of the primary aims to avoid the levy of income tax or dividend withholding tax from another person and is not put in place without valid commercial reasons that reflect economic reality; or (iv) in the case of anon-resident corporate shareholder, such shareholder is a resident of Aruba, Curacao or Saint Martin with a permanent establishment or permanent representative in Bonaire, Eustatius or Saba to which the common shares are attributable and certain conditions are met; or (v) in the case of anon-resident individual, such individual derives income or capital gains from the common shares that are taxable as benefits from ‘miscellaneous activities’ in the Netherlands (resultaat uit overige werkzaamheden, as defined in the Dutch Income Tax Act 2001), which includes the performance of activities with respect to the common shares that exceed regular portfolio management.
In general, a holder of common shares has a substantial participation if he holds either directly or indirectly and either independently or jointly with his partner (as defined in the Dutch Income Tax Act 2001), the ownership of, or certain other rights over, at least 5% of the total issued share capital or total issued particular class of shares of the Company or rights to acquire direct or indirect shares, whether or not already issued, that represent at any time 5% or more of the total issued capital (or the total issued particular class of shares) or the ownership of certain profit participating certificates that relate to 5% or more of the annual profit or to 5% or more of the liquidation proceeds. A shareholder will also have a substantial participation in the Company if one or more of certain relatives of the shareholder hold a substantial participation in the Company. A deemed substantial participation amongst others exists if (part of) a substantial participation has been disposed of, or is deemed to have been disposed of, on a non-recognition basis.
Estate and gift taxes
No estate, inheritance or gift taxes are imposed by the Netherlands on the transfer or deemed transfer of common shares by way of gift by or on the death of a shareholder if, at the time of the death of the shareholder or the gift of the common shares (as the case may be), such shareholder is not a (deemed) resident of the Netherlands.
Inheritance or gift taxes (as the case may be) are due, however, if such shareholder:
has Dutch nationality and has been a resident of the Netherlands at any time during the ten years preceding the time of their death or gift; or
does not have Dutch nationality but has been a resident of the Netherlands at any time during the twelve months preceding the time of the gift (for Netherlands gift taxes only).
United States Federal Taxation
This section describes the material United States federal income tax consequences to a US holder (as defined below) of owning common shares. It applies only if the common shares are held as capital assets for
248 Annual Report 2016
Investor Relations 14.7
tax purposes. This section does not apply to a member of a special class of holders subject to special rules, including:
a dealer in securities,
a trader in securities that elects to use amark-to-market method of accounting for securities holdings,
atax-exempt organization,
a life insurance company,
a person liable for alternative minimum tax,
a person who actually or constructively owns 10% or more of our voting stock,
a person who holds common shares as part of a straddle or a hedging or conversion transaction,
a person who purchases or sells common shares as part of a wash sale for tax purposes, or
a person whose functional currency is not the US dollar.
This section is based on the Internal Revenue Code of 1986, as amended, its legislative history, existing and proposed regulations, published rulings and court decisions, all as currently in effect, as well as on the US Tax Treaty. These laws and regulations are subject to change, possibly on a retroactive basis.
If a partnership holds the common shares, the United States federal income tax treatment of a partner will generally depend on the status of the partner and the tax treatment of the partnership. A partner in a partnership holding the common shares should consult its tax advisor with regard to the United States federal income tax treatment of an investment in the common shares.
A US holder is defined as a beneficial owner of common shares that is:
a citizen or resident of the United States,
a domestic corporation,
an estate whose income is subject to United States federal income tax regardless of its source, or
a trust if a United States court can exercise primary supervision over the trust’s administration and one or more United States persons are authorized to control all substantial decisions of the trust.
A US holder should consult its own tax advisor regarding the United States federal, state and local and other tax consequences of owning and disposing of common shares in its particular circumstances.
This discussion addresses only United States federal income taxation.
Taxation of Dividends
Under the United States federal income tax laws, the gross amount of any dividend paid in stock or cash out of our current or accumulated earnings and profits (as determined for United States federal income tax purposes) is subject to United States federal income taxation. For anon-corporate US holder, dividends paid that constitute qualified dividend income will be taxable at the preferential rates applicable to long-term capital gains, provided that thenon-corporate US holder holds the common shares for more than 60 days during the121-day period beginning 60 days before theex-dividend date and provided it meets other holding period requirements. Dividends paid with respect to the common shares generally will be qualified dividend income1). A US holder must include any Dutch tax withheld from the dividend payment in this gross amount even though it does not in fact receive it. The dividend is taxable to a US holder when it receives the dividend, actually or constructively. The dividend will not be eligible for the dividends-received deduction generally allowed to United States corporations in respect of dividends received from other United States corporations. For dividend payments made in euro, the amount of the dividend distribution that a US holder must include in its income will be the US dollar value of the euro payments made, determined at the spot euro/ US dollar rate on the date the dividend distribution can be included in its income, regardless of whether the payment is in fact converted into US dollars. Generally, any gain or loss resulting from currency exchange fluctuations during the period from the date a US holder includes the dividend payment in income to the date a US holder converts the payment into US dollars will be treated as ordinary income or loss and will not be eligible for the special tax rate applicable to qualified dividend income. The gain or loss generally will be income or loss from sources within the United States for foreign tax credit limitation purposes. Distributions in excess of current and accumulated earnings and profits, as determined for United States federal income tax purposes, will be treated as anon-taxable return of capital to the extent of a US holder’s basis in the common shares and thereafter as capital gain. However, we do not expect to calculate earnings and profits in accordance with United States federal income tax principles. Accordingly, US holders should expect to generally treat distributions we make as dividends.
Subject to certain limitations, the Dutch tax withheld in accordance with the US Tax Treaty and paid over to the Netherlands will be creditable or deductible against a US holder’s United States federal income tax liability. However, Dutch withholding tax may not be creditable or deductible to the extent that we reduce (as described above under “Dutch taxation - Dividend withholding tax”) the amount of withholding tax paid over to the Netherlands by crediting taxes withheld from certain dividends received by us. Special rules apply in determining the foreign tax credit limitation with respect to dividends that are subject to the preferential tax rates. To the extent a refund of the tax withheld is available under Dutch law, or under the US Tax Treaty, the amount of tax withheld that is refundable will not be eligible for credit against United States federal income tax liability. Dividends will be income from sources outside the United States, and depending on a holder’s circumstances, will generally be either
Annual Report 2016 249
Investor Relations 14.7
“passive” or “general” income for the purposes of computing the foreign tax credit allowable to the holder.
Taxation of Capital Gains
A US holder that sells or otherwise disposes of its common shares will recognize capital gain or loss for United States federal income tax purposes equal to the difference between the US dollar value of the amount that it realizes and its tax basis, determined in US dollars, in its common shares. Capital gain of a non-corporate US holder is generally taxed at preferential tax rates where the holder has a holding period greater than one year2). The gain or loss will generally be income or loss from sources within the United States for foreign tax credit limitation purposes.
PFIC Rules
We do not believe that the common shares will be treated as stock of a passive foreign investment company, or PFIC, for United States federal income tax purposes, but this conclusion is a factual determination that is made annually and thus is subject to change. If we are treated as a PFIC, unless a US holder elects to be taxed annually on amark-to-market basis with respect to the common shares, gain realized on the sale or other disposition of the common shares would in general not be treated as capital gain. Instead a US holder would be treated as if it had realized such gain and certain “excess distributions” ratably over the holding period for the common shares and would be taxed at the highest tax rate in effect for each such year to which the gain was allocated, in addition to which an interest charge in respect of the tax attributable to each such year would apply. Any dividends received by a US holder will not be eligible for the special tax rates applicable to qualified dividend income if we are treated as a PFIC with respect to such US holder either in the taxable year of the distribution or the preceding taxable year, but instead will be taxable at rates applicable to ordinary income and subject to the excess distribution regime described above.
| 1) | In addition, a US holder that is an individual or estate, or a trust that does not fall into a special class of trusts that is exempt from such tax, is subject to a 3.8% tax on the lesser of (1) the US holder’s “net investment income” for the relevant taxable year and (2) the excess of the US holder’s modified adjusted gross income for the taxable year over a certain threshold (the “Medicare tax”). A US holder’s net investment income generally includes its dividend income. |
| 2) | In addition, the gain or loss is generally included in a US holder’s net investment income, which may be subject to a 3.8% tax as described in the discussion of the Medicare tax under the heading – “Taxation of Dividends”. |
Fees and Charges Payable by a Holder of New York Registry Shares
Citibank, N.A., as the US registrar, transfer agent, paying agent and shareholder servicing agent (“Agent”) under Philips’ New York Registry Share program (the “Program”), collects fees for delivery and surrender of New York Registry Shares directly from investors depositing ordinary shares or surrendering New York Registry Shares for the purpose of withdrawal or from intermediaries acting for them. The Agent collects fees for making distributions to investors by deducting those fees from the amounts distributed or by selling a portion of the distributable property to pay the fees.
The charges of the Agent payable by investors are as follows:
The New York Transfer Agent charges shareholders a fee of up to USD 5.00 per 100 shares for the exchange of New York Registry shares for ordinary shares and vice versa.
Fees and Payments made by the Agent to Philips
The Agent has agreed to reimburse certain expenses of Philips related to the Program and incurred by Philips in connection with the Program. In the year ended December 31, 2016, the Agent reimbursed to Philips, or paid to third parties on Philips’ behalf, a total sum of EUR 503,520.
The table below sets forth the types of expenses that the Agent has agreed to reimburse and the amounts reimbursed in the year ended December 31, 2016:
Category of Expense Reimbursed to Philips in EUR
amount reimbursed in the year ended December 31, 2016
Program-related expenses such as legal fees and New York Stock Exchange listing fees | 98,443 | |||
A portion of the issuance and cancellation fees actually received by the Agent from holders of New York Registry | 405,077 | 1) | ||
Expense reimbursed | 503,520 | |||
| 1) | Translated at USD/EUR exchange rate of actual date(s) of reimbursement(s) during 2016 |
The Agent has also agreed to waive certain fees for standard costs associated with the administration of the program.
The table below sets forth those expenses that the Agent paid directly to third parties in the year ended December 31, 2016.
250 Annual Report 2016
Investor Relations 14.8
Category of Expense paid directly to third parties in EUR
amount in the year ended December 31, 2016
Reimbursement of Proxy Process expenses | 11,572 | |||
Reimbursement of Legal Fee expenses | ||||
NYSE Listing Fee | 86,871 | |||
Fulfillment | ||||
Expense paid directly to third parties | 98,443 | |||
Under certain circumstances, including removal of the Agent or termination of the Program by Philips, Philips is required to repay the Agent certain amounts reimbursed and/or expenses paid to or on behalf of Philips.
Annual Report 2016 251
Definitions and abbreviations 15
15 Definitions and abbreviations
BMC
Business Market Combination - As a diversified technology group, Philips has a wide portfolio of categories/business innovation units which are grouped in business groups based primarily on technology or customer needs. Philips has physical market presence in over 100 countries, which are grouped into 17 market clusters. Our primary operating modus is the Business Market matrix comprising Business Groups and Markets. These Business Market Combinations (BMCs) drive business performance on a granular level at which plans are agreed between global businesses and local market teams.
Brominated flame retardants (BFR)
Brominated flame retardants are a group of chemicals that have an inhibitory effect on the ignition of combustible organic materials. Of the commercialized chemical flame retardants, the brominated variety are most widely used.
CO2-equivalent
CO2-equivalent or carbon dioxide equivalent is a quantity that describes, for a given mixture and amount of greenhouse gas, the amount of CO2 that would have the same global warming potential (GWP), when measured over a specified timescale (generally 100 years).
Circular economy
A circular economy aims to decouple economic growth from the use of natural resources and ecosystems by using those resources more effectively. By definition it is a driver for innovation in the areas of material-, component- and product reuse, as well as new business models such as solutions and services. In a Circular Economy, the more effective use of materials enables to create more value, both by cost savings and by developing new markets or growing existing ones.
Dividend yield
The dividend yield is the annual dividend payment divided by Philips’ market capitalization. All references to dividend yield are as of December 31 of the previous year.
Electronic Industry Citizenship Coalition (EICC)
The Electronic Industry Citizenship Coalition was established in 2004 to promote a common code of conduct for the electronics and information and communications technology (ICT) industry. EICC now includes more than 100 global companies and their suppliers.
Employee Engagement Index (EEI)
The Employee Engagement Index (EEI) is the single measure of the overall level of employee engagement at Philips. It is a combination of perceptions and attitudes related to employee satisfaction, commitment and advocacy.
Energy-using Products (EuP)
An energy-using product is a product that uses, generates, transfers or measures energy (electricity, gas, fossil fuel). Examples include boilers, computers, televisions, transformers, industrial fans and industrial furnaces.
Full-time equivalent employee (FTE)
Full-time equivalent is a way to measure a worker’s involvement in a project. An FTE of 1.0 means that the person is equivalent to a full-time worker, while an FTE of 0.5 signals that the worker works half-time.
Global Reporting Initiative (GRI)
The Global Reporting Initiative (GRI) is a network-based organization that pioneered the world’s most widely used sustainability reporting framework. GRI is committed to the framework’s continuous improvement and application worldwide. GRI’s core goals include the mainstreaming of disclosure on environmental, social and governance performance.
Green Innovation
Green Innovation comprise all R&D activities directly contributing to the development of Green Products or Green Technologies.
Annual Report 2013 273
17 Definitions and abbreviations 17 - 17
Green Products
Green Products offer a significant environmental improvement in one or more Green Focal Areas: Energy efficiency, Packaging, Hazardous substances, Weight, Recycling and disposal and Lifetime reliability. The life cycle approach is used to determine a product’s overall environmental improvement. It calculates the environmental impact of a product over its total life cycle (raw materials, manufacturing, product use and disposal). Green Products need to prove leadership in at least one Green Focal Area compared to industry standards, which is defined by a sector specific peer group. This is done either by outperforming reference products (which can be a competitor or predecessor product in the particular product family) by at least 10%, outperforming product specificeco-requirements or by being awarded with a recognizedeco-performance label. Because of different product portfolios, sectors have specified additional criteria for Green Products, including product specific minimum requirements where relevant.
Growth geographies
Growth geographies are the developing geographies comprising of Asia Pacific (excluding Japan, South Korea, Australia and New Zealand), Latin America, Central & Eastern Europe, the Middle East (excluding Israel) and Africa.
Hydrochlorofluorocarbon (HCFC)Hazardous substances
Hydrochlorofluorocarbon is a fluorocarbon that is replacing chlorofluorocarbonHazardous substances are generally defined as a refrigerantsubstances posing imminent and propellant in aerosol cans.substantial danger to public health and welfare or the environment.
Income as %from operations (EBIT)
Income from operations (earnings before interest and tax) represents net income, less discontinued operations net of shareholders’ equity (ROE)
This ratio measures income from continuing operations as a percentagetaxes, investments in associates net of average shareholders’ equity. ROE rates Philips’ overall profitability by evaluating how much profit the company generates with the money shareholders have invested.income taxes, income tax expense, financial income and financial expense.
Income from continuing operations
Net income from continuing operations, or net income excluding discontinued operations.
Initiatief Duurzame Handel (IDH)
IDH is the Dutch Sustainable Trade Initiative. It brings together government, frontrunner companies, civil society organizations and labor unions to accelerate andup-scale sustainable trade in mainstream commodity markets from the emerging countries to Western Europe.
International Standardization Organization (ISO)
The International Standardization Organization (ISO)is the world’s largest developer and publisher of International Standards. ISO is a network of the national standards institutes of more than 160 countries, one member per country, with a Central Secretariat in Geneva, Switzerland, that coordinates the system. ISO is anon-governmental organization that forms a bridge between the public and private sectors.
Light-Emitting Diode (LED)
Light-Emitting Diode (LED), in electronics, is a semiconductor device that emits infrared or visible light when charged with an electric current. Visible LEDs are used in many electronic devices as indicator lamps, in automobiles as rear-window and brake lights, and on billboards and signs as alphanumeric displays or even full-color posters. Infrared LEDs are employed in autofocus cameras and television remote controls and also as light sources in fiber-optic telecommunication systems.
Lives improved by Philips
To calculate how many lives we are improving, market intelligence and statistical data on the number of people touched by the products contributing to the social or ecological dimension over the lifetime of a product are multiplied by the number of those products delivered in a year. After elimination of double counts – multiple different product touches per individual are only counted once – the number of lives improved by our innovative solutions is calculated. In 2012 weWe established our 2012 baseline at 1.71.6 billion a year.
Mature geographies
Mature geographies are the highly developed markets comprising of Western Europe, North America, Japan, South Korea, Israel, Australia and New Zealand.
Millennium Development Goals (MDG)Non-Governmental Organization (NGO)
Adopted by world leaders in the year 2000 and set to be achieved by 2015, the Millennium Development Goals (MDGs) provide concrete, numerical benchmarks for tackling extreme poverty in its many dimensions. The MDGs also provide a framework for the entire international community to work together towards a common end – making sure that human development reaches everyone, everywhere. Goals include for example eradicating extreme poverty and hunger, achieving universal primary education and ensuring environmental sustainability.
Net debt : group equity ratioAnon-governmental
The % distribution of net debt over group equity plus net debt.
Non-Governmental Organization (NGO)
A non-governmental organization (NGO) is anynon-profit, voluntary citizens’ group which is organized at a local, national or international level.
252 Annual Report 2016
Definitions and abbreviations 15
OEM
Original Equipment Manufacturer.
Operational carbon footprint
A carbon footprint is the total set of greenhouse gas emissions caused by an organization, event, product or person; usually expressed in kilotonnes CO2-equivalent. The Philips operational carbon footprint is calculated on a half-year basis and includes industrial sites (manufacturing and assembly sites),non-industrial sites (offices, warehouses, IT centers and R&D facilities), business travel (lease and rental cars and airplane travel) and logistics (air, sea and road transport).
Perfluorinated compounds (PFC)
A perfluorinated compound (PFC) is an organofluorine compound with all hydrogens replaced by fluorine on a carbon chain—but the molecule also contains at least one different atom or functional group. PFCs have unique properties to make materials stain, oil, and water resistant, and are widely used in diverse applications. PFCs persist in the environment as persistent organic pollutants, but unlike PCBs, they are not known to degrade by any natural processes due to the strength of the carbon–fluorine bond.
Polyvinyl chloride (PVC)
Polyvinyl chloride, better known as PVC or vinyl, is an inexpensive plastic so versatile it has become completely pervasive in modern society. The list of products made from polyvinyl chloride is exhaustive, ranging from phonograph records to drainage and potable piping, water bottles, cling film, credit cards and toys. More uses include window frames, rain gutters, wall paneling, doors, wallpapers, flooring, garden furniture, binders and even pens.
ProductivityREACH
Philips uses Productivity internallyRegistration, Evaluation, Authorization and as mentioned in this annual report asRestriction of Chemicals (REACH) is a non-financial indicatorEuropean Union regulation dated 18 December 2006. REACH addresses the production and use of efficiency that relateschemical substances, and their potential impacts on both human health and the added value, being income from operations adjusted for certain items such as restructuring and acquisition-related charges etc. plus salaries and wages (including pension costs and other social security and similar charges), depreciation of property, plant and equipment, and amortization of intangibles, to the average number of employees over the past 12 months.environment.
Regulation on Hazardous Substances (RoHS)
The RoHS Directive prohibits all new electrical and electronic equipment placed on the market in the European Economic Area from containing lead, mercury, cadmium, hexavalent chromium, poly-brominated biphenyls (PBB) or polybrominated diphenyl ethers (PBDE), except in certain specific applications, in concentrations greater than the values decided by the European Commission. These values have been established as 0.01% by weight per homogeneous material for cadmium and 0.1% for the other five substances.
Return on equity (ROE)VOC
IncomeVolatile organic compounds (VOCs) are organic chemicals that have a high vapor pressure at ordinary room temperature. Their high vapor pressure results from continuing operationsa low boiling point, which causes large numbers of molecules to evaporate or sublimate from the liquid or solid form of the compound and enter the surrounding air, a trait known as a %volatility.
Voluntary turnover
Voluntary turnover covers all employees who resigned of average shareholders’ equity (calculated on the quarterly balance sheet positions).
274 Annual Report 2013
17 Definitions and abbreviations 17 - 17
Return on invested capital (ROIC)
Return on Invested Capital consists of income from continuing operations excluding results attributable to non-controlling interest holders, results relating to investments in associates and financial income and expenses, divided by the average net operating capital at year end and the preceding four quarter ends. Philips believes that ROIC information makes the underlying performance of its businesses more transparent as it relates returns to the operating capital in use.
SF6
SF6 (Sulfur hexafluoride) is used in the electrical industry as a gaseous dielectric medium.
Turnover rate of net operating capital
Sales divided by average net operating capital (calculated on the quarterly balance sheet positions).their own volition.
Waste Electrical and Electronic Equipment (WEEE)
The Waste Electrical and Electronic Equipment Directive (WEEE Directive) is the European Community directive on waste electrical and electronic equipment which became European Law in February 2003, setting collection, recycling and recovery targets for all types of electrical goods. The directive imposes the responsibility for the disposal of waste electrical and electronic equipment on the manufacturers of such equipment.
Weighted Average Statutory Tax Rate (WASTR)
The reconciliation of the effective tax rate is based on the applicable statutory tax rate, which is a weighted average of all applicable jurisdictions. This weighted average statutory tax rate (WASTR) is the aggregation of the result before tax multiplied by the applicable statutory tax rate without adjustment for losses, divided by the group result before tax.
Annual Report 2013 2752016 253
18 Exhibits 18 - 18.116
| Exhibit 1 | English translation of the Articles of Association of the | |||
| Exhibit 2 (b) (1) | Indenture between Koninklijke Philips N.V. and Deutsche Bank Trust Company Americas, Trustee, dated as of March 11, 2008, as supplemented by the First Supplemental Indenture (Incorporated by reference to Exhibits 4.1 and 4.2 of Registration Statement on Form | |||
| Exhibit 4 | ||||
| Exhibit 4 (a) | ||||
| Exhibit 4 (b) | ||||
| Exhibit 4 (c) | ||||
| Exhibit 7 | Ratio of earnings to fixed charges | |||
| Exhibit 8 | List of Subsidiaries. | |||
| Exhibit 12 (a) | Certification of F.A. van Houten filed pursuant to 17 CFR 240.13a-14(a). | |||
| Exhibit 12 (b) | Certification of | |||
| Exhibit 13 (a) | Certification of F.A. van Houten furnished pursuant to 17 CFR 240.13a-14(b). | |||
| Exhibit 13 (b) | Certification of | |||
| Exhibit 15 (a) | KPMG Consent of independent registered public accounting firm. | |||
| Exhibit 15 (b) | EY Consent of independent registered public accounting firm. | |||
| Exhibit 15 (c) | Description of industry terms. | |||
276254 Annual Report 20132016
18 Exhibits 18.1 - 18.216.2
The registrant hereby certifies that it meets all of the requirements for filing on Form20-F and that it has duly caused and authorized the undersigned to sign this annual reportAnnual Report on its behalf.
Annual Report 2013 277
18 Exhibits 18.2 - 18.2
KONINKLIJKE PHILIPS N.V.
(Registrant)
| /s/ F.A. van Houten | /s/ | |
| F.A. van Houten | ||
| (CEO, Chairman of the Board of Management and the Executive Committee) | (Executive Vice-President, Chief Financial Officer, member of the Board of Management and the Executive Committee) |
Date: February 25, 201421, 2017
278 Annual Report 20132016 255
18 Exhibits 18.2 - 18.316.3
| Exhibit 1 | English translation of the Articles of Association of the | |||
| Exhibit 2 (b) (1) | Indenture between Koninklijke Philips N.V. and Deutsche Bank Trust Company Americas, Trustee, dated as of March 11, 2008, as supplemented by the First Supplemental Indenture (Incorporated by reference to Exhibits 4.1 and 4.2 of Registration Statement on Form | |||
| Exhibit 4 | ||||
| Exhibit 4 (a) | ||||
| Exhibit 4 (b) | ||||
| Exhibit 4 (c) | ||||
| Exhibit 7 | Ratio of earnings to fixed charges | |||
| Exhibit 8 | List of Subsidiaries. | |||
| Exhibit 12 (a) | Certification of F.A. van Houten filed pursuant to 17 CFR 240.13a-14(a). | |||
| Exhibit 12 (b) | Certification of | |||
| Exhibit 13 (a) | Certification of F.A. van Houten furnished pursuant to 17 CFR 240.13a-14(b). | |||
| Exhibit 13 (b) | Certification of | |||
| Exhibit 15 (a) | KPMG Consent of independent registered public accounting firm. | |||
| Exhibit 15 (b) | EY Consent of independent registered public accounting firm. | |||
| Exhibit 15 (c) | Description of industry terms. | |||
256 Annual Report 2013 2792016