As-As filed with the Securities and Exchange Commission on April 30, 2014March 29, 2017
UNITED STATES
SECURITIES AND EXCHANGE COMMISSION
Washington, D.C. 20549
FORM20-F
| REGISTRATION STATEMENT PURSUANT TO SECTION 12(b) OR (g) OF THE SECURITIES EXCHANGE ACT OF 1934 |
OR
| ANNUAL REPORT PURSUANT TO SECTION 13 OR 15(d) OF THE SECURITIES EXCHANGE ACT OF 1934 |
For the fiscal year ended December 31, 20132016
OR
| TRANSITION REPORT PURSUANT TO SECTION 13 OR 15(d) OF THE SECURITIES EXCHANGE ACT OF 1934 |
OR
| SHELL COMPANY REPORT PURSUANT TO SECTION 13 OR 15(d) OF THE SECURITIES EXCHANGE ACT OF 1934 |
Commission File Number:1-14728
LATAM Airlines Group S.A.
(Exact name of registrant as specified in its charter)
| LATAM Airlines Group S.A. | Republic of Chile | |
| (Translation of registrant’s name into English) | (Jurisdiction of incorporation or organization) |
Presidente Riesco 5711, 20th Floor
Las Condes
Santiago, Chile
(Address of principal executive offices)
Gisela Escobar Koch
Tel.:56-2-2565-3944 •E-mail: InvestorRelations@latam.com• E-mail: gisela.escobar@lan.com
Presidente Riesco 5711, 20th Floor
Las Condes
Santiago, Chile
(Name, telephone,e-mail and/or facsimile number and address of company contact person)
Securities registered or to be registered pursuant to Section 12(b) of the Act:
Title of each class: | Name of each exchange on which registered: | |
| American Depositary Shares (as evidenced by American Depositary Receipts), each representing one share of Common Stock, without par value | New York Stock Exchange |
Securities registered or to be registered pursuant to Section 12(g) of the Act:
None
Securities for which there is a reporting obligation pursuant to Section 15(d) of the Act:
None
Indicate the number of outstanding shares of each of the issuer’s classes of capital or common stock as of the close of the period covered by the annual report: 551,847,819.606,407,693.
Indicate by check mark if the registrant is a well-known seasoned issuer, as defined in Rule 405 of the Securities Act. Yes x☒ No ¨☐
If this report is an annual or transition report, indicate by check mark if the registrant is not required to file reports pursuant to Section 13 or 15(d) of the Securities Exchange Act of 1934. Yes ¨☐ No x☒
Indicate by check mark whether the registrant (1) has filed all reports required to be filed by Section 13 or 15(d) of the Securities Exchange Act of 1934 during the preceding 12 months (or for such shorter period that the registrant was required to file such reports), and (2) has been subject to such filing requirements for the past 90 days. Yes x☒ No ¨☐
Indicate by check mark whether the registrant has submitted electronically and posted on its corporate Web site, if any, every Interactive Data File required to be submitted and posted pursuant to Rule 405 of RegulationS-T (§232.405 of this chapter) during the preceding 12 months (or for such shorter period that the registrant was required to submit and post such files). Yes ¨☐ No ¨☒
Indicate by check mark whether the registrant is a large accelerated filer, an accelerated filer, or anon-accelerated filer. See definition of “accelerated filer and large accelerated filer” in Rule12b-2 of the Exchange Act. (Check one):
Large Accelerated filer ☒ Accelerated filer ☐ Non-Accelerated filer ☐
|
Indicate by check mark which basis of accounting the registrant has used to prepare the financial statements included in this filing:
U.S. GAAP | International Financial Reporting Standards as issued by the International Accounting Standards Board | Other | ☐ |
If “Other” has been checked in response to the previous question, indicate by check mark which financial statement item the registrant has elected to follow:
Item 17 ¨☐ Item 18 ¨☐
If this is an annual report, indicate by check mark whether the registrant is a shell company (as defined in Rule12b-2 of the Exchange Act). Yes ¨☐ No x☒
| 2 | ||||||
| 3 | ||||||
ITEM 1. | 5 | |||||
ITEM 2. | 5 | |||||
ITEM 3. | 5 | |||||
ITEM 4. | ||||||
ITEM 4A | ||||||
ITEM 5. | ||||||
ITEM 6. | ||||||
ITEM 7. | 77 | |||||
ITEM 8. | 83 | |||||
ITEM 9. | 86 | |||||
ITEM 10. | 88 | |||||
ITEM 11. | 114 | |||||
ITEM |
| 118 | ||||
| PART II | ||||||
ITEM 13. | 119 | |||||
ITEM | MATERIAL MODIFICATIONS TO THE | 119 | ||||
ITEM 15. | 119 | |||||
ITEM 16. | 120 | |||||
| PART III | ||||||
ITEM 17. | 123 | |||||
ITEM | ||||||
| ||||||
| ||||||
| ||||||
| ||||||
| ||||||
| ||||||
| ||||||
| ||||||
ITEM 19. | ||||||
InThroughout this annual report on Form20-F unless we make numerous references to “LATAM”. Unless the context otherwise requires, references to “LATAM Airlines Group” are to LATAM Airlines Group S.A., the unconsolidated operating entity, and references to “LATAM,” “we,” “us” or the “Company” are to LATAM Airlines Group S.A. and its consolidated subsidiaries:affiliates: Transporte Aéreo S.A. (which does business under the name “LAN Express”“LATAM Airlines Chile”), LAN Perú S.A. (“LANLATAM Airlines Peru”), Aerolane, Líneas Aéreas Nacionales del Ecuador S.A. (“LANLATAM Airlines Ecuador”), LAN Argentina S.A. (“LANLATAM Airlines Argentina,” previously Aero 2000 S.A.), Aerovías de Integración Regional, Aires S.A. (which does business under the name “LAN“LATAM Airlines Colombia”), TAM S.A. (“TAM”), LAN Cargo S.A. (“LANLATAM Cargo”) and Multiplus S.A. (“Multiplus”), and its three regional affiliates: Aero Transportes Mas de Carga S.A. de C.V. (“MasAir”) in Mexico, Linea Aerea Carguera de Colombia S.A. (“LANCO”) in Colombia and Aerolinhas Brasileiras S.A. (“ABSA”) in Brazil. AllOther references to “Chile”“LATAM”, however, are to the LATAM brand which was launched in 2016 and brings together, under one internationally recognized name, all of the affiliate brands such as LATAM Airlines Chile, LATAM Airlines Peru, LATAM Airlines Argentina, LATAM Airlines Colombia, LATAM Airlines Ecuador and LATAM Airlines Brazil.
References to “LATAM” and all references to the Republic of Chile.
On June 22, 2012,“LAN” are to LAN Airlines S.A., currently known as LATAM was formed followingAirlines Group S.A. and its consolidated affiliates, in connection with circumstances and facts occurring prior to the completion date of the business combination between LAN Airlines S.A. and its consolidated subsidiaries (“LAN”) with TAM S.A. and its consolidated subsidiaries (“TAM”). Following the combination, LAN Airlines S.A. became “LATAM Airlines Group S.A.” and TAM continues to exist as a subsidiary of Holdco I S.A. (“Holdco I”) and a subsidiary of LATAM Airlines Group. LATAM’s consolidated financial statements for the year ended December 31, 2012 include TAM’s financial results from June 23, 2012. As LATAM Airlines Group S.A. is the owner of substantially all the economic rights in TAM, TAM and its consolidated subsidiaries are for the purposes of this annual report and LATAM’s consolidated financial statements treated as being subsidiaries of LATAM Airlines Group S.A. See “Item 4. Information on the Company—A. History and Development of the Company—Combination of LAN and TAM.”
Throughout this annual report on Form 20-F we make numerous references to “LAN”. Some references to “LAN” are to LAN Airlines S.A., currently known as LATAM Airlines Group S.A. and its consolidated subsidiaries, in connection with circumstances and facts occurring prior to June 22, 2012. Other references to “LAN”, however, are to the LAN brand which was launched in 2004 and brings together, under one internationally recognized name, all of the affiliate brands such as LAN Chile, LAN Peru, LAN Argentina, LAN Colombia and LAN Ecuador.
In this annual report on Form20-F, unless the context otherwise requires, references to “TAM” are to TAM S.A., and its consolidated subsidiaries,affiliates, including TAM Linhas Aereas S.A. (“TLA”), which does business under the operating entity,name “LATAM Airlines Brazil”, Multiplus S.A. (“Multiplus”), Pantanal Linhas Aéreas S.A. (“Pantanal”), Fidelidade Viagens e Turismo Limited (“TAM Viagens”), and Transportes Aéreos Del Mercosur S.A. (“TAM Mercosur”).
LATAM Airlines Group and the majority of our affiliates maintain their accounting records and prepare their financial statements in U.S. dollars. Some of our other affiliates, however, maintain their accounting records and prepare their financial statements in Chilean pesos, Argentinean pesos, Colombian pesos or Brazilian reais. In particular, TAM maintains its accounting records and prepares its financial statements in Brazilian reais. Our audited consolidated financial statements include the results of these affiliates translated into U.S. dollars. International Financial Reporting Standards (“IFRS”) as issued by the International Accounting Standards Board (“IASB”), require assets and liabilities to be translated atperiod-end exchange rates, while revenue and expense accounts are translated at each transaction date, although a monthly rate may also be used if exchange rates do not vary widely.
In this annual report on Form20-F, all references to “Chile” are references to the Republic of Chile. This annual report contains conversions of certain Chilean peso and Brazilian real amounts into U.S. dollars at specified rates solely for the convenience of the reader. These conversions should not be construed as representations that the Chilean peso and the Brazilian real amounts actually represent such U.S. dollar amounts or could be converted into U.S. dollars at the rate indicated. Unless we specify otherwise, all references to “$”, “US$” “US$,” “U.S. dollars” or “dollars” are to United States dollars, references to “pesos,” “Chilean pesos” or “Ch$” are to Chilean pesos. References to “reais,” “Brazilian reais,”reais” or “R$” are to Brazilian reais, and references to “UF” are toUnidades de Fomento, a daily indexed Chilean peso-denominated monetary unit that takes into account the effect of the Chilean inflation rate. Unless we indicate otherwise, the U.S. dollar equivalent for information in Chilean pesos used in this annual report and in our audited consolidated financial statements is based on the “dólar observado” or “observed” exchange rate published byBanco Central de Chile (which we refer to as the Central Bank of Chile) on December 30, 2013,31, 2016, which was Ch$523.76669.47 = US$1.00. The observed exchange rate on April 25, 2014February 28, 2017, was Ch$559.67 =645.19= US$1.00. Unless we indicate otherwise, the U.S. dollar equivalent for information in Brazilian reais used in this annual report and in our audited consolidated financial statements is based on the average “dólar observadobid and offer rate” or “observed” exchange rate published byBanco Central doBrasildo Brasil (which we refer to as the Central Bank of Brazil) on December 31, 2013,2016, which was R$2.3423.259 = US$1.00. The observed exchange rate on April 25, 2014February 28, 2017 was R$2.231$R$3.099 = US$1.00. The Federal Reserve Bank of New York does not report a noon buying rate for Chilean pesos nor Brazilian reais. See “Item 3. Key Information—A. Selected Financial Data—Chilean Peso Exchange Rates” and “Item 3. Key Information—A. Selected Financial Data—Brazilian Exchange Rates.”
LATAM Airlines Group and the majority of our subsidiaries maintain their accounting records and prepare their financial statements in U.S. dollars. Some of our other subsidiaries, however, maintain their accounting records and prepare their financial statements in Chilean pesos, Argentinean pesos, Colombian pesos or Brazilian reais. In particular, TAM maintains its accounting records and prepares its financial statements in Brazilian reais. Our audited consolidated financial statements include the results of these subsidiaries translated into U.S. dollars. International Financial Reporting Standards (“IFRS”) as issued by the International Accounting Standards Board (“IASB”), require assets and liabilities to be translated at period-end exchange rates, while revenue and expense accounts are translated at each transaction date, although a monthly rate may also be used if exchange rates do not vary widely.
LATAM’s audited consolidated financial statements for the periods ended December 31, 2009, 2010, 2011, 2012 and 2013 were prepared in accordance with IFRS.
We have rounded percentages and certain U.S. dollar, Chilean peso and Brazilian reais amounts contained in this annual report for ease of presentation. Any discrepancies in any table between totals and the sums of the amounts listed are due to rounding.
LATAM’s audited consolidated financial statements for the periods ended December 31, 2012, 2013, 2014, 2015 and 2016 were prepared in accordance with IFRS.
This annual report contains certain terms that may be unfamiliar to some readers. You can find a glossary of these terms on page 4 of this annual report.
This annual report contains forward-looking statements, including those relating to our recently completed combination with TAM. See “Item 3. Key Information—D. Risk Factors—Risks Relating to the Combination of LAN and TAM.”statements. Such statements may include words such as “anticipate,” “could” “estimate,” “expect,” “project,” “intend,” “plan,” “believe” or other similar expressions. Forward-looking statements, including statements about our beliefs and expectations, are not statements of historical facts. These statements are based on current plans, estimates and projections, and, therefore, you should not place undue reliance on them. There is no assurance that the expected events, trends or results will actually occur. Forward-looking statements involve inherent risks and uncertainties. We caution you that a number of important factors could cause actual results to differ materially from those contained in any forward-looking statement. These factors include, but are not limited to:
Forward-looking statements speak only as of the date they are made, and we undertake no obligation to update publicly any of them, whether in light of new information, future events or otherwise. You should also read carefully the risk factors described in “Item 3. Key Information—D. Risk Factors.”
The following terms, as used in this annual report, have the meanings set forth below.
Capacity Measurements: | ||
| “available seat kilometers” or “ASKs” | The sum, across our network, of the number of seats made available for sale on each flight multiplied by the kilometers | |
| “available ton kilometers” or “ATKs” | The sum, across our network, of the number of tons available for the transportation of revenue load (cargo) on each flight multiplied by the kilometers | |
| “available seat kilometers equivalent” or “ASK equivalent” | The sum, across our network, of the number of seats made available for sale on each flight plus the quotient of cargo ATKs divided by 0.095, all multiplied by the kilometers | |
| Traffic Measurements: | ||
| “revenue passenger kilometers” or “RPKs” | The sum, across our network, of the number of passengers on each flight multiplied by the number of kilometers | |
| “revenue ton kilometers” or “RTKs” | The sum, across our network, of the load (cargo) in tons on each flight multiplied by the kilometers | |
| “traffic revenue” | Revenue from passenger and cargo operations. | |
| Yield Measurements: | ||
| “cargo yield” | Revenue from cargo operations divided by RTKs. | |
| “ | ||
| Revenue from passenger operations divided by RPKs. | ||
| Load Factors: | ||
| “cargo load factor” | RTKs | |
| “passenger load factor” | RPKs expressed as a percentage of ASKs. | |
| Other: | ||
| “ | ||
| The Airbus A318, Airbus A319, Airbus A320 and Airbus A321 models of aircraft. | ||
| “ | ||
| “ton” | A metric ton, equivalent to 2,204.6 pounds. | |
| “utilization rates” | The actual number of flight hours per aircraft per operating day. | |
| “operating expenses” | Operating expenses, which are calculated in accordance with IFRS, comprise the sum of the line items “cost of sales” plus “distribution costs” plus “administrative expenses” plus “other operating | |
“MiSchDynamicDT” | Market Intelligence Schedule Dynamic Table. | |
| “Diio Mi” | Data In Intelligence Out Market Intelligence. | |
| “CO2” | Carbon Dioxide Gas | |
| ITEM 1. | IDENTITY OF DIRECTORS, SENIOR MANAGEMENT AND ADVISERS |
Not applicable.
| ITEM 2. | OFFER STATISTICS AND EXPECTED TIMETABLE |
Not applicable.
| ITEM 3. | KEY INFORMATION |
A. Selected Financial Data
LATAM’s Historical Financial Information
The summary consolidated annual financial information of LATAM as of December 31, 2016, 2015, 2014, 2013 and 2012 has been prepared in accordance with IFRS(*). On June 22, 2012, LATAM Airlines Group was formed through the business combination of LAN and TAM. Following the combination, LAN Airlines S.A. became “LATAM Airlines Group S.A.” and TAM continues to exist as a subsidiary of Holdco I and a subsidiary of LATAM Airlines Group. Financial statements for LATAM fully consolidate TAM’s results since June 23, 2012.
LATAM’s Historical Financial Information
The summary consolidated annual financial information of LATAM as of December 31, 2013, 2012, 2011, 2010 and 2009 and for each of the five years ended December 31, 2013, 2012, 2011, 2010 and 2009 has been prepared in accordance with IFRS. LATAM’s consolidated annual financial information as of and for the year ended December 31, 2012, includes TAM’s results of operations from June 23, 2012, and was included in a previous annual report filed by LATAM with the SEC. The LATAM Historical Financial Information as of and for the years ended December 31, 2011, 2010 and 2009 represents LAN’s historical audited consolidated financial information and were included in previous annual reports filed by LAN with the SEC.
The following table sets forth certain income statement and balance sheet data for LATAM Airlines Group, as of and for the year ended December 31, 2012 (including TAM’s results from June 23, 2012), as retrospectively revised. For more information see “Item 5.—Operating and Financial Review and Prospects—A. Operating Results—Accounting Impact of the Business Combination”.
LATAM’s Annual Financial Information
| Year ended December 31, | Year ended December 31, | |||||||||||||||||||||||||||||||||||||||
| 2013 | 2012 | 2011 | 2010 | 2009 | 2016 | 2015 | 2014 | 2013 | 2012 | |||||||||||||||||||||||||||||||
| (in US$ millions, except per share and capital stock data) | (in US$ millions, except per share and capital stock data) | |||||||||||||||||||||||||||||||||||||||
The Company(1)(2) | ||||||||||||||||||||||||||||||||||||||||
Statement of Income Data: | ||||||||||||||||||||||||||||||||||||||||
Operating revenues | ||||||||||||||||||||||||||||||||||||||||
Passenger | 11,061.6 | 7,966.8 | 4,008.9 | 3,109.8 | 2,623.6 | 7,877.7 | 8,410.6 | 10,380.1 | 11,061.5 | 7,966.8 | ||||||||||||||||||||||||||||||
Cargo | 1,863.0 | 1,743.5 | 1,576.5 | 1,280.7 | 895.6 | 1,110.6 | 1,329.4 | 1,713.4 | 1,863.0 | 1,743.6 | ||||||||||||||||||||||||||||||
|
|
|
|
|
|
|
|
|
| |||||||||||||||||||||||||||||||
Total operating revenues | 12,924.5 | 9,710.4 | 5,585.4 | 4,390.5 | 3,519.2 | 8,988.3 | 9,740.0 | 12,093.5 | 12,924.5 | 9,710.4 | ||||||||||||||||||||||||||||||
Cost of sales | (10,054.2 | ) | (7,634.5 | ) | (4,078.6 | ) | (3,012.7 | ) | (2,522.8 | ) | (6,967.0 | ) | (7,636.7 | ) | (9,624.5 | ) | (10,054.2 | ) | (7,634.5 | ) | ||||||||||||||||||||
|
|
|
|
|
|
|
|
|
| |||||||||||||||||||||||||||||||
Gross margin | 2,870.4 | 2,075.9 | 1,506.8 | 1,377.8 | 996.4 | 2,021.3 | 2,103.3 | 2,469.0 | 2,870.3 | 2,075.9 | ||||||||||||||||||||||||||||||
Other operating income(3) | 341.6 | 220.2 | 132.8 | 132.8 | 136.4 | 538.7 | 385.8 | 377.6 | 341.6 | 220.2 | ||||||||||||||||||||||||||||||
Distribution costs | (1,025.9 | ) | (803.6 | ) | (479.8 | ) | (383.5 | ) | (327.0 | ) | (747.4 | ) | (783.3 | ) | (957.1 | ) | (1,025.9 | ) | (803.6 | ) | ||||||||||||||||||||
Administrative expenses | (1,136.1 | ) | (888.7 | ) | (405.7 | ) | (331.8 | ) | (270.0 | ) | (873.0 | ) | (878.0 | ) | (980.7 | ) | (1,136.1 | ) | (888.7 | ) | ||||||||||||||||||||
Other expenses | (408.7 | ) | (311.8 | ) | (214.4 | ) | (172.4 | ) | (100.5 | ) | (373.7 | ) | (324.0 | ) | (401.0 | ) | (408.7 | ) | (311.8 | ) | ||||||||||||||||||||
Other gains/(losses) | (55.4 | ) | (45.8 | ) | (33.0 | ) | 5.4 | (11.7 | ) | (72.6 | ) | (55.3 | ) | 33.5 | (55.4 | ) | (45.8 | ) | ||||||||||||||||||||||
Financial income | 72.8 | 77.5 | 14.5 | 14.9 | 18.2 | 74.9 | 75.1 | 90.5 | 72.8 | 77.5 | ||||||||||||||||||||||||||||||
Financial costs | (462.5 | ) | (294.6 | ) | (139.1 | ) | (155.3 | ) | (153.1 | ) | (416.3 | ) | (413.4 | ) | (430.0 | ) | (462.5 | ) | (294.6 | ) | ||||||||||||||||||||
Equity accounted earnings | 2.0 | 1.0 | 0.5 | 0.1 | 0.3 | 0.0 | 0.0 | (6.5 | ) | 2.0 | 1.0 | |||||||||||||||||||||||||||||
Exchange rate differences | (482.2 | ) | 66.7 | (0.3 | ) | 13.8 | (11.2 | ) | 121.7 | (467.9 | ) | (130.2 | ) | (482.2 | ) | 66.6 | ||||||||||||||||||||||||
Result of indexation units | 0.2 | 0 | 0.1 | 0.1 | (0.6 | ) | 0.3 | 0.6 | 0.1 | 0.3 | 0.0 | |||||||||||||||||||||||||||||
|
|
|
|
|
|
|
|
|
| |||||||||||||||||||||||||||||||
Income before income taxes | (283.9 | ) | 96.7 | 382.4 | 502.0 | 277.5 | ||||||||||||||||||||||||||||||||||
Income tax | 20.1 | (102.4 | ) | (61.8 | ) | (81.1 | ) | (44.5 | ) | |||||||||||||||||||||||||||||||
Income (loss) before income taxes | 273.9 | (357.1 | ) | 65.2 | (283.8 | ) | 96.7 | |||||||||||||||||||||||||||||||||
Income (loss) tax expense/benefit | (163.2 | ) | 178.4 | (292.4 | ) | 20.0 | (102.3 | ) | ||||||||||||||||||||||||||||||||
|
|
|
|
|
|
|
|
|
| |||||||||||||||||||||||||||||||
Net income for the period | (263.8 | ) | (5.6 | ) | 320.6 | 420.9 | 233.0 | |||||||||||||||||||||||||||||||||
Income attributable to the parent company’s equity holders | (281.1 | ) | 19.1 | 320.2 | 419.7 | 231.1 | ||||||||||||||||||||||||||||||||||
Income attributable to non-controlling interests | 17.3 | 13.4 | 0.4 | 1.2 | 1.9 | |||||||||||||||||||||||||||||||||||
Net (loss) income for the period | 110.7 | (178.7 | ) | (227.2 | ) | (263.8 | ) | (5.6 | ) | |||||||||||||||||||||||||||||||
Income (loss) attributable to the parent company’s equity holders | 69.2 | (219.3 | ) | (260.0 | ) | (281.1 | ) | (19.1 | ) | |||||||||||||||||||||||||||||||
Income (loss) attributable tonon-controlling interests | 41.5 | 40.5 | 32.8 | 17.3 | 13.5 | |||||||||||||||||||||||||||||||||||
|
|
|
|
|
|
|
|
|
| |||||||||||||||||||||||||||||||
Net income (loss) for the year | 110.7 | (178.7 | ) | (227.2 | ) | (263.8 | ) | (5.6 | ) | |||||||||||||||||||||||||||||||
Earnings per share | ||||||||||||||||||||||||||||||||||||||||
Average number of Shares | 549,559,559 | 545,547,819 | 545,547,819 | 487,930,977 | 412,267,624 | |||||||||||||||||||||||||||||||||||
Net income for the period Earnings per share Average number of Shares Basic earnings per share (US$)(4) Diluted earnings per share(US$) Year ended December 31, 2013 2012 2011 2010 2009 (in US$ millions, except per share and capital stock data) (263.8 ) (5.6 ) 320.6 420.9 233.0 487,930,977 412,267,624 339,424,598 338,790,909 338,790,909 (0.57613 ) (0.0463 ) 0.94335 1.23882 0.68221 (0.57613 ) (0.0463 ) 0.9426 1.23534 0.68221
| Year ended December 31, | ||||||||||||||||||||||||||||||||||||||||
| 2016 | 2015 | 2014 | 2013 | 2012 | ||||||||||||||||||||||||||||||||||||
| (in US$ millions, except per share and capital stock data) | ||||||||||||||||||||||||||||||||||||||||
Basic earnings (loss) per share (US$) | 0.12665 | (0.40193 | ) | (0.47656 | ) | (0.57613 | ) | (0.0463 | ) | |||||||||||||||||||||||||||||||
Diluted earnings (loss) per share (US$) | 0.12665 | (0.40193 | ) | (0.47656 | ) | (0.57613 | ) | (0.0463 | ) | |||||||||||||||||||||||||||||||
| At December 31, | At December 31, | |||||||||||||||||||||||||||||||||||||||
| 2013 | 2012 | 2011 | 2010 | 2009 | 2016 | 2015 | 2014 | 2013 | 2012 | |||||||||||||||||||||||||||||||
| (in US$ millions, except per share and capital stock data) | (in US$ millions, except per share and capital stock data) | |||||||||||||||||||||||||||||||||||||||
Balance Sheet Data: | ||||||||||||||||||||||||||||||||||||||||
Cash, and cash equivalents | 1,984.9 | 650.3 | 374.4 | 631.1 | 731.5 | 949.3 | 753.5 | 989.4 | 1,984.9 | 650.3 | ||||||||||||||||||||||||||||||
Other current assets in operation | 2,992.2 | 2,626.2 | 964.3 | 896.5 | 666.6 | 2,340.3 | 2,067.4 | 2,644.1 | 2,992.2 | 2,626.2 | ||||||||||||||||||||||||||||||
Non-current assets and disposal groups held for sale | 2.4 | 47.7 | 4.7 | 5.5 | 10.9 | 337.2 | 2.0 | 1.1 | 2.4 | 47.7 | ||||||||||||||||||||||||||||||
|
|
|
|
|
|
|
|
|
| |||||||||||||||||||||||||||||||
Total current assets | 4,979.5 | 3,324.2 | 1,343.4 | 1,533.1 | 1,409.0 | 3,626.8 | 2,822.9 | 3,634.6 | 4,979.5 | 3,324.2 | ||||||||||||||||||||||||||||||
Property and equipment | 10,982.8 | 11,807.1 | 5,928.0 | 4,948.4 | 4,196.6 | 10,498.1 | 10,938.7 | 10,773.1 | 10,982.8 | 11,807.1 | ||||||||||||||||||||||||||||||
Other non-current assets | 6,668.8 | 7,195.0 | 377.3 | 304.4 | 166.4 | 5,073.3 | 4,339.8 | 6,076.7 | 6,668.8 | 7,195.0 | ||||||||||||||||||||||||||||||
|
|
|
|
|
|
|
|
|
| |||||||||||||||||||||||||||||||
Total non-current assets | 17,651.6 | 19,002.1 | 6,305.3 | 5,252.8 | 4,363.0 | 15,571.4 | 15,278.5 | 16,849.8 | 17,651.6 | 19,002.1 | ||||||||||||||||||||||||||||||
|
|
|
|
|
|
|
|
|
| |||||||||||||||||||||||||||||||
Total assets | 22,631.1 | 22,326.3 | 7,648.7 | 6,785.9 | 5,772.0 | 19,198.2 | 18,101.4 | 20,484.4 | 22,631.1 | 22,326.3 | ||||||||||||||||||||||||||||||
Total current liabilities | 6,509.1 | 6,297.5 | 2,322.1 | 2,144.0 | 1,523.3 | 6,222.2 | 5,641.0 | 5,829.7 | 6,509.1 | 6,297.5 | ||||||||||||||||||||||||||||||
Total non-current liabilities | 10,795.6 | 10,808.1 | 3,869.2 | 3,341.8 | 3,142.7 | 8,790.7 | 9,522.9 | 10,151.0 | 10,795.6 | 10,808.1 | ||||||||||||||||||||||||||||||
|
|
|
|
|
|
|
|
|
| |||||||||||||||||||||||||||||||
Total liabilities | 17,304.7 | 17,105.6 | 6,191.3 | 5,485.8 | 4,666.0 | 15,012.9 | 15,163.9 | 15,980.7 | 17,304.7 | 17,105.6 | ||||||||||||||||||||||||||||||
Issued Capital | 2,389.4 | 1,501.0 | 473.9 | 453.4 | 453.4 | |||||||||||||||||||||||||||||||||||
Issued capital | 3,149.6 | 2,545.7 | 2,545.7 | 2,389.4 | 1,501.0 | |||||||||||||||||||||||||||||||||||
Net equity attributable to the parent company’s equity holders | 5,238.8 | 5,112.1 | 1,445.3 | 1,296.8 | 1,098.8 | 4,096.7 | 2,856.5 | 4,401.9 | 5,238.8 | 5,112.1 | ||||||||||||||||||||||||||||||
Minority interest | 87.6 | 108.6 | 12.0 | 3.2 | 7.1 | |||||||||||||||||||||||||||||||||||
Non-controlling interest | 88.6 | 81.0 | 101.8 | 87.7 | 108.6 | |||||||||||||||||||||||||||||||||||
|
|
|
|
|
|
|
|
|
| |||||||||||||||||||||||||||||||
Total net equity | 5,326.5 | 5,220.7 | 1,457.4 | 1,300.1 | 1,105.9 | 4,185.3 | 2,937.5 | 4,503.7 | 5,326.5 | 5,220.7 | ||||||||||||||||||||||||||||||
Shares Outstanding | 606,407,693 | 545,547,819 | 545,547,819 | 535,243,229 | 479,107,860 | |||||||||||||||||||||||||||||||||||
| (1) | For more information on the |
| (2) | The addition of the items may differ from the total amount due to rounding. |
| (3) | Other operating income included in this Statement of Income Data is equivalent to the sum of income derived from |
(*)Law No. 20,780 issued on September 29, 2014, introduced modifications to the income tax system in Chile and other tax matters. On October 17, 2014 the Chilean Superintendence of Securities and Insurance (the “SVS”) issued Circular No. 856, which established that the effects of the change in the income tax rates on deferred tax assets and liabilities must be recognized directly on the Balance Sheet within “Retained earnings” instead of on the Income Statement as required by IAS 12. In order to comply with IAS 12, the financial statements in this document for the period ended December 31, 2014 are different from those presented to the SVS as the modifications introduced by Law No. 20,780 have been recognized within the income statement. For more information on the reconciliation of such differencessee Note 2.1 and Note 18 to our audited consolidated financial statements.
The table below presents LATAM’s unaudited operating data of LATAM as at and for the year ended December 31, 2009, 2010, 2011 (which represents LAN’s historical unaudited operating data), as atof and for the year ended December 31, 2012 (which includes TAM’s unaudited operating data since June 23, 2012), and as atof and for the yearyears ended December 31, 2013.2013, December 31, 2014, December 31, 2015 and December 31, 2016. LATAM believes this operating data is useful to reportin reporting the operating performance of its business and may be used by certain investors in evaluating companies operating in the global air transportation sector. However, these measures may differ from similarly titled measures reported by other companies, and should not be considered in isolation or as a substitute for measures of performance in accordance with IFRS. This unaudited operating data is not included in or derived from LATAM’s financial statements.
| For the year ended and as at December 31, | ||||||||||||||||||||
| Operating Data: | 2013 | 2012(1) | 2011 | 2010 | 2009 | |||||||||||||||
ASKs (million) | 131,690.7 | 93,319.2 | 48,153.6 | 42,355.2 | 38,776.2 | |||||||||||||||
RPKs (million) | 106,466.4 | 74,694.9 | 38,422.9 | 33,147.5 | 29,836.2 | |||||||||||||||
ATKs (million) | 7,651.9 | 6,449.6 | 5,192.7 | 4,628.7 | 3,848.9 | |||||||||||||||
RTKs (million) | 4,466.7 | 4,044.5 | 3,612.4 | 3,245.3 | 2,627.4 | |||||||||||||||
ASK Equivalent (million) | 212,236.8 | 161,209.3 | 102,813.6 | 91,078.4 | 79,290.9 | |||||||||||||||
Although most of our revenues and expenses are denominated in U.S. dollars, some are denominated in different currencies, such as the Chilean peso or the Brazilian real. Fluctuations in foreign exchange rates could lead to changes in the value of these items in U.S. dollars. Nevertheless, the impact on our results stemming from any such fluctuations is partially mitigated by the fact that 42% of our revenues and 60% of our operating expenses for the year ended December 31, 2013 are denominated in U.S. dollars.
LATAM Unaudited Pro Forma Financial Information
The unaudited pro forma statement of income data for the year ended December 31, 2012 combines the historical consolidated statements of income of LAN and TAM, giving effect to the combination as if it had been consummated on January 1, 2012. The table below compares the actual financial information of LATAM as of December 31, 2013 with the unaudited pro forma financial information of LATAM as at December 31, 2012.
The unaudited pro forma information has been prepared using the purchase method of accounting, with LAN treated as the acquirer of TAM. A reconciliation of the unaudited LATAM Pro Forma Financial Information to LATAM’s audited consolidated income statements for the year ended December 31, 2012, which have been prepared in accordance with IFRS, is included under “Item 5. Operating and Financial Review and Prospects—A. Operating Results—LATAM Airlines Group Financial Results Discussion: Year ended December 31, 2013 (Actual) compared to year ended December 31, 2012 (Pro forma)—Pro Forma Adjustments.”
The LATAM unaudited Pro Forma Financial Information is provided for illustrative purposes only and does not purport to represent what the actual consolidated results of operations or the consolidated financial position of LATAM would have been had the proposed combination occurred on the date assumed, nor are they necessarily indicative of future consolidated results of operations or consolidated financial position of LATAM.
LATAM has incurred and expects to incur significant costs in the future associated with integrating the operations of LAN and TAM. The LATAM unaudited Pro Forma Financial Information does not reflect the costs of any integration activities that had not already been incurred as of dates for which financial information is presented or benefits that may result from realization of future cost savings from operating efficiencies or revenue synergies expected to result from the proposed combination. You should read the unaudited pro forma financial information below in conjunction with our audited consolidated financial statements and the notes thereto, as well as “Item 5. Operating and Financial Review and Prospects—A. Operating Results—LATAM Airlines Group Financial Results Discussion: Year ended December 31, 2013 (Actual) compared to year ended December 31, 2012 (Pro forma)—Pro Forma Adjustments,” “Presentation of Information” and “Item 5. Operating and Financial Review and Prospects.”
The Company(2)(3) Statement of Income Data: Operating revenues Passenger Cargo Total operating revenues Cost of sales Gross margin Other operating income(4) Distribution costs Administrative expenses Other expenses Other gains/(losses) Financial income Financial costs Equity accounted earnings Exchange rate differences Result of indexation units Income before income taxes Income tax Net income for the period Income attributable to the parent company’s equity holders Income attributable to non-controlling interests Net income for the period Earnings per share(5) Average number of Shares Basic earnings per share (US$) Diluted earnings per share(US$) Year ended December 31, 2013 2012(1) (actual) (pro forma) 11,061.6 11,017.0 1,863.0 1,939.8 12,924.5 12,956.7 (10,054.2 ) (10,536.7 ) 2,870.4 2,420.1 341.6 265.4 (1,025.9 ) (1,059.7 ) (1,136.1 ) (1,174.8 ) (408.7 ) (364.5 ) (55.4 ) (34.8 ) 72.8 117.2 (462.5 ) (444.2 ) 2.0 1.0 (482.2 ) (290.1 ) 0.2 (0.0 ) (283.9 ) (564.5 ) 20.1 69.7 (263.8 ) (494.9 ) (281.1 ) (523.1 ) 17.3 28.3 (263.8 ) (496.7 ) 487,930,977 476,293,870 (0.57613 ) (1.26891 ) (0.57613 ) (1.26891 )
The table below compares the unaudited operating data of LATAM as at December 31, 2013 with the unaudited pro forma operating data of LATAM as at December 31, 2012, which has been prepared by adding the operating data for TAM for the period between January 1, 2012 and June 22, 2012 to LAN’s historical operating data for that period. LATAM believes this operating data is useful to report the operating performance of its business and may be used by certain investors in evaluating companies operating in the global air transportation sector. However these measures may differ from similarly titled measures reported by other companies, and should not be considered in isolation or as a substitute for measures of performance in accordance with IFRS. The unaudited operating data and the unaudited pro forma operating data is not included in or derived from LATAM’s financial statements.
ASKs (million) RPKs (million) ATKs (million) RTKs (million) ASK Equivalent (million) For the year ended and as
at December 31, Pro Forma Operating Data: 2013
(actual) 2012(1)
(pro forma) 131,690.7 132,185.9 106,466.4 103,886.1 7,651.9 7,645.9 4,466.7 4,488.3 212,236.8 212,669.5
| For the year ended and as of December 31, | ||||||||||||||||||||
| 2016 | 2015 | 2014 | 2013 | 2012 | ||||||||||||||||
Operating Data: | ||||||||||||||||||||
ASKs (million) | 134,967.7 | 134,167.1 | 130,200.9 | 131,690.9 | 132,186.0 | |||||||||||||||
RPKs (million) | 113,626.9 | 111,509.9 | 108,534.0 | 106,466.5 | 103,886.1 | |||||||||||||||
ATKs (million) | 6,704.1 | 7,082.8 | 7,219.7 | 7,651.9 | 7,645.9 | |||||||||||||||
RTKs (million) | 3,465.9 | 3,797.0 | 4,317.2 | 4,466.7 | 4,488.3 | |||||||||||||||
ASK Equivalent (million) | 205,537.5 | 208,722.5 | 206,197.9 | 212,237.0 | 212,669.6 | |||||||||||||||
Dividend Policy
In accordance with theLey sobre Sociedades Anónimas No. 18,046 (Chilean(“Chilean Corporation Act)Act”) andReglamento de Sociedades Anónimas(“Regulation to the Chilean Corporation Act)Act”) (collectively, the “Chilean Corporation Law”), we must pay annual cash dividends equal to at least 30.0% of our annual consolidated distributable net income eachfor the prior year, (calculated in accordance with IFRS), subject to limited exceptions. LATAM Airlines Group’s board of directors has the authority to declare interim dividends.Year-end dividends, if any, are declared by our shareholders at our annual meeting. For a description of our dividend policy, see “Item 8. Financial Information—A. Consolidated Financial Statements and Other Financial Information—Dividend Policy” and “Item 10. Additional Information—B. Memorandum and Articles of Association—Dividend and Liquidation Rights.”Rights”. LATAM did not pay an interim dividenddividends in 2013.2014, 2015 or 2016. Dividend reserves of US$20,766,199 have been set aside in 2016, to be paid in 2017.
We declare cash dividends in U.S. dollars, but make dividend payments in Chilean pesos, converted from U.S. dollars at the observed exchange rate two business days prior to the day we first make payment to shareholders. Payments of cash dividends to holders of ADRs,ADSs, if any, are made in Chilean pesos to the custodian, which converts those Chilean pesos into U.S. dollars and delivers U.S. dollars to the depositary for distribution to holders. In the event that the custodian is unable to convert immediately the Chilean currency received as dividends into U.S. dollars, theThe amount of U.S. dollars payabledistributed to holders of ADRsADSs may be adversely affected by a devaluation of the Chilean currency that may occur before such dividends are converted and remitted.
LATAM’s Dividend Payments
The table below sets forth the cash dividends per common share and per ADS paid by LATAM, as well as the number of common shares entitled to such dividends, for the years indicated. Dividends per common share amounts have not been adjusted for inflation and reflect common share amounts outstanding immediately prior to the distribution of such dividend.
Dividend for year: | Payment date(s) | Total dividend payment | Number of common shares entitled to dividend | Cash dividend per common share | Cash dividend per ADS | |||||||||||||||
| (U.S. dollars) | (in millions) | (U.S. dollars) | (U.S. dollars) | |||||||||||||||||
2009 | August 20, 2009 | 34,621,043 | 338.79 | 0.10219 | 0.10219 | |||||||||||||||
| January 21, 2010 | 70,000,978 | 338.79 | 0.20662 | 0.20662 | ||||||||||||||||
| May 20, 2010 | 10,939,558 | 338.79 | 0.03229 | 0.03229 | ||||||||||||||||
2010 | August 19, 2010 | 74,466,242 | 338.79 | 0.21980 | 0.2198 | |||||||||||||||
| January 13, 2011 | 125,000,294 | 338.79 | 0.36896 | 0.36896 | ||||||||||||||||
| April 29, 2011 | 10,386,295 | 339.31 | 0.03061 | 0.03061 | ||||||||||||||||
2011 | September 15, 2011 | 56,594,769 | 339.36 | 0.16677 | 0.16677 | |||||||||||||||
| January 12, 2012 | 85,000,207 | 340.16 | 0.24988 | 0.24988 | ||||||||||||||||
| May 17 , 2012 | 18,461,735 | 341.00 | 0.05414 | 0.05414 | ||||||||||||||||
2012 | May 17, 2013 | 3,288,125 | 483,55 | 0.00680 | 0.00680 | |||||||||||||||
Chilean Peso Exchange Rates
The following table sets forth, for the periods indicated, the high, low, average andperiod-end observed exchange rate for the purchase of U.S. dollars, expressed in Chilean pesos per U.S. dollar. The rates have not been restated in constant currency units. On April 25, 2014February 28, 2017 the observed exchange rate was Ch$559.67=645.19 = US$1.00.
| Daily Observed Exchange Rate | ||||||||||||||||
Year Ended December 31, | High | Low | Average(1) | Period-End | ||||||||||||
| Ch$ per US$ | ||||||||||||||||
2012 | 519.69 | 469.65 | 486.75 | 478.60 | ||||||||||||
2013 | 533.95 | 466.50 | 495.00 | 523.76 | ||||||||||||
2014 | 621.41 | 524.61 | 570.01 | 607.38 | ||||||||||||
2015 | 715.66 | 597.10 | 654.25 | 707.34 | ||||||||||||
2016 | 730.31 | 645.22 | 676.83 | 669.47 | ||||||||||||
2016 | ||||||||||||||||
October | 670.88 | 651.65 | 663.92 | 651.65 | ||||||||||||
November | 679.24 | 650.72 | 666.12 | 675.48 | ||||||||||||
December | 677.11 | 649.40 | 667.17 | 669.47 | ||||||||||||
2017 | ||||||||||||||||
Year Ended December 31, 2008 2009 2010 2011 2012 2013 September October November December 2014 January February March April(2) Year Ended December 31, January February Daily Observed Exchange Rate High Low Average (1) Period-End Ch$ per US$ 676.75 431.22 528.88 629.11 643.87 491.09 553.77 506.43 549.17 468.37 511.20 468.37 533.74 455.91 483.67 521.46 519.69 469.65 486.75 478.60 495.34 534.12 467.05 525.45 510.38 496.49 504.57 502.97 508.58 493.36 500.81 508.58 528.19 507.64 519.25 528.19 533.95 523.76 529.45 524.01 550.53 524.61 537.03 547.22 563.32 546.94 554.41 563.32 573.24 550.53 563.84 550.53 563.76 544.96 553.72 559.67 Daily Observed Exchange Rate High Low Average(1) Period-End Ch$ per US$ 673.36 648.31 661.19 648.87 646.97 638.35 643.21 645.19
Source: Central Bank of Chile
| (1) | For each year, the average |
Brazilian Exchange Rates
TAM maintains its accounting records and prepares its financial statements in Brazilian reais. The following tables set forth, for the periods indicated, the high, low, average and period-end observed exchange rate for the purchase of U.S. dollars, expressed in Brazilian reais per U.S. dollar. The rates have not been restated in constant currency units. On April 25, 2014 the observed exchange rate was R$2.231 = US$1.00.
| Daily Observed Exchange Rate | ||||||||||||||||
Year Ended December 31, | High | Low | Average (1) | Period-End | ||||||||||||
| R$ per US$ | ||||||||||||||||
2009 | 2.422 | 1.702 | 1.998 | 1.741 | ||||||||||||
2010 | 1.881 | 1.655 | 1.759 | 1.666 | ||||||||||||
2011 | 1.902 | 1.535 | 1.675 | 1.876 | ||||||||||||
2012 | 2.112 | 1.702 | 1.955 | 2.043 | ||||||||||||
2013 | 2.454 | 1.944 | 2.161 | 2.362 | ||||||||||||
September | 2.390 | 2.203 | 2.270 | 2.230 | ||||||||||||
October | 2.210 | 2.160 | 2.190 | 2.203 | ||||||||||||
November | 2.340 | 2.240 | 2.300 | 2.325 | ||||||||||||
December | 2.380 | 2.310 | 2.350 | 2.342 | ||||||||||||
2014 | ||||||||||||||||
January | 2.440 | 2,330 | 2,380 | 2,430 | ||||||||||||
February | 2.420 | 2.330 | 2.380 | 2.330 | ||||||||||||
March | 2.360 | 2.260 | 2.330 | 2.260 | ||||||||||||
April(2) | 2.280 | 2.168 | 2.232 | 2.231 | ||||||||||||
Source: Central Bank of Brazil
B. Capitalization and Indebtedness
Not applicable.
C. Reasons for the Offer and Use of Proceeds
Not applicable.
D. Risk Factors
We wish to caution readers that theThe following important factors, and those important factors described in other reports submittedwe submit to or filedfile with the Securities and Exchange Commission (“SEC”) among other factors,, could affect our actual results and could cause our actual results to differ materially from those expressed in any forward-looking statements made by us or on our behalf. In particular, as we are anon-U.S. company, there are risks associated with investing in our ADSs that are not typical for investments in the shares of U.S. companies. Prior to making an investment decision, you should carefully consider all of the information contained in this document, including the following risk factors.
RisksRisk Factors Relating to the Combination of LAN and TAM
LATAM Airlines Group may be unable to fully realize the anticipated benefits of the combination of LAN and TAM
In June 2012, LAN and TAM completed its business combination, which has required significant efforts in order to integrate both business practices and operations. The success of the combination will depend, in part, on the ability of LATAM Airlines Group to realize anticipated revenue synergies, cost savings and growth opportunities by combining the businesses of LAN and TAM. There is a risk, however, that LATAM Airlines Group may not be able to combine the businesses of LAN and TAM in a manner that permits LATAM Airlines Group to realize these revenue synergies, cost savings and growth opportunities in the time, manner or amounts it expects. Potential difficulties include the increased complexity associated with managing both companies, the need to integrate procedures and systems, potential loss of key employees, coordination, and potential unknown liabilitites and one-time costs related to the business combination. In addition, the fact that LAN and TAM will continue to operate with different airline certificates may introduce other complexities in terms of the diversion of management’s attention; and each company’s standards, controls and procedures,
If LATAM fails to achieve the planned restructuring effectively within the time frame that is currently contemplated or to the extent that is currently planned, or if for any other reason the expected revenue synergies, cost savings and growth opportunities fail to materialize, the combination may not produce the benefits LATAM anticipates. As of December 2013 the merged company has established numerous initiatives in order to integrate both companies and generate the estimated synergies, but we cannot assure you that these initiatives will be successful.
LATAM has incurred and will continue to incur significant costs and expenses in connection with the combination and integration of the business operations of LAN and TAM
LATAM has incurred and will continue to incur expenses in connection with the combination and the integration of LAN and TAM. In 2012 and 2013, LATAM incurred US$59.2 and US$56.0 million, respectively, of non-recurring expenses in connection with the business combination and integration of LAN and TAM, principally relating to consulting fees and travel expenses. These costs and expenses included financial advisory, legal, accounting, consulting and other advisory fees and expenses, reorganization and restructuring costs, severance/employee benefit-related expenses, filing fees, printing expenses and other related charges. There are also a large number of processes, policies, procedures, operations, technologies and systems that must be integrated in connection with the combination. Any delay in the integration of the business operations of LAN and TAM or factors beyond LATAM’s control could affect the total amount or the timing of the integration and implementation expenses.
If additional unanticipated significant costs are incurred in connection with the combination or integration of these businesses, such costs and expenses could, particularly in the near term, exceed the savings that LATAM expects to achieve from the elimination of duplicative expenses and the realization of economies of scale, other efficiencies and cost savings. Although LATAM expects to achieve savings and economies of scale sufficient to offset these integration and implementation costs over time, this net benefit may not be achieved in the near term or at all.our Company
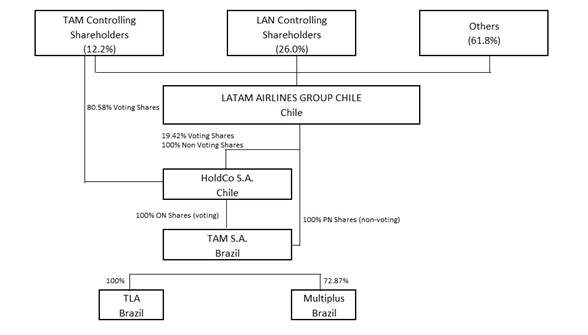
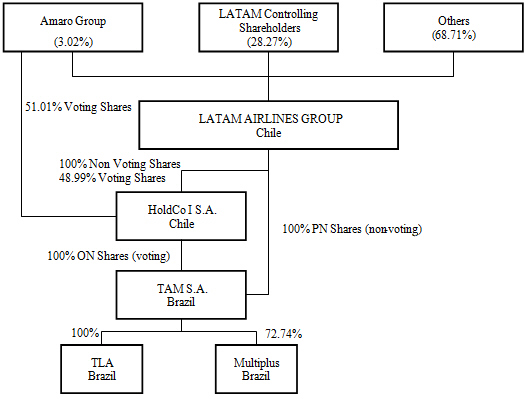
LATAM does not control the voting shares or board of directors of TAM
FollowingDue to Brazilian law restrictions on foreign ownership of Brazilian airlines, LATAM does not control the combinationvoting shares or board of LAN and TAM:directors of TAM. As of February 28, 2017, the ownership structure of TAM is as follows:
As a result of this ownership structure:
LATAM Airlines Group and TEP Chile and other parties have entered into shareholders’ agreements that establish agreements and restrictions relating to corporate governance in an attempt to balance LATAM’s interests, as the owner of substantially all of the economic rights in TAM, and the TAM controlling shareholders, as the continuing controlling shareholders of TAM under Brazilian law. See “Item 7. Controlling Shareholders and Related Party Transactions A. Major Shareholders—Shareholders’ Agreements.” These shareholders’ agreements prohibit the taking of certain specified material corporate actions and decisions without prior supermajority approval of the shareholders (5/6 of the total of the shareholders) and/or the board of directors of Holdco I or TAM. However, no assurances can be given that LATAM and the TAM controlling shareholders will be able to reach an agreement with respect to suchTAM. Certain specified actions require supermajority voting or board mattersapproval, which in the future and ifturn means they do not, the businesses, financial condition, results of operations and prospects of the combined companies could be adversely affected. In addition, pursuant to these shareholder agreements, neither Holdco I, TAM nor TAM’s subsidiaries may take certain actions without the prior approval of a supermajority of the board of directors and/or the shareholders of Holdco I or TAM. As a result of these supermajority requirements, these actions will effectively require the prior approval of both LATAM and TEP Chile (which is wholly owned by the TAM controlling shareholders). ActionsChile. Examples of actions requiring supermajority approval by the board of directors of Holdco I or TAM include, among others, entering into acquisitions or business collaborations, amending or approving budgets, business plans, financial statements and accounting policies, incurring indebtedness, encumbering assets, entering into certain agreements, making certain investments, modifying rights or claims, entering into settlements, appointing executives, creating security interests, issuing, redeeming or repurchasing securities and voting on matters as a shareholder of subsidiaries affiliates
of TAM. Actions requiring supermajority shareholder approval of Holdco I or TAM include, among others, certain changes to theby-laws of Holdco I, TAM or TAM’s subsidiariesaffiliates or any dissolution/liquidation, corporate reorganization, payment of dividends, issuance of securities, disposal or encumbrance of certain assets, creation of securities interestsecurity interests or entering into guarantees and agreements with related parties. For more information on the shareholders’ agreements, see “Item 7. Controlling Shareholders and Related Party Transactions—Shareholders’ Agreements.”
Our assets include a significant amount of goodwill.
TheOur assets of the LATAM Airlines Group included US$3,7282,710.4 million of goodwill as of December 31, 2013,2016, US$3,5642,582.5 million of which results from the merger withcombination of LAN and TAM. Under IFRS, goodwill is subject to an annual impairment test and may be required to be tested more frequently if events or circumstances indicate a potential impairment. In 2016, mainly as a result of the appreciation of the Brazilian real against the U.S. dollar, the value of our goodwill increased by 18.8% as compared with 2015. Any impairment could result in the recognition of a significant charge to earnings in LATAM’sour statement of income, which could materially and adversely impact our consolidated results for the period in which the impairment occurs.
A failure to successfully implement our strategy or a failure adjusting the strategy to the current economic situation would harm our business and the market value of our ADSs and common shares.
We have developed a strategic plan with the goal of becoming one of the best airlines in the world and renewing our commitment to sustained profitability and superior returns to shareholders. Our strategy requires us to identify value propositions that are attractive to our clients, to find efficiencies in our daily operations, and to transform ourselves into a stronger and more risk-resilient company. A tenet of our strategic plan is the adoption of a new travel model for domestic services in the six countries where we have domestic operations to address the changing dynamics of customers and the industry, and to increase our competitiveness. The financialnew travel model is based on a continued reduction in air fares that makes air travel accessible to a wider audience, and in particular to those wish to fly more frequently. This model requires continued cost reduction efforts, and in order to achieve this the Company is implementing a series of initiatives to reduce cost per ASK in all its domestic operations.
Difficulties in implementing our strategy may adversely affect our business, results of LATAM are more exposedoperation and the market value of our ADSs and common shares.
A failure to foreign currency fluctuations followingsuccessfully transfer the value proposition of the LAN and TAM brands to a new single brand, may adversely affect our business and the market value of our ADSs and common shares.
Following the combination in 2012, LAN and TAM continued to operate with TAM.
The financial results of LATAM are more exposed to currency exchange rate fluctuations as a result oftheir original brands. During 2016, we began the combination with TAM and the resulting increase in the proportion of its assets, liabilities and earnings that are denominated in currencies other than U.S. dollars.
LATAM prepares and presents its consolidated financial statements in U.S. dollars, which was the functional and presentation currency of LAN. The combinationtransition of LAN and TAM has significantly increasesinto a single brand. LAN and TAM had different value propositions, and there can be no assurances that we will be able to fully transfer the proportionvalue of LATAM’s consolidated net assets, revenuesthe original LAN and incomeTAM brands to our new single brand “LATAM”. Difficulties in non-U.S. dollar currencies, primarily Chileanpesosimplementing our single brand may prevent us from consolidating as a customer preferred carrier and Brazilianreais. In particular, the majority of TAM’s revenues are denominated in Brazilian reais, while a significant portion of its operating expenses are denominated in, or linked to, the U.S. dollar or other foreign currencies. The consolidated financial conditionmay adversely affect our business and results of operations of LATAM will therefore be more sensitive to movements in exchange rates between the U.S. dollar and other currencies. A depreciation of non-U.S. dollar currencies relative to the U.S. dollar could have an adverse impact on the financial condition, results of operations and prospects of LATAM.
Following the combination, Fitch Ratings Inc. (“Fitch”) lowered LATAM’s credit rating. This downgrade, or further downgrades from securities rating agencies, could have a negative effect on LAN’s business
Prior to the combination, TAM had a lower credit rating and was more leveraged than LAN. Following the combination, Fitch Ratings Inc. downgraded LATAM Airlines Group S.A.’s long-term foreign currency issuer default rating from BBB to BB+, which is below investment grade. Later, on May 3, 2013, Fitch downgraded LATAM’s rating again, to BB, citing the Company’s operational performance and the deteriorationmarket value of its capital structure. The Fitch downgradeour ADSs and any further securities rating agencies downgrades could increase LATAM’s financing costs and affect LATAM’s ability to finance future fleet acquisitions and could adversely affect the financial condition, results of operations and prospects of the combined companies.common shares.
It may take time to combine the frequent flyer programs of LAN and TAMTAM.
We have integrated the separate frequent flyer programs of LAN and TAM each previously ran their own frequent flyer programs. While LATAM has integrated these programs so that passengers can use frequent flyer miles earned with either LAN or TAM interchangeably,interchangeably. During 2016, LAN and TAM announced their revamped frequent flyer programs, which have new names: LATAM Pass and LATAM Fidelidade, respectively. The change is part of the process of consolidating the airline group’s new brand identity (LATAM) and the evolution of the programs, which enhances existing benefits and introduces new benefits for program members. However, there is no guarantee that full integration of the two plans will be completed in the near term or at all. Even if the integration occurs, the successful integration of these programs will involve some time and expense. Moreover, during 2016, LATAM Pass and LATAM Fidelidade approved changes in their mileage earning policy which may impact the attractiveness of the programs to passengers. Until LATAMwe effectively combinescombine these programs, passengers may prefer frequent flyer programs offered by other airlines, which may adversely affect our business.
TAM has leftOur financial results are exposed to foreign currency fluctuations.
We prepare and present our consolidated financial statements in U.S. dollars. LATAM and its affiliates operate in numerous countries and face the Star Alliancerisk of variation in foreign currency exchange rates against the U.S. dollar or between the currencies of these various countries. Changes in the exchange rate between the U.S. dollar and become a member of the oneworld® airline alliance. This changecurrencies in the countries in which we operate could adversely affect LATAM’sour business, financial condition and results of operations.. If the value of the Brazilian real, Chilean peso or other currencies in which revenues are denominated declines against the U.S. dollar, our results of operations and financial condition will be affected. The exchange rate of the Chilean peso, Brazilian real and other currencies against the U.S. dollar may fluctuate significantly in the future.
Changes in Chilean, Brazilian and other governmental economic policies affecting foreign exchange rates could also adversely affect our business, financial condition, results of operations and the return to our shareholders on their common shares or ADSs.
We depend on strategic alliances or commercial relationships in many of the countries in which we operate, and our business may suffer if clients prefer other alliances.any of our strategic alliances or commercial relationships terminates.
We maintain a number of alliances and other commercial relationships in many of the jurisdictions in which LATAM announcedand its affiliates operate. These alliances or commercial relationships allow us to enhance our network and, in some cases, to offer our customers services that we could not otherwise offer. If any of our strategic alliances or commercial relationships, deteriorates, or any of these agreements are terminated, our business, financial condition and results of operations could be adversely affected.
Our business and results of operations may suffer if we fail to obtain and maintain routes, suitable airport access, slots and other operating permits.
Our business depends upon our access to key routes and airports. Bilateral aviation agreements between countries, open skies laws and local aviation approvals frequently involve political and other considerations outside of our control. Our operations could be constrained by any delay or inability to gain access to key routes or airports, including:
We operate numerous international routes, subject to bilateral agreements, and also internal flights within Chile, Peru, Brazil, Argentina, Ecuador, Colombia and other countries, subject to local route and airport access approvals. See “Item 4. Information on the Company—B. Business Overview—Regulation.”
There can be no assurance that TAM will leave Star Alliance and become a member ofoneworld® airline alliance. On October 1, 2013 LATAM ratifiedoneworld® as the global alliance for its airline members. With this decision, TAM left Star Alliance on March 30, 2014 and joinedoneworld® on March 31, 2014, complyingexisting bilateral agreements with the requirement imposedcountries in which our companies are based and permits from foreign governments will continue. A modification, suspension or revocation of one or more bilateral agreements could have a material adverse effect on our business, financial condition and results of operations. The suspension of our permission to operate in certain airports, destinations or slots, or the imposition of other sanctions could also have a material adverse effect. A change in the administration of current laws and regulations or the adoption of new laws and regulations in any of the countries in which we operate that restrict our route, airport or other access may have a material adverse effect on our business, financial condition and results of operations.
A significant portion of our cargo revenue comes from relatively few product types and may be impacted by events affecting their production, trade or demand.
Our cargo demand, especially from Latin American exporters, is concentrated in a small number of product categories, such as exports of fish, sea products and fruits from Chile, and asparagus from Peru, and exports of fresh flowers from Ecuador and Colombia. Events that adversely affect the production, trade or demand for these goods may adversely affect the volume of goods that we transport and may have a significant impact on our results of operations. Some of our cargo products are sensitive to foreign exchange rates and, therefore, traffic volumes could be impacted by the appreciation or depreciation of local currencies.
Our operations are subject to fluctuations in the supply and cost of jet fuel, which could adversely impact our business.
Higher jet fuel prices could have a materially adverse effect on our business, financial condition and results of operations. Jet fuel costs have historically accounted for a significant amount of our operating expenses, and accounted for 23.0% of our operating expenses in 2016. Both the cost and availability of fuel are subject to many economic and political factors and events that we can neither control nor predict. We have entered into fuel hedging arrangements, but there can be no assurance that such arrangements will be adequate to protect us from an increase in fuel prices in the near future or in the long term. Also, while these hedging arrangements are designed to limit the effect of an increase in fuel prices, our hedging methods may also limit our ability to take advantage of any decrease in fuel prices, as was the case in 2015 and, to a lesser extent, in 2016. Although we have implemented measures to pass a portion of incremental fuel costs to our customers, our ability to lessen the impact of any increase in fuel costs using these types of mechanisms may be limited.
We rely on maintaining a high aircraft utilization rate to increase our revenues and absorb our fixed costs, which makes us especially vulnerable to delays.
A key element of our strategy is to maintain a high daily aircraft utilization rate, which measures the number of flight hours we use our aircraft per day. High daily aircraft utilization allows us to maximize the amount of revenue we generate from our aircraft and
absorb the fixed costs associated with our fleet and is achieved, in part, by reducing turnaround times at airports and developing schedules that enable us to increase the average hours flown per day. Our rate of aircraft utilization could be adversely affected by a number of different factors that are beyond our control, including air traffic and airport congestion, adverse weather conditions, unanticipated maintenance and delays by third-party service providers relating to matters such as fueling and ground handling. If an aircraft falls behind schedule, the resulting delays could cause a disruption in our operating performance.
We fly and depend upon Airbus and Boeing aircraft, and our business could suffer if we do not receive timely deliveries of aircraft, if aircraft from these companies becomes unavailable or if the public negatively perceives our aircraft.
As our fleet has grown, our reliance on Airbus and Boeing has also grown. As of December 31, 2016, LATAM Airlines Group has a fleet of 250 Airbus and 82 Boeing aircraft. Risks relating to Airbus and Boeing include:
The occurrence of any one or more of these factors could restrict our ability to use aircraft to generate profits, respond to increased demands, or could otherwise limit our operations and adversely affect our business.
If we are unable to incorporate leased aircraft into our fleet at acceptable rates and terms in connection withthe future, our business could be adversely affected.
A large portion of our aircraft fleet is subject to long-term operating leases. Our operating leases typically run from three to 12 years from the date of delivery. We may face more competition for, or a limited supply of, leased aircraft, making it difficult for us to negotiate on competitive terms upon expiration of our current operating leases or to lease additional capacity required for our targeted level of operations. If we are forced to pay higher lease rates in the future to maintain our capacity and the number of aircraft in our fleet, our profitability could be adversely affected.
Our business may be adversely affected if we are unable to service our debt or meet our future financing requirements.
We have a high degree of debt and payment obligations under our aircraft operating leases and financial debt arrangements. We require significant amounts of financing to meet our aircraft capital requirements and may require additional financing to fund our other business needs. We cannot guarantee that we will have access to or be able to arrange for financing in the future on favorable terms. Following the combination with TAM. The withdrawal from the Star Alliance may impede LATAM from providing customers with exactly the same benefits previously provided byof LAN and TAM, suchFitch Ratings Inc. and Standard and Poor’s downgraded LATAM Airlines Group S.A.’s credit rating to levels that are below investment grade. Any further securities rating agencies downgrades could increase our financing costs. Higher financing costs could affect our ability to expand or renew our fleet, which in turn could adversely affect our business.
In addition, the majority of our property and equipment is subject to liens securing our indebtedness. In the event that we fail to make payments on secured indebtedness, creditors’ enforcement of liens could limit or end our ability to use the affected property and equipment to fulfill our operational needs and thus generate revenue.
Moreover, external conditions in the financial and credit markets may limit the availability of funding at particular times or increase its costs, which could adversely affect our profitability, our competitive position and result in lower net interest margins, earnings and cash flows, as well as lower returns on shareholders’ equity and invested capital. Factors that may affect the same travel destinations, combinedavailability of funding or cause an increase in our funding costs include global macro-economic crises, reduction of our credit rating, and other potential market disruptions.
We have significant exposure to LIBOR and other floating interest rates; increases in interest rates will increase our financing costs and may have adverse effects on our financial condition and results of operations.
We are exposed to the risk of interest rate variations, principally in relation to the U.S. dollar London Interbank Offer Rate (“LIBOR”). Many of our operating and financial leases are denominated in U.S. dollars and bear interest at a floating rate. 36.9% of our outstanding consolidated debt as of December 31, 2016 bears interest at a floating rate after giving effect to interest rate hedging agreements. Volatility in LIBOR or other reference rates could increase our periodic interest and lease payments and have an adverse effect on our total financing costs. We may be unable to adequately adjust our prices to offset any increased financing costs, which would have an adverse effect on our revenues and our results of operations.
Increases in insurance costs and/or significant reductions in coverage could harm our financial condition and results of operations.
Major events affecting the aviation insurance industry (such as terrorist attacks, hijackings or airline crashes) may result in significant increases of airlines’ insurance premiums or in significant decreases of insurance coverage, as occurred after the September 11, 2001 terrorist attacks. Increases in insurance costs and/or significant reductions in coverage could harm our financial condition and results of operations and increases the risk that we experience uncovered losses.
Problems with air traffic control systems or other technical failures could interrupt our operations and have a material adverse effect on our business.
Our operations, including our ability to deliver customer service, are dependent on the effective operation of our equipment, including our aircraft, maintenance systems and reservation system, itinerary flexibility, among others.systems. Our operations are also dependent on the effective operation of domestic and international air traffic control systems and the air traffic control infrastructure by the corresponding authorities in the markets in which we operate. Equipment failures, personnel shortages, air traffic control problems and other factors that could interrupt operations could adversely affect our operations and financial results as well as our reputation.
We depend on a limited number of suppliers for certain aircraft and engine parts.
We depend on a limited number of suppliers for aircraft, aircraft engines and many aircraft and engine parts. As a result, we are vulnerable to any problems associated with the supply of those aircraft, parts and engines, including design defects, mechanical problems, contractual performance by the suppliers, or adverse perception by the public that would result in customer avoidance or in actions by the aviation authorities resulting in an inability to operate our aircraft.
Our business relies extensively on third-party service providers. Failure of these parties to perform as expected, or interruptions in our relationships with these providers or their provision of services to us, could have an adverse effect on our financial position and results of operations.
We have engaged a significant number of third-party service providers to perform a large number of functions that are integral to our business, including regional operations, operation of customer service call centers, distribution and sale of airline seat inventory, provision of information technology infrastructure and services, provision of aircraft maintenance and repairs, catering, ground services, and provision of various utilities and performance of aircraft fueling operations, among other vital functions and services. We do not directly control these third-party service providers, although we do enter into agreements with many of them that define expected service performance. Any of these third-party service providers, however, may materially fail to meet their service performance commitments, may suffer disruptions to their systems that could impact their services, or the agreements with such providers may be terminated. For example, flight reservations booked by customers and/or travel agencies via third-party GDSs (Global Distribution Systems) may be adversely affected by disruptions in our business relationships with GDS operators. Such disruptions, including a failure to agree upon acceptable contract terms when contracts expire or otherwise become subject to renegotiation, may cause the carriers’ flight information to be limited or unavailable for display, significantly increase fees for both us and GDS users, and impair our relationships with customers and travel agencies. The failure of any of our third-party service providers to adequately perform their service obligations, or other interruptions of services, may reduce our revenues and increase our expenses or prevent us from operating our flights and providing other services to our customers. In addition, our business, financial performance and reputation could be materially harmed if our customers believe that our services are unreliable or unsatisfactory.
Disruptions or security breaches of our information technology infrastructure or systems could interfere with our operations, compromise passenger or employee information, and expose us to liability, possibly causing our business and reputation to suffer.
A serious internal technology error or failure impacting systems hosted internally at our data centers or externally at third-party locations, or large-scale interruption in technology infrastructure we depend on, such as power, telecommunications or the internet, may disrupt our technology network with potential impacton our operations. Our technology systems and related data may also be vulnerable to a variety of sources of interruption, including natural disasters, terrorist attacks, telecommunications failures, computer viruses, hackers and other security issues. While we have in place, and continue to invest in, technology security initiatives and disaster recovery plans, these measures may not be adequate or implemented properly so as to prevent a business disruption and its adverse financial and reputational consequences to our business.
In addition, as a part of our ordinary business operations, we collect and store sensitive data, including personal information of our passengers and employees and information of our business partners. The secure operation of the networks and systems on which this type of information is stored, processed and maintained is critical to our business operations and strategy. Unauthorized parties may prefer alliances offered by LATAM’s competitors,attempt to gain access to our systems or information through fraud or deception. Hardware or software we develop or acquire
may contain defects that could unexpectedly compromise information security. The compromise of our technology systems resulting in the loss, disclosure, misappropriation of, or access to, customers’, employees’ or business partners’ information could result in legal claims or proceedings, liability or regulatory penalties under laws protecting the privacy of personal information, disruption to our operations and consequently decidedamage to fly with them,our reputation, any or all of which maycould adversely affect LATAM’sour business.
Increases in our labor costs, which constitute a substantial portion of our total operating expenses, could directly impact our earnings.
Labor costs constitute a significant percentage of our total operating expenses (21.8% in 2016) and at times in our operating history we have experienced pressure to increase wages and benefits for our employees. A significant increase in our labor costs could result in a material reduction in our earnings.
Our business may experience adverse consequences if we are unable to reach satisfactory collective bargaining agreements with our unionized employees.
As of December 31, 2016, approximately 72.9% of our employees, including administrative personnel, cabin crew, flight attendants, pilots and maintenance technicians are members of unions and have contracts and collective bargaining agreements which expire on a regular basis. Our business, financial condition and results of operations could be materially adversely affected by a failure to reach agreement with any labor union representing such employees or by an agreement with a labor union that contains terms that are not in line with our expectations or that prevent us from competing effectively with other airlines.
Collective action by employees could cause operating disruptions and adversely impact our business.
Certain employee groups such as pilots, flight attendants, mechanics and our airport personnel have highly specialized skills. As a consequence, actions by these groups, such as strikes, walk-outs or stoppages, could severely disrupt our operations and adversely impact our operating and financial performance, as well as our image.
We may experience difficulty finding, training and retaining employees.
Our business is labor intensive. We employ a large number of pilots, flight attendants, maintenance technicians and other operating and administrative personnel. The airline industry has, from time to time, experienced a shortage of qualified personnel, especially pilots and maintenance technicians. In addition, as is common with most of our competitors, we may, from time to time, face considerable turnover of our employees. Should the turnover of employees, particularly pilots and maintenance technicians, sharply increase, our training costs will be significantly higher. A failure to recruit, train and retain qualified employees at a reasonable cost could materially adversely affect our business, financial condition and results of operations.
Risks Related to our Operationsthe Airline Industry and the Airline IndustryCountries in Which We Operate
Our performance is heavily dependent on economic conditions in the countries in which we do business and negativebusiness. Negative economic conditions in those countries could have an adverseadversely impact on our business.business and results of operations and cause the market price of our common shares and ADSs to decrease.
Passenger and cargo demand is heavily cyclical and highly dependent on global and local economic growth, economic expectations and foreign exchange rate variations, among other things. In the past, our business has been negativelyadversely affected by global economic recessionary conditions, weak economic growth in Chile, recession in Brazil and Argentina and poor economic performance in certain emerging market countries in which we operate. The occurrence of similar events in the future could adversely affect our business. In fact, starting as of late 2008, and during 2009, many of the countries we serve, including Chile, experienced economic slowdowns or recessions, which translated into a substantial weakening of passenger and cargo demand. We plan to continue to expand our operations based in Latin America and our performance will, therefore, continue to depend heavily on economic conditions in the region.
Any of the following factors could adversely affect our business, financial condition and results of operations in the countries in which we operate:
No assurance can be given that capacity reductions or other steps we may take in response to weakened demand will be adequate to offset any future reduction in our cargo and/or air travel demand.demand in Brazil or in other markets in which we operate. Sustained weakened demand may adversely impact our revenues, results of operations or financial condition.
We are exposed to increases in landing fees and other airport service charges that could adversely affect our margin and competitive position.
Airlines must pay fees to airport operators for the use of airport facilities. Passenger taxes and airport charges have increased substantially in recent years. We cannot assure you that the airports in which we operate will not increase or maintain high passenger taxes and service charges in the future. Any substantial increase in airport charges could have a material adverse impact on our results of operations. In addition, any increase in passenger taxes could negatively impact demand for air travel and affect our results.
Our business is highly regulated and changes in the regulatory environmentalenvironment in which we operate may adversely affect our business and results of operations.
Our business is highly regulated and depends substantially upon the regulatory environment in the countries in which we operate or intend to operate. For example, price controls on fares may limit our ability to effectively apply customer segmentation profit maximization techniques (“passenger revenue management”) (management techniques utilizing passenger demand forecasting and fare mix optimization techniques to maximize profit for an airline) and adjust prices to reflect cost pressures. High levels of government regulation may limit the scope of our operations and our growth plans, especially inplans. The possible failure of aviation authorities to maintain the event of deterioration of the relations between the countries in which we operaterequired governmental authorizations or the public perception of foreign companies in local markets. Accordingly, regulatory issues couldour failure to comply with applicable regulations, may adversely affect our business and results of operations.
Our business, financial condition and results of operations could be adversely affected if we or certain aviation authorities in the countries served by our airlines fail to maintain the required foreign and domestic governmental authorizations. In order to maintain the necessary authorizations issued by the corresponding local authorities of the countries in which we operate, we must continue to comply with applicable statutes, rules and regulations pertaining to the airline industry, including any rules and regulations that may be adopted in the future.
We depend on strategic alliances or commercial relationships in many of the countries in which we operate and our business may suffer if any of our strategic alliances or commercial relationships terminates.
In many of the jurisdictions in which we operate, we have found it in our interest to maintain a number of alliances and other commercial relationships. These alliances or commercial relationships allow us to enhance our network and, in some cases, to offer our customers services that we could not otherwise offer. If any of our strategic alliances or commercial relationships and, in particular, with American Airlines, Iberia, Qantas oroneworld®, Japan Airlines, Korean Airlines, Cathay Pacific, Alaska Airlines deteriorates, or any of these agreements are terminated, our business, financial condition and results of operations could be negatively affected.
Our business and results of operation may suffer if we fail to obtain and maintain routes, suitable airport access, slots and other operating permits.
Our business depends upon our access to key routes and airports. Our operations could be constrained by any delay or inability to gain access to key routes or airports, including:
We operate numerous international routes, subject to bilateral agreements, and also internal flights within Chile, Peru, Brazil, Argentina, Ecuador, Colombia and other countries, subject to local route and airport access approvals. Bilateral aviation agreements as well as local aviation approvals frequently involve political and other considerations outside of our control. See “Item 4. Information on the Company—B. Business Overview—Regulation.”
There can be no assurance that existing bilateral agreements between the countries in which our companies are based and permits from foreign governments will continue. A modification, suspension or revocation of one or more bilateral agreements could have a material adverse effect on our business, financial condition and results of operations. The suspension of our permission to operate in certain airports or destinations or the imposition of other sanctions could also have a material adverse effect. A change in the administration of current laws and regulations or the adoption of new laws and regulations in any of the countries in which we operate that restricts our route, airport or other access may have a material adverse effect on our business, financial condition and results of operations.
If we are unable to obtain favorable take-off and landing authorizations at certain high-density airports, our business, financial condition and results of operations could be adversely affected. There can be no assurance that we will be able to obtain all requested authorizations and slots in the future because, among other factors, government policies regulating the distribution of the authorizations and slots are subject to change.
A failure to successfully implement our growth strategy would harm our business and the market value of the ADSs and our common shares.
Our growth strategy involves increasing the frequency of flights to the markets we currently serve and expanding our service to new markets. In order to carry out this strategy, we must be able to identify the appropriate geographic markets upon which to focus and to gain suitable airport access and route approval in these markets. There can be no assurance that the new markets we enter or in which we are seeking to expand our operations will provide passenger and cargo traffic that is sufficient to make our operations in those new markets profitable.
The expansion of our business will also require additional skilled personnel, equipment and facilities. An inability to hire and retain skilled personnel or secure the required equipment and facilities efficiently and cost-effectively may adversely affect our ability to execute our growth strategy. Expansion of our markets and flight frequencies may also strain our existing management resources and operational, financial and management information systems to the point that they may no longer be adequate to support our operations, requiring us to make significant expenditures in these areas.
Our business may be adversely affected by a downturn in the airline industry caused by exogenous events that affect travel behavior or increase costs, such as outbreak of disease, weather conditions and natural disasters, war or terrorist attacks.
Demand for air transportation may be adversely impacted by exogenous events, such as adverse weather conditions and natural disasters, epidemics, terrorist attacks, war or political and social instability. Situations such as these in one or more of the markets in which we operate could have a material impact on our business, financial condition and results of operations. Furthermore, these types of situations could have a prolonged effect on air transportation demand and on certain cost items.
Revenues for airlines depend on the number of passengers carried, the fare paid by each passenger and service factors, such as the timeliness of flight departures and arrivals. During periods of fog, ice, low temperatures, storms or other adverse weather conditions, some or all of our flights may be cancelled or significantly delayed, reducing our revenues. For example, in January 2010, extreme floods affected the city of Cuzco in Peru, causing important human and material damage and severely affecting this tourist destination. This affected our operations, which led us to decrease our capacity in order to improve load factors. We estimated the net impact of decreased passenger operations due to this weather event to have been approximately US$15.0 million. In addition, on February 27, 2010, an earthquake struck Chile causing major damages mainly in the southern regions of the country. This earthquake damaged the terminal building at the Santiago International Airport causing the suspension of LAN’s passenger services to and from Chile until March 1, 2010 and reduced passenger operations until March 28, 2010. We estimated the net impact of decreased passenger operations due to the earthquake to have been approximately US$30 million. In 2011, the Company was also impacted by the presence of volcanic ash on certain routes in Chile and other destinations, which we estimate resulted in US$36.6 million in losses, in addition to forgone revenue.
As for year 2014, the World Cup in Brazil could affect adversely our normal operations. Increasing traffic to Brazil during the month of the event will create operational challenges and could result in increased delays. In addition, during the month of the event, we expect a strong decrease in corporate traffic, although we expect this decrease to be offset by an increase in leisure traffic, the net effect on our revenues and yields could be negative. Our LATAM Airlines brand could be damaged if we do not fully comply with our passenger’s requirements during that month or if infrastructure deficits at some of Brazil’s main airports that hinder our normal operations are associated with the Company.
Terrorist attacks may also have a severe adverse impact on the airline industry. For example, the terrorist attacks in the United States on September 11, 2001 substantially affected the airline industry, particularly foreign air carriers operating international service to and from the United States. Throughout South America, passenger traffic also decreased substantially, although the decrease was less severe than that in the United States. The airline industry experienced increased costs following the September 11, 2001 terrorist attacks. Airlines have been required to adopt additional security measures and may be required to comply with more rigorous security guidelines in the future.
In addition, fuel prices and supplies, which constitute a significant cost for us, may increase as a result of any future terrorist attacks, a general increase in hostilities (for example, the current conflict between Russia and Ukraine) or a reduction in output of fuel, voluntary or otherwise, by oil-producing countries. Such increases may result in both higher airline ticket prices and decreased demand for air travel generally, which could have an adverse effect on our revenues and results of operations.
A significant portion of our cargo revenues comes from relatively few product types and may be impacted by events affecting their production or trade.
Our cargo demand, especially from Latin American exporters, is concentrated in a small number of product categories, such as exports or fish, sea products and produce from Chile and Peru, and exports of fresh flowers from Ecuador and Colombia. Events that negatively affect the production or trade of these goods may adversely affect the volume of goods that we transport and may have a significant impact on our results of operations. Some of our cargo products are sensitive to foreign exchange rates and, therefore, traffic volumes could be impacted by the appreciation or depreciation of local currencies.
Our operations are subject to fluctuations in the supply and cost of jet fuel, which could negatively impact our business.
Higher jet fuel prices or a shortage in the supply of fuel could cause a reduction in our scheduled service and could have a materially negative effect on our business, financial condition and results of operations. Jet fuel costs have historically accounted for a significant amount of our operating expenses, and accounted for approximately 35% of our operating expenses in 2013. Both the cost and availability of fuel are subject to many economic and political factors and events that we can neither control nor predict. We have entered into fuel hedging arrangements, but there can be no assurance that such arrangements will be adequate to protect us from a significant increase in fuel prices in the near future or in the long term. Also, while these hedging arrangements are designed to limit the effect of an increase in fuel prices, some of our hedging methods may also limit our ability to take advantage of any decrease in fuel prices. Although we have implemented measures to pass a portion of incremental fuel costs to our customers, our ability to lessen the impact of any increase using these types of mechanisms may be limited.
We rely on maintaining a high daily aircraft utilization rate to increase our revenues, which makes us especially vulnerable to delays.
One of the key elements of our business strategy is to maintain a high daily aircraft utilization rate, which measures the number of flight hours we use our aircraft per day. High daily aircraft utilization allows us to maximize the amount of revenue we generate from our aircraft and is achieved, in part, by reducing turnaround times at airports and developing schedules that enable us to increase the average hours flown per day. Our rate of aircraft utilization could be adversely affected by a number of different factors that are beyond our control, including air traffic and airport congestion, adverse weather conditions and delays by third-party service providers relating to matters such as fueling and ground handling.
Furthermore, high aircraft utilization rates increase the risk that, if an aircraft falls behind schedule, it could remain behind schedule for up to two days. Such delays could result in a disruption in our operating performance, leading to customer dissatisfaction due to any resulting delays or missed connections.
We fly and depend upon Airbus and Boeing aircraft, and our business is at risk if we do not receive timely deliveries of aircraft, if aircraft from these companies becomes unavailable or if the public negatively perceives our aircraft.
As our fleet has grown, our reliance on Airbus and Boeing has also grown. As of January 31, 2014, we operated a fleet of 243 Airbus, 72 Boeing and 7 Dash aircraft. These risks include:
The occurrence of any one or more of these factors could restrict our ability to use aircraft to generate profits, respond to increased demands, or could otherwise limit our operations and adversely affect our business.
We have invested in new Boeing 787 “Dreamliner” aircraft.
In 2012, LATAM received the first three Boeing 787-8 Dreamliners, and became the first airline in the Americas (and one of the first in the world) to operate this modern and efficient aircraft. The incorporation of the Boeing 787-8 Dreamliners into our fleet is part of our strategic objective to incorporate new, modern and fuel efficient aircraft into our existing fleet.
During January 2013, two incidents occurred with Boeing 787 aircraft operated by Japan Airlines, involving a fire risk to the battery of the aircraft. By recommendation of the FAA, LATAM ceased operations of its three Dreamliner aircraft in January 2013. On April 19, 2013, the FAA approved a solution proposed by Boeing to address the battery problems, and subject to the implementation of this corrective solution and approval from safety regulators, LATAM and other airline groups were able to resume operations with Dreamliner aircraft. As of May 2013, LATAM resumed normal operations of the Boeing 787. However, new problems could be discovered that adversely affect the our ability to use the Boeing 787 in our operations.
Losses and liabilities in the event of an accident involving one or more of our aircraft could materially affect our business.
We are exposed to potential catastrophic losses in the event of an aircraft accident, terrorist incident or any other similar event. There can be no assurance that, as a result of an aircraft accident or significant incident:
Substantial claims resulting from an accident or significant incident in excess of our related insurance coverage could have a material adverse effect on our business, financial condition and results of operations. Moreover, any aircraft accident, even if fully insured, could cause the negative public perception that our aircraft are less safe or reliable than those operated by other airlines, which could have a material adverse effect on our business, financial condition and results of operations.
Insurance premiums may also increase due to an accident or incident affecting one of our airline affiliates or alliance partners or affecting other airlines.
High levels of competition in the airline industry may adversely affect our level of operations.
Our business, financial condition and results of operations could be adversely affected by high levels of competition within the industry, particularly the entrance of new competitors into the markets in which we operate. Airlines compete primarily over fare levels, frequency and dependability of service, brand recognition, passenger amenities (such as frequent flyer programs) and the availability and convenience of other passenger or cargo services. New and existing airlines (and companies providing ground cargo or passenger transportation) could enter our markets and compete with us on any of these bases, including by offering lower prices, more attractive services or increasing their route capacitiesofferings in an effort to gain greater market share. Competing carriers include investor-owned, government-subsidized and national flag carriers of foreign countries as well as low-cost carriers offering discounted fares. The U.S.-Chile and other open skies agreements may subject us to further competition from international carriers. In addition, the Brazilian Government is considering raising the regulatory limitation on foreign capital investments in the Brazilian airline industry from 20% to 49% of voting capital, which could lower barriers to entry and increase competition in this market.
In addition to traditional competition among airline companies, we face competition from companies that provide ground transportation, especially in our domestic cargo and passenger businesses, as well as sea transportation for our cargo business. Competition could reduce our passenger traffic and cargo demand, forcing us to reduce our fare levels, which could have a material adverse effect on our revenues and level of operations.
Chile may open its domestic aviation industry to foreign airlines without restrictions, which may change the competitive landscape of the domestic Chilean aviation sector and affect our business and results of operations
Currently, Chilean laws and regulations permit foreign airlines to operate domestic flights in Chile. Nevertheless, the rules currently prevent foreign-based carriers from flying within Chile without setting up a Chilean subsidiary first. There are currently no foreign airlines participating in the Chilean domestic market. However, on January 18, 2012, both the Secretary of Transportation and the Secretary of Economics of Chile announced steps towards unilaterally opening the Chilean domestic skies in the near term. Chilean Domestic Unilateral Open Skies Rule may change the competitive landscape of the Domestic Chilean Aviation Sector, as it will be easier for foreign companies in the future to freely operate in the Chilean territory, which may subject us to further competition. Competition from international carriers in the Chilean market may affect the competitive dynamics of our industry by reducing our passenger traffic and cargo demands, forcing us to reduce our fare levels, which could have a material adverse effect on our revenues and level of operations.
A recent proposal by the Brazilian government would result in the reallocation of certain takeoff and landing slots at Brazilian airports; if this proposal is enacted in its current form, it would reduce our access to important airport infrastructure and adversely affect our results of operations.
The Brazilian government has proposed, but has not yet implemented, regulations to reallocate existing takeoff and landing slots at major airports in Brazil from TAM and our competitor, GOL, to smaller airlines and new market entrants, in order to stimulate small airline access to airport infrastructure. These proposed regulations also focus on operational efficiency, and require airlines to meet specified punctuality and frequency benchmarks. We rely on access to takeoff and landing slots at the Guarulhos and Congonhas airports in Sao Paolo, as well as other major airports in Rio de Janeiro and throughout Brazil, to conduct our Brazilian passenger operations. The reallocation of any of our slots to other market participants could adversely affect our operations, particularly at the Congonhas airport where we currently utilize almost half of the existing slots to service our scheduled capacity.
Some of our competitors may receive external support, which could negativelyadversely impact our competitive position.
Some of our competitors may receive support from external sources, such as their national governments, which may be unavailable to us. Support may include, among others, subsidies, financial aid or tax waivers. This support could place us at a competitive disadvantage and adversely affect our operations and financial performance.
If we are unable to incorporate leased aircraft into our fleet at acceptable rates and terms in the future, our business could be adversely affected.
A large portion of our aircraft is subject to long-term operating leases. Our operating leases typically run from three to twelve years from the date of delivery. We may face more competition for, or a limited supply of, leased aircraft, making it difficult for us to negotiate on competitive terms upon expiration of our current operating leases or to lease additional capacity required for our targeted level of operations. If we are forced to pay higher lease rates in the future to maintain our capacity and the number of aircraft in our fleet, our profitability could be adversely affected.
Our business may be adversely affected if we are unable to meet our significant future financing requirements.
We require significant amounts of financing to meet our aircraft capital requirements and may require additional financing to fund our other business needs. We cannot guarantee that we will have access to or be able to arrange for financing in the future on favorable terms. If we are unable to obtain financing for a significant portion of our capital requirements, our ability to acquire new aircraft or to expand operations could be impaired and our business negatively affected.
Our business may be adversely affected by our high degree of debt and aircraft lease obligations compared to our equity capital.
We have a high degree of debt and payment obligations under our aircraft operating leases compared to equity capital. In order to finance our debt, we depend in part on our cash flow from operations. In the combination of LAN and TAM, the LATAM Airlines Group assumed debt and payment obligations, including under aircraft lease obligations, of TAM, and as a result we have significantly increased our leverage. We cannot assure you that in the future we will be able to meet our payment obligations. In addition, the majority of our property and equipment is subject to liens securing our indebtedness. In the event that we fail to make payments on the secured indebtedness, creditors’ enforcement of liens could limit or end our ability to use the affected property and equipment to fulfill our operational needs and thus generate revenue.
Variations in interest rates may have adverse effects on our interest payments business, financial condition, results of operations and prospects and the trading price of our ADRs and BDRs and preferred shares.
We are exposed to the risk of interest rate variations, principally in relation to the U.S. dollar London Interbank Offer Rate (“LIBOR”), as well as the Long Term Interest Rate (Taxa de Juros de Longo Prazo, or TJLP), with respect to TAM’s loans denominated in reais. Many of our operating and financial leases are denominated in U.S. dollars and bear interest at a floating rate. Following the combination of LAN and TAM, LATAM is more exposed to fluctuations of interest rates, as more than half of TAM’s outstanding debt, principally, its financial leases, as well as its operating leases, bears interest at a floating rate. Approximately 30% of LATAM’s outstanding debt as of December 31, 2013 bears interest at a floating rate. Out of this floating rate debt, 19% is hedged to a fixed rate using derivative instruments.
Volatility in LIBOR or the TJLP could increase our periodic interest and lease payments and have an adverse effect on our total financing costs. We may be unable to adequately adjust our prices to offset any increased financing costs, which would have an adverse effect on our revenues and our results of operations.
In addition, concerns have been expressed that some of the member banks surveyed by the British Bankers’ Association (the “BBA”) in connection with the calculation of LIBOR rates may have been under-reporting the interbank lending rates applicable to them in order to avoid an appearance of capital insufficiency or adverse reputational or other consequences that may result from reporting higher interbank lending rates. Some member banks have admitted to under-reporting, and under-reporting may have resulted in LIBOR rates being artificially low. The BBA in June 2008 announced changes to the LIBOR rate-fixing process including tighter scrutiny of rates contributed by member banks into the rate-fixing mechanism and increasing the number of institutions surveyed to set LIBOR rates, and is continuing its consideration of ways to strengthen the oversight of the rate calculation process. On July 9, 2013, it was reported that NYSE Euronext had been awarded the contract to administer LIBOR beginning in 2014. It is not possible to predict the effect of any changes in the methods pursuant to which LIBOR is determined, the administration of LIBOR by NYSE Euronext and any other reforms to LIBOR that will be enacted in the United Kingdom and elsewhere. Uncertainty as to the nature of any potential changes in, or volatility in the calculation of, LIBOR may adversely affect our interest and lease payments for obligations which bear interest using LIBOR as a reference rate, including our fleet financing arrangements.
Increases in insurance costs and/or significant reductions in coverage could harm our financial condition and results of operations.
Major events affecting the aviation insurance industry (such as terrorist attacks, hijackings or airline crashes) may result in significant increases of the airlines’ insurance premium or in significant decreases of insurance coverage, as occurred after the September 11, 2001 terrorist attacks. Increases in insurance costs and/or significant reductions in coverage could harm our financial condition and results of operations and increases the risk that we experience uncovered losses.
Problems with air traffic control systems or other technical failures could interrupt our operations and have a material adverse effect on our business.
Our operations, including our ability to deliver customer service, are dependent on the effective operation of our equipment, including our aircraft, maintenance systems and reservation systems. Our operations are also dependent on the effective operation of domestic and international air traffic control systems and the air traffic control infrastructure in the markets in which we operate. Equipment failures, personnel shortages, air traffic control problems and other factors that could interrupt operations could adversely affect our operations and financial results as well as our reputation.
Our financial success depends on the availability and performance of key personnel, who are not subject to non-competition restrictions.
Our success depends to a significant extent on the ability of our senior management team and key personnel to operate and manage our business effectively. Our employment agreements with key personnel do not contain any non-competition provisions applicable upon termination. Competition for highly qualified personnel is intense. If we lose any executive officer, senior manager or other key employee and are not able to obtain an adequate replacement, or if we are unable to attract and retain new qualified personnel, our business, financial condition and results of operations could be materially adversely affected.
Our business may experience adverse consequences if we are unable to reach satisfactory collective bargaining agreements with our unionized employees.
As of December 31, 2013 approximately 31% of LATAM’s employees, including administrative personnel, cabin crews, flight attendants, pilots and maintenance technicians are members of unions and have contracts and collective bargaining agreements which expire on a regular basis. Our business, financial condition and results of operations could be materially adversely affected by a failure to reach agreement with any labor union representing such employees or by an agreement with a labor union that contains terms that are not in line with our expectations or that prevent us from competing effectively with other airlines.
Collective action by employees could cause operating disruptions and negatively impact our business.
Certain employee groups such as pilots, flight attendants, mechanics and our airport personnel have highly specialized skills. As a consequence, actions by these groups, such as strikes, walk-outs or stoppages, could severely disrupt our operations and negatively impact our operating and financial performance, as well as how our customers perceive us.
Increases in our labor costs, which constitute a substantial portion of our total operating expenses, could directly impact our earnings.
Labor costs constitute a significant percentage of our total operating expenses (20% in 2013) and at times in our operating history we have experienced pressure to increase wages and benefits for our employees. A significant increase in our labor costs above the assumed costs could result in a material reduction in our earnings.
We may experience difficulty finding, training and retaining employees.
Our business is labor intensive. We employ a large number of pilots, flight attendants, maintenance technicians and other operating and administrative personnel. The airline industry has, from time to time, experienced a shortage of qualified personnel, specifically pilots and maintenance technicians. In addition, as is common with most of our competitors, we may, from time to time, face considerable turnover of our employees. Should the turnover of employees, particularly pilots and maintenance technicians, sharply increase, our training costs will be significantly higher. We cannot assure you that we will be able to recruit, train and retain the qualified employees that we need to continue our current operations or replace departing employees. A failure to hire and retain qualified employees at a reasonable cost could materially adversely affect our business, financial condition and results of operations.
The regulatory structure of Brazilian civil aviation is undergoing change and we have not yet been able to evaluate the results of this change on our business and results of operations.
Scheduled air transportation services are considered public utilities in Brazil and are subject to extensive regulation by the Brazilian government. Over recent years, the Brazilian regulatory authorities have taken a more proactive role in monitoring the development of the Brazilian civil aviation market. For example, in an effort to prevent excess supply, the authorities have established rigorous criteria for air transport companies to follow when creating new routes or increasing flight frequencies.
Operation of air transportation services, as well as airport infrastructure, is an exclusive right of the Brazilian government, which may choose to provide these services directly or through third parties by means of concessions or permits. TAM’s concession to operate public air transportation was obtained on December 9, 1996 and renewed on December 9, 2011, and it is valid until December 9, 2021. We cannot assure you that we will be able to automatically renew TAM’s concession when it expires. See “Item 4. Information on the Company—B. Business Overview—Regulation—Brazil—Aeronautical Regulation.”
Additionally, our capacity to grow our Brazilian operations is dependent on receiving the necessary authorizations from ANAC and the Bureau of International Relations (Superintendência de Relações Internacionais, or “SRI”). We cannot assure you that we will obtain all necessary authorizations in the future and any failure to do so would require us to re-evaluate our strategies.
Our operations are subject to local, national and international environmental regulations; costs of compliance with applicable regulations, or the consequences of noncompliance, could adversely affect our results, our business or our reputation.
Our operations are covered by environmental regulations at local, national and international levels. These regulations cover, among other things, emissions to the atmosphere, disposal of solid waste and aqueous effluents, aircraft noise and other activities incident to our business. Future operations and financial results may vary as a result of such regulations. Compliance with these regulations and new or existing regulations that may be applicable to us in the future could increase our cost base and adversely affect our operations and financial results. In addition, failure to comply with these regulations could adversely affect us in a variety of ways, including adverse effects on our reputation.
The European Union (“EU”) has
In 2016, the ICAO adopted a directive under whichresolution creating the existingCarbon Offsetting and Reduction Scheme for International Aviation (CORSIA), providing a framework for a global market-based measure to stabilize carbon dioxide (“CO2”) emissions trading scheme (the “ETS”) in each EU member state is to be extended to airlines. This directive would require us to submit annual emission allowancesinternational civil aviation (i.e., civil aviation flights that depart in order to operate routes toone country and from EU member states.arrive in a different country). The ETS’s application to flights was scheduled to begin in 2012, however, its implementation
to international flights has been delayed by the EU and the EU did not collect allowances from airlines in 2013 (it was enforced only with respect to airlines that conducted intra-European flights during 2012). Although it is uncertain when and if the ETSCORSIA will be implemented it is increasingly likelyin phases, starting with the participation of ICAO member states on a voluntary basis during a pilot phase (from 2021 through 2023), followed by a first phase (from 2024 through 2026) and a second phase (from 2027). Currently, CORSIA focuses on defining standards for monitoring, reporting and verification of emissions from air operators, as well as on defining steps to offset CO2 emissions after 2020. To the extent most of the countries in which we operate continue to be ICAO member states, in the future we may be affected by regulations adopted pursuant to the CORSIA framework.
The proliferation of national regulations and taxes on CO2 emissions in the countries that we willhave domestic operations, including recent enviromental regulations that the airline industry is facing in Colombia, may also affect our costs of operations and our margins.
Our business may be required to participate in some form of an international aircraft emissions programadversely affected by a downturn in the future. Currently,airline industry caused by exogenous events that affect travel behavior or increase costs, such as outbreak of disease, weather conditions and natural disasters, war or terrorist attacks.
Demand for air transportation may be adversely impacted by exogenous events, such as adverse weather conditions and natural disasters, epidemics (such as Ebola and Zika), terrorist attacks, war or political and social instability. Situations such as these in one or more of the markets in which we operate 6 routes to and from Europe, and service additional destinations through our code-share agreements. The cost of compliance with any international emissions program, including the ETS, is difficult to estimate; however, these costs could be significant and could require us to reduce our emissions, purchase allowances or otherwise pay for our emissions, which could have a significantmaterial impact on our operating costs or impact the frequency of our flights to and from EU member states.
Risks Related to Chile, Brazil and Other Emerging Market Countries in which we Operate
Developments in Latin American countries and other emerging market countries may adversely affect the Chilean economy, negatively impact our business and results of operations and cause the market price of our common shares and ADSs to decrease.
We conduct a significant portion of our operations in emerging market countries, particularly in Latin America. As a result, economic and political developments in these countries, including future economic crises and political instability, could impact the Chilean economy or the market value of our securities and have a material adverse effect on our business, financial condition and results of operations. Beginning late 2008,Furthermore, these types of situations could have a prolonged effect on air transportation demand and continuing during 2009, manyon certain cost items.
Revenues for airlines depend on the number of passengers carried, the countries we serve, including Chile, experienced economic slowdownsfare paid by each passenger and service factors, such as the timeliness of flight departures and arrivals. During periods of fog, ice, low temperatures, storms or recessions,other adverse weather conditions, some or all of our flights may be cancelled or significantly delayed, reducing our revenues. In addition, fuel prices and supplies, which resultedconstitute a significant cost for us, may increase as a result of any future terrorist attacks, a general increase in hostilities or a substantial weakeningreduction in output of demand. Although economic conditionsfuel, voluntary or otherwise, byoil-producing countries. Such increases may result in other emerging market countries may differ significantly from economic conditions in Chile, we cannot assure that events in other countries, particularly other emerging market countries, will not adversely affect the market value of, or marketboth higher airline ticket prices and decreased demand for our common shares or ADSs.
Changes in the Chilean corporate tax rate or tax regimeair travel generally, which could adversely affect our financial results.
On December 2013, Ms. Bachelet won the Chilean Presidential elections with a healthy parliamentary majority. Ms Bachelet’s campaign proposed a raise in the Chilean corporate tax, which is currently at 20%. Suchhave an increase, if implemented, would adversely affect the tax provision for Chilean companies, including LATAM, and would also require an adjustment in deferred taxes to reflect the higher tax rate. This change, as well as any other change in the Chilean tax regime, could adversely affect the financial results of the Company.
Fluctuations in the value of the Chilean peso, Brazilian real and other currencies in the countries in which we operate may adversely affectadverse effect on our revenues and profitability.results of operations.
We operate in numerous countriesare subject to risks related to litigation and face the risk of variation in foreign currency exchange rates against the U.S. dollar or between the currencies of these various countries. Changes in the exchange rate between the Chilean peso and the U.S. dollar or other currencies in the countries in which we operateadministrative proceedings that could adversely affect our business and financial condition and resultsperformance in the event of operations. Approximately 75%an unfavorable ruling.
The nature of our indebtedness at December 31, 2013 was denominatedbusiness exposes us to litigation relating to labor, insurance and safety matters, regulatory, tax and administrative proceedings, governmental investigations, tort claims and contract disputes. Litigation is inherently costly and unpredictable, making it difficult to accurately estimate the outcome among other matters. Currently, as in U.S. dollars, and 42%the past, we are subject to proceedings or investigations of our revenues and 60% of our operating expensesactual or potential litigation. Although we establish provisions as we deem necessary, the amounts that we reserve could vary significantly from any amounts we actually pay due to the inherent uncertainties in 2013 were denominated in currencies other than the U.S. dollar, mainly the Chilean peso and the Brazilian real. If the value of the peso, or of other currencies in which revenues are denominated, declines against the U.S. dollar, we will need more pesosestimation process. We cannot assure you that these or other local currencylegal proceedings will not materially affect our business.
We are subject to repayanti-corruption, anti-bribery, anti-money laundering and antitrust laws and regulations in Chile, the same amount of U.S. dollars. The Chilean peso has experienced volatility in recent years, including an average nominal appreciation of 5.3% against the U.S. dollar in 2011, an average nominal depreciation of 0.7% against the U.S. dollar in 2012United States and an average nominal depreciation of 1.9% in 2013.
Following the combination of LAN and TAM, our exposure to the Brazilian real has increased, as a significant proportion of TAM’s revenues are denominated in reais. The Brazilian real has also experienced volatility and depreciated frequently over the past decade, including appreciation of 25.5% and 4.3% against the U.S. dollar in 2009 and 2010, respectively, a depreciation of 12.6% against the U.S. dollar in 2011, a depreciation of 16.7% in 2012 and a depreciation of 10.4% in 2013. The exchange rate of the Chilean peso, Brazilian real and other currencies against the U.S. dollar may fluctuate significantly in the future. Changes in Chilean, Brazilianvarious countries we operate. Violations of any such laws or regulations could have a material adverse impact on our reputation and other governmental economic policies affecting foreign exchange rates could also adversely affect our business, financial condition, results of operations and financial condition.
We are subject to anti-corruption, anti-bribery, anti-money laundering, antitrust and other international laws and regulations and are required to comply with the return to our shareholders on their common shares or ADSs.
Exchange controls in Venezuela delay our ability to repatriate cash generated from operations in Venezuela. They also increase our exposure to exchange rate losses due to potential devaluationsapplicable laws and regulations of Chile, Brazil, the Venezuelan bolivarvis à vis the U.S. dollar during the period of time between the timeUnited States and certain other jurisdictions where we operate. In addition, we are paidsubject to economic sanctions regulations that restrict our dealings with certain sanctioned countries, individuals and entities. There can be no assurance that our internal policies and procedures will be sufficient to prevent or detect all inappropriate practices, fraud or violations of law by our affiliates, employees, directors, officers, partners, agents and service providers or that any such persons will not take actions in Venezuelan bolivaresviolation of our policies and the time we are able to repatriate such revenues in U.S. dollars. See “Item 5. Operatingprocedures. Any violations by us of anti-bribery and Financial Review and Prospects A. Operating Results—LATAM’s Financial Results Discussion: Year ended December 31, 2012 (actual) compared to year ended December 31, 2011 (actual).” As of December 31, 2013, the devaluation of the Venezuelan bolivar hadanti-corruption laws or sanctions regulations could have a cash impact of US$11.0 millionmaterial adverse effect on our results.business, reputation, results of operations and financial condition.
The Brazilian government has exercised, and may continue to exercise, significant influence over the Brazilian economy, which may have an adverse impact on our business, financial condition and results of operations.
The Brazilian economy has been characterized by the significant involvement of the Brazilian government, which often changes monetary, credit, fiscal and other policies to influence Brazil’s economy. The Brazilian government’s actions to control inflation and implement other policies have involved wage and price controls, depreciation of the real, controls over remittance of funds abroad, intervention by the Central Bank to affect base interest rates and other measures. We have no control over, and cannot predict what measures or policies the Brazilian government may take in the future. Following the combination of LAN and TAM, our operations in Brazil have increased significantly. As a result, our business, financial condition, results of operations and prospects, and the trading price of our common shares and ADSs, may be adversely affected by changes in Brazilian governmental policies relating to Brazilian economic growth, inflation, interest rates, exchange control policies, fiscal policy and changes in tax law, liquidity of domestic capital and lending markets, government control of oil production activities and oil refinement and other general economic factors.
We are not required to disclose as much information to investors as a U.S. issuer is required to disclose and, as a result, you may receive less information about us than you would receive from a comparable U.S. company.
The corporate disclosure requirements that apply to us may not be equivalent to the disclosure requirements that apply to a U.S. company and, as a result, you may receive less information about us than you would receive from a comparable U.S. company. We are subject to the reporting requirements of the Securities Exchange Act of 1934, as amended, or the Exchange Act. The disclosure requirements applicable to foreign issuers under the Exchange Act are more limited than the disclosure requirements applicable to U.S. issuers. Publicly available information about issuers of securities listed on Chilean stock exchanges also provides less detail in certain respects than the information regularly published by listed companies in the United States or in certain other countries. Furthermore, there is a lower level of regulation of the Chilean securities markets and of the activities of investors in such markets as compared with the level of regulation of the securities markets in the United States and in certain other developed countries.
Risks Related to our Common Shares and ADSs
Our controllingmajor shareholders may have interests that differ from those of our other shareholders.
We have twoOne of our major shareholder groups, of major shareholders—the Cueto Group (the “LATAM Controlling Shareholders”) and the Amaro Group (the “TAM Controlling Shareholders”). As,which as of January 31, 2014, the LATAM Controlling Shareholders, in the aggregate,February 28, 2017, beneficially owned 25.5%28.27% of our voting common shares, and the TAM Controlling Shareholders, in the aggregate, beneficially owned 12.0% of our voting common shares. The LATAM Controlling Shareholders are in a positionis entitled to elect three of the nine members of our board of directors and areis in a position to direct our management. In addition, the LATAM Controlling Shareholders have entered into a shareholders agreement with the TAM Controlling Shareholders,Amaro Group, which as of January 31, 2017, held a 3.02% of LATAM shares through TEP Chile, in addition to the indirect stake they have through the 21.88% interest they hold in Costa Verde Aeronáutica S.A., the main legal vehicle through which the Cueto Group holds LATAM shares), pursuant to which these controlling shareholderstwo major shareholder groups have agreed to vote together to elect individuals thatto our board of directors in accordance with their direct and indirect shareholder interest in LATAM. Pursuant to a shareholders’ agreement, the TAMLATAM Controlling Shareholders nominateand the Amaro Group have also agreed to use their good faith efforts to reach an agreement and act jointly on all actions to be taken by our board of directors or shareholders meeting, and if unable to reach to such agreement, to follow the proposal made by our board of directors. Decisions by the Company that require supermajority votes under Chilean law are also subject to voting arrangements by the LATAM Controlling Shareholders and the Amaro Group. In addition, another major shareholder, Qatar Airways Investments (UK) Ltd., which as of January 31, 2017, held 10.03%1 of our outstanding common shares, is entitled to appoint one individual to our board of directors. The interests of our major shareholders may differ from those of our other shareholders. See “Item 7. Controlling Shareholders and Related Party Transactions—A. Major Shareholders.”
Under the terms of the deposit agreement governing the ADSs, if holders of ADSs do not provide JP Morgan Chase Bank, N.A., in its capacity as depositary for the ADSs, with timely instructions on the voting of the common shares underlying their ADRs, the depositary will be deemed to have been instructed to give a person designated by the board of directors the discretionary right to vote those common shares. The person designated by the board of directors to exercise this discretionary voting right may have interests that are aligned with our controlling shareholders, which may differ from those of our other shareholders. Historically, our board of directors has designated its chairman, who currently is Mauricio Amaro, to serve in this role.
Trading of our ADSs and common shares in the securities markets is limited and could experience further illiquidity and price volatility.
Our common shares are listed on the various Chilean stock exchanges. Chilean securities markets are substantially smaller, less liquid and more volatile than major securities markets in the United States. In addition, Chilean securities markets may be materially affected by developments in other emerging markets, particularly other countries in Latin America. Accordingly, although you are entitled to withdraw the common shares underlying the ADSs from the depositary at any time, your ability to sell the common shares underlying ADSs in the amount and at the price and time that you wish to do soof your choice may be substantially limited. This limited trading market may also increase the price volatility of the ADSs or the common shares underlying the ADSs.
Holders of ADSsADRs may be adversely affected by currency devaluations and foreign exchange fluctuations.
If the Chilean peso exchange rate falls relative to the U.S. dollar, the value of the ADSs and any distributions made thereon from the depositary could be adversely affected. Cash distributions made in respect of the ADSs are received by the depositary (represented by the custodian bank in Chile) in pesos, converted by the custodian bank into U.S. dollars at the then prevailingthen-prevailing exchange rate and distributed by the depositary to the holders of the ADRs evidencing those ADSs. In addition, the depositary will incur foreign currency conversion costs (to be borne by the holders of the ADRs) in connection with the foreign currency conversion and subsequent distribution of dividends or other payments with respect to the ADSs.
Future changes in Chilean foreign investment controls and withholding taxes could negatively affectnon-Chilean residents that invest in our shares.
Equity investments in Chile bynon-Chilean residents have been subject in the past to various exchange control regulations that govern investment repatriation and earnings thereon. Although not currently in effect, regulations of the Central Bank of Chile have in the past required, and could again require, foreign investors acquiring securities in the secondary market in Chile to maintain a cash reserve or to pay a fee upon conversion of foreign currency to purchase such securities. Further,Furthermore, future changes in withholding taxes could negatively affectnon-Chilean residents that invest in our shares.
When we established our ADS facility as part of our initial public offering in 1997, there were foreign exchange controls in Chile. At that time, in order to allow the depositary and investors to be able to enter into foreign exchange transactions to repatriate from Chile amounts they received in connection with the deposited shares of common stock (including dividends and proceeds from the sale in Chile of the underlying shares of common stock and any rights with respect thereto), we entered into a foreign investment contract (the “Foreign Investment Contract”) with the Central Bank and the depositary. The Foreign Investment Contract guaranteed ADS investors and the depositary access to the Formal Exchange Market to convert amounts from Chilean pesos into U.S. dollars and to repatriate such amounts.
In 2001, a new Compendium of Foreign Exchange Regulations (the “New Compendium”) removed exchange controls and many other barriers to investment. However, even though there are no longer foreign exchange controls in Chile, all foreign investment contracts (including the Foreign Investment Contract), continue to remain in full force.
We cannot assure you that additional Chilean restrictions applicable to the holders of ADRs, the disposition of the common shares underlying ADSs or the repatriation of the proceeds from an acquisition, a disposition or a dividend payment, will not be imposed or required in the future, nor could we make an assessment as to the duration or impact, were any such restrictions to be imposed or required. For further information, see “Item 10. Additional Information—D. Exchange Controls—Foreign Investment and Exchange Controls in Chile.”
| (1) | Qatar owns 9.999999918% of the total issued shares of LATAM. |
Our ADS holders may not be able to exercise preemptive rights in certain circumstances.
The Chilean Corporation Law provides that preemptive rights shall be granted to all shareholders whenever a company issues new shares for cash, giving such holders the right to purchase a sufficient number of shares to maintain their existing ownership percentage. We will not be able to offer shares to holders of ADSs and shareholders located in the United States pursuant to the preemptive rights granted to shareholders in connection with any future issuance of shares unless a registration statement under the U.S. Securities Act of 1933, as amended, (the “Securities Act”), is effective with respect to such rights and shares, or an exemption from the registration requirements of the Securities Act is available. At the time of any rights offering, we will evaluate the potential costs and liabilities associated with any such registration statement in light of any indirect benefit to us of enabling U.S. holders of ADRs evidencing ADSs and shareholders located in the United States to exercise preemptive rights, as well as any other factors that may be considered appropriate at that time, and we will then make a decision as to whether we will file a registration statement. We cannot assure you that we will decide to file a registration statement or that such rights will be available to ADS holders and shareholders located in the United States.
We are not required to disclose as much information to investors as a U.S. issuer is required to disclose and, as a result, you may receive less information about us than you would receive from a comparable U.S. company.
The corporate disclosure requirements that apply to us may not be equivalent to the disclosure requirements that apply to a U.S. company and, as a result, you may receive less information about us than you would receive from a comparable U.S. company. We are subject to the reporting requirements of the Securities Exchange Act of 1934, as amended, or the Exchange Act. The disclosure requirements applicable to foreign issuers under the Exchange Act are more limited than the disclosure requirements applicable to U.S. issuers. Publicly available information about issuers of securities listed on Chilean stock exchanges also provides less detail in certain respects than the information regularly published by listed companies in the United States or in certain other countries. Furthermore, there is a lower level of regulation of the Chilean securities market and of the activities of investors in such markets as compared with the level of regulation of the securities markets in the United States and in certain other developed countries.
| ITEM 4. | INFORMATION ON THE COMPANY |
A. HISTORY AND DEVELOPMENT OF THE COMPANY
General
LATAM Airlines Group is a Chilean-based airline holding company formed by the mergercombination of LAN of Chile and TAM of Brazil in 2012. Following the combination, LAN Airlines S.A. became “LATAM Airlines Group S.A.” and TAM continues to exist as a subsidiary of Holdco I and a subsidiary of LATAM. LATAMThe Company is primarily involved in the transportation of passengers and cargo and operates as one unified merged business enterprise with two separate brands:enterprise. During 2016, we began the transition of LAN and TAM.TAM into a single brand: LATAM.
LATAM’s airline holdings include LATAM and its affiliates in Peru, Argentina, Colombia and Ecuador, and LATAM Cargo and its affiliates MasAir (in Mexico) and LANCO (in Colombia), as well as TAM S.A. and its affiliates TAM Linhas Aereas S.A (LATAM Airlines Brazil), TAM Transportes Aereos del Mercosur S.A., (LATAM Airlines Paraguay), LATAM Cargo and Multiplus. LATAM is a publicly traded corporation listed in the Santiago Stock Exchange (“SSE”), the Valparaiso Stock Exchange, the Chilean Electronic Exchange and the New York Stock Exchange (“NYSE”) and the Brazilian Stock Exchange (“Bovespa”).
LATAM’s history goes back toLAN was founded in 1929 whenby the Chilean government founded LAN. LAN was a government-owned company from 1929 until its incorporation in 1983. The company began international service to Buenos Aires, Argentina in 1946, to the United States in 1958 and to Europe in 1970.government. In 1989, the Chilean government sold 51.0% of LAN’s capital stock to Chilean investors and to the Scandinavian Airlines System. In 1994, LATAM’s current controlling shareholders, together with other major shareholders, acquired 98.7% of LAN’s stocks,stock, including the remaining stocksshares then held by the Chilean government, in a series of transactions.government. In 1997, LAN was listed on the New York Stock Exchange, becomingbecame the first Latin American airline to list its shares (which trade its ADRsin the form of ADRs) on this financial market.
the New York Stock Exchange. Over the past decade, LANLATAM has significantly expanded its operations in Latin America, initiating services in Peru in 1999, in Argentina in 2005, Ecuador in 2009, and in Colombia in 2010 through the acquisition of Aerovias de Integracion Regional, Aires S.A. (dba “LAN Colombia”). The, and the combination of LAN andwith TAM in June 2012 continued to expand2012.
LATAM Airlines Brazil is one of the Company’s operations in Brazil, where TAM is a leading domestic and international airline,airlines in the Brazilian market, offering flights throughout Brazil with a strong domestic market share, international
passenger services and significant cargo operations. TAMThe company was founded in May 1997 (under the name CIT—Companhia de Investimentos em Transportes), for the purpose of participating in, managing and consolidating shareholdings in airlines. TAM began international services to Miami on 1998 and to Europe (Paris) in 1999. In September 2002, theits name was changed to TAM S.A. and its shares began to be publicly tradedwere listed on Bovespa in June 2005. InFrom 2006 until the combination with LAN in 2012, TAM wasAmerican Depositary Shares were also listed inon the NYSE.New York Stock Exchange.
Following the combination, LATAM’s airline holdings include LAN and its subsidiaries in Peru, Argentina, Colombia and Ecuador; TAM and its subsidiaries, including TAM Linhas Aereas, TAM Mercosur, TAM Airlines (Paraguay) and Multiplus; and LAN Cargo and its regional affiliates, which include ABSA (in Brazil), MasAir (in Mexico) and LANCO (in Colombia).
This association creates one of the largest airline groups in the world in terms of network connections, providing passenger transport services to approximately 134 destinations in 22 countries and cargo services to approximately 143 destinations in 27 countries, with a fleet of 339 aircraft and a set of bilateral alliances. In total, LATAM Airlines Group has more than 52,000 employees.
Our principal executive offices are located at Presidente Riesco 5711, 20th floor, Las Condes, Santiago, Chile and our general telephone number at this location is(56-2) 565-2525. 2565-2525. We have designated LATAM Airlines Group as our agent in the United States, located at 970 South Dixie Highway, Miami, Florida 33156. Our website address is www.latamairlinesgroup.net. Information obtained on, or accessible through, this website is not incorporated by reference herein and shall not be considered part of this annual report. For more information contact Gisela Escobar, Director ofSenior Vice President, Corporate Controller and Investor Relations, at gisela.escobar@lan.com.InvestorRelations@latam.com.
Combination of LAN and TAM
On June 22, 2012, LAN and TAM successfully completed an exchange offer resulting in the combination of the two businesses and the creation of LATAM Airlines Group.
Following the combination, on July 18, 2012, the registration of TAM as a publicly listed company in Brazil was cancelled and TAM was delisted from Bovespa.
In order to implement this combination, the TAMAmaro Group controlling shareholders formed four newsociedades anónimas cerradas with limited liability under the laws of Chile: TEP Chile, Holdco I, Holdco II and Sister Holdco. After the transaction was completed, Holdco II and Sister Holdco ceased to exist, and theexist. The beneficial ownership and organizational structure of LATAM Airlines Group as of DecemberJanuary 31, 20132017 was as follows:
TAM S.A., the holding company, has two significant operating subsidiaries, TAM Linhas Areas S.A. (“TLA”) and Multiplus S.A.
LATAM Airlines Group has begun integrating its business units and the transformation necessary to achieve the expected merger synergies, including the implementation of adjustments to its commercial practices and alignment of its international and domestic passenger operations. LATAM expects to fully achieve its estimated predicted merger synergies over the next four years; however, the Company’s short term results are expected to continue to reflect the transition costs as the business becomes fully integrated.
Capital Expenditures
For a description of our capital expenditures, see “Item 5. Operating and Financial Review and Prospects—B. Liquidity and Capital Resources—Capital Expenditures.”
B. BUSINESS OVERVIEW
General
LATAM Airlines Group is the largest passenger and cargo airline in South America. We are also one of the leading passengerlargest airline group in South America and the main air cargo operatorgroups in the region. Weworld in terms of network connections, providing passenger transport services to approximately 135 destinations in 24 countries and cargo services to approximately 139 destinations in 29 countries, with a fleet of 332 aircraft and a set of bilateral
alliances. In total, LATAM Airlines Group has near to 46,000 employees. LATAM Airlines Group and its affiliates currently provide domestic and international passenger services in Brazil, Chile, Peru, Ecuador,Perú, Argentina, Colombia and Brazil. WeEcuador; we also provide intra-regional and long-haul operations. The cargo affiliate carriers of LATAM in Chile, Brazil, Colombia and Mexico carry out our cargo operations through the use of belly spacespaces on ourthe passenger flights and dedicated cargo operations using freighter aircraft through our cargo airlines in Chile, Brazil, Colombia and Mexico.
As of January 31, 2014, we serviced 16 destinations in Chile, 14 destinations in Peru, 6 destinations in Ecuador, 14 destinations in Argentina, 20 destinations in Colombia, 40 destinations in Brazil, 11 destinations in other Latin American countries and the Caribbean, 5 destinations in the United States, 5 destinations in Europe and 3 destinations in the South Pacific. In addition, as of January 31, 2014, through our various code-share agreements, we offer service to 78 additional destinations in North America, 34 additional destinations in Europe, 33 additional destinations in Latin America and the Caribbean (including Mexico), 4 destinations in Africa and 7 destinations in Asia. We provide cargo service to all our passenger destinations and to approximately 9 additional destinations served only by freighterfreight aircraft. We also offer other services, such as ground handling, courier, logistics and maintenance.
As of December 31, 2016, we provided scheduled passenger service to 16 destinations in Chile, 17 destinations in Peru, five destinations in Ecuador, 15 destinations in Argentina, 14 destinations in Colombia, 41 destinations in Brazil, 12 destinations in other Latin American countries and the Caribbean, five destinations in North America, six destinations in Europe, three destinations in the South Pacific and one destination in Africa. In addition, as of December 31, 2016, through our various code-sharing and interline agreements, we offer service to 84 destinations in North America, 46 destinations in Europe, 22 destinations in Australasia, 9 destinations in Asia and 4 destinations in Africa.
Competitive Strengths
Our strategy is to maintain LATAM Airlines GroupGroup’s position as the leading airline in South America by leveraging our unique position in the airline industry. LATAM Airlines Group is the only airline group in the region with a local presence in six markets, as well as intra-regional and long-haul operations. As a result, the Company has more flexibility, as well as a proven track record of acting quickly to maximize shareholder value by increasing revenuesadapt our business to economic challenges. Moreover, LATAM’s unique leadership position in a region with growth potential and profitability through leveraging the operational efficiencies between our cargo and passenger divisions, thoroughly planning for our expansion efforts and carefully controlling costs. We plan to accomplish these goals by both focusing onfocus in our existing competitive strengths will allow us to continue building our business model and implementing new strategies to fuel our future growth. We believe our most important competitive strengths are:
Leading PresenceLeader in the South America Airlines space, with a Unique Leadership Position among Global Airlines
Through a successful regional expansion strategy, LATAM Airlines Group has become the leading international and domestic passenger airline group in South America, as well as the largest cargo operator in Latin America. WeLATAM and its affiliates have domestic passenger operations in Chile, Brazil, Peru, Argentina, Colombia and Ecuador. These six countries are among the most relevantsignificant passenger markets in South America (excluding Venezuela) and represent approximately 90%96% of the passengersdomestic ASKs in the region. We are also the largest operator of intra-regional routes, connecting the main cities in South America. Furthermore, through our significant presence in the largest hubs in South America—Lima and SaoSão Paulo—we are able to offer the best connectivity between South America and the rest of the world. Finally, theIn addition, our cargo companies of LATAM Airlines Group are the largest air cargo operators within, to and from Latin America, and particularly in Brazil, where we consolidated our position during 2013 through combining the operations of TAM Cargo and ABSA, bringing together their highly complementary capacities and networks.Brazil.
Geographically Diversified Revenue Base, including both Passenger and Cargo Operations
The operations of the LATAM Airlines Group are highly geographically diversified, including domestic operations in six different countries, as well as operations within South America and connecting South America with various international destinations. ThisWe believe this provides resilience to external shocks that may occur in any particular market. Furthermore, we believe that one of our distinct competitive advantages is our ability to profitably integrate our scheduled passenger and cargo operations. We take into account potential cargo services when planning passenger routes, and also serve certain dedicated cargo routes using our freighter aircraft when needed. By adding cargo revenues to our existing passenger service, we are able to increase the productivity of our assets and maximize revenue, which has historically coveredcontributing to our fixed operating expenses per flight, loweredlowering break-even load factors and enhancedenhancing per flight profitability. Additionally, this revenue diversification helps offset seasonal revenue fluctuations and reduces the volatility of our business over time. For the year ended December 31, 2013,2016, passenger, cargo and other revenues accounted for 86%82.7%, 11.7% and 5.7% of total revenues and cargo revenues accounted for 14% of total revenues.
“Low Cost” Business Model in Domestic Operations
We continue to utilize the business model LAN launched in 2007 to increase the efficiency of our domestic operations in Chile, Brazil, Peru, Ecuador, Colombia, and, subject to certain regulatory restrictions, in Argentina. In addition, we apply these initiatives on certain regional routes within Latin America and we are exploring opportunities to apply aspects of this model to the domestic passenger operations in Brazil. A key objective of this business model has been to increase the utilization of our fleet through modified itineraries that include more point-to-point and overnight flights and faster turnaround times. LATAM operates Airbus A320-Family Aircraft on all domestic and regional routes except some routes served by LAN Colombia. This fleet has increased efficiency and improved the margins of our short-haul operations. In addition, our modern fleet allows for lower unscheduled maintenance costs, lower fuel consumption, and operational and cost efficiencies achieved through operating fewer fleet types. Other key objectives of this business model include a reduction in sales and distribution costs through increased Internet penetration, reduced agency commissions, and increased self check-in service through web check-in and airport kiosks. We expect that these initiatives, together with simplifications in back-office and support functions, will continue to help us expand operations while controlling fixed costs, spurring a reduction in overhead costs per ASK. We pass on a portion of these operating efficiencies to consumers through fare reductions, which has stimulated additional demand and enhanced our overall profitability.respectively.
Modern Fleet and Optimized Fleet Strategy
The average age of our fleet is less than 7.0approximately seven years, making our fleetit one of the most modern in Latin America and in the world. A younger fleet makes us more cost competitive because it reduces fuel consumption and maintenance costs, and enables us to enjoy a high degree of performance reliability. In addition, a modern and fuel efficientfuel-efficient fleet reflects our strong commitment to the environment as new aircraft incorporate the industry’s latest technology, allowing for a substantial reduction in emissions, whileand also decreasing noise levels.
We optimize our fleet structure through the careful selection of modern aircraft models and staggered lease maturities. We select our aircraft based on their ability to effectively and efficiently serve our short- and long-haul flight needs, while still striving to minimize the number of different aircraft types we operate. For short-haul flights, we principally operate the Airbus A320-Family Aircraft. We are in the process of replacing the
The Company’s current fleet used by LAN Colombia—which is our only domesticplans envisage a short-haul fleet that includes Boeing 737formed exclusively by aircraft from the A320 family, with a focus on the A321 and Dash 8-200 aircraft—with more modern and efficient AirbusA320neo. In 2016, LATAM incorporated two A320neo, are-engined A320, Family aircraft. This process of fleet change is expectedbecoming the first airline in Latin America to be finished during 2014 and will allow us to generate important cost savings. fly this model.
For long-haul passenger flights, we operate the Boeing 767-300, Airbus A330, Airbus A340-300767-300ER, the Boeing787-8 and Boeing 777 aircrafts,787-9 aircraft, the Boeing777-300ER aircraft and the AirbusA350-900 that started operation in October 2012, we started operations with the new modern and efficient2016. The Boeing 787 Dreamliner, becoming the first airline in the Americas to operate this brand new aircraft. This aircraft has new technologies in aerodynamics, materials and coatings which allowsAirbus A350 models allow us to achieve important savings onin fuel consumption, and also achieve sustainable expansion of our fleet (as the Dreamliner produces up to 20% less CO2 than similar aircraft) while incorporating modern technology to deliver the best travel experience for LATAM’sour passengers. Our currentIn 2016, we incorporated five Boeing787-9 and six Airbus350-900 into our fleet.
LATAM continues to take a flexible approach to its fleet plan also includesin order to better align it to market conditions. During 2016, we achieved a significant reduction in our fleet commitments for the delivery starting in 2016 of Airbus A350 passenger aircraft, a new aircraft type that is expectedcoming years, allowing us to further improve the efficiency of the existing fleet.
Following the combination of LANdefer capital expenditures and TAM, we are focused on the rationalization of the LAN and TAM fleets and as we acquire additional aircraft, we will use the same configurations across our various airlines to unify our product offerings and reach higher levels of efficiency.
Efficient Processes
We continue to implement LEAN, a system that seeks to improvestrenghten our processes by eliminating activities that do not add value (thus increasing the value of each activity and suppressing those that are superfluous), which reduces costs, improves efficiency and increases customer satisfaction. Internationally, the LEAN system has been recognized as a methodology for achieving excellence and continuous improvement. The adoption of this system constituted a redesigning of processes to enable us to solve problems that may occur during the execution of any process, such as aircraft maintenance. The foregoing renders the daily tasks and processes carried out within LATAM more efficient. Since the merger, we have achieved important fuel savings by implementing the LEAN fuel program in TAM’s operations, resulting in more than 7.4 million gallons saved in the year ended December 31, 2013. LEAN also supports the Company’s growth plans by streamlining the pilot training process, which results in more pilots trained during the year. By establishing clear roles, challenges and achievements, the implementation of LEAN has also had an important benefit in terms of employee motivation.Balance Sheet.
Strong BrandsBrand Teamed with Key Global Strategic Alliances
Following the business combination, both LAN and TAM continue to operate under their existing brands in the same way as they have done until previously.In May 2016 our new brand, LATAM, was officially launched. We believe that both the LAN and TAM brands areour new brand is associated with superior service, aircraft and technologically-advancedtechnologically advanced operations, and areis well recognized and respected in the markets in which we operate. In 2016, our operations in Chile, Argentina, Ecuador, Peru and Colombia were awarded the top prize as the “Best Airlines in South America” by the SkyTrax World Airline Awards. These awards are considered a global barometer for customer satisfaction within the industry, thanks to their respective markets. In 2013, we also focusedexclusive reliance on enhancing our corporate image asthe opinion of passengers.
LAN joined theoneworld®alliance, one of the world’s leading airline alliances, in 2000. TAM (now LATAM Airlines Group, which allows us to unify marketing efforts as we continue to expand Brazil) joinedoneworld®in 2014, marking a significant milestone and completing the entry of all LATAM Airlines into oneworld®. To our existing and new markets.
passengers, this means greater convenience when traveling, since they will have the same standard of high-quality customer service, regardless of their international destination. Our strategic global alliances and existing commercial agreements provide our customers with access to approximately 163more than 1,000 destinations worldwide, a combined reservations system, itinerary flexibility and various other benefits, which substantially enhance our competitive position within the Latin American market.
In addition, in 2012, we2016 LATAM entered into two new bilateral agreementsjoint business agreements: an agreement with strategic partners such as American Airlines which signed newand an agreement with British Airways and Iberia. These agreements further strengthen our relationship with LAN Colombia and TAM, and broadened our network of alliances in the combination with TAM, which maintains commercial agreements with a number of leading airlines. Lan Colombia joinedotheroneworld® on October 1, 2013partners. Both agreements will allow LATAM to expand its network to more than 420 destinations worldwide, operating routes from South America to the United States and TAM joinedoneworld® onCanada with American Airlines and routes from South America to Europe with British Airways and Iberia. The agreements remain subject to regulatory approval in different countries. Some approvals have already been granted: in March, 31, 2014.2017, the administrative court of economic defense of the CADE (Administrative Council for Economic Defense) in Brazil, approved the agreement with British Airways and Iberia, representing the final stage of an evaluation process that began in June 2016. During the review, the CADE evaluated the scope of the agreement in terms of free competition and the benefits that it will bring to passengers, including improved connectivity, an expansion of the destination network and reduced prices. Both agreements have been approved in Uruguay.
Track Record of Growth, Profitability and Access to FinancingFinancial Flexibility
We have historically managed our business to maintain financial flexibility and a strong balance sheet, in orderseeking to accommodate our growth objectives while being ablehaving the ability to respond to changing market conditions. Our financial flexibility has allowed us to secure large aircraft orders,deliveries, including an important part of our currentre-fleeting program, at attractive financing rates.
Recognized Loyalty Programs
On March 1, 2016, we announced our rebranded and improved frequent flyer programs named LATAM Pass (corresponding to the previous LAN Pass) and LATAM Fidelidade (corresponding to the former TAM Fidelidade). The change is part of the process of consolidating our new brand identity (LATAM) and the evolution of our loyalty programs.
LATAM Fidelidade and LANPASSLATAM Pass together represent the leading frequent flyer programs in South America, with strong participation rates and brand recognition by our customers. Customers in each program earn points or kilometers based on distance flown, and class of ticket purchased, orand elite level, as well as by using otherthe services of outside partners in the program. In addition, TAM’sin 2009 TAM launched its affiliate Multiplus, program,a coalition of loyalty programs, which was launched in 2009, allows members to accumulate points not just by flying with TAM,LATAM, but also by making purchases through credit cards or using services and products at partner establishments, and allows members to redeem points for TAMLATAM Airlines Brazil flights and other products at partner establishments. At the end of 2013, Multiplus had 472 partner establishments, including the TAM Fidelidade Program. Following the business combination between LAN and TAM, we have begun to harmonize the two airlines’ frequent flyer programs to make them fully fungible for our customers, and have advanced cost initiatives related to the contract renegotiations and process standardization.
We regard both of our frequent flyer programs as strong relationship tools and we believe that these flexible programs are attractive to customers because they do not impose restrictions on those flights for which points can be redeemed, or the number of seats available on any particular flight to members using the loyalty program for any particular flight. LANPASSprogram. LATAM Pass and LATAM Fidelidade members can also accrue and redeem points for flights with any of LAN’s alliance carriers, including on otheroneworld® flights, and TAM Fidelidade members can accrue and redeem points for flights with any of TAM’s alliance carriers, including members of the Star Alliance (through 2014). During 2013, LANPASS reached new agreements with several partners in each specific market in which LAN operates, creating a strong position in the Spanish-speaking Latin American markets.member airlines.
Business Strategy
TheOur mission is to connect people safely, with operational excellence and a personal touch, seeking to become one of the best airline groups in the world. In order to achieve our mission, the principal areas inon which we plan to focus our efforts going forward are as follows:
AchieveContinually Strengthen Our Network
We intend to continue to strengthen our route network in South America, offering the Successful Integration of LANbest connectivity within the region at competitive prices and TAM, and Realize Merger Synergies
The Company has successfully completedensuring that we are the integration ofmost convenient option for our passengers. We are the corporate functions and of the commercial areas of both cargo and international passenger operations, which we believe will result in significant operational efficiencies, incremental revenues and a strong improvementonly airline group in the cash flow generationworld with a local presence in six home markets and an international and intra-regional operation. This position is bolstered by our enhanced infrastructure in several of the combined business. In addition, we have harmonized the airlines’frequent flyer programs, and have made significant progress in contract renegotiations and procurement standardization, and are in the process of implementing a planour key hubs, allowing us to transfer best practices across multiple areas of the Company. We strongly believe that passengers of both LAN and TAM are directly benefiting from improved connectivity, cross-selling and easier access to more destinations via LATAM’s expandedfurther strengthen our network and code-share destinations. LATAM has established newconnection. We intend to leverage our position to create a leading portfolio of services and improved agreements with international carriers, has aligned certain commercial practicesdestinations, providing more options to our passengers and aspects of the on-board product for certain routes,building a platform to support continued growth.
Enhance Brand Leadership and implemented new operations on regional routes. Regarding synergy capture, the Company has sucesfully implemented all the synergy and efficiency initiatives and continues working to fully achieve the run rate of these initiatives, therefore, we remain confident in our synergy target of between US$600 and US$700 million,Customer Experience
We will always seek to be fully achievedthe preferred choice of passengers in South America. Our efforts are supported by a differentiated passenger experience, and our leveraging of mobile digital technologies. We continue working on the fourth year after the merger (June 2016).
Fleet Restructuring Plan
After a processimplementation of reviewing its post-merger fleet planour single, unified brand, culture, product and fleet requirements, during the second half of 2013 LATAM decided to undertake a broad fleet restructuring plan with the aim of reducing the number of models operated, phasing out less efficient models and allocating aircraft best suited to each one of its markets. As a result, beginning in the fourth quarter of 2013 andvalue proposition for approximately the next thirty months, the Company will phase out all of its A330s, A340s, B737s and Q400 and Q200s. During the fourth quarter of 2013 this process has generated non-recurring costs of US$17.5 million resulting from penalties related to anticipated redeliveries and other redelivery expenses. For the full year, these costs reached US$29 million. These initiatives are part of a long term strategy which we believe is key in order to have a cost efficient operation, increasing LATAM’s competitiveness in the long term.
Improve our Capital Structure
LATAM Airlines Group is focused on developing a solid balance sheet, which we believe is a competitive advantage in the airline industry to facilitate access to fleet financing and provide resilience to the volatility inherent to airline operations. Following the business combination between LAN and TAM, we have significantly increased our outstanding indebtedness and aircraft purchase obligations. In the near-term,passengers. Additionally, we are focused on defining LATAM’s digital strategy, including applications to achieve ancillary revenues and improving the management of contingencies, so that we are able to provide information and solutions to our capital structure, by improving cash flow generation of the business and actively managing capacity in our passenger and cargo businesses. The near-term fleet plans of LAN and TAM, including for the 2013 and 2014 years, were developed separately, prior to the association of these airlines. LATAM Airlines Group has rationalized the fleet plans of LAN and TAM into a joint fleet management plan, which we expect to resultcustomers in a decrease in expected fleet capital expenditures for the coming years. This reduction in capital expenditures reflects capacity reductions in the domestic Brazil operations, as well as reduced growth estimates for our international passenger business.
In December of 2013, LATAM issued 51,685,128 shares by way of an equity rights offering, for total consideration of $784 million (before offering expenses). In January 2014, LATAM issued an additional 10,314,872 million shares that were not subscribed for in the rights offering through a subsequent auction, for total consideration of $156.5 million (before offering expenses). Approximately 50% of the net proceeds from the rights offeringtimely and subsequent auction were used to pre-pay short term financial liabilities of the Company.
Maintain Excellent Customer Satisfaction
In both our passenger and cargo businesses, we focus on delivering high quality services that are valued by our customers. In our passenger businesses we strive to achieve high on-time performance, world-class on-board service on long-haul flights, attractive and convenient pricing, quick check-in for short-haul flights, and the comfort afforded by a modern fleet. During the first half of 2009 LAN completed the reconfiguration of the cabins of all its long-haul aircraft, including both the Boeing 767 and the Airbus A340 passenger aircraft, in order to incorporate our new Premium Business Class including full-flat seats, as well as improvements in economy class which include a state-of-the-art on-board entertainment system. This high quality standard is shared by TAM, which currently offers first and business class in all its long haul flights as well as in some regional routes. Our frequent flyer programs, LANPASS and TAM Fidelidade, provide travel benefits and rewards to more than 8.5 million loyal customers in Chile, Argentina, Peru, Ecuador and Colombia as well to more than 12.2 million members in Brazil. In the cargo business, we focus on providing reliable service, taking advantage of our ability to handle different types of cargo as well as significant cargo volumes, and leveraging our facilities in key gateways, such as Miami, to ensure optimal handling of our customers’ needs.transparent manner. We continually assess opportunities to incorporate service improvements in order to respond effectively to our customers’ needs.
Focus onImproving Efficiency and SustainabilityCost Competitiveness
We are increasingly focusedcontinually working to maintain a competitive cost structure and further improve our effectiveness, simplify our organization and increase flexibility and speed in decision-making. As previously announced, LATAM is embarked on improving efficiency through a series of fleet initiatives that seekan important project to reduce fuel consumption. The most significant is our ongoing fleet renewal and growth plan, through which we expect to incorporate 157 new aircraft between 2014 and 2019, which we expect will contribute to lower costs per ASK. As an example, we estimate that the Boeing 787 Dreamliner operates with costs per ASK that are approximately 12% lower than other long haul passenger aircraft, the new Boeing 777 freighter operates with costs per ATK that are approximately 17% lower than the Boeing 767 freighter, and the Airbus A350 will operate with costs per ASK that are approximately 25% lower than the Airbus A330. In addition, we completed the installation of winglets on all of LAN’s existing Boeing 767 aircraft, achieving average fuel efficiencies of approximately 5% per aircraft per year since implementation. We are also in the process of installing sharklets (a type of winglet) in our Airbus A320 Family fleet, which we expect to result in further fuel efficiencies in this fleet.
In order to mitigate the environmental impact of our operations we seek to operate in a sustainable manner by reducing our fuel consumption and related emissions. We also continue to focus on adjusting the configuration of our aircraft to market demand by, for example, adjusting the configuration of certain Boeing 767s by reducing the number of Premium Business seats and increasing the number of Economy class seats.
During 2012, LAN also replaced its passenger service system, containing the reservation, inventory and departure control systems of the airline, withintroduce a new system provided by Sabre. The conversion process involved moving from two suppliers (Amadeus and Resiber), whose systems were previously required to cover the complete role of thetravel model for its domestic passenger service system, to a single supplier (Sabre), and is expected to resultservices in substantial savings over the coming years. For the near future, we are contemplating the migration of TAM’s reservation system to SabreSouth America, in order to achieveincrease competitiveness and ensure the synergiessustainability of havingthe domestic business model in the long term. This model requires continued cost efforts to reduce selling and distribution expenses, increase fleet utilization and operational productivity and simplify back-office and support functions, while controlling fixed costs.
Organizational Strength
We aspire to be a unified passenger service system.group of passionate people, working in a simple and aligned manner, with inspiring leaders making agile decisions. This will allow us to deliver a distinctive value proposition to our customers, surpass our competitors consistently and operate sustainably for the long term.
Proactive Risk Management
We strive to have a holistic and responsible view of risk in decision-making. We put special focus on risks that have high potential impact and low probability of occurrence, which could significantly affect LATAM’s strategic objectives.
Airline Operations and Route Network
The following tabletables sets forth our operating revenues by activity and point of sale for the periods indicated, which for the year ended December 31, 2013 includes LATAM’s total revenues; for the year ended December 31, 2012 includes TAM’s revenues since June 23, 2012; and for the year ended December 31, 2011, represents the historical consolidated revenues of LAN:
Total passenger revenues Total cargo revenues Total traffic revenues Year ended December 31, 2013
LATAM 2012
LATAM 2011
LAN (in US$ millions) 11,061.6 7,966.8 4,008.9 1,863.0 1,743.5 1,576.5 12,924.5 9,710.4 5,585.4
The following table sets forth our operating revenues by point of sale, which for the year ended December 31, 2013 includes LATAM’s total revenues; for the year ended December 31, 2012 includes TAM’s revenues since June 23, 2012; and for the year ended December 31, 2011, represent the historical consolidated revenues of LAN:indicated:
| Year ended December 31, | ||||||||||||||||||||||||
| 2016 | 2015 | 2014 | ||||||||||||||||||||||
| (in US$ millions) | ||||||||||||||||||||||||
Total passenger revenues | 7,877.7 | 8,410.6 | 10,380.1 | |||||||||||||||||||||
Total cargo revenues | 1,110.6 | 1,329.4 | 1,713.4 | |||||||||||||||||||||
Total traffic revenues | 8,988.3 | 9,740.0 | 12,093.5 | |||||||||||||||||||||
| Year ended December 31, | Year ended December 31, | |||||||||||||||||||||||
| 2013 LATAM | 2012 LATAM | 2011 LAN | 2016 | 2015 | 2014 | |||||||||||||||||||
| (in US$ millions) | (in US$ millions) | |||||||||||||||||||||||
Peru | 646.2 | 620.3 | 557.5 | 627.2 | 681.3 | 660.1 | ||||||||||||||||||
Argentina | 950.6 | 890.2 | 616.6 | 1,031.0 | 979.3 | 813.5 | ||||||||||||||||||
U.S.A. | 1,290.5 | 1,268.6 | 1,135.9 | |||||||||||||||||||||
United States | 933.1 | 1,025.5 | 1,224.3 | |||||||||||||||||||||
Europe | 937.5 | 738.8 | 523.7 | 714.4 | 723.1 | 935.9 | ||||||||||||||||||
Colombia | 388.0 | 366.7 | 367.6 | 343.0 | 353.0 | 391.7 | ||||||||||||||||||
Brazil | 5,572.9 | 3,322.4 | 258.3 | 2,974.2 | 3,464.3 | 5,361.6 | ||||||||||||||||||
Ecuador | 273.7 | 266.3 | 228.9 | 198.2 | 238.5 | 248.6 | ||||||||||||||||||
Chile | 1,698.5 | 1,525.0 | 1,312.4 | 1,512.6 | 1,575.5 | 1,589.2 | ||||||||||||||||||
Asia Pacific and rest of Latin America | 1,166.6 | 712.2 | 584.4 | 654.6 | 699.5 | 868.6 | ||||||||||||||||||
Total Operating Revenues | 12,924.5 | 9,710.4 | 5,585.4 | 8,988.3 | 9,740.0 | 12,093.7 | ||||||||||||||||||
Passenger Operations
General
As of December 31, 2013,2016, our passenger operations were performed through airlines in Chile, Brazil, Peru, Argentina, Colombia and Ecuador, where we operate both domestic and international services. We collect and report operating data for our passenger operations in three categories: international (connecting more than one country), Domestic operations in Spanish speaking countries or “SSC” (including Chile, Peru, Argentina, Colombia, and Ecuador), and Domestic Brazil (wholly within Brazil).
The following table sets forth certain of our passenger operating statistics on an actual and pro forma basis (except where noted)data for international and domestic routes for the periods indicated:
| Year ended and as at December 31, (1) | Year ended and as at December 31 | |||||||||||||||||||||||
| LATAM 2013 (actual) | LATAM 2012 (pro forma) | LAN 2011 (actual) | 2016 | 2015 | 2014 | |||||||||||||||||||
ASKs (million) (at period end) | ||||||||||||||||||||||||
International | 67,162.3 | 65,627.8 | 32,086.7 | 73,541.9 | 69,615.9 | 65,574.6 | ||||||||||||||||||
Domestic | 64,528.5 | 66,558.3 | 16,052.9 | |||||||||||||||||||||
SSC | 23,847.1 | 22,072.8 | 21,065.8 | |||||||||||||||||||||
Domestic Brazil | 37,578.7 | 42,478.5 | 43,560.5 | |||||||||||||||||||||
Total | 131,690.9 | 132,186.0 | 48,139.6 | 134,967.7 | 134,167.1 | 130,200.9 | ||||||||||||||||||
RPKs (million) | ||||||||||||||||||||||||
International | 55,274.3 | 53,957.4 | 25,935.6 | 63,392.6 | 59,003.4 | 55,980.1 | ||||||||||||||||||
Domestic | 51,192.2 | 49,928.7 | 12,487.3 | |||||||||||||||||||||
SSC | 19,293.7 | 17,858.4 | 16,964.3 | |||||||||||||||||||||
Domestic Brazil | 30,940.5 | 34,648.1 | 35,589.7 | |||||||||||||||||||||
Total | 106,466.5 | 103,886.1 | 38,422.9 | 113,626.9 | 111,509.9 | 108,534.0 | ||||||||||||||||||
Passengers (thousands) | ||||||||||||||||||||||||
International | 13,506 | 13,134 | 7,076.2 | |||||||||||||||||||||
Domestic | 53,189 | 51,544 | 15,514.7 | |||||||||||||||||||||
Total | 66,696 | 64,677 | 22,509.9 | |||||||||||||||||||||
Passenger yield (passenger revenues/RPKs, in US cents) | ||||||||||||||||||||||||
International | US¢9.6 | US¢9.6 | US¢9.5 | |||||||||||||||||||||
Domestic | US¢11.7 | US¢12.3 | US¢12.3 | |||||||||||||||||||||
| Year ended and as at December 31, (1) | Year ended and as at December 31 | |||||||||||||||||||||||
| LATAM 2013 (actual) | LATAM 2012 (pro forma) | LAN 2011 (actual) | 2016 | 2015 | 2014 | |||||||||||||||||||
Combined yield(2) | US¢10.4 | US¢10.6 | US¢10.4 | |||||||||||||||||||||
International | 15,107 | 14,156 | 13,630 | |||||||||||||||||||||
SSC | 22,829 | 21,540 | 20,735 | |||||||||||||||||||||
Domestic Brazil | 29,024 | 32,139 | 33,468 | |||||||||||||||||||||
Total | 66,960 | 67,835 | 67,833 | |||||||||||||||||||||
Passenger RASK (passenger revenues/ASK, in US cents) | ||||||||||||||||||||||||
International(1) | US¢5.8 | US¢6.5 | US¢7.6 | |||||||||||||||||||||
SSC(1) | US¢6.9 | US¢8.3 | US¢9.1 | |||||||||||||||||||||
Domestic Brazil(1) | US¢5.8 | US¢5.9 | US¢8.6 | |||||||||||||||||||||
Combined Passenger RASK(2) | US¢5.8 | US¢6.3 | US¢8.0 | |||||||||||||||||||||
Passenger load factor (%) | ||||||||||||||||||||||||
International | 82.3 | % | 82.2 | % | 80.8 | % | 86.2 | % | 84.8 | % | 85.4 | % | ||||||||||||
Domestic | 79.3 | % | 75.0 | % | 77.8 | % | ||||||||||||||||||
SSC | 80.9 | % | 80.9 | % | 80.5 | % | ||||||||||||||||||
Domestic Brazil | 82.3 | % | 81.6 | % | 81.7 | % | ||||||||||||||||||
Combined load factor | 80.8 | % | 78.6 | % | 79.8 | % | 84.2 | % | 83.1 | % | 83.4 | % | ||||||||||||
| (1) |
| business units is provided because LATAM believes that it is useful information to understand trends in each of our operations. We use our revenues as defined under IFRS to calculate this metric. The |
| (2) | The combined Passenger RASK for LATAM is calculated by dividing passenger revenues by total passenger ASKs. |
International Passenger Operations
Our international network combines the international operations of our Chilean, Peruvian, and Ecuadorian, Argentinean, Colombian and Brazilian subsidiaries.affiliates. We have operated international services out of Chile since 1946. Over time we1946 and have greatly expanded our international services, offering flights out of Peru, with the creationEcuador, Argentina, Colombia and Brazil. As of LAN PeruDecember 31, 2016, we offer 27 international destinations in 1999, out of Ecuador through the creation of LAN Ecuador18 countries, in 2003,addition to our domestic destinations and out of Argentina with LAN Argentina in August 2006, which until then had only been offering domesticinternational flights and out of Colombia in 2010 through LAN Colombia, following the acquisition of Aires. Most recently,connections between our international services grew significantly with the business combination between LAN and TAM in June of 2012.domestic destinations. As of January 31, 2014,2016, we now offer 24 international destinations.combined all of our operations under the LATAM brand.
Our general strategy to generally expand our international network is aimed at enhancing our value proposition by offering customers more destinations and routing alternatives, maximizing aircraft utilization, increasing load factors, leveraging complementary seasonal patterns, and optimizing our commercial efforts. Our sustainedpromoting tourism to and within South America. Sustained development of our international network has been a crucial factor in our long-term growth. We providestrategy. The group provides long-haul services out of our seven main hubs in Santiago, Lima, Guayaquil, Buenos Aires, Bogota, Sao Paulo and Rio de Janeiro. WeThe group also provideprovides regional services from Chile, Peru, Ecuador, Argentina, Colombia and Brazil. Since 2004,
During 2014, after the necessary infrastructure investments were made, we havecompleted our move to the new Terminal 3 at Guarulhos Airport in Sao Paulo, with new slots for takeoff and landing, which has allowed us to significantly decrease our connection times. This is a key milestone in the development of our most important hub at Guarulhos airport. In addition, the group has continued to consolidate our hubsecondary hubs in Lima which serves as the center of our Latin American network and also complements our intercontinental network, by opening new routes and increasing flights on existing routes out of Lima. After LAN and TAM’s combination in 2012, we have been also focused in building a new regional hub at Sao Paulo, Guarulhos airport, which we see is becoming one of the most important gateways into South America and where we have seen an increase in international traffic in the last years. In regard to this new hub, ongoing infrastructure investments plus the recent approval from Brazilian authorities to reallocate our airport slots at Guarulhos are facilitating the construction of this hub for LATAM Airlines.
The following table sets forth the international destinations served from each of the aforementioned countries as of January 31, 2014:
| ||||
| ||||
| ||||
| ||||
| ||||
| ||||
| ||||
| ||||
In line with our long-standing commitment to provide customers with superior service and the best products on the market, in May 2009 we completed the retrofit of all of our long-haul fleet (including our Boeing 767 and Airbus A340 passenger aircraft) with the new Premium Business class and improved Economy class. Combining the best features of the traditional First and Business classes, the new Premium Business includes 180 degrees recline full-flat seats which allow passengers to sleep with the maximum comfort and privacy. Premium Business also includes top-level personalized in-flight service. Changes in Economy class include new seats with a greater recline angle, a cushion that slides forward for increased comfort and convenience, and larger individual video monitors for each seat.Santiago.
During 2013, LATAM2016, we received two additionalfive Boeing 787-8787-9 Dreamliners ending the year with five aircraft of this model, out of an order of 32. The configuration of the cabin on the Boeing 787-8 aircraft includes 217 economy class seats and 30 seats(we have orders for Premium Business class. One of the new features offered in the new Premium Business class cabin is a 100% horizontal full flat seat with the same dimensions of our current seat that includes foot support, a memory system that records the seat position chosen by the user and lumbar massage, and our new Economy class features reclining ergonomic seats. The incorporation of the Boeing 787-8 Dreamliners into our fleetnine more), which will allow us to achieve important savings on fuel consumption, and the sustainable expansion of our fleet (as the Dreamliner produces up to 20% less CO2 than similar aircraft), while incorporating modern technology to deliver the best travel experience for our passengers. See “Item 3. Key Information—D. Risk Factors—Risks Relatedpassengers and reduce our carbon footprint, as the Dreamliner produces up to our Operations and20% less CO2 than similar aircraft. We also took delivery of six Airbus A350 aircraft (we have orders for 20 more). In addition, we received the Airline Industry—We have investedfirst two Airbus A320neo, out of an order of 34 aircraft of this model, becoming the first airline in new Boeing 787 “Dreamliner” aircraft.”Latin America to fly this model.
As part of itsour mission, LATAM seeks to promote tourism to South America. Due to itsour large network of services, visitors from around the world can experience world renownedworld-renowned destinations such as Cusco, Easter Island, the Galapagos Islands, Iguazu Falls in Brazil, orand Patagonia in Chile and Argentina, including the cities of Punta Arenas, Puerto Natales, Ushuaia, El Calafate and Bariloche.
ChileMarket Share Information
According to the Chilean JAC data, Chilean internationalThe following table presents air passenger traffic increased 2.7% from 2012 to 2013 as measured in RPK, totaling approximately 7.0 million passengers in 2013. We had 52.4% of theinformation for international flights (including intra-regional flights) and LATAM’s market share in Chileeach geographic market in 2013, which was a decrease compared to 54.4%we operate:
Country | Industry passenger figures | LATAM’s Market Share | ||||||||||||||
| % variation 2016-2015 | 2016 | 2015 | % variation | |||||||||||||
Brazil(1) | -0.3 | % | 78.9 | % | 78.5 | % | +0.4 p.p. | |||||||||
Chile(2) | +11.5 | % | 61.7 | % | 62.5 | % | -0.8 p.p. | |||||||||
Argentina(3) | +9.9 | % | 11.9 | % | 11.8 | % | +0.1 p.p. | |||||||||
Peru(4) | +9.8 | % | 44.0 | % | 43.9 | % | +0.1 p.p | |||||||||
Colombia(5) | +12.0 | % | 8.0 | % | 8.0 | % | 0.0 p.p | |||||||||
Ecuador(3) | +11.5 | % | 17.2 | % | 18.9 | % | -1.7 p.p. | |||||||||
| (1) | Source: ANAC Brazil’s website. Variation and market share considering RPK. Figures are considering only Brazilian airlines |
| (2) | Source: JAC Chile’s website. Variation and market share considering number of passengers carried. |
| (3) | Source: Diio.net. Variation and market share considering ASKs. |
| (4) | Source: Ministry of Transportation Peru’s website. Variation and market share considering number of passengers carried. |
| (5) | Source: DGAC Colombia’s website. Variation and market share considering RPK. |
Competitors in 2012 as measured in RPK. Our Chilean international operations can be divided into four main segments based on destination: to North America, to Europe, to other countries in Latin America, and to the Pacific. As of January 31, 2014, ourroutes
The following table shows LATAM’s main competitors on direct routes between Chile and North America included American Airlines, Delta Airlines, Avianca-Taca, Air Canada and Aeromexico. COPA also participated in the Chile-North American markets with stopoverseach geographic market in its Central American hub in Panama City. Our main competitors on routes between Chile and Europe were Air France-KLM and Iberia. On regional routes our main competitors included Aerolineas Argentinas, Air Canada, Avianca-Taca and GOL.which we operate:
Peru
According to Peruvian DGAC data, Peruvian international air passenger traffic increased 10.5% from 2012 to 2013 as measured in passengers transported, totaling approximately 7.5 million passengers in 2013. We had 46.3% of the international market share in Peru in 2013, which was a decrease compared to 47.5% in 2012 as measured by number of passengers. Our Peruvian international operations can be divided into three main segments based on destination: to North America, to Europe and to other countries in Latin America. As of January 31, 2014, our main competitors on direct routes between Peru and North America included American Airlines, United Airlines, Delta Airlines, Avianca-Taca, Aeromexico and Air Canada. COPA also participated in the Peru-North American markets with stopovers in its respective Central American hub. On routes to Europe, our main competitors were Air France-KLM and Iberia. On regional routes our main competitors included Avianca-Taca and Aerolineas Argentinas.
Ecuador
According to our internal estimates and travel agency statistics (captured through IATA Billing Settlement Plan or “BSP”), Ecuadorian international air passenger traffic increased 4.0% from 2012 to 2013, as measured in passengers transported totaling approximately 3.23 million passengers in 2013. We had 32.6% of the international market share as measured in ASKs in LATAM routes from Ecuador in 2013, a decrease of 1.3 percentage points compared to 33.9% in 2012. Our Ecuadorian international operations can be divided into three main segments, based on the destination: to North America, Europe to other countries in Latin America. As of January 31, 2014, our main competitors on direct routes between Ecuador and North America included American Airlines, Continental Airlines, Delta Airlines; Avianca–Taca and COPA also participate in the Ecuador-North American markets with stopovers in their respective Central American hubs. On routes to Europe, our main competitors included Iberia, KLM and Avianca-Taca. On regional routes, our main competitors included Avianca-Taca and Copa.
Argentina
According to our internal estimates and travel agency statistics (captured through BSP), Argentinean international air passenger traffic increased more than 10.0% from 2012 to 2013 as measured in passengers transported, totaling approximately 5.2 million passengers in 2013. LATAM Airlines had 24% of the international market share as measured in passengers transported in Argentina in 2013, which was a decrease as compared to 28% in 2012. The Argentinean international operations can be divided into two main segments based on destination: to North America and to other countries in Latin America. As of January 31, 2014, the main competitors on the Buenos Aires-Miami route included American Airlines and Aerolíneas Argentinas. Avianca-Taca and COPA also participated in the Argentina-North American markets with stopovers in their respective hubs. The main competitors on the Buenos Aires-Dominican Republic route included COPA and American Airlines. The main competitors on the Buenos Aires-Sao Paulo route included GOL and Aerolíneas Argentinas. The main competitors on the Buenos Aires-Lima route included Avianca-Taca and Aerolíneas Argentinas. The main competitors on the Buenos Aires-Santiago route included Aerolíneas Argentinas and Air Canada and Sky Airline.
Colombia
According toAeronautica Civil (Colombian Civil Aeronautics), the Colombian international market increased 11.5% from 2012 to 2013 as measured in RPKs (for the period January-November), from 7.8 million passengers to approximately 8.8 million passengers in 2013. LAN Colombia had a 4.4% share of the international market share in Colombia in the first eleven months of 2013,
as measured in RPK. During the second quarter of 2013, LAN Colombia began to operate two Boeing 767s on weekly routes to Miami and Sao Paulo, which allowed LAN Colombia to significantly improve international options by offering Premium Business on these flights, and strengthen its international market position. The international operations in Colombia can be divided in two business segments based on destination: to North America and to other countries in Latin America. As of January 31, 2014, the main competitors on direct routes between Colombia and North America included Avianca-Taca, American Airlines, United Airlines, Air Canada, Delta Airlines and Aeromexico. COPA also participated in the Colombia-North American markets with stopovers in its Central American hub. On regional routes, the main competitors included Avianca-Taca and COPA.
Brazil
According to Brazilian ANAC data, Brazilian international air passenger traffic increased 5.1% from 2012 to 2013 as measured in RPKs, totaling more than 6.0 million passengers in 2013. TAM had 87.5% of the international market share in Brazil in 2013 when considering only Brazilian airlines, which was a decrease compared to 89.4% in 2012. Our Brazilian international operations can be divided into three main segments, based on destination: to North America, to Europe and to other countries in Latin America. As of January 31, 2014, the main competitors on direct routes between Brazil and North America included American Airlines, United Airlines, Delta Airlines, Air Canada and Aeromexico. Avianca-Taca also participated in the Brazil-North American markets with stopovers in its Central American hub. On routes to Europe, the main competitors were Iberia, Air France-KLM, Lufthansa, TAP and Air Europa. On regional routes the main competitors included Aerolineas Argentinas, Avianca-Taca and GOL.
Country | Route | Competitors | ||
| Brazil | North America | American Airlines, United Airlines, Delta Air Lines, Azul Linhas Aereas, Air Canada and Aeromexico. | ||
| Latin America | Copa, Gol, Avianca and Aerolineas Argentinas | |||
| Europe | TAP Portugal, AirFrance-KLM, Lufthansa, Alitalia, Iberia and British Airways | |||
| Chile | North America | American Airlines, Air Canada, United Airlines, Delta Air Lines and Aeromexico. | ||
| Latin America | Copa, Sky, Avianca and Gol. | |||
| Europe | AirFrance-KLM, Iberia and Alitalia | |||
| Pacific | Qantas Airways | |||
| Argentina | North America | Aerolíneas Argentinas, American Airlines, Aeromexico, Delta Air Lines and United Airlines. | ||
| Latin America | Aerolineas Argentinas, Gol, Copa and Avianca | |||
| Peru | North America | American Airlines, United Airlines, Avianca, Aeromexico, Delta Air Lines and Air Canada. | ||
| Latin America | Avianca, Copa, Sky Airlines and Aerolíneas Argentinas | |||
| Europe | AirFrance-KLM, Iberia, Air Europa and British Airways | |||
| Colombia | North America | Avianca, American Airlines, JetBlue Airways, United Airlines, Aeromexico and Delta Air Lines. | ||
| Latin America | Avianca, Copa, Aerolineas Argentinas and VivaColombia | |||
| Ecuador | North America | American Airlines, Tame, Delta Air Lines, United Airlines, Aeromexico and JetBlue Airways. | ||
| Latin America | Copa, Avianca, Tame and Avior Airlines | |||
| Europe | AirFrance-KLM and Iberia | |||
Domestic Passenger Operations
LATAM providesAs of December 31, 2016, domestic passenger services within Chile, Brazil, Peru, Ecuador, Argentina and Colombia through LAN, LAN Express and regional subsidiaries, including LANwere operated by LATAM Airlines Chile, LATAM Airlines Brazil, LATAM Airlines Peru, LANLATAM Airlines Ecuador, LANLATAM Airlines Argentina and LANLATAM Airlines Colombia, and, in Brazil, through TAM Linhas Aereas.respectively.
Business Model for Domestic Operations
In 2007, we initiated a newNovember 2016, the group announced an important project to revamp the business model of our domestic services offering in the six domestic markets where the group operates in South America. The purpose of this change is to redesignincrease our competitiveness
and ensure the long-term sustainability of our domestic business operations with the goal of developing the industrymodel. This project seeks to increase our operational efficiency, allowing us to provide more competitive fares, and increasing efficiency of LAN’s short-haul operations, specifically with respectcontributing to the development of tourism and the growth of air travel per capita in the region. Our new domestic operationsservice model requires continuous cost reduction efforts, and we are implementing a series of initiatives to reduce cost per ASK in Chileall domestic operations. These efforts are aimed at significantly reducing selling and Peru. A key element of this business model has been to significantly increase the utilization of our narrow body fleet, which we have been successfully achieving through modified itineraries including more point-to-point and overnight flights. We removed the Boeing 737-200 aircraft from our fleet in favor of the new more efficient Airbus A320-Family Aircraft. The Airbus A320-Family Aircraftdistribution expenses, increasing fleet utilization reached approximately 9.4 block hours per day in 2012. The transition to a newer fleet allows for lower unscheduled maintenance costs as well as cost efficiencies achieved through operating fewer fleet types and operational efficiencies, including lower fuel consumption.productivity and simplifying back-office and support functions, thereby allowing us to expand our operations while controlling fixed costs.
Another key element of this business model is the reduction in sales and distribution costs through higher internet penetration and reduced agency commissions, a faster turnaround time and increased self-check-in service through web check-in and kiosks at airports. Theseare initiatives together with simplifications in back-office and support functions, will continue to allow us to expand operations while controlling fixed costs, spurring a reduction in overhead costs. We have begun to pass on these operating efficiencies to consumers through significant fare reductions, which have a strong effect in stimulating new demand. In 2007, we implemented all aspects of this new business model in the Chilean and Peruvian domestic markets, and began to implement the business model in Argentina that same year. In 2009 we began to implement this business model in Ecuador as well.
As a result of the implementation of this business model, the number of passengers transported has increased:
We plan to continue with the implementation of this business model during 2014 in Colombia and Brazil and we have started its implementation in some regional routes, as we look for ways to increase operational efficiency, encourage direct sales and self check-in, and implement new sales strategies aimed at stimulating demand.
Operations within Chile
Through LAN and LAN Express, we are the leading domestic passenger airline in Chile. We have operated domestic flights in Chile since the Company’s creation in 1929. During 2013, we flewour ancillary revenues, while allowing passengers to 16 destinations within Chile (including Santiago, but not including Easter Island, which we consider an international destination even though it is a part of Chile, because we serve it with long-haul aircraft) as well as some seasonal destinations. LAN and LAN Express have integrated passenger operations, including operations under the same two-letter “designator reservation code,” and have coordinated fare structures, scheduling and other commercial matters in order to maximize cooperative benefits and revenues for the two carriers. Our strategy is based on providing frequent service to Chile’s main destinations, offering a reliable and high quality service, and leveraging our strong brand position in Chile and abroad. We evaluate our network of domestic routes on an ongoing basis in order to achieve optimal operational efficiency and profitability. Our strategic objective is to maintain our leadership position in our domestic routes.
During 2013 we operated an average fleet of 22 Airbus A320-Family Aircraft in the Chilean domestic market, and we plan to operate an average fleet of 26 Airbus A320-Family Aircraft in 2013. Domestic operations in Chile have been positively affected by the greater utilization of the latest-generation Airbus fleet and the retirement of the Airbus A318-100s. Currently, LATAM’s domestic fleet in Chile has an average age of 2 years.
According to JAC data, the Chilean domestic market as a whole transported approximately 9.5 million passengers in 2013, an increase of 13.7% from 8.3 million passengers transported in 2012. Our domestic passenger market share in Chile was 76.8% in 2013 as measured in revenue passenger kilometer (RPK). During 2013, our main competitors in the domestic market were Sky Airlines and PAL Airlines with domestic passenger market shares as measured in RPKs of 19.4% and 3.0% respectively.
There are currently no foreign airlines participating in the Chilean domestic market. Chile permits foreign airlines to operate in Chile. Additionally, there are no regulatory barriers that prevent a foreign airline from creating a Chilean subsidiary and entering the Chilean domestic market using that subsidiary.
Operations within Peru
LAN Peru started operations in 1999 with both domestic and international flights from Lima. During the last ten years LAN Peru has expanded consistently, consolidating its domestic operations and coverage of the relevant markets with a continuous focus on improving our excellence for service. Self-check-in levels have grown steadily in recent years, reaching 80% for domestic routes in 2013.
Peru has tremendous potential, compared to other Latin American markets, based on per capita travel ratios. In 2013, the domestic market in Peru reached 8.3 million passengers, an increase of 14.8% from 7.2 million passengers transported in 2012. During 2013, LAN Peru increased daily frequencies in some flights from Lima to destinations such as Piura, Chiclayo and Iquitos; added some new direct flights between Cusco and Arequipa and Puerto Maldonado; and added new nightly flights to Cusco, the country’s most important tourist destination, being the only airline providing this flight schedule. LAN Peru flies at least three times daily to each of its 14 destinations except Tumbes, Pucallpa, Puerto Maldonado and Tacna (2 or 3 flights daily).
LAN Peru began 2013 with a fleet of 14 Airbus A319 Aircraft. During the year, one of the Airbus A319 aircraft was phased out of the fleet and 3 Airbus A320 aircraft were incorporated, one of them including sharklets. With this, LAN Peru has one of the most modern fleets in Latin America, which is ideal for the characteristics of Peruvian routes, as it maximizes available payload in high-altitude airports. In terms of efficiency, a uniform A320 family fleet also allows for low maintenance costs, high crew productivity and operational flexibility. Fleet utilization slightly decreased from 10.6 flight hours per operating day in 2012 to 10.3 flight hours per operating day in 2013.
In 2013, a total of 5.3 million passengers traveled on LAN Peru’s domestic routes, which represented an increase of 17.1% compared to 2012. According to data provided by the Peruvian DGAC, our domestic market share was 63.4% in 2013, compared to 62.2% in 2012, as measured in number of passengers. Our main competitors in Peru include Peruvian Airlines, Star Peru LC Peru and Avianca
Operations within Argentina
Since 2005, LAN Argentina has increased its domestic destinations to a total of 14 Argentine cities, and now serves Bahia Blanca, Bariloche, Buenos Aires, Calafate, Comodoro Rivadavia, Cordoba, Iguazu, Mendoza, Neuquen, Rio Gallegos, Salta, San Juan, Tucuman and Ushuaia.
Since the end of 2006, LAN Argentina has operated Airbus A320 aircraft in both domestic and regional operations. LAN Argentina currently operates a fleet of 10 Airbus A320 aircraft in our domestic operations.
In the domestic Argentine market, LAN Argentina operates in a regulated environment in which fares sold to Argentine passengers are subject to minimum and maximum prices that vary per route. In August 2006, by presidential decree, both the floor and ceiling of the regulated price range were increased by 20%. The decree also liberalized foreign ownership of Argentinean airlines, previously capped at 49%. Since this decree, the floor and ceiling of the regulated price range have been consistently increased on an annual or semi-annual basis, by a range of 8-18%. In 2013, the ceiling and floor increased in the same proportion, both increasing by 9% in May 2013, and by 12% in December 2013.
Based on internal estimates as of December 31, 2013, our domestic market share in Argentina in terms of passengers transported was approximately 29%. During this period of time LAN Argentina transported 2.3 million passengers, a slight decrease 4% compared to 2012. The competitors in the Argentinean market during 2013 were Aerolíneas Argentinas and its affiliate Austral LíneasAéreas. Together, these two companies comprise the substantial majority of the remaining domestic Argentine market share, although a small portion of the domestic market share is serviced through Sol and Andes.
Operations within Ecuador
At the end of 2008, the Civil Aviation National Board authorized LAN Ecuador to operate domestic flights in Ecuador and in April 2009, LAN Ecuador initiated service between Quito and Guayaquil. In the past three years, LAN Ecuador has greatly expanded the number of destinations and frequency of flights in Ecuador. As of the end of 2013, LAN Ecuador operated 67 weekly flights between Quito and Guayaquil, 7 weekly flights to the Baltra, 2 weekly flights to San Cristobal and 15 weekly flights between Cuenca and Quito.
In 2013, LAN Ecuador transported 1.3 million passengers in the domestic passenger market, achieving a load factor of 78.5% and representing an increase of 20% in number of passengers serviced over 2012. LAN Ecuador had a domestic market share of 31.76% in 2012, representing a significant increase over its 2012 market share, according to internal estimates.
In Ecuador, the company’s principal competitors are TAME, Aerogal and Icaro.
Operations within Colombia
Following the acquisition of Aires in 2010, LAN Colombia has successfully restructured the Company’s previous operations in order to achieve LATAM’s standards in terms of security, punctuality, efficiency and service quality. In 2012 LAN Colombia started to implement its “low cost” model, already operating in the other affiliates domestic markets of Chile, Peru, Argentina and Ecuador, and to stimulate demand on domestic flights by providing more Colombian citizens the opportunity to use air transportation. With this strategy and new marketing plans aiming to increase brand awareness, LAN Colombia wascustomize their journey. Customers will be able to stimulate demand, achievingaccess a simpler sales platform, which will allow them to choose their fare reductions of approximately 35% by introducing new segmentation parameters prior to departure, depending on the market.type of journey they want, and to purchase additional services such as extra luggage, a variety of food and beverage options on board, preferred seating options and the flexibility to change tickets.
LAN Colombia continuedWe continue to expand its routes inside Colombiadevelop digital initiatives to empower passengers providing them an enhanced digital experience withend-to-end control of their reservation. LATAM customers will be able to buy,check-in and manage the after sale service in 2013, using a network of 20simpler and faster manner through their smartphones.
We will implement our new domestic destinations to transport more than 4.2 million passengers during the year, an increase of 15% as compared to passengers transportedstrategy by country, in 2012. As of December 31, 2013, LAN Colombia had 17% of Colombian market share, second after Avianca. Other competitorsstages starting in the domestic market are Copa, Viva Colombia, EasyFly and Satena.first half of 2017.
During 2013, LAN Colombia continued to advance in its fleet renewal plan, a process which began in 2012, LAN Colombia intends during 2014 to phase out the remaining Boeing B737 aircraft and Bombardier Dash aircraft inherited from Aires and replace them with more modern and efficient aircraft from the Airbus A320 family. All these actions aim to further reduce our operating expenses and become the most efficient carrier in Colombia. As of December 2013, LAN Colombia serviced its domestic destinations with 7 Airbus A320 aircraft, 4 Boeing B737 aircraft and 8 Dash-200 aircraft.
| Brazil | Chile | Argentina | Peru | Colombia | Ecuador | |||||||||||||||||||
Destinations | 41 | 16 | 15 | 17 | 14 | 5 | ||||||||||||||||||
Fleet | 100 | 27 | 15 | 18 | 17 | 6 | ||||||||||||||||||
Passengers Transported (million) | 29.0 | 7.9 | 2.6 | 6.6 | 4.8 | 1.0 | ||||||||||||||||||
Change (YoY) | (9.7 | %) | 8.1 | % | 7.0 | % | 6.7 | % | 4.4 | % | (8.3 | %) | ||||||||||||
Market share | 35 | %(1) | 76 | %(2) | 25 | %(3) | 62 | %(4) | 21 | %(5) | 31 | %(6) | ||||||||||||
Main competitors | | Gol, Azul, Avianca Brazil | | Sky Airlines | | Aerolíneas Argentinas | | | Avianca, Peruvian Airlines, Star Perú | | | Avianca, Viva Colombia, Santena | | Tame, Avianca | ||||||||||
In regard to service, during 2013 the Company launched a new VIP lounge in the El Dorado Airport in Bogotá, which has the best standards in terms of comfort and gastronomy and has become an asset in building loyalty in our clients. This lounge classified as one of the 10 best VIP lounges in the world, according to a specialized design magazine.
In August 2013, LAN Colombia and American Airlines started to market their codeshare agreement, allowing LAN Colombia to offer its clients 12 destinations in the United States, while American Airlines may now offer 4 additional destinations in Colombia. In October 2013, LAN Colombia enteredoneworld® alliance.
The domestic Colombian industry transported 21.5 million passengers during 2013, a 14.1% increase over 2012. LAN Colombia has maintained its position as the second largest operator in Colombia’s domestic market with approximately 18.3% of the market share as measured in RPKs as of December 31, 2013. A total of 4.0 million passengers traveled on LAN Colombia domestic routes in 2013, which represented an increase of 12.2% compared to 2012 domestic passenger activity. LAN Colombia’s main competitor, Avianca, carried almost 12.6 million passengers in 2013 and had a market share as measured in RPKs of approximately 57.7% in 2013. VivaColombia, a low cost carrier that started operations within Colombia in June 2012, transported more than 1.8 million passengers for the 2013 year, reaching a 8.8% market share as measured in RPKs.
As we look ahead to 2014, LAN Colombia will continue to market the LAN brand in the domestic Colombian market, maintain excellence in service, leadership in punctuality and corporate segment penetration.
Operations within Brazil
TAM Linhas Aereas, is the leading domestic passenger airline in Brazil, and has operated domestic flights in Brazil since the company’s creation in 1961. As of January 31, 2014 TAM Linhas Aereas has flights to 40 destinations (42 airports) within Brazil as well as some seasonal destinations. The strategy is based on providing strong connectivity through a network based on the main Brazilian cities, offering a reliable and high quality service, and leveraging our strong brand position in Brazil and abroad. TAM Linhas Aereas evaluates our network of domestic routes on an ongoing basis in order to achieve optimal operational efficiency and profitability.
The domestic market in Brazil has historically suffered from overcapacity, which resulted in very low load factors compared to industry standards, which has negatively impacted the financial results of domestic airlines in recent years. However, this trend began to change during 2012 and has significantly improved during 2013, as major airlines have reduced domestic capacity, and the capacity discipline is expected to continue during 2014. LATAM has continue to make significant progress in the turnaround of the domestic Brazil passenger operation, improving profitability by increasing load factor through the rationalization of capacity and improved revenue management through better segmentation of the market. During 2013, TAM reduced its capacity by 8.4% as measured in ASKs, leading to an increase of 6.1 percentage points in load factors on a year-over-year basis, despite the 0.8% decrease in traffic measured as RPKs. As of January 31, 2014, we operate an average fleet of 120 aircraft in the Brazilian domestic market. During 2014, we expect to maintain our capacity flat in order to continue improving the profitability of our domestic passenger operations in Brazil. TAM utilized the greater efficiency of the Airbus A320-Family aircraft on short-haul flights in order to gain operational efficiencies, such as more efficient fuel consumption.
According to ANAC, the Brazilian domestic market as a whole transported approximately 90.0 million passengers in 2013, an increase of 1.4% as compared to 89.0 million in 2012. TAM Linhas Aereas domestic passenger market share in Brazil as of the end of the year was 39.9% as measured in RPKs. During 2013, TAM’s main competitors in the domestic market were GOL, the merged airlines Trip and Azul, and Avianca Brazil. GOL (including Webjet) ended 2013 with a domestic passenger market share of 35.4% while Trip-Azul and Avianca Brazil had market shares of 13.2% and 7.2% respectively.
| (1) | Source: ANAC Brazil’s website. Market share considers RPKs. |
| (2) | Source: JAC Chile’s website. Market share considers RPKs. |
| (3) | Source: Company´s estimates. |
| (4) | Source: Ministry of Transportation Peru’s website. Market share considers number of passengers carried as of November 2016. |
| (5) | Source: DGAC Colombia’s website. Market share considers ASKs |
| (6) | Source: Company´s estimates. Market share considers ASKs |
Passenger Alliances and Commercial Agreements
LATAM is currently a member of the global marketing allianceoneworld, which includes Airberlin, American Airlines, British Airways, Cathay Pacific, Finnair, Iberia, Japan Airlines, Malaysia Airlines, Qantas, Qatar, Royal Jordanian, Sri Lankan and S7. In the aggregate,oneworld® members serve more than 1,000 destinations in 157 countries, operating over 13,000 daily departures.
LATAM and its affiliates have ongoing passenger commercial agreements with several airlines, including American Airlines, Iberia, Quantas, British Airways, Lufthansa, Swiss, Interjet, All Nippon Airways, Cathay Pacific, Japan Airlines, and Jetstar Airways, among others. These commercial agreements allow us to provide additional benefits to our passengers, including access to a wider network, more flight options with better connection times, more competitive fares to destinations not served by LATAM, and increased potential for developing new routes and adding direct flights to new destinations and to destinations already served by LATAM.
Moreover, on January 14, 2016, we entered into two new joint business agreements: an agreement with American Airlines and an agreement with British Airways and Iberia. These agreements further strengthen our relationship with theseoneworld® partners.
The following are our passenger alliancesagreements remain subject to regulatory approval in different countries. Some approvals have already been granted: on March, 2017, the administrative court of economic defense of the CADE (Administrative Council for Economic Defense) in Brazil, approved the agreement with British Airways and partnerships asIberia, representing the final stage of March 31, 2014:an evaluation process that began in June 2016. During the review, the CADE evaluated the scope of the agreement in terms of free competition and the benefits that it will bring to passengers, including improved connectivity, an expansion of the destination network and reduced prices. Both agreements have been approved in Uruguay.
|
|
Passenger Marketing and Sales
Following the business combination, LATAM will continue to operate under two brands, LAN and TAM.
LAN’s Passenger Marketing and Sales
Within the “LAN” brand, we differentiate our marketing strategies between our international (long-haul) and domestic (short-haul) services.
Our long-haul marketing strategy emphasizes attributes valued by our international customers: a reliable, high-quality service centered on comfort and entertainment and comfort for longlong-haul travel. We also highlight our extensive network, coveringwhich covers the most important destinations in South American destinationsAmerica and the Caribbean and provides frequent service to major overseas gateways such as New York, Los Angeles, San Francisco, Miami, Orlando, Washington, DC, London, Madrid, Paris, Frankfurt, Milan, Barcelona and Sydney. In a continuing effort to fulfill this promise,strengthen our network, during 2016 we continuously improvelaunched three new direct routes: Sao Paulo—Johannesburg, Lima—Barcelona and Santiago—Melbourne (the last being our cabins and review our service protocols. Our Business Cabin features a premium on-board service aimed to provide our customers with more time to rest. As for our Economy Cabin, our upgraded entertainment units make their flight a more enjoyable one. In May 2009 we completed a retrofit program for our Boeing 767-300 and for our Airbus A340-300 fleet respectively, to upgrade and improve our long-haul fleet. See “—International Passenger Operations” for a description of recent improvements to our international fleet.
In October 2010, LAN decided to renew the configuration of its B767-300s which included an increased capacity for each airplane from 221 to 238 seats. The original configuration had 191 seats in the Economy cabin and 30 seats in Premium Business cabin, the new Economy seat configuration increases to 220 and decreases the amount of Premium Business seats to 18. This configuration will be used in those markets with a higher demand of tourism and / or low corporate travel.
Our current fleet average age is 6.9 years and it’s been decreasing since the arrival of 5 of the 32 new Boeing 787 aircraft we ordered. LAN was the first airline in the Americas, and fourth in the world, to receive this model with the latest-generation technology that was an innovation breaking point for the airline industry. Passengers can immediately experience the 787’s advantages: higher cabin humidity and increased comfort. The 787 airplanes will allow us to reach new destinations and boost LAN’s existing services while increasing the efficiency of our operations and reduce our carbon footprint. See “—International Passenger Operations” for a description of recent improvements to our international fleet.longest flight).
Our short-haul operations are designed to fit our customers’ need in these routes:needs: punctuality, reliability, more frequencies,frequency, modern aircraftsaircraft and efficient operations. To deliver this value proposition, we have been increasing our fleet and frequencies with morepoint-to-point flights, improved punctuality, and streamlined processes including Internet sales, web and mobilecheck-in and airportself-check-in. As such, these routes now feature modern planes, increased frequencies with more point-to-point flights, improved punctuality and streamlined processes including Internet sales, web check-in and airport self-check-in. All of the domestic operations (Chile, Brazil, Peru, Argentina, Ecuador and Colombia) have the same business model which seeks to make air travel accessible to more people through low fares supported by a low-cost operation based on the efficient use of our resources. See “—Domestic Passenger Operations” for a description of recent initiatives to improve our domestic fleet, including the introduction of modern Airbus A320-Family Aircraft in most of our domestic operations.
We are constantly focused on delivering the services and flight items valued by customers in order to maintain high levels of customer satisfaction and we continuously monitor our customers’ preferences through surveys and perception studies. In response to comments received from our business travelers, in November 2007 we created the new Premium Economy class on some regional routes. The Premium Economy program grants our customers preferential check-in and boarding, access to our VIP lounges, priority baggage claim, exclusive cabins with only twelve passengers, and personalized attention by our cabin attendants, among other benefits.
Our short-haul fleet is also growing and renewed with the more Airbus 320 and 321 coming during the next years. These aircrafts have the latest security standards in the industry, improvements in the interior cabin design and new seat technology. They are 13 percent lighter than the aircraft they will replace, resulting in lower fuel consumption and CO2 emissions. They also are more comfortable for passengers since they have leather upholstery and more in-flight entertainment screens. In addition, the upper bins have mirrors that ensure visibility of carry-on luggage among other improvements of interior design.
Our main concern isstrive to deliver our promise to our customers. Therefore, we constantly monitor our customer satisfaction within-flight surveys and research, and measure our performance against the highest standard levels.standards. This commitment to excellence has paid off with severalis reflected in the numerous prizes and recognitions givenearned by customers and industry experts such asthe Company, including Skytrax’s “2013“2016, Best Airline in South America”, Business Traveler’s “2013 Best Business Class” and Premier Traveler USA’s “2013“2016, Best Airline to South America”. by Global Travelers.
Branding
The “LAN”Our new brand, “LATAM”, was officially launched in 2004 andMay 2016. The new brand brings together under one strong international name, all the passenger and cargo airline operations of the LATAM Airlines Group carriers: with the new brand, we will continue the legacy of leadership started decades ago by LAN, TAM and their respective affiliate brands such as “LAN Chile,” “LAN Peru,” “LAN Argentina” “LAN Colombia” and “LAN Ecuador.” We developed the LAN brand and corporate image after an extensive process supported by a leading global branding agency.carriers.
Our corporate image is based on two core concepts: reliability and warmth, which support our promise of the best travel experience to, from and within South America. We are also committed to offer our customers the best coverage to, from and withinfuture of South America and to promote sustainable tourism, helping developconnecting it to the regions where we operate. And by best, we mean providingworld. The new brand allows us to offer a better, consistent service throughout our customers with an excellent connection network, and service; being transparent and accessible; and promote sustainable tourismwhich in turn strengthens our position in the countries where we do business. Our commercial strategy, centered on exploiting the LAN alliance concept, has been widely recognized, as exemplified by Airline Business magazine’s recognition of us in 2004 with its “Airline Strategy Award, Marketing.”region.
Using a single brand enabled ourenables LATAM’s customers to better understand the common service and operating standards among our airlines, and our newits airlines. LATAM’s unified image has improved ourits visibility, which enhanced flexibility and increased the efficiency of our marketing efforts. It also provided a platform for the strategic use in mature markets of the following three powerful sub-brands, all connected to the LAN root:
LAN.com for the convenience of our web booking engine and services platform (not incorporated by reference herein);
LANPASS for our frequent flyer program; and
LANTOURS, a sub-brand through which we offer travel packages, hotels and other ancillary products, as well as promote tourism activities to and from the regions in which we operate. LANTOURS was first introduced in Chile and is gradually being introduced into other key markets.
Our regular brand tracking and marketing effectiveness measurements show outstanding results in brand consistency and recognition, improving year after year, with marketing investments managed at healthy and stable rates. As the corporate values behind our umbrella brand encompass attributes applicable to both operations, long-haul and short-haul, a single brand strategy has resulted in significant savings, as we only have to promote one master brand, thereby increasing the efficiency of ourits marketing efforts.
Since the launch of our new brand, we have made significant progress on its implementation, making our brand visible to our passengers. The new brand has been adopted at 15 airports, and we now offer a new single website for all of our different points of sale. The LATAM brand has also been applied to 43 aircraft, representing approximately 13% of our fleet. We also closely monitorlaunched new uniforms for our corporate image to ensurecrew, adopting the Company’s colors of indigo and coral while providing elegance and comfort for our crew.
During 2016, LATAM Airlines Brazil was the official airline sponsor of the Rio 2016 Olympic Games, reinforcing our brand is always shown at its best.positioning as a leader in the region through our presence in one of the most important sport events worldwide.
Distribution Channels
We useare committed to being the preferred choice of our customers, placing the passenger at the center of our decision making. Our distribution structure is divided into direct and indirect distribution channels. In the past few years, we havechannels, both focused on streamliningimproving their respective platforms to allow for easy interaction for our distribution strategyclient in order to reduce costs and enhance the effectiveness of our commercial efforts. This effort has resulted in efficiency gains, and we believe it should lead to further benefits in the future.
Travel agents conduct indirect sales accounting for approximately 49.8% of passengers during 2012 and 47% in 2013. Our goal is to minimize indirect sales because of higher costs when compared to direct sales. So we are continuously introducing new projects in order to minimize the percentage of total sales that are indirect sales. We paid these travel agents standard commissions ranging from 0% to 9.3% depending on the market and the ticket region type (domestic / international). Consistent with our efforts to reduce commission costs and in line with current market practices, in recent years we have reduced standard commissions in several markets.
Travel agents obtain airline travel information and issue airline tickets through Global Distribution Systems, or GDSs, this enables them to make reservations on flights from a large number of airlines. We participate actively in all major international GDSs, including Sabre, Amadeus, Galileo and Worldspan. In return for access to these systems, we pay transaction fees that are generally based on the number of reservations booked through each system. As part of its continued commitment to its passengers, in late 2009, LAN signed a series of agreements with Sabre, one of the major suppliers of IT solutions in the global airline industry. Through these agreements, Sabre provides the Company with the most advanced technology in reservation and distribution systems, optimization of routes and operational planning. LATAM recently completed the process of implementing the new system platforms in August of 2012. This new systems platform represents a major step in terms of innovation by implementing the industry’s most advanced technology to streamline business and operational processes, and enabled us to provide itineraries that best fit the needs of passengers and to provide simpler, agile and efficient services in airports and in the sales and distribution channels, improving LAN’s services in each of the stages of the travel experience.
alike. Direct channels refer to salesowned by our ownLATAM are comprised of city ticket offices, contact-centers and website. In 2013, direct bookingse-Business (including website, mobile and smart business), and accounted for approximately 65%52% of all our passengers.
We have an extensivetotal passengers in 2016. These direct channels support sales and marketing network in over thirty countries consisting of more than 200 domesticservice, both before and international points-of-sale owned by us and approximately 45 general sales agents. We charge a fee to customers for sales completed through our own ticket offices or call centers in most countries, leavingafter the Internet as the only free-of-charge distribution channel.flight.
Our contact-centers support the growth of our operations constituting a sales and a multi-service channel. During 2011, we continued to grow and develop new services to match the increasing expectations of our clients and the growth of our direct sales channels, in particular the www.lan.com website. Our main contact-center located in Santiago accounts for 749 agents (of which 246 are home-based) and 212 agents in Lima. We complement our contact-center’s operations with third-party service providers that add approximately 1050 agents who are located in Santiago, Lima and Buenos Aires. In total, all the centers handle more than 37,500 calls/contacts per day, which mainly originate from the regions where we fly (South America, North America, Europe and Australasia) and cover five languages (Spanish, English, Portuguese, French and German). We have continually upgraded our systems by incorporating technological advances to enhance efficiency and customer service.
Our website, www.lan.com (not incorporated by reference herein),Thee-Business channel is an integral part of our commercial, marketing and service efforts. Togetherefforts, and during 2016 our Internet-related sales achieved a better channel mix with otheran increase of 0.5 percentage points out of our total sales. The Company will continue to improve oure-Business platforms to support expected future growth.
Our digital strategy includes mobile applications that provide information to our passengers regarding their trip. These applications improve our management of contingencies, enable us to provide information and solutions to our customers in a timely and transparent manner and will serve as a new direct sales initiatives,channel.
Our city ticket offices support the growth of our website provides us with an important tool to reduce our distribution costs.operations, providing a sales channel. Our Internet-relatedcontact centers are a multi-service channel providing support in six languages (Spanish, English, Portuguese, French, German and Italian).
Indirect channels currently include travel agencies, general sales have increased significantlyagencies, direct channels from other airlines and online agencies, and accounted for a 48% of total passengers in recent years, by 22% in 2010, 22.6% in 2011, 42% in 2012, and 64% in 2013, which amounted to a total of US$1.289 million internet-related sales in 2013. We2016.
Frequent Flyer Programs
Our frequent flyer programs are continually improving our website, a key element of our new short-haul model, so that the technological platform can support expected future growth.
Besides serving as a sales channel, we have utilized our website as a tool to provide value-added servicesmarketing and enhance communications. We send weekly promotional e-mails to more than 7.9 million subscribers. Members of our frequent flyer program receive their monthly balancesloyalty strategy. These programs reward customer loyalty, and, other information by e-mail and can access the data and redeem awards through our website. We have an active online marketing program which brings visitors to the website from search engines and travel-related websites.
During 2009 we improved several services on the website. We introduced the flexible award redemption service, which enables LANPASS members to obtain flights with their kilometers at any time of year. We also updated our Flight Information System to ensure accurate, real time information. In addition, we continued to promote our web-based check-in service for domestic and international flights. This system allows those passengers who are not checking-in bags, to go directly to the gate, and the remaining checked-in passengers, to leave their bags at a special bag drop counter and proceed to the gate. In addition to web-based check-in, we have 283 self-check kiosks. We have 95 in Chile, 20 in Peru, 36 in Argentina, 29 in Ecuador, 10 in Venezuela, 2 in Uruguay, 46 in Brazil, 13 in Germany and 32 in Colombia. As of December 31, 2013, the kiosk and web check-in utilization rate was of 80% for domestic routes in Chile, 74% for domestic routes in Peru, 56% for domestic routes in Argentina, 56% for domestic routes in Ecuador and 51% in Colombia. We are planning to implement six kiosks at Miami and one at Easter Island. Also in 2010 we launched our LAN.com Mobile service, enabling our customers to check-in, verify their flight status and other itineraries using their internet-enabled mobile phones.
In 2010 LAN was recognized as the “Latin American e-commerce Company of the Year” by the Latin American e-Commerce Institute and in 2012 LAN was awarded with the “Best of the Web” price by the American company Compuware. Also, in 2013 LAN.com received “Electronic Commerce Leader in Tourism” by the e-Commerce Awards for Chile and Ecuador.
Electronic Ticketing
Since 2008, the Company has issued all tickets as reached a 100% penetration of e-tickets on all LAN routes and, during 2010 we completed the implementation of interline e-ticketing with all of ouroneworld® partners. By the end of 2013, we introduced electronic boarding passes accessible on smartphones. This electronic boarding pass is read by a laser pistol using a QR (quick response) code. It has been working on some routes at South America, and we hope to have 100% availibility of this feature during 2014.
Advertising and Promotional Activities
Our advertisement and promotional efforts are aimed at enhancing our brand positioning and supporting specific aspects of our commercial efforts. These activities include the use of television, print, outdoors and radio advertisements as well as direct and online marketing. We also have a growing social media presence.
During 2013, our advertising campaigns were mainly focused on continuing stimulating demand by implementing a pricing strategy that has made flying more accessible in the domestic markets and within South America to those traveling especially for tourism. We are proud of our partnerships with tour operators and tourism government agencies across the region (SERNATUR and “Chile es Tuyo” in Chile, PROMPERU in Peru, ProExport Colombia among others) which allowed us to reach new customers and to promote local and regional tourism in the markets where we operate. This is supported by the unique coverage and travel experience that we offer to those passengers traveling to, from and within South America.
We have also innovated our demand-generating advertising by promoting pre-low season specials thus making our demand curves more stable and making it possible for us to offer to our customers all our destinations at accessible prices throughout the year.
TAM’s Passenger Marketing and Sales
Within the “TAM” brand, TAM segregates its marketing strategies between domestic (short-haul) and international (long-haul).
Our long-haul strategy focuses on attributes valued by this type of client, with a number of initiatives focusing on in-flight services, which is where passengers get most of their travel experience and where high quality and comfort are the key differentials. We also view TAM’s large network as a significant differential, since TAM is the Brazilian airline with the largest international operation, offering broad coverage in South America, to Europe and the United States, as well as other international destinations through code-share agreements and alliances with other airlines.
In 2013, we started to implement initiatives in order to capture the synergies we expect, and to better align the international passengers’ travel experience for LAN and TAM.
The initiatives of synergy capture in the long haul business, include, for example, the joint purchase of in-flight entertainment, which made product standardization, content increase and savings possible, as a result, generate incremental revenue and customer retention.
During 2016, we announced our revamped frequent flyer programs named LATAM Pass and LATAM Fidelidade. This change is part of the process of consolidating the airline group’s new brand identity (LATAM) and the evolution of the programs, which enhances existing benefits and introduces new benefits for program members.
We continued working on the homologation of our higher purchasing power. Synergies in the onboard service, both in the shortprograms’ features and long haul operations, were also captured as a result of an alignment in terms of the meals served in business and economy classes for LAN and TAM. This process included negotiations with suppliers, which resulted in better quality and savings.
As for the alignment of the travel experience, the main objective was the introduction of a service protocol, which includes the standardization of procedures for check-in and boarding, among others.
To strengthen TAM’s brand positioning, we invest in improvingbenefits. Among other improvements, our cabins and services, and constantly monitor our corporate image through quantitative and qualitative surveys. For example, we have implemented a new quality management dynamic in TAM, which includes service panels and passenger satisfaction surveys, among others. The new dynamic includes standardized Key Performance Indicators (KPIs) for TAM and LAN.
TAM short-haul operations follow international standards and meet certain client needs specific to such shorter routes, whichinitiatives include point-to-point frequency and operating efficiency. TAM operates two cabins (Business and Coach), maintaining the service standard by type of aircraft (narrow and wide body). Moreover, these routes are invaluable for frequent fliers since they enable the use of TAM Fidelidade membership points with no seat restrictions.
TAM operates Airbus A319, A320 and A321 aircraft depending on demand and infrastructure restrictions. In 2010, we started the “brand elasticity” project, making air travel even more accessible through special fares for flights planned well in advance, with the focus on the tourism/leisure market, while continuing to service the important corporate market. With this project, we achieved a high rate of migration from road to air transport and an increasingly higher number of passengers that were flying for the first time.
TAM constantly focuses on delivering services and items valued by consumers to maintain client satisfaction and retention levels high. For this, we conduct various perception studies (such as NPS, brand funnel) and segmentation studies (Conjoint) to monitor and roll out action plans. As a result, in 2012 we redesigned our domestic fare profiles, making them simple and transparent for passengers, while clearly highlighting the benefits of each profile and the upsell value between bundles. Thus, passengers interested only in price have the option of more attractive fares, while those seeking additional benefits such as TAM Fidelidade membership points, priority services (baggage, check-in and boarding) and baggage allowance may access these services through a fixed preset amount. Passengers know how much they pay for additional benefits.
TAM has also implemented projects to generate additional revenues, targeting items that passengers prioritize, such as more leg room (Espaço Mais) and pre-purchase of excess baggage, among others, offered through convenient online services. During 2013, incross-level recognition of some initiativesall members, for example, by allowing LATAM Pass members to upgrade on TAM flights and goals achieved, TAM Airlines was awarded the second placeand LATAM Fidelidade members to upgrade on LAN flights, in the category “Best airlines in South America” from Skytrax, only after LAN. In addition TAM received awards such as: most reliable airline brand in the Brazilian market, according to a Survey of trustmarks, carried out by the “Seleções e pelo Ibope Inteligência” magazine; Top of mind according to Data Folha and Grupo Folha in the category “Airlines/ Transport”; Top of mind internet, according to Data Folha; and Most admired companies in the category “Airlines” in the subsector “Corporate Services” organized by the Carta Capital magazine, an important political, economic and cultural Brazilian vehicle. Additionally, TAM classified as the fifth most attractive airlines in the world in the social networks during the fourth quarter of year 2012, according to SocialBakers.
Branding
In 2008, TAM launched the strategic platform for a single brand, with TAM being the main brand that, through values, strategic positioning and language, guides other brands, services and business units, such as TAM Airlines, TAM Cargo, TAM Viagens, TAM Fidelidade, TAM nas Nuvens and others. Thus, we generate synergies among our businesses, always guided byhaving the same values andservices at the commitment to quality and relationship with our stakeholders.airport.
During 2013, the frequent flyer program TAM Fidelidade completed 20 years of operation. To celebrate this date, we developed a big campaign in the social networks, where we were able to capture pictures from our clients, which we will then display in two aircraft from our fleet.
We also launched the “A gente faz um mundo por você” campaign, where we reinforced TAM’s focus on service. In line with this vision, our mission is to be the preferred airline of people, with joy, creativity, respect2017 LATAM Pass and responsibility.
Based on this strategic brand positioning, TAM seeks to offer accessibility to all of those who value an efficient, rewarding, safe and hassle-free experience. Whatever may be the need – whether business or leisure travel—we have created products and services that meet these needs.
Distribution Channels
TAM is constantly developing new sales channels to serve our clients, who can rely on the indirect sales channels, represented by travel agents and online travel agencies (OTA), as well as on the direct channel, through TAM.com, our call center, airport ticket offices (ATO), city ticket offices (CTO) and smart business. TAM’s call center is available 24 hours a day. We also sell tickets through our chain of stores located in the main cities of Brazil and in each airport where we operate. In addition, we significantly expanded the TAM Viagens store chain through franchises in the main cities across Brazil.
TAM was the first airline in Latin America to sell tickets online. Through TAM’s website, www.tam.com.br, users can purchase tickets online by paying or using TAM Fidelidade membership points, make reservations up to one hour prior to departure and access information related to the TAM Fidelidade program and the services available. TAM’s website is not incorporated by reference herein and shall not be considered part of this annual report.
In 2013, the indirect sales channels accounted for approximately 63% of total sales and 54% of tickets issued. One of our main challenges was to increase internet sales, which accounted for approximately 36% of total sales in the year. In terms of tickets issued, direct channels accounted for approximately 45% of all tickets, increasing substantially over the previous year.
TAM also recorded an increase of 46% in the utilization of self check-in kiosks during 2013 as compared to 2012. The average utilization for 2013 was 36%.
TAM plans to increase segmented direct sales in the leisure market and to make the booking of tickets, especially over the Internet, easier for our passengers. In 2013, we consolidated the sale of seats with increased leg room (Espaço Mais) within TAM’s e-commerce sales process and through the call center, facilitating access to this service and increasing direct sales.
During 2013, TAM launched a new service tool, with a virtual operator called Julia who is available in TAM’s site www.tam.com.br to assist passengers when needed. In addition, TAM began a check-in servisse that may be done by cellphone for flights departing from São Paulo to destinations in South America and Europe, and for flights departing from United Stated to Brazil.
Advertising and Promotional Activities
Our promotional and communications efforts are aimed at strengthening the brand positioning and providing support to specific commercial needs. These activities include initiatives in communication channels such as television, press, billboards and radio, as well as direct and online marketing.
During 2013, in order to reinforce the campaign “A gente faz um mundo por você”, we developed a promotional initiative in partnership with Coca-Cola and we materialized the Christmas dream of three Brazilian families, in the cities of Sao Paulo and Rio de Janeiro.
In addition, we launched a search tool for airline tickets in the home page of the UOL, the main internet Brazilian portal. This initiative aims to facilitate the search for tickets and to strengthen the presence of TAM’s brand.
Frequent Flyer Program
During 2013, LATAM continued to harmonize the LAN and TAM frequent flyers programs. Each program currently operates under its own brand and regulations, however, during 2013, changes were made to both programs in order to reduce key differences and to offer its members similar features and benefits, including the creation of new tiers in both programs, harmonizing qualification criteria for top tiers, and creating new benefits in order to offer all members better value. During 2014 LANPASS and TAM Fidelidade will continue with their programs rationalizationharmonization efforts and offeringwill offer new cross benefits for their top tier members.
LANPASSLATAM Pass
LANPASS, LAN, frequent Flyer Program, is a key element of the LAN’s marketing and loyalty strategy. The objective of LANPASS is to reward customer´s loyalty, and as a consequence, LANPASS generates incremental revenue and customer retention. Worldwide, asAs of December 30, 2013, LANPASS31, 2016, LATAM Pass had approximately 8.513 million members.members, an increase of 17% compared to 2015.
LANPASSLATAM Pass members earn LANPASSLATAM Pass kilometers in their accounts based on distance flown, and class of ticket purchased orand their status level, as well as by usingpurchasing the services of other partners in the LANPASSthe LATAM Pass program. Customers can redeem kilometers for free tickets oras well as for other products in an online catalogue. Under our current frequent flyer program, our passengers are grouped into one standard level and four different elite levels based on each passenger’stheir flying behavior.behavior: Gold, Platinum, Black and Black Signature. These different groups determine which benefits customers are eligible to receive, such asincluding kilometers earnings bonuses, free upgrades on a space-available basis, VIP lounge access, and preferred boarding andcheck-in. These categories have their equivalent in theoneworld® alliance: Ruby for Gold, Sapphire for Platinum, and Emerald for both Black and Black Signature.
In 2013 LANPASS2016 LATAM Pass had an increaseincreases of 22.0% in kilometers redeemed and 32.0%32 % in award tickets redeemed, by LANPASS’ membersand 9% in 2012.
LANPASSnon-flight products redeemed. LATAM Pass has highly rated partners, including other airlines, hotels, car rental agencies, retailers, and credit card issuers from the main financial institutions in Chile, Peru, Ecuador, Argentina, Uruguay, the United States and Colombia, withincluding Banco Santander in Chile and Banco de Bogotá and Occidente both(both members of Grupo Aval.Aval) in Colombia. These partnershipscommercial agreements give our customers the opportunity to earn additional kilometers for using their services.
In the non bankingnon-banking segment, LANPASSLATAM Pass continues to leverage its member’smembers’ purchase behavior to partner with leading players in theits markets and become the most attractive loyalty program in the home markets.program. In the pastrecent years, LANPASSLATAM Pass has enteredexpanded into new industries, such as retail, supermarkets, automotive, real estate, drugstores and health care centers. As an active member of theoneworld® alliance, we have reciprocal frequent-flyer agreements with alloneworld® carriers. In addition to this, we have reciprocal agreements with other carriers, such as Alaska Airlines and Aeromexico. These agreements allow LANPASS members to accrue and redeem LANPASS kilometers on flights operated by these other carriers.
The LANPASS frequent flyer program aims to be the leading loyalty program in all of LAN’s home markets. In the past couple offew years, we have implemented a number of marketing initiatives to increase customer’scustomer engagement and activity with the program in all theof its markets. In 2013,2016, membership in LANPASSLATAM Pass continued growing, at 18%expanding by 10% in Chile, 22%14% in Perú, 38% in Argentina, 6% in ArgentinaEcuador, 14% in Colombia and 35%6% in Ecuador.the United States.
TAMLATAM Fidelidade Program
TAM’s frequent flyer program, also called TAMLATAM Fidelidade was the first loyalty program launched by a Brazilian airline and represents a key element in TAM’sof LATAM’s marketing strategy. LATAM believes TAMLATAM Fidelidade, like LATAM Pass, is one of the most flexible loyalty programs in the market because it imposes no restrictions on flightsflight availability or on the number of seats available when members are redeemingredeem accumulated points. TAMLATAM Fidelidade currently has more than 12.213.2 million members, and approximately 26 million redeemed tickets have been distributed since its creation in 1993. Points earned by TAMwhich represents an increase of 14% compared to 2015. Members of LATAM Fidelidade, members must be redeemed for tickets within two years.
TAM Fidelidade customers are classified in five different categories (Branco, Azul, Vermelho, Vermelho Plus (launched in 2013) and Black) and qualification for a particular category is based on frequencylike those of flights. The rate at which points accumulate varies depending on membership tier. The Branco card is the base level of membership and cardholders accrue points each time they fly. Azul, Vermelho, Vermelho Plus cardholdersLATAM Pass, receive progressively greater benefits and increased points for miles flown;kilometers flown depending on their elite level, allowing the holdersthem to accrue redeemable points for free travel more quickly. Black members have additional benefits and conveniences for our most frequent flyers, such as access to a dedicated customer service group to help meet all of their needs.
TAM joined theoneworld® alliance on March 31, 2014 and TAMLATAM Fidelidade customers are able to accrue pointsclassified in the same four elite levels as LATAM Pass: Gold, Platinum, Black and redeem flights ononeworld® carrier flights.Black Signature.
Points earned by TAM Fidelidade members must be redeemed for tickets within two years. This two year period for redemption limits the growth in liabilities arising from
Multiplus assuming a stable trend in relation to the number of passengers we carry.
Multiplus
In 2009, TAM launched Multiplus, a company designed to create a broader network in which TAM’sLATAM Airlines Brazil’s customers can earn points through the TAMLATAM Fidelidade Program.program. Multiplus is a coalition of loyalty programs that permits the accrual of points that can be redeemed for redemption from products and services offered by many different partner companies, not just ours.in addition to LATAM Airlines Brazil. We believe this expanded network helpsacts as a sales channel for LATAM Airlines Brazil, helping to capture and retain customers and increase sales. ItMultiplus is attractive to our less frequentless-frequent flyers because it allows them to accrue loyalty points in many ways besides flying. In 2016,non-air accrual reached 15% of the total points. At the end of 2013,2016, Multiplus had 472more than 400 partners and approximately 16.5 million participants that can accrue Multiplus points directly (through LATAM Fidelidade,co-branded cards, apps, retail partners, etc.) and indirectly (by transferring points from a partner establishments, including the TAM Fidelidade Program.program).
Multiplus isbecame a publicly traded company in Brazil andfollowing its initial public offering in February 2010. TAM owns 73%S.A continues to own 72.74% of the ordinary shares of Multiplus. We believe
On December 10, 2009, Multiplus is a source of value generation and after its initial public offering,
The company strengthened its corporate governance, dedicating a team that, we believe, will improve sales even more. TAM Linhas Aereas and Multiplus recently entered into an amendmentOperating Agreement with LATAM Airlines Brazil, effective as of their operating agreement,January 1, 2010, which governsestablished the terms and conditions governing the relationship with TLA (the “Operating Agreement”). Under the Operating Agreement, Multiplus became responsible for, among other tasks, processing information on accumulating and redeeming points under the LATAM Airlines Brazil Loyalty Program, and delivering awards to the members of said program, in accordance with the rules of the TAM Loyalty Program and the Multiplus network. The Operating Agreement is valid for 15 years and is automatically renewed every five years thereafter.
Aiming to increase the value created to Multiplus and LATAM shareholders, and to improve the alignment of interests between Multiplus and TLA, on May 4, 2015, the two companies andapproved a new amendment to the Operating Agreement, effective on that date. This amendment provides that the cost for each 10,000 points redeemed on TLA air tickets shall be approximately 3% less than Multiplus’s current prices paid for those 10,000 points. Furthermore, the amendment establishes that from December 1, 2015, fixed prices for air tickets will come into force with objective rules for annual price adjustments for the purchase of airlineair tickets, paid by Multiplus to be usedTLA. The fixed prices of each are determined by both companies as a function of the market (domestic and international), fare class, demand, season, distance and flight origin/destination.
The remaining provisions established in the original Operating Agreement, including, without limitation, those relating to reciprocal exclusivity, term of effectiveness and situations for redemptionstermination with or without cause, remain, in their essence, unchanged.
On December 14, 2015, Multiplus’ Board of Directors approved a management proposal for the establishment of a limited liability company, with the name of “Multiplus Corretora de Seguros Ltda.”, for the purpose of developing an insurance brokerage business. This project is in line with Multiplus’ main objectives of providing a differentiated experience for its participants, offering a new source for accrual of points and generating value to its shareholders.
On July 5, 2016, Multiplus S.A. and Banco Itaucard S/A (“Itaucard”) signed a Commercial Partnership Contract for the offering, promotion, distribution and sale ofco-branded credit cards (“Multiplus cards”), throughout Brazil’s national territory. The partnership’s key objective is to offer its network members a product which permits the direct accumulation of Multiplus points. The new amendment, effective June 1, 2013, setsPoints by means of conversion and differentiated bonuses.
On July 12, 2016, Multiplus S.A. signed a fixed value for each 10,000partnership with the Expedia Affiliate Network, making 270,000 hotel options available to members, allowing them to accumulate Multiplus points redeemed for TAM tickets duringwhen making their reservations.
On August 25, 2016, “Multiplus Corretora de Seguros Ltda.” started operations as “Pontus Corretora”. Pontus Corretora debuted with two types of insurance policies offered with different partners: residential insurance, in partnership with Seguradora Porto Seguro, and travel insurance through Assist Card. Pontus Corretora offers a 12 month pricing assessment phase. At the end of the pricing assessment phase, the price of tickets will be set by reference to the then available public fare for flightstotally original digital experience, with flexibility, innovation and excellent products from the same originmain insurance companies in the market.
On December 27, 2016, Multiplus announced that it is expanding its “Points + Cash” offering to allow the same destinationredemption of points fornon-air products and services. This allows members who do not have sufficient accumulated points to redeem with network partners totop-up their points with a cash payment. The objective is to ensure the same durationavailability of attractive offers for all ’Multiplus members, with constant incentives for them to increasingly use and flight travel plan, less an agreed discount. This discounted price will also be subject to a maximum and minimum range, calculated with reference to a 5% cost variation (increase and decrease) fromexperience the fixed price per 10,000 points applicable during the assessment phase.loyalty network.
Cargo Operations
The following table sets forth certain ofOur Cargo division operates internationally and domestically through our cargo operating statistics for domestic and international routes foraffiliates under the periods indicated:
| Year ended and as at December 31, | ||||||||||||
| LATAM 2013 (actual) | LATAM 2012 (pro forma)(1) | LAN 2011 (actual) | ||||||||||
ATKs (millions) | 7,651.9 | 7,645.9 | 5,192.7 | |||||||||
RTKs (millions) | 4,446.7 | 4,488.3 | 3,612.4 | |||||||||
Weight of cargo carried (thousands of tons) | 1,170.9 | 1,154.0 | 874.9 | |||||||||
Total cargo yield (cargo revenues/RTKs, in US cents) | 41.7 | 43.2 | 43.6 | |||||||||
Total cargo load factor (%) | 58.4 | % | 58.7 | % | 69.6 | % | ||||||
unified LATAM Cargo brand, which has acquired significant market recognition. Our cargo business generally operates on the same route network used by our passenger airline business. It includes approximately 145138 destinations, of which approximately 136around 127 are served by passenger and/or freighter aircraft and approximately 911 are served only by freighter aircraft.
The following table sets forth certain of our cargo-operating statistics for domestic and international routes for the periods indicated:
| Year ended and as at December 31, | ||||||||||||
| 2016 | 2015 | 2014 | ||||||||||
ATKs (millions) | 6,704.1 | 7,082.8 | 7,219.7 | |||||||||
RTKs (millions) | 3,465.9 | 3,797.0 | 4,317.2 | |||||||||
Weight of cargo carried (thousands of tons) | 944.3 | 1,008.7 | 1,102.2 | |||||||||
Total cargo yield (cargo revenues/RTKs, in U.S. cents) | 32.0 | 35.0 | 39.7 | |||||||||
Total cargo load factor (%) | 51.7 | % | 53.6 | % | 59.8 | % | ||||||
We derive our revenues roughly equally between the transport of cargo as follows:
1)In the belliesBellies of our passenger aircraft. We consider our passenger network to be a key competitive advantage due to the synergies between passenger and cargo operations and, accordingly, we have developed a strategy to increase our competitiveness by enhancing our belly offering. Additionally we may purchase belly space from other airlines pursuant to interline agreements.
2)In our own dedicatedDedicated freighter fleet. As of December 31, 2013,2016, our dedicated freighter fleet under operation consisted of 12eight Boeing767-300 freighters, each with a capacity for 5458 structural tons of freight each, and fourtwo Boeing777-200 freighters, each with a capacity of 104102 structural tons of freight each. At the end of 2013,freight. In 2016 we began the processcontinued our freighter fleet optimization efforts, subleasing three B767-300F aircraft and one B777-200F to redeliver one B767-300 freighter that was leased from a third party (reclassified from property, plant and equipment to held for sale as of December 31, 2016). Our freighter fleet program has two main focus areas: first, to support the group’s belly business, improving its load factor by feeding cargo into our passenger routes, and second, to provide our customers flexibility in scheduling and destinations. With these two objectives in mind, we are complementing and enhancing our network. In Latin America, the principal origins of our cargo are Chile, Colombia, Perú, Ecuador, Brazil and Argentina, which we expect should be complete duringrepresent a large part of our northbound traffic. This demand is mainly concentrated on a small number of product categories, such as exports of fish, sea products and fruits from Chile, asparagus from Peru, and exports of fresh flowers from Ecuador and Colombia.
For our southbound flights, Brazil is the first quarter 2014. Furthermore, from time to time as warranted by market conditions, we may charter or lease aircraft pursuant to ACMI contracts (Aircraft, Crew, Maintenancemain import market. Southbound demand is mainly concentrated on a small number of product categories including high-tech equipment, electronics, auto parts and Insurance). Under the latter, which are also known as “wet-leases,” the lessor operates the aircraft and provides the aircraft, crew, maintenance and insurance pursuant to short—and medium-term contracts.pharmaceuticals.
Prior to the combination of LAN and TAM, we complemented our international cargo operations with domestic cargo services through subsidiaries and affiliates. In August 2012, Aerolinhas Brasileiras S.A. (“ABSA”), LANs Brazilian cargo affiliate, and the cargo unit of TAM began the integration of their respective operations. Following the integration, the combined cargo businesses now operate in Brazil under the brand “TAM Cargo” and are operated by ABSA. We expect to leverage the TAM Cargo brand, which has significant recognition in Brazil, to increase our presence in this market.
Our internationallargest domestic cargo operations are headquartered in Miami. This geographical location isBrazil, where LATAM Cargo remains the market leader there, carrying cargo for a natural gateway for Latin American importsvariety of customers, including other international air carriers, freight-forwarding companies, export-oriented companies and exportsindividual consumers. In order to maintain its leadership, LATAM Cargo continues to invest in infrastructure, service and from the United States. We have operatedsecurity in our 397,000 square-foot facilities within the Miami International Airport since 2001. In 2010 we upgraded this facility to enhance our ability to handle perishables and we leased an additional 114,000 square-foot warehouse close to our main facilities. Furthermore, during 2013, LAN Cargo signed a contract with Miami Dade county lease 66,000 square-feet to build a maintenance hangar with capacity to service a Boeing 777-200 freighter.key cargo terminals.
The United States accounts for the majority of the cargo traffic to and from Latin America. Besides being the main market for Latin American exports by air, the United States is also the main supplier of goods such as high-tech equipment or spare parts, transported by air to Latin American countries.
We operate to six destinations in Europe: Amsterdam, Frankfurt, London, Madrid, Milan and Paris. The last five we serve via passenger aircraft (with flights from Santiago, Lima, Guayaquil, Sao Paulo and/or Rio de Janeiro, depending on the destination), and we serve Amsterdam through freighter operations. Additionally, we also serve Frankfurt via our passenger flights and freighter operations conducted via our block space agreement with Lufthansa Cargo. For more information, see “—Cargo Agreements” below.
In Latin America, the principal origins of our cargo are Chile, Colombia, Perú, Ecuador, Brazil and Argentina, which represent a large part of our northbound traffic. For our southbound flights, Brazil is the main import market. In Brazil, we carry cargo for a variety of customers, including other international air carriers, freight-forwarding companies, export oriented companies and individual consumers. Colombia is Latin America’s largest market for exports by air to the United States, reaching an estimated 195,000 tons annually
The evolution ofhave thus headquartered our international cargo operations has always been affected byin Miami. This geographical location is a natural gateway between Latin America and the flow imbalances of theUnited States. We also transport cargo to and from eight destinations in Europe: London, Madrid, Milan, Paris, Barcelona, Frankfurt, Amsterdam and Basel. The first six are served via passenger aircraft, and we also serve Amsterdam, Frankfurt and Basel through freighter operations. In October 2016 LATAM Cargo added a new operation to its belly network: Sao Paulo, Brazil – Johannesburg, South Africa, opening a gateway between Latin American markets and the African continent.
During 2016, cargo markets,traffic decreased 8.7%, mainly due to a strong decline in Brazilian imports resulting from economic weakness and currency depreciation in Brazil. However, Latin American exports remain at healthy levels, despite a dramatic shiftcontraction in the relative weightproduction of southbound and northbound cargo flows throughout the years. We have designed our operations, route network and commercial strategies with the flexibility required to respond to changing conditions.fresh salmon in Chile.
The flexibility that thiscargo business model allows was key to LAN Cargo’s operations in 2007 when LAN Cargo saw a sharp drop in salmon exports from Chile as a result of an outbreak of the ISA virus. It also proved beneficial in 2009 when the business was affected by the contraction of import markets in response to the global economic crisis, and from 2010 to 2012 during the recovery of cargo markets. More recently it has been a key element that has allowed LATAM to weather highly competitive market conditions.
The sharp contraction of LATAM’s traditional markets in 2009—imports into the region and exports from the region – followed by the rapid recovery of demand in 2010 required the Company to fully lever the flexibility of its business model. During 2009 the Company implemented a series of measures such as the adjustment of its capacity through a reduction in the number of planes rented under Aircraft, Crew, Maintenance & Insurance (“ACMI”) agreements and adjustments in the operations of its own cargo fleet of Boeing 767F freighters. This process has also been reinforced by the incorporation of four new Boeing 777-200F, the most modern and efficient cargo aircraft of their type in the world, with range of 9,045 kilometers when carrying its maximum payload. This significant investment allowed LATAM to consolidate its regional competitiveness by positioning it as the first airline in the region and only the second internationally, to use these latest-generation cargo planes.
During 2013, cargo traffic decreased 0.8%, reflecting a challenging scenario in Latin American cargo markets due to a decline in demand on routes from USA to Latin America, especially Brazil and Argentina, which was partially offset by better demand on routes from Europe to Latin America and from Latin America to USA, as well as increasedis highly competitive, pressures from regional and international cargo carriers.
Because of the difficult environment for cargo operations around the world during 2013, competition increased in the region as international and regional carriers added idleoften have spare capacity to servicein their cargo operations. Despite this, increase in competition, we have been able to maintain solid market shares bythrough an efficient utilization of our fleet and network. Today, on Latin America-United States routes, our main competitors are Centurion, AVIANCAAvianca Cargo, Atlas Air and American Airlines. On the Latin American-EuropeAmerica-Europe routes, our main competitors are Cargolux, Lufthansa Cargo, Martinair and Emirates Airlines.
Cargo Agreements
Since 2002, LAN Cargo and Lufthansa Cargo have operated pursuant to a block space agreement covering Europe and Latin America. As part of this agreement, we allocate space to Lufthansa Cargo on our flights between selected cities in Latin America and Europe, and Lufthansa Cargo allocates space to us on its flights between Europe and Brazil.
We also have interline, codeshare and other commercial agreements with Asian carriers such as Korean Airlines, JAL, China Airlines, Air China and Cathay Pacific through which we receive space allocations to move our cargo from Seoul, Tokyo, Taipei, Shanghai, Beijing and Hong Kong to hubs in the United States—Los Angeles, New York, Miami and also in Europe—where we can connect with our cargo network. In exchange, we provide these airlines with space from these same hubs in the United States and Europe to all Latin American destinations and also provide them with westbound cargo.
Marketing and Sales
Our cargo sales and marketing efforts are carried out directly in cities where we have a local office, or through general sales agents. In total, we have over 30 international offices. In Latin America, we have our own offices in all key markets, adding during 2013 a new office in Paraguay.markets. In the United States, we have offices in Miami, New York and Los Angeles, and work with representatives in various other cities. In Europe, we have offices in Frankfurt, Amsterdam, Madrid and Paris (opened in 2013) and use agents in other key cities. In Asia all our sales efforts are conducted through general sales agents. In total, we maintain a network of more than thirty30 independent cargo sales agencies domestically and internationally.
Our cargo marketing strategy emphasizes ourthe combination of our unique freighter and passenger aircraft cargo capacity,network, which offers a wide variety of reliable cargo routing possibilities with different pricing options; strong connectivity to, from and within Latin America; and a clear focus on providing high-quality service for our clients. Our offering allows our customers to ship large, bulky freight, as well as smaller, high-density cargo, fresh products, express shipments and other types of cargo. Our cargo marketing strategy also emphasizes
During 2016 we focused on various aspects of our high-quality services, scheduling flexibility and punctuality. In particular, during 2013 we renewedvalue chain to improve our focus on service including the formation ofcustomer experience. We developed a new Customer Care team fully dedicatedportfolio of LATAM Cargo products with an innovative proposition aligned to proactively informing clients about any shipment problems that might arisethe needs of customers, allowing us to deliver greater consistency and providing timely solutions.a clear service offering to the market. In line with this, we made progress in transforming the Company’s internal processes to ensure they are aligned with our commitments to clients.
On some routes,Cargo Agreements
During 2016 we offer special, value-added productsmaintained our Enhanced Cargo Transfer Interline and other commercial agreements with Asian carriers such as Positive Flight SpecificAir China, Korean Air and Priority 1, which enables the customerCathay Pacific, among others. Under these agreements, we receive space allocations to choose a specific passenger flight or access first available freighter capacity to transport its goods. During 2010, we launched the first phase of a new revenue management project aimed at optimizing yields, which has resulted in better capacity and overbooking administration and better pricing practices in 2011, 2012 and 2013. During 2012, we started the roll-out (in New York, Miami and Mexico) ofmove our online booking system (e-booking) allowing our customers to make reservations 24/7.
Cargo Related Investigations
In February 2006 the European Commission (“EC”), in conjunction with the Department of Justice of the United States (“DOJ”), initiated a global investigation of a large number of international cargo airlines (among them LAN Cargo) for possible price fixing of cargo fuel surcharges and other fees in the European and United States air cargo markets. On December 26, 2007, the European competition authorities notified LAN Cargo and LATAM of the initiation of proceedings against twenty-five cargo airlines, among them LAN Cargo, for allegations of anti-competitive behavior in the airfreight business.
On January 21, 2009, LAN Cargo announced that it had reached a plea agreement with the DOJ in relation to the DOJ’s ongoing investigation regarding price fixing of fuel surcharges and other fees for cargo shipments. Under the plea agreement, LAN Cargo agreed to pay a fine of US$88 million. In addition, ABSA also reached a plea agreement with the DOJ and agreed to pay a fine of US$21 million. These amounts were stipulated to be paid over a five-year payment schedule starting in 2009. As of March 31, 2014, there were no amounts remaining to be paid.
On November 9, 2010, the EC imposed fines on 11 air carriers for a total amount of €800 million (equivalent to approximately US$1.1 billion). The fine imposed against LAN Cargo and its parent company, LAN, totaled €8.2 million (equivalent to approximately US$10.9 million). The Company provisioned US$25 million during the fourth quarter of 2007 for such fines, and maintained this provision until the fine was imposed in 2010. In 2010, the Company recorded a US$14.1 million gain (pre-tax) from the reversal of a portion of this provision. See “Item 5. Operating and Financial Review and Prospects—A. Operating Results.” This was the lowest fine applied by the EC, which includes a significant reduction duemain gateways in Asia to the Company’s cooperation with the Commission during the course of the investigation. In accordance with European Union law, on January 24, 2011 this administrative decision was appealed by LAN Cargo and LAN to the General Court in Luxembourg. Any judgment by the General Court may also be appealed to the Court of Justice of the European Union.
The investigation by the DOJ prompted the filing of numerous civil class actions by freight forwarding and shipping companies against many airlines, including LAN Cargo and LATAM Airlines Group, including fifty-fourhubs in the United States. The cases filedStates—Los Angeles, New York and Miami—and in Europe, where we can connect with our cargo network. In exchange, we provide these airlines with space from these same hubs in the United States were consolidated in the United States District Court, Eastern Districtand Europe to all of New Yorkour Latin American destinations and the original complaint was subsequently amendedalso provide them with westbound cargo. These agreements have allowed us to include additional airlines, including ABSA. On May 11, 2011, LAN Cargo announced that it had reached a settlement agreement with the class action plaintiffs in relationachieve greater visibility, improved support and allowed us to this litigation. As per the settlement agreement, LAN Cargo agreed to pay US$59.7 million. Furthermore, ABSA also reached a settlement agreement with class action plaintiffsprovide better service recovery, further expanding our network between Latin America and agreed to pay US$6.3 million. The amounts were paid to plaintiffs’ counsel escrow account in 2011. DHL, a former member of the civil class action plaintiffs, timely opted out of the settlements agreement. LAN Cargo reached a settlement agreement with StarBroker A.G., on behalf of DHL Global Forwarding, whereby LAN Cargo agreed to pay US$8.2 million, of which US$7.1 million was recovered by LAN Cargo from the escrow amount set aside in the class action settlement previously paid by LAN Cargo for opt out plaintiffs.Asia.
The Canadian Competition Bureau (“CCB”), in conjunction with the DOJ, also initiated a global investigation of a large number of international cargo airlines (among them LAN Cargo) for possible price fixing of cargo fuel surcharges and other fees in the Canadian air cargo markets in 2006. On August 20, 2013, LAN Cargo reached a plea agreement with the CCB in relation to the CCB’s ongoing investigation regarding price fixing of fuel surcharges and other fees for cargo shipments. Under the plea agreement, LAN Cargo agreed to pay a fine of US$975,000. The CCB’s investigation prompted the filing of four separate civil class actions by freight forwarding and shipping companies against many airlines, including LAN Cargo and LAN, in Canada. On January 31, 2012, LAN and LAN Cargo approved a settlement agreement with the class actions plaintiffs for an amount of CAD$700,000 (Canadian Dollars).
On April 5, 2008, Brazilian authorities notified ABSA of the initiation of administrative proceedings before theConselho Administrativo de Defesa EconômicaCargo-Related Investigations (CADE) against several cargo airlines and airline officers, among them ABSA, for allegations of anticompetitive practices regarding fuel surcharges in the air cargo business. On September 3, 2013, CADE published its decision to impose a fine of US$51,020,000 against ABSA. CADE also imposed fines upon a former Director and two former employees in the amounts of US$1,020,000 and US$510,000 respectively. On December 5, 2013 ABSA filed its application for Administrative Reconsideration before CADE which remains pending. ABSA will also have the right to appeal the final decision of CADE before Judge in a formal judicial proceeding. Given the current stage of the proceedings, it is not possible at this time to anticipate with any precision the outcome of this matter, although it is expected to be a lengthy process.
See “Item 8. Financial Information—A. Consolidated Financial Statements and Other Financial Information—Legal and Arbitration Proceedings.”
Fleet
General
As of December 31, 2013,2016, we operated a fleet of 339329 aircraft, comprised of 323319 passenger aircraft and 1610 cargo aircraft. Additionally, we subleased four cargo aircraft as set forthto third parties (one of them not included in the following chart:table below as it was reclassified from property plant and equipment held for sale).
| Number of aircraft in operation | Average term of lease remaining (years) | Average age (years) | ||||||||||||||||||
| Total | Owned(1) | Operating Lease | ||||||||||||||||||
Passenger aircraft(2) | ||||||||||||||||||||
Airbus A320 Family Aircraft(3) | ||||||||||||||||||||
Airbus A318-100(4) | — | — | — | — | — | |||||||||||||||
Airbus A319-100 | 54 | 39 | 15 | 5.1 | 7.0 | |||||||||||||||
Airbus A320-200 | 160 | 95 | 65 | 3.6 | 6.1 | |||||||||||||||
Airbus A321-200 | 10 | 9 | 1 | 9.3 | 4.2 | |||||||||||||||
Airbus A340 Family Aircraft | ||||||||||||||||||||
Airbus A340-300(5) | 4 | 0 | 4 | 1.0 | 12.7 | |||||||||||||||
Airbus A340-500(6) | 2 | 2 | 0 | 0.0 | 9.5 | |||||||||||||||
Airbus A330-200 | 20 | 8 | 12 | 2.4 | 8.7 | |||||||||||||||
Boeing Aircraft | ||||||||||||||||||||
Boeing 737-700 | 5 | 0 | 5 | 0.4 | 11.8 | |||||||||||||||
Boeing 767-700(7) | 43 | 37 | 6 | 1.5 | 7.4 | |||||||||||||||
Boeing B787-816 | 5 | 3 | 2 | 11.8 | 0.9 | |||||||||||||||
Boeing B777-32WER | 10 | 8 | 2 | 4.6 | 2.7 | |||||||||||||||
Dash Aircraft | ||||||||||||||||||||
Dash 8-200 | 7 | 0 | 7 | 1.9 | 16.2 | |||||||||||||||
Dash 8-400 | 3 | 0 | 3 | 6.6 | 7.6 | |||||||||||||||
Total passenger aircraft | 323 | 201 | 122 | 3.4 | 6.9 | |||||||||||||||
|
|
|
|
|
|
|
|
|
| |||||||||||
Cargo aircraft | ||||||||||||||||||||
Boeing 767-300 Freighter(7) | 12 | 8 | 4 | 2.2 | 10.2 | |||||||||||||||
Boeing 777-200 Freighter(8) | 4 | 2 | 2 | 3.4 | 3.0 | |||||||||||||||
Total cargo aircraft | 16 | 10 | 6 | 2.6 | 8.4 | |||||||||||||||
|
|
|
|
|
|
|
|
|
| |||||||||||
Total fleet(2) | 339 | 211 | 128 | 3.4 | 6.8 | |||||||||||||||
|
|
|
|
|
|
|
|
|
| |||||||||||
| Number of aircraft in operation | ||||||||||||||||||||
| Total | Owned(1) | Operating Lease | Average term of lease remaining (years) | Average age (years) | ||||||||||||||||
Passenger aircraft(2) | ||||||||||||||||||||
Airbus A320-Family Aircraft | ||||||||||||||||||||
AirbusA319-100 | 48 | 36 | 12 | 3.4 | 9.2 | |||||||||||||||
AirbusA320-200 | 146 | 93 | 53 | 2.6 | 8.6 | |||||||||||||||
AirbusA321-200 | 47 | 30 | 17 | 9.3 | 2.7 | |||||||||||||||
Airbus A320-200neo | 2 | 1 | 1 | 9.7 | 0.2 | |||||||||||||||
Airbus A350-Family Aircraft | ||||||||||||||||||||
AirbusA350-900 | 7 | 5 | 2 | 11.8 | 0.5 | |||||||||||||||
Boeing Aircraft Boeing767-300ER Boeing787-8 Boeing787-9 Boeing 777-300ER Total passenger aircraft Cargo aircraft Boeing767-300 Freighter(3) Boeing777-200 Freighter(4) Total cargo aircraft Total fleet 37 34 3 2.6 8.5 10 6 4 9.2 3.1 12 4 8 10.8 1.2 10 4 6 2.1 5.7 319 213 106 4.8 7.0 11 8 3 2.0 13.1 2 2 0.4 7.6 13 8 5 1.4 12.2 332 221 111 4.7 7.2
| (1) | Aircraft included within property, plant and equipment. |
| (2) | All passenger aircraft bellies are available for cargo. |
| (3) |
| (4) |
The daily average hourly utilization rates of LAN’sLATAM’s aircraft for each of the periods indicated are set forth below.below, in hours per day.
| Year ended December 31, | ||||||||||||
| 2013 | 2012(1) | 2011 | ||||||||||
| (measured in hours) | ||||||||||||
Passenger aircraft | ||||||||||||
Airbus A340-300 | 8.2 | 13.9 | 14.2 | |||||||||
Boeing 767-300 ER | 10.6 | 12.1 | 12.8 | |||||||||
Boeing 787 | 5.6 | 3.7 | — | |||||||||
Airbus A320 Family | 9.52 | 10.2 | 9.5 | |||||||||
Cargo aircraft | ||||||||||||
Boeing 767-300 Freighter | 10.0 | 13.5 | 14.8 | |||||||||
Boeing 777-200 Freighter | 10.9 | 14.1 | 14.3 | |||||||||
| 2016 | 2015 | 2014 | ||||||||||
Passenger aircraft | ||||||||||||
Boeing767-300ER | 10.0 | 11.3 | 10.5 | |||||||||
Boeing787-8/9 | 11.0 | 11.7 | 10.5 | |||||||||
Airbus A320-Family | 8.9 | 9.5 | 9.8 | |||||||||
Boeing777-300ER | 11.7 | 12.2 | 12.9 | |||||||||
AirbusA330-200 | 4.4 | 6.2 | 7.0 | |||||||||
AirbusA350-900 | 8.5 | 0.8 | — | |||||||||
Cargo aircraft | ||||||||||||
Boeing767-300 Freighter | 12.1 | 10.9 | 9.5 | |||||||||
Boeing777-200 Freighter | 13.7 | 13.0 | 13.2 | |||||||||
We operate various different aircraft types as we perform variousthat are best suited for our different services, ranging fromwhich include short-haul domestic and regional trips toas well as long-haul trans-continentaltranscontinental flights. We have selected our aircraft based on thetheir ability to effectively and efficiently serve these missions while trying to minimize the number of aircraft families we operate.
For short-haul domestic and regional flights, we principally operate the Airbus A320-Family aircraft and, since 2010, we also operate the Boeing 737-700 aircraft, the Dash 8-200 aircraft, and the Dash 8-Q400 aircraft.Aircraft. The Airbus A320-Family has been incorporated into our fleet pursuant to operating leases or has been purchasedacquired directly from Airbus pursuant to various purchase agreements since 1999. In 2016, we received our first two A320neo,re-engined A320s, which incorporate the latest technologies including new generation engines and Sharklet wing tip devices, resulting in approximately 15% in fuel savings compared with the original A320. LATAM was the first airline in the Americas, and the fifth on the world, to operate the A320neo.
For long-haul passenger and cargo flights, we operate the Airbus A330-200 aircraft, the Airbus A340-300 aircraft, the Airbus A340-500 aircraft, the Boeing767-300 passenger and cargo aircraft, theBoeing787-800 and787-900 aircraft, Boeing 777 passenger and cargo aircraft and since the fourth quarter of 2012, the Boeing B787-816 aircraft. The Boeing 767-300 aircraft’s size and range provides an optimal alternative for most of our long-haulAirbusA350-900 passenger and cargo routes. Additionally, the commonality between the passenger and dedicated cargo versions allows us to leverage the ensuing economies of scale. The Boeing 767-300 aircraft that we currently operate have been incorporated into our fleet pursuant to operating leases or have been purchased directly from Boeing pursuant to various purchase orders since 1997. Our Airbus A340-300 and A340-500 aircraft are also well-suited for long-haul routes, given their range and four-engine configuration.
Duringstarted operations in 2015. LATAM is the first quarter of 2009, we initiatedA350-900 operator in the process of incorporating winglets which are advanced technology devices, in all our passenger and freighter Boeing 767-300 aircraft. Winglets are placed on the wings of an aircraft and have resulted in an approximate 5% reduction in average fuel consumption per year. The total investment in this project is expected to be approximately US$100 million. As of December 2012, 52 aircraft operated by LAN have been modified. We completed the implementation of this project during 2013.
See “Item 5—Operating and Financial Review and Prospects—F. Tabular Disclosure of Contractual Obligations” for a description of our purchase obligations for aircraft, for delivery between 2013 and 2019.Americas.
Fleet Leasing and Financing Arrangements
LATAM’s fleet financing and leasing methodsstructures include borrowing from financial institutions and leasing under financial leases, tax leases, sale-leaseback transactions and pure operating leases. As of December 31, 2013,2016, LATAM had 339332 aircraft, of which 11three were subleased to third parties resulting in redelivery process, totaling 328329 aircraft in operation. Of thesethe aircraft 161in operation, 156 are operated by LAN and 167163 aircraft are operated by TAM.TAM and 10 are operated by LATAM Airlines Cargo.
As of December 31, 2013, LAN’s2016, LATAM’s operating fleet was comprised of 107192 financial leases, 512 tax leases, 44102 operating leases, and 5 unencumbered10 aircraft as loan guarantees.guarantees and 13 unencumbered aircraft. Most of the LAN’sLATAM’s financial and tax leases are structured forwith a 12-year period. LAN12- year initial term. LATAM has 3242 financial aircraft leases supported by the U.S. Export-Import Bank (“EXIM Bank”) and 5785 supported by the European Export Credit Agencies (the “ECAs”). LAN’sLATAM’s operating lease maturities are within a maturityinitially range from 2three to 12 years.
As of December 31, 2013, TAM’s operating fleet included 86 financial leases, 12 tax leases and 69 operating leases. For accounting purposes TAM classifies 9 tax leases as operating leases in the financial statements. TAM has 14 aircraft supported by EXIM Bank and 27 supported by the ECAs. TAM’s operating leases maturities are within a maturity range from 5 to 13 years.
LATAM’s aircraft debt, which is comprised of financial and tax leases, is denominated in USU.S. dollars and typically has quarterly amortization payments. TheBoth the financial leases have a bank as counterparty and the tax leases have a bank and a(or group of banks) as counterparty; however, the tax leases also include third party involved. 69.5% parties. 63.1%of our aircraft debt has a fixed interest rate and the balance has a floating rate debt based on USD LIBOR. During 2013, LATAM refinanced and pre-financed all of its Boeing deliveries for the year with EX-IM guaranteed bonds.
Going forward, LATAM will be the entity that takes delivery and act as the lessee on all related leases of all aircraft for the group. Pursuant to this strategy, all Boeing and Airbus aircraft deliveries during 2013 (8 wide body aircraft and 27 narrow body aircraft) were made to LATAM, and LATAM has the ability to sublease them to other airlines of the group.
In order to reduce TAM’s balance sheet FX exposure to the Brazilian real, LATAM plansas part of the integration plan following the combination with TAM, we have sought to transfer allthe majority of the TAM aircraft under financial leases up to the LATAM level. As of MarchDecember 31, 2014, 102016, we have transferred 51 aircraft were transferred to LATAM, whichincluding 13 transferred during 2016. This program has helped to reduce the exposure byto approximately US$205 million.
During the first quarter of 2014, LATAM entered into a sale-leaseback transaction for 8 B777-300 passenger aircraft for a lease term of approximately 5 years in order to gain more flexibility in the long haul fleet.
1.2 billion equivalent. See “Item 5. Operating and Financial Review and Prospects—B. Liquidity and Capital Resources—Sources of financing” and “Item 5. Operating and Financial Review and Prospects—B. Liquidity and Capital Resources—Capital Expenditures” for a description of expected sources of financing and expected expenditures on aircraft.
See “Item 11—Quantitative and Qualitative Disclosures about Market Risk — Risk of Variation in Foreign Currency Exchange Rates” for a further analysis about the balance sheet FX fluctuation impact
Maintenance
LAN’sLATAM Maintenance
Our heavy maintenance, line maintenance and component shops are equipped and certified to service our entire fleet of Airbus Boeing and BombardierBoeing aircraft. Our maintenance capabilities allow us flexibility in scheduling airframe maintenance, offering us an alternative to third-party maintenance providers.
LANLATAM Line Maintenance
Our Line Maintenance Network (the “Network”) provides a full range of aircraft maintenance services to ensure our fleet operates safely and in compliance with all local and international regulations. We strive to provide the best experience to our passengers, through the highest standards of on time performance and cabin condition.
The Network serves over 190 locations, which are staffed by over 4,000 LATAM maintenance professionals. In 2016, the Network effectively carried out over 2.1 million man hours of preventive and corrective maintenance tasks on the LATAM fleet. We also rely on certified third party services in a few destinations where it is economically convenient, such as in Frankfurt (where we are served by Lufthansa Technik), Milan (served by AirFrance-KLM), and Johannesburg (served by South African Airways).
LATAM Maintenance has used LEAN methodology and developed computerized systems to achieve improved automation and integration processes, offering sustainable and scalable planning, productive and operational processes.We have deployed more than 600 tablets in order to:
| 1) | Provide fast and simplified access to technical documents through a native app called Content Management System (CMS Mobile); |
| 2) | Provide access to our Maintenance System called Maintenix andin-house coordination apps; |
| 3) | Improve our internal communication through message and video call apps; and |
| 4) | Allow use ofin-house developments systems like MaintCraft (allocates man hours resources and Gantt charts to each specific maintenance tasks) and MaintControl (manages the execution of the planned tasks of MaintCraft through a friendly interface, showing all the tasks that each technician has to perform throughout the shift). MaintControl also serves as a platform where the maintenance leaders can monitor their team’s progress and solve problems that arise. |
LATAM Line Maintenance Network has hangar facilities at Comodoro Arturo Merino Benítez International Airport in Santiago, ChileSão Carlos, São Paulo (CGH), Lima, Miami, Buenos Aires (AEP) and Brasilia, among others. These multiple locations improve the flexibility of the Network by allowing the execution of tasks that previously might be restricted because of adverse weather conditions and environmental authority restrictions.
In order to strictly comply with applicable regulations, all of our maintenance operations are among the most extensive in Latin Americasupervised and have been certified according to IOSA standards and as a FAA approved repair station. Our facilities at our Santiago repair station can service the Boeing 787, Boeing 767, Boeing 777, Airbus 340 and Airbus 320 Family Aircraft fleet, as well as designing and manufacturing galleys, structures and composite materials. We also have the capability to retrofit aircraft interiors, including sophisticated in-flight entertainment equipment, and blended winglets in the Boeing 767 fleet. LAN facilities at El Dorado International Airport in Bogotá, Colombia can service the Boeing 737 and the Dash 8-200 fleet.
Our engineering and maintenance division is supervisedaudited by the local DGAC and it is subjected to several recurrent external audits from civil aviation authorities and international entities around the Network, such as DGAC Chile, ANAC Brazil, the FAA,Federal Aviation Administration in the ArgentineAdministración Nacional de Aviación CivilUnited States (“ANAC”FAA”), the BrazilianAgencia Nacional de Aviacao Civil (“ANAC”), the EcuadorianDirección General de Aeronáutica Civil (“DGAC Ecuador”), the PeruvianDirección General de Aeronáutica Civil(“DGAC Peru”), the ColombianUnidad Administrativa Especial de Aeronáutica Civil (the UAEAC), the International Air Transport Association Operational Safety Audit (“IOSA”) (from the International Air Transport Association or “IATA”) and the International Civil Aviation Organization (“ICAO”), in order to strictly comply with applicable regulations.among others. The audits are conducted in connection with each country’s certification procedures and enable us to continue to perform maintenance for the aircraft types registered in the certificating jurisdictions. Our repair station holdsstations hold FAAPart-145 certifications under these approvals.
We also rely on third parties
In addition, to ensure the most qualified personnel as needed for certain maintenance support forsafe, accurate andon-time Line Maintenance, we seek to improve our aircraft and engines, where long term partnerships take place with the following MROs (Maintenance Repair and Overhaul facilities): Lufthansa Technik provides our Airbus A320-Family Aircraft and A340 Aircraft component support. International Aero Engines, CFM International and Pratt & Whitney, provides the A320 Family engine maintenance services. General Electric also provides engine maintenance services for Boeing 767-300 aircraft as well as Air France KLM for the Boeing 777-300F, which also includes components support.
Occasionally, we perform certain maintenance services for other airlines.
Our aircraft maintenance personnel participate intechnicians’ skills through extensive training programs at the jointly operated Lufthansa LANour LATAM Technical Training S.A., locatedCenter and through specific training programs designed and conducted by our partnerships. Our Fleet and Engineering teams participate actively in Santiago, Chile.
LAN continues to benefit from the implementation of LEAN in heavyperiodic airline Fleet Reliability meetings, where we share best industry practices and line maintenance. Heavy maintenance is performed approximately every 12–18 months or a specific amount of actual flight hours as defined by the manufacturer, while line maintenance is performed on a daily basis. Since 2009, we have achieved a reduction of approximately 30% to 40% in the time an aircraft remains at the hangar. Moreover, we achieved a reduction of over 20% in the time for someupdates of the most demanding tasks in line maintenancelatest Line Maintenance trends and over 30% increase on workers’ productivity. Other benefits of LEAN include a reduction of approximately 19% in labor accidents in heavy maintenance areas, a reduction of approximately 80% on delayed deliveries of aircraft from programmed maintenance,top technical issues.
LATAM MRO
Our two MRO (“Maintenance, repair and a considerable improvement on dispatch reliability. Furthermore, LEAN has had important benefits in terms of employee motivation, by establishing clear roles, setting new challenges and rewarding team achievements.
TAM’s Maintenance
In 2013 we started the process of integrating TAM MRO capabilities and processes with LAN Heavy Maintenance capabilities and Heavy Maintenance outsourcing in a new coordinating LATAM MRO (Maintenance, Repair and Overhaul) structure.
The LATAM MRO Business Unit provides services mainly for LATAM fleet but provides services for third-party customers as well. It hasOperations”) facilities, one in São Carlos (SP/Brazil) Technological Center(Brazil) and one in its ownSantiago (Chile), are equipped and certified to service our fleet of Airbus and Boeing aircraft and provide 76% of all heavy maintenance services that LATAM demands. The services not executed internally are contracted to our extensive network of MRO partners around the globe. Both MRO facilities are FAAPart-145 certified repair stations. We occasionally perform certain heavy maintenance and component services for other airlines or OEMs. LATAM MRO is also responsible for the planning and execution of aircraft redeliveries.
In MRO São Carlos (LATAM Airlines Brazil MRO), we are prepared to service up to eight aircraft (narrow and wide body) simultaneously with a dedicated hangar for stripping and painting. In this facility we also have 22 technical component shops, including a full landing gear repair & overhaul shop, hydraulics, pneumatics, electronics (ATEC), electrical components, electroplating, composites, wheels & brakes, interiors and emergency equipment shops. This facility has a total area of 400 hectares and a hangar area of 100,000 m��m², with a dedicated runway of 1,720 meters and a facility in Santiago International Airport (Chile).
meters. MRO São Carlos (TAM MRO) is certified and audited by major international aeronautical authorities such as the FAA, (USA), EASA (Europe)the European Aviation Safety Agency (“EASA”), ANAC (Brazil)Brazil, the Chilean DGAC, the ArgentineanAdministración Nacional de Aviación Civil (“ANAC Argentina”), DGAC (Chile)the EcuadorianDirección General de Aviación Civil(“DGCA”), ANAC Argentina, DGCA (Ecuador)the ParaguayanDirección Nacional de Aeronautica Civil (“DINAC”), DINAC (Paraguay), TC (Canada)and Transport Canada (“TC”) , among others, for Heavy Maintenance and Components Repair and Overhaul for the AirbusA-320 family (A318, A319, A320 &and A321) and Airbus A330, Boeing 767,ATR-42/72 and the EmbraerE-Jet 170/190 families. TAMThe MRO also has some minor capabilities for the repair and overhaul of Airbus A340 and Boeing 777 components. MRO São Carlos includes its own support engineering capabilities and a full technical training center.
In MRO Santiago, (LAN Heavy Maintenance)located near Comodoro Arturo Merino Benítez International Airport in Santiago, we have two hangars capable of servicing one wide body aircraft and two narrow body aircraft simultaneously. MRO Santiago is certified and audited by FAA, ANAC (Brazil),Brazil, DGAC, (Chile), ANAC Argentina and DGCA, (Ecuador), among others, for Heavy Maintenance for the Airbus A320-Family (A318, A319, A320 family (A319, A320 &and A321), and Boeing 767. MRO Santiago has eight shops prepared to support hangar activities such as cabin shops, galleys, structures and composite materials. We also have the capability to retrofit aircraft interiors, including the installation of IFE(in-flight entertainment) equipment and blended winglets in the Boeing 767 and 787. Both MRO facilities are FAA Part-145 certified repair stations.fleet.
In 2013 we expanded our capacity by one hangar in MRO São Carlos and now we can accommodate 7 aircraft (Narrowbody/Widebody) and 2 Regional/Turboprop aircraft simultaneously, and we have a dedicated hangar for stripping and painting. In that facility we also have 22 technical shops, including full Landing Gear repair & overhaul shop, Hydraulics, Pneumatics, Electronics (ATEC), Electrical Components, Electroplating, Composites, Wheels & Brakes, Interiors and Escape Slides shops. In Santiago we have 2 hangars with 2 widebody slots and 1 narrowbody slot.
In 2013, TAMDuring 2016, LATAM MRO effectively applied 1.5executed 1.2 millionman-hours (a 10% increase compared with 2012), serviced 168 aircraft, in more than 300 services, including C Dchecks (114) and Special Checks (209) for the LATAM fleet, and for third party customers,maintaining our 2015 labor production. Our shops delivered approximately 58,000more than 50,000 components and performed 1417 landing gear overhauls. In 2013, TAM MRO serviced almost 100% of all TAM’s Airbus A320 family and A330 demand for Heavy Maintenance, and 75% of demand for Components Repair & Overhaul. We expanded pursuing services for LAN fleet, reaching 15 Heavy Checks. TAM’s external maintenance and repair customers include Azul, Trip, Avianca, the Brazilian Air Force, Embraer, Goodrich, and Hamilton Sundstrand, among others.
TAM’s structure in São Carlos includes engineering capabilities, a full technical training center which develops TAM’s capabilities in terms of human skills with more than 6,000 students and 90,000 hours of training in 2013, providing 80 different basic courses, on-the-job training and special training such as structural, avionics, foreign language and leadership training and education.
In 2011 TAM started a turn-around process to achieve international MRO competitive standards in terms of costs, quality, reliability and time of deliveries (TAT). In 2012 TAM began to implement the LEAN system and other activities, including continuous process improvement culture, redesign of the production methodology in productive cells and scheduling of task through CCPM methodology (Critical Chain Project Management), development of shop-floor control systems and carry out VSM process modeling for Landing Gear shop. 2013 was the year of consolidation of these initiatives and in 2013 we accomplished a significant 7% reduction in turnaround times, increased ontime performance and improved quality of our services (as measured by reductions in post-check failures and premature components failures).
TAM’s line maintenance is fully capable to provide services to all types of Airbus and Boeing aircraft of TAM fleet. Operations in TAM’s extensive network of 41 domestic destinations are supported by TAM maintenance staff; in the international maintenance line stations, there is a mix of TAM staff and qualified outsourced line maintenance providers.
TAM’s maintenance and engineering organization in Brazil is supervised by the Brazilian Agência Nacional de Aviação Civil (‘ANAC’). TAM Mercosur’s operations are supervised by the Paraguayan Dirección Nacional de Aeronáutica Civil (‘DINAC’). All operations are subjected to periodic audits by these regulatory authorities. As IATA Operational Safety Audit (IOSA)-certified airlines, TAM and TAM Mercosur are also periodically audited by IOSA-qualified Audit Organizations to guarantee fully compliance with applicable regulations.
In addition to the broad capability of TAM heavy maintenance facilities in São Carlos for aircraft and components, TAM relies on a range of qualified third parties maintenance providers, including MTU Aero Engines in Germany and GE Celma In Brazil for Airbus A320-Family IAE and CFM engines, General Electric facilities in USA and Europe for A330, B767 and B777 GE engines and Pratt & Whitney in Singapore for A330 P&W engines. Third parties also provide certain additional components applicable to TAM fleets.
LATAM Safety and Security
Our most important priority is the safety of our passengers and employees. LATAM has been working to standardize LAN and TAM’sour operational indicators regarding safety, audits and emergency response. This processresponse throughout our operations.
The divisions that currently support these functions are Safety Management, Emergency Response Management, and Security Management. These divisions function on the basis of identifying synergies in LANuniform policies and TAM’s operational indicators has led to opportunities to improve processes and standardize operational processes and audits.
LAN’sprocedures issued from the Corporate Safety and Security Corporate DirectionVicepresidency located in Santiago, Chile, and that are represented in each affiliated company.
TheOrganization of the LATAM Safety and Security Corporate Direction (“SSCD”) is an internal division in charge of the management of safety and security matters related to flight operations, operative and administrative buildings, organization and coordination of emergency response matters, safety and security audits and safety and occupational health.Vicepresidency
The SSCD reports directly to LAN’s Chief Executive Officer (“CEO”), which reflects the firm commitment that the Company’s senior management has to the Safety & Security. The SSCD is comprised of five independent reporting management areas: safety management, security management, emergency response management, Safety & Security Audit management and Safety and Occupational Health Management.
Safety Management Corporate
We give highthe highest priority to providing safe and reliable air service. We have uniform safety standards and safety-related training programsunified our Safety Management under a single organization (Corporate) that cover all of our operations. LAN has implemented a System called LAN I-AMS (LAN Integrated Airline Management System) throughout the operational areas of the Company, which is certified by the Chilean DGAC and IOSA System. The LAN I-AMS integrates Safety, Safety Assurance, Emergency Response, Security and Occupational Safety and Health management and provides clear definitions of the functions and responsibilities regarding safety for all persons involved, from the top to the bottom of the operational structure of the airline. It strengthens the commitment and knowledge required from everyone in the Company regarding any and all actions that could affect safety.
The Operational Safety Senior Manager (“SSM”) is responsible for the Operational Safety Oversight and the implementationdefinition of the LAN I-AMS. The SSM supervises a staff of approximately 21 safety specialists of different backgrounds, including pilots, aeronautical engineers, aircraft maintenance engineers, a psychologist, and dangerous goods and ground handling safety specialists.
Our corporate operational safety organization consists of three main areas:
The main safety programs, elements and procedures include:
We also periodically evaluate the skills, experience and safety records of our flight crews in order to maintain strict control over the quality of our flight crews. All of our aircraft pilots participate in training programs, some of which are sponsored by aircraft manufacturers, and all are required to undergo recurrent training.
Our operational safety committee, composed of senior executives and key operational managers, is responsible for the initiation of safety-related actions.
All of our Boeing 767, A320 Family, A340 and Boeing 777 and 787 fleets are equipped with an enhanced ground proximity warning system, a traffic collision avoidance system, a wind shear detection system and reduced vertical separation minimum capabilities.
Security Management
The main policy and the essential principle of the Company is to ensure an adequate security protection to all its flights, aircraft, passengers, crew members, ground personnel, airport facilities and other services related to the commercial civil aviation against any threat or unlawful action.
We have implemented corporate policies and a quality management system through the operational system to detect any lack of security in its operations and prevent acts of unlawful interference. Risk analysis is used to determine different levels of security to be implemented to international and domestic operations.
The Security Corporate Manager (“SCM”) has the responsibility to evaluate, analyze and assign risk levels (high, medium, low) to international and domestic operations, proposing security procedures for each scenario. The SCM leads an organization of eight security specialists. These specialists analyze high risk flights and all the aspects of the operation that could cause an impact in the normal daily activities of the Company. Finally, the security management is controlled and audited constantly. The current SCM is a former police officer with more than 20 years of experience in the civil aviation.
The corporate security organization has three main areas: standards, procedures and quality control; planning and management control; and dangerous goods. Additionally, our SCM gives support to the different areas of the Company related to training, internal investigations, and travel documentation assistance.
Since 2002, the Company’s Corporate Security Manual has unified international and domestic security procedures, including local security procedures; airport security programs for each country in which we have operations, which includes procedures to prevent unlawful conductprocesses and procedures for a bomb threat or hijacking drill; corporation security training programs regarding the acceptance of aircraft, baggage, cargoLATAM Safety Management and passengers an airport security audit procedures regarding airport inspections; and identification of security issues and corrective action plans for non-compliance.
Emergency Response Management
The emergency response management team is responsible for the administrationoversight of the Emergency Response Plan (ERP). It has been developed for the effectiveaffiliates that apply and implement those processes and procedures.
All LATAM affiliates have safety management of different kinds of emergencies (aircraft accidents, natural disasters, strikes, pandemics) with the purpose of mitigating impacts of emergencies on passengers and their relatives, as well as the Company’s operations.
The ERP includes:
The “Go Team,” which is a special team that will be dispatched in the case of an emergency to the city nearest to the site where the emergency or accident has occurred and assume the responsibility of emergency management in such place with the following areas: Humanitarian Assistance (APF Team), Investigation (Field Investigation team), General Support (Logistics, Informatics & Telecommunication, Security, Finance, Legal and Maintenance departments), Aircraft Recovery (Recovery Team).
Safety and Security Audit Management
The Safety and Security Audit Management area reports directly to the Corporate Director. This area has the mission to advise senior management on issues relating to planning and control, design, documentation, implementation, maintenance and improvement of the LAN’s Safety and Quality Management System. The Safety and Security Audit Management is responsible for:
Safety and Occupational Health Management
The main objective of the Safety and Occupational Health Management is to ensure the safety and health of workers at work, by advising, managing and helping the company prevent occupational accidents and diseases through the identification and control of occupational hazards and medical surveillance.
The forgoing objectives are satisfied through a dedicated team of professionals (engineers, doctors, risk prevention experts and paramedics), who constantly develop activities aimed at protecting LAN employees and is responsible for:
TAM’s Safety and Security Corporate Direction
The Safety & Security Direction is an internal division in charge of the management of safety and security matters related to flight operations, operative and administrative buildings, organization and coordination of emergency response matters, safety and security audits and safety and occupational health.
Safety Management
We have uniform safety standards and safety-related training programs that cover all of TAM’s operations. TAM has implemented a Safety and Quality Management System (“SMS”) throughout the operational areas its operations, which is IOSA certified. The SMSdocumentation that provides clear definitions of the functions and responsibilities regarding operational safety for all persons involved, from the top to the bottom of the operational structure ofin the airline. It strengthens the commitment and knowledge required from everyone in the Company regarding any and all actions that could affect safety.
TheAll systems are IOSA certified and have a Senior Safety & Security DirectorManager who is responsible for the Operational Safety Oversighteach system implementation and the implementation of the SMS. The Safety & Security Director supervises a staff of approximately three hundred twenty-nine employers the different backgrounds, including pilots, aeronautical engineers, aircraft maintenance engineers, psychologist, dangerous goods, auditors, security agents, and ground handling safety specialists (Operational Safety & Security, Aerospace Health and Safety Labor. The Safety & Security Director is also responsible for setting procedure standardstandardized procedures for measuring the quality and safety of services provided by companies or professional contractors that affect the operational safety of this organization.
Other programs for safety management include:
Safety Assurance, Safety Audit Manager and Dangerous Goods
Safety Audit establishes guidelines and principles to be applied in Audit Program Operating to identify whether activities related to operations are in accordance with established procedures in operating manuals, meeting the needs and operational standards set forth in applicable laws or to check for hazards operation, latent conditions or undesirable areas needing improvement by ISO 9001:2008, 19011:2002, IOSA and ISAGO.
Safety Assurance consolidates risks operational through the creation and monitoring processes to integrate information from failures and shortcomings of the company with audit programs, monitoring and data analysis through the parameterization of the systems and Hyperion AQD for Security System.
Dangerous Goods coordinates the administrative and operational activities of the board of operational safety with regard to the carriage of dangerous goods by integrating with other areas of the board and managers and assisting the director of operational safety in decision making.LATAM.
Functions and Responsibilities
Security Management Manager
The main policy and the essential principle of security management is to ensure an adequate security protection for all TAM’s flights, aircraft, passengers, crew members, ground personnel, airport facilities and other services related to the commercial civil aviation against any threat or unlawful action. TAM has implemented corporate policies and a quality management system through the operational system to detect any lack of security in its operations. Audits and assessments are used to assign different levels of security to international and domestic operations.
The Corporate Security Manager (“CSM”) has the responsibility to evaluate, analyze and assign threat levels (high, medium, low) to international and domestic operations, and to propose security procedures for each scenario. The CSM is responsible for managing and coordinating security processes, procedures, measures and controls in accordance with the requirements described in the National Civil Aviation Security Programme, and participating in the development, implementation and continuous improvement of Airport Contingency Plans where TAM operations are conducted.
The Corporate Security Organization has four main areas:
The Corporate Security Department has been developing and implementing the Airline Security Programme (PSEA) in accordance with local and international regulators, which includes the following:
Emergency Response Management ManagerCorporate
The emergency response areamanagement team is responsible for the administration of the Emergency Response Plan (ERP)(“ERP”). It has been developed for the effective management of different kinds of emergencies (aircraft accidents, natural disasters, strikes and serious incidentspandemics) with the purpose of mitigating anythe impacts of emergencies on the passengerpassengers and their relatives, and theas well as on our operations.
The ERP consists mainly of:
Security Management Corporate
The Company ensures the highest levels of security for all of its passengers, crewemployees, aircraft, equipment and facilities against any threats or third parties affect by an occurrence involving TAM aircraft.
Flight Data Monitoring
The Flight Data Monitoring Area is responsible for the maintenance and administration of recorded flight data and safety-related databases and software.
Flight Operations Quality Assurance—“FOQA”
Since May 2002, TAM has utilized a Flight Data Monitoring (“FDM”) program. The FDM program is fully developed for the A320-Family Aircraft, A330, Boeing B767 and B777 fleet. The statistical information obtained produces recommended standard operational procedure changes and other safety-related measures. We have started the development of a maintenance variation for the same aircraft types which will monitor the engines, flight controls and general performance of the airplanes.security processes and procedures through the execution of annual audits.
Maintenance Safety Coordinator
The Maintenance Safety Area oversees our maintenance safety measures and investigates maintenance-related incidents usingFurthermore, every LATAM affiliate has to abide by a Security Program approved by the Maintenance Error Decision Aid (“MEDA”) methodology.
Cabin Safety Coordinator
The cabin safety area coordinator is responsible for managing the safety of aircraft cabins, cabin safety investigations, cabin passengers and flight attendants.
Investigation & Safety Information Management Coordinator
All information regarding safety-related incidents is entered into dedicated software, where it is analyzed according to potential risk. Important incidents are investigated thoroughly. Each particular incident requiring corrective actions is addressed accordingly with the assistancerelevant local authority. These Security Programs provide clear definitions of the corporate operational safety directory.
ASR—Aviation Safety Report Coordinator
The Aviation Safety Report (“ASR”), catalogues all confidential safety reports submitted by employees of the company. The ASR is an important toolsecurity functions required for accident prevention. The management of the ASR system through the Aviation Quality Database (“AQD”) allows for the sharing of information and facilitates corrective actions by the Company). This system includes features to classify risk reports for management.
All ASR reporting is subjected to the following basic process within the AQD:
Mandatory Occurrence and Mandatory Reports Coordinator
The Authority Operational Policy manual defines the incidents and occurrences that require mandatory reporting. Those reports are created by the Safety Department of the Company.
LOSA—Line Operations Safety Audit Coordinator
This program was recognized by the International Civil Aviation Organization (“ICAO”) ( and National Civil Aviation Agency—Brazil (“ANAC”) as a necessary tool to protect passengers and employees.
The implementation of this program has been used to improve flight safety in the Company, by recording behaviors observed during normal flights for experienced pilots and through the preparation of a mandatory checklist (form) developed by experienced pilots familiar with the program. Observations by the Threat and Error Management (“TEM”) may even propose appropriate changes to the system and processes.
MAS—Maintenance Assessment Survey Coordinator
This program is similar to the LOSA program, applied to the mechanics of the aircraft, following a methodology known as the Maintenance Climate Assessment Survey (“MCAS”) which is utilized by the Department of Defense (United States Government), as in other Brazilian and international airlines, with the goal of improving processes and system based on assessments of human behavior in maintenance activities.
Airport infrastructure, Air traffic control and Ground Handling Coordinator
This area of the Company is responsible for identifying and analyzing risks related to Airports, and ATC and Ground handling. This area of the Company utilizes tools such as: Airport Surveys, ASR, FOQA Analysis, accident and Incident Investigations to develop ways to reduce risk to acceptable levels.
Other Safety and Security Procedures
In addition the specific policies discussed above, LATAM maintains various other internal divisions and employees specifically designated to manage safety planning and maintenance, investigation, data collection and reporting regarding safety related events.every operation.
Fuel Supplies
Fuel costs comprise one of the single largest categorycategories of our operating expenses. Over the last years, our fuel consumption and operating expenses have increased due to the significant growth in our operations andoperations. However, in 2016 due to the increasesignificant drop in the international price of crude oil, LATAM saw a drop in its jet fuel prices as a result of economic and political factors.costs. In 20132016, total fuel costs represented 35.0%23.0% of our total operating expenses. TheOur average into-wing price for 2013, (average fuel2016 (fuel price plus taxes and transportation costs, including hedge) was US$3.481.70 per gallon, representing a decrease of 5.6%22.2% from the 20122015 into-wing pro forma average fuel price. We can neither control nor accurately predict the volatility of fuel prices. Despite the foregoing, we believe it is possible to partially offset the price volatility risk through our hedging and fuel surcharge programs, in place in both our passenger and cargo business. For more information, see “Item 11. Quantitative and Qualitative Disclosures About Market Risk—Risk of Fluctuations in Jet Fuel Prices.”
The following table details our consolidated fuel consumption and operating expenses, after related hedging gains and losses (which exclude fuel costs related to charter operations because fuel expenses are covered by the entity that charters the flight) during the last three years.
| Year ended December 31, (1) | Year ended December 31,(1) | |||||||||||||||||||||||
| 2013 LATAM (actual) | 2012 LATAM (pro forma) | 2011 LAN (actual) | 2016 | 2015 | 2014 | |||||||||||||||||||
Fuel consumption (thousands of gallons) | 1,266,718.6 | 1,295,099.9 | 562,346.0 | 1,185,508.8 | 1,221,096.9 | 1,219,882.7 | ||||||||||||||||||
ASKs Equivalent (millions) | 212,236.8 | 212,669.5 | 102.814.0 | |||||||||||||||||||||
Fuel consumption (thousands of gallons) per ASK Equivalent (millions) | 59.7 | 60.9 | 54.70 | |||||||||||||||||||||
ASK equivalents (millions) | 205,537.5 | 208,722.5 | 206,197.9 | |||||||||||||||||||||
Fuel gallons consumed per 1,000 ASK equivalents | 5.77 | 5.85 | 5.92 | |||||||||||||||||||||
Total fuel costs (US$ thousands) | 4,414,249 | 4,780,289 | 1,750,052 | 2,056,643 | 2,651,067 | 4,167,030 | ||||||||||||||||||
Cost per gallon (US$) | 3.48 | 3.69 | 3.11 | 1.70 | 2.19 | 3.42 | ||||||||||||||||||
Total fuel costs as a percentage of total operating expenses | 34.97 | % | 36.41 | % | 33.79 | % | 23.0 | % | 27.6 | % | 34.8 | % | ||||||||||||
| (1) |
Our fuel supply arrangements vary by airport and are distributed on 26among 34 providers, but are mainly concentrated in Brazil (50%(42%), Chile (12%(15%), the United States (11%) and Perú (8%Peru (11%). During 2013,2016, we negotiatedre-negotiated our fuel supply contracts in all North American, major European, North American and certain South American airports. In 201_,
Regarding our operations in the United States, we renegotiatedchanged our entire fuel supplystrategy related to the term of our agreements. While previously we relied only on short term agreements, in Chile and closed a long2016 we established medium term agreement with the main player in this market (Joint Venture Copec – Air BP).
In 2013, we also signed a long term contract with Shell and YPF in Argentina. In North America our main airports are Miami and New York, where we signed contracts with WFS and Air BP respectivelyagreements, securing our supply in a complex markets.market.
In others countries Brazil, Colombia, Peru, Ecuador, Mexico, Paraguay, Uruguay, we continued working
As part of a comprehensive energy efficiency initiative, LATAM Airlines Group worked with our current suppliers (including Raizen a team of stakeholders to generate a streamlined fuel efficiency program (the “LATAM Fuel Efficiency Program”), Petrobras, Petroperu, Exxon , Repsol, Petroecuador, Terpel, Axxion, among others.) regarding ourwhich encompassess a wide range of different innovations and technologies for fuel supply arrangementsefficiency:
As a direct result of this program, LATAM Airlines Group has been recognized since 2014 by the Dow Jones Sustainability Index as one of the world’s leading companies ineco-efficiency. The magnitude of this program has allowed the Company to improve its environmental performance and to enhance environmental awareness both within the Company and externally.
Ground Facilities and Services
Our main operations are based at the Comodoro Arturo Merino Benítez International Airport in Santiago, Chile. We also operate from various other airports in Chile, and abroad. Wewhere we operate hangars, aircraft parking and other airport service facilities at the Comodoro Arturo Merino Benítez International Airport and other airports throughout Chile pursuant to concessions granted by the DGAC. We also maintain onea customs warehouse at the Comodoro Arturo Merino Benítez International Airport, additional customs warehouses in Chile (Iquique, Antofagasta and Punta Arenas) and Argentina (Aeroparque) and operate cargo warehouses at the Miami International Airport to service our cargo customers. Our facilities at Miami International Airport include corporate offices for our cargo and passenger operations and temperature-controlled and freezer space for imports and exports. We also operate from various other airports in Chile and abroad.
We also operate significant ground facilities and services through TAM’sat LATAM Airlines Brazil’s headquarters located at Congonhas International Airport in São Paulo, Brazil. In 2013, weLATAM Airlines Brazil inaugurated two new facilities for ground handling equipment maintenance and repair at(at São Paulo’s Guarulhos Airport with 9,000 m² and at Rio de Janeiro’s Galeão Airport with 4,000 m²).
Finally, weWe incur certain airport usage fees and other charges for services performed by the various airports where we operate, such as air traffic control charges,take-off and landing fees, aircraft parking fees and fees payable in connection with the use of passenger waiting rooms andcheck-in counter space.
Ancillary Airline Activities
In addition to our airline operations, we generate revenues from a variety of other activities, including revenue from aircraft leases (including subleases,dry-leases,wet-leases and capacity sales to certain alliance partners) and charter flights, from tours, from duty-freein-flight sales, from other maintenance services for third parties, handling, storage and customs services, handling and activities and revenues of Multiplus.Multiplus and the sale of certain LATAM Pass kilometers to third parties. In 2013,2016, LATAM generated other revenues of US$342538.7 million from ancillary activities.
Insurance
We maintain insurance policies as required by law and in accordance with the terms of all aircraft financing and leasing agreements whichfor aircraft that LATAM and theirits affiliates and subsidiaries may own, or we are responsible for or operate, including TAM and its affiliates and subsidiaries.operate. The scope of these policies includes all risk coverage for aircraft hulls, including war risks and third partythird-party legal liability for passengers, cargo, baggage and injuries to third parties on the ground. Our current policies, which are in force through April 1, 2014 and are renewed annually, follow the best practices adopted by the international civil aviation industry.
We have negotiated common terms for Hull All Risk, Aviation Legal Liabilities and Spares coverage, together with IAG Group (British Airways, Iberia and their affiliates and franchises), which allows us to obtain premium reductions and coverage improvements. We also maintain insurance in respect of the assets against the risk of theft, fire, flood, electrical damage and similar events for equipment and buildings we own or for which we are responsible, including airport areas where we have operations. Similarly, we have contracted for vehicle insurance against the risk of robbery, theft, fire and civil liability against third parties for all vehicles we own or for which we are responsible. Our current policies, which are in force through April 1, 2017 and are renewed annually, follow the best practices adopted by the international civil aviation industry.
We have negotiated common terms for Hull All Risk, Aviation Legal Liabilities and Spares coverage, together with IAG Group (the parent of British Airways, Iberia and their affiliates and franchises), which allows us to obtain premium reductions and coverage improvements.
Information Technology
GeneralPassenger Service Systems
We use information technology in almost every aspectAs part of our business.agenda of transformation of the customer experience at LATAM, we have redefined our travel experience model and will continue to redesign our passenger service systems with the aim of providing a unified experience to our customers. Since the 2012 combination of LAN and TAM, a series of projects have been implemented to communicate the unification of the companies to our customers. Intense efforts have been made to standardize processes such as passenger recognition, attention at contact centers, sales offices and airports,in-flight services,e-commerce and loyalty programs. However, many of these efforts are partial pending full unification of the two companies’ processes and systems, which is still ongoing.
In 2014, we redefined our travel experience model based on the needs of our target customer, reinforcing six key elements: transparency of information, early solutions, passenger choice, digital simplicity,end-to-end rapidity, and care for our customer. In order to implement this model, during 2016 we continued the work of previous years, adopting several measures for the unification of our processes and systems:
From the integration perspective, we continue working to reach a simplified and consistent technological platform. For example, we implemented a unified Revenue Accounting System for the passenger business, and we have improved our airport management, loyalty program, contact center, customer database, and marketing tools applications. We continue to work with SABRE to unify the Passenger Service SystemPlatform in an effort to obtain operational and financial synergies, as set forth below.
During 2017, we expect to continue developing solutions aimed at improving our customers’ experience.
LATAM PSS Migration and Digital Platform
Our reservations, departure control (check-in), inventory, flight planningPrior to the 2012 combination, LAN and baggage tracing systemsTAM used different passenger service platform (“PSP”) solutions, TAM used Amadeus and LAN used SABRE. LATAM has since decided to unify the Passenger Service Systems, or “PSS”Platform in an effort to obtain operational and financial synergies. As a result, the PSS Migration Program began in 2014.
After running a Request for Proposal (“RFP”) are operatedprocess with both providers (SABRE and Amadeus) in May 2015, LATAM signed a10-year contract with SABRE. Since June 2015, LATAM and SABRE have jointly started the execution of PSS Migration, which should be fully implemented by Sabre,2018.
Maintenance
In 2013, LATAM Airlines Brazil began a Maintenix implementation project which was completed in the first quarter of 2016. This project included standardization of all of our network’s maintenance processes, permitting optimization of stocks of components and SITA, and we operate our internal systems fromseeking to take advantage of synergies in the maintenance process, while maintaining operational safety as the key pillar.
Disaster Recovery Plan
As of December 2016, LATAM has two data center facilitiescenters in Santiago, Chile. In 2006, we implementedChile and one in Brazil. Design and configuration of two data centers and a Disaster Recovery Plan between those two sites in order to ensure the functionality of our critical systems, with a recovery time objective of four days. The line of business infrastructure currently has an average recovery time of two hours for 80% of our systems and two days for the remaining 20%. In 2012, we completed a significant “HOST” change from multiple legacy applications to implement a single supplier (Sabre) for our PSS, which contains the reservation, inventory and departure controls for LATAM Airlines Group.
Third-party suppliers provide us with the following technical infrastructure elements:
Basic Infrastructure Operation
Since early 2010, we have outsourced our IT infrastructure with Accenture and IBM worldwide. During 2011 IBM managed the data center and Accenture handled our desktop equipment. In 2012 we changed the company in charge of managing of our data center from IBM to HP.
Between 2010 and 2013, LAN upgraded its IT platform and optimized its solution for contingencies in case of a disaster.
Front-End Systems
We employ a strategy of encouraging and facilitating self-service alternatives for customers, through improving the functionality of the www.lan.com website as well as implementing self check-in kiosks in airports. During 2009, we deployed a new online system in order to provide the processes that our engineering, maintenance and materials areas develop, with technological solutions. This project has allowed us to establish and automate simple and integrated processes, standardize processes for the Company (including our subsidiaries and related companies), facilitate handling of materials and maintenance, make relevant information available in a full, unique and consistent way to all users, and optimize distribution and execution (planned and non planned), among other benefits.
Enterprise Resource Planning
In 2002, we purchased an enterprise resource planning (“ERP”) system from SAP. This system, which testing was fully implemented in the second quarter of 2004 for LAN and almost all of its subsidiaries, includes modules covering areas such as: finance, accounting, inventory management, human resources, business warehouse, as well as a user-friendly portal.
Development and Maintenance System
With respect to new development needs, our first choice is to acquire existing packaged software, but we outsource this service when such software is not available in the market. Since early 2007, we have outsourced our IT system development to four principal vendors: TATA Consultancy Services, Everis, Accenture and Indra.
Business Initiatives
The purchase of Boeing 787 Dreamliners, Boeing’s most fuel efficient aircraft and the world’s first e-enabled airplane, has been a significant challenge for our technology processes since the airplane needs more connectivity to network, optimized hardware and software and constant support.
Integration between LAN and TAM
Following the combination, we are undertaking a project to unify the IT applications of LAN and TAM and to develop a plan to integrate LAN and TAM´s business processes and applications. The main focus was:
As a result of this roadmap, LATAM will prioritize initiatives in 2014 that are most valuable for integrating IT operations, which include:
To implement these prioritized projects, we estimated an investment of approximately US$45.6 million. During 2013 the following innicatives were implemented:
In addition,done during 2014 the following systems implementations will be finalized:
Central IT Operations:
Regarding the IT central infrastructure, LATAM’s technical model was designed to support not only the implementation of LATAM’s system applications but also the implementation of integrated datacenter and telecommunications (data and voice) solutions. The integrated IT model will require future investments of approximately US$13.6 million.
In 2013, we established a unified outsourcing contract with HP to manage LAN & TAM´s Data Center, this services is now provided by HP. We are currently working to consolidate TAM´s 3 Data Centers in only one. In 2014 we will define a new DRP model (Disaster Recovery Plan) for LATAM, which will be implemented in 2015.
Regarding the computer platform, the current type of equipment that TAM holds are being standardized (desktops and Laptops) with those used by our other subsidiaries. In addition the procurement model is changing from renting to purchasing the assets. As a result there is only one customer support model, which will optimize costs and improve services quality. Customer support is currently provided by Accenture and IBM.
In 2013, we selected SITA as the main vendor to provide a consolidated telecommunications network between LAN & TAM, in addition to Telefonica and OI. Implementation is scheduled for 2014.2016.
Regulation
Below is a brief reference to the material effects of aeronautical and other regulations in force in each of the relevant jurisdictions in which LANwe operate.
We are subject to the jurisdiction of various regulatory and enforcement agencies in each of the countries where we operate. We believe we have obtained and maintain the necessary authority, including authorizations and operative certificates where required, which are subject to ongoing compliance with statutes, rules and regulations pertaining to the airline industry, including any rules and regulations that may be adopted in the future.
The countries where we carry out most of our operations are contracting states and permanent members of the ICAO, an agency of the United Nations established in 1947 to assist in the planning and development of international air transportation. The ICAO establishes technical standards for the international aviation industry. In the absence of an applicable local regulation concerning safety or maintenance, the countries where we operate have incorporated by reference the majority of the ICAO’s technical standards. We believe that we are in material compliance with all such relevant technical standards.
Environmental and Noise Regulation.There are no material environmental regulations or controls imposed upon airlines, applicable to aircraft, or that otherwise affect us, except for environmental laws and regulations of general applicability.
In Argentina, Brazil, Colombia, Ecuador, Peru and the United States, aircraft should comply with certain noise restrictions. We believe our aircraft substantially complies with all such restrictions. Chilean authorities are planning to pass a noise-related regulation governing aircraft that fly to and within Chile, observing a standard known as “Stage 3 requirements”. Our fleet already complies with such standards, so we do not believe that enactment of the proposed standards would impose a material burden on us.
In 2016, the ICAO adopted a resolution creating the Carbon Offsetting and Reduction Scheme for International Aviation (CORSIA), providing a framework for a global market-based measure to stabilize CO2 emissions in international civil aviation (i.e., civil aviation flights that depart in one country and arrive in a different country). With the adoption of this framework, the aviation industry became the first industry to achieve an agreement with respect to its CO2 emissions. The scheme, which defines a unified standard to regulate CO2 emissions in international flights, will be implemented in various phases by ICAO member states starting in 2020.
Safety and Security. Our operations are subject to the jurisdiction of various agencies in each of the countries where we operate, which set standards and requirements for the operation of aircraft and its subsidiariesmaintenance.
In the United States, the Aviation and Transporation Security Act requires, among other things, the implementation of certain security measures by airlines and airports, such as the requirement that all passenger bags be screened for explosives. Funding for airline and airport security required under the Aviation Security Act is provided in part by a US$5.60 per segment passenger security fee, subject to a US$11.20 per roundtrip cap; however, airlines are responsible for costs in excess of this fee. Implementation of the requirements of the Aviation Security Act has resulted in increased costs for airlines and their passengers. Since the events of September 11, 2001, Congress has mandated, and the TSA has implemented, numerous security procedures and requirements that have imposed and will continue to impose burdens on airlines, passengers and shippers.
Below are some specific aeronautical regulations related to route rights and pricing policy in the countries where we operate.
Chile
Aeronautical Regulation
Both the DGACDirección Nacional de Aeronáutica Civil (“DGAC”) and the JACJunta de Aeronáutica Civil (“JAC”) oversee and regulate the Chilean aviation industry. The DGAC reports directly to the Chilean Air Force and is responsible for supervising compliance with Chilean laws and regulations relating to air navigation. The JAC is the Chilean civil aviation authority. Primarily on the basis of Decree Law No. 2,564, which regulates commercial aviation, the JAC establishes the main commercial policies for the aviation industry in Chile and regulates the assignment of international routes and the compliance with certain insurance requirements, andwhile the DGAC regulates flight operations, including personnel, aircraft and security standards, air traffic control and airport management. We have obtained and maintain the necessary authority from the Chilean government to conduct flight operations, including authorization certificates from the JAC and technical operative certificates from the DGAC, the continuation of which is subject to the ongoing compliance with applicable statutes, rules and regulations pertaining to the airline industry, including any rules and regulations that may be adopted in the future.
Chile is a contracting state, as well as a permanent member, of the ICAO, an agency of the United Nations established in 1947 to assist in the planning and development of international air transport. The ICAO establishesICAO. Chilean authorities have incorporated ICAO’s technical standards for the international aviation industry which Chilean authorities have incorporated into Chilean laws and regulations. In the absence of an applicable Chilean regulation concerning safety or maintenance, the DGAC has incorporated by reference the majority of the ICAO’s technical standards. We believe that we are in material compliance with all such relevant technical standards.
Route Rights
Domestic Routes.Chilean airlines are not required to obtain permits in connection with carryingorder to carry passengers or cargo on any domestic routes, but only to comply with the technical and insurance requirements established respectively by the DGAC and the JAC. There are no regulatory barriers that would prevent a foreign airline from creating a Chilean subsidiary and entering the Chilean domestic market using that subsidiary. On January 18, 2012 the Secretary of Transportation and the Secretary of Economics of Chile announced steps towards unilaterallya unilateral opening of the Chilean domestic skiesskies. This was confirmed on November 2013, and has been in the near term.force since that date.
International Routes.As an airline providing services on international routes, LANLATAM is also subject to a variety of bilateral civil air transporttransportation agreements that provide for the exchange of air traffic rights between Chile and various other countries. There can be no assurance that existing bilateral agreements between Chile and foreign governments will continue, and a modification, suspension or revocation of one or more bilateral treaties could have a material adverse effect on our operations and financial results.
International route rights, as well as the corresponding landing rights, are derived from a variety of air transporttransportation agreements negotiated between Chile and foreign governments. Under such agreements, the government of one country grants the government of another country the right to designate one or more of its domestic airlines to operate scheduled services to certain destinations of the former and, in certain cases, to further connect to third-country destinations. In Chile, when additional route frequencies to and from foreign cities become available, any eligible airline may apply to obtain them. If there is more than one applicant for a route frequency, the JAC awards it through a public auction for a period of five years. The JAC grants route frequencies subject to the condition that the recipient airline operate them on a permanent basis. If an airline fails to operate a route for a period of six months or more, the JAC may terminate its rights to that route. International route frequencies are freely transferable. In the past, we have generally paid only nominal amounts for international route frequencies obtained in uncontested auctions.
Airfare Pricing Policy.Chilean airlines are permitted to establish their own domestic and international fares without government regulation. For more information, see “—Antitrust Regulation” below. In 1997, the Antitrust Commission approved and imposed a specific self-regulatory fare plan for our domestic operations in Chile consistent with the Antitrust Commission’s directive to maintain a competitive environment. According to this plan, we must file notice with the JAC of any increase or decrease in standard fares on
routes deemed “non-competitive”“non-competitive” by the JAC and any decrease in fares on “competitive” routes at least twenty20 days in advance. We must file notice with the JAC of any increase in fares on “competitive” routes at least ten10 days in advance. In addition, the Chilean authorities now require that we justify any modification that we make to our fares onnon-competitive routes. We must also ensure that our average yields on anon-competitive route are not higher than those on competitive routes of similar distance.
Registration of Aircraft.Aircraft registration in Chile is governed by the Chilean Aeronautical Code (“CAC”). In order to register or continue to be registered in Chile, an aircraft must be wholly owned by either:
Safety.The DGAC requires that all aircraft operated by Chilean airlines be registered either with the DGAC or with an equivalent supervisory body in a country other than Chile. All aircraft must have a valid certificate of airworthiness issued by either the DGAC or an equivalent non-Chilean supervisory entity. In addition, the DGAC will not issue maintenance permits to a Chilean airline until the DGAC has assessed the airline’s maintenance capabilities. The DGAC renews maintenance permits annually, and has approved our maintenance operations. Only DGAC-certified maintenance facilities or facilities certified by an equivalent non-Chilean supervisory body in the country where the aircraft is registered may maintain and repair the aircraft operated by Chilean airlines. Aircraft maintenance personnel at such facilities must also be certified either by the DGAC or an equivalent non-Chilean supervisory body before assuming any aircraft maintenance positions.
Security.The DGAC establishes and supervises the implementation of security standards and regulations for the Chilean commercial aviation industry. Such standards and regulations are based on standards developed by international commercial aviation organizations. Each airline and airport in Chile must submit an aviation security handbook to the DGAC describing its security procedures for the day-to-day operations of commercial aviation and procedures for staff security training. LAN has submitted its aviation security handbook to the DGAC. Chilean airlines that operate international routes must also adopt security measures in accordance with the requirements of applicable bilateral international agreements.
Airport Policy.The DGAC supervises and manages airports in Chile, including the supervision of take-off and landing charges. The DGAC proposes airport charges, which are approved by the JAC and are the same at all airports. Since the mid-90s, a number of Chilean airports have been privatized, including the Comodoro Arturo Merino Benítez International Airport in Santiago. At the privatized airports, the airport administration manages the facilities under the supervision of the DGAC and JAC.
Environmental and Noise Regulation.There are no material environmental regulations or controls imposed upon airlines, applicable to aircraft, or that otherwise affect us in Chile, except for environmental laws and regulations of general applicability. There is no noise restriction regulation currently applicable to aircraft in Chile. However, Chilean authorities are planning to pass a noise-related regulation governing aircraft that fly to and within Chile. The proposed regulation will require all such aircraft to comply with certain noise restrictions, referred to in the market as Stage 3 standards. LAN’s fleet already complies with the proposed restrictions so we do not believe that enactment of the proposed standards would impose a material burden on us.
Argentina
Aeronautical Regulation
Both theAdministración Nacional de Aviación Civil (“ANAC”) and the SecretaryMinistry of Transport oversee and regulate the Argentinean aviation industry. ANACIANAC regulates flight operations, including personnel, aircraft and security standards, air traffic control and airport management, and reports indirectlydirectly to the Ministry of Planning andTransport. ANAC also is responsible for supervising compliance with Argentinean laws and regulations relating to air navigation. The SecretaryMinistry of Transport also reports to the Ministry of Planning and regulates the assignment of international routes and matters related to tariff regulation policies. We have obtained and maintain the necessary authorizations from the Argentinean government to conduct flight operations, including authorization certificates and technical operative certificates from ANACI,ANAC, the continuation of which is subject to the ongoing compliance with applicable statutes, rules and regulations pertaining to the airline industry, including any rules and regulations that may be adopted in the future.
Argentina is a contracting state and a permanent member of the ICAO, an agency of the United Nations established in 1947 to assist in the planning and development of international air transport. The ICAO establishes technical standards for the international aviation industry, which Argentinean authorities have incorporated into Argentinean laws and regulations. In the absence of applicable Argentinean regulation concerning safety or maintenance, the ANACIANAC has incorporated by reference the majority of the ICAO’s technical standards. We believe that we are in material compliance with all such relevant technical standards.
Route Rights
Domestic Routes. In Argentina, airlines are required to obtain permits in connection with carrying passengers or cargo on any domestic routes, and to comply with the technical requirements established by the local authority. There are no regulatory barriers preventing a foreign airline from creating an Argentine subsidiary and entering the Argentine domestic market using that subsidiary. However, ownership of such subsidiary by the foreign airline may not be direct, but through a subsidiary formed in Argentina, which in turn may be directly or indirectly owned by the foreign company. However, such subsidiary should operate Argentine registeredArgentine-registered aircraft and employ Argentine aeronautical personnel.
International Routes. As an airline providing services on international routes, LANLATAM Argentina is also subject to a variety of bilateral civil air transport agreements that provide for the exchange of air traffic rights between Argentina and various other countries. There can be no assurance that existing bilateral agreements between Argentina and foreign governments will continue. Furthermore, a modification, suspension or revocation of one or more bilateral treaties could have a material adverse effect on our operations and financial results.
International route rights, as well as the corresponding landing rights, are derived from a variety of air transport agreements negotiated between Argentina and foreign governments. Under such agreements, the government of one country grants the government of another country the right to designate one or more of its domestic airlines to operate scheduled services to certain destinations of the former and, in certain cases, to further connect to third-country destinations. In Argentina, when additional route frequencies to and from foreign cities become available, any eligible airline may apply to obtain them. ANACIANAC grants route frequencies subject to the condition that the recipient airline operate them on a permanent basis. If an airline fails to operate a route for a period of six months or more, the ANACIANAC may terminate its rights to that route.
Airfare Pricing Policy. Argentine airlines are permitted to establish their own international fares without government regulation, as long as they do not abuse any dominant market position they may enjoy. Yet,However, there are government-fixed maximum and minimum prices for domestic flights.
Registration of Aircraft. Aircraft registration Government-fixed maximum prices were in Argentina is governed byplace until February 3, 2016, when the Argentinean Aeronautical Code (“AAC”). In order to register or continue to be registered in Argentina, an aircraft must be wholly owned by either:
Safety.ANACI requires that all aircraft operated by Argentinean airlines be registered with ANACI. All aircraft must have a valid certificate of airworthiness issued by ANACI. In addition, ANACI will not issue maintenance permits to an Argentinean airline until ANACI has assessed the airline’s maintenance capabilities. ANACI renews maintenance permits periodically and approves maintenance operations once the airline initiates its operations and each time an airline changes its maintenance regime. Only ANACI-certified maintenance facilities (in Argentina or in any other country) may maintain and repair the aircraft operated by Argentinean airlines. Aircraft maintenance personnel at such facilities must also be certified by ANACI before assuming any aircraft maintenance positions.minimum prices.
Security.ANACI establishes and supervises the implementation of security standards and regulations for the Argentinean commercial aviation industry. Such standards and regulations are based on standards developed by international commercial aviation organizations. Each airline and airport in Argentina must submit an aviation security handbook to ANACI describing its security procedures for the day-to-day operations of commercial aviation and procedures for staff security training. LAN Argentina has submitted its aviation security handbook to ANACI. Argentinean airlines that operate international routes must also adopt security measures in accordance with the requirements of applicable bilateral international agreements.
Airport Policy.The ORSNA (Organismo Regulador del Sistema Nacional de Aeropuertos) supervises and manages the airports in Argentina, including the supervision of take-off and landing charges. The ORSNA proposes airport charges, which are approved by ANACI and are the same at all airports. Nevertheless, while domestic flights are charged in local currency, international flights are charged in U.S. dollars. Since the late-90s, a number of Argentinean airports have been privatized, including Aeroparque and Aeropuerto Internacional de Ezeiza Ministro Pistarini in Buenos Aires, the two most important airports in Argentina. At the privatized airports, the airport administration manages the facilities under the supervision of ANACI and ORSNA.
Environmental and Noise Regulation.There are no material environmental regulations or controls imposed upon airlines, applicable to aircraft, or that otherwise affect us in Argentina, except for environmental laws and regulations of general applicability and noise restriction regulation currently applicable to aircraft in Argentina. Any aircraft operated by an Argentinean airline should comply with certain noise restrictions, specifically with Stage 3 standards, as set forth in chapter 91.805 of the Argentinean civilian aviation regulations (Regulaciones Argentinas de Aviación Civil) referred to in the market as Stage 3 standards. LAN’s fleet already complies with the proposed restrictions so we do not believe that enactment of the proposed standards would impose a material burden on us.
Peru
Aeronautical Regulation
The Peruvian DGAC (“PDGAC”) oversees and regulates the Peruvian aviation industry. The PDGAC reports directly to the Ministry of Transportation and Communications and is responsible for supervising compliance with Peruvian laws and regulations relating to air navigation. In addition, the PDGAC regulates the assignment of national and international routes, and the compliance with certain insurance requirements, and it regulates flight operations, including personnel, aircraft and security standards, air traffic control and airport management. We have obtained and maintain the necessary authorizations from the Peruvian government to conduct flight operations, including authorization and technical operative certificates, the continuation of which is subject to the ongoing compliance with applicable statutes, rules and regulations pertaining to the airline industry, including any rules and regulations that may be adopted in the future.
Peru is a contracting state and a permanent member of the ICAO. The ICAO establishes technical standards for the international aviation industry, which Peruvian authorities have incorporated into Peruvian laws and regulations. In the absence of an applicable Peruvian regulation concerning safety or maintenance, the PDGAC has incorporated by reference the majority of the ICAO’s technical standards. We believe that we are in material compliance with all relevant technical standards.
Route Rights
Domestic Routes.Peruvian airlines are required to obtain permits in connection with carrying passengers or cargo on any domestic routes and to comply with the technical requirements established by the PDGAC.Non-Peruvian airlines are not permitted to provide domestic air service between destinations in Peru.
International Routes.As an airline providing services on international routes, LANLATAM Peru is also subject to a variety of bilateral civil air transport agreements that provide for the exchange of air traffic rights between Peru and various other countries. There can be no assurance that existing bilateral agreements between Peru and foreign governments will continue, and a modification, suspension or revocation of one or more bilateral treaties could have a material adverse effect on our operations and financial results.
International route rights, as well as the corresponding landing rights, are derived from a variety of air transport agreements negotiated between Peru and foreign governments. Under such agreements, the government of one country grants the government of another country the right to designate one or more of its domestic airlines to operate scheduled services to certain destinations of the former and, in certain cases, to further connect to third-country destinations. In Peru, when additional route frequencies to and from foreign cities become available, any eligible airline may apply to obtain them. If there is more than one applicant for a route frequency, the PDGAC awards it through a public auction for a period of four years. The PDGAC grants route frequencies subject to the condition that the recipient airline operate them on a permanent basis. If an airline fails to operate a route for a period of 90 days or more, the PDGAC may terminate its rights to that route, although that has never happened in practice.
Airfare Pricing Policy.Peruvian airlines are permitted to establish their own domestic and international fares without government regulation, as long as they do not abuse any dominant market position they may enjoy. For more information, see “—Antitrust Regulation” below. Airlines or other interested parties may file complaints before the Institute for Protection of Fair Competition and Consumer Rights (“Indecopi”) with respect to monopolistic or other pricing practices by other airlines that violate Peru’s antitrust laws.
Registration of Aircraft.Aircraft registration in Peru is governed by the Peruvian Civil Aviation Law. In order to own and register a Peruvian aircraft, the following conditions shall apply:
Safety. Peruvian law allows the use of aircraft that are registered either with the PDGAC or with an equivalent supervisory body in a country other than Peru. All aircraft must have a valid certificate of airworthiness issued by either the PDGAC or an equivalent non-Peruvian supervisory entity. In addition, the PDGAC will issue maintenance permits to a Peruvian airline as long as the PDGAC has assessed the airline’s maintenance capabilities. The PDGAC has approved our maintenance operations. Only PDGAC-certified maintenance facilities or facilities certified by an equivalent non-Peruvian supervisory body in the country where the aircraft is registered may maintain and repair the aircraft operated by Peruvian airlines. Aircraft maintenance personnel at such facilities must also be certified either by the PDGAC or an equivalent non-Peruvian supervisory body before be appointed to any aircraft maintenance positions.
Security.The PDGAC establishes and supervises the implementation of security standards and regulations for the Peruvian commercial aviation industry. Such standards and regulations are based on standards developed by international commercial aviation organizations. Each airline and airport in Peru must submit an aviation security handbook to the PDGAC describing its security procedures for the day-to-day operations of commercial aviation and procedures for staff security training. LAN Peru has submitted its aviation security handbook to the PDGAC. Peruvian airlines that operate international routes must also adopt security measures in accordance with the requirements of applicable bilateral international agreements.
Airport Policy. CORPAC supervises and manages airports in Peru, including the supervision of take-off and landing charges. CORPAC sets airport charges for navigation facilities, which may differ from airport to airport. Since the mid-90s, a number of Peruvian airports have been privatized, including the Aeropuerto Internacional Jorge Chávez in Lima. At the privatized airports, the airport administration manages the facilities under the supervision of theOrganismo Supervisor de la Inversión en Infraestructura de Transporte de Uso Público, (the Supervising Agency of Investment in Public Transport Infrastructure Facilities or “OSITRAN”), an independent regulatory and supervising entity.
Environmental and Noise Regulation.There are no specific material environmental regulations or controls imposed upon airlines, applicable to aircraft, or that otherwise materially affect us in Peru, except for environmental laws and regulations of general applicability. There are noise restriction regulations currently applicable to aircraft in Peru. LAN’s fleet complies with the proposed restrictions so they do not impose a material burden on us.
Ecuador
Aeronautical Regulation
There are two institutions that control commercial aviation on behalf of the State: (i) The National Civil Aviation Board (“CNAC”), which directs aviation policy; and (ii) the General Civil Aviation Bureau (“EDGAC”), which is a technical regulatory and control agency. The CNAC issues operating permits and grants operating concessions to national and international airlines. It also issues opinions on bilateral and multilateral air transportation treaties, allocates routes and traffic rights, and approves joint operating agreements such as wet leases and shared codes.
Fundamentally, the EDGAC is responsible for:
The EDGAC also must comply with the standards and recommended methods of the ICAO since Ecuador is a signatory of the 1944 Chicago Convention.
Route Rights
Domestic Routes.Airlines must obtain authorization from CNAC (an operating permit or concession) to provide air transportation. For domestic operations, only companies incorporated in Ecuador can operate locally, and only Ecuadorian-licensed aircraft and dry leases are authorized to operate domestically.
International Routes.Permits for international operations are based on air transportation treaties signed by Ecuador or, otherwise, the principle of reciprocity is applied. All airlines doing business in Latin America that are incorporated in countries that are members of theComunidad Andina de Naciones (the Andean Community, or “CAN”) obtain their traffic rights on the basis of decisions currently in force under that regime, in particular decision N°582 of 2004, which guarantee free access to markets, with no type of restriction except technical considerations.
Shared codes are allowed in Ecuador after authorization by the CNAC, but the respective airlines must have the relevant traffic rights.
Airfare Pricing Policy.On October 13, 2011, The Statutory Law of Regulation and Control of the Market Power was passed with a purpose to avoid, prevent, correct, eliminate and sanction the abuse of economic operators with market power, as well as to sanction restrictive, disloyal and agreements involving collusive practices. This Law creates a new public entity as the maximum authority of application and establishes the procedures of investigation and the applicable sanctions, which are severe. Rates are not regulated and are subject only to registration. In general, bilateral treaties regarding air transportation provide for airfares to be regulated by the regulation of the country of origin.
Registration of Aircraft.The legislation allows Ecuadorian companies to provide international air transportation services using aircraft licensed in Ecuador and aircraft with a foreign license, always provided the latter are exploited under dry leases. For domestic operations, aircraft is authorized only pursuant to dry leases and Ecuadorian registration. Aircraft interchange agreements are also allowed for international operations, provided that the aviation authority can confirm that the aircraft is under the operational control of an Ecuadorian operator. Wet leases are permitted, but very restricted.
Safety. In order to ensure aviation safety, the EDGAC requires that the airline hold an Air Operator Certificate and have Operating Specifications that are examined technically and rigorously to ensure compliance with the Civil Aviation Technical Regulations, which are essentially the same as the Federal Aviation Regulations (“FAR”) of the FAA. They cover matters of aircraft airworthiness, certification of maintenance facilities, and oversight by the EDGAC.
Security.The governing rules also apply to security in respect of the EDGAC. There are regulations, manuals and procedures on airport security overseen by the EDGAC.
Airport Policy. The international airports in Quito and Guayaquil are managed under administrative concessions, and the EDGAC merely controls air traffic. Fees for the use of airport facilities, terminal fees, landing fees, parking fees are all overseen and collected by the operator. Over-flight and approach fees are controlled and collected by the EDGAC.
Environmental and Noise Regulation.Aircraft must comply with the standards of category 3 under Ecuadorian applicable noise regulations, as set forth in Executive Decree (Decreto Ejecutivo) 1,405, enacted on October 24,2008, which provides certain technical specific criteria. Beginning in May 2010, aircraft must comply with standards of category 4 under cited regulation. Category 3 provides for compliance with ICAO regulations and technical conditions mandatory in the United States of America.
United States of America
Aeronautical Regulation
Operations to and from the United States by non-U.S. airlines, such as LAN, are subject to Title 49 of the U.S. Code, under which the Department of Transportation (“DOT”) and the FAA exercise regulatory authority. The DOT has jurisdiction over international aviation in connection with the United States, subject to review by the President of the United States. The DOT also has jurisdiction with respect to unfair practices and methods of competition by airlines and related consumer protection matters. The U.S. DOJ also has jurisdiction over airline competition matters under the U.S. federal antitrust laws. Flight operations between Chile and the United States by airlines licensed by either country are governed generally by the open skies air transport agreement that Chile and the United States signed in October 1997. Under the open skies agreement, there are no restrictions on the number of destinations or flights that either a U.S. or a Chilean airline may operate between the two countries or on the number of U.S. and Chilean airlines that may operate.
Authorizations and Licenses
LAN is authorized by the DOT to engage in scheduled and charter air transportation services, including the transportation of persons, property (cargo) and mail, or combinations thereof, between points in Chile and points in the United States and beyond (via intermediate points in other countries). LAN holds the necessary authorizations from the DOT in the form of a foreign air carrier permit, Exemption Authorizations and Statements of Authorization to conduct current operations to and from the United States. Exemptions and Statements of Authorization are temporary in nature and are subject to renewal and therefore there can be no assurance that any particular exemption or statement of authorization will be renewed. LAN’s foreign air carrier permit has no expiration date, while a renewal of the exemption authorization (which includes the open skies traffic rights) was timely filed and the Authority was automatically extended until such time as the DOT issues the renewal order. LAN intends to request the inclusion of the open skies rights into our foreign air carrier permit, which would eliminate our need to renew the exemption authority in the future.
The FAA is engaged in the regulation with respect to safety matters, including aircraft maintenance and operations, equipment, aircraft noise, ground facilities, dispatch, communications, personnel, training, weather observation and other matters affecting air safety. The FAA requires each foreign air carrier to obtain certain operations specifications that authorize it to operate to particular airports on approved international routes using specified equipment. LAN currently holds FAA operations specifications under Part 129 of the FAR in compliance in all material respects with all requirements necessary to maintain in good standing of its operations specifications issued by the FAA. The FAA can amend, suspend, revoke or terminate those specifications, or can suspend temporarily or revoke permanently our authority if an airline fails to comply with the regulations, and can assess civil penalties for such failure. A modification, suspension or revocation of any of our DOT authorizations or FAA operations specifications could have a material adverse effect on our business.
The FAA also conducts safety audits and has the power to impose fines and other sanctions for violations of airline safety regulations. We have not incurred any material fines related to operations.
Security. On November 19, 2001, the Congress of the United States passed, and the President signed into law, the Aviation and Transportation Security Act, also referred to as the Aviation Security Act. This law federalized substantially all aspects of civil aviation security and created the Transportation Security Administration (“TSA”), which took over security responsibilities previously held by the FAA. The TSA is an agency of the U.S. Department of Homeland Security. The Aviation Security Act requires, among other things, the implementation of certain security measures by airlines and airports, such as the requirement that all passenger bags be screened for explosives. Funding for airline and airport security required under the Aviation Security Act is provided in part by a US$2.50 per segment passenger security fee, subject to a US$10 per roundtrip cap; however, airlines are responsible for costs in excess of this fee. Implementation of the requirements of the Aviation Security Act has resulted in increased costs for airlines and their passengers. Since the events of September 11, 2001, Congress has mandated and the TSA has implemented numerous security procedures and requirements that have imposed and will continue to impose burdens on airlines, passengers and shippers.
Noise Restrictions. Under the Airport Noise and Capacity Act of 1990 (“ANCA”), and related FAA regulations, aircraft that fly to the United States must comply with certain Stage 3 noise restrictions, which are currently the most stringent FAA noise requirements. All of our aircraft that fly to the United States meet the Stage 3 requirements.
Under the direction of the ICAO, governments are considering the creation of a new and more stringent noise standard than that contained in the ANCA. The ICAO adopted new noise standards in 2001 that established more stringent noise requirements for aircraft manufactured after January 1, 2006. In the U.S., legislation known as the “Vision 100—Century of Aviation Reauthorization Act,” which was signed into law in December 2003, required the FAA to issue regulations implementing Stage 4 noise standards consistent with recommendations adopted by the ICAO. FAA regulations require all aircraft designed and certified after January 1, 2006 to comply with Stage 4 noise restrictions.
FAA regulations also require compliance with the Traffic Alert and Collision Avoidance System, approved airborne wind shear warning system and aging aircraft regulations. Our entire fleet meets these requirements.
Brazil
Aeronautical Regulation
The Brazilian aviation industry is regulated and overseen by the ANAC. The ANAC reports directly to the Civil Aviation Secretary, which is subordinated by the Federal Executive Power of this country. Primarily on the basis of Law No. 11.182/2005, ANAC was created to regulate commercial aviation, air navigation, the assignment of domestic and international routes, compliance with certain insurance requirements, flight operations, including personnel, aircraft and security standards, air traffic control, in this case sharing itits activities and responsibilities with theDepartamento de Controle do Espaço Aéreo (Department of Airspace Control) (“DECEA”),which is a public secretary also subordinated to the Brazilian Defense Ministry, and airport management, in this last case sharing responsibilities with theEmpresa Brasileira de Infra-Estrutura Aeroportuária (the Brazilian Airport Infrastructure Company, or “INFRAERO”), a public company that was created by Law No. 5862/72, and is responsible for administrating, operating and exploring Brazilian airports industrially and commercially (with the exception of Guarulhos International Airport, Viracopos International Airport and Brasilia International Airport, which waswere privatized in 2012 and are administrated by concession agreement).
We have obtained and maintain the necessary authority from the Brazilian government to conduct flight operations, including authorization and technical operative certificates from ANAC, the continuation of which is subject to ongoing compliance with applicable statutes, rules and regulations pertaining to the airline industry, including any rules and regulations that may be adopted in the future.
ANAC is the Brazilian civil aviation authority and it is responsible for supervising compliance with Brazilian laws and regulations relating to air navigation. Brazil is a contracting state and a permanent member of the ICAO. The ICAO establishes technical standards for the international aviation industry, which Brazilian authorities, represented by the Brazilian Defense Ministry, have incorporated into Brazilian laws and regulations. In the absence of an applicable Brazilian regulation concerning safety or maintenance, ANAC has incorporated by reference the majority of the ICAO’s technical standards.
Route Rights
Domestic Routes. Brazilian airlines are not required to obtain permits in connection with domestic passenger or cargo transportation, but only to comply with the technical requirements established by ANAC. Based on the Brazilian Aeronautical Code (“CBA”) established by Law No. 7.565/86,non-Brazilian airlines are not permitted to provide domestic air service between destinations in Brazil. The same law prevents a foreign airline from creating a Brazilian subsidiary and entering the Brazilian domestic market using that subsidiary.
International Routes. Brazilian andnon-Brazilian airlines providing services on international routes are also subject to a variety of bilateral civil air transport agreements that provide for the exchange of air traffic rights between Brazil and various other countries. International route rights, as well as the corresponding landing rights, are derived from a variety of air transport agreements negotiated between Brazil and foreign governments. Under such agreements, the government of one country grants the government of another country the right to designate one or more of its domestic airlines to operate scheduled services to certain destinations of the former and, in certain cases, to further connect to third-country destinations. In Brazil, when additional route frequencies to and from foreign cities become available, any eligible airline may apply to obtain them. If there is more than one applicant for a route frequency ANAC must carry out a public bid and award it to the elected airline. ANAC grants route frequencies subject to the condition that the recipient airline operate them on a permanent basis. If an airline fails to operate a route for a period of six months or more, ANAC may terminate its rights to that route. ANAC may also terminate its right if the recipient airline does not operate at least 80% of the frequency given for that specific route.
Airfare Pricing Policy. Brazilian andnon-Brazilian airlines are permitted to establish their own international and domestic fares, in this last case only for Brazilian airlines, without government regulation, as long as they do not abuse any dominant market position they may enjoy. Airlines may file complaints before the Antitrust Court with respect to monopolistic or other pricing practices by other airlines that violate Brazil’s antitrust laws.
Registration of Aircraft. Aircraft registration in Brazil is managed by ANAC, which maintains the Brazilian Aeronautical Register, as regulated by the CBA. The CBA allows ANAC to permit registration of aircraft belonging to Brazilian and non-Brazilian individuals.
Safety. ANAC requires that all Brazilian aircraft must have a valid certificate of airworthiness issued by ANAC. In addition, ANAC will not issue maintenance permits to a Brazilian airline until it has assessed the airline’s maintenance capabilities. ANAC renews maintenance permits annually, and has approved our maintenance operations. Only ANAC certifies aircraft maintenance services and its personnel.
Security. ANAC establishes and supervises the implementation of security standards and regulations for the Brazilian commercial aviation industry. Such standards and regulations are based on standards developed by international commercial aviation organizations. Each airline and airport in Brazil must submit an aviation security handbook to ANAC describing its security procedures for the day-to-day operations of commercial aviation and procedures for staff security training.
Brazilian Airport Policy. INFRAERO supervises and manages airports in Brazil, including the supervision of take-off and landing charges. INFRAERO proposes airport charges, which are approved by ANAC and are the same at all airports. At privatized airports, the airport administration manages the facilities under the supervision of ANAC.
Environmental and Noise Regulation. ANAC coordinates and supervises noise regulations by regulation 121, which established noise restriction applicable to aircraft in Brazil. There are no material environmental regulations or controls imposed specifically upon airlines companies, applicable to aircraft, other than Brazilian general environmental laws and regulations.
Colombia
Aeronautical Regulation
The governmental entity in charge of regulating, directing and supervising the civil aviation in Colombia is the Aeronáutica Civil (“AC”), a technical agency ascribed to the Ministry of Transportation. The AC is the aeronautical authority for the entire domestic territory, in charge of regulating and supervising the Colombian air space. The AC may interpret, apply and complement all civil aviation and air transportation regulation to ensure compliance with the Colombian Aeronautical Regulations (“RAC”). The AC also grants the necessary permits for air transportation.
Route Rights
The AC grants operation permits to domestic and foreign carriers that intend to operate in, from and to Colombia. In the case of Colombian airlines, in order to obtain the operational permit the company must comply with the RAC and fulfill legal, economic and technical requirements, to later be subject to public hearings where the public convenience and necessity of the service is considered. The same process must be followed to add national or international routes, whose concession is subject to the bilateral instruments entered into by Colombia. Routes cannot be transferred under any circumstance and there is no limit to foreign investment in domestic airlines.
Airfare Pricing Policy.Since July 2007, as stated in resolution 3299 of the Aeronautical Civil entity, bottom level airfares for both international and domestic transportation were eliminated. Under resolution 904 issued in February 2012, the Aeronautical Civil entity decidedauthority ceased to liberalizeimpose the obligation of charging a fuel surcharge for both domestic and international transportation of passengers and cargo. As of April 1, 2012, air carriers may now freely decide whether or not to charge a fuel surcharge. In the case that it isa fuel surcharge charged, the fuel surchargeit must be part of the fare, but mayshall be informed separately on the tickets, advertising or other methods of marketing used by the company.
In the same line, as of April 1, 2012 there is no longer be any restriction on top levelmaximum fares published by the airlines or with respect to the obligations for air carriers to report to the Aeronautical civil entityauthority the fares and conditions the day after being published.
Administrative fares are not subject to any changes, and its charge is an obligationmandatory for the transport of passengers under Aeronautical Civil Regulations.
Registration of Aircraft.The AC, Differential administrative fares apply to ticket sales made through the Office of Aeronautical Registration, is in charge of handling the registration of aircraft that will be operated by Colombian airlines. Registration may be obtained by a registration process fully conducted in Colombia or through the validation in Colombia of a foreign registration. For such registration, the aircraft must be legally imported to the country and inspected by the aeronautical inspectors. This office is also in charge of property registrations, lease contracts and liens of the registered aircraft.
Safety. Aircraft registered in Colombia obtain an airworthiness certificate or a validation of the airworthiness certificate (if they operate under the approval of the foreign registration).
Security.Following the guidelines of the OACI annexes, the AC issued an airport security program that must be strictly complied with by all the aircraft operators in the country as well as by airports.
Environmental and Noise Regulation.In Colombia, only aircraft that comply with category 3 noise limits may operate. There are strict regulations to control noise during takeoffs and landings of the aircraft at the El Dorado Airport in Bogotá due to its location in an urban area.internet channels.
Antitrust Regulation
The Chilean antitrust authority, which we refer to as the Antitrust Court (previously the Antitrust Commission), oversees antitrust matters, which are governed by Decree Law No. 211 of 1973, as amended, or the Antitrust Law. The Antitrust Law prohibits any entity from preventing, restricting or distorting competition in any market or any part of any market. The Antitrust Law also prohibits any business or businesses that have a dominant position in any market or a substantial part of any market from abusing that dominant position. An aggrieved person may sue for damages arising from a breach of Antitrust Law and/or file a complaint with the Antitrust Court requesting an order to enjoin the violation of the Antitrust Law. The Antitrust Court has the authority to impose a variety of sanctions for violations of the Antitrust Law, including termination of contracts contrary to the Antitrust Law, dissolution of a company and imposition of fines and daily penalties on businesses. Courts may award damages and other remedies (such as an injunction) in appropriate circumstances. As described above under “—Chile—Route Rights—Airfare Pricing Policy,” in October 1997, the Antitrust Court approved a specific self-regulatory fare plan for us consistent with the Antitrust Court’s directive to maintain a competitive environment within the domestic market.
Since October 1997, LAN Airlines S.A.LATAM and LAN ExpressLATAM Chile follow a self-regulatory plan, which was modified and approved by the Tribunal de la Libre Competencia (the Competition Court) in July 2005, and further in September 2011. In February 2010, the Fiscalía Nacional Economica (the National Economic Prosecutor’s Office) finalized the investigation initiated in 2007 regarding our compliance with this self-regulatory plan and no further observations were mademade.
As a condition to the business combination between LAN and TAM in June 2012, the antitrust authorities in Chile and in Brazil each imposed certain mitigation measures as part of their approval of the merger.combination . Furthermore, the mergerassociation was submitted to the antitrust authorities in Germany, Italy and Spain. All these jurisdictions granted unconditional clearances for this transaction. The mergerassociation was filed with the Argentinean antitrust authorities, which approval is still pending. For more information regarding these mitigation measures please see below:
Chile
On September 21, 2011, the TDLC issued the Decisiona decision (the “Decision”) with respect to the consultation procedure initiated on January 28, 2011 in connection with the proposed combination.combination between LAN and TAM. The TDLC, in the Decision, approved the proposed combination between LAN and TAM, subject to 14 conditions, as generally described below:
| 1. | exchange of certain slots in the Guarulhos Airport at Sao Paulo, Brazil; |
| 2. | extension of the frequent flyer program to airlines operating or willing to operate theSantiago-Sao Paulo,Santiago-Río de Janeiro, Santiago-Montevideo and Santiago-Asunción routes during the five-year period from the effective time of the combination; |
| 3. | execution of interline agreements with airlines operating theSantiago-Sao Paulo,Santiago-Río de Janeiro and Santiago-Asunción routes; |
| 4. | certain capacity and other transitory restrictions applicable to theSantiago-São Paulo route; |
| 5. | certain amendments to LAN’s self-regulatory fare plan approved by the TDLC with respect to LAN’s domestic passenger business; |
| 6. | the obligation of LATAM to renounce to one global airline alliance within 24 months from the date in which the combination becomes effective, except in the case that the TDLC approves otherwise, or to elect not to participate in any global airline alliance; |
| 7. | certain restrictions on code-sharing agreements outside the global airline alliance to which LATAM belongs for routes with origin or destination in Chile or that connect to North America and Europe, or with Avianca/TACA or Gol for international routes in South America, including the obligation to consult with, and obtain approval from, the TDLC prior to its execution of certain of those codeshare agreements; |
| 8. | the abandonment of four air traffic frequencies with fifth freedom rights between Chile and Perú and limitations on acquiring in excess of 75%, as applicable, of the air traffic frequencies in that route and the period that certain air traffic frequencies may be granted by the Chilean air transport authorities to LATAM; |
| 9. | issuance of a statement by LATAM supporting the unilateral opening of the Chilean domestic skies (cabotage) and abstention from any actions that would prevent such opening; |
| 10. | promotion by LATAM of the growth and normal operation of the Guarulhos (Brazil) and Arturo Merino Benítez (Chile) airports, to facilitate access thereto to other airlines; |
| 11. | certain restrictions regarding incentives to travel agencies; |
| 12. | to maintain temporarily 12 round trip flights per week between Chile and the United States and at least seven round tripnon-stop flights per week between Chile and Europe; |
| 13. | certain transitory restrictions on increasing fares in theSantiago-Sao Paulo andSantiago-Río de Janeiro routes for the passenger business and for theChile-Brazil routes for the cargo business; and |
| 14. | engaging an independent consultant, expert in airline operations, which for 36 months, and in coordination with the FNE, will monitor and audit compliance with the conditions imposed by the Decision. |
On or about June 2015, the FNE initiated a legal claim against LATAM before the TDLC alleging that LATAM was not complying with certain mitigation conditions related to the code share agreements with airlines outside LATAM’s global alliance as referenced above. Although LATAM opposed this allegation and responded the claim accordingly, a settlement agreement was reached between the FNE and LATAM. The Settlement Agreement approved by the TDLC with respect to LAN’s domestic passenger business;
Brazil
The Brazilian Council for Economic Defense – CADE approved the Santiago-Săo Paulo and Santiago-Río de Janeiro routes forLAN/TAM merger by unanimous decision during the passenger business and for the Chile-Brazil routes for the cargo business; and
Brazil
On September 3, 2010, LAN and TAM submitted a merger filing before the Brazilian Antitrust System, composedhearing session of CADE, the SDE and the SEAE. The filing was made based on the Memorandum of Understanding, executed by the parties on August 13, 2010. As per the request of the parties, the SEAE suspended its analysis of the merger filing until the parties had taken more definitive steps with respect to the proposed combination. On October 21, 2010, the parties informed SEAE of the execution of the Instrumento Particular de Ratificaçăo de Entendimento by the parties on October 12, 2010, pursuant to which the parties agreed on a transaction structure for the proposed combination and thus requested that SEAE resume its analysis of the merger filing. SEAE issued its report approving the merger filing without any restrictions on August 11, 2011. The case was then further examined by CADE’s Reporting Commissioner, Olavo Chinaglia, for an additional four months. CADE sent information requests to LAN and TAM (Official Letter Nos. 1830/2011; 1945/2011; 2410/2011; and 2493/2011) to complement SEAE’s analysis. On December 14, 2011, the case was adjudicated in a Plenary Session, where the board of CADE approved the transaction withsubject to the following conditions: (i) LAN(1) the new combined group (LATAM) should leave one of the two global alliances to which it was part (Star Alliance oroneworld); and TAM cannot be members of more than one global airline alliance; (ii) LAN and TAM must(2) the new combined group (LATAM) should offer to swap two pairs of slots atin Guarulhos International Airport, to be used by an occasional third party interested in offering directnon-stop flights between São Paulo and Santiago, Chile. These impositions are in line with the Guarulhos Airport with one or more companies that is willing to operate non-stop flightsmitigation measures adopted by the TDLC, in the Săo Paulo-Santiago route, granting the swapping companies the necessary infrastructure in the Guarulhos Airport; and (iii) LAN and TAM must publish the contents of the decision in newspapers widely sold in Brazil, and send letters to carriers that operate commercial flights from the Guarulhos Airport, informing them of the decision.Chile.
C. ORGANIZATIONAL STRUCTURE
LATAM Airlines Group is a company primarily involved in the transportation of passengers and cargo. Our operations are carried out principally by LAN, and by a number of different subsidiaries and affiliates, including TAM. As of January 31, 2014, in the passenger business we operatedoperates through seven main airlines: LAN,LATAM Airlines Group S.A., incorporated in Chile; Transporte Aéreo S.A. (which does business under the name “LAN Express”(“LATAM Airlines Chile”), a Chilean subsidiary; LAN PerúPeru S.A. (“LANLATAM Airlines Peru”), a Peruvian subsidiary, Aerolane, Líneas Aéreas Nacionales del Ecuador S.A. (“LANLATAM Airlines Ecuador”), and Ecuadorian subsidiary, LAN Argentina S.A. (“LANLATAM Airlines Argentina,” previously Aero 2000 S.A.), an Argentinian subsidiary, Aerovías de Integración Regional, Aires S.A. (which does business under the name “LAN(“LATAM Airlines Colombia”) and, a Colombian subsidiary; TAM Linhas Aereas S.A. (“TAM Linhas Aereas”LATAM Airlines Brazil”) incorporated in Brazil; and Transportes Aéreos del Mercosur S.A. (“LATAM Airlines Paraguay”), a Paraguayan subsidiary.
As of January 31, 20142017 we held a 99.90%100% stake in LAN ExpressTransporte Aéreo S.A. through direct and indirect interests, a 69.98%70% stake in LAN Peru through direct and indirect interests, a 71.95% indirect55.00% stake inof the voting shares of LAN Ecuador and a 100% of thenon-voting shares of Holdco Ecuador S.A., who has 45.00% of the voting shares of LAN Ecuador, a 94.99%95% indirect stake in LAN Argentina, a 98.81%99.19% indirect stake in LAN Colombia and a 100.00% stake of thenon-voting shares of TAM, and 19.42%48.99% of the voting shares and 100% ofthenon-voting of Holdco I S.A., who has 100.00% of the voting shares of TAM. Following changes in Brazilian law, which now permit foreign persons to own up to 49% of the voting capital of Brazilian airlines, on April 20, 2016, we increased our ownership of the voting shares of Holdco I S.A., who has the 100.00% of the voting shares of TAM. to 48.99%. For a description of the recent2012 combination with TAM, including TAM’s operating structure, see “Item 4. Information on the Company—A. History and Development of the Company—Combination of LAN and TAM.”
Our cargo operations are carried out by our subsidiaries and affiliates including, TAM Linhas Aereas and LANunder the new brand LATAM Cargo. Our cargo operations are complemented by the operations of certain related companies, such as Aero Transportes Mas de Carga S.A. de C.V. (“MasAir”) in Mexico, Aerolinhas Brasileiras S.A. (“ABSA”) in Brazil and Linea Aérea Carguera de Colombia S.A. (“LANCO”) in Colombia. As of January 31, 2014,2016, we indirectly held a 100% of thenon-voting shares and a 24.99% of the voting shares of MasAir, a 100% of thenon-voting shares and a 20% of the voting shares of ABSA, and an 89.90%a 90% stake in LANCO through direct and indirect participations. TAM S.A. has 100% of thenon-voting shares and 100% of the voting shares of ABSA. Following the business combination between LAN and TAM, we have coordinated the operations of ABSA and TAM Cargo in Brazil. In the cargo business, we market ourselves primarily under the LANLATAM Cargo brand internationally and the TAM Cargo brand in Brazil.internationally.
D. PROPERTY, PLANTSPLANT AND EQUIPMENT
From February 1, 2013, LAN Infrastructure Management and TAM Infrastructure Management report to the Director of Purchasing and Infrastructure of LATAM. Both LAN and TAM infrastructure management teams have worked together during 2012 and 2013 regarding strategic planning for infrastructure issues for the LATAM Airlines Group.
LAN’s Property, Plant and EquipmentChile
Headquarters
Our main facilities are located on approximately five acres of land that we own near the Comodoro Arturo Merino Benítez International Airport. The complex includes approximately 150,695 square feet of office space, 32,292 square feet of conference space and training facilities, 9,688 square feet of dining facilities andmock-up cabins used for crew instruction.
During the fourth quarter of 2003,In addition, we moved some ofoccupy 17,715 square feet for our executive offices into a new building in a more central location inof Santiago, Chile, where we initially occupied a total of fourChile. This space includes five floors owned by LAN. In the first half of 2005 we added three more floors to accommodate our growth requirements. These floors are also owned by LAN. In 2007,LATAM in order to accommodate the Company’s growth, LANone building and 16 leased two floors in an adjacent building (totaling 18,298 square feet), where somebuilding. We also own one additional floor of LAN staff moved in February 2008. We have leased these additional floors since 2007, under a 5-year lease. In 2009, to respond to the Company’s growth, LAN leased two additional floors in this building (totaling 12,917 square feet). We have leased these additional floors since 2009 until May 2016. In 2010, new offices were leased east of Santiago to allow for Company growth and to implement projects such as “Host,” which involves changing our system of reservations, sales, inventory and passenger check-in. We have leased these additional offices since 2010, under a 4-year lease. These additional offices add a total of 19,913 square feet to LAN’s property.
Furthermore, during 2011 we added to our facilities a new 11,840 square feet floor at the Arrau Building located in Santiago, Chile, which we lease for the new facilities of LAN Cargo. We have leased this floor since 2011, under a 3-year lease.Chile.
Maintenance Base
Our 877,258 square feetfoot maintenance base is located on a site that we own inside the grounds of the Comodoro Arturo Merino Benítez International Airport. This facility contains our aircraft hangar, warehouses, workshops and offices, as well as a 559,720 square feet aircraft parking area capable of accommodating up to seventeen short-haul aircraft. We have a five-floor, 53,820 square feetfoot office building plus a 10,000 square feetfoot office and workshop space. This facility is certified by several civil aviation authorities, including the United States’ FAA. As such, we are permitted to perform maintenance work for third parties at the facility. The FAA periodically inspects the facility to ensure its compliance with FAA standards. We also lease from the DGAC 193,750 square feet of space inside the Comodoro Arturo Merino Benítez International Airport for operational and service purposes. Our lease has a duration of 14 years.
During 2012, we continued to invest and improve the maintenance base infrastructure with the objective of having world class facilities, including new access to the base, which allows facilities access control, therefore, improves its security.
During 2013, we began to develop a series of infrastructure projects, the most significant of which is the construction of a north platform which allows for an additional 13 new A320 aircraft parking spaces. During 2013, a significant part of this project was completed, including 5 new parking spaces for A320 aicraft. The project is expected to be finished during the third quarter of 2014. Additionally during 2013, parking capacity for vehicles was increased by 135 new spaces.
Miami Facilities
We occupy a 36.3-acre site at the Miami International Airport that has been leased to us by the airport under a concession agreement. Our facilities include a 48,000 square feet corporate building, a 380,000 square feet cargo warehouse (including a 10,000 square meter cooling area) and a 783,000 square feet aircraft-parking platform, which were constructed and are now leased to us under a long-term contract by a North American developer, and approximately 21,528 square feet of furnished office space, which we converted from warehouse space in 2004. The rent we pay for the use of this space is approximately US$735,000 per month. We are currently negotiating with the local airport authority regarding its construction of a new hangar at the Miami International Airport, which we expect to lease from them when it is constructed.
During 2010, LAN signed a concession agreement with the AMB Property Corporation to add a new cargo warehouse for additional areas for future developments. Our concession has duration of 5 years at a rate of approximately US$215,000 per month.
During 2013, a new project for a Boeing B777 hangar was developed. This project finally received approval from Miami airport authorities in 2014 and should be completed during the first half of 2015.
Other Facilities
We own a building and sixteen acres of land and a building on the west side of the Comodoro Arturo Merino Benítez International Airport that houses a flight-training center. As of February 28, 2014, thisThis facility features three full-flight simulators for Boeing 767, Airbus A320 and Boeing 737 aircraft. We leased this flight-training center under a long-term lease to CAE Inc. (a leading Canadian company in the flight training business).
In 2004, Fast Air Almacenes de Carga S.A. (“Fast Air”), one of our subsidiariesaffiliates that operates import customs warehouses, began utilizingutilizes an import warehouse and office building at the Comodoro Arturo Merino Benítez International Airport. This 172,000 square feetfoot building was developed in conjunction with two other operators. We have leased these facilities since 2004 and as a result of a new contract signed in 2013, we will continue to operate there until September 2015.March 2017. During April 2017, we will transfer our operations to a 5,600 m² warehouses located at Comodoro Arturo Merino Benítez International Airport.
LAN Peru’s Property, Plant and Equipment
LAN Peru has approximately 19,000 m2 built. All facilities are leased and are distributed as follows:
Administrative Offices: 7,000 m2
Sales Offices: 2,000 m2
Concessions airports: 10,000 m2
We also own a 166,840 square feet of land near the Lima airport, where we have built new corporate and training facilities for the Company. The training facilities for flight and cabin crews (instructor center) completed in 2012 have capacity for two flight simulators (Airbus A320s and Boeing 767s), modern facilities for emergency evacuation practice (including pool to practice ditching) and classrooms. In addition, in 2010 leased a piece of land and hangar inside the Lima airport for our maintenance facilities, for which construction was completed in 2012. The land is rented to LAN Peru for a period of 5 years, and is renewable. The new maintenance facilities have staff facilities on three floors with approximately 3,500 m² of space, a hangar with a covered area of approximately 6,500 m² (space for three Airbus A320s or one Boeing 767) plus an outplatform of approximately 3,500 m².
Finally, we are renting eight floors in a building and three floors in another building for our corporate facilities. We are also renting twenty three commercial offices around the country.
LAN Colombia’s Property, Plant and Equipment
LAN Colombia has approximately 27,500 m2 built. All facilities are leased and are distributed as follows:
Administrative Offices: 4,500 m2
Sales Offices: 1,700 m2
Concessions airports: 21,300 m2
During 2012, new administrative and operational offices were created in the Logistic center (PARQUE DEL SOL) near the El Dorado airport in Bogota. The Project, covering 11,500 square feet, involved the remodeling and expansion of storage with offices and administrative space, with the capacity for more than 200 people.
During November 2013, a new VIP lounge covering 690m2 in the El Dorado Airport in Bogotá was completed.
LAN Ecuador’s Property, Plant and Equipment
LAN Ecuador has approximately 14,500 m2 built. All facilities are leased and are distributed as follows:
Administrative Offices: 1,600 m2
Sales Offices: 1,000 m2
Concessions airports: 11,900 m2
In Ecuador, the New Quito Airport was opened in 2013 and LAN Ecuador spent approximately US$4.5 million for facilities and infrastructure investments at this new airport. During the construction period, LAN Ecuador (and other airlines) were required to make significant investments for airport infrastructure in this new airport.
During 2012, LAN began the construction of new facilities for Andes, a company that performs ground service aircraft handling services for LAN Ecuador and acts as an airport service provider. A new facility for line maintenance and operations was also constructed. Both facilities were built on land concessioned by QUIPORT and were opened during the first quarter of 2013. Further information regarding the size and amount of these investments is detailed in the table below:
Facilities | Ground (m2) | Constructions (m2) | Pavements (m2) | Investment (US$) | ||||||||||||
ANDES | 4,000 | 3,134 | 1,800 | 2,500,000 | ||||||||||||
MAINTENANCE | 15,167 | 1,300 | 6,200 | 2,000,000 | ||||||||||||
LAN Argentina’s Property, Plant and Equipment
LAN Argentina has approximately 192,670 square feet built. All facilities are leased and are distributed as follows:
Administrative Offices: 71,042 square feet
Sales Offices: 27,986 square feet
Concessions airports: 93,646 square feet
We also have maintenance base in Argentina with a hangar of 26,900 square feet, 9,600 square feet of offices, 1,070 square feet of workshops and an exterior platform of 5,300 square feet. This project was completed in 2009. This facility is meant for the parking and maintenance of A320 aircraft and it’s capable of providing full maintenance, including C-Checks.
On December of 2012, LAN Argentina launched its new VIP lounge in Terminal B of the Ezeiza Airport. An area of 6,458 square feet was built to house a modern lounge with a capability of more than 150 passengers, with areas for resting, work, entertainment, bathrooms and shower services.
TAM’s Property Plant and EquipmentBrazil
Headquarters
TAM’sLATAM Airlines Brazil’s main facilities are located in São Paulo, in hangars within the Congonhas Airport and nearby. At Congonhas Airport, TAMLATAM Airlines Brazil leases office facilities in converted hangars belonging to INFRAERO (the Local Administrator Airport)Airport Administrator). These facilities comprise 649,933 square feet.60,380 m².
The LATAM Service Academy is located at Rua Atica, about 2.5 km from Congonhas Airport, is a separateAirport. This property, which TAMLATAM Airlines Brazil owns, exclusivelyis used for the areas of Selection, Medicalhuman resources selection, medical services, training,mock-ups and offices- The Service Training, and Mock-ups, comprisingAcademy comprises 15,342 m² of land area and 9,032 m² of building area.
We also lease office space for corporate purposes in the city of São Paulo, where we operate 1,500 workstations distributed in 11 floors and about 240 workstations.floors.
Base Maintenance
At Hangars II and V in Congonhas Airport, which TAM leases for approximately R$39,510 and R$52,665 per month, TAMfrom INFRAERO, LATAM Airlines Brazil has 15,65021,727 m² of offices and hangars with about 1,0501,300 workstations. This site also houses the areas of Aircraft Maintenance, Procurementaircraft maintenance, procurement, aeronautical materials logistics and Logistics of Aeronautical Materials, and has been receiving a retrofit since 2008 for operational improvements at a total investment amount of approximately R$ 30 million. The first two phasesretrofitting departments.
Headquarters of the retrofit have been completed, andPresidency
Completed in 2013, the third phaseHeadquarters of the Presidency has an area of 5,066 m², space for 641 workstations. The headquarters is currently being planned.located at the Tower Bridge Building in the Brooklin region of São Paulo.
Other Facilities
In São Paulo, TAMLATAM Airlines Brazil has other facilities, such as: Commercial Headquarters, an old Pantanal´s office area leased, located 7.0 km from Congonhas Airport, with 540 m² and about 94 workstations;including: Uniform Building, located 700 m from the Service Academy, with 890 m2 and about 10 workstations, exclusive useused for storage and delivery of uniforms; Morumbi Office Tower located 8.0 km from Congonhas Airport, with 330 m2 area and about 85 workstations exclusive for the Financial area,a Call Center Building at Rua Augusta near to Paulista with 110 m23,199 m2, distributed over 5 floors (plus a ground floor and a basement) that currently holds about 150 workstations distributed in four floors.
Besides, in São Paulo, TAM has the offices belonging to the Group as: Multiplus Office, located in Brooklin region at 6.7 km from Congonhas Airport, with 800 m2 leased, with approximately 150 workstations; TAM Viagens Office, located in the region of Paulista 9.0 Km from Congonhas Airport, with 2,800 m2 leased distributed in 04 floors and about 265 workstations; Two Stores of TAM Viagens, at Rua Augusta with 110 m2 leased and about 10400 workstations and at Shopping SP Market with 50 m2 leasedsupport rooms (meetings / training / dining room / coordination) of the operations of Call Center Reservations, Talk to People and about 05 workstations.LATAM Cargo Brazil back office.
In Guarulhos, TAMLATAM has a total area of approximately 12,894 m2 distributed inwithin the Passenger Terminal, Operational Areasincluding areas such asCheck-in, Ticket Sales, Check Out, Operations Areas, VIP Lounges, Aircraft Maintenance, GSE, Cargo Terminal, Distribution Centers, etc. The Cargo Terminal has 164 m2 of office and 15,0008,534 m2 of open area. TheOur Distribution Centre Supplies hasarea occupies 3,030 m2. We have a VIP Lounge recently opened in October 2012 with 540 m2, with capacity for 174 seats located in Terminal 2, and 02 other VIP Lounges with 280 m2 and 120 m2.
In Brazil, TAM has a total of 45 online sites and 10 offline/chartering/high season sites, located in the capitals and main cities of the country, composing 78,772 m2 of areas in Airports, Aircraft Maintenance, GSE, Hangars, Cargo Terminals, Commercial Offices, etc. TAM also has 133 franchised stores of TAM Viagens through Brazil.
Abroad, TAM has a total of 30 sites in 6,300 m², including 10 online sites and three offline/chartering/high season sites located in Latin America (except Brazil) with an area of 3,500 m², five online sites and one offline site in Central and North America with an area of 1,000 m², five online sites and three offline sites in Europe and three offline sites in Asia with a total area of 1,800 m².
New Headquarters
During 2013, TAM finished its project for a new headquarters with an area of 5,066 m², of which two and one-third floors are leased, space for 641 workstations and a total investment of R$12.0 million. The new headquarters is located at the Tower Bridge Building, located in Brooklin region, approximately 6.7 km from Congonhas Airport. TAM took occupancy of the new headquarters in June 2013.
New Facilities
TAM executedcompleted several infrastructure projects for newin Brazil during 2016. The main highlights are:
1. New Cargo Warehouses in Fortaleza and Rio de Janeiro: total of 3,500 m².
2. Terminal transfers in São Paulo- Viracopos and Goiânia: total of 250 m².
3. Relocation of office areas in Rio de Janeiro and São José do Rio Preto: total of 650 m².
4. Improvement of Hangar 3 at Congonhas: 4,060 m2.
Other locations
We occupy a 36.3 acre site at the Miami International Airport that has been leased to us under a concession agreement by the Miami Dade Aviation Department. Our facilities in 2013, the most significant of which wasinclude a new44,650 square feet corporate building, a 380,000 square feet cargo terminal in Manaus that integrates the operations of ABSA and TAM Cargo in the city, has a cargo space of about 4,700 m², the construction of a new ground support equipment (“GSE”) area in Guarulhos withwarehouse (including an area of approximately 19,202 m², the construction of a new GSE area in Florianópolis with an area of approximately 400 m²; the construction of a new GSE area in Vitória with 255 m²116,670 square meter cooling area) and a new distribution center783,000 square feet aircraft-parking platform. These facilities were constructed and are now leased to us under a long-term contract by Aero Term, a division of Real Term Global. The rent we pay annually for supplies in Guarulhos, with an area of approximately 3,035 m². all facilities totals US$9.6 million.
In total, TAM spent approximately R$30 million on these projects in 2013.
Building Improvements
We have approvedJune 2016 we received the “Big Picture” project, which will implement a new plan offinal occupancy permit for Hangars in the Hangars 2, 3, 5, 7 and 8 at Congonnas Airport as well as improvements of facilities and standardization of offices. The total area of the hangars is 32,777 m2 and the estimated cost is R$ 25 million. This project will be completed in the second half of 2015.
New Facilities
TAM has several projects for new facilities in 2014, the most significant of which are a new cargo terminal in Guarulhos that will integrate the operations of ABSA and TAM Cargo in Guarulhos, with a cargo space of about 15,434 m²; construction of a new Vip Lounge in Guarulhos Airport with 1,900 m2; investments of R$ 20 million targeted to general improvements of GSE facilities in all Brazilian territory and a new hangar in Guarulhos Airport for narrow and wide bodyat the Miami International Airport. The property has a 50,785 square feet aircraft maintenance the new hangar is under study but is expectedspace, sufficient to complete projects stillhouse a Boeing B777 aircraft, in 2014. The new facilities will receive an investment of R$ 51 millionaddition to a 32,440 square feet area designated for office space.
In addition, LATAM holds leases to airport concessions, administrative and sale offices, hangars and maintenance areas in 2014-2015.
Besides all projects mentioned above, some large airports in Brazil, including, like Guarulhos, Natal e Viracopos are undergoing major structural reforms promoted by the government which will require investments of R$ 8,181 for modernization of our facilities. This project is directly related to the world cup football.Argentina, Colombia, Ecuador, and Peru.
| ITEM 4A | UNRESOLVED STAFF COMMENTS |
None.
| ITEM 5. | OPERATING AND FINANCIAL REVIEW AND PROSPECTS |
A. Operating Results
You should read the following discussion of our financial condition and results of operations together with our audited consolidated financial statements and the accompanying notes beginning on pageF-1 of this annual report. As a result
The summary consolidated annual financial information as of the combination of LANDecember 31, 2016 and TAM on June 22, 2012, the discussion of LATAM’s results of operations below includes: (i) a discussion of
LATAM’s consolidated results2015 and for the yearyears ended December 31, 2013, as compared to the year ended December 31, 2012, which includes the consolidated results of TAM2016, 2015 and 2014, has been prepared in accordance with IFRS and has been derived from June 23, 2012, (ii) a supplementary discussion of LATAM’s consolidated results for the year ended December 31, 2013, as compared to the unaudited pro forma results of LATAM Airlines Group for the year ended December 31, 2012, prepared for illustrative purposes only, to present a discussion of LATAM’s results on a consolidated basis and giving effect to the combination with TAM as if it had occurred on January 1, 2012 and (iii) a discussion of LATAM’s consolidated results for the year ended December 31, 2012, which includes the consolidated results of TAM from June 23, 2012, as compared to the year ended December 31, 2011, which represent LAN’s historicalour audited consolidated results.annual financial statements included in this annual report.
Overview
The principal and most distinctive aspect ofWe derive our business model is the way in which we integraterevenues primarily from transporting passengers on our passenger andaircraft, as well as from transporting cargo activities. Our sophisticated service-oriented approach to combining passenger and cargo traffic enables us to better utilize our aircraft, reduce our break-even load factors on passenger flights, and diversify our revenue streams. Furthermore,in the geographically diversified naturebelly of our passenger aircraft and cargo networks provides additional diversification in our operations and reduces exposure to any single market. These benefits have helped us maintain profitability and expand our operations, despite volatile macroeconomic conditions and various external shocks that have affected the airline industry over the years.
dedicated freighter aircraft. In 2013, 97%2016, 82.7% of our total revenues are(including for this purpose other income from operating activities) came from passenger revenues and 11.7% came from our cargo business. The remaining 5.7% was classified as other operating income, which consists primarily of revenues generated byfrom our air transport activities. We generate the balance of our operating revenues fromcoalition and loyalty program Multiplus, tour operator services, aircraft leases, on-board sales,leasing, customs and warehouseing services, third-party maintenance, ground handlingduty free sales and customs and storage brokerage operations.other miscellaneous income.
Our operating environment in 20132016 was marked by a moderategenerally weak macroeconomic environment in Latin America, including slower GDP growth or GDP contraction. In Brazil specifically, where GDP declined by 3.5% in passenger operations,2016, the macroeconomic environment was marked by political corruption issues leading to a marked decrease in business and reduced cargo demand. For the year ended December 31, 2013consumer confidence levels. LATAM Airlines reported a net loss of US$263.8 million, largely resulting from a US$481 million foreign exchange loss arising from the 6.5% depreciation of the Brazilian realGroup successfully managed capacity throughout its markets in December 31, 2013 as comparedorder to December 31, 2012. Operating revenues decreased by 0.2% in 2013 from pro forma revenues of US$ 12,956.7 million in 2012 to US$12,924.5 million, as a result of an increase of 0.4% in passenger revenues and a decrease of 4.0% in cargo revenues.
During 2013, passenger demand responded to different trends in our business units, resulting from the diverse strategies implemented in each of them. The Company’s slight decrease in passenger capacity of 0.4% as compared to pro forma capacity for year 2012 was mainly a result of an 8.4% decrease in capacity in the domestic Brazil market and the rationalization of our international passenger operations where capacity only grew by 2.3%. These effects were partially offset by continued growth of 11.0% in capacity in our domestic Spanish speaking countries. In our domestic passenger operations in Brazil, the reduction in capacity, together with market segmentation and revenue management practices, resulted in a load factor of 79.7% in the year, which represents an increase of 6.1 percentage points as compared to pro forma figures for 2012. Revenues per ASK inaddress this market increased by 4.1% in US dollar terms as a result of these initiatives. In our international passenger operations, capacity rationalization during the year resulted in an increase of only 2.3% in capacity as compared to pro forma capacity for 2012, which led to an increase of 2.4% in traffic and a slight increase in load factors and revenues per ASK.
For the year ended December 31, 2013 the combined yield for the international and domestic passenger businesses decreased by 2.0% as compared to the pro forma yield in 2012, reflecting a more challenging environment, dueand continued to higher competition in the international routes and the impact of the 10.4% average depreciation of the Brazilian real for 2013 as compared to 2012, which impacted yields from the domestic Brazilian market. Depreciation of the local currencies in our Spanish speaking countries also impacted yields in these operations.
In the cargo business, we continue to face a challenging scenario due to a slowdown in world trade momentum, a decline in demand on routes to Latin America (especially to Brazil) and competitive pressures from new cargo carriers flying in the region, which has been partially offset by strong northbound routes. In the year ended December 31, 2013 cargorationalize capacity a measured in ATKs slightly increased by 0.1%, with a significant decrease in capacity during the last quarter of the year, whereas cargo traffic slightly decreased by 0.5%, resulting in a decrease of 0.3 percentage points in cargo load factors to 58.4%. The Company continues with a rational and disciplined approach toward freighter capacity utilization, in line with a still challengingdemand conditions on both domestic and competitive scenario in Latin American cargo markets, while focused on maximizing the belly utilization of the Company’s passenger fleet. During the month of November 2013, we grounded for redelivery one B767F aircraft, thus reducing our cargo capacityinternational operations in the quarter significantly and increasing load factors as of the end of the year.
Our operating expenses in 2013 were primarily impacted by a decrease in fuel prices, the depreciation of local currencies, especially the Brazilian real, and certain non-recurring costs related to our fleet plan restructuring. The Company continues to manage fuel prices through its fuel surcharge policy and financial hedging strategy, as well as tactical capacity adjustments on certain routes.
In June 2012, LATAM Airlines Group was formed through the business combination of LAN and TAM. During the second half of 2012, LATAM began the integration of LAN and TAM’s business units and the transformation necessary to achieve the expected merger synergies, implementing adjustments to commercial practices and aligning operations and processes in its international and domestic passenger operations in Brazil. For the years ended December 31, 2013 and 2012, LATAM incurred one-time costs of
US$56.0 million and 59.2 million (pro forma), respectively. Although in the short term the Company’s results are expected to be impacted by these transition and integration costs, the Company expects to achieve increased operating income in the long-term as a result of substantial synergies between these two businesses.market.
Passenger Operations
In general, our passenger revenues are driven by international and country-specific political and economic conditions, competitive activity, and the attractiveness of the destinations that we serve, and the capacity we allocate among our different routes.serve. Passenger revenues are also affected by our capacity, traffic, load factors, yield and unit revenue. Our capacity is measured in terms of available seat kilometers, or ASKs, which represents the sum, across our network, of the number of seats we make available for sale on each flight, multiplied by the kilometers flown.flown by the respective flight. We measure traffic in revenue passenger kilometers, or RPKs, as the sum, across our network, of the number of passengers on our flightseach flight multiplied by the number of kilometers flown.flown by the respective flight. Load factors represent RPKs (traffic) as a percentage of ASKs (capacity), or the percentage of our capacity that is actually used by paying customers. Finally,Last, we use yield, or revenue from passenger operations divided by RPKs, to measure the average amount that one passenger pays to fly one kilometer and unit revenue, or revenue per ASK, to measure the effect of capacity on revenues. See “Item 3. Key Information—A. Selected Financial Data.” The following discussion of revenue drivers in our passenger operations is based on our unaudited pro forma operating results for 2012 where specified.
Passenger demand has grown over the past years driven by positivehas been affected as a result of weaker economic conditionsenvironments in some Latin America. EconomicAmerican countries, reflected in slower GDP growth trends and improved customer confidence have leddepreciated currencies, and increases in competition from operators to an expansion in both business and leisure traffic to and from Latin America. Increased interest in travel into South America from Europe and within the United States has been another factor positively impacting overall passenger traffic. As a consequence, passenger volumesregion.
During 2016, domestic operations of our affiliate carriers based in markets such asthe Spanish speaking countries (“SSC”, which includes Chile, Peru, Argentina, Colombia and Ecuador grew significantly between 2010Ecuador) continued to show growth in terms of traffic and 2013.
Competitive activity on both our domestic and international passenger routes has also varied over the last several years. On our international routes, competition has gradually increased as both incumbent and new competitors expanded their operations. Nevertheless, we have maintained our market shareremained profitable, in most of our international markets since 2005 and have gradually increased our presence in international routes. We also have increased our domestic operations, initiating operations in Ecuador in April 2009, in Colombia in 2010 and in Brazil in 2012 following the business combination between LAN and TAM.
We address different challenges while advancing our strategic development plans by taking advantage of our integrated business model, efficient operations, continued customer focus, and flexible capacity management. Continuous monitoring of demand trends and competitive activity has allowed us to identify opportunities and, as a consequence, additional capacity has also been allocated to certain operations. We have also decreased capacity among other routes, especially in long haul routes to Europe because of weaker economic conditions, and domestic routes in Brazil, in response to softened demand in our Brazilian domestic operations. Further refinements to our itineraries have been implemented in order to improve connectivity between our operations and those of our partners.
We continue to enhance our regional network by selectively adding new destinations and launching new routes. Since 2004, we have been developing an intra-regional hub in Lima that enables us to effectively use Lima as a connecting point for passengers traveling between Mexico City, Bogotá, Caracas, Guayaquil, Quito, Buenos Aires, La Paz, Santa Cruz, Sao Paulo and Santiago de Chile. In 2007, we began direct service between Lima and Madrid and in July 2010, we launched four weekly frequencies between Lima and San Francisco, with connections from Sao Paulo, Santiago and Buenos Aires. During 2012 and 2013, becausespite of the weak economic situationslowdown in Europe, LATAM reducedsome countries. Our SSC business in 2016 grew at a higher pace than in 2015; we increased capacity to that region and increased frequencies to the United States, including a new LAN Colombia route, Bogotá-Miami, and a new TAM route, Rio de Janeiro-Orlando,(as measured in order to promote Florida as a getaway from Latin America to the United States.
LATAM’s more moderate traffic growth of 2.5% during 2013 responded to a slight decrease of 0.4% in passenger capacity during the year, resulting from capacity rationalization initiatives both in the Brazilian domestic market, where capacity decreasedASKs) by 8.4% in the year and in our long haul operations, where capacity decreases were focused on routes from Brazil to Europe.
During 2013, the combined yield for the international and domestic passenger businesses decreased by 2.0%8.0% as compared to the pro forma yield2015, in 2012, reflecting the depreciation of the Brazilian real and local currencies inline with our Spanish speaking countries and a more challenging competitive environment in the region.
Passenger revenues increased by 0.4% to US$11,061.6 million in the year ended December 31, 2013 as compared to pro forma revenues of US$11,017.0 million for 2012. This was a result of the increase of 2.5%8.0% growth in passenger traffic (as measured in RPKs), partially offsetmaintaining our load factors at 80.9%. However, yields in the SSC domestic markets continue to be under pressure, due largely to the decline of fuel prices, the depreciation of local currencies, (mainly the Argentinian Peso and the Colombian Peso, which depreciated by 59.2% and 11.0% respectively, during 2016), and increased competition in certain markets. The combination of these factors resulted in a 16.5% decline in revenue per ASK in US dollars as compared to 2015.
In our domestic operations in Brazil, we continued to adjust capacity in response to a weak demand environment. LATAM Airlines Brazil reduced capacity (as measured by ASKs) by 11.5%, while passenger traffic (as measured in RPKs) decreased by 10.7%, allowing for an improvement of 0.8 percentage points in load factors, which reached a healthy 82.3%. LATAM Airlines Brazil ended the year with an increase of 6.3% in our revenues per ASK in Brazilian Reais as compared to 2015. Moreover, during the fourth quarter of 2016, revenues per ASK (RASK) increased by 34.8% as compared to the same quarter of 2015, driven by a 2.0% decrease14.8% increase in yields,RASK in BRL as described above.
In our international operations, we increased our passenger capacity by adding new destinations and strengthening the use of our regional hubs, consistent with the Company’s focus on network improvements. Brazilian international demand was also adversely affected by the weak macroeconomic conditions in the country. For this reason, LATAM Airlines Brazil reduced its capacity on routes with weaker demand, specifically between Brazil and the US, with a significant recovery in unit revenues as compared to 2015, especially in the second half of the year. On the other hand, the other affiliates added capacity on healthy routes, primarily from the Spanish Speaking Countries to destinations in the US and Europe. As a result, capacity in those markets (as measured by ASKs) increased by 5.6%, while traffic (as measured in RPKs) increased 7.4%, resulting in an improvement of 1.4 percentage points in load factors, which reached 86.2%, while the revenue per ASK (RASK) declined 9.9% in US dollars. A portion of the RASK decline is related to lower fuel prices and devaluation of local currencies during 2016 as compared to 2015.
Although 2016 was a challenging year, with weakening regional economies and recession in Brazil, devalued local currencies and high inflation rates in certain countries, LATAM continues to be the best positioned airline group in Latin America to respond to these challenging conditions, as we continue to improve our margins, generate cash flow and deleverage our balance sheet, showing the resilience of our business model. Our management has been proactive in addressing these economic challenges. We continue to pursue initiatives to further reduce costs, and we also successfully restructured our fleet commitments to adapt fleet deliveries to the current demand environment in the region, reaching historically low levels of fleet commitments for 2017.
Cargo Operations
Our cargo operations depend on exports from South America to North America and Europe, and imports from North America and Europe to South America, andwhere Brazil is the main import market. Cargo markets are therefore, affected by economic conditions, foreign exchange rates, changes in international trade, the health of particular industries and competition and fuel prices (which we usually pass on to our customers through a cargo fuel surcharge). Cargo revenues are also affected by our capacity, traffic, load factors and yield. Our capacity is measured in terms of available ton kilometers, or ATKs, which represents the number of tons available across our network for the transportation of cargo on each flight, multiplied by the kilometers flown.flown by the respective flights. We measure traffic in revenue ton kilometers, or RTKs, as the amount of cargo loads (measured in tons) on each flight multiplied by the number of kilometers flown.flown by the respective flights. Load factors represent RTKs (traffic) as a percentage of ATKs (capacity), or the percentage of our cargo capacity that is actually used to transport cargo for our customers.
Finally, we use cargo yield, or revenue from cargo operations divided by RTKs, to measure the average amount that our customers pay to transport one ton of cargo one kilometer. See “Item 3. Key Information—A. Selected Financial Data.” The following discussion of revenue drivers in our cargo operations including changes in capacity, traffic, load factors and yields, is based on our unaudited pro forma operating results for 2012 and 2011 where specified.
We operate in many of the major import and export markets in South America. In particular, in 2012, the agreements implemented relative to the TAM’s cargo network in Brazil significantly expanded our cargo capacity and route coverage. At the end of 2012, this additional cargo capacity represented approximately 32% of all LATAM Cargo capacity. In addition to providing additional cargo routes within Brazil, the combination of LAN and TAM also provided additional international destinations, including Milan, Paris and London.
The relative size of inbound and outbound flows to a particular market or route is a key element in cargo operations, as the unidirectional nature of freight flows requires airlines to create routes that combine origin-destination pairs that feature complementary freight flows. Changes in macroeconomic conditions may lead to major fluctuations in cargo flows to and from Latin America, therefore requiring continuous route and capacity adjustments.
We have designed our operations, route network and commercial strategies with the flexibility required to respond to changing conditions. The flexibility that our integrated business model allows based on adaptation to changes in market trends was key for LATAM’s operations in 2009, when the business was affected by the contraction of import and export markets in response to the global economic crisis and continued contraction in salmon exports from Chile as a result of an outbreak of the Infectious Salmon Anemia virus during 2007. LATAM received two Boeing 777 freighters in 2009, at a time where there was a decrease in demand in cargo operations. These aircraft were utilized to increase capacity, mainly on routes between South America and Europe and to expand LATAM’s cargo coverage beyond the region and strengthen its cargo services to Europe. As the economy started to recover at the end of 2009, LATAM was able to take advantage of the new capacity and growth opportunities in various markets in 2010 and 2011. Accordingly, the cargo business played an important role in driving LATAM’s revenue growth in 2010 and 2011. Since 2012, however, a slowdown in world macroeconomic conditions has significantly impacted cargo volumes, specifically in Europe and Asia. This slowdown has also affected South America, mainly in the southbound routes where LATAM Cargo carries imports of value added goods into Brazil. This weak macroeconomic environment also brought new competition to the region during 2012 and 2013, with airlines carriers such as Emirates and Cargo Lux, increasing the available capacity in the region and adding pressure to cargo yields. This weak cargo trend has continued during 2013.
As a result of these factors,During 2016, cargo traffic decreased 8.7%, reflecting a challenging scenario in Latin American cargo markets mainly due to a strong decline in Brazilian imports affected by 0.5%recessionary conditions and currency devaluation. However, Latin American exports remain at healthy levels, notwithstanding lower production in 2013the salmon industry in Chile. Revenues per ATK declined by 8.5% as comparedfares continued to pro forma traffic for 2012. Cargo yieldsbe pressured by the competitive landscape and low fuel prices. The Company continued its rational and disciplined approach toward freighter capacity utilization, while focused on maximizing the belly utilization of our passenger fleet. Consistent with this approach, we are currentlysub-leasing three of our767-300Fs and one of our777-200Fs to a third party operating in a different market.Our cargo capacity decreased by 3.5% compared to 2012, reflecting the decline5.3% in demand on routes to Latin America, especially Brazil; increased competitive pressures from regional and international cargo carriers; and the effect of the depreciation of the Brazilian real on cargo revenues in that market. LATAM increased its capacity by approximately 0.1%,2016, resulting in a 0.3 point decrease in its cargo load factor to 58.4% in 2013. LATAM’s cargo operations transported 1,171 thousand tons of freight in 2013, an increase of 1.5% as compared to the total (pro forma) freight transported in 2012.51.7%.
As a result of decreased traffic and yields, LATAM’s pro forma cargo revenues decreased by 4.0% to US$1,863.0 million in 2013 as compared to pro forma cargo sales of US$1,939.8 million in 2012, representing 14.4% of the Company’s total revenues in 2013.
Cost Structure
LATAM Airlines Group’s costs are largely driven by the size of our operations, fuel prices, fleet costs and exchange rates. Our operating expenses are calculated in accordance with IFRS and comprise the sum of the line items “cost of sales” plus “distribution costs” plus “administrative expenses” plus “other operating expenses”,expenses,” as shown on our consolidated statement of comprehensive income. These operating expenses include wages and benefits, fuel, depreciation and amortization, commissions to agents, aircraft rentals, other rental and landing fees, passenger services, aircraft maintenance and other operating expenses. The following is a discussion of costthe drivers is based on our unaudited pro forma operating results where specified.of the most important costs.
As an airline, we are subject to fluctuations in costs that are outside of our control, particularly fuel prices. At the end of 2015, fuel prices were relatively low, principally due to an aggregate excess supply from exporter countries (mainly OPEC members and exchange rates.Russia), which offset the lower production by shale oil companies in the U.S. In 2016, fuel prices followed the same trend largely due to the agreement reached by Iran and the largest economies regarding Iran’s nuclear program, ending the penalties imposed on that country’s oil exports. However, the concerns and speculations regarding the actual implementation of this agreement put pressure on fuel prices toward the end of 2016. LATAM Airlines Group has a hedging policy to protect medium term liquidity risk from fuel price increases, while participating of benefits from fuel price reduction. Cost of fuel is also affected by the amount of gallons we manage partconsume, which depends on the size of our exposure to changes in fuel prices through a fuel-hedging policyoperation, the efficiency of our fleet and the use of pass-through mechanisms on both the passenger and cargo businesses. To mitigate the impact in terms of exchange rate fluctuations on our net income, during 2013 we entered into a financial derivative contract to hedge more than 50% of our operating exposure to the Brazilian real in 2014.efficiency programs.
Personnel expenses are another significant component of our overall costs. Because a significant portion of our labor costs is denominated in Chilean pesos and in Brazilian reais, appreciation of these currencies against the dollar as well as increases in local inflation rates can result in increased costs in dollar terms and can negatively affect our results. Depreciation of local currencies results in decreases in costs in dollars. However, this cost pressure is mitigated by the partial natural hedge between the currenciesOther important drivers of denomination of our total operating revenuespersonnel expenses are average headcount and expenses.average wages.
Commissions paid to travel and cargo agents are also comprise a significant cost to us.the Company. We compete with other airlines over the amount of commission we pay per sale, particularly in connection with special programs and marketing efforts, and to maintain competitive incentives with travel agents. In Chile, Ecuador, Argentina, Peru and Colombia we pay 1% commission to travel agencies and agents. In Brazil, the industry standard is not to provide any commissions directly to travel agencies and agents.
Fleet related expenses, namely aircraft rentals and depreciation, are another significant cost.cost, and mainly depend on the number and type of aircraft that are owned and that are under operating leases. These costs are mainlylargely fixed and can be reduced on a per unit basis by achieving higher daily aircraft utilization rates. Following the combination of LAN and TAM, the percentage of our fleet under operating leases increased from 34.8% in 2011 to 37.6% in 2012, and was 37.8% as of December 31, 2013.
To manage our cost structure, we have launched various efficiency-related initiatives aimed at reducing fuel consumption and increasingly incorporating efficient aircraft into the fleet.
Higher aircraft utilization has been an important source of improved efficiency. Our utilization strategy in 2012 was coupled with the addition of new passenger routes to our network, which enabled us to leverage our human and physical assets for increased efficiency as well as increasing frequencies. In our domestic operations we have also worked consistently to improve our cost structure. The key elements of our domestic business model have focused on improving short-haul service standards, reducing sales and distribution costs through higher Internet penetration and reduced agency commission, improving turnaround time, and increasing self check-in service through web check-in and kiosks at airports.
In addition, during 2009 we began to implement LEAN, a system for improving our processes by eliminating activities that do not add value to processes (thus increasing the value of each activity and suppressing those that are superfluous), thereby allowing us to reduce costs, and increase customer satisfaction. To improve fuel efficiency, in 2009 we began a program to install winglets on LAN’s existing Boeing 767 aircraft fleet, which we continue to install as we receive new 767 aircraft. The installation of winglets on our Boeing 767 aircraft helped us to achieve average fuel efficiencies of approximately 5% per aircraft per year since implementation.
During 2013, and after a process of reviewing its post-merger fleet plan and fleet requirements, LATAM decided to undertake a broad fleet restructuring plan with the aim of reducing the number of models operated, phasing out less efficient models and allocating aircraft best suited to each one of its markets. As a result, beginning in the fourth quarter of 2013 and for approximately the next thirty months, the Company will phase out all of its A330s, A340s, B737s and Q400 and Q200s. During 2013, this process generated non-recurring costs of US$29 million resulting from penalties related to anticipated redeliveries and other redelivery expenses.
Cost of sales for the year ended December 31, 2013 decreased by 3.9% as compared to pro forma cost of sales for 2012, mainly resulting from a decrease of 7.7% in aircraft fuel expenses, both because of lower prices and consumption; and a decrease of 4.0% in wages and benefits related to a lower headcount.
Outlook
Our long-term strategy is aimed at consolidating LATAM Airlines Group’s position as the preferred passenger and cargo airline group in South America. The creation of LATAM Airlines Group in 2012, following the combination of LAN and TAM, has created the largest airline group in Latin America, with the largest fleet and number of destinations and, we believe, superior service standards. This combination has enabled LATAM to serve all major domestic markets across Latin America and has positioned us to compete in an increasingly consolidating global airline industry.
We will continue to expand our network by further developing our existing routes, adding new destinations, developing new alliances, and entering new markets. We expect our strong brand recognition, coupled with a continuous effort to improve service standards to drive increased customer preference, ultimately leading to strong market shares in the markets we serve. Our product and service design is aimed at providing passengers and cargo customers with differentiated offerings that provide valuable solutions to the needs of each of our customer types. We also aim to have products and services that evolve together with changes in technology, market conditions and competitive actions. We plan to maintain a highly competitive cost structure by leveraging our cost-conscious culture, incorporating new technologies and practices, and by identifying and implementing cost-reduction and efficiency-related initiatives. We believe that a focus on flexibility will enable us to effectively react to changing market conditions.
Our results will be mainly determined by the expansion of our current network, the evolution of our market share in our main markets, our level of success in entering new markets, the successful combination between LAN and TAM and achievement of the expected synergies, the continued implementation of new efficiency-related programs, the continued implementation of our business model for short-haul operations, and fuel price levels.
Overall, we believe that these initiatives will enable us to successfully respond to growth opportunities, maintain a solid competitive position, and manage operating expenses.
Our financial performance will also continue to be significantly affected by jet fuel prices. These prices rose significantly until mid-2008, which led to a sharp rise in our fuel expenditures, but significantly declined in 2009. During 2010 and 2011 fuel prices recovered from the 2009 decline and again rose significantly, as a result of increased demand coupled with geopolitical conflicts that affected global fuel supply. In 2012 jet fuel prices fluctuated in a stable range, having a lower impact in our fuel expenses as compared to prior years. At the end of 2013, fuel prices were high principally because of positive signs of growth in the United States, and presently, fuel is following the same trend, mainly because of the Ukraine/Russia conflict and also because of positive signs of growth in the United States and Europe. Although we have implemented a number of strategies to mitigate the impact of the volatility of fuel prices, it is unlikely that we will be able to fully protect ourselves against the volatility of fuel costs.
Results of OperationOperations
The discussion of LATAM Airlines Group’s financial results for the year ended December 31, 2013 compared to the year ended December 31, 2012 (actual) compares the audited consolidated results of the LATAM Airlines Group for the 2013 fiscal year to the audited consolidated results of the LATAM Airlines Group for the 2012 fiscal year (which includes TAM’s financial results from June 23, 2012) Accordingly, the acquisition of TAM during June, 2012 is a significant factor affecting the comparability of the historical financial results for previous and upcoming years.
The discussion of LATAM Airlines Group’s financial results for the year ended December 31, 2013 compared to the year ended December 31, 2012 (pro forma) below is on the basis of the LATAM Unaudited Pro Forma Financial Information. The Unaudited LATAM Pro Forma Information has been prepared using the purchase method of accounting with LAN treated as the acquirer of TAM, and giving effect to the combination as if it had been consummated on January 1, 2012. The discussion of LATAM’s results on a pro forma basis is provided for illustrative purposes only and does not purport to represent what the actual consolidated results of operations or the consolidated financial position of LATAM would have been had the proposed combination occurred on the dates assumed, nor are the pro forma results necessarily indicative of future consolidated results of operations or consolidated financial position of LATAM.
The discussion of LATAM Airlines Group’s financial results for the year ended December 31, 2012 (actual) compared to the year ended December 31, 2011 (actual) below compares the audited consolidated results of the LATAM Airlines Group for the 2012 fiscal year (which includes TAM’s financial results from June 23, 2012) to the audited consolidated results of the LATAM Airlines Group for the 2011 fiscal year (which are historical results for LAN). These financial results for the year ended December 31, 2012 were retrospectively revised. For more information see “Operating and Financial Review and Prospects – Accounting Impact of the Business Combinations”.
LATAM Airlines Group Financial Results Discussion: Year ended December 31, 2013 (actual)2016 compared to year ended December 31, 2012 (actual) as retrospectively revised2015.
The following table sets forth certain income statement data for LATAM Airlines Group, for the year ended December 31, 2013,2016, and for LATAM Airlines Group, for the year ended December 31, 2012 (including TAM’s results from June 23, 2012).2015. For certain operating data duringfor these periods, see “Item 3. Key Information—A. Selected Financial Data.”
| Year Ended December 31, | ||||||||||||||||||||
| 2013 | 2012 | 2013 | 2012 | 2013/2012 % change | ||||||||||||||||
| (in US$ millions, except per share and capital stock data) | As a percentage of total operating revenues | |||||||||||||||||||
Consolidated Results of Income by Function | ||||||||||||||||||||
Operating revenues | ||||||||||||||||||||
Passenger | 11,061.6 | 7,966.8 | 85.6 | % | 82.0 | % | 38.8 | % | ||||||||||||
Cargo | 1,863.0 | 1,743.5 | 14.4 | % | 18.0 | % | 6.9 | % | ||||||||||||
|
|
|
|
|
|
|
|
|
| |||||||||||
Total operating revenues | 12,924.5 | 9,710.4 | 100.0 | % | 100.0 | % | 33.1 | % | ||||||||||||
|
|
|
|
|
|
|
|
|
| |||||||||||
Cost of sales | (10,054.2 | ) | (7,634.5 | ) | (77.8 | )% | (78.6 | )% | 31.7 | % | ||||||||||
Gross margin | 2,870.4 | 2,075.9 | 22.2 | % | 21.4 | % | 38.3 | % | ||||||||||||
Other operating income | 341.6 | 220.2 | 2.6 | % | 2.3 | % | 55.1 | % | ||||||||||||
Distribution costs | (1,025.9 | ) | (803.6 | ) | (7.9 | )% | (8.3 | )% | 27.7 | % | ||||||||||
Administrative expenses | (1,136.1 | ) | (888.7 | ) | (8.8 | )% | (9.2 | )% | 27.8 | % | ||||||||||
Other operating expenses | (408.7 | ) | (311.8 | ) | (3.2 | )% | (3.2 | )% | 31.1 | % | ||||||||||
Financial income | 72.8 | 77.5 | 0.6 | % | 0.8 | % | (6.1 | )% | ||||||||||||
Financial costs (from non-financial activities) | (462.5 | ) | (294.6 | ) | (3.6 | )% | (3.0 | )% | 57.0 | % | ||||||||||
Earning on investments (equity method) | 2.0 | 1.0 | 0.0 | % | 0.0 | % | 100.0 | % | ||||||||||||
Exchange rate differences | (482.2 | ) | 66.7 | (3.7 | )% | 0.7 | % | (822.9 | )% | |||||||||||
Result of indexation units | 0.2 | 0.0 | 0.0 | % | 0.0 | % | 100.0 | % | ||||||||||||
Negative goodwill | — | — | — | — | ||||||||||||||||
Other gains/(losses) | (55.4 | ) | (45.8 | ) | (0.4 | )% | (0.5 | )% | 21.0 | % | ||||||||||
|
|
|
|
|
|
|
|
|
| |||||||||||
Income before income taxes | (283.9 | ) | 96.7 | (2.2 | )% | 1.0 | % | (393.6 | )% | |||||||||||
Income tax expense | 20.1 | (102.4 | ) | 0.2 | % | (1.1 | )% | (119.6 | )% | |||||||||||
|
|
|
|
|
|
|
|
|
| |||||||||||
Net income for the period | (263.8 | ) | (5.6 | ) | (2.0 | )% | (0.1 | )% | 4,610.7 | % | ||||||||||
|
|
|
|
|
|
|
|
|
| |||||||||||
Income for the period attributable to the parent company’s equity holders | (281.1 | ) | (19.1 | ) | (2.2 | )% | (0.2 | )% | (1,372.3 | )% | ||||||||||
Income for the period attributable to non-controlling interests | 17.3 | 13.4 | 0.1 | % | 0.1 | % | 29.1 | % | ||||||||||||
Net income for the period | (263.8 | ) | (5.6 | ) | (2.0 | )% | (0.1 | )% | 4,610.7 | % | ||||||||||
|
|
|
|
|
|
|
|
|
| |||||||||||
Earnings per share | ||||||||||||||||||||
Basic earnings per share (US$) | (0.57613 | ) | (0.04627 | ) | n.a. | n.a. | (1,145.1 | )% | ||||||||||||
Diluted earnings per share (US$) | (0.57613 | ) | (0.04627 | ) | n.a. | n.a. | (1,145.1 | )% | ||||||||||||
| Year Ended December 31, | ||||||||||||||||||||
| 2016 | 2015 | 2016 | 2015 | 2016/2015 % change | ||||||||||||||||
| (in US$ millions, except per share and capital stock data) | As a percentage of total operating revenues | |||||||||||||||||||
Consolidated Results of Income by Function | ||||||||||||||||||||
Operating revenues | ||||||||||||||||||||
Passenger | 7,877.7 | 8,410.6 | 87.6 | % | 86.4 | % | (6.3 | %) | ||||||||||||
Cargo | 1,110.6 | 1,329.4 | 12.4 | % | 13.6 | % | (16.5 | %) | ||||||||||||
|
|
|
|
|
|
|
|
|
| |||||||||||
Total operating revenues | 8,988.3 | 9,740.0 | 100.0 | % | 100.0 | % | (7.7 | %) | ||||||||||||
|
|
|
|
|
|
|
|
|
| |||||||||||
Cost of sales | (6,967.0 | ) | (7,636.7 | ) | (77.5 | %) | (78.4 | %) | (8.8 | %) | ||||||||||
Gross margin | 2,021.3 | 2,103.3 | 22.5 | % | 21.6 | % | (3.9 | %) | ||||||||||||
Other operating income | 538.7 | 385.8 | 6.0 | % | 4.0 | % | 39.6 | % | ||||||||||||
Distribution costs | (747.4 | ) | (783.3 | ) | (8.3 | %) | (8.0 | %) | (4.6 | %) | ||||||||||
Administrative expenses | (873.0 | ) | (878.0 | ) | (9.7 | %) | (9.0 | %) | (0.6 | %) | ||||||||||
Other operating expenses | (373.7 | ) | (324.0 | ) | (4.2 | %) | (3.3 | %) | 15.4 | % | ||||||||||
Financial income | 74.9 | 75.1 | 0.8 | % | 0.8 | % | (0.3 | %) | ||||||||||||
Financial costs | (416.3 | ) | (413.4 | ) | (4.6 | %) | (4.2 | %) | 0.7 | % | ||||||||||
Share of profit of investments accounted for using the equity method | 0.0 | 0.0 | 0.0 | % | 0.0 | % | 0.0 | % | ||||||||||||
Foreign exchange gains/(losses) | 121.7 | (467.9 | ) | 1.4 | % | (4.8 | %) | (126.0 | %) | |||||||||||
Result of indexation units Other gains/(losses) Income (loss) before income taxes Income (loss) tax expense Net income (loss) for the period Income (loss) for the period attributable to the parent company’s equity holders Income (loss) for the period attributable tonon-controlling interests Net income (loss) for the period Earnings per share Basic earnings per share (US$) Diluted earnings per share (US$) Year Ended December 31, 2016 2015 2016 2015 2016/2015
% change (in US$ millions, except per
share and capital stock data) As a percentage of total
operating revenues 0.3 0.6 0.0 % 0.0 % (50.0 %) (72.6 ) (55.3 ) (0.8 %) (0.6 %) 31.3 % 273.9 (357.1 ) 3.1 % (3.5 %) (17.7 %) (163.2 ) 178.4 (1.8 %) 1.8 % (16.2 %) 110.7 (178.7 ) 1.3 % (1.7 %) (38.1 %) 69.2 (219.3 ) 0.8 % (2.3 %) (131.6 %) 41.5 40.5 0.5 % 0.4 % 2.2 % 110.7 (178.7 ) 1.3 % (1.7 %) (38.1 %) 0.12665 (0.40193 ) n.a. n.a. (131.5 %) 0.12665 (0.40193 ) n.a. n.a. (131.5 %)
| * | The abbreviation “n.a.” means |
Net Income
Net lossincome for the year ended December 31, 20132016 equaled US$ 263.8110.7 million, representing an increaseimprovement of US$ 258.2289.4 million from a net loss of US$5.6178.7 million in 2012.2015. Net lossincome attributable to the parents of the company rose toparent company’s shareholders was US$ 281.169.2 million in 2013 from2016, compared with a net loss of US$19.1219.3 million in 2012.2015. Results for the 2013 year were negativelypositively impacted by a foreign exchange gain of US$ 121.7 million, compared to a net foreign exchange loss of US$ 482.2467.9 million mainly resulting from the depreciation of the Brazilian real in the year. On the other hand, in 2012 and 2013, LATAM incurred US$59.2 and US$56.0 million, respectively, of non-recurring expenses related to the merger and integration costs, and an accounting charge of US$70 million related to the increase in the Chilean corporate tax rate from 17% to 20% during 2012.2015.
Operating Revenues
Our total operating revenues increaseddecreased by 33.1%7.7% to US$ 12,924.58,988.3 million in the year ended December 31, 20132016 compared to revenues of US$ 9,710.49,740.0 million in 2012, reflecting the consolidation of TAM’s revenues in 2012 only since June 23.2015. The 2013 increase2016 decrease in operating revenues was attributable to a 38.8% increase6.3% decrease in passenger revenues, and a 6.9% increase16.5% decrease in cargo revenues. Passenger and cargo revenues accounted for 85.6%87.6% and 14.4%12.4% of total operating revenues in 2013,2016, respectively.
Passenger traffic and capacityOur consolidated passenger revenues decreased by 6.3% to US$7,877.7 million in 2013 increased significantly following the full year consolidation of TAM’s domestic and international operations. Capacity increases2016 from US$8,410.6 million in 2013 were mainly focused on domestic routes in our Spanish speaking countries and regional routes within Latin America, and were partially offset by decreased capacity on Brazilian domestic routes and long haul routes, especially to Europe.
Operating expenses also increased2015, as a result of a decrease of 6.9% in our increased operations following the combination with TAM on June 22, 2012.
Operating Revenues
Operatingunit revenues (“RASK”). Our capacity increased by 33.1%0.6%. The increase in capacity was a result of an 8.0% increase in our domestic Spanish-speaking countries operations and a 5.6% increase in our international operations, partially offset by a decrease of 11.5% in capacity in our domestic Brazil operations. Decreases in RASK reflect a decrease of 8.1% in consolidated yields, resulting from the slowdown in economic activity in the region, the depreciation of local currencies, a more competitive environment, and the pass-through of the savings in fuel costs to customers.
Cargo revenues decreased by 16.5%, to US$12,924.51,110.6 million in 2016 from US$1,329.4 million in 2015, as a result of a decrease of 5.3% in capacity (ATK) and a decrease of 11.7% in unit revenues (“RATK”). Capacity decreased in our cargo operations mainly as a result of a reduced freighter operation. Decreases in RATK reflect the still challenging cargo scenario in South America and in particular the weakness of the imports into the region, mainly to Brazil from North America and Europe, which has affected our cargo yields, which decreased by 8.5% in 2016 as compared to 2015.
Cost of Sales
Cost of sales decreased by 8.8% to US$6,967.0 million for the year ended December 31, 2013 from2016 (from US$9,710.47,636.7 million in 2012. Our consolidated passenger revenues increased by 38.8%2015), mainly due to US$11,061.6 million in 2013 from US$7,966.8 million in 2012, primarily as a resultlower fuel expenses during the year and the positive impact of the consolidationdepreciation of TAM’s revenue for 2012 since June 23.
Cargo revenues increased by 6.9%, to US$1,863.0 million in 2013 from US$1,743.5 million in 2012, alsolocal currencies as a result of the consolidation of TAM’s cargo revenues for full year 2013. The slight increase in cargo revenues in spite of TAM’s cargo integration is a result of a weak global cargo scenario which has impacted both cargo traffic and yields.Cost of Sales
Cost of sales increased by 31.7% to US$10,054.2 million in the year ended December 31, 2013 from US$7,634.5 million in 2012, mainlywell as a result of increased operations due to the complete consolidation of TAM’s costs for year 2013.our ongoing cost reduction program. As a percentage of total operating revenues, cost of sales decreased from 78.6%78.4% in 20122015 to 77.8%77.5% in 2013.2016.
The table below presents cost of sales information for the fiscal year ended December 31, 20132016 and 2012 actual.2015.
| Year Ended December 31 | Year Ended December 31, | |||||||||||||||||||||||||||||||||||||||
| 2013 | 2012 | 2013 | 2012 | 2013/2012 % change | 2016 | 2015 | 2016 | 2015 | 2016/2015 % change | |||||||||||||||||||||||||||||||
| (in US$millions, except as otherwise stated) | As a percentage of total operating revenues | (in US$ millions, except as otherwise stated) | As a percentage of total operating revenues | |||||||||||||||||||||||||||||||||||||
Revenues | 12,924.5 | 9,710.4 | 100.0 | % | 100.0 | % | 33.1 | % | 8,988.3 | 9,740.0 | 100.0 | % | 100.0 | % | (7.8 | %) | ||||||||||||||||||||||||
Cost of sales | (10,054.2 | ) | (7,634.5 | ) | (77.8 | )% | (78.6 | )% | 31.7 | % | (6,967.0 | ) | (7,636.7 | ) | (77.5 | %) | (78.4 | %) | (8.8 | %) | ||||||||||||||||||||
|
|
|
|
|
|
|
|
|
| |||||||||||||||||||||||||||||||
Aicraft Fuel | (4,414.2 | ) | (3,434.6 | ) | (34.2 | )% | (35.4 | )% | 28.5 | % | ||||||||||||||||||||||||||||||
Aircraft Fuel | (2,056.6 | ) | (2,651.1 | ) | (22.9 | %) | (27.2 | %) | (22.4 | %) | ||||||||||||||||||||||||||||||
Wages and Benefits | (1,881.0 | ) | (1,431.2 | ) | (14.6 | )% | (14.7 | )% | 31.4 | % | (1,479.5 | ) | (1,553.8 | ) | (16.5 | %) | (16.0 | %) | (4.8 | %) | ||||||||||||||||||||
Other Rental and Landing Fees | (1,373.1 | ) | (1,052.6 | ) | (10.6 | )% | (10.8 | )% | 30.4 | % | (1,077.4 | ) | (1,109.8 | ) | (12.0 | %) | (11.4 | %) | (2.9 | %) | ||||||||||||||||||||
Depreciation and Amortization | (1,041.7 | ) | (771.1 | ) | (8.1 | )% | (7.9 | )% | 35.1 | % | (960.3 | ) | (934.4 | ) | (10.7 | %) | (9.6 | %) | 2.8 | % | ||||||||||||||||||||
Aircraft Rentals | (441.1 | ) | (308.8 | ) | (3.4 | )% | (3.2 | )% | 42.8 | % | (569.0 | ) | (525.1 | ) | (6.3 | %) | (5.4 | %) | 8.3 | % | ||||||||||||||||||||
Aircraft Maintenance | (477.1 | ) | (297.6 | ) | (3.7 | )% | (3.1 | )% | 60.3 | % | (366.2 | ) | (437.2 | ) | (4.1 | %) | (4.5 | %) | (16.3 | %) | ||||||||||||||||||||
Passenger Services | (331.4 | ) | (239.8 | ) | (2.6 | )% | (2.5 | )% | 38.2 | % | (286.6 | ) | (295.4 | ) | (3.2 | %) | (3.0 | %) | (3.0 | %) | ||||||||||||||||||||
Other Costs of Sales | (94.5 | ) | (98.8 | ) | (0.7 | )% | (1.0 | )% | (4.3 | )% | (171.4 | ) | (129.9 | ) | (2.8 | %) | (1.3 | %) | 49.8 | % | ||||||||||||||||||||
The increasedecrease in our cost of sales was driven by higherlower aircraft fuel expenses, which increaseddecreased by 28.5%22.4% to US$4,414.22,056.6 million in 20132016 as a result of higher fuel consumption related toa 16.6% decrease in the incorporation of TAM’s operations from June 23, 2012, which was partially offset by lowerfull year average fuel prices and efficiency initiatives. In addition,price (excluding hedge). LATAM recognized a net gainloss of US$19.048.0 million in fuel hedging in 2013,2016, compared to thea fuel hedge loss of US$1.8239.4 million in 2012.2015. In 2016, the Company also recognized a US$40.3 million hedge loss related to foreign currency contracts, which were recognized in the fuel cost line compared to a US$19.2 gain million in 2015.
Depreciation and amortization increased by US$270.625.9 million, amounting to US$1,041.7960.3 million, which represents an increase of 35.1% mainly2.8% due to the incorporationincrease in the number of allowned aircraft, partially offset by the positive impact of TAM’s fleet (including new TAM fleet deliveries in 2012) starting June 23, 2012.
Wages and benefits increased by US$449.8 million amounting to US$1,881.0 million, which represents an increasethe 4.5% depreciation of 31.4%, mainly due to the incorporation of TAM’s employees following the combination of LAN and TAM in 2012.Brazilian real.
Other rental and landing fees increaseddecreased by 30.4%2.9% to US$1,373.11,077.4 million in 20132016 from U$1,052.61,109.8 million in 2012, resulting from higher fees related2015, mainly due to a larger operation withdecline in the consolidationrental of TAM’s fees for full year 2013.passenger and cargo capacity from third parties as well as lower handling costs.
Aircraft maintenance expenses increaseddecreased by 60.3%16.3%, from US$297.6437.2 million in 20122015 to US$477.1366.2 million in 2013, as a result2016, mainly due to cost efficiencies related with the renewal of higher costsour fleet and lower maintenance expenses related to a larger fleet and higher maintenance costs related to redeliveriesthe redelivery of aircraft.
Aircraft rentals increased by 42.8%8.3% to US$441.1569.0 million in 20132016 from US$308.8525.1 million in 2012, primarily due to2015 as a result of the complete consolidationincorporation of TAM’s fleet for full year 2013larger and the net increase ofmore modern aircraft under operating leases during the year.(i.e. Boeing 787s and Airbus A350s), whereas returned aircraft have mainly been older models (i.e. Airbus A319s and A330s).
Passenger service expenses increaseddecreased by 38.2%3.0%, to US$331.4286.6 million in 20132016 compared to US$239.8295.4 million in 2012,2015, due mainly resulting fromto a decrease of 1.3% in the number of passengers transported, as well as the decrease in on board services expenses, offset in part by an increase in passengers transported after the combination of LAN and TAM.passenger compensation.
As a result of the above, gross margin increased by 38.3%margin(defined as operating revenue minus cost of sales)decreasedby 3.9% from US$2,075.92,103.3 million in 20122015 to US$2,870.42,021.3 million in 2013.2016.
Other Consolidated Results
Other operating income increased in 20132016 by 39.6%, from US$121.4385.8 million from US$220.2 millionin 2015 to US$341.6538.7 million in 2016, mainly due to the incorporationa US$80.1 million gains derived from aircraft sales and leaseback transaction (resulting in an operating lease) as well as a US$41.8 million increase in revenues from freighter aircraft leases and sales of TAM’s other revenues since June 22, 2012, afixed assets.
Distribution costs decreased by 4.6% from US$28.7783.3 million revenue from Multiplus’breakage and non-air redemptions, and an income for recognizingin 2015 to US$10.8747.4 million and US$ 8.2 million generatedin 2016, mainly as a result of the sale and lease-back of ten Airbus A330 aircraft, and two Airbus A318 aircraft and an engine during the second quarter of the year.
Distribution costs increasedlower commissions to agents (which decreased by 27.7%11.1%, from US$803.6302.8 million in 2012 to US$1,025.9 million269.3 million), in 2013, asboth the passenger and cargo businesses, representing a result ofgreater percentage decline than the consolidation of TAM’s results only starting7.7% decline in June 23, 2012.passenger and cargo revenues.
Administrative expenses increaseddecreased by 27.8%0.6% from US$888.7878.0 million in 20122015 to US$1,136.1873.0 million in 2013,2016, mainly due to an increasea decrease of 30.6%4.8% in wages and benefits resulting from(as a result of a 6.2% decline in average headcount), as well as the higher numberpositive impact of employees following the combinationdepreciation of LAN and TAMcertain local currencies on wages denominated in 2012.those currencies.
Other operating expenses increased by 31.1%15.4% from US$311.8324.0 million in 20122015 to US$408.7373.7 million in 2013,2016, driven by higher costs associated with fleet sales and redeliveries, and due to lower cost in 2015 as a result of higher sales costs, advertising and marketing expenses and costs relatednegotiations with third parties relating to tours and travel services, related to the integration of TAM’s operations from June 23, 2012.our passenger service system.
Financial income decreased towas essentially unchanged US$72.874.9 million in the year ended December 31, 2013 from2016 compared with US$77.575.1 million in 2012, due to a lower average cash balance and interest rates during the period.2015).
Financial costs (from non-financial activities) increased by 57.0%0.7% to US$462.5416.3 million in 20132016 from US$292.6413.4 million in 20122015, mainly due to higher average long-term debt related to fleet financing mainly related to the consolidation of TAM’s fleet.base interest rate increases on floating rate debt.
Exchange rate differences decreased fromincreased to a gain of US$66.7121.7 million in 2012 to2016 from a loss of US$482.2467.9 million in 2013,2015, mainly resulting from the depreciation if16.5% appreciation of the Brazilian real in the period.
Under other gains (losses), the Company recorded a net loss of US$55.4 million in 2013 as compared to a net loss of US$45.8 million in 2012.between December 31, 2015 and December 31, 2016.
Income tax creditexpense for 20132016 amounted to US$ 20.1163.2 million, as compared to an income tax expensebenefit of US$102.4178.4 million in 2012.2015. This variation is explained mainly by improvedpre-tax results in 2016 (US$273.9 million gain) compared with 2015 (US$357.1 million loss) resulting in increased income tax charges of US$196 million; thenon-recognition of deferred taxes related to tax losses in Brazil from the fourth quarter of 2015(non-recognition of US$90.4 million in 2016 vs US$16.9 million in 2015); the reversal in 2016 of tax provisions in Brazil in the amount of US$61.2 million in 2015; and other items of US$10 million. For more information, see “—Critical Accounting Policies—Deferred Taxes” below and Note 1918 to our audited consolidated financial statements.
Out of Period Adjustments
The Company recorded out of period adjustments resulting in an aggregate net decrease of US$18.2 million to “Net income (loss) for the period” for the year ended December 31, 2016. These adjustments include a loss of US$39.5 million resulting from an account reconciliation process initiated after TAM S.A. and its subsidiaries completed the implementation of the SAP system. A further US$11.0 million decrease reflects adjustments related to foreign exchange differences, also relating to the Company’s subsidiaries in Brazil. The balance of US$32.3 million includes mainly the adjustment of unclaimed fees for expired tickets for the Company and its affiliates outside Brazil. Management of TAM S.A. has concluded that the out of period adjustments that have been identified are material to the 2015 financial statements of TAM S.A., which should therefore require a restatement of TAM’s financial statements. However, LATAM has evaluated the impact of all out of period adjustments, both individually and in the aggregate, and concluded that due to their relative size and to qualitative factors they are not material to the annual consolidated financial statements of LATAM for the year ended December 31, 2016, or to any previously reported consolidated financial statements, therefore no restatement or revision is necessary.
LATAM Airlines Group Financial Results Discussion: Year ended December 31, 2013 (actual)2015 compared to year ended December 31, 2012 (Pro forma)
The following table sets forth certain pro forma income statement data for LATAM Airlines Group. See “—Pro Forma Adjustments” below for further information. For certain operating data during these periods, see “Item 3. Key Information—A. Selected Financial Data—LATAM Unaudited Pro Forma Financial Information.”
| Year Ended December 31, | ||||||||||||||||||||
| (on a Pro Forma Basis) | ||||||||||||||||||||
| 2013 | 2012 | 2013 | 2012 | 2013/2012 | ||||||||||||||||
(in millions of US$, except per share and capital stock data) | As a percentage of total operating revenues | % change | ||||||||||||||||||
Operating Revenues | ||||||||||||||||||||
Passenger | 11,061.6 | 11,017.0 | 85.6 | % | 85.0 | % | 0.4 | % | ||||||||||||
Cargo | 1,863.0 | 1,939.8 | 14.4 | % | 15.0 | % | (4.0 | )% | ||||||||||||
|
|
|
|
|
|
|
|
|
| |||||||||||
Total Operating revenues | 12,924.5 | 12,956.7 | 100.0 | % | 100.0 | % | (0.2 | )% | ||||||||||||
|
|
|
|
|
|
|
|
|
| |||||||||||
Cost of sales | (10,564.8 | ) | (10,536.7 | ) | (77.8 | )% | (81.3 | )% | (4.6 | )% | ||||||||||
Gross Margin | 2,870.4 | 2,420.1 | 22.2 | % | 18.7 | % | 18.6 | % | ||||||||||||
Other operating income | 341.6 | 265.4 | 2.6 | % | 2.0 | % | 28.7 | % | ||||||||||||
Distribution costs | (1,025.9 | ) | (1,059.7 | ) | (7.9 | )% | (8.2 | )% | (3.2 | )% | ||||||||||
Administrative expenses | (1,136.1 | ) | (1,174.8 | ) | (8.8 | )% | (9.1 | )% | (3.3 | )% | ||||||||||
Other operating expenses | (408.7 | ) | (364.5 | ) | (3.2 | )% | (2.8 | )% | 12.1 | % | ||||||||||
Other gains/(losses) | (55.4 | ) | (34.8 | ) | (0.4 | )% | (0.3 | )% | 59.2 | % | ||||||||||
Financial income | 72.8 | 117.2 | 0.6 | % | 0.9 | % | (37.9 | )% | ||||||||||||
Financial costs (from non-financial activities) | (462.5 | ) | (444.2 | ) | (3.6 | )% | (3.4 | )% | 4.1 | % | ||||||||||
Earning on investments (equity method) | 2.0 | 1.0 | 0.0 | % | 0.0 | % | 100.0 | % | ||||||||||||
Exchange rate differences | (482.2 | ) | (290.1 | ) | (3.7 | )% | (2.2 | )% | 66.2 | % | ||||||||||
Result of indexation units | 0.2 | 0.0 | 0.0 | % | 0.0 | % | 100.0 | % | ||||||||||||
|
|
|
|
|
|
|
|
|
| |||||||||||
Income (loss) before taxes | (283.9 | ) | (564.5 | ) | (2.2 | )% | (4.4 | )% | (49.7 | )% | ||||||||||
Income tax expense | 20.1 | 69.7 | 0.2 | % | 0.5 | % | (71.2 | )% | ||||||||||||
|
|
|
|
|
|
|
|
|
| |||||||||||
Net income (loss) for the year | (263.8 | ) | (494.9 | ) | (2.0 | )% | (3.8 | )% | (46.7 | )% | ||||||||||
|
|
|
|
|
|
|
|
|
| |||||||||||
Income (loss) for the period attributable to the parent company’s equity holders | (281.1 | ) | (523.1 | ) | (2.2 | )% | (4.0 | )% | (46.3 | )% | ||||||||||
Income for the period attributable to non-controlling interests | 17.3 | 28.3 | 0.1 | % | 0.2 | % | (38.8 | )% | ||||||||||||
|
|
|
|
|
|
|
|
|
| |||||||||||
Net income for the year | (263.8 | ) | (494.9 | ) | (2.0 | )% | (3.8 | )% | (46.7 | )% | ||||||||||
Earnings per share | ||||||||||||||||||||
Basic earnings per share (US$) | (0.57613 | ) | (1.26891 | ) | n.a. | n.a. | (54.6 | )% | ||||||||||||
Diluted earnings per share(US$) | (0.57613 | ) | (1.26891 | ) | n.a. | n.a. | (54.6 | )% | ||||||||||||
Net loss
Net loss decreased by 46.7% to a loss of US$263.8 million for the year ended December 31, 2013 from a pro forma loss of US$494.9 million in 2012. Net loss attributable to the owners of the parent decreased by 46.3% to US$281.1 million from a pro forma net loss of US$523.1 million in 2012. Results for year 2013 were negatively impacted by a foreign exchange loss of US$ 482.2 million primarily resulting from the 10.4% depreciation of the Brazilian real in 2013 as compared to 2012. Results for 2013 also include US$ 29 million in non-recurring costs related to the restructuring of LATAM’s fleet plan. For more information, see “—Business strategy – Fleet restructuring plan”.
LATAM’s total operating revenues slightly decreased by 0.2% during 2013 as compared to pro forma revenues for 2012, reflecting the rationalization of our domestic Brazil and international operations and a still challenging scenario in the cargo business. These variations include the negative impact of the 10.4% average depreciation of the Brazilian real in 2013 as compared to 2012 in revenues denominated in that currency. The decrease in operating revenues was attributable to a decrease of 4.0% in cargo revenues, partially offset by an increase of 0.4% in passenger revenues. Passenger and cargo accounted to 85.6% and 14.4% of total operating revenues, respectively, for the year ended December 31, 2013.
Total operating expenses decreased by 3.9%, mainly due to lower fuel expenses, reflecting the 2.2% decrease in consumption and the 5.6% decrease in fuel price (after hedge). Lower wages and benefits of 4.0% in the year also positively impacted our operating expenses in 2013 as compared to pro forma operating expenses in 2012.
Operating Revenues
LATAM’s total operating revenues decreased 0.2% to US$ 12,924.5 million for the year ended December 31, 2013 from pro forma operating revenues of US$ 12,956.7 million in 2012, as a result of a 4.0% decrease in cargo revenues, partially offset by a 0.4% increase in passenger revenues.
Passenger revenues increased by 0.4% to US$ 11,061.6 million in 2013 as compared to pro forma passenger revenues of US$ 11.017.0 million in 2012, as a result of an increase of 2.5% in passenger traffic, partially offset by a decrease of 2.0% in passenger yields. Load factors increased by 2.3 percentage points from 78.6% (pro forma) to 80.8%, as the increase in traffic was despite the 0.4% decrease in capacity. Overall, revenues per ASK increased by 0.8% as compared to pro forma revenues per ASK for 2013, including the effect of the devaluation of the Brazilian real on revenues denominated in that currency during year 2013. During 2013, the 0.4% decrease in capacity as compared to pro forma capacity for 2012 was mainly a result of a strong decrease in capacity of 8.4% in the Brazilian domestic market and a rationalization of our international routes, mainly long haul routes from Brazil to Europe. This contraction was partially offset by still strong capacity increases of 11.0% in our Spanish speaking domestic markets in the period. Total passenger yields decreased mostly as a result of the depreciation of the Brazilian real and other currencies in LAN’s domestic markets.
Cargo revenues decreased by 4.0% to US$ 1,863.0 million in 2013 from pro forma cargo revenues of US$1,939.8 million in 2012, as a result of a decline of 3.5% in cargo yields and a 0.5% decrease in traffic. Cargo demand continued to be weak in this period, in particular on import routes into Latin America. Additionally, the decline in yields reflects the 10.4% depreciation of the Brazilian real on cargo revenues in the Brazilian domestic market during 2013 as compared to 2012, and competitive pressures from regional and international cargo carriers.
Cost of Sales
Cost of sales decreased by 4.6% to US$10,054.2 million for the year ended December 31, 2013 from a pro forma cost of sales of US$10,536.7 million in 2012, mainly as a result of lower fuel expenses in the year. Cost of sales was positively impacted by the 10.4% average depreciation of the Brazilian real in 2013 as compared to 2012 in costs denominated in that currency. As a percentage of total revenues, cost of sales decreased from 81.3% in 2012 to 77.8% in 2013.
The table below presents cost of sales information for the fiscal year ended December 31, 2013 actual and 2012 pro forma.
| Year Ended December 31 | ||||||||||||||||||||
| 2013 | 2012 | 2013 | 2012 | 2013/2012 % change | ||||||||||||||||
| (in US$millions, except as otherwise stated) | As a percentage of total operating revenues | |||||||||||||||||||
Revenues | 12,924.5 | 12,956.7 | 100.0 | % | 100.0 | % | (0.2 | )% | ||||||||||||
Cost of sales | (10,564.8 | ) | (10,536.7 | ) | (77.8 | )% | (81.3 | )% | (4.6 | )% | ||||||||||
|
|
|
|
|
|
|
|
|
| |||||||||||
Aicraft Fuel | (4,414.2 | ) | (4,780.3 | ) | (34.2 | )% | (36.9 | )% | (7.7 | )% | ||||||||||
Wages and Benefits | (1,881.0 | ) | (2,009.0 | ) | (14.6 | )% | (15.5 | )% | (6.4 | )% | ||||||||||
Other Rental and Landing Fees | (1,373.1 | ) | (1,377.1 | ) | (10.6 | )% | (10.6 | )% | (0.3 | )% | ||||||||||
Depreciation and Amortization | (1,041.7 | ) | (1,087.0 | ) | (8.1 | )% | (8.4 | )% | (4.2 | )% | ||||||||||
Aircraft Rentals | (441.1 | ) | (422.0 | ) | (3.4 | )% | (3.3 | )% | 4.5 | % | ||||||||||
Aircraft Maintenance | (477.1 | ) | (424.4 | ) | (3.7 | )% | (3.3 | )% | 12.4 | % | ||||||||||
Passenger Services | (331.4 | ) | (314.9 | ) | (2.6 | )% | (2.4 | )% | 5.2 | % | ||||||||||
Other Costs of Sales | (94.5 | ) | (122.0 | ) | (0.7 | )% | (0.9 | )% | (22.5 | )% | ||||||||||
Aircraft fuel expense decreased by 7.7% to US$ 4,414.2 million in 2013 compared to a pro forma fuel expense of US$ 4,780.3 million in 2012. Fuel expense decreased both because of a decrease of 2.2% in consumption and a decrease in the cost of fuel. The decrease in consumption goes in line with the rationalization of passenger and cargo operations which resulted in a decrease of 0.2% in our ASK-equivalents in the year as compared to 2012 (pro forma), and ongoing fuel efficiency initiatives. The into-wing (fuel price
plus taxes and transportation costs) 2013 average final price was US$3.50 per gallon (without hedge), representing a 5.2% decrease from the 2012 average. In addition, during 2013 the Company recognized US$19.0 million in fuel hedge gains as compared to fuel hedge losses of US$ 1.8 million in year 2012.
Wages and benefits decreased 6.4% to US$1,881.0 million in 2013 compared to US$2,009.0 million in 2012, mainly as a result of the depreciation of the Brazilian real during 2013 as compared to 2012. This effect was partially offset by the increase in the average wages.
Depreciation and amortization decreased by 4.2% to US$1,041.7 million in 2013 from US$1,087.0 million in 2012 (pro forma), mainly as a result of the depreciation of the Brazilian real in the year as compared to 2012. Excluding this effect, depreciation would have increased slightly as a result of the incorporation of twenty-five aircraft from the Airbus A320 family, four Boeing 767 aircraft, two Boeing 777-300ER aircraft and two Boeing 787-800 aircraft to our total fleet (on and off balance sheet) during the year; partially offset by the phase out of thirteen Airbus A320 family aircraft, one Airbus A340 aircraft, one Boeing 767 aircraft, three Bombardier Dhc8-200 aircraft and one Bombardier Dhc-400 aircraft during the year.
Other rental and landing fees decreased by 0.3% to US$ 1,373.1 million in 2013 from pro forma rentals and landing fees of US$ 1,377.1 million in 2012, mainly as a result of lower aeronautical fees.
Aircraft maintenance expenses increased by 12.4% to US$477.1 million in 2013 from US$424.4 million in 2012 (pro forma) mainly due to more aircraft redeliveries, which resulted in increased maintenance expenses for required checks prior to the return of such aircraft to lessors during the year. This effect was partially offset by the depreciation of the Brazilian real on maintenance done in Brazil.
Aircraft rentals increased 4.5% to US$ 441.1 million in 2013 from pro forma rentals of US$ 422.0 million in 2012, explained by the incorporation under operating leases of five Airbus A320 family aircraft, ten Airbus A330 aircraft, two Boeing B777 aircraft and two Boeing B787 aircraft aircraft to our fleet. This effect was partially offset by the phase out of aircraft under operating leases, including eight Airbus A320 family aircraft, one Airbus A340 aircraft, one Boeing B737 aircraft, two Boeing B767 aircraft, three Bombardier Dhc 8-200 aircraft and one Bombardier Dhc 8-400 aircraft during the same period.
Passenger service expenses increased by 5.2% to US$ 331.4 million from pro forma passenger services of US$ 314.9 million in 2012, mainly resulting from the increase of 3.1% in passengers transported and increases in passenger concessions.
As a result of the above, gross margin increased by 22.2% from US$2,420.1 million in 2012 (pro forma) to US$2,870.4 million in 2013.
Other Consolidated Results
Other operating income increased by US$ 76.2 million to US$341.6 million in the year ended December 31, 2013 from US$265.4 million in 2012 (pro forma), mainly as a result of increased income of US$28.7 million from Multiplus resulting from breakage and non-air redemptions during 2013 and the income of US$10.8 million and US$ 8.2 million generated as a result of the sale and lease-back of ten Airbus A330 aircraft, and two Airbus A318 aircraft and an engine, during the second quarter of the year, respectively.
Distribution costs decreased by 3.2% from US$1,059.7 million in 2012 (pro forma) to US$1,025.9 million in 2013. This decrease was related to lower commissions to agents (related to both passenger and cargo sales), which decreased 2.0% to US$408.7 million in 2013 from US$417.1 million in 2012.
Administrative expenses decreased by 3.3% from US$1,174.8 million in 2012 (pro forma) to US$1,136.1 million in 2013 due to lower wages and benefits expenses resulting from a lower headcount in the period and the 10.4% depreciation of the Brazilian real as compared to 2012, partially offset by the recognition of US$15.5 million in compensations related to the voluntary leave and retirement program of 800 employees at TAM.
Other operating expenses increased by 12.1% from US$364.5 million in 2012 to US$408.7 million in 2013.
Financial income decreased by 37.9% to US$72.8 million in 2013 from US$117.2 million in 2012, mainly due to a lower average cash balance and lower interest rates during the period.
Financial costs (from non-financial activities) increased by 4.1% to US$462.5 million in 2013 from US$444.2 million in 2012 (pro forma) mainly as a result of a new debt profile, which includes the securitized bond issued in November 2013.
Exchange rate differences resulted in a loss of US$482.2 million in 2013 compared to a loss of US$290.1 million in 2012. This variation is mainly explained due to a depreciation of the Brazilian real in 2013 compared to 2012 and the depreciation of local currencies in LAN’s Spanish speaking countries in the period.
Income tax credit amounted to US$20.1 million in 2013 as compared to a pro forma tax credit of US$69.7 million in 2012. For more information, see “—Critical Accounting Policies—Deferred Taxes” below and Note 19 to our audited consolidated financial statements.
Pro Forma Adjustments
The unaudited pro forma information had been prepared using the purchase method of accounting, with LAN treated as the acquirer of TAM.
| For the period ended December 31, 2012 | ||||||||||||||||||||
| (on a pro forma basis) | ||||||||||||||||||||
| LATAM (As Revised) | TAM (a) (January 1, 2012 to June 22, 2012) | LATAM (consolidated) | Pro Forma Adjustments | Condensed Pro Forma | ||||||||||||||||
| (in millions of US$, except per share and capital stock data) | ||||||||||||||||||||
Passenger | 7,966.8 | 3,050.1 | 11,017.0 | 0.0 | 11,017.0 | |||||||||||||||
Cargo | 1,743.5 | 196.2 | 1,939.8 | (0.0 | ) | 1,939.8 | ||||||||||||||
Total operating revenues | 9,710.4 | 3,246.4 | 12,956.7 | (0.0 | ) | 12,956.7 | ||||||||||||||
Cost of sales (b, c, d, e) | (7,634.5 | ) | (2,852.2 | ) | (10,486.7 | ) | (50.0 | ) | (10,536.7 | ) | ||||||||||
|
|
|
|
|
|
|
|
|
| |||||||||||
Gross Margin | 2,075.9 | 394.1 | 2,470.1 | (50.0 | ) | 2,420.1 | ||||||||||||||
|
|
|
|
|
|
|
|
|
| |||||||||||
Other operating income | 220.2 | 45.2 | 265.4 | 0.0 | 265.4 | |||||||||||||||
Distribution costs | (803.6 | ) | (256.1 | ) | (1,059.7 | ) | 0.0 | (1,059.7 | ) | |||||||||||
Administrative expenses (f) | (888.7 | ) | (328.6 | ) | (1,217.3 | ) | 42.4 | (1,174.8 | ) | |||||||||||
Other expenses | (311.8 | ) | (52.7 | ) | (364.5 | ) | (0.0 | ) | (364.5 | ) | ||||||||||
Other gains/(losses) (d) | (45.8 | ) | 18.8 | (27.0 | ) | (7.8 | ) | (34.8 | ) | |||||||||||
Financial income (g) | 77.5 | 26.5 | 103.9 | 13.2 | 117.2 | |||||||||||||||
Financial costs (h, g) | (294.6 | ) | (147.6 | ) | (442.2 | ) | (2.0 | ) | (444.2 | ) | ||||||||||
Equity accounted earnings | 1.0 | 0.0 | 1.0 | 0.0 | 1.0 | |||||||||||||||
Foreing exchange gains/(losses) | 66.7 | (356.7 | ) | (290.1 | ) | (0.0 | ) | (290.1 | ) | |||||||||||
Result of indexation units | (0.0 | ) | 0.0 | (0.0 | ) | (0.0 | ) | (0.0 | ) | |||||||||||
|
|
|
|
|
|
|
|
|
| |||||||||||
Income (loss) before taxes | 96.7 | (657.2 | ) | (560.4 | ) | (4.1 | ) | (564.5 | ) | |||||||||||
Income tax expense (i) | (102.4 | ) | 169.0 | 66.6 | 3.0 | 69.7 | ||||||||||||||
|
|
|
|
|
|
|
|
|
| |||||||||||
Net (loss)/income for the period | (5.6 | ) | (488.2 | ) | (493.8 | ) | (1.1 | ) | (494.9 | ) | ||||||||||
| 0.0 | 0.0 | 0.0 | 0.0 | 0.0 | ||||||||||||||||
| 0.0 | 0.0 | 0.0 | 0.0 | 0.0 | ||||||||||||||||
Income (loss) for the period attributable | 0.0 | 0.0 | 0.0 | 0.0 | 0.0 | |||||||||||||||
to the parent company’s equity holders | (19.1 | ) | (501.2 | ) | (520.3 | ) | (2.9 | ) | (523.1 | ) | ||||||||||
Income for the period attributable to | 0.0 | 0.0 | 0.0 | 0.0 | 0.0 | |||||||||||||||
non-controlling interests | 13.4 | 13.0 | 26.5 | 1.8 | 28.3 | |||||||||||||||
|
|
|
|
|
|
|
|
|
| |||||||||||
Net (loss)/income | (5.6 | ) | (488.2 | ) | (493.8 | ) | (2.9 | ) | (496.7 | ) | ||||||||||
Earnings per share (j) | ||||||||||||||||||||
Basic loss per share (US$) | (1.26891 | ) | ||||||||||||||||||
Diluted loss per share (US$) | (1.26891 | ) | ||||||||||||||||||
The Unaudited Pro Forma Statement of Income reflects the following adjustments:
LATAM Airlines Group Financial Results Discussion: Year ended December 31, 2012 (actual) as retrospectively revised compared to year ended December 31, 2011 (actual)2014.
The following table sets forth certain income statement data for LATAM Airlines Group, for the year ended December 31, 2012 (including TAM’s results from June 23, 2012)2015, and for LATAM Airlines Group, for the year ended December 31, 2011, which represents the historical income statement data of LAN for2014. For certain operating data duringfor these years.periods, see “Item 3. Key Information—A. Selected Financial Data.”
| Year Ended December 31 | ||||||||||||||||||||
| 2012 | 2011 | 2012 | 2011 | 2012/2011 % change | ||||||||||||||||
| (in US$ millions, except as otherwise stated) | As a percentage of total operating revenues | |||||||||||||||||||
Passenger | 7,966.8 | 4,008.9 | 82.0 | % | 71.8 | % | 98.7 | % | ||||||||||||
Cargo | 1,743.5 | 1,576.5 | 18.0 | % | 28.2 | % | 10.6 | % | ||||||||||||
|
|
|
|
|
|
|
|
|
| |||||||||||
Total operating revenues | 9,710.4 | 5,585.4 | 100.0 | % | 100.0 | % | 73.9 | % | ||||||||||||
Cost of sales | (7,634.5 | ) | (4,078.6 | ) | 78.6 | % | 73.0 | % | 87.2 | % | ||||||||||
|
|
|
|
|
|
|
|
|
| |||||||||||
Gross margin | 2,075.9 | 1,506.5 | 21.4 | % | 27.0 | % | 37.8 | % | ||||||||||||
Other operating income | 220.2 | 132.8 | 2.3 | % | 2.4 | % | 65.4 | % | ||||||||||||
Distribution costs | (803.6 | ) | (479.8 | ) | 8.3 | % | 8.6 | % | 67.5 | % | ||||||||||
Administrative expenses | (889 | ) | (405.7 | ) | 9.2 | % | 7.3 | % | 119.0 | % | ||||||||||
Other expenses | (311.8 | ) | (214.4 | ) | 3.2 | % | 3.8 | % | 44.9 | % | ||||||||||
Other gains/(losses) | (45.8 | ) | (33.0 | ) | 0.5 | % | 0.6 | % | 39.4 | % | ||||||||||
Financial income | 77.5 | 14.5 | 0.8 | % | 0.3 | % | 450.0 | % | ||||||||||||
Financial costs | (294.6 | ) | (139.1 | ) | 3.0 | % | 2.5 | % | 112.2 | % | ||||||||||
Equity accounted earnings | 1.0 | 0.5 | 0.0 | % | 0.0 | % | 100.0 | % | ||||||||||||
Foreign exchange gains/(losses) | 66.7 | (0.3 | ) | 0.7 | % | 0.0 | % | 100.0 | % | |||||||||||
Result of indexation units | 0.0 | 0.1 | 0.0 | % | 0.0 | % | 0 | % | ||||||||||||
|
|
|
|
|
|
|
|
|
| |||||||||||
Income before taxes | 96.7 | 382.4 | 1.0 | % | 6.8 | % | (74.6 | )% | ||||||||||||
Income tax expense | (102.4 | ) | (61.8 | ) | 1.1 | % | 1.1 | % | 68.9 | % | ||||||||||
|
|
|
|
|
|
|
|
|
| |||||||||||
Net (loss)/income for the year | (5.6 | ) | 320.6 | 0.1 | % | 5.7 | % | (101.9 | )% | |||||||||||
|
|
|
|
|
|
|
|
|
| |||||||||||
(Loss)/Income attributable to owners of the parent | (19.1 | ) | 320.2 | 0.2 | % | 5.7 | % | (105.9 | )% | |||||||||||
Income/(loss) attributable to non-controlling interest | 13.4 | 0.4 | 0.1 | % | 0.0 | % | 100.0 | % | ||||||||||||
|
|
|
|
|
|
|
|
|
| |||||||||||
Net (loss)/income for the year | (5.6 | ) | 320.6 | 0.1 | % | 5.7 | % | (101.9 | )% | |||||||||||
|
|
|
|
|
|
|
|
|
| |||||||||||
Earnings per share | ||||||||||||||||||||
Basic (loss)/earnings per share (US$) | (0.0463 | ) | 0.9434 | n.a. | n.a. | (104.9 | )% | |||||||||||||
Diluted (loss)/earnings per share (US$) | (0.0463 | ) | 0.9426 | n.a. | n.a. | (104.9 | )% | |||||||||||||
| Year Ended December 31, | ||||||||||||||||||||
| 2015 | 2014 | 2015 | 2014 | 2015/2014 % change | ||||||||||||||||
| (in US$ millions, except per share and capital stock data) | As a percentage of total operating revenues | |||||||||||||||||||
Consolidated Results of Income by Function | ||||||||||||||||||||
Operating revenues | ||||||||||||||||||||
Passenger | 8,410.6 | 10,380.1 | 86.4 | % | 85.8 | % | (19.0 | %) | ||||||||||||
Cargo | 1,329.4 | 1,713.4 | 13.6 | % | 14.2 | % | (22.4 | %) | ||||||||||||
|
|
|
|
|
|
|
|
|
| |||||||||||
Total operating revenues | 9,740.0 | 12,093.5 | 100.0 | % | 100.0 | % | (19.5 | %) | ||||||||||||
|
|
|
|
|
|
|
|
|
| |||||||||||
Cost of sales | (7,636.7 | ) | (9,624.5 | ) | (78.4 | %) | (79.6 | %) | (20.7 | %) | ||||||||||
Gross margin | 2,103.3 | 2,469.0 | 21.6 | % | 20.4 | % | (14.8 | %) | ||||||||||||
Other operating income | 385.8 | 377.6 | 4.0 | % | 3.1 | % | 2.2 | % | ||||||||||||
Distribution costs | (783.3 | ) | (957.1 | ) | (8.0 | %) | (7.9 | %) | (18.2 | %) | ||||||||||
Administrative expenses | (878.0 | ) | (980.7 | ) | (9.0 | %) | (8.1 | %) | (10.5 | %) | ||||||||||
Other operating expenses | (324.0 | ) | (401.0 | ) | (3.3 | %) | (3.3 | %) | (19.2 | %) | ||||||||||
Financial income | 75.1 | 90.5 | 0.8 | % | 0.7 | % | (17.0 | %) | ||||||||||||
Financial costs | (413.4 | ) | (430.0 | ) | (4.2 | %) | (3.6 | %) | (3.9 | %) | ||||||||||
Share of profit of investments accounted for using the equity method Foreign exchange gains/(losses) Result of indexation units Other gains/(losses) Income (loss) before income taxes Income (loss) tax expense Net income (loss) for the period Income (loss) for the period attributable to the parent company’s equity holders Income (loss) for the period attributable tonon-controlling interests Net income (loss) for the period Earnings per share Basic earnings per share (US$) Diluted earnings per share (US$) Year Ended December 31, 2015 2014 2015 2014 2015/2014
% change (in US$ millions, except per
share and capital stock data) As a percentage of total
operating revenues 0.0 (6.5 ) 0.0 % (0.1 %) 100.0 % (467.9 ) (130.2 ) (4.8 %) (1.1 %) 259.4 % 0.6 0.1 0.0 % 0.0 % 500.0 % (55.3 ) 33.5 (0.5 %) 0.3 % (265.0 %) (357.1 ) 65.2 (3.4 %) 0.4 % (647.6 %) 178.4 (292.4 ) 1.8 % (2.4 %) 39.0 % (178.7 ) (227.2 ) (1.6 %) (2.0 %) (21.3 %) (219.3 ) (260.0 ) (2.2 %) (2.2 %) (15.7 %) 40.5 32.8 0.4 % 0.3 % 23.5 % (178.7 ) (227.2 ) (1.8 %) (1.9 %) (161.0 %) (0.40193 ) (0.47656 ) n.a. n.a. (15.7 %) (0.40193 ) (0.47656 ) n.a. n.a. (15.7 %)
| * | The abbreviation “n.a.” means |
Net (Loss)Income /Income Loss
Net incomeloss for the year ended December 31, 2015 equaled US$ 178.7 million, representing an improvement of US$ 48.5 million from a net loss of US$227.2 million in 2014. Net loss attributable to the parent company’s shareholders improved to US$ 219.3 million in 2015 from US$260.0 million in 2014. Results for 2015 include an US$ 80 million provision recognized during the fourth quarter of the year for aircraft redelivery costs associated with the 2016phase-out of the Airbus A330 (for more information, see Financial Statements Note 27 (e) – Restructuring Costs). Results were also impacted by a foreign exchange loss of US$ 467.9 million, (mainly resulting from the 49.0% depreciation of the Brazilian real between December 31, 2014 and December 31, 2015, and a US$41.0 million charge related to the adjustment in the exchange rate of cash held in Venezuela), as compared to a foreign exchange loss of US$130.2 million in 2014.
Operating Revenues
Our total operating revenues decreased by 101.9%19.5% to a loss of US$6 9,740.0 million for the year ended December 31, 2012 from an income2015, compared to revenues of US$321 12,093.5 million in 2011. Net income attributable to the owners of the parent decreased by 105.9% to a loss of US$19 million in 2012 from an income of US$321 million in 2011. Results for the 2012 year were negatively impacted by a net loss of US$45 million related to the business combination with TAM and integration costs of US$47 million, due to the combination of LAN and TAM on June 22, 2012. In addition, LATAM recorded an accounting charge of US$70 million related to the increase in the Chilean corporate tax rate from 17% to 20% during 2012.
LATAM’s total operating revenues increased by 73.9% during 2012, reflecting the consolidation of TAM’s revenues from June 23, 2012, as well as solid upward demand trends in our passenger business.2014. The increase2015 decrease in operating revenues was attributable to an increasea 19.0% decrease in passenger revenues, and a 22.4% decrease in cargo revenues of 98.7% and 10.6%, respectively.revenues. Passenger and cargo revenues accounted for 82%86.4% and 18%13.6% of total operating revenues (defined as revenues from passenger and cargo operations, plus other operating income) in 2012,2015, respectively.
Passenger traffic and capacity increased significantlyOur consolidated passenger revenues decreased by 19.0% to US$8,410.6 million in 2012 following the consolidation of TAM’s domestic and international operations. Other capacity increases were mainly focused on domestic routes within Chile, regional routes within Latin America, and long-haul routes to the United States, and were partially offset by decreased capacity on Brazilian domestic routes.
Operating expenses also increased2015 from US$10,380.1 million in 2014, largely as a result of a decrease of 21.4% in our unit revenues (RASK). Our capacity increased by 3.1%. The increase in capacity was a result of a 6.4% increase in our international operations (includingand a larger fleet) following4.8% increase in our domestic Spanish-Speaking Countries operations, and was partially offset by a decrease of 2.5% in capacity in our domestic Brazil operations. Decreases in RASK reflect a decrease of 21.1% in consolidated yields, resulting from the combination with TAM on June 22, 2012.slowdown in economic activity in the region and depreciation of local currencies, mainly in Brazil.
Operating Revenues
OperatingCargo revenues increased 73.9%decreased by 22.4%, to US$9,710 million for the year ended December 31, 2012 from US$5,5851,329.4 million in 2011. Our consolidated passenger revenues increased by 98.7% to2015 from US$7,9671,713.4 million in 2012 from US$4,009 million in 2011, primarily2014, as a result of the consolidationa decrease of TAM’s revenue from June 23, 2012. These consolidated1.9% in capacity (ATK) and a decrease of 20.9% in unit revenues incorporate US$3,645 million(RATK). Capacity decreased in our cargo operations mainly as a result of a reduced freighter operation and thesub-lease of two additional aircraft to another company. Decreases in RATK reflect the business combination with TAM. Notwithstandingstill challenging cargo scenario in South America and in particular the combination with TAM, the increase in passenger revenues is mainly attributable to an increase of 12.0% in passenger capacity, as measured in ASKs, and a 0.9% increase in unit revenue per ASK.
Cargo revenues increased by 10.6% to US$1,743 million in 2012 from US$1,576 million in 2011, also as a resultweakness of the consolidation of TAM’simports into the region, mainly to Brazil, which have affected our cargo revenues from June 23, 2012. These consolidated Cargo revenues incorporate US$196 millionyields. During 2015, cargo yields decreased by 11.8% as a result of the combination with TAM. Excluding this effect, cargo revenues decreased 2.2%.compared to 2014.
Other operating income also increased by US$87 million to US$133 million in 2012 from US$220 million in 2011, due primarily to the sale of two properties owned by Inmobiliaria Aeronautica S.A., an affiliate of LATAM, and the sale of a Boeing 767-200 and three Airbus A318s. As a result of the combination with TAM, US$50 million in other operating income relating to TAM has been included in our consolidated results.
Cost of Sales
Cost of sales increaseddecreased by 87.2%20.7% to US$7,6347,636.7 million forin the year ended December 31, 20122015 from US$4,0789,624.5 million in 2011,2014, mainly as a result of increase in operations due to lower fuel expenses in the consolidation of TAM’s costs from June 23, 2012.year. As a percentage of total operating revenues, cost of sales increaseddecreased from 73.0%79.6% in 20112014 to 78.6 %78.4% in 2012.2015.
The table below presents cost of sales information for the fiscal year ended December 31, 20122015 and 2011 actual.2014.
| Year Ended December 31 | Year Ended December 31, | |||||||||||||||||||||||||||||||||||||||
| 2012 | 2011 | 2012 | 2011 | 2012/2011 % change | 2015 | 2014 | 2015 | 2014 | 2015/2014 % change | |||||||||||||||||||||||||||||||
| (in US$millions, except as otherwise stated) | As a percentage of total operating revenues | (in US$ millions, except as otherwise stated) | As a percentage of total operating revenues | |||||||||||||||||||||||||||||||||||||
Revenues | 9,710.4 | 5,585.4 | 82.0 | % | 71.8 | % | 98.7 | % | 9,740.0 | 12,093.5 | 100.0 | % | 100.0 | % | (19.5 | %) | ||||||||||||||||||||||||
Cost of sales | (7,634.5 | ) | (4,078.6 | ) | 78.6 | % | 73.0 | % | 87.2 | % | (7,636.7 | ) | (9,624.5 | ) | (78.4 | %) | (79.6 | %) | (20.7 | %) | ||||||||||||||||||||
|
|
|
|
|
|
|
|
|
| |||||||||||||||||||||||||||||||
Aicraft Fuel | (3,434.6 | ) | (1,750.1 | ) | (35.4 | )% | (31.3 | )% | 96.3 | % | ||||||||||||||||||||||||||||||
Aircraft Fuel | (2,651.1 | ) | (4,167.0 | ) | (27.2 | %) | (34.5 | %) | (36.4 | %) | ||||||||||||||||||||||||||||||
Wages and Benefits | (1,431.2 | ) | (717.5 | ) | (14.7 | )% | (12.8 | )% | 99.5 | % | (1,553.8 | ) | (1,751.3 | ) | (16.0 | %) | (14.5 | %) | (11.3 | %) | ||||||||||||||||||||
Other Rental and Landing Fees | (1,052.6 | ) | (671.6 | ) | (10.8 | )% | (12.0 | )% | 56.7 | % | (1,109.8 | ) | (1,327.2 | ) | (11.4 | %) | (11.0 | %) | (16.4 | %) | ||||||||||||||||||||
Depreciation and Amortization | (771.1 | ) | (396.5 | ) | (7.9 | )% | (7.1 | )% | 94.5 | % | (934.4 | ) | (991.3 | ) | (9.6 | %) | (8.2 | %) | (5.7 | %) | ||||||||||||||||||||
Aircraft Rentals | (308.8 | ) | (174.2 | ) | (3.2 | )% | (3.1 | )% | 77.3 | % | (525.1 | ) | (521.4 | ) | (5.4 | %) | (4.3 | %) | 0.7 | % | ||||||||||||||||||||
Aircraft Maintenance | (297.6 | ) | (182.4 | ) | (3.1 | )% | (3.3 | )% | 63.2 | % | (437.2 | ) | (452.7 | ) | (4.5 | %) | (3.7 | %) | (3.4 | %) | ||||||||||||||||||||
Passenger Services | (239.8 | ) | (136.0 | ) | (2.5 | )% | (2.4 | )% | 76.3 | % | (295.4 | ) | (300.3 | ) | (3.0 | %) | (2.5 | %) | (1.6 | %) | ||||||||||||||||||||
Other Costs of Sales | (98.8 | ) | (50.3 | ) | (1.0 | )% | (0.9 | )% | 96.4 | % | (129.9 | ) | (113.3 | ) | (1.3 | %) | (0.9 | %) | 14.6 | % | ||||||||||||||||||||
The increasedecrease in cost of sales was driven by higherlargely lower aircraft fuel expenses, which increaseddecreased by 96.3%36.4% to US$3,4342,651.1 million in 2012 from US$1,750 million2015 as a result of a 40.2% decrease in 2011. Fuel expenses increased mainly due to a 68.7% increase in consumption related to the incorporation of TAM’s operations from June 23, 2012. Notwithstanding the incorporation of TAM’s operations, the increase reflects a rise of 7.4% in prices and 6.1% in consumption. In addition,full year average fuel price (excluding hedge losses). LATAM recognized a net loss of US$1.8239.4 million in fuel hedging in 2015, compared to a gainfuel hedge loss of US$40108.8 million in 2011.
Wages and benefits increased 99.5%2014. In 2015 the Company also recognized a US$19.2 million hedge gain related to US$1,431 millionforeign currency contracts, which were recognized in 2012 compared to US$718 million in 2011, mainly due to the combination between LAN and TAM.fuel cost line.
Depreciation and amortization increaseddecreased by US$38856.9 million, amounting to US$934.4 million, which represents a decrease of which US$318 million was due to the combination with TAM. This represents an increase of 98% mainly due to the incorporation in 2012 under property, plant and equipment of all of TAM’s fleet (including new TAM fleet deliveries in 2012). Notwithstanding the incorporation of TAM’s fleet,5.7% (despite the increase wasin modern owned aircraft in our fleet), mainly dueas a result of thephase-out of leased aircraft with the consequent decrease in maintenance depreciation and the positive impact of the depreciation of the Brazilian real in the year as compared to the addition to the LAN fleet of three Airbus A319 aircraft, seven A320 Airbus aircraft, nine Boeing 767 aircraft, three Boeing 787 aircraft, four Boeing 777 aircraft and two Boeing 777F aircraft during 2012.2014.
Other rental and landing fees increaseddecreased by 16.4% to US$3811,109.8 million of which US$335in 2015 from U$1,327.2 million was due to the combination with TAM. Notwithstanding the combination with TAM, the increase is largely due to higher charter aircraft rentals andin 2014, mainly resulting from lower aeronautical charges and handling fees, in line with the increase in the sizerates (in dollars) as a result of the LAN fleet during the year detailed above. This increase was partially offset by lower costsdepreciation of aviation insurance.local currencies.
Aircraft maintenance expenses increaseddecreased by 63.7%3.4%, tofrom US$298452.7 million in 2012 from2014 to US$182437.2 million in 2011, with US$77 million due to the combination with TAM. Notwithstanding the combination with TAM, the increase is due to the increase in the size2015, mainly as a result of the LAN fleet during the year detailed above.renewal initiatives and reduced operations.
Aircraft rentals increased by US$139 million, primarily due0.7% to an increase of US$133525.1 million in 2015 from US$521.4 million in 2014 despite fewer leased aircraft, rentals as a result of the combination with TAM. In addition, LATAM recently leased fourincorporation of larger and more modern aircraft under operating leases (i.e. Boeing 787s), whereas returned aircraft were mainly been older and smaller models (i.e. Airbus A320 aircraft. This increase is partially offset by the return of three Boeing 737s and two Boeing 767s.A319, Dash8 Q400 aircraft).
Passenger service expenses increaseddecreased by 76.5%1.6%, to US$240295.4 million in 2012 when2015 compared to passenger service expenses of US$136300.3 million in 2011. This increase was primarily due to the effect of the combination with TAM, which added US$92 million to the passenger service expenses. Notwithstanding the combination with TAM, the increase is primarily due to2014, despite a 16.4% increase inflat the number of passengers transported, partially offset by lowermainly due a decrease in passenger compensation payments.compensations and the positive effect of the depreciation of the Brazilian real on supplier costs.
As a result of the above, gross margin increased by 37.8%margin(defined as operating revenue minus cost of sales)decreasedby 14.8% from US$2,469.0 million in 2014 to US$2,0762,103.3 million in 2012 from US$1,507 million in 2011, as the increase in total revenues in 2012 following the combination of LAN and TAM were greater than the increase in costs of sales associated with the consolidation of TAM’s operations.2015.
Other Consolidated Results
Other operating income increased in 2015 by 2.2%, from US$87377.6 million in 2014 to US$385.8 million in 2015, mainly due to an increase of US$15.4 million in revenue from aircraft leased to third parties.
Distribution costs decreased by 18.2% from US$957.1 million in 2014 to US$783.3 million in 2015, mainly as a result of lower commissions to agents (which decreased by 17.2% from US$365.5 million to US$220302.8 million),related to lower revenues, lower sales fulfillments in some countries and depreciation of local currencies.
Administrative expenses decreased by 10.5% from US$980.7 million forin 2014 to US$878.0 million in 2015, mainly due to a decrease of 11.3% in wages and benefits resulting from a 5.0% decline in average headcount and the positive impact of the depreciation of the Brazilian real and Chilean peso on wages denominated in those currencies.
Other operating expenses decreased by 19.2% from US$401.0 million in 2014 to US$324.0 million in 2015, mainly due to lower tax contingencies in 2015 as well as the reversal of certain tax contingencies established during 2014.
Financial income decreased to US$75.1 million in the year ended December 31, 20122015 from US$13390.5 million in 2011,2014, mainly due primarilyto an increase in interest rates in Brazil and due to the depreciation of the local currency affecting the investments the Company held in Brazil and Argentina.
Financial costs (fromnon-financial activities) decreased by 3.9% to US$413.4 million in 2015 from US$430.0 million in 2014, mainly due to the recognition of US$23 million in breakage costs related to the sale and leaseback of two properties owned by Inmobiliaria Aeronautica S.A. and the salefour of aour Boeing 767-200 and three Airbus A318s, which together amounted to approximately US$29 million. As a result of the combination with TAM, US$50 million in other operating revenue relating to TAM has been included in our consolidated results.
Distribution costs increased by 67.5% to US$804 million in 2012 from US$480 million in 2011, as a result of the consolidation of TAM’s results from June 23, 2012.
Administrative expenses increased by 119.0% to US$889 million in 2012 from US$406 million in 2011, due to the higher number of employees following the combination of LAN and TAM in 2012.
Other expenses increased by 44.4% to US$310 million in 2012 from US$214 million in 2011, as a result of higher sales costs, advertising and marketing expenses, and costs related to tours and travel services, related to the combination of TAM’s operations from June 23, 2012.
Financial income increased to US$77 million in 2012 from US$14 million in 2011, due to a higher average cash balance777 aircraft during the period, following the consolidationfirst quarter of TAM’s results from June 23, 2012.
Financial costs increased by 112.2% to US$295 million in 2012 from US$139 million in 2011 due to higher average long-term debt related to fleet financing mainly related to the consolidation of TAM’s fleet.2014.
Exchange rate differences increased to a gain of US$67 million in 2012worsened, from a loss of US$0.3130.2 million in 2011. The 2012 amount2014 to a loss of US$467.9 million in 2015, mainly resulting from the 49.0% depreciation of the Brazilian real between December 31, 2014 and December 31, 2015.
We obtained an income tax benefit for 2015 of US$178.4 million, compared to an income tax expense of US$292.4 million in 2014. This variation is primarilypartially explained by an accounting charge of US$150.2 million in 2014 due to the consolidation of TAM operations from June 23, 2012, which are substantially conducted in Brazilian real.
Under other gains/(losses), the Company recorded a net loss of US$46 million in 2012, mainly due to aircraft sale and redelivery costs.
Income tax expenses increased by 68.9%, totaling US$103 million in 2012 as compared to US$61 million in 2011.
Accounting impact of the business combination
The merger between LAN and TAM has been accounted for using the purchase method of accounting, with LAN treated as the acquirer of TAM.
Consideration paid was calculated, in accordance with IFRS 3, as the sum of the fair value of the LAN shares provided and the squeeze-out of the remaining TAM shareholders. Following this criteria, the total consideration paid as of June 22, 2012 was US$ 3,782.2 million.
As a result of the consolidation, certain TAM assets and liabilities which were accounted for at historical values were incorporated into the consolidated balance sheet at their fair value, as required by applicable accounting principles. Applicable accountings standards permit a one year measurement period, requiring fair value adjustments completed during that period to be adjusted against previously reported goodwill. As of June 30, 2013, the purchase price allocation has been completed. Previously reported goodwill has been adjusted to reflect fair value changes in this one year period. Goodwill as of June 30, 2013 amounts to US$ 3,890.2 million.
The main adjustmentsmodifications made to the balance sheet accountsChilean Tax System, consisting in a gradual increase of TAM as a result of the consolidation with LATAM Airlines Group were relatedcorporate income tax from 20% in 2014 to the fair values of the following: (i) airport slots (Congonhas, JFK27% by 2018. For more information, see “—Critical Accounting Policies—Deferred Taxes” below and Heathrow airports); (ii) the Multiplus loyalty program; (iii) fleet; and (iv) other provisions, including legal proceedings with a probability of loss below 50%, which are not accounted for under the normal course of business but must be accounted for under a business combination, accordingNote 17 to applicable accounting standards (IFRS 3). In addition, during the first half of 2013, the Company identified and corrected certain errors in the financial statements of TAM, which are not material for LATAM.
Retrospective revision of theour audited consolidated financial statements for fiscal year 2012
As required by IFRS, the consolidated financial statements of LATAM for 2012 have been retrospectively revised to reflect the following:
The abovementioned errors have also been corrected for purposes of the pro forma financial statements for the first half of 2012, prior to the business combination, resulting in US$30 million of less revenue during this period.
U.S. Dollar Presentation and Price-Level Adjustments
General
Foreign currency transactions
(a) Presentation and functional currencies
The items included in the financial statements of LATAM are valued using the currency of the main economic environment in which theeach entity operates (the “functional currency”). The functional currency of LATAM is the U.S. dollar, which is also the currency of presentation of the audited consolidated financial statements of LATAM and its subsidiaries.affiliates.
(b) Transactions and balances
Foreign currency transactions are translated to the functional currency using the exchange rates on the transaction dates. Foreign currency gains and losses resulting from the liquidation of these transactions and from the translation, at the closing exchange rates, of the monetary assets and liabilities denominated in foreign currency, are shown in the consolidated statement of income.
(c) Group entities
The results and financial position of all the LATAM entities (none of which utilizes the currency ofoperated in a hyper-inflationary economy) that have a functional currency other than the currency of presentation are translated to the currency of presentation as follows:
| (i) |
| (ii) | The revenues and expenses of each results account are translated at monthly average rates; and |
| (iii) | All the |
For consolidation purposes, exchange differences arising from the translation of a net investment in foreign entities (or in local entities with a functional currency different to that of the parent), and of loans and other foreign currency instruments designated as hedges for such investments, are recorded within net equity. When the investment is sold, these exchange differences are shown in the consolidated statement of income as part of the loss or gain on the sale.
Adjustments to the goodwill and fair value arising from the acquisition of a foreign entity are treated as assets and liabilities of the foreign entity and are translated at theperiod-end exchange rate.
Effects of Exchange Rate Fluctuations
Our functional currency is the U.S. dollar in terms of the pricing of our products, composition of our balance sheet and effects on our results of operations. Most of our revenues (42%(58% in 2013)2016) are in U.S. dollars or in prices pegged to the U.S. dollar and a substantial portion of our expenses (60%(56% in 2013)2016) is denominated in dollars or pegged to the U.S. dollar, particularly fuel costs, landing and over flightover-flight fees, aircraft rentals, insurance and aircraft components and supplies. Almost all
A substantial majority of our liabilities are denominated in U.S. dollars (75%(70.6% as of December 31, 2013)2016), including bank loans, certain air traffic liabilities, and certain amounts payable to our suppliers. As of December 31, 2013, 48%2016, 61.8% of our assets were denominated in U.S. dollars, principally aircraft, cash and cash equivalents, accounts receivable and other fixed assets. Substantially all of our commitments, including operating lease and purchase commitments for aircraft, are denominated in U.S. dollars.
Although we generally maintainBalance sheet imbalance denominated in currencies other than the functional currency of each specific entity creates a foreign exchange rate exposure that impacts our international passenger fares and cargo prices in U.S. dollars or at prices pegged to the U.S. dollar, we are exposed to foreign exchange losses and gains due to exchange rate fluctuations. We recorded a net foreign exchange profitlosses of US$66.7467.9 million in 20122015 and a net foreign exchange loss ofgains US$482.2121.7 million gain in 2013,2016, which are set forth in our consolidated statement of income under “Exchange rates differences.“Foreign Exchange gains/(losses).” For more information, see Notes 2.3(a)2.3 and 3329 to our audited consolidated financial statements.
Critical Accounting Policies
The Company has used estimates to value and record certain assets, liabilities, revenue, expenditure, and commitments. These estimates principally relate to:
(a) Evaluation of possible losses through impairment of goodwill and intangible assets with an indefinite useful life.
As of December 31, 2016 goodwill amounted to US$2,710.4 million (US$2,280.6 million as of December 31, 2015), while intangible assets with an indefinite useful life comprised airport slots of US$978.8 million (US$817.0 million as of December 31, 2015), loyalty program assets of US$326.3 million (US$272.3 million as of December 31, 2015) and trade marksof US$53.0 million at December 31, 2015.
At least once per year the Company verifies whether goodwill and intangible assets with an indefinite useful life have suffered any losses through impairment. For the purposes of this evaluation, the Company has identified two cash-generating units (CGUs): “Air transport” and “Multiplus loyalty and coalition program.” The book value of goodwill assigned to each CGU as of December 31, 2016, amounted to US$2,176.7 million and US$533.7 million (US$1,835.1 million and US$445.5 million as of December 31, 2015), which included intangible assets with undefined useful life.
Air Transport CGU | Coalition and loyalty Program Multiplus CGU | |||||||||||||||
| As of | As of | As of | As of | |||||||||||||
| December 31, | December 31, | December 31, | December 31, | |||||||||||||
| 2016 | 2015 | 2016 | 2015 | |||||||||||||
| (in US$ million) | ||||||||||||||||
Airport Slots | 978.8 | 817.0 | — | — | ||||||||||||
Trade marks(1) | 53.0 | — | — | |||||||||||||
Loyalty program | — | — | 326.3 | 272.3 | ||||||||||||
| (1) | At December 31, 2016, the Company has changed the estimated useful life of the brands from an indefinite useful life to a five-year period (see Note 15 to our audited consolidated financial statements). |
The recoverable value of these cash-generating units (CGUs) has been determined based on calculations of their value in use. The principal assumptions used by the management include: growth rate, exchange rate, discount rate, fuel prices, and other economic assumptions. The estimation of these assumptions requires significant judgment by management, as these variables feature inherent uncertainty; however, the assumptions used are consistent with Company’s internal planning. Therefore, management evaluates and updates these estimates on an annual basis, in light of conditions that affect these variables. The principal assumptions used, as well as the corresponding sensitivity analyses, are shown in Note 16 to our audited consolidated financial statements.
(b) Useful life, residual value, and impairment of property, plant, and equipment
The depreciation of assets is calculated based on a straight-line model, except for certain technical components depreciated on cycles and hours flown. Useful lives are reviewed on an annual basis according with the Company’s future economic benefits associated with them.
Changes in circumstances such as: technological advances, business model, planned use of assets or capital strategy may render the useful life different to the lifespan estimated. When it is determined that the useful life of property, plant, and equipment must be reduced, as may occur in line with changes in planned usage of assets, the difference between the net book value and estimated recoverable value is depreciated, in accordance with the revised remaining useful life.
Residual values are estimated in accordance with the market value that these assets will have at the end of their useful life. The assets’ residual values and useful lives are reviewed, and adjusted if appropriate, once a year. An asset’s carrying amount is written down immediately to its recoverable amount if the asset’s carrying amount is greater than its estimated recoverable amount (see Note 2.8 to our audited consolidated financial statements).
(c) Recoverability of deferred tax assets
Deferred taxes are calculated in accordance with the liability method, applied over temporary differences that arise between the fiscal base of assets and liabilities, and their book value. Deferred tax assets for tax losses are recognized to the extent that the realization of the related tax benefit through future taxable profits is probable. The Company makes tax and financial projections to evaluate the realization of our deferred tax asset over the course of time. Additionally, these projections are tested to be consistent with those used to measure other long term assets. As of December 31, 2016 the company recognized deferred tax assets amounting to US$384.6 million (US$376.6 million at December 31, 2015), and had ceased to recognize deferred tax assets for tax losses amounting to US$115.8 million (US$15.5 million at December 31, 2015) (see Note 18 to our audited consolidated financial statements).
(d) Air tickets sold that are not actually used.
The Company treats advance sales of tickets as deferred revenue. Revenue from ticket sales is recognized in the income statement when the service is provided or when tickets expires unused, reducing corresponding deferred revenue. The Company evaluates on a monthly basis the probability that tickets will expire unused, based on the history of ticket utilization. Changes in this probability would have an impact on our revenue in the year in which the change occurs and in future years. As of December 31, 2016, deferred revenue associated with air tickets sold amounted to US$1,535.2 million (US$1,223.9 million as of December 31, 2015). As of December 31, 2016, we estimate that a hypothetical change of one percentage point in passenger behavior regarding to ticket usage, (that is, if during the 6 months after a sale the probability of utilization were 89% rather than 90%), would have a revenue impact of up to US$20.0 million.
(e) Valuation of loyalty points and kilometers issued to loyalty program members, pending usage.
As of December 31, 2016 and 2015, the Company operated the following loyalty programs: LATAM Pass, LATAM Fidelidade, and Multiplus, with the objective of enhancing customer loyalty by offering points or kilometers (see Note 22 to our audited consolidated financial statements).
When kilometers and points are redeemed for products and services other than the services provided by the Company, revenue is recognized immediately; when they are redeemed for air tickets issued by LATAM Airlines Group S.A. and affiliates, revenue is deferred until the transport service is provided or the corresponding tickets expire.
Deferred revenue from loyalty programs at the closing date corresponds to the valuation of unutilized points and kilometers issued to loyalty program members, adjusted for redemption probability.
According toIFRIC-13, the value of kilometers and points that the Company estimates are not likely to be redeemed (“breakage”), is recognized proportionally during the period in which the remaining kilometers or points are expected to be redeemed. The Company uses statistical models to estimate the breakage, based on historical redemption patterns. Changes in breakage would have a significant impact on our revenue in the year in which the change occurs and in future years.
As of December 31, 2016, deferred revenue associated with the LATAM Pass loyalty program amounted to US$896.2 million (US$973.3 million at December 31, 2015). As of December 31, 2016 a hypothetical change of 1% in the probability of usage would result in an impact of approximately US$30.6 million (US$30.0 million as of December 31, 2015). Deferred revenue associated with the LATAM Fidelidade and Multiplus loyalty programs amounted to US$392.1 million (US$452.3 million as of December 31, 2015). As of December 31, 2016 a hypothetical change of 2% in the probability of usage in these programs would result in an impact of approximately US$14.6 million (US$11.7 million as of December 31, 2015).
The fair value of kilometers is determined by the Company based on its best estimate of the price at which they have been sold in the past. As of December 31, 2016 a hypothetical change of 1% in the fair value of unused kilometers would result in an impact of approximately US$8.4 million (US$8.8 million as of December 31, 2015).
(f) Required provisions and their valuation as necessary
Known contingencies are recognized when the Company has an effective legal or constructive obligation as a result of past events, it is probable that an outflow of resources will be required to settle the obligation, and the amount has been reliably estimated. The Company applies professional judgment, experience, and knowledge to use available information to determine these values, in light of the specific characteristics of known risks. This process facilitates the early assessment and valuation of potential risks in individual cases or in the development of contingencies.
(g) Investment in subsidiary (TAM)
Management has applied its judgment in determining that LATAM Airlines Group S.A. controls TAM S.A. and its affiliates, for accounting purposes, and has therefore consolidated the financial statements of TAM S.A. and its affiliates.
The grounds for this decision are that LATAM issued ordinary shares in exchange for the majority of circulating ordinary and preferential shares in TAM, entitling LATAM to substantially all economic benefits generated by TAM, and thus exposing it to substantially all risks relating to the operations of TAM. This exchange aligns the economic interests of LATAM and all of its shareholders, including the controlling shareholders of TAM, thus insuring that the shareholders and directors of TAM shall have no incentive to exercise their rights in a manner that would be beneficial to TAM but detrimental to LATAM. Furthermore, all significant actions necessary for the operation of the airlines require affirmative votes by the controlling shareholders of both LATAM and TAM.
Since the integration of LAN and TAM, the most critical airline operations in Brazil have been managed by the CEO of TAM while global activities have been managed by the CEO of LATAM, who is in charge of the operation of the LATAM Group as a whole and reports to the LATAM Board. The CEO of TAM functionally reports to the CEO of LATAM.
The CEO of LATAM also evaluates the performance of LATAM Group executives including the CEO of TAM and, together with the LATAM Board, determines compensation. Although Brazilian law currently imposes restrictions on the percentages of voting rights that may be held by foreign investors, LATAM believes that the economic basis of these agreements meets the requirements of accounting standards in force, and that the consolidation of the operations of LAN and LATAM is appropriate.
These estimates were made based on the best information available relating to the matters analyzed. In any case, it is possible that events that may take place in the future could lead to their modification in future reporting periods, which would be made in a prospective manner.
Recently Issued Accounting Pronouncements
(a) Accounting pronouncements with implementation effective from January 1, 2016: | Date of issue | Mandatory | ||||
| (i) Standards and amendments | ||||||
| Amendment to IFRS 11: Joint arrangements. | Accounting for acquisitions of interests in joint operations | May 2014 | January 1, 2016 | |||
| Amendment to IAS 16: Property, plant and equipment, and IAS 38: Intangible assets. | Clarification of acceptable methods of depreciation and amortization | May 2014 | January 1, 2016 | |||
| Amendment to IAS 27: Separate financial statements. | Equity Method in Separate Financial Statements | August 2014 | January 1, 2016 | |||
| Amendment IAS 1: Presentation of Financial Statements. | Disclosure initiative | December 2014 | January 1, 2016 | |||
| Amendment to IFRS 10: Consolidated financial statements, IFRS 12: Disclosure of interests in other entities and IAS 28: Investments in associates and joint ventures. | Investment Entities: Applying the consolidation exception | December 2014 | January 1, 2016 | |||
| Improvements to International Financial Reporting Standards (2012-2014 cycle): | September 2014 | January 1, 2016 | ||||
| IFRS 5Non-current assets held for sale and discontinued operations. | Changes in methods of disposal. | |||||
| IFRS 7 Financial instruments: Disclosures. | Servicing contracts. Applicability of the amendments to IFRS 7 to condensed interim financial statements | |||||
| IAS 19 Employee benefits. | Discount rate: regional market issue. | |||||
| IAS 34 Interim financial reporting. | Disclosure of information ‘elsewhere in the interim financial report’. | |||||
The application of standards, amendments, interpretations and improvements had no material impact on the consolidated financial statements of the Company.
(b) Accounting pronouncements not yet in force for financial years beginning on January 1, 2016 and | Date of issue | Mandatory | ||||
| (i) Standards and amendments | ||||||
| Amendment to IAS 7: Statement of Cash Flows. | Disclosure initiative | January 2016 | January 1, 2017 | |||
| Amendment to IAS 12: Income Taxes. | Recognition of Deferred Tax Assets for Unrealised Losses | January 2016 | January 1, 2017 | |||
| IFRS 9: Financial instruments. | Disclosure initiative | December 2009 | January 1, 2018 | |||
| Amendment to IFRS 9: Financial instruments. | Novation of derivatives and continuation of hedge accounting | November 2013 | January 1, 2018 | |||
| IFRS 15: Revenue from contracts with customers(1). | Implementation | May 2014 | January 1, 2018 | |||
| Amendment to IFRS 15: Revenue from contracts with customers. | Clarifications | April 2016 | January 1, 2018 | |||
| Amendment to IFRS 2: Share-based payments | classification and measurement of share☐based payment transactions | June 2016 | January 1, 2018 | |||
| Amendment to IFRS 4: Insurance contracts. | Pendiente Applying IFRS 9 Financial Instruments with IFRS 4 Insurance Contracts | September 2016 | January 1, 2018 | |||
| Amendment to IFRS 40: Investment property | Transfers of investment property | December 2016 | January 1, 2018 | |||
| IFRS 16: Leases(2). | Disclosure initiative | January 2016 | January 1, 2019 | |||
| Amendment to IFRS 10: Consolidated financial statements and IAS 28 Investments in associates and joint ventures. | Sale or contribution of assets between an Investor and its associate or joint venture | September 2014 | To be determined | |||
(b) Accounting pronouncements not yet in force for financial years beginning on January 1, 2016 and | Date of issue | Mandatory | ||||
| (ii) Improvements | ||||||
| Improvements to International Financial Reporting Standards (2012-2014 cycle): | December 2016 | |||||
| IFRS 1: First-time adoption of international financial reporting standards. | Deletion of short-term exemptions for first-time adopters | January 1, 2018 | ||||
| IFRS 12 Disclosure of interests in other entities. | Clarification of the scope of the Standard | January 1, 2017 | ||||
| IAS 28 investments in associates and joint ventures. | Measuring an associate or joint venture at fair value | January 1, 2018 | ||||
| (iii) Interpretations | ||||||
| IFRIC 22: Foreign currency transactions and advance consideration | Disclosure initiative | December 2016 | January 1, 2018 | |||
| (1) | The Company’s management believes that the adoption of the standards, amendments and interpretations described above but not yet effective would not have had a significant impact on the Company’s consolidated financial statements in the year of their first application, except for IFRS 15 and IFRS 16. |
IFRS 15 – “Revenue from Contracts with Customers” supersedes the standard for revenue recognition currently used by the Company, i.e. IAS 18 Revenue and IFRIC 13 Customer Loyalty Programmes. The core principle of IFRS 15 is that an entity recognizes revenue to depict the transfer of promised goods or services to customers in an amount that reflects the consideration to which the entity expects to be entitled in exchange for those goods or services. IFRS 15 supersedes the following standards and interpretations: IAS 11 Construction Contracts, IAS 18 Revenue, IFRIC 13 Customer Loyalty Programmes, IFRIC 15 Agreements for the Construction of Real Estate, IFRIC 18 Transfers of Assets from Customers; andSIC-31 Revenue—Barter Transactions Involving Advertising Services.
We are currently evaluating how the adoption of the revenue recognition standard will impact our Consolidated Financial Statements. Interpretations areon-going and could have a significant impact on our implementation. We currently believe the adoption will not have a significant impact on passenger and cargo revenue recognition. However, the impact on revenue and liability for our frequent flyer program is still being analyzed.
| (2) | IFRS 16 – “Leases” adds important changes in the accounting for lessees by introducing a similar treatment to financial leases for all operating leases with a term of more than 12 months. This means, in general terms, that an asset should be recognized for the right to use the underlying leased assets and a liability representing its present value of payments associated with the agreement. Monthly lease payments will be replaced by asset depreciation and a financial cost on the income statement. |
We are currently evaluating how the adoption of the leases recognition standard will impact our Consolidated Financial Statements. Interpretations areon-going and could have a material impact on our implementation. Currently, we expect that the adoption of the new lease standard will have a material impact on our consolidated balance sheet due to the recognition ofright-of-use assets and lease liabilities principally for certain leases currently accounted for as operating leases.
LATAM Airlines Group S.A. and affiliates are still assessing these standards to determine the effect on their Financial Statements, covenants and other financial indicators.
IFRS/Non-IFRS Reconciliation
We use “Cost perASK-equivalent” and “Cost perASK-equivalent excluding fuel price variations” in analyzing operating expenses on a per unit basis. “ASKs” (available seat kilometers) measures the number of seats of capacity available for the transportation of passengers multiplied by the kilometers flown. “ASK-equivalent”“ASK-equivalent” includes capacity for both passenger and cargo equivalent tons multiplied by the kilometers flown. The figure is obtained by adding passenger ASKs and the quotient of cargo ATKs (available ton kilometers) divided by 0.095. To obtain our unit costs, which are used by our management in the analysis of our results, we divide our “total costs” by our totalASK-equivalents. “Total costs” are calculated by starting with operating expenses as defined under IFRS and making certain adjustments for interest costs and other revenues. The cost component is further adjusted to obtain “costs perASK-equivalents excluding fuel price variations,” in order to remove the impact of changes in fuel prices for the year. “Cost perASK-equivalent” and “Cost perASK-equivalent excluding fuel price variations” do not have a standardized meaning, and as such may not be comparable to similarly titled measures provided by other companies. These metrics should not be considered in isolation or as a substitute for operating expenses or as indicators of performance or cash flows or as a measure of liquidity.
The table below reconciles our operating expenses (as defined by IFRS) for 2013, 20122016, 2015 and 20112014 to costs used in the calculation of “Cost perASK-equivalent” and “Cost perASK-equivalent excluding fuel price variations” for such periods. Figures for 2012 (pro forma) have been presented on a pro forma basis to include the operating data of TAM for all of 2012. Figures for
| 2016 | 2015 | 2014 | ||||||||||
Cost perASK-equivalent | ||||||||||||
Operating expenses (US$ thousands) | 8,959,185 | 9,611,907 | 11,957,780 | |||||||||
+ Interest expense (US$ thousands) | 416,336 | 413,357 | 430,034 | |||||||||
– Interest income (US$ thousands) | 74,949 | 75,080 | 90,500 | |||||||||
Divided by system’sASK-equivalents (million) | 205,537.5 | 208,722.5 | 206,197.9 | |||||||||
= Cost per ASK equivalent (US$ cents) | 4.52 | 4.77 | 5.96 | |||||||||
Cost perASK-equivalent excluding fuel price variations | ||||||||||||
Operating expenses (US$ thousands) | 8.959,185 | 9,611,907 | 11,957,780 | |||||||||
+ Interest expense (US$ thousands) | 416,336 | 413,357 | 430,034 | |||||||||
– Interest income (US$ thousands) | 74,949 | 75,080 | 90,500 | |||||||||
– Aircraft fuel (US$ thousands) | 2,056,643 | 2,651,067 | 4,167,030 | |||||||||
Divided by system’s ASK equivalents (millions) | 205,537.5 | 208,722.5 | 206,197.9 | |||||||||
= Cost perASK-equivalent excluding fuel price variations (US$ cents) | 3.52 | 3.50 | 3.94 | |||||||||
Other Operating Measures
LATAM 2012 (actual) correspond to LATAM’s consolidated audited financial statements prepared in accordance with IFRS for the year ended December 31, 2012, including TAM’s consolidated costs from June 23, 2012 and TAM’s third and fourth quarter operating statistics. Figures for LAN 2011 (actual) represent LAN’s historical operating expenses and statistics and do not include any costs or statistics from TAM.
2013 LATAM 2012 LATAM (pro forma) 2012 LATAM (actual) 2011 LAN Cost per ASK-equivalent Operating expenses (US$ thousands) + Interest expense (US$ thousands) – Interest income (US$ thousands) – Other operating income (US$ thousands) ASK-equivalent operating expenses Divided by system’s ASK-equivalents (thousands) = Cost per ASK equivalent (US$ cents) Cost per ASK-equivalent excluding fuel price variations ASK-equivalent operating expenses (thousands) – Actual fuel expenses (US$ thousands) + (Gallons consumed) times (previous year’s fuel price) ASK-equivalent operating expenses excluding fuel price variations Divided by system’s ASK-equivalents (thousands) = Cost per ASK-equivalent excluding fuel price variations (US$ cents)
(actual) 12,622,197 13,130,717 9,638,479 5,178,554 462,524 444,201 294,598 139,077 72,828 117,172 77,489 14,453 341,565 265,365 220,156 132,804 12,670,328 13,192,381 9,635,432 5,170,374 212,236,832 212,669,546 161,209.26 102,798.87 5.97 6.20 5.98 5.03 12,670,328 13,192,381 9,635,432 5,170,374 4,414,249 4,780,289 3,434,569 1,750,052 4,675,532 4,359,448 2,952,257 1,303,621 12,931,611 12,771,540 9,153,120 4,723,943 212,236,832 212, 669,546 161,209.26 102,798.87 6.09 6.01 5.68 4.60
In addition, LATAM continues to useuses revenues per ASK or ATK, as applicable, in analyzing revenues on a per unit basis, which is consistent with how LAN analyzed its revenues before the merger.basis. To obtain unit revenues, we divide our passenger revenues by our total ASKs and our cargo revenues by our total ATKs. We use our revenues as defined under IFRS for purposes of the calculation of this metric. Revenues per ASK or ATK, as the case may be, do not have a standardized meaning, and as such may not be comparable to similarly titled measures provided by other companies. ItThis metric is not an IFRS based measure of performance or liquidity. This metricIt should not be considered in isolation or as a substitute for revenues or as indicators of performance or cash flows as a measure of liquidity.
The table below shows the calculation of our revenues per ASK or ATK, as applicable, in each of the periods indicated. Figures for 2012 (pro forma) have been presented on a pro forma basis to include the revenues of TAM for 2012. Figures for LATAM 2012 (actual) correspond to LATAM’s consolidated audited financial statements prepared in accordance with IFRS for the year ended December 31, 2012, including TAM’s consolidated revenues from June 23, 2012. Figures for LAN 2011 (actual) represent LAN’s historical revenues and do not include any revenues from TAM.
| 2013 LATAM | 2012 LATAM (pro forma) | 2012 LATAM (actual) | 2011 LAN (actual) | 2016 | 2015 | 2014 | ||||||||||||||||||||||
Passenger Revenues (US$ million) | 11,061.56 | 11,016.98 | 7,966.85 | 4,008.91 | 7,877.72 | 8,410.61 | 10,380.12 | |||||||||||||||||||||
ASK (million) | 131,690.60 | 132,186.04 | 93,318.15 | 48,153.58 | 134,967.69 | 134,167.14 | 130,200.94 | |||||||||||||||||||||
Passenger Revenues/ASK (US$ cents) | 8.40 | 8.33 | 8.54 | 8.33 3 | 5.84 | 6.27 | 7.97 | |||||||||||||||||||||
Cargo Revenues (US$ million) | 1,862.98 | 1,939.75 | 1,743.53 | 1,576.53 | 1,110.63 | 1,329.43 | 1,713.38 | |||||||||||||||||||||
ATK (million) | 7,651.88 | 7,645.95 | 6,449.50 | 5,192.74 | 6,704.13 | 7,082.76 | 7,219.71 | |||||||||||||||||||||
Cargo Revenues/ATK (US$ cents) | 24.35 | 25.37 | 27.03 | 30.36 | 16.57 | 18.77 | 23.73 | |||||||||||||||||||||
Seasonality
Our operating revenues are substantially dependent on overall passenger and cargo traffic volume, which is subject to seasonal and other changes in traffic patterns. Our passenger revenues are generally higher in the first and fourth quarters of each year, during the southern hemisphere’s spring and summer. In the Brazilian passenger air transportation market, there is always agenerally higher demand for air transportation services in the second half of the year, leavingmaking the second quarter as the weakest one for the Company. However, the seasonality is partially mitigated by the fact of LATAMLATAM’s having higher than markethigher-than-market average concentration of business travel (which is less sensitive to seasonality). Additionally, the expansion of the Company ininto other countries with different seasonal patterns has also moderated the overall seasonality of the passenger business.
Critical Accounting Policies
The preparation of our consolidated financial statements in accordance with IFRS requires our management to adopt accounting policies and make estimates and judgments to develop amounts reported in our consolidated financial statements and related notes. We strive to maintain a process to review the application of our accounting policies and to evaluate the appropriateness of the estimates that are required to prepare our consolidated financial statements. We believe that the consistent application of these policies enables us and our subsidiaries to provide readers of the financial statements with more useful and reliable information about our operating results and financial condition.
Critical accounting policies and estimates are those that are reflective of significant judgments and uncertainties, and potentially result in materially different outcomes under different assumptions and conditions. For a discussion on these and other accounting policies, see Note 2 to our consolidated financial statements. The following are the accounting policies that we believe are the most important to the portrayal of our financial condition and results of operations and require our most difficult, subjective or complex judgments.
Accounting estimates and judgments
The Company has used estimates to value and book some of the assets, liabilities, revenues, expenses and commitments; these basically refer to:
These estimates are made on the basis of the best information available on the matters analyzed.
In any case, it is possible that events will require them to be modified in the future, in which case the effects would be accounted for prospectively.
Additionally, the management has applied judgment in determining that LATAM Airlines Group S.A. has control over TAM S.A. and Subsidiaries for accounting purposes and therefore has consolidated their financial statements. The above on the basis that LATAM issued their ordinary shares in exchange for all of the outstanding common and preferred shares of TAM (except those shareholders of TAM who did not accept exchange and which were subject of the squeeze-out described in Note 18.2.a), entitling LATAM to substantially all of the economic benefits that will be generated by the LATAM Group and also, consequently, exposing it to substantially all the risks incidental to the operations of TAM. This exchange aligns the economic interests of LATAM and all of its shareholders, including the TAM controlling shareholders, ensuring that the shareholders and directors of TAM will have no incentive to exercise their rights in a manner that is beneficial to TAM but detrimental to LATAM. Further, all significant actions required for the operation of the airlines require the affirmative vote of both LATAM and the TAM controlling shareholders.
In addition, LATAM is in the process of integrating the operations with TAM, and both entities will be operated as a single company. Within this, most critical airline activities will be managed in Brazil under the TAM CEO and globally by the LATAM CEO, who will be in charge of the overall operation of the LATAM Group and who will report to the LATAM board. Further, the LATAM CEO will evaluate the performance of the LATAM Group executives and, together with the LATAM board, determine compensation. Although there are restrictions on voting interests that currently may be held by foreign investors under Brazilian law, LATAM believes that the economic substance of these arrangements satisfies the requirements established by the applicable accounting standards and that consolidation by LATAM of TAM’s operations is appropriate.
Revenue Recognition
Revenues include the fair value of the proceeds received or to be received on sales of goods and rendering services in the ordinary course of the Company’s business. Revenues are shown net of refunds, rebates and discounts.
(a) Rendering of services
We recognize passenger and cargo revenues either when the transportation service is provided or when we determine that the tickets will not be used or refunded, which, in the case of passenger revenues, reduces the air traffic liability. We estimate revenue breakage based on historical breakage experience that takes into account the aging of tickets that will not be used or refunded. Commissions payable related to such unearned earnings are shown net of the air traffic liability. Other revenues, including aircraft leases, courier, logistic and ground services, duty free sales, and storage and customs brokering, are recognized when services are provided.
The amount of passenger ticket sales not yet recognized as revenue is reflected as an air traffic liability. Air traffic liability includes estimates of the amount of future refunds and exchanges, net of forfeitures for all unused tickets once the flight date has passed. We perform periodic evaluations of this estimated liability based on actual results. Any adjustments, which can be significant, are included in the results of operations for the periods in which the evaluations are completed. These adjustments relate primarily to the differences between our estimation of certain revenue transactions and the related sales price, as well as refunds, exchanges and other items for which final settlement occurs in periods subsequent to the sale of the related tickets at amounts other than the original sales price.
Actual events and circumstances may differ from historical fare sale activity and customer travel patterns and can result in refunds, exchanges or forfeited tickets differing significantly from estimates. We evaluate our estimates periodically. If actual refunds, exchanges or forfeitures fall outside of our estimated ranges, we review our estimates and assumptions and adjust air traffic liability and passenger revenues as necessary. As with any estimates, actual results may vary from estimated amounts.
The Company has a frequent flyer program for LATAM passengers called LANPASS and a frequent flyer program for TAM passengers called TAM Fidelidade. Customers can also earn points through Multiplus, a subsidiary of TAM, which permits the accrual of points for many products and services (not just airline flights) and had more than 200 partner establishments, including the TAM Fidelidade program, as of December 31, 2013.
Both frequent flyer programs’ objective is customer loyalty through the delivery of LANPASS kilometers or Multiplus points every time that members of the program fly with the Company or its alliance partners, use the services of entities registered with the program or make purchases with an associated credit card. The kilometers/points earned can be exchanged for flights tickets or other services of associated entities.
The consolidated financial statements include LANPASS liabilities for this concept (deferred income), according to the estimate of the valuation established for the kilometers accumulated pending use at that date, in accordance with IFRIC 13: “Customer loyalty programs.” Points earned from TAM Fidelidade members are bought from Multiplus and seats redeemed are sold to Multiplus. Multiplus manages the points liabilities. Revenue from both programs are recognized once the purchased tickets are flown.
LANPASS Kilometers expire if they are not utilized over a period of three years. This period is renewable if the passenger takes a flight or meets specific requirements regarding the accumulation of kilometers through one of the partners of the program. Multiplus Points expire if they are not utilized over a period of two years, this period is not renewable.
Property, Plant and Equipment
LATAM’s land is recognized at cost less any accumulated impairment loss. The rest of the property, plant and equipment are shown, initially and subsequently, at their historic cost less the corresponding depreciation and any impairment loss.
The amount of advance payments to aircraft manufacturers are capitalized by the Company under “Construction in progress” until receipt of aircraft.
Subsequent costs (replacement of components, improvements and extensions) are included in the value of the initial asset or shown as a separate asset only when it is probable that the future economic benefits associated with the elements of Property, plant and equipment are going to flow to the Company and the cost of the element can be determined reliably. The value of the component replaced is written-off in the books at the time of replacement. The rest of the repairs and maintenance are charged to the result of the year in which they are incurred.
Depreciation of property, plant and equipment is calculated using the straight-line method over their estimated useful lives; except in the case of certain technical components, which are depreciated on the basis of cycles and hours flown.
The residual value and useful life of assets is revised, and adjusted if necessary, once a year.
When the carrying amount of an asset is higher than its estimated recoverable amount, its value is reduced immediately to its recoverable amount. For more information, see Note 2.8 to our audited consolidated financial statements.
Losses and gains on the sale of property, plant and equipment are calculated by comparing the proceeds obtained with the book value and are included in the consolidated statement of income.
Maintenance
The costs incurred for scheduled heavy maintenance of the aircraft’s fuselage and engines are capitalized and depreciated until the next maintenance. The depreciation rate is determined on technical grounds, according to the use of the aircraft expressed in terms of cycles and flight hours.
In case of on balance sheet aircraft, these maintenance costs are capitalized as Property, plant and equipment, while in the case of off balance sheet aircraft maintenance costs are periodically provided for and recognized through profit and loss as “Cost of sales”.
The unscheduled maintenance of aircraft and engines, as well as minor maintenance, are charged to results as incurred.
Derivative Financial Instruments and Hedging Activities
Derivatives are booked initially at fair value on the date the derivative contracts are signed and later they continue to be valued at their fair value. The method for booking the resultant loss or gain depends on whether the derivative has been designated as a hedging instrument and, if so, the nature of the item hedged.
The Company designates certain derivatives as:
The Company documents, at the inception of each transaction, the relationship between the hedging instrument and the hedged item, as well as its objectives for managing risk and the strategy for carrying out various hedging transactions. The Company also documents its assessment, both at the beginning and on an ongoing basis, as to whether the derivatives used in the hedging transactions are highly effective in offsetting the changes in the fair value or cash flows of the items being hedged.
The total fair value of the hedging derivatives is booked as an Other non-current financial asset or liability if the remaining maturity of the hedging instrument is over 12 months, and as an Other current financial asset or liability if the remaining term of the hedging instrument is less than 12 months. Derivatives not booked as hedges are classified as other financial assets or liabilities, current in the case that their remaining maturity is less than 12 months and non-current in the case that it is more than 12 months.
Changes in the fair value of designated derivatives that qualify as fair value hedges are shown in the consolidated statement of income, together with any change in the fair value of the asset or liability hedged that is attributable to the risk being hedged.
The effective portion of changes in the fair value of designated derivatives that qualify as cash flow hedges is shown in net equity. The loss or gain relating to the ineffective portion is recognized immediately in the consolidated statement of income under “Other gains (losses).” Amounts deferred in equity are reclassified to profit and loss when the related hedged item impacts profit and loss.
In the case of variable interest-rate hedges, this means that the amounts recognized in equity are reclassified to results within financial cost at the same time the associated debts accrue interest.
For fuel price hedges, the amounts shown in equity are reclassified to results as Cost of sales to the extent that the fuel subject to the hedge is used.
For foreign currency hedges, the amounts shown in equity are reclassified to results to the extent that the deferred revenue resulting from the use of points, are recognized as income.
When hedging instruments mature or are sold or when they do not meet the requirements to be accounted for as hedges, any gain or loss accumulated in net equity until that moment remains in equity and is reclassified to the consolidated statement of income when the hedged transaction is finally recognized. When it is expected that the hedged transaction is no longer going to occur, the gain or loss accumulated in net equity is taken immediately to the consolidated statement of income as “Other gains (losses).”
(c) Derivatives not booked as a hedge
The changes in fair value of any derivative instrument that is not booked as a hedge are shown immediately in the consolidated statement of income, in “Other gains (losses).”
Deferred taxes
Deferred taxes are calculated on the temporary differences arising between the tax bases of assets and liabilities and their book values. However, if the temporary differences arise from the initial recognition of a liability or an asset in a transaction different from a business combination that at the time of the transaction does not affect the accounting result or the tax gain or loss, they are not booked. The deferred tax is determined using the tax rates (and laws), that have been enacted or substantially enacted at the end of the reporting period, and are expected to apply when the related deferred tax asset is realized or the deferred tax liability is discharged.
Deferred tax assets are recognized when it is probable that there will be sufficient future tax earnings with which to compensate the temporary differences.
The Company does not record deferred tax on temporary differences arising on investments in subsidiaries, provided that the opportunity to reverse the temporary differences is controlled by the Company and it is probable that the temporary differences will not reverse in the foreseeable future. Deferred tax on temporary differences arising on investments in associates is immaterial.
Recently Issued Accounting Pronouncements
The Company’s management believes that the early adoption of the standards, amendments and interpretations described above but not yet effective would not have had a significant impact on the Company’s consolidated financial statements in the year of their first application. The Company only has early adopted the amendment to IAS 36.
B. Liquidity and Capital Resources
LATAMLATAM’s cash and cash equivalents totaled US$1,984.9949.3 million as of December 31, 2013,2016, US$650.3753.5 million as of December 31, 20122015 and US$374.4989.4 million as of December 31, 2011.2014. Additionally, the Company had short term marketable securities totaling US$576.7537.0 million as of December 31, 2013,2016, US$470.1606.4 million as of December 31, 20122015 and US$98.1544.4 million as of December 31, 2011.2014. In the aggregate, LATAM’s cash and cash equivalents and marketable securities totaled US$2,561.61,486.3 million as of December 31, 2013,2016, US$1,120.31,361.1 million as of December 31, 20122015 and US$472.51,533.8 million as of December 31, 2011.2014.
The US$1,441.3126.4 million increase in our cash and cash equivalents and marketable securities from 20122015 to 20132016 is the result of a reduction in the cash flow from operation that was mainly dueoffest bya US$560 million inflow frompre-delivery payments during 2016 and the subscription by Qatar Airways of a capital increase of US$608.5 million into LATAM.
The US$173.9 million decrease in our cash and cash equivalents and marketable securities from 2014 to LATAM’s Capital Increase2015 is the result of positive cash flows from operations of US$784.01,715.5 million used to pay financial obligations and investment commitments, and to initiatives including LATAM’s liability management of its TAM notes together with the financing of its arriving fleet through the issuance of Enhanced Equipment Trust Certificates (“EETC”). In June 2015, LATAM executed a liability management transaction in 2013 representing a 83.4%which the Company redeemed US$300.0 million senior unsecured notes issued by TAM’s subsidiary, Tam Capital 2 Inc. and issued LATAM’s inaugural US$500.0 million senior unsecured notes. Additionally in June 2015, LATAM issued Enhanced EquipmentTrust Certificates (“EETC”) for an aggregate face amount of approximately US$1,020.8 million to finance 17 new aircraft deliveries. LATAM recognized the EETCs as debt upon delivery of each Aircraft. At December 31, 2015 the escrow of proceeds from the issuance of the total Capital Increase completed on January 10, 2014 (See “Item 4. Information on the Company—B. Business Overview—Business Strategy—Improve our Capital Structure.”)EETC amounted US$345.1 corresponding to five aircraft received during 2016 and the Securitization of airline ticket credit card voucher receivables for US$450 million. In January 2014, LATAMone to be received an additional US$ 156.5 million upon completion of the Capital Increase. Changes in our net cash generated from operating, investing and financing activities are described below.2016.
Cash position and liquidity
The following table provides a summary of our cash flows from operating activities, investing activities and financing activities for the years ended December 31, 2013, 20122016, 2015 and 20112014 and our total cash position as of December 31, 2013, 20122016, 2015 and 2011.2014.
| 2013 | 2012 | 2011 | 2016 | 2015 | 2014 | |||||||||||||||||||
| (in US$ millions) | (in US$ millions) | |||||||||||||||||||||||
Net cash generated from operating activities | 1,408,7 | 1,203.8 | 767.7 | |||||||||||||||||||||
Net cash used in investing activities | (1,278.8 | ) | (1,926.4 | ) | (1,241.1 | ) | ||||||||||||||||||
Net cash generated from financing activities | 1,205.8 | 1,005.2 | 216.9 | |||||||||||||||||||||
Net cash flows from operating activities | 992.1 | 1,715.5 | 1,331.4 | |||||||||||||||||||||
Net cash flow from (used in) investing activities | (443.0 | ) | (1,739.1 | ) | (899.1 | ) | ||||||||||||||||||
Net cash flows from (used in) financing activities | (396.3 | ) | (128.4 | ) | (1,320.2 | ) | ||||||||||||||||||
Effects of variation in the exchange rate on cash and cash equivalents | 1.0 | (6.7 | ) | (0.1 | ) | 43.0 | (83.9 | ) | (107.6 | ) | ||||||||||||||
Cash and cash equivalents at the beginning of the year | 650.3 | 374.4 | 631.1 | 753.5 | 989.4 | 1,984.9 | ||||||||||||||||||
Cash and cash equivalents at the end of the year | 1,984.9 | 650.3 | 374.4 | 949.3 | 753.5 | 989.4 | ||||||||||||||||||
In addition to the cash and marketable securities LATAM has access to short term credit lines. As of December 31, 2013,2016, LATAM had working capital uncommitted credit facilities for a total amount of US$ 1.9 billion,1,193.0 million, of which $1,091US$830.0 million was drawn as of December 31, 2013,2016, and committed credit lines within the form of a total availablerevolving credit facility (“RCF”) for an amount of US$185325.0 million, of which $0 was drawn asdrawn. The Company’s plan is to maintain the RCF undrawn, in line with maintaining adequate levels of December 31, 2013.liquidity considering the current volatile market conditions. The RCF is secured by spare parts, engines, and aircraft.
Net cash generatedflows from operating activities
Cash from operations is derived primarily from providing air passenger and cargo transportation to customers. Operating cash outflows are primarily related to the recurring expenses of airline operations, including fuel consumption. Net cash inflows from operating activities in 2013 increase $204.92016 decreased US$723.3 million, or 17.0%42.2%, from US$1,203.81,715.5 million, in 2012, primarilymainly due to an improvementchanges in working capital.
The main impacts on working capital were the reduction in prepayments of credit card receivables in Brazil in the operational marginamount of US$255.4 and the turnaroundUS$ 108.0 million related to thenon-payment in 2015 of the performance bonuses of 2014. Other impacts include the appreciation of the Brazilian domestic market, mainlyReal contingencies, and contingencies reflected the payment of a guarantee to continue certain legal proceedings at the tax courts in a stronger fourth quarter operational result. Brazil.
Net cash generatedinflows from LATAM’s operating activities in 20122015 increased US$436.1384.1 million, or 28.8%, from US$767.71,331.4 million, mainly driven by a significant reduction in 2011 to US$1,203.8 million in 2012, mainlyoperating costs due to lower fuel prices, as well as by the increase in operations following the combination of LAN and TAM on June 22, 2012. In addition,Company’s ongoing cost savings initiatives. Net cash flows from operations in 2011 were reducedwas negatively affected by fuel hedging, hedging margin guarantees and other guarantees by US$84.0 184.6 million as a result(for more information see to Note 6 – Cash and Cash Equivalents of fine payments.our audited consolidated financial statements).
Net cash flow used in investing activities
Net cash used in investing activities in 20132016 decreased US$647.61,296.1 million from US$1,926.41,739.1 million in 20122015 to US$1,278.8443.0 million in 2013, primarily2016, due to LATAM’s capital increase, the decreasea reduction in capital expenditurepurchases of property, plant and the returnequipment. This reduction resulted mainly from a US$559.5 million inflow from pre delivery payments during 2016, as opposed to an outflow of PDP payments relatingUS$128.4 million during 2015. In addition, during 2016, there was a net inflow of US$263.0 million from sale and purchase of debt instruments of other entities, in constrast to the aircraft deliveries. Aircraft purchases in 2013 included 20 narrow body aircraft and 4 wide body aircraft for a totalan outflow of US$1,219 million.184.7 million during 2015.
Net cash used in investing activities in 20122015 increased US$685.3840.0 million from US$1,241.1899.1 million in 20112014 to US$1,926.41,739.1 million in 2012,2015, due primarily due to aone-time impact related to the sale and leaseback of four B777 aircraft purchases which were partially offset by the inclusionrecognized during 2014 as an asset sale of US$264.0510.5 million. Capital expenditures for aircraft increased US$127.0 million of cash on the balance sheet of TAM. Aircraft purchases in 2012 included 142015 compared to 2014, including costs to acquire eight narrow body aircraft and 18four wide body aircraft, for a total of US$2,535 million.compared to nine narrow body aircraft and three wide body aircraft in 2014.
Net cash generated fromflows used in financing activities
NetIn 2016, net cash used in financing activities totaled US$396.3 million, an increase of US$267.9 million from the US$128.4 million in cash generated fromby financing activities increasedin 2015. The variation resulted primarily from a significant increase in loan repayments from US$1,263.8 million to US$2,121.1 million, which was compensated by the capital increase of US$200.6608.5 million subscribed and paid during 2016.
In 2015, net cash used in financing activities totaled US$128.4 million, a decrease of US$1,191.8 million from the US$1,005.21,320.2 million to US$1,205.8million in 2013, primarily due to increase long term debt related to new aircraft purchases, but partially offset bycash used in financing activities in 2014. This reduction reflects the voluntary prepaymentconclusion of the BRL 400 million local Brazilian bonds.
Net cash generated from financing activities increasedliability restructuring and reduction plan executed during the same period in 2014, whereby the Company reduced its financial obligations by US$788.3 million from US$216.9 million to US$1,005.2 million in 2012, primarily due to increase long term debt related to new aircraft purchases. Of these 2012 aircraft purchases, approximately 85% of the net aircraft prices were financed.US$ 1,049.0 million.
Sources of financing
Long term
We typically finance our fleet with long-term loans covering between 80% and 100% of the net purchase price. We also finance our aircraft under sale and leaseback arrangements in order to add flexibility to our fleet. For more information regarding to the fleet financing, please refer to certain information below and to “—F. Long Term Indebtedness—Tabular Disclosure of Contractual Obligations.”
From time to time in the past, we have considered, and may consider in the future, other forms of financing including securitization of ticket receivables or the securitization of fleet and engines or the issuance of additional debt or equity securities.
During 2013, LATAM completed two important debt structuring transactions. On November 7, 2013, LATAM issued a 7-year securitized bond, securitizing the future flow of receivables from certain foreign institutions operating credit card systems in the United States and Canada in the amount of US$450 million, at an interest rate of 6.0% per annum. Later, on December 19th, LATAM completed the refinancing of five B767 aircrafts, including three passengers and two freighters B767, for a total amount of US$95.3 million.
Short term
We have generally been able to arrange for short-term loans with local Chilean and international banks when we have needed to finance working capital expenditures or increase our liquidity. As of December 31, 2013,2016, we maintained US$629 1,518 million in short-term credit lines with both local and foreign banks, including US$185325 million of committed credit lines.lines of which $0 was drawn as of December 31, 2016.
We have diversified our sources of short term financing to include the following: PAE (“Prestamos a Exportadores”), which are foreign currency short term loans granted to exporting parties in Chile mainly to finance working capital; FINIMPS (“Financiamento à Importação”), which are short term loans granted to importers in Brazil; Credit card advancements,advances, a financial alternative where the bank advances to the Company a percentage of the cash inflows related to the credit card sales on installments with a discount factor; and advance purchases by Multiplus of kilometers for TAM flights, in an amount at any time up to a maximum of R$500 million.installments.
Capital expenditures
Our capital expenditures are related to the acquisition of aircraft, aircraft-related equipment, IT equipment, support infrastructure and the funding ofpre-delivery deposits. LATAM’s capital expenditures totaled US$1,381.8694.4 million in 2013,2016, US$2,389.41,569.7 million in 20122015 and US$1,367.01,440.4 million in 2011.2014, and purchases of intangible assets totaled US$88.6 million in 2016, US$52.5 million in 2015 and US$55.8 million in 2014. See “—Sources of financing” above.
The following chart sets forth our estimate, as of December 31, 2013, of our futurethe Company’s estimated capital expenditures for 2014, 2015, 2016, 2017, 2018 and 20182019 calendar years:
| Estimated capital expenditures by year, as of December 31, 2013 | ||||||||||||||||||||
| 2014 | 2015 | 2016 | 2017 | 2018 | ||||||||||||||||
| (in US$ millions) | ||||||||||||||||||||
Expenditures on aircraft | 1,149 | 1,471 | 3,034 | 3,297 | 2,856 | |||||||||||||||
PDPs (1) | 95 | 181 | -96 | -207 | -369 | |||||||||||||||
Purchase Obligations | 1244 | 1652 | 2938 | 3090 | 2487 | |||||||||||||||
|
|
|
|
|
|
|
|
|
| |||||||||||
Other expenditures(2) | 399 | 375 | 353 | 336 | 312 | |||||||||||||||
Total | 1,643 | 2,027 | 3,291 | 3,426 | 2,799 | |||||||||||||||
|
|
|
|
|
|
|
|
|
| |||||||||||
| Estimated capital expenditures by year, as of December 31, 2016 | ||||||||||||||||
| 2017 | 2018 | 2019 | 2020 | |||||||||||||
| (in US$ millions) | ||||||||||||||||
Fleet Commitments(1) | 469 | 555 | �� | 1,589 | 1,503 | |||||||||||
PDPs (2) | 135 | 269 | (41 | ) | (18 | ) | ||||||||||
Other expenditures(3) | 524 | 504 | 530 | 531 | ||||||||||||
|
|
|
|
|
|
|
| |||||||||
| (1) | The amount of Fleet Commitments presented includes all the commited deliveries with estimates regarding (i) changes in scheduled delivery dates; (ii) conversion of certain aircraft types and (iii) aircraft of which we do not expect to take delivery, regardless of the financiation the aircraft will have upon arrival, thus representing the sum of aircraft capex and future sale and leasebacks. |
| (2) | Representspre-delivery payments made by LATAM, or inflows received by LATAM after the delivery of the aircraft is |
The expenditures set out in the table above reflect payments for purchases and other fleet-related items, as well as for information technology and other items. See “Item 4. Information on the Company—B. Business Overview—Fleet.” We have projected our capital expenditures based on our anticipated deliveries of aircraft fleet. See “—F. Tabular Disclosure of Contractual Obligations” below for a description of our purchase obligations, borrowings and other contractual commitments as of December 31, 2013.
C. Research and Development, Patents and Licenses, etc.
LATAM has registered the trademarks “LAN,“LATAM,” “LAN“LATAM Airlines Chile,” “LAN“LATAM Airlines Peru,” “LAN“LATAM Airlines Argentina” and “LAN“LATAM Airlines Ecuador” with the trademark office in Chile, Peru, Argentina and Ecuador, respectively. We license certain brands, logos and trade dress under the alliance agreement withoneworld® related to LAN’sLATAM’s alliance. As long as LANLATAM is a member ofoneworld®, it will have the right to continue to use current logos on its aircraft.
TAM holds or has filed registration applications for 229216 trademarks before theInstituto Nacional da Propriedade Industrial (“INPI”), or INPI, the body with jurisdiction for registering trademarks and patents in Brazil, and 74100 trademarks before the bodies with jurisdiction for registering trademarks in other countries in which TAM operates. Currently, TAM is not aware of any third-party challenges toone opposition filed by a third party challenging one of these applications.
D. Trend Information
During 2014, we expectFor 2017, LATAM expects total passenger ASK growth to be between 0% and 2%. International passenger ASK growth for full year 2017 is expected to be between 0% and 2%. LATAM Airlines Brazil’s domestic passenger ASKs in the Brazilian market are expected to decrease between 2% and 0%. ASKs in Spanish-speaking countries are expected to increase by approximately 4% to 6%.
Regarding cargo operations, LATAM expects cargo ATKs to decrease between 12% and 10% for full year 2017, driven by the withdrawals of two of four Boeing 777s-200F, which are currently classified as held for sale, and, two Boeing767-300F, during 2017.
In a context of increasing competitive pressures from different players across the region, including low cost operators, it is our goal to continue to experience positive trends inincrease the passengerefficiency of our operations, where we see significant growth opportunities in domestic and international markets in Latin America, and believe that the positive integration of LAN’s and TAM’s operations will allowallowing us to start achievingprovide the estimated synergies ofbest and most convenient options for our customers with the combination. Fuel prices have remained relatively stable thus far in 2014. Nevertheless, geopolitical instability, which affects the supply of fuel, isdistinctive customer experience LATAM passengers expect. In this context, LATAM has undertaken an important project to introduce a potential risk since fuel supply is key to our business, as it represents approximately 35% of our operating expenses. We can address increases in fuel prices through our fuel-hedging policy and the use of pass-through mechanismsnew travel model for both the passenger and cargo operations. However, these strategies are never completely effective and our operating margins are negatively impacted by a higher fuel price scenario. Specifically, we expect to face:
In 2014, we expect to continue expanding and diversifying our revenue base through the expansion of our network, namely, by further developing our existing routes, addingthis new destinations, developing new alliances, and entering new markets. During 2014, we expect to receive 14 Airbus A320-Family aircraft to operate domestic and regional routes, as well as 5 additional wide-body passenger aircraft (Models Boeing 767-300 and Boeing 787-8 Dreamliners) for long-haul routes. We also expect the return of 5 leased Boeing 737 aircraft, the return of 3 leased A340 aircraft, and the return of 3 leased Dash 8-Q400 aircraft operated by LAN Colombia. In addition, we expect to sale 7 Airbus A330 and take phase out some Airbus A320 family aircraft to be replaced by new aircraft of this family. Seetravel model, see “Item 4. Information on the Company—B. Business Overview—Fleet.”Passenger Operations—Business Model for Domestic Operations”.
Over the last year, we have implemented significant changes with the objective of transforming LATAM into a simpler, leaner and more efficient group. We have made these changes amidst a challenging and volatile macroeconomic scenario in the region. At the same time, the Company continues to strengthen its network, taking advantage of specific opportunities for profitable growth in LATAM’s South American Spanish-speaking markets (SSC, which include Chile, Peru, Argentina, Colombia and Ecuador). During 2016, we inaugurated new routes connecting our Lima hub with secondary cities (mainly in Argentina), as well as launched a new flight from Lima to Washington, DC. In addition, in October 2016 we launched the cargo business, we will continue to adjust capacityroute between São Paulo and Johannesburg, becoming the first airline in response to weakened demand in our core markets and to macroeconomic conditions. We expect import flows to Latin America to recover, but weaker cargo markets globally might further drive additional competitionconnect our region with a country in the African continent. We have also announced the launch of our longestnon-stop flight (between Santiago, Chile and Melbourne, Australia), starting in October 2017.
During 2016, we also announced joint business agreements with American Airlines and British Airways and Iberia, subject to regulatory approval in different countries, which will allow our passengers access to a wider network, more flight options with better connection times, more competitive fares to destinations not served by LATAM, increased potential for developing new routes and adding more direct flights to new destinations, as well as to destinations already served by LATAM, among other initiatives.
In response to the macroeconomic slowdown in South America especially Brazil. We will continueand the resulting deceleration in growth of demand for air travel, we are currently working on rightsizing our fleet, targeting a decrease of US$2.0 to monitorUS$3.0 billion in our expected fleet assets for 2018 through postponements, cancellations, redeliveries and asset sales. During 2016, the cargo market trends onCompany achieved a weekly basis in order to react as soon as possible if necessary. Also, we plantotal asset reduction of US$ 2.2 billion and expects to continue to optimize the utilization of the bellies of our passenger aircraft to maximize synergies associated with the Company’s integrated passenger/cargo business model.
We continue to maintain significant flexibility to adjust the physical size of our fleet. Between 2014 and 2016, we will have 25 operating lease expirations (including Japanese operating leases) in our wide-body passenger fleet, which can be terminated without cost. Starting in 2010, part of our Boeing 767 fleet has been fully paid, providing us with additional financial flexibility.
We also intend to make our cost structure more efficient and to offset potential decreases in demand with more efficient asset utilization, and we aim to enhance efficiency by streamlining our support processes, reducing commercial costs, continuing to develop our domestic business model for short-haul operations, and further developing the LEAN system in our processes.
Although we expect fuel prices to remain stableadjustments for the remainder of 2014,upcoming years.
Regarding fuel, we will continue to use fuel hedging programs and fuel surcharge mechanisms in both theour passenger and cargo businesses to help minimize the impact of short-term movements in crude oil prices. For instance, as of March 31, 2014 we haveLATAM has hedged approximately 56%33%, 45% and 19% of ourits estimated fuel requirementsconsumption for the first, quarter 2014, 51% for the second quarter and 25% for the third quarter. These hedging instruments are comprisedquarters of a combination of WTI and jet fuel collars and swaps. These hedges are for an average price between US$120 and US$122 dollars per barrel in jet fuel prices.2017 respectively.
E.Off-Balance Sheet Arrangements
As of December 31, 20132016 the Company had 128102 aircraft (of which 7919 are obligations of TAM and 4983 are obligations of LAN)LATAM) and 1910 aircraft engines under operating leases. These operating leases provide us with flexibility to adjust our fleet to any demand volatility that may affect the airline industry and therefore we consider such arrangements to be of great value to our strategy and financial performance. The total future lease payments related to our operating leases as of December 31, 2013 were2016 was US$1,912.0 3,255 million, for all remaining periods through maturity (the latest of which expires in 2020)2028). See “—F. Long Term Indebtedness—Tabular Disclosure of Contractual Obligations.”
Under the aforementioned operating leases, LATAM is responsible for all maintenance, insurance and other costs associated with operating these aircraft. The Company has not made any residual value or similar guarantees to our lessors. There are certain guarantees and indemnities to other unrelated parties that are not reflected on the Company’s balance sheet, but we believe that these will not have a significant impact on our results of operations or financial condition.
LATAM operates 2212 aircraft under tax leasing structures. These methods involve the creation of special purpose entities that acquire aircraft with bank and third partythird-party financing. Under IFRS, these aircraft are shown in the consolidated statement of financial position as part of “Property, plant and equipment” and the corresponding debt is shown as a liability. Of LATAM’s total tax leases, nine TAM tax leases are classified as operating leases for accounting purposes as of December 31, 2013.2016.
As of December 31, 2013,2016, we are not aware of any event, lawsuit, commitment, trend or uncertainty that may result in, or is reasonably likely to result in, the termination of the operating leases. See Note 33 to our audited consolidated financial statements for a more detailed discussion of these commitments.
F. Tabular Disclosure of Contractual ObligationsLong Term Indebtedness
We have contractual obligations and commitments primarily related to the payment of aircraft debt and lease arrangements, principal and interest on our non-aircraft long-term debt (which consists of senior notes, a securitized bond and bank loans), short-term export-import credits and for the future incorporation of aircraft to our fleet.Long Term Indebtedness
Secured Debt
Aircraft Debt
| 1. | ECA/EX-IM: Bank guaranteed bonds like Export-Import Bank of the United States(“EX-IM Bank”) and Export Credit Agency (“ECA”) guaranteed loan debt, as of December 31, 2016, was US$ 3,269 million. In general, ECA ans EX –IM financing have a12-year repayment profiles. |
| 2. | Enhanced Equipment Trust Certificates (“EETC”): In June 2015, LATAM issued the first EETC in Latin America for an aggregate face amount of approximately US$ 1,021 million to finance 17 new aircraft deliveries composed by 11 AirbusA321-200, 2 AirbusA350-900 and 4 Boeing787-9, with delivery dates from July 2015 through March 2016. The offering is comprised of Class A Certificates maturing in November 2027 and Class B Certificates maturing in November 2023. The annual interest rate for Class A and B Certificates are 4.20% and 4.50%, respectively. As of December 31, 2016, the EETC debt was US$ 962 million. |
| 3. | Bank Commercial Loans: As of December 31, 2016, bank commercial loans debt was US$ 1,697 million. |
| 4. | Tax Leases: LATAM has secured debt with tax leases through Japanese Leases with a call option (“JOLCO”) and Spanish Leases (“SOL”) structures. As of December 31, 2016, tax leases were US$ 108 million. |
Non Aircraft Debt
| 1. | 2013-1 Series Note: Regardingnon-aircraft debt, LATAM issued a securitized bond for an amount of US$ 450 million in November 2013 with a seven year term and a two year interest-only period (the“2013-1 Series Note”). This bond is backed by future flows of credit card sales of LATAM Airlines in the United States and Canada. The coupon is 6.0% fixed with quarterly payments. As of December 31, 2016, the2013-1 Series Note was US$ 368 million. |
| 2. | Bank Commercial Loans: As of December 31, 2016, bank commercial loans debt was US$ 52 million. |
Others
| 1. | Pre-Delivery Payments (“PDP”) financing: As of December 31, 2016, PDP financing outstanding amount was US$ 214 million. |
| 2. | Revolving Credit Facility (“RCF”): In March 2016, LATAM structured a Revolving Credit Facility secured by aircraft, engines, spare parts and supplies for a total amount available of US$ 325 million. The facility was disbursed for an initial amount of US$ 275 million increasing up to US$ 325 million by November, 2016. On December 2016, the facility was prepaid and remains fully available to be drawn. |
| 3. | Multiplus Shares Backed Loan (“Margin Loan”): In September 2016, TAM S.A. structured a financing amounting to US $ 200 million with the guarantee of approximately 18% ownership of the shares of Multiplus S.A., percentage subject to adjustment depending on the value of the stock as collateral. As of December 31, 2016, the Multiplus Shares Backed Loan outstanding amount was US$ 200 million. |
Unsecured Debt
| 1. | LATAM 2020 Notes: On June 9, 2015 LATAM Airlines Group S.A. issued and placed on the international market an unsecured long-term bond in the amount of US$ 500 million maturing 2020, at interest rate of 7.25% per year. As of December 31, 2016, the LATAM 2020 Notes outstanding amount was US$ 492 million. |
| 2. | TAM Capital 2017 Notes: As of December 31, 2016, TAM has a senior note outstanding US$ 300 million due in 2017, with a fixed interest rate of 7.375% payable semi-annually, issued by TAM Capital Inc. and guaranteed on a senior unsecured basis by TAM S.A. and TAM Linhas Aereas. These notes are listed on the Euro MTF market of the Luxembourg Stock Exchange. On December 18, 2007, TAM completed an exchange offer pursuant to which 99.2% of the holders exchanged these notes for new notes that are registered under the Securities Act and otherwise have identical terms. As of December 31, 2016, the TAM Capital 2017 Notes outstanding amount was US$ 304 million. |
| 3. | TAM Capital 2021 Notes: As of December 31, 2016, TAM has a senior note outstanding US$ 500 million due in 2021, with a fixed interest rate of 8.375% payable semi-annually, issued by TAM Capital 3 Inc. and guaranteed on a senior unsecured basis by TAM S.A. and TAM Linhas Aereas. As of December 31, 2016, the TAM Capital 2021 Notes outstanding amount was US$ 513 million. |
| 4. | Commercial Bank Loans: As of December 31, 2016, unsecured Bank Commercial loans debt was US$ 426 million. |
The Company’s debt that is secured by aircraft (including Export-Import Bank of the United States (“Ex-IM Bank”) Bank guaranteed bonds, Export Credit Agency (“ECA”) guaranteed loans, commercial loans, Japanese Lease with a call option (“JALCO”) structures and capital leases) asAs of December 31, 2013, was US$6,654.0 million. In general, LATAM’s aircraft debt has 12 year repayment profiles. However, some financing structures feature a balloon payment or a purchase option at2016, the end of the lease. By refinancing this balloon payment, the maturity dates of a number of our aircraft financings have been extended for another 3 to 8 years (some up to 20 years in total). Our 2013 aircraft acquisitions are described in further detail below under “—2013 Fleet Acquisitions.”
During December 2013, following LATAM’s strategy to reduce its short term debt and replace it by more structured long term facilities, the company pledged five fully paid B767 aircraft (three passenger and two Cargo aircraft) as collateral for a bank loan for an amount of US$ 95 million due in December 2016.
Regarding non-aircraft debt, LATAM issued a securitized bond for an amount of US$ 450 million in November 2013 with seven years tenor and two years interest only. This bond is backed by future flows of credit card sales of LATAM Airlines in the United States and Canada. The coupon is 6.0% fixed with quarterly payments.
In addition, TAM has three series of senior notes, totaling US$1,100 million. TAM’s senior notes comprise:
The average interest rate of all of our long term debt (which is our aircraft debt plus the senior notes issued by TAM, the LATAM securitization and bank loans) was 3.89% as of December 31, 2013.4.01%. Out of the total long-term debt, 73%63.1% accrues interest at a fixed rate (either through a stated fixed interest rate or through ourthe use of interest rate swap agreements) or is subject to interest rate caps.
As of December 2013,31, 2016, LATAM had US$1,969.3 1,773 million in current debt liabilities. Of this amount, US$896.1 228 million wasconsisted of short-term debt, which represents 46%13% of our total current debt liabilities. The remaining US$1,073.1 million is composed mainly of amounts payable within the next 12 months related to aircraft financing.
VariousEX-IM Bank loans signed by the CompanyLATAM for the financing of Boeing 767, 767 freighter, 777 freighter and 787 aircraft also contain financial covenants and other restrictions, including on the Company’s managementrestrictions in terms of its ownership and disposal of assets. In connection with the financing of spare engines for its Boeing 767, 767 freighter, 777, 777 freighter and 787 fleet, which are also guaranteed by the EX-IM Bank, financial covenants and other customary restrictions also apply. Additionally, with respect to various EX-IM Bank loans signed by Lan Cargo S.A. for the financing of Boeing 767 freighter and 777 freighter aircraft, financial covenants and other restrictions have been established to the Company’s management and its subsidiary Lan Cargo S.A. in terms of shareholder composition and disposal of assets.
As of December 31, 2013,2016, we also had purchase obligations totaling US$12.2 7.0 billion, with deliveries between 20142017 and 2020,2022, as set forth below:
Tabular Disclosure of Contractual Obligations
The following table sets forth our material expected obligations and commitments as of December 31, 2013:2016:
| Payments due by period, as of December 31, 2013 | Payments due by period, as of December 31, 2016 | |||||||||||||||||||||||||||||||||||||||
(US$ in millions) | Total | Less than 1 year | 1-3 years | 3-5 years | More than 5 years | Total(2) | Less than 1 year | 1-3 years | 3-5 years | More than 5 years | ||||||||||||||||||||||||||||||
Long-term debt obligations(1) | US$ | 6,313 | US$ | 534 | US$ | 1,152 | US$ | 1,385 | US$ | 3,242 | ||||||||||||||||||||||||||||||
Capital (finance) lease obligations | US$ | 2,312 | US$ | 410 | US$ | 708 | US$ | 580 | US$ | 614 | ||||||||||||||||||||||||||||||
Financial debt obligations(1) | US$ | 8,714 | US$ | 1,773 | US$ | 2,241 | US$ | 2,544 | US$ | 2,156 | ||||||||||||||||||||||||||||||
Operating lease obligations | US$ | 1,913 | US$ | 476 | US$ | 746 | US$ | 356 | US$ | 335 | US$ | 3,255 | US$ | 533 | US$ | 838 | US$ | 621 | US$ | 1,263 | ||||||||||||||||||||
Purchase obligations | US$ | 12,213 | US$ | 1,149 | US$ | 4,505 | US$ | 6,153 | US$ | 406 | ||||||||||||||||||||||||||||||
Fleet Commitments(3) | US$ | 6,966 | US$ | 469 | US$ | 2,144 | US$ | 4,002 | US$ | 351 | ||||||||||||||||||||||||||||||
TOTAL | US$ | 22,751 | US$ | 2,569 | US$ | 7,111 | US$ | 8,474 | US$ | 4,597 | US$ | 18,935 | US$ | 2,775 | US$ | 5,223 | US$ | 7,167 | US$ | 3,770 | | |||||||||||||||||||
| (1) |
| (2) | The amount presented reflects LATAM’s estimates regarding (i) changes in scheduled delivery dates; (ii) conversion of certain aircraft types and (iii) aircraft of which we do not expect to take delivery. For the amounts of material obligations and commitments as of December 31, 2016, please see Note 16 to our audited consolidated financial statements. |
| (3) | Fleet commitments represent the capex equivalent of purchasing all fleet arrivals. |
20132016 Fleet Acquisitions
During 2013,2016, LATAM completed the acquisition of the following wide body aircraft:
The Boeing787-9 aircraft financed through an operating lease has a 12 year term and leaseback transaction(s)
These EX-IM Bank financial obligations have a repayment profile of 12 years, with a guarantee covering 85% of the net purchase price of the aircraft.monthly payments. The EX-IM Bank guarantee is secured with a first priority mortgage on the aircraft in favor of a security trustee on behalf of EX-IM Bank. We have financed the remaining 15% of the net purchase price with our own funds. The firstfour Boeing787-9 and two aircraft were financed by EX-IM supported loans which subsequently were refinanced by EX-IM bank supported bond. The second two aircraft were pre-funded by EX-IM bank supported bonds.
Wide-bodyAirbus350-900 aircraft financed through sale and leaseback transactions have lease terms between 4 andof 12 years. These leases are denominated in U.S. dollars and have monthly payments. Aircraft financed through EETC are under the terms described above. The three Airbus350-900 financed through commercial loans have a Senior and Junior tranche, which have terms of 12 and 7 years, respectively.
In June 2013, LATAM entered into a sale-leaseback agreement with a leasing company for 10 A330 aircraft, which were operated by TAM, for a lease term of approximately 3 years following the company’s plan to replace this type of aircraft with new technology aircraft in the next years. Additionally 9 A350-900, 4 B787-9 and 2 B787-8 future deliveries were part of this deal in order to add more flexibility to LATAM’s wide body fleet plan.
During 2013,2016, LATAM completed the acquisition of the following narrow body aircraft:
Aircraft financed by TheECA-guaranteed bonds loans have an advance rate equal to 80% of the net purchase price of the aircraft for a 12 year12-year period, with the remaining 20% of the aircraft being financed by the Company’s available cash flows. Initially these
2015 Fleet Acquisitions
During 2015, LATAM completed the acquisition of the following wide body aircraft:
The four Boeing787-9 aircraft financed through operating lease transactions have lease terms of 12 years. These leases are denominated in U.S. dollars and have monthly payments. Aircraft financed through EETC are under the terms described above.
InDuring 2015, LATAM completed the caseacquisition of the following narrow body aircraft:
The aircraft financed under commercial financing for our Airbus 320-200 fleet, there is a senior tranche financing 81.7%part of the net purchase price of the aircraft. A first priority mortgage on the aircraft is in favor of2014 facility under a security trustee on behalf of the senior lender. The documentation for each loan follows standard market forms for the type of financing, including standard events of default.
Finally, narrow12-year floating rate amortizing loan. Narrow body aircraft financed through sale and leaseback transactions have lease terms of 812 years. These leases are denominated in U.S. dollars and have monthly payments. Finally, aircraft financed through EETC are under the terms described above.
The majorityECA-guaranteed loans have an advance rate equal to 80% of our wide body and narrow bodythe net purchase price of the aircraft financings through EX-IM Bank bonds, ECA guaranteed loans or commercial loans are denominated in U.S. dollars and have quarterly amortizationsfor a12-year period, with a combinationthe remaining 20% of fixed and floating rates linked to USD LIBOR. A small portion of ourthe aircraft debt has monthly or semiannual payments; nevertheless it is also denominated in US Dollars and linked to USD LIBOR. Throughbeing financed by the use of interest rate swaps and fixed coupon Bond emissions in the case of Boeing aircraft, we have effectively converted a significant portion of our floating rate debt under these loans into fixed rate debt.Company’s available cash flows.
| ITEM 6. | DIRECTORS, SENIOR MANAGEMENT AND EMPLOYEES |
A. Directors and Senior Management
The management of LATAM Airlines Group is conducted by its board of directors which, in accordance with LATAM Airlines Group’s by-laws, consists of nine directors who are elected every two years fortwo-year terms at annual regular shareholders’ meetings or, if necessary, at an extraordinary shareholders’ meeting,, and may bere-elected. The board of directors may appoint replacements to fill any vacancies that occur during periods between elections. Scheduled meetings of the board of directors are held once a month and extraordinary board of directors’ meetings are called when summoned by the chairman of the board of directors and two other directors,directors. Extraordinary meetings can be summoned by the chairman, or when requested by one or more directors if the need for such meeting is previously approved by the chairman, unless the meeting is requested by a majority of the directors.directors, in which case the meeting must be held without the previous approval of the chairman.
The current board of directors was elected at the extraordinaryordinary shareholders’ meeting held on September 4, 2012.April 28, 2015. Its term expires in September 2014. April 2017. On June 7, 2016, Mr. Ricardo J. Caballero resigned as a member of the board of directors, which elected on January 24th, 2017 Mr. Giles Agutter in his place.
The following are LATAM Airlines Group’s directors:
Directors | Position | |
Mauricio Rolim Amaro(1) | Director / Chairman | |
Henri Philippe Reichstul | Director | |
Juan José Cueto Plaza(2) | Director | |
Ramón Eblen Kadis(3) | Director | |
Georges de Bourguignon | Director | |
Giles Agutter | Director | |
Carlos Heller Solari(4) | Director | |
Gerardo Jofré Miranda | Director | |
Francisco Luzón López | Director |
Senior Management | Position | ||
Enrique Cueto Plaza(2) | CEO LATAM | ||
Ignacio Cueto Plaza(2) | CEO LAN | ||
Ramiro Alfonsín | CFO LATAM | ||
Armando Valdivieso Montes | Senior VP Commercial LATAM | ||
Claudia Sender | President | ||
Emilio del Real Sota | Senior VP Human Resources | ||
Juan Carlos Mencio | Senior VP Legal | ||
| (1) | Mr. Mauricio Rolim Amaro |
| (2) | Messrs. Ignacio, Juan José and Enrique Cueto Plaza are brothers. All three are members of the Cueto Group, which is defined in |
| (3) | Mr. Ramón Eblen Kadis is a member of the Eblen Group, which is defined in |
| (4) | Mr. Carlos Heller Solari is a member of the Bethia Group, which is defined in |
Biographical Information
Set forth below are brief biographical descriptions of LATAM Airlines Group’s directors and senior management. All of LATAM’s directors were elected or reelected, as the case may be, in September 2012April 28, 2015 for atwo-year term, which expires in September 2014.April 2017, with the exception of Mr. Giles Agutter who was elected by the Board of Directors to fill the vacancy left by Mr. Ricardo J. Caballero due to his resignation.
Directors
Mr. Mauricio Rolim Amaro, 43 years old, has served as member of LATAM Airlines Group’s board of directors since June 2012,2012. He was reelected to the board of directors of LATAM in September 2012April 2015 and has served as Chairman since September 2012. Mr. Amaro current term as chairman ends in September 2014. Mr. Amaro has previously held various positions in the TAM Group and served as a professional pilot at TAM Linhas Aéreas S.A. and TAM Aviação Executiva S.A..S.A. Mr. Amaro has been a member of the Board of TAM S.A. since 2004, and vice-chairman of the Board since April 2007. He is also an executive officer at TAM Empreendimentos e Participações S.A. and chairman of the boards of Multiplus S.A. (subsidiary of TAM S.A.) and of TAM AviaçãoExecutivao Executiva e Taxi Aéreo S.A. As of January 31, 2014,2017, according to shareholder registration data in Chile, Mr. Amaro shared in the beneficial ownership of 65,554,07518,342,913 common shares of LATAM Airlines Group (12.01%(3.02% of LATAM Airlines Group’s outstanding shares), held directly by TEP Chile S.A. For more information see “Item 7. Controlling Shareholders and Related Party Transactions.”
Mrs. Maria Claudia Amaro, 47 years old, has served on LATAM Airlines Group’s board of directors since June 2012 and was reelected to the board of directors of LATAM in September 2012. Mrs. Amaro’s term as a director ends in September 2014. She holds a bachelor’s degree in Business Administration and Marketing. Previously she served as Marketing Director at TAM Linhas Aéreas. She has been a member of the Board of TAM S.A. since September 2003, and chairwoman of the Board since April 2007. She is also an Executive Officer at TAM Empreendimentos e Participações S.A. and a member of the boards of Multiplus S.A. and of TAM AviaçãoExecutiva e Taxi Aéreo S.A. As of January 31, 2014, according to shareholder registration data in Chile, Mrs. Amaro shared in the beneficial ownership of 65,554,07535,292,908 common shares of LATAM Airlines Group (12.01%(5.82% of LATAM Airlines Group’s outstanding shares), held indirectly by TEP Chile S.A.Chile. For more information see “Item 7. Controlling Shareholders and Related Party Transactions.”
Mr. Henri Philippe Reichstul, joined LATAM’s board of directors in April 2014. Mr. Reichstul has served as President of Petrobras and the IPEA-Institute for Economic and Social Planning and Executive Vice President of Banco Inter American Express S.A. Currently, in addition to his roles as Administrative Board member of TAM and LATAM Group, he is also a member of the Board of Directors of Repsol YPF, Peugeot Citroen, AES Brasil, and SEMCO Partners, among others. Mr. Reichstul is an economist with an undergraduate degree from the Faculty of Economics and Administration, University of São Paulo, and postgraduate work degrees in the same discipline—Hertford College—Oxford University.
Mr. Juan José Cueto Plaza53 years old, ,has served on LAN’s board of directors since 1994 and was reelected to the board of directors of LATAM in September 2012. Mr. Cueto’s term as a director ends in September 2014.April 2015. Mr. Cueto currently serves as Executive Vice President of Inversiones Costa Verde S.A., a position he has held since 1990, and serves on the boards of directors of Consorcio Maderero S.A., Minera Michilla S.A., Inversiones del Buen Retiro S.A., Inmobiliaria e Inversiones Asturias S.A., Inversiones Mineras del Cantábrico S.A., Costa Verde Aeronáutica S.A., Sinergia Inmobiliaria S.A. and, Valle Escondido S.A., Fundación Colunga and Universidad San Sebastián. Mr. Cueto is the brother of Messrs. Enrique and Ignacio Cueto Plaza, LATAM Airlines Group Executive Vice-President and LAN CEO, respectively. Mr. Cueto is a member of the Cueto Group (LATAM Airlines Group’s Controlling Shareholder). As of January 31, 2014,2017, Mr. Cueto shared in the beneficial ownership of 139,089,517171,430,090 common shares of LATAM Airlines Group (25.49%(28.27% of LATAM Airlines Group’s outstanding shares) held by the Cueto Group. Mr. Cueto is also a member of the board of directors of Holdco II. For more information see “Item 7. Controlling Shareholders and Related Party Transactions.”
Mr. Georges de Bourguignon, has served on LATAM Airlines Group’s board of directors since September 2012 and was reelected to the board of directors of LATAM in April 2015. Mr. de Bourguignon has been a partner and executive director of Asset Chile S.A., a Chilean investment bank, since 1993. He is currently member of the board of directors K+S Chile S.A. andEmbotelladora Andina S.A. In the past he has served on several other boards of public and private companies, as well as of boards of non profit organizations. Between 1990 and 1993, he was manager of the Financial Institutions Group at Citibank S.A. in Chile, and was a professor of economics at the Catholic University of Chile. He is an economist from Catholic University of Chile and a graduate of Harvard Business School. As of January 31, 2017, Mr. de Bourguignon indirectly held 3,153 common shares of LATAM Airlines Group (0.0005%) of LATAM Airlines Group outstanding shares).
Mr. Ramón Eblen Kadis 69 years old,, has served on LAN’s board of directors since June 1994 and was reelected to the board of directors of LATAM in September 2012. Mr. Eblen’s term as a director ends in September 2014.April 2015. Mr. Eblen has served as President of Comercial Los Lagos Ltda., Inversiones Santa Blanca S.A., Inversiones Andes SpA, Granja Marina Tornagaleones S.A. and TJC Chile S.A. Mr. Eblen is a member of the Eblen Group (a major shareholder of LATAM Airlines Group). As of January 31, 2014, Mr.2017, The Eblen Group had the beneficial ownership of 27,945,19935,945,199 common shares of LATAM Airlines Group (approximately 5.12%(5.93% of LATAM Airlines Group’s outstanding shares) held by the Eblen Group plus a 40% ownership of Costaverde Aeronautica SpA, which owns 20.000.000 common shares of LATAM Airlines Group.. For more information see “Item 7. Controlling Shareholders and Related Party Transactions.”
Mr. Georges de Bourguignon, 51 years old, Giles Agutter is the owner and Chief Executive Officer of Southern Sky Ltd, an airline consultant company specializing in airline strategy, fleet planning, aircraft acquisition and aircraft financing. Mr. Agutter has servedhad vast experience in advising airlines, including Qatar Airways, on LATAM Airlines Group’s board of directors since September 2012. Mr. de Bourguignon’s term assignificant Merger and Acquisition projects within the airline industry. Mr Agutter has a director endsdegree in September 2014. Mr. de Bourguignon has been a partnerAerospace Engineering from Manchester University and co-founder of Asset Chile SA, a Chilean investment bank, since 1994. He ishe currently member of the board of directors of the company Sal Lobos, Chilean subsidiary of the German group K+S. From 1990 to 1993 he served as Manager of Financial Institutions of Citibank SAresides in Chile. During 1993-2005 he was director of Intergenesis Investment Fund Administrator. As of January 31, 2014, Mr. de Bourguignon indirectly held 33,153 common shares of LATAM Airlines Group (0.0057 % of LATAM Airlines Group’s outstanding shares).Mr. José María Eyzaguirre Baeza, 51 years old, has served on LATAM Airlines Group’s board of directors since September 2012. Mr. Eyzaguirre’s term as a director ends in September 2014.Mr. Eyzaguirre has been a partner at Claro y Cia, a law firm in Chile, since 1993 and currently leads the M&A practice. During the practice of law, Mr. Eyzaguirre started in commercial litigation, then specialized in financial and capital markets and recently, and especially, in the areas of corporate nature, with special dedication to the area of mergers and acquisition of companies (cross-border). Currently Mr. Eyzaguirre is Director of Walmart Chile S.A. (since 2010), Komax S.A. (since 2010) and Sociedad Quimica y Minera de Chile S.A. (since 2001). Previously, Mr. Eyzaguirre hasparticipated in several companies’ boards, including Andina (until 2012) and AES Gener S.A. (until 2001).England.
Mr. Carlos Heller Solari, 52 years old, joined LAN’sthe board of directorsLAN in May 2010 and was reelectedre-elected to the boardBoard of directorsDirectors of LATAM in September 2012. Mr. Heller’s term as a director ends in September 2014.April 2015. Mr. Heller has a vast experience in the retail, transportscommunications, transport and agriculture sectors.industries. Mr. Heller is Presidentpresident of Bethia S.A. (“Bethia”) (holding(parent company and owner of Axxion S.A. and Betlan DosInversiones HS SpA). He is also President of the Boards of Falabella Retail S.A.), Chairman of AxxionRed Televisiva Megavision S.A., Club Hípico de Santiago S.A., Sotraser S.A., Blue Express S.A., Aero Andina S.A. and Agrícola Ancali.“Azul Azul S.A.” concessionaire of the Corporación de Fútbol Profesional de la Universidad de Chile. He is also participates as a board of directors’ member of SACIthe Board of Directors of S.A.C.I Falabella, S.A., Falabella Retail S.A., Sodimac S.A. , Titanium S.A., Viña Indómita S.A., Viña Santa Alicia S.A., Blue Express and Viña Dos Andes S.A. and Aero Andina S.A. Additionally he is the major shareholder and Vice President of “Azul Azul” (Universidad de Chile’s first division soccer team administrator). As ofOn January 31, 2014,2017, Mr. Heller indirectly held 33,501,357 common33,367,357 ordinary shares of LATAM Airlines Group through Axxion S.A. and Inversiones HS Spa (6.14 %(5.50% of the shares of LATAM Airlines Group’s outstanding shares)Group).
Mr. Gerardo Jofré Miranda, 64 years old, joined LAN’sLATAM Airlines’ Board of directors on May 2010 and was reelected to the board of directors of LATAM in September 2012. Mr. Jofré’s term as a director ends in September 2014.April 2015. Mr. Jofré is Chairman of Codelco and member of the board of directors of Pan B Foundation. Mr. Jofré is President of Saber Más FoundationCodelco, Enel Chile and member of the Real Estate Investment Council of Santander Real Estate Funds. From 2010 to 2014 he served as president of the board of directors of Codelco. From 2005 to 2010 he served as member of the boards of directors of Endesa Chile S.A., Viña San Pedro Tarapacá S.A., D&S S.A., Inmobiliaria Titanium S.A. Construmart S.A., Inmobiliaria Playa Amarilla S.A., Air Life Chile S.A and Inmobiliaria Parque del Sendero S.A. and was President of Saber Más Foundation. Mr. Jofré was Director of Insurance for America for Santander Group of Spain between the years 2004 and 2005. From 1989 to 2004 he served on Santander Group in Chile, as Vice Chairman of the Group and as CEO, member of the boards of directors and Chairman of many of the Group’s companies. As of January 31,st, 2014, 2017, Mr. JofreJofré held 5,673106,843 common shares of LATAM Airlines Group (0.0010%(0.017% of LATAM Airlines Group’s outstanding shares).
Mr. Francisco Luzón López, 66 years old, has served on LATAM Airlines Group’s board of directors since September 2012. Mr. Luzón’s term2012 and was reelected to the board of directors of LATAM in April 2015. He has served as a director ends in September 2014. Consultantconsultant of the Inter-American Development Bank (BID) and he has been Teacher “Visiting Leader” of the School of Business China-Europe (CEIBS)(“CEIBS”) in Shanghai (2012-2013). Current European Stability Mechanism (ESM) Advisor (September 2013)He is
currently a member of the board of La Haya Real Estate and Currentserved as Independent Director at Willis Group (June 2013).between June 2013 and January 2016. Between 1999 and 2012, Mr. Luzon served as Executive Vice President for Latin America of Banco Santander. In this period, he was also Worldwide Vice President of Universia SA.S.A. Between 1991 and 1996 he was Chairman and CEO of Argentaria Bank Group. Previously, in 1987, he was appointed Director and General Manager of BancoVizcayaBanco de Vizcaya and in 1988, Counselor and General Director of Banking Group at BBV. During his career Mr. Luzon has held positions on the boards of several companies, most recently participating in the council of the global textile company Inditex-Zara from 1997 until 2012. As of January 31, 2014, Mr. Luzon held 12,200 common shares of LATAM Airlines Group (0.0022% of LATAM Airlines Group’s outstanding shares).
Senior Management
Mr. Enrique Cueto Plaza 55 years old,, is LATAM Airlines Group’s Chief Executive Officer (“CEO”). From 1994 to 2012, Mr. Cueto was and has been in this position since the CEO of LAN.combination between LAN and TAM in June 2012. From 1983 to 1993, Mr. Cueto was Chief Executive Officer of Fast Air, a Chilean Cargo airline. From 1993 to 1994, Mr Cueto was a member of the board of LAN Airlines. Thereafter, Mr. Cueto also served onheld the position of CEO of LAN board of directors from 1993 to 1994.until June 2012. Mr. Cueto hasin-depth knowledge of passenger and cargo airline management, both in commercial and operational aspects, gained during his 2430 years in the airline industry. Mr. Cueto is an active member of theoneworld® Alliance Governing Board, the IATA (International Air Transport Association) Board of Governors. He is also member of the Board of the Federation of Chilean Industry (SOFOFA) and of the Board of the Endeavor foundation, an organization dedicated to the promotion of entrepreneurship in Chile.Chile, and president of the Latin American and Caribbean Air Transport Association (ALTA). Mr. Cueto is the brother of Messrs. Juan José and Ignacio Cueto Plaza, member of the board and LAN CEO, respectively. Mr. Cueto is also a member of the Cueto Group (LATAM Airlines Group’s Controlling Shareholder). As of January 31, 2014,2017, Mr. Cueto jointly shared in the beneficial ownership of 139,089,517171,430,090 common shares of LATAM Airlines Group (25.49%(28.27% of LATAM Airlines Group’s outstanding shares) held by the Cueto Group. For more information see “Item 7. Controlling Shareholders and Related Party Transactions.”
Mr. Ignacio Cueto Plaza 50 years old,, is LAN’s CEO. His career in the airline industry extends over 30 years. In 1985, Mr. Cueto assumed the position of Vice President of Sales at Fast Air Carrier, the biggest national cargo company of that time. In 1985, Mr. Cueto assumed as Service Manager and Commercial Manager for the Miami sales office. Mr. Cueto later served on the board of directors of Ladeco (from 1994 to 1997) and LAN (from 1995 to 1997). Mr. Cueto served as President of LAN Cargo from 1995 to 1998, as Chief Executive Officer-Passenger Business from 1999 to 2005, and as President and Chief Operating Officer of LAN since 2005 until the mergercombination with TAM in 2012. Mr. Cueto also led the establishment of the different affiliates that the Company has previously served onin South America, as well as the boardimplementation of directors of LAN (from 1995 to 1997) and Ladeco (from 1994 to 1997). In addition, Mr. Cueto served as Chief Executive Officer of Fast Air from 1993 to 1995. Between 1985 and 1993, Mr. Cueto held several positions at Fast Air, including Service Manager for the Miami sales office, Director of Sales for Chile and Vice President of Sales and Marketing.key alliances with other airlines. Mr. Cueto is the brother of Messrs. Juan José and Enrique Cueto Plaza, Director and LATAM’s CEO, respectively. Mr. Cueto is also a member of the Cueto Group (which is a controlling shareholder of LATAM). As of January 31, 2014,2017, Mr. Cueto shared in the beneficial ownership of 139,089,517171,430,090 common shares of LATAM (25.49%(28.27% of LATAM’s outstanding shares) held by the Cueto Group. For more information see “Item 7. Controlling Shareholders and Related Party Transactions.” Mr. Cueto is expected to leave the Company’s senior management team inmid-April 2017 and is applying to become a member of LATAM’s board of directors.
Mr. Andrés Osorio, 50 years old, is LATAM’s Chief Financial Officer (“CFO”), and has held this position since August, 2013. Mr. Osorio joined LATAM in August, 2013. Prior to joining LATAM, Mr. Osorio served as CFO Cencosud S.A. As of January 31, 2014, Mr. Osorio owned 20,000 common shares of LATAM (0.0036% of LATAM Airlines Group’s outstanding shares).
Mr. Marco Bologna, 59 years old, is TAM’s CEO since May, 2010. He is also board member of Suzano Papel e Celulose S/A. He joined TAM in March 2001, when he was appointed Vice President for Finance and Management, and Market Relations Director. From 2004 to 2007 he served as President of TAM Linhas Aéreas, and in March 2009 he took over as President of TAM Aviação Executiva and Táxi Aéreo S.A. Since April 30, 2010 he has chaired the holding company TAM S.A., which brings together TAM Linhas Aéreas, TAM Airlines (formerly TAM Mercosur), Multiplus Fidelidade, and the maintenance unit TAM MRO. In February 2012, he was also appointed President of TAM Linhas Aéreas. Mr. Bologna has extensive experience in the aviation industry, and has worked in the financial markets for over 20 years.
Mr. Armando Valdivieso Montes51 years old, ,is Senior Commercial Vice President of LAN. Between 1997LATAM since 2015. After the combination between LAN and 2005 heTAM in 2012, Mr. Valdivieso served as Chief Executive Officer-Cargo BusinessGeneral Manager of LAN, and from 2006 until 2012 he served as the General Manager-Passenger. After the merger with TAM in 2012, Mr. ValdiviesoBetween 1997 and 2005 he served as LATAM’s Spanish Speaking CountriesChief Executive Vice-President, before being named to his current position.Officer-Cargo Business of LAN. From 19941995 to 1997, Mr. Valdivieso was President of Fast Air. FromAir, and from 1991 to 1994, Mr. Valdivieso served as Vice President, North America of Fast Air Miami. Mr. Valdivieso is a civil engineer and obtained an AMP (Advance Managements Program) from Harvard Business School. Mr. Valdivieso will leave the Company during August 2017 as was announced by the Company on March 16, 2017. As of January 31, 2014, according to shareholder registration data in Chile,2016, Mr. Valdivieso owned 67,35995,859 common shares of LATAM Airlines Group (0.012%(0.016% of LATAM Airlines Group’s outstanding shares).
Mr. Cristian Ureta Larrain,Mrs. 51 years old, is LATAM’s Cargo Executive Vice-President. From 1998 and 2002, Mr. Ureta was LAN Cargo’s Planning and Development Vice-President and in 2002 he was promoted to Production Vice President. In 2005, Mr. Ureta assumed the position of General Manager-Cargo. Mr. Ureta has an Engineering degree from Pontificia Universidad Católica and a Special Executive Program from Stanford University. Prior to that, Mr. Ureta served as General Director and Commercial Director at Mas Air, and as Service Manager for Fast Air.
Mr. Roberto Alvo Milosawlewitsch, 45 years old, is LATAM’s Chief Corporate Officer. Mr. Alvo has served in various roles within LAN since 2001, including as CFO of LAN Argentina from 2005 until 2008, as Vice-president of Development of LATAM Airlines Group from 2003 until 2005 and Vice-President of Treasury of LATAM Airlines Group from 2001 until 2003. He assumed the position of Senior Vice-President Strategic Planning and Development in 2008. Before 2001 Mr. Alvo held various positions at Sociedad Química y Minera de Chile S.A., a leading non-metallic Chilean mining company. Mr. Alvo is a civil engineer and obtained an MBA from IMD in Lausanne, Switzerland.
Mr. Damian Scokin, 47 years old, is LATAM’s International Unit Business Executive Vice President. He joined LAN in 2005. Prior to his current position, Mr. Scokin was responsible for LAN International business and CEO of LAN Argentina, where he led the start up and development of LAN’s new subsidiary in Argentina. Prior to joining LAN, he developed an extensive career as a management consultant at McKinsey & Company, where he worked for 11 years. During his consulting experience Mr. Scokin worked in the United States, Great Britain, Chile, Brazil, Peru and Argentina in a variety of projects. In 2000, Mr. Scokin was elected Partner of the Firm and in 2003 he became “Location Manager” of the Buenos Aires office, leading McKinsey’s practice in Argentina. Damian Scokin obtained his MBA from Harvard Business School in 1995, after graduating as Bachelor in Economics (1991) and Industrial Engineer (1992) at the University of Buenos Aires. As of January 31, 2014, according to shareholder registration data in Chile, Mr. Scokin owned 7,730 common shares of LATAM Airlines Group (0.0014% of LATAM Airlines Group’s outstanding shares.
Mrs. Claudia Sender Ramirez 39, is, has served as TAM Airlines’ CEOPresident since May 2013. Mrs. Sender joined the company in December 2011, as Commercial and Marketing Vice-President. After June 2012, with the conclusion ofTAM-LAN merger combination and the creation of LATAM Airlines Group, she became the head of Brazil Domestic Business Unit, and her functions were expanded in order to include TAM´sTAM’s entire Customer Service structure. Mrs. Sender dedicated most of her career in consumer goods industry, focused in Marketing and Strategic Planning. Prior to joining TAM,LATAM Airlines, she was Marketing Vice-President at Whirlpool Latin America for seven years. She also worked as a consultant at Bain&Company, & Company, developing projects for large companies in various industries, including TAM Airlines and other players of the global aviation sector. She has a bachelorbachelor’s degree in Chemical Engineering from the Polytechnic School at the University of São Paulo (USP)(“USP”) and a MBA from Harvard Business School. As
Mr. Juan Carlos Mencio, is Senior Vice President of January 31, 2014, Mrs. Sender did not own any sharesLegal Affairs and Compliance for LATAM Airlines Group since September 1, 2014. Mr. Mencio had previously held the position of LATAM.General Counsel for North America for LATAM Airlines Group and its related companies, as well as General Counsel for its worldwide Cargo Operations, both since 1998. Prior to joining LAN, he was in private practice in New York and Florida representing various international airlines. Mr. Mencio obtained his Bachelor’s Degree in International Finance and Marketing from the School of Business at the University of Miami and his Juris Doctor Degree from Loyola University.
Mr. Ramiro Alfonsín, is LATAM’s Chief Financial Officer (“CFO”), a position he holds since July 2016. Over the past 16 years, before joining LATAM, he worked for Endesa, a leading utility company, in Spain, Italy and Chile, having served as Deputy Chief Executive Officer and Chief Financial Officer for their Latin American operations. Before joining the utility sector, he worked for 5 years in Corporate and Investment Banking in large European banks. Mr. Alfonsín holds a degree in business administration from Pontificia Universidad Católica de Argentina.
Mr. Emilio del Real Sota, 49 years old, is LATAM’s HR Executive Vice-President, a position he assumed (with LAN) in August 2005. Mr. del Real has a Psychology degree from Universidad Gabriela Mistral. Between 2003 and 2005, Mr. del Real was the Human Resource Manager of D&S, a Chilean retail company. Between 1997 and 2003 Mr. del Real served in various positions in Unilever, including Human Resource Manager for Chile, and Training and Recruitment Manager and Management Development Manager for Latin America.
“Mr. Jerome Cadier,44 years old, is Chief Marketing Officer, a position he assumed in March 1st, 2013. Mr. Cadierdel Real has a MastersPsychology degree from Universidad Gabriela Mistral.
During 2017, the Kellogg Graduate SchoolCompany will implement a new organizational structure focused on four basic areas –Clients, Revenue, Operations and Fleet, and Finance– which will be the pillars of Business, USAthe Company’s business strategy and will report directly to the CEO LATAM. The new structure will be simpler, more efficient and more functional, and will enable the Company to face an increasingly competitive environment. With this reorganization that will focus on functions instead of business units, the Company expects to optimize its internal synergies and strengthen its structure.
The Clients area will be initially led by Claudia Sender. This area will focus on providing the client with a Industrial Engineer degree from Escola Politecnica da Universidade de Sao Paulo, Brasil. Between 1994complete experience. The Revenues area, focused on maximizing revenues for the Company, will be initially led by Roberto Alvo Milosawlewitsch, who will be LATAM’s Chief Commercial Officer. The Operations and 2002, Mr. Cadier workedFleet area will be initially led by Hernan Pasman, who will be responsible for McKinseythe Operations and Co in Sao Paulo, Brasil as a management consultant. In 2003 he joined Whirlpool Home Appliances where he held several positions among which are headFleet Vice-presidency. The Finance area will preserve its existing organization and structure, and will be led by Ramiro Alfonsín, the current Chief Financial Officer of sales and marketing for Brazil and CEO for Whirlpool Oceania. As of January 31, 2014, Mr. Cadier did not own any shares of LATAM”the Company
B. Compensation
In 2013,2016, the Company paid its principal executives (considering the levels of Vice-Vice Presidents, General Managers, Senior DirectorsDirector and Directors as defined above) a total of US$43,644,704 plus US$24,755,841 in40,194,453. After the incentives for performance paid during 2013, which were paid in March 2014. As a result,2015, the Company paid its principal executives total gross remunerations of US$68,400,545.55,174,744.
Under Chilean law, LATAM Airlines Group must disclose in its annual report details of all compensation paid to its directors during the relevant fiscal year, including any amounts that they received from LATAM Airlines Group for functions or employment other than serving as a member of the board of directors, including amounts received as per diem stipends, bonuses and, generally, all other payments. Additionally, pursuant to regulations of the Superintendencia de Valores y Seguros de Chile (“SVS”), the Chilean securities regulator, the annual report must also include the total compensation and severance payments received by managers and principal executives, and the terms of and the manner in which board members and executive officers participateparticipated in any stock option plans.
LATAM Airlines Group’s directors are paid 50 UF per meeting (100 UF for the chairman of the board) and 40 UF for assistance to the subcommittee of Directors meetings. LATAM Airlines Group also provides certain benefits to its directors and executive officers, such as free and discounted airline tickets and health insurance. We do not have contracts with any of our directors to provide benefits upon termination of employment.
As set forth in further detail in the following table, in 20132016 the members of our board of directors currently in office received fees and salaries in the aggregate amount of US$377,383.282,364.
Board Members | Fees (US$)(1) | |||
Mauricio Rolim Amaro | ||||
| ||||
Ricardo J. Caballero | 9,188 | |||
Juan José Cueto Plaza | ||||
| ||||
Ramon Eblen Kadis | ||||
Georges de Bourguignon | ||||
| ||||
Carlos Heller Solari | ||||
Juan Gerardo Jofre Miranda | ||||
Francisco Luzón López( | ||||
Total | ||||
|
| |||
| (1) | Includes fees paid to members of the board of directors’ committee, as described below. |
All of the abovementionedabove-mentioned directors were elected to the LATAM board of directors in September 2012.April 2015.
As required by Chilean law, LATAM Airlines Group makes obligatory contributions to the privatized pension fund system on behalf of its senior managers and executives, but it does not maintain any separate program to provide pension, retirement or similar benefits to these or any other employees.
C. Board Practices
Our board of directors is currently comprised of nine members. The terms of each of our current directors will expire in September 2014.April 2017. See “—A. Directors and Senior Management” above.
Committees
Board of Directors’ Committee and Audit Committee
Pursuant to Chilean Corporation Law, LATAM Airlines Group must have a board of directors’ committee composed of no less than three board members. LATAM Airlines Group has established a three-person committee of its board of directors, which, among other duties, is responsible for:
Under Chilean lawCorporation Law we are required, to the extent possible, to appoint a majority of independent directors to the Board of Directors Committee. The corresponding independence requirements are set forth in Chilean Corporation Law and relate to the relationship between the directors and the shareholders that control a corporation. A director is considered independent when he or she can be elected regardless of the voting of the controlling shareholders. See “Item 16. Reserved—G. Corporate Governance.”
Pursuant to U.S. regulations, we are required to have an audit committee of at least three board members, which complies with the independence requirements set forth in Rule10A-3 under the Exchange Act. Given the similarity in the functions that must be performed by our Board of Directors’ Committee and the audit committee, our Board of Directors’ Committee serves as our Audit Committee for purposes of Rule10A-3 under the Exchange Act.
As of March 30, 2013,December 31, 2016, all of the members of our Board of Directors’ Committee, which also serves as our Audit Committee, were independent under Rule10A-3 of the Exchange Act. As of March 30, 2013,December 31, 2016, the committee members were Mr. Gerardo Jofré Miranda, Mr. Ramón Eblen Kadis and Mr. Georges de Bourguignon Arndt.Bourguignon. We pay each member of the committee 3267 UFs per meeting.monthly assistance to meetings.
Other LATAM Board Committees
LATAM’s board of directors also has established four other committees to review, discuss and make recommendations to our board of directors. These include a Strategy Committee, a Leadership Committee, a Finance Committee and a Brand, Product and Frequent Flyer Program Committee. The Strategy Committee focuses on the corporate strategy, current strategic issues and the three-year plans and budgets for the main business units and functional areas and high-level competitive strategy reviews. The Leadership Committee focuses on, among other things, group culture, high-level organizational structure, appointment of the LATAM CEO and
his or her other reports, corporate compensation philosophy, compensation structures and levels for the LATAM CEO and other key executives, succession or contingency planning for the LATAM CEO and performance assessment of the LATAM CEO. The Finance Committee is responsible for financial policies and strategy, capital structure, monitoring policy compliance, tax optimization strategy and the quality and reliability of financial information. Finally, the Brand and Frequent Flyer Program Committee is responsible for brand strategies and brand building initiatives for the corporate and main business unit brands, the main characteristics of products and services for each of the main business units, frequent flyer program strategy and key program features and regular audit of brand performance.
On June, 2014 LATAM’s board of directors established a Risk Committee to oversee the creation, implementation and management of a risk matrix for the Company.
Corporate Governance Practices
On March 31, 2014 the Board of Directors of LATAM Airlines Group filed for the first time the Company’s Corporate Practices Report prepared according to General Rule N° 341, current N°385 of the Securities and Insurance Commission issued November 29, 2012. The reporting obligation stipulated in this rule is for practices in place as of December 31st of each year and the report must be presented no later than March 31st of the following year.
The report provided each year to the Commission must cover the following subjects:
D. Employees
The following table sets forth the number of employees in various positions at the Company.
Employees | As of December 31, | |||||||||||||||||||||||
Employees ending the period | As of December 31, | |||||||||||||||||||||||
| 2013 | 2012(2) | 2011(1) | 2016(1) | 2015 | 2014 | |||||||||||||||||||
Administrative | 9,908 | 8,980 | 4,170 | 8,010 | 9,118 | 10,077 | ||||||||||||||||||
Sales | 5,680 | 4,858 | 2,750 | 4,235 | 5,022 | 5,246 | ||||||||||||||||||
Maintenance | 6,925 | 6,932 | 2,918 | 4,895 | 5,990 | 6,986 | ||||||||||||||||||
Operations | 17,054 | 18,138 | 6,194 | 15,924 | 16,878 | 17,517 | ||||||||||||||||||
Cabin crew | 9,339 | 10,164 | 3,837 | 8,970 | 9,383 | 9,237 | ||||||||||||||||||
Cockpit crew | 4,091 | 4,527 | 1,969 | 3,882 | 4,022 | 4,009 | ||||||||||||||||||
|
|
|
|
|
| |||||||||||||||||||
Total | 52,997 | 53,473 | 21,838 | 45,916 | 50,413 | 53,072 | ||||||||||||||||||
|
|
|
|
|
| |||||||||||||||||||
| (1) |
We have a performance-related payOur salary structure is comprised of: (a) fixed payments (base salary and other fixed payments such as legal gratifications, local bonus, company seniority and others, depending on each country’s law and market practice); (b) short term incentives (associated with corporate, area and individual performance), applicable to our ground staff; (c) long term incentives (applicable to our senior executives (Senior Directors and above)).
According to the local law requirements, we make pension and social security contributions on behalf of our employees. Additionally, for our administrative, managementair staff and flight personnel (suchspecialized professionals such as cabin crew members, airportmechanics, we have fixed and sales agents, call-center employees,variable payments, subject to the local collective agreements.
Regarding benefits, we usually provide life insurance and some back office employees) including performance-based bonuses and pay scales that reward foreign language proficiency among counter, technical and administrative personnel. During 2013, 93% of our employees were eligible to receive performance related bonus payments that are linked to personal, team and corporate performance. TAM executives participate in the same program described below. For other employees there is a profit sharing program, which is a variable pay program based on the Company’s financial performance.
We provide our employees with medical insurance, complementary toof the coverage ofprovided by the private health system, andlegal system. We also grant other benefits, such asaccording to local market practice (meal, transportation, maternal and paternal leave, etc.). Additionally, we have a global staff travel program, which grants free and discounted airline tickets to our permanent employees.
A stock option compensation plan is offered to key senior executives. For a detailed description of the stock option compensation plan, please see Note 38 to our audited consolidated financial statements for the fiscal year ended December 31, 2013.
As required by Chilean law, we make obligatory contributions to the privatized pension fund system on behalf of our employees, but we do not maintain any separate program to provide pension, retirement or similar benefits to these or any other employees. However, the pilots’ collective bargaining agreement includes a clause that permits resignation with severance payment, in case a pilot reaches a certain age and is still providing services to the company. In Brazil TAM offers a private pension plan to its executives and pilots.
Long Term Incentive Compensation Program
1. Compensation plan 2011
On December 21, 2016, the subscription and payment period of the 4,800,000 shares corresponding to the compensation plan approved at the Extraordinary Shareholders Meeting held on December 21, 2011 (the “2011 Compensation Plan”), expired. Of the extraordinarytotal shares allocated to the 2011 Compensation Plan, only 10,282 shares were subscribed and paid and were placed on the market in January 2014. At the expiration date, the 2011 Compensation Plan had a balance of 4,789,718 unsubscribed and unpaid shares, which was deducted from the authorized capital of the Company.
2. Compensation plan 2013
At the Extraordinary Shareholders Meeting held on June 11, 2013, the Company’s shareholders meeting approved a capital increase and the allocation of 142,355,8821,500,000 shares to a total of 488,355,791 shares. The same meeting designated 4,800,000 sharescompensation plans for purposes of a proposed employee stock option compensation plan. Those 4,800,000 shares represented a 0.98% of the total share capital after such capital increase. The shareholders’ meeting authorized our board of directors to elaborate the compensation plan. This incentive compensation program is aimed at promoting our interests by encouraging senior management employees to contribute substantially to our success, by motivating them with stock options.
The general features of this stock option plan are:
The selection of employees for participation in the stock option plan was based on, among other criteria that the Board determined at the time of employment with the Company, the position they hold, their importance in earning profits, the responsibility of their position, the amount of equity managed, the ability to work as a team, performance, potential for development and importance within the Company given their education and experience.
As of December 31, 2013, Stock Option Contracts were issued by the Company to 46 employees of the Company and its subsidiaries for a total of 4,497,000 stock options. This stock option plan excludes memberspursuant to Article 24 of the Cueto group, the LATAM Controlling Shareholders, that serve as senior managementChilean Corporations Law. The Company has not defined a date for implementation of the Company. The Company’s shareholders approved the issuance of 1,500,000 shares at the Special Shareholders Meeting held June 11, 2013, among other matters. Those shares will be allocated tothis compensation plans for the employees of the Company and its subsidiaries (the “2013plan yet.
3. Compensation Plan”).plan 2016-2018
The general features of the 2013 Compensation Plan are:
1. The options allocated to each employee shall be exercisable entirely on November 15, 2017, provided the employee continues to workCompany implemented a long-term retention plan for the Company.
2. Employees may exercise such options, after they become exercisable on the aforesaid date, either all at once or in parts. They must subscribe and pay for those shares at once, at the time of subscription, in cash, by check, by bank check, by money transfer or by any other instrument or medium representing cash payable on demand. Partial option exercises cannot be for less than 10% of all options granted to the Employee.
3. The period in which employees must exercise options after they become exercisable, as explained in number 3) above, expires June 11, 2018. If employees have not exercised or waived options in that period, they shall be deemed to have waived the options for all purposes and, accordingly, all rights, powers, promises or offers in relation to the subscription of cash shares in the company shall be deemed extinguished, the employee shall be deemed to have irrevocably waived all rights or powers in relation thereto, and the company shall be released from any obligation.
4. The price payable per share allocated to the 2013 Compensation Plan is US$16.40, if the respective options are exercised, adjusted by the change in the Consumer Price Index (“CPI”) published monthly by the U.S. Department of Labor, starting the first day of the preemptive option period to theexecutives, with an end date of subscriptionDecember 2018 and payment of the shares.a vesting period between October 2018 and March 2019. The subscription price willplan contemplates an extraordinary bonus to be paid in Chilean pesos, converted using the Observed Dollar exchange rate published in the Official Gazettecash, whose calculation formula based on the same date as subscription and paymentvariation of shares.the value of the Company’s shares over a certain period of time.
No options have been granted under the 2013 Compensation Plan.
Training
Some ofFor more information, please see note 34 Note to our employees, such as the flight operations, maintenance and customer ground operations personnel undergo training when they join the Company and throughout their employment with us. We maintain an agreement with CAE (a Canadian firm specializing in flight simulators and training centers) to develop a pilot training center in Santiago de Chile and Sao Paulo. This training center includes Airbus and Boeing Full Flight simulators plus MFTD simulator. Our pilot staff also receives simulator training at sites in the United States.consolidated financial statements.
Our pilots are rated for only one aircraft type by local aeronautical authorities, and they are not cross-qualified between two or more aircraft types. Regulations require pilots to be licensed as commercial pilots for a first officer position and as an airline transport pilot for a captain position, with specific type, function and special ratings for each aircraft to be flown, and to be medically certified as physically fit. Licenses and medical certifications are subject to periodic reevaluation, including flight simulator recurrent training, ground recurrent training, annual emergency procedures training, safety and security training and recent flying experience. Our pilots receive a variety of training, such as lectures, simulations and gaming and computer based training. Cabin crew must have initial and periodic competency fitness training.
Aircraft mechanics and maintenance supervisory personnel must be licensed by the DGAC and other corresponding authorities in other countries in which we operate. We train our technicians (Mechanics, Specialists, Inspectors and Maintenance Supervisors) in all programs required by both local authority (DGAC) and international authorities and aviation associations, such as the FAA, the European Aviation Safety Agency (“EASA”), IATA rules and regulations, those required by aircraft manufacturers and the training needs that we identify during our annual reviews. The program of study contains initial and continuing training. Initial training is level III ATA SPEC 104 and lasts forty to fifty days depending on the aircraft types and continuing training lasts up to five to six days.
During 2013, we continued training sales and administrative personnel in areas such as service and sales quality. We also continued delivering learning programs to develop leadership skills and others with different methodologies including e-learning.
Labor Relations
We believe we generally maintain good relations with our employees and the unions, and expect to continue to enjoy good relations with our employees and the unions in the future. We also believe that we have built a solid base among our employees that
will support and facilitate our growth plans. We can provide no assurance, however, that our employee compensation arrangements may not be subject to change or modification after the expiration of the contracts currently in effect, or that we will not be subject to labor-related disruptions due to strikes, stoppages or walk-outs.
Chile
We have negotiated longer-termAs a general labor relations policy in Chile, we negotiate labor contracts with the labor unions in anticipation of their scheduled expirations, which under Chilean lawexpirations. As anon-negotiable clause, all collective bargaining agreements are limited to a period ofsigned for the maximum legal term, namely, four years. In general, the expiration of our labor agreements with the several unions that represent our pilots and other personnel are staggered in a way that we avoid being in the position of having to renegotiate contract terms with substantially all of our pilots or other personnel at the same time.
During 2013,2016, we renegotiated our collective bargaining agreements with ourthe following unions: Transporte Aéreo (LATAM Airlines Chile) Pilots’ Union, LATAM maintenance union, LATAM airport union, Transporte Aéreo maintenance union and LATAM Cargo administrative union.All these collective agreements will be in force for the maximum legal term.
LATAM Cargo pilots’ union, which will be effective until 2016. Non-unionized pilots havein the same benefits as unionized pilots, throughcontext of a directruled negotiation, rejected the Company’s last offer, and the negotiation ended by in a unilateral extension of the union’s renegotiated agreement. We also negotiated agreements with pilots workingcollective agreement’s validity for our subsidiaries, LAN Express and LAN Cargo, which agreements will also be18 months. Thus, a new negotiation process should take place during the first quarter of 2018.
Ecuador
| • | LATAM:Three employee associations were formed in 2012: of pilots, other general but composed mostly by maintenance employees and other general but composed mostly by employees of airports/administration. In November 2015 the Company signed a voluntary agreement with the association of pilots, in force until July 2019. |
Additionally, in effect until 2016.
We have also entered into or renegotiated collective bargaining agreements with many of our other employees in Chile during 2012, including general airport, maintenance and supply staff of LATAM; administrative staff of LAN Express; and administration staff of LAN Cargo. Each of these agreements is effective for2011 a four-year term, until 2016.
Ecuador
In Ecuador, two employee associations were formed (mechanical and airport/administration) in 2012. These employee associations maintainunion previously exclusive to cabin crew became general. This group maintains relations with the Company, but dodoes not have the right to enter into or negotiate collective bargaining agreements under Ecuador law.
Also in Andes, a unionEcuadorian law because less than 50% of ground handlingour employees has been formed and was legally constituted in 2013. Aseligible for membership are members of today there is no process of negotiations or bargainings agreements with this union.
| • | ANDES:In 2013 two unions of ground handling employees were formed in Andes. These groups maintain relations with the Company, but do not have the right to enter into or negotiate collective bargaining agreements under Ecuadorian law, because less than 50% of our employees eligible for membership are members of each union. Additionally, in 2015 one employees association was formed in Andes. This group also has no right to enter negotiate collective bargaining agreements under Ecuadorian law, because less than 50% of our employees eligible for membership are members of the association. |
Argentina
In Argentina, 75.9% percent of LATAM employees are affiliated in at least in one of nine unions.
In November 2016 we started to negotiate the majority of LAN Argentina’s employees belong to industry-wideannual adjustment for inflation with the seven unions. In December 2013, salary agreements were finalizedJanuary 2017, we reached an agreement with the five unionsunions.
In 2016 we succeeded in LAN Argentina. Theseimplementing the Company’s planned changes to reduce operational labor and overhead costs, without significant protests or union intervention.
Colombia
In Colombia we have 4 different unions. The company held negotiations are held annually.
Peru
LAN Peru is currently negotiating with its cabin crew and maintenance unions,them, as follows: (i) with the Technicians Union (ACMA), in 2014, and it expects to complete thesewill be in force until June of 2018, (ii) With the Cabin Crew Union (ACAV), in 2014, and it will be in force until December of 2018, (iii) with the Industrial Union of Aviation Workers (SINTRATAC), held in June of 2016 and it will be in force until May of 2018, and (iv) in October 2016, an arbitration court ruled that the negotiation with the Pilots Union (ACDAC) will be in force until November 2017.
Peru
LATAM Airlines Peru will begin negotiations and finalize a collective bargaining agreement with eachthe pilots’ union during the second or third quarter of 2014.2016. Negotiations are expected to conclude with a collective agreement in June 2017.In 2017, negotiations will begin with the cabin crew’s union and the aircraft technicians’ union. In Peru we have in total six unions representing workers from different areas: pilots, cabin crew, aircraft technicians, flight dispatchers and airport workers. Our current collective agreements have a term of four years.
Brazil
Under Brazilian law, the validityterm of collective bargaining agreements is limited to two years. TAM’s collective bargaining agreements are valid for one year (for the economic clauses) and for two years (for social clauses). TAM has historically negotiated
collective bargaining agreements with nineten unions in Brazil: Brazil—one crew flight crew union, which represents the functions of flying workers (pilots,pilots, copilots and flight attendants),attendants, and eightnine ground staff unions, which represent TAM employees who perform their duties on the ground in support of TAM’s operations.unions. In December 2013,2016, TAM renegotiated collective bargaining agreements with fiveall the unions, which included a wage increase of 7% for ground workers (ground handling) earning minimum wage, and an increase of 5.6% for other salaried ground workers and flying workers (compared7.4%, in line with anthe inflation rate forof the period of 5.6%). Groundlast 12 mounths. For ground staff workers who earnwith salaries of up to R$10,000 received anten thousand dollars, the increase of 5.6%. Employees who earn more thanwas R$10,000 received an increase of R$560.0. Negotiations with the other four unions are ongoing. However, the Company granted all employees the same rights accorded the five unions that signed collective bargaining agreements. Although 92% of wage negotiations in Brazil have resulted in real wage increase greater than inflation, we believe that the wage increases granted to our employees has been positive for the Company, since the majority of employee wage increases were within the rate of inflation. During these negotiations there were no strikes or labor stoppages. 739.00.
E. Share Ownership
As of MarchDecember 31, 2014,2016, the members of our Board of Directors and our executive officers as a group own 48.77%owned 47.7% of our shares. See “Item 7. Controlling Shareholders and Related Party Transactions.”
For a description of stock options granted to our executive officers, see “—D. Employees—Long Term Incentive Compensation Program.”
| ITEM 7. | CONTROLLING SHAREHOLDERS AND RELATED PARTY TRANSACTIONS |
A. Major Shareholders
The Cueto Group is LATAM’s controlling shareholder and it is comprised by Mr. Juan José Cueto Plaza (one of our directors), Mr. Ignacio Cueto Plaza (the CEO of LAN), Mr. Enrique Cueto Plaza (the CEO LATAM) and certain other Cueto family members.members and entities controlled by them, comprise the Cueto Group. As of MarchJanuary 31, 2014,2017 the Cueto Group beneficially owned 25.49%(as defined in Rule13d-3 under the Securities Exchange Act) 28.27% of LATAM Airlines Group’s common shares. The Cueto Group is entitled to elect three of the nine members of our board of directors and is in a position to direct the management of the Company. TheIn connection with our combination with TAM, members of the Cueto Group which(which we also refer to collectively as the “LATAM controlling shareholders,” haveControlling Shareholders”) entered into a shareholder’s agreement with LATAM,the Amaro Family, acting through TEP Chile, and the TAM controlling shareholders.TEP Chile entered into shareholder’s agreements with LATAM and TAM. See “—Shareholders’ Agreements.”
Following our combination with TAM, the Amaro Group is also a major shareholder of LATAM Airlines Group. The Amaro Group, which we also refer to as the “TAM controlling shareholders,” are controlling shareholders of TAM, throughThrough their 100% ownership of TEP Chile and majority ownership of the voting shares of Holdco I, voting shares, which in turn owns 100% of the common shares of TAM,the Amaro Group, are controlling shareholders of TAM. TheThis is the case even though LATAM is entitled to substantially all the economic rights arising from the operations of TAM by virtue of LATAM’s ownership of 100% of Holdco I and TAMnon-voting shares. Members of the Amaro Group’s membersGroup’ include our chairman, Mauricio Rolim Amaro and our former director Maria Claudia Amaro. As of MarchJanuary 31, 2014,2017, the Amaro Group owned 12.01%3.02%(2) of LATAM Airlines Group’s common shares. The terms of the shareholders’ agreement among the Amaro Group, has entered into a shareholder’s agreement with LATAM and the LATAM controlling shareholders. The terms of this shareholder agreementControlling Shareholders require the LATAM controlling shareholdersControlling Shareholders and the Amaro Group to vote to elect individuals nominated by TEP Chile as members ofto our board of directors.directors in accordance with the direct and indirect shareholder interests in LATAM. See “—Shareholders’ Agreements.”
In addition to thesethe Cueto Group and the Amaro Group, three other groups or entities are major shareholders there are two other major shareholder groups.of LATAM. As of MarchJanuary 31, 2014, the Bethia Group, which includes our director Carlos Heller Solari, owned 6.14% of our common shares and2017, the Eblen Group, which includes our director Ramón Eblen Cádiz, owned 5.12%5.93% of our common shares; the Bethia Group, which includes our director Carlos Heller Solari, owned 5.50% of our common shares; and Qatar Airways Investments (UK) Ltd., whose nominee Giles Agutter became one of our directors effective January 24, 2017, owned 10.03%(4)of our outstanding common shares.
The table below sets forth additional information regarding the beneficial owners, as of March 31, 2014,ownership of our common shares, includingas of January 31, 2017, by our controlling shareholders, other major shareholders or shareholder groups, and minority shareholders.
| Beneficial ownership (as of March 31, 2014) | ||||||||
| Number of shares of common stock beneficially owned | Percentage of common stock beneficially owned | |||||||
Shareholder | ||||||||
Cueto Group | 139,089,517 | 25.49 | % | |||||
Costa Verde Aeronautica S.A. | 86,386,914 | 15.83 | % | |||||
Inversiones Nueva Costa Verde Aeronautica Ltda. | 22,314,277 | 4.19 | % | |||||
Costa Verde Aeronautica SpA | 20,000,000 | 3.67 | % | |||||
Others | 10.388.326 | 1.8 | % | |||||
Amaro Group | 65,554,075 | 12.01 | % | |||||
TEP Chile S.A. | 65,554,075 | 12.01 | % | |||||
Bethia Group. | 33,501,357 | 6.14 | % | |||||
Axxion S.A. | 18,473,333 | 3.38 | % | |||||
Inversiones HS SpA. | 15,028,024 | 2.75 | % | |||||
Eblen Group. | 27.945.199 | 5.12 | % | |||||
Inversiones Andes S.A. | 17,146,529 | 3.14 | % | |||||
Inversiones Los Guindos S.A. | 5,394,866 | 0.98 | % | |||||
Inversiones Alcalá S.A. | 5,403,804 | 0.99 | % | |||||
All other minority shareholders | 279.467.953 | 51.23 | % | |||||
|
|
|
| |||||
Total | 545.558.101 | 100.00 | % | |||||
|
|
|
| |||||
| Beneficial ownership (as of January 31, 2017) | ||||||||
| Number of shares of common stock beneficially owned | Percentage of common stock beneficially owned | |||||||
Shareholder | ||||||||
Cueto Group(1) | 171,430,090 | 28.27 | % | |||||
Costa Verde Aeronautica S.A(2) (3) | 90,427,620 | 14.91 | % | |||||
Inversiones Costa Verde Aeronautica Tres SpA | 35,300,000 | 5.82 | % | |||||
Inversiones Nueva Costa Verde Aeronautica Ltda. | 23,578,077 | 3.89 | % | |||||
Costa Verde Aeronautica SpA | 12,000,000 | 1.98 | % | |||||
Others | 10,124,393 | 1.67 | % | |||||
Qatar Airways(4) | 60,837,452 | 10.03 | % | |||||
Qatar Airways Investments (UK) Ltda. Eblen Group. Inversiones Andes SpA. Inversiones Andes II SpA Inversiones PIA SpA. Comercial las Vertientes SpA Bethia Group. Axxion S.A. Inversiones HS SpA. Amaro Group(2)(3) TEP Chile S.A. All other minority shareholders Total Beneficial ownership
(as of January 31, 2017) Number of shares
of common stock
beneficially owned Percentage of
common stock
beneficially owned 60,837,452 10.03 % 35,945,199 5.93 % 17,146,529 2.83 % 8,000,000 1.32 % 5,403,804 0.89 % 5,394,866 0.89 % 33,367,357 5.50 % 18,473,333 3.05 % 14,894,024 2.45 % 18,342,913 3.02 % 18,342,913 3.02 % 288,484,682 47.24 % 606,407,693 100.00 %
| (1) | The ownership figures for the Cueto Group in this table exclude shares held directly by TEP Chile S.A. which are subject to the shareholders’ agreements described below. |
| (2) | Members of the Amaro Group also hold a 21.88% interest in Costa Verde Aeronáutica S.A. |
| (3) | The ownership figures for the Amaro Group in this table exclude shares held by the Cueto Group which are subject to the shareholders’ agreements described below. |
| (4) | Qatar owns 9.999999918% of the total issued shares of LATAM. |
As of MarchJanuary 31, 2014, investors outside of Chile held 8.63%2017, 4.55% of our capital stock was held in the form of ADSs, and 0.71% in the form of BDSs.ADSs. Chilean pension funds held 16.13%19.41% of our capital stock and other minority investors held 25.76%23.28% in the form of common shares. It is not practicable for us to determine the number of ADSs or common shares beneficially owned in the United States. As of MarchJanuary 31, 2014,2017, we had 1,6541,585 record holders of our common shares. It is not practicable for us to determine the portion of shares held in Chile or the number of record holders in Chile. All of our shareholders have identical voting rights.
Shareholders’ Agreements
As described above under “Item 4. Information on the Company—A. History and Development of the Company—Combination of LAN and TAM,” following the combination of LAN and TAM in June 2012, TAM S.A. continues to exist as a subsidiary of Holdco I and a subsidiary of LATAM, and LAN Airlines S.A. has been redesignated as “LATAM Airlines Group S.A.”
Prior to the consummation of the business combination, LATAM Airlines Group and the LATAM controlling shareholdersControlling Shareholders entered into several shareholdersshareholders’ agreements with TAM, the TAM controlling shareholdersAmaro Group (acting through TEP Chile) and Holdco I, that establishestablishing agreements and restrictions relating to corporate governance in an attempt to balance LATAM Airlines Group’s interests, as the owner of substantially all of the economic rights in TAM, and those of the TAM controlling shareholders,Amaro Group, as the continuing controlling shareholders of TAM under Brazilian law, by prohibiting the taking of certain specified material corporate actions and decisions without prior supermajority approval of the shareholders and/or the board of directors of Holdco I or TAM. These shareholdershareholders’ agreements also set forth the parties’ agreement regarding the governance and management of the LATAM Airlines Group following the consummation of the business combination of LAN and TAM.
Governance and Management of LATAM Airlines Group
We refer to the shareholdersshareholders’ agreement among the LATAM controlling shareholdersControlling Shareholders and the Amaro Group (acting through TEP Chile,Chile), which sets forth the parties’ agreement concerning the governance, management and operation of the LATAM Airlines Group, and voting and transfer of their respective LATAM Airlines Group common shares and TEP Chile’s voting shares of Holdco I,
as the “control group shareholdersshareholders’ agreement.” We refer to the shareholdersshareholders’ agreement between usLATAM Airlines Group S.A. and TEP Chile, which sets forth our agreementagreements concerning the governance, management and operation of the LATAM Airlines Group, as the “LATAM AirlinesGroup-TEP shareholders shareholders’ agreement.” The control group shareholdersshareholders’ agreement and the LATAM AirlinesGroup-TEP shareholders shareholders’ agreement set forth the parties’ agreement on the governance and management of the LATAM Airlines Group following the effective time.
This section describes the key provisions of the control group shareholdersshareholders’ agreement and the LATAM AirlinesGroup-TEP shareholders shareholders’ agreement. The rights and obligations of the parties to the control group shareholders agreement and the LATAM Airlines Group-TEP shareholders agreement are governed by the express terms and conditions of the aforementioned shareholders agreements and not by this summary or any other information contained in this annual report on Form 20-F. The description of these control group shareholders agreement and the LATAM AirlinesGroup-TEP shareholders shareholders’ agreement summarized below and elsewhere in this annual report on Form20-F are is qualified in theirits entirety by reference to the full text of the aforementioned shareholders agreements,such shareholders’ agreement, which are incorporated by reference intohas been filed as exhibit to this annual report on Form20-F. For a full understanding of these agreements, we advise you to read these agreements carefully and in their entirety.
Composition of the LATAM Airlines Group Board
Mr. Maurício Rolim Amaro and Maria Cláudia Oliveira Amaro were electedwas reelected to the LATAM Airlines Group board of directors in June 2012April 2014 and confirmed as directors at a special meeting of the shareholders of LATAM held on September 4, 2012 in which the entire LATAM Airlines Group board of directors was reelected or replaced. Mr. Maurício Rolim Amaro was appointed chairman of LATAM Airlines Group’s board of directors for the first two years following such shareholders’ meeting.April 2015. If Mr. Amaro vacates this position for any reason within that two-year period,before April 2017, TEP Chile has the right to select a replacement to complete his term. Thereafter, LATAM Airlines Group’s board of directors will appoint any of its members as the chairman of LATAM Airlines Group’s board of directors, from time to time, in accordance with the LATAM Airlines Group’sby-laws. Mrs. Maria Cláudia Oliveira Amaro was elected to the LATAM Airlines Group board of directors in June 2012, and resigned this position in September 2014. Also in September 2014, pursuant to Chilean law, Mr. Henri Philippe Reichstul was appointed by the board to fill her seat until the next general shareholders meeting. Mr. Reichstul wasre-elected to the board in April 2015.
Management of the LATAM Airlines Group
As of June 2012,Mr. Enrique Cueto Plaza became thehas served as CEO of LATAM or the (“CEO LATAM”). since June 2012. The CEO LATAM is the highest ranked officer of the LATAM Airlines Group and reports directly to the LATAM board of directors. The CEO LATAM is charged with the general supervision, direction and control of the business of the LATAM Airlines Group and certain other responsibilities set forth in the LATAM AirlinesGroup-TEP shareholders shareholders’ agreement. After any departure of the current CEO LATAM, our board of directors will select his or her successor after receiving the recommendation of the Leadership Committee.
As of June 2012,Mr. Ignacio Cueto Plaza became thehas served as CEO of LAN or the “CEO LAN.”(“CEO LAN”) since June 2012. The CEO LAN reports directly to the CEO LATAM and has general supervision, direction and control of the passenger and cargo operations of the LATAM Airlines Group, excluding those conducted by Holdco I, TAM and its subsidiaries,affiliates, and the international passenger business of the LATAM Airlines Group. The CEO LAN, together with Marco Antonia Bologna,Mrs. Claudia Sender, the current the CEO of TAM (“CEO TAM”), are responsible for recommending a candidate to the CEO LATAM to serve as the head of the international passenger business of the LATAM Airlines Group (including both long haul and regional operations), who shall report jointly to the CEO LAN and the CEO TAM. The key executives of the LATAM Airlines Group (other than the CEO LATAM and those in the TAM Group) will be appointed by, and will report, directly or indirectly, to the CEO LATAM. Mr. Cueto will leave the Company’s senior management team inmid-April 2017 and is applying to become a member of LATAM’s board of directors.
The head office of the LATAM Airlines Group continues to be located in Santiago, Chile.
Governance and Management of Holdco I and TAM
We refer to the shareholdersshareholders’ agreement between us, Holdco I and TEP Chile, which sets forth our agreement concerning the governance, management and operation of Holdco I, and voting and transfer of voting shares of Holdco I, as the “Holdco I shareholdersshareholders’ agreement” and to the shareholdersshareholders’ agreement between us, Holdco I, TAM and TEP Chile, which sets forth our agreement concerning the governance, management and operation of TAM and its subsidiaries following the effective time, as the “TAM shareholdersshareholders’ agreement.” The Holdco I shareholdersshareholders’ agreement and the TAM shareholdersshareholders’ agreement set forth the parties’ agreement on the governance and management of Holdco I, TAM and its subsidiaries (collectively, the “TAM Group”) following the business combination of LAN and TAM.
This section describes the key provisions of the Holdco I shareholdersshareholders’ agreement and the TAM shareholdersshareholders’ agreement. The rights and obligationsdescription of the parties to the Holdco I shareholdersshareholders’ agreement and the TAM shareholders agreement are governed by the express terms and conditions of the aforementioned shareholders agreements and not by this summary or any other information contained in this annual report on Form 20-F. The description of these Holdco I shareholders agreement and the TAM shareholdersshareholders’ agreement summarized below and elsewhere in this annual report on Form20-F are qualified in their entirety by reference to the full text of the aforementioned shareholdersshareholders’ agreements, which are incorporated by reference intohave been filed as exhibits to this annual report on Form20-F. For a full understanding of these agreements, we advise you to read these agreements carefully and in their entirety.
Composition of the Holdco I and TAM Boards
The Holdco I shareholdersshareholders’ agreement and TAM shareholdersshareholders’ agreement generally provide for identical boards of directors and the same chief executive officer at Holdco I and TAM, with LATAM appointing two directors and TEP Chile appointing four directors (including the chairman of the board of directors). From September 2012 to September 2014, the chairman of the Holdco I and TAM boards of directors will be Maria Cláudia Oliveira Amaro.
The control group shareholdersshareholders’ agreement provides that the persons elected by or on behalf of the LATAM controlling shareholdersControlling Shareholders or the TAM controlling shareholdersAmaro Group to our board of directors must also serve on the boards of directors of both Holdco I and TAM.
Management of Holdco I and TAM
Theday-to-day business and affairs of Holdco I will be managed by the TAM Group CEO under the oversight of the board of directors of Holdco I. Theday-to-day business and affairs of TAM will be managed by theTAM Diretoria under the oversight of the board of directors of TAM. The “TAM Diretoria” will be comprised of the TAM Group CEO, the TAM CFO, the TAM COO and the TAM CCO. Marco Bologna,CCO, currently the CEO of TAM, will be the initial CEO of Holdco I and TAM, or the “TAM Group CEO” and any successor CEO will be selected by usLATAM from three candidates proposed by TEP Chile. The TAM Group CEO will have general supervision, direction and control of the business and operations of the TAM Group (other than the international passenger business of the LATAM Airlines Group) and will carry out all orders and resolutions of the board of directors of TAM. The initial chief financial officer of TAM, or the “TAM CFO,” has been jointly selected by usLATAM and TEP Chile and any successor CFO will be selected by TEP Chile from three candidates proposed by us.LATAM. The chief operating officer of TAM, or the “TAM COO,” and chief commercial officer of TAM, or the “TAM CCO,” will be jointly selected and recommended to the TAM board of directors by the TAM Group CEO and TAM CFO and approved by the TAM board of directors. These shareholdersshareholders’ agreements also regulate the composition of the boards of directors of subsidiaries of TAM.
Following the combination, TAM continues to be headquartered in São Paulo, Brazil.
Supermajority Actions
Certain actions by Holdco I or TAM require supermajority approval by the board of directors or the shareholders of Holdco I or TAM which effectively require the approval of both LATAM and TEP Chile before the specified actions can be taken. Actions that require supermajority approval of the Holdco I board of directors or the TAM board of directors include, as applicable:
Actions requiring supermajority shareholder approval include:
Voting Agreements, Transfers and Other Arrangements
Voting Agreements
The LATAM controlling shareholdersControlling Shareholders and TEP Chile have agreed in the control group shareholders agreement to vote their respective LATAM Airlines Group common shares as follows:
The number of “exempted shares” of TEP Chile means that number of LATAM Airlines Group common shares which TEP Chile owns immediately after the effective time in excess of 12.5% of the outstanding LATAM Airlines Group common shares at such time as determined on a fully diluted basis.
The parties to the Holdco I shareholders agreement and TAM shareholders agreement have agreed to vote their voting shares of Holdco I and shares of TAM so as to give effect to the agreements with respect to representation on the TAM board of directors discussed above.
Transfer Restrictions
Pursuant to the control group shareholdersshareholders’ agreement, the LATAM Airlines Group controlling shareholdersControlling Shareholders and TEP Chile are subject to certain restrictions on sales, transfers and pledges of the LATAM Airlines Group common shares and (in the case of TEP Chile only) the voting shares of Holdco I beneficially owned by them. Except for a limited amount of LATAM Airlines Group common shares, neither the LATAM Airlines Group controlling shareholders nor TEP Chile maywere permitted to sell any of itstheir LATAM Airlines Group common shares, and TEP Chile maywas not permitted to sell its voting shares of Holdco I, until June 2015. Thereafter,Since then, sales of
LATAM Airlines Group common shares by either party are permitted, subject to (i) certain limitations on the volume and frequency of such sales and (ii) in the case of TEP Chile only, TEP Chile satisfying certain minimum ownership requirements. After June 2022,On or after December 31, 2021, TEP Chile may sell all of its LATAM Airlines Group common shares and voting shares of Holdco I as a block, subject to (x) approval of the transferee by the LATAM board of directors, (y) the condition that the sale not have an adverse effect and (z) a right of first offer in favor of the LATAM Airlines Group controlling shareholders, which we refer to collectively as “block sale provisions.” An “adverse effect” is defined in the control group shareholders agreement to mean a material adverse effect on our and Holdco I’s ability to own or receive the full benefits of ownership of TAM and its subsidiaries or the ability of TAM and its subsidiaries to operate their airline businesses worldwide. The LATAM Airlines Group controlling shareholders have agreed to transfer any voting shares of Holdco I acquired pursuant to such right of first offer to usLATAM for the same consideration paid for such shares.
In addition, TEP Chile may sell all LATAM Airlines Group common shares and voting shares of Holdco I beneficially owned by it as a block, subject to satisfaction of the block sale provisions, after June 2015December 21, 2021 if a release event (as described below) occurs or if TEP Chile is required to make two or more directed votes during any24-month period at two meetings (consecutive or not) of the shareholders of LATAM Airlines Group held at least 12 months apart and LATAM Airlines Group has not yet fully exercised its conversion option described below. A “release event” will occur if (i) a capital increase of LATAM Airlines Group occurs, (ii) TEP Chile does not fully exercise the preemptive rights granted to it under applicable law in Chile with respect to such capital increase in respect of all of its restricted LATAM Airlines Group common shares, and (iii) after such capital increase is completed, the individual designated by TEP Chile for election to the board of directors of LATAM Airlines Group with the assistance of the LATAM Airlines Group controlling shareholders is not elected to the board of directors of LATAM Airlines Group.
In addition, after June 2022December 31, 2021 and after the occurrence of the full ownership trigger date (as described below under the “—Conversion Option”) section), TEP Chile may sell all or any portion of its LATAM Airlines Group common shares, subject to (x) a right of first offer in favor of the LATAM Airlines Group controlling shareholders and (y) the restrictions on sales of LATAM Airlines Group common shares more than once in a12-month period.
The control group shareholders agreement provides certain exceptions to these restrictions on transfer for certain pledges of LATAM Airlines Group common shares made by the parties and for transfers to affiliates, in each case under certain limited circumstances.
In addition, TEP Chile agreed in the Holdco I shareholders agreement not to vote its voting shares of Holdco I, or to take any other action, in support of any transfer by Holdco I of any equity securities or convertible securities issued by it or by any of TAM or its subsidiaries without our prior written consent.
Restriction on transfer of TAM shares
WeLATAM agreed in the Holdco I shareholdersshareholders’ agreement not to sell or transfer any shares of TAM stock to any person (other than our affiliates) at any time when TEP Chile owns any voting shares of Holdco I. However, weLATAM will have the right to effect such a sale or transfer if, at the same time as such sale or transfer, weLATAM (or ourits assignee) acquires all the voting shares of Holdco I beneficially owned by TEP Chile for an amount equal to TEP Chile’s then current tax basis in such shares and any costs TEP Chile is required to incur to effect such sale or transfer. TEP Chile has irrevocably granted us the assignable right to purchase all of the voting shares of Holdco I beneficially owned by TEP Chile in connection with any such sale.
Conversion Option
Pursuant to the control group shareholdersshareholders’ agreement and the Holdco I shareholdersshareholders’ agreement, we have the unilateral right to convert our shares ofnon-voting stock of Holdco I into shares of voting stock of Holdco I to the maximum extent allowed under law and to increase our representation on the TAM and Holdco I boards of directors if and when permitted in accordance with foreign ownership control laws in Brazil and other applicable laws if the conversion would not have an adverse effect (as defined above under the “—Transfer Restrictions”) section).
On or after June 2022,December 31, 2021, and after we have fully converted all of our shares ofnon-voting stock of Holdco I into shares of voting stock of Holdco I as permitted by Brazilian law and other applicable laws, we will have the right to purchase all of the voting shares of Holdco I held by the controlling shareholders of TAM for an amount equal to their then current tax basis in such shares and any costs incurred by them to effect such sale, which amount we refer to as the “sale consideration.” If we do not timely exercise our right to purchase these shares or if, after June 2022,December 31, 2021, we have the right under applicable law in Brazil and other applicable law to fully convert all the shares ofnon-voting stock of Holdco I beneficially owned by us into shares of voting stock of Holdco I and such conversion would not have an adverse effect but we have not fully exercised such right within a specified period, then the controlling shareholders of TAM will have the right to put their shares of voting stock of Holdco I to us for an amount equal to the sale consideration.
Acquisitions of TAM Stock
The parties have agreed that all acquisitions of TAM common shares by LATAM Airlines Group, Holdco I, TAM or any of their respective subsidiaries from and after the effective time of the business combination will be made by Holdco I.
B. Related Party Transactions
General
We have engaged in a variety of transactions with our affiliates, including entities owned or controlled by certain of our controlling shareholders. In the ordinary course of our business we render to and receive from related companies services of various types, including aircraft leases, aircraft interchanges, freight transportation and reservation services.
It is our policy not to engage in any transaction with or for the benefit of any shareholder or member of the board of directors, or any entity controlled by such a person or in which such a person has a substantial economic interest, unless the transaction is related to our business and the price and other terms are at least as favorable to us as those that could be obtained on an arm’s-length basis from a third party. Such transactions, none of which is individually material, are summarized in Note 35 to our audited consolidated financial statements for the fiscal year ended December 31, 2013.2016.
On August 2, 2016, the Board of Directors recently approved the Policy on Control of Related-Party Transactions of LATAM Airlines Group S.A. and its subsidiaries, which states:
| ITEM 8. | FINANCIAL INFORMATION |
A. Consolidated Financial Statements and Other Financial Information
See “Item 3. Key Information—A. Selected Financial Data,” “Item 18. Financial Statements” and pagesF-1 through F-219.F-194.
Legal and Arbitration Proceedings
We are involved in routine litigation and other proceedings relating to the ordinary course of our business. The following is a description of all the material legal and arbitration proceedings.
In February 2006 the European Commission (“EC”), in conjunction with the Department of Justice of the United States (“DOJ”), the Canadian Competition Bureau (“CCB”), and Conselho Administrativo de Defesa Econômica (“CADE”), among others, initiated a global investigation of a large number of international cargo airlines (among them LAN Cargo) for possible price fixing of cargo fuel surcharges and other fees in the European and United States air cargo markets. On December 26, 2007, the European competition authorities notifiedAs previously announced, LAN Cargo and LATAM of the initiation of proceedings against twenty-five cargo airlines, among them LAN Cargo, for allegations of anti-competitive behavior in the airfreight business.
On January 21, 2009, LAN Cargo announced that it had reached a plea agreement with the DOJ in relation to the DOJ’s ongoing investigation regarding price fixing of fuel surcharges and other fees for cargo shipments. Under the plea agreement, LAN Cargo agreed to pay a fine of US$88 million. In addition, ABSA also reached a plea agreementagreements with the DOJ and agreedthe CCB, which included the payment of fines, in relation to pay a fine of US$21 million. These amounts were stipulated to be paid over a five-year payment schedule starting in 2009. As of December 31, 2013, the pending amount to be paid during the next year is approximately US$18 million and has been recorded within “Other Accounts Payable.” As of March 31, 2014 there is no amount remaining to be paid.
such investigation. On November 9, 2010, the EC imposed fines on 11 air carriers for a total amount of €800€799.4 million (equivalent to approximately US$1.1 billion). The fine imposed against LAN Cargo and its parent company, LAN, totaled €8.2 million (equivalent to approximately US$10.9 million). The CompanyLAN provisioned US$25 million during the fourth quarter of 2007 for such fines, and maintained this provision until the fine was imposed in 2010. In 2010, the CompanyLAN recorded a US$14.1 million gain(pre-tax) from the reversal of a portion of this provision. See “Item 5. Operating and Financial Review and Prospects—Operating Results.” This was the lowest fine applied by the EC, which includes a significant reduction due to the Company’sLAN’s cooperation with the Commission during the course of the investigation. In accordance with European Union law, on January 24, 2011 this administrative decision was appealed by LAN Cargo and LAN to the General Court in Luxembourg. Any judgment by the General Court may also be appealed to the Court of Justice of the European Union.
The investigationEuropean Court of Justice overtuned the Commission’s decision on December 16, 2015. On May 20 2016 the EC confirmed that they have decided not to appeal the case and to issue a new decision with the aim of correcting the faults identified in the judgement by the DOJ promptedEuropean Court of Justice. On 17 March 2017, the filing of numerous civil class actions by freight forwardingECre-adopted its decision and shipping companies against many airlines, includingimposed on LAN Cargo and its parent company, LATAM, Airlines Group, including fifty-foura fine in the United States. The cases filed in the United States were consolidated in the United States District Court, Eastern District of New York andsame amount, €8.2 million, as the original complaint was subsequently amended to include additional airlines, including ABSA. On May 11, 2011, LAN Cargo announced that it had reached a settlement agreement with the class action plaintiffs in relation to this litigation. As per the settlement agreement, LAN Cargo agreed to pay US$59.7 million. Furthermore, ABSA also reached a settlement agreement with class action plaintiffs and agreed to pay US$6.3 million. The amounts were paid to plaintiffs’ counsel escrow account in 2011. DHL, a former member of the civil class action plaintiffs, timely opted out of the settlements agreement. LAN Cargo recently reached a settlement agreement with StarBroker A.G., on behalf of DHL Global Forwarding, whereby LAN Cargo agreed to pay US$8.2 million, of which US$7.1 million was shall be recovered by LAN Cargo from the escrow amount set aside in the class action settlement previously paid by LAN Cargo for opt out plaintiffs.fine.
The Canadian Competition Bureau (“CCB”), in conjunction with the DOJ, also initiated a global investigation of a large number of international cargo airlines (among them LAN Cargo) for possible price fixing of cargo fuel surcharges and other fees in the Canadian air cargo markets in 2006. On August 20, 2013, LAN Cargo reached a plea agreement with the CCB in relation to the CCB’s ongoing investigation regarding price fixing of fuel surcharges and other fees for cargo shipments. Under the plea agreement, LAN Cargo agreed to pay a fine of US$975,000.000. The CCB’s investigation prompted the filing of four separate civil class actions by freight forwarding and shipping companies against many airlines, including LAN Cargo and LAN, in Canada. On January 31, 2012, LAN and LAN Cargo approved a settlement agreement with the class actions plaintiffs for an amount of CAD$700,000 (Canadian Dollars), which is pending court approval.
On April 5, 2008, Brazilian authorities notified ABSA of the initiation of administrative proceedings before the Conselho Administrativo de Defesa Econômica (CADEthe Brazilian Antitrust Authority) against several cargo airlines and airline officers, among them ABSA, for allegations of anticompetitive practices regarding fuel surcharges in the air cargo business. On September 3, 2013, CADE published its decision to impose a fine of US$51,02051.0 million against ABSA.ABSA, after an investigation, commenced in 2008, against several cargo airlines and airlines officers over allegations of anticompetitive practices regarding fuel surcharges in the air cargo business. CADE also imposed fines upon a former Director and two former employees in the amounts of US$1.0201.0 million and US$510,000.00510,000 respectively. On December 5, 2013 ABSA filed its application for Administrative Reconsideration before CADE. On December 19, 2014, CADE issued a new decision which remains pending.reduced the fine against ABSA willto US$15,382,082 (based on an exchange rate of US$ 1 = R$ 3.2591). CADE also havereduced the rightfines against ABSA’s Director and employees to US$251,616 and US$125,800, respectively (also based on an exchange rate of US$ 1 = R$ 3.2591). ABSA has initiated a judicial appeal against the final decision of CADE before Judge in a formal judicial proceeding. Given the current stageUnion Federal seeking an additional reduction of the proceedings, it is not possible at this time to anticipate with any precisionfine amount. In the light of said pending judicial appeal, we cannot predict the ultimate outcome of this matter althoughat this time.
The investigations by the DOJ, CCB and the EC prompted the filing of civil actions and claims by freight forwarding and shipping companies against many airlines, including LAN Cargo and LATAM Airlines Group. LAN Cargo and ABSA reached a settlement agreement with the class action plaintiffs /non-class action claimants in the United States on August 6, 2012, and in Canada on August 20, 2013.
Civil actions have also been initiated against many airlines, including LAN Cargo and LATAM Airlines Group, in various European countries (Great Britain, Norway, Holland and Germany). The activity and progress of said civil actions is limited, in that they are now directly contingent upon the decision of the EC to issue a new decision correcting the faults identified in the judgement. We cannot predict the ultimate outcome of these cases at this time.
Agreements with the DOJ and the SEC. In 2011, authorities in Chile and the United States initiated investigations relating to certain payments by LATAM Airlines Group S.A. (formerly LAN Airlines S.A.) to a consultant who assisted in the resolution of labor issues in Argentina in 2006-2007. The Company voluntarily reported this situation to the Securities and Exchange Commission (“SEC”) and the Justice Department of the United States (“DOJ”) and actively cooperated in those investigations. On February 4, 2016, Ignacio Cueto, the CEO of LAN, consented to entry of acease-and-desist order by the SEC relating to the payments described above. Mr. Cueto agreed to pay a US$75,000 penalty to the SEC, to remain in compliance with LATAM’s compliance structure and internal accounting controls and to comply with the SEC’s books and records requirements. In July 2016, after multiple and prolonged exchanges of opinions and conversations with the DOJ and the SEC, LATAM also reached definitive agreements with both authorities.
In the case of the DOJ, the agreement took the form of a Deferred Prosecution Agreement (“DPA”), pursuant to which the DOJ will dismiss the charges after the expiration of a three-year period if LATAM complies with all terms of the DPA. Pursuant to the DPA, LATAM has admitted that the accounting for the payments made to the consultant in Argentina was incorrect and that, at the time that such payments were made (2006-2007), it lacked adequate internal controls. LATAM has also accepted an independent consultant, for 27 months, whose function will be to monitor, evaluate, and report to the DOJ on the effectiveness of LATAM’s compliance program. LATAM also committed to reporting to the DOJ on the effectiveness of the aforementioned compliance program for 9 months after the work of the independent consultant is expectedfinished. Lastly, LATAM also agreed to bepay a lengthy process.fine of US$12,750,000 to the DOJ.
The settlement with the SEC included the issuance by the SEC of acease-and-desist order, which is an administrative order closing the investigation whereby LATAM has accepted certain obligations and statements of fact. The order also refers to the obligations related to the monitorship agreed under the DPA with the DOJ. LATAM also agreed to pay an amount of US$6,700,000 plus interest to the SEC. As of December 31, 2016, a balance of US$ 4,718,894 was payable to the SEC. .
Legal proceedings involving TAM
TAM Linhas Aéreas is party to 1one action filed by relatives of victims of an accident that occurred in October 1996 involving one of its Fokker 100 aircraft which crashed during departure, in addition to 22 actions filed by residents of the region of where the accident occurred, who are claiming pain and suffering, and a class action related to this crash. Any damages resulting from the aforementioned legal claims are covered by the civil liability guarantee provided for in TAM’s insurance policy with ItaúUnibancoSeguros Unibanco Seguros S.A. We believe that the cap of U.S.$ US$400 million in that insurance policy is sufficient to cover any potential penalties and judicial or extrajudicial agreements arising as a result of this matter.
Insurance coverage has been sufficient to cover the liabilities arising from an accident that occurred in July 2007 involving an Airbus A320 aircraft from TAM Linhas Aereas. Settlements have been made directly between the insurance company and the victims’ families. As of December 31, 2013, approximately 196 settlements have occurred and others are under negotiation between the insurance company and victims’ families. Management believes that the insurance coverage is adequate and that TAM will not incur any expenses that were not contemplated by the scope of the insurance policy that would result in TAM’s obligation to pay damages.
TAM Linhas Aereas challenged the constitutionality of a change in the tax basis of the PIS and the increase in the contribution and basis calculation of COFINS, introduced under Law No. 9.718/98. On November 9, 2005, the Brazilian Supreme Court of Justice ruled that the change in the tax basis of the PIS was unconstitutional. During 2006, TAM Linhas Aereas was successful in obtaining one favorable ruling which enabled TAM to partially reverse a tax assessment of R$46. In November 2009, Brazil established the Fiscal Recovery Program (“REFIS”) to refund amounts previously required under Law No. 9.718/98. TAM Linhas Aéreas has applied to REFIS to settle its outstanding tax assessments relating to Law No. 9.718/98.
Proceedings had been filed against TAM LinhasAéreas concerning the alleged failure to pay ICMS due on imported aircraft, parts and engines. In response, TAM had filed the appropriate challenges on the basis that ICMS should not be payable on leased aircraft. On May 30, 2007, theSupremo Tribunal Federal (Federal Supreme Court) ruled in TAM’s favor in respect of one of these cases. On the basis of this precedent decision and of recent rulings of the Superior Tribunal of Justice, we believe our chance of loss in respect of the other pending cases is remote. We had not established any provisions for the amounts in question.
TAM Linhas Aereas filed an ordinary action with a request for injunctive relief fornon-payment of the Airline Workers Fund, a tax charged monthly at the rate of 2.5% of an airline’s total payroll. Payment of the tax credit is suspended by virtue of the injunctive relief granted in TAM’s favor. Currently, judgment is pending on an appeal that TAM lodged challenging the initial decision (which was ruled in favor of the INSS)Brazilian National Institute of Social Security (“INSS”)). In 2004 and 2011, the INSS issued an assessment notice tolling the Statute of Limitations of the social security credit as a result of TAM Linhas Aereas’non-payment of the Airline Workers Fund. The administrative proceedings have been suspended until completion of the judicial process. The approximate adjusted value of this proceeding as of December 31, 2012 was R$ 271US$43.3 million. In the opinion of our legal advisors, the chance of losing in this proceeding is possible. Assuming payment of this tax is required by law, we have established a provision in the amount of R$271US$43.3 million pending the final outcome of the matter.
TAM Linhas Aereas is a plaintiff in an action filed against the Brazilian government in 1993 seeking damages for thebreak-up of an air transporttransportation concession agreement that resulted in the freezing of TAM’s prices from 1988 to September 1993 in order to maintain operations with the prices set by the Brazilian government during that period. The process is currently being heard before the Federal Regional Court and judgment is pending an appeal by TAM requesting clarification of the initial decision. The estimated value of the action is R$245 million, based on a calculation made by an expert witness of the court. This sum is subject to delinquent interest since September 1993 and inflation adjustment since November 1994. Based on the opinion of TAM’s legal advisors, and recent rulings handed down by the Brazilian Supreme Court of Justice in favor of airlines in similar cases (specifically, actions filed by Transbrasil and Varig), we believe that TAM’s likelihood of success is probable. We have not recognized these credits in our financial statements and will only do so if and when the aforementioned decision is final.
TAM Linhas Aereas filed an ordinary claim, with a request for early judgment, in relation to a dispute concerning the legality of charging theAdicional das TarifasAeroportuáTarifas Aeroportuárias (“Additional Airport Tariffs,” or “ATAERO”), which are charged at a rate of 50% on the value of tariffs and airport tariffs. The total amount involved, adjusted for inflation, as of December 31, 2012 totaled R$1,1461,696 million.
In addition, one administrative proceeding had been filed against TAM Linhas Aéreas concerning the alleged failure to pay an Industrialized Products Tax (“IPI”) and Import Tax (“II”) due on imported aircraft. In response, we filed the appropriate challenges on the basis that no federal tax should be payable on the imported aircraft because it is leased aircraft. The total amount involved in this administrative proceeding is R$7702.794 million. Since February 2016 the administrative proceeding awaits a decision. In April 2013, the Conselho Administrativo de Recursos Fiscais (“CARF”) ruledopinion of our legal advisors, the casechance of losing in this proceeding is possible.
For additional Legal Proceedings relating to the ordinary course of our favor and definitively released the Company from paying the initial debt.business, please see Note 30 – Contingencies – to our audited consolidated financial statements.
Dividend Policy
In accordance with the Chilean Corporation Law, LATAM must distribute cash dividends equal to at least 30% of its annual consolidated net income calculated in accordance with IFRS unless otherwise decided by a unanimous vote of the holders of all issued shares and unless and exceptsubject to the extent it has accumulated losses.terms ofOficio Circular No. 856 issued on October 17, 2014 by the Chilean Superintendency of Securities and Insurance. If there is no net income in a given year, LATAM can elect but is not legally obligated to distribute dividends out of retained earnings. The board of directors may declare interim dividends out of profits earned during such interim period. Pursuant to LATAM’sby-laws, the annual cash dividend is approved by the shareholders at the annual ordinary shareholders’ meeting held between February 1 and April 30 of the year following the year with respect to which the dividend is proposed. All outstanding common shares are entitled to share equally in all dividends declared by LATAM, unless the shares have not been fully paid by the shareholder after being subscribed.
Holders of ADSs will be entitled to receive dividends on the underlying common shares to the same extent as holders of common shares. Holders of ADRs on the applicable record dates will be entitled to receive dividends paid on the common shares represented by the ADSs evidenced by such ADRs. Dividends payable to holders of ADSs will be paid by us to the depositary in Chilean pesos and remitted by the depositary to such holders net of foreign currency conversion fees and expenses of the depositary and will be subject to Chilean withholding tax currently imposed at a rate of 35% (subject to credits in certain cases as described under “Item 10. Additional Information—E. Taxation—Chilean Tax—Cash Dividends and Other Distributions”). Owners of the ADSs will not be charged any dividend remittance fee by the depositary with respect to cash dividends.
Chilean law requires that holders of shares of Chilean companies that are not residents of Chile register as foreign investors under one of the foreign investment regimes established by Chilean law in order to have dividends, sale proceeds or other amounts with respect to their shares remitted outside Chile through the Formal Exchange Market (Mercado Cambiario Formal). Under our Foreign Investment Contract, the depositary, on behalf of ADS holders, will be granted access to the Formal Exchange Market to convert cash dividends from pesos to U.S. dollars and to pay such U.S. dollars to ADS holders outside Chile.
B. Significant Changes
None.
| ITEM 9. | THE OFFER AND LISTING |
A. Offer and Listing Details
The principal trading market for our common shares is the SSE. The common shares have been listed on the SSE under the symbol “LAN” since 1989, and the ADSs have been listed on the NYSE under the symbol “LFL” since November 7, 1997. The common shares also trade on theBolsa de Valores de Valparaísoand theBolsa Electrónica de Chile. On June 22nd the common shares additionally started to be traded on the Brazilian Stock Exchange (“Bovespa”) under the symbol LATM11.Chile. The outstanding ADSs are identified by the CUSIP number 501723100. The following table sets forth, for the periods indicated, the high and low closing sale prices on the SSE for the common shares and the high and low closing prices on the NYSE for the common shares represented by ADSs. The information set forth in the table below reflects actual historical amounts and has not been restated in constant Chilean pesos.
Period | Ch$ per Common Share | US$ per ADS | R$ per BDR | Ch$ per Common Share | US$ per ADS | R$ per BDR | ||||||||||||||||||||||||||||||||||||||||||
| Low | High | Low | High | Low | High | Low | High | Low | High | Low | High | |||||||||||||||||||||||||||||||||||||
2009 | 7,798.10 | 8,664.30 | 15.77 | 16.90 | ||||||||||||||||||||||||||||||||||||||||||||
2012(1) | 10,481.4 | 14,230.5 | 21.89 | 29.11 | 44.86 | 52.79 | ||||||||||||||||||||||||||||||||||||||||||
|
|
|
|
|
|
|
|
|
|
|
| |||||||||||||||||||||||||||||||||||||
2010 | 14,790.00 | 15,600.0 | 30.79 | 32.68 | ||||||||||||||||||||||||||||||||||||||||||||
2013 | 5,967.3 | 11,755.4 | 11.62 | 24.84 | 26.53 | 49.00 | ||||||||||||||||||||||||||||||||||||||||||
|
|
|
|
|
|
|
| |||||||||||||||||||||||||||||||||||||||||
2011 | 14,790.00 | 15,600.0 | 18.65 | 31.91 | ||||||||||||||||||||||||||||||||||||||||||||
2014 | 6,533.3 | 8,791.6 | 10.60 | 16.36 | 25.00 | 38.00 | ||||||||||||||||||||||||||||||||||||||||||
|
|
|
|
|
|
|
|
|
|
|
| |||||||||||||||||||||||||||||||||||||
2012 | ||||||||||||||||||||||||||||||||||||||||||||||||
2015 | ||||||||||||||||||||||||||||||||||||||||||||||||
Quarters: | ||||||||||||||||||||||||||||||||||||||||||||||||
First | 11,918.1 | 14,360.7 | 23.28 | 29.40 | 5,123.7 | 7,198.3 | 8.06 | 11.82 | 26.35 | 29.50 | ||||||||||||||||||||||||||||||||||||||
Second(*) | 11,833.1 | 14,290.7 | 23.47 | 29.39 | 52.40 | 53.35 | ||||||||||||||||||||||||||||||||||||||||||
Second | 4,521.3 | 6,163.4 | 6.88 | 10.02 | 21.41 | 29.05 | ||||||||||||||||||||||||||||||||||||||||||
Third | 11,084.2 | 12,939.9 | 22.73 | 26.10 | 45.50 | 52.30 | 3,320.8 | 4,596.5 | 4.64 | 7.11 | 17.50 | 21.69 | ||||||||||||||||||||||||||||||||||||
Fourth | 10,577.3 | 12,393.0 | 22.10 | 26.10 | 45.33 | 52.01 | 3,270.2 | 4,150.5 | 4.70 | 6.07 | 18.06 | 24.00 | ||||||||||||||||||||||||||||||||||||
|
|
|
|
|
|
|
|
|
|
|
| |||||||||||||||||||||||||||||||||||||
Annual: | ||||||||||||||||||||||||||||||||||||||||||||||||
Annual 2012 | 10,577.3 | 14,360.7 | 22.10 | 29.40 | 45.33 | 53.35 | ||||||||||||||||||||||||||||||||||||||||||
Annual 2015 | 3,270.2 | 7,198.3 | 4.64 | 11.82 | 17.50 | 29.50 | ||||||||||||||||||||||||||||||||||||||||||
|
|
|
|
|
|
|
|
|
|
|
| |||||||||||||||||||||||||||||||||||||
2013 | ||||||||||||||||||||||||||||||||||||||||||||||||
2016 | ||||||||||||||||||||||||||||||||||||||||||||||||
Quarters: | ||||||||||||||||||||||||||||||||||||||||||||||||
First | 10,112.5 | 11,755.4 | 21.53 | 24.84 | 42.38 | 49.00 | 3,276.4 | 4,730.5 | 4.49 | 7.00 | 19.80 | 23.00 | ||||||||||||||||||||||||||||||||||||
Second | 7,800.9 | 10,100.6 | 15.17 | 21.22 | 31.73 | 42.30 | 4,163.5 | 4,893.4 | 5.86 | 7.40 | 20.00 | (2) | 22.68 | |||||||||||||||||||||||||||||||||||
Third | 5,967.3 | 8,313.9 | 11.62 | 16.45 | 26.53 | 35.16 | 4,350.6 | 5,855.8 | 6.53 | 8.96 | — | — | ||||||||||||||||||||||||||||||||||||
Fourth | 7,388.0 | 8,726.6 | 14.91 | 16.86 | 32.94 | 38.59 | 5,341.6 | 6,460.4 | 8.18 | 9.86 | — | — | ||||||||||||||||||||||||||||||||||||
|
|
|
|
|
|
|
|
|
|
|
| |||||||||||||||||||||||||||||||||||||
Months: | ||||||||||||||||||||||||||||||||||||||||||||||||
September | 6,553.0 | 7,779.0 | 12.93 | 15.42 | 27.72 | 34.44 | 5,243.1 | 5,499.6 | 7.66 | 8.38 | — | — | ||||||||||||||||||||||||||||||||||||
October | 7,388.0 | 8,413.8 | 14.91 | 16.68 | 32.94 | 36.12 | 5,341.6 | 6,460.4 | 8.22 | 9.86 | — | — | ||||||||||||||||||||||||||||||||||||
November | 8,081.6 | 8,726.6 | 15.80 | 16.86 | 36.64 | 38.59 | 5,827.4 | 6,393.9 | 8.59 | 9.80 | — | — | ||||||||||||||||||||||||||||||||||||
December | 8,052.7 | 8,579.4 | 15.48 | 16.31 | 35.77 | 37.10 | 5,549.8 | 6,091.8 | 8.18 | 9.40 | — | — | ||||||||||||||||||||||||||||||||||||
Annual: | ||||||||||||||||||||||||||||||||||||||||||||||||
Annual 2013 | 5,967.3 | 11,755.4 | 11.62 | 24.84 | 26.53 | 49.00 | ||||||||||||||||||||||||||||||||||||||||||
2014 | ||||||||||||||||||||||||||||||||||||||||||||||||
Months: | ||||||||||||||||||||||||||||||||||||||||||||||||
January | 7,695.8 | 8,971.6 | 13.90 | 16.36 | 35.30 | 38.00 | ||||||||||||||||||||||||||||||||||||||||||
February | 7,517.5 | 8,645.8 | 11.62 | 24.40 | 31.01 | 36.00 | ||||||||||||||||||||||||||||||||||||||||||
March(1) | 7,936.1 | 8,587.3 | 11.62 | 21.22 | 32.01 | 35.00 | ||||||||||||||||||||||||||||||||||||||||||
Annual 2016 | 3,276.4 | 6,460.4 | 4.49 | 9.86 | 19.80 | 23.00 | ||||||||||||||||||||||||||||||||||||||||||
Period 2017 Months: January February Ch$ per Common Share US$ per ADS R$ per
BDR Low High Low High Low High 5,574,1 6,166.0 8.18 9.45 — — 5,931.8 6,663.2 9.19 10.45 — —
Source: Santiago Stock Exchange, the New York Stock Exchange and the Bovespa
| From June 22, 2012, following the combination of LAN and TAM, the trading stock continues to be listed as “LFL” on the NYSE and as “LAN” on the SSE, but reflects the value of the combined operating entity, LATAM Airlines Group. |
As of JanuaryDecember 31, 2014,2016, a total of 545,558,101606,407,693 million common shares were outstanding, including common shares represented by ADSs.
B. Plan of Distribution
Not applicable.
C. Markets
Trading
Chile
The Chilean stock market, which is regulated by the SVS under Law 18,045 of October 22, 1981, as amended, which we refer to as the Securities Market Law, is one of the most developed among emerging markets, reflecting the particular economic history and development of Chile. The Chilean government’s policy of privatizing state-owned companies, implemented during the 1980s, led to an expansion of private ownership of shares, resulting in an increase in the importance of stock markets. Privatization extended to the social security system, which was converted into a privately managed pension fund system. These pension funds have been allowed, subject to certain limitations, to invest in stocks and are currently major investors in the stock market. Some market participants, including pension fund administrators, are highly regulated with respect to investment and remuneration criteria, but the general market is less regulated than the U.S. market with respect to disclosure requirements and information usage.
The SSE is Chile’s principal exchange and accounts for approximately 86.87% of securities traded in Chile. Approximately 12.91% of equity trading is conducted on the Chilean Electronic Stock Exchange, an electronic trading market created by banks andnon-member brokerage houses. The remaining equity trading is conducted on the Valparaíso Stock Exchange.
Equities,closed-end funds, fixed-income securities, short-term and money market securities, gold and U.S. dollars are traded on the SSE. In 1991, the SSE initiated a futures market with two instruments: U.S. dollar futures and Selective Shares Price Index, or IPSA, futures. Securities are traded primarily through an open voice auction system; a firm offers system or daily auctions. Trading through the open voice system occurs on each business day betweenfrom 9:30 a.m. to 4:30 p.m. The SSE has an electronic system of trade, calledTelepregón HT, which operates continuously for stocks trading in high volumes from 9:30 a.m. to 4:00 p.m. (or 5:00 p.m., depending on the period of the year). The Chilean Electronic Stock Exchange operates continuously from 9:30 a.m. to 4:30 p.m. (or 5:30 p.m., depending on the period of the year) on each business day. In February 2000, the SSEOff-Shore Market began operations. In theOff-Shore Market, publicly offered foreign securities are traded and quoted in U.S. dollars.
Brazil
Bovespa is a Brazilian publicly-held company, created in 2008, through the integration between the São Paulo Stock Exchange (Bolsa de Valores de São Paulo) and the Brazilian Mercantile & Futures Exchange (Bolsa de Mercadorias e Futuros).
Bovespa is the most important Brazilian institution to intermediate equity market transactions and the only securities, commodities and futures exchange in Brazil. Trading on such exchanges is limited to member brokerage firms and to limited number of authorized non-members. LATAM’s common shares are listed on the Bovespa.
Although the Brazilian equity market is Latin America’s largest in terms of market capitalization, it is smaller and less liquid than major U.S. and European securities markets. Any of the outstanding shares of a listed company may trade on a Brazilian stock exchange, but in most cases fewer than half of the listed shares are actually available for trading by the public, the remainder being held by small groups of controlling persons, governmental entities or one principal shareholder.
The Brazilian securities markets are principally governed by Law No. 6,385, of December 7, 1976, and Brazilian corporation law, each as amended and supplemented, and by regulations issued by the CVM, which has authority over stock exchanges and the securities markets generally; the National Monetary Council; and the Central Bank, which has, among other powers, licensing authority over brokerage firms and regulates foreign investment and foreign exchange transactions.
Trading through Bovespa occurs on each business day between 10:00 a.m. to 4:20 pm (Brazilian local time).
D. Selling Shareholders
Not applicable.
E. Dilution
Not applicable.
| ITEM 10. | ADDITIONAL INFORMATION |
This Item reflects recent legal amendments effected by Chilean Law No. 20,382 on Corporate Governance, which was enacted on October 20,13, 2009, and came into effect on January 1, 2010,October 20, 2009, and Chilean Law No. 20,552, which modernizemodernized and encourageencouraged competition in the financial system, was enacted on November 6, 2011 and came into effect on December 17, 2011.
A. Share Capital
Not applicable.
B. Memorandum and Articles of Association
Set forth below is information concerning our share capital and a brief summary of certain significant provisions of ourby-laws and Chilean law. This description contains all material information concerning the common shares but does not purport to be complete and is qualified in its entirety by reference to ourby-laws, the Chilean Corporation Law and the Securities Market Law, each referred to below. For additional information regarding the common shares, reference is made to ourby-laws, a copy of which is included as Exhibit 1.1 to this annual report on Form20-F.
Organization and Register
LATAM Airlines Group is a publicly held stock corporation (sociedad anónima abierta) incorporated under the laws of Chile. LATAM Airlines Group was incorporated by a public deed dated December 30, 1983, an abstract of which was published in the Chilean Official Gazette (Diario Oficial de la República de Chile) No. 31.759 on December 31, 1983, and registered on page 20,341, No. 11,248 of the Chilean Real Estate and Commercial Registrar (Registro de Comercio del Conservador de Bienes Raices y Comercio de Santiago) for the year 1983. Our corporate purpose, as stated in ourby-laws, is to provide a broad range of transportation and related services, as more fully set forth in Article Four thereof.
General
Shareholders’ rights in a Chilean company are generally governed by the company’sby-laws and the Chilean Corporation Law. Article 22 of the Chilean Corporation Law states that the purchaser of shares of a company implicitly accepts itsby-laws and any prior agreements adopted at shareholders’ meetings. Additionally, the Chilean Corporation Law regulates the government and operation of corporations (“sociedades anónimas,” or S.A.) and provides for certain shareholder rights. Article 137 of the Chilean Corporation Law provides that the provisions of the Chilean Corporation Law take precedence over any contrary provision in a corporation’sby-laws. The Chilean Corporation Law and ourby-laws also provide that all disputes arising among shareholders in their capacity as such or between us or our administrators and the shareholders may either be submitted to arbitration in Chile or to the courts of Chile at the election of the plaintiff initiating the action. Despite the foregoing, a recent legal amendment has forbidden certain individuals (directors, senior managers, administrators and main executives of the corporation, and any shareholder that directly or indirectly holds shares whose book or market value exceed 5,000 UF at the moment of filing of the action) from submitting such action before the ordinary courts, thus obligating them to proceed with arbitration in all situations. Finally,Decree-Law No. 3,500 on Pension Fund Administrators, which allows pension funds to invest in the stock of qualified corporations, indirectly affects corporate governance and prescribes certain rights of shareholders. The Chilean Corporation Law sets forth the rules and requirements under which a corporation is deemed to be “publicly held.” Article 2 of the Chilean Corporation Law defines publicly held corporations as corporations that register their shares with theRegistro de Valores (Securities Registry) of the SVS, either voluntarily or pursuant to a legal obligation. In addition, Article 5 of the Chilean Securities Market Law indicates which corporation’s shares must be registered with the Securities Registry:
The framework of the Chilean securities market is regulated by the SVS under the Securities Market Law and the Chilean Corporation Law, which imposes certain disclosure requirements, restricts insider trading, prohibits price manipulation and protects minority investors. In particular, the Securities Market Law establishes requirements for public offerings, stock exchanges and brokers and outlines disclosure requirements for corporations that issue publicly offered securities.
Ownership Restrictions
Under Articles 12 and 20 of the Securities Market Law and General Rule 269 issued by the SVS in 2009, certain information regarding transactions in shares of publicly held corporations must be reported to the SVS and the Chilean stock exchanges on which the shares are listed. Since the ADRs are deemed to represent the shares underlying the ADSs, transactions in ADRs will be subject to those reporting requirements. Among other matters, the beneficial owners of ADSs that directly or indirectly hold 10% or more of the subscribed capital of LATAM Airlines Group, or that reach or exceed such percentage through an acquisition, are required to report to the SVS and the Chilean stock exchanges, the day following the event:
These obligations are extended (i) to certain individuals (immediate family, next of kin and others) if the ADSsADS holder is a natural person; (ii) to any entity controlled by the holder, if the ADSsADS is ana legal entity,;entity; and (iii) to groups, if a holder has any joint action agreement with other holders and the group reaches or exceeds the cited threshold.
In addition, majority shareholders must state in their report whether their purpose is to acquire control of the company or if they are making a financial investment.
Under Article 54 of the Securities Market Law and under SVS regulations, persons or entities that intend to acquire control, whether directly or indirectly, of a publicly traded company, must follow certain notice requirements, regardless of the acquisition vehicle or procedure or whether the acquisition will be made through direct subscriptions or private transactions. In the first place, the potential acquiror must send a written communication to the target corporation, any companies controlling or controlled by the target corporation, the SVS and the Chilean stock exchanges on which the target’s securities are listed, stating, among other things, the person or entity purchasing or selling and the price and conditions of any negotiations. Subsequently, the potential acquiror must also inform the public of its planned acquisition by means of a publication in two Chilean newspapers with national distribution and by uploading such notice to the acquiror’s website, if available. Both requirements shall be met at least ten business days prior to the date on which the acquisition transaction is to close, and in any event, as soon as negotiations regarding the change of control have been formalized or when confidential information or documents concerning the target are delivered to the potential acquiror. The notices must state, among other things, the person or entity purchasing or selling and the price and conditions of any negotiations.
In addition to the foregoing, Article 54A of the Securities Market Law requires that within two business days of the completion of the transactions pursuant to which a person has acquired control of a publicly traded company, a notice shall be published in the same newspapers in which the notice referred to above was published and notices shall be sent to the same persons mentioned in the preceding paragraphs.
Consequently, a beneficial owner of ADSs intending to acquire control of LATAM Airlines Group will be subject to the foregoing reporting requirements.
The provisions of the aforementioned articles do not apply whenever the acquisition is being made through a tender or exchange offer.
Title XXV of the Securities Market Law on tender offers and SVS regulations provide that the following transactions shall be carried out through a tender offer:
| • | an offer for all the outstanding shares of a publicly traded company upon acquiringtwo-thirds or more of its voting shares (this offer must be made at a price not lower than the price at which appraisal rights may be exercised, that is, book value if the shares of the company are not actively traded or, if the shares of the company are actively traded, the weighted average price at which the stock has been traded during the 60stock-exchange-business-day period between the 30th and the 90th stock-exchange-business-days-preceding immediately preceding the acquisition); and |
Article 200 of the Securities Market Law prohibits any shareholder that has taken control of a publicly traded company from acquiring, for a period of twelve12 months from the date of the transaction that granted it control of the publicly traded company, a number of shares equal to or higher than 3.0% of the outstanding issued shares of the target without making a tender offer at a price per share not lower than the price paid at the time of taking control. Should the acquisition from the other shareholders of the company be made on the floor of a stock exchange and on a pro rata basis, the controlling shareholder may purchase a higher percentage of shares, if so permitted by the regulations of the stock exchange.
Title XV of the Securities Market Law sets forth the basis for determining what constitutes a controlling power, a direct holding and a related party.
Capitalization
Under Chilean law, the shareholders of a company, acting at an extraordinary shareholders’ meeting, have the power to authorize an increase in the company’s share capital. When an investor subscribes issued shares, the shares are registered in that investor’s name even without payment, and the investor is treated as a shareholder for all purposes except with regard to receipt of dividends and return of capital, provided that the shareholders may, by amending theby-laws, also grant the right to receive dividends of distribution of capital despite not having paid for the subscribed shares. The investor becomes eligible to receive dividends once it has paid for the shares, or, if it has paid for only a portion of such shares, it is entitled to receive a corresponding pro rata portion of the dividends declared with respect to such shares, unless the company’sby-laws provide otherwise. If an investor does not pay for shares for which it has subscribed on or prior to the date agreed upon for payment, the company is entitled under Chilean law to auction the shares on the appropriate stock exchange, and it has a cause of action against the investor to recover the difference between the subscription price and the price received for the sale of those shares at auction. However, until such shares are sold at auction, the investor continues to exercise all the rights of a shareholder (except the right to receive dividends and return of capital, as noted above). Regarding shares issued but not paid for within the period determined by the extraordinary shareholders’ meeting for their payment (which period cannot exceed three years from the date of such shareholders’ meeting), until January 1, 2010 they were canceled and no longer available for issuance by us. As of January 1, 2010, the board of directors of LATAM Airlines Group has a legal obligation to initiate the necessary legal actions to collect the unpaid amounts, unless the shareholders’ meeting which authorized the capital increase allowed the board to abstain from taking such action by a vote of two thirds of the issued shares, in which case the former rule still applies. Once the foregoing legal actions are exhausted, the board of directors shall propose to the shareholders’ meeting the appropriate capital adjustment measures, to be decided by simple majority. Fully paid shares are not subject to further calls or assessments or to liabilities of LATAM Airlines Group.
As of March, 31, 2014,February, 28, 2017, our share capital consisted of 545,558,101608,374,525 common shares all of which were606,407,693 are subscribed and fully paid. paid shares and 1,966,832 shares are pending of subscription and payment. The unsubscribed shares include (i) 1,500,000 shares allocated to stock option compensation plans and (ii) 466,832 that remain unsubscribed following our most recent capital increase. The current share capital amount reflects the expiration of stock options, covering 4,789,718 shares that had been granted under employee compensation plans. Upon the expiration of the stock options on December 21, 2016, the Company’s capital stock was reduced to 608,374,525 shares.
Chilean law recognizes the right of corporations to issue common and preferred shares. To date, we have issued and are authorized by our shareholders to issue only common shares. Each share of stock is entitled to one vote. Pursuant to twoone employee compensation plans: (i) 2011: approved by extraordinary shareholders’ meetings held on December 21, 2011 and September 4, 2012, the issuance of the shares for this compensation plan has been authorized but has not been made effective, as such issuance is subject to the exercising of rights granted to certain employees that expire on December 21, 2016; and (ii) 2013: approved by extraordinary shareholders’ meeting held on June 11, 2013, the issuance of the shares for this compensation plan has been authorized but has not been made effective, as such issuance is subject to the exercising of rights granted to certain employees that expire on November 15, 2017.
Preemptive Rights and Increases in Share Capital
The Chilean Corporation Law requires Chilean companies to offer existing shareholders the right to purchase a sufficient number of shares to maintain their existing percentage of ownership in a company whenever that company issues new shares for cash, except for up to 10% of the capital increase which may be designated to employee compensation pursuant to article 24 of the Corporation Law. Under this requirement, any preemptive rights will be offered by us to the depositary as the registered owner of the common shares underlying the ADSs, but holders of ADSs and shareholders located in the United States will not be allowed to exercise preemptive rights with respect to new issuances of shares by us unless a registration statement under the Securities Act is effective with respect to those common shares or an exemption from the registration requirements thereunder is available.
We intend to evaluate at the time of any preemptive rights offering the costs and potential liabilities associated with the preparation and filing of a registration statement with the SEC, as well as the indirect benefits of enabling the exercise by the holders of ADSs and shareholders located in the United States of preemptive rights and any other factors we consider appropriate at the time. No assurances can be given that any registration statement would be filed. If preemptive rights are not made available to ADS holders, the depositary may sell those holders’ preemptive rights and distribute the proceeds thereof if a secondary market for such rights exists and a premium can be recognized over the cost of such sale. In the event that the depositary does not sell such rights at a premium over the cost of any such sale, all or certain holders of ADRs may receive no value for the preemptive rights. The inability of holders of ADSs to exercise preemptive rights in respect of common shares underlying their ADSs could result in a change in their percentage ownership of common shares following a preemptive rights offering.
Under Chilean law, preemptive rights are freely exercisable, transferable or waived by shareholders during a thirty-day30-day period commencing upon publication of the official notice announcing the start of the preemptive rights period in the newspaper designated by the shareholders’ meeting. The preemptive right of the shareholders is the pro rata amount of the shares registered in their name in the shareholders’ registry of LATAM Airlines Group as of the fifth business day prior to the date of publication of the notice announcing the start of the preemptive rights period. During such thirty-day30-day period (except for shares as to which preemptive rights have been waived), Chilean companies are not permitted to offer any newly issued common shares for sale to third parties. For that thirty-day 30-day
period and an additional thirty-day30-day period, Chilean publicly held corporations are not permitted to offer any unsubscribed common shares for sale to third parties on terms that are more favorable to the purchaser than those offered to shareholders. At the end of such additional thirty-day30-day period, Chilean publicly held corporations are authorized to sellnon-subscribed shares to third-partiesthird parties on any terms, provided they are sold on a Chilean stock exchange.
Directors
Ourby-laws provide for a board of nine directors. Compensation to be paid to directors must be approved by vote at the annual shareholders’ meeting. We hold elections for all positions on the board of directors every two years. Under ourby-laws, directors are elected by cumulative voting. Each shareholder has one vote per share and may cast all of his or her votes in favor of one nominee or may apportion his or her votes among any number of nominees. These voting provisions currently ensure that a shareholder owning more than 10% of our outstanding shares is able to elect at least one representative to our board of directors.
Under the Chilean Corporation Law, transactions of a publicly-traded company with a “related” party must be conducted on anarm’s-length basis and must satisfy certain approval and disclosure requirements which are different from the ones that apply to a privately-held company. The conditions apply to the publicly-traded company and to all of its subsidiaries.subsidiaries .
These transactions include any negotiation, act, contract or operation in which the publicly-traded company intervenes together with either (i) parties which are legally deemed related pursuant to article 100 of the Chilean Securities Market Law, (ii) a director, senior manager, administrator, main executive or liquidator of the company, either on their own behalf or on behalf of a third party, including those individuals’ spouses or close relatives, (iii) companies in which the foregoing individuals own at least 10% (directly or indirectly), or in which they serve as directors, senior managers, administrators or main executives, (iv) parties indicated as such in the publicly-traded company’sby-laws, or identified by the directors’ committee or (v) those who have served as directors, senior managers, administrators, main executives or liquidators of the counterparty in the last eighteen18 months and are now serving in one of those positions at the publicly-traded company.
Corporations may enter into transactions with related parties if (i) the transaction is in the interest of the corporation, (ii) the transaction is made on anarm’s-length basis at market conditions, (iii) the individuals involved in the transactions report them immediately to the board, (iv) the transaction is approved after a reasoned explanation by the majority of the board, excluding those directors or liquidators that are involved in the transaction (who shall, nonetheless, render an opinion on the matter if required by the board), (v) the decisions of the board isare disclosed at the next shareholders’ meeting, and (vi) in case the majority of the board is disqualified to vote, the majority of thenon-involved directors have approved the transaction, or two thirds of the voting shares have approved the transaction).
If, as noted in clause (vi) of the preceding paragraph, the transaction is to be approved by the shareholder’sshareholders’ meeting, the following additional rules apply: (i) the board shall appoint an independent appraiser that shall report to the shareholders on the transaction;transaction, (ii) the director’s committee or thenon-involved directors may appoint a second independent appraiser;appraiser, (iii) the appraiser’s reports shall be made available for fifteen days;15 days, (iv) the receipt and availability of the reports shall be disclosed as a material fact;fact and (iv) directors shall render an opinion on the transaction within five business days after receiving the reports.
Transactions which do not meet the foregoing requirements are valid and enforceable, but neither the corporation nor its shareholders shall have a cause of action to sue the infringing party for reimbursement on behalf of the corporation, for a total of the benefits reported to the interested party, in addition to indemnification for the damages caused. In such proceedings, the defendant shall prove that the transaction met the legal requirements.
The Chilean Corporation Law sets forth a number of exceptions to the foregoing rules. In the following situations, transactions with related parties may be carried out without complying with the foregoing rules: (i) if a transaction does not involve a substantial amount (if it does not exceed 1.0% of the net worth of the company and does not exceed the equivalent of 2,000 UF or approximately US$96,554 as of the date of this annual report on Form 20F)20-F) unless such a transaction exceeds 20,000 UF (for this calculation all similar transactions carried out within a consecutive12-month period between the same parties or for the same subject matter, shall be deemed as a single transaction), (ii) transactions which according to the policies determined by the board of directors, are deemed to be within the ordinary course of business (the determination of such policies shall be disclosed as a material fact and made available to shareholders), and (iii) if the counterparty is an entity in which the publicly-traded company has, directly or indirectly, at least a 95.0% ownership. As per the exemption indicated in (ii) above, on December 29, 2009, the Board of Directors of LATAM Airlines Group established policies setting forth the transactions that fall within the ordinary course of business. That determination was publicly disclosed on the same day and is currently available on LATAM Airlines Group’s website under the “Corporate Governance” section.
Shareholders’ Meetings and Voting Rights
The Chilean Corporation Law requires that an ordinary annual meeting of shareholders be held within the first four months of each year after being called by the board of directors (generally they are held in April, but in any case following the preparation of our
financial statements, including the report of our auditors, for the previous fiscal year). LATAM Airlines Group’sby-laws further provide that the ordinary annual meeting of shareholders must take place between February 1 and April 30. The shareholders at the ordinary annual meeting approve the annual financial statements, including the report of our auditors, the annual report, the dividend policy and the final dividend on the prior year’s profits, elect the board of directors (in our case, every two years or earlier if a vacancy occurs) and approve any other matter that does not require an extraordinary shareholders’ meeting. The most recent extraordinary meeting of our shareholders was held on June 11, 2013,August 18, 2016, and the most recent ordinary annual meeting of our shareholders was held on April 29, 2013.26, 2016.
Extraordinary shareholders’ meetings may be called by the board of directors, if deemed appropriate, and ordinary or extraordinary shareholders’ meetings must be called by the board of directors when requested by shareholders representing at least 10.0% of the issued voting shares or by the SVS. In addition, as from January 1, 2010 there are two new rules in this regard: (i) the SVS may directly call for an extraordinary shareholders’ meeting in case of a publicly-traded companies,company, and (ii) any kind of shareholders’ meeting may be self-convened and take place if all voting shares attend, regardless of the fulfillment of the notice and other type of procedural requirements.
Notice to convene the ordinary annual meeting or an extraordinary meeting is given by means of three notices which must be published in a newspaper of our corporate domicile (currently Santiago, Chile) designated by the shareholders at their annual meeting and, if the shareholders fail to make such designation, the notice must be published in the Chilean Official Gazette pursuant to legal requirements. The first notice must be published not less than fifteen15 days and not more than twenty20 days in advance of the scheduled meeting. Notice also must be mailed not less than fifteen15 days in advance of the meeting to each shareholder and to the SVS and the Chilean stock exchanges. Currently, we publish our official notices in the newspaperLa Tercera(available online at www.latercera.com).
The quorum for a shareholders’ meeting is established by the presence, in person or by proxy, of shareholders representing a majority of our issued common shares. If that quorum is not reached, the meeting can be reconvened within forty-five45 days, and at the second meeting the shareholders present are deemed to constitute a quorum regardless of the percentage of the common shares that they represent.
Only shareholders registered with us on the fifth business day prior to the date of a meeting are entitled to attend and vote their shares. A shareholder may appoint another individual (who need not be a shareholder) as his or her proxy to attend and vote on his or her behalf. Proxies addressed to us that do not designate a person to exercise the proxy are taken into account in order to determine if there is a sufficient quorum to hold the meeting, but the shares represented thereby are not entitled to vote at the meeting. The proxies must fulfill the requirements set forth by the Chilean Corporation Law and its regulatory norms. Every shareholder entitled to attend and vote at a shareholders’ meeting has one vote for every share subscribed.
The following matters can only be considered at an extraordinary shareholders’ meeting:
The matters referred to in the first seven items listed above may only be approved at a meeting held before a notary public, who shall certify that the minutes are a true record of the events and resolutions of the meeting.
Theby-laws establish that resolutions are passed at shareholders’ meetings by the affirmative vote of an absolute majority of those voting shares present or represented at the meeting. However, under the Chilean Corporation Law, the vote of atwo-thirds majority of the outstanding voting shares is required to approve any of the following actions:
Amendments to theby-laws that have the effect of establishing, modifying or eliminating any special rights pertaining to any series of shares require the consenting vote of holders oftwo-thirds of the shares of the affected series. As noted above, LATAM Airlines Group does not have special series of shares.
In general, Chilean law does not require a publicly held corporation to provide the level and type of information that the U.S. securities laws require a reporting company to provide to its shareholders in connection with a solicitation of proxies. However, shareholders are entitled to examine the books of the company and its subsidiaries within the fifteen-day15-day period before a scheduled meeting. No later than the first notice summoning an ordinary shareholder’s meeting, the board of directors of a publicly held corporation is required to send to every shareholder notice by regular mail, a notice containing a reference to the issues that will be discussed, together with instructions to obtain all the appropriate documentation regarding those issues, and publish such notice on its website. The board is also required to provide a copy ofmake available to the shareholders the annual report and the financial statements of the company. However,company, and to publish such information in the SVS may authorize companies that have a large numbercompany’s webpage at least 10 days in advance of the scheduled shareholders to limit the sending of such documents only to those shareholders who have a number of shares exceeding a certain number, and, in any case, to any shareholder who has requested a written notice. Shareholders who do not fall into this category but who request it must be sent a copy of our annual report.meeting. In addition to these requirements, we regularly have provided, and currently intend to continue to provide, together with the notice of shareholders’ meeting, a proposal for the final annual dividend for shareholder approval. See “—Dividend and Liquidation Rights” below.
The Chilean Corporation Law provides that, whenever shareholders representing 10% or more of the issued voting shares so request, a Chilean company’s annual report must include such shareholders’ comments and proposal in relation to the company’s affairs, together with the comments and proposals set forth by the directors’ committee. Similarly, the Chilean Corporation Law provides that whenever the board of directors of a publicly held corporation convenes an ordinary meeting of the shareholders and solicits proxies for that meeting, or distributes information supporting its decisions or other similar material, it is obligated to include as an annex to its annual report any pertinent comments and proposals that may have been made by shareholders owning 10% or more of the company’s voting shares who have requested that such comments and proposals be included, together with the comments and proposals set forth by the directors’ committee.
Dividend and Liquidation Rights
In accordance with the Chilean Corporation Law, LATAM Airlines Group must distribute an annual cash dividend equal to at least 30% of its annual net income calculated in accordance with IFRS, unless otherwise decided by a unanimous vote of the holders
of all issued shares, and unless and except to the extent it has accumulated losses. If there is no net income in a given year, LATAM Airlines Group can elect but is not legally obligated to distribute dividends out of retained earnings. All outstanding common shares are entitled to share equally in all dividends declared by LATAM Airlines Group, unless the shares have not been fully paid by the shareholder after being subscribed.
For all dividend distributions agreed by the board of directors in excess of the mandatory minimum of 30% noted in the preceding paragraph, LATAM Airlines Group may grant an option to its shareholders to receive those dividends in cash, or in shares issued by either LATAM Airlines Group or other corporations. Shareholders who do not expressly elect to receive a dividend other than in cash are legally presumed to have decided to receive the dividend in cash. A U.S. holder of ADSs may, in the absence of an effective registration statement under the Securities Act or an available exemption from the registration requirement thereunder, effectively beis required to receive a dividend in cash. See “—Preemptive Rights and Increases in Share Capital” above.
Dividends that are declared but not paid within the appropriate time period set forth in the Chilean Corporation Law (as to minimum dividends, thirty30 days after declaration; as to additional dividends, the date set for payment at the time of declaration) are adjusted to reflect the change in the value of the UF. The UF is a daily indexed, Chilean peso-denominated accounting unit designed to discount the effect of Chilean inflation and it is based on the previous month’s inflation rate as officially determined. Such dividends also accrue interest at the then-prevailing rate forUF-denominated deposits during such period. The right to receive a dividend lapses if it is not claimed within five years from the date such dividend is payable. After that period, the amount not claimed is given to anon-profit organization, theJunta Nacional de Cuerpos de Bomberos de Chile(the National Corporation of Firefighters).
In the event of LATAM Airlines Group’s liquidation, the holders of fully paid common shares would participate pro rata in the distribution of assets remaining after payment of all creditors. Holders of shares not fully paid will participate in such distribution in proportion to the amount paid.
Approval of Financial Statements
The board of directors is required to submit our consolidated financial statements to the shareholders for their approval at the annual ordinary shareholders’ meeting. If the shareholders reject the financial statements, the board of directors must submit new financial statements not later than sixty60 days from the date of that meeting. If the shareholders reject the new financial statements, the entire board of directors is deemed removed from office and a new board is to be elected at the same meeting. Directors who approved such financial statements are disqualified forre-election for the ensuing period.
Right of Dissenting Shareholders to Tender Their Shares
The Chilean Corporation Law provides that, upon the adoption at an extraordinary meeting of shareholders of any of the resolutions or if it takes place any of the situations enumerated below takes place, dissenting or affected shareholders acquire the right to withdraw and to compel the company to repurchase their shares, subject to the fulfillment of certain terms and conditions. However, such right shall be suspended if we are declared bankrupta debtor in a bankruptcy liquidation proceeding, or if we are subject to a creditor’sreorganization agreement pursuantapproved in accordance with Chilean law No. 20,720, unless such agreement allows the right to Title XII of Book IV of the Commerce Code. In the case of holders of ADRs, however, in order to exercise such rights, holders of ADRs would be required to first withdraw, the common shares representedor unless it is terminated by the ADRs pursuant to the termsissuance of the deposit agreement. Sucha liquidation resolution.Such holders of ADRs would need to perfect the withdrawal of the common shares on or before the fifth business day prior to the date of the meeting.
“Dissenting shareholders” are defined as those who attend a shareholders’ meeting and vote against a resolution which results in the withdrawal right, or, if absent at such a meeting, those who state in writing to the company their opposition to such resolution within the following thirty30 days. Dissenting shareholders must perfect their withdrawal rights by tendering their stock to the company within thirty days after adoption of the resolution.
The price paid to a dissenting shareholder of a publicly held corporation is the weighted average of the sales prices for the shares as reported on the Chilean stock exchanges on which the shares are quoted forduring the two-month60stock-exchange-business-day period precedingelapsed between the 30th and the 90th stock-exchange-business-days-preceding the event giving rise to the withdrawal right. If, because of the volume, frequency, number and diversity of the buyers and sellers, the SVS determines that the shares are not shares actively traded on a stock exchange (acciones de transacción bursátil), the price paid to the dissenting shareholder is the book value. Book value for this purpose equals paid capital plus reserves and profits, less losses, divided by the total number of subscribed shares (whether entirely or partially paid). For the purpose of making this calculation, the last annual balance sheet is used and adjusted to reflect inflation up to the date of the shareholders’ meeting that gave rise to the withdrawal right.
The resolutions and situations that result in a shareholder’s right to withdraw are the following:
In addition, shareholders of publicly held corporations have the right to withdraw if a person acquirestwo-thirds or more of the outstanding shares of such corporation with the right to vote (except as a result of other shareholders not having subscribed and paid a capital increase) and does not make a tender offer for the remaining shares within thirty30 days after acquisition.
Under Article 69(bis)article 69 bis of the Chilean Corporation Law, the right to withdraw also is granted to shareholders (other than pension funds that administer private pension plans under the national pension law), under certain terms and conditions, if a company were to become controlled by the Chilean government, directly or through any of its agencies, and if two independent rating agencies downgrade the rating of its stock from first class because of certain actions specified in Article 69(bis)69 bis undertaken by the company or the Chilean government that affect negatively and substantially the earnings of the company. Shareholders must perfect their withdrawal rights by tendering their shares to the company within thirty30 days of the date of the publication of the new rating by two independent rating agencies. If the withdrawal right is exercised by a shareholder invoking Article 69(bis),69 bis, the price paid to the dissenting shareholder shall be the weighted average of the sales price for the shares as reported on the stock exchanges on which the company’s shares are quoted for thesix-month period preceding the publication of the new rating by two independent rating agencies. If, as previously described, the SVS determines that the shares are not actively traded on a stock exchange, the price shall be the book value calculated as described above.
There is no legal precedent as to whether a shareholder that has voted both for and against a proposal (such as the depositary) may exercise withdrawal rights with respect to the shares voted against the proposal. As such, there is doubt as to whether holders of ADRs who have not surrendered their ADRs and withdrawn common shares on or before the fifth business day prior to the shareholder meeting will be able to exercise withdrawal rights either directly or through the depositary with respect to the shares represented by ADRs. Under the provisions of the deposit agreement the depositary will not exercise these withdrawal rights.
The circumstance indicated above regarding ownership in excess of 95% by the controlling shareholder creates not only a withdrawal right for the remaining minority shareholders, but as of January 1, 2010, it also creates a “squeeze out” right by the controlling shareholder with respect to those same shareholders (granting a call option by means of which the controlling shareholder maybuy-out the existing ownership participations pursuant to the provisions of article 71 bis of the Corporation Law).
Registration and Transfers
TheDepósito Central de Valores, (“DCV”), acts as LATAM Airlines Group’s registration agent. In the case of jointly owned common shares, anattorney-in-fact must be appointed to represent the joint owners in dealings with us.
C. Material Contracts
Boeing
Boeing767-300 Fleet
On May 9, 1997, we entered into the Aircraft General Terms Agreement with The Boeing Company (“AGTA”), applicable to all Boeing aircraft contracted for purchase from The Boeing Company.
On January 30, 1998, we entered into Purchase Agreement No. 2126 with The Boeing Company (“Purchase Agreement No. 2126”) to acquire two Boeing767-300 passenger aircraft.
On November 11, 2004, we entered into supplemental agreement No. 16 to the Purchase Agreement No. 2126 to acquire one additional Boeing767-300 freighter aircraft and three Boeing767-300 passenger aircraft. The estimated gross value (at list prices) of these aircraft was US$140,000,000.
On April 28, 2005, we entered into supplemental agreement No. 20 to the Purchase Agreement No. 2126 to acquire two additional Boeing767-300 freighter aircraft and one Boeing767-300 passenger aircraft. The estimated gross value (at list prices) of these aircraft was US$300,000,000.
On July 20, 2005, we entered into supplemental agreement No. 21 to the Purchase Agreement No. 2126 to acquire three Boeing767-300 passenger aircraft. The estimated gross value (at list prices) of these aircraft was US$410,000,000.
On March 31, 2006, we entered into supplemental agreement No. 22 to the Purchase Agreement No. 2126 to acquire three Boeing767-300 aircraft. Furthermore, we converted two Boeing767-300 freighter aircraft to two Boeing767-300 passenger aircraft. The estimated gross value (at list prices) of these aircraft was US$430,000,000.
On December 14, 2006, we entered into supplemental agreement No. 23 to the Purchase Agreement No. 2126 to acquire three additional Boeing767-300 passenger aircraft. The estimated gross value (at list prices) of these aircraft was US$460,000,000.
On November 10, 2008, we entered into supplemental agreement No. 24 to the Purchase Agreement No. 2126 to acquire four additional Boeing767-300 passenger aircraft and two purchase rights for Boeing767-300 aircraft. Two of these aircraft were delivered in 2011, while the other two aircraft havehad a scheduled delivery date in 2012. The estimated gross value (at list prices) of these aircraft was US$636 million.
On March 22, 2010, we entered into supplemental agreement No. 28 to the Purchase Agreement No. 2126, whereby we agreed to accelerate the delivery of ten787-8 aircraft, substitute four aircraft from787-916 to787-816 and substitute three767-316ER to767-316F freighter aircraft. Moreover, on November 10, 2010, we entered into supplemental agreement No. 29 to the Purchase Agreement No. 2126, whereby we agreed to accelerate the delivery of three Aircraft and substitute those three aircraft from767-316F to767-316ER.
On February 15, 2011, we entered into supplemental agreement No.30No. 30 to the Purchase Agreement No.2126No. 2126 to acquire three additional Boeing767-300 passenger aircraft. Delivery iswas scheduled to take place in 2012. The estimated gross value (at list prices) of these aircraft was US$510 million.
On May 10, 2011, we entered into supplemental agreement No.31No. 31 to the Purchase Agreement No.2126No. 2126 to acquire five additional Boeing767-300 passenger aircraft and four purchase rights for Boeing767-300 passenger aircraft. Delivery iswas scheduled to take place in 2012. The estimated gross value (at list prices) of these aircraft was US$870 million.
On December 22, 2011 we entered into supplemental agreement No.32No. 32 to the Purchase Agreement No.2126No. 2126 to exercise two purchase options for two additional Boeing767-300 passenger aircraft, while the remaining purchase options were deleted. Delivery iswas scheduled to take place in 2012. The estimated gross value (at list prices) of these aircraft was US$340 million.
Boeing787-8/9 Fleet
On October 29, 2007, we entered into Purchase Agreement No. 3256 with the Boeing Company (“Purchase Agreement No. 3256”) to acquire 18 Boeing787-8 aircraft and eight Boeing787-9 aircraft to be delivered between 2012 and 2016. This purchase agreement provides us with the option of purchasing fifteen15 additional aircraft to be delivered in 2017 and 2018. The estimated gross value (at list prices) of the Boeing aircraft for which we had firm commitments to take delivery under this contract is US$3.2 billion.
On March 22, 2010, we entered into supplemental agreement No. 1 to the Purchase Agreement No. 3256 to advance the schedulescheduled delivery date of ten Boeing787-8 aircraft and substitute four Boeing787-9 aircraft into four Boeing787-8 aircraft.
On July 8, 2010, we entered into supplemental agreement No. 2 to the Purchase Agreement No. 3256 to advance the schedulescheduled delivery date of two Boeing787-8 aircraft.
On August 24, 2012, we entered into supplemental agreement No. 3 to the Purchase Agreement No. 3256 to replace two Boeing787-8 aircraft with two Boeing787-8 aircraft with a later delivery.
On September 16, 2013, we entered into a delay settlement agreement with respect to Purchase Agreement No. 3256, whereby we agreed to update delivery dates, settle consequences of the currently known delays and convert several future deliveries ofB787-8 aircraft toB787-9 aircraft. This delay settlement agreement was amended on April 22, 2015 to update delivery dates of certain aircraft.
On April 22, 2015, we entered into Supplemental Agreement No. 4 to Purchase Agreement No. 3256 to reschedule the delivery dates of four Boeing787-8 aircraft and replace four Boeing787-8 aircraft with four Boeing787-9 aircraft.
On July 3, 2015, we entered into Supplemental Agreement No. 5 to Purchase Agreement No. 3256 to reschedule the delivery date of one Boeing787-8 aircraft.
On May 27, 2016, we entered into Supplemental Agreement No. 6 to Purchase Agreement No. 3256 to (i) convert four Model787-816 Aircraft to four Model787-916 Aircraft, and (ii) defer of two Model787-916 Aircraft from 1Q 2018 and 2Q 2018 to 3Q 2018 and 4Q 2018 respectively.
On December 20, 2016, we entered into Supplemental Agreement No. 7 to Purchase Agreement No. 3256 to reschedule the delivery of four Model787-916 Aircraft and document the actual delivery months for two Model787-916 Aircraft in 2019.
Boeing 777 Freighter Fleet
On July 3, 2007, we entered into Purchase Agreement No. 3194 with the Boeing Company (“Purchase Agreement No. 3194”) to acquire two Boeing 777 freighter aircraft with schedule deliveries dates in 2011 and 2012. The estimated gross value (at list prices) of the Boeing aircraft for which we had firm commitments to take delivery under this contract was US$545 million.
On March 22, 2010, we entered into letter agreement6-1162-KSW-6454R2 to the Purchase Agreement No. 3194 to transfer two purchase rights from Purchase Agreement No. 2126 to Purchase Agreement No. 3194.
On November 2, 2010, we entered into supplemental agreement No. 2 to the Purchase Agreement No. 3194, to exercise one of the two options for a Boeing 777 freighter aircraft with schedulescheduled delivery date in 2012.The2012. The estimated gross value (at list prices) of this aircraft was US$280 million.
On September 22, 2011, we entered into supplemental agreement No. 3 to the Purchase Agreement No. 3194 to advance the schedulescheduled delivery date of one firm Boeing 777 freighter aircraft during 2012.
On August 9, 2012, we entered into supplemental agreement No. 4 to the Purchase Agreement No. 3194 to reflect the configuration of the aircraft covered under such Purchase Agreement.
Airbus A320-Family Fleet
On March 20, 1998, we entered into the Second A320-Family Purchase Agreement with Airbus S.A.S. (“Second A320-Family Purchase Agreement”) to acquire five Airbus 320 family aircraft.A320-Family Aircraft.
On November 14, 2003, we entered into amendment No. 1 to the Second A320-Family Purchase Agreement to exercise three purchase rights for Airbus 319 aircraft, among other things.
On October 4, 2005, we entered into amendment No. 2 to the Second A320-Family Purchase Agreement to acquire twenty five25 additional Airbus 320 family aircraft and fifteen15 purchase rights for Airbus A320-Family aircraft.
On March 6, 2007, we entered into amendment No. 3 to the Second A320-Family Purchase Agreement to exercise fifteen15 purchase rights for fifteen15 Airbus A320-Family aircraft.Aircraft.
On December 23, 2009, we entered into amendment No. 5 to the Second A320-Family Purchase Agreement to acquire thirty30 additional Airbus A320-Family aircraft.Aircraft. The estimated gross value (at list prices) of these aircraft was US$2.0 billion.
According to clause 12.2 of the Second A320-Family Purchase Agreement, applicable to all subsequent amendments, in case of a failure, as defined in such agreement, a service life policy for a period of 12 years after delivery of any given aircraft shall apply.
On May 10, 2010, we entered into amendment No. 6 to the Second A320-Family Purchase Agreement to convert the aircraft type of three aircraft and advance the scheduled delivery date of thirteen13 aircraft.
On May 19, 2010, we entered into amendment No. 7 to the Second A320-Family Purchase Agreement to advance the scheduled delivery date of three aircraft.
On September 23, 2010, we entered into amendment No. 8 to the Second A320-Family Purchase Agreement to convert the aircraft type of one aircraft and advance the scheduled delivery date of four aircraft.
On December 21, 2010, we entered into amendment No. 9 to the Second A320-Family Purchase Agreement to acquire fifty50 additional Airbus A320-Family aircraft.Aircraft. The estimated gross value (at list prices) of these aircraft was US$2,600,000,000.
On June 10, 2011, we entered into amendment No. 10 to the Second A320-Family Purchase Agreement to convert the aircraft type of three aircraft, to select sharklets for some aircraft and to notify delivery dates for some aircraft.
On November 3, 2011, we entered into amendment No. 11 to the Second A320-Family Purchase Agreement to convert the aircraft type of three aircraft and defer the schedulescheduled delivery date of four aircraft.
On November 19, 2012, we entered into amendment No. 12 to the Second A320-Family Purchase Agreement to convert the aircraft type of three aircraft, identify certain Aircraft as Sharklet Installed Aircraft and others as Sharklet Capable Aircraft, as those are defined in such Purchase Agreement, and notify the scheduled delivery month for certain aircraft.
On August 19, 2013, we entered into amendment No. 13 to the Second A320-Family Purchase Agreement to convert several A320 aircraft to A321 aircraft and to postpone the scheduled delivery dates of several aircraft.
On June 22, 2011,31 March, 2014, we entered into amendment No. 14 to the Second A320 NEOFamily Purchase Agreement (“covering the rescheduling of the scheduled delivery date of one Aircraft.
On May 16, 2014, we entered into amendment No. 15 to the Second A320 NEOFamily Purchase Agreement”)Agreement covering the rescheduling of the scheduled delivery month of certain Aircraft.
On July 15, 2014, we entered into amendment No. 16 to acquire twenty Airbus 320 NEO family aircraft with schedule delivery dates in 2017the Second A320 Family Purchase Agreement covering cancellation and 2018. The estimated gross value (at list prices)substitution of these aircraft is US$1.7 billion.certain Aircraft.
On October 30, 2014, we entered into a novation agreement covering the novation of the original TAM A320/A330 Family Purchase Agreement from TAM to LATAM.
On December 11, 2014, we entered into amendment No. 17 to the Second A320 Family Purchase Agreement covering the substitution of certain Aircraft.
Between April and August 2011, we entered into Buyback Agreements No. 3001, 3030, 3062, 3214 and 3216 with Airbus Financial Services for the sale of five A318 aircraft for approximately US$107 million.
Between August 2012 and January 2013, we entered into Buyback Agreements No. 3371, 3390, 3438, 3469 and 3509 with Airbus Financial Services for the sale of five A318 aircraft for approximately US$102 million.
Airbus A320NEO-Family Fleet
On June 22, 2011, we entered into A320 NEO Purchase Agreement (“A320 NEO Purchase Agreement”) to acquire 20 Airbus 320 NEO family aircraft with scheduled delivery dates in 2017 and 2018. The estimated gross value (at list prices) of these aircraft is US$1.7 billion.
On February 27, 2014, we entered into amendment No. 1 to the A320 NEO Purchase Agreement covering the advancement of the date by which LATAM selects the propulsion systems.
On July 15, 2014, we entered into amendment No. 2 to the A320 NEO Purchase Agreement covering the order of incremental A320 NEO Aircraft.
On December 11, 2014, we entered into amendment No. 3 to the A320 NEO Purchase Agreement covering the order of incremental A320 NEO Aircraft and A321 NEO Aircraft.
On April 15, 2016, we entered into amendment No. 4 to the A320 NEO Purchase Agreement covering the reschedule of the delivery of eight Original NEO Aircraft and the conversion of four Original NEO Aircraft into A321 NEO Aircraft.
On April 15, 2016, we entered into amendment No. 5 to the A320 NEO Purchase Agreement to reflect the changes in the technical specifications of the aircraft to be received under this agreement.
On August 8, 2016, we entered into amendment No. 6 to the A320 NEO Purchase Agreement covering the cancellation of the delivery of four A320 NEO Aircraft.
Aercap Holdings N.V.
On May 28, 2013, we entered into a framework deed with Aercap Holdings N.V. for the sale and leaseback of severalA330-200 aircraft already in fleet and several new aircraft to be received from the manufacturer including A350-00, A350-900,B787-8 andB787-9 aircraft. The estimated gross value (at list prices) of these aircraft is US$3.0 billion.
For more information, see “Item 4. Information onAircastle Holding Corporation Limited
On February 21, 2014, we entered into a framework deed with Aircastle Holding Corporation Limited for the Company—B. Business Overview—Fleet—Fleet Leasinglease of four B777-300ER already in fleet. The four aircraft were manufactured in 2012 and Financing Arrangements.”the estimated market value (at list prices) of these aircraft is US$580 million. The average term of the leases is 60 months.
GE Commercial Aviation
On April 30, 2007, we also entered into an Aircraft Lease Common Terms Agreement with GE Commercial Aviation Services Limited and two Aircraft Lease Agreements with Wells Fargo Bank Northwest N.A., as owner trustee, for the lease of two Boeing B777-200LRF aircraft. These aircraft were delivered in 2009 and the leases shall remain in place for a term of 96 months.
For more information, see “Item 4. Information on the Company—B. Business Overview—Fleet—Fleet Leasing and Financing Arrangements.”
GE Engine Services LLC
On December 17, 2010,June 12, 2014, we (and TAM Linhas Aereas S.A.) entered into a Digital Services Agreementengine services agreement with GE Engine Services, LLC and GE Celma Ltda. for the provision of operational analysis, performance andmaintenance services ofCF6-80C2B6F engines (which powers our B767 fleet) during 200 shop visits or 10 years, whichever occurs first.
On July 28, 2009, TAM Linhas Aereas S.A. entered into an engine services agreement with GE Engine Services, Inc. for the provision of maintenance services of aircraft engines.GE90-115BL engines, which power 10 B777 passenger fleet and 4 spare engines, for a period of 12 years per engine.
Société AIR FRANCE
On February 22, 2010, we entered into an engine services agreement with Société AIR FRANCE for the provision of maintenance services for GE90-110BL engines, which power 2 B777 freighter fleet and 1 spare engine, for a period of eight years per engine.
CFM International
On December 17, 2010, we entered into General Terms Agreement No.CFM-1-2377460475 (the “GTA”) and Letter Agreement No. 1 to GTA with CFM International, Inc. (“CFM”) for the sale and support by CFM ofCFM56-5B engines to power 70 A320 family aircraft and up to 14CFM56-5B spare engines, related equipment and spare parts. Moreover, on December 17, 2010,engines. On the same date, we entered into a Rate Per Flight Hour Engine Shop Maintenance Services Agreement with CFM for the provision by CMFCFM of maintenance services over our aircraftfor the above-mentioned installed and spare engines.
General Electric Company
On July 11, 2011December 31, 2014, we entered into Letter Agreement No.12No. 2 to the General Terms Agreements No. 6-9576GTA with General Electric Company for the purchase of four new CF6 80CB6F engines with delivery on 2013 and one purchase right for a CF6 80CB6F engine.
Pratt & Whitney Engine Leasing
On July 28, 2011, we entered into Used PW6122A Five Engine Purchase Agreement with Pratt & Whitney Engine Leasing, LLCCFM International, Inc. (“CFM”) for the sale and support by CFM ofCFM56-5B engines to power 20 A320 family aircraft and one spare engine.
On March 15, 2006, TAM Linhas Aereas S.A. entered into an engine services agreement with GE Celma Ltda. for the provision of five PW6122A engines.maintenance services forCFM56-5B engines, which power 47 A320 Fam passenger fleet and 6 spare engines, for a period of 15 years per engine.
PW1100G-JM Engine Maintenance Agreement
In February 2014, we entered into an engine support and maintenance services agreement with United Technologies Internation Corporation, Pratt & Whitney covering Division (“PW”) for the sale, support and maintenance by PW ofPW1100G-JM engines to power 42 A320NEO family aircraft and nine spare engines. It is also a rate per engine flight hour contract agreement, which includes cost control mechanisms for LATAM.
Rolls-Royce PLC & Rolls-Royce TotalCare Services Limited
On September 30, 2009, we entered into General Terms Agreement No. DEG5307 (the “GTA”) with Rolls-Royce PLC for the sale and support by Rolls-Royce of Trent 1000 engines to power 32 B787 family aircraft and up to 10 Trent 1000 spare engines. On the same date, we entered into a Rate Per Flight Hour Engine Shop Maintenance Services Agreement with Rolls-Royce TotalCare Services Limited for the provision by Rolls-Royce of maintenance services for the above-mentioned installed and spare engines, for a period of 15 years per engine.
On January 11, 2011, TAM Linhas Aereas S.A. entered into General Terms Agreement No. DEG5292 (the “GTA”) with Rolls-Royce PLC for the sale and support by Rolls-Royce of Trent XWB engines to power 27 A350XWB family aircraft and up to 7 Trent XWB spare engines. On the same date, we entered into a Rate Per Flight Hour Engine Shop Maintenance Services Agreement with Rolls-Royce TotalCare Services Limited for the provision by Rolls-Royce of maintenance services for the above-mentioned installed and spare engines, for a period of 12 years per engine. Subsequently, on July 31, 2015, the aforementioned agreements were novated, so that LATAM Airlines Group S.A. replaces TAM Linhas Aereas S.A. in both agreements.
International Aero Engines AG
On October 12, 2006, we entered into an engine services agreement with IAE International Aero Engines AG for the provision of maintenance services ofV2500-A5 engines, which power 53 A320 Fam passenger fleet and 9 spare engines, for a period of 12 years per engine.
On October 21, 2010, TAM Linhas Aereas S.A. entered into an engine services agreement with IAE International Aero Engines AG for the provision of maintenance services ofV2500-A5 engines, which power 26 A320 Fam passenger fleet and 7 spare engines, for a period of 12 years per engine.
CFM International
On June 29, 2016, we entered into a Rate Per Flight Hour Agreement for Engine Shop Maintenance Services with CFM International, Inc., covering the maintenance, repair and overhaul of certainCFM56-5B engines.
PAAL Gemini Company Limited – PAAL Aquila Company Limited
During 2016, we entered into operating lease agreements with PAAL Gemini Company Limited and PAAL Aquila Company Limited, for the sale and lease back of four Airbus A321 received in our fleet in 2016. The term of each of the leases is 10 years and the estimated market value (at list prices) of these aircraft is US$200 million.
Jackson Square
During 2016, we entered into operating lease agreements with JSA Aircraft 7126, LLC, JSA Aircraft 7128, LLC, JSA Aircraft 7239, LLC and JSA Aircraft 7298, LLC, for the sale and lease back of three Airbus A321 and one Airbus A320 Neo received in our fleet in 2016. The term of each of the leases is 10 years and the estimated market value (at list prices) of these aircraft is US$200 million.
SABRE Contract
In November 2009, we entered into a master agreement with SABRE Inc., pursuant to which LATAM was granted with access and use of certain reservation systems and other SABRE software solutions. This agreement will remain in force for five years or until the expiration of all Work Orders to the agreement. In addition, on May 4, 2015, we entered into a Master Services License Agreement with SABRE Inc. Pursuant to this agreement SABRE Inc., will grant LATAM access and use of certain reservation systems. This agreement will enter into force after the expiration of Work Order No. 1 to the agreement entered in November 2009 by LATAM and SABRE Inc. and will be effective for an initial period of 10 years.
In addition, LATAM has distribution agreements in place with SABRE as well as with other distribution providers.
TAM Material Contracts
A320/A330 Family Purchase Agreements
In November 2006, TAM entered into a purchase agreement with Airbus S.A.S. for the purchase of 31 A320-Family Aircraft and 6 sixA330-200 aircraft, with deliveries between 2007 and 2010.
In January 2008, TAM entered into a new purchase agreement for 20 A320-Family Aircraft and 4 fourA330-200 aircraft, with deliveries between 2007 and 2014.
In July 2010, TAM entered a purchase agreement for 20 A320-Family Aircraft with deliveries between 2014 and 2015.
In October 2011, TAM entered into a new purchase agreement for 10 A320-Family Aircraft with deliveries between 2016 and 2017, plus 22 A320 NEO Family Aircraft with deliveries between 2016 and 2018, plus 10 options rights for A320 NEO Family Aircraft.
In January 2012, TAM entered into Amendment No. 12 to the A320/A330 Purchase Agreement to reschedule the delivery dates of certain aircraft.
In November 2012, TAM entered into Amendment No. 13 to the A320/A330 Purchase Agreement to convert the aircraft type of A320 family aircraft.
In December 2012, TAM entered into Amendment No. 14 to the A320/A330 Purchase Agreement to convert the aircraft type of an A320 family aircraft and reschedule the delivery date of such aircraft.
In February 2013, TAM entered into Amendment No. 15 to the A320/A330 Purchase Agreement to make some changes to the scheduled delivery month of certain A320 Family Aircraft.
In February 2013, TAM entered into Amendment No. 16 to the A320/A330 Purchase Agreement to make a change to the aircraft type of certain A320 Family Aircraft, to the scheduled delivery month/quarter of certain A320 Family Aircraft and to make certain changes to the dates by which TAM will select the propulsion systems and NEO propulsion systems for certain Aircraft.
In August 2013, TAM entered into Amendment No. 17 to the A320/A330 Purchase Agreement to make a change to the scheduled delivery month of a certain A320 Family Aircraft and to make the selection of the propulsion systems and NEO propulsion systems for certain Aircraft.
In December 2014, TAM entered into Amendment No. 19 to the A320/A330 Purchase Agreement to reschedule and substitute certain A321 Aircraft.
In June 2015, TAM entered into Amendment No. 20 to the A320/A330 Purchase Agreement to make a change to the schedule delivery month of one A321 Aircraft.
In December 2015, TAM entered into Amendment No. 21 to the A320/A330 Purchase Agreement to make a change to the schedule delivery month of two A320 NEO Aircraft.
On April 15, 2016, we entered into amendment No. 22 to the A320/A330 Purchase Agreement covering the rescheduling of the delivery of one A321 Aircraft.
On April 15, 2016, we entered into amendment No. 23 to the A320/A330 Purchase Agreement to reflect the changes in the technical specifications of the aircraft to be received under this agreement.
On August 8, 2016, we entered into amendment No. 24 to the A320/A330 Purchase Agreement to cancel the delivery of eight A320 NEO Aircraft.
A350 Family Purchase Agreement
In January 2008, TAM entered into a purchase agreement with Airbus S.A.S. for the purchase of 22 A350 aircraft plus 10 options rights for A350 aircraft. On
In July 2010, TAM exercised option rights for 5 ofentered into amendment No. 1 to the A350 purchase agreement to exercise its option of five A350 XWB options.
In July 2014, TAM entered into amendment No. 2 to the A350 purchase agreement to reschedule the delivery of certain A350-900XWB and to amend certain provisions to reflect the latest aircraft withspecification.
In July 2014, TAM, LATAM and Airbus entered into a novation agreement novating the remainingA350 purchase agreement from TAM to LATAM.
In October 2014, we entered into amendment No. 3 to the A350 purchase agreement to reschedule the scheduled delivery month of a certain A350-900XWB aircraft.
In September 2015, we entered into amendment No. 4 to the A350 purchase agreement to modifiy certain terms and conditions of such agreement and to convert a number ofA350-900 XWB Aircraft into A350-1000 XWB Aircraft.
In November 2015, we entered into amendment No. 5 option rights to be exercised in the future.A350 purchase agreement to convert a number ofA350-900 XWB aircraft into six A350-1000 XWB aircraft and to reschedule the delivery of certainA350-900 XWB.
On February 3, 2016, we entered into amendment No. 6 to the A350 purchase agreement to reschedule the delivery of two A350—900 XWB Aircraft.
On August 8, 2016, we entered into amendment No. 7 to the A350 purchase agreement to change aircraft type, from twoA350-900 XWB Aircraft to two A350—1000 XWB Aircraft.
On September 9, 2016, we entered into amendment No. 8 to the A350 purchase agreement to reschedule the delivery of two A350—900 XWB Aircraft.
Boeing 777 Purchase Agreement
In February 2007, TAM entered into a purchase agreement with Boeing for the purchase of four Boeing777-32WER aircraft.
In August 2007, TAM entered into supplemental agreement No. 1 to the 777 Purchase Agreement to exercise four option aircraft and to define certain aircraft configuration.
In March 2008, TAM entered into supplemental agreement No. 2 to the 777 Purchase Agreement to document its agreement on the descriptions and pricing of some options and master changes related to certain aircraft.
In December 2008, TAM entered into supplemental agreement No. 3 to the 777 Purchase Agreement for the purchase of two incremental 777 aircraft.
In July 2010, TAM entered into supplemental agreement No. 5 to the 777 Purchase Agreement to reschedule the delivery of certain aircraft.
In February 2011, TAM entered into supplemental agreement No. 6 to the 777 Purchase Agreement for the purchase of two incremental 777 aircraft.
In May 2014, TAM entered into supplemental agreement No. 7 to the 777 purchase agreement to substitute two777-300ER Aircraft originally scheduled for delivery in 2014 for two777-F aircraft for scheduled delivery in 2017.
In April 2015, TAM entered into supplemental agreement No. 8 to the 777 purchase agreement to reschedule the delivery of certain aircraft.
CFM56-5B Engine Maintenance Contract
In March 2006, TAM entered into an exclusivea services agreement with GE Celma, a Brazilian subsidiary of General Electric Engine Services division, which remains in force untilfor the latest Airbusmaintenance by GE Celma ofCFM56-5B engines to power 25 A320 family aircraft powered by CFM56-5Band four spare engines.
In March 2007 TAM entered into the Amendment 1 to the above-mentioned services agreement with GE Celma, extending the maintenance services to the engines is delivered to TAM (scheduled to occur in 2026).powering additional 16 A320 family aircraft and two spare engines.
V2500-A5 Engine Maintenance Agreement
In 2000, TAM entered into an engine maintenance contract with MTUMotoren-und Turbinen-Union München GmbH, or MTU, pursuant to which MTU agreed to provide certain maintenance, refurbishment, repair and modification services with respect to approximately 105TAY650-15 aircraft engines. This contract is complemented by a novation and amendment agreement between us and Rolls-Royce Brazil Ltda. pursuant to which Rolls-Royce Brazil Ltda., replaced MTU as contract counterparty. This agreement terminates on June 30, 2015.
PW4168 Engine Maintenance Agreement
In June 2007, TAM Linhas Aéreas S.A. entered into ana purchase and support agreement engine sale, support and maintenance services agreement with Pratt & Whitney covering more than 20 engines contained in TAM’sA330-200 fleet. fleet six aircraft plus two spares. It is also a rate per engine flight hour contract agreement, which includes cost control mechanisms for TAM. Amendment 3 July 2010 10 aircraft 4 spares.
SabreSABRE Contract
In October 2003, TAM entered into a general services agreement with SabreSABRE Travel International Limited, pursuant to which TAM was granted a license (relating to the provision of maintenance services) for electronic reservation technology and database backup. The term of the agreement was tacitly and automatically extended to cover all Work Orders currently in force under the agreement and will expire at the same time with the expiration of the last Work Order. In addition, TAM has distribution agreements in place with SABRE as well as with other distribution providers.
In adittion, on May 4, 2015, we entered into a Master Services License Agreement with SABRE Inc. Pursuant to this agreement SABRE Inc., will grant TAM access and use of certain reservation systems. This agreement will remain inenter into force after the expiration of that Work Order No. 1 to the November 2009 agreement between LATAM and SABRE Inc., and will be effective for ten years, unless cancelled early by either party.an initial period of 10 years.
Amadeus Contract
In July 2009, TAM entered into a general services agreement with Amadeus IT Group S.A., pursuant to which TAM was granted a license (relating to the provision of maintenance services) for electronic reservation technology and database backup. ThisThe term of this agreement will remain in force forwas ten years, unless cancelledterminated early by either party. On March 1, 2016, as part of LATAM’s plan to unify the Passenger Service Platform and migrate to a single service provider, TAM sent Amadeus an early termination notice to be effective during 2017. In addition, TAM has distribution agreements in place with Amadeus as well as with other distribution providers.
D. Exchange Controls
Foreign Investment and Exchange Controls in Chile
The Central Bank of Chile is responsible, among other things, for monetary policies and exchange controls in Chile. Equity investments, including investments in shares of stock by persons who arenon-Chilean residents, have been generally subject in the past to various exchange control regulations restricting the repatriation of their investments and the earnings thereon.
Article 47 of the Central Bank Act and former Chapter XXVI of the Central Bank Foreign Exchange Regulations regulated the foreign exchange aspects of the issuance of ADSs by a Chilean company until April 2001. According to former Chapter XXVI, the Central Bank of Chile and the depositary had to enter into an agreement in order to gain access to the formal exchange market. The issuers of the shares underlying the ADSs and the custodian could also be parties to these agreements.
On April 16, 2001, the Central Bank of Chile agreed that, effective April 19, 2001:
| • | a new Compendium of Foreign Exchange Regulations (Compendio de Normas de Cambios Internacionales) would be applied. |
The main objective of these amendments, as declared by the Central Bank of Chile, is to facilitate movement of capital in and out of Chile and to encourage foreign investment.
In connection with the change in policy, the Central Bank of Chile eliminated the following restrictions:
Under the new regulations, only the following limitations apply to these operations:
| Under | the new regulations, only the following limitations apply to these operations: |
The Central Bank of Chile also eliminated Chapter XXVI of the Compendium of Foreign Exchange Regulations, which regulated the establishment of an ADR facility by a Chilean company. Pursuant to the new rules, it is no longer necessary to seek the Central Bank of Chile’s prior approval in order to establish an ADR facility noror to enter into a foreign investment contract with the
Central Bank of Chile. The establishment of an ADR facility is now regarded as an ordinary foreign investment, and simply requires that the Central Bank of Chile be informed of the transaction pursuant to Chapter XIV of the amended Compendium of Foreign Exchange Regulations and that the foreign currency transactions related thereby be conducted through the Formal Exchange Market.
However, all contracts executed under the provisions of former Chapter XXVI (including the foreign investment contract among LATAM Airlines Group, the Central Bank of Chile and the ADS depositary, or the “Foreign Investment Contract”), remained in full force and effect and continued to be governed by the provisions, and continued to be subject to the restrictions, set forth in former Chapter XXVI at the time of its abrogation. Our Foreign Investment Contract guaranteed ADS investors access to the Formal Exchange Market to convert amounts from Chilean pesos into U.S. dollars and repatriate amounts received with respect to deposited common shares or common shares withdrawn from deposit or surrender of ADRs (including amounts received as cash dividends and proceeds from the sale in Chile of the underlying common shares and any rights arising from them).
On May 10, 2007, the Board of the Central Bank of Chile resolved to interpret the regulations regarding the former Chapter XXVI in connection with the access granted to the Formal Exchange Market. These regulations allowed entities that carry out capital increases by means of the issuance of cash shares before August 31, 2007 to apply the aforementioned regulation to their capital increases, but only once and only if those shares can be fully subscribed and paid by August 31, 2008, among other conditions. Consequently, capital increases carried out after August 31, 2007 will have no guaranteed access to the Formal Exchange Market.
On October 17, 2012, the Central Bank of Chile, the depositary and LATAM Airlines Group entered into a termination agreement in respect of LATAM’s existing foreign investment contract. ADR holders were notified about this termination in accordance with Section 16 of the Deposit Agreement. Upon termination of the foreign investment contract, holders of ADSs and the depositary no longer have guaranteed access to the Formal Exchange Market. Currently, the ADS facility is governed by Chapter XIV of the Compendium on “Regulations applicable to Credits, Deposits, Investments and Capital Contributions from Abroad.” According to Chapter XIV, the establishment or maintenance of an ADS facility is regarded as an ordinary foreign investment, and it is not necessary to seek the Central Bank of Chile’s prior approval in order to establish an ADS facility. The establishment or maintenance of an ADS facility only requires that the Central Bank of Chile be informed of the transaction, and that the foreign currency transactions related thereby be conducted through the Formal Exchange Market.
Investment in Our Shares and ADRs after the business combination with TAM
As a result of the mergercombination with TAM, investments made in shares of our common stock are subject to the following requirements:
When funds are brought into Chile for a purpose other than to acquire shares to convert them into ADSs or deposit them into an ADR program and subsequently such funds are used to acquire shares to be converted into ADSs or deposited into an ADR program such investment must be reported to the Central Bank of Chile by the custodian within 10 days following the end of each month within which the custodian is obligated to deliver periodic reports to the Central Bank of Chile.
When funds to acquire shares of our common stock or to acquire shares to convert them into ADSs or deposit them into an ADR program are received by us abroad (i.e., outside of Chile), such investment must be reported to the Central Bank of Chile directly by the foreign investor or by an entity participating in the Formal Exchange Market within ten days following the end of the month in which the investment was made.
All payments in foreign currency in connection with our shares of common stock or ADSs made from Chile through the Formal Exchange Market must be reported to the Central Bank of Chile by the entity participating in the transaction. In the event there
are payments made outside of Chile, the foreign investor must provide the relevant information to the Central Bank of Chile directly or through an entity of the Formal Exchange Market within the first ten calendar days of the month following the date on which the payment was made.
There can be no assurance that additional Chilean restrictions applicable to the holders of ADSs, the disposition of shares of our common shares underlying ADSs or the conversion or repatriation of the proceeds from such disposition will not be imposed in the future, nor can we assess the duration or impact of such restriction if imposed.
This summary does not purport to be complete and is qualified by reference to Chapter XIV of the Central Bank of Chile’s Foreign Exchange Regulations, a copy of which is available in Spanish and English versions at the Central Bank’s website at www.bcentral.cl.
Voting Rights
Holders of our ADSs, which represent common shares, may instruct the depositary to vote the shares underlying their ADRs. If we ask holders for instructions, the depositary will notify such holders of the upcoming vote and arrange to deliver our voting materials to such holders. The materials will describe the matters to be voted on and explain how holders may instruct the depositary to vote the shares or other deposited securities underlying their ADSs as they direct by a specified date. For instructions to be valid, the depositary must receive them on or before the date specified as “VoteCut-Off Date.” The depositary will try, as far as practical, subject to Chilean law and the provisions of ourby-laws, to vote or to have its agents vote the shares or other deposited securities as holders instruct. Otherwise, holders will not be able to exercise their right to vote unless they withdraw the shares. However, holders may not know about the meeting far enough in advance to withdraw the shares. We will use our best efforts to request that the depositary notify holders of upcoming votes and ask for their instructions.
If the depositary does not receive voting instructions from a holder by the specified date, it will consider such holder to have authorized and directed it to give a discretionary proxy to a person designated by our board of directors to vote the number of deposited securities represented by such holder’s ADSs. The depositary will give a discretionary proxy in those circumstances to vote on all questions to be voted upon unless we notify the depositary that:
The depositary will only vote or attempt to vote as such holder instructs or as described above.
We cannot assure holders that they receive the voting materials in time to ensure that they can instruct the depositary to vote their shares. This means that holders may not be able to exercise their right to vote and there may be nothing they can do if their shares are not voted as they requested.
Exchange Rates
Prior to 1989, Chilean law permitted the purchase and sale of foreign exchange only in those cases explicitly authorized by the Central Bank of Chile. The Central Bank Act liberalized the rules that govern the ability to buy and sell foreign currency. The Central Bank Act empowers the Central Bank of Chile to determine that certain purchases and sales of foreign currency specified by law must be carried out exclusively in the Formal Exchange Market, which is made up of the banks and other entities authorized by the Central Bank of Chile. All payments and distributions with respect to the ADSs must be conducted exclusively in the Formal Exchange Market.
For purposes of the operation of the Formal Exchange Market, the Central Bank of Chile sets a reference exchange rate (dólar acuerdo). The Central Bank of Chile resets the reference exchange rate monthly, taking internal and external inflation into account, and adjusts the reference exchange rate daily to reflect variations in parities between the Chilean peso, the U.S. dollar, the Japanese yen and the European euro.
The observed exchange rate (dólar observado) is the average exchange rate at which transactions were actually carried out in the Formal Exchange Market on a particular day, as certified by the Central Bank of Chile on the next banking day.
Prior to September 3, 1999, the Central Bank of Chile was authorized to buy or sell dollars in the Formal Exchange Market to maintain the observed exchange rate within a specified range above or below the reference exchange rate. On September 3, 1999, the Central Bank of Chile eliminated the exchange band. As a result, the Central Bank of Chile may buy and sell foreign exchange in the Formal Exchange Market in order to maintain the observed exchange rate at a level the Central Bank of Chile determines.
Purchases and sales of foreign exchange may be effected outside the Formal Exchange Market through the Informal Exchange Market (Mercado Cambiario Informal) established by the Central Bank in 1990. There are no limits on the extent to which the rate of exchange in the Informal Exchange Market can fluctuate above or below the observed exchange rate.
Although our results of operations have not been significantly affected by fluctuations in the exchange rates between the peso and the U.S. dollar because our functional currency is the U.S. dollar, we are exposed to foreign exchange losses and gains due to exchange rate fluctuations. Even though the majority of our revenues are denominated in or pegged to the U.S. dollar, the Chilean government’s economic policies affecting foreign exchange and future fluctuations in the value of the peso against the U.S. dollar could adversely affect our results of operations and an investor’s return on an investment in ADSs.
E. Taxation
Chilean Tax
The following discussion relates to Chilean income tax laws presently in force, including Ruling No. 324 of January 29, 1990 of the Chilean Internal Revenue Service (“Chilean IRS”) and other applicable regulations and rulings, all of which are subject to change. The discussion summarizes the principal Chilean income tax consequences of an investment in the ADSs or common shares by a person who is neither domiciled in, nor a resident of, Chile or by a legal entity that is incorporated abroad not organized under the laws of Chile and does not have a branch or a permanent establishment located in Chile (such an individual or entity is referred to herein as a Foreign Holder). For purposes of Chilean tax law, an individual holder is a resident of Chile if such person has resided in Chile for more than six consecutive months in one calendar year or for a total of six months whether consecutive or not, in two consecutive tax years. In addition, an individual is considered domiciled in Chile in case he or she resides in Chile with the actual or presumptive intent of staying in the country. The discussion is not intended as tax advice to any particular investor, which can be rendered only in light of that investor’s particular tax situation.
Under Chilean law, provisions contained in statutes such as tax rates applicable to foreign investors, the computation of taxable income for Chilean purposes and the manner in which Chilean taxes are imposed and collected may only be amended by another statute. In addition, the Chilean tax authorities enact rulings and regulations of either general or specific application and interpret the provisions of Chilean tax law. Chilean tax may not be assessed retroactively against taxpayers who act in good faith relying on such rulings, regulations and interpretations, but Chilean tax authorities may change these rulings, regulations and interpretations prospectively. On February 4, 2010, representatives of the governments of the United States and Chile signed an income tax treaty. The treaty which takeswill have to be approved by the U.S. Senate before it may become effective.
Law No. 20,780, enacted on September 29, 2014, in conjunction with Law No. 20,899, enacted on February 8, 2016 (both, the “Tax Reform Act”) introduced a comprehensive modification to the Chilean income tax system. The Tax Reform Act introduced changes to the corporate tax rate, mandating a gradual increase of the rate from 20% to 25% or 27% in certain cases, the rules regarding minimum capitalization, and the taxation of Chilean investments abroad (the controlled-foreign-corporation rules), and introduced two new alternative general income tax regimes for Chilean taxpayers (Fully Integrated Regime and Partially Integrated Regime), among others. The new rules are set to come into effect only upon ratificationgradually, with the implementation process having commenced on October 1, 2014 and set to be completed by both countries.January 1, 2018. The Fully Integrated Regime and the Partially Integrated Regime apply as from January 1, 2017. The mandatory regime for entities organized as stock corporations like Latam Airlines Group S.A. is the Partially Integrated System. The Corporate Income Tax rate for companies under this regime is 27% from 2018 onward. A transition rate of 25.5% applies in 2017.
Cash Dividends and Other Distributions
CashUnder the new Partially Integrated Regime, cash dividends we pay with respect to the ADSs or common shares held by a Foreign Holder will be subject to a 35% Chilean withholding tax, which we withhold and pay over to the Chilean tax authorities and which we refer to as the Withholding Tax. A
credit against the Withholding Tax is available based on the levelcorporate income tax rate of the year of distribution and provided a sufficient balance of accumulated corporate income tax credits is available. These credits correspond to corporate income tax we actually paid on the accumulated income to be distributed (referred to herein as the First Category Tax); however,Tax or FCIT). However, this credit does not reduce the Withholding Tax on aone-for-one basis because it also increases the base on which the Withholding Tax is imposed. If we register net income but taxable losses, no credit against the Withholding Tax willmay be available. In addition, if we distribute less than all of our distributable income, the credit for First Category Tax we pay is proportionately reduced. Last year, law 20.630 modified and fixed
The Partially Integrated Regime reduces the rate provisionalamount of First Category Tax creditable against the Withholding Tax for certain
Foreign Holders. As a general rule, only 65% of the first categoryFirst Category Income Tax credit will actually offset the Withholding Tax. 35% of the credit must be added back to the Withholding Tax amount to be paid into the Treasury (referred to herein as First Category Tax Credit Restitution). However, if a tax from 18.5%treaty is in place between Chile and the country of domicile of a Foreign Holder and such Foreign Holder is entitled to 20% from 2012 onwards.treaty benefits in relation to the income, the full First Category Tax credit will continue to be available to offset against the Withholding Tax.
Under a transitory provision in force until December 31, 2019, the full 27% First Category Tax will also be creditable against the 35% Withholding Tax if the recipient of a dividend distribution is a shareholder resident in a country with which Chile has a tax treaty signed before January 1st, 2017, although such treaty is not yet in force.
In general, the example below illustrates the effective Withholding Tax burden on a cash dividend received by a Foreign Holder assuming a Withholding Tax rate of 35%, a First Category Tax rate of 20%,27% and a distribution of 30% of the consolidated net income of the Company after payment of the First Category Tax:
| Foreign Holder in Treaty Country | Foreign Holder in Non Treaty country | |||||||
The Company’s taxable income | 100.00 | 100.00 | ||||||
First Category Tax (27% of Ch$100)(*) | (27.00 | ) | (27.00 | ) | ||||
Net distributable income | 73.00 | 73.00 | ||||||
Dividend distributed (*) | 21.90 | 21.90 | ||||||
First category increase | 8.10 | 8.10 | ||||||
Amount subject to Withholding Tax (**) | 30.00 | 30.00 | ||||||
Withholding Tax | (10.50 | ) | (10.50 | ) | ||||
Credit for First Category Tax | 8.10 | 8.10 | ||||||
Add back 35% of the First Category Tax | N/A | (2.84 | ) | |||||
Net tax withheld | (2.40 | ) | (5.24 | ) | ||||
Net dividend received | 19.5 | 16.66 | ||||||
Effective dividend withholding rate | 11 | % | 24 | % | ||||
| (*) | Special considerations apply to a distribution in 2017 |
| (**) | 30% of net distributable income. |
| (**) | ||||
The | ||||
dividend of Ch$21.90 grossed up with the First Category Tax | ||||
| ||||
| ||||
| ||||
| ||||
| ||||
| ||||
| ||||
|
In general, the effective dividend Withholding Tax rate, after giving effect to the credit for the First Category Tax, can be calculated using the following formula:
(Withholding Tax rate) – (First Category Tax effective rate)1 – (First Category Tax effective rate)
Under Chilean income tax law, dividends generally are assumed to have been paid out of our oldest retained profits for purposes of determining the level of First Category Tax that we paid. The effective rate of Withholding Tax to be imposed on dividends we pay will vary depending upondepend on the amountFirst Category Tax rate applicable in the year of distribution and on the balance of First Category Income Tax credits accumulated by the company. The First Category Tax rate will be 27% for 2018 and following years. Special considerations apply to a distribution in 2017. These considerations are set out in a separate paragraph further below. The First Category Income Tax credits generated under the new tax regime, i.e. as of 2017, will be allocated first. Once the balance of First Category Tax credits generated as of 2017 are exhausted, the First Category Tax credits accumulated until December 31, 2016 will be used. In that event the First Category Tax credit available against the Withholding Tax will not correspond to the First Category Tax rate of the year of distribution but to the average rate of First Category Tax credits accumulated until December 31, 2016. This average rate will be determined by dividing the aggregate First Category Tax Credits accumulated until December 31, 2016 by the aggregate retained taxable profits accumulated at the same date. The First Category Tax credits accumulated until December 31, 2016 are not subject to the First Category Tax Credit Restitution irrespective of whether a tax treaty is in place with the country of the Foreign Holder or not.
The First Category Tax credits accumulated until December 31, 2016 correspond to the First Category Tax we actually paid (if any) on the income generated in a given year. For earnings to which the dividends are attributed, according to the Company’s Taxable Profit Fund. The Effective Withholding Tax rate for dividends attributed to earningsgenerated from 1991 until 2001, for which the First Category Tax rate was 15%, which results in an effective rate of 23.5%. For 2002, the First Category TaxThe rate was 16.0%, which results in an effective rate of 22.62%. In2002, 16.5% in 2003, the First Category Tax rate was 16.5%, which results in an effective rate of 22.16%,17% from 2004 until 2010, the First Category Tax rate was 17%, which results20% from 2011 until 2013, 21% in an effective rate of Withholding Tax of 21.69%, In 2011 the First Category Tax rate was 20%, which results2014, 22.5% in an effective rate of Withholding Tax of 18.75%. In 2012 the First category Tax rate was 20%, which results2015 and 24% in an effective rate of Withholding Tax of 18.75%. From 2013 onwards the First category Tax rate will be 20%, which results in an effective rate of Withholding Tax of 18.75%,2016.
For dividends attributable to our profits during years when the First Category Tax was 10% (before 1991), the effective rate will be 27.8%. However, whether the First Category Tax is 10%, 15%, 16%, 16.5% or 17%, the effective overall combined tax rate imposed on our distributed profits will be 35%. In the event that profits from previous yearsthe accumulated First Category Tax credits are not sufficient to cover aany particular dividend, and the dividend is attributable to the current year, we will generally withhold tax from the dividend at the full 35% rate. If as of December 31 of the year in which the dividend is paid, the withholding is determined to be excessive taking into account First Category Tax, holders may file for a refund.
Dividend distributions made in property would be subject to the same Chilean tax rules as cash dividends based on the fair market value of such property. Stock dividends and the distribution of preemptive rights are not subject to Chilean taxation.
Special Considerations for distributions in 2017
The First Category Tax rate for 2017 is 25.5%. However, in 2017 the First Category Tax credit available against the Withholding Tax will not correspond to the First Category Tax rate of the year but to the average rate of First Category Tax credits accumulated until December 31, 2016. This average rate will be determined by dividing the aggregate First Category Tax Credits accumulated until December 31, 2016 by the aggregate retained taxable profits accumulated at the same date. These credits are not subject to the First Category Tax Credit Restitution, irrespective of whether a tax treaty is in place with the country of the Foreign Holder or not.
Capital Gains
Gain from the sale or other disposition by a Foreign Holder of ADRs evidencing ADSs outside Chile will not be subject to Chilean taxation. The deposit and withdrawal of common shares in exchange for ADRs will not be subject to any Chilean taxes.
Gain recognized on a sale or disposition of common shares by a Foreign Holder (as distinguished from sales or exchanges of ADRs evidencing ADSs representing such common shares) may be subject to both the First Categorya 35% Withholding Tax. Moreover, a gain not exceeding 10 Annual Tax and the Withholding Tax (the former being creditable against the latter) if:
In all other cases,The gain on the disposition of common shares will be subject only to a flat capital gains tax which is assessed at the same rate as the First Category Tax as sole income tax (18.5% or 20% in 2012, and from 2013 onwards 20%) and no withholding tax will apply. The sale of shares of common stock by a Foreign Holder is subject to an individual or entity resident or domiciled in Chilea withholding of 35% of the gain. If the gain subject to taxation cannot be determined, the Foreign Holder is subject to a provisional withholding. Such a provisional withholding will be equal to (i) 5%of 10% of the total (sale price) amount, without any deduction, when the amounts are paid to, credited to, accountaccounted for, put at the disposal of, or corresponding to, the Foreign Holder if the transaction is subject to the First Category Tax, as a sole tax. Unless the gain subject to taxation can be determined, case in which the withholding is equal to 20% or 18.5% (this last rate if the sale was between January to August 2012) , on the gain, or (ii) 20% of the total amount (the sale price without any deduction), paid to, credited to, account for, put at the disposal of, or corresponding to, the Foreign Holder if the transaction is subject to the general tax regime, that is, the First Category Tax, and the Withholding Tax, with a credit of the First Category Tax already paid. TheHolder.The Foreign Holder would be entitled to request a tax refund for any amounts withheld in excess of the taxes actually due in April of the following year upon filing its corresponding tax return. Gain recognized in the transfer of common shares that have a high presence in the stock exchange, however, is not subject to capital gains tax in Chile, provided that the common shares are transferred in a local stock exchange in other authorized stock exchanges or within the process of a public tender of common shares governed by the Securities Market Law.
Chile’s Internal Revenue Service Ruling Nº224 (issued on January 30, 2008) confirmed that capital gains stemming from the sale of shares with high stock-market presence acquired through the exchange of American Depositary Receipts (ADRs) for shares is not subject to capital gains tax in Chile. Such exemption is applicable provided that the purchase of such ADR certificates has been made at stock exchanges duly authorized by SVS (which includes the New York Stock Exchange).
The common shares must also have been acquired either in a local stock exchange, within the process of a public tender of common shares governed by the Securities Market Law, in an initial public offer of common shares resulting from the formation of a corporation or a capital increase of the same, or in an exchange of convertible bonds.
Please note that, Chile’s IRS Ruling No. 1,480 (issued on August 22, 2014) confirmed that capital gains stemming from the sale of shares with high stock market presence acquired through the exchange of American Depositary Receipts (ADRs) for shares is not subject to capital gains tax in Chile. Such exemption is applicable provided that the ADRs comply with the requirements established by the Chilean Superintendence for Securities and Insurance (SVS) for the public offering of securities in Chile (i.e. if the ADRs are registered in the Foreign Securities Registry of the SVS, or their registration has been exempted by the SVS under a cooperation agreement signed with regulators of foreign markets), and the underlying shares have been registered in the Securities Registry of the SVS and on a Chilean Stock exchange. Shares are considered to have a high presence in the stock exchange when they:
| i. | have an adjusted presence equal to or above 25%; |
| ii. | have a Market Maker. |
To calculate the adjusted presence of a particular share, the aforementioned regulation first requires a determination of the number of days in which the operations regarding the stock exceeded, in Chilean pesos, the equivalent of 1,000 UF (US$44,43239,356 as of December 31, 2013)2016) within the previous 180 business days of the stock market. That number must then be divided by 180, multiplied by 100, and expressed in a percentage value. This tax regime does not apply if the transaction involves an amount of shares that would allow the acquirer to take control of the publicly traded corporation, in which case the ordinary tax regime referred to in the previous paragraph will apply, unless the transfer is part of a tender offer governed by the Securities Market Law or the transfer is done on a Chilean stock exchange, without substantially exceeding the market price.
CapitalTo meet the “Market Maker” requirement the issuer of the shares must execute a written contract with a stock broker incorporated in Chile that fulfills some additional requirements.
A capital gains tax exemption for “foreign institutional investors” such as mutual funds and pension funds was repealed as from May 1, 2014 by Law 20,712. However, the law includes a grandfathering provision for shares acquired before May 1, 2014. This provision establishes an exemption on the capital gain obtained in the sale of shares that are publicly traded and have a high presence in a stock exchange are also exempt from capital gains tax in Chile when the sale is made by “foreigna foreign institutional investors” such as mutual funds and pension funds,investor, provided that the sale is made in a local stock exchange or in a public tender in accordance with the provisions of the Securities Market Law, or in any other form authorized by the SVS. Toredemption of fund quotas, and the shares were acquired before May 1, 2014.
Pursuant to the regulations of the grandfathering rule, to qualify as a foreign institutional investor an entity must be formed outside of Chile, not have a domicile in Chile, and must be at least one of the following:
| • | an insurance company regulated by the competent regulatory authority of the insurance business, as appropriate, which must be part of IAIS,International Association of Insurance Supervisors, or ASSAL,Asociación de Supervisores de Seguros de América Latina; |
The foreign institutional investor must not directly or indirectly participate in the control of the corporations issuing the shares it invests in, nor possess or participate directly or indirectly in 10% or more of the capital or the profits of such corporations.
Another requirement for the exemption is that the foreign institutional investor must execute a written contract with a bank or a stock broker incorporated in Chile. In this contract, the bank or stock broker must undertake to execute purchase and sale orders, verify the applicability of the tax exemption or tax withholding and inform the Chilean IRS of the investors it works with and the transactions it performs. Finally, the foreign institutional investor must register with the Chilean IRS by means of a sworn statement issued by such bank or stock broker.
The tax basis of common shares received in exchange for ADRs will be the acquisition value of the common shares on the date of exchange duly adjusted for local inflation. The valuation procedure set forth in the deposit agreement, which values common shares which are being exchanged at the highest price at which they trade on the SSE on the date of the exchange, will determine the acquisition value for this purpose. Consequently, the surrender of ADRs for common shares and the immediate sale of the common shares for the value established under the Deposit Agreement will not generate a capital gain subject to taxation in Chile, provided that the sale of the common shares is made on the same date on which the exchange of ADRs for common shares is recorded, or if the price of the common shares at the exchange date, as determined above, is higher than the price at which the common shares are sold.
The exercise of preemptive rights relating to the common shares will not be subject to Chilean taxation. Any gain obtained by a Foreign Holder without taxable presence in Chile on the sale of preemptive rights relating to the common shares will be subject to both the First Category Tax and the Withholding Tax (the former being creditable against the latter).
Other Chilean Taxes
There are no Chilean inheritance, gift or succession taxes applicable to the ownership, transfer or disposition of ADSs by a Foreign Holder, but such taxes generally will apply to the transfer at death or by gift of the common shares by a Foreign Holder. There are no Chilean stamp, issue, registration or similar taxes or duties payable by Foreign Holders of ADSs or common shares.
Withholding Tax Certificates
Upon request, we will provide to Foreign Holders appropriate documentation evidencing the payment of the Withholding Tax (net of the applicable First Category Tax)Tax credit).
United States Federal Income Tax Considerations
This section describes the material United States federal income tax consequences to a U.S. holder (as defined below) of owning common shares or ADSs. It applies to you only if you hold your common shares or ADSs as capital assets for tax purposes. This section does not apply to you if you are a member of a special class of holders subject to special rules, including:
This section is based on the Internal Revenue Code of 1986, as amended, its legislative history, existing and proposed regulations, published rulings and court decisions, all as currently in effect. These laws are subject to change, possibly on a retroactive basis. As described above in “—Taxation—Chilean Tax”, thereThere is currently no comprehensive income tax treaty in effect between the United States and the Republic of Chile. In addition, this section is based in part upon the representations of the Depositary and the assumption that each obligation in the Deposit Agreement and any related agreement will be performed in accordance with its terms.
If a partnership holds the common shares or ADSs, the United States federal income tax treatment of a partner will generally depend on the status of the partner and the tax treatment of the partnership. A partner in a partnership holding the common shares or ADSs should consult its tax advisor with regard to the United States federal income tax treatment of an investment in the common shares or ADSs.
You are a U.S. holder if you are a beneficial owner of common shares or ADSs and you are:
You should consult your own tax advisor regarding the United States federal, state and local and the Chilean and other tax consequences of owning and disposing of common shares and ADSs in your particular circumstances.
ADSs
In general, and taking into account the earlier assumptions, for United States federal income tax purposes, if you hold ADRs evidencing ADSs, you will be treated as the owner of the common shares represented by those ADRs. Exchanges of common shares for ADRs, and ADRs for common shares, generally will not be subject to United States federal income tax.
Taxation of Dividends
Under the United States federal income tax laws, and subject to the passive foreign investment company (“PFIC”) rules discussed below, if you are a U.S. holder, the gross amount of any dividend we pay out of our current or accumulated earnings and profits (as determined for United States federal income tax purposes) is subject to United States federal income taxation.
If you are a noncorporate U.S. holder, dividends paid on the ADSs or common shares that constitute qualified dividend income will be taxable to you at the preferential rates applicable to long-term capital gains if you hold the ADSs or common shares for more than 60 days during the121-day period beginning 60 days before theex-dividend date and meet other holding period requirements. Dividends paid on the ADSs or common shares will be treated as qualified dividend income if:
We believe that our common shares and ADSs should not be treated as stock of a PFIC for United States federal income tax purposes. See “—PFIC Rules” below. The ADSs are listed on the New York Stock Exchange, and will qualify as readily tradable on an established securities market in the United States so long as they are so listed. Accordingly, we expect that dividends we pay with respect to the ADSs will be qualified dividend income. Because our common shares are not expected to be listed on any United States securities market, it is unclear whether dividends we pay with respect to the common shares will also be qualified dividend income. If dividends we pay with respect to our common shares are not qualified dividend income, then the U.S. dollar amount of such dividends received by a U.S. holder (including dividends received by a noncorporate U.S. holder) will be subject to taxation at ordinary income tax rates.
You must include any Chilean tax withheld from the dividend payment in this gross amount even though you do not in fact receive it. The dividend is taxable to you when you, in the case of common shares, or the Depositary, in the case of ADSs, receive the dividend, actually or constructively. The dividend will not be eligible for the dividends-received deduction generally allowed to United States corporations in respect of dividends received from other United States corporations. The amount of the dividend distribution that you must include in your income as a U.S. holder will be the U.S. dollar value of the Chilean pesos payments made, determined at the spot Chilean pesos/U.S. dollar rate on the date the dividend distribution is includible in your income, regardless of whether the payment is in fact converted into U.S. dollars. Generally, any gain or loss resulting from currency exchange fluctuations during the period from the date you include the dividend payment in income to the date you convert the payment into U.S. dollars will be treated as ordinary income or loss and will not be eligible for the special tax rate applicable to qualified dividend income. The gain or loss generally will be income or loss from sources within the United States for foreign tax credit limitation purposes. Distributions in excess of current and accumulated earnings and profits, as determined for United States federal income tax purposes, will be treated as anon-taxable return of capital to the extent of your basis in the common shares or ADSs and thereafter as capital gain. However, we do not expect to calculate earnings and profits in accordance with United States federal income tax principles. Accordingly, you should expect to generally treat distributions we make as dividends.
Subject to generally applicable limitations and conditions under the Internal Revenue Code, Chilean Withholding Tax withheld and paid over to the Chilean tax authorities (after taking into account the credit for the First Category Tax, when it is available) will be creditable or deductible against your United States federal income tax liability. Special rules apply in determining the foreign tax
credit limitation with respect to dividends that are subject to the preferential tax rates. To the extent a refund of the tax withheld is available to you under Chilean law, as is the case if the amount of Chilean Withholding Tax initially withheld from a dividend is determined to be excessive as described above under “—Taxation—Chilean Tax—Cash Dividends and Other Distributions,” the amount of tax withheld that is refundable will not be eligible for credit against your United States federal income tax liability.
Dividends will generally be income from sources outside the United States and will, depending on your circumstances, be either “passive” or “general” income for purposes of computing the foreign tax credit allowable to you.
Taxation of Capital Gains
Subject to the PFIC rules discussed below, if you are a U.S. holder and you sell or otherwise dispose of your common shares or ADSs, you will recognize capital gain or loss for United States federal income tax purposes equal to the difference between the U.S. dollar value of the amount that you realize and your tax basis, determined in U.S. dollars, in your common shares or ADSs. Capital gain of a noncorporate U.S. holder is generally taxed at preferential rates where the property is held for more than one year. The gain or loss will generally be income or loss from sources within the United States for foreign tax credit limitation purposes.
Consequently, you may not be able to use the foreign tax credit arising from any Chilean tax imposed on the disposition of common shares or ADSs unless such credit can be applied against tax due on other income treated as derived from foreign sources in the appropriate limitation category.
Medicare Tax
A U.S. holder that is an individual or estate, or a trust that does not fall into a special class of trusts that is exempt from such tax, is subject to a 3.8% tax on the lesser of (1) the U.S. holder’s “net investment income” (or “undistributed net investment income” in the case of an estate or trust) for the relevant taxable year and (2) the excess of the U.S. holder’s modified adjusted gross income for the taxable year over a certain threshold (which in the case of individuals is between $125,000 and $250,000, depending on the individual’s circumstances). A holder’s net investment income generally includes its dividend income and its net gains from the disposition of shares or ADSs, unless such dividend income or net gains are derived in the ordinary course of the conduct of a trade or business (other than a trade or business that consists of certain passive or trading activities). If you are a U.S. holder that is an individual, estate or trust, you are urged to consult your tax advisors regarding the applicability of the Medicare tax to your income and gains in respect of your investment in the shares or ADSs.
PFIC Rules
We believe that common shares and ADSs should not be treated as stock of a PFIC for United States federal income tax purposes, but this conclusion is a factual determination that is made annually and thus may be subject to change. If we were to be treated as a PFIC, unless you elect to be taxed annually on a mark-to-market basis with respect to your common shares or ADSs, gain realized on the sale or other disposition of your commonscommon shares or ADSs would in general not be treated as capital gain. Instead, if you are a U.S. holder, unless you elect to be taxed annually on amark-to-market basis with respect to your common shares or ADSs, or you elect to be taxed annually on the earnings of the PFIC attributable to your shares or ADSs as a “qualified electing fund”, you would be treated as if you had realized such gain and certain “excess distributions” ratably over your holding period for the commonscommon shares or ADSs and would be taxed at the highest tax rate in effect for each such year to which the gain was allocated, together with an interest charge in respect of the tax attributable to each such year. With certain exceptions, your commonscommon shares or ADSs will be treated as stock in a PFIC if we were a PFIC at any time during your holding period in your commonscommon shares or ADSs. Dividends that you receive from us will not be eligible for the special tax rates applicable to qualified dividend income if we are treated as a PFIC with respect to you either in the taxable year of the distribution or the preceding taxable year, but instead will be taxable at rates applicable to ordinary income.
F. Dividends and Paying Agents
Not applicable.
G. Statement by Experts
Not applicable.
H. Documents on Display
We are subject to the information requirements of the Exchange Act, as amended. In accordance with these requirements, we file reports, including annual reports on Form20-F and other information with the SEC. These materials, including this annual report and the exhibits hereto, may be inspected and copied at the SEC’s public reference rooms in Washington, D.C. Please call the SEC at1-800-SEC-0330 for further information on the public reference rooms. In addition, some of our SEC filings, including those filed on and after February 19, 2002, are also available to the public through the SEC’s website at www.sec.gov.
As a foreign private issuer, we are not subject to the same disclosure requirements as a domestic U.S. registrant under the Exchange Act. For example, we are not required to prepare and issue quarterly reports. However, we furnish our shareholders with annual reports containing financial statements audited by our independent auditors and make available to our shareholders quarterly reports containing unaudited financial data for the first three quarters of each fiscal year. We file such quarterly reports with the SEC within two months of each quarter of our fiscal year, and we file annual reports on Form20-F within the time period required by the SEC, which is currently six months from December 31, the end of our fiscal year.
I. Subsidiary Information
Not applicable.
| ITEM 11. | QUANTITATIVE AND QUALITATIVE DISCLOSURES ABOUT MARKET RISK |
General
Given the nature of its business, LATAM is exposed mainly to three types of market risk:
Management assesses the level of our exposure to these risks periodically to determine the extent to which we should hedge against them and the most effective mechanisms to implement the hedge. LATAM purchases derivative instruments in foreign markets to offset market risk exposure, typically utilizing a mixturemix of call options, collar structuresfinancial and fixed price swaps agreements.commodity derivatives. LATAM does not enter into or hold derivative contracts for trading purposes.
Risk of Fluctuations in Jet Fuel Prices
Individually, LAN and TAM forecasted fuel consumption for 2013 of 608.9 million and 676.6 million gallons, respectively. Since the combination of their business operations, LATAM has been managing the fuel hedging program for both LAN and TAM, based on an approved policy. LATAM forecasted fuel consumption for 2014 was 1.266 million gallons. This policy aims to hedge approximately 20-60% of our aggregate fuel consumption, using swaps, calls and collars for the expected fuel consumption from 12-24 months.
Jet fuel price fluctuations are largely dependent on supply and demand for crude oil, OPEC decisions, refinery capacities, stock levels of crude oil and geopolitical factors. In order
LATAM fuel consumption for 2016 was 1,185.5 million gallons and the consumption forecast for 2017 is 1,179.6 million gallons. To manage its exposure to minimize the riskcost of jet fuel, price fluctuations, LATAM hedges against such riskhas a hedging program based on an approved policy. This policy aims to hedge approximately20-60% of our aggregate fuel consumption, using derivative instruments.commodity derivatives for the expected fuel consumption in the short term3-6 months, where the pass-through of cost changes is limited.
Because jet fuelJet Fuel is not traded in organized futures exchanges, there are limited options to hedge against jet fuel price fluctuations. However,the only underlying asset that LATAM considers financialmay use for hedging purposes. It may also consider derivative instruments in other commoditiesunderlying commodity assets such as crude oil (BRENT), West Texas intermediate (WTI) or heating oil to be useful for decreasing its exposure to jet(HO).
To keep the Company competitive, a portion of the fuel price increases.
LATAM uses swaps, calls and collars to hedge againstconsumption is not hedged, as a drop in fuel prices fluctuations. Swap contracts allow us to eliminatepositively affects the volatility risk by fixing the price. InCompany through a typical swap contract, LATAM is compensated if the market price is above the fixed price at certain predetermined dates, and must make disbursements if the market price is below the fixed price at those dates. Call options give us protection against risereduction in prices. Call option are only exercised when the market price is above the predetermined strike price thus providing LATAM with protection with no downside risk. Collars are a combination of call and put options that limit the range of possible positive or negative outcomes to a specific price range. Above the predetermined ceiling price, LATAM is compensated for the difference between the market price and the ceiling price. For any price below the predetermined floor price, LATAM has to disburse the difference between the market price and the floor price.costs.
We may be exposed to fuel hedging transaction losses if our counterparties default. To manage this credit risk, we select counterparties based on their credit ratings and monitor our relative market position on a daily basis. We generally are not required to post collateral and do not require our counterparties to post collateral in respect of positions under our fuel hedging transactions. For more information see “Item 3. Key Information—D. Risk Factors—Risks Related to Our Operations and the Airline Industry—Our operations are subject to fluctuations in the supply and cost of jet fuel, which could negativelyadversely impact our business”.business.”
During 2013, 20122016, 2015 and 20112014 we entered into a mix of swaps calls, zero cost collars, three-way collars and collars option contracts on BRENT, WTI BRENT and JET FUEL 54 USGC prices with investment grade banks and other financial entities for notional fuel purchases.purchases(non-delivery forward). Details of the fuel hedging program are shown below:
| LATAM Fuel Hedging Year ended December 31, | ||||||||||||
| 2013 LATAM | 2012 LATAM(1) | 2011 LAN | ||||||||||
| (millions of US$) | ||||||||||||
Gallons Purchased | 861.4 | 598.4 | 397.8 | |||||||||
% Total Annual Fuel Consumption | 48 | % | 46.6 | % | 69.8 | % | ||||||
Combined Result of Hedges (in US$) | +3.1 | –1.8 | +39.9 | |||||||||
| LATAM Fuel Hedging Year ended December 31, | ||||||||||||
| 2016 LATAM | 2015 LATAM | 2014 LATAM | ||||||||||
Gallons Purchased (million) | 781.2 | 544.7 | 684.3 | |||||||||
% Total Annual Fuel Consumption | 66.7 | % | 43.6 | % | 55.6 | % | ||||||
Combined Result of Hedges (in million of US$) | (48.0 | ) | (239.4 | ) | (108.7 | ) | ||||||
As of December 31, 2013,2016, the fair value of our outstanding fuel related derivative contracts was estimated to be US$15.9 8.1 million (asset)(positive).
Fair value by quarter of LATAM’s fuel related hedges, as of December 31, 2013
| ||||||||
| ||||||||
Gains and losses on the hedging contracts outlined above are recognized as a cost of sales in the income statement when the fuel subject to the hedge is consumed. Premiums paid related to fuel derivative contracts are recorded as prepaid expenses (current assets) and recorded as an expense at the time the contract expires.
Under IFRS, the fair value of the hedging derivatives is booked as anon-current asset or liability if the remaining maturity of the item is hedged for more than 12 months, and as a current asset or liability if the remaining term of the item is hedged for less than 12 months. The fair value of the derivative contracts is deferred within an equity reserve account. Please see Note 2.10 to our audited consolidated financial statements.
Sensitivity analysis
In order to protect the Company from increases in fuel prices, a portion of the fuel consumption is hedged using a mixture of protective instruments (call, collars) and fixing instruments (swaps). To keep the Company competitive, a portion of the fuel consumption is not hedged, as a drop in fuel prices positively affects the Company through a reduction in costs.
As the current positions do not represent changes in cash flows but a variation in the exposure to the market value, the Company’s current hedge positions have no impact on income; they are booked as cash flow hedge contracts, so a variation in fuel prices has an impact on the Company’s net equity.
The following table shows the sensitivity analysis of our hedging contracts to reasonable changes in fuel prices and their effect on equity. The term used for the projection was June 30, 2014,2017, the last maturity date of our current fuel hedge contracts. The calculations were made considering a parallel movement of US$5 per barrel in the curve of the WTI, BRENT and JET crude futures benchmark price at the end of December 2013, 20122016, 2015 and 2011.2014.
| LATAM fuel price sensitivity (effect on equity) Position as of December 31, | ||||||||||||||||||||||||
| 2016 LATAM | 2015 LATAM | 2014 LATAM | ||||||||||||||||||||||
| LATAM fuel price sensitivity (effect on equity) Position as of December 31, | (millions of US$ per barrel) | |||||||||||||||||||||||
| BRENT or JET benchmark price | 2013 LATAM | 2012 LATAM | 2011 LAN | |||||||||||||||||||||
| (millions of US$ per barrel) | ||||||||||||||||||||||||
+5 | +24.6 | +12.6 | +16.5 | +3.1 | +5.4 | +24.9 | ||||||||||||||||||
–5 | -19.1 | –11.3 | –13.8 | -4.8 | –2.8 | –25.1 | ||||||||||||||||||
During the periods presented, the Company has not recorded amounts for ineffectiveness in the consolidated income statement pursuant to IAS 39 (IFRSIFRS principles for recognizing and measuring financial instruments).instruments.
Given the fuel hedge structure as of December 31, 2013,2016, which reflects only a partial hedge of our expected fuel consumption, a vertical fall by US$5 in the BRENT and JET benchmark price (the monthly daily average) for each month would have meant savings of approximately US$127.6 116.3 million in the cost of the Company’s total fuel consumption. A vertical increase by US$5 in the WTIJET and BRENT benchmark price (the monthly daily average) for each month would have meant an additional cost of approximately US$118.5 114.5 million of the Company’s total fuel consumption.
Risk of Variation in Foreign Exchange Rates
The functional currency of the LATAM holding company is the U.S. dollar. Because LATAM conducts its business in local currencies in several countries, it faces the risk of variations in multiple foreign currency exchange rates. Depreciation of these currencies against the U.S. dollar could have adverse effects both transactional and translational, because part of our revenues and expenses are denominated in those currencies.
At the same time, LATAM’s affiliates are exposed to foreign exchange risk, which could in turn impact the consolidated results of the Company.
The greatest exposure to future cash flows is mainly presented by the subsidiary TAM S.A. and volatility in the R$/US$ exchange rate. TAM S.A.’s earnings are generated largely in R$. We actively manage the R$/US$ exchange rate risk by entering into FX derivative contracts and carrying out internal operations for obtaining natural hedging. Additionally, LATAM manages its economic exposures of future flows revenues on Great Britain Pound (GBP), by entering into FX derivative contracts.
In lower concentration, the company also faces foreign exchange risk relating to additional currencies such as: Euro, Chilean Peso, Australian Dollars, Argentinean Peso, Paraguayan Guaraní, Mexican Peso, Peruvian Nuevo Sol, Colombian Peso and New Zealand Dollars.
As of December 31, 2016, the fair value of our FX derivative contracts was estimated to be US$ 1.1 million (negative).
Because changes in the values of existing FX derivative positions do not represent changes in cash flows, but a variation in the exposure of market value, the outstanding hedging positions do not impact results (they are registered as cash flow hedges under IFRS, therefore, a change in the foreign exchange rate has an impact on the equity of the Company).
The following table shows the sensitivity of the fair value of financial instruments as a result of reasonable changes in the exchange rates of British Pounds and Brazilian reais. The term projection is defined until the end of the last hedging contract in force:
LATAM foreign exchange sensitivity Derivatives Position as of December 31, 2016 | ||||
Appreciation | Effect on equity (Millions of US$) | |||
| +10% | +3.4 | |||
| -10% | -1.0 | |||
As of December 31, 2016, the Company has FX derivatives of US$60 million (notional) for FX BRL and US$10 million (notional) for FX GBP.
Balance sheet exposure of LATAM to the Brazilian Real is related to the functional currency of TAM and its balance sheet currency mismatch, as TAM has a net US$ liability position. When the balance sheet denominated in U.S. dollars is translated to Brazilian Real, the financial results of TAM may fluctuate and therefore could impact LATAM’s financial results.
The exposure to the Brazilian real on TAM’s balance sheet has been reduced from over US$4.0 billion since the combination in June 2012 to around US$1.2 billion as of December 31, 2016. The Company continues working to mitigate this exposure through the execution of the fleet transfer from TAM to LATAM and payment of TAM’s debt denominated in USD.
The following table shows the sensitivity of TAM’s financial results to changes in the R$/US$ exchange rate:
| TAM exchange rate sensitivity Position effect onpre-tax earnings as of December 31, | ||||||||||||
| 2016 | 2015 | 2014 | ||||||||||
| LATAM | LATAM | LATAM | ||||||||||
| (millions of US$) | ||||||||||||
Appreciation (depreciation) of R$/US$ | ||||||||||||
–10% | +119.2 | +67.6 | +69.8 | |||||||||
+10% | -119.2 | –67.6 | –69.8 | |||||||||
Our foreign currency exchange exposure as of December 31, 2016 was as follows:
| LATAM foreign currency exchange exposure | ||||||||||||||||||||||||||||||||||||
| U.S. Dollars MUS$ | % of total | Brazilian real MUS$ | % of total | Chilean pesos MUS$ | % of total | Other currencies MUS$ | % of total | Total MUS$ | ||||||||||||||||||||||||||||
Current assets | 1,727,743 | 47.6 | % | 1,438,613 | 39,7 | % | 155,611 | 4,3 | % | 304,808 | 8.4 | % | 3,626,775 | |||||||||||||||||||||||
Other assets | 10,140,422 | 65.1 | % | 5,285,025 | 33,9 | % | 11,475 | 0,1 | % | 134,497 | 0.9 | % | 15,571,419 | |||||||||||||||||||||||
Total assets | 11,868,165 | 61.8 | % | 6,723,638 | 35,0 | % | 167,086 | 0,9 | % | 439,305 | 2.3 | % | 19,198,194 | |||||||||||||||||||||||
Current liabilities | 3,582,543 | 57.6 | % | 2,121,915 | 34,1 | % | 257,405 | 4,1 | % | 260,328 | 4.2 | % | 6,222,191 | |||||||||||||||||||||||
Long-term liabilities | 11,400,803 | 75.9 | % | 2,919,683 | 19,4 | % | 413,118 | 2,8 | % | 279,286 | 1.9 | % | 15,012,890 | |||||||||||||||||||||||
|
|
|
|
|
|
|
|
|
|
|
|
|
|
|
|
|
| |||||||||||||||||||
Total liabilities and shareholders’ equity | 14,983,346 | 70.6 | % | 5,041,598 | 23,7 | % | 670,523 | 3,2 | % | 539,614 | 2,5 | % | 21,235,081 | |||||||||||||||||||||||
|
|
|
|
|
|
|
|
|
|
|
|
|
|
|
|
|
| |||||||||||||||||||
For more information on Market Risk, see Note 3 “Financial Risk Management” to our audited consolidated financial statements.
Risk of Fluctuations in Interest Rates
As of December 31, 2013,2016, LATAM had US$ 9,8678,710 million in outstanding interest bearing loans. LATAM uses swaps and capsinterest rate derivatives to reduce the impact of an increase of interest rates. Following the combination63.1% of LAN and TAM, LATAM is more exposed to fluctuations of interest rates (before giving effect to swaps), as more than half of TAM’s outstanding debt bears interest at a floating rate. Individually as of December 31, 2013, 52.2% of TAM’s outstanding debt is in the form of fixed rate loans, and 77.6% of LAN’s outstanding debt2016 was effectively at a fixed rate, either as fixed rate loans or variable rate loans hedged using a floating to fixed rate derivative instrument. On a combined basis, 70% of LATAM outstanding debt as of December 31, 2013 was effectively at fixed rate, either as fixed rate loans or variable rate loans hedged using a floating to fix rate derivative instrument.
LATAM’s interest bearing loans can be classified by: variable interest rate debt, fixed interest rate debt and interest rate hedged debt. LATAM’s variable interest rate debt amounts to US$2,938 3,216 million, from which 73.9%84.2% is assigned to aircraft financing and 26.1%15.8% tonon-aircraft financing. The fixed interest rate debt amounts toare US$ 6,3735,494 million fromof which 68.3%62.6% is assigned to aircraft financing and 31.7%37.4% tonon-aircraft financing. The interest rate hedged debt amounts to US$ 556406 million fromof which 93.6%100% is assigned to interest rate swaps and 6.4% to interest rate caps.swaps.
Under IFRS, the positive fair value of these interest rate swaps is reflected in the balance sheet as hedging assets and the negative fair value of these agreements is reflected as hedging liabilities. As of December 31, 2013,2016, the fair value of all the interest rate swaps was estimated to be -US$96.8 million.US$ 17.2 million (negative).
The interest rate cap contracts qualify as cash flow hedges with no ineffectiveness associated to them due to the fact that all critical terms of the debt and the caps are matched. As of December 31, 2013, the fair value of these contracts was estimated to be US$0.01 million.
The premiums paid on the cap contracts were allocated to individual caplets and recognized in the income statement throughout the term of each contract. Under IAS 39 these derivatives qualify as cash flow hedges even though some ineffectiveness exists as the notional amount over which some caps are calculated is different from the one used to determine the interest and lease payments on the aircraft. For IFRS purposes, there was no amount of ineffectiveness recorded in earnings because the change in fair value of the perfect hypothetical option was greater than the change in the fair value of the Company’s option.
The utilizationuse of the aforementioned hedging instruments, combined with fixed interest rate financing for our aircraft financing, has enabled the Company to have a predictable interest rate costs, reducing the cash volatility.
As of December 31 2013,2016, the average interest rate of our entire outstanding interest-bearing long-term debt rate was 4.0%.
The following table summarizes our principal payment obligations on all of our interest-bearing debt as of December 31, 20132016 and the related average interest rate for such debt. The average interest rate has been calculated based on the prevailing interest rate on December 31, 20132016 for each loan.
| LATAM’s principal payment obligations by year of expected maturity(1) | ||||||||||||||
| Average interest rate(2) | 2014 | 2015 | 2016 | 2017 | 2018 | 2019 and thereafter | ||||||||
| (thousands of US$) | ||||||||||||||
Interest-bearing liabilities | 3.8% | 1.877 | 914 | 1.243 | 1.177 | 794 | 3.862 | |||||||
| LATAM’s principal payment obligations by year of expected maturity(1) | ||||||||||||||||||||||||||||
| Average interest rate(2) | 2017 | 2018 | 2019 | 2020 | 2021 | 2022 and thereafter | ||||||||||||||||||||||
| (millions of US$) | ||||||||||||||||||||||||||||
Interest-bearing liabilities | 4.0 | % | 1,771 | 1,119 | 1,120 | 1,440 | 1,105 | 2,156 | ||||||||||||||||||||
| (1) | At cost. |
| (2) | Average interest rate means the average prevailing interest rate on our debt on December 31, |
The following table shows the sensitivity of changes in our long-term interest bearing liabilities and capital leases that are not hedged against interest-rate variations. These changes are considered reasonably possible based on current market conditions.
| LATAM’s interest rate sensitivity (effect on pre-tax earnings) Position as of December 31 | LATAM’s interest rate sensitivity (effect on pre-tax earnings) Position as of December 31, | |||||||||||||||||||||||
| 2013 LATAM | 2012 LATAM | 2011 LAN | 2016 LATAM | 2015 LATAM | 2014 LATAM | |||||||||||||||||||
| (millions of US$) | (millions of US$) | |||||||||||||||||||||||
Increase (decrease) in LIBOR | ||||||||||||||||||||||||
+100 basis points | -29.70 | –33.69 | –3.06 | -32.2 | -26.7 | –27.5 | ||||||||||||||||||
–100 basis points | +29.70 | +33.69 | +3.06 | +32.2 | +26.7 | +27.5 | ||||||||||||||||||
Changes in market conditions produce a change in the valuation of current financial instruments hedging against fluctuations in interest rates, causing an effect on the Company’s equity (because they are booked as cash-flow hedges). These changes are considered reasonably possible based on current market conditions. The calculations were made by increasing (decreasing) 100 basis points of the three-month Libor futures curve.
| LATAM’s interest rate sensitivity (effect on equity) Position as of December 31 | LATAM’s interest rate sensitivity (effect on equity) Position as of December 31, | |||||||||||||||||||||||
| 2013 LATAM | 2012 LATAM | 2011 LAN | 2016 LATAM | 2015 LATAM | 2014 LATAM | |||||||||||||||||||
| (millions of US$) | (millions of US$) | |||||||||||||||||||||||
Increase (decrease) in three month LIBOR | ||||||||||||||||||||||||
Future rates | ||||||||||||||||||||||||
+100 basis points | 23.35 | +33.61 | +40.70 | +3,9 | +8.7 | +15.3 | ||||||||||||||||||
–100 basis points | -24.46 | –35.48 | –43.20 | -4,0 | +9.0 | –16.0 | ||||||||||||||||||
During the periods presented, the companyCompany has not recorded amounts for ineffectiveness in the consolidated income statement pursuant to IAS 39.IFRS.
There are market-related limitations in the method used for the sensitivity analysis. These limitations derive from the fact that the levels indicated by the futures curves may not be necessarily met and may change in each period.
Risk of Variation in Foreign Currency Exchange Rates
LATAM sells most of its services in U.S. dollars (or prices equivalent to the U.S. dollar) and, following the combination with TAM, in Brazilian real. A large part of its expenses are denominated in U.S. dollars (or its equivalents), particularly fuel costs, aeronautic charges, aircraft leases, insurance and aircraft components and accessories. Of LATAM’s total expenses, the main item denominated in local currencies is employee remuneration.
Since 2012, the proportion of our operating revenues denominated in U.S. dollars has decreased due to the combination with TAM, increasing our exposure to Brazilian domestic market and Brazilian real as compared to 2011. However, because we conduct business in local currencies in several countries, we face the risk of variations in multiple foreign currency exchange rates. A depreciation of the Chilean peso, the Brazilian real, the Argentine peso, the Mexican peso, the Peruvian nuevo sol, the Venezuelan bolivar or the euro against the U.S. dollar could have an adverse effect on us as part of our revenues and receivables are denominated in those currencies. The Company may enter into derivative contracts to protect against the possible appreciation or depreciation of the currencies against the functional currency of the Company.
Balance sheet exposure of LATAM to the Brazilian real is related to the functional currency of TAM and its balance sheet currency mismatch, as more of TAM’s debt is denominated in U.S. dollars as compared to its assets denominated in U.S. dollars. When the balance sheet denominated in U.S. dollars is translated to Brazilian real, the financial results of TAM may fluctuate and therefore could impact LATAM’s financial results.
The exposure to the Brazilian real in TAM’s balance sheet has constantly been reduced from over US$4.0 billion since the merger in June 2012 to US$2.0 billion as of December 31, 2013. The Company continues working to largely mitigate this exposure to approximately US$0.6 billion by the end of third quarter 2014. The plan includes the execution of the fleet transfer from TAM to LATAM and payment of TAM’s short term debt denominated in USD.
The following table shows the sensitivity of LATAM’s financial results to changes in the R$/US$ exchange rate:
| TAM exchange rate sensitivity Position effect on pre-tax earnings as of December 31 | ||||||||||||
| 2013 | 2012 | 2011 | ||||||||||
| LATAM | LATAM | TAM | ||||||||||
| (millions of US$) | ||||||||||||
Appreciation (depreciation) of R$/US$ | ||||||||||||
–10% | +197.76 | +404.19 | +439.16 | |||||||||
+10% | -197.76 | –404.21 | –439.16 | |||||||||
The prices of frequent flyer points of TAM’s subsidiary, Multiplus S.A., are denominated in U.S. dollars. As the functional currency is the Brazilian real, the sale of these frequent flyer points are subject to variations in the R$/US$ exchange rate. To reduce its exposure, Multiplus S.A. has entered into exchange rate collars.
The following table presents the notional amount and the market value of the derivative exchange rate collars for each maturity date. The expiration dates of the derivatives coincide with the probable date of redemption of the frequent flyer points. The redemption of the frequent flyer points are recognized as a highly probable event and will be recognized as income, on average, six months after redemption.
| Multiplus exchange rate collars Position as of December 31 (millions of US$) | ||||||||
| 2014 | Total | |||||||
Foreign Currency Derivative | ||||||||
Notional Value (MU$) | 18.0 | 18 | ||||||
Market Value (MU$) | -1.7 | -1.7 | ||||||
If the Brazilian real appreciates or depreciates by 10% against the U.S. dollar and all other variables are held constant, the financial results of Multiplus S.A. would have varied approximately by US$3.3 million (appreciation)/US$4.2 million (depreciation) for the year ended December 31, 2013.
The profit or losses caused by changes in the fair value of the hedged item are segregated between intrinsic value and time value. The intrinsic value is the percentage of cash flow covered, initially shown in the equity and later transferred to income, while the hedge transaction is recorded as income. The time value corresponds to the ineffective portion of the cash flow hedge and is recognized in the financial results of the Company.
Additionally, one of the LATAM financing sources is the receipt of future flows related dividends and capital distributions that subsidiaries will distribute. These future cash flows vary depending on the evolution of the foreign currency exchange rate compared to US$. The greatest exposure to future cash flows is presented by the subsidiary TAM S.A. and the R$/US$ volatility. In the case of TAM S.A., the earnings are expressed in large proportion in R$, which a large portion of its costs are in US$.
To hedge the investment in subsidiaries and reduce the cash flow volatility, the Company may enter into derivative contracts to protect the mitigate currency appreciation or depreciation against the LATAM functional currency.
In order to reduce the operational monthly cash flow exposures for 2014, caused by Brazilian real depreciation and ensure economic margin, LATAM hedges the foreign exchange risk using Foreign Exchange (“FX”) Forwards.
At December 31, 2013, the market value of LATAM’s FX positions was US$ 32.1 million (positive). These derivative contracts were entered into by LATAM during 2013, so as of December 31, 2012, LATAM did not have these types of derivatives contracts.
The following table shows both the notional amount of FX Forward positions and average of Forward prices:
| Positions as December 31, 2013 | Q114 | Q214 | Q314 | Q414 | Total | |||||||||||||||
Volume (millions of US$) | 125 | 125 | 125 | 125 | 500 | |||||||||||||||
Forward Price (R$/US$) | 2.24 | 2.28 | 2.33 | 2.39 | 2.31 | |||||||||||||||
Total (millions of R$) | 280 | 285 | 291 | 299 | 1.115 | |||||||||||||||
If the Brazilian real depreciates against the U.S. dollar, it could adversely affect the Company’s results by increasing costs to LATAM denominated in US$. However, a depreciation of the Brazilian real would positively affect the value of these derivative positions.
Because changes in the values of existing positions do not represent changes in cash flow, but a variation in the exposure of market value, the outstanding hedging positions do not impact results (they are registered as cash flow hedges under IFRS, therefore, a change in the exchange rate has an impact on the equity of the Company.
The following table shows the sensitivity of financial instruments according to reasonable changes in the exchange rate and its effect on equity is shown. The term projection is defined until the end of the last hedging contract in force, being the last business day of the fourth quarter of 2014:
| LATAM foreign exchange sensitivity Position as of December 31 | ||||
| 2013 | ||||
Appreciation (depreciation) of R$/US$ | (Millions of US$) | |||
-10% | -49.46 | |||
+10% | +49,46 | |||
Our foreign currency exchange exposure as of December 31, 2013 was as follows:
| LATAM foreign currency exchange exposure | ||||||||||||||||||||||||||||||||||||
| US dollars MUS$ | % of total | Brazilian real MUS$ | % of total | Chilean pesos MUS$ | % of total | Other currencies MUS$ | % of total | Total MUS$ | ||||||||||||||||||||||||||||
Current assets | 2,166,248 | 43.50 | % | 1,818,088 | 36.51 | % | 381,274 | 7. 66 | % | 613,939 | 12.33 | % | 4,979,549 | |||||||||||||||||||||||
Other assets | 8,703,165 | 49.31 | % | 8,626,489 | 48.87 | % | 20,638 | 0.12 | % | 301,305 | 1.71 | % | 17,651,597 | |||||||||||||||||||||||
Total assets | 10,869,413 | 48.03 | % | 10,444,577 | 46.15 | % | 401,912 | 1.78 | % | 915,244 | 4.04 | % | 22,631,146 | |||||||||||||||||||||||
Current liabilities | 3,976,248 | 61.09 | % | 1,918,281 | 29.47 | % | 183,262 | 2.82 | % | 431,316 | 6.63 | % | 6,509,107 | |||||||||||||||||||||||
Long-term liabilities | 8,961,972 | 83.01 | % | 1,596,476 | 14.79 | % | 211,639 | 1.96 | % | 26,404 | 0.324 | % | 10,796,491 | |||||||||||||||||||||||
|
|
|
|
|
|
|
|
|
|
|
|
|
|
|
|
|
| |||||||||||||||||||
Total liabilities and shareholders’ equity | 18,262,474 | 80.70 | % | 3,514,757 | 15.53 | % | 394,901 | 1.75 | % | 457,720 | 2.02 | % | 22,629,852 | |||||||||||||||||||||||
|
|
|
|
|
|
|
|
|
|
|
|
|
|
|
|
|
| |||||||||||||||||||
For more information on Market Risk, see Note 3 “Financial Risk Management” to our audited consolidated financial statements.
| ITEM 12. | DESCRIPTION OF SECURITIES OTHER THAN EQUITY SECURITIES |
A. Debt Securities
Not applicable.
B. Warrants and Rights
Not applicable.
C. Other Securities
Not applicable.
D. American Depositary Shares
In the United States, our common shares trade in the form of ADS. Since August 2007, each ADS represents one common share, issued by The Bank of New York Mellon, as Depositary pursuant to a Deposit Agreement. ADSs commenced trading on the NYSE in 1997. In October 2011, our Depositary bank changed from The Bank of New York Mellon to JP Morgan Chase Bank, N.A. (“JP Morgan”).
Fees and Charges for ADR Holders
The Bank of New York Mellon, and since October 2011 JP Morgan, as depositary, collects its fees for delivery and surrender of ADSs directly from investors depositing shares or surrendering ADSs for the purpose of withdrawal or from intermediaries acting for them. The depositary collects fees for making distributions to investors by deducting those fees from the amounts distributed or by selling a portion of the distributable property to pay the fees. The depositary may also collect its annual fee for depositary services by deductions from cash distributions, by directly billing investors or by charging the book-entry system accounts of participants acting for them. The depositary may generally refuse to providefee-attracting services until its fees for those services are paid.
| Persons depositing or withdrawing shares must pay: | For: | |
| US$5.00 (or less) per 100 ADSs (or portion of 100 ADSs) | • Issuance of ADSs, including issuances resulting from a distribution of shares or rights or other property | |
• Cancellation of ADSs for the purpose of withdrawal, including if the deposit agreement terminates | ||
| US$ | • Any cash distribution to ADS registered holders | |
| A fee equivalent to the fee that would be payable if securities distributed had been shares and the shares had been deposited for issuance of ADSs | • Distribution of securities distributed to holders of deposited securities which are distributed by the depositary to ADS registered holders | |
| US$ | • Depositary services | |
| Registration or transfer fees | • Transfer and registration of shares on the depositary’s share register to or from the name of the depositary or its agent when investors deposit or withdraw shares | |
| Expenses of the depositary | • Cable, telex and facsimile transmissions | |
• Conversion of foreign currencies into U.S. dollars | ||
| 1 | Withdrawing Deposited Securities; there are no such fees in respect of the Shares as of the date of the Deposit Agreement), and (iv) expenses of the Depositary in connection with the conversion of foreign currency into U.S. dollars (which are paid out of such foreign currency). Such charges may at any time and from time to time be changed by agreement between the Company and the Depositary. |
| Persons depositing or withdrawing shares must pay: | For: | |
| Taxes and other governmental charges the depositary or the custodian | • As necessary | |
| Any charges incurred by the depositary or its agents for servicing the deposited securities | • As necessary | |
Fees and Direct and Indirect Payments Made by the Depositary to the Foreign Issuer
Past Fees and Payments
During 2013,2016, the Company received from the depositary US$106,250 million443,339.9 for continuing annual stock exchange listing fees, standardout-of-pocket maintenance costs for the ADRs (consisting of the expenses of postage and envelopes for mailing annual and interim financial reports, printing and distributing dividend checks, electronic filing of U.S. Federal tax information, mailing required tax forms, stationery, postage, facsimile, and telephone calls), payments related to applicable performance indicators relating to the ADR facility, underwriting fees and legal fees.
Future Fees and Payments
JP Morgan, as the depositary bank, has agreed to reimburse the Company for certain of our reasonable expenses related to our ADS program and incurincurred by us in connection with the program. The reimbursements include direct payments (legal and accounting fees incurred in connection with preparation of Form20-F and ongoing SEC compliance and listing requirements, listing fees, investor relations expenses, advertising and public relations expenses and fees payable to service providers for the distribution of hard copy materials to beneficial ADR holders in the Depositary Trust Company, such as information related to shareholders’ meetings and related voting instruction cards); and indirect payments (third-party expenses paid directly and fees waived).
| ITEM 13. | DEFAULTS, DIVIDEND ARREARAGES AND DELINQUENCIES |
None.
| ITEM 14. | MATERIAL MODIFICATIONS TO THE RIGHTS OF SECURITY HOLDERS AND USE OF PROCEEDS |
None.
| ITEM 15. | CONTROLS AND PROCEDURES |
Controls and Procedures
Management carried out an evaluation, with the participation of the chief executive officerChief Executive Officer and chief financial officer,Chief Financial Officer, of the effectiveness of the design and operation of the Company’s disclosure controls and procedures as of December 31, 2013.2016. There are inherent limitations to the effectiveness of any system of disclosure controls and procedures, including the possibility of human error and the circumvention or overriding of the controls and procedures. Accordingly, even effective disclosure controls and procedures can only provide reasonable assurance of achieving their control objectives. Based upon such evaluation, management, with the participation of the chief executive officer and chief financial officer concluded that the disclosure controls and procedures, as of December 31, 2013,2016, were effective in providing reasonable assurance that information required to be disclosed by us in the reports we file or submit under the Exchange Act, as amended, is recorded, processed, summarized and reported within the time periods specified in the applicable rules and forms, and that it is accumulated and communicated to our management including our Chief Executive Officer and Chief Financial Officer as appropriate to allow timely decisions regarding required disclosure.
Management’s annual report on internal control over financial reporting
The management of the Company, including the Chief Executive Officer and the Chief Financial Officer, is responsible for establishing and maintaining adequate internal control over financial reporting, as such term is defined in Rules13a-15(f) and15d-15(f) under the Exchange Act, as amended.
The Company’s internal control over financial reporting is a process designed to provide reasonable assurance regarding the reliability of financial reporting and the preparation of financial statements for external purposes in accordance with generally accepted accounting principles. The Company’s internal control over financial reporting includes those policies and procedures that (i) pertain to the maintenance of records that, in reasonable detail, accurately and fairly reflect the transactions and dispositions of the assets of the Company; (ii) provide reasonable assurance that transactions are recorded as necessary to permit preparation of financial statements in accordance with generally accepted accounting principles, and that receipts and expenditures of the Company are being made only in accordance with authorizations of management and directors of the Company; and (iii) provide reasonable assurance regarding prevention or timely detection of unauthorized acquisition, use or disposition of the Company’s assets that could have a material effect on the financial statements.
Because of its inherent limitations, internal control over financial reporting may not prevent or detect misstatements. Also, projections of any evaluation of the effectiveness of internal control to future periods are subject to the risk that controls may become inadequate because of changes in conditions, and that the degree of compliance with the policies or procedures may deteriorate. LATAM Airlines Group S.A.’s management, including the Chief Executive Officer and the Chief Financial Officer, has assessed the effectiveness of the Company’s internal control over financial reporting as of December 31, 20132016 based on the criteria established in “Internal Control—IntegratedControl-Integrated Framework (1992)(2013)” issued by the Committee of Sponsoring Organizations of the Treadway Commission (“COSO”) and, based on such criteria, LATAM Airlines Group S.A.’s management has concluded that, as of December 31, 2013,2016 , the Company’s internal control over financial reporting is effective. The company’s internal control over financial reporting effectiveness as of December 31, 20132016 has been audited by PricewaterhouseCoopers Consultores Auditores y Companía Limitada,SpA, an independent registered public accounting firm, as stated in their report included herein.
(c)Attestation report of the registered public accounting firm. See page F-218F-156 of our audited consolidated financial statements.
(d)Changes in internal control over financial reporting. Except for certain internal control procedures that have been modified to address the incorporation of TAM S.A., there has been no significant change in our internal control over financial reporting during 2013. None of the changes has materially affected, or is reasonably likely to materially affect, our internal control over financial reporting.
| - | (d) Changes in internal control over financial reporting.There have been no changes in our internal control over financial reporting during 2016 that materialy affected, or are reasonablely likely to materially affect, our internal control over financial reporting. |
| ITEM 16. | RESERVED |
A. AUDIT COMMITTEE FINANCIAL EXPERT
Our Board of Directors has designated Georges de Bourguignon Arndt, as an “audit committee financial expert” within the meaning of this Item 16. A. Mr. de Bourguignon is independent within the meaning of Rule10A-3 under the Exchange Act. See “Item 6. Directors, Senior Management and Employees—A. Directors and Senior Management.”
B. CODE OF ETHICS
We have adopted a code of ethics and conduct, as defined in Item 16B of Form20-F under the Exchange Act. Our code of ethics applies to our senior management, including our chief executive officer,Chief Executive Officer, our chief financial officerChief Financial Officer and our chief accounting officer,Chief Accounting Officer, as well as to other employees. Our code is freely available online at our website, www.lan.com,www.latam.com, under the heading “Corporate Governance” inon the Investor Relations page. In addition, upon written request, by regular mail, to the following address: LANLATAM Airlines Group S.A., Investor Relations Department, attention: Investor Relations, Av. Presidente Riesco 5711, Piso 20, Comuna Las Condes, Santiago, Chile, or bye-mail atinvestor.relations@lan.comInvestor.Relations@latam.com we will provide any person with a copy of it without charge. If we amend the provisions of our code of ethics that apply to our senior management or to other persons performing similar functions, or if we grant any waiver of such provisions, we will disclose such amendment or waiver on our website.
C. PRINCIPAL ACCOUNTANT FEES AND SERVICES
Audit andNon-Audit Fees
The following table sets forth the fees paid to our independent registered public accounting firm, PricewaterhouseCoopers, during the fiscal years ended December 31, 2011, 20122016 and 2013:2015:
| 2013 | 2012 | 2011 | 2016 | 2015 | ||||||||||||||||
| USD (in thousands) | USD (in thousands) | |||||||||||||||||||
Audit fees | 5,930 | 5,809 | 1,823 | 1,734 | 1,910 | |||||||||||||||
Audit-related fees | 73 | 195 | 0 | 21 | 7 | |||||||||||||||
Tax fees | 90 | 80 | 229 | — | 6 | |||||||||||||||
Other fees | 42 | 421 | 590 | |||||||||||||||||
All Other fees | 40 | 11 | ||||||||||||||||||
|
|
|
|
| ||||||||||||||||
Total fees | 6,135 | 6,505 | 2,642 | 1,795 | 1,934 | |||||||||||||||
|
|
|
|
| ||||||||||||||||
Audit-related fees in the above table are the aggregate fees billed by PricewaterhouseCoopers for assurance and related services that are reasonably related to the performance of the audit or review of our financial statements or that are traditionally performed by the external auditor, including due diligence and other audit related services. These fees increased in 2012 as a result of due diligence performed on TAM. Fees in 2012 include payments2016 correspond to PricewaterhouseCoopers Brazil, since the business combinationreview over sustentability report and attestation services related with TAM.revenues in Argentina. Fees in 2015 correspond to attestation services related with revenues in Argentina.
Other fees in the above table are fees billed by PricewaterhouseCoopers as of December 31, 2016 and correspond primarily for training servicesreview of requirements necessary for building construction authorization and 0survey salary in IFRS. During 2011 these fees increased duePeru. Fees in 2015 correspond to additional services related to the preparation of the Form F-4, relating to our exchange offera survey salary and business combination with TAM, the preparation of pro forma financial statements,salary special studies in Peru and other services. Other fees in 2012 and 2013 also included the preparation of pro forma financial statements included in this Form 20-F.Chile.
Board of Directors’ CommitteePre-Approval Policies and Procedures
Since January 2004, LATAM has complied with the SEC regulationregulations regarding the type of additional services PricewaterhouseCoopers isour independent auditors are authorized to offer to us. In addition, to this, our Board of Directors’ Committee (which serves as our Audit Committee) has decided to automatically authorize any of such accepted services for an amount of up to 10% of the fees charged by the auditing firm, and for an amount of up to 50% when adding all such services provided by PricewaterhouseCoopersthe auditing firm in the aggregate. If the amount of any services is larger than these thresholds, the approval ofby the Board of Directors’ Committee will be required.
D. EXEMPTIONS FROM THE LISTING STANDARDS FOR AUDIT COMMITTEES
None.
E. PURCHASES OF EQUITY SECURITIES BY THE ISSUER AND AFFILIATED PURCHASERS
None.
F. CHANGE IN REGISTRANT’S CERTIFYING ACCOUNTANT
None.
G. CORPORATE GOVERNANCE
New York Stock Exchange Corporate Governance Comparison
Pursuant to Section 303A.11 of the Listed Company Manual of the NYSE, we are required to provide a summary of the significant ways in which our corporate governance practices differ from those required for U.S. companies under the NYSE listing standards. We are a Chilean corporation with shares listed on the SSE, the Chilean Electronic Exchange and the Valparaiso Stock Exchange and our ADSs listed on the NYSE and our BDRs listed on Bovespa.NYSE. Our corporate governance practices are governed by our bylaws, the Chilean Corporation Law and the Securities Market Law.
The table below discloses the significant differences between our corporate governance practices and the NYSE standards.
| NYSE Standards | Our Corporate Governance Practice | |
| Director Independence.Majority of board of directors must be independent. §303A.01 | Under Chilean law, we are not required to have a majority of independent directors on our board. | |
| Our board of directors’ committee (all of whom are members of our board of directors) is composed of three directors, two of whom must be independent if we have a sufficient number of independent directors on our board. | ||
| The definition of independence applicable to us pursuant to the Chilean Corporation Law differs in certain respects from the definition applicable to U.S. issuers under the NYSE rules. | ||
| Pursuant to Law No. 20,382 on Corporate Governance, which came into effect on January 1, 2010, we are also required to have at least one independent director. | ||
| NYSE Standards | ||
| Starting on January 1, 2010, directors are deemed to be independent if they have not fallen within any of the following categories during the 18 months prior to their election: (i) had a relevant relationship, interest or dependence on us, our | ||
| Executive | There is no similar requirement under our bylaws or under applicable Chilean law. | |
| Audit committee.Audit committee satisfying the independence and other requirements of Rule10A-3 under the Exchange Act, as amended, and the more stringent requirements under the NYSE standards is required. §§303A.06, 303A.07 | We are in compliance with Rule10A-3. We are not required to satisfy the NYSE independence and other audit committee standards that are not prescribed by Rule10A-3. | ||
| Nominating/corporate governance committee.Nominating/corporate governance committee of independent directors is required. The committee must have a charter specifying the purpose, duties and evaluation procedures of the committee. §303A.04 | We are not required to have, and do not have, a nominating/corporate governance committee. | ||
| Compensation committee.Compensation committee of independent directors is required, which must approve executive officer compensation. The committee must have a charter specifying the purpose, duties and evaluation procedures of the committee. §303A.05 | We are not required to have a compensation committee. Pursuant to the Chilean Corporation Law, our board of directors’ committee must approve our senior | ||
| Equity compensation plans.Equity compensation plans require shareholder approval, subject to limited exemptions. | Under the Chilean Corporation Law, equity compensation plans require shareholder approval. | ||
| Code of Ethics.Corporate governance guidelines and a code of business conduct and ethics is required, with disclosure of any waiver for directors or executive officers. §303A.10 | We have adopted a code of ethics and conduct applicable to our senior management, including our chief executive officer, our chief financial officer and our chief accounting officer, as well as to other employees. Our code is freely available online at our website, www.latamairlinesgroup.net, under the heading “Corporate Governance” in the Investor Relations informational page. In addition, upon written request, by regular mail to LATAM Airlines Group S.A., Investor Relations Department, attention: Investor Relations, Av. Presidente Riesco 5711, 20th | ||
The disclosure of the significant ways in which our corporate governance practices differ from those required for U.S. companies under the NYSE listing standards is also posted on our website and can be accessed at www.latamairlinesgroup.net
H. Mine Safety Disclosure
Not applicable.
| ITEM 17. | FINANCIAL STATEMENTS |
See “Item 18. Financial Statements.”
| ITEM 18. | FINANCIAL STATEMENTS |
See our consolidated Financial Statements beginning on pageF-1. The following is an index of the financial statements.
Consolidated Financial Statements for LATAM Airlines Group and its Subsidiaries
| ||||
| ||||
| ||||
| ||||
| ||||
| ||||
| ||||
| ||||
| ITEM 19. | EXHIBITS |
Documents filed as exhibits to this annual report:
Exhibit
| Description | |
| 1.1* | AmendedBy-laws of LATAM Airlines Group S.A. | |
| 2.1 | Second Amended and Restated Deposit Agreement, dated as of October 28, 2011, between the Company and JPMorgan Chase Bank, N.A. (incorporated by reference to our amended registration statement on FormF-4 (FileNo. 333-177984), filed on November 15, 2011). | |
| 2.3 | Indenture, dated as of April 25, 2007, among TAM Capital Inc., Tam S.A., TAM Linhas Aéreas S.A., The Bank of New York and The Bank of New York (Luxembourg) S.A., incorporated herein by reference from our secondpre-effective amendment to our Registration Statement on FormF-4, FileNo. 333-131938. | |
| 2.4 | Indenture, dated as of October 29, 2009, among TAM Capital 2 Inc., TAM S.A., TAM Linhas Aéreas S.A., The Bank of New York Mellon and The Bank of New York Mellon (Luxembourg) S.A., incorporated herein by reference from our Annual Report for the fiscal year ended December 31, 2009 on Form20-F, filed June 30, 2010, | |
| 2.5 | Indenture, dated as of June 3, 2011, between TAM Capital 3 Inc., TAM S.A., TAM Linhas Aéreas S.A., The Bank of New York Mellon and The Bank of New York Mellon (Luxembourg) S.A., incorporated by reference to our annual report on Form20-F (FileNo. 001-14728) filed on April 29, 2016. | |
| 2.6 | Indenture, dated as of November 7, 2013, between Guanay Finance Limited and Citibank N.A., incorporated by reference to our annual report on Form20-F (FileNo. 001-14728) filed on April 29, 2016. | |
| 2.7 | Form of Indenture and Security Agreement between Parina Leasing Limited, Cuclillo Leasing Limited, Rayador Leasing Limited or Canastero Leasing Limited and Wilmington Trust Company (including Annex A), incorporated by reference to our annual report on Form20-F (FileNo. 001-14728) filed on April 29, 2016. | |
| 2.8 | Indenture, dated as of June 9, 2015, between LATAM Airlines Group S.A. and The Bank of New York Mellon, incorporated by reference to our annual report on Form20-F (FileNo. 001-14728) filed on April 29, 2016. | |
| 2.9 | We hereby agree to furnish to the SEC, upon its request, copies of any instruments defining the rights of holders of our long-term debt (or any long-term debt of our subsidiaries for which we are required to filed consolidated or unconsolidated financial statements), where such indebtedness does not exceed 10% of our total consolidated assets. | |
| 4.1 | Second A320-Family Purchase Agreement, dated March 20, 1998, between the Company and Airbus Industry relating to Airbus A320-Family Aircraft (incorporated by reference to our annual report on Form20-F (FileNo. 001-14728), filed on June 24, 2001, and portions of which have been omitted pursuant to a request for confidential treatment). | |
| 4.1.1 | Amendment No. 1, dated as of November 14, 2003, and Amendment No. 2, dated as of October 4, 2005, to the Second A320-Family Purchase Agreement dated as of March 20, 1998, as amended and restated, between the Company and Airbus S.A.S. (as successor to Airbus Industry) (incorporated by reference to our amended annual report on Form20-F (FileNo. 001-14728), filed on June 30, 2006, and portions of which have been omitted pursuant to a request for confidential treatment). | |
Exhibit No. | Description | |
| 4.1.2 | Amendment No. 3, dated as of March 6, 2007, to the Second A320-Family Purchase Agreement, dated as of March 20, 1998, as amended and restated, between the Company and Airbus S.A.S. (incorporated by reference to our amended annual report on Form20-F (FileNo. 001-14728), filed on June 30, 2006, and portions of which have been omitted pursuant to a request for confidential treatment). | |
| 4.1.3 | Amendment No. 5, dated as of December 23, 2009, to the Second A320-Family Purchase Agreement, dated as of March 20, 1998, as amended and restated, between the Company and Airbus S.A.S. (incorporated by reference to our amended annual report on Form20-F (FileNo. 001-14728), filed on June 29, 2010, and portions of which have been omitted pursuant to a request for confidential treatment). | |
|
| |
| 4.1.4 | Amendments No. 6, 7, 8 and 9 (dated as of May 10, 2010, May 19, 2010, September 23, 2010 and December 21, 2010, respectively), to the Second A320-Family Purchase Agreement dated as of March 20, 1998, as amended and restated, between the Company and Airbus S.A.S. (incorporated by reference to our amended annual report on Form20-F (FileNo. 001-14728), filed on May 5, 2011, and portions of which have been omitted pursuant to a request for confidential treatment). | |
| 4.1.5 | Amendments No. 10 and 11 (dated as of June 10, 2011 and November 8, 2011, respectively), to the Second A320-Family Purchase Agreement, dated as of March 20, 1998, as amended and restated, between the Company and Airbus S.A.S. (incorporated by reference to our annual report on Form20-F (FileNo. 001-14728), filed on April 2, 2012 and portions of which have been omitted pursuant to a request for confidential treatment). | |
| 4.1.6 | Amendment No. 12 (dated as of November 19, 2012), to the Second A320-Family Purchase Agreement, dated as of March 20, 1998, as amended and restated, between the Company and Airbus S.A.S. (incorporated by reference to our annual report on Form20-F (FileNo. 001-14728), filed on April 30, 2013, and portions of which have been omitted pursuant to a request for confidential treatment). | |
| Amendment No. 13 (dated as of August 19, 2013), to the Second A320-Family Purchase Agreement dated as of March 20, 1998, as amended and restated, between the Company and Airbus S.A.S. | ||
| 4.1.8 | Amendments No. 14, 15, 16 and 17 (dated as of March 31, 2014, May 16, 2014, July 15, 2015 and December 11, 2014, respectively), to the Second A320-Family Purchase Agreement dated as of March 20, 1998, as amended and restated, between the Company and Airbus S.A.S. (incorporated by reference to our annual report on Form20-F (FileNo. 001-14728) filed on April 1, 2015 and portions of which have been omitted pursuant to a request for confidential treatment). | |
| 4.1.9 | Novation Agreement (dated as of October 30, 2014) between TAM Linhas Aereas S.A., LATAM Airlines Group S.A. and Airbus S.A.S., relating to the A320 Family/A330 purchase agreement dated November 14, 2006, as amended and restated, between Airbus S.A.S. and TAM Linhas Aereas S.A. (incorporated by reference to our annual report on Form20-F (FileNo. 001-14728)filed | |
| 4.2 | Purchase Agreement No. 2126, dated as of January 30, 1998, between the Company and The Boeing Company as amended and supplemented, relating to Model767-316ER, Model767-38EF, and Model767-316F Aircraft (incorporated by reference to our amended annual report on Form20-F (FileNo. 001-14728), filed on December 21, 2004, and portions of which have been omitted pursuant to a request for confidential treatment). | |
| 4.2.1 | Supplemental Agreements No. 16, 19, 20, 21 and 22 (dated as of November 11, 2004, January 21, March 10, April 1, April 28, and July 20, 2005, and March 31, 2006, respectively) to the Purchase Agreement No. 2126, dated January 30, 1998, between the Company and The Boeing Company, relating to Model767-316ER, Model767-38EF, and Model767-316F Aircraft (incorporated by reference to our amended annual report filed on Form20-F (FileNo. 001-14728) filed on May 7, 2007 and portions of which have been omitted pursuant to a request for confidential treatment). | |
| 4.2.2 | Supplemental Agreement No. 23, dated as of March 6, 2007, to the Purchase Agreement No. 2126, dated as of January 30, 1998, between the Company and The Boeing Company (incorporated by reference to our amended annual report on Form20-F (FileNo. 001-14728), filed on April 23, 2007, and portions of which have been omitted pursuant to a request for confidential treatment). | |
| 4.2.3 | Supplemental Agreement No. 24, dated as of November 10, 2008, to the Purchase Agreement No. 2126, dated as of January 30, 1998, between the Company and The Boeing Company. Portions of this document have been omitted pursuant to a request for confidential treatment (incorporated by reference to our amended annual report on Form20-F (FileNo. 001-14728), filed on June 25, 2009, and portions of which have been omitted pursuant to a request for confidential treatment). | |
Exhibit No. | Description | |
| 4.2.4 | Supplemental Agreements No. 28 and 29 (dated as of March 22, 2010 and November 10, 2010, respectively), to the Purchase Agreement No. 2126, dated as of January 30, 1998, between the Company and The Boeing Company. Portions of these documents have been omitted pursuant to a request for confidential treatment (incorporated by reference to our amended annual report on Form20-F (FileNo. 001-14728), filed on May 5, 2011, and portions of which have been omitted pursuant to a request for confidential treatment). | |
| 4.2.5 | Supplemental Agreements No. 30, 31 and 32 (dated as of February 15, 2011, May 10, 2011 and December 22, 2011, respectively), to the Purchase Agreement No. 2126, dated as of January 30, 1998, between the Company and The Boeing Company (incorporated by reference to our annual report on Form20-F (FileNo. 001-14728), filed on April 2, 2012, and portions of which have been omitted pursuant to a request for confidential treatment). | |
| 4.3 | Aircraft Lease Common Terms Agreement between GE Commercial Aviation Services Limited and LAN Cargo S.A., dated as of April 30, 2007, and Aircraft Lease Agreements between Wells Fargo Bank Northwest N.A., as owner trustee, and LAN Cargo S.A., dated as of April 30, 2007 (incorporated by reference to our amended annual report on Form20-F (FileNo. 001-14728), filed on May 7, 2007, and portions of which have been omitted pursuant to a request for confidential treatment). | |
| 4.4 | Purchase Agreement No. 3194 between the Company and The Boeing Company relating to Boeing Model777-Freighter aircraft, dated as of July 3, 2007, (incorporated by reference to our amended annual report on Form20-F (FileNo. 001-14728), filed on June 25, 2008, and portions of which have been omitted pursuant to a request for confidential treatment). | |
|
| |
| 4.4.1 | Supplemental Agreement No. 2, dated as of November 2, 2010, to the Purchase Agreement No. 3194 between the Company and The Boeing Company, dated as of July 3, 2007 (incorporated by reference to our amended annual report on Form20-F (FileNo. 001-14728), filed on May 5, 2011, and portions of which have been omitted pursuant to a request for confidential treatment). | |
| 4.4.2 | Supplemental Agreement No. 3, dated as of September 24, 2011, to the Purchase Agreement No. 3194 between the Company and The Boeing Company, dated as of July 3, 2007 (incorporated by reference to our annual report on Form20-F (FileNo. 001-14728), filed on April 2, 2012, and portions of which have been omitted pursuant to a request for confidential treatment). | |
| 4.4.3 | Supplemental Agreement No. 4, dated as of August 9, 2012, to the Purchase Agreement No. 3194 between the Company and The Boeing Company, dated as of July 3, 2007 (incorporated by reference to our annual report on Form20-F (FileNo. 001-14728), filed on April 30, 2013, and portions of which have been omitted pursuant to a request for confidential treatment). | |
| 4.5 | Purchase Agreement No. 3256 between the Company and The Boeing Company relating to Boeing Model787-8 and787-9 aircraft, dated as of October 29, 2007, (incorporated by reference to our amended annual report on Form20-F (FileNo. 001-14728), filed on June 25, 2008, and portions of which have been omitted pursuant to a request for confidential treatment). | |
| 4.5.1 | Supplemental Agreements No. 1 and 2, (dated March 22, 2010 and July 8, 2010, respectively) to the Purchase Agreement No. 3256, dated October 29, 2007, as amended, between the Company and The Boeing Company (incorporated by reference to our amended annual report on Form20-F (FileNo. 001-14728), filed on May 5, 2011, and portions of which have been omitted pursuant to a request for confidential treatment). | |
| 4.5.2 | Supplemental Agreement No. 3, dated as of August 24, 2012, to the Purchase Agreement No. 3256, as amended, between the Company and The Boeing Company, dated as of October 29, 2007 (incorporated by reference to our annual report on Form20-F (FileNo. 001-14728), filed on April 30, 2013, and portions of which have been omitted pursuant to a request for confidential treatment). | |
| Delay Settlement Agreement, dated as of September 16, 2013, to the Purchase Agreement No. 3256, as amended, between the Company and The Boeing Company, dated as of October 29, 2007 (incorporated by reference to our annual report on Form20-F (FileNo. 001-14728) filed on April 30, 2014 and portions of which have been omitted pursuant to a request for confidential treatment).. | ||
Exhibit No. | Description | |
| 4.5.4 | Supplemental Agreements No. 4 and 5 (dated as of April 22, 2015 and July 3, 2015, respectively) to the Purchase Agreement No. 3256, as amended, between the Company and The Boeing Company, dated as of October 29, 2007 (incorporated by reference to our annual report on Form20-F (FileNo. 001-14728) filed on April 29, 2016 and portions of which have been omitted pursuant to a request for confidential treatment). | |
| 4.5.5* | Supplemental Agreements No. 6 and 7 (dated as of May 27, 2016 and December 20, 2016, respectively) to the Purchase Agreement No. 3256, as amended, between the Company and The Boeing Company, dated as of October 29, 2007. Portions of | |
| 4.6 | General Terms Agreement No.CFM-1-2377460475 and Letter Agreement No. 1 to General Terms Agreement No.CFM-1-2377460475 between the Company and CFM International, Inc., both dated December 17, 2010 (incorporated by reference to our amended annual report on Form20-F (FileNo. 001-14728), filed on May 5, 2011, and portions of which have been omitted pursuant to a request for confidential treatment). | |
| 4.7 | Rate Per Flight Hour Engine Shop Maintenance Services Agreement between the Company and CFM International, Inc., dated December 17, 2010 (incorporated by reference to our amended annual report on Form20-F (FileNo. 001-14728), filed on May 5, 2011, and portions of which have been omitted pursuant to a request for confidential treatment). | |
| 4.8 | ||
| Implementation Agreement, dated as of January 18, 2011, among the Company, Costa Verde Aeronáutica S.A., | ||
| Extension Letter to the Implementation Agreement and Exchange Offer Agreement, dated January 12, 2012, among the Company, Costa Verde Aeronáutica S.A., | ||
| Exchange Offer Agreement, dated as of January 18, 2011, among LAN Airlines S.A., Costa Verde Aeronáutica S.A., | ||
|
| |
| Shareholders Agreement, dated as of January 25, 2012, between the Company and TEP Chile S.A. (incorporated by reference to our amended registration statement on FormF-4 (FileNo. 333-177984), filed on November 15, 2011). | ||
| Shareholders Agreement, dated as of January 25, 2012, among the Company, TEP Chile S.A. and Holdco I S.A. (incorporated by reference to our amended registration statement on FormF-4 (FileNo. 333-177984), filed on November 15, 2011). | ||
| Shareholders Agreement, dated as of January 25, 2012, among the Company, TEP Chile S.A., Holdco I S.A. and TAM S.A. (incorporated by reference to our amended registration statement on FormF-4 (FileNo. 333-177984) filed on November 15, 2011). | ||
| Letter Agreement No. 12 (GTANo. 6-9576), dated July 11, 2011, between the Company and the General Electric Company (incorporated by reference to our annual report on Form20-F (FileNo. 001-14728), filed on April 2, 2012 and portions of which have been omitted pursuant to a request for confidential treatment). | ||
| 4.14 | A320 NEO Purchase Agreement, dated as of June 22, 2011, between the Company and Airbus S.A.S. (incorporated by reference to our annual report on Form20-F (FileNo. 001-14728), filed on April 2, 2012, and portions of which have been omitted pursuant to a request for confidential treatment). | |
| 4.14.1 | Amendments No. 1, 2 and 3 (dated as of February 27, 2013, July 15, 2014 and December 11, 2014, respectively), to the A320 NEO Purchase Agreement dated as of June 22, 2011, between the Company and Airbus S.A. (incorporated by reference to our annual report on Form20-F (FileNo. 001-14728) filed on April 1, 2015 and portions of which have been omitted pursuant to a request for confidential treatment). | |
Exhibit No. | Description | |
| 4.14.2 | Letter Agreement No. 1 (dated as of July 15, 2014) to Amendment No. 2 (dated as of July 15, 2014) to the A320 NEO Purchase Agreement dated as of June 22, 2011, between the Company and Airbus S.A. (incorporated by reference to our annual report on Form20-F (FileNo. 001-14728) filed on April 1, 2015 and portions of which have been omitted pursuant to a request for confidential treatment). | |
| 4.14.3* | Amendment No. 4, 5 and 6 (dated as of April 15, 2016, April 15, 2016, and August 8, 2016, respectively), to the A320 NEO Purchase Agreement dated as of June 22, 2011, between the Company and Airbus S.A.. Portions of these documents have been omitted pursuant to a request for confidential treatment. Such omitted portions have been filed separately with the Securities and Exchange Commission. | |
| 4.15 | Buyback Agreement No. 3001 relating to One (1) AirbusA318-100 Aircraft MSN 3001, dated as of April 14, 2011, between the Company and Airbus Financial Services (incorporated by reference to our annual report on Form20-F (FileNo. 001-14728), filed on April 2, 2012, and portions of which have been omitted pursuant to a request for confidential treatment). | |
| 4.16 | ||
| 4.17 | ||
| Buyback Agreement No. | ||
| Buyback Agreement No. | ||
| Buyback Agreement No. 3371, dated as of July 25, 2012, between the Company and Airbus Financial Services. Portions of this document have been omitted pursuant to a request for confidential treatment (incorporated by reference to our annual report on Form20-F (FileNo. 001-14728), filed on April 30, 2013, and portions of which have been omitted pursuant to a request for confidential treatment). | ||
|
| |
| Buyback Agreement No. 3390, dated as of October 26, 2012, between the Company and Airbus Financial Services. Portions of this document have been omitted pursuant to a request for confidential treatment (incorporated by reference to our annual report on Form20-F (FileNo. 001-14728), filed on April 30, 2013, and portions of which have been omitted pursuant to a request for confidential treatment). | ||
| Buyback Agreement No. 3438, dated as of December 5, 2012, between the Company and Airbus Financial Services. Portions of this document have been omitted pursuant to a request for confidential treatment (incorporated by reference to our annual report on Form20-F (FileNo. 001-14728), filed on April 30, 2013, and portions of which have been omitted pursuant to a request for confidential treatment). | ||
| Buyback Agreement No. 3469, dated as of January 4, 2013, between the Company and Airbus Financial | ||
Exhibit No. | Description | |
| 4.25 | Buyback Agreement No. 3509, dated as of February 20, 2013, between the Company and Airbus Financial Services (incorporated by reference to our annual report on Form20-F (FileNo. 001-14728), filed on April 30, 2013, and portions of which have been omitted pursuant to a request for confidential treatment). | |
| A320 Family Purchase Agreement, dated March 19, 1998, between Airbus S.A.S. (formerly known as Airbus Industrie GIE) and TAM Linhas Aéreas S.A. (formerly known as TAM Transportes Aéreas Meridionais S.A. and as successor in interest inTAM-Transportes Aéreas Regionais S.A.), incorporated herein by reference from our sixthpre-effective amendment to our Registration Statement on FormF-1, filed March 2, 2006, FileNo. 333-131938. | ||
| Amendments No. 12, 13 and 14 (dated as of January 27, 2012 and November 30, 2012 and December 14, 2012, respectively), to the Second A320-Family Purchase Agreement, dated as of March 20, 1998, as amended and restated, between the Company and Airbus S.A.S. (incorporated by reference to our annual report on Form20-F (FileNo. 001-14728), filed on April 30, 2013, and portions of which have been omitted pursuant to a request for confidential treatment). | ||
| A350 Family Purchase Agreement, dated December 20, 2005, between Airbus S.A.S. and TAM Linhas Aéreas S.A., incorporated herein by reference from our sixthpre-effective amendment to our Registration Statement on FormF-1, filed March 2, 2006, FileNo. 333-131938. | ||
| A350 Family Purchase Agreement, dated December 20, 2005, as amended and restated on January 21, 2008, between Airbus S.A.S. and TAM Linhas Aereas S.A. (incorporated by reference to our annual report on Form20-F (FileNo. 001-14728) filed on April 1, 2015 and portions of which have been omitted pursuant to a request for confidential treatment). | ||
| 4.27.2 | Amendments No. 1, 2 and 3 (dated July 28, 2010, July 15, 2014 and October 30, 2014, respectively) to the A350 Purchase Agreement, dated December 20, 2005, as amended and restated on January 21, 2008, between Airbus S.A.S. and TAM Linhas Aereas S.A. (incorporated by reference to our annual report on Form20-F (FileNo. 001-14728) filed on April 1, 2015 and portions of which have been omitted pursuant to a request for confidential treatment). | |
| 4.27.3 | Novation Agreement (dated as of July 21, 2014) between TAM Linhas Aereas S.A., LATAM Airlines Group S.A. and Airbus S.A.S., relating to the A350 Family Purchase Agreement, dated December 20, 2005, as amended and restated on January 21, 2008, between Airbus S.A.S. and TAM Linhas Aereas S.A. (incorporated by reference to our annual report on Form20-F (FileNo. 001-14728) filed on April 1, 2015 and portions of which have been omitted pursuant to a request for confidential treatment). | |
| 4.27.4 | Amendments No. 4 and 5 (dated September 15, 2015 and November 19, 2015, respectively) to the A350 Purchase Agreement, dated December 20, 2005, as amended and restated on January 21, 2008, between Airbus S.A.S. and TAM Linhas Aereas S.A. (incorporated by reference to our annual report on Form20-F (FileNo. 001-14728) filed on April 29, 2016 and portions of which have been omitted pursuant to a request for confidential treatment). | |
| 4.27.5* | Amendments No. 6, 7 and 8 (dated February 3, 2016, August 8, 2016, and September 9, 2016, respectively) to the A350 Purchase Agreement, dated December 20, 2005, as amended and restated on January 21, 2008, between Airbus S.A.S. and TAM Linhas Aereas S.A.. Portions of these documents have been omitted pursuant to a request for confidential treatment. Such omitted portions have been filed separately with the Securities and Exchange Commission. | |
| 4.29 | V2500 Maintenance Agreement, dated September 14, 2000, between TAM Transportes Aéreos Regionais S.A. (incorporated by TAM Linhas Aéreas S.A.) and MTU Maintenance Hannover GmbH (MTU), incorporated herein by reference from our sixthpre-effective amendment to our Registration Statement on FormF-1, filed March 2, 2006, FileNo. 333-131938. | |
| PW1100G-JM Engine Support and Maintenance Agreement, dated February 26, 2014, between LATAM Airlines Group S.A. and Pratt & Whitney Division. Portions of this document have been omitted pursuant to a request for confidential treatment. Such omitted portions have been filed separately with the Securities and Exchange Commission. | ||
| Framework Deed, dated May 28, 2013, between LATAM Airlines Group S.A. and Aercap Holdings N.V. Portions of this document have been omitted pursuant to a request for confidential treatment. Such omitted portions have been filed separately with the Securities and Exchange Commission. | ||
| 4.32 | A320 Family/A330 Purchase Agreement (dated as of November 14, 2006) between Airbus S.A.S. and TAM – Linhas Aereas S.A. (incorporated by reference to our annual report on Form20-F (FileNo. 001-14728) filed on April 1, 2015 and portions of which have been omitted pursuant to a request for confidential treatment). | |
Exhibit No. | Description | |
| 4.32.1 | Amendments No. 15, 16, 17, 18, and 19 (dated as of February 18, 2013, February 27, 2013, August 19, 2013, July 15, 2014 and December 11, 2014, respectively) to the A320 Family/A330 Purchase Agreement (dated as of November 14, 2006) between Airbus S.A.S. and TAM – Linhas Aereas S.A. (incorporated by reference to our annual report on Form20-F (FileNo. 001-14728) filed on April 1, 2015 and portions of which have been omitted pursuant to a request for confidential treatment). | |
| 4.32.2 | Amendments No. 20 and 21 (dated as of June 3, 2015 and December 21, 2015, respectively) to the A320 Family/A330 Purchase Agreement (dated as of November 14, 2006) between Airbus S.A.S. and TAM – Linhas Aereas S.A. (incorporated by reference to our annual report on Form20-F (FileNo. 001-14728) filed on April 1, 2015 and portions of which have been omitted pursuant to a request for confidential treatment). | |
| 4.32.3* | Amendments No. 22, 23 and 24 (dated as of April 15, 2016, April 15, 2016, and August 8, 2016, respectively) to the A320 Family/A330 Purchase Agreement (dated as of November 14, 2006) between Airbus S.A.S. and TAM – Linhas Aereas S.A.. Portions of these documents have been omitted pursuant to a request for confidential treatment. Such omitted portions have been filed separately with the Securities and Exchange Commission. | |
| 4.33 | Supplemental Agreement No. 7 (dated as of May 2014) to the Boeing777-32WER Purchase Agreement (dated as of February 2007) between TAM – Linhas Aereas S.A. and The Boeing Company (incorporated by reference to our annual report on Form20-F (FileNo. 001-14728) filed on April 1, 2015 and portions of which have been omitted pursuant to a request for confidential treatment). | |
| 4.33.1 | Supplemental Agreement No. 8, dated as of April 22, 2015, to the Boeing777-32WER Purchase Agreement (dated as of February 2007) between TAM Linhas Aéreas and The Boeing Company (incorporated by reference to our annual report on Form20-F (FileNo. 001-14728) filed on April 29, 2016 and portions of which have been omitted pursuant to a request for confidential treatment). | |
| 8.1* | List of subsidiaries of the Company. | |
| 12.1* | Certification of Chief Executive Officer pursuant to Section 302 of the Sarbanes-Oxley Act of 2002. | |
| 12.2* | Certification of Chief Financial Officer pursuant to Section 302 of the Sarbanes-Oxley Act of 2002. | |
| 13.1* | Certifications of Chief Financial Officer and Chief Executive Officer pursuant to Section 906 of the Sarbanes-Oxley Act of 2002. | |
| * | Filed |

LATAM AIRLINES GROUP S.A. AND SUBSIDIARIES
CONSOLIDATED FINANCIAL STATEMENTS
DECEMBER 31, 20132016
Consolidated Statement of Financial Position
Consolidated Statement of Income by Function Consolidated Statement of Comprehensive Income Consolidated Statement of Changes in Equity Consolidated Statement of Cash Flows—Direct Method Notes to the Consolidated Financial Statements | ||
| CLP | - | CHILEAN PESO | ||
| ARS | - | ARGENTINE PESO | ||
| US$ | - | UNITED STATES DOLLAR | ||
| THUS$ | - | THOUSANDS OF UNITED STATES DOLLARS | ||
| COP | - | COLOMBIAN PESO | ||
| BRL/R$ | - | BRAZILIAN REAL | ||
| THR$ | - | THOUSANDS OF BRAZILIAN REAL | ||
| MXN | - | MEXICAN PESO | ||
| VEF | - | STRONG BOLIVAR |
Contents of the notes to the consolidated financial statements of LATAM Airlines Group S.A. and Subsidiaries.
| Notes | Page | |||
2.10. Derivative financial instruments and hedging activities | ||||
| 16 | ||||
2.22. Non-current assets (or disposal groups) classified as held for sale | ||||
8 - Trade, other accounts receivable and non-current accounts receivable | ||||
| ||||
| ||||
| 127 | ||||
| 37 - Events subsequent to the date of the financial statements | ||||
LATAM AIRLINES GROUP S.AS.A. AND SUBSIDIARIES
CONSOLIDATED STATEMENT OF FINANCIAL POSITION
ASSETS
| ASSETS | ||||||||||
| As of | As of | |||||||||
| December 31, | December 31, | |||||||||
| Note | 2013 | 2012 (*) | ||||||||
| ThUS$ | ThUS$ | |||||||||
Current assets | ||||||||||
Cash and cash equivalents | 6 - 7 | 1,984,903 | 650,263 | |||||||
Other financial assets | 7 - 12 | 709,944 | 636,543 | |||||||
Other non-financial assets | 13 | 335,617 | 284,404 | |||||||
Trade and other accounts receivable | 7 - 8 | 1,633,094 | 1,417,531 | |||||||
Accounts receivable from related entities | 7 - 9 | 628 | 15,187 | |||||||
Inventories | 10 | 231,028 | 176,818 | |||||||
Tax assets | 11 | 81,890 | 95,785 | |||||||
|
|
|
| |||||||
Total current assets other than non-current assets (or disposal groups) classified as held for sale or as held for distribution to owners | 4,977,104 | 3,276,531 | ||||||||
|
|
|
| |||||||
Non-current assets (or disposal groups) classified as held for sale or as held for distribution to owners | 14 | 2,445 | 47,655 | |||||||
|
|
|
| |||||||
Total current assets | 4,979,549 | 3,324,186 | ||||||||
|
|
|
| |||||||
Non-current assets | ||||||||||
Other financial assets | 7 - 12 | 65,289 | 74,095 | |||||||
Other non-financial assets | 13 | 272,276 | 307,987 | |||||||
Accounts receivable | 7 - 8 | 100,775 | 50,612 | |||||||
Equity accounted investments | 16 | 6,596 | 3,757 | |||||||
Intangible assets other than goodwill | 17 | 2,093,308 | 2,382,399 | |||||||
Goodwill | 18 | 3,727,605 | 4,213,160 | |||||||
Property, plant and equipment | 19 | 10,982,786 | 11,807,076 | |||||||
Deferred tax assets | 20 | 402,962 | 163,067 | |||||||
|
|
|
| |||||||
Total non-current assets | 17,651,597 | 19,002,153 | ||||||||
|
|
|
| |||||||
Total assets | 22,631,146 | 22,326,339 | ||||||||
|
|
|
| |||||||
| Note | As of December 31, 2016 | As of December 31, 2015 | ||||||||||
| ThUS$ | ThUS$ | |||||||||||
Current assets | ||||||||||||
Cash and cash equivalents | 6 -7 | 949,327 | 753,497 | |||||||||
Other financial assets | 7 -11 | 712,828 | 651,348 | |||||||||
Other non-financial assets | 12 | 212,242 | 330,016 | |||||||||
Trade and other accounts receivable | 7 - 8 | 1,107,889 | 796,974 | |||||||||
Accounts receivable from related entities | 7 - 9 | 554 | 183 | |||||||||
Inventories | 10 | 241,363 | 224,908 | |||||||||
Tax assets | 18 | 65,377 | 64,015 | |||||||||
|
|
|
| |||||||||
Total current assets other than non-current assets (or disposal groups) classified as held for sale or as held for distribution to owners | 3,289,580 | 2,820,941 | ||||||||||
|
|
|
| |||||||||
Non-current assets (or disposal groups) classified as held for sale or as held for distribution to owners | 13 | 337,195 | 1,960 | |||||||||
|
|
|
| |||||||||
Total current assets | 3,626,775 | 2,822,901 | ||||||||||
|
|
|
| |||||||||
Non-current assets | ||||||||||||
Other financial assets | 7 -11 | 102,125 | 89,458 | |||||||||
Other non-financial assets | 12 | 237,344 | 235,463 | |||||||||
Accounts receivable | 7 - 8 | 8,254 | 10,715 | |||||||||
Intangible assets other than goodwill | 15 | 1,610,313 | 1,321,425 | |||||||||
Goodwill | 16 | 2,710,382 | 2,280,575 | |||||||||
Property, plant and equipment | 17 | 10,498,149 | 10,938,657 | |||||||||
Tax assets | 18 | 20,272 | 25,629 | |||||||||
Deferred tax assets | 18 | 384,580 | 376,595 | |||||||||
|
|
|
| |||||||||
Total non-current assets | 15,571,419 | 15,278,517 | ||||||||||
|
|
|
| |||||||||
Total assets | 19,198,194 | 18,101,418 | ||||||||||
|
|
|
| |||||||||
The accompanying Notes 1 to 4138 form an integral part of these consolidated financial statements.
LATAM AIRLINES GROUP S.AS.A. AND SUBSIDIARIES
CONSOLIDATED STATEMENT OF FINANCIAL POSITION
LIABILITIES AND EQUITY
| LIABILITIES AND EQUITY | ||||||||||
| As of | As of | |||||||||
| December 31, | December 31, | |||||||||
| Note | 2013 | 2012(*) | ||||||||
| ThUS$ | ThUS$ | |||||||||
LIABILITIES | ||||||||||
Current liabilities | ||||||||||
Other financial liabilities | 7 - 21 | 2,039,787 | 2,047,330 | |||||||
Trade and other accounts payables | 7 - 22 | 1,557,736 | 1,689,990 | |||||||
Accounts payable to related entities | 7 - 9 | 505 | 274 | |||||||
Other provisions | 23 | 27,856 | 59,574 | |||||||
Tax liabilities | 24 | 11,583 | 14,512 | |||||||
Other non-financial liabilities | 25 | 2,871,640 | 2,485,887 | |||||||
|
|
|
| |||||||
Total current liabilities | 6,509,107 | 6,297,567 | ||||||||
|
|
|
| |||||||
Non-current liabilities | ||||||||||
Other financial liabilities | 7 - 21 | 7,859,985 | 7,698,857 | |||||||
Accounts payable | 7 - 27 | 922,887 | 1,085,601 | |||||||
Other provisions | 23 | 1,122,247 | 1,306,872 | |||||||
Deferred tax liabilities | 20 | 767,228 | 579,339 | |||||||
Employee benefits | 26 | 45,666 | 38,095 | |||||||
Other non-financial liabilities | 25 | 77,567 | 99,323 | |||||||
|
|
|
| |||||||
Total non-current liabilities | 10,795,580 | 10,808,087 | ||||||||
|
|
|
| |||||||
Total liabilities | 17,304,687 | 17,105,654 | ||||||||
|
|
|
| |||||||
EQUITY | ||||||||||
Share capital | 28 | 2,389,384 | 1,501,018 | |||||||
Retained earnings | 28 | 795,303 | 1,076,136 | |||||||
Treasury Shares | 28 | (178 | ) | (203 | ) | |||||
Other reserves | 28 | 2,054,312 | 2,535,100 | |||||||
|
|
|
| |||||||
Parent’s ownership interest | 5,238,821 | 5,112,051 | ||||||||
Non-controlling interest | 87,638 | 108,634 | ||||||||
|
|
|
| |||||||
Total equity | 5,326,459 | 5,220,685 | ||||||||
|
|
|
| |||||||
Total liabilities and equity | 22,631,146 | 22,326,339 | ||||||||
|
|
|
| |||||||
| Note | As of December 31, 2016 | As of December 31, 2015 | ||||||||||
| ThUS$ | ThUS$ | |||||||||||
LIABILITIES | ||||||||||||
Current liabilities | ||||||||||||
Other financial liabilities | 7 - 19 | 1,839,528 | 1,644,235 | |||||||||
Trade and other accounts payables | 7 - 20 | 1,593,068 | 1,483,957 | |||||||||
Accounts payable to related entities | 7 - 9 | 269 | 447 | |||||||||
Other provisions | 21 | 2,643 | 2,922 | |||||||||
Tax liabilities | 18 | 14,286 | 19,378 | |||||||||
Other non-financial liabilities | 22 | 2,762,245 | 2,490,033 | |||||||||
|
|
|
| |||||||||
| 6,212,039 | 5,640,972 | |||||||||||
|
|
|
| |||||||||
Liabilities included in disposal groups classified as held for sale | 10,152 | — | ||||||||||
|
|
|
| |||||||||
Total current liabilities | 6,222,191 | 5,640,972 | ||||||||||
|
|
|
| |||||||||
Non-current liabilities | ||||||||||||
Other financial liabilities | 7 - 19 | 6,796,952 | 7,532,385 | |||||||||
Accounts payable | 7 - 24 | 359,391 | 417,050 | |||||||||
Other provisions | 21 | 422,494 | 424,497 | |||||||||
Deferred tax liabilities | 18 | 915,759 | 811,565 | |||||||||
Employee benefits | 23 | 82,322 | 65,271 | |||||||||
Other non-financial liabilities | 22 | 213,781 | 272,130 | |||||||||
|
|
|
| |||||||||
Total non-current liabilities | 8,790,699 | 9,522,898 | ||||||||||
|
|
|
| |||||||||
Total liabilities | 15,012,890 | 15,163,870 | ||||||||||
|
|
|
| |||||||||
EQUITY | ||||||||||||
Share capital | 25 | 3,149,564 | 2,545,705 | |||||||||
Retained earnings | 25 | 366,404 | 317,950 | |||||||||
Treasury Shares | 25 | (178 | ) | (178 | ) | |||||||
Other reserves | 580,870 | (6,942 | ) | |||||||||
|
|
|
| |||||||||
Parent’s ownership interest | 4,096,660 | 2,856,535 | ||||||||||
Non-controlling interest | 14 | 88,644 | 81,013 | |||||||||
|
|
|
| |||||||||
Total equity | 4,185,304 | 2,937,548 | ||||||||||
|
|
|
| |||||||||
Total liabilities and equity | 19,198,194 | 18,101,418 | ||||||||||
|
|
|
| |||||||||
The accompanying Notes 1 to 4138 form an integral part of these consolidated financial statements.
LATAM AIRLINES GROUP S.AS.A. AND SUBSIDIARIES
CONSOLIDATED STATEMENT OF INCOME BY FUNCTION
| For the period ended | ||||||||||||||||
| December 31, | ||||||||||||||||
| Note | 2013 | 2012(*) | 2011 | |||||||||||||
| ThUS$ | ThUS$ | ThUS$ | ||||||||||||||
Revenue | 29 | 12,924,537 | 9,710,372 | 5,585,440 | ||||||||||||
Cost of sales | (10,054,164 | ) | (7,634,453 | ) | (4,078,598 | ) | ||||||||||
|
|
|
|
|
| |||||||||||
Gross margin | 2,870,373 | 2,075,919 | 1,506,842 | |||||||||||||
|
|
|
|
|
| |||||||||||
Other income | 32 | 341,565 | 220,156 | 132,804 | ||||||||||||
Distribution costs | (1,025,896 | ) | (803,619 | ) | (479,829 | ) | ||||||||||
Administrative expenses | (1,136,115 | ) | (888,654 | ) | (405,716 | ) | ||||||||||
Other expenses | (408,703 | ) | (311,753 | ) | (214,411 | ) | ||||||||||
Other gains/(losses) | (55,410 | ) | (45,831 | ) | (33,039 | ) | ||||||||||
|
|
|
|
|
| |||||||||||
Gains (losses) from operating activities | 585,814 | 246,218 | 506,651 | |||||||||||||
|
|
|
|
|
| |||||||||||
Financial income | 72,828 | 77,489 | 14,453 | |||||||||||||
Financial costs | 30 | (462,524 | ) | (294,598 | ) | (139,077 | ) | |||||||||
Equity accounted earnings | 16 | 1,954 | 972 | 458 | ||||||||||||
Foreign exchange gains/(losses) | 33 | (482,174 | ) | 66,685 | (256 | ) | ||||||||||
Result of indexation units | 214 | (22 | ) | 131 | ||||||||||||
|
|
|
|
|
| |||||||||||
Income (loss) before taxes | (283,888 | ) | 96,744 | 382,360 | ||||||||||||
Income (loss) tax expense | 20 | 20,069 | (102,386 | ) | (61,789 | ) | ||||||||||
|
|
|
|
|
| |||||||||||
NET INCOME (LOSS) FOR THE PERIOD | (263,819 | ) | (5,642 | ) | 320,571 | |||||||||||
|
|
|
|
|
| |||||||||||
Income (loss) attributable to owners of the parent | (281,114 | ) | (19,076 | ) | 320,197 | |||||||||||
Income (loss) attributable to non-controlling interest | 17,295 | 13,434 | 374 | |||||||||||||
|
|
|
|
|
| |||||||||||
Net income (loss) for the period | (263,819 | ) | (5,642 | ) | 320,571 | |||||||||||
|
|
|
|
|
| |||||||||||
EARNINGS PER SHARE | ||||||||||||||||
Basic earnings (losses) per share (US$) | 34 | (0.57613 | ) | (0.04627 | ) | 0.94335 | ||||||||||
Diluted earnings (losses) per share (US$) | 34 | (0.57613 | ) | (0.04627 | ) | 0.94260 | ||||||||||
For the period ended December 31, | ||||||||||||||||
| Note | 2016 | 2015 | 2014 | |||||||||||||
| ThUS$ | ThUS$ | ThUS$ | ||||||||||||||
Revenue | 26 | 8,988,340 | 9,740,045 | 12,093,501 | ||||||||||||
Cost of sales | (6,967,037 | ) | (7,636,709 | ) | (9,624,501 | ) | ||||||||||
|
|
|
|
|
| |||||||||||
Gross margin | 2,021,303 | 2,103,336 | 2,469,000 | |||||||||||||
|
|
|
|
|
| |||||||||||
Other income | 28 | 538,748 | 385,781 | 377,645 | ||||||||||||
Distribution costs | (747,426 | ) | (783,304 | ) | (957,072 | ) | ||||||||||
Administrative expenses | (872,954 | ) | (878,006 | ) | (980,660 | ) | ||||||||||
Other expenses | (373,738 | ) | (323,987 | ) | (401,021 | ) | ||||||||||
Other gains/(losses) | (72,634 | ) | (55,280 | ) | 33,524 | |||||||||||
|
|
|
|
|
| |||||||||||
Income from operation activities | 493,299 | 448,540 | 541,416 | |||||||||||||
|
|
|
|
|
| |||||||||||
Financial income | 74,949 | 75,080 | 90,500 | |||||||||||||
Financial costs | 27 | (416,336 | ) | (413,357 | ) | (430,034 | ) | |||||||||
Share of profit of investments accounted for using the equity method | — | 37 | (6,455 | ) | ||||||||||||
Foreign exchange gains/(losses) | 29 | 121,651 | (467,896 | ) | (130,201 | ) | ||||||||||
Result of indexation units | 311 | 481 | 7 | |||||||||||||
|
|
|
|
|
| |||||||||||
Income (loss) before taxes | 273,874 | (357,115 | ) | 65,233 | ||||||||||||
Income (loss) tax expense / benefit | 18 | (163,204 | ) | 178,383 | (292,404 | ) | ||||||||||
|
|
|
|
|
| |||||||||||
NET INCOME (LOSS) FOR THE PERIOD | 110,670 | (178,732 | ) | (227,171 | ) | |||||||||||
|
|
|
|
|
| |||||||||||
Income (loss) attributable to owners of the parent | 69,220 | (219,274 | ) | (259,985 | ) | |||||||||||
Income (loss) attributable to non-controlling interest | 14 | 41,450 | 40,542 | 32,814 | ||||||||||||
|
|
|
|
|
| |||||||||||
Net income (loss) for the year | 110,670 | (178,732 | ) | (227,171 | ) | |||||||||||
|
|
|
|
|
| |||||||||||
EARNINGS PER SHARE | ||||||||||||||||
Basic earnings (losses) per share (US$) | 30 | 0.12665 | (0.40193 | ) | (0.47656 | ) | ||||||||||
Diluted earnings (losses) per share (US$) | 30 | 0.12665 | (0.40193 | ) | (0.47656 | ) | ||||||||||
The accompanying Notes 1 to 4138 form an integral part of these consolidated financial statements.
LATAM AIRLINES GROUP S.AS.A. AND SUBSIDIARIES
CONSOLIDATED STATEMENT OF COMPREHENSIVE INCOME
| For the period ended | ||||||||||||||||
| December 31, | ||||||||||||||||
| Note | 2013 | 2012(*) | 2011 | |||||||||||||
| ThUS$ | ThUS$ | ThUS$ | ||||||||||||||
NET INCOME (LOSS) | (263,819 | ) | (5,642 | ) | 320,571 | |||||||||||
Components of other comprehensive income that will be reclassified to income before taxes | ||||||||||||||||
Currency translation differences | ||||||||||||||||
Gains (losses) on currency translation, before tax | 33 | (629,858 | ) | 19,170 | (10,864 | ) | ||||||||||
|
|
|
|
|
| |||||||||||
Other comprehensive income, before taxes, currency translation differences | (629,858 | ) | 19,170 | (10,864 | ) | |||||||||||
|
|
|
|
|
| |||||||||||
Cash flow hedges | ||||||||||||||||
Gains (losses) on cash flow hedges before taxes | 21 | 128,166 | (2,510 | ) | (40,368 | ) | ||||||||||
|
|
|
|
|
| |||||||||||
Other comprehensive income (losses), before taxes, cash flow hedges | 128,166 | (2,510 | ) | (40,368 | ) | |||||||||||
|
|
|
|
|
| |||||||||||
Other components of other comprehensive income (loss), before taxes | (501,692 | ) | 16,660 | (51,232 | ) | |||||||||||
|
|
|
|
|
| |||||||||||
Income tax relating to other comprehensive income that will be reclassified to income | ||||||||||||||||
Income tax related to currency translation differences in other comprehensive income | 20 | — | (2,734 | ) | 1,846 | |||||||||||
Income tax related to cash flow hedges in other comprehensive income | 20 | (19,345 | ) | (2,623 | ) | 6,862 | ||||||||||
|
|
|
|
|
| |||||||||||
Income taxes related to components of other comprehensive income that will be reclassified to income | (19,345 | ) | (5,357 | ) | 8,708 | |||||||||||
|
|
|
|
|
| |||||||||||
Other comprehensive income (loss) | (521,037 | ) | 11,303 | (42,524 | ) | |||||||||||
|
|
|
|
|
| |||||||||||
Total comprehensive income (loss) | (784,856 | ) | 5,661 | 278,047 | ||||||||||||
|
|
|
|
|
| |||||||||||
Comprehensive income (loss) attributable to owners of the parent | (768,457 | ) | (2,359 | ) | 277,631 | |||||||||||
Comprehensive income (loss) attributable to non-controlling interests | (16,399 | ) | 8,020 | 416 | ||||||||||||
|
|
|
|
|
| |||||||||||
TOTAL COMPREHENSIVE INCOME (LOSS) | (784,856 | ) | 5,661 | 278,047 | ||||||||||||
|
|
|
|
|
| |||||||||||
For the period ended December 31, | ||||||||||||||||
| Note | 2016 | 2015 | 2014 | |||||||||||||
| ThUS$ | ThUS$ | ThUS$ | ||||||||||||||
NET INCOME (LOSS) | 110,670 | (178,732 | ) | (227,171 | ) | |||||||||||
Components of other comprehensive income that will not be reclassified to income before taxes | ||||||||||||||||
Other comprehensive income, before taxes, gains (losses) by new measurements on defined benefit plans | 25 | (3,105 | ) | (14,631 | ) | — | ||||||||||
|
|
|
|
|
| |||||||||||
Total other comprehensive income that will not be reclassified to income before taxes | (3,105 | ) | (14,631 | ) | — | |||||||||||
|
|
|
|
|
| |||||||||||
Components of other comprehensive income that will be reclassified to income before taxes | ||||||||||||||||
Currency translation differences | ||||||||||||||||
Gains (losses) on currency translation, before tax | 29 | 494,362 | (1,409,439 | ) | (650,439 | ) | ||||||||||
|
|
|
|
|
| |||||||||||
Other comprehensive income, before taxes, currency translation differences | 494,362 | (1,409,439 | ) | (650,439 | ) | |||||||||||
|
|
|
|
|
| |||||||||||
Cash flow hedges | ||||||||||||||||
Gains (losses) on cash flow hedges before taxes | 19 | 127,390 | 80,387 | (163,993 | ) | |||||||||||
|
|
|
|
|
| |||||||||||
Other comprehensive income (losses), before taxes, cash flow hedges | 127,390 | 80,387 | (163,993 | ) | ||||||||||||
|
|
|
|
|
| |||||||||||
Total other comprehensive income that will be reclassified to income before taxes | 621,752 | (1,329,052 | ) | (814,432 | ) | |||||||||||
|
|
|
|
|
| |||||||||||
Other components of other comprehensive income (loss), before taxes | 618,647 | (1,343,683 | ) | (814,432 | ) | |||||||||||
|
|
|
|
|
| |||||||||||
Income tax relating to other comprehensive income that will not be reclassified to income | ||||||||||||||||
Income tax relating to new measurements on defined benefit plans | 18 | 921 | 3,911 | — | ||||||||||||
|
|
|
|
|
| |||||||||||
Accumulate income tax relating to other comprehensive income that will not be reclassified to income | 921 | 3,911 | — | |||||||||||||
|
|
|
|
|
| |||||||||||
Income tax relating to other comprehensive income that will be reclassified to income | ||||||||||||||||
Income tax related to cash flow hedges in other comprehensive income | (34,695 | ) | (21,103 | ) | 47,979 | |||||||||||
|
|
|
|
|
| |||||||||||
Income taxes related to components of other comprehensive income that will be reclassified to income | (34,695 | ) | (21,103 | ) | 47,979 | |||||||||||
|
|
|
|
|
| |||||||||||
Total Other comprehensive income | 584,873 | (1,360,875 | ) | (766,453 | ) | |||||||||||
|
|
|
|
|
| |||||||||||
Total comprehensive income (loss) | 695,543 | (1,539,607 | ) | (993,624 | ) | |||||||||||
|
|
|
|
|
| |||||||||||
Comprehensive income (loss) attributable to owners of the parent | 648,539 | (1,551,331 | ) | (980,697 | ) | |||||||||||
Comprehensive income (loss) attributable to non-controlling interests | 47,004 | 11,724 | (12,927 | ) | ||||||||||||
|
|
|
|
|
| |||||||||||
TOTAL COMPREHENSIVE INCOME (LOSS) | 695,543 | (1,539,607 | ) | (993,624 | ) | |||||||||||
|
|
|
|
|
| |||||||||||
The accompanying Notes 1 to 4138 form an integral part of these consolidated financial statements.
LATAM AIRLINES GROUP S.A AND SUBSIDIARIES
CONSOLIDATED STATEMENT OF CHANGES IN EQUITY
| Attributable to owners of the parent | ||||||||||||||||||||||||||||||||||||||||||||||||
| Change in other reserves | ||||||||||||||||||||||||||||||||||||||||||||||||
| Currency | Cash flow | Shares based | Other | Total | Parent’s | Non- | ||||||||||||||||||||||||||||||||||||||||||
| Share | Treasury | translation | hedging | payments | sundry | other sundry | Retained | ownership | controlling | Total | ||||||||||||||||||||||||||||||||||||||
| Note | capital | shares | reserve | reserve | reserve | reserve | reserve | earnings | interest | interest | equity | |||||||||||||||||||||||||||||||||||||
| ThUS$ | ThUS$ | ThUS$ | ThUS$ | ThUS$ | ThUS$ | ThUS$ | ThUS$ | ThUS$ | ThUS$ | ThUS$ | ||||||||||||||||||||||||||||||||||||||
Equity as of January 1, 2013 | 1,501,018 | (203 | ) | 3,574 | (140,730 | ) | 5,574 | 2,666,682 | 2,535,100 | 1,076,136 | 5,112,051 | 108,634 | 5,220,685 | |||||||||||||||||||||||||||||||||||
Total increase (decrease) in equity | ||||||||||||||||||||||||||||||||||||||||||||||||
Comprehensive income | ||||||||||||||||||||||||||||||||||||||||||||||||
Gain (losses) | 28 | — | — | — | — | — | — | — | (281,114 | ) | (281,114 | ) | 17,295 | (263,819 | ) | |||||||||||||||||||||||||||||||||
Other comprehensive income | — | — | (593,565 | ) | 106,222 | — | — | (487,343 | ) | — | (487,343 | ) | (33,694 | ) | (521,037 | ) | ||||||||||||||||||||||||||||||||
|
|
|
|
|
|
|
|
|
|
|
|
|
|
|
|
|
|
|
|
|
| |||||||||||||||||||||||||||
Total comprehensive income | — | — | (593,565 | ) | 106,222 | — | — | (487,343 | ) | (281,114 | ) | (768,457 | ) | (16,399 | ) | (784,856 | ) | |||||||||||||||||||||||||||||||
|
|
|
|
|
|
|
|
|
|
|
|
|
|
|
|
|
|
|
|
|
| |||||||||||||||||||||||||||
Transactions with shareholders | ||||||||||||||||||||||||||||||||||||||||||||||||
Equity issuance | 28-38 | 888,570 | — | — | — | — | — | — | — | 888,570 | — | 888,570 | ||||||||||||||||||||||||||||||||||||
Increase (decrease) through transactions with treasury shares | 28 | (25 | ) | 25 | — | — | — | — | — | — | — | — | — | |||||||||||||||||||||||||||||||||||
Increase (decrease) through transfers and other changes, equity | 28-38 | (179 | ) | — | — | — | 15,437 | (8,882 | ) | 6,555 | 281 | 6,657 | (4,597 | ) | 2,060 | |||||||||||||||||||||||||||||||||
|
|
|
|
|
|
|
|
|
|
|
|
|
|
|
|
|
|
|
|
|
| |||||||||||||||||||||||||||
Total transactions with shareholders | 888,366 | 25 | — | — | 15,437 | (8,882 | ) | 6,555 | 281 | 895,227 | (4,597 | ) | 890,630 | |||||||||||||||||||||||||||||||||||
|
|
|
|
|
|
|
|
|
|
|
|
|
|
|
|
|
|
|
|
|
| |||||||||||||||||||||||||||
Closing balance as of December 31, 2013 | 2,389,384 | (178 | ) | (589,991 | ) | (34,508 | ) | 21,011 | 2,657,800 | 2,054,312 | 795,303 | 5,238,821 | 87,638 | 5,326,459 | ||||||||||||||||||||||||||||||||||
|
|
|
|
|
|
|
|
|
|
|
|
|
|
|
|
|
|
|
|
|
| |||||||||||||||||||||||||||
The accompanying Notes 1 to 41 form an integral part of these consolidated financial statements.
LATAM AIRLINES GROUP S.AS.A. AND SUBSIDIARIES
CONSOLIDATED STATEMENT OF CHANGES IN EQUITY
| Attributable to owners of the parent | ||||||||||||||||||||||||||||||||||||||||||||||||
| Change in other reserves | ||||||||||||||||||||||||||||||||||||||||||||||||
| Currency | Cash flow | Shares based | Other | Total | Parent’s | Non- | ||||||||||||||||||||||||||||||||||||||||||
| Share | Treasury | translation | hedging | payments | sundry | other sundry | Retained | ownership | controlling | Total | ||||||||||||||||||||||||||||||||||||||
| Note | capital | shares | reserve | reserve | reserve | reserve | reserve | earnings | interest | interest | equity | |||||||||||||||||||||||||||||||||||||
| ThUS$ | ThUS$ | ThUS$ | ThUS$ | ThUS$ | ThUS$ | ThUS$ | ThUS$ | ThUS$ | ThUS$ | ThUS$ | ||||||||||||||||||||||||||||||||||||||
Equity as of January 1, 2012 | 473,907 | — | (13,317 | ) | (140,556 | ) | 7,130 | 1,362 | (145,381 | ) | 1,116,798 | 1,445,324 | 12,048 | 1,457,372 | ||||||||||||||||||||||||||||||||||
Total increase (decrease) in equity | ||||||||||||||||||||||||||||||||||||||||||||||||
Comprehensive income | ||||||||||||||||||||||||||||||||||||||||||||||||
Gain (losses) | 28 | — | — | — | — | — | — | — | (19,076 | ) | (19,076 | ) | 13,434 | (5,642 | ) | |||||||||||||||||||||||||||||||||
Other comprehensive income | — | — | 16,891 | (174 | ) | — | — | 16,717 | — | 16,717 | (5,414 | ) | 11,303 | |||||||||||||||||||||||||||||||||||
|
|
|
|
|
|
|
|
|
|
|
|
|
|
|
|
|
|
|
|
|
| |||||||||||||||||||||||||||
Total comprehensive income | — | — | 16,891 | (174 | ) | — | — | 16,717 | (19,076 | ) | (2,359 | ) | 8,020 | 5,661 | ||||||||||||||||||||||||||||||||||
|
|
|
|
|
|
|
|
|
|
|
|
|
|
|
|
|
|
|
|
|
| |||||||||||||||||||||||||||
Transactions with shareholders | ||||||||||||||||||||||||||||||||||||||||||||||||
Equity issuance | 28-38 | 1,030,621 | — | — | — | — | 2,665,692 | 2,665,692 | — | 3,696,313 | — | 3,696,313 | ||||||||||||||||||||||||||||||||||||
Dividends | 28 | — | — | — | — | — | — | — | (21,749 | ) | (21,749 | ) | — | (21,749 | ) | |||||||||||||||||||||||||||||||||
Increase (decrease) through transactions with treasury shares | 28 | — | (203 | ) | — | — | — | — | — | — | (203 | ) | — | (203 | ) | |||||||||||||||||||||||||||||||||
Increase (decrease) through transfers and other changes, equity | 28-38 | (3,510 | ) | — | — | — | (1,556 | ) | (372 | ) | (1,928 | ) | 163 | (5,275 | ) | 88,566 | 83,291 | |||||||||||||||||||||||||||||||
|
|
|
|
|
|
|
|
|
|
|
|
|
|
|
|
|
|
|
|
|
| |||||||||||||||||||||||||||
Total transactions with shareholders | 1,027,111 | (203 | ) | — | — | (1,556 | ) | 2,665,320 | 2,663,764 | (21,586 | ) | 3,669,086 | 88,566 | 3,757,652 | ||||||||||||||||||||||||||||||||||
|
|
|
|
|
|
|
|
|
|
|
|
|
|
|
|
|
|
|
|
|
| |||||||||||||||||||||||||||
Closing balance as of December 31, 2012 | 1,501,018 | (203 | ) | 3,574 | (140,730 | ) | 5,574 | 2,666,682 | 2,535,100 | 1,076,136 | 5,112,051 | 108,634 | 5,220,685 | |||||||||||||||||||||||||||||||||||
|
|
|
|
|
|
|
|
|
|
|
|
|
|
|
|
|
|
|
|
|
| |||||||||||||||||||||||||||
| Attributable to owners of the parent | ||||||||||||||||||||||||||||||||||||||||||||||||||||
| Change in other reserves | ||||||||||||||||||||||||||||||||||||||||||||||||||||
| Note | Share capital | Treasury shares | Currency translation reserve | Cash flow hedging reserve | Actuarial gains or losses on defined benefit plans reserve | Shares based payments reserve | Other sundry reserve | Total other reserve | Retained earnings | Parent’s ownership interest | Non- controlling interest | Total equity | ||||||||||||||||||||||||||||||||||||||||
| ThUS$ | ThUS$ | ThUS$ | ThUS$ | ThUS$ | ThUS$ | ThUS$ | ThUS$ | ThUS$ | ThUS$ | ThUS$ | ThUS$ | |||||||||||||||||||||||||||||||||||||||||
Equity as of January 1, 2016 | 2,545,705 | (178 | ) | (2,576,041 | ) | (90,510 | ) | (10,717 | ) | 35,647 | 2,634,679 | (6,942 | ) | 317,950 | 2,856,535 | 81,013 | 2,937,548 | |||||||||||||||||||||||||||||||||||
Total increase (decrease ) in equity Comprehensive income Gain (losses ) | 25 | — | — | — | — | — | — | — | — | 69,220 | 69,220 | 41,450 | 110,670 | |||||||||||||||||||||||||||||||||||||||
Other comprehensive income | — | — | 489,486 | 92,016 | (2,183 | ) | — | 579,319 | — | 579,319 | 5,554 | 584,873 | ||||||||||||||||||||||||||||||||||||||||
|
|
|
|
|
|
|
|
|
|
|
|
|
|
|
|
|
|
|
|
|
|
|
| |||||||||||||||||||||||||||||
Total comprehensive income | — | — | 489,486 | 92,016 | (2,183 | ) | — | — | 579,319 | 69,220 | 648,539 | 47,004 | 695,543 | |||||||||||||||||||||||||||||||||||||||
|
|
|
|
|
|
|
|
|
|
|
|
|
|
|
|
|
|
|
|
|
|
|
| |||||||||||||||||||||||||||||
Transactions with shareholders Equity issue | 25-34 | 608,496 | — | — | — | — | — | — | — | — | 608,496 | — | 608,496 | |||||||||||||||||||||||||||||||||||||||
Dividens | 25 | — | — | — | — | — | — | — | — | (20,766 | ) | (20,766 | ) | — | (20,766 | ) | ||||||||||||||||||||||||||||||||||||
Increase (decrease ) through transfers and other changes , equity | 25-34 | (4,637 | ) | — | — | — | — | 2,891 | 5,602 | 8,493 | — | 3,856 | (39,373 | ) | (35,517 | ) | ||||||||||||||||||||||||||||||||||||
|
|
|
|
|
|
|
|
|
|
|
|
|
|
|
|
|
|
|
|
|
|
|
| |||||||||||||||||||||||||||||
Total transactions with shareholders | 603,859 | — | — | — | — | 2,891 | 5,602 | 8,493 | (20,766 | ) | 591,586 | (39,373 | ) | 552,213 | ||||||||||||||||||||||||||||||||||||||
|
|
|
|
|
|
|
|
|
|
|
|
|
|
|
|
|
|
|
|
|
|
|
| |||||||||||||||||||||||||||||
Closing balance as of December 31, 2016 | 3,149,564 | (178 | ) | (2,086,555 | ) | 1,506 | (12,900 | ) | 38,538 | 2,640,281 | 580,870 | 366,404 | 4,096,660 | 88,644 | 4,185,304 | |||||||||||||||||||||||||||||||||||||
|
|
|
|
|
|
|
|
|
|
|
|
|
|
|
|
|
|
|
|
|
|
|
| |||||||||||||||||||||||||||||
The accompanying Notes 1 to 4138 form an integral part of these consolidated financial statements.
LATAM AIRLINES GROUP S.AS.A. AND SUBSIDIARIES
CONSOLIDATED STATEMENT OF CHANGES IN EQUITY
| Attributable to owners of the parent | ||||||||||||||||||||||||||||||||||||||||||||||||
| Change in other reserves | ||||||||||||||||||||||||||||||||||||||||||||||||
| Currency | Cash flow | Shares based | Other | Total | Parent’s | Non- | ||||||||||||||||||||||||||||||||||||||||||
| Share | Treasury | translation | hedging | payments | sundry | other sundry | Retained | ownership | controlling | Total | ||||||||||||||||||||||||||||||||||||||
| Note | capital | shares | reserve | reserve | reserve | reserve | reserve | earnings | interest | interest | equity | |||||||||||||||||||||||||||||||||||||
| ThUS$ | ThUS$ | ThUS$ | ThUS$ | ThUS$ | ThUS$ | ThUS$ | ThUS$ | ThUS$ | ThUS$ | ThUS$ | ||||||||||||||||||||||||||||||||||||||
Equity as of January 1, 2011 | 453,444 | — | (4,257 | ) | (107,050 | ) | 5,401 | 62 | (105,844 | ) | 949,214 | 1,296,814 | 3,246 | 1,300,060 | ||||||||||||||||||||||||||||||||||
Total increase (decrease) in equity | ||||||||||||||||||||||||||||||||||||||||||||||||
Comprehensive income | ||||||||||||||||||||||||||||||||||||||||||||||||
Gain (losses) | 28 | — | — | — | — | — | — | — | 320,197 | 320,197 | 374 | 320,571 | ||||||||||||||||||||||||||||||||||||
Other comprehensive income | — | — | (9,060 | ) | (33,506 | ) | — | — | (42,566 | ) | — | (42,566 | ) | 42 | (42,524 | ) | ||||||||||||||||||||||||||||||||
|
|
|
|
|
|
|
|
|
|
|
|
|
|
|
|
|
|
|
|
|
|
|
| |||||||||||||||||||||||||
Total comprehensive income | — | — | (9,060 | ) | (33,506 | ) | — | — | (42,566 | ) | 320,197 | 277,631 | 416 | 278,047 | ||||||||||||||||||||||||||||||||||
|
|
|
|
|
|
|
|
|
|
|
|
|
|
|
|
|
|
|
|
|
|
|
| |||||||||||||||||||||||||
Transactions with shareholders | ||||||||||||||||||||||||||||||||||||||||||||||||
Equity issuance | 28-38 | 23,135 | — | — | — | — | — | — | — | 23,135 | — | 23,135 | ||||||||||||||||||||||||||||||||||||
Dividends | 28 | — | — | — | — | — | — | — | (151,981 | ) | (151,981 | ) | — | (151,981 | ) | |||||||||||||||||||||||||||||||||
Increase (decrease) through transactions with treasury shares | 28 | — | — | — | — | — | — | — | — | — | — | — | ||||||||||||||||||||||||||||||||||||
Increase (decrease) through transfers and other changes, equity | 28-38 | (2,672 | ) | — | — | — | 1,729 | 1,300 | 3,029 | (632 | ) | (275 | ) | 8,386 | 8,111 | |||||||||||||||||||||||||||||||||
|
|
|
|
|
|
|
|
|
|
|
|
|
|
|
|
|
|
|
|
|
|
|
| |||||||||||||||||||||||||
Total transactions with shareholders | 20,463 | — | — | — | 1,729 | 1,300 | 3,029 | (152,613 | ) | (129,121 | ) | 8,386 | (120,735 | ) | ||||||||||||||||||||||||||||||||||
|
|
|
|
|
|
|
|
|
|
|
|
|
|
|
|
|
|
|
|
|
|
|
| |||||||||||||||||||||||||
Closing balance as of December 31, 2011 | 473,907 | — | (13,317 | ) | (140,556 | ) | 7,130 | 1,362 | (145,381 | ) | 1,116,798 | 1,445,324 | 12,048 | 1,457,372 | ||||||||||||||||||||||||||||||||||
|
|
|
|
|
|
|
|
|
|
|
|
|
|
|
|
|
|
|
|
|
|
|
| |||||||||||||||||||||||||
| Attributable to owners of the parent | ||||||||||||||||||||||||||||||||||||||||||||||||||||
| Change in other reserves | ||||||||||||||||||||||||||||||||||||||||||||||||||||
| Note | Share capital | Treasury shares | Currency translation reserve | Cash flow hedging reserve | Actuarial gains or losses on defined benefit plans reserve | Shares based payments reserve | Other sundry reserve | Total other reserve | Retained earnings | Parent’s ownership interest | Non- controlling interest | Total equity | ||||||||||||||||||||||||||||||||||||||||
| ThUS$ | ThUS$ | ThUS$ | ThUS$ | ThUS$ | ThUS$ | ThUS$ | ThUS$ | ThUS$ | ThUS$ | ThUS$ | ThUS$ | |||||||||||||||||||||||||||||||||||||||||
Equity as of January 1, 2015 | 2.545.705 | (178 | ) | (1.193.871 | ) | (151.340 | ) | — | 29.642 | 2.635.748 | 1.320.179 | 536.190 | 4.401.896 | 101.799 | 4.503.695 | |||||||||||||||||||||||||||||||||||||
Total increase (decrease) in equity Comprehensive income Gain (losses) | 25 | — | — | — | — | — | — | — | — | (219.274 | ) | (219.274 | ) | 40.542 | (178.732 | ) | ||||||||||||||||||||||||||||||||||||
Other comprehensive income | — | — | (1.382.170 | ) | 60.830 | (10.717 | ) | — | (1.332.057 | ) | — | (1.332.057 | ) | (28.818 | ) | (1.360.875 | ) | |||||||||||||||||||||||||||||||||||
|
|
|
|
|
|
|
|
|
|
|
|
|
|
|
|
|
|
|
|
|
|
|
| |||||||||||||||||||||||||||||
Total comprehensive income | — | — | (1.382.170 | ) | 60.830 | (10.717 | ) | — | — | (1.332.057 | ) | (219.274 | ) | (1.551.331 | ) | 11.724 | (1.539.607 | ) | ||||||||||||||||||||||||||||||||||
|
|
|
|
|
|
|
|
|
|
|
|
|
|
|
|
|
|
|
|
|
|
|
| |||||||||||||||||||||||||||||
Transactions with shareholders | ||||||||||||||||||||||||||||||||||||||||||||||||||||
Increase (decrease) through transfers and other changes , equity | 25-34 | — | — | — | — | — | 6.005 | (1.069 | ) | 4.936 | 1.034 | 5.970 | (32.510 | ) | (26.540 | ) | ||||||||||||||||||||||||||||||||||||
|
|
|
|
|
|
|
|
|
|
|
|
|
|
|
|
|
|
|
|
|
|
|
| |||||||||||||||||||||||||||||
Total transactions with shareholders | — | — | — | — | — | 6.005 | (1.069 | ) | 4.936 | 1.034 | 5.970 | (32.510 | ) | (26.540 | ) | |||||||||||||||||||||||||||||||||||||
|
|
|
|
|
|
|
|
|
|
|
|
|
|
|
|
|
|
|
|
|
|
|
| |||||||||||||||||||||||||||||
Closing balance as of December 31, 2015 | 2.545.705 | (178 | ) | (2.576.041 | ) | (90.510 | ) | (10.717 | ) | 35.647 | 2.634.679 | (6.942 | ) | 317.950 | 2.856.535 | 81.013 | 2.937.548 | |||||||||||||||||||||||||||||||||||
|
|
|
|
|
|
|
|
|
|
|
|
|
|
|
|
|
|
|
|
|
|
|
| |||||||||||||||||||||||||||||
The accompanying Notes 1 to 4138 form an integral part of these consolidated financial statements.
LATAM AIRLINES GROUP S.AS.A. AND SUBSIDIARIES
CONSOLIDATED STATEMENT OF CHANGES IN EQUITY
| Attributable to owners of the parent | ||||||||||||||||||||||||||||||||||||||||||||||||
| Change in other reserves | ||||||||||||||||||||||||||||||||||||||||||||||||
| Note | Share capital | Treasury shares | Currency translation reserve | Cash flow hedging reserve | Shares based payments reserve | Other sundry reserve | Total other reserve | Retained earnings | Parent’s ownership interest | Non- controlling interest | Total equity | |||||||||||||||||||||||||||||||||||||
| ThUS$ | ThUS$ | ThUS$ | ThUS$ | ThUS$ | ThUS$ | ThUS$ | ThUS$ | ThUS$ | ThUS$ | ThUS$ | ||||||||||||||||||||||||||||||||||||||
Equity as of January 1, 2014 | 2,389,384 | (178 | ) | (589,991 | ) | (34,508 | ) | 21,011 | 2,657,800 | 2,054,312 | 795,303 | 5,238,821 | 87,638 | 5,326,459 | ||||||||||||||||||||||||||||||||||
Total increase (decrease) in equity Comprehensive income Gain (losses) | 25 | — | — | — | — | — | — | — | (259,985 | ) | (259,985 | ) | 32,814 | (227,171 | ) | |||||||||||||||||||||||||||||||||
Other comprehensive income | — | — | (603,880 | ) | (116,832 | ) | — | — | (720,712 | ) | — | (720,712 | ) | (45,741 | ) | (766,453 | ) | |||||||||||||||||||||||||||||||
|
|
|
|
|
|
|
|
|
|
|
|
|
|
|
|
|
|
|
|
|
| |||||||||||||||||||||||||||
Total comprehensive income | — | — | (603,880 | ) | (116,832 | ) | — | — | (720,712 | ) | (259,985 | ) | (980,697 | ) | (12,927 | ) | (993,624 | ) | ||||||||||||||||||||||||||||||
|
|
|
|
|
|
|
|
|
|
|
|
|
|
|
|
|
|
|
|
|
| |||||||||||||||||||||||||||
Transactions with shareholders Equity issuance | 25-34 | 156,321 | — | — | — | — | — | — | — | 156,321 | — | 156,321 | ||||||||||||||||||||||||||||||||||||
Increase (decrease) through transfers and other changes, equity | 25-34 | — | — | — | — | 8,631 | (22,052 | ) | (13,421 | ) | 872 | (12,549 | ) | 27,088 | 14,539 | |||||||||||||||||||||||||||||||||
|
|
|
|
|
|
|
|
|
|
|
|
|
|
|
|
|
|
|
|
|
| |||||||||||||||||||||||||||
Total transactions with shareholders | 156,321 | — | — | — | 8,631 | (22,052 | ) | (13,421 | ) | 872 | 143,772 | 27,088 | 170,860 | |||||||||||||||||||||||||||||||||||
|
|
|
|
|
|
|
|
|
|
|
|
|
|
|
|
|
|
|
|
|
| |||||||||||||||||||||||||||
Closing balance as of December 31, 2014 | 2,545,705 | (178 | ) | (1,193,871 | ) | (151,340 | ) | 29,642 | 2,635,748 | 1,320,179 | 536,190 | 4,401,896 | 101,799 | 4,503,695 | ||||||||||||||||||||||||||||||||||
|
|
|
|
|
|
|
|
|
|
|
|
|
|
|
|
|
|
|
|
|
| |||||||||||||||||||||||||||
The accompanying Notes 1 to 38 form an integral part of these consolidated financial statements.
LATAM AIRLINES GROUP S.A. AND SUBSIDIARIES
CONSOLIDATED STATEMENT OF CASH FLOWS DIRECT – METHOD
| For the periods ended | ||||||||||||||||||||||||||||||
| December 31, | For the periods ended December 31, | |||||||||||||||||||||||||||||
| Note | 2013 | 2012 | 2011 | Note | 2016 | 2015 | 2014 | |||||||||||||||||||||||
| ThUS$ | ThUS$ | ThUS$ | ThUS$ | ThUS$ | ThUS$ | |||||||||||||||||||||||||
Cash flows from operating activities | ||||||||||||||||||||||||||||||
Cash collection from operating activities | ||||||||||||||||||||||||||||||
Proceeds from sales of goods and services | 13,406,275 | 10,258,473 | 5,966,464 | 9,918,589 | 11,372,397 | 13,367,838 | ||||||||||||||||||||||||
Other cash receipts from operating activities | 4,638 | 57,763 | 52,012 | 70,359 | 88,237 | 96,931 | ||||||||||||||||||||||||
Payments for operating activities | ||||||||||||||||||||||||||||||
Payments to suppliers for goods and services | (9,570,723 | ) | (7,153,865 | ) | (4,286,394 | ) | (6,756,121 | ) | (7,029,582 | ) | (8,823,007 | ) | ||||||||||||||||||
Payments to and on behalf of employees | (2,405,315 | ) | (1,938,769 | ) | (883,297 | ) | (1,820,279 | ) | (2,165,184 | ) | (2,433,652 | ) | ||||||||||||||||||
Other payments for operating activities | (31,215 | ) | (19,325 | ) | (84,000 | ) | (162,839 | ) | (351,177 | ) | (528,214 | ) | ||||||||||||||||||
Interest received | 11,310 | 52,986 | 9,762 | 11,242 | 43,374 | 11,589 | ||||||||||||||||||||||||
Income taxes refunded (paid) | (83,033 | ) | (3,018 | ) | 626 | (59,556 | ) | (57,963 | ) | (108,389 | ) | |||||||||||||||||||
Other cash inflows (outflows) | 6 | 76,761 | (50,433 | ) | (7,499 | ) | 35 | (209,269 | ) | (184,627 | ) | (251,657 | ) | |||||||||||||||||
|
|
|
|
|
| |||||||||||||||||||||||||
Net cash flows from operating activities | 1,408,698 | 1,203,812 | 767,674 | 992,126 | 1,715,475 | 1,331,439 | ||||||||||||||||||||||||
|
|
|
|
|
| |||||||||||||||||||||||||
Cash flows used in investing activities | ||||||||||||||||||||||||||||||
Cash flows arising from the loss of control of subsidiaries or other entities | — | — | 47,337 | |||||||||||||||||||||||||||
Cash flows used for acquisition of subsidiaries | (5,517 | ) | (3,223 | ) | (3,541 | ) | ||||||||||||||||||||||||
Cash flows used in the purchase of non-controlling interest | (497 | ) | — | — | ||||||||||||||||||||||||||
Cash flows used to obtain control of subsidiaries or other businesses | — | — | 518 | |||||||||||||||||||||||||||
Other cash receipts from sales of equity or debt instruments of other entities | 270,485 | 386,379 | 9,201 | 2,969,731 | 519,460 | 524,370 | ||||||||||||||||||||||||
Other payments to acquire equity or debt instruments of other entities | (440,801 | ) | — | (72 | ) | (2,706,733 | ) | (704,115 | ) | (474,656 | ) | |||||||||||||||||||
Amounts raised from sale of property, plant and equipment | 225,196 | 73,429 | 93,787 | 76,084 | 57,117 | 564,266 | ||||||||||||||||||||||||
Purchases of property, plant and equipment | (1,381,786 | ) | (2,389,364 | ) | (1,367,025 | ) | (694,370 | ) | (1,569,749 | ) | (1,440,445 | ) | ||||||||||||||||||
Amounts raised from sale of intangible assets | — | — | 6,189 | 1 | 91 | — | ||||||||||||||||||||||||
Purchases of intangible assets | (43,484 | ) | (59,166 | ) | (27,615 | ) | (88,587 | ) | (52,449 | ) | (55,759 | ) | ||||||||||||||||||
Payment from other long-term assets | 22,144 | 38,035 | — | |||||||||||||||||||||||||||
Dividends received | — | 351 | 89 | |||||||||||||||||||||||||||
Other cash inflows (outflows) | 6 | 75,448 | 27,143 | 545 | 35 | 843 | 10,576 | (17,399 | ) | |||||||||||||||||||||
|
|
|
|
|
| |||||||||||||||||||||||||
Net cash flow used in investing activities | (1,278,812 | ) | (1,926,416 | ) | (1,241,105 | ) | ||||||||||||||||||||||||
Net cash flow from (used in) investing activities | (443,031 | ) | (1,739,069 | ) | (899,105 | ) | ||||||||||||||||||||||||
|
|
|
|
|
| |||||||||||||||||||||||||
Cash flows from (used in) financing activities | ||||||||||||||||||||||||||||||
Amounts raised from issuance of shares | 888,949 | 83,512 | 23,153 | 608,496 | — | 156,321 | ||||||||||||||||||||||||
Payments to acquire or redeem the shares of the entity | — | (203 | ) | — | — | — | 4,661 | |||||||||||||||||||||||
Amounts raised from long-term loans | 2,043,518 | 2,185,663 | 969,252 | 1,820,016 | 1,791,484 | 1,042,820 | ||||||||||||||||||||||||
Amounts raised from short-term loans | 1,101,159 | 152,000 | 334,500 | 279,593 | 205,000 | 603,151 | ||||||||||||||||||||||||
Loans repayments | (1,952,013 | ) | (539,332 | ) | (883,402 | ) | (2,121,130 | ) | (1,263,793 | ) | (2,315,120 | ) | ||||||||||||||||||
Payments of finance lease liabilities | (423,105 | ) | (292,931 | ) | (59,990 | ) | (314,580 | ) | (342,614 | ) | (394,131 | ) | ||||||||||||||||||
Dividends paid | (29,694 | ) | (124,827 | ) | (192,133 | ) | 35 | (41,223 | ) | (35,032 | ) | (35,362 | ) | |||||||||||||||||
Interest paid | (361,006 | ) | (227,607 | ) | (121,338 | ) | (398,288 | ) | (383,648 | ) | (368,789 | ) | ||||||||||||||||||
Other cash inflows (outflows) | 6 | (62,013 | ) | (231,079 | ) | 146,849 | 35 | (229,163 | ) | (99,757 | ) | (13,777 | ) | |||||||||||||||||
|
|
|
|
|
| |||||||||||||||||||||||||
Net cash flows from (used in) financing activities | 1,205,795 | 1,005,196 | 216,891 | (396,279 | ) | (128,360 | ) | (1,320,226 | ) | |||||||||||||||||||||
|
|
|
|
|
| |||||||||||||||||||||||||
Net increase (decrease) in cash and cash equivalents before effect of exchanges rate change | 1,335,681 | 282,592 | (256,540 | ) | 152,816 | (151,954 | ) | (887,892 | ) | |||||||||||||||||||||
Effects of variation in the exchange rate on cash and cash equivalents | (1,041 | ) | (6,736 | ) | (105 | ) | 43,014 | (83,945 | ) | (107,615 | ) | |||||||||||||||||||
|
|
|
|
|
| |||||||||||||||||||||||||
Net increase (decrease) in cash and cash equivalents | 1,334,640 | 275,856 | (256,645 | ) | 195,830 | (235,899 | ) | (995,507 | ) | |||||||||||||||||||||
CASH AND CASH EQUIVALENTS AT BEGINNING OF PERIOD | 6 | 650,263 | 374,407 | 631,052 | 35 | 753,497 | 989,396 | 1,984,903 | ||||||||||||||||||||||
|
|
|
|
|
| |||||||||||||||||||||||||
CASH AND CASH EQUIVALENTS AT END OF PERIOD | 6 | 1,984,903 | 650,263 | 374,407 | 6 | 949,327 | 753,497 | 989,396 | ||||||||||||||||||||||
|
|
|
|
|
| |||||||||||||||||||||||||
The accompanying Notes 1 to 4138 form an integral part of these interim consolidated financial statements.
LATAM AIRLINES GROUP S.AS.A. AND SUBSIDIARIES
NOTES TO THE CONSOLIDATED FINANCIAL STATEMENTS
AS OF DECEMBER 31, 20132016
LATAM Airlines Group S.A. (the “Company”) is a public company registered with the Chilean Superintendency of Securities and Insurance (SVS), under No.306, whose shares are quoted in Chile on the Stock Brokers—Stock Exchange (Valparaíso), —the Chilean Electronic Stock Exchange and the Santiago Stock Exchange; it is also quoted in the United States of America on the New York Stock Exchange (“NYSE”) in New York in the form of American Depositary Receipts (“ADRs”) and in Brazil BM & FBOVESPA S.A. – Stock Exchange, Mercadorias e Futuros, in the form of Brazilian Depositary Receipts (“BDRs”).
Its principal business is passenger and cargo air transportation, both in the domestic markets of Chile, Peru, Argentina, Colombia, Ecuador and Brazil and in a developed series of regional and international routes in America, Europe and Oceania. These businesses are performed directly or through its subsidiaries in different countries. In addition, the Company has subsidiaries operating in the freight business in Mexico, Brazil and Colombia.
On August 13, 2010, the Company reported to the Superintendency of Securities and Insurance, as an Essential Matter, that at this date the Company Costa Verde Aeronáutica S.A. and Inversiones Mineras del Cantábrico S.A. (the latter two, “Cueto Subsidiaries”), TAM S.A. (“TAM”), and TAM Empreendimentos e Participações (“TEP”) signed a non-binding Memorandum of Understanding (“MOU”) in which the companies agreed to proceed with their intention of carrying out their operations jointly under one parent company, to be named LATAM Airlines Group S.A. (“LATAM”). The proposed affiliation would be within the world’s 10 largest airline groups, providing transport services for passengers and cargo to more than 115 destinations in 23 countries, operating with a fleet of over 300 aircraft, with over 50,000 employees. Both airlines would continue operating independently with their current operating licenses and brands. On October 20, 2010, the Company and TAM announced that the operating subsidiaries of TAM had presented the structure of the transaction to the Brazilian Civil Aviation Agency (“ANAC”), which was approved by this agency on March 1, 2011.
On January 18, 2011 the parties of the MOU and Mrs. Maria Cláudia Oliveira Amaro, Maurício Rolim Amaro, Noemy Almeida Olivera Amaro and Joao Francisco Amaro (“Amaro Family”), as the only shareholders of TEP, signed binding contracts written in English called (a) Implementation Agreement and (b) Exchange Offer Agreement (“Contracts Signed”) containing the final terms and conditions of the proposed partnership between the Company and TAM.
On September 21, 2011, the Court of Defense of Free Competition (“TDLC”) approved the merger between the Company and TAM, establishing 14 mitigation measures. On October 3, 2011, the Company and TAM filed an appeal to the Supreme Court objecting to certain mitigation measures. On April 5, 2012, the Supreme Court confirmed the TDLC resolution rejecting the appeal filed by both companies.
On December 21, 2011, the Board of the Company cited a special meeting of shareholders, carried out on November 11, 2011, in which their shareholders approved, among others, the following matters:
The effectiveness of these agreements was subject to compliance with the conditions established in the extraordinary shareholders’ meeting.
On May 10, 2012, the Company and Holdco II initiated the exchange offer of TAM shares. Having complied with the conditions for declaring the exchange offer successful and having received 95.9% of the total shares of TAM in circulation, on June 22, 2012, the Company and the Absorbed Companies granted the execution deed of Merger, through which the shares of the Absorbed Companies were exchanged for shares of the Company, as effected according to that described above. On that same date the change of the Company’s name to “LATAM Airlines Group S.A.” became effective. The execution deed was rectified by instrument dated July 10, 2012.
On September 4, 2012 the Board of the Company cited a special meeting of shareholders, carried out on August 3, 2012 in which their shareholders approved, among others, the following matters:
The placement of the shares referred to in paragraph (b) above was approved by the Superintendency of Securities and Insurance, on December 11, 2012. On December 20, 2012, the Board of Directors agreed to start, from December 21, 2012, at the period of preferred option of those shares and proceeded to fix the price of placement of them, all of which was reported to the Superintendency of Securities and Insurance by Essential Matter on the same date. At the end of the period of first refusal, that is, as of January 19, 2013, there were 6,857,190 shares remaining subscribed and paid, leaving a balance of 579,626 shares to be subscribed. This balance was auctioned on the Santiago Stock Exchange—Stock Exchange dated January 23, 2013 at a value of CLP$ 11,921 per share.
On June 11, 2013, the Company held an extraordinary shareholders’ meeting, which had been called by the board on April 30, 2013, at this meeting the shareholders adopted the following resolutions:
1) To increase the company’s capital by the sum of ThUS$ 1.000.000 through the issuance of 63,500,000 shares, that is, from the sum of US$ 1,652,896,812.43, represented by 488,347,819 shares, all of one single series and with no par value, to the sum of US$ 2,652,896,812.43, represented by 551,847,819 shares, all of one single series and with no par value.
2) To set aside 1,500,000 new shares from the aforementioned issuance, to be used for a compensation plan for executives at LATAM and its subsidiaries, as provided in Article 24 of the Corporations Law (Note 38 (a.2)).
3) To empower the Board, acting freely and within the broadest faculties, to determine, fix, and agree the price, manner, time, procedure, and conditions for placing the aforementioned shares.
4) To empower the Board to proceed to issue the shares related with the capital increase; to enact all formal procedures necessary for said shares to be inscribed and floated; to act on behalf of the Company against all types of authorities, bodies, or persons related to the securities market; to determine all matters relating to the options that may form part of the compensation plans; to grant whatsoever powers may be necessary or desirable in order to implement all or part of the above; and, in general, to resolve all related matters approved at this Meeting.
5) To amend the articles of the Corporate Statutes that refer to equity in order to adjust them to the aforementioned modifications.
6) To delegate on the Board, for a five year period starting on December 21, 2011, the power to fix the new price of placement of the 4,800,000 shares destined for compensation plans, as provided in Article 24 of the Corporations Law, in conformity with the Extraordinary Shareholders’ Meeting held on December 21, 2011, as modified at the Extraordinary Shareholders’ Meeting held on September 4, 2012, and to amend and resolve the terms and conditions applicable thereto.
7) To empower the Board to adopt such further agreements as may be necessary in order to carry out the aforementioned matters.
On June 20, 2013, was presented to the Superintendency of Securities and Insurance a request for the inscription of 63,500,000 mentioned above. On July 22, 2013 the Superintendency of Securities and Insurance remitted the Company providing comments for said presentation by Deed No. 16141. The Company replied to these submissions on October 16, 2013. Finally, on November 11, 2013, the Superintendency of Securities and Insurance issued the certificate that approved the inscription of that issuance under the number 987. On November 20, 2013, began the preferential subscription period of the 62,000,000 shares not destined for the above compensation plans, settling the price that these shares would be offered to shareholders in US$ 15,17. On December 19, 2013, ended the preferential subscription period, have been subscribed and paid the total of 51,685,128 shares and collected the equivalent of US$ 784 million (Note 40(a)).
The Company is located in Santiago, Chile, at Avenida Américo Vespucio Sur No. 901, commune of Renca.
Corporate Governance practices of the Company are set in accordance with Securities Market Law the Corporations Law and its regulations, and the regulations of the SVS and the laws and regulations of the United States of America and the U.S. Securities and Exchange Commission (“SEC”) of that country, with respect to the issuance of ADRs, andADRs.
On July 18, 2016, LATAM received the Federal Republic of Brazil and theapproval by Comissão de Valores MobiliariosMobiliários (“CVM”) for a discontinuation of that country,Brazilian LATAM depositary receipts-BDRS level III (“BDRs”), supported by common shares of the Company and, consequently, our registration of the foreign issuer. On May 24, 2016, the Company reported as it pertainsan Essential Fact the maturity date May 23, 2016 deadline for holders of BDRs to express their option to keep the shares and the blockade by BM&FBOVESPA with the same date of the respective balances of shares of the holders of BDRs who chose to adhere to the issuanceprocedure for sale of BDRs.shares through the procedure called Sale Facility and assigned for this purpose a theoretical value of sales in the Santiago Stock Exchange. On June 9, 2016, the Company reported that BTG Pactual Chile S.A. Stockbrokers (“BTG Pactual Chile”), a chilean institution contracted by the Company, made the sale on the Santiago Stock Exchange of the shares of the respective holders who adhered to Sale Facility procedure.
As of December 31, 2015, the Company’s subscribed and paid capital was represented by 545,558,101 commons shares, without par value. On August 18, 2016, the Company held an extraordinary shareholders’ meeting in which it was approved to increase the capital by issuing 61,316,424 shares of payment, all of them commons shares, without par value. As of December 31, 2016, 60,849,592 shares, equivalent to this increase, had been placed, so at that date the number of shares subscribed and paid by the Company amounted to 606,407,693 shares.
At December 31, 2016, the Company’s capital stock is represented by 608,374,525 shares, all common shares, without par value, which is divided into: (a) the 606,407,693 subscribed and paid shares mentioned above; And (b) 1,966,832 shares pending of subscription and payment, of which: (i) 1,500,000 shares are allocated to compensation stock option plan; And (ii) 466,832 correspond to the balance of shares pending of placement of the last capital increase.
It should be noted that the Company’s capital stock was expressed in 613,164,243 shares, all ordinary shares, without nominal value. However, on December 21, 2016, the deadline for the subscription and payment of 4,789,718 shares that were also destined to compensation plans for the workers expired, so the Company’s capital stock was fully reduced to the already mentioned 608.374.525 shares.
The Board of the Company is composed of nine members who are elected every two years by the ordinary shareholders’ meeting. The Board meets in regular monthly sessions and in extraordinary sessions as the corporate needs demand. Of the nine board members, three form part of its Directors’ Committee which fulfills both the role foreseen in the Corporations Law and the functions of the Audit Committee required by the Sarbanes Oxley Law of the United States of America and the respective regulations of the SEC.
The majority shareholder of the Company is the Cueto Group, which through Costa Verde Aeronáutica S.A., Costa Verde Aeronáutica SpA, Costa Verde Aeronáutica Tres SpA, Inversiones Nueva Costa Verde Aeronáutica Limitada, Costa Verde Aeronáutica SpA, Inversiones Priesca Dos y Cía. Ltda., Inversiones Caravia Dos y Cía. Ltda., Inversiones El Fano Dos y Cía. Ltda., Inversiones La EspadaEspasa Dos S.A., Inversiones, Puerto ClaroInversiones La Espasa Dos Limitada ey Cía. Ltda. and Inversiones Mineras del Cantábrico S.A. owns 25.50%28.27% of the shares issued by the Company, and therefore is the controlling shareholder of the Company in accordance with the provisions of the letter b) of Article 97 and Article 99 of the Securities Market Law, given that there is a decisive influence on its administration.
As of December 31, 2013,2016, the Company had a total of 1,5881,566 registered shareholders. At that date approximately 7.91%4.69 % of the Company’s share capital was in the form of ADRs and approximately 0.73% in the form of BDRs.ADRs.
For the yearperiod ended December 31, 2013,2016, the Company had an average of 52,91948,336 employees, ending this period with a total of 52,99745,916 employees, spread over 9,9088,010 Administrative employees, 6,9254,895 in Maintenance, 17,05415,924 in Operations, 9,3398,970 in Cabin Crew, 4,0913,882 in Controls Crew, and 5,6804,235 in Sales.
The main subsidiaries included in these consolidated financial statements are as follows:
| a) | Participation rate |
| As December 31, 2016 | As December 31, 2015 | As December 31, 2014 | ||||||||||||||||||||||||||||||||||||||||
| Country | Functional | |||||||||||||||||||||||||||||||||||||||||
Tax No. | Company | of origin | Currency | Direct | Indirect | Total | Direct | Indirect | Total | Direct | Indirect | Total | ||||||||||||||||||||||||||||||
| % | % | % | % | % | % | % | % | % | ||||||||||||||||||||||||||||||||||
96.518.860-6 | Latam Travel Chile S.A. and Subsidary (*) | Chile | US$ | 99.9900 | 0.0100 | 100.0000 | 99.9900 | 0.0100 | 100.0000 | 99.9900 | 0.0100 | 100.0000 | ||||||||||||||||||||||||||||||
96.763.900-1 | Inmobiliaria Aeronáutica S.A. | Chile | US$ | 99.0100 | 0.9900 | 100.0000 | 99.0100 | 0.9900 | 100.0000 | 99.0100 | 0.9900 | 100.0000 | ||||||||||||||||||||||||||||||
96.969.680-0 | Lan Pax Group S.A. and Subsidiaries | Chile | US$ | 99.8361 | 0.1639 | 100.0000 | 99.8361 | 0.1639 | 100.0000 | 99.8361 | 0.1639 | 100.0000 | ||||||||||||||||||||||||||||||
Foreign | Lan Perú S.A. | Peru | US$ | 49.0000 | 21.0000 | 70.0000 | 49.0000 | 21.0000 | 70.0000 | 49.0000 | 21.0000 | 70.0000 | ||||||||||||||||||||||||||||||
Foreign | Lan Chile Investments Limited and Subsidiary | Cayman Insland | US$ | 0.0000 | 0.0000 | 0.0000 | 99.9900 | 0.0100 | 100.0000 | 99.9900 | 0.0100 | 100.0000 | ||||||||||||||||||||||||||||||
93.383.000-4 | Lan Cargo S.A. | Chile | US$ | 99.8939 | 0.0041 | 99.8980 | 99.8939 | 0.0041 | 99.8980 | 99.8939 | 0.0041 | 99.8980 | ||||||||||||||||||||||||||||||
Foreign | Connecta Corporation | U.S.A. | US$ | 0.0000 | 100.0000 | 100.0000 | 0.0000 | 100.0000 | 100.0000 | 0.0000 | 100.0000 | 100.0000 | ||||||||||||||||||||||||||||||
Foreign | Prime Airport Services Inc. and Subsidary | U.S.A. | US$ | 0.0000 | 100.0000 | 100.0000 | 0.0000 | 100.0000 | 100.0000 | 0.0000 | 100.0000 | 100.0000 | ||||||||||||||||||||||||||||||
96.951.280-7 | Transporte Aéreo S.A. | Chile | US$ | 0.0000 | 100.0000 | 100.0000 | 0.0000 | 100.0000 | 100.0000 | 0.0000 | 100.0000 | 100.0000 | ||||||||||||||||||||||||||||||
Foreign | Aircraft International Leasing Limited | U.S.A. | US$ | 0.0000 | 0.0000 | 0.0000 | 0.0000 | 100.0000 | 100.0000 | 0.0000 | 100.0000 | 100.0000 | ||||||||||||||||||||||||||||||
96.631.520-2 | Fast Air Almacenes de Carga S.A. | Chile | CLP | 0.0000 | 100.0000 | 100.0000 | 0.0000 | 100.0000 | 100.0000 | 0.0000 | 100.0000 | 100.0000 | ||||||||||||||||||||||||||||||
96.631.410-9 | Ladeco Cargo S.A. | Chile | CLP | 0.0000 | 0.0000 | 0.0000 | 0.0000 | 100.0000 | 100.0000 | 0.0000 | 100.0000 | 100.0000 | ||||||||||||||||||||||||||||||
Foreign | Laser Cargo S.R.L. | Argentina | ARS | 0.0000 | 100.0000 | 100.0000 | 0.0000 | 100.0000 | 100.0000 | 0.0000 | 100.0000 | 100.0000 | ||||||||||||||||||||||||||||||
Foreign | Lan Cargo Overseas Limited and Subsidiaries | Bahamas | US$ | 0.0000 | 100.0000 | 100.0000 | 0.0000 | 100.0000 | 100.0000 | 0.0000 | 100.0000 | 100.0000 | ||||||||||||||||||||||||||||||
96.969.690-8 | Lan Cargo Inversiones S.A. and Subsidary | Chile | US$ | 0.0000 | 100.0000 | 100.0000 | 0.0000 | 100.0000 | 100.0000 | 0.0000 | 100.0000 | 100.0000 | ||||||||||||||||||||||||||||||
96.575.810-0 | Inversiones Lan S.A. and Subsidiaries | Chile | US$ | 99.7100 | 0.2900 | 100.0000 | 99.7100 | 0.2900 | 100.0000 | 99.7100 | 0.0000 | 99.7100 | ||||||||||||||||||||||||||||||
59.068.920-3 | Technical Trainning LATAM S.A. | Chile | CLP | 99.8300 | 0.1700 | 100.0000 | 99.8300 | 0.1700 | 100.0000 | 99.8300 | 0.1700 | 100.0000 | ||||||||||||||||||||||||||||||
Foreign | TAM S.A. and Subsidiaries (**) | Brazil | BRL | 63.0901 | 36.9099 | 100.0000 | 63.0901 | 36.9099 | 100.0000 | 63.0901 | 36.9099 | 100.0000 | ||||||||||||||||||||||||||||||
| (*) | Lantours Division de Servicios Terrestres S.A. changes its name to Latam Travel Chile S.A. |
| (**) | As of December 31, |
Thus, since April 2016, LATAM Airlines Group S.A. owns 901 voting shares of Holdco I S.A., equivalent to 49% of the total shares with voting rights of said company and TEP Chile S.A. owns 938 voting shares of Holdco I S.A., equivalent to 51% of the total voting shares of that company.
| b) | Statement of financial position |
| Participation rate As of December 31, 2013 | Statement of financial position As of December 31, 2013 | Net Income As of December 31, 2013 | Statement of financial position | Net Income | ||||||||||||||||||||||||||||||||||||||||||||||||||||||||||||||||||||||||||||||||
Tax No. | Company | Country of origin | Functional Currency | Direct ownership interest | Indirect ownership interest | Total ownership interest | Assets | Liabilities | Equity | Gain (loss) | ||||||||||||||||||||||||||||||||||||||||||||||||||||||||||||||||||||||||||
| For the periods ended | ||||||||||||||||||||||||||||||||||||||||||||||||||||||||||||||||||||||||||||||||||||
| As of December 31, 2016 | As of December 31, 2015 | As of December 31, 2014 | December 31, | |||||||||||||||||||||||||||||||||||||||||||||||||||||||||||||||||||||||||||||||||
|
|
| 2016 | 2015 | 2014 | |||||||||||||||||||||||||||||||||||||||||||||||||||||||||||||||||||||||||||||||
Tax No . | Company | Assets | Liabilities | Equity | Assets | Liabilities | Equity | Assets | Liabilities | Equity | Gain/(loss) | |||||||||||||||||||||||||||||||||||||||||||||||||||||||||||||||||||||||||
| % | % | % | ThUS$ | ThUS$ | ThUS$ | ThUS$ | ThUS$ | ThUS$ | ThUS$ | ThUS$ | ThUS$ | ThUS$ | ThUS$ | ThUS$ | ThUS$ | ThUS$ | ThUS$ | ThUS$ | ||||||||||||||||||||||||||||||||||||||||||||||||||||||||||||||||||
96.518.860-6 | Lantours Division Servicios | Latam Travel Chile S.A. and Subsidary (*) | 5,468 | 2,727 | 2,741 | 5,613 | 5,522 | 91 | 3,229 | 2,289 | 940 | 2,650 | 2,341 | 2,078 | ||||||||||||||||||||||||||||||||||||||||||||||||||||||||||||||||||||||
| Terrestres S.A. and Subsidiaries | Chile | US$ | 99.9900 | �� | 0.0100 | 100.0000 | 2,722 | 2,210 | 512 | 787 | ||||||||||||||||||||||||||||||||||||||||||||||||||||||||||||||||||||||||||
96.763.900-1 | Inmobiliaria Aeronáutica S.A. | Chile | US$ | 99.0100 | 0.9900 | 100.0000 | 38,553 | 12,124 | 26,429 | 1,231 | Inmobiliaria Aeronáutica S.A. | 36,756 | 8,843 | 27,913 | 39,302 | 14,832 | 24,470 | 39,920 | 16,854 | 23,066 | 3,443 | 1,404 | (717 | ) | ||||||||||||||||||||||||||||||||||||||||||||||||||||||||||||
96.969.680-0 | Lan Pax Group S.A. and Subsidiaries (1) | Chile | US$ | 99.8361 | 0.1639 | 100.0000 | 641,589 | 901,851 | (246,521 | ) | (104,966 | ) | Lan Pax Group S.A. and Subsidiaries (**) | 475,763 | 1,045,761 | (561,472 | ) | 519,663 | 1,049,232 | (521,907 | ) | 640,020 | 1,065,157 | (426,016 | ) | (36,331 | ) | (35,187 | ) | (114,511 | ) | |||||||||||||||||||||||||||||||||||||||||||||||||||||
Foreign | Lan Perú S.A. | Peru | US$ | 49.0000 | 21.0000 | 70.0000 | 263,516 | 252,109 | 11,407 | 3,755 | Lan Perú S.A. | 306,111 | 294,912 | 11,199 | 255,691 | 240,938 | 14,753 | 239,470 | 228,395 | 11,075 | (2,164 | ) | 5,068 | 1,058 | ||||||||||||||||||||||||||||||||||||||||||||||||||||||||||||
Foreign | Lan Chile Investments Limited and Subsidiaries (1) | Cayman Islands | US$ | 99.9900 | 0.0100 | 100.0000 | 4,419 | 5,248 | (829 | ) | (1 | ) | Lan Chile Investments Limited and Subsidiary (**) | — | — | — | 2,015 | 13 | 2,002 | 2,015 | — | 2,015 | 23 | (13 | ) | 2,844 | ||||||||||||||||||||||||||||||||||||||||||||||||||||||||||
93.383.000-4 | Lan Cargo S.A. | Chile | US$ | 99.8939 | 0.0041 | 99.8980 | 772,640 | 413,527 | 359,113 | 3,685 | Lan Cargo S.A. | 480,908 | 239,728 | 241,180 | 483,033 | 217,037 | 265,966 | 575,979 | 234,772 | 341,207 | (24,813 | ) | (74,408 | ) | (17,905 | ) | ||||||||||||||||||||||||||||||||||||||||||||||||||||||||||
Foreign | Connecta Corporation | U.S.A | US$ | 0.0000 | 100.0000 | 100.0000 | 9 | 2,171 | (2,162 | ) | (356 | ) | Connecta Corporation | 31,981 | 23,525 | 8,456 | 37,070 | 38,298 | (1,228 | ) | 27,431 | 28,853 | (1,422 | ) | 9,684 | 194 | 740 | |||||||||||||||||||||||||||||||||||||||||||||||||||||||||
Foreign | Prime Airport Services Inc. and Subsidiary (1) | U.S.A | US$ | 0.0000 | 100.0000 | 100.0000 | 13,528 | 18,412 | (4,884 | ) | (78 | ) | Prime Airport Services Inc . and Subsidary (**) | 7,385 | 11,294 | (3,909 | ) | 6,683 | 11,180 | (4,497 | ) | 18,120 | 22,897 | (4,777 | ) | 588 | 279 | 107 | ||||||||||||||||||||||||||||||||||||||||||||||||||||||||
96.951.280-7 | Transporte Aéreo S.A. | Chile | US$ | 0.0000 | 100.0000 | 100.0000 | 359,693 | 120,399 | 239,294 | (4,129 | ) | Transporte Aéreo S.A. | 340,940 | 124,805 | 216,135 | 331,117 | 122,666 | 208,451 | 367,570 | 147,278 | 220,292 | 8,206 | 5,878 | (19,001 | ) | |||||||||||||||||||||||||||||||||||||||||||||||||||||||||||
96.634.020-7 | Ediciones Ladeco América S.A. | Chile | CLP | 0.0000 | 100.0000 | 100.0000 | — | 560 | (560 | ) | — | |||||||||||||||||||||||||||||||||||||||||||||||||||||||||||||||||||||||||
Foreign | Aircraft International Leasing Limited | U.S.A | US$ | 0.0000 | 100.0000 | 100.0000 | — | 2,805 | (2,805 | ) | (5 | ) | Aircraft International Leasing Limited | — | — | — | — | 4 | (4 | ) | — | — | — | 9 | (4 | ) | 2,805 | |||||||||||||||||||||||||||||||||||||||||||||||||||||||||
96.631.520-2 | Fast Air Almacenes de Carga S.A. | Chile | CLP | 0.0000 | 100.0000 | 100.0000 | 10,675 | 3,684 | 6,991 | 1,802 | Fast Air Almacenes de Carga S.A. | 10,023 | 3,645 | 6,378 | 8,985 | 4,641 | 4,344 | 9,601 | 3,912 | 5,689 | 1,717 | 1,811 | 893 | |||||||||||||||||||||||||||||||||||||||||||||||||||||||||||||
96.631.410-9 | Ladeco Cargo S.A. | Chile | CLP | 0.0000 | 100.0000 | 100.0000 | 381 | 13 | 368 | (2 | ) | |||||||||||||||||||||||||||||||||||||||||||||||||||||||||||||||||||||||||
Foreign | Laser Cargo S.R.L. | Argentina | ARS | 0.0000 | 100.0000 | 100.0000 | 52 | 201 | (149 | ) | (34 | ) | Laser Cargo S.R.L. | 21 | 32 | (11 | ) | 27 | 39 | (12 | ) | 41 | 138 | (97 | ) | (1 | ) | 69 | 12 | |||||||||||||||||||||||||||||||||||||||||||||||||||||||
Foreign | Lan Cargo Overseas Limited and Subsidiaries (1) | Bahamas | US$ | 0.0000 | 100.0000 | 100.0000 | 354,250 | 256,109 | 96,817 | 111,043 | Lan Cargo Overseas Limited and Subsidiaries (**) | 54,092 | 35,178 | 15,737 | 62,406 | 43,759 | 15,563 | 60,634 | 46,686 | 12,218 | 176 | 3,344 | (84,603 | ) | ||||||||||||||||||||||||||||||||||||||||||||||||||||||||||||
96.969.690-8 | Lan Cargo Inversiones S.A. and Subsidiary (1) | Chile | CLP | 0.0000 | 100.0000 | 100.0000 | 39,419 | 48,630 | (9,937 | ) | (1,246 | ) | Lan Cargo Inversiones S.A. and Subsidary (**) | 80,644 | 95,747 | (13,506 | ) | 54,179 | 68,220 | (12,601 | ) | 45,589 | 59,768 | (12,711 | ) | (910 | ) | 113 | (4,276 | ) | ||||||||||||||||||||||||||||||||||||||||||||||||||||||
96.575.810-0 | Inversiones Lan S.A. and Subsidiaries (1) | Chile | CLP | 99.7100 | 0.0000 | 99.7100 | 15,362 | 8,933 | 6,421 | 517 | Inversiones Lan S.A. and Subsidiaries (**) | 10,971 | 6,452 | 4,452 | 16,512 | 14,676 | 1,828 | 16,035 | 14,746 | 1,272 | 2,549 | 2,772 | (4,473 | ) | ||||||||||||||||||||||||||||||||||||||||||||||||||||||||||||
59.068.920-3 | Technical Trainning LATAM S.A. | 1,745 | 284 | 1,461 | 1,527 | 266 | 1,261 | 1,660 | 263 | 1,397 | 73 | (72 | ) | — | ||||||||||||||||||||||||||||||||||||||||||||||||||||||||||||||||||||||
Foreign | TAM S.A. and Subsidiaries (1) (2) | Brazil | BRL | 63.0901 | 36.9099 | 100.0000 | 8,695,458 | 7,983,671 | 617,035 | (458,475 | ) | TAM S.A. and Subsidiaries (**) | 5,287,286 | 4,710,308 | 495,562 | 4,969,553 | 4,199,223 | 423,190 | 6,817,698 | 5,809,529 | 912,634 | 2,107 | (183,581 | ) | 171,655 | |||||||||||||||||||||||||||||||||||||||||||||||||||||||||||
| Lantours Division de Servicios Terrestres S.A. changes its name to Latam Travel Chile S.A. |
| (**) | The Equity reported corresponds to Equity attributable to owners of the parent, does not include Non-controlling interest. |
LATAM Airlines Group S.A. owns 226 voting shares of Holdco I S.A., equivalent to 19.42% of total voting shares of that company.
During 2013 LATAM Airlines Group S.A. made increase of capital in TAM S.A. for a total of ThUS$1,650,000.
| Participation rate As of December 31, 2012 | Statement of financial position As of December 31, 2012 | Net Income As of December 31, 2012 | ||||||||||||||||||||||||||||||||
Tax No. | Company | Country of origin | Functional Currency | Direct ownership interest | Indirect ownership interest | Total ownership interest | Assets | Liabilities | Equity | Gain (loss) | ||||||||||||||||||||||||
| % | % | % | ThUS$ | ThUS$ | ThUS$ | ThUS$ | ||||||||||||||||||||||||||||
96.518.860-6 | Lantours Division Servicios | |||||||||||||||||||||||||||||||||
| Terrestres S.A. And Subsidiaries | Chile | US$ | 99.9900 | 0 .0100 | 100.0000 | 2,678 | 2,153 | 525 | 1,300 | |||||||||||||||||||||||||
96.763 .900-1 | Inmobiliaria Aeronáutica S.A. | Chile | US$ | 99.0100 | 0 .9900 | 100.0000 | 57,227 | 23,029 | 34,198 | 17,719 | ||||||||||||||||||||||||
96.969.680 -0 | Lan Pax Group S.A. and Subsidiaries (1) | Chile | US$ | 99.8361 | 0.1639 | 100.0000 | 522,408 | 637,851 | (112,395 | ) | (77,269 | ) | ||||||||||||||||||||||
Foreign | Lan Perú S.A. | Peru | US$ | 49.0000 | 21.0000 | 70 .0000 | 159,361 | 150,319 | 9,042 | 2,513 | ||||||||||||||||||||||||
Foreign | Lan Chile Investments Limited and Subsidiaries (1) | Cayman Islands | US$ | 99.9900 | 0 .0100 | 100.0000 | 4,419 | 5,247 | (828 | ) | (10 | ) | ||||||||||||||||||||||
93.383.000-4 | Lan Cargo S.A. | Chile | US$ | 99.8939 | 0 .0041 | 99 .8980 | 727,091 | 371,663 | 355,428 | (50,693 | ) | |||||||||||||||||||||||
Foreign | Connecta Corporation | U.S.A | US$ | 0.0000 | 100.0000 | 100.0000 | 234 | 2,041 | (1,807 | ) | 70 | |||||||||||||||||||||||
Foreign | Prime Airport Services Inc. and Subsidiary (1) | U.S.A | US$ | 0.0000 | 100.0000 | 100.0000 | 24,678 | 29,484 | (4,806 | ) | 1,174 | |||||||||||||||||||||||
96.951.280 -7 | Transporte Aéreo S.A. | Chile | US$ | 0.0000 | 100.0000 | 100.0000 | 357,725 | 114,302 | 243,423 | 11,144 | ||||||||||||||||||||||||
96.634.020-7 | Ediciones Ladeco América S.A. | Chile | CLP | 0.0000 | 100.0000 | 100.0000 | — | 612 | (612 | ) | — | |||||||||||||||||||||||
Foreign | Aircraft International Leasing Limited | U.S.A | US$ | 0.0000 | 100.0000 | 100.0000 | — | 2,799 | (2,799 | ) | (5 | ) | ||||||||||||||||||||||
96.631.520 -2 | Fast Air Almacenes de Carga S.A. | Chile | CLP | 0.0000 | 100.0000 | 100.0000 | 9,708 | 1,553 | 8,155 | 2,067 | ||||||||||||||||||||||||
96.631.410 -9 | Ladeco Cargo S.A. | Chile | CLP | 0.0000 | 100.0000 | 100.0000 | 416 | 11 | 405 | 3 | ||||||||||||||||||||||||
Foreign | Laser Cargo S.R.L. | Argentina | ARS | 0.0000 | 100.0000 | 100.0000 | 70 | 228 | (158 | ) | (42 | ) | ||||||||||||||||||||||
Foreign | Lan Cargo Overseas Limited and Subsidiaries (1) | Bahamas | US$ | 0.0000 | 100.0000 | 100.0000 | 364,482 | 397,611 | (37,368 | ) | (6,375 | ) | ||||||||||||||||||||||
96.969.690-8 | Lan Cargo Inversiones S.A. and Subsidiary (1) | Chile | CLP | 0.0000 | 100.0000 | 100.0000 | 57,154 | 64,905 | (8,692 | ) | (4,458 | ) | ||||||||||||||||||||||
96.575.810-0 | Inversiones Lan S.A. and Subsidiaries (1) | Chile | CLP | 99.7100 | 0 .0000 | 99 .7100 | 16,181 | 9,714 | 6,466 | (112 | ) | |||||||||||||||||||||||
Foreign | TAM S.A. y Filiales (1) (2) | Brazil | BRL | 63.0901 | 36.9099 | 100.0000 | 8,821,298 | 9,198,899 | (480,632 | ) | (75,195 | ) | ||||||||||||||||||||||
| As of December 31, 2011 | Statement of financial position As of December 31, 2011 | Results for the period ended December 31, 2011 | ||||||||||||||||||||||||||||||||
Tax No. | Company | Country of origin | Functional Currency | Direct ownership interest | Indirect ownership interest | Total ownership interest | Assets | Liabilities | Equity | Gain (loss) | ||||||||||||||||||||||||
| % | % | % | ThUS$ | ThUS$ | ThUS$ | ThUS$ | ||||||||||||||||||||||||||||
96.518.860-6 | Lantours Division de Servicios | |||||||||||||||||||||||||||||||||
| Terrestres S.A. | Chile | US$ | 99.9900 | 0.0100 | 100.0000 | 2,534 | 1,749 | 785 | 860 | |||||||||||||||||||||||||
96.763.900-1 | Inmobiliaria Aeronáutica S.A. | Chile | US$ | 99.0100 | 0.9900 | 100.0000 | 65,580 | 34,101 | 31,479 | 3,484 | ||||||||||||||||||||||||
96.969.680-0 | Lan Pax Group S.A. and Subsidiaries (1) | Chile | US$ | 99.8361 | 0.1639 | 100.0000 | 464,789 | 502,284 | (41,935 | ) | (28,163 | ) | ||||||||||||||||||||||
Foreign | Lan Perú S.A. | Peru | US$ | 49.0000 | 21.0000 | 70.0000 | 139,888 | 128,979 | 10,909 | 920 | ||||||||||||||||||||||||
Foreign | Lan Chile Investments Limited and Subsidiaries (1) | Cayman Islands | US$ | 99.9900 | 0.0100 | 100.0000 | 4,420 | 5,238 | (818 | ) | 1,820 | |||||||||||||||||||||||
93.383.000-4 | Lan Cargo S.A. | Chile | US$ | 99.8939 | 0.0041 | 99.8980 | 765,829 | 343,799 | 422,030 | 57,140 | ||||||||||||||||||||||||
Foreign | Connecta Corporation | U.S.A | US$ | 0.0000 | 100.0000 | 100.0000 | 346 | 2,223 | (1,877 | ) | (109 | ) | ||||||||||||||||||||||
Foreign | Prime Airport Services Inc. and Subsidiary (1) | U.S.A | US$ | 0.0000 | 100.0000 | 100.0000 | 9,965 | 15,945 | (5,980 | ) | (735 | ) | ||||||||||||||||||||||
96.951.280-7 | Transporte Aéreo S.A. | Chile | US$ | 0.0000 | 100.0000 | 100.0000 | 348,943 | 116,663 | 232,280 | 26,146 | ||||||||||||||||||||||||
96.634.020-7 | Ediciones Ladeco América S.A. | Chile | CLP | 0.0000 | 100.0000 | 100.0000 | — | 566 | (566 | ) | — | |||||||||||||||||||||||
Foreign | Aircraft International Leasing Limited | U.S.A | US$ | 0.0000 | 100.0000 | 100.0000 | — | 2,794 | (2,794 | ) | (8 | ) | ||||||||||||||||||||||
96.631.520-2 | Fast Air Almacenes de Carga S.A. | Chile | CLP | 0.0000 | 100.0000 | 100.0000 | 24,692 | 11,372 | 13,320 | 1,998 | ||||||||||||||||||||||||
96.631.410-9 | Ladeco Cargo S.A. | Chile | CLP | 0.0000 | 100.0000 | 100.0000 | 380 | 8 | 372 | 1 | ||||||||||||||||||||||||
Foreign | Laser Cargo S.R.L. | Argentina | ARS | 0.0000 | 100.0000 | 100.0000 | 82 | 216 | (134 | ) | (18 | ) | ||||||||||||||||||||||
Foreign | Lan Cargo Overseas Limited and Subsidiaries (1) | Bahamas | US$ | 0.0000 | 100.0000 | 100.0000 | 162,002 | 189,614 | (30,990 | ) | 9,037 | |||||||||||||||||||||||
96.969.690-8 | Lan Cargo Inversiones S.A. and Subsidiary (1) | Chile | CLP | 0.0000 | 100.0000 | 100.0000 | 67,194 | 69,671 | (2,477 | ) | 3,070 | |||||||||||||||||||||||
96.575.810-0 | Inversiones Lan S.A. and Subsidiaries (1) | Chile | CLP | 99.7100 | 0.0000 | 99.7100 | 14,299 | 7,821 | 6,478 | (347 | ) | |||||||||||||||||||||||
Additionally, haswe have proceeded to consolidate the following special purpose entities, denominated:entities: 1. JOL destined(Japanese Operating Lease) created in order to finance the aircraft financing andpurchase of certain aircraft; 2. Chercán Leasing Limited destinedcreated to finance the aircraft advance financing, as the Company has major risks and benefits associatedpre-delivery payments on aircraft; 3. Guanay Finance Limited created to them according to standards issued by the Standing Interpretations Committee of the International Accounting Information: Consolidation—Special Purpose Entities (“SIC 12”) and privateissue a bond collateralized with future credit card receivables; 4. Private investment funds in whichand 5. Avoceta Leasing Limited created to finance the parent company and subsidiaries are contributors.pre-delivery payments on aircraft. These companies have been consolidated as required by IFRS 10.
All the entities controlled have been included in the consolidation.
Changes in the scope of consolidation between January 1, 20122015 and December 31, 2013,2016, are detailed below:
| (1) | Incorporation or acquisition of companies |
| (2) | Dissolution of companies |
NOTE 2 - SUMMARY OF SIGNIFICANT ACCOUNTING POLICIES
The following describes the principal accounting policies adopted in the preparation of these consolidated financial statements.
| 2.1. | Basis of Preparation |
The consolidated financial statements of LATAM Airlines Group S.A. are for the period ended December 31, 2013, and2016, have been prepared in accordance with International Financial Reporting Standards (IFRS) issued by the International Accounting Standards Board (IASB)(“IASB”) incorporated therein and IFRIC interpretations.with the interpretations issued by the International Financial Reporting Standards Interpretations Committee (IFRIC).
Law No. 20,780 issued on September 29, 2014, introduced modifications to the income tax system in Chile and other tax matters. On October 17, 2014 the Chilean Superintendence of Securities and Insurance (the “SVS”) issued Circular No. 856, which established that the effects of the change in the income tax rates on deferred tax assets and liabilities must be recognized directly within “Retained earnings” instead of the income statement as required by IAS 12. In order to comply with IAS 12, the financial statements for the period ended December 31, 2014 are different from those presented to the SVS as the modifications introduced by Law No. 20,780 and Circular No. 856 have been recognized within the income statement. A reconciliation of such differences in presented as follows:
As of December 31, 2014
| Consolidated Financial Statements for SEC | Consolidated Financial Statements for SVS | Difference | ||||||||||
| ThUS$ | ThUS$ | ThUS$ | ||||||||||
Total Equity | ||||||||||||
Parent’s ownership | ||||||||||||
Retained earnings | ||||||||||||
Net Income (Loss) for the period | (259,985 | ) | (109,790 | ) | (150,195 | ) | ||||||
Retained earnings for the last period | 796,175 | 645,980 | 150,195 | |||||||||
|
|
|
|
|
| |||||||
Total Retained earnings | 536,190 | 536,190 | — | |||||||||
|
|
|
|
|
| |||||||
Non-controlling | ||||||||||||
Retained earnings | ||||||||||||
Net Income (Loss) for the period | 32,814 | 32,829 | (15 | ) | ||||||||
Retained earnings for the last period | 17,099 | 17,084 | 15 | |||||||||
|
|
|
|
|
| |||||||
Total Retained earnings | 49,913 | 49,913 | — | |||||||||
|
|
|
|
|
| |||||||
As from the year 2016, the differences between the financial statements presented to the Chilean regulator and those prepared to comply with IAS 12 no longer exist so no adjustment is necessary.
The consolidated financial statements have been prepared under the historic-cost criterion, although modified by the valuation at fair value of certain financial instruments.
The preparation of the consolidated financial statements in accordance with IFRS requires the use of certain critical accounting estimates. It also requires management to use its judgment in applying the Company’s accounting policies. Note 4 shows the areas that imply a greater degree of judgment or complexity or the areas where the assumptions and estimates are significant to the consolidated financial statements.
During 2016 the Company recorded out of period adjustments resulting in an aggregate net decrease of US$ 18.2 million to “Net income (loss) for the period” for the year ended December 31, 2016. These adjustments include US$ 39.5 million (loss) resulting from an account reconciliation process initiated after the Company’s afiliate TAM S.A. and its subsidiaries completed the implementation of the SAP system. A further US$ 11.0 million (loss) reflect adjustments related to foreign exchange differences, also relating to the Company’s subsidiaries in Brazil. The comparativebalance of US$ 32.3 million (gain) includes principally the adjustment of unclaimed fees for expired tickets for the Company and its affiliates outside Brazil. Management of TAM S.A. has concluded that the out of period adjustments that have been identified are material to the 2015 financial statements of TAM S.A., which should therefore require a restatement in Brazil. However, Management of LATAM has evaluated the impact of all out of period adjustments, both individually and in the aggregate, and concluded that due to their relative size and to qualitative factors they are not material to the annual consolidated financial statements have been revised as a resultfor 2016 of modifications madeLatam Airlines Group S.A. or to the fair values calculated in the business combination with TAM S.A. and Subsidiaries, during the measurement period in accordance with IFRS 3, and correction of non- significant errors originated before the date of acquisition within TAM S.A. (Note 18.2.(c)). Additionally, in order to facilitate comparison, there have been some minor reclassifications to theany previously reported consolidated financial statements, corresponding to the previous year.therefore no restatement or revision is necessary.
| (a) | Accounting pronouncements with implementation effective from January 1, |
(i) Standards and amendments | Date of issue | Mandatory
| ||
| ||||
| ||||
| ||
| ||
| ||
| ||
| ||
| ||
| ||
| ||
| ||
The application of standards, amendments and interpretations had no material impact on the annual consolidated financial statements of the Company.
(b) Accounting pronouncements effective implementation starting on January 1, 2014 and following:
| ||
| ||
| ||
| ||
|
| |
| ||
| ||
| ||
Annual periods beginning on or after | ||||
| May 2014 | 01/ | ||
| May 2014 | 01/01/2016 | |||
| August 2014 | 01/01/2016 | ||
| December 2014 | 01/01/2016 | ||
| Amendment to IFRS 10: Consolidated financial statements, IFRS 12: Disclosure of interests in other entities and IAS 28: Investments in associates and joint ventures. | December 2014 | 01/01/2016 | ||
(ii) Standards and amendments | Date of issue | Mandatory Application: Annual periods beginning on or after | ||
(iii) Improvements
| ||||
| Improvements to International Financial Reporting Standards (2012-2014 cycle ): IFRS 5 Non-current assets held for sale and discontinued operations; IFRS 7 Financial instruments: Disclosures; IAS | September 2014 | 01/01/2016 | ||
The application of standards, amendments, interpretations and improvements had no material impact on the consolidated financial statements of the Company.
| (b) | Accounting pronouncements not yet in force for financial years beginning on January 1, 2016 and which has not been effected early adoption |
(i) Standards and amendments | Date of issue | Mandatory Application: Annual periods beginning on or after | ||
| January 2016 | 01/ | ||
| Amendment to IAS 12: Income Taxes. | January 2016 | 01/01/2017 | ||
| IFRS | December 2009 | 01/01/2018 | ||
| Amendment to IFRS 9: Financial instruments. | November 2013 | 01/01/2018 | ||
| IFRS | May 2014 | 01/01/2018 | ||
Amendment to IFRS
| April 2016 | 01/01/2018 | ||
| June 2016 | 01/01/2018 | |||
| Amendment to IFRS 4: Insurance contracts. | September 2016 | 01/01/2018 | ||
| Amendment to IAS 40: Investment property | December 2016 | 01/01/2018 | ||
| IFRS 16: Leases (2). | January 2016 | 01/01/2019 | ||
(i) Standards and amendments | Date of issue | Mandatory
Annual periods beginning on or after | ||
| Amendment to IFRS 10: Consolidated financial statements and IAS 28 Investments in associates and joint ventures. | September 2014 | To be determined | ||
(ii) Improvements | ||||
| Improvements to International Financial Reporting Standards. (cycle 2012-2014) IFRS 1: First-time adoption of international financial reporting standards; IFRS 12 Disclosure of interests in other entities and IAS 28 investments in associates and joint ventures. | December 2016 | 01/01/2017 (improvements IFRS 12) 01/01/2018 (improvements IFRS 1 and IAS 28) | ||
(iii) Interpretations | ||||
| IFRIC
| December 2016 | 01/01/ | ||
The Company’s management believes that the adoption of the standards, amendments and interpretations described above but not yet effective would not have had a significant impact on the Company’s consolidated financial statements in the year of their first application. The Company has not early adopted anyapplication, except for IFRS 15 and IFRS 16:
| (1) | IFRS 15 Revenue from Contracts with Customers supersedes actual standard for revenue recognition that actually uses the Company, as IAS 18 Revenue and IFRIC 13 Customer Loyalty Programmes. The core principle of IFRS 15 is that an entity recognizes revenue to depict the transfer of promised goods or services to customers in an amount that reflects the consideration to which the entity expects to be entitled in exchange for those goods or services. This standards supersedes IFRS 15 supersedes, IAS 11 Construction Contracts, IAS 18 Revenue, IFRIC 13 Customer Loyalty Programmes, IFRIC 15 Agreements for the Construction of Real Estate, IFRIC 18 Transfers of Assets from Customers; and SIC-31 Revenue—Barter Transactions Involving Advertising Services. |
We are currently evaluating how the adoption of the above standards.revenue recognition standard will impact our Consolidated Financial Statements. Interpretations are on-going and could have a significant impact on our implementation. We currently believe the adoption will not have a significant impact on passenger and cargo revenue recognition. However, the impact in revenue and liability for frequent flyer program are still being analyzed.
| (2) | The IFRS 16 Leases add important changes in the accounting for lessees by introducing a similar treatment to financial leases for all operating leases with a term of more than 12 months. This mean, in general terms, that an asset should be recognized for the right to use the underlying leased assets and a liability representing its present value of payments associate to the agreement. Monthly leases payments will be replace by the asset depreciation and a financial cost in the income statement. |
We are currently evaluating how the adoption of the leases recognition standard will impact our Consolidated Financial Statements. Interpretations are on-going and could have a material impact on our implementation. Currently, we expect that the adoption of the new lease standard will have a material impact on our consolidated balance sheet due to the recognition of right-of-use assets and lease liabilities principally for certain leases currently accounted for as operating leases.
LATAM Airlines Group S.A. and subsidiaries are still assessing these standard to determinate the effect on their Financial Statements, covenants and other financial indicators.
| 2.2. | Basis of Consolidation |
(a) Subsidiaries
| (a) | Subsidiaries |
Subsidiaries are all the entities (including special-purpose entities) over which the Company has the power to control the financial and operating policies, which are generally accompanied by a holding of more than half of the voting rights. In evaluating whether the Company controls another entity, the existence and effect of potential voting rights that are currently exercisable or convertible at the date of the consolidated financial statements are considered. The subsidiaries are consolidated from the date on which control is passed to the Company and they are excluded from the consolidation on the date they cease to be so controlled. The results and flows are incorporated from the date of acquisition.
To account for and identify the financial information to be revealed when carrying out a business combination, such as the acquisition of an entity by the Company, shall apply the acquisition method provided for in IFRS 3 (or IFRS 3 for its acronym in Spanish—http://www.normasinternacionalesdecontabilidad.es/nic/pdf/niif3.pdf). According to IFRS 3, the cost of acquisition is the fair value of the assets acquired, the equity instruments issued and the liabilities incurred or assumed on the date of the business combination. The identifiable assets acquired and the liabilities and contingent liabilities assumed in a business combination are initially valued at their fair value on the date of acquisition, regardless of the extent of the non-controlling interests. The excess of the acquisition cost over the fair value of the Company’s holding in the net identifiable assets acquired is shown as Goodwill. If the cost is less than the fair value of the net assets of the acquired subsidiary, the difference is recorded directly in the consolidated statement of income (Note 2.6). The transaction costs in a business combination are recognized in the consolidated income statement when they are incurred. Additionally, IFRS 3 allows adjustments to the initial accounting for a business combination within the period of twelve months from the acquisition date. In connection with the business combination process with TAM SA and Subsidiaries, this period of 12 months from the day June 22, 2012.
Inter-companyBalances, transactions balances and unrealized gains on transactions between the Company’s entities are eliminated. Unrealized losses are also eliminated unless the transaction provides evidence of an impairment loss of the asset transferred. When necessary in order to ensure uniformity with the policies adopted by the Company, the accounting policies of the subsidiaries are modified.
(b) Transactions with non-controlling interestsTo account for and identify the financial information to be revealed when carrying out a business combination, such as the acquisition of an entity by the Company, shall apply the acquisition method provided for in IFRS 3: Business combination.
| (b) | Transactions with non-controlling interests |
The Company applies the policy of considering transactions with non-controlling interests, when not related to loss of control, as equity transactions without an effect on income.
(c) Sales of subsidiaries
| (c) | Sales of subsidiaries |
When a subsidiary is sold and a percentage of participation is not retained, the Company derecognizes assets and liabilities of the subsidiary, the non-controlling and other components of equity related to the subsidiary. Any gain or loss resulting from the loss of control is recognized in the consolidated income statement in Other gains (losses).
If LATAM Airlines Group S.A. and Subsidiaries retain an ownership of participation in the sold subsidiary, and does not represent control, this is recognized at fair value on the date that control is lost, the amounts previously recognized in Other comprehensive income are accounted as if the Company had disposed directly from the assets and related liabilities, which can cause these amounts are reclassified to profit or loss. The percentage retained valued at fair value areis subsequently accounted using the equity method.
(d) Investees or associates
| (d) | Investees or associates |
Investees or associates are all entities over which LATAM Airlines Group S.A. and Subsidiaries have significant influence but have no control. This usually arises from holding between 20% and 50% of the voting rights. Investments in associates are booked using the equity method and are initially recognized at their cost.
The participation of LATAM Airlines Group S.A. and Subsidiaries in the losses or gains after the acquisition of its investees or associates is shown in results, and its participation in post-acquisition movements in reserves of investees or associates are shown in reserves.
| 2.3. | Foreign currency transactions |
Post-acquisition movement is adjusted against the book value of the investment. When the participation of LATAM Airlines Group S.A. and Subsidiaries in the losses of an investee or associate is equal to or more than its holding in it, including any other non-guaranteed account receivable, LATAM Airlines Group S.A. and Subsidiaries will not show the additional losses unless it has incurred obligations or made payments on behalf of the investee or associate.
Gains or losses for dilution in investees or associates are shown in the consolidated statement of income.
2.3. Foreign currency transactions
(a) Presentation and functional currencies
| (a) | Presentation and functional currencies |
The items included in the financial statements of each of the entities of LATAM Airlines Group S.A. and Subsidiaries are valued using the currency of the main economic environment in which the entity operates (the functional currency). The functional currency of LATAM Airlines Group S.A. is the United States dollar which is also the presentation currency of the consolidated financial statements of LATAM Airlines Group S.A. and Subsidiaries.
(b) Transactions and balances
| (b) | Transactions and balances |
Foreign currency transactions are translated to the functional currency using the exchange rates on the transaction dates. Foreign currency gains and losses resulting from the liquidation of these transactions and from the translation at the closing exchange rates of the monetary assets and liabilities denominated in foreign currency are shown in the consolidated statement of income by function except when deferred in Other comprehensive income as qualifying cash flow hedges.
(c) Group entities
| (c) | Group entities |
The results and financial position of all the Group entities (none of which has the currency of a hyper-inflationary economy) that have a functional currency other than the presentation currency are translated to the presentation currency as follows:
(i)
| (i) | Assets and liabilities of each consolidated statement of financial position presented are translated at the closing exchange rate on the consolidated statement of financial position date; |
| (ii) | The revenues and expenses of each income statement account are translated at the exchange rates prevailing on the transaction dates, and |
| (iii) | All the resultant exchange differences by conversion are shown as a separate component in Other comprehensive income. |
(ii) The revenues and expenses of each income statement account are translated at the exchange rates prevailing on the transaction dates,
(iii) All the resultant exchange differences are shown as a separate component in Other comprehensive income.
The exchange rates used correspond to those fixed in the country where the subsidiary is located, whose functional currency is different to the U.S. dollar.
In the consolidation, exchange differences arising from the translation of a net investment in foreign entities (or local with a functional currency different to that of the parent), and of loans and other foreign currency instruments designated as hedges for these investments, are recorded within net equity. When the investment is sold, these exchange differences are shown in the consolidated statement of income as part of the loss or gain on the sale.
Adjustments to the Goodwill and fair value arising from the acquisition of a foreign entity are treated as assets and liabilities of the foreign entity and are translated at the closing exchange rate.rate or period informed.
2.4. Property, plant and equipment
| 2.4. | Property, plant and equipment |
The land of LATAM Airlines Group S.A. and Subsidiaries is recognized at cost less any accumulated impairment loss. The rest of the Property, plant and equipment are registered, initially and subsequently, at historic cost less the corresponding depreciation and any impairment loss.
The amounts of advance payments to aircraft manufacturers are capitalized by the Company under Construction in progress until receipt of the aircraft.
Subsequent costs (replacement of components, improvements, extensions, etc.) are included in the value of the initial asset or shown as a separate asset only when it is probable that the future economic benefits associated with the elements of Property, plant and equipment are going to flow to the Company and the cost of the element can be determined reliably. The value of the component replaced is written off in the books at the time of replacement. The rest of the repairs and maintenance are charged to the results of the year in which they are incurred.
Depreciation of Property, plant and equipment is calculated using the straight-line method over their estimated technical useful lives; except in the case of certain technical components which are depreciated on the basis of cycles and hours flown.
The residual value and useful life of assets are reviewed, and adjusted if necessary, once per year.
When the carrying amount of an asset is higher than its estimated recoverable amount, its value is reduced immediately to its recoverable amount (Note 2.8).
Losses and gains on the sale of Property, plant and equipment are calculated by comparing the compensation with the book value and are included in the consolidated statement of income.
2.5. Intangible assets other than goodwill
| 2.5. | Intangible assets other than goodwill |
Brands, airport Slots
| (a) | Airport slots and Loyalty program |
Airport slots and Loyalty program
Brands, airport Slotsthe Coalition and coalition and loyaltyLoyalty program are intangible assets of indefinite useful life and are subject to impairment tests annually.annually as an integral part of each CGU, in accordance with the premises that are applicable, included as follows:
Airport slots – Air transport CGU
Loyalty program – Coalition and loyalty program Multiplus CGU
(See Note 16)
The airport slots correspond to an administrative authorization to carry out an operationoperations of arrival and departure of aircraft at a specific airport, within a specified period.
The Loyalty program corresponds to the system of accumulation and redemption of points that has developed Multiplus S.A., subsidiary of TAM S.A.
The Brands, airport Slots and Loyalty program were recognized in fair values determined in accordance with IFRS 3, as a consequence of the business combination explained in Note 18.2.(b).with TAM and Subsidiaries.
Computer software
| (b) | Computer software |
Licenses for computer software acquired are capitalized on the basis of the costs incurred in acquiring them and preparing them for using the specific software. These costs are amortized over their estimated useful lives.lives, for which the Company has been defined useful lives between 3 and 10 years.
Expenses related to the development or maintenance of computer software which do not qualify for capitalization, are shown as an expense when incurred. CertainThe personnel costs and others costs directly related to the production of unique and identifiable computer software controlled by the Company, are shown as intangible Assets others than Goodwill when they have met all the criteria for capitalization.
| (c) | Brands |
The direct costs includeBrands were acquired in the expensesbusiness combination with TAM S.A. And Subsidiaries and recognized at fair value under IFRS. During the year 2016, the estimated useful life of the personnel who developbrands change from an indefinite useful life to a five-year period, the computer software and other costs directly associated.period in which the value of the brands will be amortized (See Note 15).
Development costs of computer software shown as assets are amortized over their estimated useful lives.
| 2.6. | Goodwill |
Goodwill represents the excess of acquisition cost over the fair value of the Company’s participation in the net identifiable assets of the subsidiary or associate on the acquisition date. Goodwill related to acquisition of subsidiaries is not amortized but tested for impairment annually.annually or each time that there is evidence of impairment. Gains and losses on the sale of an entity include the book amount of the goodwill related to the entity sold.
| 2.7. | Borrowing costs |
Interest costs incurred for the construction of any qualified asset are capitalized over the time necessary for completing and preparing the asset for its intended use. Other interest costs are recognized in the consolidated income statement when they are incurred.accrued.
2.8. Losses for impairment of non-financial assets
| 2.8. | Losses for impairment of non-financial assets |
Intangible assets that have an indefinite useful life, and developing IT projects, are not subject to amortization and are subject to annual testing for impairment. Assets subject to amortization are subjected to impairment tests whenever any event or change in circumstances indicates that the book value of the assets may not be recoverable. An impairment loss is recorded when the book value is greater than the recoverable amount. The recoverable amount of an asset is the higher of its fair value less costs to sell and its value in use. In evaluating the impairment, the assets are grouped at the lowest level for which cash flows are separately identifiable (CGUs). Non-financial assets other than goodwill that have suffered an impairment loss are reviewed if there are indicators of reverse losses at each reporting date.
| 2.9. | Financial assets |
The Company classifies its financial instruments in the following categories: financial assets at fair value through profit and loss and loans and receivables and financial assets held to maturity.receivables. The classification depends on the purpose for which the financial instruments were acquired. Management determines the classification of its financial instruments at the time of initial recognition, which occurs on the date of transaction.
(a) Financial assets at fair value through profit and loss
| (a) | Financial assets at fair value through profit and loss |
Financial assets at fair value through profit and loss are financial instruments held for trading and those which have been designated at fair value through profit or loss in their initial classification. A financial asset is classified in this category if acquired mainly for the purpose of being sold in the near future or when these assets are managed and measured using fair value. Derivatives are also classified as acquiredheld for trading unless they are designated as hedges. AssetsThe financial assets in this category and have been designated initial recognition through profit or loss, are classified as Cash and cash equivalents and Other current financial assets and those designated as instruments held for trading are classified as Other current and othernon-current financial assets, designated on initial recognition.assets.
(b) Loans and receivables
| (b) | Loans and receivables |
Loans and receivables are non-derivative financial instruments with fixed or determinable payments not traded on an active market. These items are classified in current assets except for those with maturity over 12 months from the date of the consolidated statement of financial position, which are classified as non-current assets. Loans and receivables are included in trade and other accounts receivable in the consolidated statement of financial position (Note 2.12).
c) Financial assets held to maturity
Financial assets held to maturity are non-derivative financial instruments with fixed or determinable payments and fixed maturities that the Company’s management has the positive intention and capacity to hold until their maturity. Should the Company sell a not-insignificant amount of the financial assets held to their maturity, the whole category is reclassified as available for sale. These financial instruments held to maturity are included in non-current assets, except for those maturity equal to or less than 12 months from the consolidated statement of financial position, which are classified as Other current financial assets.
RegularThe regular purchases and sales of financial assets are recognized on the trade date – the date on which the Group commits to purchase or sell the asset. Investments are initially recognized at fair value plus transaction costs for all financial assets not carried at fair value through profit or loss. Financial assets carried at fair value through profit or losslosses are initially recognized at fair value, and transaction costs are expensed in the income statement. Financial assets are derecognized when the rights to receive cash flows from the investments have expired or have been transferred and the Group has transferred substantially all risks and rewards of ownership.
The financial assets at fair value through profit or loss are subsequently carried at fair value. Loans and receivables are subsequently carried at amortized cost using the effective interest rate method. Held to maturity investments are carried at amortized cost using the effective interest rate.
At the date of each consolidated statement of financial position, the Company assesses if there is objective evidence that a financial asset or group of financial assets may have suffered an impairment loss. For the case of financial assets held to maturity, if there is any evidence of impairment, the amount of the provision is the difference between the book value of the assets and the present value of the estimated future cash flows, discounted at the original effective interest rate.
2.10. Derivative financial instruments and hedging activities
| 2.10. | Derivative financial instruments and hedging activities |
Derivatives are booked initially at fair value on the date the derivative contracts are signed and later they continue to be valued at their fair value. The method for booking the resultant loss or gain depends on whether the derivative has been designated as a hedging instrument and if so, the nature of the item hedged. The Company designates certain derivatives as:
(a) Hedge of the fair value of recognized assets (fair value hedge);
| (a) | Hedge of the fair value of recognized assets (fair value hedge); |
(b) Hedge of an identified risk associated with a recognized liability or an expected highly-Probable transaction (cash-flow hedge), or
| (b) | Hedge of an identified risk associated with a recognized liability or an expected highly- Probable transaction (cash-flow hedge), or |
(c) Derivatives that do not qualify for hedge accounting.
| (c) | Derivatives that do not qualify for hedge accounting. |
The Company documents, at the inception of each transaction, the relationship between the hedging instrument and the hedged item, as well as its objectives for managing risk and the strategy for carrying out various hedging transactions. The Company also documents its assessment, both at the beginning and on an ongoing basis, as to whether the derivatives used in the hedging transactions are highly effective in offsetting the changes in the fair value or cash flows of the items being hedged.
The total fair value of the hedging derivatives is booked as Other non-current financial asset or liability if the remaining maturity of the item hedged is over 12 months, and as an other current financial asset or liability if the remaining term of the item hedged is less than 12 months. Derivatives not booked as hedges are classified as Other financial assets or liabilities.
(a) Fair value hedges
| (a) | Fair value hedges |
Changes in the fair value of designated derivatives that qualify as fair value hedges are shown in the consolidated statement of income, together with any change in the fair value of the asset or liability hedged that is attributable to the risk being hedged.
(b) Cash flow hedges
| (b) | Cash flow hedges |
The effective portion of changes in the fair value of derivatives that are designated and qualify as cash flow hedges is shown in the statement of other comprehensive income. The loss or gain relating to the ineffective portion is recognized immediately in the consolidated statement of income under Other gains (losses). Amounts accumulated in equity are reclassified to profit or loss in the periods when the hedged item affects profit or loss.
In case of variable interest-rate hedges, the amounts recognized in the statement of Other comprehensive income are reclassified to results within financial costs at the same time the associated debts accrue interest.
For fuel price hedges, the amounts shown in the statement of Other comprehensive income are reclassified to results under the line item Cost of sales to the extent that the fuel subject to the hedge is used.
For foreign currency hedges, the amounts recognized in the statement of Other comprehensive income are reclassified to income as deferred revenue resulting from the use of points, are recognized as income.Income.
When hedging instruments mature or are sold or when they do not meet the requirements to be accounted for as hedges, any gain or loss accumulated in the statement of Other comprehensive income until that moment remains in the statement of other comprehensive income and is reclassified to the consolidated statement of income when the hedged transaction is finally recognized. When it is expected that the hedged transaction is no longer going to occur, the gain or loss accumulated in the statement of other comprehensive income is taken immediately to the consolidated statement of income as “Other gains (losses)”.
(c) Derivatives not booked as a hedge
| (c) | Derivatives not booked as a hedge |
The changes in fair value of any derivative instrument that is not booked as a hedge are shown immediately in the consolidated statement of income in “Other gains (losses)”.
| 2.11. | Inventories |
Inventories, detailed in Note 10, are shown at the lower of cost and their net realizable value. The cost is determined on the basis of the weighted average cost method (WAC). The net realizable value is the estimated selling price in the normal course of business, less estimated costs necessary to make the sale.
2.12. Trade and other accounts receivable
| 2.12. | Trade and other accounts receivable |
Trade accounts receivable are shown initially at their fair value and later at their amortized cost in accordance with the effective interest rate method, less the allowance for impairment losses. An allowance for impairment loss of trade accounts receivable is made when there is objective evidence that the Company will not be able to recover all the amounts due according to the original terms of the accounts receivable.
The existence of significant financial difficulties on the part of the debtor, the probability that the debtor is entering bankruptcy or financial reorganization and the default or delay in making payments are considered indicators that the receivable has been impaired. The amount of the provision is the difference between the book value of the assets and the present value of the estimated future cash flows, discounted at the original effective interest rate. The book value of the asset is reduced by the amount of the allowance and the loss is shown in the consolidated statement of income in Cost of sales. When an account receivable is written off, it is charged to the allowance account for accounts receivable.
2.13. Cash and cash equivalents
| 2.13. | Cash and cash equivalents |
Cash and cash equivalents include cash and bank balances, time deposits in financial institutions, and other short-term and highly liquid investments.
| 2.14. | Capital |
The common shares are classified as net equity.
Incremental costs directly attributable to the issuance of new shares or options are shown in net equity as a deduction from the proceeds received from the placement of shares.
2.15. Trade and other accounts payables
| 2.15. | Trade and other accounts payables |
Trade payables and other accounts payable are initially recognized at fair value and subsequently at amortized cost and are valued according to the method of the effective interest rate.cost.
| 2.16. | Interest-bearing loans |
Financial liabilities are shown initially at their fair value, net of the costs incurred in the transaction. Later, these financial liabilities are valued at their amortized cost; any difference between the proceeds obtained (net of the necessary arrangementarrangement| costs) and the repayment value, is shown in the consolidated statement of income during the term of the debt, according to the effective interest rate method.
Financial liabilities are classified in current and non-current liabilities according to the contractual payment dates of the nominal principal.
| 2.17. | Current and deferred taxes |
The expense by current tax is comprised of income and deferred taxes.
The charge for current tax is calculated based on tax laws in force on the date of statement of financial position, in the countries in which the subsidiaries and associates operate and generate taxable income.
Deferred taxes are calculated using the liability method, on the temporary differences arising between the tax bases of assets and liabilities and their book values. However, if the temporary differences arise from the initial recognition of a liability or an asset in a transaction different from a business combination that at the time of the transaction does not affect the accounting result or the tax gain or loss, they are not booked. The deferred tax is determined using the tax rates (and laws) that have been enacted or substantially enacted at the consolidated financial statements close, and are expected to apply when the related deferred tax asset is realized or the deferred tax liability discharged.
Deferred tax assets are recognisedrecognized when it is probable that there will be sufficient future tax earnings with which to compensate the temporary differences.
The Company does not record deferred tax on temporary differences arising on investments(current and deferred) is recognized in subsidiaries, providedincome by function, unless it relates to an item recognized in Other comprehensive income, directly in equity or from business combination. In that case the opportunity to reverse the temporary differencestax is controlledalso recognized in Other comprehensive income, directly in income by the Company and it is probable that the temporary differences will not reverse in the foreseeable future. Deferred tax on temporary differences arising on investments in associates is immaterial.function or goodwill, respectively.
| 2.18. | Employee benefits |
(a) Personnel vacations
| (a) | Personnel vacations |
The Company recognizes the expense for personnel vacations on an accrual basis.
(b) Share-based compensation
| (b) | Share-based compensation |
The compensation plans implemented bybased on the grantingshares of options for the subscription and payment of sharesCompany are shownrecognized in the consolidated financial statements in accordance with IFRS 2: ShareShare-based payments, for plans based payments, showingon the granting of options, the effect of the fair value of the options granted asis recorded in equity with a charge to remuneration onin a straight-line basislinear manner between the date of granting suchgrant of said options and the date on which thesethey become vested.irrevocable, for the plans considered as cash settled award the fair value, updated as of the closing date of each reporting period, is recorded as a liability with charge to remuneration.
(c) Post-employment and other long-term benefits
| (c) | Post-employment and other long-term benefits |
Provisions are made for these obligations by applying the method of the actuarial value of the accrued cost,projected unit credit method, and taking into account estimates of future permanence, mortality rates and future wage increases determined on the basis of actuarial calculations. The discount rates are determined by reference to market interest-rate curves. Actuarial gains or losses are shown in results for the period when they occur.other comprehensive income.
(d) Incentives
| (d) | Incentives |
The Company has an annual incentives plan for its personnel for compliance with objectives and individual contribution to the results. The incentives eventually granted consist of a given number or portion of monthly remuneration and the provision is made on the basis of the amount estimated for distribution.
| 2.19. | Provisions |
Provisions are recognisedrecognized when:
(i) The Company has a present legal or implicit obligation as a result of past events.
| (i) | The Company has a present legal or implicit obligation as a result of past events; |
(ii) It is probable that payment is going to be necessary to settle an obligation, and
| (ii) | It is probable that payment is going to be necessary to settle an obligation; and |
(iii) The amount has been reliably estimated.
| (iii) | The amount has been reliably estimated. |
Provisions are shown at the present value of the disbursements expected to be necessary for settling the obligation using the Company’s best estimates. The pre-tax discount rate used for determining the present value reflects current market evaluations on the date of the consolidated financial statements, time value of money, as well as the specific risks related to the liability in question.
| 2.20. | Revenue recognition |
Revenues include the fair value of the proceeds received or to be received on sales of goods and rendering services in the ordinary course of the Company’s business. Revenues are shown net of refunds, rebates and discounts.
(a) Rendering of services
| (a) | Rendering of services |
(i) Passenger and cargo transport
| (i) | Passenger and cargo transport |
The Company shows revenue from the transportation of passengers and cargo once the service has been provided.
Consistent with the foregoing, the Company presents the deferred revenues, generated by anticipated sale of flight tickets and freight services, in heading Other non—financial liabilities in the Statement of Financial Position.
(ii) Frequent flyer program
| (ii) | Frequent flyer program |
The Company currently has a frequent flyer program,programs, whose objective is customer loyalty through the delivery of kilometers or points fly whenever the programprograms holders make certain flights, use the services of entities registered with the program or make purchases with an associated credit card. The kilometers or points earned can be exchanged for flight tickets or other services of associated entities.
The consolidated financial statements include liabilities for this concept (deferred income), according to the estimate of the valuation established for the kilometers or points accumulated pending use at that date, in accordance with IFRIC 13: Customer loyalty programs.
(iii) Other revenues
| (iii) | Other revenues |
The Company records revenues for other services when these have been provided.
(b) Interest income
Interest income is booked using the effective interest rate method.
(c) Dividend income
| (b) | Dividend income |
Dividend income is booked when the right to receive the payment is established.
| 2.21. | Leases |
(a) When the Company is the lessee – financial lease
| (a) | When the Company is the lessee – financial lease |
The Company leases certain Property, plant and equipment in which it has substantially all the risk and benefits deriving from the ownership; they are therefore classified as financial leases. Financial leases are initially recorded at the lower of the fair value of the asset leased and the present value of the minimum lease paymentspayments.
Every lease payment is separated between the liability component and the financial expenses so as to obtain a constant interest rate over the outstanding amount of the debt. The corresponding leasing obligations, net of financial charges, are included in Other financial liabilities. The element of interest in the financial cost is charged to the consolidated statement of income over the lease period so that it produces a constant periodic rate of interest on the remaining balance of the liability for each year. The asset acquired under a financial lease is depreciated over its useful life and is included in Property, plant and equipment.
(b) When the Company is the lessee – operating lease
| (b) | When the Company is the lessee – operating lease |
Leases, in which the lessor retains an important part of the risks and benefits deriving from ownership, are classified as operating leases. Payments with respect to operating leases (net of any incentive received from the lessor) are charged in the consolidated statement of income on a straight-line basis over the term of the lease.
2.22. Non-current assets or disposal groups classified as held for sale
| 2.22. | Non-current assets or disposal groups classified as held for sale |
Non-current assets (or disposal groups) are classified as assets held for sale when their carrying amount is to be recovered principally through a sale transaction and a sale is considered highly probable. They are shownstated at at the lesser of their book value and the fair value less costs to sell.
| 2.23. | Maintenance |
The costs incurred for scheduled heavy maintenance of the aircraft’s fuselage and engines are capitalized and depreciated until the next maintenance. The depreciation rate is determined on technical grounds, according to the use of the aircraft expressed in terms of cycles and flight hours.
In case of on balance sheetown aircraft or under financial leases, these maintenance cost are capitalized as Property, plant and equipment, while in the case of off balance sheet aircraft under operating leases, a liability is accrued based on the use of the main components is recognized, since a contractual obligation with the lessor to return the aircraft on agreed terms of maintenance costlevels exists. These are periodically provided for and recognized through profit and loss as “CostCost of sales”.sales.
Additionally, some leases establish the obligation of the lessee to make deposits to the lessor as a guarantee of compliance with the maintenance and return conditions. These deposits, often called maintenance reserves, accumulate until a major maintenance is performed, once made, is request the recovery is requested to the lessor. At the end of the contract period, there is comparison between the balancereserves that have been paid and required return conditions, and compensation between paid reservations and conditions agreed with levels of maintain in delivering, be offset the parties are made if applicable.
The unscheduled maintenance of aircraft and engines, as well as minor maintenance, are charged to results as incurred.
| 2.24. | Environmental costs |
Disbursements related to environmental protection are charged to results when incurred.
NOTE 3 - 3—FINANCIAL RISK MANAGEMENT
| 3.1. | Financial risk factors |
The Company’s activities areCompany is exposed to different financial risks: (a) market risk, (b) credit risk, and (c) liquidity risk. The Company’s globalprogram overall risk management program is focused on uncertainty inof the financial markets and triesCompany aims to minimize the potential adverse effects onof financial risks affecting the net margin. The Company uses derivatives to hedge part of these risks.company.
(a) Market risk
| (a) | Market risk |
Due to the nature of its operations, the Company is exposed to market risksfactors such as:
(i) fuel-price risk, (ii) interest-rateexchange -rate risk, and (iii) local exchange-rateinterest -rate risk. In order
The Company has developed policies and procedures for managing market risk, which aim to fully or partially hedge allidentify, quantify, monitor and mitigate the adverse effects of these risks,changes in market factors mentioned above.
For this, the Administration monitors the evolution of price levels and rates, and quantifies their risk exposures (Value at Risk), and develops and implements hedging strategies.
| (i) | Fuel-price risk: |
Exposition:
For the execution of its operations the Company purchases a fuel called Jet Fuel grade 54 USGC, which is subject to the fluctuations of international fuel prices.
Mitigation:
To cover the risk exposure fuel, the Company operates with derivative instruments to fix or limit rises in the(swaps and options) whose underlying assets.
(i) Fuel-price risk:
Fluctuations in fuel prices largely depend on the global supply and demand for oil, decisions taken by Organization of Petroleum Exporting Countries (“OPEC”), global refining capacity, stock levels maintained, and weather and geopolitical factors.
The Company purchases an aircraft fuel calledassets may be different from Jet Fuel, grade 54. There is a benchmark price in the international market for this underlying asset, which is US Gulf Coast Jet 54. However, the futures market for this asset has a low liquidity index and as a result the Company hedges its exposure usingbeing possible use West Texas Intermediate (“WTI”) crude, Brent (“BRENT”) crude and distillate Heating Oil (“HO”), which have a high correlation with Jet Fuel and are highly liquid assets and therefore have advantages in comparison to the use of the U.S. Gulf Coast Jet 54 index.liquid.
Fuel Hedging Results:
During the period of 2013, the Company recognized gains of US$ 19.03 million on fuel hedging. During the same period 2012,ended at December 31, 2016, the Company recognized losses of US$ 1.8048.0 million and duringon fuel derivative. During the same period 2011of 2015, the Company recognized gainslosses of US$ 39.9239.4 million for the same reason.
At December 31, 2013,2016, the market value of its fuel positions amounted to US$ 15.98.1 million (positive). At December 31, 2012,2015, this market value was US$ 9.956.4 million (negative).
The following tables show the notional valuelevel of the purchase positions together with the derivatives contractedhedge for the different periods:
Positions as of December 31, 2013 (*) | ||||||||||||
| Q114 | Q214 | Total | ||||||||||
Volume (thousands of barrels) | 4,093 | 1,851 | 5,944 | |||||||||
Contracted future price (US$ per barrel)(**) | 110 | 109 | 110 | |||||||||
|
|
|
|
|
| |||||||
Total (ThUS$) | 450,230 | 201,759 | 653,840 | |||||||||
|
|
|
|
|
| |||||||
Percentage of the hedge of expected consumption value | 56 | % | 26 | % | 41 | % | ||||||
Positions as of December 31, 2016 (*) | Maturities | |||||||||||
| Q117 | Q217 | Total | ||||||||||
Percentage of the hedge of expected consumption value | 21 | % | 16 | % | 18 | % | ||||||
|
|
|
|
|
| |||||||
| (*) | The volume shown in the table considers all the hedging instruments (swaps and options) |
Positions as of December 31, 2012 (*) | Maturities | |||||||||||||||||||||||||||
| Q113 | Q213 | Q313 | Q413 | Q114 | Q214 | Total | ||||||||||||||||||||||
Volume (thousands of barrels) | 4,824 | 600 | 525 | 525 | 525 | 75 | 7,074 | |||||||||||||||||||||
Contracted future price (US$ per barrel)(**) | 122 | 132 | 132 | 131 | 111 | 104 | 123 | |||||||||||||||||||||
|
|
|
|
|
|
|
|
|
|
|
|
|
| |||||||||||||||
Total (ThUS$) | 588,528 | 79,200 | 69,300 | 68,775 | 58,275 | 7,800 | 870,102 | |||||||||||||||||||||
|
|
|
|
|
|
|
|
|
|
|
|
|
| |||||||||||||||
Percentage of the hedge of expected consumption value | 61 | % | 7 | % | 6 | % | 6 | % | 6 | % | 1 | % | 19 | % | ||||||||||||||
Positions as of December 31, 2015 (*) | Maturities | |||||||||||||||||||
| Q116 | Q216 | Q316 | Q416 | Total | ||||||||||||||||
Percentage of the hedge of expected consumption value | 63 | % | 27 | % | 27 | % | 11 | % | 32 | % | ||||||||||
|
|
|
|
|
|
|
|
|
| |||||||||||
| (*) | The volume shown in the table considers all the hedging instruments (swaps and options) |
Given that current derivatives portfolio comprises mainly contracts based on Brent, a decision has been made to change the equivalence applied to this underlying index in order to calculate the agreed future value for different periods.
Sensitivity analysis
A drop in fuel price positively affects the Company through a reduction in costs. However, this drop also negatively affects contracted positions as these are acquired to protect the Company against the risk of a rise in price. The policy therefore is to maintain a hedge-free percentage in order to be competitive in the event of a drop in price.
Due to the fact that current positions do not represent changes in cash flows, but a variation in the exposure to the market value, theThe current hedge positions have no impact on income (theythey are booked as cash flow hedge contracts, so a variation in the fuel price has an impact on the Company’s net equity).equity.
The following table shows the sensitivity analysis of the financial instruments according to reasonable changes in the fuel price and their effect on equity. The term of the projection was defined until the end of the last current fuel hedge contract, being the last business day of the secondlast quarter of 2014.2017.
The calculations were made considering a parallel movement of US$ 5 per barrel in the curve of the WTI, BRENT and JET crude futures benchmark price at the end of December, 2013September 2016 and the end of December, 2012.2015.
Benchmark price (US$ per barrel) | Positions as of December 31, 2013 effect on equity (millions of US$) | Positions as of December 31, 2012 effect on equity (millions of US$) | ||||||
+ 5 | +24.57 | +12.60 | ||||||
-5 | -19.13 | -11.30 | ||||||
The Company seeks to reduce the risk of fuel price rises to ensure it is not left at a disadvantage compared to its competitors in the event of a sharp price fall. The Company therefore uses hedge instruments like swaps, call options and collars to partially hedge the fuel volumes by consume.
Beginning with the third quarter of 2012 the company meets the required criteria of IAS 39, presented to apply hedge accounting in respect of fuel hedging TAM society. Until June 30, 2012, the Company did not apply hedge accounting to fuel hedging instruments of TAM. During the periods presented the Company has not recorded ineffectiveness within the income statement.
Benchmark price (US$ per barrel) | Positions as of December 31, 2016 (millions of US$) | Positions as of December 31, 2015 (millions of US$) | ||
+5 | +3.12 | +5.41 | ||
-5 | -4.78 | -2.78 |
Given the fuel hedge structure during 2013,the year 2016, which considers a hedge-free portion, a vertical fall by 5 dollars in the WTI, BRENT and JET benchmark price (the monthly daily average), would have meant an impact of approximately US$ 127.6116.3 million in the cost of total fuel consumption for the same period. For 2013,the year 2016, a vertical rise by 5 dollars in the WTI, BRENT and JET benchmark price (the monthly daily average) would have meant an impact of approximately US$ 118.5114.5 million of increased fuel costs.
| (ii) | Foreign exchange rate risk: |
(ii) Cash flow interest-rate risk:Exposition:
The fluctuation in interest rates depends heavily on the statefunctional and presentation currency of the global economy. An improvement in long-term economic prospects moves long-term rates upward while a drop causes a decline through market effects. However, if we consider government intervention in periodsFinancial Statements of economic recession, itthe Parent Company is usual to reduce interest rates to stimulate aggregate demand by making credit more accessible and increasing production (in the same way interest rates are raised in periods of economic expansion).
The present uncertainty about how the market and governments will react, and thus how interest rates will change, creates a risk related to the Company’s debt at floating interest rates and its investments.
Cash flow interest rate risk equates toUnited States dollar, so the risk of future cash flowsTransactional exchange rate and Conversion arises mainly from its own operating activities of the financial instruments due to the fluctuation in interest rates on the market. The Company’s exposure to risksbusiness, strategic and accounting of changes in market interest rates is mainly related to long-term obligations with variable interest rates.
In order to reduce the risk of an eventual rise in interest rates, the Company has signed interest-rate swap and call option contracts. Currently a 70% of the debt is fixed to fluctuations in interest rate. Therefore the Company is exposed in one portion to the variations of London Inter-Bank Offer Rate (“LIBOR”) of 30 days, 90 days, 180 days and 360 days. Other interest rates of less relevance are Brazilian Interbank Deposit Certificate (“ILC”), and the Interest Rate Term of Brazil (“TJLP”).
The following table shows the sensitivity of changes in financial obligations that are not hedged against interest-rate variations. These changes are considered reasonably possible based on current market conditions.
Increase (decrease) futures curve in libor 3 months | Positions as of December 31, 2013 effect on equity (millions of US$) | Positions as of December 31, 2012 effect on equity (millions of US$) | ||||||
+100 basis points | -29.70 | -33.69 | ||||||
-100 basis points | +29.70 | +33.69 | ||||||
Changes in market conditions produce a change in the valuation of current financial instruments hedging interest rates, causing an effect on the Company’s equity (because they are booked as cash-flow hedges). These changes are considered reasonably possible based on current market conditions. The calculations were made increasing (decreasing) vertically 100 basis points of the three-month Libor futures curve.
Increase (decrease) futures curve in libor 3 months | Positions as of December 31, 2013 effect on equity (millions of US$) | Positions as of December 31, 2012 effect on equity (millions of US$) | ||||||
+100 basis points | +23.35 | +33.60 | ||||||
-100 basis points | -24.46 | -35.50 | ||||||
There are limitations in the method used for the sensitivity analysis and relate to those provided by the market because the levels indicated by the futures curves are not necessarily met and will change in each period.
In accordance with the requirements of IAS 39, during the periods presented, the Company has not recorded amounts for ineffectiveness in the consolidated income statement.
(iii) Foreign exchange rate risk:
The functional currency used by the Company is the US dollar in terms of setting prices for its services, the composition of its statement of financial position and effects on its operating income.
The risk arises when items listed on the balance sheet are exposed to exchange rate variations, due to their being listeddenominated in a different currency other than the functional currency.
InLATAM Subsidiaries are also exposed to currency risk that impacts the caseconsolidated results of the subsidiary TAM S.A,Company.
Most currency exposure of LATAM comes from the concentration of business in Brazil, which operates with theare mostly denominated in Brazilian Real as its functional currency, a large proportion of(BRL), being actively managed by the company’s liabilities are expressedcompany.
Additionally, the company manages the economic exposure to operating revenues in dollars. Therefore, this subsidiary’s profit and loss varies when its financial assets and liabilities, an its accounts receivable listed in dollars are converted to Brazilian Reals. This impact on profit and loss is consolidated, directly affecting the Company.Pound Sterling (GBP).
In order to reducelower concentrations the impacts on the Company’s profit and loss caused by rises and falls in the R$/US$ exchange rate, during the last quarter of 2013 the Company conducted transactions to reduce the net US$ liabilities held by TAM S.A.
The following table shows the variation of financial performance to appreciate or depreciate 10% exchange rate R$/US$:
| ||||
| ||||
| ||||
The Company sells most of its services in US dollars, prices equivalent to the US dollar and Brazilian real. A large part of its expenses are denominated in US dollars or equivalents to the US dollar, particularly fuel costs, aeronautic charges, aircraft leases, insurance and aircraft components and accessories. Remuneration expenses are denominated in local currencies.
The Company maintains its cargo and passenger international business tariffs in US dollars. There is a mix in the domestic markets as sales in Peru are in local currency but the prices are indexed to the US dollar. In domestic markets of Brazil, Chile, Argentina and Colombia the tariffs are in local currency without any kind of indexation. In the case of the domestic business in Ecuador, both tariffs and sales are in US dollar. The Company is therefore exposed to fluctuations in the differentothers currencies, among which are: Brazilian real,such as: Euro, Australian Dollar, Colombian Peso, Chilean peso,Peso, Argentine peso,Peso, Paraguayan guaraníGuaraní, Mexican peso, Euro, Pound Sterling,Peso, Peruvian sol, Colombian peso, Australian dollarSol and New Zealand dollar. Of these currencies,Dollar.
Mitigation:
The Company mitigates currency risk exposures by contracting derivative instruments or through natural hedges or execution of internal operations.
FX Hedging Results:
With the largestaim of reducing exposure is presented by Brazilian real and Chilean peso.
On the other hand, one of the sources of financing of the Company is the receipt of future flows relating to dividends and distributions of capital that the subsidiaries project distribute. These futures flows vary depending on the evolution of currency in compared to the US$. Most exposure to future flows is presented in subsidiary TAM S.A. and the volatility in the exchange rate R$/US$. In the case of the subsidiary TAM S.A. the incomes are expressed a large proportion in R$ and a large proportion of their costs are expressed in US$.
For cover the inversion in the subsidiaries and reduce the volatility in the cash flow , the Company may acquire derivatives contracts to hedge variations in other currencies against the Company’s functional currency, hedging exchange rate risk on operating cash flows in 2016 and 2017, and secure the operating margin, LATAM and TAM conduct hedging through currency forwards.
With the object of reduce the exposition to the futures monthly operating flows of all 2014, caused by eventual depreciation of the BRL and assure an economic margins, LATAM done the hedge by derivatives FX Forwards.derivatives.
At December 31, 2013,2016, the market value of its FX positions amounted to US$ 32.061.1 million (negative). At end of December 2015 the market value was of US$ 8.0 million (positive), these derivatives were contracted during 2013 so.
During the period ended at December 31, 2012, there was no this type2016 the Company recognized losses of derivatives.
The following table presentsAt end of December 2016, the notional amountCompany has contracted FX derivatives for US$ 60 million to BRL and US$ 10 million to GBP. At end of December 2015, the Company had contracted positions with the average prices agreed:FX for US$ 270 million to BRL, US$ 30 million to EUR and US$ 15 million to GBP.
Positions at December 31, 2013 | ||||||||||||||||||||
| Q114 | Q214 | Q314 | Q414 | Total | ||||||||||||||||
Volume (million of US$) | 125 | 125 | 125 | 125 | 500 | |||||||||||||||
Forward average price agreed (US$/R$) | 2.24 | 2.28 | 2.33 | 2.39 | 2.31 | |||||||||||||||
|
|
|
|
|
|
|
|
|
| |||||||||||
Total (million of R$) | 280 | 285 | 291 | 299 | 1,155 | |||||||||||||||
|
|
|
|
|
|
|
|
|
| |||||||||||
Sensitivity exchange rate LATAManalysis:
A depreciation of exchange rate R$/US$ and US$/GBP, affects negatively the Company for a rise of its costs in US$, however, it also affects positively the value of contracted derivate positions.
Because the changes in the valueThe FX derivatives are registered for as hedges of current positions not represented changes in cash flows, but a variation in the exposure of market value, the current hedge positions have not impact on result (are registered as cash flow, hedges according to IFRS, therefore, a variation in the exposureexchange rate has an impact on the market value of derivatives, whose changes impact on the Company’s net equity).equity.
The following table presents the sensitivity of financialderivative FX Forward instruments agrees with reasonable changes to exchange rate and its effect on equity. The projection term was defined until the end of the last current contract hedge, being the last business day of the fourthfirst quarter of 2014:2017:
Appreciation (depreciation) of R$/US$ | Effect at December 31, 2014 Millions of US$ | |||||||
Appreciation (depreciation)* of R$ /GBP | Effect at December 31, 2016 | Effect at December 31, 2015 | ||||||
-10% | -49.46 | -1.02 | -21.28 | |||||
+10% | +49.46 | +3.44 | +16.71 | |||||
Operations hedgingIn the case of TAM S.A. which operates with the Brazilian Real as its functional currency, a large proportion of the company’s assets liabilities are expressed in United States Dollars. Therefore, this subsidiary’s profit and loss varies when its financial assets and liabilities, and its accounts receivable listed in dollars are converted to Brazilian Reals. This impact on profit and loss is consolidated in the Company.
In order to reduce the volatility on the financial statements of the Company caused by rises and falls in the R$/US$ exchange rate, Multiplusthe Company has contracted hedging derivatives has conducted transactions for to reduce the net US$ liabilities held by TAM S.A.
The pricesfollowing table shows the variation of frequent flyer points in the subsidiary Multiplus S.A. are denominated in US dollars. As functional currency is the Brazilian real, the sale of these points are assignedfinancial performance to variations in theappreciate or depreciate 10% exchange rate R$/US$. To decrease exposure, Multiplus S.A. contract rate collars.
The following table presents the notional amount and market value of derivatives exchange rate for each maturity date. The expiration date of the derivatives coincide with the probable date of collection points. The highly probable sale of the points are expected to be recognized in income after being exchanged, on average, six months later.:
| Foreign currency | Position at December 31, 2013 | |||||||
| derivative | Maturity | |||||||
Multiplus | 2014 | Total | ||||||
Notional Value (Millions of US$) | +18.00 | +18.00 | ||||||
Market Value (Millions of US$) | -1.65 | -1.65 | ||||||
Appreciation (depreciation)* of R$/US$ | Effect at December 31, 2016 Millons of US$ | Effect at December 31, 2015 Millons of US$ | ||
-10% | +119.2 | +67.6 | ||
+10% | -119.2 | -67.6 |
The derivatives hedges(*) Appreciation (depreciation) of Multiplus expire in March 2014. Have not yet been executed new hedge contracts byUS$ regard to the subsidiary Multiplus, because exposure to exchange rate R$/US$ has been managed by a change in the indexation of Multiplus costs, increase the cost base in US$, which creates a natural hedge to reduce the exposure of cash flows to exchange rate R$/US$.
Sensitivity exchange rate Multiplus S.A.
If the Brazilian real appreciates or depreciates by 10% against the US dollar and all other variables are held constant, the financial results would have varied approximately US$3.3 million/ US$ 4.2 million, mainly as the effect of gains or losses from exchange rate in the time value of derivatives, which are recognized immediately through profit and loss.covered currencies.
Effects of exchange rate derivatives in the Financial Statements
The profit or losses caused by changes in the fair value of hedging instruments are segregated between intrinsic value and timetemporary value. The intrinsic value is the actual percentage of cash flow cash covered, initially shown in equity and later transferred to income, while the hedge transaction is recorded in income. The timetemporary value corresponds to the ineffective portion of cash flow hedge andwhich is recognized in the financial results of the Company (Note 21)19).
Due to the functional currency of TAM S.A. and Subsidiaries is the Brazilian real, the Company presents the effects byof the exchange rate fluctuations in Other comprehensive income by converting the Statement of financial position and Income statement of TAM S.A. and Subsidiaries from their functional currency to the U.S. dollar, being these last currencywhich is the presentation currency of the consolidated financial statement of LATAM Airlines Group S.A. and Subsidiaries. The Goodwill generated in the Business combination is recognized as an asset of TAM S.A. and Subsidiaries in Brazilian real whose conversion to U.S. dollar also produces effects in Other comprehensive income.
The following table shows the change in Other comprehensive income recognized in Total equity toin the case of appreciate or depreciate 10% the exchange rate R$/US$:
Appreciation (depreciation) of R$/US$ | Effect at December 31, 2013 Millions of US$ | Effect at December 31, 2012 Millions of US$ | Effect at December 31, 2016 | Effect at December 31, 2015 | ||||||||
-10% | +466.45 | +407.00 | +351.04 | +296.41 | ||||||||
+10% | -381.63 | -332.98 | -287.22 | -242.52 | ||||||||
| (iii) | Interest -rate risk: |
Exposition:
The Company is exposed to fluctuations in interest rates affecting the markets future cash flows of the assets, and current and future financial liabilities.
The Company is exposed in one portion to the variations of London Inter-Bank Offer Rate (“LIBOR”) and other interest rates of less relevance are Brazilian Interbank Deposit Certificate (“ILC”), and the Interest Rate Term of Brazil (“TJLP”).
(b) CreditMitigation:
In order to reduce the risk of an eventual rise in interest rates, the Company has signed interest-rate swap and call option contracts. Currently a 63% (71% at December 31, 2015) of the debt is fixed to fluctuations in interest rate.
Rate Hedging Results:
At December 31, 2016, the market value of the positions of interest rate derivatives amounted to US$ 17.2 million (negative). At end of December 2015 this market value was US$ 39.8 million (negative).
Sensitivity analysis:
The following table shows the sensitivity of changes in financial obligations that are not hedged against interest-rate variations. These changes are considered reasonably possible, based on current market conditions each date.
Increase (decrease) futures curve in libor 3 months | Positions as of December 31, 2016 | Positions as of December 31, 2015 | ||
+100 basis points | -32.16 | -26.70 | ||
-100 basis points | +32.16 | +26.70 |
Much of the current rate derivatives are registered for as hedges of cash flow, therefore, a variation in the exchange rate has an impact on the market value of derivatives, whose changes impact on the Company’s net equity.
The calculations were made increasing (decreasing) vertically 100 basis points of the three-month Libor futures curve, being both reasonably possible scenarios according to historical market conditions.
Increase (decrease) futures curve in libor 3 months | Positions as of December 31, 2016 | Positions as of December 31, 2015 | ||
+100 basis points | +3.93 | +8.71 | ||
-100 basis points | -4.03 | -9.02 |
The assumptions of sensitivity calculation must assume that forward curves of interest rates do not necessarily reflect the real value of the compensation flows. Moreover, the structure of interest rates is dynamic over time.
During the periods presented, the Company has no registered amounts by ineffectiveness in consolidated statement of income for this kind of hedging.
| (b) | Credit risk |
Credit risk occurs when the counterparty to a financial agreement or instrument fails to discharge an obligation due or financial instrument, leading to a loss in market value of a financial instrument (only financial assets, not liabilities).
The Company is exposed to credit risk due to its operative and financial activities, including deposits with banks and financial institutions, investments in other kinds of instruments, exchange-rate transactions and the contracting of derivative instruments or options.
To reduce the credit risk associated with operational activities, the Company has established credit limits to abridge the exposure of their debtors which are monitored permanently (mainly in case of operational activities in Brazil with travel agents).
As a way to mitigate credit risk related to financial activities, the Company requires that the counterparty to the financial activities remain at least investment grade by major Risk Assessment Agencies. Additionally the company has established maximum limits for investments which are monitored regularly.
(i) Financial activities
| (i) | Financial activities |
Cash surpluses that remain after the financing of assets necessary for the operation are invested according to credit limits approved by the Company’s Board, mainly in time deposits with different financial institutions, private investment funds, short-term mutual funds, and easily-liquidated corporate and sovereign bonds with short remaining maturities. These investments are booked as Cash and cash equivalents and Other current financial assets.
In order to reduce counterparty risk and to ensure that the risk assumed is known and managed by the Company, investments are diversified among different banking institutions (both local and international). The Company evaluates the credit standing of each counterparty and the levels of investment, based on (i) their credit rating, (ii) the equity size of the counterparty, and (iii) investment limits according to the Company’s level of liquidity. According to these three parameters, the Company chooses the most restrictive parameter of the previous three and based on this, establishes limits for operations with each counterparty.
The Company has no guarantees to mitigate this exposure.
(ii) Operational activities
| (ii) | Operational activities |
The Company has four large sales “clusters”: travel agencies, cargo agents, airlines and credit-card administrators. The first three are governed by International Air Transport Association, international (“IATA”) organization comprising most of the airlines that represent over 90% of scheduled commercial traffic and one of its main objectives is to regulate the financial transactions between airlines and travel agents and cargo. When an agency or airline does not pay their debt, they are excluded from operating with IATA’s member airlines. In the case of credit-card administrators, they are fully guaranteed by 100% by the issuing institutions.
The exposure consists of the term granted, which fluctuates between 1 and 45 days.
One of the tools the Company uses for reducing credit risk is to participate in global entities related to the industry, such as IATA, Business Sales Processing (“BSP”), Cargo Account Settlement Systems (“CASS”), IATA Clearing House (“ICH”) and banks (credit cards). These institutions fulfill the role of collectors and distributors between airlines and travel and cargo agencies. In the case of the Clearing House, it acts as an offsetting entity between airlines for the services provided between them. A reduction in term and implementation of guarantees has been achieved through these entities. Currently the sales invoicing of TAM Linhas Aéreas S.A. related with travel agents and cargo agents for domestic transportation in Brazil is done directly by TAM Linhas Aéreas S.A.
Credit quality of financial assets
The external credit evaluation system used by the Company is provided by IATA. Internal systems are also used for particular evaluations or specific markets based on trade reports available on the local market. The internal classification system is complementary to the external one, i.e. for agencies or airlines not members of IATA, the internal demands are greater.
To reduce the credit risk associated with operational activities, the Company has established credit limits to abridge the exposure of their debtors which are monitored permanently (mainly in case of operational activities of TAM Linhas Aéreas S.A. with travel agents).The bad-debt rate in the principal countries where the Company has a presence is insignificant.
(c) Liquidity risk
| (c) | Liquidity risk |
Liquidity risk represents the risk that the Company has no sufficient funds to meet its obligations.
Because of the cyclical nature of the business, the operation, and its investment and financing needs related to the acquisition of new aircraft and renewal of its fleet, plus the financing needs, related to market-risk hedges, the Company requires liquid funds, defined as cash and cash equivalents plus other short term financial assets, to meet its payment obligations.
The liquid funds, the future cash generation and the capacity to obtain additional funding, through bond issuance and banking loans, will allow the Company therefore managesto obtain sufficient alternatives to face its cashinvestment and cash equivalents and its financial assets, matching the termfinancing future commitments.
The liquid funds balance as of investments with those of its obligations. The Company’s policyDecember 31, 2016 is that the average term of its investments may not exceed the average term of its obligations. This cash and cash equivalents position isUS$ 1,486 million (US$ 1,360 million at December 31, 2015), invested in highly-liquid short-termshort term instruments through first-class financial high credit rating levels entities.
TheIn addition to the liquid funds, the Company has future obligations relatedaccess to financial leases, operating leases, maturitiesshort term credit line. As of other bank borrowings, derivative contractsDecember 31, 2016, LATAM has working capital credit lines with multiple banks and aircraft purchase contracts.additionally has a US$ 325 million undrawn committed credit line (US$ 130 million at December 31, 2015).
Class of liability for the analysis of liquidity risk ordered by date of maturity as of December 31, 20132016
Debtor: LATAM Airlines Group S.A. and Subsidiaries , Tax No. 89.862.200-2 Chile.
|
|
|
| |||||||||||||||
|
| |||||||||||||||||
| ||||||||||||||||||
| ||||||||||||||||||
| ||||||||||||||||||
|
| |||||||||||||||||
| ||||||||||||||||||
| ||||||||||||||||||
| ||||||||||||||||||
|
| |||||||||||||||||
| ||||||||||||||||||
| ||||||||||||||||||
| ||||||||||||||||||
| ||||||||||||||||||
| ||||||||||||||||||
| ||||||||||||||||||
| ||||||||||||||||||
| ||||||||||||||||||
| ||||||||||||||||||
| ||||||||||||||||||
|
| |||||||||||||||||
|
| |||||||||||||||||
| ||||||||||||||||||
| ||||||||||||||||||
| ||||||||||||||||||
| ||||||||||||||||||
| ||||||||||||||||||
|
| |||||||||||||||||
| ||||||||||||||||||
|
| |||||||||||||||||
|
| |||||||||||||||||
Class of Liability | More than 90 days to one year | More than one to three years | More than three to five years | More than five years | Total | Amortization | Effective rate | Nominal value | Nominal rate | |||||||||||||||||||||||||||||||||||||||||||||||||||||||||||||||||||||||||||
| Tax No. | Creditor | Creditor country | Currency | Up to 90 days | More than 90 days to one year | More than one to three years | More than three to five years | More than five years | Total | Nominal value | Amortization | Effective rate | Nominal rate | |||||||||||||||||||||||||||||||||||||||||||||||||||||||||||||||||||||||
| ThUS$ | ThUS$ | ThUS$ | ThUS$ | ThUS$ | % | ThUS$ | % | ThUS $ | ThUS $ | ThUS $ | ThUS $ | ThUS $ | ThUS $ | ThUS $ | % | % | ||||||||||||||||||||||||||||||||||||||||||||||||||||||||||||||||||||
Loans to exporters | 30,100 | — | — | — | 30,100 | At expiration | 1.00 | % | 30,000 | 1.00 | % | |||||||||||||||||||||||||||||||||||||||||||||||||||||||||||||||||||||||||
97.032.000-8 | BBVA | Chile | US $ | 75,212 | — | — | — | — | 75,212 | 75,000 | At Expiration | 1.85 | 1.85 | |||||||||||||||||||||||||||||||||||||||||||||||||||||||||||||||||||||||
97.032.000-8 | BBVA | Chile | UF | — | 52,675 | — | — | — | 52,675 | 50,381 | At Expiration | 5.23 | 4.43 | |||||||||||||||||||||||||||||||||||||||||||||||||||||||||||||||||||||||
97.036.000-K | SANTANDER | Chile | US $ | 30,193 | — | — | — | — | 30,193 | 30,000 | At Expiration | 2.39 | 2.39 | |||||||||||||||||||||||||||||||||||||||||||||||||||||||||||||||||||||||
97.030.000-7 | ESTADO | Chile | US $ | 40,191 | — | — | — | — | 40,191 | 40,000 | At Expiration | 1.91 | 1.91 | |||||||||||||||||||||||||||||||||||||||||||||||||||||||||||||||||||||||
97.003.000-K | BANCODOBRASIL | Chile | US $ | 72,151 | — | — | — | — | 72,151 | 70,000 | At Expiration | 3.08 | 3.08 | |||||||||||||||||||||||||||||||||||||||||||||||||||||||||||||||||||||||
97.951.000-4 | HSBC | Chile | US $ | 12,054 | — | — | — | — | 12,054 | 12,000 | At Expiration | 1.79 | 1.79 | |||||||||||||||||||||||||||||||||||||||||||||||||||||||||||||||||||||||
Obligations with the public | ||||||||||||||||||||||||||||||||||||||||||||||||||||||||||||||||||||||||||||||||||||
97.023.000-9 | CORPBANCA | Chile | UF | 20,808 | 61,112 | 63,188 | 16,529 | — | 161,637 | 153,355 | Quarterly | 4.06 | 4.06 | |||||||||||||||||||||||||||||||||||||||||||||||||||||||||||||||||||||||
0-E | BLADEX | U.S.A. | US $ | — | 14,579 | 31,949 | — | — | 46,528 | 42,500 | Semiannual | 5.14 | 5.14 | |||||||||||||||||||||||||||||||||||||||||||||||||||||||||||||||||||||||
0-E | DVB BANK SE | U.S.A. | US $ | 145 | 199 | 28,911 | — | — | 29,255 | 28,911 | Quarterly | 1.86 | 1.86 | |||||||||||||||||||||||||||||||||||||||||||||||||||||||||||||||||||||||
97.036.000-K | SANTANDER | Chile | US $ | 1,497 | 4,308 | 160,556 | — | — | 166,361 | 158,194 | Quarterly | 3.55 | 3.55 | |||||||||||||||||||||||||||||||||||||||||||||||||||||||||||||||||||||||
Obligations with the public | ||||||||||||||||||||||||||||||||||||||||||||||||||||||||||||||||||||||||||||||||||||
0-E | BANK OF NEWYORK | U.S.A. | US $ | — | 36,250 | 72,500 | 518,125 | — | 626,875 | 500,000 | At Expiration | 7.77 | 7.25 | |||||||||||||||||||||||||||||||||||||||||||||||||||||||||||||||||||||||
Guaranteed obligations | ||||||||||||||||||||||||||||||||||||||||||||||||||||||||||||||||||||||||||||||||||||
0-E | CREDIT AGRICOLE | France | US $ | 11,728 | 30,916 | 65,008 | 33,062 | 3,760 | 144,474 | 138,417 | Quarterly | 2.21 | 1.81 | |||||||||||||||||||||||||||||||||||||||||||||||||||||||||||||||||||||||
0-E | BNP PARIBAS | U.S.A. | US $ | 13,805 | 56,324 | 142,178 | 141,965 | 376,894 | 731,166 | 628,118 | Quarterly | 2.97 | 2.96 | |||||||||||||||||||||||||||||||||||||||||||||||||||||||||||||||||||||||
0-E | WELLS FARGO | U.S.A. | US $ | 35,896 | 107,830 | 287,878 | 288,338 | 411,076 | 1,131,018 | 1,056,345 | Quarterly | 2.37 | 1.68 | |||||||||||||||||||||||||||||||||||||||||||||||||||||||||||||||||||||||
0-E | WILMINGTON TRUST COMPANY | U.S.A. | US $ | 25,833 | 79,043 | 206,952 | 200,674 | 733,080 | 1,245,582 | 967,336 | Quarterly | 4.25 | 4.25 | |||||||||||||||||||||||||||||||||||||||||||||||||||||||||||||||||||||||
0-E | CITIBANK | U.S.A. | US $ | 20,224 | 61,020 | 164,077 | 166,165 | 184,053 | 595,539 | 548,168 | Quarterly | 2.72 | 1.96 | |||||||||||||||||||||||||||||||||||||||||||||||||||||||||||||||||||||||
97.036.000-K | SANTANDER | Chile | US $ | 5,857 | 17,697 | 47,519 | 48,024 | 26,448 | 145,545 | 138,574 | Quarterly | 1.98 | 1.44 | |||||||||||||||||||||||||||||||||||||||||||||||||||||||||||||||||||||||
0-E | BTMU | U.S.A. | US $ | 3,163 | 9,568 | 25,752 | 26,117 | 27,270 | 91,870 | 85,990 | Quarterly | 2.31 | 1.72 | |||||||||||||||||||||||||||||||||||||||||||||||||||||||||||||||||||||||
0-E | APPLE BANK | U.S.A. | US $ | 1,551 | 4,712 | 12,693 | 12,891 | 13,857 | 45,704 | 42,754 | Quarterly | 2.29 | 1.69 | |||||||||||||||||||||||||||||||||||||||||||||||||||||||||||||||||||||||
0-E | US BANK | U.S.A. | US $ | 18,563 | 55,592 | 147,357 | 146,045 | 230,747 | 598,304 | 532,608 | Quarterly | 3.99 | 2.81 | |||||||||||||||||||||||||||||||||||||||||||||||||||||||||||||||||||||||
0-E | DEUTSCHE BANK | U.S.A. | US $ | 6,147 | 18,599 | 31,640 | 31,833 | 48,197 | 136,416 | 117,263 | Quarterly | 3.86 | 3.86 | |||||||||||||||||||||||||||||||||||||||||||||||||||||||||||||||||||||||
0-E | NATIXIS | France | US $ | 14,779 | 44,826 | 116,809 | 96,087 | 206,036 | 478,537 | 422,851 | Quarterly | 2.60 | 2.57 | |||||||||||||||||||||||||||||||||||||||||||||||||||||||||||||||||||||||
0-E | PK AirFinance | U.S.A. | US $ | 2,265 | 6,980 | 19,836 | 25,610 | 3,153 | 57,844 | 54,787 | Monthly | 2.40 | 2.40 | |||||||||||||||||||||||||||||||||||||||||||||||||||||||||||||||||||||||
0-E | KFWIP EX-BANK | Germany | US $ | 2,503 | 7,587 | 18,772 | 9,178 | — | 38,040 | 36,191 | Quarterly | 2.55 | 2.55 | |||||||||||||||||||||||||||||||||||||||||||||||||||||||||||||||||||||||
0-E | AIRBUS FINANCIAL | U.S.A. | US $ | 1,982 | 5,972 | 16,056 | 7,766 | — | 31,776 | 30,199 | Monthly | 2.49 | 2.49 | |||||||||||||||||||||||||||||||||||||||||||||||||||||||||||||||||||||||
0-E | INVESTEC | England | US $ | 1,880 | 10,703 | 25,369 | 25,569 | 23,880 | 87,401 | 72,202 | Semiannual | 5.67 | 5.67 | |||||||||||||||||||||||||||||||||||||||||||||||||||||||||||||||||||||||
Other guaranteed obligations | ||||||||||||||||||||||||||||||||||||||||||||||||||||||||||||||||||||||||||||||||||||
0-E | CREDITAGRICOLE | France | US $ | 1,501 | 4,892 | 268,922 | — | — | 275,315 | 256,860 | At Expiration | 2.85 | 2.85 | |||||||||||||||||||||||||||||||||||||||||||||||||||||||||||||||||||||||
Financial leases | ||||||||||||||||||||||||||||||||||||||||||||||||||||||||||||||||||||||||||||||||||||
0-E | ING | U.S.A. | US $ | 5,889 | 17,671 | 34,067 | 12,134 | — | 69,761 | 63,698 | Quarterly | 5.62 | 4.96 | |||||||||||||||||||||||||||||||||||||||||||||||||||||||||||||||||||||||
0-E | CREDITAGRICOLE | France | US $ | 1,788 | 5,457 | — | — | — | 7,245 | 7,157 | Quarterly | 1.85 | 1.85 | |||||||||||||||||||||||||||||||||||||||||||||||||||||||||||||||||||||||
0-E | CITIBANK | U.S.A. | US $ | 6,083 | 18,250 | 48,667 | 14,262 | — | 87,262 | 78,249 | Quarterly | 6.40 | 5.67 | |||||||||||||||||||||||||||||||||||||||||||||||||||||||||||||||||||||||
0-E | PEFCO | U.S.A. | US $ | 17,558 | 50,593 | 67,095 | 3,899 | — | 139,145 | 130,811 | Quarterly | 5.39 | 4.79 | |||||||||||||||||||||||||||||||||||||||||||||||||||||||||||||||||||||||
0-E | BNP PARIBAS | U.S.A. | US $ | 13,744 | 41,508 | 79,165 | 22,474 | — | 156,891 | 149,119 | Quarterly | 3.69 | 3.26 | |||||||||||||||||||||||||||||||||||||||||||||||||||||||||||||||||||||||
0-E | WELLS FARGO | U.S.A. | US $ | 5,591 | 16,751 | 44,615 | 44,514 | 1,880 | 113,351 | 103,326 | Quarterly | 3.98 | 3.54 | |||||||||||||||||||||||||||||||||||||||||||||||||||||||||||||||||||||||
0-E | DVB BANK S E | U.S.A. | US $ | 4,773 | 9,541 | — | — | — | 14,314 | 14,127 | Quarterly | 2.57 | 2.57 | |||||||||||||||||||||||||||||||||||||||||||||||||||||||||||||||||||||||
0-E | RRP F ENGINE | England | US $ | — | — | 8,248 | 8,248 | 12,716 | 29,212 | 25,274 | Monthly | 2.35 | 2.35 | |||||||||||||||||||||||||||||||||||||||||||||||||||||||||||||||||||||||
Other loans | ||||||||||||||||||||||||||||||||||||||||||||||||||||||||||||||||||||||||||||||||||||
0-E | BOEING | U.S.A. | US $ | 163 | 320 | 26,214 | — | — | 26,697 | 26,214 | At Expiration | 2.35 | 2.35 | |||||||||||||||||||||||||||||||||||||||||||||||||||||||||||||||||||||||
0-E | CITIBANK (*) | U.S.A. | US $ | 25,802 | 77,795 | 207,001 | 103,341 | — | 413,939 | 370,389 | Quarterly | 6.00 | 6.00 | |||||||||||||||||||||||||||||||||||||||||||||||||||||||||||||||||||||||
Hedging derivatives | ||||||||||||||||||||||||||||||||||||||||||||||||||||||||||||||||||||||||||||||||||||
- | OTHERS | — | US $ | 7,364 | 15,479 | 7,846 | — | — | 30,689 | — | — | — | — | |||||||||||||||||||||||||||||||||||||||||||||||||||||||||||||||||||||||
| — | — | — | — | 231,533 | At expiration | 1.63 | % | 230,000 | 1.63 | % |
|
|
|
|
|
|
| |||||||||||||||||||||||||||||||||||||||||||||||||||||||||||||||||||
| 40,188 | — | — | — | 40,188 | At expiration | 1.06 | % | 40,000 | 1.06 | % | Total | 508,683 | 944,749 | 2,476,840 | 2,002,850 | 2,303,047 | 8,236,169 | 7,257,368 | ||||||||||||||||||||||||||||||||||||||||||||||||||||||||||||||||||
| — | — | — | — | 100,934 | At expiration | 1.87 | % | 100,000 | 1.87 | % |
|
|
|
|
|
|
| |||||||||||||||||||||||||||||||||||||||||||||||||||||||||||||||||||
Bank loans | 789 | 115,051 | — | — | 116,717 | At expiration | 3.19 | % | 115,051 | 3.19 | % | |||||||||||||||||||||||||||||||||||||||||||||||||||||||||||||||||||||||||
| 55,465 | 139,603 | 84,505 | — | 298,574 | Quarterly | 4.85 | % | 268,460 | 4.85 | % | ||||||||||||||||||||||||||||||||||||||||||||||||||||||||||||||||||||||||||
| 15,861 | — | — | — | 16,646 | Monthly | 20.75 | % | 15,335 | 20.75 | % | ||||||||||||||||||||||||||||||||||||||||||||||||||||||||||||||||||||||||||
| 30,029 | — | — | — | 31,697 | Monthly | 23.78 | % | 27,603 | 23.78 | % | ||||||||||||||||||||||||||||||||||||||||||||||||||||||||||||||||||||||||||
Guaranteed obligations | 12,065 | 32,213 | 32,203 | 28,234 | 108,746 | Quarterly | 5.69 | % | 91,543 | 5.01 | % | |||||||||||||||||||||||||||||||||||||||||||||||||||||||||||||||||||||||||
| 35,886 | 83,920 | 10,139 | — | 141,807 | Quarterly | 1.99 | % | 140,312 | 1.99 | % | ||||||||||||||||||||||||||||||||||||||||||||||||||||||||||||||||||||||||||
| 6,839 | — | — | — | 9,119 | Quarterly | 3.06 | % | 8,964 | 2.73 | % | ||||||||||||||||||||||||||||||||||||||||||||||||||||||||||||||||||||||||||
| 34,296 | 93,368 | 96,444 | 237,865 | 473,298 | Quarterly | 2.45 | % | 418,254 | 2.31 | % | ||||||||||||||||||||||||||||||||||||||||||||||||||||||||||||||||||||||||||
| 165,469 | 439,680 | 437,387 | 1,205,577 | 2,303,348 | Quarterly | 2.47 | % | 2,099,776 | 1.76 | % | ||||||||||||||||||||||||||||||||||||||||||||||||||||||||||||||||||||||||||
| 34,748 | 93,687 | 95,226 | 168,917 | 404,118 | Quarterly | 2.64 | % | 372,191 | 2.04 | % | ||||||||||||||||||||||||||||||||||||||||||||||||||||||||||||||||||||||||||
| 16,374 | 44,359 | 45,459 | 96,694 | 208,306 | Quarterly | 1.32 | % | 200,599 | 0.78 | % | ||||||||||||||||||||||||||||||||||||||||||||||||||||||||||||||||||||||||||
| 8,741 | 23,742 | 24,417 | 65,005 | 124,796 | Quarterly | 1.64 | % | 118,070 | 1.04 | % | ||||||||||||||||||||||||||||||||||||||||||||||||||||||||||||||||||||||||||
| 4,292 | 11,671 | 12,017 | 32,461 | 61,859 | Quarterly | 1.63 | % | 58,502 | 1.04 | % | ||||||||||||||||||||||||||||||||||||||||||||||||||||||||||||||||||||||||||
| 56,022 | 148,643 | 147,528 | 449,705 | 820,597 | Quarterly | 2.81 | % | 703,992 | 2.81 | % | ||||||||||||||||||||||||||||||||||||||||||||||||||||||||||||||||||||||||||
| 17,500 | 47,175 | 39,021 | 93,773 | 203,229 | Quarterly | 3.27 | % | 173,036 | 3.27 | % | ||||||||||||||||||||||||||||||||||||||||||||||||||||||||||||||||||||||||||
Other guaranteed obligations | 24,564 | 65,726 | — | — | 98,468 | Quarterly | 1.99 | % | 95,292 | 1.99 | % | |||||||||||||||||||||||||||||||||||||||||||||||||||||||||||||||||||||||||
Financial leases | 15,205 | 39,703 | 9,324 | — | 69,260 | Quarterly | 3.23 | % | 65,076 | 3.03 | % | |||||||||||||||||||||||||||||||||||||||||||||||||||||||||||||||||||||||||
| 14,599 | 31,434 | 24,647 | 17,415 | 93,181 | Quarterly | 1.21 | % | 89,514 | 1.21 | % | ||||||||||||||||||||||||||||||||||||||||||||||||||||||||||||||||||||||||||
| 6,028 | 16,075 | 16,075 | 8,038 | 48,225 | Quarterly | 6.38 | % | 40,564 | 5.65 | % | ||||||||||||||||||||||||||||||||||||||||||||||||||||||||||||||||||||||||||
| 52,678 | 140,462 | 115,934 | 23,211 | 349,851 | Quarterly | 5.35 | % | 308,774 | 4.23 | % | ||||||||||||||||||||||||||||||||||||||||||||||||||||||||||||||||||||||||||
| 24,056 | 64,890 | 59,475 | 7,139 | 163,544 | Quarterly | 4.65 | % | 147,334 | 4.15 | % | ||||||||||||||||||||||||||||||||||||||||||||||||||||||||||||||||||||||||||
| 2,099 | 5,628 | — | — | 8,430 | Monthly | 1.43 | % | 7,899 | 1.43 | % | ||||||||||||||||||||||||||||||||||||||||||||||||||||||||||||||||||||||||||
Other loans | 2,804 | 172,128 | — | — | 174,932 | At expiration | 1.75 | % | 170,838 | 1.75 | % | |||||||||||||||||||||||||||||||||||||||||||||||||||||||||||||||||||||||||
| 20,100 | 131,865 | 209,810 | 209,684 | 581,209 | Quarterly | 6.00 | % | 450,000 | 6.00 | % | ||||||||||||||||||||||||||||||||||||||||||||||||||||||||||||||||||||||||||
Hedging derivatives | 30,495 | 59,829 | 16,561 | 614 | 118,504 | — | — | 112,819 | — | |||||||||||||||||||||||||||||||||||||||||||||||||||||||||||||||||||||||||||
Non-hedging derivatives | 3,203 | 1,618 | — | — | 5,941 | — | — | 5,562 | — | |||||||||||||||||||||||||||||||||||||||||||||||||||||||||||||||||||||||||||
|
|
|
|
|
| |||||||||||||||||||||||||||||||||||||||||||||||||||||||||||||||||||||||||||||||
| 760,495 | 2,002,470 | 1,476,172 | 2,644,332 | 7,437,157 | 6,705,360 | |||||||||||||||||||||||||||||||||||||||||||||||||||||||||||||||||||||||||||||||
|
|
|
|
|
| |||||||||||||||||||||||||||||||||||||||||||||||||||||||||||||||||||||||||||||||
| (*) | Securitized bond with the future flows from the sales with credit card in United States and Canada. |
Class of liability for the analysis of liquidity risk ordered by date of maturity as of December 31, 20132016
Debtor: TAMS .A. and Subsidiaries, Tax No. 02.012.862/ 0001-60, Brazil.
|
|
|
| |||||||||||||||
|
|
| ||||||||||||||||
|
| |||||||||||||||||
|
| |||||||||||||||||
|
| |||||||||||||||||
|
| |||||||||||||||||
|
| |||||||||||||||||
|
| |||||||||||||||||
|
| |||||||||||||||||
|
|
| ||||||||||||||||
|
|
| ||||||||||||||||
|
| |||||||||||||||||
|
| |||||||||||||||||
|
| |||||||||||||||||
|
| |||||||||||||||||
|
| |||||||||||||||||
|
| |||||||||||||||||
|
| |||||||||||||||||
|
| |||||||||||||||||
|
| |||||||||||||||||
|
| |||||||||||||||||
|
| |||||||||||||||||
|
| |||||||||||||||||
|
| |||||||||||||||||
|
| |||||||||||||||||
|
| |||||||||||||||||
|
| |||||||||||||||||
|
| |||||||||||||||||
|
| |||||||||||||||||
|
| |||||||||||||||||
|
| |||||||||||||||||
|
| |||||||||||||||||
|
| |||||||||||||||||
|
| |||||||||||||||||
|
|
| ||||||||||||||||
|
| |||||||||||||||||
|
| |||||||||||||||||
|
| |||||||||||||||||
| ||||||||||||||||||
Class of Liability | More than 90 days to one year | More than one to three years | More than three to five years | More than five years | Total | Amortization | Effective rate | Total Nominal rate | Nominal rate | |||||||||||||||||||||||||||||||||||||||||||||||||||||||||||||||||||||||||||||
| Tax No. | Creditor | Creditor country | Currency | Up to 90 days | More than 90 days to one year | More than one to three years | More than three to five years | More than five years | Total | Nominal value | Amortization | Effective rate | Nominal rate | |||||||||||||||||||||||||||||||||||||||||||||||||||||||||||||||||||||||||
| ThUS$ | ThUS$ | ThUS$ | ThUS$ | ThUS$ | % | ThUS$ | ThUS$ | ThUS$ | ThUS$ | ThUS$ | ThUS$ | ThUS$ | ThUS$ | % | % | |||||||||||||||||||||||||||||||||||||||||||||||||||||||||||||||||||||||
Bank loans | 44,071 | — | — | — | 46,481 | At Expiration | 3.76 | % | 43,885 | 3.20 | % | Bank loans |
| |||||||||||||||||||||||||||||||||||||||||||||||||||||||||||||||||||||||||
0-E | NEDERLANDSCHE | |||||||||||||||||||||||||||||||||||||||||||||||||||||||||||||||||||||||||||||||||||||
| | CREDIETVERZEKERING MAATS CHAPPIJ | | Holland | US $ | 179 | 493 | 1,315 | 1,314 | 54 | 3,355 | 2,882 | Monthly | 6.01 | 6.01 | ||||||||||||||||||||||||||||||||||||||||||||||||||||||||||||||||||||||||
0-E | CITIBANK | U.S .A. | US $ | 1,528 | 203,150 | — | — | — | 204,678 | 200,000 | At Expiration | 3.39 | 3.14 | |||||||||||||||||||||||||||||||||||||||||||||||||||||||||||||||||||||||||
Obligation with the public | Obligation with the public |
| ||||||||||||||||||||||||||||||||||||||||||||||||||||||||||||||||||||||||||||||||||||
0-E | | THE BANK OF NEWYORK | | U.S .A. | US $ | — | 352,938 | 83,750 | 562,813 | — | 999,501 | 800,000 | At Expiration | 8.17 | 8.00 | |||||||||||||||||||||||||||||||||||||||||||||||||||||||||||||||||||||||
Financial leases | Financial leases |
| ||||||||||||||||||||||||||||||||||||||||||||||||||||||||||||||||||||||||||||||||||||
0-E | | AFS INVESTMENT IX LLC | | U.S.A. | US $ | 2,733 | 7,698 | 20,522 | 8,548 | — | 39,501 | 35,448 | Monthly | 1.25 | 1.25 | |||||||||||||||||||||||||||||||||||||||||||||||||||||||||||||||||||||||
0-E | DVB BANK SE | U.S .A. | US $ | 120 | 165 | — | — | — | 285 | 282 | Monthly | 2.50 | 2.50 | |||||||||||||||||||||||||||||||||||||||||||||||||||||||||||||||||||||||||
0-E | | GENERALELECTRIC CAPITAL | | |||||||||||||||||||||||||||||||||||||||||||||||||||||||||||||||||||||||||||||||||||
| CORPORATION | U.S .A. | US $ | 3,852 | 5,098 | — | — | — | 8,950 | 8,846 | Monthly | 2.30 | 2.30 | ||||||||||||||||||||||||||||||||||||||||||||||||||||||||||||||||||||||||||
0-E | KFWIP EX-BANK | Germany | US $ | 592 | 1,552 | — | — | — | 2,144 | 2,123 | Monthly/Quarterly | 2.80 | 2.80 | |||||||||||||||||||||||||||||||||||||||||||||||||||||||||||||||||||||||||
0-E | NATIXIS | France | US $ | 4,290 | 7,837 | 22,834 | 40,968 | 41,834 | 117,763 | 107,443 | Quarterly/Semiannual | 4.90 | 4.90 | |||||||||||||||||||||||||||||||||||||||||||||||||||||||||||||||||||||||||
0-E | WACAPOULEASINGS.A. | Luxemburg | US $ | 833 | 2,385 | 6,457 | 6,542 | — | 16,217 | 14,754 | Quarterly | 3.00 | 3.00 | |||||||||||||||||||||||||||||||||||||||||||||||||||||||||||||||||||||||||
0-E | | SOCIÉTÉGÉNÉRALE MILAN BRANCH | | Italy | US $ | 11,875 | 32,116 | 85,995 | 171,553 | — | 301,539 | 279,335 | Quarterly | 4.18 | 4.11 | |||||||||||||||||||||||||||||||||||||||||||||||||||||||||||||||||||||||
0-E | BANCO IBMS .A | Brazil | BRL | 380 | 1,161 | 35 | — | — | 1,576 | 1,031 | Monthly | 13.63 | 13.63 | |||||||||||||||||||||||||||||||||||||||||||||||||||||||||||||||||||||||||
0-E | | HP FINANCIAL SERVICE |
| Brazil | BRL | 225 | — | — | — | — | 225 | 222 | Monthly | 10.02 | 10.02 | |||||||||||||||||||||||||||||||||||||||||||||||||||||||||||||||||||||||
0-E | SOCIÉTÉGÉNÉRALE | France | BRL | 146 | 465 | 176 | — | — | 787 | 519 | Monthly | 13.63 | 13.63 | |||||||||||||||||||||||||||||||||||||||||||||||||||||||||||||||||||||||||
| 135,450 | — | — | — | 145,253 | At Expiration | 5.20 | % | 137,849 | 4.66 | % |
|
|
|
|
|
|
| |||||||||||||||||||||||||||||||||||||||||||||||||||||||||||||||||||||
| 50,737 | — | — | — | 79,879 | At Expiration | 6.31 | % | 73,830 | 4.73 | % | Total | 26,753 | 615,058 | 221,084 | 791,738 | 41,888 | 1,696,521 | 1,452,885 | ||||||||||||||||||||||||||||||||||||||||||||||||||||||||||||||||||||
| 22,986 | — | — | — | 66,197 | At Expiration | 3.73 | % | 62,357 | 2.94 | % |
|
|
|
|
|
|
| |||||||||||||||||||||||||||||||||||||||||||||||||||||||||||||||||||||
| 447 | 52 | — | — | 699 | Monthly | 7.42 | % | 684 | 7.42 | % | ||||||||||||||||||||||||||||||||||||||||||||||||||||||||||||||||||||||||||||
| 50,686 | — | — | — | 130,681 | At Expiration | 3.87 | % | 122,341 | 3.29 | % | ||||||||||||||||||||||||||||||||||||||||||||||||||||||||||||||||||||||||||||
| 44,986 | — | — | — | 44,986 | At Expiration | 10.63 | % | 42,688 | 10.15 | % | ||||||||||||||||||||||||||||||||||||||||||||||||||||||||||||||||||||||||||||
| 495 | 1,320 | 1,320 | 2,035 | 5,356 | Monthly | 6.01 | % | 4,215 | 6.01 | % | ||||||||||||||||||||||||||||||||||||||||||||||||||||||||||||||||||||||||||||
Obligation with the public | 80,251 | 190,343 | 457,367 | 953,212 | 1,715,183 | At Expiration | 8.60 | % | 1,100,000 | 8.41 | % | |||||||||||||||||||||||||||||||||||||||||||||||||||||||||||||||||||||||||||
Financial leases | 7,728 | 20,609 | 20,609 | 18,892 | 70,688 | Monthly | 1.25 | % | 58,321 | 1.25 | % | |||||||||||||||||||||||||||||||||||||||||||||||||||||||||||||||||||||||||||
| 1,645 | — | — | — | 2,970 | Monthly | 0.00 | % | 2,970 | 0.00 | % | ||||||||||||||||||||||||||||||||||||||||||||||||||||||||||||||||||||||||||||
| 10,405 | 28,944 | 21,867 | 15,758 | 80,520 | Monthly | 1.42 | % | 75,352 | 1.42 | % | ||||||||||||||||||||||||||||||||||||||||||||||||||||||||||||||||||||||||||||
| 4,432 | — | — | — | 10,083 | Monthly | 0.00 | % | 5,651 | 0.00 | % | ||||||||||||||||||||||||||||||||||||||||||||||||||||||||||||||||||||||||||||
| 2,008 | 5,705 | 6,283 | 8,648 | 23,366 | Quarterly | 1.00 | % | 22,082 | 1.00 | % | ||||||||||||||||||||||||||||||||||||||||||||||||||||||||||||||||||||||||||||
| 2,397 | 6,387 | 6,394 | 10,385 | 26,435 | Quarterly | 0.86 | % | 22,359 | 0.75 | % | ||||||||||||||||||||||||||||||||||||||||||||||||||||||||||||||||||||||||||||
| 20,021 | 48,442 | 50,209 | 109,870 | 235,601 | Quarterly | 1.03 | % | 222,590 | 0.90 | % | ||||||||||||||||||||||||||||||||||||||||||||||||||||||||||||||||||||||||||||
| 14,177 | 57,595 | 12,297 | 14,308 | 103,348 | Quarterly | 1.40 | % | 97,945 | 1.40 | % | ||||||||||||||||||||||||||||||||||||||||||||||||||||||||||||||||||||||||||||
| 26,771 | 61,037 | 51,629 | 53,270 | 201,541 | Semiannual/ Quarterly | 0.75 | % | 195,396 | 0.65 | % | ||||||||||||||||||||||||||||||||||||||||||||||||||||||||||||||||||||||||||||
| 9,812 | 12,717 | — | — | 25,915 | Quarterly | 2.50 | % | 25,000 | 2.50 | % | ||||||||||||||||||||||||||||||||||||||||||||||||||||||||||||||||||||||||||||
| 621 | 1,243 | 284 | — | 2,362 | Monthly | 1.75 | % | 2,279 | 1.75 | % | ||||||||||||||||||||||||||||||||||||||||||||||||||||||||||||||||||||||||||||
| 48,803 | — | — | — | 52,512 | Monthly | 1.25 | % | 51,978 | 1.25 | % | ||||||||||||||||||||||||||||||||||||||||||||||||||||||||||||||||||||||||||||
| 4,480 | 12,148 | 12,461 | 37,705 | 68,405 | Quarterly | 1.45 | % | 64,296 | 1.25 | % | ||||||||||||||||||||||||||||||||||||||||||||||||||||||||||||||||||||||||||||
| 13,067 | 30,880 | 21,672 | 18,232 | 88,314 | Monthly/ Quarterly | 1.74 | % | 82,718 | 1.74 | % | ||||||||||||||||||||||||||||||||||||||||||||||||||||||||||||||||||||||||||||
| 20,117 | 58,917 | 62,444 | 124,621 | 275,718 | Quarterly/ Semiannual | 2.81 | % | 246,128 | 2.78 | % | ||||||||||||||||||||||||||||||||||||||||||||||||||||||||||||||||||||||||||||
| 10,137 | 43,583 | 19,001 | 38,965 | 115,177 | Monthly | 1.71 | % | 106,403 | 1.71 | % | ||||||||||||||||||||||||||||||||||||||||||||||||||||||||||||||||||||||||||||
| 1,679 | 3,943 | 3,209 | 14,585 | 24,048 | Quarterly | 2.00 | % | 21,737 | 2.00 | % | ||||||||||||||||||||||||||||||||||||||||||||||||||||||||||||||||||||||||||||
| 1,427 | — | — | — | 3,208 | Monthly | 1.25 | % | 3,194 | 1.25 | % | ||||||||||||||||||||||||||||||||||||||||||||||||||||||||||||||||||||||||||||
| 39,557 | 96,309 | 102,366 | 105,460 | 357,805 | Quarterly | 3.86 | % | 334,095 | 3.78 | % | ||||||||||||||||||||||||||||||||||||||||||||||||||||||||||||||||||||||||||||
| 1,673 | 4,534 | 4,645 | 6,619 | 18,051 | Quarterly | 0.57 | % | 17,394 | 0.57 | % | ||||||||||||||||||||||||||||||||||||||||||||||||||||||||||||||||||||||||||||
| 676 | — | — | — | 900 | Monthly | 10.38 | % | 963 | 10.38 | % | ||||||||||||||||||||||||||||||||||||||||||||||||||||||||||||||||||||||||||||
| 205 | 630 | 306 | — | 1,325 | Monthly | 10.58 | % | 1,050 | 10.58 | % | ||||||||||||||||||||||||||||||||||||||||||||||||||||||||||||||||||||||||||||
| 960 | 2,507 | 313 | — | 4,156 | Monthly | 9.90 | % | 3,559 | 9.90 | % | ||||||||||||||||||||||||||||||||||||||||||||||||||||||||||||||||||||||||||||
| 1,258 | — | — | — | 2,105 | Monthly | 6.82 | % | 1,379 | 6.82 | % | ||||||||||||||||||||||||||||||||||||||||||||||||||||||||||||||||||||||||||||
Other loans | 537 | — | — | — | 27,781 | Monthly | 2.38 | % | 27,781 | 2.38 | % | |||||||||||||||||||||||||||||||||||||||||||||||||||||||||||||||||||||||||||
| 14,824 | 42,581 | 54,715 | 198,408 | 315,731 | Monthly | 8.99 | % | 138,516 | 8.99 | % | ||||||||||||||||||||||||||||||||||||||||||||||||||||||||||||||||||||||||||||
| 54 | 162 | 192 | 792 | 1,217 | Monthly | 8.99 | % | 534 | 8.99 | % | ||||||||||||||||||||||||||||||||||||||||||||||||||||||||||||||||||||||||||||
| 1,156 | — | — | — | 1,652 | — | — | 1,652 | — | ||||||||||||||||||||||||||||||||||||||||||||||||||||||||||||||||||||||||||||||
|
|
|
|
|
| |||||||||||||||||||||||||||||||||||||||||||||||||||||||||||||||||||||||||||||||||
| 690,736 | 730,588 | 909,583 | 1,731,765 | 4,375,649 | 3,421,171 | |||||||||||||||||||||||||||||||||||||||||||||||||||||||||||||||||||||||||||||||||
|
|
|
|
|
| |||||||||||||||||||||||||||||||||||||||||||||||||||||||||||||||||||||||||||||||||
Class of liability for the analysis of liquidity risk ordered by date of maturity as of December 31, 20132016
Debtor: LATAM Airlines Group S.A. and Subsidiaries , Tax No .89.862.200-2, Chile.
|
|
|
| |||||||||||||||||
|
| |||||||||||||||||||
| ||||||||||||||||||||
| ||||||||||||||||||||
| ||||||||||||||||||||
| ||||||||||||||||||||
|
| |||||||||||||||||||
|
|
|
| |||||||||||||||||
| ||||||||||||||||||||
Class of Liability | More than 90 days to one year | More than one to three years | More than three to five years | More than five years | Total | Amortization | Effective rate | Nominal value | Nominal rate | |||||||||||||||||||||||
| ThUS$ | ThUS$ | ThUS$ | ThUS$ | ThUS$ | % | ThUS$ | % | |||||||||||||||||||||||||
Trade and other accounts payable | 7,245 | — | — | — | 821,599 | — | — | 821,599 | — | |||||||||||||||||||||||
| 3,318 | — | — | — | 4,422 | Quarterly | 2.01% | 4,141 | 2.01 | % | |||||||||||||||||||||||
| 6 | — | — | — | 16,370 | — | — | 16,370 | — | ||||||||||||||||||||||||
| 8 | — | — | — | 207,766 | — | — | 207,766 | — | ||||||||||||||||||||||||
| 615 | — | — | — | 214,519 | — | — | 214,519 | — | ||||||||||||||||||||||||
Accounts payable, non-current | — | 11,557 | — | — | 11,557 | Quarterly | 2.01% | 11,400 | 2.01 | % | ||||||||||||||||||||||
Accounts payable to related parties currents | — | — | — | — | 187 | — | — | 187 | — | |||||||||||||||||||||||
| — | — | — | — | 14 | — | — | 14 | — | ||||||||||||||||||||||||
| — | — | — | — | 304 | — | — | 304 | — | ||||||||||||||||||||||||
|
|
|
|
|
|
|
|
|
|
|
| |||||||||||||||||||||
| 11,192 | 11,557 | — | — | 1,276,738 | 1,276,300 | |||||||||||||||||||||||||||
|
|
|
|
|
|
|
|
|
|
|
| |||||||||||||||||||||
| 1,462,423 | 2,744,615 | 2,385,755 | 4,376,097 | 13,089,544 | 11,402,831 | |||||||||||||||||||||||||||
|
|
|
|
|
|
|
|
|
|
|
| |||||||||||||||||||||
| Tax No . | Creditor | Creditor country | Currency | Up to 90 days | More than 90 days to one year | More than one to three years | More than three to five years | More than five years | Total | Nominal value | Amortization | Effective rate | Nominal rate | |||||||||||||||||||||||||||||||||||||||
| ThUS$ | ThUS$ | ThUS$ | ThUS$ | ThUS$ | ThUS$ | ThUS$ | % | % | ||||||||||||||||||||||||||||||||||||||||||||
Trade and other accounts payables |
| |||||||||||||||||||||||||||||||||||||||||||||||||||
— | OTHERS | OTHERS | US$ | 549,897 | 21,215 | — | — | — | 571,112 | 571,112 | — | — | — | |||||||||||||||||||||||||||||||||||||||
| CLP | 48,842 | (30 | ) | — | — | — | 48,812 | 48,812 | — | — | — | |||||||||||||||||||||||||||||||||||||||||
| BRL | 346 ,037 | 27 | — | — | — | 346,064 | 346,064 | — | — | — | ||||||||||||||||||||||||||||||||||||||||||
| Other currencies | 140 ,471 | 11,467 | — | — | — | 151,938 | 151,938 | — | — | — | ||||||||||||||||||||||||||||||||||||||||||
Accounts payable to related parties currents |
| |||||||||||||||||||||||||||||||||||||||||||||||||||
0-E | | Consultoría Administrativa Profesional S.A. de C.V. | | Mexico | MXN | 170 | — | — | — | — | 170 | 170 | — | — | — | |||||||||||||||||||||||||||||||||||||
78.997.060-2 | | Viajes Falabella Ltda. | | Chile | CLP | 46 | — | — | — | — | 46 | 46 | — | — | — | |||||||||||||||||||||||||||||||||||||
0 -E | | TAM Aviação Executiva e Taxi Aéreo S.A. | | Brazil | BRL | 28 | — | — | — | — | 28 | 28 | — | — | — | |||||||||||||||||||||||||||||||||||||
65.216.000K | | Comunidad Mujer | | Chile | CLP | 13 | — | — | — | — | 13 | 13 | — | — | — | |||||||||||||||||||||||||||||||||||||
78.591.3701 | | Bethia S.A. y Filiales | | Chile | CLP | 6 | — | — | — | — | 6 | 6 | — | — | — | |||||||||||||||||||||||||||||||||||||
79.773.4403 | | Trans portes San Felipe S:A. | | Chile | CLP | 4 | — | — | — | — | 4 | 4 | — | — | — | |||||||||||||||||||||||||||||||||||||
0 -E | | Inversora Aeronáutica Argentina | | Argentina | US$ | 2 | — | — | — | — | 2 | 2 | — | — | — | |||||||||||||||||||||||||||||||||||||
|
|
|
|
|
|
|
|
|
|
|
|
|
| |||||||||||||||||||||||||||||||||||||||
| Total | 1,085,516 | 32,679 | — | — | — | 1,118,195 | 1,118,195 | |||||||||||||||||||||||||||||||||||||||||||||
|
|
|
|
|
|
|
|
|
|
|
|
|
| |||||||||||||||||||||||||||||||||||||||
| Total consolidated | 1,620,952 | 1,592,486 | 2,697,924 | 2,794,588 | 2,344,935 | 11,050,885 | 9,828,448 | |||||||||||||||||||||||||||||||||||||||||||||
|
|
|
|
|
|
|
|
|
|
|
|
|
| |||||||||||||||||||||||||||||||||||||||
Class of liability for the analysis of liquidity risk ordered by date of maturity as of December 31, 20122015
Debtor: LATAM Airlines Group S.A. and Subsidiaries , Tax No . 89 .862.200 -2 Chile.
| Tax No . | Creditor | Creditor country | Currency | Up to 90 days | More than 90 days to one year | More than one to three years | More than three to five years | More than five years | Total | Nominal value | Amortization | Effective rate | Nominal rate | |||||||||||||||||||||||||||||||||||||||
| ThUS$ | ThUS$ | ThUS$ | ThUS$ | ThUS$ | ThUS$ | ThUS$ | % | % | ||||||||||||||||||||||||||||||||||||||||||||
Loans to exporters |
| |||||||||||||||||||||||||||||||||||||||||||||||||||
97.032.000-8 | BBVA | Chile | US$ | 100,253 | — | — | — | — | 100,253 | 100,000 | At Expiration | 1.00 | 1.00 | |||||||||||||||||||||||||||||||||||||||
97.036.000-K | SANTANDER | Chile | US$ | 100,363 | — | — | — | — | 100,363 | 100,000 | At Expiration | 1.44 | 1.44 | |||||||||||||||||||||||||||||||||||||||
97.030.000-7 | ESTADO | Chile | US$ | 55,172 | — | — | — | — | 55,172 | 55,000 | At Expiration | 1.05 | 1.05 | |||||||||||||||||||||||||||||||||||||||
97.004.000-5 | | BANCO DE CHILE | | Chile | US$ | 50,059 | — | — | — | — | 50,059 | 50,000 | At Expiration | 1.42 | 1.42 | |||||||||||||||||||||||||||||||||||||
97.003.000-K | | BANCO DO BRASIL | | Chile | US$ | 70,133 | — | — | — | — | 70,133 | 70,000 | At Expiration | 1.18 | 1.18 | |||||||||||||||||||||||||||||||||||||
97.951.000-4 | HSBC | Chile | US$ | 12,020 | — | — | — | — | 12,020 | 12,000 | At Expiration | 0.66 | 0.66 | |||||||||||||||||||||||||||||||||||||||
Bank loans | ||||||||||||||||||||||||||||||||||||||||||||||||||||
97.023.000-9 | CORPBANCA | Chile | UF | 19,873 | 58,407 | 112,252 | 35,9 53 | — | 226,485 | 211,135 | Quarterly | 4.18 | 4.18 | |||||||||||||||||||||||||||||||||||||||
0 -E | | BANCO BLADEX | | U.S.A. | US$ | — | 9,702 | 30,526 | 15,514 | — | 55,742 | 50 ,000 | Semiannual | 4.58 | 4.58 | |||||||||||||||||||||||||||||||||||||
0 -E | | DVB BANKSE | | U.S.A. | US$ | 146 | 430 | 154,061 | — | — | 154,637 | 153,514 | Quarterly | 1.67 | 1.67 | |||||||||||||||||||||||||||||||||||||
97.036.000-K | SANTANDER | Chile | US$ | 1,053 | — | 226,712 | — | — | 227,765 | 226,712 | Quarterly | 2.24 | 2.24 | |||||||||||||||||||||||||||||||||||||||
Obligations with the public |
| |||||||||||||||||||||||||||||||||||||||||||||||||||
0 -E | | BANK OF NEW YORK | | U.S.A. | US$ | — | 36,250 | 72,500 | 554 ,3 75 | — | 663,125 | 500,000 | At Expiration | 7.77 | 7.25 | |||||||||||||||||||||||||||||||||||||
Guaranteed obligations |
| |||||||||||||||||||||||||||||||||||||||||||||||||||
0 -E | | CREDIT AGRICOLE | | Francia | US$ | 31,813 | 92,167 | 210,541 | 55,3 8 1 | 12,677 | 402,579 | 389,027 | Quarterly | 1.83 | 1.66 | |||||||||||||||||||||||||||||||||||||
0 -E | | BNP PARIBAS | | U.S.A. | US$ | 9,899 | 29,975 | 82,094 | 83 ,4 2 7 | 148,904 | 354,299 | 319,397 | Quarterly | 2.29 | 2.22 | |||||||||||||||||||||||||||||||||||||
0 -E | | WELLS FARGO | | U.S.A. | US$ | 35,636 | 106,990 | 285,967 | 286 ,9 59 | 554,616 | 1,270,168 | 1,180,751 | Quarterly | 2.27 | 1.57 | |||||||||||||||||||||||||||||||||||||
0 -E | | WILMINGTON TRUST | | U.S.A. | US$ | 6,110 | 69,232 | 135,334 | 133,363 | 539,019 | 883,058 | 675,696 | Quarterly | 4.25 | 4.25 | |||||||||||||||||||||||||||||||||||||
0 -E | CITIBANK | U.S.A. | US$ | 19,478 | 58,741 | 158,957 | 162,459 | 266,273 | 665,908 | 617,002 | Quarterly | 2.40 | 1.64 | |||||||||||||||||||||||||||||||||||||||
97.036.000-K | SANTANDER | Chile | US$ | 5,585 | 16,848 | 45,653 | 46,740 | 50,124 | 164,950 | 159,669 | Quarterly | 1.47 | 0.93 | |||||||||||||||||||||||||||||||||||||||
0 -E | BTMU | U.S.A. | US$ | 2,992 | 9,035 | 24,541 | 25,214 | 39,930 | 101,712 | 96,954 | Quarterly | 1.82 | 1.22 | |||||||||||||||||||||||||||||||||||||||
0 -E | | APPLE BANK | | U.S.A. | US$ | 1,471 | 4,445 | 12,079 | 12,431 | 20,099 | 50,525 | 48,142 | Quarterly | 1.72 | 1.12 | |||||||||||||||||||||||||||||||||||||
0 -E | US BANK | U.S.A. | US$ | 18,643 | 55,824 | 147,994 | 146,709 | 303,600 | 672,770 | 591,039 | Quarterly | 3.99 | 2.81 | |||||||||||||||||||||||||||||||||||||||
0 -E | | DEUTSCHE BANK | | U.S.A. | US$ | 5,923 | 17,881 | 39,185 | 30,729 | 63,268 | 156,986 | 136,698 | Quarterly | 3.40 | 3.40 | |||||||||||||||||||||||||||||||||||||
0 -E | NATIXIS | France | US$ | 13,740 | 41,730 | 115,026 | 100,617 | 249,194 | 520,307 | 469,423 | Quarterly | 2.08 | 2.05 | |||||||||||||||||||||||||||||||||||||||
0 -E | HSBC | U.S.A. | US$ | 1,590 | 4,790 | 12,908 | 13,112 | 25,175 | 57,575 | 53,583 | Quarterly | 2.40 | 1.59 | |||||||||||||||||||||||||||||||||||||||
0 -E | | PK AirFinance | | U.S.A. | US$ | 2,172 | 6,675 | 18,928 | 20,812 | 18,104 | 66,691 | 62,514 | Monthly | 2.04 | 2.04 | |||||||||||||||||||||||||||||||||||||
0 -E | | KFW IPEX- BANK | Germany | US$ | 728 | 2,232 | 5,684 | 4,131 | 1,6 58 | 14,433 | 13,593 | Quarterly | 2.45 | 2.45 | ||||||||||||||||||||||||||||||||||||||
Other guaranteed obligations |
| |||||||||||||||||||||||||||||||||||||||||||||||||||
0 -E | | DVB BANK SE | | U.S.A. | US$ | 8,225 | 24,695 | — | — | — | 32,920 | 32,492 | Quarterly | 2.32 | 2.32 | |||||||||||||||||||||||||||||||||||||
Financial leases |
| |||||||||||||||||||||||||||||||||||||||||||||||||||
0 -E | ING | U.S.A. | US$ | 9,214 | 26,054 | 41,527 | 28,234 | — | 105,029 | 94,998 | Quarterly | 5.13 | 4.57 | |||||||||||||||||||||||||||||||||||||||
0 -E | | CREDIT AGRICOLE | | France | US$ | 1,711 | 5,236 | 7,216 | — | — | 14,163 | 13,955 | Quarterly | 1.28 | 1.28 | |||||||||||||||||||||||||||||||||||||
0 -E | CITIBANK | U.S.A. | US$ | 6,083 | 18,250 | 48,667 | 3 8,596 | — | 111,596 | 97,383 | Quarterly | 6.40 | 5.67 | |||||||||||||||||||||||||||||||||||||||
0 -E | PEFCO | U.S.A. | US$ | 17,556 | 52,674 | 115,934 | 23,211 | — | 209,375 | 192,914 | Quarterly | 5.37 | 4.77 | |||||||||||||||||||||||||||||||||||||||
0 -E | | BNP PARIBAS | | U.S.A. | US$ | 11,368 | 34,292 | 86,206 | 31,782 | — | 163,648 | 153,107 | Quarterly | 4.08 | 3.64 | |||||||||||||||||||||||||||||||||||||
0 -E | | WELLS FARGO | | U.S.A. | US$ | 5,594 | 16,768 | 44,663 | 44,565 | 24,125 | 135,715 | 121,628 | Quarterly | 3.98 | 3.54 | |||||||||||||||||||||||||||||||||||||
0 -E | DVBBANKSE | U.S.A. | US$ | 4,732 | 14,225 | 14,269 | — | — | 33,226 | 32,567 | Quarterly | 2.06 | 2.06 | |||||||||||||||||||||||||||||||||||||||
0 -E | | BANC OF AMERICA | | U.S.A. | US$ | 703 | 2,756 | — | — | — | 3,459 | 2,770 | Monthly | 1.41 | 1.41 | |||||||||||||||||||||||||||||||||||||
Other loans | ||||||||||||||||||||||||||||||||||||||||||||||||||||
0 -E | BOEING | U.S.A. | US$ | 655 | 533 | 151,362 | — | — | 152,550 | 151,362 | At Expiration | 1.80 | 1.80 | |||||||||||||||||||||||||||||||||||||||
0 -E | | CITIBANK (*) | | U.S.A. | US$ | 25,820 | 77,850 | 207,190 | 206,749 | — | 517,609 | 450,000 | Quarterly | 6.00 | 6.00 | |||||||||||||||||||||||||||||||||||||
Hedging derivatives | ||||||||||||||||||||||||||||||||||||||||||||||||||||
— | OTROS | - | US$ | 12,232 | 33,061 | 40,986 | 3 ,688 | 16 | 89,983 | 85,653 | - | — | — | |||||||||||||||||||||||||||||||||||||||
|
|
|
|
|
|
|
|
|
|
|
|
|
| |||||||||||||||||||||||||||||||||||||||
| Total | 668,745 | 927,748 | 2,648,962 | 2,104,751 | 2,316,782 | 8,666,988 | 7,770,678 | |||||||||||||||||||||||||||||||||||||||||||||
|
|
|
|
|
|
|
|
|
|
|
|
|
| |||||||||||||||||||||||||||||||||||||||
| (*) | ||||||||||||||||||
|
|
| ||||||||||||||||
| ||||||||||||||||||
| ||||||||||||||||||
| ||||||||||||||||||
| ||||||||||||||||||
| ||||||||||||||||||
| ||||||||||||||||||
| ||||||||||||||||||
| ||||||||||||||||||
| ||||||||||||||||||
| Securitized bond with the future flows from the sales with credit card in United States and Canada. | ||||||||||||||||||
Class of liability for the analysis of liquidity risk ordered by date of maturity as of
December 31, 2015 Debtor: TAM S.A. and Subsidiaries , Tax No . 02.012.862/0001-60, Brazil.
Class of Liability | More than 90 days to one year | More than one to three years | More than three to five years | More than five years | Total | Amortization | Effective rate | Nominal value | Nominal rate | |||||||||||||||||||||||||
| ThUS$ | ThUS$ | ThUS$ | ThUS$ | ThUS$ | % | ThUS$ | % | |||||||||||||||||||||||||||
Loans to exporters | — | — | — | — | 30,331 | Semiannual | 2.17 | % | 30,000 | 2.17 | % | |||||||||||||||||||||||
| — | — | — | — | 35,102 | Semiannual | 1.70 | % | 35,000 | 1.70 | % | ||||||||||||||||||||||||
| — | — | — | — | 75,205 | Quarterly | 1.32 | % | 75,000 | 1.32 | % | ||||||||||||||||||||||||
| — | — | — | — | 102,770 | Annual | 1.83 | % | 102,000 | 1.79 | % | ||||||||||||||||||||||||
Bank loans | 195 | 214,373 | — | — | 214,749 | — | 2.57 | % | 214,373 | 2.57 | % | |||||||||||||||||||||||
| 45,430 | — | — | — | 45,430 | Semiannual | 1.76 | % | 44,848 | 1.74 | % | ||||||||||||||||||||||||
Guaranteed obligations | 12,070 | 32,208 | 32,203 | 44,336 | 124,842 | Quarterly | 5.69 | % | 102,649 | 5.01 | % | |||||||||||||||||||||||
| 34,730 | 36,019 | 6,757 | — | 90,451 | Quarterly | 3.42 | % | 87,448 | 3.37 | % | ||||||||||||||||||||||||
| 12,695 | 24,726 | 15,597 | 19,493 | 76,720 | Quarterly | 4.96 | % | 66,148 | 4.41 | % | ||||||||||||||||||||||||
| 53,435 | 144,037 | 146,463 | 152,574 | 514,249 | Quarterly | 4.15 | % | 451,090 | 3.67 | % | ||||||||||||||||||||||||
| 144,221 | 383,034 | 380,772 | 1,207,825 | 2,163,919 | Quarterly | 2.57 | % | 1,959,463 | 1.76 | % | ||||||||||||||||||||||||
| 34,628 | 93,287 | 94,699 | 217,034 | 451,156 | Quarterly | 2.71 | % | 409,908 | 2.10 | % | ||||||||||||||||||||||||
| 16,281 | 44,085 | 45,085 | 119,771 | 230,627 | Quarterly | 1.39 | % | 220,449 | 0.85 | % | ||||||||||||||||||||||||
| 8,680 | 23,567 | 24,190 | 77,456 | 136,769 | Quarterly | 1.73 | % | 128,222 | 1.13 | % | ||||||||||||||||||||||||
| 4,262 | 11,576 | 11,898 | 38,593 | 67,739 | Quarterly | 1.71 | % | 63,480 | 1.11 | % | ||||||||||||||||||||||||
| 11,194 | 30,188 | 30,703 | 111,059 | 186,858 | Quarterly | 1.97 | % | 172,789 | 1.26 | % | ||||||||||||||||||||||||
| 6,958 | 18,759 | 19,079 | 68,662 | 115,767 | Quarterly | 1.98 | % | 107,072 | 1.27 | % | ||||||||||||||||||||||||
| 17,413 | 46,958 | 47,790 | 109,099 | 227,037 | Quarterly | 3.35 | % | 190,000 | 3.35 | % | ||||||||||||||||||||||||
Financial leases | 17,848 | 38,443 | 26,596 | 1,865 | 92,012 | Quarterly | 3.71 | % | 85,491 | 3.42 | % | |||||||||||||||||||||||
| 15,145 | 31,093 | 31,375 | 26,226 | 108,831 | Quarterly | 1.32 | % | 103,684 | 1.29 | % | ||||||||||||||||||||||||
| 6,028 | 16,075 | 16,075 | 16,075 | 56,262 | Quarterly | 6.38 | % | 46,086 | 5.65 | % | ||||||||||||||||||||||||
| 5,676 | — | — | — | 7,525 | Quarterly | 1.31 | % | 7,462 | 1.31 | % | ||||||||||||||||||||||||
| 46,825 | 124,870 | 122,783 | 51,501 | 361,583 | Quarterly | 5.29 | % | 314,261 | 4.70 | % | ||||||||||||||||||||||||
Other loans | 2,248 | 146,189 | — | — | 149,033 | — | 1.86 | % | 146,189 | 1.86 | % | |||||||||||||||||||||||
| 10,733 | 29,473 | 15,214 | — | 58,959 | Quarterly | 2.08 | % | 58,960 | 2.08 | % | ||||||||||||||||||||||||
Hedging derivatives | 31,344 | 68,360 | 30,509 | 5,678 | 146,284 | — | — | 141,624 | — | |||||||||||||||||||||||||
Non-hedging derivatives | 3,557 | 5,926 | — | — | 10,718 | — | — | 10,300 | — | |||||||||||||||||||||||||
|
|
|
|
|
|
|
|
|
|
|
| |||||||||||||||||||||||
| 541,596 | 1,563,246 | 1,097,788 | 2,267,247 | 5,880,928 | 5,373,996 | |||||||||||||||||||||||||||||
|
|
|
|
|
|
|
|
|
|
|
| |||||||||||||||||||||||
| Tax No . | Creditor | Creditor country | Currency | Up to 90 days | More than 90 days to one year | More than one to three years | More than three to five years | More than five years | Total | Nominal value | Amortization | Effective rate | Nominal rate | |||||||||||||||||||||||||||||||||||||
| ThUS$ | ThUS$ | ThUS$ | ThUS$ | ThUS$ | ThUS$ | ThUS$ | �� | % | % | |||||||||||||||||||||||||||||||||||||||||
Bank loans | ||||||||||||||||||||||||||||||||||||||||||||||||||
0-E | | NEDERLANDSCHE CREDIETVERZEKERING MAATSCHAPPIJ | | Holland | US$ | 181 | 493 | 1,315 | 1,314 | 712 | 4,015 | 3,353 | Monthly | 6.01 | 6.01 | |||||||||||||||||||||||||||||||||||
Obligation with the public | ||||||||||||||||||||||||||||||||||||||||||||||||||
0-E | BANK OF NEW YORK | U.S.A. | US$ | 440 | 65,321 | 397,785 | 86,590 | 521,727 | 1,071,863 | 800,000 | At Expiration | 8.17 | 8.00 | |||||||||||||||||||||||||||||||||||||
Financial leases | ||||||||||||||||||||||||||||||||||||||||||||||||||
0-E | | AFS INVESTMENT IX LLC | | U.S.A. | US$ | 2,771 | 7,700 | 20,527 | 18,808 | — | 49,806 | 43,505 | Monthly | 1.25 | 1.25 | |||||||||||||||||||||||||||||||||||
0-E | AIRBUS FINANCIAL | U.S.A. | US$ | 3,715 | 11,054 | 21,830 | 15,730 | — | 52,329 | 49,995 | Monthly | 1.43 | 1.43 | |||||||||||||||||||||||||||||||||||||
0-E | | CREDIT AGRICOLE -CIB | | France | US$ | 4,542 | — | — | — | — | 4,542 | 4,50 0 | Quarterly/Semiannual | 3.25 | 3.25 | |||||||||||||||||||||||||||||||||||
0-E | DVB BANK SE | U.S.A. | US$ | 12 3 | 3 6 1 | 2 8 4 | — | — | 76 8 | 755 | Monthly | 1.6 4 | 1.6 4 | |||||||||||||||||||||||||||||||||||||
0-E | | GENERAL ELECTRIC CAPITAL | | |||||||||||||||||||||||||||||||||||||||||||||||
| CORPORATION | U.S.A. | US$ | 3,834 | 11,437 | 9,050 | — | — | 24,321 | 23,761 | Monthly | 1.25 | 1.25 | ||||||||||||||||||||||||||||||||||||||
0-E | KFW IPEX-BANK | Germany | US$ | 3,345 | 6,879 | 15,973 | 12,429 | — | 38,626 | 36,899 | Monthly/Quarterly | 1.72 | 1.72 | |||||||||||||||||||||||||||||||||||||
0-E | NATIXIS | France | US$ | 4,338 | 7,812 | 22,635 | 23,030 | 70,925 | 128,740 | 115,020 | Quarterly/Semiannual | 3.85 | 3.85 | |||||||||||||||||||||||||||||||||||||
0-E | | PK AIR FINANCE US, INC. | | U.S.A. | US$ | 1,428 | �� | 21,992 | — | — | — | 23,420 | 23,045 | Monthly | 1.75 | 1.75 | ||||||||||||||||||||||||||||||||||
0-E | | WACAPOU LEASING S.A. | | Luxemburg | US$ | 520 | 1,386 | 3,198 | 14,567 | — | 19,671 | 18,368 | Quarterly | 2.00 | 2.00 | |||||||||||||||||||||||||||||||||||
0-E | | SOCIÉTÉ GÉNÉRALE MILAN BRANCH | | Italy | US$ | 11,993 | 31,874 | 85,695 | 214,612 | — | 344,174 | 312,486 | Quarterly | 3.63 | 3.55 | |||||||||||||||||||||||||||||||||||
0-E | BANCO IBM S.A | Brazil | BRL | 267 | 846 | 1,230 | — | — | 2,343 | 1,728 | Monthly | 14.14 | 14.14 | |||||||||||||||||||||||||||||||||||||
0-E | | HP FINANCIAL SERVICE | | Brazil | BRL | 188 | 564 | 188 | — | — | 940 | 882 | Monthly | 10.02 | 10.02 | |||||||||||||||||||||||||||||||||||
0-E | SOCIÉTÉ GÉNÉRALE | France | BRL | 104 | 330 | 626 | — | — | 1,060 | 775 | Monthly | 14.14 | 14.14 | |||||||||||||||||||||||||||||||||||||
|
|
|
|
|
|
|
|
|
|
|
|
|
| |||||||||||||||||||||||||||||||||||||
| Total | 37,789 | 168,049 | 580,336 | 387,080 | 593,364 | 1,766,618 | 1,435,072 | |||||||||||||||||||||||||||||||||||||||||||
|
|
|
|
|
|
|
|
|
|
|
|
|
| |||||||||||||||||||||||||||||||||||||
Class of liability for the analysis of liquidity risk ordered by date of maturity as of December 31, 20122015
Debtor: LATAM Airlines Group S.A. and Subsidiaries, Tax No. 89.862.200-2, Chile.
|
|
| ||||||||||||||||||
|
| |||||||||||||||||||
| ||||||||||||||||||||
| ||||||||||||||||||||
| ||||||||||||||||||||
| ||||||||||||||||||||
| ||||||||||||||||||||
| ||||||||||||||||||||
| ||||||||||||||||||||
| ||||||||||||||||||||
|
| |||||||||||||||||||
| ||||||||||||||||||||
|
| |||||||||||||||||||
| ||||||||||||||||||||
| ||||||||||||||||||||
| ||||||||||||||||||||
| ||||||||||||||||||||
| ||||||||||||||||||||
| ||||||||||||||||||||
| ||||||||||||||||||||
| ||||||||||||||||||||
| ||||||||||||||||||||
| ||||||||||||||||||||
| ||||||||||||||||||||
| ||||||||||||||||||||
| ||||||||||||||||||||
| ||||||||||||||||||||
| ||||||||||||||||||||
| ||||||||||||||||||||
| ||||||||||||||||||||
| ||||||||||||||||||||
| ||||||||||||||||||||
| ||||||||||||||||||||
| ||||||||||||||||||||
| ||||||||||||||||||||
| ||||||||||||||||||||
| ||||||||||||||||||||
| ||||||||||||||||||||
|
| |||||||||||||||||||
|
| |||||||||||||||||||
|
| |||||||||||||||||||
| ||||||||||||||||||||
| More than | More than | More than | ||||||||||||||||||||||||||||
| 90 days | one to | three to | More than | |||||||||||||||||||||||||||
| Class of | to one | three | five | five | Effective | Nominal | Nominal | |||||||||||||||||||||||
Liability | year | years | years | years | Total | Amortization | rate | rate | rate | |||||||||||||||||||||
| ThUS$ | ThUS$ | ThUS$ | ThUS$ | ThUS$ | % | ThUS$ | % | |||||||||||||||||||||||
Bank loans | 64,533 | — | — | — | 65,626 | Quarterly | 2.81% | 50,322 | 2.81% | |||||||||||||||||||||
| 5,945 | — | — | — | 32,465 | At Expiration | 4.03% | 29,986 | 4.03% | ||||||||||||||||||||||
| 118,821 | — | — | — | 164,767 | At Expiration | 5.35% | 151,980 | 5.35% | ||||||||||||||||||||||
| — | — | — | — | 356 | Semiannual | 10.72% | 92 | 10.72% | ||||||||||||||||||||||
| 129,638 | — | — | — | 182,266 | At Expiration | 5.65% | 163,391 | 5.65% | ||||||||||||||||||||||
| 15,391 | 861 | — | — | 35,145 | Monthly/At Expiration | 7,69% / 4,01% | 32,446 | 7,69% / 4,01% | ||||||||||||||||||||||
| 29 | — | — | — | 101 | Monthly | 8.94% | 88 | 8.94% | ||||||||||||||||||||||
| 28,563 | — | — | — | 28,563 | At Expiration | 3.34% | 27,484 | 3.34% | ||||||||||||||||||||||
| 495 | 1,320 | 1,320 | 2,695 | 6,061 | Monthly | 0.96% | 4,608 | 0.95% | ||||||||||||||||||||||
Obligation with the public | 87,902 | 191,720 | 480,708 | 1,028,161 | 1,815,500 | At Expiration | 8.60% | 1,100,000 | 8.41% | |||||||||||||||||||||
| 271,490 | — | — | — | 313,712 | Semiannual | 8.96% | 244,678 | 8.56% | ||||||||||||||||||||||
Financial leases | 7,728 | 20,609 | 20,609 | 29,196 | 81,624 | Monthly | N/A | 65,127 | N/A | |||||||||||||||||||||
| 9,350 | — | — | — | 12,871 | Monthly | N/A | 12,750 | N/A | ||||||||||||||||||||||
| 10,105 | 28,056 | 28,642 | 23,687 | 94,179 | Monthly | 2.25% | 87,033 | 2.25% | ||||||||||||||||||||||
| 14,958 | 9,418 | — | — | 30,333 | Monthly | N/A | 17,617 | N/A | ||||||||||||||||||||||
| 1,919 | 5,445 | 5,983 | 11,867 | 25,989 | Quarterly | 1.50% | 24,326 | 1.50% | ||||||||||||||||||||||
| 8,487 | 19,824 | 19,476 | 45,939 | 96,664 | Quarterly | 3.84% | 87,986 | 3.84% | ||||||||||||||||||||||
| 44,695 | 90,296 | 87,083 | 241,694 | 476,887 | Quarterly | 3.69% | 451,284 | 3.69% | ||||||||||||||||||||||
| 14,164 | 70,758 | 11,728 | 20,603 | 122,645 | Quarterly | 2.29% | 114,810 | 2.29% | ||||||||||||||||||||||
| 50,931 | 132,830 | 124,825 | 184,734 | 513,675 | Quarterly/Semiannual | 2,01% / 0,82% | 494,721 | 2,01% / 0,37% | ||||||||||||||||||||||
| 10,103 | 25,845 | — | — | 39,430 | Quarterly | 2.89% | 37,500 | 2.89% | ||||||||||||||||||||||
| 1,456 | 2,918 | 768 | — | 5,651 | Monthly | 2.25% | 5,402 | 2.25% | ||||||||||||||||||||||
| 20,745 | 51,339 | — | — | 82,982 | Monthly | 2.59% | 81,086 | 2.59% | ||||||||||||||||||||||
| 4,427 | 12,000 | 12,302 | 43,975 | 74,305 | Quarterly | 1.70% | 69,458 | 0.85% | ||||||||||||||||||||||
| 12,801 | 35,134 | 25,246 | 27,784 | 105,533 | Monthly/Quarterly | 2,11% / 2,21% | 97,770 | 2,11% / 2,21% | ||||||||||||||||||||||
| 26,169 | 73,710 | 78,388 | 178,957 | 369,350 | Quarterly/Semiannual | 2,62% / 3,32% | 316,425 | 2,62% / 3,32% | ||||||||||||||||||||||
| 9,773 | 27,406 | 38,907 | 48,681 | 128,385 | Monthly | 1.96% | 117,092 | 1.96% | ||||||||||||||||||||||
| 1,835 | 4,332 | 3,569 | 15,599 | 26,675 | Quarterly | 2.42% | 23,647 | 2.42% | ||||||||||||||||||||||
| 5,379 | 3,205 | — | — | 10,420 | Monthly | 1.98% | 10,271 | 1.98% | ||||||||||||||||||||||
| 39,102 | 100,197 | 99,264 | 157,422 | 410,771 | Quarterly | 1.95% | 380,025 | 1.95% | ||||||||||||||||||||||
| 1,654 | 4,481 | 4,589 | 8,956 | 20,341 | Quarterly | 0.88% | 19,431 | 0.08% | ||||||||||||||||||||||
| 1,458 | 1,891 | — | — | 3,842 | Monthly | 7.51% | 2,025 | 7.51% | ||||||||||||||||||||||
| 1,882 | 136 | — | — | 2,622 | Monthly | 10.58% | 2,255 | 10.58% | ||||||||||||||||||||||
| 13 | — | — | — | 54 | Monthly | 5.31% | 53 | 5.31% | ||||||||||||||||||||||
| 529 | 93 | — | — | 799 | Monthly | 9.08% | 747 | 9.08% | ||||||||||||||||||||||
| 108 | 1,203 | — | — | 1,940 | Monthly | 6.82% | 1,572 | 6.82% | ||||||||||||||||||||||
| — | — | — | — | 2,766 | Monthly | 0.00% | 2,520 | 0.00% | ||||||||||||||||||||||
Other loans | 9,143 | — | — | — | 41,025 | Monthly | 2.20% | 41,025 | 2.20% | |||||||||||||||||||||
Hedging derivatives | 9,353 | 1,963 | — | — | 15,324 | — | 0.00% | 15,324 | 0.00% | |||||||||||||||||||||
Non-hedging derivatives | 6,903 | 4,529 | — | — | 15,035 | — | 0.00% | 15,035 | 0.00% | |||||||||||||||||||||
|
|
|
|
|
|
|
|
|
|
|
| |||||||||||||||||||
| 1,047,977 | 921,519 | 1,043,407 | 2,069,950 | 5,456,679 | 4,399,392 | |||||||||||||||||||||||||
|
|
|
|
|
|
|
|
|
|
|
| |||||||||||||||||||
Class of liability for the analysis of liquidity risk ordered by date of maturity as of December 31, 2012
|
|
|
| |||||||||||||||
|
|
| ||||||||||||||||
|
|
| ||||||||||||||||
|
|
| ||||||||||||||||
| ||||||||||||||||||
| ||||||||||||||||||
| ||||||||||||||||||
Class of Liability | More than 90 days to one year | More than one to three years | More than three to five years | More than five years | Total | Amortization | Effective rate | Nominal value | Nominal rate | |||||||||||||||||||||||||
| ThUS$ | ThUS$ | ThUS$ | ThUS$ | ThUS$ | % | ThUS$ | % | |||||||||||||||||||||||||||
Trade and other accounts payable | 82,049 | — | — | — | 688,934 | — | — | 688,934 | — | |||||||||||||||||||||||||
| — | — | — | — | 5,761 | — | — | 5,761 | — | ||||||||||||||||||||||||||
| 31,190 | — | — | — | 451,597 | — | — | 451,597 | — | ||||||||||||||||||||||||||
| 8,860 | — | — | — | 38,618 | — | — | 38,618 | — | ||||||||||||||||||||||||||
| 14,480 | — | — | — | 19,869 | Monthly | 6.60 | % | 19,668 | 6.60 | % | ||||||||||||||||||||||||
| — | — | — | — | 198,968 | — | — | 198,968 | — | ||||||||||||||||||||||||||
Accounts payable, non-current | — | 18,000 | — | — | 18,000 | — | — | 18,000 | — | |||||||||||||||||||||||||
| — | 15,994 | — | — | 15,994 | Quarterly | 2.06 | % | 15,541 | 2.06 | % | ||||||||||||||||||||||||
| — | 3,594 | — | — | 3,594 | — | — | 3,594 | — | ||||||||||||||||||||||||||
| — | 39,251 | 44,872 | 142,914 | 227,037 | Monthly | 6.60 | % | 207,089 | 6.60 | % | ||||||||||||||||||||||||
Accounts payable to related parties currents | — | — | — | — | 14 | — | — | — | — | |||||||||||||||||||||||||
| — | — | — | — | 237 | — | — | — | — | ||||||||||||||||||||||||||
| — | — | — | — | 23 | — | — | — | — | ||||||||||||||||||||||||||
|
|
|
|
|
|
|
|
|
|
|
| |||||||||||||||||||||||
| 136,579 | 76,839 | 44,872 | 142,914 | 1,668,646 | 1,647,770 | |||||||||||||||||||||||||||||
|
|
|
|
|
|
|
|
|
|
|
| |||||||||||||||||||||||
| 1,726,152 | 2,561,604 | 2,186,067 | 4,480,111 | 13,006,253 | 11,421,158 | |||||||||||||||||||||||||||||
|
|
|
|
|
|
|
|
|
|
|
| |||||||||||||||||||||||
| Tax No. | Creditor | Creditor country | Currency | Up to 90 days | More than 90 days to one year | More than one to three years | More than three to five years | More than five years | Total | Nominal value | Amortization | Effective rate | Nominal rate | |||||||||||||||||||||||||||||||||||||
| ThUS$ | ThUS$ | ThUS$ | ThUS$ | ThUS$ | ThUS$ | ThUS$ | % | % | ||||||||||||||||||||||||||||||||||||||||||
Trade and other accounts payables |
| |||||||||||||||||||||||||||||||||||||||||||||||||
— | OTHERS | OTHERS | US$ | 442,320 | 14,369 | — | — | — | 456,689 | 456,689 | — | — | — | |||||||||||||||||||||||||||||||||||||
| CLP | 39,823 | 114 | — | — | — | 39,937 | 39,937 | — | — | — | ||||||||||||||||||||||||||||||||||||||||
| BRL | 301,569 | 16 | — | — | — | 301,585 | 301,585 | — | — | — | ||||||||||||||||||||||||||||||||||||||||
| Others currencies | 218,347 | 9,016 | — | — | — | 227,363 | 227,363 | — | — | — | ||||||||||||||||||||||||||||||||||||||||
Accounts payable to related parties currents |
| |||||||||||||||||||||||||||||||||||||||||||||||||
65.216.000-K | COMUNIDAD MUJER | Chile | CLP | 10 | — | — | — | — | 10 | 10 | — | — | — | |||||||||||||||||||||||||||||||||||||
78.591.370-1 | BETHIA S.A. Y FILIALES | Chile | CLP | 5 | — | — | — | — | 5 | 5 | — | — | — | |||||||||||||||||||||||||||||||||||||
78.997.060-2 | Viajes Falabella Ltd a. | Chile | CLP | 68 | 68 | 68 | — | — | — | |||||||||||||||||||||||||||||||||||||||||
0-E | Consultoría Administrativa Profesional | Mexico | MXN | 342 | — | — | — | — | 342 | 342 | — | — | — | |||||||||||||||||||||||||||||||||||||
0-E | INVERSORA AERONÁUTICA ARGENTINA | Argentina | US$ | 22 | — | — | — | — | 22 | 22 | — | — | — | |||||||||||||||||||||||||||||||||||||
|
|
|
|
|
|
|
|
|
|
|
|
|
| |||||||||||||||||||||||||||||||||||||
| Total | 1,002,506 | 23,515 | — | — | ��� | 1,026,021 | 1,026,021 | |||||||||||||||||||||||||||||||||||||||||||
|
|
|
|
|
|
|
|
|
|
|
|
|
| |||||||||||||||||||||||||||||||||||||
| Total consolidated | 1,709,040 | 1,119,312 | 3,229,298 | 2,491,831 | 2,910,146 | 11,459,627 | 10,231,771 | |||||||||||||||||||||||||||||||||||||||||||
|
|
|
|
|
|
|
|
|
|
|
|
|
| |||||||||||||||||||||||||||||||||||||
The Company has fuel, interest rate and exchange rate hedging strategies involving derivatives contracts with different financial institutions. The Company has margin facilities with each financial institution in order to regulate the mutual exposure produced by changes in the market valuation of the derivatives.
At the end of 2012,2015, the Company provided US$ 189.949.6 million in derivative margin guarantees, for cash and stand-by letters of credit. At December 31, 2013,2016, the Company had provided US$ 94.330.2 million in guarantees for Cash and cash equivalent and stand-by letters of credit. The falldecrease was due atat: i) maturity of hedge contracts, ii) acquire of new fuel purchase contracts, and exchange rate R$/US$, and iii) changes in fuel prices, exchange rate R$/US$ and interest rates.
| 3.2. | Capital risk management |
The Company’s objectives, with respect to the management of capital, are (i) to safeguard it in order to continue as an on-going business,comply with the restrictions of minimum equity and (ii) to seek a return for its shareholders, and (iii) to maintain an optimumoptimal capital structure and reduce its costs.
In order to maintain or adjust the capital structure, the Company may adjust the amount of the dividends payable to shareholders, return capital to shareholders, issue new shares or sell assets to reduce debt.structure.
The Company monitors its contractual obligations and the adjusted leverage ratio,regulatory limitations in line with industry practice. This index is calculated as net adjusted debt divided by the sum of adjusted equity and net adjusted debt. Net adjusted debt is total financial debt plus 8 timesdifferent countries where the operating lease paymentsentities of the last 12 months, less total cash (measured asgroup are domiciled to assure they meet the sumlimit of cash and cash equivalents plus marketable securities). Adjusted capital is the amount ofminimum net equity, withoutwhere the impactmost restrictive limitation is to maintain a positive net equity.
Additionally, the Company periodically monitors the short and long term cash flow projections to assure the Company has adequate sources of funding to generate the market value of derivatives.cash requirement to face its investment and funding future commitments.
The Company’s strategy, which has not changed since 2007, has consisted of maintaining a leverage ratio of between 70% and 80% and anCompany international credit rating of higher than BBB-(is the minimum required for being considered investment grade). As a resultconsequence of consolidation with TAM S.A. and Subsidiaries, the rating agency Fitch has issued on May 3, 2013 a new long-term rating for the Company of BB + with stable perspective (which is not an investment grade rating).Additionally, on June 10, 2013, S&P issued acapacity to face its long term rating of BB, with a positive outlook.
The leverage ratios asterms financing commitments. As of December 31, 2013,2016 the Company has an international long term credit rating of BB- with negative outlook by Standard & Poor’s, a B+ rating with negative outlook by Fitch Ratings and December 31, 2012, were as follows:a B1 rating with stable outlook by Moody’s.
| As of December 31, 2013 | As of December 31, 2012 | |||||||
| ThUS$ | ThUS$ | |||||||
Total financial loans | 9,830,866 | 9,759,507 | ||||||
Last twelve months Operating lease payment x 8 | 3,528,616 | 3,390,664 | ||||||
Less: | ||||||||
Cash and marketable securities | (2,561,574 | ) | (1,120,335 | ) | ||||
|
|
|
| |||||
Total net adjusted debt | 10,797,908 | 12,029,836 | ||||||
|
|
|
| |||||
Net Equity | 5,238,821 | 5,112,051 | ||||||
Cash flow hedging reserve | 34,508 | 140,730 | ||||||
|
|
|
| |||||
Adjusted equity | 5,273,329 | 5,252,781 | ||||||
|
|
|
| |||||
Total adjusted debt and equity | 16,071,237 | 17,282,617 | ||||||
|
|
|
| |||||
Adjusted leverage | 67.2 | % | 69.6 | % | ||||
See information related to financial covenants in Note 36 (a).
| 3.3. | Estimates of fair value. |
At December 31, 2013,2016, the Company maintained financial instruments that should be recorded at fair value. These are grouped into two categories:
1. Hedge Instruments:
| 1. | Hedge Instruments: |
This category includes the following instruments:
2. Financial Investments:
| 2. | Financial Investments: |
This category includes the following instruments:
The Company has classified the fair value measurement using a hierarchy that reflects the level of information used in the assessment. This hierarchy consists of 3 levels (I) fair value based on quoted prices in active markets for identical assets or liabilities, (II) fair value calculated through valuation methods based on inputs other than quoted prices included within level 1 that are observable for the asset or liability, either directly (that is, as prices) or indirectly (that is, derived from prices) and (III) fair value based on inputs for the asset or liability that are not based on observable market data.
The fair value of financial instruments traded in active markets, such as investments acquired for trading, is based on quoted market prices at the close of the period using the current price of the buyer. The fair value of financial assets not traded in active markets (derivative contracts) is determined using valuation techniques that maximize use of available market information. Valuation techniques generally used by the Company are quoted market prices of similar instruments and / or estimating the present value of future cash flows using forward price curves of the market at period end.
The following table shows the classification of financial instruments at fair value, depending on the level of information used in the assessment:
| As of December 31, 2013 | ||||||||||||||||
| Fair value measurements using values considered as | ||||||||||||||||
| Fair value | Level I | Level II | Level III | |||||||||||||
| ThUS$ | ThUS$ | ThUS$ | ThUS$ | |||||||||||||
Assets | ||||||||||||||||
Cash and cash equivalents | 579,349 | 579,349 | — | — | ||||||||||||
Short-term mutual funds | 579,349 | 579,349 | — | — | ||||||||||||
Other financial assets, current | 625,086 | 546,116 | 78,970 | |||||||||||||
Fair value of interest rate derivatives | 6 | — | 6 | — | ||||||||||||
Fair value of fuel derivatives | 15,868 | — | 15,868 | — | ||||||||||||
Fair value of foreign currency derivatives | 32,058 | — | 32,058 | |||||||||||||
Interest accrued since the last payment date of Currency Swap | 483 | — | 483 | — | ||||||||||||
Private investment funds | 544,182 | 544,182 | — | — | ||||||||||||
Certificate of deposit CDB | 2,374 | — | 2,374 | — | ||||||||||||
Financial letter | 351 | 351 | — | — | ||||||||||||
Domestic and foreign bonds | 28,181 | — | 28,181 | — | ||||||||||||
Other investments | 1,583 | 1,583 | — | — | ||||||||||||
Liabilities | ||||||||||||||||
Other financial liabilities, current | 70,506 | — | 70,506 | |||||||||||||
Fair value of interest rate derivatives | 32,070 | — | 32,070 | — | ||||||||||||
Fair value of foreign currency derivatives | 28,621 | — | 28,621 | — | ||||||||||||
Interest accrued since the last payment date of Currency Swap | 5,775 | — | 5,775 | |||||||||||||
Interest rate derivatives not recognized as a hedge | 4,040 | — | 4,040 | — | ||||||||||||
Other financial liabilities, non current | 56,397 | — | 56,397 | — | ||||||||||||
Fair value of interest rate derivatives | 54,906 | — | 54,906 | — | ||||||||||||
Interest rate derivatives not recognized as a hedge | 1,491 | — | 1,491 | — | ||||||||||||
| As of December 31, 2012 | ||||||||||||||||||||||||||||||||||||||||||||||||
| As of December 31, 2016 | As of December 31, 2015 | |||||||||||||||||||||||||||||||||||||||||||||||
Fair value measurements using values considered as | Fair value measurements using values considered as | Fair value measurements using considered as | ||||||||||||||||||||||||||||||||||||||||||||||
| Fair value | Level I | Level II | Level III | Fair value | Level I | Level II | Level III | Fair | Level I | Level II | Level III | |||||||||||||||||||||||||||||||||||||
| ThUS$ | ThUS$ | ThUS$ | ThUS$ | ThUS$ | ThUS$ | ThUS$ | ThUS$ | ThUS$ | ThUS$ | ThUS$ | ThUS$ | |||||||||||||||||||||||||||||||||||||
Assets | ||||||||||||||||||||||||||||||||||||||||||||||||
Cash and cash equivalents | 311,675 | 311,675 | — | — | 15,522 | 15,522 | — | — | 26,600 | 26,600 | — | — | ||||||||||||||||||||||||||||||||||||
Short-term mutual funds | 311,675 | 311,675 | — | — | 15,522 | 15,522 | — | — | 26,600 | 26,600 | — | — | ||||||||||||||||||||||||||||||||||||
Other financial assets, current | 474,176 | 319,145 | 155,031 | 548,402 | 536,991 | 11,411 | — | 622,963 | 606,385 | 16,578 | — | |||||||||||||||||||||||||||||||||||||
Fair value of interest rate derivatives | 6 | — | 6 | — | ||||||||||||||||||||||||||||||||||||||||||||
Fair value of fuel derivatives | 4,098 | — | 4,098 | — | ||||||||||||||||||||||||||||||||||||||||||||
Private investment funds | 317,598 | 317,598 | — | — | ||||||||||||||||||||||||||||||||||||||||||||
Certificate of deposit CDB | 77,316 | — | 77,316 | — | ||||||||||||||||||||||||||||||||||||||||||||
Financial letter | 73,611 | — | 73,611 | — | ||||||||||||||||||||||||||||||||||||||||||||
Domestic and foreign bonds | 748 | 748 | — | — | ||||||||||||||||||||||||||||||||||||||||||||
Other investments | 799 | 799 | — | — | ||||||||||||||||||||||||||||||||||||||||||||
Other financial assets, non current | 1,118 | — | 1,118 | |||||||||||||||||||||||||||||||||||||||||||||
Fair value of fuel derivatives | 1,023 | — | 1,023 | — | 10,088 | — | 10,088 | — | 6,293 | — | 6,293 | — | ||||||||||||||||||||||||||||||||||||
Fair value of foreign currency derivatives | 95 | — | 95 | — | 1,259 | — | 1,259 | — | 9,888 | — | 9,888 | — | ||||||||||||||||||||||||||||||||||||
Interest accrued since the last payment date of Cross Currency Swap | 64 | — | 64 | — | 397 | — | 397 | — | ||||||||||||||||||||||||||||||||||||||||
Private investment funds | 536,991 | 536,991 | — | — | 448,810 | 448,810 | — | — | ||||||||||||||||||||||||||||||||||||||||
Domestic and foreign bonds | — | — | — | — | 157,575 | 157,575 | — | — | ||||||||||||||||||||||||||||||||||||||||
Liabilities | ||||||||||||||||||||||||||||||||||||||||||||||||
Other financial liabilities, current | 70,075 | — | 70,075 | |||||||||||||||||||||||||||||||||||||||||||||
Interest accrued since the last payment date of Currency Swap | 4,660 | 4,660 | ||||||||||||||||||||||||||||||||||||||||||||||
Other financial liabilities , current | 24,881 | — | 24,881 | — | 134,089 | — | 134,089 | — | ||||||||||||||||||||||||||||||||||||||||
Fair value of interest rate derivatives | 37,076 | — | 37,076 | — | 9,579 | — | 9,579 | — | 33,518 | — | 33,518 | — | ||||||||||||||||||||||||||||||||||||
Fair value of fuel derivatives | 10,502 | — | 10,502 | — | — | — | — | — | 39,818 | 39,818 | ||||||||||||||||||||||||||||||||||||||
Fair value of foreign currency derivatives | 13,360 | — | 13,360 | — | 13,155 | — | 13,155 | — | 56,424 | — | 56,424 | — | ||||||||||||||||||||||||||||||||||||
Interest accrued since the last payment date of Currency Swap | 2,147 | — | 2,147 | — | 4,329 | — | 4,329 | — | ||||||||||||||||||||||||||||||||||||||||
Interest rate derivatives not recognized as a hedge | 4,477 | — | 4,477 | — | — | — | — | — | — | — | ||||||||||||||||||||||||||||||||||||||
Other financial liabilities, non current | 116,555 | — | 116,555 | — | 6,679 | — | 6,679 | — | 16,128 | — | 16,128 | — | ||||||||||||||||||||||||||||||||||||
Fair value of interest rate derivatives | 104,547 | — | 104,547 | — | 6,679 | — | 6,679 | — | 16,128 | — | 16,128 | — | ||||||||||||||||||||||||||||||||||||
Fair value of fuel derivatives | 4,530 | — | 4,530 | — | ||||||||||||||||||||||||||||||||||||||||||||
Fair value of foreign currency derivatives | 1,963 | — | 1,963 | — | ||||||||||||||||||||||||||||||||||||||||||||
Interest rate derivatives not recognized as a hedge | 5,515 | — | 5,515 | — | ||||||||||||||||||||||||||||||||||||||||||||
Additionally, at December 31, 2013,2016, the Company has financial instruments which are not recorded at fair value. In order to meet the disclosure requirements of fair values, the Company has valued these instruments as shown in the table below:
| As of December 31, 2013 | As of December 31, 2012 | |||||||||||||||||||||||||||||||
| Book | Fair | Book | Fair | As of December 31, 2016 | As of December 31, 2015 | |||||||||||||||||||||||||||
| value | value | value | value | Book value | Fair value | Book value | Fair value | |||||||||||||||||||||||||
| ThUS$ | ThUS$ | ThUS$ | ThUS$ | ThUS$ | ThUS$ | ThUS$ | ThUS$ | |||||||||||||||||||||||||
Cash and cash equivalents | 1,405,554 | 1,405,554 | 338,588 | 338,588 | 933,805 | 933,805 | 726,897 | 726,897 | ||||||||||||||||||||||||
Cash on hand | 6,017 | 6,017 | 6,835 | 6,835 | 8,630 | 8,630 | 10,656 | 10,656 | ||||||||||||||||||||||||
Bank balance | 229,935 | 229,935 | 147,373 | 147,373 | 255,746 | 255,746 | 255,421 | 255,421 | ||||||||||||||||||||||||
Overnight | 508,781 | 508,781 | 119,713 | 119,713 | 295,060 | 295,060 | 267,764 | 267,764 | ||||||||||||||||||||||||
Time deposits | 660,821 | 660,821 | 64,667 | 64,667 | 374,369 | 374,369 | 193,056 | 193,056 | ||||||||||||||||||||||||
Other financial assets | 84,858 | 84,858 | 162,367 | 162,367 | ||||||||||||||||||||||||||||
Other financial assets, current | 164,426 | 164,426 | 28,385 | 28,385 | ||||||||||||||||||||||||||||
Other financial assets | 84,858 | 84,858 | 162,367 | 162,367 | 164,426 | 164,426 | 28,385 | 28,385 | ||||||||||||||||||||||||
Trade and other accounts receivable current | 1,633,094 | 1,633,094 | 1,417,531 | 1,417,531 | 1,107,889 | 1,107,889 | 796,974 | 796,974 | ||||||||||||||||||||||||
Accounts receivable from related entities | 628 | 628 | 15,187 | 15,187 | 554 | 554 | 183 | 183 | ||||||||||||||||||||||||
Other financial assets, non current | 65,289 | 65,289 | 72,977 | 72,977 | 102,125 | 102,125 | 89,458 | 89,458 | ||||||||||||||||||||||||
Accounts receivable | 100,775 | 100,775 | 50,612 | 50,612 | 8,254 | 8,254 | 10,715 | 10,715 | ||||||||||||||||||||||||
Other financial liabilities, current | 1,969,281 | 2,128,096 | 1,977,255 | 2,090,726 | 1,814,647 | 2,022,290 | 1,510,146 | 1,873,552 | ||||||||||||||||||||||||
Trade and other accounts payables | 1,557,736 | 1,557,736 | 1,689,990 | 1,689,990 | 1,593,068 | 1,593,068 | 1,483,957 | 1,483,957 | ||||||||||||||||||||||||
Accounts payable to related entities | 505 | 505 | 274 | 274 | 269 | 269 | 447 | 447 | ||||||||||||||||||||||||
Other financial liabilities, non current | 7,803,588 | 7,910,446 | 7,582,302 | 7,806,643 | 6,790,273 | 6,970,375 | 7,516,257 | 7,382,221 | ||||||||||||||||||||||||
Accounts payable, non-current | 922,887 | 922,887 | 1,085,601 | 1,085,601 | 359,391 | 359,391 | 417,050 | 417,050 | ||||||||||||||||||||||||
The book values of accounts receivable and payable are assumed to approximate their fair values, due to their short-term nature. In the case of cash on hand, bank balances, overnight, time deposits and accounts payable, non-current, fair value approximates their carrying values.
The fair value of Other financial liabilities is estimated by discounting the future contractual cash flows at the current market interest rate for similar financial instruments.instruments (Level II). In the case of Other financial assets, the valuation was performed according to market prices at period end.
NOTE 4 - 4—ACCOUNTING ESTIMATES AND JUDGMENTS
The Company has used estimates to value and book some of therecord certain assets, liabilities, revenues, expensesrevenue, expenditure, and commitments;commitments. Basically, these estimates relate principally to:
| (a) |
As of December 31, 2016 goodwill amounted to ThUS$ 2,710,382 (ThUS$ 2,280,575 at December 31, 2015), while intangible assets with an indefinite useful life comprised airport slots for ThUS$ 978,849 (ThUS$ 816,987 at December 31, 2015), Loyalty Program for ThUS$ 326,262 (ThUS$ 272,312 at December 31, 2015) and Trademarks (*) for ThUS$ 52.981 at December 31, 2015.
At least once per year the Company verifies whether goodwill and intangible assets with an indefinite useful life have suffered any losses through impairment. For the purposes of this evaluation, the Company has identified two cash-generating units (CGUs): “Air transport” and “Multiplus loyalty and coalition program.” The book value of goodwill assigned to each CGU as of December 31, 2016, amounted to ThUS$ 2,176,634 and ThUS$ 533,748 (ThUS$ 1,835,088 and ThUS$ 445,487 at December 31, 2015), which included intangible assets with undefined useful life:
Air Transport CGU | Coalition and loyalty Program Multiplus CGU | |||||||||||||||
| As of December 31, 2016 | As of December 31, 2015 | As of December 31, 2016 | As of December 31, 2015 | |||||||||||||
| ThUS$ | ThUS$ | ThUS$ | ThUS$ | |||||||||||||
Airport Slots | 978,849 | 816,987 | — | — | ||||||||||||
Trade marks (*) | — | 52,981 | — | — | ||||||||||||
Loyalty program | — | — | 326,262 | 272,312 | ||||||||||||
| (*) | At December 31, 2016, the Company has changed the estimated useful life of the brands from an indefinite useful life to a five-year period (See Note 15). |
The recoverable value of these cash-generating units (CGUs) has been determined based on calculations of their value in use. The principal assumptions used by the management include: growth rate, exchange rate, discount rate, fuel prices, and other economic assumptions. The estimation of these assumptions requires significant judgment by the management, as these variables feature inherent uncertainty; however, the assumptions used are consistent with Company’s internal planning. Therefore, management evaluates and updates the estimates on an annual basis, in light of conditions that affect these variables. The mainly assumptions used as well as, the corresponding sensitivity analyses are showed in Note 16.
| (b) |
The depreciation of assets is calculated based on the linear model, except for certain technical components depreciated on cycles and hours flown. These useful lives are reviewed on an annual basis according with the Company’s future economic benefits associated with them.
Changes in circumstances such as: technological advances, business model, planned use of assets or capital strategy may render the useful life different to the lifespan estimated. When it is determined that the useful life of property, plant, and equipment must be reduced, as may occur in line with changes in planned usage of assets, the difference between the net book value and estimated recoverable value is depreciated, in accordance with the revised remaining useful life.
Residual values are estimated in accordance with the market value that these assets will have at the end of their useful life. The assets’ residual values and useful lives are reviewed, and adjusted if appropriate, once a year. An asset’s carrying amount is written down immediately to its recoverable amount if the asset’s carrying amount is greater than its estimated recoverable amount (note 2.8).
| (c) |
Deferred taxes are calculated in accordance with the liability method, applied over temporary differences that arise between the fiscal based of assets and liabilities, and their book value. Deferred tax assets for tax losses are recognized to the extent that the realization of the related tax benefit through future taxable profits is probable. The Company makes tax and financial projections to evaluate the realization of deferred tax asset over the course of time. Additionally, these projections are ensured to be consistent with those used to measure other long term assets. As of December 31, 2016 the company recognized deferred tax assets amounting to ThUS$ 384,580 (ThUS$ 376,595 at December 31, 2015), and had ceased to recognize deferred tax assets for tax losses amounting to ThUS$ 115,801 (ThUS$ 15,513 at December 31, 2015) (Note 18).
| (d) | Air tickets sold that are not actually used. |
The Company advance sales of tickets as deferred revenue. Revenue from ticket sales is recognized in the income statement when the service is provided or when the tickets expires unused, reducing the corresponding deferred revenue. The Company evaluates monthly the probability that tickets expiry unused, based on the history of used tickets. Changes in the exchange probability would have an impact our revenue in the year in which the change occurs and in future years. As of December 31, 2016, deferred revenue associated with air tickets sold amounted to ThUS$ 1,535,229 (ThUS$ 1,223,886 as of December 31, 2015). An hypothetical change of 1% in passenger behavior regarding to the ticket usage,—that is, if during the next six months after sells probability of used were 89% rather than 90%, as we consider, it would lead to a change in the expiry period from six to seven months, which, as of December 31, 2016, would have an impact of up to ThUS$ 20,000.
| (e) |
As of December 31, 2016 and December 31, 2015, the Company operated the following loyalty programs: LATAM Pass, LATAM Fidelidade and Multiplus, with the objective of enhancing customer loyalty by offering points or kilometers (see Note 22).
When kilometers and points are redeemed for products and services other than the services provided by the Company, revenue is recognized immediately; when they are redeemed for air tickets on airlines from to LATAM Airlines Group S.A. and subsidiaries, revenue is deferred until the transport service is provided or the corresponding tickets expired.
Deferred revenue from loyalty programs at the closing date corresponds to the valuation of points and kilometers granted to loyalty program members, pending of use, and the probability to be redeemed.
According to IFRIC-13, kilometers and points value that the Company estimate are not likely to be redeemed (“breakage”), they recognize the associated value proportionally during the period in which the remaining kilometers or points are expected to be redeemed. The Company uses statistical models to estimate the breakage, based on historical redemption patterns Changes in the breakage would have a significant impact on our revenue in the year in which the change occurs and in future years.
As of December 31, 2016, deferred revenue associated with the LATAM Pass loyalty program amounted to ThUS$ 896,190 (ThUS$ 973,264 at December 31, 2015). As of December 31, 2016 a hypothetical change of 1% in the probability of usage would result in an impact of approximately ThUS$ 30,632 and ThUS$ 30,000 at the same period of 2015. Meanwhile, deferred revenue associated with the LATAM Fidelidade and Multiplus loyalty programs amounted to ThUS$ 392,107 (ThUS$ 452,264 at December 31, 2015). As of December 31, 2016 a hypothetical change of 2% in the probability of usage would result in an impact of approximately ThUS$ 14,639 and ThUS$ 11,755 at the same period of 2015.
The fair value of kilometers is determined by the Company based in its best estimate of the price at which they have been sold in the past. As of December 31, 2016 a hypothetical change of 1% in the fair value of the unused kilometers would result in an impact of approximately ThUS$ 8,400 and ThUS$ 8,800 at the same period of 2015.
| (f) |
Known contingencies are recognized when: the Company has a present legal or constructive obligation as a result of past events; it is probable that an outflow of resources will be required to settle the obligation and the amount has been reliably estimated. The Company applies professional judgment, experience, and knowledge to use available information to determine these values, in light of the specific characteristics of known risks. This process facilitates the early assessment and valuation of potential risks in individual cases or in the development of contingent eventualities.
| (g) |
These estimates are made on the basis of the best information available on the matters analyzed.
In any case, it is possible that events will require modification of the estimates in the future, in which case the effects would be accounted for prospectively.
Additionally, theThe management has applied its judgment in determining that LATAM Airlines Group S.A. has control overcontrols TAM S.A. and Subsidiaries, for accounting purposes, and has therefore has consolidated theirthe financial statements.
The above on the basisgrounds for this decision are that LATAM issued their ordinary shares in exchange for allthe majority of the outstanding commoncirculating ordinary and preferredpreferential shares ofin TAM, (exceptexcept for those TAM shareholders of TAM who did not accept the exchange, and which were subject of the squeeze-out described in Note 18.2.a),to a squeeze out, entitling LATAM to substantially all of the economic benefits that will be generated by the LATAM Group, and also, consequently,thus exposing it to substantially all the risks incidentalrelating to the operations of TAM. This exchange aligns the economic interests of LATAM and all of its shareholders, including the TAM controlling shareholders ensuringof TAM, thus insuring that the shareholders and directors of TAM willshall have no incentive to exercise their rights in a manner that iswould be beneficial to TAM but detrimental to LATAM. Further,Furthermore, all significant actions required fornecessary of the operation of the airlines require votes in favor by the affirmative votecontrolling shareholders of both LATAM and TAM.
Since the integration of LAN and TAM controlling shareholders.
In addition, LATAM is in process of integrating operations, with TAM, and both entities will be operated as a single company. Within this,the most critical airline activities will be managedoperations in Brazil under the TAM CEO and globallyhave been managed by the CEO of TAM while global activities have been managed by the CEO of LATAM, CEO, who will beis in charge of the overall operation of the LATAM Group as a whole and who will reportreports to the LATAM board. Further,Board.
The CEO of LATAM also evaluates the LATAM CEO will evaluate performance of the LATAM Group executives and, together with the LATAM board, determineBoard, determines compensation. Although there areBrazilian law currently imposes restrictions on the percentages of voting interestsrights that currently may be held by foreign investors, under Brazilian law, LATAM believes that the economic substancebasis of these arrangements satisfiesagreements meets the requirements established by the applicableof accounting standards in force, and that the consolidation byof the operations of LAN and LATAM of TAM’s operations is appropriate.
These estimates were made based on the best information available relating to the matters analyzed.
In any case, it is possible that events that may take place in the future could lead to their modification in future reporting periods, which would be made in a prospective manner.
NOTE 5 - SEGMENTAL INFORMATION
The Company reports information by segments as established in IFRS 8 “Operating segments”. This standard sets rules for the reporting of information by segments in the financial statements, plus reporting about products and services, geographical areas and principal customers.
An operating segment is defined as a component of an entity on which financial information is held separately and which is evaluated regularly by the senior management in making decisions with respect to the assignment of resources and evaluation of results.
The Company has determined that it has two operating segments: the air transportation business and the coalition and loyalty program Multiplus.
The Air transport segment corresponds to the route network for air transport and it is based on the way that the business is run and managed, according to the centralized nature of its operations, the ability to open and close routes and reallocate resources (aircraft, crew, staff, etc.) within the network, which is a functional relationship between all of them, making them inseparable. This segment definition is the most common level used by the global airline industry.
The segment of loyalty coalition called Multiplus, unlike LanLATAM Pass and TAMLATAM Fidelidade, is a frequent flyer programs which operate as a unilateral system of loyalty that offers a flexible coalition system, interrelated among its members, with eleven millions16.5 million of members, along with being a governmentregulated entity with a separately business and not directly related to air transport.
(a) For the periodperiods ended
Air transportation At December 31, | Coalition and loyalty program Multiplus At December 31, | Eliminations At December 31, | Consolidated At December 31, | |||||||||||||||||||||||||||||||||||||
| 2013 | 2012 | 2011 | 2013 | 2012 | 2013 | 2012 | 2013 | 2012 | 2011 | |||||||||||||||||||||||||||||||
| ThUS$ | ThUS$ | ThUS$ | ThUS$ | ThUS$ | ThUS$ | ThUS$ | ThUS$ | ThUS$ | ThUS$ | |||||||||||||||||||||||||||||||
Income from ordinary activities from external customers | 12,328,634 | 9,380,181 | 5,585,440 | 595,903 | 330,191 | — | — | 12,924,537 | 9,710,372 | 5,585,440 | ||||||||||||||||||||||||||||||
LAN passenger | 4,731,296 | 4,529,099 | 4,008,910 | — | — | — | — | 4,731,296 | 4,529,099 | 4,008,910 | ||||||||||||||||||||||||||||||
TAM passenger | 5,734,359 | 3,107,555 | — | — | — | — | — | 5,734,359 | 3,107,555 | — | ||||||||||||||||||||||||||||||
Freight | 1,862,979 | 1,743,527 | 1,576,530 | — | — | — | — | 1,862,979 | 1,743,527 | 1,576,530 | ||||||||||||||||||||||||||||||
Income from ordinary activities from transactions with other operating segments | 595,903 | 330,191 | — | 94,457 | 52,175 | (690,360 | ) | (382,366 | ) | — | — | — | ||||||||||||||||||||||||||||
Income from ordinary activities from interest | — | — | — | — | — | — | — | — | — | — | ||||||||||||||||||||||||||||||
Other operating income | 272,640 | 207,273 | 132,804 | 68,925 | 26,696 | — | (13,813 | ) | 341,565 | 220,156 | 132,804 | |||||||||||||||||||||||||||||
Interest income | 49,737 | 51,004 | 14,453 | 34,280 | 26,485 | (11,189 | ) | — | 72,828 | 77,489 | 14,453 | |||||||||||||||||||||||||||||
Interest expense | (472,171 | ) | (294,448 | ) | (139,077 | ) | (1,542 | ) | (150 | ) | 11,189 | — | (462,524 | ) | (294,598 | ) | (139,077 | ) | ||||||||||||||||||||||
|
|
|
|
|
|
|
|
|
|
|
|
|
|
|
|
|
|
|
| |||||||||||||||||||||
Total net interest expense | (422,434 | ) | (243,444 | ) | (124,624 | ) | 32,738 | 26,335 | — | — | (389,696 | ) | (217,109 | ) | (124,624 | ) | ||||||||||||||||||||||||
|
|
|
|
|
|
|
|
|
|
|
|
|
|
|
|
|
|
|
| |||||||||||||||||||||
(b) For the period ended
Air transportation At December 31, | Coalition and loyalty program Multiplus At December 31, | Eliminations At December 31, | Consolidated At December 31, | Air transportation At December 31, | Coalition and loyalty program Multiplus At December 31, | Eliminations At December 31, | Consolidated At December 31, | |||||||||||||||||||||||||||||||||||||||||||||||||||||||||||||||||||||||||||||||||
| 2013 | 2012 | 2011 | 2013 | 2012 | 2013 | 2012 | 2013 | 2012 | 2011 | 2016 | 2015 | 2014 | 2016 | 2015 | 2014 | 2016 | 2015 | 2014 | 2016 | 2015 | 2014 | |||||||||||||||||||||||||||||||||||||||||||||||||||||||||||||||||||
| ThUS$ | ThUS$ | ThUS$ | ThUS$ | ThUS$ | ThUS$ | ThUS$ | ThUS$ | ThUS$ | ThUS$ | ThUS $ | ThUS $ | ThUS $ | ThUS $ | ThUS $ | ThUS $ | ThUS $ | ThUS $ | ThUS $ | ThUS $ | ThUS $ | ThUS $ | |||||||||||||||||||||||||||||||||||||||||||||||||||||||||||||||||||
Income from ordinary activities from external customers (*) | 8,587,772 | 9,278,041 | 11,587,224 | 400,568 | 462,004 | 506,277 | — | — | — | 8,988,340 | 9,740,045 | 12,093,501 | ||||||||||||||||||||||||||||||||||||||||||||||||||||||||||||||||||||||||||||
LAN passenger | 4,104,348 | 4,241,918 | 4,464,761 | — | — | — | — | — | — | 4,104,348 | 4,241,918 | 4,464,761 | ||||||||||||||||||||||||||||||||||||||||||||||||||||||||||||||||||||||||||||
TAM passenger | 3,372,799 | 3,706,692 | 5,409,084 | 400,568 | 462,004 | 506,277 | — | — | — | 3,773,367 | 4,168,696 | 5,915,361 | ||||||||||||||||||||||||||||||||||||||||||||||||||||||||||||||||||||||||||||
Freight | 1,110,625 | 1,329,431 | 1,713,379 | — | — | — | — | — | — | 1,110,625 | 1,329,431 | 1,713,379 | ||||||||||||||||||||||||||||||||||||||||||||||||||||||||||||||||||||||||||||
Income from ordinary activities from transactions with other operating segments | 400,568 | 462,004 | 506,277 | 65,969 | 67,826 | 106,030 | (466,537 | ) | (529,830 | ) | (612,307 | ) | — | — | — | |||||||||||||||||||||||||||||||||||||||||||||||||||||||||||||||||||||||||
Other operating income | 364,551 | 230,823 | 217,390 | 174,197 | 154,958 | 160,255 | — | — | — | 538,748 | 385,781 | 377,645 | ||||||||||||||||||||||||||||||||||||||||||||||||||||||||||||||||||||||||||||
Interest income | 27,287 | 21,818 | 32,390 | 58,380 | 63,647 | 58,110 | (10,718 | ) | (10,385 | ) | — | 74,949 | 75,080 | 90,500 | ||||||||||||||||||||||||||||||||||||||||||||||||||||||||||||||||||||||||||
Interest expense | (427,054 | ) | (423,742 | ) | (430,030 | ) | — | — | (4 | ) | 10,718 | 10,385 | — | (416,336 | ) | (413,357 | ) | (430,034 | ) | |||||||||||||||||||||||||||||||||||||||||||||||||||||||||||||||||||||
Total net interest expense | (399,767 | ) | (401,924 | ) | (397,640 | ) | 58,380 | 63,647 | 58,106 | — | — | — | (341,387 | ) | (338,277 | ) | (339,534 | ) | ||||||||||||||||||||||||||||||||||||||||||||||||||||||||||||||||||||||
Depreciation and amortization | (1,037,734 | ) | (770,264 | ) | (396,475 | ) | (3,999 | ) | (849 | ) | — | — | (1,041,733 | ) | (771,113 | ) | (396,475 | ) | (952,285 | ) | (923,311 | ) | (983,847 | ) | (8,043 | ) | (11,095 | ) | (7,417 | ) | — | — | — | (960,328 | ) | (934,406 | ) | (991,264 | ) | |||||||||||||||||||||||||||||||||||||||||||||||||
Material non-cash items other than depreciation and amortization | (523,666 | ) | 33,497 | 1,583 | 59 | (1,559 | ) | — | — | (523,607 | ) | 31,938 | 1,583 | 10,069 | (507,921 | ) | (168,573 | ) | (991 | ) | 1,893 | (2,350 | ) | — | — | — | 9,078 | (506,028 | ) | (170,923 | ) | |||||||||||||||||||||||||||||||||||||||||||||||||||||||||
Disposal of fixed assets and inventory losses | (33,987 | ) | (21,990 | ) | (6,008 | ) | (123 | ) | (1,597 | ) | — | — | (34,110 | ) | (23,587 | ) | (6,008 | ) | (82,734 | ) | (20,932 | ) | (28,756 | ) | — | — | (814 | ) | — | — | — | (82,734 | ) | (20,932 | ) | (29,570 | ) | |||||||||||||||||||||||||||||||||||||||||||||||||||
Doubtful accounts | (7,754 | ) | (11,233 | ) | 7,716 | 217 | 95 | — | — | (7,537 | ) | (11,138 | ) | 7,716 | (29,674 | ) | (18,292 | ) | (9,637 | ) | (476 | ) | 611 | (1,522 | ) | — | — | — | (30,150 | ) | (17,681 | ) | (11,159 | ) | ||||||||||||||||||||||||||||||||||||||||||||||||||||||
Exchange differences | (482,139 | ) | 66,742 | (256 | ) | (35 | ) | (57 | ) | — | — | (482,174 | ) | 66,685 | (256 | ) | 122,129 | (469,178 | ) | (130,187 | ) | (478 | ) | 1,282 | (14 | ) | — | — | — | 121,651 | (467,896 | ) | (130,201 | ) | ||||||||||||||||||||||||||||||||||||||||||||||||||||||
Result of indexation units | 214 | (22 | ) | 131 | — | — | — | — | 214 | (22 | ) | 131 | 348 | 481 | 7 | (37 | ) | — | — | — | — | — | 311 | 481 | 7 | |||||||||||||||||||||||||||||||||||||||||||||||||||||||||||||||
|
|
|
|
|
|
|
|
|
| |||||||||||||||||||||||||||||||||||||||||||||||||||||||||||||||||||||||||||||||
Segment profit | (389,040 | ) | (81,222 | ) | 320,197 | 107,926 | 62,146 | — | — | (281,114 | ) | (19,076 | ) | 320,197 | ||||||||||||||||||||||||||||||||||||||||||||||||||||||||||||||||||||||||||
|
|
|
|
|
|
|
|
|
| |||||||||||||||||||||||||||||||||||||||||||||||||||||||||||||||||||||||||||||||
Income (loss) atributable to owners of the parents | (83,653 | ) | (356,039 | ) | (404,346 | ) | 152,873 | 136,765 | 144,361 | — | — | — | 69,220 | (219,274 | ) | (259,985 | ) | |||||||||||||||||||||||||||||||||||||||||||||||||||||||||||||||||||||||
Participation of the entity in the income of associates | 1,954 | 972 | 458 | — | — | — | — | 1,954 | 972 | 458 | — | 37 | (2,175 | ) | — | — | (4,280 | ) | — | — | — | — | 37 | (6,455 | ) | |||||||||||||||||||||||||||||||||||||||||||||||||||||||||||||||
Expenses for income tax | 72,155 | (72,324 | ) | (61,789 | ) | (52,086 | ) | (30,062 | ) | — | — | 20,069 | (102,386 | ) | (61,789 | ) | (92,476 | ) | 249,090 | (218,503 | ) | (70,728 | ) | (70,707 | ) | (73,901 | ) | — | — | — | (163,204 | ) | 178,383 | (292,404 | ) | |||||||||||||||||||||||||||||||||||||||||||||||||||||
Segment profit/(loss) | (42,203 | ) | (315,497 | ) | (332,287 | ) | 152,873 | 136,765 | 105,116 | — | — | — | 110,670 | (178,732 | ) | (227,171 | ) | |||||||||||||||||||||||||||||||||||||||||||||||||||||||||||||||||||||||
Assets of segment | 21,520,500 | 21,170,727 | 7,648,659 | 1,118,686 | 1,163,316 | (8,040 | ) | (7,704 | ) | 22,631,146 | 22,326,339 | 7,648,659 | 17,805,749 | 16,924,200 | 18,759,848 | 1,400,432 | 1,182,111 | 1,773,584 | (7,987 | ) | (4,893 | ) | (49,002 | ) | 19,198,194 | 18,101,418 | 20,484,430 | |||||||||||||||||||||||||||||||||||||||||||||||||||||||||||||
Investments in associates | 3,572 | 1,619 | 991 | 3,024 | 2,138 | — | — | 6,596 | 3,757 | 991 | ||||||||||||||||||||||||||||||||||||||||||||||||||||||||||||||||||||||||||||||
Amount of non-current asset additions (*) | 1,746,913 | 12,778,773 | 1,133,501 | — | 846,285 | — | — | 1,746,913 | 13,625,058 | 1,133,501 | ||||||||||||||||||||||||||||||||||||||||||||||||||||||||||||||||||||||||||||||
Amount of non-current asset additions | 1,481,090 | 1,492,281 | 1,522,298 | — | — | — | — | — | — | 1,481,090 | 1,492,281 | 1,522,298 | ||||||||||||||||||||||||||||||||||||||||||||||||||||||||||||||||||||||||||||
Property, plant and equipment | 1,685,011 | 7,275,165 | 1,104,311 | — | — | — | — | 1,685,011 | 7,275,165 | 1,104,311 | 1,390,730 | 1,439,057 | 1,444,402 | — | — | — | — | — | — | 1,390,730 | 1,439,057 | 1,444,402 | ||||||||||||||||||||||||||||||||||||||||||||||||||||||||||||||||||
Intangibles other than goodwill | 61,902 | 2,333,906 | 29,190 | — | — | — | — | 61,902 | 2,333,906 | 29,190 | 90,360 | 53,224 | 77,896 | — | — | — | — | — | — | 90,360 | 53,224 | 77,896 | ||||||||||||||||||||||||||||||||||||||||||||||||||||||||||||||||||
Goodwill | — | 3,169,702 | — | — | 846,285 | — | — | — | 4,015,987 | — | ||||||||||||||||||||||||||||||||||||||||||||||||||||||||||||||||||||||||||||||
Segment liabilities | 16,604,451 | 16,477,979 | 6,191,287 | 775,975 | 746,854 | (75,739 | ) | (119,179 | ) | 17,304,687 | 17,105,654 | 6,191,287 | 14,469,505 | 14,700,072 | 15,293,668 | 572,065 | 490,076 | 723,438 | (28,680 | ) | (26,278 | ) | (36,371 | ) | 15,012,890 | 15,163,870 | 15,980,735 | |||||||||||||||||||||||||||||||||||||||||||||||||||||||||||||
Purchase of non-monetary assets of segment | 1,425,270 | 2,448,530 | 1,394,640 | — | — | — | — | 1,425,270 | 2,448,530 | 1,394,640 | 782,957 | 1,622,198 | 1,496,204 | — | — | — | — | — | — | 782,957 | 1,622,198 | 1,496,204 | ||||||||||||||||||||||||||||||||||||||||||||||||||||||||||||||||||
| (*) |
The Company’s revenues by geographic area are as follows:
| For the period ended | ||||||||||||||||||||||||
| At December 31, | For the period ended At December 31, | |||||||||||||||||||||||
| 2013 | 2012 | 2011 | 2016 | 2015 | 2014 | |||||||||||||||||||
| ThUS$ | ThUS$ | ThUS$ | ThUS$ | ThUS$ | ThUS$ | |||||||||||||||||||
Peru | 646,217 | 620,263 | 557,549 | 627,215 | 681,340 | 660,057 | ||||||||||||||||||
Argentina | 950,595 | 890,167 | 616,625 | 1,030,973 | 979,324 | 813,472 | ||||||||||||||||||
U.S.A. | 1,290,493 | 1,268,573 | 1,135,904 | 933,130 | 1,025,475 | 1,224,264 | ||||||||||||||||||
Europe | 937,539 | 738,803 | 523,749 | 714,436 | 723,062 | 935,893 | ||||||||||||||||||
Colombia | 387,999 | 366,664 | 367,642 | 343,001 | 353,007 | 391,678 | ||||||||||||||||||
Brazil | 5,572,884 | 3,322,431 | 258,300 | 2,974,234 | 3,464,297 | 5,361,594 | ||||||||||||||||||
Ecuador | 273,712 | 266,271 | 228,871 | 198,171 | 238,500 | 248,585 | ||||||||||||||||||
Chile | 1,698,476 | 1,525,009 | 1,312,376 | |||||||||||||||||||||
Chili | 1,512,570 | 1,575,519 | 1,589,202 | |||||||||||||||||||||
Asia Pacific and rest of Latin America | 1,166,622 | 712,191 | 584,424 | 654,610 | 699,521 | 868,756 | ||||||||||||||||||
|
|
|
|
|
| |||||||||||||||||||
Income from ordinary activities | 12,924,537 | 9,710,372 | 5,585,440 | 8,988,340 | 9,740,045 | 12,093,501 | ||||||||||||||||||
|
|
|
|
|
| |||||||||||||||||||
Other operating income | 341,565 | 220,156 | 132,804 | 538,748 | 385,781 | 377,645 | ||||||||||||||||||
|
|
|
|
|
| |||||||||||||||||||
The Company allocates revenues by geographic area based on the point of sale of the passenger ticket or cargo. Assets are composed primarily of aircraft and aeronautical equipment, which are used throughout the different countries, so it is not possible to assign a geographic area.
The Company has no customers that individually represent more than 10% of sales.
NOTE 6 - CASH AND CASH EQUIVALENTS
| As of | As of | |||||||||||||||
| December 31, | December 31, | |||||||||||||||
| 2013 | 2012 | As of December 31, 2016 | As of December 31, 2015 | |||||||||||||
| ThUS$ | ThUS$ | ThUS$ | ThUS$ | |||||||||||||
Cash on hand | 6,017 | 6,835 | 8,630 | 10,656 | ||||||||||||
Bank balances | 229,935 | 147,373 | 255,746 | 255,421 | ||||||||||||
Overnight | 508,781 | 119,713 | 295,060 | 267,764 | ||||||||||||
|
|
|
| |||||||||||||
Total Cash | 744,733 | 273,921 | 559,436 | 533,841 | ||||||||||||
|
|
|
| |||||||||||||
Cash equivalents | ||||||||||||||||
Time deposits | 660,821 | 64,667 | 374,369 | 193,056 | ||||||||||||
Mutual funds | 579,349 | 311,675 | 15,522 | 26,600 | ||||||||||||
|
|
|
| |||||||||||||
Total cash equivalents | 1,240,170 | 376,342 | 389,891 | 219,656 | ||||||||||||
|
|
|
| |||||||||||||
Total cash and cash equivalents | 1,984,903 | 650,263 | 949,327 | 753,497 | ||||||||||||
|
|
|
| |||||||||||||
Cash and cash equivalents are denominated in the following currencies at December 31, 2013, and December 31, 2012:currencies:
| As of | As of | |||||||||||||||
| December 31, | December 31, | |||||||||||||||
Currency | 2013 | 2012 | As of December 31, 2016 | As of December 31, 2015 | ||||||||||||
| ThUS$ | ThUS$ | ThUS$ | ThUS$ | |||||||||||||
Argentine peso | 59,018 | 70,381 | 7,871 | 18,733 | ||||||||||||
Brazilian real | 253,392 | 149,723 | 97,401 | 106,219 | ||||||||||||
Chilean peso (*) | 229,918 | 40,212 | ||||||||||||||
Chilean peso | 30,758 | 17,978 | ||||||||||||||
Colombian peso | 28,132 | 28,758 | 4,336 | 14,601 | ||||||||||||
Euro | 16,571 | 15,502 | 1,695 | 10,663 | ||||||||||||
US Dollar | 1,200,828 | 230,776 | 780,124 | 564,214 | ||||||||||||
Strong bolivar (**) | 162,809 | 51,346 | ||||||||||||||
Strong bolivar (*) | 61 | 2,986 | ||||||||||||||
Other currencies | 34,235 | 63,565 | 27,081 | 18,103 | ||||||||||||
|
|
|
| |||||||||||||
Total | 1,984,903 | 650,263 | 949,327 | 753,497 | ||||||||||||
|
|
|
| |||||||||||||
| (*) |
The Company has no significant non-cash transactions that must be disclosed.
Other inflows (outflows)As of December 31, 2016, the DICOM rate, which replaces SIMADI (February 2016), and to this date is 673.76 VEF/US$, Applied to cash and cash equivalents in VEF, represented a balance of ThUS$ 61 (ThUS$ 2,986 at December 31, 2013, December 31, 2012 and December 31, 2011 are detailed as follow:2015)
| For the periods ended | ||||||||||||
| December 31, | ||||||||||||
| 2013 | 2012 | 2011 | ||||||||||
| ThUS$ | ThUS$ | ThUS$ | ||||||||||
Fuel hedge | 11,413 | 14,237 | 51,611 | |||||||||
Hedging margin guarantees | 88,925 | 12,057 | (40,519 | ) | ||||||||
Guarantees | (5,001 | ) | (13,974 | ) | (1,609 | ) | ||||||
Commodities fuel derivatives | (4,041 | ) | (20,479 | ) | (7,987 | ) | ||||||
Bank commissions, taxes paid and other | (14,535 | ) | (42,274 | ) | (8,995 | ) | ||||||
|
|
|
|
|
| |||||||
Total Other inflows (outflows) Operation flow | 76,761 | (50,433 | ) | (7,499 | ) | |||||||
|
|
|
|
|
| |||||||
Opening balance Cash and cash equivalents acquired companies | — | 263,986 | 1,122 | |||||||||
Amount paid by Squeeze Out TAM S.A. (*) | — | (167,589 | ) | — | ||||||||
Certificate of bank deposits | 75,448 | (69,254 | ) | — | ||||||||
Other | — | — | (577 | ) | ||||||||
|
|
|
|
|
| |||||||
Total Other inflows (outflows) Investment flow | 75,448 | 27,143 | 545 | |||||||||
|
|
|
|
|
| |||||||
Aircraft Financing advances | 24,650 | (242,804 | ) | 163,754 | ||||||||
Credit card loan manager | (8,965 | ) | 76,280 | — | ||||||||
Settlement of derivative contracts | (61,897 | ) | (50,827 | ) | (9,219 | ) | ||||||
Breakage | (16,280 | ) | (7,405 | ) | — | |||||||
Other | 479 | (6,323 | ) | (7,686 | ) | |||||||
|
|
|
|
|
| |||||||
Total Other inflows (outflows) Financing flow | (62,013 | ) | (231,079 | ) | 146,849 | |||||||
|
|
|
|
|
| |||||||
NOTE 7 - FINANCIAL INSTRUMENTS
7.1. Financial instruments by category
| 7.1. | Financial instruments by category |
As of December 31, 20132016
Assets | Loans and receivables | Hedge derivatives | Held for trading | Initial designation as fair value through profit and loss | Total | |||||||||||||||||||||||||||||||||||
| Loans and receivables | Hedge derivatives | Held for trading | Initial designation as fair value through profit and loss | Total | ||||||||||||||||||||||||||||||||||||
| ThUS$ | ThUS$ | ThUS$ | ThUS$ | ThUS$ | ThUS$ | ThUS$ | ThUS$ | ThUS$ | ThUS$ | |||||||||||||||||||||||||||||||
Cash and cash equivalents | 1,405,554 | — | — | 579,349 | 1,984,903 | 933,805 | — | — | 15,522 | 949,327 | ||||||||||||||||||||||||||||||
Other financial assets, current (*) | 83,136 | 48,415 | 2,073 | 576,320 | 709,944 | 164,426 | 11,411 | — | 536,991 | 712,828 | ||||||||||||||||||||||||||||||
Trade and others accounts receivable, current | 1,633,094 | — | — | — | 1,633,094 | 1,107,889 | — | — | — | 1,107,889 | ||||||||||||||||||||||||||||||
Accounts receivable from related entities, current | 628 | — | — | — | 628 | 554 | — | — | — | 554 | ||||||||||||||||||||||||||||||
Other financial assets, non current (*) | 64,783 | — | 506 | — | 65,289 | 101,603 | — | 522 | — | 102,125 | ||||||||||||||||||||||||||||||
Accounts receivable, non current | 100,775 | — | — | — | 100,775 | 8,254 | — | — | — | 8,254 | ||||||||||||||||||||||||||||||
|
|
|
|
|
|
|
|
|
| |||||||||||||||||||||||||||||||
Total | 3,287,970 | 48,415 | 2,579 | 1,155,669 | 4,494,633 | 2,316,531 | 11,411 | 522 | 552,513 | 2,880,977 | ||||||||||||||||||||||||||||||
|
|
|
|
|
|
|
|
|
| |||||||||||||||||||||||||||||||
Liabilities | ||||||||||||||||||||||||||||||||||||||||
| Other financial liabilities | Hedge derivatives | Held for trading | Total | |||||||||||||||||||||||||||||||||||||
| ThUS$ | ThUS$ | ThUS$ | ThUS$ | |||||||||||||||||||||||||||||||||||||
Other liabilities, current | 1,969,281 | 66,466 | 4,040 | 2,039,787 | ||||||||||||||||||||||||||||||||||||
Trade and others accounts payable, current | 1,557,736 | — | — | 1,557,736 | ||||||||||||||||||||||||||||||||||||
Accounts payable to related entities, current | 505 | — | — | 505 | ||||||||||||||||||||||||||||||||||||
Other financial liabilities, non current | 7,803,588 | 54,906 | 1,491 | 7,859,985 | ||||||||||||||||||||||||||||||||||||
Accounts payable, non current | 922,887 | — | — | 922,887 | ||||||||||||||||||||||||||||||||||||
|
|
|
| |||||||||||||||||||||||||||||||||||||
Total | 12,253,997 | 121,372 | 5,531 | 12,380,900 | ||||||||||||||||||||||||||||||||||||
|
|
|
| |||||||||||||||||||||||||||||||||||||
Liabilities | Other financial liabilities | Held Hedge derivatives | Total | |||||||||
| ThUS$ | ThUS$ | ThUS$ | ||||||||||
Other liabilities, current | 1,814,647 | 24,881 | 1,839,528 | |||||||||
Trade and others accounts payable, current | 1,593,068 | — | 1,593,068 | |||||||||
Accounts payable to related entities, current | 269 | — | 269 | |||||||||
Other financial liabilities, non-current | 6,790,273 | 6,679 | 6,796,952 | |||||||||
Accounts payable, non-current | 359,391 | — | 359,391 | |||||||||
|
|
|
|
|
| |||||||
Total | 10,557,648 | 31,560 | 10,589,208 | |||||||||
|
|
|
|
|
| |||||||
| (*) | The value presented as initial designation as fair value through profit and loss, corresponds mainly to private investment funds; and loans and receivables corresponds to guarantees given. |
AtAs of December 31, 20122015
Assets | Loans and receivables | Hedge derivatives | Held for trading | Initial designation as fair value through profit and loss | Total | |||||||||||||||||||||||||||||||||||
| Loans and receivables | Hedge derivatives | Held for trading | Initial designation as fair value through profit and loss | Total | ||||||||||||||||||||||||||||||||||||
| ThUS$ | ThUS$ | ThUS$ | ThUS$ | ThUS$ | ThUS$ | ThUS$ | ThUS$ | ThUS$ | ThUS$ | |||||||||||||||||||||||||||||||
Cash and cash equivalents | 338,588 | — | — | 311,675 | �� | 650,263 | 726,897 | — | — | 26,600 | 753,497 | |||||||||||||||||||||||||||||
Other financial assets, current (*) | 162,367 | 4,104 | 74,359 | 395,713 | 636,543 | 28,385 | 16,578 | 157,575 | 448,810 | 651,348 | ||||||||||||||||||||||||||||||
Trade and others accounts receivable, current | 1,417,531 | — | — | — | 1,417,531 | 796,974 | — | — | — | 796,974 | ||||||||||||||||||||||||||||||
Accounts receivable from related entities, current | 15,187 | — | — | — | 15,187 | 183 | — | — | — | 183 | ||||||||||||||||||||||||||||||
Other financial assets, non current (*) | 72,470 | 1,118 | 507 | — | 74,095 | 88,820 | — | 638 | — | 89,458 | ||||||||||||||||||||||||||||||
Accounts receivable, non current | 50,612 | — | — | — | 50,612 | 10,715 | — | — | — | 10,715 | ||||||||||||||||||||||||||||||
|
|
|
|
|
|
|
|
|
| |||||||||||||||||||||||||||||||
Total | 2,056,755 | 5,222 | 74,866 | 707,388 | 2,844,231 | 1,651,974 | 16,578 | 158,213 | 475,410 | 2,302,175 | ||||||||||||||||||||||||||||||
|
|
|
|
|
|
|
|
|
| |||||||||||||||||||||||||||||||
Liabilities | ||||||||||||||||||||||||||||||||||||||||
| Other financial liabilities | Hedge derivatives | Held for trading | Total | |||||||||||||||||||||||||||||||||||||
| ThUS$ | ThUS$ | ThUS$ | ThUS$ | |||||||||||||||||||||||||||||||||||||
Other liabilities, current | 1,977,255 | 65,598 | 4,477 | 2,047,330 | ||||||||||||||||||||||||||||||||||||
Trade and others accounts payable, current | 1,689,990 | — | — | 1,689,990 | ||||||||||||||||||||||||||||||||||||
Accounts payable to related entities, current | 274 | — | — | 274 | ||||||||||||||||||||||||||||||||||||
Other financial liabilities, non current | 7,582,302 | 111,040 | 5,515 | 7,698,857 | ||||||||||||||||||||||||||||||||||||
Accounts payable, non current | 1,085,601 | — | — | 1,085,601 | ||||||||||||||||||||||||||||||||||||
|
|
|
| |||||||||||||||||||||||||||||||||||||
Total | 12,335,422 | 176,638 | 9,992 | 12,522,052 | ||||||||||||||||||||||||||||||||||||
|
|
|
| |||||||||||||||||||||||||||||||||||||
Liabilities | Other financial liabilities | Held Hedge derivatives | Total | |||||||||
| ThUS$ | ThUS$ | ThUS$ | ||||||||||
Other liabilities, current | 1,510,146 | 134,089 | 1,644,235 | |||||||||
Trade and others accounts payable, current | 1,483,957 | — | 1,483,957 | |||||||||
Accounts payable to related entities, current | 447 | — | 447 | |||||||||
Other financial liabilities, non-current | 7,516,257 | 16,128 | 7,532,385 | |||||||||
Accounts payable, non-current | 417,050 | — | 417,050 | |||||||||
|
|
|
|
|
| |||||||
Total | 10,927,857 | 150,217 | 11,078,074 | |||||||||
|
|
|
|
|
| |||||||
| (*) | The value presented as initial designation as fair value through profit and loss, corresponds mainly to private investment funds; and loans and receivables corresponds to guarantees given. |
7.2. Financial instruments by currency
a) Assets
| 7.2. | Financial instruments by currency |
| As of December 31, 2013 | As of December 31, 2012 | |||||||||||||||
| a) Assets | As of December 31, 2016 | As of December 31, 2015 | ||||||||||||||
| ThUS$ | ThUS$ | ThUS $ | ThUS $ | |||||||||||||
Cash and cash equivalents | 1,984,903 | 650,263 | 949,327 | 753,497 | ||||||||||||
Argentine peso | 59,018 | 70,381 | 7,871 | 18,733 | ||||||||||||
Brazilian real | 253,392 | 149,723 | 97,401 | 106,219 | ||||||||||||
Chilean peso | 229,918 | 40,212 | 30,758 | 17,978 | ||||||||||||
Colombian peso | 28,132 | 28,758 | 4,336 | 14,601 | ||||||||||||
Euro | 16,571 | 15,502 | 1,695 | 10,663 | ||||||||||||
US Dollar | 1,200,828 | 230,776 | 780,124 | 564,214 | ||||||||||||
Strong bolívar | 162,809 | 51,346 | ||||||||||||||
Strong bolivar | 61 | 2,986 | ||||||||||||||
Other currencies | 34,235 | 63,565 | 27,081 | 18,103 | ||||||||||||
Other financial assets (current and non current) | 775,233 | 710,638 | ||||||||||||||
Other financial assets (current and non-current) | 814,953 | 740,806 | ||||||||||||||
Argentine peso | 1,007 | 131 | 337 | 157,281 | ||||||||||||
Brazilian real | 610,242 | 545,426 | 686,501 | 449,934 | ||||||||||||
Chilean peso | 27,555 | 648 | 668 | 640 | ||||||||||||
Colombian peso | 2,550 | 2,828 | 1,023 | 1,670 | ||||||||||||
Euro | 5,494 | 7,825 | 6,966 | 614 | ||||||||||||
US Dollar | 127,294 | 142,254 | 117,346 | 128,620 | ||||||||||||
Strong bolívar | 14 | 601 | ||||||||||||||
Strong bolivar | 76 | 22 | ||||||||||||||
Other currencies | 1,077 | 10,925 | 2,036 | 2,025 | ||||||||||||
Trade and other accounts receivable, current | 1,633,094 | 1,417,531 | 1,107,889 | 796,974 | ||||||||||||
Argentine peso | 27,343 | 33,049 | 82,770 | 71,438 | ||||||||||||
Brazilian real | 802,789 | 552,947 | 551,260 | 191,037 | ||||||||||||
Chilean peso | 82,880 | 132,869 | 92,791 | 57,755 | ||||||||||||
Colombian peso | 9,762 | 8,086 | 16,454 | 13,208 | ||||||||||||
Euro | 21,479 | 67,287 | 21,923 | 30,006 | ||||||||||||
US Dollar | 520,991 | 530,380 | 312,394 | 344,153 | ||||||||||||
Strong bolívar | 2,353 | 2,759 | ||||||||||||||
Strong bolivar | 43 | 7,225 | ||||||||||||||
Other currencies (*) | 165,497 | 90,154 | 30,254 | 82,152 | ||||||||||||
Accounts receivable, non-current | 100,775 | 50,612 | 8,254 | 10,715 | ||||||||||||
Brazilian real | 1,194 | 6,677 | 4 | 521 | ||||||||||||
Chilean peso | 8,624 | 9,564 | 8,250 | 5,041 | ||||||||||||
US Dollar | 90,755 | 34,123 | — | 5,000 | ||||||||||||
Other currencies | 202 | 248 | ||||||||||||||
Other currencies (*) | — | 153 | ||||||||||||||
Accounts receivable from related entities, current | 628 | 15,187 | 554 | 183 | ||||||||||||
Brazilian real | 162 | 611 | — | 2 | ||||||||||||
Chilean peso | 466 | 14,565 | 554 | 181 | ||||||||||||
US Dollar | — | 11 | ||||||||||||||
Total assets | 4,494,633 | 2,844,231 | 2,880,977 | 2,302,175 | ||||||||||||
Argentine peso | 87,368 | 103,561 | 90,978 | 247,452 | ||||||||||||
Brazilian real | 1,667,779 | 1,255,384 | 1,335,166 | 747,713 | ||||||||||||
Chilean peso | 349,443 | 197,858 | 133,021 | 81,595 | ||||||||||||
Colombian peso | 40,444 | 39,672 | 21,813 | 29,479 | ||||||||||||
Euro | 43,544 | 90,614 | 30,584 | 41,283 | ||||||||||||
US Dollar | 1,939,868 | 937,544 | 1,209,864 | 1,041,987 | ||||||||||||
Strong bolívar | 165,176 | 54,706 | ||||||||||||||
Strong bolivar | 180 | 10,233 | ||||||||||||||
Other currencies | 201,011 | 164,892 | 59,371 | 102,433 | ||||||||||||
| (*) | See the composition of the others currencies in Note 8 Trade, other accounts receivable and non-current accounts receivable. |
(*) Other currencies Australian Dollar Chinese Yuan Danish krone Pound Sterling Indian rupee Japanese Yen Norwegian kroner Swiss Franc Korean Won New Taiwanese Dollar Other currencies As of
December 31,
2013 As of
December 31,
2012 ThUS$ ThUS$ 165,497 90,154 26,198 15,944 22,887 4,173 6,899 10,477 15,256 10,159 5,343 3,296 10,332 5,271 14,970 666 6,645 1,394 16,929 3,362 9,670 478 30,368 34,934
b) Liabilities
| b) | Liabilities |
Liabilities information is detailed in the table within Note 3 Financial risk management.
NOTE 8 - TRADE AND OTHER ACCOUNTS RECEIVABLE CURRENT, AND NON-CURRENT ACCOUNTS RECEIVABLE
| As of | As of | |||||||||||||||
| December 31, | December 31, | |||||||||||||||
| 2013 | 2012 | As of December 31, 2016 | As of December 31, 2015 | |||||||||||||
| ThUS$ | ThUS$ | ThUS$ | ThUS$ | |||||||||||||
Trade accounts receivable | 1,552,489 | 1,360,666 | 1,022,933 | 685,733 | ||||||||||||
Other accounts receivable | 251,982 | 182,980 | 170,264 | 182,028 | ||||||||||||
|
|
|
| |||||||||||||
Total trade and other accounts receivable | 1,804,471 | 1,543,646 | 1,193,197 | 867,761 | ||||||||||||
Less: Allowance for impairment loss | (70,602 | ) | (75,503 | ) | (77,054 | ) | (60,072 | ) | ||||||||
|
|
|
| |||||||||||||
Total net trade and accounts receivable | 1,733,869 | 1,468,143 | 1,116,143 | 807,689 | ||||||||||||
Less: non-current portion – accounts receivable | (100,775 | ) | (50,612 | ) | (8,254 | ) | (10,715 | ) | ||||||||
|
|
|
| |||||||||||||
Trade and other accounts receivable, current | 1,633,094 | 1,417,531 | 1,107,889 | 796,974 | ||||||||||||
|
|
|
| |||||||||||||
The fair value of trade and other accounts receivable does not differ significantly from the book value.
The maturity of these accounts at the end of each period is as follows:
| As of | As of | As of December 31, 2016 | As of December 31, 2015 | |||||||||||||
| December 31, | December 31, | ThUS$ | ThUS$ | |||||||||||||
| 2013 | 2012 | |||||||||||||||
| ThUS$ | ThUS$ | |||||||||||||||
Day | 1,378,226 | 1,231,937 | ||||||||||||||
Fully performing | 896,040 | 577,902 | ||||||||||||||
Matured accounts receivable, but not impaired | ||||||||||||||||
Expired from 1 to 90 days | 72,417 | 33,160 | 38,969 | 28,717 | ||||||||||||
Expired from 91 to 180 days | 11,547 | 10,705 | 9,303 | 10,995 | ||||||||||||
More than 180 days overdue (*) | 19,697 | 9,361 | 1,567 | 8,047 | ||||||||||||
|
| |||||||||||||||
Total matured accounts receivable, but not impaired | 49,839 | 47,759 | ||||||||||||||
|
| |||||||||||||||
Matured accounts receivable and impaired | ||||||||||||||||
Judicial, pre-judicial collection and protested documents | 19,630 | 29,556 | 34,909 | 24,304 | ||||||||||||
Debtor under pre-judicial collection process and portfolio sensitization | 50,972 | 45,947 | 42,145 | 35,768 | ||||||||||||
|
|
|
| |||||||||||||
Total matured accounts receivable and impaired | 77,054 | 60,072 | ||||||||||||||
|
| |||||||||||||||
Total | 1,552,489 | 1,360,666 | 1,022,933 | 685,733 | ||||||||||||
|
|
|
| |||||||||||||
| (*) | Value of this segment corresponds primarily to accounts receivable that were evaluated in their ability to recover, therefore not requiring a provision. |
The receivable past due but not impaired at the end of each period is as follows:
| As of | As of | |||||||
| �� | December 31, | December 31, | ||||||
| 2013 | 2012 | |||||||
| ThUS$ | ThUS$ | |||||||
Expired from 1 to 90 days | 72,417 | 33,160 | ||||||
Expired from 91 to 180 days | 11,547 | 10,705 | ||||||
More than 180 days overdue | 19,697 | 9,361 | ||||||
|
|
|
| |||||
Total | 103,661 | 53,226 | ||||||
|
|
|
| |||||
The amounts of individually impaired Trade and other accounts receivable are as follows:
| As of | As of | |||||||
| December 31, | December 31, | |||||||
| 2013 | 2012 | |||||||
| ThUS$ | ThUS$ | |||||||
Judicial, pre-judicial collection and protested documents | 19,630 | 29,556 | ||||||
Debtors under pre-judicial collection process and portfolio sensitization | 50,972 | 45,947 | ||||||
|
|
|
| |||||
Total | 70,602 | 75,503 | ||||||
|
|
|
| |||||
Currency balances that make up the Trade and other accounts receivable and Accountsnon-current accounts receivable at December 31, 2013 and December 31, 2012, are as follows:the following:
| As of | As of | |||||||||||||||
| December 31, | December 31, | |||||||||||||||
Currency | 2013 | 2012 | As of December 31, 2016 | As of December 31, 2015 | ||||||||||||
| ThUS$ | ThUS$ | ThUS$ | ThUS$ | |||||||||||||
Argentine Peso | 27,343 | 33,049 | 82,770 | 71,438 | ||||||||||||
Brazilian Real | 803,983 | 559,624 | 551,264 | 191,558 | ||||||||||||
Chilean Peso | 91,504 | 142,433 | 101,041 | 62,796 | ||||||||||||
Colombian peso | 9,762 | 8,086 | 16,454 | 13,208 | ||||||||||||
Euro | 21,479 | 67,287 | 21,923 | 30,006 | ||||||||||||
US Dollar | 611,746 | 564,503 | 312,394 | 349,153 | ||||||||||||
Strong bolivar | 2,353 | 2,759 | 43 | 7,225 | ||||||||||||
Other currency (*) | 165,699 | 90,402 | 30,254 | 82,305 | ||||||||||||
|
|
|
| |||||||||||||
Total | 1,733,869 | 1,468,143 | 1,116,143 | 807,689 | ||||||||||||
|
|
|
| |||||||||||||
(*) Other currencies | ||||||||||||||||
Australian Dollar | 26,198 | 15,944 | 5,487 | 26,185 | ||||||||||||
Chinese Yuan | 22,887 | 4,173 | 271 | 4,282 | ||||||||||||
Danish krone | 6,899 | 10,477 | ||||||||||||||
Danish Krone | 151 | 164 | ||||||||||||||
Pound Sterling | 15,256 | 10,159 | 3,904 | 7,228 | ||||||||||||
Indian rupee | 5,343 | 3,296 | ||||||||||||||
Indian Rupee | 303 | 3,070 | ||||||||||||||
Japanese Yen | 10,332 | 5,271 | 2,601 | 4,343 | ||||||||||||
Norwegian kroner | 14,970 | 666 | ||||||||||||||
Norwegian Kroner | 184 | 221 | ||||||||||||||
Swiss Franc | 6,645 | 1,394 | 1,512 | 1,919 | ||||||||||||
Korean Won | 16,929 | 3,362 | 4,241 | 4,462 | ||||||||||||
New Taiwanese Dollar | 9,670 | 478 | 662 | 3,690 | ||||||||||||
Other currencies | 30,570 | 35,182 | 10,938 | 26,741 | ||||||||||||
|
|
|
| |||||||||||||
Total | 165,699 | 90,402 | 30,254 | 82,305 | ||||||||||||
|
|
|
| |||||||||||||
The Company records allowances when there is evidence of impairment of trade receivables. The criteria used to determine that there is objective evidence of impairment losses are the maturity of the portfolio, specific acts of damage (default) and specific market signals.
Maturity | Impairment | |||
Judicial and pre-judicial collection assets | 100 | % | ||
Over 1 year | 100 | % | ||
Between 6 and 12 months | 50 | % | ||
The movementMovement in the allowance for impairment loss of Trade and other accounts receivables between January 1, 2011 and December 31, 2013 is as follows:are the following:
| ||||
| ||||
| ||||
| ||||
| ||||
| ||||
| ||||
| ||||
| ||||
| ||||
| ||||
| ||||
| ||||
| ||||
Periods | Opening balance ThUS$ | Write-offs ThUS$ | (Increase) Decrease ThUS$ | Closing balance ThUS$ | ||||||||||||
From January 1 to December 31, 2014 | (70,602 | ) | 6,864 | (7,304 | ) | (71,042 | ) | |||||||||
From January 1 to December 31, 2015 | (71,042 | ) | 10,120 | 850 | (60,072 | ) | ||||||||||
From January 1 to December 31, 2016 | (60,072 | ) | 20,910 | (37,892 | ) | (77,054 | ) | |||||||||
Once pre-judicial and judicial collection efforts are exhausted, the assets are written off against the allowance. The Company only uses the allowance method rather than direct write-off, to ensure control.
Historic and current re-negotiations are not relevant and the policy is to analyze case by case in order to classify them according to the existence of risk, determining whether it is appropriate to re-classify accounts to pre-judicial recovery. If such re-classification is justified, an allowance is made for the account, whether overdue or falling due.
The maximum credit-risk exposure at the date of presentation of the information is the fair value of each one of the categories of accounts receivable indicated above.
| As of December 31, 2013 | As of December 31, 2012 | |||||||||||||||||||||||||||||||||||||||||||||||
| Gross exposure | Gross | Exposure net | Gross exposure | Gross | Exposure net | |||||||||||||||||||||||||||||||||||||||||||
| according to | impaired | of risk | according to | Impaired | of risk | As of December 31, 2016 | As of December 31, 2015 | |||||||||||||||||||||||||||||||||||||||||
| balance | exposure | concentrations | balance | exposure | concentrations | Gross exposure according to balance | Gross impaired exposure | Exposure net of risk concentrations | Gross exposure according to balance | Gross Impaired exposure | Exposure net of risk concentrations | |||||||||||||||||||||||||||||||||||||
| ThUS$ | ThUS$ | ThUS$ | ThUS$ | ThUS$ | ThUS$ | ThUS$ | ThUS$ | ThUS$ | ThUS$ | ThUS$ | ThUS$ | |||||||||||||||||||||||||||||||||||||
Trade accounts receivable | 1,552,489 | (70,602 | ) | 1,481,887 | 1,360,666 | (75,503 | ) | 1,285,163 | 1,022,933 | (77,054 | ) | 945,879 | 685,733 | (60,072 | ) | 625,661 | ||||||||||||||||||||||||||||||||
Other accounts receivable | 251,982 | — | 251,982 | 182,980 | — | 182,980 | 170,264 | — | 170,264 | 182,028 | — | 182,028 | ||||||||||||||||||||||||||||||||||||
There are no relevant guarantees covering credit risk and these are valued when they are settled; no materially significant direct guarantees exist. Existing guarantees, if appropriate, are made through IATA.
NOTE 9 - ACCOUNTS RECEIVABLE FROM/PAYABLE TO RELATED ENTITIES
The Accounts receivable from and payable to related entities as of December 31, 2013 and December 31, 2012, respectively, are as follows:
(a) Accounts Receivable
| (a) | Accounts Receivable |
| As of | As of | |||||||||||||||||||
| Country | December 31, | December 31, | Transaction | Nature of | ||||||||||||||||
Tax No. | Related party | Relationship | of origin | 2013 | 2012 | Currency | deadlines | transaction | ||||||||||||
| ThUS$ | ThUS$ | |||||||||||||||||||
96.810.370-9 | Inversiones Costa Verde Ltda. y CPA. | Controlling shareholder | Chile | — | 1 | CLP | 30 to 45 days | Monetary | ||||||||||||
78.591.370-1 | Bethia S.A. y Filiales | Others related parties | Chile | 441 | 14,534 | CLP | 30 to 45 days | Monetary | ||||||||||||
79.773.440-1 | Transportes San Felipe S.A. | Others related parties | Chile | 1 | — | CLP | 30 to 45 days | Monetary | ||||||||||||
87.752.000-5 | Granja Marina Tornagaleones S.A. | Others related parties | Chile | 24 | 30 | CLP | 30 to 45 days | Monetary | ||||||||||||
Foreign | Made In Everywhere Repr. Com. Distr. Ltda. | Others related parties | Brazil | 2 | — | BRL | 30 to 45 days | Monetary | ||||||||||||
Foreign | TAM Aviação Executiva e Taxi Aéreo S.A. | Others related parties | Brazil | 14 | 14 | BRL | 30 to 45 days | Monetary | ||||||||||||
Foreign | Prisma Fidelidade S.A. | Others related parties | Brazil | 146 | 597 | BRL | 30 to 45 days | Monetary | ||||||||||||
Foreign | Inversora Aeronáutica Argentina | Others related parties | Argentina | — | 11 | US$ | 30 to 45 days | Monetary | ||||||||||||
|
|
|
| |||||||||||||||||
| Total current assets | 628 | 15,187 | ||||||||||||||||||
|
|
|
| |||||||||||||||||
On December 28, 2012, Inmobiliaria Aeronáutica S.A. as seller and Sotraser S.A. (Subsidiary of Bethia S.A.) as purchaser, entered into an agreement to purchase the land called “Lot No. 12 of parcellation project Lo Echevers”. The value of the sale amounts to ThUS$ 14,217. On December 31, 2013, this balance is paid.
(b) Accounts payable
Tax No. | Related party | Relationship | Country of origin | Currency | As of December 31, 2016 | As of December 31, 2016 | ||||||||||
| ThUS$ | ThUS$ | |||||||||||||||
| 78.591.370-1 | Bethia S.A. and Subsidiaries | Related director | Chile | CLP | 538 | 167 | ||||||||||
| 87.752.000-5 | Granja Marina Tornagaleones S.A. | Common shareholder | Chile | CLP | 14 | 14 | ||||||||||
| 96.810.370-9 | Inversiones Costa Verde Ltda. y CPA. | Controller | Chile | CLP | 2 | — | ||||||||||
| Foreign | TAM Aviação Executiva e Taxi Aéreo S.A. | Related director | Brazil | BRL | — | 2 | ||||||||||
|
|
|
| |||||||||||||
| Total current assets | 554 | 183 | ||||||||||||||
|
|
|
| |||||||||||||
| Country | As of | As of | ||||||||||||||||||
| of | December 31, | December 31, | Transaction | Nature of | ||||||||||||||||
Tax No. | Related party | Relationship | origin | 2013 | 2012 | Currency | deadlines | transaction | ||||||||||||
| ThUS$ | ThUS$ | |||||||||||||||||||
96.847.880-K | Lufthansa Lan Technical Training S.A. | Associate | Chile | 187 | 237 | US$ | 30 to 45 days | Monetary | ||||||||||||
78.591.370-1 | Bethia S.A. y Filiales | Other related parties | Chile | 14 | 14 | CLP | 30 to 45 days | Monetary | ||||||||||||
Foreign | Made In Everywhere Repr. Com. Distr. Ltda. | Other related parties | Brazil | — | 23 | BRL | 30 to 45 days | Monetary | ||||||||||||
Foreign | Inversora Aeronaútica Argentina | Other related parties | Argentina | 304 | — | US$ | 30 to 45 days | Monetary | ||||||||||||
|
|
|
| |||||||||||||||||
| Total current liabilities | 505 | 274 | ||||||||||||||||||
|
|
|
| |||||||||||||||||
| (b) | Accounts payable |
Tax No. | Related party | Relationship | Country of origin | Currency | As of December 31, 2016 | As of December 31, 2015 | ||||||||||
| ThUS$ | ThUS$ | |||||||||||||||
| Foreign | Consultoría Administrativa Profesional S.A. de C.V. | Associate | Mexico | MXN | 170 | 342 | ||||||||||
| 65.216.000-K | Viajes Falabella Ltda. | Related director | Chile | CLP | 46 | 68 | ||||||||||
| 79.773.440-3 | TAM Aviação Executiva e Taxi Aéreo S.A. | Related director | Brazil | BRL | 28 | — | ||||||||||
| 65.216.000-K | Comunidad Mujer | Related director | Chile | CLP | 13 | 10 | ||||||||||
| 78.591.370-1 | Bethia S.A. and Subsidiaries | Related director | Chile | CLP | 6 | 5 | ||||||||||
| 79.773.440-3 | Transportes San Felipe S.A | Common property | Chile | CLP | 4 | — | ||||||||||
| Foreign | Inversora Aeronaútica Argentina | Related director | Argentina | US$ | 2 | 22 | ||||||||||
|
|
|
| |||||||||||||
| Total current liabilities | 269 | 447 | ||||||||||||||
|
|
|
| |||||||||||||
Transactions between related parties have been carried out on free-trade conditions between interested and duly-informed parties. The transaction times are between 30 and 45 days, and the nature of settlement of the transactions is monetary.
The composition of Inventories December 31, 2013 and December 31, 2012 respectively, are detailed below:is as follows:
| As of | As of | |||||||||||||||
| December 31, | December 31, | |||||||||||||||
| 2013 | 2012 | As of December 31, 2016 | As of December 31, 2015 | |||||||||||||
| ThUS$ | ThUS$ | ThUS$ | ThUS$ | |||||||||||||
Technical stock | 190,202 | 145,665 | 191,864 | 192,930 | ||||||||||||
Non-technical stock | 40,826 | 31,153 | 49,499 | 31,978 | ||||||||||||
|
|
|
| |||||||||||||
Total production suppliers | 231,028 | 176,818 | ||||||||||||||
Total | 241,363 | 224,908 | ||||||||||||||
|
|
|
| |||||||||||||
The items included in this heading are spare parts and materials that will be used mainly in consumption in in-flight and maintenance services provided to the Company and third parties, which are valued at average cost, net of provision for obsolescence, that as of December 31, 2013 amounts to ThUS$ 1,757 (ThUS$ 1,174 as of December 31, 2012). per the following detail:
| As of December 31, 2016 | As of December 31, 2015 | |||||||
| ThUS$ | ThUS$ | |||||||
Provision for obsolescence Technical stock | 31,647 | 13,303 | ||||||
Provision for obsolescence Non-technical stock | 3,429 | 2,589 | ||||||
|
|
|
| |||||
Total | 35,076 | 15,892 | ||||||
|
|
|
| |||||
The resulting amounts do not exceed the respective net realizable values.
As of December 31, 2013,2016, the Company recorded ThUS$ 160,068167,365 (ThUS$ 127,989 as of160,030 at December 31, 2012, ThUS$ 41,213 as of December 31, 2011)2015) within the income statement, mainly due to in-flight consumption and maintenance, which forms part of Cost of sales.
The composition of Tax assets is as follows:
| As of | As of | |||||||
| December 31, | December 31, | |||||||
| 2013 | 2012 | |||||||
| ThUS$ | ThUS$ | |||||||
Current | ||||||||
Provisional monthly payments (advance) | 61,570 | 76,173 | ||||||
Other credits recovery | 20,320 | 19,612 | ||||||
|
|
|
| |||||
Total current | 81,890 | 95,785 | ||||||
|
|
|
| |||||
NOTE 1211 - OTHER FINANCIAL ASSETS
The composition of Other financial assets is as follows:
| As of | As of | |||||||
| December 31, | December 31, | |||||||
| 2013 | 2012 | |||||||
| ThUS$ | ThUS$ | |||||||
Current | ||||||||
(a) Other financial assets | 661,529 | 632,439 | ||||||
(b) Hedging asset | 48,415 | 4,104 | ||||||
|
|
|
| |||||
Total current | 709,944 | 636,543 | ||||||
|
|
|
| |||||
Non-current | ||||||||
(a) Other financial assets | 65,289 | 72,977 | ||||||
(b) Hedging asset | — | 1,118 | ||||||
|
|
|
| |||||
Total non-current | 65,289 | 74,095 | ||||||
|
|
|
| |||||
(a) Other financial assets
Other financial assets as of December 31, 2013 and December 31, 2012, respectively, are as follows:
| Current Assets | Non-current assets | Total Assets | ||||||||||||||||||||||
| As of December 31, 2016 | As of December 31, 2015 | As of December 31, 2016 | As of December 31, 2015 | As of December 31, 2016 | As of December 31, 2015 | |||||||||||||||||||
| ThUS$ | ThUS$ | ThUS$ | ThUS$ | ThUS$ | ThUS$ | |||||||||||||||||||
(a ) Other financial assets | ||||||||||||||||||||||||
Private investment funds | 536,991 | 448,810 | — | — | 536,991 | 448,810 | ||||||||||||||||||
Deposits in guarantee (aircraft) | 16,819 | 16,532 | 56,846 | 58,483 | 73,665 | 75,015 | ||||||||||||||||||
Guarantees for margins of derivatives | 939 | 4,456 | — | — | 939 | 4,456 | ||||||||||||||||||
Other investments | — | — | 522 | 638 | 522 | 638 | ||||||||||||||||||
Domestic and foreign bonds | — | 157,575 | — | — | — | 157,575 | ||||||||||||||||||
Other guarantees given | 140,733 | 6,160 | 44,757 | 30,337 | 185,490 | 36,497 | ||||||||||||||||||
Other | 5,935 | 1,237 | — | — | 5,935 | 1,237 | ||||||||||||||||||
|
|
|
|
|
|
|
|
|
|
|
| |||||||||||||
Subtotal of other financial assets | 701,417 | 634,770 | 102,125 | 89,458 | 803,542 | 724,228 | ||||||||||||||||||
|
|
|
|
|
|
|
|
|
|
|
| |||||||||||||
(b) Hedging assets | ||||||||||||||||||||||||
Interest accrued since the last payment date of Cross currency swap | 64 | 397 | — | — | 64 | 397 | ||||||||||||||||||
Fair value of foreign currency derivatives (*) | 1,259 | 9,888 | — | — | 1,259 | 9,888 | ||||||||||||||||||
Fair value of fuel price derivatives | 10,088 | 6,293 | — | — | 10,088 | 6,293 | ||||||||||||||||||
|
|
|
|
|
|
|
|
|
|
|
| |||||||||||||
Subtotal of hedging assets | 11,411 | 16,578 | — | — | 11,411 | 16,578 | ||||||||||||||||||
|
|
|
|
|
|
|
|
|
|
|
| |||||||||||||
Total Other Financial Assets | 712,828 | 651,348 | 102,125 | 89,458 | 814,953 | 740,806 | ||||||||||||||||||
|
|
|
|
|
|
|
|
|
|
|
| |||||||||||||
| As of | As of | |||||||
| December 31, | December 31, | |||||||
| 2013 | 2012 | |||||||
| ThUS$ | ThUS$ | |||||||
Current | ||||||||
Private investment funds | 544,182 | 317,598 | ||||||
Deposits in guarantee (aircraft) | 51,879 | 33,012 | ||||||
Time deposits | 28,181 | — | ||||||
Guarantees for margins of derivatives | 28,157 | 121,889 | ||||||
Certificate of deposit (CBD) | 2,374 | 77,316 | ||||||
Other investments | 1,583 | 799 | ||||||
Domestic and foreign bonds | 351 | 748 | ||||||
Financial letters | — | 73,611 | ||||||
Other guarantees given | 4,822 | 7,466 | ||||||
|
|
|
| |||||
Total current | 661,529 | 632,439 | ||||||
|
|
|
| |||||
Non-current | ||||||||
Deposits in guarantee (aircraft) | 49,893 | 37,247 | ||||||
Deposits in guarantee (loan) | 11,753 | 29,344 | ||||||
Other investments | 506 | 507 | ||||||
Other guarantees given | 3,137 | 5,879 | ||||||
|
|
|
| |||||
Total non-current | 65,289 | 72,977 | ||||||
|
|
|
| |||||
Total other financial assets | 726,818 | 705,416 | ||||||
|
|
|
| |||||
(b) Hedging assets
Hedging assets as of December 31, 2013 and December 31, 2012, are as follows:
| As of | As of | |||||||
| December 31, | December 31, | |||||||
| 2013 | 2012 | |||||||
| ThUS$ | ThUS$ | |||||||
Current | ||||||||
Interest accrued since the last payment date of currency Swap | 483 | — | ||||||
Fair value of interest rate derivatives | 6 | 6 | ||||||
Fair value of foreign currency derivatives | 32,058 | — | ||||||
Fair value of fuel price derivatives | 15,868 | 4,098 | ||||||
|
|
|
| |||||
Total current | 48,415 | 4,104 | ||||||
|
|
|
| |||||
Non-current | ||||||||
Fair value of foreign currency derivatives | — | 95 | ||||||
Fair value of fuel price derivatives | — | 1,023 | ||||||
|
|
|
| |||||
Total non-current | — | 1,118 | ||||||
|
|
|
| |||||
Total hedging asset | 48,415 | 5,222 | ||||||
|
|
|
| |||||
The foreign currency derivatives exchange is collars and cross currency swap.
| (*) | The foreign currency derivatives correspond to forward and combination of options. |
The types of derivative hedging contracts maintained by the Company at the end of each period are presenteddescribed in Note 21.19.
NOTE 1312 - OTHER NON-FINANCIAL ASSETS
The composition of Other non-financial assets is as follows:
| As of | As of | |||||||
| December 31, | December 31, | |||||||
| 2013 | 2012 | |||||||
| ThUS$ | ThUS$ | |||||||
Current | ||||||||
(a) Advance payments | 56,392 | 45,826 | ||||||
(b) Other assets | 279,225 | 238,578 | ||||||
|
|
|
| |||||
Total current | 335,617 | 284,404 | ||||||
|
|
|
| |||||
Non-Current | ||||||||
(a) Advance payments | 55,889 | 39,707 | ||||||
(b) Other assets | 216,387 | 268,280 | ||||||
|
|
|
| |||||
Total non-current | 272,276 | 307,987 | ||||||
|
|
|
| |||||
(a) Advance payments
Advance payments as of December 31, 2013 as of December 31, 2012 are as follows:
| As of | As of | |||||||
| December 31, | December 31, | |||||||
| 2013 | 2012 | |||||||
| ThUS$ | ThUS$ | |||||||
Current | ||||||||
Aircraft leases | 28,555 | 18,703 | ||||||
Aircraft insurance and other | 13,180 | 12,643 | ||||||
Handling and ground handling services | 286 | 158 | ||||||
Others | 14,371 | 14,322 | ||||||
|
|
|
| |||||
Total current | 56,392 | 45,826 | ||||||
|
|
|
| |||||
Non-Current | ||||||||
Aircraft leases | 17,332 | 20,732 | ||||||
Others | 38,557 | 18,975 | ||||||
|
|
|
| |||||
Total non-current | 55,889 | 39,707 | ||||||
|
|
|
| |||||
Total advance payments | 112,281 | 85,533 | ||||||
|
|
|
| |||||
(b) Other assets
Other assets as of December 31, 2013, and December 31, 2012 are as follows:
| As of | As of | Current Assets | Non-current assets | Total Assets | ||||||||||||||||||||||||||||
| December 31, | December 31, | As of December 31, 2016 | As of December 31, 2015 | As of December 31, 2016 | As of December 31, 2015 | As of December 31, 2016 | As of December 31, 2015 | |||||||||||||||||||||||||
| 2013 | 2012 | ThUS $ | ThUS $ | ThUS $ | ThUS $ | ThUS $ | ThUS $ | |||||||||||||||||||||||||
(a ) Advance payments | ||||||||||||||||||||||||||||||||
Aircraft leases | 37,560 | 33,305 | 14,065 | 22,569 | 51,625 | 55,874 | ||||||||||||||||||||||||||
Aircraft insurance and other | 14,717 | 12,408 | — | — | 14,717 | 12,408 | ||||||||||||||||||||||||||
Others | 4,521 | 16,256 | 1,573 | 33,781 | 6,094 | 50,037 | ||||||||||||||||||||||||||
| ThUS$ | ThUS$ |
|
|
|
|
|
| |||||||||||||||||||||||||
Current | ||||||||||||||||||||||||||||||||
Subtotal advance payments | 56,798 | 61,969 | 15,638 | 56,350 | 72,436 | 118,319 | ||||||||||||||||||||||||||
|
|
|
|
|
| |||||||||||||||||||||||||||
(b) Other assets | ||||||||||||||||||||||||||||||||
Aircraft maintenance reserve (*) | 152,797 | 123,299 | 51,576 | 99,112 | 90,175 | 64,366 | 141,751 | 163,478 | ||||||||||||||||||||||||
Sales tax | 120,215 | 106,736 | 102,351 | 158,134 | 40,232 | 45,061 | 142,583 | 203,195 | ||||||||||||||||||||||||
Others taxes | 5,556 | 7,847 | ||||||||||||||||||||||||||||||
Other taxes | 500 | 4,295 | — | — | 500 | 4,295 | ||||||||||||||||||||||||||
Contributions to Société Internationale de Télécommunications Aéronautiques (“SITA”) | 657 | 696 | 406 | 505 | 591 | 547 | 997 | 1,052 | ||||||||||||||||||||||||
|
| |||||||||||||||||||||||||||||||
Total current | 279,225 | 238,578 | ||||||||||||||||||||||||||||||
|
| |||||||||||||||||||||||||||||||
Non-current | ||||||||||||||||||||||||||||||||
Aircraft maintenance reserve (*) | 79,012 | 140,116 | ||||||||||||||||||||||||||||||
Judicial deposits | 70,380 | 54,336 | — | — | 90,604 | 67,980 | 90,604 | 67,980 | ||||||||||||||||||||||||
Sales tax | 65,936 | 73,050 | ||||||||||||||||||||||||||||||
Contributions to Société Internationale de Télécommunications Aéronautiques (“SITA”) | 515 | 474 | ||||||||||||||||||||||||||||||
Others | 544 | 304 | 611 | 6,001 | 104 | 1,159 | 715 | 7,160 | ||||||||||||||||||||||||
|
|
|
|
|
|
|
| |||||||||||||||||||||||||
Total non-current | 216,387 | 268,280 | ||||||||||||||||||||||||||||||
Subtotal other assets | 155,444 | 268,047 | 221,706 | 179,113 | 377,150 | 447,160 | ||||||||||||||||||||||||||
|
|
|
|
|
|
|
| |||||||||||||||||||||||||
Total other assets | 495,612 | 506,858 | ||||||||||||||||||||||||||||||
Total Other Non - Financial Assets | 212,242 | 330,016 | 237,344 | 235,463 | 449,586 | 565,479 | ||||||||||||||||||||||||||
|
|
|
|
|
|
|
| |||||||||||||||||||||||||
| (*) | Aircraft maintenance reserves reflect prepayment deposits made by the group to lessors of certain aircraft under operating lease agreements in order to ensure that funds are available to support the scheduled heavy maintenance of the aircraft. |
These amounts are calculated based on performance measures, such as flight hours or cycles, are payablepaid periodically (usually monthly) and are contractually required to be repaid to the lessee upon the completion of the required maintenance of the leased aircraft. At the end of the lease term, any unused maintenance reserves are either returned to the Company in cash or used to offset amounts that we may owe the lessor as a maintenance adjustment.
In some cases (10(five lease agreements), if the maintenance cost incurred by LATAM is less than the corresponding maintenance reserves, the lessor is entitled to retain those excess amounts at the time the heavy maintenance is performed. The Company periodically reviews its maintenance reserves for each of its leased aircraft to ensure that they will be recovered, and recognizes an expense if any such amounts are less than probable of being returned. Since the acquisition of TAM in June 2012, the cost of aircraft maintenance has been higher than the related maintenance reserves for all aircraft.
As of December 31, 2013,2016, LATAM had ThUS$231,809 141,751 in maintenance reserves (ThUS$ 263,416163,478 at December 31, 2012)2015), corresponding to two aircraft with contracts that establish periodic payments and whose expiration date is in 2017 and 21 aircraft out of a total fleet of 339 (24 aircraft out of a total fleet of 327 at December 31, 2012). All ofthat maintains remaining balances, which will be liquidated in the Company’s aircraft leases containing provisions fornext maintenance reserves will expire fully by 2017.or return.
Aircraft maintenance reserves are classified as current or non-current depending on the dates when the related maintenance is expected to be performed (Note 2.23).
NOTE 1413 - NON-CURRENT ASSETS (ORAND DISPOSAL GROUPS)GROUP CLASSIFIED AS HELD FOR SALE
Non-current assets and in disposal groups held for sale as ofat December 31, 2013,2016 and December 31, 20122015 are as follows:detailed below:
| As of | As of | |||||||
| December 31, | December 31, | |||||||
| 2013 | 2012 | |||||||
| ThUS$ | ThUS$ | |||||||
Aircraft | 438 | 44,878 | ||||||
Rotables | 1,362 | 1,184 | ||||||
Inventories on consignment | 8 | 686 | ||||||
Engines | 272 | 542 | ||||||
Scrapped aircraft | 365 | 365 | ||||||
|
|
|
| |||||
Total | 2,445 | 47,655 | ||||||
|
|
|
| |||||
| As of December 31, 2016 | As of December 31, 2015 | |||||||
| ThUS$ | ThUS$ | |||||||
Current assets | ||||||||
Aircraft | 281,158 | 263 | ||||||
Engines and rotables | 29,083 | 1,697 | ||||||
Other assets | 26,954 | — | ||||||
|
|
|
| |||||
Total | 337,195 | 1,960 | ||||||
|
|
|
| |||||
Current liabilities | ||||||||
Other liabilities | 10,152 | — | ||||||
|
|
|
| |||||
Total | 10,152 | — | ||||||
|
|
|
| |||||
During 2012,The balances are presented at the lower of book value and fair value less cost to sell. The fair value of these assets were determined based on quoted prices in active markets for similar assets or liabilities. This is a level II measurement as per the fair value hierarchy set out in note 3.3 (2). There were no transfers between levels for recurring fair value measurements during the year.
| (a) | Assets reclassified from Property, plant and equipment to Non-current assets or groups of assets for disposal classified as held for sale |
In the period ended December 31, 2016, two A318-100Airbus A319 aircraft, two Airbus A320 aircraft, six Airbus A330 aircraft, two Boeing 777 aircraft, eight A330 spare engines, A330 rotables and two buildings were transferredreclassified from the heading of Property, plant and equipment to Non-current assets or groups of assets for disposal classedclassified as held for sale. These
During the period ended December 31, 2016, two Airbus A319 aircraft, one Airbus A320 aircraft and two Airbus A330 aircraft were sold during the first quarter of 2013.
Moreover, during the fourth quarter of 2013, a Boeing B737-200sold. Additionally an A330 spare engine and four ATR42-300 aircraftD200 rotables were sold.
The figures shown in this item are presented at book value or fair value minus sales cost, whichever is lower.As a result, an adjustment of US $ 55 million was recorded to write down these assets to their net
The Company has no discontinued operationsdetail of fleet classified as non-current assets or groups of December 31, 2013.
Aircraft | As of December 31, 2016 | As of December 31, 2015 | ||||||
Boeing 777 Freighter | 2 | (*) | — | |||||
Airbus A330-200 | 4 | — | ||||||
Airbus A320-200 | 1 | — | ||||||
ATR42-300 | 1 | 1 | ||||||
|
|
|
| |||||
Total | 8 | 1 | ||||||
|
|
|
| |||||
| (*) | One aircraft leased to DHL. |
NOTE 1514 - INVESTMENTS IN SUBSIDIARIESSUBSIDIARIES”
| (a) | Investments in subsidiaries |
The Company has investments in companies recognized as investments in subsidiaries. All the companies defined as subsidiaries have been consolidated within the financial statements of LATAM Airlines Group S.A. and Subsidiaries. The consolidation also includes special-purpose entities and private investment funds.entities.
The detailDetail of significant subsidiaries and summarized financial information at December 31, 2013, December 31, 2012 and December 31, 2011 is presented below:
Significant subsidiaries detailed as of December 31, 2013information:
| ||||||||||
| ||||||||||
| ||||||||||
| ||||||||||
| ||||||||||
| ||||||||||
| ||||||||||
| ||||||||||
| Ownership | ||||||||||||
Name of significant subsidiary | Country of incorporation | Functional currency | As of December 31, 2016 | As of December 31, 2015 | ||||||||
| % | % | |||||||||||
Lan Perú S.A. | Peru | US$ | 70.00000 | 70.00000 | ||||||||
Lan Cargo S.A. | Chile | US$ | 99.89803 | 99.89803 | ||||||||
Lan Argentina S.A. | Argentina | ARS | 95.85660 | 94.99055 | ||||||||
Transporte Aéreo S.A. | Chile | US$ | 99.89804 | 99.89804 | ||||||||
Aerolane Líneas Aéreas Nacionales del Ecuador S.A. | Ecuador | US$ | 100.00000 | 100.00000 | ||||||||
Aerovías de Integración Regional, AIRES S.A. | Colombia | COP | 99.19056 | 99.01646 | ||||||||
TAM S.A. | Brazil | BRL | 99.99938 | 99.99938 | ||||||||
SignificantThe consolidated subsidiaries detailed as of December 31, 2012do not have significant restrictions for transferring funds to controller.
| ||||||||||
| ||||||||||
| ||||||||||
| ||||||||||
| ||||||||||
| ||||||||||
| ||||||||||
| ||||||||||
Significant subsidiaries detailed as of December 31, 2011
| ||||||||||
| ||||||||||
| ||||||||||
| ||||||||||
| ||||||||||
| ||||||||||
| ||||||||||
Summary financial information of significant subsidiaries
| Results for the period | ||||||||||||||||||||||||||||||||||||||||||||||||||||||||||||||||
| Statement of financial position as of December 31, 2013 | ended December 31, 2013 | |||||||||||||||||||||||||||||||||||||||||||||||||||||||||||||||
| Total | Current | Non-current | Total | Current | Non-current | Net | Statement of financial position as of December 31, 2016 | Results for the period ended December 31, 2016 | ||||||||||||||||||||||||||||||||||||||||||||||||||||||||
Name of significant subsidiary | Assets | Assets | Assets | Liabilities | Liabilities | Liabilities | Revenue | Income | Total Assets | Current Assets | Non-current Assets | Total Liabilities | Current Liabilities | Non-current Liabilities | Revenue | Net Income | ||||||||||||||||||||||||||||||||||||||||||||||||
| ThUS$ | ThUS$ | ThUS$ | ThUS$ | ThUS$ | ThUS$ | ThUS$ | ThUS$ | ThUS$ | ThUS$ | ThUS$ | ThUS$ | ThUS$ | ThUS$ | ThUS$ | ThUS$ | |||||||||||||||||||||||||||||||||||||||||||||||||
Lan Perú S.A. | 263,516 | 237,577 | 25,939 | 252,109 | 250,699 | 1,410 | 1,173,391 | 3,755 | 306,111 | 283,691 | 22,420 | 294,912 | 293,602 | 1,310 | 967,787 | (2,164 | ) | |||||||||||||||||||||||||||||||||||||||||||||||
Lan Cargo S.A. | 772,640 | 360,733 | 411,907 | 413,527 | 233,363 | 180,164 | 304,060 | 3,685 | 480,908 | 144,309 | 336,599 | 239,728 | 211,395 | 28,333 | 266,296 | (24,813 | ) | |||||||||||||||||||||||||||||||||||||||||||||||
Lan Argentina S.A. | 214,426 | 192,590 | 21,836 | 205,672 | 203,567 | 2,105 | 500,128 | (13,311 | ) | 216,331 | 194,306 | 22,025 | 200,172 | 197,330 | 2,842 | 371,896 | (29,572 | ) | ||||||||||||||||||||||||||||||||||||||||||||||
Transporte Aéreo S.A. | 359,693 | 69,459 | 290,234 | 120,399 | 37,049 | 83,350 | 400,518 | (4,129 | ) | 340,940 | 36,986 | 303,954 | 124,805 | 59,668 | 65,137 | 297,247 | 8,206 | |||||||||||||||||||||||||||||||||||||||||||||||
Aerolane Líneas Aéreas Nacionales del Ecuador S.A. | 94,160 | 58,867 | 35,293 | 93,535 | 89,802 | 3,733 | 299,138 | (40,295 | ) | 89,667 | 56,064 | 33,603 | 81,101 | 75,985 | 5,116 | 219,676 | (1,281 | ) | ||||||||||||||||||||||||||||||||||||||||||||||
Aerovías de Integración Regional, AIRES S.A. | 188,518 | 69,591 | 118,927 | 36,009 | 24,936 | 11,073 | 335,854 | (63,359 | ) | 129,734 | 55,132 | 74,602 | 85,288 | 74,160 | 11,128 | 277,503 | (13,675 | ) | ||||||||||||||||||||||||||||||||||||||||||||||
TAM S.A. (*) | 8,695,458 | 2,372,047 | 6,323,411 | 7,983,671 | 3,249,581 | 4,734,090 | 6,791,104 | (458,475 | ) | 5,287,286 | 1,794,189 | 3,493,097 | 4,710,308 | 2,837,620 | 1,872,688 | 4,145,951 | 2,107 | |||||||||||||||||||||||||||||||||||||||||||||||
| Statement of financial position as of December 31, 2015 | Results for the period ended December 31, 2015 | |||||||||||||||||||||||||||||||
Name of significant subsidiary | Total Assets | Current Assets | Non-current Assets | Total Liabilities | Current Liabilities | Non-current Liabilities | Revenue | Net Income | ||||||||||||||||||||||||
| ThUS$ | ThUS$ | ThUS$ | ThUS$ | ThUS$ | ThUS$ | ThUS$ | ThUS$ | |||||||||||||||||||||||||
Lan Perú S.A. | 255,691 | 232,547 | 23,144 | 240,938 | 239,521 | 1,417 | 1,078,992 | 5,068 | ||||||||||||||||||||||||
Lan Cargo S.A. | 483,033 | 159,294 | 323,739 | 217,037 | 147,423 | 69,614 | 278,117 | (74,408 | ) | |||||||||||||||||||||||
Lan Argentina S.A. | 195,756 | 180,558 | 15,198 | 170,384 | 168,126 | 2,258 | 443,317 | 9,432 | ||||||||||||||||||||||||
Transporte Aéreo S.A. | 331,117 | 41,756 | 289,361 | 122,666 | 44,495 | 78,171 | 324,464 | 5,878 | ||||||||||||||||||||||||
Aerolane Líneas Aéreas Nacionales del Ecuador S.A. | 126,001 | 80,641 | 45,360 | 116,153 | 111,245 | 4,908 | 246,402 | (1,278 | ) | |||||||||||||||||||||||
Aerovías de Integración Regional, AIRES S.A. | 130,039 | 62,937 | 67,102 | 75,003 | 64,829 | 10,174 | 291,354 | (34,079 | ) | |||||||||||||||||||||||
TAM S.A. (*) | 4,711,316 | 1,350,377 | 3,360,939 | 4,199,223 | 1,963,400 | 2,235,823 | 4,597,611 | (183,812 | ) | |||||||||||||||||||||||
Summary financial information of significant subsidiaries
| Results for the period | ||||||||||||||||||||||||||||||||||||||||||||||||||||||||||||||||
| Statement of financial position as of December 31, 2012 | ended December 31, 2012 | |||||||||||||||||||||||||||||||||||||||||||||||||||||||||||||||
| Total | Current | Non-current | Total | Current | Non-current | Net | Statement of financial position as of December 31, 2014 | Results for the period ended December 31, 2014 | ||||||||||||||||||||||||||||||||||||||||||||||||||||||||
Name of significant subsidiary | Assets | Assets | Assets | Liabilities | Liabilities | Liabilities | Revenue | Income | Total Assets | Current Assets | Non-current Assets | Total Liabilities | Current Liabilities | Non-current Liabilities | Revenue | Net Income | ||||||||||||||||||||||||||||||||||||||||||||||||
| ThUS$ | ThUS$ | ThUS$ | ThUS$ | ThUS$ | ThUS$ | ThUS$ | ThUS$ | ThUS$ | ThUS$ | ThUS$ | ThUS$ | ThUS$ | ThUS$ | ThUS$ | ThUS$ | |||||||||||||||||||||||||||||||||||||||||||||||||
Lan Perú S.A. | 159,361 | 133,448 | 25,913 | 150,319 | 149,263 | 1,056 | 1,047,106 | 2,513 | 239,470 | 214,245 | 25,225 | 228,395 | 226,784 | 1,611 | 1,134,289 | 1,058 | ||||||||||||||||||||||||||||||||||||||||||||||||
Lan Cargo S.A. | 727,091 | 172,856 | 554,235 | 371,663 | 169,501 | 202,162 | 292,066 | (50,693 | ) | 575,979 | 250,174 | 325,805 | 234,772 | 119,111 | 115,661 | 267,578 | (17,905 | ) | ||||||||||||||||||||||||||||||||||||||||||||||
Lan Argentina S.A. | 165,961 | 144,463 | 21,498 | 141,454 | 139,653 | 1,801 | 538,328 | 9,152 | 233,142 | 206,503 | 26,639 | 201,168 | 198,593 | 2,575 | 439,929 | (17,864 | ) | |||||||||||||||||||||||||||||||||||||||||||||||
Transporte Aéreo S.A. | 357,725 | 249,174 | 108,551 | 114,302 | 26,731 | 87,571 | 373,157 | 11,144 | 367,570 | 80,090 | 287,480 | 147,278 | 59,805 | 87,473 | 364,580 | (19,001 | ) | |||||||||||||||||||||||||||||||||||||||||||||||
Aerolane Líneas Aéreas Nacionales del Ecuador S.A. | 74,204 | 40,531 | 33,673 | 71,284 | 68,068 | 3,216 | 305,177 | (14,077 | ) | 126,472 | 78,306 | 48,166 | 116,040 | 111,718 | 4,322 | 256,925 | (20,193 | ) | ||||||||||||||||||||||||||||||||||||||||||||||
Aerovías de Integración Regional, AIRES S.A. | 165,032 | 58,457 | 106,575 | 58,398 | 46,434 | 11,964 | 283,870 | (75,522 | ) | 131,324 | 38,751 | 92,573 | 61,736 | 49,577 | 12,159 | 392,433 | (81,033 | ) | ||||||||||||||||||||||||||||||||||||||||||||||
TAM S.A. (*) | 8,821,298 | 2,003,122 | 6,818,176 | 9,198,899 | 3,556,778 | 5,642,121 | 3,633,592 | (75,195 | ) | 6,817,698 | 1,921,316 | 4,896,382 | 5,809,529 | 2,279,110 | 3,530,419 | 6,628,432 | 171,655 | |||||||||||||||||||||||||||||||||||||||||||||||
| (*) |
Summary financial information of significant subsidiaries
| (b) | Non-controlling interest |
| Results for the year | ||||||||||||||||||||||||||||||||
| Statement of financial position as of December 31, 2011 | ended December 31, 2011 | |||||||||||||||||||||||||||||||
| Total | Current | Non-current | Total | Current | Non-current | Net | ||||||||||||||||||||||||||
Name of significant subsidiary | Assets | Assets | Assets | Liabilities | Liabilities | Liabilities | Revenue | Income | ||||||||||||||||||||||||
| ThUS$ | ThUS$ | ThUS$ | ThUS$ | ThUS$ | ThUS$ | ThUS$ | ThUS$ | |||||||||||||||||||||||||
Lan Perú S.A. | 139,888 | 124,485 | 15,403 | 128,979 | 128,025 | 954 | 916,861 | 920 | ||||||||||||||||||||||||
Lan Cargo S.A. | 765,829 | 188,937 | 576,892 | 343,799 | 122,450 | 221,349 | 258,298 | 57,140 | ||||||||||||||||||||||||
Lan Argentina S.A. | 136,579 | 108,561 | 28,018 | 114,037 | 112,555 | 1,482 | 438,137 | (1,972 | ) | |||||||||||||||||||||||
Transporte Aéreo S.A. | 348,943 | 237,627 | 111,316 | 116,663 | 26,332 | 90,331 | 370,697 | 26,146 | ||||||||||||||||||||||||
Aerolane Líneas Aéreas Nacionales del Ecuador S.A. | 71,598 | 42,369 | 29,229 | 61,102 | 58,726 | 2,376 | 278,039 | 2,303 | ||||||||||||||||||||||||
Aerovías de Integración Regional, AIRES S.A. | 134,983 | 76,936 | 58,047 | 80,271 | 70,112 | 10,159 | 282,493 | (25,860 | ) | |||||||||||||||||||||||
NOTE 16 - EQUITY ACCOUNTED INVESTMENTS
The composition of investments accounted for using the equity method is as follows:
| Equity | Tax No . | Country of origin | As of December 31, 2016 | As of December 31, 2015 | As of December 31, 2016 | As of December 31, 2015 | ||||||||||||||
| % | % | ThUS$ | ThUS$ | |||||||||||||||||
Lan Perú S.A | 0 - E | Peru | 30.00000 | 30.00000 | 3,360 | 4,426 | ||||||||||||||
Lan Cargo S.A. and Subsidiaries | 93.383.000 - 4 | Chile | 0.10196 | 0.10605 | 957 | 974 | ||||||||||||||
Promotora Aére a Latinoamericana S.A. and Subsidiaries | 0 - E | Mexico | 51.00000 | 51.00000 | 3,162 | 3,084 | ||||||||||||||
Inversora Cordillera S.A. and Subsidiaries | 0 - E | Argentina | 0 .70422 | 0.70422 | 515 | (1,386 | ) | |||||||||||||
Lan Argentina S.A. | 0 - E | Argentina | 0 .13440 | 1.00000 | (311 | ) | 29 | |||||||||||||
Americonsult de Guatemala S.A. | 0 - E | Guatemala | 1.00000 | 1.00000 | 1 | 5 | ||||||||||||||
Americonsult Costa Rica S.A. | 0 - E | Costa Rica | 1.00000 | 1.00000 | 12 | 12 | ||||||||||||||
Line a Aére a Carguera de Colombiana S.A. | 0 - E | Colombia | 10.00000 | 10.00000 | (905 | ) | (811 | ) | ||||||||||||
Aerolíneas Regionales de Integración Aires S.A. | 0 - E | Colombia | 0.80944 | 0.98307 | 436 | 540 | ||||||||||||||
Transportes Aere os de l Mercosur S.A. | 0 - E | Paraguay | 5.02000 | 5.02000 | 1,104 | 1,256 | ||||||||||||||
Multiplus S.A. | 0 - E | Brazil | 27.26000 | 27.26000 | 80,313 | 72,884 | ||||||||||||||
|
|
|
| |||||||||||||||||
Total | 88,644 | 81,013 | ||||||||||||||||||
|
|
|
| |||||||||||||||||
| As of | As of | |||||||
| December 31, | December 31, | |||||||
| 2013 | 2012 | |||||||
| ThUS$ | ThUS$ | |||||||
(a) Related companies | 3,572 | 1,619 | ||||||
(b) Joint Ventures | 3,024 | 2,138 | ||||||
|
|
|
| |||||
Equity accounted investments | 6,596 | 3,757 | ||||||
|
|
|
| |||||
Lan Perú S.A Lan Cargo S.A. and Subsidiaries Inversiones Lan S.A. and Subsidiaries Promotora Aerea Latinoamericana S.A. and Subsidiaries Aerolane, Line as Aére as Nacionales del Ecuador S.A. Invers ora Cordillera S.A. and Subsidiaries Lan Argentina S.A. Americonsult de Guatemala S.A. Americonsult Costa Rica S.A. Line a Aére a Carguera de Colombiana S.A. Aerolíne as Regionales de Integración Aires S.A. Transportes Aereos de l Mercosur S.A. Multiplus S.A. Total (a) Related CompaniesIncomes Tax No. Country
of origin As of
December 31,
2016 As of
December 31,
2015 As of
December 31,
2014 2016 For the period ended
December 31,
2015 2014 % % % ThUS$ ThUS$ ThUS$ 0 - E Peru 30.00000 30.00000 30.00000 (649 ) 1,521 317 93.383.000 - 4 Chile 0 .10196 0 .10605 0 .10605 (7 ) (69 ) (125 ) 96.575.810 - 0 Chile 0 .00000 0 .00000 0 .29000 — — (14 ) 0 - E Mexico 51.00000 51.00000 51.00000 96 1,349 396 0 - E Ecuador 0 .00000 0 .00000 0 .00000 — — (5,671 ) 0 - E Argentina 0 .70422 0 .70422 4 .22000 364 281 270 0 - E Argentina 0 .13440 1.00000 1.00000 77 61 58 0 - E Guatemala 1.00000 1.00000 1.00000 (4 ) 1 4 0 - E Costa Rica 1.00000 1.00000 1.00000 — 5 6 0 - E Colombia 10.00000 10.00000 10.00000 (106 ) 14 (495 ) 0 - E Colombia 0 .80944 0 .98307 0 .98307 (140 ) (335 ) (797 ) 0 - E Paraguay 5 .02000 5 .02000 5 .02000 146 431 (389 ) 0 - E Brazil 27.26000 27.26000 27.26000 41,673 37,283 39,254 41,450 40,542 32,814
The following summarized financial information is the sum of the financial statements of the investees, corresponding to the statements of financial position as of December 31, 2013 and December 31, 2012, and the statements of income, for the periods ended at December 31, 2013, December 31, 2012 and December, 2011.
As of December 31, 2013
| Assets | Liabilities | |||||||
| ThUS$ | ThUS$ | |||||||
Current | 2,147 | 670 | ||||||
Non-current | 331 | 109 | ||||||
|
|
|
| |||||
Total | 2,478 | 779 | ||||||
|
|
|
| |||||
As of December 31, 2012
| Assets | Liabilities | |||||||
| ThUS$ | ThUS$ | |||||||
Current | 3,193 | 1,421 | ||||||
Non-current | 419 | 109 | ||||||
|
|
|
| |||||
Total | 3,612 | 1,530 | ||||||
|
|
|
| |||||
| For the periods ended | ||||||||||||
| December 31, | ||||||||||||
| 2013 | 2012 | 2011 | ||||||||||
| ThUS$ | ThUS$ | ThUS$ | ||||||||||
Total operating revenues | 3,212 | 3,704 | 2,896 | |||||||||
Total expenses | (2,533 | ) | (2,759 | ) | (1,902 | ) | ||||||
|
|
|
|
|
| |||||||
Sum of net income | 679 | 945 | 994 | |||||||||
|
|
|
|
|
| |||||||
As an investment in associates, the Company has shown its holdings in the following companies: Austral Sociedad Concesionaria S.A. and Lufthansa Lan Technical Training S.A. The Company made no investments in associates during 2013.
| Percentage of ownership | Cost of investment | |||||||||||||||||||
| As of | As of | As of | As of | |||||||||||||||||
| Country of | Functional | December 31, | December 31, | December 31, | December 31, | |||||||||||||||
Company | incorporation | currency | 2013 | 2012 | 2013 | 2012 | ||||||||||||||
| % | % | ThUS$ | ThUS$ | |||||||||||||||||
Austral Sociedad Concesionaria S.A. | Chile | CLP | 20.00 | 20.00 | 661 | 661 | ||||||||||||||
Lufthansa Lan Technical Training S.A. | Chile | CLP | 50.00 | 50.00 | 702 | 702 | ||||||||||||||
These companies do not have significant restrictions on the ability to transfer funds.
The movement of investments in associates between January 1, 2011 and December 31, 2013 is as follows:
| ||||
| ||||
| ||||
| ||||
| ||||
| ||||
| ||||
| ||||
| ||||
| ||||
| ||||
| ||||
| ||||
| ||||
| ||||
| ||||
| ||||
| ||||
| ||||
The Company records the gain or loss on its investments in associates on a monthly basis in the consolidated statement of income, using the equity method. The Company has no investments in associates which are not accounted for using the equity method.
(b) Joint Venture
Multiplus S.A., a subsidiary of TAM S.A. and AIMIA Newco UK LLP (“Aimia”) jointly control the Companhia Brasileira de Serviços de Fidelização S.A. (“CBSF”). The company was incorporated on April 2, 2012, whose corporate name was changed to Prismah Fidelidade S.A. (“Prismah”).
The purpose of Prismah Fidelidade S.A. is the provision of various services, the development of programs related to loyalty programs/customer relationships and sales incentive programs for companies. Their activities include but are not limited to: the customer relationship management, technical and technological consulting, and through points programs or other ways of possible changes, the conversion of loyalty program points.
The shareholding participation in Prismah Fidelidade S.A., does not allow unilateral decisions that affect investment returns. Multiplus S.A. owns 50% of company shares and participation is accounted by the equity method proportional investment, initially recognized at cost. The participation in earnings of the company are recognized in income and the participation in changes in reserves are recognized in reserves of Multiplus S.A.
Movement investment at December 31, 2013
| Amount of | ||||||||
| shares | ThUS$ | |||||||
Capital aware - AAG Constituent (*) | 500 | 1 | ||||||
Capital increase - AGE (**) 09/18/2012 | 6,571,500 | 3,215 | ||||||
Equity accounted earnings | — | (1,078 | ) | |||||
|
|
|
| |||||
Closing balance at December 31, 2012 | 6,572,000 | 2,138 | ||||||
|
|
|
| |||||
Future advance capital increase | — | 4,977 | ||||||
Equity accounted earnings | — | (3,833 | ) | |||||
Conversion difference affiliates | — | (258 | ) | |||||
|
|
|
| |||||
Closing balance at December 31, 2013 | 6,572,000 | 3,024 | ||||||
|
|
|
| |||||
The company Prismah Fidelidade S.A. as of December 31, 2013, has the following items:
| As of | As of | |||||||
| December 31, | December 31, | |||||||
| 2013 | 2012 | |||||||
Social capital ThUS$ | 16,323 | 6,432 | ||||||
Number of ordinary shares | 35,200,194 | 13,144,000 | ||||||
Ordinary shares owned by Multiplus S.A. | 17,600,097 | 6,572,000 | ||||||
Participation % | 50 | 50 | ||||||
| ThUS$ | ThUS$ | |||||||
Equity accounted investments | 3,024 | 2,138 | ||||||
Current assets | 6,985 | 4,356 | ||||||
Non-current assets | 1,481 | 2,275 | ||||||
Current liabilities | 2,418 | 2,356 | ||||||
| For the periods ended | ||||||||
| December 31, | ||||||||
| 2013 | 2012 | |||||||
| ThUS$ | ThUS$ | |||||||
Result of the period | (7,665 | ) | (1,065 | ) | ||||
Equity accounted earnings | (3,833 | ) | (533 | ) | ||||
Revenues in the period | 1,091 | 9 | ||||||
Expense in the period | (8,756 | ) | (1,075 | ) | ||||
NOTE 1715 - INTANGIBLE ASSETS OTHER THAN GOODWILL
The details of intangible assets are as follows:
Classes of intangible assets (net) | As of | As of | ||||||||||||||||||||||
| December 31, | December 31, | |||||||||||||||||||||||
| 2013 | 2012 | Classes of intangible assets | Classes of intangible assets | |||||||||||||||||||||
| ThUS$ | ThUS$ | (net) | (gross ) | |||||||||||||||||||||
| As of | As of | As of | As of | |||||||||||||||||||||
| December 31, | December 31, | December 31, | December 31, | |||||||||||||||||||||
| 2016 | 2015 | 2016 | 2015 | |||||||||||||||||||||
| ThUS $ | ThUS $ | ThUS $ | ThUS $ | |||||||||||||||||||||
Airports lots | 978,849 | 816,987 | 978,849 | 816,987 | ||||||||||||||||||||
Loyalty program | 326,262 | 272,312 | 326,262 | 272,312 | ||||||||||||||||||||
Computer software | 143,124 | 144,244 | 157,016 | 104,258 | 419,652 | 324,043 | ||||||||||||||||||
Developing software | 46,075 | 54,635 | 91,053 | 74,887 | 91,053 | 74,887 | ||||||||||||||||||
Airport slots | 1,361,807 | 1,561,130 | ||||||||||||||||||||||
Loyalty program | 453,907 | 520,344 | ||||||||||||||||||||||
Trademarks | 88,314 | 101,240 | ||||||||||||||||||||||
Trademarks (1) | 57,133 | 52,981 | 63,730 | 52,981 | ||||||||||||||||||||
Other assets | 81 | 806 | — | — | 808 | 808 | ||||||||||||||||||
|
|
|
|
|
| |||||||||||||||||||
Total | 2,093,308 | 2,382,399 | 1,610,313 | 1,321,425 | 1,880,354 | 1,542,018 | ||||||||||||||||||
|
|
|
|
|
| |||||||||||||||||||
Classes of intangible assets (gross) | As of | As of | ||||||
| December 31, | December 31, | |||||||
| 2013 | 2012 | |||||||
| ThUS$ | ThUS$ | |||||||
Computer software | 278,721 | 223,586 | ||||||
Developing software | 46,075 | 54,635 | ||||||
Airport slots | 1,361,807 | 1,561,130 | ||||||
Loyalty program | 453,907 | 520,344 | ||||||
Trademarks | 88,314 | 101,240 | ||||||
Other assets | 808 | 1,372 | ||||||
|
|
|
| |||||
Total | 2,229,632 | 2,462,307 | ||||||
|
|
|
| |||||
The movementMovement in Intangible assets other than goodwill between January 1, 2011 and December 31, 2013 is as follows:goodwill:
| Computer | Trademarks | Other | Computer | Trademarks | Other | |||||||||||||||||||||||||||||||||||||||||||
| software | Developing | Airport | and loyalty | assets | software | Developing | Airport | and loyalty | assets | |||||||||||||||||||||||||||||||||||||||
| Net | software | slots (*) | program (*) | Net | Total | Net | software | slots (2) | program (1) (2) | Net | Total | |||||||||||||||||||||||||||||||||||||
| ThUS$ | ThUS$ | ThUS$ | ThUS$ | ThUS$ | ThUS$ | ThUS $ | ThUS $ | ThUS $ | ThUS $ | ThUS $ | ThUS $ | |||||||||||||||||||||||||||||||||||||
Opening balance as of January 1, 2011 | 26,074 | 19,109 | — | — | 566 | 45,749 | ||||||||||||||||||||||||||||||||||||||||||
Additions | 8,904 | 20,286 | — | — | — | 29,190 | ||||||||||||||||||||||||||||||||||||||||||
Withdrawals | (184 | ) | — | — | — | — | (184 | ) | ||||||||||||||||||||||||||||||||||||||||
Amortization | (9,670 | ) | — | — | — | (162 | ) | (9,832 | ) | |||||||||||||||||||||||||||||||||||||||
|
|
|
|
|
| |||||||||||||||||||||||||||||||||||||||||||
Closing balance as of December 31, 2011 | 25,124 | 39,395 | — | — | 404 | 64,923 | ||||||||||||||||||||||||||||||||||||||||||
|
|
|
|
|
| |||||||||||||||||||||||||||||||||||||||||||
Opening balance as of January 1, 2012 | 25,124 | 39,395 | — | — | 404 | 64,923 | ||||||||||||||||||||||||||||||||||||||||||
Opening balance as of January 1, 2014 | 143,124 | 46,075 | 1,361,807 | 542,221 | 81 | 2,093,308 | ||||||||||||||||||||||||||||||||||||||||||
Additions | 18,769 | 43,632 | — | 24 | — | 62,425 | 16,902 | 60,994 | — | — | — | 77,896 | ||||||||||||||||||||||||||||||||||||
Withdrawals | (1,636 | ) | — | — | (2 | ) | — | (1,638 | ) | (1,365 | ) | (3,576 | ) | — | — | — | (4,941 | ) | ||||||||||||||||||||||||||||||
Transfer software | 55,618 | (51,391 | ) | — | — | — | 4,227 | 22,351 | (24,539 | ) | — | — | — | (2,188 | ) | |||||||||||||||||||||||||||||||||
Adquisitions through business combinations | 78,106 | 22,864 | 1,552,016 | 617,934 | 561 | 2,271,481 | ||||||||||||||||||||||||||||||||||||||||||
Difference by subsidiaries conversion | (757 | ) | 135 | 9,114 | 3,628 | 3 | 12,123 | |||||||||||||||||||||||||||||||||||||||||
Foreing exchange | (6,763 | ) | (4,904 | ) | (160,779 | ) | (64,017 | ) | — | (236,463 | ) | |||||||||||||||||||||||||||||||||||||
Amortization | (30,980 | ) | — | — | — | (162 | ) | (31,142 | ) | (47,452 | ) | — | — | — | (81 | ) | (47,533 | ) | ||||||||||||||||||||||||||||||
|
|
|
|
|
|
|
|
|
|
|
| |||||||||||||||||||||||||||||||||||||
Closing balance as of December 31, 2012 | 144,244 | 54,635 | 1,561,130 | 621,584 | 806 | 2,382,399 | ||||||||||||||||||||||||||||||||||||||||||
Closing balance as of December 31, 2014 | 126,797 | 74,050 | 1,201,028 | 478,204 | — | 1,880,079 | ||||||||||||||||||||||||||||||||||||||||||
|
|
|
|
|
|
|
|
|
|
|
| |||||||||||||||||||||||||||||||||||||
Opening balance as of January 1, 2013 | 144,244 | 54,635 | 1,561,130 | 621,584 | 806 | 2,382,399 | ||||||||||||||||||||||||||||||||||||||||||
Opening balance as of January 1, 2015 | 126,797 | 74,050 | 1,201,028 | 478,204 | — | 1,880,079 | ||||||||||||||||||||||||||||||||||||||||||
Additions | 14,703 | 47,199 | — | — | — | 61,902 | 4,954 | 48,270 | — | — | — | 53,224 | ||||||||||||||||||||||||||||||||||||
Withdrawals | (467 | ) | (1,975 | ) | — | — | — | (2,442 | ) | (4,612 | ) | (162 | ) | — | (1 | ) | — | (4,775 | ) | |||||||||||||||||||||||||||||
Transfer software | 46,444 | (48,890 | ) | — | — | (492 | ) | (2,938 | ) | 28,726 | (30,426 | ) | — | — | — | (1,700 | ) | |||||||||||||||||||||||||||||||
Subsidiaries conversion difference | (5,542 | ) | (4,894 | ) | (199,323 | ) | (79,363 | ) | (72 | ) | (289,194 | ) | ||||||||||||||||||||||||||||||||||||
Foreing exchange | (14,871 | ) | (16,845 | ) | (384,041 | ) | (152,910 | ) | — | (568,667 | ) | |||||||||||||||||||||||||||||||||||||
Amortization | (56,258 | ) | — | — | — | (161 | ) | (56,419 | ) | (36,736 | ) | — | — | — | — | (36,736 | ) | |||||||||||||||||||||||||||||||
|
|
|
|
|
|
|
|
|
|
|
| |||||||||||||||||||||||||||||||||||||
Closing balance as of December 31, 2013 | 143,124 | 46,075 | 1,361,807 | 542,221 | 81 | 2,093,308 | ||||||||||||||||||||||||||||||||||||||||||
Closing balance as of December 31, 2015 | 104,258 | 74,887 | 816,987 | 325,293 | — | 1,321,425 | ||||||||||||||||||||||||||||||||||||||||||
|
|
|
|
|
|
|
|
|
|
|
| |||||||||||||||||||||||||||||||||||||
Opening balance as of January 1, 2016 | 104,258 | 74,887 | 816,987 | 325,293 | — | 1,321,425 | ||||||||||||||||||||||||||||||||||||||||||
Additions | 6,688 | 83,672 | — | — | — | 90,360 | ||||||||||||||||||||||||||||||||||||||||||
Withdrawals | (736 | ) | (191 | ) | — | — | — | (927 | ) | |||||||||||||||||||||||||||||||||||||||
Transfer software | 85,029 | (74,376 | ) | — | — | — | 10,653 | |||||||||||||||||||||||||||||||||||||||||
Foreing exchange | 5,689 | 7,061 | 161,862 | 64,447 | — | 239,059 | ||||||||||||||||||||||||||||||||||||||||||
Amortization | (43,912 | ) | — | — | (6,345 | ) | — | (50,257 | ) | |||||||||||||||||||||||||||||||||||||||
|
|
|
|
|
| |||||||||||||||||||||||||||||||||||||||||||
Closing balance as of December 31, 2016 | 157,016 | 91,053 | 978,849 | 383,395 | — | 1,610,313 | ||||||||||||||||||||||||||||||||||||||||||
|
|
|
|
|
| |||||||||||||||||||||||||||||||||||||||||||
| (1) | After the extensive integration work following the combination between LAN and TAM, during which there has been solid progress in the homologation of the optimization processes of its air connections, in addition to the restructuring and modernization of the fleet of aircraft, the Company has resolved adopt a unique name and identity, and announce that the brand of the group will be LATAM”, which would unite all companies under a single image. |
Given the above, we have proceeded to review the brands useful life, concluding that these should go from an indefinite to defined useful life. The airport slots correspond to an administrative authorization for the arrival and departure of aircraft, in a specific airport, within a period of time.
The coalition and loyalty program correspondsestimated new useful life is 5 years, equivalent to the system of accumulation and redemption of points that has developed Multiplus.period for finishing all the image changes necessary.
Intangible assets with defined useful lives consist primarily of licensing and computer software, for which the Company has established useful lives of between 3 and 7 years.
Intangible assets with undefined useful lives are tested annually for impairment as an integral part of each CGU, in accordance with the premises that are applicable, included as follows:
Airport slots – Air transport CGU
Loyalty program – Coalition and loyalty program Multiplus CGU
Brand – Air transport CGU
(See Note 18.1.)
| (2) | See Note 2.5 |
The amortization of the period is shown in the consolidated statement of income in administrative expenses. The accumulated amortization of computer programs as of December 31, 20132016 amounts to ThUS$ 135,597270,041 (ThUS$ 79,342 as of December 31, 2012, ThUS$ 48,362 as of December 31, 2011). The accumulated amortization of other identifiable intangible assets as of December 31, 2013 amounts to ThUS$ 727 (ThUS$ 566 as of December 31, 2012, ThUS$ 404 as of December 31, 2011).
NOTE 18 – GOODWILL AND BUSINESS COMBINATION
The goodwill represents the excess of cost of acquisition over the fair value of the participation of the Company in the identifiable net assets of the subsidiaries at the acquisition date. Goodwill220,593 at December 31, 2013 amounted to ThUS$ 3,727,605 (ThUS$ 4,213,160 as revised2015).
The Goodwill amount at December 31, 2012)2016 is ThUS$ 2,710,382 (ThUS$ 2,280,575 at December 31, 2015 and ThUS$ 3,313,401 at December 31, 2014). Movement of Goodwill separated by CGU it includes the following:
Movement of Goodwill, separated by CGU:
| Coalition | ||||||||||||
| and loyalty | ||||||||||||
| Air | program | |||||||||||
| Transport | Multiplus | Total | ||||||||||
| ThUS$ | ThUS$ | ThUS$ | ||||||||||
Opening balance as of January 1, 2014 | 2,985,037 | 742,568 | 3,727,605 | |||||||||
Increase (decrease) due to exchange rate differences | (360,371 | ) | (87,670 | ) | (448,041 | ) | ||||||
Others | 33,837 | — | 33,837 | |||||||||
|
|
|
|
|
| |||||||
Closing balance as of December 31, 2014 | 2,658,503 | 654,898 | 3,313,401 | |||||||||
|
|
|
|
|
| |||||||
Opening balance as of January 1, 2015 | 2,658,503 | 654,898 | 3,313,401 | |||||||||
Increase (decrease) due to exchange rate differences | (823,415 | ) | (209,411 | ) | (1,032,826 | ) | ||||||
|
|
|
|
|
| |||||||
Closing balance as of December 31, 2015 | 1,835,088 | 445,487 | 2,280,575 | |||||||||
|
|
|
|
|
| |||||||
Opening balance as of January 1, 2016 | 1,835,088 | 445,487 | 2,280,575 | |||||||||
Increase (decrease) due to exchange rate differences | 341,813 | 88,261 | 430,074 | |||||||||
Others | (267 | ) | — | (267 | ) | |||||||
|
|
|
|
|
| |||||||
Closing balance as of December 31, 2016 | 2,176,634 | 533,748 | 2,710,382 | |||||||||
|
|
|
|
|
| |||||||
The Company has two cash- generating units (CGU)(CGUs), confirming the existence of two cash-generating units: “Air transportation” and, “Coalition and loyalty program Multiplus”; consistent. The CGU “Air transport” considers the transport of passengers and cargo, both in the domestic markets of Chile, Peru, Argentina, Colombia, Ecuador and Brazil, and in a developed series of regional and international routes in America, Europe and Oceania, while the CGU “Coalition and loyalty program Multiplus” works with this, performed impairment tests based on valuean integrated network associated companies in use and no impairment was identified. These tests are done at least once per year.Brazil.
The recoverable amounts of cash generatingcash-generating units have been determined from estimatedbased on value-in-use calculations. These calculations require the use of expected cash flows, by the Administration. The main assumptions used5 years after tax, which are disclosed as follows:
Air transportation CGU
Management establish rates for annual growth, discount, inflation and 12.0%.
Coalition and loyalty program Multiplus CGU (*)
As of December 31, 2016 the recoverable values were determined using the following assumptions presented below:
| Air transportation | Coalition and loyalty | |||||
| CGU | program Multiplus CGU | |||||
Annual growth rate (Terminal) | % | 1.0 - 2.0 | 4.0 - 5.0 | |||
Exchange rate (1) | R$/US$ | 3.9 - 4.4 | 3.9 - 4.4 | |||
Discount rate based on the weighted average cost of capital (WACC) | % | 8.27 - 9.27 | — | |||
Discount rate based on cost of equity (Ke) | % | — | 12.3 - 13.3 | |||
Fuel Price from futures price curves commodities markets | US$/barril | 61 - 76 | — |
| (1) | In line with the expectations of the Central Bank of Brazil |
| (2) | The flow, as well as annual growth rte and discount, are denominated in real. |
Given the expectation of growth and the long investment cycles characteristic of the industry, are used projections of ten years.
The result of the impairment test, which includes a sensitivity analysis of the main variables, showed that the estimated recoverable amount is higher than carrying value of the book value of net assets allocated to the cash generating unit, and therefore impairment was not detected.
CGU’s are sensitive to rates for annual growth, discount and exchanges rates. The sensitivity analysis included the individual impact of variationschanges in the key assumptions with impact on the determination ofestimates critical in determining the recoverable amounts, namely:
Air transportation CGU
Coalition and loyalty program Multiplus CGU
| Decrease | ||||||||||||
| Increase | Increase | Minimum | ||||||||||
| Maximum | Maximum | terminal | ||||||||||
| WACC | Ke | growth rate | ||||||||||
| % | % | % | ||||||||||
Air transportation CGU | 9.27 | — | 1.0 | |||||||||
Coalition and loyalty program Multiplus CGU | — | 13.3 | 4.0 | |||||||||
In none of the previous cases was presented an impairment.
The movement of Goodwill from January 1, 2012 to December 31, 2013, is as follows:
| Air | Coalition and | |||||||||||
| transportation | loyalty program | |||||||||||
| (**) | Multiplus (**) | Total | ||||||||||
| ThUS$ | ThUS$ | ThUS$ | ||||||||||
Opening balance as of January 1, 2012 | 163,777 | — | 163,777 | |||||||||
Additions by business combinations | 2,118,057 | — | 2,118,057 | |||||||||
Amendment initial recognition (*) | 1,051,645 | 846,285 | 1,897,930 | |||||||||
Increase (decrease) due to exchange rate differences | 28,427 | 4,969 | 33,396 | |||||||||
|
|
|
|
|
| |||||||
Closing balance as of December 31, 2012 | 3,361,906 | 851,254 | 4,213,160 | |||||||||
|
|
|
|
|
| |||||||
Opening balance as of January 1, 2013 | 3,361,906 | 851,254 | 4,213,160 | |||||||||
Others | 44,860 | — | 44,860 | |||||||||
Increase (decrease) due to exchange rate differences | (421,729 | ) | (108,686 | ) | (530,415 | ) | ||||||
|
|
|
|
|
| |||||||
Closing balance as of December 31, 2013 | 2,985,037 | 742,568 | 3,727,605 | |||||||||
|
|
|
|
|
| |||||||
The following information summarizes the business combination process with TAM S.A. and subsidiaries:
(a) Description of the Business Combination process with TAM S.A and Subsidiaries
Dated June 22, 2012 the merger was successfully completed between LAN Airlines S.A. (today LATAM Airlines Group S.A.), with Sister Holdco S.A. and Holdco II S.A., two companies specially constituted for the purpose of the association between the Company and TAM S.A. which was reflectedimpairment in the deed of execution of merger issued by such companies at the same time, and itcash- generating unit was rectified by deed dated July 10, 2012. These scriptures recorded the share exchange of Sister Holdco S.A. and Holdco II S.A. for LAN´s shares in one related of 0.9 of LAN´s shares for each Sister Holdco S.A. and Holdco II S.A. That exchange occurred with the delivery of the respective LAN shares to shareholders of Sister Holdco S.A. and the respective BDRs (“Brazilian Depositary Receipts”) and ADRs (“American Depositary Receipts”) from LAN to the shareholders of Holdco II S.A. abroad on June 27, 2012, that is, TAM shareholders who accepted the exchange offer.
The share exchange offer materialized with the exchange previously referenced was 99.9% of the TAM shares that accepted that TAM would stop being a public company in Brazil, which fulfilled the condition for the cancellation of registration, requirement for the success of the exchange offer.
The capital increase in LATAM Airline S.A originated in the merger is determined by the social capital amount of Sister Holdco S.A. and Holdco II S.A., equivalent to ThUS$ 951,409. The difference between this value and the purchase price (Note 18.2.b), amounting to ThUS$ 2,665,692 was included in “Other reserves” during 2012.
On July 27, 2012, TAM made use of the Squeeze-Out granted by the Brazilian legislation, under which a compulsory could rescue all TAM shares that were not exchanged in the exchange offer or contributed by controlling shareholders of TAM. Since TAM shares received in the exchange offer, plus the shares committed by the controlling shareholders of TAM, represented 95.9% of the total outstanding shares of TAM, the aforementioned condition was met on the remaining 4.1% through the disbursement by TAM of ThUS$ 165,143.
As a consequence of the end of that process: (i) concluded the process of Business Combination of LAN and TAM, and (ii) the renaming of LAN Airlines S.A. to LATAM Airlines Group S.A. became effective.
The costs incurred by LATAM Airline Group S.A. to make the Business Combination amounts to ThUS$ 50,647 for the year ended December 31, 2012, and were recorded in the Income statement when they were incurred.presented.
The ownership structure of TAM, after the business combination, is as follows:
TAM S.A.
| Holdco I S.A. | LATAM Airlines Group S.A. | Total | ||||||||||||||||||
Class of shares | Shares | % | Shares | % | Shares | |||||||||||||||
ON (voting rights) | 55,413,784 | 100.00 | — | 55,413,784 | ||||||||||||||||
PN (non-votings rights) | — | 94,718,931 | 100.00 | 94,718,931 | ||||||||||||||||
|
|
|
|
|
| |||||||||||||||
Total | 55,413,784 | 94,718,931 | 150,132,715 | |||||||||||||||||
|
|
|
|
|
| |||||||||||||||
Holdco I S.A.
| TEP Chile S.A. (owned by the controlling shareholders of TAM) | LATAM Airlines Group S.A. | Total | ||||||||||||||||||
Class of shares | Shares | �� | % | Shares | % | shares | ||||||||||||||
Serie A (voting rights) | 938 | 80.58 | 226 | 19.42 | 1,164 | |||||||||||||||
Serie B (economic right) | — | 55,413,621 | 100.00 | 55,413,621 | ||||||||||||||||
|
|
|
|
|
| |||||||||||||||
Total | 938 | 55,413,847 | 55,414,785 | |||||||||||||||||
|
|
|
|
|
| |||||||||||||||
TAM is a leading airline in Brazil, with more than 35 years in operation, and as of the date of the business combination it boasted: over 30,000 employees, a fleet of more than 160 aircraft, annual sales surpassing US$7.3 billion, and a 2011 Brazilian market share of 41.2% domestically, and 88.1% of international flights operated by Brazilian-flagged airlines. It is appropriate to point out that Multiplus S.A., a company controlled by TAM S.A., is engaged in the development and administration of client loyalty programs. Multiplus S.A. has been registered in the “Novo Mercado” section on the BMF&Bovespa exchange since February 3, 2010.
Under IFRS 3 this operation has been registered as a business combination consigning to the Company as purchaser of TAM. Besides the fact that LATAM is the one who issuing the shares in the combination, this is based on the economic rights and relative vote relating of the former shareholders of LAN and TAM over the combined entity.
(b) Business combination in accordance with IFRS 3 (*)
IFRS 3 establishes principles and requirements for how the acquirer:
IFRS 3 provides the acquirer with a reasonable time (measurement period) to obtain the information necessary to identify and measure the three points mentioned above as of the acquisition date. During the measurement period, the acquirer shall retrospectively adjust the provisional amounts recognized at the acquisition date to reflect new information obtained about facts and circumstances that existed as of the acquisition date and, if known, would have affected the measurement of the amounts recognized as of that date. The measurement period shall not exceed one year from the acquisition date (June 22, 2012). Therefore, some amounts reported in previous financial statements as provisional amounts because the accounting was incomplete have been retrospectively adjusted.
(i) Consideration paid
The following summarizes the consideration paid for TAM S.A. and subsidiaries:
Number of shares LAN (a) | Share price at at June 22 US$ (b) | Total exchange of shares (a) times (b) | Squeeze Out At July 27 | Total purchase price ThUS$ | ||||
135,119,066 | 26.76973 | 3,617,101 | 165,143 | 3,782,244 | ||||
|
|
|
|
|
Value of the share at June 22, 2012 CLP$ 13,489
Exchange rate as of June 22, 2012 503.89 CLP$/US$
Consideration paid was calculated, in accordance with IFRS 3, as the sum of the fair value of the LAN shares provided and the Squeeze-Out cash payment explained in Note 18.2.(a).
(ii) Fair value of identifiable assets acquired and liabilities assumed.
The following table summarizes the fair value of recognized amounts of identifiable assets acquired and liabilities assumed at the acquisition date.
| ||||
| ||||
| ||||
| ||||
| ||||
| ||||
| ||||
| ||||
| ||||
| ||||
| ||||
| ||||
| ||||
| ||||
| ||||
| ||||
| ||||
| ||||
| ||||
| ||||
| ||||
iii. Goodwill acquired
The financial statements of LATAM Airlines Group S.A. include goodwill recorded to the value of ThUS$ 4,015,987 calculated and assigned to corresponding segments. The following table summarizes the consideration paid, the fair value of assets acquired, liabilities assumed, non-controlling interest and goodwill acquired at the acquisition date.
| ThUS$ | ThUS$ | |||||||
Purchase price | 3,782,244 | |||||||
|
| |||||||
Less: | ||||||||
Historic net assets | 578,559 | |||||||
Fair value adjustment: | ||||||||
Airport Slots | (1,472,625 | ) | ||||||
Loyalty program | (517,304 | ) | ||||||
Fleet (included maintenance) | 723,364 | |||||||
Other provisions | 1,157,419 | |||||||
Error correction | 584,126 | |||||||
Deferred tax | 104,342 | |||||||
Other | 130,054 | |||||||
|
| |||||||
Total adjustment | 709,376 | |||||||
|
| |||||||
Total net assets at fair value | (130,817 | ) | (130,817 | ) | ||||
Non-controlling interest | 102,926 | |||||||
|
| |||||||
Goodwill restated at June 22, 2012 | 4,015,987 | |||||||
|
| |||||||
The following table summarizes Goodwill acquired by segments.
| ||||
| ||||
| ||||
Non-controlling interest have been measured and recognized at fair value.
(c) Retrospective revision to LATAM 2012 consolidated financial statements.
As required by IFRS, during the first half of 2013, based on new information obtained about facts and circumstances that existed as of the acquisition date, Latam Airlines Group S.A. has retrospectively adjusted the amounts presented in the December 31, 2012 consolidated financial statements. Adjustments are related to the fair value of: fleet, customer loyalty programs and provisions, and to non-material errors identified related to Deferred income and Tax liabilities that existed before the acquisition date relating to TAM S.A. and Subsidiaries.
The revised amounts of the statement of financial position at June 22, 2012, date of the business combination of TAM S.A. and its subsidiaries are as follows:
| Errors on Revenue and deferred revenue cycle | Errors on Tax and deferred taxes cycle | |||||||||||||||||||||||
| Fair value at June 22, 2012 | ||||||||||||||||||||||||
| publicated at June 30, 2013 | publicated at december 31, 2012 | Variation | Fair value modification | |||||||||||||||||||||
| ThUS$ | ThUS$ | ThUS$ | ThUS$ | ThUS$ | ThUS$ | |||||||||||||||||||
| Unaudited | ||||||||||||||||||||||||
Cash and cash equivalents | 263,986 | 263,986 | — | — | — | — | ||||||||||||||||||
Other financial assets | 810,079 | 810,079 | — | — | — | — | ||||||||||||||||||
Other non-financial assets | 324,170 | 333,086 | (8,916 | ) | (8,916 | ) | — | — | ||||||||||||||||
Trade and other accounts receivable | 1,004,331 | 1,035,692 | (31,361 | ) | (15,686 | ) | (15,675 | ) | — | |||||||||||||||
Inventories | 66,287 | 69,823 | (3,536 | ) | (3,434 | ) | (102 | ) | — | |||||||||||||||
Tax assets | 145,626 | 156,215 | (10,589 | ) | (28,897 | ) | (22 | ) | 18,330 | |||||||||||||||
Assets held for sale | 8,865 | 8,865 | — | — | — | — | ||||||||||||||||||
Airport slots | 1,472,625 | 1,472,625 | — | — | — | — | ||||||||||||||||||
Loyalty programs | 517,304 | — | 517,304 | 517,304 | (a) | — | — | |||||||||||||||||
Other intangible assets | 281,552 | 268,190 | 13,362 | 13,385 | (23 | ) | — | |||||||||||||||||
Fleet | 3,178,065 | 3,176,372 | 1,693 | 1,693 | — | — | ||||||||||||||||||
Other property, plant and equipment | 1,063,036 | 1,057,220 | 5,816 | 5,816 | — | — | ||||||||||||||||||
Other financial liabilities | (4,802,902 | ) | (4,802,902 | ) | — | — | — | — | ||||||||||||||||
Other non-financial liabilities | (1,445,463 | ) | (1,064,782 | ) | (380,681 | ) | 16,847 | (397,528 | ) | — | ||||||||||||||
Trade and other accounts payables | (1,473,579 | ) | (1,077,784 | ) | (395,795 | ) | (406,153 | ) (b) | 10,358 | — | ||||||||||||||
Other provisions | (1,429,012 | ) | (634,076 | ) | (794,936 | ) | (742,180 | ) (c) | — | (52,756 | ) | |||||||||||||
Employee benefits | (18,580 | ) | — | (18,580 | ) | (18,580 | ) | — | — | |||||||||||||||
Tax liabilities | (65,185 | ) | (65,185 | ) | — | — | — | — | ||||||||||||||||
Deferred taxes | (31,940 | ) | (22,109 | ) | (9,831 | ) | 136,877 | — | (146,708 | ) | ||||||||||||||
Accounts payable to related entities | (82 | ) | (82 | ) | — | — | — | — | ||||||||||||||||
|
|
|
|
|
|
|
|
|
|
|
| |||||||||||||
Net assets at fair value | (130,817 | ) | 985,233 | (1,116,050 | ) | (531,924 | ) | (402,992 | ) | (181,134 | ) | |||||||||||||
|
|
|
|
|
|
|
|
|
|
|
| |||||||||||||
The main changes made to the fair value correspond to:
(a) Loyalty program
Complementing the mentioned in Note 18.2 (b) ii, the company has recognized as an intangible asset the loyalty program and coalition of Multiplus. The program provides a system of coalition flexible and interrelated among its partners and members, which allows a considerable increase in consumer loyalty. This program has been valued at fair value using the income approach, through cash flows from the margins attributed to intangible. His life has been regarded as indefinite, based on the ability to maintain and renew the relationship between strategic partners among others aspects.
(b) Trade and other accounts payables
The main fair values reflected in this category are:
(c) Other provision
The fair value of other provision, correspond to those contingencies with a probability of loss under 50%, which are not provided for the normal application of IFRS enforcement and that only must be registered in the context of a business combination in accordance with IFRS 3.
The detailed fair values for other provision are as follows:
| ||||||||
| ||||||||
| ||||||||
| ||||||||
| ||||||||
| ||||||||
Civil cases correspond to approximately 7,000 cases involving different demands of civil order, filed against of TAM S.A. and Subsidiaries and whose loss probability is less than 50%.
The labor disputes are approximately 2,200 cases involving different demands of labor order, filed against of TAM S.A. and Subsidiaries and whose loss probability is less than 50%.
The litigation and tax criteria correspond to approximately 500 cases involving to the tax treatment applicable to direct and indirect taxes, which are found in both administrative and judicial stage, and whose probability of loss is less than 50%.
In the process of determining the fair values of the net assets of TAM S.A. and its Subsidiaries, at the date of the business combination, non-significant errors were detected within the LATAM’s consolidated financial statement, in Deferred income and Tax liabilities. These errors originated from TAM S.A. and Subsidiaries and the nature of these errors correspond to:
Differences between the general ledger and the sub-ledger, corresponding to deferred revenue not recognized related with unused tickets.
The correction of this difference resulted in decreases in the following items of the Statement of financial position of TAM S.A. and its Subsidiaries at June 22, 2012: Trade and other accounts receivable for ThUS$ 15,675, other items of assets for ThUS$ 147 and Trade payables and other accounts payable ThUS$ 10,358, and increases in Other financial liabilities non-current of ThUS$ 397,528.
Errors in the determination of annual taxable income used to calculate of deferred tax and the re-calculation and correction of statements, product of changes in the method of determination of tax credits.
The corrections of this errors resulted in the increase of the following items of the Statement of financial position of TAM S.A. and its Subsidiaries at June 22, 2012: Tax assets for ThUS$ 18,330, Other long term provision for ThUS$ 52,756 and Deferred tax liabilities for ThUS$ 146,708.
The adjustments to LATAM Airlines Group SA and subsidiaries, for each type of error between the acquisition date and December 31, 2012 were:
During this period the adjustments are complementary to the error correction made at the acquisition date, and the main modified items are: Trade and other accounts receivables (increase of ThUS$ 40,856) and Other financial liabilities non-current (increase of ThUS$ 50,393) with effect Revenue (loss of ThUS$ 10,236).
During this period the adjustments are complementary to the error correction made at the acquisition date, and the main modified items are: Other provisions non-current (increase of ThUS$ 1,581) and Deferred tax liabilities (decrease of ThUS$ 1,139) with effect on Revenue (loss of ThUS$ 1,581) and loss tax expense (less expense of ThUS$ 1,139).
The effects resulting from the fair value adjustments and errors correction at December 31, 2012 were the following:
| Revised amount for the year ended at december 31, 2012 | Historical amounts for the year ended at december 31, 2012 | Variation | Fair value modification | Errors on Revenue and deferred revenue cycle | Errors on Tax and deferred taxes cycle | |||||||||||||||||||
| ThUS$ | ThUS$ | ThUS$ | ThUS$ | ThUS$ | ThUS$ | |||||||||||||||||||
| Unaudited | ||||||||||||||||||||||||
Revenue | 9,710,372 | 9,722,189 | (11,817 | ) | — | (10,236 | ) | (1,581 | ) | |||||||||||||||
Cost of sale | (7,634,453 | ) | (7,642,643 | ) | 8,190 | 8,190 | (*) | — | — | |||||||||||||||
|
|
|
|
|
|
|
|
|
|
|
| |||||||||||||
Gross margin | 2,075,919 | 2,079,546 | (3,627 | ) | 8,190 | (10,236 | ) | (1,581 | ) | |||||||||||||||
|
|
|
|
|
|
|
|
|
|
|
| |||||||||||||
Other income | 220,156 | 220,156 | — | — | — | — | ||||||||||||||||||
Distribution cost | (803,619 | ) | (803,619 | ) | — | — | — | — | ||||||||||||||||
Administrative expenses | (888,654 | ) | (869,504 | ) | (19,150 | ) | (19,150 | ) (**) | — | — | ||||||||||||||
Other expenses | (311,753 | ) | (311,753 | ) | — | — | — | — | ||||||||||||||||
Other gains / (losses) | (45,831 | ) | (38,750 | ) | (7,081 | ) | (7,081 | ) (*) | — | — | ||||||||||||||
|
|
|
|
|
|
|
|
|
|
|
| |||||||||||||
Gains (losses) from operating activities | 246,218 | 276,076 | (29,858 | ) | (18,041 | ) | (10,236 | ) | (1,581 | ) | ||||||||||||||
|
|
|
|
|
|
|
|
|
|
|
| |||||||||||||
Financial income | 77,489 | 77,489 | — | — | — | — | ||||||||||||||||||
Financial cost | (294,598 | ) | (294,598 | ) | — | — | — | — | ||||||||||||||||
| — | — | — | — | |||||||||||||||||||||
Equity accounted earning | 972 | 972 | — | — | — | — | ||||||||||||||||||
Foreing exchange goins / (losses) | 66,685 | 66,685 | — | — | — | — | ||||||||||||||||||
Result of indexation units | (22 | ) | (22 | ) | — | — | — | — | ||||||||||||||||
|
|
|
|
|
|
|
|
|
|
|
| |||||||||||||
Income (loss) before taxes | 96,744 | 126,602 | (29,858 | ) | (18,041 | ) | (10,236 | ) | (1,581 | ) | ||||||||||||||
Income (loss) tax expenses | (102,386 | ) | (102,212 | ) | (174 | ) | (1,313 | ) | — | 1,139 | ||||||||||||||
|
|
|
|
|
|
|
|
|
|
|
| |||||||||||||
NET INCOME (LOSS) FOR THE PERIOD | (5,642 | ) | 24,390 | (30,032 | ) | (19,354 | ) | (10,236 | ) | (442 | ) | |||||||||||||
|
|
|
|
|
|
|
|
|
|
|
| |||||||||||||
Income (loss) attributable to owners of the parent | (19,076 | ) | 10,956 | (30,032 | ) | (19,354 | ) | (10,236 | ) | (442 | ) | |||||||||||||
Income (loss) attributable to non-controlling interest | 13,434 | 13,434 | — | — | — | — | ||||||||||||||||||
|
|
|
|
|
|
|
|
|
|
|
| |||||||||||||
Net income (loss) for the period | (5,642 | ) | 24,390 | (30,032 | ) | (19,354 | ) | (10,236 | ) | (442 | ) | |||||||||||||
|
|
|
|
|
|
|
|
|
|
|
| |||||||||||||
(d) Other information
The income contribution of TAM S.A. and Subsidiaries during the period of 2012 was ThUS$ 3,633,592, the net result considered in the consolidated financial statements of the group at December 31, 2012, was a loss of ThUS$ 75,195.
NOTE 1917 - PROPERTY, PLANT AND EQUIPMENT
The composition by category of Property, plant and equipment is as follows:
| Gross Book Value | Acumulated depreciation | Net Book Value | ||||||||||||||||||||||
| As of December 31, 2013 | As of December 31, 2012 | As of December 31, 2013 | As of December 31, 2012 | As of December 31, 2013 | As of December 31, 2012 | |||||||||||||||||||
| ThUS$ | ThUS$ | ThUS$ | ThUS$ | ThUS$ | ThUS$ | |||||||||||||||||||
Construction in progress | 858,650 | 1,153,003 | — | — | 858,650 | 1,153,003 | ||||||||||||||||||
Land | 59,352 | 65,307 | — | — | 59,352 | 65,307 | ||||||||||||||||||
Buildings | 247,263 | 245,939 | (75,478 | ) | (70,869 | ) | 171,785 | 175,070 | ||||||||||||||||
Plant and equipment | 8,461,456 | 7,942,957 | (1,708,668 | ) | (1,635,532 | ) | 6,752,788 | 6,307,425 | ||||||||||||||||
Own aircraft | 7,409,394 | 6,979,985 | (1,347,671 | ) | (1,278,739 | ) | 6,061,723 | 5,701,246 | ||||||||||||||||
Other | 1,052,062 | 962,972 | (360,997 | ) | (356,793 | ) | 691,065 | 606,179 | ||||||||||||||||
Machinery | 73,561 | 76,956 | (41,509 | ) | (41,799 | ) | 32,052 | 35,157 | ||||||||||||||||
Information technology equipment | 182,108 | 171,568 | (135,889 | ) | (131,105 | ) | 46,219 | 40,463 | ||||||||||||||||
Fixed installations and accessories | 97,212 | 81,252 | (46,620 | ) | (38,909 | ) | 50,592 | 42,343 | ||||||||||||||||
Motor vehicles | 75,150 | 70,706 | (51,128 | ) | (48,451 | ) | 24,022 | 22,255 | ||||||||||||||||
Leasehold improvements | 88,641 | 87,004 | (71,872 | ) | (65,276 | ) | 16,769 | 21,728 | ||||||||||||||||
Other property, plants and equipment | 4,791,236 | 5,814,689 | (1,820,679 | ) | (1,870,364 | ) | 2,970,557 | 3,944,325 | ||||||||||||||||
Financial leasing aircraft | 4,618,127 | 5,659,575 | (1,777,980 | ) | (1,830,273 | ) | 2,840,147 | 3,829,302 | ||||||||||||||||
Other | 173,109 | 155,114 | (42,699 | ) | (40,091 | ) | 130,410 | 115,023 | ||||||||||||||||
|
|
|
|
|
|
|
|
|
|
|
| |||||||||||||
Total | 14,934,629 | 15,709,381 | (3,951,843 | ) | (3,902,305 | ) | 10,982,786 | 11,807,076 | ||||||||||||||||
|
|
|
|
|
|
|
|
|
|
|
| |||||||||||||
The movement in the different categories of Property, plant and equipment from January 1, 2011 to December 31, 2013 is shown below:
(a) As of December 31, 2011
| Gross Book Value | Acumulated depreciation | Net Book Value | ||||||||||||||||||||||
| As of | As of | As of | As of | As of | As of | |||||||||||||||||||
| December 31, | December 31, | December 31, | December 31, | December 31, | December 31, | |||||||||||||||||||
| 2016 | 2015 | 2016 | 2015 | 2016 | 2015 | |||||||||||||||||||
| ThUS$ | ThUS$ | ThUS$ | ThUS$ | ThUS$ | ThUS$ | |||||||||||||||||||
Construction in progress (*) | 470,065 | 1,142,812 | — | — | 470,065 | 1,142,812 | ||||||||||||||||||
Land | 50,148 | 45,313 | — | — | 50,148 | 45,313 | ||||||||||||||||||
Buildings | 190,771 | 131,816 | (60,552 | ) | (40,325 | ) | 130,219 | 91,491 | ||||||||||||||||
Plant and equipment | 10,099,587 | 9,683,764 | (2,350,045 | ) | (2,392,463 | ) | 7,749,542 | 7,291,301 | ||||||||||||||||
Own aircraft | 9,436,684 | 9,118,396 | (2,123,025 | ) | (2,198,682 | ) | 7,313,659 | 6,919,714 | ||||||||||||||||
Other (**) | 662,903 | 565,368 | (227,020 | ) | (193,781 | ) | 435,883 | 371,587 | ||||||||||||||||
Machinery | 39,246 | 36,569 | (26,821 | ) | (21,220 | ) | 12,425 | 15,349 | ||||||||||||||||
Information technology equipment | 163,695 | 154,093 | (123,981 | ) | (110,204 | ) | 39,714 | 43,889 | ||||||||||||||||
Fixed installations and accessories | 178,363 | 179,026 | (94,451 | ) | (90,068 | ) | 83,912 | 88,958 | ||||||||||||||||
Motor vehicles | 96,808 | 99,997 | (67,855 | ) | (64,047 | ) | 28,953 | 35,950 | ||||||||||||||||
Leasehold improvements | 192,100 | 124,307 | (87,559 | ) | (70,219 | ) | 104,541 | 54,088 | ||||||||||||||||
Other property, plants and equipment | 3,005,981 | 3,279,902 | (1,177,351 | ) | (1,150,396 | ) | 1,828,630 | 2,129,506 | ||||||||||||||||
Financial leasing aircraft | 2,905,556 | 3,151,405 | (1,152,190 | ) | (1,120,682 | ) | 1,753,366 | 2,030,723 | ||||||||||||||||
Other | 100,425 | 128,497 | (25,161 | ) | (29,714 | ) | 75,264 | 98,783 | ||||||||||||||||
|
|
|
|
|
|
|
|
|
|
|
| |||||||||||||
Total | 14,486,764 | 14,877,599 | (3,988,615 | ) | (3,938,942 | ) | 10,498,149 | 10,938,657 | ||||||||||||||||
|
|
|
|
|
|
|
|
|
|
|
| |||||||||||||
| Construction in progress | Land | Buildings net | Plant and equipment net | Information technology equipment net | Fixed installations & accessories net | Motor vehicles net | Leasehold improvements net | Other property, plant and equipment net | Property, Plant and equipment net | |||||||||||||||||||||||||||||||
| ThUS$ | ThUS$ | ThUS$ | ThUS$ | ThUS$ | ThUS$ | ThUS$ | ThUS$ | ThUS$ | ThUS$ | |||||||||||||||||||||||||||||||
Opening balance as of January 1, 2011 | 715,603 | 35,538 | 80,121 | 3,663,136 | 18,599 | 27,003 | 1,290 | 44,120 | 363,020 | 4,948,430 | ||||||||||||||||||||||||||||||
|
|
|
|
|
|
|
|
|
|
|
|
|
| �� |
|
|
|
|
| |||||||||||||||||||||
Additions | 29,898 | — | 1,111 | 1,028,568 | 11,885 | 6,663 | 543 | 6,555 | 19,072 | 1,104,295 | ||||||||||||||||||||||||||||||
Acquisitions through business combination | — | — | — | — | — | — | — | — | 16 | 16 | ||||||||||||||||||||||||||||||
Disposals | — | — | (2,681 | ) | (109,936 | ) | (8 | ) | — | (6 | ) | — | (537 | ) | (113,168 | ) | ||||||||||||||||||||||||
Transfers (to) from non-current assets and disposal groups | (127 | ) | — | — | (112 | ) | (1,195 | ) | (588 | ) | (1 | ) | — | (115 | ) | (2,138 | ) | |||||||||||||||||||||||
Retirements | (150 | ) | — | (4 | ) | (4,817 | ) | (85 | ) | (23 | ) | (17 | ) | — | (332 | ) | (5,428 | ) | ||||||||||||||||||||||
Depreciation expense | — | — | (3,302 | ) | (265,062 | ) | (6,354 | ) | (3,602 | ) | (215 | ) | (19,938 | ) | (30,608 | ) | (329,081 | ) | ||||||||||||||||||||||
Conversion difference subsidiaries | (852 | ) | — | (95 | ) | (771 | ) | (63 | ) | (54 | ) | 18 | — | (95 | ) | (1,912 | ) | |||||||||||||||||||||||
Other increases (decreases) | 343,191 | 135 | 2,788 | (169,021 | ) | (188 | ) | 5,699 | 25 | 762 | 143,577 | 326,968 | ||||||||||||||||||||||||||||
|
|
|
|
|
|
|
|
|
|
|
|
|
|
|
|
|
|
|
| |||||||||||||||||||||
Changes, total | 371,960 | 135 | (2,183 | ) | 478,849 | 3,992 | 8,095 | 347 | (12,621 | ) | 130,978 | 979,552 | ||||||||||||||||||||||||||||
|
|
|
|
|
|
|
|
|
|
|
|
|
|
|
|
|
|
|
| |||||||||||||||||||||
Closing balance as of December 31, 2011 | 1,087,563 | 35,673 | 77,938 | 4,141,985 | 22,591 | 35,098 | 1,637 | 31,499 | 493,998 | 5,927,982 | ||||||||||||||||||||||||||||||
|
|
|
|
|
|
|
|
|
|
|
|
|
|
|
|
|
|
|
| |||||||||||||||||||||
(b) As of December 31, 2012
| Construction in progress | Land | Buildings net | Plant and equipment net | Information technology equipment net | Fixed installations & accessories net | Motor vehicles net | Leasehold improvements net | Other property, plant and equipment net | Property, Plant and equipment net | |||||||||||||||||||||||||||||||
| ThUS$ | ThUS$ | ThUS$ | ThUS$ | ThUS$ | ThUS$ | ThUS$ | ThUS$ | ThUS$ | ThUS$ | |||||||||||||||||||||||||||||||
Opening balance as of January 1, 2012 | 1,087,563 | 35,673 | 77,938 | 4,141,985 | 22,591 | 35,098 | 1,637 | 31,499 | 493,998 | 5,927,982 | ||||||||||||||||||||||||||||||
|
|
|
|
|
|
|
|
|
|
|
|
|
|
|
|
|
|
|
| |||||||||||||||||||||
Additions | 34,885 | — | 17,349 | 2,803,242 | 11,626 | 7,836 | 458 | 4,668 | 154,000 | 3,034,064 | ||||||||||||||||||||||||||||||
Acquisitions through business combinations | 553,781 | 46,373 | 87,338 | 469,650 | 16,990 | 1,696 | 4,099 | — | 3,061,174 | 4,241,101 | ||||||||||||||||||||||||||||||
Disposals | (27 | ) | (5,116 | ) | (4,821 | ) | (73,654 | ) | (15 | ) | — | (28 | ) | — | (5 | ) | (83,666 | ) | ||||||||||||||||||||||
Transfers (to) from non-current assets (or disposal groups) | (2,256 | ) | (11,895 | ) | — | (49,910 | ) | — | — | — | — | (64,061 | ) | |||||||||||||||||||||||||||
Retirements | (281 | ) | — | (1,100 | ) | (136,879 | ) | (951 | ) | (261 | ) | (62 | ) | (82 | ) | (18,799 | ) | (158,415 | ) | |||||||||||||||||||||
Depreciation expenses | — | — | (3,311 | ) | (319,578 | ) | (14,982 | ) | (6,526 | ) | (1,316 | ) | (16,432 | ) | (250,329 | ) | (612,474 | ) | ||||||||||||||||||||||
Conversion difference subsidiaries | 1,844 | 272 | (2,370 | ) | 2,625 | 3,968 | 530 | (101 | ) | — | 16,725 | 23,493 | ||||||||||||||||||||||||||||
Other increases (decreases) | (522,506 | ) | — | 4,047 | (477,366 | ) | 1,236 | 3,970 | 35 | 2,075 | 487,561 | (500,948 | ) | |||||||||||||||||||||||||||
|
|
|
|
|
|
|
|
|
|
|
|
|
|
|
|
|
|
|
| |||||||||||||||||||||
Changes, total | 65,440 | 29,634 | 97,132 | 2,218,130 | 17,872 | 7,245 | 3,085 | (9,771 | ) | 3,450,327 | 5,879,094 | |||||||||||||||||||||||||||||
|
|
|
|
|
|
|
|
|
|
|
|
|
|
|
|
|
|
|
| |||||||||||||||||||||
Closing balance as of December 31, 2012 | 1,153,003 | 65,307 | 175,070 | 6,360,115 | 40,463 | 42,343 | 4,722 | 21,728 | 3,944,325 | 11,807,076 | ||||||||||||||||||||||||||||||
|
|
|
|
|
|
|
|
|
|
|
|
|
|
|
|
|
|
|
| |||||||||||||||||||||
(c) As of December 31, 2013
| Construction in progress | Land | Buildings net | Plant and equipment net | Information technology equipment net | Fixed installations & accessories net | Motor vehicles net | Leasehold improvements net | Other property, plant and equipment net | Property, plant and equipment net | |||||||||||||||||||||||||||||||
| ThUS$ | ThUS$ | ThUS$ | ThUS$ | ThUS$ | ThUS$ | ThUS$ | ThUS$ | ThUS$ | ThUS$ | |||||||||||||||||||||||||||||||
Opening balance as of Janury 1, 2013 | 1,153,003 | 65,307 | 175,070 | 6,360,115 | 40,463 | 42,343 | 4,722 | 21,728 | 3,944,325 | 11,807,076 | ||||||||||||||||||||||||||||||
|
|
|
|
|
|
|
|
|
|
|
|
|
|
|
|
|
|
|
| |||||||||||||||||||||
Additions | 17,731 | — | 11,798 | 1,555,667 | 22,146 | 7,663 | 303 | — | 69,703 | 1,685,011 | ||||||||||||||||||||||||||||||
Disposals | — | — | — | (141,328 | ) | (31 | ) | — | (161 | ) | — | (644,637 | ) | (786,157 | ) | |||||||||||||||||||||||||
Retirements | (615 | ) | — | (430 | ) | (65,151 | ) | (270 | ) | (15 | ) | (10 | ) | (219 | ) | (19,716 | ) | (86,426 | ) | |||||||||||||||||||||
Depreciation expenses | — | — | (11,768 | ) | (446,503 | ) | (14,131 | ) | (8,893 | ) | (312 | ) | (12,281 | ) | (336,586 | ) | (830,474 | ) | ||||||||||||||||||||||
Conversion difference subsidiaries | (53,452 | ) | (5,955 | ) | (12,414 | ) | (71,013 | ) | (3,375 | ) | (1,527 | ) | (286 | ) | (1 | ) | (320,738 | ) | (468,761 | ) | ||||||||||||||||||||
Other increases (decreases) | (258,017 | ) | — | 9,529 | (384,669 | ) | 1,417 | 11,021 | (2,512 | ) | 7,542 | 278,206 | (337,483 | ) | ||||||||||||||||||||||||||
|
|
|
|
|
|
|
|
|
|
|
|
|
|
|
|
|
|
|
| |||||||||||||||||||||
Changes, total | (294,353 | ) | (5,955 | ) | (3,285 | ) | 447,003 | 5,756 | 8,249 | (2,978 | ) | (4,959 | ) | (973,768 | ) | (824,290 | ) | |||||||||||||||||||||||
|
|
|
|
|
|
|
|
|
|
|
|
|
|
|
|
|
|
|
| |||||||||||||||||||||
Closing balance as of December 31, 2013 | 858,650 | 59,352 | 171,785 | 6,807,118 | 46,219 | 50,592 | 1,744 | 16,769 | 2,970,557 | 10,982,786 | ||||||||||||||||||||||||||||||
|
|
|
|
|
|
|
|
|
|
|
|
|
|
|
|
|
|
|
| |||||||||||||||||||||
(d) Composition of the fleet
Aircraft included in the Company’s Property, plant and equipment:
| Aircraft | Model | As of December 31, 2013 | As of December 31, 2012 | |||||||
Boeing 767 | 300 | 3 | 3 | |||||||
Boeing 767 | 300ER | 34 | 30 | |||||||
Boeing 767 | 300F | 8 | 8 | |||||||
Boeing 777 | 300ER | 8 | 8 | |||||||
Boeing 777 | Freighter | 2 | 2 | |||||||
Boeing 787 | 800 | 3 | 3 | |||||||
Airbus A318 | 100 | — | 5 | |||||||
Airbus A319 | 100 | 39 | 39 | |||||||
Airbus A320 | 200 | 95 | 76 | |||||||
Airbus A321 | 200 | 9 | 8 | |||||||
Airbus A330 | 200 | 8 | 18 | |||||||
Airbus A340 | 300 | — | 2 | |||||||
Airbus A340 | 500 | 2 | 2 | |||||||
|
|
|
| |||||||
Total | 211 | 204 | ||||||||
|
|
|
| |||||||
Operating leases:
| Aircraft | Model | As of December 31, 2013 | As of December 31, 2012 | |||||||
Boeing 767 | 300ER | 6 | 8 | |||||||
Boeing 767 | 300F | 4 | 4 | |||||||
Boeing 777 | 300ER | 2 | — | |||||||
Boeing 777 | Freighter | 2 | 2 | |||||||
Boeing 787 | 800 | 2 | — | |||||||
Airbus A319 | 100 | 15 | 18 | |||||||
Airbus A320 | 200 | 65 | 65 | |||||||
Airbus A321 | 200 | 1 | 1 | |||||||
Airbus A330 | 200 | 12 | 2 | |||||||
Airbus A340 | 300 | 4 | 3 | |||||||
Boeing 737 | 700 | 5 | 6 | |||||||
Bombardier | Dhc8-200 | 7 | 10 | |||||||
Bombardier | Dhc8-400 | 3 | 4 | |||||||
|
|
|
| |||||||
Total | 128 | 123 | ||||||||
|
|
|
| |||||||
Total fleet | 339 | 327 | ||||||||
|
|
|
| |||||||
| (*) | It includes pre-delivery payments to aircraft manufacturers for ThUS$ 434,250 (ThUS$ 1,016,007 as of December 31, 2015) |
| (**) | Mainly considers rotable and tools. |
| Movement in the different categories of Property, plant and equipment: |
| Other | ||||||||||||||||||||||||||||||||||||||||
| Information | Fixed | property, | Property, | |||||||||||||||||||||||||||||||||||||
| Plant and | technology | installations | Motor | Leasehold | plant and | Plant and | ||||||||||||||||||||||||||||||||||
| Construction | Buildings | equipment | equipment | & accessories | vehicles | improvements | equipment | equipment | ||||||||||||||||||||||||||||||||
| in progress | Land | net | net | net | net | net | net | net | net | |||||||||||||||||||||||||||||||
| ThUS $ | ThUS $ | ThUS $ | ThUS $ | ThUS $ | ThUS $ | ThUS $ | ThUS $ | ThUS $ | ThUS $ | |||||||||||||||||||||||||||||||
Opening balance as of January 1, 2014 | 858,650 | 59,352 | 171,785 | 6,807,118 | 46,219 | 50,592 | 1,744 | 16,769 | 2,970,557 | 10,982,786 | ||||||||||||||||||||||||||||||
|
|
|
|
|
|
|
|
|
|
|
|
|
|
|
|
|
|
|
| |||||||||||||||||||||
Additions | 29,980 | 3,440 | 16,636 | 1,214,282 | 22,239 | 2,190 | 1,586 | — | 154,049 | 1,444,402 | ||||||||||||||||||||||||||||||
Disposals | — | — | — | (660,129 | )(1) | (57 | ) | — | (4 | ) | — | (328 | ) | (660,518 | ) | |||||||||||||||||||||||||
Retirements | (705 | ) | — | (403 | ) | (39,463 | ) | (205 | ) | (230 | ) | (53 | ) | (50 | ) | (34,282 | ) | (75,391 | ) | |||||||||||||||||||||
Depreciation expenses | — | — | (13,980 | ) | (431,967 | ) | (16,889 | ) | (8,899 | ) | (1,041 | ) | (19,127 | ) | (286,033 | ) | (777,936 | ) | ||||||||||||||||||||||
Foreing exchange | 733 | (4,804 | ) | (12,341 | ) | (59,957 | ) | (3,595 | ) | (1,509 | ) | 330 | — | (110,727 | ) | (191,870 | ) | |||||||||||||||||||||||
Other increases (decreases) | 48,621 | — | 5,309 | 124,205 | 3,297 | 1,639 | (597 | ) | 58,931 | (189,802 | ) | 51,603 | ||||||||||||||||||||||||||||
|
|
|
|
|
|
|
|
|
|
|
|
|
|
|
|
|
|
|
| |||||||||||||||||||||
Changes, total | 78,629 | (1,364 | ) | (4,779 | ) | 146,971 | 4,790 | (6,809 | ) | 221 | 39,754 | (467,123 | ) | (209,710 | ) | |||||||||||||||||||||||||
|
|
|
|
|
|
|
|
|
|
|
|
|
|
|
|
|
|
|
| |||||||||||||||||||||
Closing balance as of December 31, 2014 | 937,279 | 57,988 | 167,006 | 6,954,089 | 51,009 | 43,783 | 1,965 | 56,523 | 2,503,434 | 10,773,076 | ||||||||||||||||||||||||||||||
|
|
|
|
|
|
|
|
|
|
|
|
|
|
|
|
|
|
|
| |||||||||||||||||||||
Opening balance as of January 1, 2015 | 937,279 | 57,988 | 167,006 | 6,954,089 | 51,009 | 43,783 | 1,965 | 56,523 | 2,503,434 | 10,773,076 | ||||||||||||||||||||||||||||||
|
|
|
|
|
|
|
|
|
|
|
|
|
|
|
|
|
|
|
| |||||||||||||||||||||
Additions | 39,711 | — | 439 | 1,304,199 | 15,322 | 1,692 | 280 | 13,188 | 64,226 | 1,439,057 | ||||||||||||||||||||||||||||||
Disposals | — | — | (500 | ) | (76,675 | )(2) | (27 | ) | — | (8 | ) | — | (11 | ) | (77,221 | ) | ||||||||||||||||||||||||
Retirements | (1,262 | ) | — | (956 | ) | (38,240 | ) | (104 | ) | (476 | ) | (4 | ) | — | (8,902 | ) | (49,944 | ) | ||||||||||||||||||||||
Depreciation expenses | — | — | (7,161 | ) | (521,688 | ) | (16,196 | ) | (11,649 | ) | (378 | ) | (13,973 | ) | (174,474 | ) | (745,519 | ) | ||||||||||||||||||||||
Foreing exchange | (932 | ) | (11,786 | ) | (18,248 | ) | (129,933 | ) | (6,126 | ) | (13,269 | ) | (638 | ) | (1,659 | ) | (252,709 | ) | (435,300 | ) | ||||||||||||||||||||
Other increases (decreases) | 168,016 | (889 | ) | (49,089 | ) | (150,677 | ) | 11 | 68,877 | 308 | 9 | (2,058 | ) | 34,508 | ||||||||||||||||||||||||||
|
|
|
|
|
|
|
|
|
|
|
|
|
|
|
|
|
|
|
| |||||||||||||||||||||
Changes, total | 205,533 | (12,675 | ) | (75,515 | ) | 386,986 | (7,120 | ) | 45,175 | (440 | ) | (2,435 | ) | (373,928 | ) | 165,581 | ||||||||||||||||||||||||
|
|
|
|
|
|
|
|
|
|
|
|
|
|
|
|
|
|
|
| |||||||||||||||||||||
Closing balance as of December 31, 2015 | 1,142,812 | 45,313 | 91,491 | 7,341,075 | 43,889 | 88,958 | 1,525 | 54,088 | 2,129,506 | 10,938,657 | ||||||||||||||||||||||||||||||
|
|
|
|
|
|
|
|
|
|
|
|
|
|
|
|
|
|
|
| |||||||||||||||||||||
Opening balance as of January 1, 2016 | 1,142,812 | 45,313 | 91,491 | 7,341,075 | 43,889 | 88,958 | 1,525 | 54,088 | 2,129,506 | 10,938,657 | ||||||||||||||||||||||||||||||
|
|
|
|
|
|
|
|
|
|
|
|
|
|
|
|
|
|
|
| |||||||||||||||||||||
Additions | 14,481 | — | 272 | 1,301,093 | 7,392 | 292 | 6 | 54,181 | 13,013 | 1,390,730 | ||||||||||||||||||||||||||||||
Disposals | — | — | — | (16,918 | )(3) | (59 | ) | — | (32 | ) | — | (2,972 | ) | (19,981 | ) | |||||||||||||||||||||||||
Retirements | (284 | ) | — | (68 | ) | (39,816 | ) | (55 | ) | (1,258 | ) | — | — | (2,604 | ) | (44,085 | ) | |||||||||||||||||||||||
Depreciation expenses | — | — | (6,234 | ) | (562,131 | ) | (14,909 | ) | (13,664 | ) | (293 | ) | (23,283 | ) | (124,038 | ) | (744,552 | ) | ||||||||||||||||||||||
Foreing exchange | 5,081 | 4,835 | 2,538 | 51,770 | 2,924 | 9,384 | 223 | 2,849 | 93,383 | 172,987 | ||||||||||||||||||||||||||||||
Other increases (decreases) | (692,025 | ) | — | 42,220 | (285,198 | )(4) | 532 | 200 | (384 | ) | 16,706 | (277,658 | ) | (1,195,607 | ) | |||||||||||||||||||||||||
|
|
|
|
|
|
|
|
|
|
|
|
|
|
|
|
|
|
|
| |||||||||||||||||||||
Changes, total | (672,747 | ) | 4,835 | 38,728 | 448,800 | (4,175 | ) | (5,046 | ) | (480 | ) | 50,453 | (300,876 | ) | (440,508 | ) | ||||||||||||||||||||||||
|
|
|
|
|
|
|
|
|
|
|
|
|
|
|
|
|
|
|
| |||||||||||||||||||||
Closing balance as of December 31, 2016 | 470,065 | 50,148 | 130,219 | 7,789,875 | 39,714 | 83,912 | 1,045 | 104,541 | 1,828,630 | 10,498,149 | ||||||||||||||||||||||||||||||
|
|
|
|
|
|
|
|
|
|
|
|
|
|
|
|
|
|
|
| |||||||||||||||||||||
| (1) | During the first half of 2014 four Boeing 777- 300ER were sold and subsequently leased. |
| (2) | During the first half of 2015 three Airbus A340 aircraft were sold. |
| During the second half of 2015 seven Dash-200 aircraft were sold. |
| During the second half of 2015 two Airbus A319 aircraft were sold. |
| (3) | During the first half of 2016 two Airbus A330 aircraft were sold. |
| (4) | During 2016 two Airbus A319 aircraft, two Airbus A320 aircraft, six Airbus A330 and two Boeing 777 aircraft were reclassified to non-current assets and disposal group classified as held for sale (See Note 13). |
| (b) | Composition of the fleet: |
| Aircraft included | ||||||||||||||||||||||||||||
| in Property, | Operating | Total | ||||||||||||||||||||||||||
| plant and equipment | leases | fleet | ||||||||||||||||||||||||||
| As of | As of | As of | As of | As of | As of | |||||||||||||||||||||||
| December 31, | December 31, | December 31, | December 31, | December 31, | December 31, | |||||||||||||||||||||||
Aircraft | Model | 2016 | 2015 | 2016 | 2015 | 2016 | 2015 | |||||||||||||||||||||
Boeing 767 | 300ER | 34 | 34 | 3 | 4 | 37 | 38 | |||||||||||||||||||||
Boeing 767 | 300F | 8 | (1) | 8 | (1) | 3 | 3 | 11 | (1) | 11 | (1) | |||||||||||||||||
Boeing 777 | 300ER | 4 | 4 | 6 | 6 | 10 | 10 | |||||||||||||||||||||
Boeing 777 | Freighter | — | 2 | (2) | 2 | 2 | 2 | 4 | (2) | |||||||||||||||||||
Boeing 787 | 800 | 6 | 6 | 4 | 4 | 10 | 10 | |||||||||||||||||||||
Boeing 787 | 900 | 4 | 3 | 8 | 4 | 12 | 7 | |||||||||||||||||||||
Airbus A319 | 100 | 36 | 38 | 12 | 12 | 48 | 50 | |||||||||||||||||||||
Airbus A320 | 200 | 93 | 95 | 53 | 59 | 146 | 154 | |||||||||||||||||||||
Airbus A320 | NEO | 1 | — | 1 | — | 2 | — | |||||||||||||||||||||
Airbus A321 | 200 | 30 | 26 | 17 | 10 | 47 | 36 | |||||||||||||||||||||
Airbus A330 | 200 | — | 8 | — | 2 | — | 10 | |||||||||||||||||||||
Airbus A350 | 900 | 5 | 1 | 2 | — | 7 | 1 | |||||||||||||||||||||
|
|
|
|
|
|
|
|
|
|
|
| |||||||||||||||||
Total | 221 | 225 | 111 | 106 | 332 | 331 | ||||||||||||||||||||||
|
|
|
|
|
|
|
|
|
|
|
| |||||||||||||||||
| (1) | Three aircraft leased to FEDEX |
| (2) | One aircraft leased to DHL |
| (c) | Method used for the depreciation of Property, plant and equipment: |
| Method | Useful life | Method | Useful life (years) | |||||||||||||||||
| minimum | maximum | minimum | maximum | |||||||||||||||||
Buildings | Straight line without residual value | 20 | 50 | Straight line without residual value | 20 | 50 | ||||||||||||||
Plant and equipment | Straight line with residual value of 20% in the short-haul fleet and 36% in the long-haul fleet. (*) | 5 | 20 | Straight line with residual value of 20% in the short-haul fleet and 36% in the long-haul fleet. (*) | 5 | 23 | ||||||||||||||
Information technology equipment | Straight line without residual value | 5 | 10 | Straight line without residual value | 5 | 10 | ||||||||||||||
Fixed installations and accessories | Straight line without residual value | 10 | 10 | Straight line without residual value | 10 | 10 | ||||||||||||||
Motor vehicle | Straight line without residual value | 10 | 10 | Straight line without residual value | 10 | 10 | ||||||||||||||
Leasehold improvements | Straight line without residual value | 5 | 5 | Straight line without residual value | 5 | 5 | ||||||||||||||
Other property, plant and equipment | Straight line with residual value of 20% in the short-haul fleet and 36% in the long- haul fleet. (*) | 3 | 20 | Straight line with residual value of 20% in the short-haul fleet and 36% in the long-haul fleet. (*) | 10 | 23 | ||||||||||||||
| (*) | Except for the Boeing 767 300ER and Boeing 767 300F fleets which consider a lower residual value due to the extension of their useful life to 22 and 23 years respectively. Additionally certain technical components, which are depreciated based on the basis of cycles and flight hours. |
As a result of the business combination with TAM S.A. and Subsidiaries 65The aircraft were incorporated with remarketing clause (**) under modality of financial leasing, which are depreciated according to the duration of their contracts, between 12 and 18 years. Its residual values are estimated according to market value at the end of such contracts.
Additionally, for the same business combination, 5 aircraft were added under operating lease contracts, which according to the stated policy, are classified as finance leases because the present value of the payments represents most of the economic value of the property. The useful life assigned is 6 years, according to the duration of the contracts.
| (**) | Aircraft with remarketing clause are those that are required to sell at the end of the contract. |
The depreciation charged to income in the period, which is included in the consolidated statement of income, amounts to ThUS$ 830,474744,552 (ThUS$ 612,474745,519 at December 31, 2012, ThUS$ 329,081 at December 31, 2011)2015). Depreciation charges for the year are recognized in Cost of sales and administrative expenses in the consolidated statement of income.
| (d) | Additional information regarding Property, plant and equipment: |
(f) Additional information regarding Property, plant and equipment:
(i) Property, plant and equipment pledged as guarantee:
| (i) | Property, plant and equipment pledged as guarantee: |
In the period ended December 31, 2013, we added2016, direct guarantees for nine Boeing 767-300 aircraft, nineteen Airbus A320 and one Airbus A321 aircraft. Moreover, the Company sold its interest in the permanent establishments Mirlo Leasing LLC, Osprey Leasing Limited, and subsidiary Conure Leasing Limited. Product of the above direct guarantees associated with a Boeing 767-300 aircraft, two aircraft Airbus A320-200s and eightby five Airbus A319-100 aircraft, were eliminated. Additionally, guarantees for seven A318-100two Airbus A320-200 aircraft, one Airbus A320 NEO aircraft, four Airbus A321-200 aircraft, four Airbus A350-900 aircraft and two Airbus A340-300one Boeing 787-9 aircraft were removed from their sale.added.
Description of Property, plant and equipment pledged as guarantee:
| As of December 31, 2013 | As of December 31, 2012 | As of | As of | |||||||||||||||||||||||||||||||||||||||
Creditor of guarantee | Assets committed | Fleet | Existing Debt | Book Value | Existing Debt | Book Value | ||||||||||||||||||||||||||||||||||||
| ThUS$ | ThUS$ | ThUS$ | ThUS$ | December 31, | December 31, | |||||||||||||||||||||||||||||||||||||
Wilmington Trust Company | Aircraft and engines | Boeing 767 | 1,437,810 | 1,827,349 | 1,296,704 | 1,640,071 | ||||||||||||||||||||||||||||||||||||
| 2016 | 2015 | |||||||||||||||||||||||||||||||||||||||||
| Creditor of | Assets | Existing | Book | Existing | Book | |||||||||||||||||||||||||||||||||||||
guarantee | committed | Fleet | Debt | Value | Debt | Value | ||||||||||||||||||||||||||||||||||||
| ThUS $ | ThUS $ | ThUS $ | ThUS $ | |||||||||||||||||||||||||||||||||||||||
Wilmington | Aircraft and engines | Airbus A321/A350 | 596,224 | 722,979 | 374,619 | 478,667 | ||||||||||||||||||||||||||||||||||||
Trust Company | Boeing 767 | 811,723 | 1,164,364 | 907,356 | 1,220,541 | |||||||||||||||||||||||||||||||||||||
| Boeing 777 / 787 | 777,796 | 880,470 | 858,221 | 937,074 | Boeing 787 | 739,031 | 899,445 | 712,059 | 834,567 | |||||||||||||||||||||||||||||||||
Banco Santander S.A. | Aircraft and engines | Airbus A319 | 74,042 | 105,353 | 81,698 | 111,458 | Aircraft and engines | Airbus A319 | 50,671 | 91,889 | 58,527 | 95,387 | ||||||||||||||||||||||||||||||
| Airbus A320 | 643,945 | 829,185 | 626,317 | 782,609 | Airbus A320 | 462,950 | 709,788 | 524,682 | 749,192 | |||||||||||||||||||||||||||||||||
| Airbus A321 | 43,071 | 49,208 | — | — | Airbus A321 | 32,853 | 44,227 | 36,334 | 45,380 | |||||||||||||||||||||||||||||||||
BNP Paribas | Aircraft and engines | Airbus A318 | — | — | 121,172 | 150,026 | Aircraft and engines | Airbus A319 | 134,346 | 228,384 | 154,828 | 229,798 | ||||||||||||||||||||||||||||||
| Airbus A319 | 209,993 | 281,846 | 360,100 | 501,836 | ||||||||||||||||||||||||||||||||||||||
| Airbus A320 | 199,114 | 257,857 | 261,139 | 333,105 | Airbus A320 | 128,173 | 181,838 | 145,506 | 192,957 | |||||||||||||||||||||||||||||||||
Credit Agricole | Aircraft and engines | Airbus A319 | 32,251 | 99,241 | 44,002 | 107,625 | Aircraft and engines | Airbus A319 | 26,014 | 37,389 | 37,755 | 84,129 | ||||||||||||||||||||||||||||||
| Airbus A320 | 96,774 | 153,531 | 68,096 | 156,355 | Airbus A320 | 71,794 | 144,157 | 115,339 | 214,726 | |||||||||||||||||||||||||||||||||
| Airbus A340 | — | — | 19,531 | 105,349 | Airbus A321 | 40,609 | 93,110 | 50,591 | 97,257 | |||||||||||||||||||||||||||||||||
JP Morgan | Aircraft and engines | Boeing 777 | 259,272 | 292,486 | 280,698 | 324,159 | Aircraft and engines | Boeing 777 | — | — | 215,265 | 263,366 | ||||||||||||||||||||||||||||||
Wells Fargo | Aircraft and engines | Airbus A320 | 331,854 | 384,273 | — | — | Aircraft and engines | Airbus A320 | 252,428 | 333,419 | 279,478 | 348,271 | ||||||||||||||||||||||||||||||
Bank of Utah | Aircraft and engines | Airbus A320 | 277,622 | 347,765 | — | — | Aircraft and engines | Airbus A320/A350 | 670,826 | 709,280 | 240,094 | 312,573 | ||||||||||||||||||||||||||||||
DVB Bank SE | Aircraft and engines | Boeing 767 | 95,292 | 151,824 | — | — | ||||||||||||||||||||||||||||||||||||
Natixis | Aircraft and engines | Airbus A320 | 45,748 | 66,738 | 56,223 | 81,355 | ||||||||||||||||||||||||||||||||||||
Airbus A321 | 377,104 | 514,625 | 413,201 | 542,594 | ||||||||||||||||||||||||||||||||||||||
Citibank N.A. | Aircraft and engines | Airbus A320 | 111,243 | 166,370 | 127,135 | 172,918 | ||||||||||||||||||||||||||||||||||||
Airbus A321 | 42,867 | 70,166 | 49,464 | 73,122 | ||||||||||||||||||||||||||||||||||||||
HSBC | Aircraft and engines | Airbus A320 | — | — | 53,583 | 64,241 | ||||||||||||||||||||||||||||||||||||
KfW IP EX-Bank | Aircraft and engines | Airbus A319 | 7,494 | 6,360 | — | — | ||||||||||||||||||||||||||||||||||||
Airbus A320 | 28,696 | 36,066 | 13,593 | 16,838 | ||||||||||||||||||||||||||||||||||||||
Airbus Financial Services | Aircraft and engines | Airbus A319 | 30,199 | 33,823 | — | — | ||||||||||||||||||||||||||||||||||||
PK AirFinance US, Inc. | Aircraft and engines | Airbus A320 | 54,786 | 46,341 | 62,514 | 48,691 | ||||||||||||||||||||||||||||||||||||
Banco BBVA | Land and buildings | 50,381 | 69,498 | — | — | |||||||||||||||||||||||||||||||||||||
|
|
|
|
|
|
|
| |||||||||||||||||||||||||||||||||||
Total direct guarantee | 4,478,836 | 5,660,388 | 4,017,678 | 5,149,667 | 4,766,160 | 6,370,256 | 4,628,146 | 6,166,570 | ||||||||||||||||||||||||||||||||||
|
|
|
|
|
|
|
| |||||||||||||||||||||||||||||||||||
The amounts of existing debt are presented at nominal value. Book value corresponds to the carrying value of the goods provided as guarantees.
Additionally, there are indirect guarantees related to assets recorded in Property, plant and equipment whose total debt at December 31, 20132016 amounted to ThUS$ 2,167,470913,494 (ThUS$ 2,888,7531,311,088 at December 31, 2012)2015). The book value of assets with indirect guarantees as of December 31, 20132016 amounts to ThUS$ 2,767,5931,740,815 (ThUS$ 3,777,7152,001,605 as of December 31, 2012)2015).
(ii) Commitments and others
| (ii) | Commitments and others |
Fully depreciated assets and commitments for future purchases are as follows:
| As of | As of | |||||||||||||||
| December 31, | December 31, | |||||||||||||||
| As of December 31, 2013 | As of December 31, 2012 | 2016 | 2015 | |||||||||||||
| ThUS$ | ThUS$ | ThUS$ | ThUS$ | |||||||||||||
Gross book value of fully depreciated property, plant and equipment still in use | 160,116 | 188,214 | 116,386 | 129,766 | ||||||||||||
Commitments for the acquisition of aircraft (*) | 23,900,000 | 24,500,000 | 15,100,000 | 19,800,000 | ||||||||||||
(*) Acording to the manufacturer’s price list.
Purchase commitment of aircraft
| Year of delivery | ||||||||||||||||||||||||||||
| Manufacturer | 2017 | 2018 | 2019 | 2020 | 2021 | 2022 | Total | |||||||||||||||||||||
Airbus S.A.S. | 5 | 16 | 14 | 16 | 21 | 2 | 74 | |||||||||||||||||||||
|
|
|
|
|
|
|
|
|
|
|
|
|
| |||||||||||||||
A320-NEO | 5 | 5 | 8 | 8 | 8 | — | 34 | |||||||||||||||||||||
A321 | — | 1 | — | — | — | — | 1 | |||||||||||||||||||||
A321-NEO | — | 6 | 2 | 6 | 5 | — | 19 | |||||||||||||||||||||
A350-1000 | — | — | 2 | 2 | 8 | 2 | 14 | |||||||||||||||||||||
A350-900 | 4 | 2 | — | — | — | 6 | ||||||||||||||||||||||
|
|
|
|
|
|
|
|
|
|
|
|
|
| |||||||||||||||
The Boeing Company | 1 | — | 6 | 2 | 2 | — | 11 | |||||||||||||||||||||
|
|
|
|
|
|
|
|
|
|
|
|
|
| |||||||||||||||
Boeing 777 | — | — | 2 | — | — | — | 2 | |||||||||||||||||||||
Boeing 787-9 | 1 | — | 4 | 2 | 2 | — | 9 | |||||||||||||||||||||
|
|
|
|
|
|
|
|
|
|
|
|
|
| |||||||||||||||
Total | 6 | 16 | 20 | 18 | 23 | 2 | 85 | |||||||||||||||||||||
|
|
|
|
|
|
|
|
|
|
|
|
|
| |||||||||||||||
In April 2015 the change of eight Boeing 787-8 aircraft for eight Boeing 787-8 aircraft was signed.
In September 2015 the change of six Airbus A350-900 aircraft for six Airbus A350-1000 aircraft was signed. Additionally, in November 2015 the change of six Airbus A350-900 aircraft to six Airbus A350-1000 aircraft was signed. In April 2016 the change of four Airbus A320 NEO aircraft to four Airbus A321 NEO aircraft was signed. In August 2016 a cancellation of 12 Airbus A320 NEO aircraft and the change of two Airbus A350-900 to two Airbus A350-1000 were signed.
As of December 2009,31, 2016, as a result of the Companydifferent aircraft purchase agreements signed a purchase commitment with Airbus S.A.S. for the purchase of 30, 54 aircraft of theAirbus A320 family with deliveries between 2011 and 2016. Later, in December 2010 the Company signed a new commitment to this manufacturer for the acquisition of 50 aircraft of the same family with deliveries between 2012 and 2016. Additionally, in June 2011, a contract was signed for 20 additional aircraft of the A320 NEO family, with deliveries between 2017 and 2018.
With regards to the above, as of December 31, 2013,2021, and as a result of different aircraft purchase contracts signed with Airbus S.A.S., there remain 6420 Airbus aircraft of the A320A350 family with deliveries between 2017 and 2022 remain to be delivered between 2014 and 2018. received.
The approximate amount is ThUS$ 5,600,000,12,400,000, according to the manufacturer’s price list. Additionally, the Company has valid purchase options for 4 Airbus A350 aircraft.
On October 2007, we signed a binding purchase agreement with TheIn May 2016 the change of four Boeing Company787-8 aircraft for the purchase of 26four Boeing 787787-9 aircraft with deliveries starting in 2012. Moreover, purchase contracts were signed with the same manufacturer in February, May and December 2011, 3, 5 and 2 aircraft 767-300, respectively.was signed.
As of December 31, 2013,2016, and as a result of different aircraft purchase contracts signed with The Boeing Company, remain to receive a total of 21nine Boeing 787 Dreamliner aircraft, with delivery dates between 20142017 and 2018. 2021, and two Boeing 777 with delivery expected for 2019 remain to be received.
The approximate amount, according to the manufacturer’s price list, is ThUS$ 4,300,000. Additionally, the Company has valid purchase options for 15 787 Dreamliner aircraft.
The acquisition of these aircraft is part of the strategic plan for the long-term fleet. This plan also involves the sale of 15 Airbus A318 model between 2011 and 2013.During 2011 the first 5 aircraft were sold, during 2012 another 3 were sold and during 2013 the last 7 aircraft were sold.
Additionally, as a result of the business combination with TAM S.A. and Subsidiaries the following commitments are incorporated:
In November 2006, a purchase commitment was signed with Airbus S.A.S. for the acquisition of 31 A320 family aircraft and 6 A330-200 aircraft, with deliveries between 2007 and 2010. Subsequently, in January 2008 signed a new commitment for the acquisition of 20 additional A320 family aircraft and 4 aircraft A330-200, with deliveries between 2010 and 2014, also signed a purchase commitment for 22 A350 aircraft. In July 2010, signed a purchase commitment for the acquisition of 20 A320 family aircraft with deliveries between 2014 and 2015 and on the same date the option was exercised to purchase 5 A350. In October 2011, a new commitment was signed to this manufacturer for the acquisition of 10 additional aircraft of the A320 family with deliveries between 2016 and 2017, plus 22 family aircraft A320 NEO with deliveries between 2016 and 2018.
With the above, at December 31, 2013, as a result of the different aircraft purchase agreements signed with Airbus S.A.S., remain to receive 58 aircraft Airbus A320 family, with deliveries between 2014 and 2018, and 27 Airbus aircraft A350 family with delivery dates starting from 2015. Additionally, the Company has valid purchase options for 5 Airbus A350.
In December 2008, a new commitment purchase agreement was signed with The Boeing Company for 2 777 aircraft with deliveries in 2013, and in February 2011 an agreement was signed for the purchase of another 2 777 aircraft with deliveries in 2014.
With the above, at December 31, 2013, due to the various purchase contracts signed with The Boeing Company, remain to receive 2 777 aircraft, whose delivery was scheduled for 2014, which has been rescheduled for 2017. Additionally, the Company has valid purchase options for other 2 777 aircraft.
The approximate amount of individual purchase contracts incorporated for the effect of the business combination with TAM S.A. and Subsidiaries is ThUS$ 14,000,000, according to the manufacturers price list.
(iii) Capitalized interest costs with respect to Property, plant and equipment.2,700,000.
For the periods ended December 31, | ||||||||||||||
| 2013 | 2012 | 2011 | ||||||||||||
Average rate of capitalization of capitalized interest costs | % | 3.63 | 2.60 | 3.51 | ||||||||||
Costs of capitalized interest | ThUS$ | 25,625 | 45,069 | 33,342 | ||||||||||
| (iii) | Capitalized interest costs with respect to Property, plant and equipment. |
| For the periods ended | ||||||||||||||
| December 31, | ||||||||||||||
| 2016 | 2015 | 2014 | ||||||||||||
Average rate of capitalization of capitalized interest costs | % | 3.54 | 2.79 | 2.84 | ||||||||||
Costs of capitalized interest | ThUS$ | (696 | ) | 22,551 | 18,426 | |||||||||
(iv) Financial leases
| (iv) | Financial leases |
The detail of the main financial leases is as follows:
| As of | As of | |||||||||||||||||||||||||||
| December 31, | December 31, | |||||||||||||||||||||||||||
Lessor | Aircraft | Model | As of December 31, 2013 | As of December 31, 2012 | Aircraft | Model | 2016 | 2015 | ||||||||||||||||||||
Agonandra Statutory Trust | Airbus A319 | 100 | 4 | 4 | Airbus A320 | 200 | — | 2 | ||||||||||||||||||||
Agonandra Statutory Trust | Airbus A320 | 200 | 2 | 2 | ||||||||||||||||||||||||
Air Canada | Airbus A340 | 500 | 2 | 2 | ||||||||||||||||||||||||
AWMS I (AWAS) | Boeing 767 | 300 | 3 | 3 | ||||||||||||||||||||||||
Bluebird Leasing LLC | Boeing 767 | 300F | — | 2 | ||||||||||||||||||||||||
Becacina Leasing LLC | Boeing 767 | 300ER | 1 | 1 | ||||||||||||||||||||||||
Caiquen Leasing LLC | Boeing 767 | 300F | 1 | 1 | Boeing 767 | 300F | 1 | 1 | ||||||||||||||||||||
Cernicalo Leasing LLC | Boeing 767 | 300F | 2 | 2 | Boeing 767 | 300F | 2 | 2 | ||||||||||||||||||||
Chirihue Leasing Trust | Boeing 767 | 300F | 2 | — | ||||||||||||||||||||||||
Chirihue Leasing T rust | Boeing 767 | 300F | — | 2 | ||||||||||||||||||||||||
Cisne Leasing LLC | Boeing 767 | 300ER | 2 | 2 | ||||||||||||||||||||||||
Codorniz Leasing Limited | Airbus A319 | 100 | 2 | 2 | Airbus A319 | 100 | 2 | 2 | ||||||||||||||||||||
Conure Leasing Limited | Airbus A320 | 200 | 2 | — | Airbus A320 | 200 | 2 | 2 | ||||||||||||||||||||
Eagle Leasing LLC | Boeing 767 | 300ER | — | 1 | ||||||||||||||||||||||||
Flamenco Leasing LLC | Boeing 767 | 300ER | 1 | 1 | ||||||||||||||||||||||||
FLYAFI 1 S.R.L. | Boeing 777 | 300ER | 1 | 1 | Boeing 777 | 300ER | 1 | 1 | ||||||||||||||||||||
FLYAFI 2 S.R.L. | Boeing 777 | 300ER | 1 | 1 | Boeing 777 | 300ER | 1 | 1 | ||||||||||||||||||||
FLYAFI 3 S.R.L. | Boeing 777 | 300ER | 1 | 1 | Boeing 777 | 300ER | 1 | 1 | ||||||||||||||||||||
Forderum Holding B.V. (GECAS) | Airbus A320 | 200 | 2 | 2 | Airbus A320 | 200 | — | 2 | ||||||||||||||||||||
Garza Leasing LLC | Boeing 767 | 300ER | 1 | 1 | Boeing 767 | 300ER | 1 | 1 | ||||||||||||||||||||
General Electric Capital Corporation | Airbus A330 | 200 | 3 | 6 | Airbus A330 | 200 | 3 | 3 | ||||||||||||||||||||
Intraelo BETA Corporation (KFW) | Airbus A320 | 200 | 1 | 1 | ||||||||||||||||||||||||
Intraelo BET A Corpotation (KFW) | Airbus A320 | 200 | 1 | 1 | ||||||||||||||||||||||||
Juliana Leasing Limited | Airbus A320 | 200 | 2 | 2 | Airbus A320 | 200 | — | 2 | ||||||||||||||||||||
Linnet Leasing Limited | Airbus A320 | 200 | 4 | 4 | ||||||||||||||||||||||||
Loica Leasing Limited | Airbus A319 | 100 | 2 | 2 | ||||||||||||||||||||||||
Loica Leasing Limited | Airbus A320 | 200 | 2 | 2 | ||||||||||||||||||||||||
Mirlo Leasing LLC | Boeing 767 | 300ER | 1 | — | Boeing 767 | 300ER | 1 | 1 | ||||||||||||||||||||
NBB Rio de Janeiro Lease CO and Brasilia Lease LLC (BBAM) | Airbus A320 | 200 | 1 | 1 | Airbus A320 | 200 | 1 | 1 | ||||||||||||||||||||
NBB São Paulo Lease CO. Limited (BBAM) | Airbus A321 | 200 | 1 | 1 | Airbus A321 | 200 | 1 | 1 | ||||||||||||||||||||
Osprey Leasing Limited | Airbus A319 | 100 | 8 | — | Airbus A319 | 100 | 8 | 8 | ||||||||||||||||||||
Petrel Leasing LLC | Boeing 767 | 300ER | 1 | 1 | Boeing 767 | 300ER | 1 | 1 | ||||||||||||||||||||
Pilpilen Leasing Limited | Airbus A320 | 200 | 4 | 4 | ||||||||||||||||||||||||
Pochard Leasing LLC | Boeing 767 | 300ER | 2 | 2 | Boeing 767 | 300ER | 2 | 2 | ||||||||||||||||||||
Quetro Leasing LLC | Boeing 767 | 300ER | 3 | 3 | Boeing 767 | 300ER | 3 | 3 | ||||||||||||||||||||
SG Infraestructure Italia S.R.L. | Boeing 777 | 300ER | 1 | 1 | Boeing 777 | 300ER | 1 | 1 | ||||||||||||||||||||
SL Alcyone LTD (Showa) | Airbus A320 | 200 | 1 | 1 | ||||||||||||||||||||||||
TMF Interlease Aviation B.V. | Airbus A320 | 200 | 12 | 12 | ||||||||||||||||||||||||
SL Alcyone LT D (Showa) | Airbus A320 | 200 | 1 | 1 | ||||||||||||||||||||||||
TMF Interlease Aviation B.V. | Airbus A330 | 200 | 1 | 1 | Airbus A330 | 200 | — | 1 | ||||||||||||||||||||
TMF Interlease Aviation II B.V. | Airbus A319 | 100 | 5 | 5 | Airbus A319 | 100 | — | 5 | ||||||||||||||||||||
TMF Interlease Aviation II B.V. | Airbus A320 | 200 | 2 | 2 | Airbus A320 | 200 | — | 2 | ||||||||||||||||||||
TMF Interlease Aviation III B.V. | Airbus A319 | 100 | 3 | 3 | ||||||||||||||||||||||||
TMF Interlease Aviation III B.V. | Airbus A320 | 200 | 12 | 12 | ||||||||||||||||||||||||
TMF Interlease Aviation III B.V. | Airbus A321 | 200 | 7 | 7 | ||||||||||||||||||||||||
TMF Interlease Aviation III B.V. | Airbus A330 | 200 | — | 10 | ||||||||||||||||||||||||
Tricahue Leasing LLC | Boeing 767 | 300ER | 3 | 3 | ||||||||||||||||||||||||
Wacapou Leasing S.A | Airbus A320 | 200 | 1 | 1 | Airbus A320 | 200 | 1 | 1 | ||||||||||||||||||||
Wells Fargo Bank North National Association (ILFC) | Airbus A330 | 200 | 1 | 1 | ||||||||||||||||||||||||
|
|
|
| |||||||||||||||||||||||||
Total | 99 | 102 | 50 | 66 | ||||||||||||||||||||||||
|
|
|
| |||||||||||||||||||||||||
Financial leasing contracts where the Company acts as the lessee of aircrafts establish duration between 12 and 18 year terms and semi-annual, quarterly and monthly payments of obligations.
Additionally, the lessee will have the obligation to contract and maintain active the insurance coverage for the aircraft,aircrafts, perform maintenance on the aircraftaircrafts and update the airworthiness certificates at their own cost.
Fixed assets acquired under financial leases are classified as Other property, plant and equipment. As of December 31, 20132016 the Company had ninety and nine aircraft (one hundred and twofifty aircrafts (sixty six aircraft as of December 31, 2012)2015).
DuringAs of December 31, 2016, as a result of the first quartertransfer plan fleet of 2013, dueTAM Linhas Aéreas S.A. to the sale of its participation in the permanent establishments Mirlo Leasing LLC, Osprey Leasing Limited, and subsidiary Conure Leasing Limited,LATAM Airlines Group S.A., the Company increaseddeclined its number of aircraft on lease by one Boeing 767-300, twoleasing in five Airbus A319-100, eight Airbus A320-200 and eightone Airbus A319-100. Therefore, these aircraft were reclassified from the Plant and equipment category to the category Other property plant and equipment.
Additionally, during the second quarter of 2013 the contracts system applied to ten A330-200 aircraft was changed from financial leasing to operative leasing. As a result, the mentioned aircraft are no longer included under Property, plant, and equipment.
During to the third quarter of 2013, the option was exercised to purchase 3 A330-200. Therefore, these aircraft were reclassified from the Other property plant and equipment category to the category Plant and equipment.
During to the fourth quarter of 2013, the option was exercised to purchase one B767-300 aircraft belonging Eagle Leasing LLC, was reclassified from the Other property plant and equipment category to the category Plant and equipment.
As a result of the business combination 81 aircraft capital leases were added as financial leasing, and during the third quarter of 2012 two more Airbus A320-200 were added in this way.aircraft.
The book value of assets under financial leases as of December 31, 20132016 amounts to ThUS$ 2,835,8401,753,366 (ThUS$ 3,863,193 as of2,030,723 at December 31, 2012)2015).
The minimum payments under financial leases are as follows:
As of December 31, 2013
| Gross Value | Interest | Present Value | ||||||||||
| ThUS$ | ThUS$ | ThUS$ | ||||||||||
No later than one year | 462,157 | (53,925 | ) | 408,232 | ||||||||
Between one and five years | 1,406,384 | (118,702 | ) | 1,287,682 | ||||||||
Over five years | 633,120 | (19,562 | ) | 613,558 | ||||||||
|
|
|
|
|
| |||||||
Total | 2,501,661 | (192,189 | ) | 2,309,472 | ||||||||
|
|
|
|
|
| |||||||
As of December 31, 2012
| Gross Value | Interest | Present Value | ||||||||||
| ThUS$ | ThUS$ | ThUS$ | ||||||||||
No later than one year | 523,033 | (66,090 | ) | 456,943 | ||||||||
Between one and five years | 1,687,596 | (186,145 | ) | 1,501,451 | ||||||||
Over five years | 1,135,262 | (57,455 | ) | 1,077,807 | ||||||||
|
|
|
|
|
| |||||||
Total | 3,345,891 | (309,690 | ) | 3,036,201 | ||||||||
|
|
|
|
|
| |||||||
As of December 31, 2011
| Gross Value | Interest | Present Value | ||||||||||
| ThUS$ | ThUS$ | ThUS$ | ||||||||||
No later than one year | 78,369 | (7,622 | ) | 70,747 | ||||||||
Between one and five years | 207,365 | (18,657 | ) | 188,708 | ||||||||
Over five years | 59,152 | (2,078 | ) | 57,074 | ||||||||
|
|
|
|
|
| |||||||
Total | 344,886 | (28,357 | ) | 316,529 | ||||||||
|
|
|
|
|
| |||||||
No later than one year Between one and five years Over five years Total As of December 31, 2016 As of December 31, 2015 As of December 31, 2014 Gross Present Gross Present Gross Present Value Interest Value Value Interest Value Value Interest Value ThUS$ ThUS$ ThUS$ ThUS$ ThUS$ ThUS$ ThUS$ ThUS$ ThUS$ 285,168 (32,365 ) 252,803 360,862 (47,492 ) 313,370 403,840 (48,197 ) 355,643 704,822 (43,146 ) 661,676 1,003,237 (75,363 ) 927,874 1,121,190 (97,909 ) 1,023,281 43,713 (120 ) 43,593 95,050 (1,406 ) 93,644 261,877 (6,409 ) 255,468 1,033,703 (75,631 ) 958,072 1,459,149 (124,261 ) 1,334,888 1,786,907 (152,515 ) 1,634,392
NOTE 2018 - TAXESCURRENT AND DEFERRED TAXES
DeferredIn the period ended December 31, 2016, the income tax provision was calculated for such period, applying the rate of 24% for the business year 2016, in accordance with the Law No. 20,780 published in the Official Journal of the Republic of Chile on September 29, 2014.
Among the main changes is the progressive increase of the First Tax Category reaching 27% in 2018 if the “Partially Integrated Taxation System” is chosen. Alternatively, if the Company chooses the “Attributed Income Taxation System” the top rate would reach 25% in 2017.
According with the Law reference above, since LATAM Airlines Group S.A. is a public company, by default should apply the “Partially Integrated Taxation System”(*), unless in a Company´s Extraordinary Meeting of Shareholders agrees, by a minimum of 2/3 of the votes, to use the “Attributed Income Taxation System”(*). The deadline for making that decision was the last quarter of 2016.
On February 8, 2016, an amendment to the above mentioned Law was issued (Law 20,899), which simplify the system for paying taxes, between the mainly changes, it is now mandatorily, for public companies, such as Latam Airlines Group S.A. choosing the “Partially Integrated Taxation System”(*), without any option to elect the “Attributed Income Taxation System”, as describe above.
The effects of the updating of deferred tax assets and liabilities according to rates changes introduced by Law No. 20,780 depending on their period back were recorded on income for the business year 2014. The total effect on income was ThUS $ 150,210, which is explained by an increase in deferred tax assets of ThUS$ 87 and an increase in deferred tax liabilities of ThUS$ 145,253 and an increase in equity by deferred tax of ThUS$ 5,044. The net effect on the assets and liabilities by deferred tax was an increase on liabilities for ThUS$ 145,166.
Assets and deferred tax liabilities are offset if there is a legal right to offset the assets and liabilities, for income taxes relatingalways correspond to the same entity and tax authority.
(*)The balancesPartially Integrated Taxation System” final income taxation is applied upon effective dividend disbursements or profit withdrawals, and under the “Attributed Income Taxation System” by using the accrual of deferredprofits.
| (a) | Current taxes |
| (a.1) | The composition of the current tax assets is the following: |
| Current assets | Non-current assets | Total assets | ||||||||||||||||||||||
| As of | As of | As of | As of | As of | As of | |||||||||||||||||||
| December 31, | December 31, | December 31, | December 31, | December 31, | December 31, | |||||||||||||||||||
| 2016 | 2015 | 2016 | 2015 | 2016 | 2015 | |||||||||||||||||||
| ThUS$ | ThUS$ | ThUS$ | ThUS$ | ThUS$ | ThUS$ | |||||||||||||||||||
Provisional monthly payments (advances) | 43,821 | 43,935 | — | — | 43,821 | 43,935 | ||||||||||||||||||
Other recoverable credits | 21,556 | 20,080 | 20,272 | 25,629 | 41,828 | 45,709 | ||||||||||||||||||
|
|
|
|
|
|
|
|
|
|
|
| |||||||||||||
Total assets by current tax | 65,377 | 64,015 | 20,272 | 25,629 | 85,649 | 89,644 | ||||||||||||||||||
|
|
|
|
|
|
|
|
|
|
|
| |||||||||||||
(a.2) The composition of the current tax liabilities are as follows:
| Assets | Liabilities | |||||||||||||||
| Concept | As of December 31, 2013 | As of December 31, 2012 | As of December 31, 2013 | As of December 31, 2012 | ||||||||||||
| ThUS$ | ThUS$ | ThUS$ | ThUS$ | |||||||||||||
Depreciation | (17,152 | ) | (662 | ) | 557,845 | 454,183 | ||||||||||
Leased assets | (147,074 | ) | — | 46,688 | 268,619 | |||||||||||
Amortization | (10,778 | ) | 15,148 | 113,579 | 91,911 | |||||||||||
Provisions | 317,883 | 34,704 | (207,358 | ) | (520,719 | ) | ||||||||||
Revaluation of financial instruments | 562 | 5,178 | (15,508 | ) | (31,741 | ) | ||||||||||
Tax losses | 267,189 | 105,652 | (284,339 | ) | (314,926 | ) | ||||||||||
Revaluation property, plant and equipment | — | — | (18,544 | ) | (22,892 | ) | ||||||||||
Intangibles | — | — | 593,325 | 680,167 | ||||||||||||
Others | (7,668 | ) | 3,047 | (18,460 | ) | (25,263 | ) | |||||||||
|
|
|
|
|
|
|
| |||||||||
Total | 402,962 | 163,067 | 767,228 | 579,339 | ||||||||||||
|
|
|
|
|
|
|
| |||||||||
| Current liabilities | Non-current liabilities | Total liabilities | ||||||||||||||||||||||
| As of | As of | As of | As of | As of | As of | |||||||||||||||||||
| December 31, | December 31, | December 31, | December 31, | December 31, | December 31, | |||||||||||||||||||
| 2016 | 2015 | 2016 | 2015 | 2016 | 2015 | |||||||||||||||||||
| ThUS$ | ThUS$ | ThUS$ | ThUS$ | ThUS$ | ThUS$ | |||||||||||||||||||
Income tax provision | 9,632 | 19,001 | — | — | 9,632 | 19,001 | ||||||||||||||||||
Additional tax provision | 4,654 | 377 | — | — | 4,654 | 377 | ||||||||||||||||||
|
|
|
|
|
|
|
|
|
|
|
| |||||||||||||
Total liabilities by current tax | 14,286 | 19,378 | — | — | 14,286 | 19,378 | ||||||||||||||||||
|
|
|
|
|
|
|
|
|
|
|
| |||||||||||||
| (b) | Deferred taxes |
The balances of deferred tax are the following:
| Assets | Liabilities | |||||||||||||||
| Concept | As of December 31, 2016 | As of December 31, 2015 | As of December 31, 2016 | As of December 31, 2015 | ||||||||||||
| ThUS$ | ThUS$ | ThUS$ | ThUS$ | |||||||||||||
Depreciation | 11,735 | (14,243 | ) | 1,387,760 | 1,116,748 | |||||||||||
Leased assets | (35,922 | ) | (25,299 | ) | 203,836 | 226,003 | ||||||||||
Amortization | (15,820 | ) | (5,748 | ) | 61,660 | 65,416 | ||||||||||
Provisions | 222,253 | 210,992 | (59,096 | ) | (167,545 | ) | ||||||||||
Revaluation of financial instruments | — | 709 | (3,223 | ) | (7,575 | ) | ||||||||||
Tax losses | 202,536 | 212,067 | (1,126,200 | ) | (797,715 | ) | ||||||||||
Intangibles | — | — | 430,705 | 364,314 | ||||||||||||
Others | (202 | ) | (1,883 | ) | 20,317 | 11,919 | ||||||||||
|
|
|
|
|
|
|
| |||||||||
Total | 384,580 | 376,595 | 915,759 | 811,565 | ||||||||||||
|
|
|
|
|
|
|
| |||||||||
The balance of deferred tax assets and liabilities are composed principallyprimarily of temporary differences to reversebe reversed in the long term.
Movements of Deferred tax assets and liabilities from January 1, 2011 to December 31, 2013 are as follows:
(a) From January 1 to December 31, 20112014
| Beginning balance asset (liability) | Recognized in consolidated income | Recognized in other comprehensive income | Incorporation by business combinations | Reclassifications | Others | Sale of investment | Ending balance asset (liability) | Opening balance Assets/(liabilities) | Recognized in consolidated income | Recognized in comprehensive income | Exchange rate variation | Effect from change in tax rate | Others | Ending balance Asset (liability) | ||||||||||||||||||||||||||||||||||||||||||||||
| ThUS$ | ThUS$ | ThUS$ | ThUS$ | ThUS$ | ThUS$ | ThUS$ | ThUS$ | ThUS$ | ThUS$ | ThUS$ | ThUS$ | ThUS$ | ThUS$ | ThUS$ | ||||||||||||||||||||||||||||||||||||||||||||||
Depreciation | (290,669 | ) | (48,614 | ) | — | — | — | — | (5 | ) | (339,288 | ) | (574.997 | ) | (74.623 | ) | — | 3.575 | (225.595 | ) | — | (871.640 | ) | |||||||||||||||||||||||||||||||||||||
Leased assets | (59,848 | ) | (5,392 | ) | (65,240 | ) | (193.762 | ) | 47.749 | — | 3.267 | (43.029 | ) | — | (185.775 | ) | ||||||||||||||||||||||||||||||||||||||||||||
Amortization | (17,320 | ) | (8,903 | ) | — | 3,811 | — | — | — | (22,412 | ) | (124.357 | ) | (21.621 | ) | — | 1.928 | (16.050 | ) | — | (160.100 | ) | ||||||||||||||||||||||||||||||||||||||
Provisions | (14,889 | ) | (22,482 | ) | — | — | — | — | (388 | ) | (37,759 | ) | 525.241 | (99.262 | ) | — | (53.090 | ) | (21.812 | ) | — | 351.077 | ||||||||||||||||||||||||||||||||||||||
Post-employment benefit obligations | 1,604 | (1,604 | ) | — | — | — | — | — | — | |||||||||||||||||||||||||||||||||||||||||||||||||||
Revaluation of financial instruments | 21,926 | — | 6,862 | — | — | — | — | 28,788 | 16.070 | (53.675 | ) | 47.979 | (1.331 | ) | 3.763 | — | 12.806 | |||||||||||||||||||||||||||||||||||||||||||
Tax losses | 13,229 | 112,013 | — | — | (6,645 | ) | — | — | 118,597 | |||||||||||||||||||||||||||||||||||||||||||||||||||
Tax losses (*) | 551.528 | 147.798 | — | (13.968 | ) | 163.596 | (126.205 | ) | 722.749 | |||||||||||||||||||||||||||||||||||||||||||||||||||
Intangibles | (593.325 | ) | — | — | 70.050 | — | — | (523.275 | ) | |||||||||||||||||||||||||||||||||||||||||||||||||||
Others | 72,039 | (63,460 | ) | 1,846 | — | — | (2,521 | ) | (67 | ) | 7,837 | 29.336 | 7.071 | — | (32.361 | ) | (6.039 | ) | 11.580 | 9.587 | ||||||||||||||||||||||||||||||||||||||||
|
|
|
|
|
|
|
|
|
|
|
|
|
|
| ||||||||||||||||||||||||||||||||||||||||||||||
Total | (273,928 | ) | (38,442 | ) | 8,708 | 3,811 | (6,645 | ) | (2,521 | ) | (460 | ) | (309,477 | ) | (364.266 | ) | (46.563 | ) | 47.979 | (21.930 | ) | (145.166 | ) | (114.625 | ) | (644.571 | ) | |||||||||||||||||||||||||||||||||
|
|
|
|
|
|
|
|
|
|
|
|
|
|
| ||||||||||||||||||||||||||||||||||||||||||||||
(b) From January 1 to December 31, 2012
| (b) | From January 1 to December 31, 2015 |
| Opening balance Assets/(liabilities) | Recognized in consolidated income | Recognized in comprehensive income | Incorporation by business combination | Exchange rate variation | Effect from change in tax rate | Others | Ending balance Asset (liability) | Opening balance Assets/(liabilities) | Recognized in consolidated income | Recognized in comprehensive income | Exchange rate variation | Others | Ending balance Asset (liability) | |||||||||||||||||||||||||||||||||||||||||||
| ThUS$ | ThUS$ | ThUS$ | ThUS$ | ThUS$ | ThUS$ | ThUS$ | ThUS$ | ThUS$ | ThUS$ | ThUS$ | ThUS$ | ThUS$ | ThUS$ | |||||||||||||||||||||||||||||||||||||||||||
Depreciation | (339,288 | ) | (21,066 | ) | — | (34,512 | ) | (203 | ) | (59,776 | ) | — | (454,845 | ) | (871,640 | ) | (267,891 | ) | — | 8,540 | — | (1,130,991 | ) | |||||||||||||||||||||||||||||||||
Leased assets | (65,240 | ) | (160,147 | ) | — | (31,533 | ) | (186 | ) | (11,513 | ) | — | (268,619 | ) | (185,775 | ) | (73,330 | ) | — | 7,803 | — | (251,302 | ) | |||||||||||||||||||||||||||||||||
Amortization | (22,412 | ) | (29,157 | ) | — | (18,614 | ) | (109 | ) | (6,471 | ) | — | (76,763 | ) | (160,100 | ) | 84,330 | — | 4,606 | — | (71,164 | ) | ||||||||||||||||||||||||||||||||||
Provisions | (37,759 | ) | 86,040 | — | 512,487 | 3,008 | (8,353 | ) | — | 555,423 | 351,077 | 150,362 | 3,911 | (126,813 | ) | — | 378,537 | |||||||||||||||||||||||||||||||||||||||
Revaluation of financial instruments | 28,788 | (7,249 | ) | (2,623 | ) | 12,785 | 138 | 5,080 | — | 36,919 | 12,806 | 19,760 | (21,103 | ) | (3,179 | ) | — | 8,284 | ||||||||||||||||||||||||||||||||||||||
Tax losses | 118,597 | 152,022 | — | 134,833 | 792 | 14,334 | — | 420,578 | ||||||||||||||||||||||||||||||||||||||||||||||||
Revaluation property, plant and equipment | — | (36,931 | ) | — | 59,474 | 349 | — | — | 22,892 | |||||||||||||||||||||||||||||||||||||||||||||||
Tax losses (*) | 722,749 | 320,397 | — | (33,364 | ) | — | 1,009,782 | |||||||||||||||||||||||||||||||||||||||||||||||||
Intangibles | — | — | — | (676,197 | ) | (3,970 | ) | — | — | (680,167 | ) | (523,275 | ) | (8,362 | ) | — | 167,323 | — | (364,314 | ) | ||||||||||||||||||||||||||||||||||||
Others | 7,837 | 410 | (2,734 | ) | 34,577 | (165 | ) | 1,080 | (12,695 | ) | 28,310 | 9,587 | 45,638 | — | (62,182 | ) | (6,845 | ) | (13,802 | ) | ||||||||||||||||||||||||||||||||||||
|
|
|
|
|
|
|
|
|
|
|
|
|
| |||||||||||||||||||||||||||||||||||||||||||
Total | (309,477 | ) | (16,078 | ) | (5,357 | ) | (6,700 | ) | (346 | ) | (65,619 | ) | (12,695 | ) | (416,272 | ) | (644,571 | ) | 270,904 | (17,192 | ) | (37,266 | ) | (6,845 | ) | (434,970 | ) | |||||||||||||||||||||||||||||
|
|
|
|
|
|
|
|
|
|
|
|
|
| |||||||||||||||||||||||||||||||||||||||||||
| (c) | From January 1 to December 31, 2016 |
| (c) From January 1 to December 31, 2013 | ||||||||||||||||||||||||||||||||||||||||||||||||
| Beginning balance asset (liability) | Recognized in consolidated income | Recognized in comprehensive income | Exchange rate variation | Others | Ending balance asset (liability) | Opening balance Assets/(liabilities) | Recognized in consolidated income | Recognized in comprehensive income | Exchange rate variation | Others | Ending balance Asset (liability) | |||||||||||||||||||||||||||||||||||||
| ThUS$ | ThUS$ | ThUS$ | ThUS$ | ThUS$ | ThUS$ | ThUS$ | ThUS$ | ThUS$ | ThUS$ | ThUS$ | ThUS$ | |||||||||||||||||||||||||||||||||||||
Depreciation | (454,845 | ) | (124,584 | ) | — | 4,432 | — | (574,997 | ) | (1,130,991 | ) | (241,435 | ) | — | (3,599 | ) | — | (1,376,025 | ) | |||||||||||||||||||||||||||||
Leased assets | (268,619 | ) | 70,807 | — | 4,050 | — | (193,762 | ) | (251,302 | ) | 14,833 | — | (3,289 | ) | — | (239,758 | ) | |||||||||||||||||||||||||||||||
Amortization | (76,763 | ) | (49,985 | ) | — | 2,391 | — | (124,357 | ) | (71,164 | ) | (4,375 | ) | — | (1,941 | ) | — | (77,480 | ) | |||||||||||||||||||||||||||||
Provisions | 555,423 | 35,636 | — | (65,818 | ) | — | 525,241 | 378,537 | (149,969 | ) | 921 | 53,448 | (1,568 | ) | 281,369 | |||||||||||||||||||||||||||||||||
Revaluation of financial instruments | 36,919 | 146 | (19,345 | ) | (1,650 | ) | — | 16,070 | 8,284 | 28,294 | (34,695 | ) | 1,340 | — | 3,223 | |||||||||||||||||||||||||||||||||
Tax losses | 420,578 | 148,266 | — | (17,316 | ) | — | 551,528 | |||||||||||||||||||||||||||||||||||||||||
Revaluation property, plant and equipment | 22,892 | 3,290 | — | (7,638 | ) | — | 18,544 | |||||||||||||||||||||||||||||||||||||||||
Tax losses (*) | 1,009,782 | 304,892 | — | 14,062 | — | 1,328,736 | ||||||||||||||||||||||||||||||||||||||||||
Intangibles | (680,167 | ) | — | — | 86,842 | — | (593,325 | ) | (364,314 | ) | 4,131 | — | (70,522 | ) | — | (430,705 | ) | |||||||||||||||||||||||||||||||
Others | 28,310 | 9,543 | — | (28,070 | ) | 1,009 | 10,792 | (13,802 | ) | (30,185 | ) | — | 22,234 | 1,214 | (20,539 | ) | ||||||||||||||||||||||||||||||||
|
|
|
|
|
|
|
|
|
|
|
| |||||||||||||||||||||||||||||||||||||
Total | (416,272 | ) | 93,119 | (19,345 | ) | (22,777 | ) | 1,009 | (364,266 | ) | (434,970 | ) | (73,814 | ) | (33,774 | ) | 11,733 | (354 | ) | (531,179 | ) | |||||||||||||||||||||||||||
|
|
|
|
|
|
|
|
|
|
|
| |||||||||||||||||||||||||||||||||||||
Deferred tax assets not recognized:
| As of December 31, 2013 | As of December 31, 2012 | As of December 31, 2016 | As of December 31, 2015 | |||||||||||||
| ThUS$ | ThUS$ | ThUS$ | ThUS$ | |||||||||||||
Tax losses | 6,538 | 1,439 | 115,801 | 15,513 | ||||||||||||
|
|
|
| |||||||||||||
Total Deferred tax assets not recognized | 6,538 | 1,439 | 115,801 | 15,513 | ||||||||||||
|
|
|
| |||||||||||||
Deferred tax assets on tax loss, carry-forwards, are recognized to the extent that it is likely to provide relevantprobable the realization of future tax benefit through future taxable profits. TheBy the above at December 31, 2016, the Company has not recognized deferred tax assets of ThUS$ 6,538115,801 (ThUS$ 1,43915,513 at December 31, 2012) compared to2015) according with a loss of ThUS$ 28,855340,591 (ThUS$ 5,26545,628 at December 31, 2012) to offset against future years tax benefits.2015).
Expense (income) for deferredDeferred tax expense and current income taxes for the periods ended at December 31, 2013, December 31, 2012 and December 31, 2011, respectively, are as follows:taxes:
| For the periods ended | For the period ended December 31, | |||||||||||||||||||||||
| December 31, | 2016 | 2015 | 2014 | |||||||||||||||||||||
| 2013 | 2012 | 2011 | ThUS$ | ThUS$ | ThUS$ | |||||||||||||||||||
| ThUS$ | ThUS$ | ThUS$ | ||||||||||||||||||||||
Expense for current income tax | ||||||||||||||||||||||||
Current tax expense | ||||||||||||||||||||||||
Current tax expense | 73,611 | 34,563 | 19,470 | 87,307 | 92,916 | 97,782 | ||||||||||||||||||
Adjustment to previous period’s current tax | (561 | ) | (13,886 | ) | 3,877 | 2,083 | (395 | ) | (2,151 | ) | ||||||||||||||
Other current tax expense | — | 12 | — | |||||||||||||||||||||
|
|
|
|
|
| |||||||||||||||||||
Total current tax expense, net | 73,050 | 20,689 | 23,347 | 89,390 | 92,521 | 95,631 | ||||||||||||||||||
|
|
|
|
|
| |||||||||||||||||||
Expense for deferred income taxes | ||||||||||||||||||||||||
Deferred tax expense | ||||||||||||||||||||||||
Deferred expense for taxes related to the creation and reversal of temporary differences | (92,863 | ) | 80,293 | 40,051 | 73,814 | (270,904 | ) | 196,676 | ||||||||||||||||
Reduction (increase) in value of deferred tax assets during the evaluation of its usefulness | (256 | ) | 1,404 | (1,609 | ) | — | — | 97 | ||||||||||||||||
|
|
|
|
|
| |||||||||||||||||||
Total deferred tax expense, net | (93,119 | ) | 81,697 | 38,442 | 73,814 | (270,904 | ) | 196,773 | ||||||||||||||||
|
|
|
|
|
| |||||||||||||||||||
Income tax expense | (20,069 | ) | 102,386 | 61,789 | 163,204 | (178,383 | ) | 292,404 | ||||||||||||||||
|
|
|
|
|
| |||||||||||||||||||
Composition of income tax expense (income):
| For the periods ended | ||||||||||||||||||||||||
| December 31, | For the period ended December 31, | |||||||||||||||||||||||
| 2013 | 2012 | 2011 | 2016 | 2015 | 2014 | |||||||||||||||||||
| ThUS$ | ThUS$ | ThUS$ | ThUS$ | ThUS$ | ThUS$ | |||||||||||||||||||
Current tax expense, net, foreign | 61,118 | 30,827 | 4,486 | 80,600 | 89,460 | 92,272 | ||||||||||||||||||
Current tax expense, net, Chile | 11,932 | (10,138 | ) | 18,861 | 8,790 | 3,061 | 3,359 | |||||||||||||||||
|
|
|
|
|
| |||||||||||||||||||
Total current tax expense, net | 73,050 | 20,689 | 23,347 | 89,390 | 92,521 | 95,631 | ||||||||||||||||||
|
|
|
|
|
| |||||||||||||||||||
Deferred tax expense, net, foreign | (112,047 | ) | (53,842 | ) | (20,876 | ) | 119,175 | (280,445 | ) | 168,049 | ||||||||||||||
Deferred tax expense, net, Chile | 18,928 | 135,539 | 59,318 | (45,361 | ) | 9,541 | 28,724 | |||||||||||||||||
|
|
|
|
|
| |||||||||||||||||||
Deferred tax expense, net, total | (93,119 | ) | 81,697 | 38,442 | 73,814 | (270,904 | ) | 196,773 | ||||||||||||||||
|
|
|
|
|
| |||||||||||||||||||
Income tax expense | (20,069 | ) | 102,386 | 61,789 | 163,204 | (178,383 | ) | 292,404 | ||||||||||||||||
|
|
|
|
|
| |||||||||||||||||||
Reconciliation ofProfit before tax expense usingby the legal rate to the tax expense using the effective rate:
| For the periods ended | ||||||||||||
| December 31, | ||||||||||||
| 2013 | 2012 | 2011 | ||||||||||
| ThUS$ | ThUS$ | ThUS$ | ||||||||||
Tax expense using the legal rate | (61,035 | ) | 22,633 | 76,410 | ||||||||
|
|
|
|
|
| |||||||
Tax effect of legal rate change | — | 70,441 | (*) | (10,571 | ) | |||||||
Tax effect of rates in other jurisdictions | (34,287 | ) | (10,512 | ) | 1,916 | |||||||
Tax effect of non-taxable operating revenues | (24,004 | ) | (7,029 | ) | (11,094 | ) | ||||||
Tax effect of disallowable expenses | 98,211 | 27,437 | 5,087 | |||||||||
Other increases (decreases) in legal tax charge | 1,046 | (584 | ) | 41 | ||||||||
|
|
|
|
|
| |||||||
Total adjustments to tax expense using the legal rate | 40,966 | 79,753 | (14,621 | ) | ||||||||
|
|
|
|
|
| |||||||
Tax expense using the effective rate | (20,069 | ) | 102,386 | 61,789 | ||||||||
|
|
|
|
|
| |||||||
Reconciliation of legal tax rate to effective tax rate:in Chile (24% and 22.5% at December 31, 2016 and 2015, respectively)
| For the periods ended | ||||||||||||
| December 31, | ||||||||||||
| 2013 | 2012 | 2011 | ||||||||||
| % | % | % | ||||||||||
Legal tax rate | 20.00 | 20.00 | 20.00 | |||||||||
|
|
|
|
|
| |||||||
Effect of tax rates for legal rate change | — | 62.24 | (*) | (2.77 | ) | |||||||
Effect of tax rates in other jurisdictions | 11.24 | (9.28 | ) | 0.50 | ||||||||
Effect of tax rate on non-taxable operating revenues | 7.87 | (6.21 | ) | (2.89 | ) | |||||||
Effect of tax rate on disallowable expenses | (32.18 | ) | 24.24 | 1.33 | ||||||||
Other increase (decrease) in legal tax rate | (0.34 | ) | (0.52 | ) | 0.01 | |||||||
|
|
|
|
|
| |||||||
Total adjustment to the legal tax rate | (13.41 | ) | 70.47 | (3.82 | ) | |||||||
|
|
|
|
|
| |||||||
Total effective tax rate | 6.59 | 90.47 | 16.18 | |||||||||
|
|
|
|
|
| |||||||
For the period ended December 31, | For the period ended December 31, | |||||||||||||||||||||||
| 2016 | 2015 | 2014 | 2016 | 2015 | 2014 | |||||||||||||||||||
| ThUS$ | ThUS$ | ThUS$ | % | % | % | |||||||||||||||||||
Tax expense using the legal rate (*) | 65,449 | (89,472 | ) | 6,805 | 24.00 | 22.50 | 21.00 | |||||||||||||||||
|
|
|
|
|
|
|
|
|
|
|
| |||||||||||||
Tax effect by change in tax rate (*) | — | — | 150,210 | — | — | 463.55 | ||||||||||||||||||
Tax effect of rates in other jurisdictions | 16,333 | (21,803 | ) | 112,563 | 5.99 | 5.48 | 347.37 | |||||||||||||||||
Tax effect of non-taxable operating revenues | (62,419 | ) | (106,381 | ) | (60,960 | ) | (22.89 | ) | 26.75 | (188.12 | ) | |||||||||||||
Tax effect of disallowable expenses | 132,469 | 38,677 | 88,643 | 48.58 | (9.73 | ) | 273.55 | |||||||||||||||||
Other increases (decreases) in legal tax charge | 11,372 | 596 | (4,857 | ) | 4.17 | (0.15 | ) | (14.99 | ) | |||||||||||||||
|
|
|
|
|
|
|
|
|
|
|
| |||||||||||||
Total adjustments to tax expense using the legal rate | 97,755 | (88,911 | ) | 285,599 | 35.85 | 22.35 | 881.36 | |||||||||||||||||
|
|
|
|
|
|
|
|
|
|
|
| |||||||||||||
Tax expense using the effective rate | 163,204 | (178,383 | ) | 292,404 | 59.85 | 44.85 | 902.36 | |||||||||||||||||
|
|
|
|
|
|
|
|
|
|
|
| |||||||||||||
| (*) | On September |
Thereby,Thus, at December 31, 20122016 the Company hadpresents the reconciliation of income tax expense and legal tax rate considering the increased rate of 17% to 20%, which meant a higher recorded tax expense by ThUS$ 70,441.increase.
Deferred taxes related to items charged to net equity:
| For the periods ended December 31, | ||||||||
| 2013 | 2012 | |||||||
| ThUS$ | ThUS$ | |||||||
Aggregate deferred taxation of components of other comprehensive income | (19,345 | ) | (5,357 | ) | ||||
Aggregate deferred taxation related to items charged to net equity | (3,440 | ) | (257 | ) | ||||
|
|
|
| |||||
Total deferred taxes related to items charged to net equity | (22,785 | ) | (5,614 | ) | ||||
|
|
|
| |||||
Aggregate deferred taxation of components of other comprehensive income Aggregate deferred taxation related to items charged to net equityDeferred tax effects of the components of other comprehensive income: For the period ended
December 31, 2016 2015 ThUS$ ThUS$ (33,774 ) (17,192 ) (807 ) (992 )
| As of December 31, 2013 | ||||||||||||
| Amount before taxes | Income tax expense (income) | Amount after taxes | ||||||||||
| ThUS$ | ThUS$ | ThUS$ | ||||||||||
Cash-flow hedges | (128,166 | ) | 19,345 | (108,821 | ) | |||||||
Translation adjustment | 629,858 | — | 629,858 | |||||||||
|
| |||||||||||
| 19,345 | ||||||||||||
|
| |||||||||||
| As of December 31, 2012 | ||||||||||||
| Amount before taxes | Income tax expense (income) | Amount after taxes | ||||||||||
| ThUS$ | ThUS$ | ThUS$ | ||||||||||
Cash-flow hedges | 2,510 | 2,623 | 5,133 | |||||||||
Translation adjustment | (19,170 | ) | 2,734 | (16,436 | ) | |||||||
|
| |||||||||||
| 5,357 | ||||||||||||
|
| |||||||||||
| As of December 31, 2011 | ||||||||||||
| Amount before taxes | Income tax expense (income) | Amount after taxes | ||||||||||
| ThUS$ | ThUS$ | ThUS$ | ||||||||||
Cash-flow hedges | 40,368 | (6,862 | ) | 33,506 | ||||||||
Translation adjustment | 10,864 | (1,846 | ) | 9,018 | ||||||||
|
| |||||||||||
| (8,708 | ) | |||||||||||
|
| |||||||||||
NOTE 21 -OTHER19 - OTHER FINANCIAL LIABILITIES
The composition of Other financial liabilities is as follows:
| As of December 31, 2013 | As of December 31, 2012 | As of December 31, 2016 | As of December 31, 2015 | |||||||||||||
| ThUS$ | ThUS$ | ThUS$ | ThUS$ | |||||||||||||
Current | ||||||||||||||||
(a) Interest bearing loans | 1,969,281 | 1,977,255 | 1,814,647 | 1,510,146 | ||||||||||||
(b) Derivatives not recognized as a hedge | 4,040 | 4,477 | ||||||||||||||
(c) Hedge derivatives | 66,466 | 65,598 | ||||||||||||||
(b) Hedge derivatives | 24,881 | 134,089 | ||||||||||||||
|
|
|
| |||||||||||||
Total current | 2,039,787 | 2,047,330 | 1,839,528 | 1,644,235 | ||||||||||||
|
|
|
| |||||||||||||
Non-current | ||||||||||||||||
(a) Interest bearing loans | 7,803,588 | 7,582,302 | 6,790,273 | 7,516,257 | ||||||||||||
(b) Derivatives not recognized as a hedge | 1,491 | 5,515 | ||||||||||||||
(c) Hedge derivatives | 54,906 | 111,040 | ||||||||||||||
(b) Hedge derivatives | 6,679 | 16,128 | ||||||||||||||
|
|
|
| |||||||||||||
Total non-current | 7,859,985 | 7,698,857 | 6,796,952 | 7,532,385 | ||||||||||||
|
|
|
| |||||||||||||
| (a) | Interest bearing loans |
Obligations with credit institutions and debt instruments:
| As of December 31, 2013 | As of December 31, 2012 | As of December 31, 2016 | As of December 31, 2015 | |||||||||||||
| ThUS$ | ThUS$ | ThUS$ | ThUS$ | |||||||||||||
Current | ||||||||||||||||
Loans to exporters | 401,263 | 242,955 | 278,164 | 387,409 | ||||||||||||
Bank loans | 602,618 | 519,762 | ||||||||||||||
Bank loans (1) | 290,810 | 80,188 | ||||||||||||||
Guaranteed obligations | 455,512 | 411,313 | 578,014 | 591,148 | ||||||||||||
Other guaranteed obligations | 31,109 | — | 1,908 | 32,513 | ||||||||||||
|
|
|
| |||||||||||||
Subtotal bank loans | 1,490,502 | 1,174,030 | 1,148,896 | 1,091,258 | ||||||||||||
Obligation with the public | 21,761 | 273,682 | 312,043 | 10,999 | ||||||||||||
Financial leases | 423,537 | 471,896 | 268,040 | 324,859 | ||||||||||||
Other loans | 33,481 | 57,647 | 85,668 | 83,030 | ||||||||||||
|
|
|
| |||||||||||||
Total current | 1,969,281 | 1,977,255 | 1,814,647 | 1,510,146 | ||||||||||||
|
|
|
| |||||||||||||
Non-current | ||||||||||||||||
Bank loans | 322,207 | 219,319 | 294,477 | 564,128 | ||||||||||||
Guaranteed obligations | 3,776,910 | 3,432,919 | 4,180,538 | 4,122,995 | ||||||||||||
Other guaranteed obligations | 64,247 | — | 254,512 | — | ||||||||||||
|
|
|
| |||||||||||||
Subtotal bank loans | 4,163,364 | 3,652,238 | 4,729,527 | 4,687,123 | ||||||||||||
Obligation with the public | 1,116,671 | 1,123,840 | ||||||||||||||
Obligation with the public (2) | 997,302 | 1,294,882 | ||||||||||||||
Financial leases | 1,902,715 | 2,615,924 | 754,321 | 1,015,779 | ||||||||||||
Other loans | 620,838 | 190,300 | 309,123 | 518,473 | ||||||||||||
|
|
|
| |||||||||||||
Total non-current | 7,803,588 | 7,582,302 | 6,790,273 | 7,516,257 | ||||||||||||
|
|
|
| |||||||||||||
Total obligations with financial institutions | 9,772,869 | 9,559,557 | 8,604,920 | 9,026,403 | ||||||||||||
|
|
|
| |||||||||||||
| (1) | On September 29, 2016 TAM Linhas Aéreas S.A. obtained financing for US $ 200 million, guaranteed with 18% of the shares of Multiplus S.A., percentage adjustable depending on the shares price. Additionally, TAM obtained a Cross Currency Swap for the same amount and period, in order to convert the commitment currency from US$ to BRL. |
| (2) | On June 9, 2015 LATAM Airlines Group S.A. has issued and placed on the international market under Rule 144-A and Regulation S of the securities laws of the United States of America, unsecured long-term bonds in the amount of US$ 500,000,000, maturing 2020, interest rate of 7.25% per annum. |
As reported in the Essential Matter of May 20 and June 5, 2015, the Issuance and placement of the Bonds 144-A shall be: (i) finance the repurchase, conversion and redemption of secured long-term bonds issued by the company TAM Capital 2 Inc., under Rule 144-A and Regulation S of the securities laws of the United States of America, maturing 2020; (ii) in the event there is any remnant fund other general corporate purposes. The aforementioned bonds TAM Capital 2 Inc. were redeemed in whole (US$ 300,000,000) through a process of exchange for new bonds dated June 9, 2015 and then the remaining bonds were redeemed by running the prepay dated June 18, 2015.
All interest-bearing liabilities are recorded using the effective interest rate method. Under IFRS, the effective interest rate for loans with a fixed interest rate does not vary throughout the loan, while in the case of loans with variable interest rates, the effective rate changes on each date of repricingreprising of the loan.
Currency balances that make the interest bearing loans at December 31, 2013 and December 31, 2012, are as follows:loans:
| As of December 31, 2013 | As of December 31, 2012 | |||||||
| Currency | ThUS$ | ThUS$ | ||||||
Argentine peso | 43,335 | — | ||||||
Brazilian real | 76,674 | 326,394 | ||||||
Chilean peso | 267,554 | — | ||||||
Euro | 2,029 | 1,785 | ||||||
US Dollar | 9,383,277 | 9,231,378 | ||||||
|
|
|
| |||||
Total | 9,772,869 | 9,559,557 | ||||||
|
|
|
| |||||
Interest-bearing loans due in installments due at December 31, 2013, at nominal value.
|
|
| ||||||||||||||||
| ||||||||||||||||||
| ||||||||||||||||||
| ||||||||||||||||||
| ||||||||||||||||||
| ||||||||||||||||||
| ||||||||||||||||||
Class of Liability | More than 90 days to one year | More than one to three years | More than three to five years | More than five years | Total nominal value | Amortization | Effective rate | Total accounting value | Nominal rate | |||||||||||||||||||||||||
| ThUS $ | ThUS $ | ThUS $ | ThUS $ | ThUS $ | % | ThUS $ | % | |||||||||||||||||||||||||||
Loans to exporters | 30,000 | — | — | — | 30,000 | At Expiration | 1.00 | % | 30,022 | 1.00 | % | |||||||||||||||||||||||
| — | — | — | — | 230,000 | At Expiration | 1.63 | % | 230,819 | 1.63 | % | ||||||||||||||||||||||||
| 40,000 | — | — | — | 40,000 | At Expiration | 1.06 | % | 40,023 | 1.06 | % | ||||||||||||||||||||||||
| — | — | — | — | 100,000 | At Expiration | 1.87 | % | 100,399 | 1.87 | % | ||||||||||||||||||||||||
Bank loans | — | 115,051 | — | — | 115,051 | At Expiration | 3.19 | % | 115,204 | 3.19 | % | |||||||||||||||||||||||
| 46,772 | 124,724 | 81,374 | — | 268,460 | Quarterly | 4.85 | % | 267,554 | 4.85 | % | ||||||||||||||||||||||||
| 15,335 | — | — | — | 15,335 | Monthly | 20.75 | % | 15,370 | 20.75 | % | ||||||||||||||||||||||||
| 27,603 | — | — | — | 27,603 | Monthly | 23.78 | % | 27,965 | 23.78 | % | ||||||||||||||||||||||||
Guaranteed obligations | 8,808 | 25,172 | 27,867 | 26,831 | 91,543 | Quarterly | 5.69 | % | 90,705 | 5.01 | % | |||||||||||||||||||||||
| 34,713 | 82,646 | 10,033 | — | 140,312 | Quarterly | 1.99 | % | 140,601 | 1.99 | % | ||||||||||||||||||||||||
| 6,745 | — | — | — | 8,964 | Quarterly | 3.06 | % | 8,966 | 2.73 | % | ||||||||||||||||||||||||
| 27,256 | 76,985 | 83,871 | 221,267 | 418,254 | Quarterly | 2.45 | % | 417,306 | 2.31 | % | ||||||||||||||||||||||||
| 139,012 | 378,314 | 389,759 | 1,146,684 | 2,099,776 | Quarterly | 2.47 | % | 2,003,334 | 1.76 | % | ||||||||||||||||||||||||
| 29,315 | 81,681 | 87,189 | 164,399 | 372,191 | Quarterly | 2.64 | % | 364,068 | 2.04 | % | ||||||||||||||||||||||||
| 15,237 | 41,767 | 43,552 | 95,022 | 200,599 | Quarterly | 1.32 | % | 195,687 | 1.78 | % | ||||||||||||||||||||||||
| 7,846 | 21,655 | 22,801 | 63,189 | 118,070 | Quarterly | 1.64 | % | 114,484 | 1.04 | % | ||||||||||||||||||||||||
| 3,848 | 10,636 | 11,210 | 31,544 | 58,502 | Quarterly | 1.63 | % | 56,780 | 1.04 | % | ||||||||||||||||||||||||
| 41,995 | 115,549 | 120,924 | 411,684 | 703,992 | Quarterly | 2.81 | % | 656,764 | 2.81 | % | ||||||||||||||||||||||||
| 13,408 | 38,018 | 32,448 | 84,814 | 173,036 | Quarterly | 3.27 | % | 173,741 | 3.27 | % | ||||||||||||||||||||||||
| 1,915 | 4,104 | 2,521 | 765 | 9,986 | Quarterly | — | 9,986 | — | ||||||||||||||||||||||||||
Other guaranteed obligations | 23,342 | 64,247 | — | — | 95,292 | Quarterly | 1.99 | % | 95,356 | 1.99 | % | |||||||||||||||||||||||
Financial leases | 13,896 | 37,656 | 9,001 | — | 65,076 | Quarterly | 3.23 | % | 65,226 | 3.03 | % | |||||||||||||||||||||||
| 13,833 | 63,715 | 7,158 | — | 89,514 | Quarterly | 1.21 | % | 89,658 | 1.21 | % | ||||||||||||||||||||||||
| 4,414 | 12,707 | 14,254 | 7,759 | 40,564 | Quarterly | 6.38 | % | 40,138 | 5.65 | % | ||||||||||||||||||||||||
| 42,702 | 121,395 | 108,403 | 22,407 | 308,774 | Quarterly | 5.35 | % | 306,532 | 4.23 | % | ||||||||||||||||||||||||
| 19,839 | 56,989 | 56,934 | 7,129 | 147,334 | Quarterly | 4.65 | % | 145,826 | 4.15 | % | ||||||||||||||||||||||||
| 1,891 | 5,392 | — | — | 7,899 | Monthly | 1.43 | % | 7,930 | 1.43 | % | ||||||||||||||||||||||||
Other loans | — | 170,838 | — | — | 170,838 | At Expiration | 1.75 | % | 172,488 | 1.75 | % | |||||||||||||||||||||||
| — | 79,611 | 174,178 | 196,211 | 450,000 | Quarterly | 6.00 | % | 454,050 | 6.00 | % | ||||||||||||||||||||||||
|
|
|
|
|
|
|
|
|
| |||||||||||||||||||||||||
| 609,725 | 1,728,852 | 1,283,477 | 2,479,705 | 6,596,965 | 6,436,982 | |||||||||||||||||||||||||||||
|
|
|
|
|
|
|
|
|
|
|
| |||||||||||||||||||||||
Interest-bearing loans due in installments due at December 31, 2013, at nominal value.
|
|
|
|
|
| |||||||||||||
|
| |||||||||||||||||
| ||||||||||||||||||
| ||||||||||||||||||
| ||||||||||||||||||
| ||||||||||||||||||
| ||||||||||||||||||
| ||||||||||||||||||
| ||||||||||||||||||
|
| |||||||||||||||||
|
| |||||||||||||||||
| ||||||||||||||||||
| ||||||||||||||||||
| ||||||||||||||||||
| ||||||||||||||||||
| ||||||||||||||||||
| ||||||||||||||||||
| ||||||||||||||||||
| ||||||||||||||||||
| ||||||||||||||||||
| ||||||||||||||||||
| ||||||||||||||||||
| ||||||||||||||||||
| ||||||||||||||||||
| ||||||||||||||||||
| ||||||||||||||||||
| ||||||||||||||||||
| ||||||||||||||||||
| ||||||||||||||||||
| ||||||||||||||||||
| ||||||||||||||||||
| ||||||||||||||||||
| ||||||||||||||||||
| ||||||||||||||||||
|
| |||||||||||||||||
| ||||||||||||||||||
| ||||||||||||||||||
Class of Liability | More than 90 days to one year | More than one to three years | More than three to five years | More than five years | Total nominal value | Amortization | Effective rate | Total accounting value | nominal rate | |||||||||||||||||||||||||
| ThUS$ | ThUS$ | ThUS$ | ThUS$ | ThUS$ | % | ThUS$ | % | |||||||||||||||||||||||||||
Bank loans | 41,678 | — | — | — | 43,885 | At Expiration | 3.76 | % | 44,719 | 3.20 | % | |||||||||||||||||||||||
| 128,799 | — | — | — | 137,849 | At Expiration | 5.20 | % | 140,152 | 4.66 | % | ||||||||||||||||||||||||
| 47,219 | — | — | — | 73,830 | At Expiration | 6.31 | % | 76,228 | 4.73 | % | ||||||||||||||||||||||||
| 21,731 | — | — | — | 62,357 | At Expiration | 3.73 | % | 63,981 | 2.94 | % | ||||||||||||||||||||||||
| 443 | 48 | — | — | 684 | Monthly | 7.42 | % | 669 | 7.42 | % | ||||||||||||||||||||||||
| 47,641 | — | — | — | 122,341 | At Expiration | 3.87 | % | 126,046 | 3.29 | % | ||||||||||||||||||||||||
| 42,688 | — | — | — | 42,688 | At Expiration | 10.63 | % | 42,701 | 10.15 | % | ||||||||||||||||||||||||
| 316 | 915 | 1,031 | 1,851 | 4,215 | Monthly | 6.01 | % | 4,236 | 6.01 | % | ||||||||||||||||||||||||
Obligations with the publics | — | — | 300,000 | 800,000 | 1,100,000 | At Expiration | 8.60 | % | 1,138,432 | 8.41 | % | |||||||||||||||||||||||
Financial leases | 5,438 | 15,673 | 17,540 | 17,908 | 58,321 | Monthly | 1.25 | % | 58,595 | 1.25 | % | |||||||||||||||||||||||
| 1,645 | — | — | — | 2,970 | Monthly | — | 2,970 | — | ||||||||||||||||||||||||||
| 9,311 | 26,792 | 20,813 | 15,416 | 75,352 | Monthly | 1.42 | % | 75,488 | 1.42 | % | ||||||||||||||||||||||||
| 2,659 | — | — | — | 5,651 | Monthly | — | 6,315 | — | ||||||||||||||||||||||||||
| 1,810 | 5,262 | 5,982 | 8,448 | 22,082 | Quarterly | 1.00 | % | 22,153 | 1.00 | % | ||||||||||||||||||||||||
| 1,758 | 4,959 | 5,371 | 9,693 | 22,359 | Quarterly | 0.86 | % | 22,433 | 0.75 | % | ||||||||||||||||||||||||
| 18,179 | 44,318 | 47,123 | 106,987 | 222,590 | Quarterly | 1.03 | % | 223,008 | 0.90 | % | ||||||||||||||||||||||||
| 12,917 | 55,573 | 11,431 | 13,766 | 97,945 | Quarterly | 1.40 | % | 98,203 | 1.40 | % | ||||||||||||||||||||||||
| 25,433 | 58,866 | 50,469 | 52,717 | 195,396 | Quarterly/ Semiannual | 0.75 | % | 195,819 | 0.65 | % | ||||||||||||||||||||||||
| 9,375 | 12,500 | — | — | 25,000 | Quarterly | 2.50 | % | 25,070 | 2.50 | % | ||||||||||||||||||||||||
| 590 | 1,210 | 282 | — | 2,279 | Monthly | 1.75 | % | 2,283 | 1.75 | % | ||||||||||||||||||||||||
| 48,548 | — | — | — | 51,978 | Monthly | 1.25 | % | 52,049 | 1.25 | % | ||||||||||||||||||||||||
| 3,983 | 10,976 | 11,533 | 36,497 | 64,296 | Quarterly | 1.45 | % | 64,425 | 1.25 | % | ||||||||||||||||||||||||
| 11,869 | 28,660 | 20,499 | 17,813 | 82,718 | Monthly/ Quarterly | 1.74 | % | 82,869 | 1.74 | % | ||||||||||||||||||||||||
| 16,490 | 49,293 | 55,352 | 118,984 | 246,128 | Quarterly/ Semiannual | 2.81 | % | 247,705 | 2.78 | % | ||||||||||||||||||||||||
| 8,610 | 40,227 | 17,171 | 37,615 | 106,403 | Monthly | 1.71 | % | 106,588 | 1.71 | % | ||||||||||||||||||||||||
| 1,303 | 3,097 | 2,617 | 14,267 | 21,737 | Quarterly | 2.00 | % | 21,782 | 2.00 | % | ||||||||||||||||||||||||
| 1,425 | — | — | — | 3,194 | Monthly | 1.25 | % | 3,198 | 1.25 | % | ||||||||||||||||||||||||
| 35,604 | 87,655 | 96,473 | 102,591 | 334,095 | Quarterly | 3.86 | % | 335,017 | 3.78 | % | ||||||||||||||||||||||||
| 1,566 | 4,297 | 4,485 | 6,531 | 17,394 | Quarterly | 0.57 | % | 17,420 | 0.57 | % | ||||||||||||||||||||||||
| 724 | — | — | — | 963 | Monthly | 10.38 | % | 896 | 10.38 | % | ||||||||||||||||||||||||
| 192 | 511 | 213 | — | 1,050 | Monthly | 10.58 | % | 1,069 | 10.58 | % | ||||||||||||||||||||||||
| 746 | 2,218 | 308 | — | 3,559 | Monthly | 9.90 | % | 3,558 | 9.90 | % | ||||||||||||||||||||||||
| 1,310 | — | — | — | 1,379 | Monthly | 6.82 | % | 2,029 | 6.82 | % | ||||||||||||||||||||||||
Other loans | 537 | — | — | — | 27,781 | Monthly | 2.38 | % | 27,781 | 2.38 | % | |||||||||||||||||||||||
|
|
|
|
|
|
|
|
|
|
|
| |||||||||||||||||||||||
| 552,537 | 453,050 | 668,693 | 1,361,084 | 3,280,469 | 3,335,887 | |||||||||||||||||||||||||||||
|
|
|
|
|
|
|
|
|
|
|
| |||||||||||||||||||||||
| 1,162,262 | 2,181,902 | 1,952,170 | 3,840,789 | 9,877,434 | 9,772,869 | |||||||||||||||||||||||||||||
|
|
|
|
|
|
|
|
|
|
|
| |||||||||||||||||||||||
| As of December 31, 2016 | As of December 31, 2015 | |||||||
Currency | ThUS$ | ThUS$ | ||||||
Brazilian real | 1,253 | 3,387 | ||||||
Chilean peso (U.F.) | 203,194 | 210,423 | ||||||
US Dollar | 8,400,473 | 8,812,593 | ||||||
|
|
|
| |||||
Total | 8,604,920 | 9,026,403 | ||||||
|
|
|
| |||||
Interest-bearing loans due in installments to December 31, 2013, at accounting values2016
Debtor: LATAM Airlines Group S.A. and Subsidiaries, Tax No. 89.862.200-2, Chile.
|
|
|
|
|
| |||||||||||||
| ||||||||||||||||||
| ||||||||||||||||||
| ||||||||||||||||||
| ||||||||||||||||||
| ||||||||||||||||||
| ||||||||||||||||||
Class of Liability | More than 90 days to one year | More than one to three years | More than three to five years | More than five years | Total accounting value | Amortization | Effective rate | Total nominal value | Nominal rate | |||||||||||||||||||||||||||||||||||||||||||||||||||||||||||||||||||||||||||||||||||||||||||||||
| ThUS$ | ThUS$ | ThUS$ | ThUS$ | ThUS$ | % | ThUS$ | % | Nominal values | Accounting values | |||||||||||||||||||||||||||||||||||||||||||||||||||||||||||||||||||||||||||||||||||||||||||||||
Loans to export | 30,022 | — | — | — | 30,022 | At Expiration | 1.00 | % | 30,000 | 1.00 | % | |||||||||||||||||||||||||||||||||||||||||||||||||||||||||||||||||||||||||||||||||||||||||||||
| Tax No. | Creditor | Creditor country | Currency | Up to 90 days | More than 90 days to one year | More than one to three years | More than three to five years | More than five years | Total nominal value | Up to 90 days | More than 90 days to one year | More than one to three years | More than three to five years | More than five years | Total accounting value | Amortization | Effective Rate | Nominal rate | ||||||||||||||||||||||||||||||||||||||||||||||||||||||||||||||||||||||||||||||||||||||
| ThUS$ | ThUS$ | ThUS$ | ThUS$ | ThUS$ | ThUS$ | ThUS$ | ThUS$ | ThUS$ | ThUS$ | ThUS$ | ThUS$ | % | % | |||||||||||||||||||||||||||||||||||||||||||||||||||||||||||||||||||||||||||||||||||||||||||
Loans to exporters | Loans to exporters | |||||||||||||||||||||||||||||||||||||||||||||||||||||||||||||||||||||||||||||||||||||||||||||||||||||||
97.032.000-8 | BBVA | Chile | US$ | 75,000 | — | — | — | — | 75,000 | 75,234 | — | — | — | — | 75,234 | | At Expiration | | 1.85 | 1.85 | ||||||||||||||||||||||||||||||||||||||||||||||||||||||||||||||||||||||||||||||||||||
97.032.000-8 | BBVA | Chile | UF | — | 50,381 | — | — | — | 50,381 | — | 50,324 | — | — | — | 50,324 | | At Expiration | | 5.23 | 4.43 | ||||||||||||||||||||||||||||||||||||||||||||||||||||||||||||||||||||||||||||||||||||
97.036.000-K | SANTANDER | Chile | US$ | 30,000 | — | — | — | — | 30,000 | 30,183 | — | — | — | — | 30,183 | | At Expiration | | 2.39 | 2.39 | ||||||||||||||||||||||||||||||||||||||||||||||||||||||||||||||||||||||||||||||||||||
97.030.000-7 | ESTADO | Chile | US$ | 40,000 | — | — | — | — | 40,000 | 40,098 | — | — | — | — | 40,098 | | At Expiration | | 1.91 | 1.91 | ||||||||||||||||||||||||||||||||||||||||||||||||||||||||||||||||||||||||||||||||||||
97.003.000-K | BANCO DO BRASIL | Chile | US$ | 70,000 | — | — | — | — | 70,000 | 70,323 | — | — | — | — | 70,323 | | At Expiration | | 3.08 | 3.08 | ||||||||||||||||||||||||||||||||||||||||||||||||||||||||||||||||||||||||||||||||||||
97.951.000-4 | HSBC | Chile | US$ | 12,000 | — | — | — | — | 12,000 | 12,002 | — | — | — | — | 12,002 | | At Expiration | | 1.79 | 1.79 | ||||||||||||||||||||||||||||||||||||||||||||||||||||||||||||||||||||||||||||||||||||
Bank loans | Bank loans | |||||||||||||||||||||||||||||||||||||||||||||||||||||||||||||||||||||||||||||||||||||||||||||||||||||||
97.023.000-9 | CORP BANCA | Chile | UF | 19,229 | 57,686 | 60,186 | 16,254 | — | 153,355 | 19,819 | 57,686 | 59,176 | 16,189 | — | 152,870 | Quarterly | 4.06 | 4.06 | ||||||||||||||||||||||||||||||||||||||||||||||||||||||||||||||||||||||||||||||||||||||
0-E | BLADEX | U.S.A. | US$ | — | 12,500 | 30,000 | — | — | 42,500 | — | 12,667 | 29,625 | — | — | 42,292 | Semiannual | 5.14 | 5.14 | ||||||||||||||||||||||||||||||||||||||||||||||||||||||||||||||||||||||||||||||||||||||
0-E | DVB BANK SE | U.S.A. | US$ | — | — | 28,911 | — | — | 28,911 | 3 | — | 28,911 | — | — | 28,914 | Quarterly | 1.86 | 1.86 | ||||||||||||||||||||||||||||||||||||||||||||||||||||||||||||||||||||||||||||||||||||||
97.036.000-K | SANTANDER | Chile | US$ | — | — | 158,194 | — | — | 158,194 | 542 | — | 158,194 | — | — | 158,736 | Quarterly | 3.55 | 3.55 | ||||||||||||||||||||||||||||||||||||||||||||||||||||||||||||||||||||||||||||||||||||||
Obligations with the public | Obligations with the public | |||||||||||||||||||||||||||||||||||||||||||||||||||||||||||||||||||||||||||||||||||||||||||||||||||||||
0-E | BANK OF NEWYORK | U.S.A. | US$ | — | — | — | 500,000 | — | 500,000 | 2,291 | — | — | 489,885 | — | 492,176 | | At Expiration | | 7.77 | 7.25 | ||||||||||||||||||||||||||||||||||||||||||||||||||||||||||||||||||||||||||||||||||||
Guaranteed obligations | Guaranteed obligations | |||||||||||||||||||||||||||||||||||||||||||||||||||||||||||||||||||||||||||||||||||||||||||||||||||||||
0-E | CREDIT AGRICOLE | France | US$ | 11,073 | 29,252 | 62,209 | 32,172 | 3,711 | 138,417 | 11,454 | 29,252 | 60,781 | 31,221 | 3,631 | 136,339 | Quarterly | 2.21 | 1.81 | ||||||||||||||||||||||||||||||||||||||||||||||||||||||||||||||||||||||||||||||||||||||
0-E | BNP PARIBAS | U.S.A. | US$ | 10,496 | 42,401 | 111,962 | 118,181 | 345,078 | 628,118 | 12,792 | 43,023 | 108,271 | 116,067 | 341,481 | 621,634 | Quarterly | 2.97 | 2.96 | ||||||||||||||||||||||||||||||||||||||||||||||||||||||||||||||||||||||||||||||||||||||
0-E | WELLS FARGO | U.S.A. | US$ | 31,448 | 95,186 | 260,112 | 269,512 | 400,087 | 1,056,345 | 35,211 | 95,186 | 233,012 | 257,387 | 391,253 | 1,012,049 | Quarterly | 2.37 | 1.68 | ||||||||||||||||||||||||||||||||||||||||||||||||||||||||||||||||||||||||||||||||||||||
0-E | WILMINGTON TRUST | U.S.A. | US$ | 15,554 | 49,236 | 135,254 | 140,848 | 626,444 | 967,336 | 20,997 | 49,236 | 130,792 | 138,455 | 622,153 | 961,633 | Quarterly | 4.25 | 4.25 | ||||||||||||||||||||||||||||||||||||||||||||||||||||||||||||||||||||||||||||||||||||||
0-E | CITIBANK | U.S.A. | US$ | 17,495 | 53,162 | 146,932 | 154,774 | 175,805 | 548,168 | 19,059 | 53,162 | 138,257 | 150,891 | 172,087 | 533,456 | Quarterly | 2.72 | 1.96 | ||||||||||||||||||||||||||||||||||||||||||||||||||||||||||||||||||||||||||||||||||||||
97.036.000-K | SANTANDER | Chile | US$ | 5,347 | 16,204 | 44,472 | 46,386 | 26,165 | 138,574 | 5,680 | 16,204 | 42,707 | 45,815 | 26,063 | 136,469 | Quarterly | 1.98 | 1.44 | ||||||||||||||||||||||||||||||||||||||||||||||||||||||||||||||||||||||||||||||||||||||
0-E | BTMU | U.S.A. | US$ | 2,787 | 8,470 | 23,393 | 24,635 | 26,705 | 85,990 | 3,001 | 8,470 | 22,132 | 24,149 | 26,519 | 84,271 | Quarterly | 2.31 | 1.72 | ||||||||||||||||||||||||||||||||||||||||||||||||||||||||||||||||||||||||||||||||||||||
0-E | APPLE BANK | U.S.A. | US$ | 1,364 | 4,167 | 11,516 | 12,146 | 13,561 | 42,754 | 1,538 | 4,166 | 10,889 | 11,902 | 13,464 | 41,959 | Quarterly | 2.29 | 1.69 | ||||||||||||||||||||||||||||||||||||||||||||||||||||||||||||||||||||||||||||||||||||||
0-E | US BANK | U.S.A. | US$ | 14,817 | 44,958 | 123,705 | 129,462 | 219,666 | 532,608 | 17,298 | 44,958 | 104,709 | 120,509 | 211,895 | 499,369 | Quarterly | 3.99 | 2.81 | ||||||||||||||||||||||||||||||||||||||||||||||||||||||||||||||||||||||||||||||||||||||
0-E | DEUTSCHE BANK | U.S.A. | US$ | 4,992 | 15,365 | 24,725 | 26,984 | 45,197 | 117,263 | 5,570 | 15,365 | 24,023 | 26,515 | 44,522 | 115,995 | Quarterly | 3.86 | 3.86 | ||||||||||||||||||||||||||||||||||||||||||||||||||||||||||||||||||||||||||||||||||||||
0-E | NATIXIS | France | US$ | 12,289 | 37,388 | 98,873 | 82,066 | 192,235 | 422,851 | 13,038 | 37,388 | 97,469 | 81,130 | 190,048 | 419,073 | Quarterly | 2.60 | 2.57 | ||||||||||||||||||||||||||||||||||||||||||||||||||||||||||||||||||||||||||||||||||||||
0-E | PK AIRFINANCE | U.S.A. | US$ | 2,018 | 6,268 | 18,413 | 24,944 | 3,144 | 54,787 | 2,071 | 6,269 | 18,412 | 24,944 | 3,144 | 54,840 | Monthly | 2.40 | 2.40 | ||||||||||||||||||||||||||||||||||||||||||||||||||||||||||||||||||||||||||||||||||||||
0-E | KFW IPEX-BANK | Germany | US$ | 2,288 | 7,015 | 17,869 | 9,019 | — | 36,191 | 2,319 | 7,015 | 17,869 | 9,019 | — | 36,222 | Quarterly | 2.55 | 2.55 | ||||||||||||||||||||||||||||||||||||||||||||||||||||||||||||||||||||||||||||||||||||||
0-E | AIRBUS FINANCIAL | U.S.A. | US$ | 1,797 | 5,476 | 15,262 | 7,664 | — | 30,199 | 1,841 | 5,477 | 15,261 | 7,664 | — | 30,243 | Monthly | 2.49 | 2.49 | ||||||||||||||||||||||||||||||||||||||||||||||||||||||||||||||||||||||||||||||||||||||
0-E | INVESTEC | England | US$ | 1,298 | 7,526 | 19,290 | 21,667 | 22,421 | 72,202 | 1,771 | 7,733 | 18,533 | 21,368 | 22,309 | 71,714 | Semiannual | 5.67 | 5.67 | ||||||||||||||||||||||||||||||||||||||||||||||||||||||||||||||||||||||||||||||||||||||
— | SWAP Aviones llegados | — | US$ | 403 | 1,067 | 1,658 | 158 | — | 3,286 | 403 | 1,067 | 1,658 | 158 | — | 3,286 | Quarterly | — | — | ||||||||||||||||||||||||||||||||||||||||||||||||||||||||||||||||||||||||||||||||||||||
Other guaranteed obligations | Other guaranteed obligations |
| ||||||||||||||||||||||||||||||||||||||||||||||||||||||||||||||||||||||||||||||||||||||||||||||||||||||
0-E | CREDIT AGRICOLE | France | US$ | — | — | 256,860 | — | — | 256,860 | 1,908 | — | 254,512 | — | — | 256,420 | Quarterly | 2.85 | 2.85 | ||||||||||||||||||||||||||||||||||||||||||||||||||||||||||||||||||||||||||||||||||||||
Financial leases | Financial leases | |||||||||||||||||||||||||||||||||||||||||||||||||||||||||||||||||||||||||||||||||||||||||||||||||||||||
0-E | ING | U.S.A. | US$ | 5,089 | 15,653 | 31,151 | 11,805 | — | 63,698 | 5,641 | 15,652 | 30,577 | 11,771 | — | 63,641 | Quarterly | 5.62 | 4.96 | ||||||||||||||||||||||||||||||||||||||||||||||||||||||||||||||||||||||||||||||||||||||
0-E | CREDIT AGRICOLE | France | US$ | 1,754 | 5,403 | — | — | — | 7,157 | 1,780 | 5,403 | — | — | — | 7,183 | Quarterly | 1.85 | 1.85 | ||||||||||||||||||||||||||||||||||||||||||||||||||||||||||||||||||||||||||||||||||||||
0-E | CITIBANK | U.S.A. | US$ | 4,956 | 15,312 | 44,177 | 13,804 | — | 78,249 | 5,622 | 15,312 | 43,413 | 13,762 | — | 78,109 | Quarterly | 6.40 | 5.67 | ||||||||||||||||||||||||||||||||||||||||||||||||||||||||||||||||||||||||||||||||||||||
0-E | PEFCO | U.S.A. | US$ | 15,979 | 47,048 | 63,957 | 3,827 | — | 130,811 | 16,852 | 47,048 | 63,072 | 3,819 | — | 130,791 | Quarterly | 5.39 | 4.79 | ||||||||||||||||||||||||||||||||||||||||||||||||||||||||||||||||||||||||||||||||||||||
0-E | BNP PARIBAS | U.S.A. | US$ | 12,520 | 38,494 | 75,958 | 22,147 | — | 149,119 | 13,122 | 38,494 | 74,776 | 22,079 | — | 148,471 | Quarterly | 3.69 | 3.26 | ||||||||||||||||||||||||||||||||||||||||||||||||||||||||||||||||||||||||||||||||||||||
0-E | WELLS FARGO | U.S.A. | US$ | 4,678 | 14,261 | 39,862 | 42,663 | 1,862 | 103,326 | 5,018 | 14,260 | 38,834 | 42,430 | 1,861 | 102,403 | Quarterly | 3.98 | 3.54 | ||||||||||||||||||||||||||||||||||||||||||||||||||||||||||||||||||||||||||||||||||||||
0-E | DVB BANK SE | U.S.A. | US$ | 4,680 | 9,447 | — | — | — | 14,127 | 4,713 | 9,448 | — | — | — | 14,161 | Quarterly | 2.57 | 2.57 | ||||||||||||||||||||||||||||||||||||||||||||||||||||||||||||||||||||||||||||||||||||||
0-E | RRP ENGINE | England | US$ | — | — | 6,402 | 6,955 | 11,917 | 25,274 | — | — | 6,402 | 6,955 | 11,917 | 25,274 | Monthly | 2.35 | 2.35 | ||||||||||||||||||||||||||||||||||||||||||||||||||||||||||||||||||||||||||||||||||||||
Other loans | Other loans | |||||||||||||||||||||||||||||||||||||||||||||||||||||||||||||||||||||||||||||||||||||||||||||||||||||||
0-E | BOEING | U.S.A. | US$ | — | — | 26,214 | — | — | 26,214 | 185 | — | 26,214 | — | — | 26,399 | | At Expiration | | 2.35 | 2.35 | ||||||||||||||||||||||||||||||||||||||||||||||||||||||||||||||||||||||||||||||||||||
0-E | CITIBANK (*) | U.S.A. | US$ | 20,555 | 63,942 | 184,866 | 101,026 | — | 370,389 | 21,541 | 63,942 | 182,043 | 100,866 | — | 368,392 | Quarterly | 6.00 | 6.00 | ||||||||||||||||||||||||||||||||||||||||||||||||||||||||||||||||||||||||||||||||||||||
| — | — | — | — | 230,819 | At Expiration | 1.63 | % | 230,000 | 1.63 | % |
|
|
|
|
|
|
|
|
|
|
|
| ||||||||||||||||||||||||||||||||||||||||||||||||||||||||||||||||||||||||||||||||||
| 40,023 | — | — | — | 40,023 | At Expiration | 1.06 | % | 40,000 | 1.06 | % | Total | 451,906 | 753,268 | 2,122,383 | 1,819,099 | 2,113,998 | 7,260,654 | 480,920 | 754,207 | 2,040,524 | 1,774,950 | 2,082,347 | 7,132,948 | |||||||||||||||||||||||||||||||||||||||||||||||||||||||||||||||||||||||||||||||||
| — | — | — | — | 100,399 | At Expiration | 1.87 | % | 100,000 | 1.87 | % |
|
|
|
|
|
|
|
|
|
|
|
| ||||||||||||||||||||||||||||||||||||||||||||||||||||||||||||||||||||||||||||||||||
Bank loans | — | 115,051 | — | — | 115,204 | At Expiration | 3.19 | % | 115,051 | 3.19 | % | |||||||||||||||||||||||||||||||||||||||||||||||||||||||||||||||||||||||||||||||||||||||||||||
| 46,771 | 122,780 | 80,528 | — | 267,554 | Quarterly | 4.85 | % | 268,460 | 4.85 | % | ||||||||||||||||||||||||||||||||||||||||||||||||||||||||||||||||||||||||||||||||||||||||||||||
| 15,335 | — | — | — | 15,370 | Monthly | 20.75 | % | 15,335 | 20.75 | % | ||||||||||||||||||||||||||||||||||||||||||||||||||||||||||||||||||||||||||||||||||||||||||||||
| 27,603 | — | — | — | 27,965 | Monthly | 23.78 | % | 27,603 | 23.78 | % | ||||||||||||||||||||||||||||||||||||||||||||||||||||||||||||||||||||||||||||||||||||||||||||||
Guaranteed obligations | 8,807 | 24,144 | 27,437 | 26,682 | 90,705 | Quarterly | 5.69 | % | 91,543 | 5.01 | % | |||||||||||||||||||||||||||||||||||||||||||||||||||||||||||||||||||||||||||||||||||||||||||||
| 34,713 | 82,646 | 10,033 | — | 140,601 | Quarterly | 1.99 | % | 140,312 | 1.99 | % | ||||||||||||||||||||||||||||||||||||||||||||||||||||||||||||||||||||||||||||||||||||||||||||||
| 6,746 | (19 | ) | — | — | 8,966 | Quarterly | 3.06 | % | 8,964 | 2.73 | % | |||||||||||||||||||||||||||||||||||||||||||||||||||||||||||||||||||||||||||||||||||||||||||||
| 27,256 | 75,420 | 83,243 | 221,031 | 417,306 | Quarterly | 2.45 | % | 418,254 | 2.31 | % | ||||||||||||||||||||||||||||||||||||||||||||||||||||||||||||||||||||||||||||||||||||||||||||||
| 139,012 | 330,363 | 365,871 | 1,115,366 | 2,003,334 | Quarterly | 2.47 | % | 2,099,776 | 1.76 | % | ||||||||||||||||||||||||||||||||||||||||||||||||||||||||||||||||||||||||||||||||||||||||||||||
| 29,315 | 76,583 | 84,847 | 162,473 | 364,068 | Quarterly | 2.64 | % | 372,191 | 2.04 | % | ||||||||||||||||||||||||||||||||||||||||||||||||||||||||||||||||||||||||||||||||||||||||||||||
| 15,238 | 38,966 | 42,256 | 93,880 | 195,687 | Quarterly | 1.32 | % | 200,599 | 0.78 | % | ||||||||||||||||||||||||||||||||||||||||||||||||||||||||||||||||||||||||||||||||||||||||||||||
| 7,846 | 19,797 | 21,891 | 62,166 | 114,484 | Quarterly | 1.64 | % | 118,070 | 1.04 | % | ||||||||||||||||||||||||||||||||||||||||||||||||||||||||||||||||||||||||||||||||||||||||||||||
| 3,848 | 9,716 | 10,758 | 31,027 | 56,780 | Quarterly | 1.63 | % | 58,502 | 1.04 | % | ||||||||||||||||||||||||||||||||||||||||||||||||||||||||||||||||||||||||||||||||||||||||||||||
| 41,995 | 93,083 | 109,417 | 395,163 | 656,764 | Quarterly | 2.81 | % | 703,992 | 2.81 | % | ||||||||||||||||||||||||||||||||||||||||||||||||||||||||||||||||||||||||||||||||||||||||||||||
| 13,408 | 38,017 | 32,449 | 84,814 | 173,741 | Quarterly | 3.27 | % | 173,036 | 3.27 | % | ||||||||||||||||||||||||||||||||||||||||||||||||||||||||||||||||||||||||||||||||||||||||||||||
| 1,915 | 4,104 | 2,521 | 765 | 9,986 | Quarterly | — | 9,986 | — | ||||||||||||||||||||||||||||||||||||||||||||||||||||||||||||||||||||||||||||||||||||||||||||||||
| — | ||||||||||||||||||||||||||||||||||||||||||||||||||||||||||||||||||||||||||||||||||||||||||||||||||||||||
Other guaranteed obligations | 23,343 | 64,247 | — | — | 95,356 | Quarterly | 1.99 | % | 95,292 | 1.99 | % | |||||||||||||||||||||||||||||||||||||||||||||||||||||||||||||||||||||||||||||||||||||||||||||
Financial leases | 13,896 | 37,395 | 8,971 | — | 65,226 | Quarterly | 3.23 | % | 65,076 | 3.03 | % | |||||||||||||||||||||||||||||||||||||||||||||||||||||||||||||||||||||||||||||||||||||||||||||
| 13,834 | 63,715 | 7,157 | — | 89,658 | Quarterly | 1.21 | % | 89,514 | 1.21 | % | ||||||||||||||||||||||||||||||||||||||||||||||||||||||||||||||||||||||||||||||||||||||||||||||
| 4,413 | 12,254 | 14,089 | 7,731 | 40,138 | Quarterly | 6.38 | % | 40,564 | 5.65 | % | ||||||||||||||||||||||||||||||||||||||||||||||||||||||||||||||||||||||||||||||||||||||||||||||
| 42,702 | 118,027 | 107,595 | 22,324 | 306,532 | Quarterly | 5.35 | % | 308,774 | 4.23 | % | ||||||||||||||||||||||||||||||||||||||||||||||||||||||||||||||||||||||||||||||||||||||||||||||
| 19,839 | 55,403 | 56,567 | 7,109 | 145,826 | Quarterly | 4.65 | % | 147,334 | 4.15 | % | ||||||||||||||||||||||||||||||||||||||||||||||||||||||||||||||||||||||||||||||||||||||||||||||
| 1,891 | 5,392 | — | — | 7,930 | Monthly | 1.43 | % | 7,899 | 1.43 | % | ||||||||||||||||||||||||||||||||||||||||||||||||||||||||||||||||||||||||||||||||||||||||||||||
Other loans | 1,650 | 170,838 | — | — | 172,488 | At Expiration | 1.75 | % | 170,838 | 1.75 | % | |||||||||||||||||||||||||||||||||||||||||||||||||||||||||||||||||||||||||||||||||||||||||||||
| — | 79,611 | 174,178 | 196,211 | 454,050 | Quarterly | 6.00 | % | 450,000 | 6.00 | % | ||||||||||||||||||||||||||||||||||||||||||||||||||||||||||||||||||||||||||||||||||||||||||||||
|
|
|
|
|
| |||||||||||||||||||||||||||||||||||||||||||||||||||||||||||||||||||||||||||||||||||||||||||||||||||
| 611,421 | 1,637,533 | 1,239,808 | 2,426,742 | 6,436,982 | 6,596,965 | |||||||||||||||||||||||||||||||||||||||||||||||||||||||||||||||||||||||||||||||||||||||||||||||||||
|
|
|
|
|
| |||||||||||||||||||||||||||||||||||||||||||||||||||||||||||||||||||||||||||||||||||||||||||||||||||
| (*) | Securitized bond with the future flows from the sales with credit card in United States and Canada. |
Interest-bearing loans due in installments to December 31, 2013, at accounting value2016
Debtor: TAM S.A. and Subsidiaries, Tax No. 02.012.862/0001-60, Brazil.
|
|
|
|
|
| |||||||||||||
|
| |||||||||||||||||
| ||||||||||||||||||
| ||||||||||||||||||
| ||||||||||||||||||
| ||||||||||||||||||
| ||||||||||||||||||
| ||||||||||||||||||
| ||||||||||||||||||
| ||||||||||||||||||
|
| |||||||||||||||||
|
| |||||||||||||||||
| ||||||||||||||||||
| ||||||||||||||||||
| ||||||||||||||||||
| ||||||||||||||||||
| ||||||||||||||||||
| ||||||||||||||||||
| ||||||||||||||||||
| ||||||||||||||||||
| ||||||||||||||||||
| ||||||||||||||||||
| ||||||||||||||||||
| ||||||||||||||||||
| ||||||||||||||||||
| ||||||||||||||||||
| ||||||||||||||||||
| ||||||||||||||||||
| ||||||||||||||||||
| ||||||||||||||||||
| ||||||||||||||||||
| ||||||||||||||||||
| ||||||||||||||||||
| ||||||||||||||||||
| ||||||||||||||||||
|
| |||||||||||||||||
| ||||||||||||||||||
| ||||||||||||||||||
Class of Liability | More than 90 days to one year | More than one to three years | More than three to five years | More than five years | Total accounting value | Amortization | Effective rate | Total nominal value | Nominal rate | |||||||||||||||||||||||||
| ThUS$ | ThUS$ | ThUS$ | ThUS$ | ThUS$ | % | ThUS$ | % | |||||||||||||||||||||||||||
Bank loans | 42,413 | — | — | — | 44,719 | At expiration | 3.76 | % | 43,885 | 3.20 | % | |||||||||||||||||||||||
| 130,742 | — | — | — | 140,152 | At expiration | 5.20 | % | 137,849 | 4.66 | % | ||||||||||||||||||||||||
| 48,424 | — | — | — | 76,228 | At expiration | 6.31 | % | 73,830 | 4.73 | % | ||||||||||||||||||||||||
| 22,213 | — | — | — | 63,981 | At expiration | 3.73 | % | 62,357 | 2.94 | % | ||||||||||||||||||||||||
| 431 | 51 | — | — | 669 | Monthly | 7.42 | % | 684 | 7.42 | % | ||||||||||||||||||||||||
| 48,828 | — | — | — | 126,046 | At expiration | 3.87 | % | 122,341 | 3.29 | % | ||||||||||||||||||||||||
| 42,701 | — | — | — | 42,701 | At expiration | 10.63 | % | 42,688 | 10.15 | % | ||||||||||||||||||||||||
| — | — | |||||||||||||||||||||||||||||||||
| 316 | 915 | 1,031 | 1,851 | 4,236 | Monthly | 6.01 | % | 4,215 | 6.01 | % | ||||||||||||||||||||||||
Obligations with the publics | 2,001 | 5,343 | 305,554 | 805,774 | 1,138,432 | At expiration | 8.60 | % | 1,100,000 | 8.41 | % | |||||||||||||||||||||||
Financial leases | 5,437 | 15,673 | 17,541 | 17,908 | 58,595 | Monthly | 1.25 | % | 58,321 | 1.25 | % | |||||||||||||||||||||||
| 1,645 | — | — | — | 2,970 | Monthly | — | 2,970 | — | ||||||||||||||||||||||||||
| 9,311 | 26,792 | 20,812 | 15,417 | 75,488 | Monthly | 1.42 | % | 75,352 | 1.42 | % | ||||||||||||||||||||||||
| 2,659 | — | — | — | 6,315 | Monthly | — | 5,651 | — | ||||||||||||||||||||||||||
| 1,810 | 5,262 | 5,982 | 8,448 | 22,153 | Quarterly | 1.00 | % | 22,082 | 1.00 | % | ||||||||||||||||||||||||
| 1,758 | 4,959 | 5,371 | 9,693 | 22,433 | Quarterly | 0.86 | % | 22,359 | 0.75 | % | ||||||||||||||||||||||||
| 18,179 | 44,318 | 47,123 | 106,987 | 223,008 | Quarterly | 1.03 | % | 222,590 | 0.90 | % | ||||||||||||||||||||||||
| 12,917 | 55,573 | 11,431 | 13,766 | 98,203 | Quarterly | 1.40 | % | 97,945 | 1.40 | % | ||||||||||||||||||||||||
| 25,433 | 58,866 | 50,469 | 52,717 | 195,819 | Quarterly/ Semiannual | 0.75 | % | 195,396 | 0.65 | % | ||||||||||||||||||||||||
| 9,375 | 12,500 | — | — | 25,070 | Quarterly | 2.50 | % | 25,000 | 2.50 | % | ||||||||||||||||||||||||
| 590 | 1,210 | 282 | — | 2,283 | Monthly | 1.75 | % | 2,279 | 1.75 | % | ||||||||||||||||||||||||
| 48,548 | — | — | — | 52,049 | Monthly | 1.25 | % | 51,978 | 1.25 | % | ||||||||||||||||||||||||
| 3,983 | 10,976 | 11,533 | 36,497 | 64,425 | Quarterly | 1.45 | % | 64,296 | 1.25 | % | ||||||||||||||||||||||||
| 11,869 | 28,660 | 20,500 | 17,813 | 82,869 | Monthly/ Quarterly | 1.74 | % | 82,718 | 1.74 | % | ||||||||||||||||||||||||
| 16,490 | 49,293 | 55,352 | 118,984 | 247,705 | Quarterly/ Semiannual | 2.81 | % | 246,128 | 2.78 | % | ||||||||||||||||||||||||
| 8,611 | 40,227 | 17,171 | 37,615 | 106,588 | Monthly | 1.71 | % | 106,403 | 1.71 | % | ||||||||||||||||||||||||
| 1,303 | 3,097 | 2,617 | 14,267 | 21,782 | Quarterly | 2.00 | % | 21,737 | 2.00 | % | ||||||||||||||||||||||||
| — | ||||||||||||||||||||||||||||||||||
| 1,425 | — | — | — | 3,198 | Monthly | 1.25 | % | 3,194 | 1.25 | % | ||||||||||||||||||||||||
| 35,604 | 87,655 | 96,473 | 102,591 | 335,017 | Quarterly | 3.86 | % | 334,095 | | — 3.78 | % | |||||||||||||||||||||||
| 1,566 | 4,297 | 4,485 | 6,531 | 17,420 | Quarterly | 0.57 | % | 17,394 | | — 0.57 | % | |||||||||||||||||||||||
| 674 | — | — | — | 896 | Monthly | | — 10.38 | % | 963 | 10.38 | % | |||||||||||||||||||||||
| 192 | 511 | 213 | — | 1,069 | Monthly | 10.58 | % | 1,050 | 10.58 | % | ||||||||||||||||||||||||
| 745 | 2,220 | 308 | — | 3,558 | Monthly | 9.90 | % | 3,559 | 9.90 | % | ||||||||||||||||||||||||
| 1,205 | — | — | — | 2,029 | Monthly | 6.82 | % | 1,379 | 6.82 | % | ||||||||||||||||||||||||
| — | ||||||||||||||||||||||||||||||||||
| — | — | |||||||||||||||||||||||||||||||||
Other loans | 537 | — | — | — | 27,781 | Monthly | 2.38 | % | 27,781 | 2.38 | % | |||||||||||||||||||||||
|
|
|
|
|
|
|
|
|
|
|
| |||||||||||||||||||||||
| 559,935 | 458,398 | 674,248 | 1,366,859 | 3,335,887 | 3,280,469 | |||||||||||||||||||||||||||||
|
|
|
|
|
|
|
|
|
|
|
| |||||||||||||||||||||||
| 1,171,356 | 2,095,931 | 1,914,056 | 3,793,601 | 9,772,869 | 9,877,434 | |||||||||||||||||||||||||||||
|
|
|
|
|
|
|
|
|
|
|
| |||||||||||||||||||||||
Interest-bearing loans due in installments due at December 31, 2012, at nominal value
|
|
|
|
|
| |||||||||||||||
|
| |||||||||||||||||||
| ||||||||||||||||||||
| ||||||||||||||||||||
| ||||||||||||||||||||
|
| |||||||||||||||||||
| ||||||||||||||||||||
|
| |||||||||||||||||||
| ||||||||||||||||||||
| ||||||||||||||||||||
| ||||||||||||||||||||
| ||||||||||||||||||||
| ||||||||||||||||||||
| ||||||||||||||||||||
| ||||||||||||||||||||
| ||||||||||||||||||||
| ||||||||||||||||||||
| ||||||||||||||||||||
| ||||||||||||||||||||
| ||||||||||||||||||||
|
| |||||||||||||||||||
| ||||||||||||||||||||
| ||||||||||||||||||||
| ||||||||||||||||||||
| ||||||||||||||||||||
|
| |||||||||||||||||||
| ||||||||||||||||||||
| ||||||||||||||||||||
Class of Liability | More than 90 days to one year | More than one to three years | More than three to five years | More than five years | Total nominal value | Amortization | Effective rate | Total accounting value | Nominal rate | |||||||||||||||||||||||||
| ThUS$ | ThUS$ | ThUS$ | ThUS$ | ThUS$ | % | ThUS$ | % | |||||||||||||||||||||||||||
Loans to exporters | — | — | — | 30,000 | Semiannual | 2.17 | % | 30,253 | 2.17 | % | ||||||||||||||||||||||||
| — | — | — | 35,000 | Semiannual | 1.70 | % | 35,056 | 1.70 | % | |||||||||||||||||||||||||
| — | — | — | 75,000 | Quarterly | 1.32 | % | 75,084 | 1.32 | % | |||||||||||||||||||||||||
| — | — | — | 102,000 | Annual | 1.83 | % | 102,562 | 1.79 | % | |||||||||||||||||||||||||
Bank loans | — | 214,373 | — | 214,373 | — | 2.57 | % | 214,586 | 2.57 | % | ||||||||||||||||||||||||
| 44,848 | — | — | 44,848 | Semiannual | 1.76 | % | 44,972 | 1.74 | % | |||||||||||||||||||||||||
Guaranteed obligations | 8,374 | 23,951 | 26,478 | 41,114 | 102,649 | Quarterly | 5.69 | % | 101,461 | 5.01 | % | |||||||||||||||||||||||
| 33,402 | 35,129 | 6,714 | — | 87,448 | Quarterly | 3.42 | % | 87,719 | 3.37 | % | ||||||||||||||||||||||||
| 10,696 | 20,753 | 13,014 | 18,211 | 66,148 | Quarterly | 4.96 | % | 65,494 | 4.41 | % | ||||||||||||||||||||||||
| 41,635 | 118,769 | 130,877 | 146,231 | 451,090 | Quarterly | 4.15 | % | 444,700 | 3.67 | % | ||||||||||||||||||||||||
| 119,458 | 324,890 | 334,407 | 1,141,162 | 1,959,463 | Quarterly | 2.57 | % | 1,872,616 | 1.76 | % | ||||||||||||||||||||||||
| 28,406 | 79,112 | 84,369 | 208,710 | 409,908 | Quarterly | 2.71 | % | 399,854 | 2.10 | % | ||||||||||||||||||||||||
| 14,919 | 40,930 | 42,645 | 117,024 | 220,449 | Quarterly | 1.39 | % | 214,435 | 0.85 | % | ||||||||||||||||||||||||
| 7,638 | 21,116 | 22,221 | 74,733 | 128,222 | Quarterly | 1.73 | % | 123,920 | 1.13 | % | ||||||||||||||||||||||||
| 3,748 | 10,359 | 10,919 | 37,223 | 63,480 | Quarterly | 1.71 | % | 61,411 | 1.11 | % | ||||||||||||||||||||||||
| 9,602 | 26,388 | 27,586 | 106,054 | 172,789 | Quarterly | 1.97 | % | 165,394 | 1.26 | % | ||||||||||||||||||||||||
| 5,974 | 16,404 | 17,153 | 65,579 | 107,072 | Quarterly | 1.98 | % | 102,662 | 1.27 | % | ||||||||||||||||||||||||
| 12,813 | 36,339 | 39,791 | 96,906 | 190,000 | Quarterly | 3.35 | % | 190,813 | 3.35 | % | ||||||||||||||||||||||||
| 2,316 | 5,158 | 3,549 | 1,916 | 13,754 | — | — | 13,754 | — | ||||||||||||||||||||||||||
Financial leases | 16,075 | 35,499 | 25,563 | 1,844 | 85,491 | Quarterly | 3.71 | % | 85,670 | 3.42 | % | |||||||||||||||||||||||
| 14,192 | 29,145 | 30,216 | 25,485 | 103,684 | Quarterly | 1.32 | % | 103,869 | 1.29 | % | ||||||||||||||||||||||||
| 4,164 | 12,014 | 13,461 | 15,089 | 46,086 | Quarterly | 6.38 | % | 45,480 | 5.65 | % | ||||||||||||||||||||||||
| 5,637 | — | — | — | 7,462 | Quarterly | 1.31 | % | 7,466 | 1.31 | % | ||||||||||||||||||||||||
| 36,603 | 104,071 | 112,116 | 49,572 | 314,261 | Quarterly | 5.29 | % | 311,418 | 4.70 | % | ||||||||||||||||||||||||
Other loans | — | 146,189 | — | — | 146,189 | — | 1.86 | % | 148,582 | 1.86 | % | |||||||||||||||||||||||
| 10,706 | 29,472 | 15,258 | — | 58,960 | Quarterly | 2.08 | % | 58,340 | 2.08 | % | ||||||||||||||||||||||||
|
|
|
|
|
|
|
|
|
|
|
| |||||||||||||||||||||||
| 431,206 | 1,330,061 | 956,337 | 2,146,853 | 5,235,826 | 5,107,571 | |||||||||||||||||||||||||||||
|
|
|
|
|
|
|
|
|
|
|
| |||||||||||||||||||||||
Interest-bearing loans due in installments due at December 31, 2012, at nominal value
|
|
|
|
|
| |||||||||||||
|
| |||||||||||||||||
| ||||||||||||||||||
| ||||||||||||||||||
| ||||||||||||||||||
| ||||||||||||||||||
| ||||||||||||||||||
| ||||||||||||||||||
| ||||||||||||||||||
| ||||||||||||||||||
| ||||||||||||||||||
|
| |||||||||||||||||
|
| |||||||||||||||||
| ||||||||||||||||||
| ||||||||||||||||||
| ||||||||||||||||||
| ||||||||||||||||||
| ||||||||||||||||||
| ||||||||||||||||||
| ||||||||||||||||||
| ||||||||||||||||||
| ||||||||||||||||||
| ||||||||||||||||||
| ||||||||||||||||||
| ||||||||||||||||||
| ||||||||||||||||||
| ||||||||||||||||||
| ||||||||||||||||||
| ||||||||||||||||||
| ||||||||||||||||||
| ||||||||||||||||||
| ||||||||||||||||||
| ||||||||||||||||||
| ||||||||||||||||||
| ||||||||||||||||||
| ||||||||||||||||||
| ||||||||||||||||||
| ||||||||||||||||||
|
| |||||||||||||||||
| ||||||||||||||||||
| ||||||||||||||||||
Class of Liability | More than 90 days to one year | More than one to three years | More than three to five years | More than five years | Total nominal value | Amortization | Effective rate | Total accounting value | Nominal rate | |||||||||||||||||||||
| ThUS$ | ThUS$ | ThUS$ | ThUS$ | ThUS$ | % | ThUS$ | % | |||||||||||||||||||||||
Bank loans | 50,322 | — | — | — | 50,322 | Quarterly | 2.81% | 64,480 | 2.81% | |||||||||||||||||||||
| 5,623 | — | — | — | 29,986 | At Expiration | 4.03% | 30,419 | 4.03% | ||||||||||||||||||||||
| 109,874 | — | — | — | 151,980 | At Expiration | 5.35% | 152,517 | 5.35% | ||||||||||||||||||||||
| — | — | — | — | 92 | Semiannual | 10.72% | 336 | 10.72% | ||||||||||||||||||||||
| 117,852 | — | — | — | 163,391 | At Expiration | 5.65% | 166,916 | 5.65% | ||||||||||||||||||||||
| 14,356 | 784 | — | — | 32,446 | Monthly/ At Expiration | 7,69%/4,01% | 32,596 | 7,69%/4,01% | ||||||||||||||||||||||
| 27 | — | — | — | 88 | Monthly | 8.94% | 78 | 8.94% | ||||||||||||||||||||||
| 27,484 | — | — | — | 27,484 | At Expiration | 3.34% | 27,506 | 3.34% | ||||||||||||||||||||||
| 297 | 861 | 971 | 2,383 | 4,608 | Monthly | 0.96% | 4,674 | 0.95% | ||||||||||||||||||||||
Obligations with the publics | — | — | 300,000 | 800,000 | 1,100,000 | At Expiration | 8.60% | 1,146,251 | 8.41% | |||||||||||||||||||||
| 220,210 | — | — | — | 244,678 | Semiannual | 8.96% | 251,271 | 8.56% | ||||||||||||||||||||||
Financial leases | 5,140 | 14,816 | 16,580 | 26,925 | 65,127 | Monthly | N/A | 66,032 | N/A | |||||||||||||||||||||
| 9,350 | — | — | — | 12,750 | Monthly | N/A | 12,871 | N/A | ||||||||||||||||||||||
| 8,819 | 25,357 | 27,070 | 22,925 | 87,033 | Monthly | 2.25% | 87,409 | 2.25% | ||||||||||||||||||||||
| 8,975 | 5,651 | — | — | 17,617 | Monthly | N/A | 18,588 | N/A | ||||||||||||||||||||||
| 1,699 | 4,939 | 5,609 | 11,535 | 24,326 | Quarterly | 1.50% | 24,479 | 1.50% | ||||||||||||||||||||||
| 7,237 | 17,064 | 17,384 | 43,929 | 87,986 | Quarterly | 3.84% | 88,109 | 3.84% | ||||||||||||||||||||||
| 41,043 | 82,593 | 81,129 | 234,657 | 451,284 | Quarterly | 3.69% | 451,201 | 3.69% | ||||||||||||||||||||||
| 12,683 | 67,629 | 10,627 | 19,689 | 114,810 | Quarterly | 2.29% | 115,493 | 2.29% | ||||||||||||||||||||||
| 47,894 | 126,930 | 121,391 | 182,561 | 494,721 | Quarterly/ Semiannual | 2,01%/0,82% | 497,986 | 2,01%/0,37% | ||||||||||||||||||||||
| 9,375 | 25,000 | — | — | 37,500 | Quarterly | 2.89% | 37,570 | 2.89% | ||||||||||||||||||||||
| 1,369 | 2,821 | 756 | — | 5,402 | Monthly | 2.25% | 5,420 | 2.25% | ||||||||||||||||||||||
| 19,967 | 51,979 | — | — | 81,086 | Monthly | 2.59% | 81,379 | 2.59% | ||||||||||||||||||||||
| 3,887 | 10,713 | 11,249 | 42,334 | 69,458 | Quarterly | 1.70% | 69,596 | 0.85% | ||||||||||||||||||||||
| 11,343 | 32,226 | 23,604 | 26,888 | 97,770 | Monthly/ Quarterly | 2,11%/2,21% | 98,111 | 2,11%/2,21% | ||||||||||||||||||||||
| 20,421 | 59,579 | 66,989 | 163,464 | 316,425 | Quarterly/ Semiannual | 2,62%/3,32% | 319,002 | 2,62%/3,32% | ||||||||||||||||||||||
| 8,080 | 23,530 | 36,373 | 46,500 | 117,092 | Monthly | 1.96% | 117,520 | 1.96% | ||||||||||||||||||||||
| 1,417 | 3,369 | 2,847 | 15,521 | 23,647 | Quarterly | 2.42% | 23,844 | 2.42% | ||||||||||||||||||||||
| 5,308 | 3,194 | — | — | 10,271 | Monthly | 1.98% | 10,300 | 1.98% | ||||||||||||||||||||||
| 34,574 | 90,164 | 91,964 | 151,968 | 380,025 | Quarterly | 1.95% | 381,847 | 1.95% | ||||||||||||||||||||||
| 1,532 | 4,207 | 4,390 | 8,798 | 19,431 | Quarterly | 0.88% | 19,544 | 0.08% | ||||||||||||||||||||||
| 758 | 1,015 | — | — | 2,025 | Monthly | 7.51% | 1,344 | 7.51% | ||||||||||||||||||||||
| 1,631 | 81 | — | — | 2,255 | Monthly | 10.58% | 2,192 | 10.58% | ||||||||||||||||||||||
| 13 | — | — | — | 53 | Monthly | 5.31% | 50 | 5.31% | ||||||||||||||||||||||
| 484 | 74 | — | — | 747 | Monthly | 9.08% | 711 | 9.08% | ||||||||||||||||||||||
| 191 | 1,320 | — | — | 1,572 | Monthly | 6.82% | 1,785 | 6.82% | ||||||||||||||||||||||
| — | — | — | — | 2,520 | Monthly | 0.00% | 1,534 | 0.00% | ||||||||||||||||||||||
Others loans | 9,143 | — | — | — | 41,025 | Monthly | 2.20% | 41,025 | 2.20% | |||||||||||||||||||||
|
|
|
|
|
|
|
|
|
|
|
| |||||||||||||||||||
| 818,378 | 655,896 | 818,933 | 1,800,077 | 4,369,033 | 4,451,986 | |||||||||||||||||||||||||
|
|
|
|
|
|
|
|
|
|
|
| |||||||||||||||||||
| 1,249,584 | 1,985,957 | 1,775,270 | 3,946,930 | 9,604,859 | 9,559,557 | |||||||||||||||||||||||||
|
|
|
|
|
|
|
|
|
|
|
| |||||||||||||||||||
| Nominal values | Accounting values | |||||||||||||||||||||||||||||||||||||||||||||||||||||||||||||||||||||
| Tax No. | Creditor | Creditor country | Currency | Up to 90 days | More than 90 days to one year | More than one to three years | More than three to five years | More than five years | Total nominal value | Up to 90 days | More than 90 days to one year | More than one to three years | More than three to five years | More than five years | Total accounting value | Amortization | Effective rate | Nominal rate | ||||||||||||||||||||||||||||||||||||||||||||||||||||
| ThUS$ | ThUS$ | ThUS$ | ThUS$ | ThUS$ | ThUS$ | ThUS$ | ThUS$ | ThUS$ | ThUS$ | ThUS$ | ThUS$ | % | % | |||||||||||||||||||||||||||||||||||||||||||||||||||||||||
Bank loans | ||||||||||||||||||||||||||||||||||||||||||||||||||||||||||||||||||||||
0-E | NEDERLANDSCHE | |||||||||||||||||||||||||||||||||||||||||||||||||||||||||||||||||||||
| CREDIETVERZEKERING MAATS CHAPPIJ | Holland | US$ | 122 | 378 | 1,094 | 1,234 | 54 | 2,882 | 137 | 378 | 1,094 | 1,233 | 55 | 2,897 | Monthly | 6.01 | 6.01 | |||||||||||||||||||||||||||||||||||||||||||||||||||||
0-E | CITIBANK | U.S.A | US$ | — | 200,000 | — | — | — | 200,000 | (151 | ) | 199,729 | — | — | — | 199,578 | | At Expiration | | 3.39 | 3.14 | |||||||||||||||||||||||||||||||||||||||||||||||||
Obligation with the public | ||||||||||||||||||||||||||||||||||||||||||||||||||||||||||||||||||||||
0-E | THE BANK OF NEW YORK | U.S.A | US$ | — | 300,000 | — | 500,000 | — | 800,000 | 8,173 | 301,579 | 4,119 | 503,298 | — | 817,169 | | At Expiration | | 8.17 | 8.00 | ||||||||||||||||||||||||||||||||||||||||||||||||||
Financial leases | ||||||||||||||||||||||||||||||||||||||||||||||||||||||||||||||||||||||
0-E | AFS INVESTMENT IX LLC | U.S.A | US$ | 2,086 | 6,437 | 18,556 | 8,369 | — | 35,448 | 2,253 | 6,437 | 18,556 | 8,369 | — | 35,615 | Monthly | 1.25 | 1.25 | ||||||||||||||||||||||||||||||||||||||||||||||||||||
0-E | DVB BANK SE | U.S.A | US$ | 118 | 164 | — | — | — | 282 | 119 | 164 | — | — | — | 283 | Monthly | 2.50 | 2.50 | ||||||||||||||||||||||||||||||||||||||||||||||||||||
0-E | GENERAL ELECTRIC CAPITAL CORPORATION | U.S.A | US$ | 3,771 | 5,075 | — | — | — | 8,846 | 3,794 | 5,075 | — | — | — | 8,869 | Monthly | 2.30 | 2.30 | ||||||||||||||||||||||||||||||||||||||||||||||||||||
0-E | KFW IPEX-BANK | Germany | US$ | 579 | 1,544 | — | — | — | 2,123 | 583 | 1,544 | — | — | — | 2,127 | | Monthly/ Quarterly | 2.80 | 2.80 | |||||||||||||||||||||||||||||||||||||||||||||||||||
0-E | NATIXIS | France | US$ | 2,675 | 5,732 | 18,485 | 38,820 | 41,731 | 107,443 | 3,533 | 5,732 | 18,485 | 38,820 | 41,731 | 108,301 | | Quarterly/ Semiannual | 4.90 | 4.90 | |||||||||||||||||||||||||||||||||||||||||||||||||||
0-E | WACAPOU LEASING S.A. | Luxemburg | US$ | 668 | 2,038 | 5,768 | 6,280 | — | 14,754 | 709 | 2,038 | 5,768 | 6,280 | — | 14,795 | Quarterly | 3.00 | 3.00 | ||||||||||||||||||||||||||||||||||||||||||||||||||||
0-E | SOCIÉTÉ GÉNÉRALE MILAN BRANCH | Italy | US$ | 8,547 | 26,275 | 74,783 | 169,730 | — | 279,335 | 9,779 | 26,275 | 74,783 | 169,730 | — | 280,567 | Quarterly | 4.18 | 4.11 | ||||||||||||||||||||||||||||||||||||||||||||||||||||
0-E | BANCO IBM S.A | Brazil | BRL | 260 | 749 | 22 | — | — | 1,031 | 260 | 749 | 21 | — | — | 1,030 | Monthly | 13.63 | 13.63 | ||||||||||||||||||||||||||||||||||||||||||||||||||||
0-E | HP FINANCIAL SERVICE | Brazil | BRL | 222 | — | — | — | — | 222 | 222 | — | — | — | — | 222 | Monthly | 10.02 | 10.02 | ||||||||||||||||||||||||||||||||||||||||||||||||||||
0-E | SOCIETE GENERALE | France | BRL | 102 | 307 | 110 | — | — | 519 | 102 | 307 | 110 | — | — | 519 | Monthly | 13.63 | 13.63 | ||||||||||||||||||||||||||||||||||||||||||||||||||||
|
|
|
|
|
|
|
|
|
|
|
|
|
|
|
|
|
|
|
|
|
|
|
| |||||||||||||||||||||||||||||||||||||||||||||||
| Total | 19,150 | 548,699 | 118,818 | 724,433 | 41,785 | 1,452,885 | 29,513 | 550,007 | 122,936 | 727,730 | 41,786 | 1,471,972 | ||||||||||||||||||||||||||||||||||||||||||||||||||||||||||
|
|
|
|
|
|
|
|
|
|
|
|
|
|
|
|
|
|
|
|
|
|
|
| |||||||||||||||||||||||||||||||||||||||||||||||
| Total consolidated | 471,056 | 1,301,967 | 2,241,201 | 2,543,532 | 2,155,783 | 8,713,539 | 510,433 | 1,304,214 | 2,163,460 | 2,502,680 | 2,124,133 | 8,604,920 | ||||||||||||||||||||||||||||||||||||||||||||||||||||||||||
|
|
|
|
|
|
|
|
|
|
|
|
|
|
|
|
|
|
|
|
|
|
|
| |||||||||||||||||||||||||||||||||||||||||||||||
Interest-bearing loans due in installments to December 31, 2012, at accounting values2015
Debtor: LATAM Airlines Group S.A. and Subsidiaries, Tax No. 89.862.200-2, Chile.
| Nominal values | Accounting values | |||||||||||||||||||||||||||||||||||||||||||||||||||||||||||||||||||||
| Tax No. | Creditor | Creditor country | Currency | Up to 90 days | More than 90 days to one year | More than one to three years | More than three to five years | More than five years | Total nominal value | Up to 90 days | More than 90 days to one year | More than one to three years | More than three to five years | More than five years | Total accounting value | Amortization | Effective rate | Nominal rate | ||||||||||||||||||||||||||||||||||||||||||||||||||||
| ThUS$ | ThUS$ | ThUS$ | ThUS$ | ThUS$ | ThUS$ | ThUS$ | ThUS$ | ThUS$ | ThUS$ | ThUS$ | ThUS$ | % | % | |||||||||||||||||||||||||||||||||||||||||||||||||||||||||
Loans to exporters | ||||||||||||||||||||||||||||||||||||||||||||||||||||||||||||||||||||||
97.032.000-8 | BBVA | Chile | US$ | 100,000 | — | — | — | — | 100,000 | 100,183 | — | — | — | — | 100,183 | | At Expiration | | 1.00 | 1.00 | ||||||||||||||||||||||||||||||||||||||||||||||||||
97.036.000-K | SANTANDER | Chile | US$ | 100,000 | — | — | — | — | 100,000 | 100,067 | — | — | — | — | 100,067 | | At Expiration | | 1.44 | 1.44 | ||||||||||||||||||||||||||||||||||||||||||||||||||
97.030.000-7 | ESTADO | Chile | US$ | 55,000 | — | — | — | — | 55,000 | 55,088 | — | — | — | — | 55,088 | | At Expiration | | 1.05 | 1.05 | ||||||||||||||||||||||||||||||||||||||||||||||||||
97.004.000-5 | CHILE | Chile | US$ | 50,000 | — | — | — | — | 50,000 | 50,006 | — | — | — | — | 50,006 | | At Expiration | | 1.42 | 1.42 | ||||||||||||||||||||||||||||||||||||||||||||||||||
97,003,000-K | BANCO DO BRASIL | Chile | US$ | 70,000 | — | — | — | — | 70,000 | 70,051 | — | — | — | — | 70,051 | | At Expiration | | 1.18 | 1.18 | ||||||||||||||||||||||||||||||||||||||||||||||||||
97.951.000-4 | HSBC | Chile | US$ | 12,000 | — | — | — | — | 12,000 | 12,014 | — | — | — | — | 12,014 | | At Expiration | | 0.66 | 0.66 | ||||||||||||||||||||||||||||||||||||||||||||||||||
Bank loans | ||||||||||||||||||||||||||||||||||||||||||||||||||||||||||||||||||||||
97.023.000-9 | CORPBANCA | Chile | UF | 17,631 | 52,893 | 105,837 | 34,774 | — | 211,135 | 18,510 | 52,892 | 104,385 | 34,635 | — | 210,422 | Quarterly | 4.18 | 4.18 | ||||||||||||||||||||||||||||||||||||||||||||||||||||
0-E | BLADEX | U.S.A. | US$ | — | 7,500 | 27,500 | 15,000 | — | 50,000 | 134 | 7,500 | 27,125 | 14,875 | — | 49,634 | Semiannual | 4.58 | 4.58 | ||||||||||||||||||||||||||||||||||||||||||||||||||||
0-E | DVB BANK SE | U.S.A. | US$ | — | — | 153,514 | — | — | 153,514 | 14 | — | 153,514 | — | — | 153,528 | Quarterly | 1.67 | 1.67 | ||||||||||||||||||||||||||||||||||||||||||||||||||||
97.036.000-K | SANTANDER | Chile | US$ | — | — | 226,712 | — | — | 226,712 | 650 | — | 226,712 | — | — | 227,362 | Quarterly | 2.24 | 2.24 | ||||||||||||||||||||||||||||||||||||||||||||||||||||
Obligations with the public | ||||||||||||||||||||||||||||||||||||||||||||||||||||||||||||||||||||||
0-E | BANK OF YORK | U.S.A. | US$ | — | — | — | 500,000 | — | 500,000 | 2,383 | — | — | 486,962 | — | 489,345 | | At Expiration | | 7.77 | 7.25 | ||||||||||||||||||||||||||||||||||||||||||||||||||
Guaranteed obligations | ||||||||||||||||||||||||||||||||||||||||||||||||||||||||||||||||||||||
0-E | CREDIT AGRICOLE | France | US$ | 29,633 | 88,188 | 204,722 | 54,074 | 12,410 | 389,027 | 30,447 | 88,189 | 203,286 | 54,074 | 12,410 | 388,406 | Quarterly | 1.83 | 1.66 | ||||||||||||||||||||||||||||||||||||||||||||||||||||
0-E | BNP PARIBAS | U.S.A. | US$ | 8,162 | 25,012 | 70,785 | 75,028 | 140,410 | 319,397 | 9,243 | 25,012 | 70,335 | 74,917 | 140,407 | 319,914 | Quarterly | 2.29 | 2.22 | ||||||||||||||||||||||||||||||||||||||||||||||||||||
0-E | WELLS FARGO | U.S.A. | US$ | 30,895 | 93,511 | 255,536 | 264,770 | 536,039 | 1,180,751 | 34,933 | 93,511 | 227,704 | 252,054 | 525,257 | 1,133,459 | Quarterly | 2.27 | 1.57 | ||||||||||||||||||||||||||||||||||||||||||||||||||||
0-E | WILMINGTON TRUST | U.S.A. | US$ | — | 48,264 | 85,183 | 90,694 | 451,555 | 675,696 | 5,691 | 48,263 | 81,867 | 88,977 | 448,016 | 672,814 | Quarterly | 4.25 | 4.25 | ||||||||||||||||||||||||||||||||||||||||||||||||||||
0-E | CITIBANK | U.S.A. | US$ | 17,042 | 51,792 | 143,168 | 150,792 | 254,208 | 617,002 | 18,545 | 51,792 | 133,740 | 146,362 | 249,406 | 599,845 | Quarterly | 2.40 | 1.64 | ||||||||||||||||||||||||||||||||||||||||||||||||||||
97.036.000-K | SANTANDER | Chile | US$ | 5,233 | 15,862 | 43,552 | 45,416 | 49,606 | 159,669 | 5,514 | 15,862 | 41,434 | 44,599 | 49,281 | 156,690 | Quarterly | 1.47 | 0.93 | ||||||||||||||||||||||||||||||||||||||||||||||||||||
0-E | BTMU | U.S.A. | US$ | 2,714 | 8,250 | 22,801 | 24,007 | 39,182 | 96,954 | 2,897 | 8,250 | 21,336 | 23,376 | 38,789 | 94,648 | Quarterly | 1.82 | 1.22 | ||||||||||||||||||||||||||||||||||||||||||||||||||||
0-E | APPLE BANK | U.S.A. | US$ | 1,333 | 4,055 | 11,211 | 11,828 | 19,715 | 48,142 | 1,478 | 4,056 | 10,483 | 11,513 | 19,515 | 47,045 | Quarterly | 1.72 | 1.12 | ||||||||||||||||||||||||||||||||||||||||||||||||||||
0-E | US BANK | U.S.A. | US$ | 14,483 | 43,948 | 120,924 | 126,550 | 285,134 | 591,039 | 17,232 | 43,948 | 102,607 | 117,968 | 277,195 | 558,950 | Quarterly | 3.99 | 2.81 | ||||||||||||||||||||||||||||||||||||||||||||||||||||
0-E | DEUTSCHE BANK | U.S.A. | US$ | 4,767 | 14,667 | 32,449 | 25,826 | 58,989 | 136,698 | 5,342 | 14,666 | 32,448 | 25,826 | 58,989 | 137,271 | Quarterly | 3.40 | 3.40 | ||||||||||||||||||||||||||||||||||||||||||||||||||||
0-E | NATIXIS | France | US$ | 11,698 | 35,914 | 97,434 | 83,289 | 241,088 | 469,423 | 12,351 | 35,914 | 97,434 | 83,289 | 241,088 | 470,076 | Quarterly | 2.08 | 2.05 | ||||||||||||||||||||||||||||||||||||||||||||||||||||
0-E | HSBC | U.S.A. | US$ | 1,374 | 4,180 | 11,533 | 12,112 | 24,384 | 53,583 | 1,504 | 4,180 | 11,533 | 12,112 | 24,384 | 53,713 | Quarterly | 2.40 | 1.59 | ||||||||||||||||||||||||||||||||||||||||||||||||||||
0-E | PK AIRFINANCE | U.S.A. | US$ | 1,882 | 5,846 | 17,171 | 19,744 | 17,871 | 62,514 | 1,937 | 5,846 | 17,171 | 19,744 | 17,871 | 62,569 | Monthly | 2.04 | 2.04 | ||||||||||||||||||||||||||||||||||||||||||||||||||||
0-E | KFW IPEX-BANK | Germany | US$ | 653 | 2,028 | 5,314 | 3,958 | 1,640 | 13,593 | 655 | 2,028 | 5,314 | 3,958 | 1,640 | 13,595 | Quarterly | 2.45 | 2.45 | ||||||||||||||||||||||||||||||||||||||||||||||||||||
— | SWAP Aviones llegados | — | US$ | 502 | 1,360 | 2,521 | 765 | — | 5,148 | 502 | 1,360 | 2,521 | 765 | — | 5,148 | Quarterly | — | — | ||||||||||||||||||||||||||||||||||||||||||||||||||||
Other guaranteed obligations |
| |||||||||||||||||||||||||||||||||||||||||||||||||||||||||||||||||||||
0-E | DVB BANK SE | U.S.A. | US$ | 8,054 | 24,438 | — | — | — | 32,492 | 8,075 | 24,438 | — | — | — | 32,513 | Quarterly | 2.32 | 2.32 | ||||||||||||||||||||||||||||||||||||||||||||||||||||
Financial leases | ||||||||||||||||||||||||||||||||||||||||||||||||||||||||||||||||||||||
0-E | ING | U.S.A. | US$ | 8,108 | 23,191 | 36,868 | 26,831 | — | 94,998 | 8,894 | 23,191 | 36,066 | 26,682 | — | 94,833 | Quarterly | 5.13 | 4.57 | ||||||||||||||||||||||||||||||||||||||||||||||||||||
0-E | CREDIT AGRICOLE | France | US$ | 1,666 | 5,131 | 7,158 | — | — | 13,955 | 1,700 | 5,131 | 7,158 | — | — | 13,989 | Quarterly | 1.28 | 1.28 | ||||||||||||||||||||||||||||||||||||||||||||||||||||
0-E | CITIBANK | U.S.A. | US$ | 4,687 | 14,447 | 41,726 | 36,523 | — | 97,383 | 5,509 | 14,447 | 40,684 | 36,330 | — | 96,970 | Quarterly | 6.40 | 5.67 | ||||||||||||||||||||||||||||||||||||||||||||||||||||
0-E | PEFCO | U.S.A. | US$ | 15,246 | 46,858 | 108,403 | 22,407 | — | 192,914 | 16,536 | 46,858 | 106,757 | 22,324 | — | 192,475 | Quarterly | 5.37 | 4.77 | ||||||||||||||||||||||||||||||||||||||||||||||||||||
0-E | BNP PARIBAS | U.S.A. | US$ | 9,956 | 30,678 | 81,373 | 31,100 | — | 153,107 | 10,494 | 30,678 | 79,983 | 30,958 | — | 152,113 | Quarterly | 4.08 | 3.64 | ||||||||||||||||||||||||||||||||||||||||||||||||||||
0-E | WELLS FARGO | U.S.A. | US$ | 4,519 | 13,784 | 38,531 | 41,238 | 23,556 | 121,628 | 4,919 | 13,784 | 37,247 | 40,819 | 23,486 | 120,255 | Quarterly | 3.98 | 3.54 | ||||||||||||||||||||||||||||||||||||||||||||||||||||
0-E | DVB BANK SE | U.S.A. | US$ | 4,567 | 13,873 | 14,127 | — | — | 32,567 | 4,625 | 13,873 | 14,127 | — | — | 32,625 | Quarterly | 2.06 | 2.06 | ||||||||||||||||||||||||||||||||||||||||||||||||||||
0-E | BANC OF AMERICA | U.S.A. | US$ | 674 | 2,096 | — | — | — | 2,770 | 676 | 2,096 | — | — | — | 2,772 | Monthly | 1.41 | 1.41 | ||||||||||||||||||||||||||||||||||||||||||||||||||||
Other loans | ||||||||||||||||||||||||||||||||||||||||||||||||||||||||||||||||||||||
0-E | BOEING | U.S.A. | US$ | — | — | 151,362 | — | — | 151,362 | 2,294 | — | 151,363 | — | — | 153,657 | | At Expiration | | 1.80 | 1.80 | ||||||||||||||||||||||||||||||||||||||||||||||||||
0-E | CITIBANK (*) | U.S.A. | US$ | 19,361 | 60,251 | 174,178 | 196,210 | — | 450,000 | 20,485 | 60,251 | 174,178 | 192,932 | — | 447,846 | Quarterly | 6.00 | 6.00 | ||||||||||||||||||||||||||||||||||||||||||||||||||||
|
|
|
|
|
|
|
|
|
|
|
|
|
|
|
|
|
|
|
|
|
|
|
| |||||||||||||||||||||||||||||||||||||||||||||||
| Total | 611,840 | 738,017 | 2,291,593 | 1,892,936 | 2,155,787 | 7,690,173 | 641,578 | 738,016 | 2,218,512 | 1,846,051 | 2,127,734 | 7,571,891 | ||||||||||||||||||||||||||||||||||||||||||||||||||||||||||
|
|
|
|
|
|
|
|
|
|
|
|
|
|
|
|
|
|
|
|
|
|
|
| |||||||||||||||||||||||||||||||||||||||||||||||
| (*) | ||||||||||||||||||
|
|
|
|
|
| |||||||||||||
|
| |||||||||||||||||
| ||||||||||||||||||
| ||||||||||||||||||
| ||||||||||||||||||
|
| |||||||||||||||||
| ||||||||||||||||||
|
| |||||||||||||||||
| ||||||||||||||||||
| ||||||||||||||||||
| ||||||||||||||||||
| ||||||||||||||||||
| ||||||||||||||||||
| ||||||||||||||||||
| ||||||||||||||||||
| ||||||||||||||||||
| ||||||||||||||||||
| ||||||||||||||||||
| ||||||||||||||||||
| ||||||||||||||||||
|
| |||||||||||||||||
| ||||||||||||||||||
| ||||||||||||||||||
| ||||||||||||||||||
| ||||||||||||||||||
|
| |||||||||||||||||
| ||||||||||||||||||
| ||||||||||||||||||
| Securitized bond with the future flows from the sales with credit card in United States and Canada. | ||||||||||||||||||
Class of Liability | More than 90 days to one year | More than one to three years | More than three to five years | More than five years | Total accounting value | Amortization | Effective rate | Total nominal value | Nominal rate | |||||||||||||||||||||||||
| ThUS$ | ThUS$ | ThUS$ | ThUS$ | ThUS$ | % | ThUS$ | % | |||||||||||||||||||||||||||
Loans to export | — | — | — | — | 30,253 | Semiannual | 2.17 | % | 30,000 | 2.17 | % | |||||||||||||||||||||||
| — | — | — | — | 35,056 | Semiannual | 1.70 | % | 35,000 | 1.70 | % | ||||||||||||||||||||||||
| — | — | — | — | 75,084 | Quarterly | 1.32 | % | 75,000 | 1.32 | % | ||||||||||||||||||||||||
| — | — | — | — | 102,562 | Annual | 1.83 | % | 102,000 | 1.79 | % | ||||||||||||||||||||||||
Bank loans | — | 214,372 | — | — | 214,586 | — | 2.57 | % | 214,373 | 2.57 | % | |||||||||||||||||||||||
| 44,988 | (16 | ) | — | — | 44,972 | Semiannual | 1.76 | % | 44,848 | 1.74 | % | |||||||||||||||||||||||
Guaranteed obligations | 8,374 | 22,767 | 25,947 | 40,783 | 101,461 | Quarterly | 5.69 | % | 102,649 | 5.01 | % | |||||||||||||||||||||||
| 33,402 | 35,128 | 6,714 | — | 87,719 | Quarterly | 3.42 | % | 87,448 | 3.37 | % | ||||||||||||||||||||||||
| 10,696 | 20,126 | 12,764 | 18,079 | 65,494 | Quarterly | 4.96 | % | 66,148 | 4.41 | % | ||||||||||||||||||||||||
| 41,635 | 113,648 | 128,765 | 145,224 | 444,700 | Quarterly | 4.15 | % | 451,090 | 3.67 | % | ||||||||||||||||||||||||
| 119,458 | 284,423 | 313,700 | 1,109,926 | 1,872,616 | Quarterly | 2.57 | % | 1,959,463 | 1.76 | % | ||||||||||||||||||||||||
| 28,406 | 73,422 | 81,588 | 205,727 | 399,854 | Quarterly | 2.71 | % | 409,908 | 2.10 | % | ||||||||||||||||||||||||
| 14,919 | 37,798 | 41,117 | 115,293 | 214,435 | Quarterly | 1.39 | % | 220,449 | 0.85 | % | ||||||||||||||||||||||||
| 7,638 | 19,070 | 21,177 | 73,289 | 123,920 | Quarterly | 1.73 | % | 128,222 | 1.13 | % | ||||||||||||||||||||||||
| 3,748 | 9,347 | 10,401 | 36,497 | 61,411 | Quarterly | 1.71 | % | 63,480 | 1.11 | % | ||||||||||||||||||||||||
| 9,602 | 23,088 | 25,860 | 103,278 | 165,394 | Quarterly | 1.97 | % | 172,789 | 1.26 | % | ||||||||||||||||||||||||
| 5,974 | 14,360 | 16,085 | 63,870 | 102,662 | Quarterly | 1.98 | % | 107,072 | 1.27 | % | ||||||||||||||||||||||||
| 12,813 | 36,339 | 39,791 | 96,906 | 190,813 | Quarterly | 3.35 | % | 190,000 | 3.35 | % | ||||||||||||||||||||||||
| 2,316 | 5,158 | 3,549 | 1,916 | 13,754 | — | — | 13,754 | — | ||||||||||||||||||||||||||
Financial leases | 16,076 | 35,155 | 25,431 | 1,841 | 85,670 | Quarterly | 3.71 | % | 85,491 | 3.42 | % | |||||||||||||||||||||||
| 14,191 | 29,145 | 30,216 | 25,486 | 103,869 | Quarterly | 1.32 | % | 103,684 | 1.29 | % | ||||||||||||||||||||||||
| 4,164 | 11,481 | 13,237 | 14,995 | 45,480 | Quarterly | 6.38 | % | 46,086 | 5.65 | % | ||||||||||||||||||||||||
| 5,638 | — | — | — | 7,466 | Quarterly | 1.31 | % | 7,462 | 1.31 | % | ||||||||||||||||||||||||
| 36,603 | 100,514 | 110,981 | 49,360 | 311,418 | Quarterly | 5.29 | % | 314,261 | 4.70 | % | ||||||||||||||||||||||||
Other loans | 1,829 | 146,190 | — | — | 148,582 | — | 1.86 | % | 146,189 | 1.86 | % | |||||||||||||||||||||||
| 10,706 | 29,472 | 14,638 | — | 58,340 | Quarterly | 2.08 | % | 58,960 | 2.08 | % | ||||||||||||||||||||||||
|
|
|
|
|
|
|
|
|
|
|
| |||||||||||||||||||||||
| 433,176 | 1,260,987 | 921,961 | 2,102,470 | 5,107,571 | 5,235,826 | |||||||||||||||||||||||||||||
|
|
|
|
|
|
|
|
|
|
|
| |||||||||||||||||||||||
Interest-bearing loans due in installments to December 31, 2012, at accounting value2015
Debtor: TAM S.A. and Subsidiaries, Tax No. 02.012.862/0001-60, Brazil.
| Nominal values | Accounting values | |||||||||||||||||||||||||||||||||||||||||||||||||||||||||||||||||||||
| Tax No. | Creditor | Creditor country | Currency | Up to 90 days | More than 90 days to one year | More than one to three years | More than three to five years | More than five years | Total nominal value | Up to 90 days | More than 90 days to one year | More than one to three years | More than three to five years | More than five years | Total accounting value | Amortization | Effective rate | Nominal rate | ||||||||||||||||||||||||||||||||||||||||||||||||||||
| ThUS$ | ThUS$ | ThUS$ | ThUS$ | ThUS$ | ThUS$ | ThUS$ | ThUS$ | ThUS$ | ThUS$ | ThUS$ | ThUS$ | % | % | |||||||||||||||||||||||||||||||||||||||||||||||||||||||||
Bank loans | ||||||||||||||||||||||||||||||||||||||||||||||||||||||||||||||||||||||
0-E | NEDER LANDS CHE | |||||||||||||||||||||||||||||||||||||||||||||||||||||||||||||||||||||
| CREDIETVER ZEKER ING MAATSCHAPPIJ | Holland | US$ | 115 | 356 | 1,031 | 1,162 | 689 | 3,353 | 132 | 356 | 1,031 | 1,162 | 689 | 3,370 | Monthly | 6.01 | 6.01 | |||||||||||||||||||||||||||||||||||||||||||||||||||||
Obligations with the public |
| |||||||||||||||||||||||||||||||||||||||||||||||||||||||||||||||||||||
0-E | THE BANK OF NEW YORK | U.S.A. | US$ | — | — | 300,000 | — | 500,000 | 800,000 | 7,506 | 1,110 | 301,722 | 5,171 | 501,027 | 816,536 | | At Expiration | | 8.17 | 8.00 | ||||||||||||||||||||||||||||||||||||||||||||||||||
Financial leases | ||||||||||||||||||||||||||||||||||||||||||||||||||||||||||||||||||||||
0-E | AFS INVESTMENT IX LLC | U.S.A. | US$ | 1,972 | 6,085 | 17,540 | 17,908 | — | 43,505 | 2,176 | 6,085 | 17,540 | 17,908 | — | 43,709 | Monthly | 1.25 | 1.25 | ||||||||||||||||||||||||||||||||||||||||||||||||||||
0-E | AIRBUS FINANCIAL | U.S.A. | US$ | 3,370 | 10,397 | 20,812 | 15,416 | — | 49,995 | 3,461 | 10,396 | 20,813 | 15,416 | — | 50,086 | Monthly | 1.43 | 1.43 | ||||||||||||||||||||||||||||||||||||||||||||||||||||
0-E | CREDIT AGRICOLE-CIB | U.S.A. | US$ | 4,500 | — | — | — | — | 4,500 | 4,528 | — | — | — | — | 4,528 | Quarterly | 3.25 | 3.25 | ||||||||||||||||||||||||||||||||||||||||||||||||||||
0-E | DVB BANK SE | U.S.A. | US$ | 118 | 355 | 282 | — | — | 755 | 120 | 355 | 282 | — | — | 757 | Monthly | 1.64 | 1.64 | ||||||||||||||||||||||||||||||||||||||||||||||||||||
0-E | GENERAL ELECTRIC CAPITAL CORPORATION | U.S.A. | US$ | 3,654 | 11,137 | 8,970 | — | — | 23,761 | 3,697 | 11,137 | 8,970 | — | — | 23,804 | Monthly | 1.25 | 1.25 | ||||||||||||||||||||||||||||||||||||||||||||||||||||
0-E | KFW IPEX-BANK | Germany | US$ | 3,097 | 6,401 | 15,186 | 12,215 | — | 36,899 | 3,163 | 6,401 | 15,186 | 12,215 | — | 36,965 | | Monthly/ Quarterly | 1.72 | 1.72 | |||||||||||||||||||||||||||||||||||||||||||||||||||
0-E | NATIXIS | France | US$ | 2,505 | 5,387 | 17,359 | 19,682 | 70,087 | 115,020 | 3,476 | 5,387 | 17,360 | 19,682 | 70,088 | 115,993 | | Quarterly/ Semiannual | 3.85 | 3.85 | |||||||||||||||||||||||||||||||||||||||||||||||||||
0-E | PK AIR FINANCE US, INC. | U.S.A. | US$ | 1,276 | 21,769 | — | — | — | 23,045 | 1,316 | 21,769 | — | — | — | 23,085 | Monthly | 1.75 | 1.75 | ||||||||||||||||||||||||||||||||||||||||||||||||||||
0-E | WACAPOU LEASING S.A. | Luxemburg | US$ | 383 | 1,101 | 2,617 | 14,267 | — | 18,368 | 418 | 1,101 | 2,617 | 14,267 | — | 18,403 | Quarterly | 2.00 | 2.00 | ||||||||||||||||||||||||||||||||||||||||||||||||||||
0-E | SOCIÉTÉ GÉNÉRALE MILAN BRANCH | Italy | US$ | 8,148 | 25,003 | 71,311 | 208,024 | — | 312,486 | 9,552 | 25,003 | 71,311 | 208,024 | — | 313,890 | Quarterly | 3.63 | 3.55 | ||||||||||||||||||||||||||||||||||||||||||||||||||||
0-E | BANCO IBM S.A | Brazil | BRL | 217 | 651 | 860 | — | — | 1,728 | 217 | 651 | 860 | — | — | 1,728 | Monthly | 14.14 | 14.14 | ||||||||||||||||||||||||||||||||||||||||||||||||||||
0-E | HP FINANCIAL SERVICE | Brazil | BRL | 168 | 529 | 185 | — | — | 882 | 169 | 529 | 185 | — | — | 883 | Monthly | 10.02 | 10.02 | ||||||||||||||||||||||||||||||||||||||||||||||||||||
0-E | SOCIETE GENERALE | France | BRL | 85 | 256 | 434 | — | — | 775 | 85 | 256 | 434 | — | — | 775 | Monthly | 14.14 | 14.14 | ||||||||||||||||||||||||||||||||||||||||||||||||||||
|
|
|
|
|
|
|
|
|
|
|
|
|
|
|
|
|
|
|
|
|
|
|
| |||||||||||||||||||||||||||||||||||||||||||||||
| Total | 29,608 | 89,427 | 456,587 | 288,674 | 570,776 | 1,435,072 | 40,016 | 90,536 | 458,311 | 293,845 | 571,804 | 1,454,512 | ||||||||||||||||||||||||||||||||||||||||||||||||||||||||||
|
|
|
|
|
|
|
|
|
|
|
|
|
|
|
|
|
|
|
|
|
|
|
| |||||||||||||||||||||||||||||||||||||||||||||||
| Total consolidated | 641,448 | 827,444 | 2,748,180 | 2,181,610 | 2,726,563 | 9,125,245 | 681,594 | 828,552 | 2,676,823 | 2,139,896 | 2,699,538 | 9,026,403 | ||||||||||||||||||||||||||||||||||||||||||||||||||||||||||
|
|
|
|
|
|
|
|
|
|
|
|
|
|
|
|
|
|
|
|
|
|
|
| |||||||||||||||||||||||||||||||||||||||||||||||
| (b) | ||||||||||||||||||
|
|
|
|
|
| |||||||||||||
|
| |||||||||||||||||
| ||||||||||||||||||
| ||||||||||||||||||
| ||||||||||||||||||
| ||||||||||||||||||
| ||||||||||||||||||
| ||||||||||||||||||
| ||||||||||||||||||
| ||||||||||||||||||
|
| |||||||||||||||||
| ||||||||||||||||||
|
| |||||||||||||||||
| ||||||||||||||||||
| ||||||||||||||||||
| ||||||||||||||||||
| ||||||||||||||||||
| ||||||||||||||||||
| ||||||||||||||||||
| ||||||||||||||||||
| ||||||||||||||||||
| ||||||||||||||||||
| ||||||||||||||||||
| ||||||||||||||||||
| ||||||||||||||||||
| ||||||||||||||||||
| ||||||||||||||||||
| ||||||||||||||||||
| ||||||||||||||||||
| ||||||||||||||||||
| ||||||||||||||||||
| ||||||||||||||||||
| ||||||||||||||||||
| ||||||||||||||||||
| ||||||||||||||||||
| ||||||||||||||||||
| ||||||||||||||||||
| ||||||||||||||||||
|
| |||||||||||||||||
| ||||||||||||||||||
| ||||||||||||||||||
| Hedge derivatives | ||||||||||||||||||
Class of Liability | More than 90 days to one year | More than one to three years | More than three to five years | More than five years | Total accounting value | Amortization | Effective rate | Total nominal value | Nominal rate | |||||||||||||||||||||
| ThUS$ | ThUS$ | ThUS$ | ThUS$ | ThUS$ | % | ThUS$ | % | |||||||||||||||||||||||
Bank loans | 63,747 | — | — | — | 64,480 | Quarterly | 2.81% | 50,322 | 2.81% | |||||||||||||||||||||
| 5,684 | — | — | — | 30,419 | At Expiration | 4.03% | 29,986 | 4.03% | ||||||||||||||||||||||
| 111,073 | — | — | — | 152,517 | At Expiration | 5.35% | 151,980 | 5.35% | ||||||||||||||||||||||
| — | — | — | — | 336 | Semiannual | 10.72% | 92 | 10.72% | ||||||||||||||||||||||
| 119,711 | — | — | — | 166,916 | At Expiration | 5.65% | 163,391 | 5.65% | ||||||||||||||||||||||
| 14,560 | 748 | — | — | 32,596 | Monthly/ At Expiration | 7,69%/4,01% | 32,446 | 7,69%/4,01% | ||||||||||||||||||||||
| 28 | — | — | — | 78 | Monthly | 8.94% | 88 | 8.94% | ||||||||||||||||||||||
| 27,506 | — | — | — | 27,506 | At Expiration | 3.34% | 27,484 | 3.34% | ||||||||||||||||||||||
| 298 | 861 | 971 | 2,382 | 4,674 | Monthly | 0.96% | 4,608 | 0.95% | ||||||||||||||||||||||
Obligations with the public | 9,652 | 6,720 | 306,771 | 810,349 | 1,146,251 | At Expiration | 8.60% | 1,100,000 | 8.41% | |||||||||||||||||||||
| 220,210 | — | — | — | 251,271 | Semiannual | 8.96% | 244,678 | 8.56% | ||||||||||||||||||||||
Financial leases | 5,140 | 14,816 | 16,580 | 26,925 | 66,032 | Monthly | N/ A | 65,127 | N/ A | |||||||||||||||||||||
| 9,350 | — | — | — | 12,871 | Monthly | N/ A | 12,750 | N/ A | ||||||||||||||||||||||
| 8,819 | 25,357 | 27,070 | 22,925 | 87,409 | Monthly | 2.25% | 87,033 | 2.25% | ||||||||||||||||||||||
| 8,975 | 5,651 | — | — | 18,588 | Monthly | N/ A | 17,617 | N/ A | ||||||||||||||||||||||
| 1,699 | 4,939 | 5,609 | 11,535 | 24,479 | Quarterly | 1.50% | 24,326 | 1.50% | ||||||||||||||||||||||
| 7,237 | 17,064 | 17,384 | 43,929 | 88,109 | Quarterly | 3.84% | 87,986 | 3.84% | ||||||||||||||||||||||
| 41,043 | 82,593 | 81,129 | 234,657 | 451,201 | Quarterly | 3.69% | 451,284 | 3.69% | ||||||||||||||||||||||
| 12,683 | 67,629 | 10,627 | 19,689 | 115,493 | Quarterly | 2.29% | 114,810 | 2.29% | ||||||||||||||||||||||
| 47,894 | 126,929 | 121,392 | 182,562 | 497,986 | Quarterly/ Semiannual | 2,01%/0,82% | 494,721 | 2,01%/0,37% | ||||||||||||||||||||||
| 9,375 | 25,000 | — | — | 37,570 | Quarterly | 2.89% | 37,500 | 2.89% | ||||||||||||||||||||||
| 1,369 | 2,821 | 756 | — | 5,420 | Monthly | 2.25% | 5,402 | 2.25% | ||||||||||||||||||||||
| 19,967 | 50,876 | — | — | 81,379 | Monthly | 2.59% | 81,086 | 2.59% | ||||||||||||||||||||||
| 3,887 | 10,713 | 11,249 | 42,334 | 69,596 | Quarterly | 1.70% | 69,458 | 0.85% | ||||||||||||||||||||||
| 11,343 | 32,226 | 23,605 | 26,888 | 98,111 | Monthly/ Quarterly | 2,11%/2,21% | 97,770 | 2,11%/2,21% | ||||||||||||||||||||||
| 20,421 | 59,579 | 66,989 | 163,464 | 319,002 | Quarterly/ Semiannual | 2,62%/3,32% | 316,425 | 2,62%/3,32% | ||||||||||||||||||||||
| 8,080 | 23,530 | 36,373 | 46,500 | 117,520 | Monthly | 1.96% | 117,092 | 1.96% | ||||||||||||||||||||||
| 1,417 | 3,370 | 2,847 | 15,018 | 23,844 | Quarterly | 2.42% | 23,647 | 2.42% | ||||||||||||||||||||||
| 5,308 | 3,194 | — | — | 10,300 | Monthly | 1.98% | 10,271 | 1.98% | ||||||||||||||||||||||
| 34,574 | 90,164 | 91,964 | 151,968 | 381,847 | Quarterly | 1.95% | 380,025 | 1.95% | ||||||||||||||||||||||
| 1,533 | 4,205 | 4,390 | 8,798 | 19,544 | Quarterly | 0.88% | 19,431 | 0.08% | ||||||||||||||||||||||
| 302 | 939 | — | — | 1,344 | Monthly | 7.51% | 2,025 | 7.51% | ||||||||||||||||||||||
| 1,585 | 102 | — | — | 2,192 | Monthly | 10.58% | 2,255 | 10.58% | ||||||||||||||||||||||
| 13 | — | — | — | 50 | Monthly | 5.31% | 53 | 5.31% | ||||||||||||||||||||||
| 472 | 81 | — | — | 711 | Monthly | 9.08% | 747 | 9.08% | ||||||||||||||||||||||
| 35 | 1,148 | — | — | 1,785 | Monthly | 6.82% | 1,572 | 6.82% | ||||||||||||||||||||||
| — | — | — | — | 1,534 | Monthly | 0.00% | 2,520 | 0.00% | ||||||||||||||||||||||
Others loans | 9,143 | — | — | — | 41,025 | Monthly | 2.20% | 41,025 | 2.20% | |||||||||||||||||||||
|
|
|
|
|
|
|
|
|
|
|
| |||||||||||||||||||
| 844,133 | 661,255 | 825,706 | 1,809,923 | 4,451,986 | 4,369,033 | |||||||||||||||||||||||||
|
|
|
|
|
|
|
|
|
|
|
| |||||||||||||||||||
| 1,277,309 | 1,922,242 | 1,747,667 | 3,912,393 | 9,559,557 | 9,604,859 | |||||||||||||||||||||||||
|
|
|
|
|
|
|
|
|
|
|
| |||||||||||||||||||
Summary of other financial non-current loans (other than bank loans, obligations with the public and financial leases)
| As of December 31, 2013 | As of December 31, 2012 | |||||||
| ThUS$ | ThUS$ | |||||||
Current | ||||||||
a) Other interest bearing loans (see note 21 a) | 33,481 | 57,647 | ||||||
b) Derivative not recognized as a hedge (see note 21 b) | 4,040 | 4,477 | ||||||
c) Hedge derivatives (see note 21 c) | 66,466 | 65,598 | ||||||
|
|
|
| |||||
Total currents | 103,987 | 127,722 | ||||||
|
|
|
| |||||
Non-current | ||||||||
a) Other interest bearing loans (see note 21 a) | 620,838 | 190,300 | ||||||
b) Derivative not recognized as a hedge (see note 21 b) | 1,491 | 5,515 | ||||||
c) Hedge derivatives (see note 21 c) | 54,906 | 111,040 | ||||||
|
|
|
| |||||
Total non-currents | 677,235 | 306,855 | ||||||
|
|
|
| |||||
(b) Derivatives not recognized as a hedge.
Derivatives not recognized as a hedge as of December 31, 2013 and December 31, 2012, respectively, is as follows:
| As of December 31, 2013 | As of December 31, 2012 | |||||||
| ThUS$ | ThUS$ | |||||||
Current | ||||||||
Interest rate derivative not recognized as a hedge | 4,040 | 4,477 | ||||||
|
|
|
| |||||
Total current | 4,040 | 4,477 | ||||||
|
|
|
| |||||
Non-current | ||||||||
Interest rate derivative not recognized as a hedge | 1,491 | 5,515 | ||||||
|
|
|
| |||||
Total non-current | 1,491 | 5,515 | ||||||
|
|
|
| |||||
Total other financial liabilities | 5,531 | 9,992 | ||||||
|
|
|
| |||||
(c) Hedge derivatives
Hedge derivatives as of December 31, 2013 and December 31, 2012 are as follows:
| As of December 31, 2013 | As of December 31, 2012 | |||||||
| ThUS$ | ThUS$ | |||||||
Current | ||||||||
Accrued interest from the last date of interest rate swap | 5,775 | 4,660 | ||||||
Fair value of interest rate derivatives | 32,070 | 37,076 | ||||||
Fair value of fuel derivatives | — | 10,502 | ||||||
Fair value of foreign currency derivatives | 28,621 | 13,360 | ||||||
|
|
|
| |||||
Total current | 66,466 | 65,598 | ||||||
|
|
|
| |||||
Non-current | ||||||||
Fair value of interest rate derivatives | 54,906 | 104,547 | ||||||
Fair value of fuel derivatives | — | 4,530 | ||||||
Fair value of foreign currency derivatives | — | 1,963 | ||||||
|
|
|
| |||||
Total non-current | 54,906 | 111,040 | ||||||
|
|
|
| |||||
Total hedging liabilities | 121,372 | 176,638 | ||||||
|
|
|
| |||||
| Current liabilities | Non-current liabilities | Total hedge derivatives | ||||||||||||||||||||||
| As of December 31, 2016 | As of December 31, 2015 | As of December 31, 2016 | As of December 31, 2015 | As of December 31, 2016 | As of December 31, 2015 | |||||||||||||||||||
| ThUS$ | ThUS$ | ThUS$ | ThUS$ | ThUS$ | ThUS$ | |||||||||||||||||||
Accrued interest from the last date of interest rate swap | 2,148 | 4,329 | — | — | 2,148 | 4,329 | ||||||||||||||||||
Fair value of interest rate derivatives | 9,578 | 33,518 | 6,679 | 16,128 | 16,257 | 49,646 | ||||||||||||||||||
Fair value of fuel derivatives | — | 56,424 | — | — | — | 56,424 | ||||||||||||||||||
Fair value of foreign currency derivative | 13,155 | 39,818 | — | — | 13,155 | 39,818 | ||||||||||||||||||
|
|
|
|
|
|
|
|
|
|
|
| |||||||||||||
Total hedge derivatives | 24,881 | 134,089 | 6,679 | 16,128 | 31,560 | 150,217 | ||||||||||||||||||
|
|
|
|
|
|
|
|
|
|
|
| |||||||||||||
The foreign currency derivatives exchangeexchanges are collarsFX forward and cross currency swap.
Hedging operation
The fair values of net assets/(liabilities), by type of derivative, of the contracts held as hedging instruments are presented below:
| As of | As of | |||||||
| December 31, | December 31, | |||||||
| 2013 | 2012 | |||||||
| ThUS$ | ThUS$ | |||||||
Cross currency swaps (CCS) (1) | (26,028 | ) | — | |||||
Interest rate options (2) | 6 | 6 | ||||||
Interest rate swaps (3) | (92,088 | ) | (146,283 | ) | ||||
Fuel collars (4) | 1,878 | (911 | ) | |||||
Fuel swap (5) | 13,990 | (9,000 | ) | |||||
Currency forward R$/US$ (6) | 32,058 | — | ||||||
Currency forward CLP/US$ (7) | (1,121 | ) | — | |||||
Currency collars (8) | (1,652 | ) | (15,228 | ) | ||||
| As of | As of | |||||||
| December 31, | December 31, | |||||||
| 2016 | 2015 | |||||||
| ThUS$ | ThUS$ | |||||||
Cross currency swaps (CCS) (1) | (12,286 | ) | (49,311 | ) | ||||
Interest rate swaps (2) | (16,926 | ) | (44,085 | ) | ||||
Fuel options (3) | 10,088 | (50,131 | ) | |||||
Currency forward—options US$/GBP$ (4) | 618 | 7,432 | ||||||
Currency forward—options US$/EUR$ (4) | 109 | 1,438 | ||||||
Currency options R$/US$ (4) | (1,752 | ) | 933 | |||||
Currency options CLP/US$ (4) | — | 85 | ||||||
| (1) | Covers the significant variations in cash flows associated with market risk implicit in the changes in the 3-month LIBOR interest rate and the exchange rate |
| (2) |
| Covers the significant variations in cash flows associated with market risk implicit in the increases in the 3 months LIBOR interest rates for long-term loans incurred in the acquisition of aircraft and bank loans. These contracts are recorded as cash flow hedges. |
| Covers significant variations in cash flows associated with market risk implicit in the changes in the price of future fuel purchases. These contracts are recorded as cash flow hedges. |
| Covers the foreign exchange risk exposure of operating cash flows caused mainly by fluctuations in the exchange rate R$/US$ |
During the periods presented, the Company only maintains cash flow hedges.hedges and fair value (in the case of CCS). In the case of fuel hedges, the cash flows subject to saidsuch hedges will impact results in the next 6six months from the consolidated statement of financial position date, where asmeanwhile in the case of interest rate hedging, the hedges will impact results over the life of the related loans, which are valid initially for 12 years. The hedges on investments will impact results continuously throughout the life of the investment, (up to 3 months), while the cash flows occur at the maturity of the investment. In the case of currency hedges through a CCS, are generated two types of hedge accounting, a cash flow component by US$/UF and US$/BRL, and other fair value by US$ floating rate component.
During the periods presented, there have not occurredno hedging operations of future highly probable transaction that have not been realized.
During the periods presented, there has been hedge ineffectiveness recognized in the consolidated statement of income, for currency collars.realized have occurred.
Since none of the coverage resulted in the recognition of a non-financial asset, no portion of the result of the derivatives recognized in equity was transferred to the initial value of such assets.
The amounts recognized in comprehensive income during the period and transferred from net equity to income are as follows:
| For the periods ended | ||||||||||||
| December 31, | ||||||||||||
| 2013 | 2012 | 2011 | ||||||||||
| ThUS$ | ThUS$ | ThUS$ | ||||||||||
Debit (credit) recognized in comprehensive income during the period | 128,166 | (2,510 | ) | (40,368 | ) | |||||||
Debit (credit) transferred from net equity to income during the period | (18,688 | ) | (26,470 | ) | 62 | |||||||
| For the period ended | ||||||||||||
| December 31, | ||||||||||||
| 2016 | 2015 | 2014 | ||||||||||
| ThUS$ | ThUS$ | ThUS$ | ||||||||||
Debit (credit) recognized in comprehensive income during the period | 127,390 | 80,387 | (163,993 | ) | ||||||||
Debit (credit) transferred from net equity to income during the period | (113,403 | ) | (151,244 | ) | (151,520 | ) | ||||||
NOTE 2220 - TRADE AND OTHER ACCOUNTS PAYABLES
The composition of Trade and other accounts payables is as follows:
| As of | As of | As of | As of | |||||||||||||
| December 31, | December 31, | December 31, | December 31, | |||||||||||||
| 2013 | 2012 | 2016 | 2015 | |||||||||||||
| ThUS$ | ThUS$ | ThUS$ | ThUS$ | |||||||||||||
Current | ||||||||||||||||
(a) Trade and other accounts payables | 1,264,395 | 1,403,546 | 1,117,926 | 1,025,574 | ||||||||||||
(b) Accrued liabilities at the reporting date | 293,341 | 286,444 | 475,142 | 458,383 | ||||||||||||
|
|
|
| |||||||||||||
Total trade and other accounts payables | 1,557,736 | 1,689,990 | 1,593,068 | 1,483,957 | ||||||||||||
|
|
|
| |||||||||||||
(a) Trade and other accounts payable as of December 31, 2013 and December 31, 2012 are as follows:
| (a) | Trade and other accounts payable: |
| As of | As of | |||||||
| December 31, | December 31, | |||||||
| 2013 | 2012 | |||||||
| ThUS$ | ThUS$ | |||||||
Trade creditors | 969,260 | 1,069,345 | ||||||
Leasing obligation | 44,756 | 30,818 | ||||||
Other accounts payable (*) | 250,379 | 303,383 | ||||||
|
|
|
| |||||
Total | 1,264,395 | 1,403,546 | ||||||
|
|
|
| |||||
Trade creditors Leasing obligation Other accounts payable Total As of As of December 31, December 31, 2016 2015 ThUS$ ThUS$ 868,833 758,783 10,446 18,784 238,647 248,007 1,117,926 1,025,574
The details of Trade and other accounts payables are as follows:
| As of | As of | As of | As of | |||||||||||||
| December 31, | December 31, | December 31, | December 31, | |||||||||||||
| 2013 | 2012 | 2016 | 2015 | |||||||||||||
| ThUS$ | ThUS$ | ThUS$ | ThUS$ | |||||||||||||
Aircraft Fuel | 302,419 | 360,618 | 188,276 | 148,612 | ||||||||||||
Boarding Fee | 217,389 | 182,185 | 149,880 | 175,900 | ||||||||||||
Airport charges and overflight | 90,327 | 94,139 | ||||||||||||||
Handling and ground handling | 87,406 | 88,629 | ||||||||||||||
Other personnel expenses | 117,418 | 134,357 | 81,632 | 72,591 | ||||||||||||
Airport charges and overflight | 98,560 | 125,402 | ||||||||||||||
Professional services and advisory | 79,270 | 63,302 | ||||||||||||||
Land services | 74,260 | 80,387 | ||||||||||||||
Marketing | 61,053 | 45,997 | ||||||||||||||
Services on board | 44,589 | 32,993 | ||||||||||||||
Leases, maintenance and IT services | 44,287 | 25,558 | ||||||||||||||
Suppliers’ technical purchases | 67,995 | 64,981 | 40,305 | 52,160 | ||||||||||||
Professional services and advisory | 63,082 | 46,934 | ||||||||||||||
Marketing | 50,009 | 51,360 | ||||||||||||||
Handling and ground handling | 48,797 | 49,738 | ||||||||||||||
Land services | 47,046 | 38,436 | ||||||||||||||
Leases, maintenance and IT services | 46,163 | 34,903 | ||||||||||||||
Crew | 29,074 | 23,834 | ||||||||||||||
Maintenance | 25,962 | 18,573 | ||||||||||||||
Achievement of goals | 17,801 | 15,386 | ||||||||||||||
Distribution system | 15,710 | 17,531 | ||||||||||||||
Airlines | 13,264 | 3,890 | ||||||||||||||
Aircraft and engines leasing | 44,756 | 84,729 | 10,446 | 19,146 | ||||||||||||
Services on board | 29,940 | 26,674 | ||||||||||||||
U.S.A. Department of Justice (**) | 18,290 | 18,387 | ||||||||||||||
Maintenance | 15,793 | 5,305 | ||||||||||||||
Tax recovery program (*) | 14,569 | 19,668 | ||||||||||||||
Crew | 14,040 | 16,233 | ||||||||||||||
Aviation insurance | 10,665 | 7,465 | 7,694 | 7,655 | ||||||||||||
Achievement of goals | 9,806 | 5,024 | ||||||||||||||
Airlines | 5,054 | 9,362 | ||||||||||||||
Communications | 4,578 | 4,948 | 7,500 | 6,731 | ||||||||||||
Distribution sistem | 3,103 | 1,389 | ||||||||||||||
Fleet (JOL) | — | 59,181 | ||||||||||||||
SEC agreement (*) | 4,719 | — | ||||||||||||||
Others | 34,923 | 56,267 | 44,471 | 32,560 | ||||||||||||
|
|
|
| |||||||||||||
Total trade and other accounts payables | 1,264,395 | 1,403,546 | 1,117,926 | 1,025,574 | ||||||||||||
|
|
|
| |||||||||||||
| (*) |
(b) The liabilities accrued atAs of December 31, 2013 and December 31, 2012, are as follows:2016, the balance payable to the SEC is ThUS $ 4,719.
| (b) | Liabilities accrued: |
| As of | As of | As of | As of | |||||||||||||
| December 31, | December 31, | December 31, | December 31, | |||||||||||||
| 2013 | 2012 | 2016 | 2015 | |||||||||||||
| ThUS$ | ThUS$ | ThUS$ | ThUS$ | |||||||||||||
Aircraft and engine maintenance | 244,949 | 246,454 | ||||||||||||||
Accrued personnel expenses | 151,586 | 171,873 | 113,785 | 108,058 | ||||||||||||
Accounts payable to personnel (*) | 110,147 | 70,625 | 89,523 | 81,368 | ||||||||||||
Aircraft and engine maintenance | 3,741 | 22,053 | ||||||||||||||
Others accrued liabilities | 27,867 | 21,893 | 26,885 | 22,503 | ||||||||||||
|
|
|
| |||||||||||||
Total accrued liabilities | 293,341 | 286,444 | 475,142 | 458,383 | ||||||||||||
|
|
|
| |||||||||||||
| (*) | Profits and bonds participation (Note |
The detail of Other provisions as of December 31, 2013 and December 31, 2012 is as follows:provisions:
| As of | As of | Current liabilities | Non-current liabilities | Total Liabilities | ||||||||||||||||||||||||||||
| December 31, | December 31, | As of | As of | As of | As of | As of | As of | |||||||||||||||||||||||||
| 2013 | 2012 | December 31, | December 31, | December 31, | December 31, | December 31, | December 31, | |||||||||||||||||||||||||
| ThUS$ | ThUS$ | 2016 | 2015 | 2016 | 2015 | 2016 | 2015 | |||||||||||||||||||||||||
Current | ||||||||||||||||||||||||||||||||
Provision for contingencies (1) | ||||||||||||||||||||||||||||||||
Tax contingencies | 7,092 | 6,774 | ||||||||||||||||||||||||||||||
Civil contingencies | 13,430 | 23,880 | ||||||||||||||||||||||||||||||
Labor contingencies | 7,334 | 28,920 | ||||||||||||||||||||||||||||||
|
| ThUS$ | ThUS$ | ThUS$ | ThUS$ | ThUS$ | ThUS$ | |||||||||||||||||||||||||
Total other provisions, current | 27,856 | 59,574 | ||||||||||||||||||||||||||||||
|
| |||||||||||||||||||||||||||||||
Non-current | ||||||||||||||||||||||||||||||||
Provision for contingencies (1) | ||||||||||||||||||||||||||||||||
Tax contingencies | 968,211 | 1,137,961 | 1,425 | 1,297 | 313,064 | 350,418 | 314,489 | 351,715 | ||||||||||||||||||||||||
Civil contingencies | 50,022 | 60,732 | 993 | 1,476 | 56,413 | 37,555 | 57,406 | 39,031 | ||||||||||||||||||||||||
Labor contingencies | 64,895 | 91,248 | 225 | 149 | 29,307 | 15,648 | 29,532 | 15,797 | ||||||||||||||||||||||||
Other | 27,770 | 6,066 | — | — | 15,046 | 11,910 | 15,046 | 11,910 | ||||||||||||||||||||||||
Provision for European Commission investigation (2) | 11,349 | 10,865 | ||||||||||||||||||||||||||||||
|
| |||||||||||||||||||||||||||||||
Total other provisions, non-current | 1,122,247 | 1,306,872 | ||||||||||||||||||||||||||||||
Provision for European | ||||||||||||||||||||||||||||||||
Commision investigation (2) | — | — | 8,664 | 8,966 | 8,664 | 8,966 | ||||||||||||||||||||||||||
|
|
|
|
|
|
|
| |||||||||||||||||||||||||
Total other provisions (3) | 1,150,103 | 1,366,446 | 2,643 | 2,922 | 422,494 | 424,497 | 425,137 | 427,419 | ||||||||||||||||||||||||
|
|
|
|
|
|
|
| |||||||||||||||||||||||||
| (1) | Provisions for contingencies: |
The tax contingencies correspond to litigation and tax criteria related to the tax treatment applicable to direct and indirect taxes, which are found in both administrative and judicial stage.
The civil contingencies correspond to different demands of civil order filed against the company.
The labor contingencies correspond to different demands of labor order filed against the company.
The Provisions are recognized in the consolidated income statement in administrative expenses or tax expenses, as appropriate, except for the fair value by application of IFRS 3 business combination, in which case the recognition is in the State of Financial Position in the heading of Goodwill.appropriate.
| (2) | Provision made for proceedings brought by the European Commission for possible breaches of free competition in the freight market. |
| (3) | Total other provision at December 31, |
The movementMovement of provisions between January 1, 2011 and December 31, 2013 is as follows:provisions:
| European | ||||||||||||
| Legal | Commission | |||||||||||
| claims | Investigation(***) | Total | ||||||||||
| ThUS$ | ThUS$ | ThUS$ | ||||||||||
Opening balance as of January 1, 2011 | 21,957 | 10,916 | 32,873 | |||||||||
Increase in provisions | 12,085 | — | 12,085 | |||||||||
Provision used | (3,592 | ) | — | (3,592 | ) | |||||||
Reversal of provisions (*) | (11,518 | ) | — | (11,518 | ) | |||||||
Exchange difference | 141 | (241 | ) | (100 | ) | |||||||
|
|
|
|
|
| |||||||
Closing balance as of December 31, 2011 | 19,073 | 10,675 | 29,748 | |||||||||
|
|
|
|
|
| |||||||
Opening balance as of January 1, 2012 | 19,073 | 10,675 | 29,748 | |||||||||
Increase in provisions | 30,399 | — | 30,399 | |||||||||
Provision used (**) | (131,136 | ) | — | (131,136 | ) | |||||||
Additions due to business combination | 1,429,012 | — | 1,429,012 | |||||||||
Subsidiaries conversion difference | 8,391 | — | 8,391 | |||||||||
Reversal of provisions | (449 | ) | — | (449 | ) | |||||||
Exchange difference | 291 | 190 | 481 | |||||||||
|
|
|
|
|
| |||||||
Closing balance as of December 31, 2012 | 1,355,581 | 10,865 | 1,366,446 | |||||||||
|
|
|
|
|
| |||||||
Opening balance as of January 1, 2013 | 1,355,581 | 10,865 | 1,366,446 | |||||||||
Increase in provisions | 65,107 | — | 65,107 | |||||||||
Provision used | (57,192 | ) | — | (57,192 | ) | |||||||
Reversal of provision | (53,459 | ) | — | (53,459 | ) | |||||||
Subsidiaries conversion difference | (170,452 | ) | — | (170,452 | ) | |||||||
Exchange difference | (831 | ) | 484 | (347 | ) | |||||||
|
|
|
|
|
| |||||||
Closing balance as of December 31, 2013 | 1,138,754 | 11,349 | 1,150,103 | |||||||||
|
|
|
|
|
| |||||||
| European | ||||||||||||
| Legal | Commission | |||||||||||
| claims (1) | Investigation (2) | Total | ||||||||||
| ThUS$ | ThUS$ | ThUS$ | ||||||||||
Opening balance as of January 1, 2014 | 1,138,754 | 11,349 | 1,150,103 | |||||||||
Increase in provisions | 42,792 | — | 42,792 | |||||||||
Provision used | (27,597 | ) | — | (27,597 | ) | |||||||
Difference by subsidiaries conversion | (132,092 | ) | — | (132,092 | ) | |||||||
Reversal of provision | (315,288 | ) | — | (315,288 | ) | |||||||
Exchange difference | (1,017 | ) | (1,350 | ) | (2,367 | ) | ||||||
|
|
|
|
|
| |||||||
Closing balance as of December 31, 2014 | 705,552 | 9,999 | 715,551 | |||||||||
|
|
|
|
|
| |||||||
Opening balance as of January 1, 2015 | 705,552 | 9,999 | 715,551 | |||||||||
Increase in provisions | 54,675 | — | 54,675 | |||||||||
Provision used | (19,522 | ) | — | (19,522 | ) | |||||||
Difference by subsidiaries conversion | (220,266 | ) | — | (220,266 | ) | |||||||
Reversal of provision | (100,740 | ) | — | (100,740 | ) | |||||||
Exchange difference | (1,246 | ) | (1,033 | ) | (2,279 | ) | ||||||
|
|
|
|
|
| |||||||
Closing balance as of December 31, 2015 | 418,453 | 8,966 | 427,419 | |||||||||
|
|
|
|
|
| |||||||
Opening balance as of January 1, 2016 | 418,453 | 8,966 | 427,419 | |||||||||
Increase in provisions | 141,797 | — | 141,797 | |||||||||
Provision used | (21,997 | ) | — | (21,997 | ) | |||||||
Difference by subsidiaries conversion | 79,396 | — | 79,396 | |||||||||
Reversal of provision | (201,425 | ) | — | (201,425 | ) | |||||||
Exchange difference | 249 | (302 | ) | (53 | ) | |||||||
|
|
|
|
|
| |||||||
Closing balance as of December 31, 2016 | 416,473 | 8,664 | 425,137 | |||||||||
|
|
|
|
|
| |||||||
The accumulated balance includes US$ 115 million as judicial deposit |
| collect the tax |
| (2) | European Commission Provision: |
(***)European Commission Provision:
(a) This provision was established because of the investigation brought by the Directorate General for Competition of the European Commission against more than 25 cargo airlines, including Lan Cargo S.A., as part of a global investigation begunthat began in 2006December 2007 regarding possible unfair competition on the air cargo market. This was a joint investigation done by the European and U.S.A. authorities. The start of the investigation was disclosed through a Essential Matter report dated December 27, 2007. The U.S.A. portion of the global investigation concluded when Lan Cargo S.A. and its subsidiary, Aerolíneas Brasileiras S.A. (“ABSA”) signed aPlea Agreement with the U.S.A. Department of Justice, as disclosed in a Essential Matter report notice on January 21, 2009.
(b) A Essential Matter report dated November 9, 2010, reported that theJustice. The General Direction of Competition had issued its decision on this case (the “decision”), under which it imposed fines totaling €799,445,000€ 799,445,000 (seven hundred and ninety nine million four hundred and forty-five thousand Euros) for infringement of European Union regulations on free competition against eleven (11) airlines, among which areyou can find LATAM AirlineA irlines Group S.A. and Lan Cargo S.A., Air Canada, Air France, KLM, British Airways, Cargolux, Cathay Pacific, Japan Airlines, Qantas Airways, S.A.S. and Singapore Airlines.
(c) Jointly, LATAM AirlineAirlines Group S.A. and Lan Cargo S.A., have been fined in the amount of € 8,220,000 (eight million two hundred twenty thousand Euros) for said infractions, which was provisioned in the financial statements of LATAM AirlineAirlines Group S.A. This is a minor fine in comparison to the original decision, as there was a significant reduction in fine because LATAM Airline Group S.A. cooperated during the investigation.
(d) On January 24, 2011, LATAM AirlineAirlines Group S.A. and Lan Cargo S.A. appealed the decision before the Court of Justice of the European Union. AtOn December 31, 2013,16, 2015 The European Commission does not appeal the provision reachedsentence, but can issue a new decision correcting the amountfailures specified in the Judgment and it has a period of ThUS$ 11,349 (ThUS$ 10,8655 years which is fulfilled in 2021 the Court European resolved the appeal and annulled the European Commission. The procedural stage at December 31, 20122016 is disclosed in Note 31, in (ii) lawsuits received by Latam Airlines Group S.A. and ThUS$ 10,675 at December 31, 2011).Subsidiaries.
The composition of Tax liabilities is as follow:
| As of | As of | |||||||
| December 31, | December 31, | |||||||
| 2013 | 2012 | |||||||
| ThUS$ | ThUS$ | |||||||
Current | ||||||||
Income tax provision | 9,919 | 13,152 | ||||||
Additional tax provision | 1,664 | 1,360 | ||||||
|
|
|
| |||||
Total current | 11,583 | 14,512 | ||||||
|
|
|
| |||||
NOTE 2522 - OTHER NON-FINANCIAL LIABILITIES
Other non-financial liabilities as of December 31, 2013 and December 31, 2012 are as follows:
| As of | As of | Current liabilities | Non-current liabilities | Total Liabilities | ||||||||||||||||||||||||||||
| December 31, | December 31, | As of | As of | As of | As of | As of | As of | |||||||||||||||||||||||||
| 2013 | 2012 | December 31, | December 31, | December 31, | December 31, | December 31, | December 31, | |||||||||||||||||||||||||
| ThUS$ | ThUS$ | 2016 | 2015 | 2016 | 2015 | 2016 | 2015 | |||||||||||||||||||||||||
Current | ||||||||||||||||||||||||||||||||
| ThUS$ | ThUS$ | ThUS$ | ThUS$ | ThUS$ | ThUS$ | |||||||||||||||||||||||||||
Deferred revenues (*) | 2,739,125 | 2,360,151 | 2,655,086 | 2,423,703 | 213,781 | 272,130 | 2,868,867 | 2,695,833 | ||||||||||||||||||||||||
Sales tax | 52,576 | 47,122 | 19,402 | 10,379 | — | — | 19,402 | 10,379 | ||||||||||||||||||||||||
Retentions | 49,355 | 45,413 | 45,542 | 33,125 | — | — | 45,542 | 33,125 | ||||||||||||||||||||||||
Others taxes | 12,294 | 8,434 | 7,465 | 11,211 | — | — | 7,465 | 11,211 | ||||||||||||||||||||||||
Dividends payable | 275 | 4,023 | ||||||||||||||||||||||||||||||
Dividends | 25,518 | 3,980 | — | — | 25,518 | 3,980 | ||||||||||||||||||||||||||
Other sundry liabilities | 18,015 | 20,744 | 9,232 | 7,635 | — | — | 9,232 | 7,635 | ||||||||||||||||||||||||
|
| |||||||||||||||||||||||||||||||
Total other non-financial liabilities, current | 2,871,640 | 2,485,887 | ||||||||||||||||||||||||||||||
|
| |||||||||||||||||||||||||||||||
Non-current | ||||||||||||||||||||||||||||||||
Deferred revenues (*) | 77,513 | 99,261 | ||||||||||||||||||||||||||||||
Other sundry liabilities | 54 | 62 | ||||||||||||||||||||||||||||||
|
| |||||||||||||||||||||||||||||||
Total other non-financial liabilities, non-current | 77,567 | 99,323 | ||||||||||||||||||||||||||||||
|
|
|
|
|
|
|
| |||||||||||||||||||||||||
Total other non-financial liabilities | 2,949,207 | 2,585,210 | 2,762,245 | 2,490,033 | 213,781 | 272,130 | 2,976,026 | 2,762,163 | ||||||||||||||||||||||||
|
|
|
|
|
|
|
| |||||||||||||||||||||||||
| (*) | Note 2.20. |
The balance comprises, among other,mainly, deferred income by services not yet rendered and programs such as: LANPASS, TAMLATAM Pass, LATAM Fidelidade y Multiplus.Multiplus:
LANPASSLATAM Pass is the frequent flyer program created by LAN to reward the preference and loyalty of its customers with many benefits and privileges, throughby the accumulation of kilometers that can be exchanged for free flying tickets to fly free or for a wide range of products and services. Customers accumulate LANPASSLATAM Pass kilometers every time they fly with LAN, TAM, in companies that are members ofoneworld® members and other airlines associated with the program, as well as when they buy on the stores or use the services of a vast network of companies that have an agreement with the program around the world.
For its part, TAM, thinkingThinking on people who travel constantly, TAM created the program TAMLATAM Fidelidade, in order to improve carethe passenger attention and give recognition to those who choose the company. Through theBy using this program, customers accumulate points in a variety of programs loyalty in a single account and can redeem them at all TAM destinations and companiesrelated airline partners,companies, and even more, participate in the Red Multiplus Fidelidade.
Multiplus is a coalition of loyalty program, with the aimprograms, aiming to operate activities of operating activities accumulation and redemption of points TAM Fidelidade.points. This program has an integrated network by associates including hotels, financial institutions, retail companies, supermarkets, vehicle rentals and magazines, among many other partners from different segments.
Liability for employee benefits as of December 31, 2013 and December 31, 2012, respectively, are as follows:
| As of | As of | As of | As of | |||||||||||||
| December 31, | December 31, | December 31, | December 31, | |||||||||||||
| 2013 | 2012 | 2016 | 2015 | |||||||||||||
| ThUS$ | ThUS$ | ThUS$ | ThUS$ | |||||||||||||
Pension payments | 9,639 | 32,323 | ||||||||||||||
Termination payments | 493 | 240 | ||||||||||||||
Retirements payments | 49,680 | 42,117 | ||||||||||||||
Resignation payments | 10,097 | 8,858 | ||||||||||||||
Other obligations | 35,534 | 5,532 | 22,545 | 14,296 | ||||||||||||
|
|
|
| |||||||||||||
Total liability for employee benefits | 45,666 | 38,095 | 82,322 | 65,271 | ||||||||||||
|
|
|
| |||||||||||||
| (a) | The movement in |
| ||||||||||||||||||||||||||||||||||||||||||||||||||||||||||||||||||||||||||||||||||||||||||||||||||||||||||||||||||||||||||||||||||||||||||||||||||||||||||||||||||||||||||||||||||||||||||||||||||||||||||||||||||||||||||||||||||||||||||||
| ||||||||||||||||||||||||||||||||||||||||||||||||||||||||||||||||||||||||||||||||||||||||||||||||||||||||||||||||||||||||||||||||||||||||||||||||||||||||||||||||||||||||||||||||||||||||||||||||||||||||||||||||||||||||||||||||||||||||||||
| ||||||||||||||||||||||||||||||||||||||||||||||||||||||||||||||||||||||||||||||||||||||||||||||||||||||||||||||||||||||||||||||||||||||||||||||||||||||||||||||||||||||||||||||||||||||||||||||||||||||||||||||||||||||||||||||||||||||||||||
| ||||||||||||||||||||||||||||||||||||||||||||||||||||||||||||||||||||||||||||||||||||||||||||||||||||||||||||||||||||||||||||||||||||||||||||||||||||||||||||||||||||||||||||||||||||||||||||||||||||||||||||||||||||||||||||||||||||||||||||
| ||||||||||||||||||||||||||||||||||||||||||||||||||||||||||||||||||||||||||||||||||||||||||||||||||||||||||||||||||||||||||||||||||||||||||||||||||||||||||||||||||||||||||||||||||||||||||||||||||||||||||||||||||||||||||||||||||||||||||||
| ||||||||||||||||||||||||||||||||||||||||||||||||||||||||||||||||||||||||||||||||||||||||||||||||||||||||||||||||||||||||||||||||||||||||||||||||||||||||||||||||||||||||||||||||||||||||||||||||||||||||||||||||||||||||||||||||||||||||||||
| ||||||||||||||||||||||||||||||||||||||||||||||||||||||||||||||||||||||||||||||||||||||||||||||||||||||||||||||||||||||||||||||||||||||||||||||||||||||||||||||||||||||||||||||||||||||||||||||||||||||||||||||||||||||||||||||||||||||||||||
| ||||||||||||||||||||||||||||||||||||||||||||||||||||||||||||||||||||||||||||||||||||||||||||||||||||||||||||||||||||||||||||||||||||||||||||||||||||||||||||||||||||||||||||||||||||||||||||||||||||||||||||||||||||||||||||||||||||||||||||
| ||||||||||||||||||||||||||||||||||||||||||||||||||||||||||||||||||||||||||||||||||||||||||||||||||||||||||||||||||||||||||||||||||||||||||||||||||||||||||||||||||||||||||||||||||||||||||||||||||||||||||||||||||||||||||||||||||||||||||||
| ||||||||||||||||||||||||||||||||||||||||||||||||||||||||||||||||||||||||||||||||||||||||||||||||||||||||||||||||||||||||||||||||||||||||||||||||||||||||||||||||||||||||||||||||||||||||||||||||||||||||||||||||||||||||||||||||||||||||||||
| ||||||||||||||||||||||||||||||||||||||||||||||||||||||||||||||||||||||||||||||||||||||||||||||||||||||||||||||||||||||||||||||||||||||||||||||||||||||||||||||||||||||||||||||||||||||||||||||||||||||||||||||||||||||||||||||||||||||||||||
| ||||||||||||||||||||||||||||||||||||||||||||||||||||||||||||||||||||||||||||||||||||||||||||||||||||||||||||||||||||||||||||||||||||||||||||||||||||||||||||||||||||||||||||||||||||||||||||||||||||||||||||||||||||||||||||||||||||||||||||
(b) The liability for short-term benefits as of December 31, 2013 and December 31, 2012 respectively, is detailedprincipal assumptions used in the calculation to the provision in Chile are presented below:
| As of | As of | |||||||
| December 31, | December 31, | |||||||
| 2013 | 2012 | |||||||
| ThUS$ | ThUS$ | |||||||
Profit-sharing and bonuses (*) | 110,147 | 70,625 | ||||||
|
|
|
| |||||
| As of | ||||||||
| December 31, | ||||||||
Assumptions | 2016 | 2015 | ||||||
Discount rate | 4.54 | % | 4.84 | % | ||||
Expected rate of salary increase | 4.50 | % | 4.50 | % | ||||
Rate of turnover | 6.16 | % | 6.16 | % | ||||
Mortality rate | RV-2009 | RV-2009 | ||||||
Inflation rate | 2.86 | % | 2.92 | % | ||||
Retirement age of women | 60 | 60 | ||||||
Retirement age of men | 65 | 65 | ||||||
The discount rate is determined by reference to free risk 20 years Central Bank of Chile BCP bond. Mortality table RV – 2009, established by Chilean Superintendency of Securities and Insurance and inflation rate performance curve of Central Bank of Chile instruments long term BCU and BCP.
The obligation is determined based on the actuarial value of the accrued cost of the benefit and it is sensibility to main actuarial assumptions used for the calculation. The Following is a sensitivity analysis based on increased (decreased) on the discount rate, increased wages, rotation and inflation:
| Effect on the liability | ||||||||
| As of | As of | |||||||
| December 31, | December 31, | |||||||
| 2016 | 2015 | |||||||
| ThUS$ | ThUS$ | |||||||
Discount rate | ||||||||
Change in the accrued liability an closing for increase in 100 p.b. | (5,665 | ) | (4,669 | ) | ||||
Change in the accrued liability an closing for decrease of 100 p.b. | 5,952 | 5,345 | ||||||
Rate of wage growth | ||||||||
Change in the accrued liability an closing for increase in 100 p.b. | 6,334 | 5,309 | ||||||
Change in the accrued liability an closing for decrease of 100 p.b. | (5,644 | ) | (4,725 | ) | ||||
| (b) | The liability for short-term: |
| As of | As of | |||||||
| December 31, | December 31, | |||||||
| 2016 | 2015 | |||||||
| ThUS$ | ThUS$ | |||||||
Profit-sharing and bonuses (*) | 89,523 | 81,368 | ||||||
|
|
|
| |||||
| (*) | Accounts payables to employees (Note |
The participation in profits and bonuses correspondscorrespond to an annual incentives plan for achievement of objectives.
(c) Employment expenses are detailed below:
| (c) | Employment expenses are detailed below: |
| For the periods ended | For the periods ended | |||||||||||||||||||||||
| December 31, | December 31, | |||||||||||||||||||||||
| 2013 | 2012 | 2011 | 2016 | 2015 | 2014 | |||||||||||||||||||
| ThUS$ | ThUS$ | ThUS$ | ThUS$ | ThUS$ | ThUS$ | |||||||||||||||||||
Salaries and wages | 1,720,513 | 1,296,101 | 764,396 | 1,549,402 | 1,631,320 | 1,656,565 | ||||||||||||||||||
Short-term employee benefits | 452,158 | 397,824 | 85,681 | 132,436 | 171,366 | 361,328 | ||||||||||||||||||
Termination benefits | 67,508 | 32,864 | 18,207 | 79,062 | 51,684 | 84,179 | ||||||||||||||||||
Other personnel expenses | 252,590 | 182,126 | 144,219 | 190,233 | 218,435 | 248,030 | ||||||||||||||||||
|
|
|
|
|
| |||||||||||||||||||
Total | 2,492,769 | 1,908,915 | 1,012,503 | 1,951,133 | 2,072,805 | 2,350,102 | ||||||||||||||||||
|
|
|
|
|
| |||||||||||||||||||
NOTE 2724 - ACCOUNTS PAYABLE, NON-CURRENT
Non-current accounts payable as of December 31, 2013 and December 31, 2012 are as follows:
| As of | As of | |||||||
| December 31, | December 31, | |||||||
| 2016 | 2015 | |||||||
| ThUS$ | ThUS$ | |||||||
Aircraft and engine maintenance | 347,085 | 371,419 | ||||||
Fleet financing (JOL) | — | 35,042 | ||||||
Provision for vacations and bonuses | 12,080 | 10,365 | ||||||
Other sundry liabilities | 226 | 224 | ||||||
|
|
|
| |||||
Total accounts payable, non-current | 359,391 | 417,050 | ||||||
|
|
|
| |||||
| As of | As of | |||||||
| December 31, | December 31, | |||||||
| 2013 | 2012 | |||||||
| ThUS$ | ThUS$ | |||||||
Aircraft and engine maintenance | 663,837 | 685,441 | ||||||
Tax recovery program (*) | 176,666 | 207,089 | ||||||
Fleet financing (JOL) | 57,997 | 140,769 | ||||||
Provision for vacations and bonuses | 9,879 | 9,954 | ||||||
Other accounts payable (**) | 2,654 | 26,354 | ||||||
Other sundry liabilities | 11,854 | 15,994 | ||||||
|
|
|
| |||||
Total accounts payable, non-current | 922,887 | 1,085,601 | ||||||
|
|
|
| |||||
(a) Capital
The Company’s objective is to maintain an appropriate level of capitalization that enables it to ensure access to the financial markets for carrying out its medium and long-term objectives, optimizing the return for its shareholders and maintaining a solid financial position.
The Capital of the Company is managed and composed in the following form:
Thepaid capital of the Company at December 31, 20132016 amounts to ThUS$ 2,389,3843,149,564 (*) divided into 535,243,229606,407,693 common stock of a same series (ThUS$ 1,501,018,2,545,705, divided into 479,098,052545,547,819 shares as of December 31, 2012)2015), a single series nominative, ordinary character with no par value. There are no special series of shares and no privileges. The form of its stock certificates and their issuance, exchange, disablement, loss, replacement and other similar circumstances, as well as the transfer of the shares, is governed by the provisions of Corporations Law and its regulations.
(b) Subscribed(*) Include a deduction for issuance costs ThUS$ 4,793 and paidadjustment by 10,282 placement shares for ThUS$ 156.
(b.1) At
| (b) | Subscribed and paid shares |
As of December 31, 2013:2015, the Company’s subscribed and paid-in capital was represented by 545,558,101 shares, all common shares, without par value.
The total numberOn August 18, 2016, the Company held an extraordinary meeting of shareholders in which it was approved to increase the capital by issuing 61,316,424 shares of payment, all ordinary shares, authorized stands at 551,847,819 shares with no par value, in accordance with the increase in equity approved at the Extraordinary Shareholders’ Meeting held on June 11, 2013 issuing 63,500,000 ordinary shares with nowithout par value. As of December 31, 2016, 60,849,592 shares had been placed against this increase, according to the closefollowing breakdown: (a) 30,499,685 shares subscribed and paid at the end of thisthe preferred subscription period, 400,124,163 are fully paid up and 135,119,066 were subject to exchange forwhich expired on, December 2016, raising the equivalent of US$ 304,996,850; And (b) 30,349,907 additional shares insubscribed on December 28, 2016, earning the companies Sister Holdco S.A. and Holdco II S.A. Totaling 535,243,229 shares fully paid.equivalent of US$ 303,499,070.
As reported by Essential Matter dated on April 30, 2013, on that date the Board approved an Extraordinary Shareholders’ Meeting to be held on June 11, 2013, to address matters including the following:
1. To increase corporate equity by the amount of US$ 1,000,000,000 (one billion United States Dollars), with the objective of financing parta result of the investment plan for upcoming years, particularly requirements for fleet renewallast placement, as of December 31, 2016, the number Company shares subscribed and growth, andpaid amounts to strengthen606,407,693.
At December 31, 2016, the company’s financial position, through the issuance of a number of ordinaryCompany’s capital stock is represented by 608,374,525 shares, withall common shares, without no par value, as determined atwhich is divided into: (a) the meeting;
2. To destine a part606,407,693 subscribed and paid shares mentioned above; And (b) 1,966,832 shares pending subscription and payment, of said new capitalwhich: (i) 1,500,000 shares are allocated to compensation plans, understock option plans; And (ii) 466,832 correspond to the terms specified in Article 24balance of Law 18,046, the Corporations Law;
3. To set the price, manner, time, and procedure for theshares pending placement of the last capital increase.
It should be noted that during the year the Company’s capital stock was expressed in 613,164,243 shares, issued relating to this increase in equity; or to delegate toall ordinary shares, without nominal value, that is, 551,847,819 shares already authorized at the Board the faculty of determining the price, manner, time, and procedure, and other conditions for the placement of said shares, including but not limited to setting the terms and conditionsbeginning of the company’s compensation plans.
On June 20, 2013, information was presented to the Superintendency of Securitiesyear and Insurance in order to request the registration of the share issuance approved at the aforementioned Extraordinary Shareholders’ Meeting. On July 22, 2013 the Superintendency of Securities and Insurance remitted the Company providing comments for said registration by Deed No. 16,141. The Company replied to these submissions on October 16, 2013.
Finally, on November 11, 2013, the Superintendency of Securities and Insurance issued the certificate that approved the registration of that issuance under the number 987. On November 20, 2013, began the preferential subscription period of the 62,000,000 shares not destined for the above compensation plans, settling the price that these shares would be offered to shareholders in US$ 15,17. On December 19, 2013, ended the preferential subscription period, have been subscribed and paid the total of 51,695,410 shares and collected the equivalent of ThUS$ 784,219, the unsubscribed remainder of 10,304,590 shares shall be offered and placed on the general market.
(b.2) At December 31, 2012:
The total number of ordinary61,316,424 shares authorized stands at 488,355,791 shares with no par value, in accordance with the last Capital increase in equity approved at the Extraordinary Shareholders’ Meeting helddated August 18, 2016. However, on December 21, 2011 issuing 147,355,882 ordinary2016, the deadline for the subscription and payment of 4,789,718 shares with no par value. Of this increase, 142,555,882 shares, were destined to the merge with Sister Holdco S.A. and Holdco II S.A. 4,800,000 shares,that were destined to compensation plans for employees of the Company and its subsidiaries. As of the close of this period, 343,978,986 shares are fully paid and 135,119,066 were subject to exchange for shares in the companies Sister Holdco S.A. and Holdco II S.A., totaling 479,098,052 shares fully paid.
As reported by Essential Matter dated June 28, 2012, the Board agreed to submit to the approval of shareholders of the Companyworkers expired, so that the remaining 7,436,816 shares that were not used in the exchange, not be used for the purpose of creating and implementing a compensation plan for employees of the Company and its subsidiaries, as provided in Article 24 of the Corporations Law, but instead preferably intendedCompany’s capital stock was reduced to be offered to shareholders of LATAM Airlines Group S.A., according to article 25 of the Corporation Law.608,374,525 shares.
According to the information through Essential Matter dated August 3, 2012, to this date, the Board agreed to call Extraordinary Shareholders Meeting to discuss, among other matters, that the referred 7,436,816 shares were intended to be offered preferentially to shareholders of the Company and the balance not subscribed, was offered and placed on the market in general. The aforementioned Extraordinary Shareholders Meeting held on September 4, 2012, agreed, among other matters, the approval of the remaining 7,436,816 shares of total 142,555,882 shares issued under the authorization of the Extraordinary Shareholders Meeting dated December 21, 2011, and were not to be exchanged for shares of the Sister Holdco S.A. and Holdco II S.A., were intended to be offered preferably between the LATAM shareholders under Article 25 of the Corporations Law and that the unsubscribed balance, would be offered and placed on the market in general.
The re-destination and placement of those shares was approved by the Superintendency of Securities and Insurance, dated December 11, 2012. On December 20, 2012, the Board of Directors agreed to start, from December 21, 2012, the period of preferred option of those shares, proceeded to fix the price of placing them, which was reported to the Superintendency of Securities and Insurance by Essential Matter on the same date. At the end of the period of first refusal, that is, to January 19, 2013, were 6,857,190 shares subscribed and paid the said remnant, leaving a balance of 579,626 shares to be subscribed. This balance was auctioned on the Santiago Stock Exchange—Stock Exchange dated January 23, 2013 at a value of CLP$ 11,921 per share.
The following table shows the movement of the authorized and fully paid shares described above between January 1, 2012 and December 31, 2013.above:
| Movement of authorized shares | ||||
| shares | ||||
| ||||
No movement of autorized shares during 2015 | — | |||
Authorized shares as of December 31, 2015 | 551,847,819 | |||
Autorized shares as of January 1, 2016 | 551,847,819 | |||
Increase capital | 61,316,424 | |||
Full capital decrease due to maturity of the subscription and payment period of the compensation plan 2011, December 21, 2016 (*) | ( | ) | ||
|
| |||
Authorized shares as of December 31, | ||||
|
| |||
| ||||
| ||||
| ||||
| ||||
| ||||
| No. of shares | Movement value of shares (*) ThUS$ | Cost of issuance and placement of shares (**) ThUS$ | Paid-in Capital ThUS$ | |||||||||||||
Paid shares as of January 1, 2012 | 340,326,431 | 476,579 | (2,672 | ) | 473,907 | |||||||||||
Exercise stock options increase capital 2007 | 673,478 | 10,226 | — | 10,226 | ||||||||||||
Exchange of shares for merger Companies Sister Holdco S.A and Holdco II S.A. | 135,119,066 | 951,409 | — | 951,409 | ||||||||||||
Capitalization of reserves | — | — | (3,510 | ) | (3,510 | ) | ||||||||||
Placement of the remaining preferential shares issued for merger Companies Sister Holdco S.A. y Holdco II S.A. | 2,979,077 | 68,986 | — | 68,986 | ||||||||||||
|
|
|
|
|
|
|
| |||||||||
Paid shares as of December 31, 2012 | 479,098,052 | 1,507,200 | (6,182 | ) | 1,501,018 | |||||||||||
|
|
|
|
|
|
|
| |||||||||
Paid shares as of January 1, 2013 | 479,098,052 | 1,507,200 | (6,182 | ) | 1,501,018 | |||||||||||
Placement of the remaining preferred shares issued for merger with Companies Sister Holdco S.A. y Holdco II S.A. | 4,457,739 | 104,351 | — | 104,351 | ||||||||||||
Full right decrease of treasury stock | (7,972 | ) | (25 | ) | — | (25 | ) | |||||||||
Capitalization of reserves | — | — | (179 | ) | (179 | ) | ||||||||||
Preferential placement capital increase approved at Extraordinary Shareholders meeting dated June 11, 2013 | 51,695,410 | 784,219 | — | 784,219 | ||||||||||||
|
|
|
|
|
|
|
| |||||||||
Paid shares as of December 31, 2013 | 535,243,229 | 2,395,745 | (6,361 | ) | 2,389,384 | |||||||||||
|
|
|
|
|
|
|
| |||||||||
| (*) | See Note 34 (a.1) |
Movement fully paid shares
| Movement | Cost of issuance | |||||||||||||||
| value | and placement | Paid-in | ||||||||||||||
| N° of | of shares (1) | of shares (2) | Capital | |||||||||||||
| increase (decrease) through transfers and other changes | shares | ThUS$ | ThUS$ | ThUS$ | ||||||||||||
Paid shares as of January 1, 2015 | 545,547,819 | 2,552,066 | (6,361 | ) | 2,545,705 | |||||||||||
No movement of paid shares during 2015 | — | — | — | — | ||||||||||||
|
|
|
|
|
|
|
| |||||||||
Paid shares as of December 31, 2015 | 545,547,819 | 2,552,066 | (6,361 | ) | 2,545,705 | |||||||||||
|
|
|
|
|
|
|
| |||||||||
Paid shares as of January 1, 2016 | 545,547,819 | 2,552,066 | (6,361 | ) | 2,545,705 | |||||||||||
Placement capital increase | ||||||||||||||||
Approved at Extraordinary Shareholders meeting dated August 18, 2016 | 60,849,592 | 608,496 | — | 608,496 | ||||||||||||
Capital reserve | — | — | (4,793 | ) | (4,793 | ) | ||||||||||
Increase (decrease) by transfers and other changes (4) | 10,282 | 156 | — | 156 | ||||||||||||
|
|
|
|
|
|
|
| |||||||||
Paid shares as of December 31, 2016 | 606,407,693 | (3) | 3,160,718 | (11,154 | ) | 3,149,564 | ||||||||||
|
|
|
|
|
|
|
| |||||||||
| (1) | Amounts reported represent only those arising from the payment of the shares subscribed. |
| Decrease of capital by capitalization of reserves for cost of issuance and placement of shares established according to Extraordinary Shareholder’s Meetings, where such decreases were authorized. |
| (3) | At December 31, 2016, the difference between authorized shares and fully paid shares are 1,966,832 shares, of which 1,500,000 correspond to compensation plans for executives of LATAM Airlines Group S.A. and subsidiaries (see Note 34(a.1)) and 466,832 correspond to the shares issued and unsubscribed from the capital increase approved at the Extraordinary Shareholders’ Meeting held on August 18, 2016. |
| (4) | In January 2014, these 10,282 shares were placed and charged to the Compensation plan 2011 (See Note 34 (a.1)) |
(c) Treasury stock
| (c) | Treasury stock |
At December 31, 2013, as per minutes2016, the Company held no treasury stock, the remaining of ThUS$ (178) corresponds to the difference between the amount paid for the shares and their book value, at the time of the Extraordinary Shareholder’s Meeting held on June 11, 2013, the company relinquished allfull right to 7,972 stocks of its portfolio, this date the Company does not maintain treasury stock.
At December 31, 2012, the total subscribed and paid sharesdecrease of the company acquired 7,972 shares shareholders who exercised the right to withdraw an amount of US$203.which held in its portfolio.
(d) Reserve of share- based payments
| (d) | Reserve of share-based payments |
The movementMovement of Reserves of share- based payments between January 1, 2011 and December 31, 2013, is as follows:share-based payments:
| Deferred tax | ||||||||||||||||||||||||
| Stock | by tax effect | |||||||||||||||||||||||
| Opening | option | Deferred | of change in legal rate | Net movement | Closing | |||||||||||||||||||
Periods | balance | plan | tax | (Tax reform) (*) | of the period | balance | ||||||||||||||||||
| ThUS$ | ThUS$ | ThUS$ | ThUS$ | ThUS$ | ThUS$ | |||||||||||||||||||
From January 1 to December 31, 2014 | 21,011 | 14,728 | (3,389 | ) | (2,708 | ) | 8,631 | 29,642 | ||||||||||||||||
From January 1 to December 31, 2015 | 29,642 | 8,924 | (2,919 | ) | — | 6,005 | 35,647 | |||||||||||||||||
From January 1 to December 31, 2016 | 35,647 | 3,698 | (807 | ) | — | 2,891 | 38,538 | |||||||||||||||||
| (*) | ||||
| ||||
| ||||
| ||||
| ||||
| ||||
| ||||
| ||||
| ||||
| ||||
| ||||
| ||||
| ||||
| year 2015. | ||||
These reserves are related to the “Share-based payments” explained in Note 38.
| (e) | Other sundry reserves |
(e) Other sundry reserves
The movementMovement of Other sundry reserves between January 1, 2011 and December 31, 2013, is as follows:reserves:
| ||||
| ||||
| ||||
| ||||
| ||||
| ||||
| ||||
| ||||
| ||||
| ||||
| ||||
| ||||
| ||||
| ||||
| ||||
| ||||
| ||||
| ||||
| Transactions | ||||||||||||||||
| with | ||||||||||||||||
| Opening | non-controlling | Legal | Closing | |||||||||||||
Periods | balance | interest | reserves | balance | ||||||||||||
| ThUS$ | ThUS$ | ThUS$ | ThUS$ | |||||||||||||
From January 1 to December 31, 2014 | 2,657,800 | (21,526 | ) | (526 | ) | 2,635,748 | ||||||||||
From January 1 to December 31, 2015 | 2,635,748 | — | (1,069 | ) | 2,634,679 | |||||||||||
From January 1 to December 31, 2016 | 2,634,679 | — | 5,602 | 2,640,281 | ||||||||||||
(e.1) Other sundry reserves
The balanceBalance of Other sundry reserves comprises the following:
| As of | As of | As of | As of | As of | As of | |||||||||||||||||||
| December 31, | December 31, | December 31, | December 31, | December 31, | December 31, | |||||||||||||||||||
| 2013 | 2012 | 2011 | 2016 | 2015 | 2014 | |||||||||||||||||||
| ThUS$ | ThUS$ | ThUS$ | ThUS$ | ThUS$ | ThUS$ | |||||||||||||||||||
Higher value for TAM S.A. share exchange (1) | 2,665,692 | 2,665,692 | — | 2,665,692 | 2,665,692 | 2,665,692 | ||||||||||||||||||
Reserve for the adjustment to the value of fixed assets (2) | 2,620 | 2,620 | 2,620 | 2,620 | 2,620 | 2,620 | ||||||||||||||||||
Transactions with non-controlling interest (3) | (5,355 | ) | (3,405 | ) | (1,801 | ) | (25,911 | ) | (25,891 | ) | (25,891 | ) | ||||||||||||
Cost of issuance and placement of shares | (5,264 | ) | — | — | 9 | (4,793 | ) | (5,264 | ) | |||||||||||||||
Others | 107 | 1,775 | 543 | (2,129 | ) | (2,949 | ) | (1,409 | ) | |||||||||||||||
|
|
|
|
|
| |||||||||||||||||||
Total | 2,657,800 | 2,666,682 | 1,362 | 2,640,281 | 2,634,679 | 2,635,748 | ||||||||||||||||||
|
|
|
|
|
| |||||||||||||||||||
| (1) | Corresponds to the difference in the shares value of TAM S.A. acquired (under subscriptions) by Sister Holdco S.A. and Holdco II S.A. (under the Exchange Offer), as stipulated in the Declaration of Posting of Merger by Absorption and the fair value of these exchange shares of LATAM Airlines Group S.A. at June 22, 2012. |
| (2) | Corresponds to the technical revaluation of fixed assets authorized by the Superintendence of Securities and Insurance in 1979, in Circular No. 1,529. The revaluation was optional and could be taken only once, the reserve is not distributable and can only be capitalized. |
| (3) | The balance at December 31, |
| (f) | Reserves with effect in other comprehensive income. |
(f) Reserves with effect in other comprehensive income.
The movementMovement of Reserves with effect in other comprehensive income between January 1, 2011 and December 31, 2013 is as follows:income:
| Currency | Cash flow | |||||||||||
| translation | hedging | |||||||||||
| reserve | reserve | Total | ||||||||||
| ThUS$ | ThUS$ | ThUS$ | ||||||||||
Opening balance as of January 1, 2011 | (4,257 | ) | (107,050 | ) | (111,307 | ) | ||||||
Derivatives valuation gains (losses) | — | (40,368 | ) | (40,368 | ) | |||||||
Deferred tax | 1,855 | 6,862 | 8,717 | |||||||||
Conversion difference subsidiaries | (10,925 | ) | — | (10,925 | ) | |||||||
|
|
|
|
|
| |||||||
Closing balance as of December 31, 2011 | (13,327 | ) | (140,556 | ) | (153,883 | ) | ||||||
|
|
|
|
|
| |||||||
Opening balance as of January 1, 2012 | (13,317 | ) | (140,556 | ) | (153,873 | ) | ||||||
Derivatives valuation gains (losses) | — | 5,003 | 5,003 | |||||||||
Deferred tax | (2,727 | ) | (5,177 | ) | (7,904 | ) | ||||||
Conversion difference subsidiaries | 19,618 | — | 19,618 | |||||||||
|
|
|
|
|
| |||||||
Closing balance as of December 31, 2012 | 3,574 | (140,730 | ) | (137,156 | ) | |||||||
|
|
|
|
|
| |||||||
Opening balance as of January 1, 2013 | 3,574 | (140,730 | ) | (137,156 | ) | |||||||
Derivatives valuation gains (losses) | — | 124,227 | 124,227 | |||||||||
Deferred tax | — | (18,005 | ) | (18,005 | ) | |||||||
Conversion difference subsidiaries | (593,565 | ) | — | (593,565 | ) | |||||||
|
|
|
|
|
| |||||||
Closing balance as of December 31, 2013 | (589,991 | ) | (34,508 | ) | (624,499 | ) | ||||||
|
|
|
|
|
| |||||||
| Currency translation reserve | Cash flow hedging reserve | Actuarial gain or loss on defined benefit plans reserve | Total | |||||||||||||
| ThUS$ | ThUS$ | ThUS$ | ThUS$ | |||||||||||||
Opening balance as of January 1, 2014 | (589,991 | ) | (34,508 | ) | — | (624,499 | ) | |||||||||
Derivatives valuation gains (losses) | — | (165,231 | ) | — | (165,231 | ) | ||||||||||
Deferred tax | — | 40,647 | — | 40,647 | ||||||||||||
Tax effect on deferred tax by change legal tax rate (Tax reform)(*) | — | 7,752 | — | 7,752 | ||||||||||||
Difference by subsidiaries conversion | (603,880 | ) | — | — | (603,880 | ) | ||||||||||
|
|
|
|
|
|
|
| |||||||||
Closing balance as of December 31, 2014 | (1,193,871 | ) | (151,340 | ) | — | (1,345,211 | ) | |||||||||
|
|
|
|
|
|
|
| |||||||||
Opening balance as of January 1, 2015 | (1,193,871 | ) | (151,340 | ) | — | (1,345,211 | ) | |||||||||
Derivatives valuation gains (losses) | — | 82,730 | — | 82,730 | ||||||||||||
Deferred tax | — | (21,900 | ) | — | (21,900 | ) | ||||||||||
Actuarial reserves by employee benefit plans | — | — | (14,627 | ) | (14,627 | ) | ||||||||||
Deferred tax actuarial IAS by employee benefit plans | — | — | 3,910 | 3,910 | ||||||||||||
Difference by subsidiaries conversion | (1,382,170 | ) | — | — | (1,382,170 | ) | ||||||||||
|
|
|
|
|
|
|
| |||||||||
Closing balance as of December 31, 2015 | (2,576,041 | ) | (90,510 | ) | (10,717 | ) | (2,677,268 | ) | ||||||||
|
|
|
|
|
|
|
| |||||||||
Opening balance as of January 1, 2016 | (2,576,041 | ) | (90,510 | ) | (10,717 | ) | (2,677,268 | ) | ||||||||
Derivatives valuation gains (losses) | — | 126,360 | — | 126,360 | ||||||||||||
Deferred tax | — | (34,344 | ) | — | (34,344 | ) | ||||||||||
Actuarial reserves by employee benefit plans | — | — | (3,104 | ) | (3,104 | ) | ||||||||||
Deferred tax actuarial IAS by employee benefit plans | — | — | 921 | 921 | ||||||||||||
Difference by subsidiaries conversion | 489,486 | — | — | 489,486 | ||||||||||||
|
|
|
|
|
|
|
| |||||||||
Closing balance as of December 31, 2016 | (2,086,555 | ) | 1,506 | (12,900 | ) | (2,097,949 | ) | |||||||||
|
|
|
|
|
|
|
| |||||||||
(f.1) Currency translation reserve
| (*) | On September 29, 2014, Law No. 20,780 “Amendment to the system of income taxation and introduces various adjustments in the tax system.” was published in the Official Journal of the Republic of Chile. Within major tax reforms that law contains is modified gradually from 2014 to 2018 the First- Category Tax rate to be declared and paid starting in tax year 2015. |
| (f.1) | Currency translation reserve |
These originate from exchange differences arising from the translation of any investment in foreign entities (or Chilean investment with a functional currency different to that of the parent), and from loans and other instruments in foreign currency designated as hedges for such investments. When the investment (all or part) is sold or disposed and loss of control occurs, these reserves are shown in the consolidated statement of income as part of the loss or gain on the sale or disposal. If the sale does not involve loss of control, these reserves are transferred to non-controlling interests.
(f.2) Cash flow hedging reserve
| (f.2) | Cash flow hedging reserve |
These originate from the fair value valuation at the end of each period of the outstanding derivative contracts that have been defined as cash flow hedges. When these contracts expire, these reserves should be adjusted and the corresponding results recognized.
(g) Retained earnings
The movement of Retained earnings between January 1, 2011 and December 31, 2013, is as follows:
| (g) | ||||
| ||||
| ||||
| ||||
| ||||
| ||||
| ||||
| ||||
| ||||
| ||||
| ||||
| ||||
| ||||
| ||||
| ||||
| Retained earnings | ||||
(h) Dividends per shareMovement of Retained earnings:
Periods | Opening balance | Result for the period | Dividends | Other increase (decreases) | Closing balance | |||||||||||||||
| ThUS$ | ThUS$ | ThUS$ | ThUS$ | ThUS$ | ||||||||||||||||
From January 1 to December 31, 2014 | 795,303 | (259,985 | ) | — | 872 | 536,190 | ||||||||||||||
From January 1 to December 31, 2015 | 536,190 | (219,274 | ) | — | 1,034 | 317,950 | ||||||||||||||
From January 1 to December 31, 2016 | 317,950 | 69,220 | (20,766 | ) | — | 366,404 | ||||||||||||||
| (h) | Dividends per share |
Description of dividend | Minimum mandatory dividend 2016 | Final dividend dividend 2015 | ||||||
Date of dividend | 12-31-2016 | 12-31-2015 | ||||||
Amount of the dividend (ThUS$) | 20,766 | — | ||||||
Number of shares among which the dividend is distributed | 606,407,693 | 545,547,819 | ||||||
Dividend per share (US$) | 0.0342 | — | ||||||
As of December 31, 2013
| ||||
| ||||
| ||||
| ||||
| ||||
| ||||
As of December 31, 2013
| Minimum mandatory | ||||||||
| Final dividend | dividend | |||||||
Description of dividend | 2011 | 2012 | ||||||
Date of dividend | 04-26-2012 | 12-31-2012 | ||||||
Amount of the dividend (ThUS$) | 18,462 | 3,287 | ||||||
Number of shares among which the dividend is distributed | 340,999,909 | 479,098,052 | ||||||
Dividend per share (US$) | 0.05414 | 0.00686 | ||||||
As of December 31, 2011
| Final | Interim | Interim | ||||||||||
| dividend | dividend | dividend | ||||||||||
Description | 2010 | 2011 | 2011 | |||||||||
Date of dividend | 04-29-2011 | 08-30-2011 | 12-20-2011 | |||||||||
Amount of the dividend (ThUS$) | 10,386 | 56,595 | 85,000 | |||||||||
Number of shares among which the dividend is distributed | 339,310,509 | 339,358,209 | 340,164,105 | |||||||||
Dividend per share (US$) | 0.03061 | 0.16677 | 0.24988 | |||||||||
The Company’s dividend policy is that dividends distributed will be equal to the minimum required by law, i.e. 30% of the net income according to current regulations. This policy does not preclude2016 and 2015, the Company from distributing dividends in excess of this obligatory minimum, based on the events and circumstances that may occur during the course of the year.
At December 31, 2013, mandatory minimum dividend washas not applicable; therefore no provision was made for.been paid dividends.
The detail of revenues is as follows:
For the periods ended December 31, | ||||||||||||
| 2013 | 2012 | 2011 | ||||||||||
| ThUS$ | ThUS$ | ThUS$ | ||||||||||
Passengers | 11,061,557 | 7,966,846 | 4,008,910 | |||||||||
Cargo | 1,862,980 | 1,743,526 | 1,576,530 | |||||||||
|
|
|
|
|
| |||||||
Total | 12,924,537 | 9,710,372 | 5,585,440 | |||||||||
|
|
|
|
|
| |||||||
| 2016 | For the periods ended December 31, 2015 | 2014 | ||||||||||
| ThUS$ | ThUS$ | ThUS$ | ||||||||||
Passengers LAN | 4,104,348 | 4,241,918 | 4,464,761 | |||||||||
Passengers TAM | 3,773,367 | 4,168,696 | 5,915,361 | |||||||||
Cargo | 1,110,625 | 1,329,431 | 1,713,379 | |||||||||
|
|
|
|
|
| |||||||
Total | 8,988,340 | 9,740,045 | 12,093,501 | |||||||||
|
|
|
|
|
| |||||||
NOTE 3027 - COSTS AND EXPENSES BY NATURE
(a) Costs and operating expenses
| (a) | Costs and operating expenses |
The main operating costs and administrative expenses are detailed below:
For the periods ended December 31, | 2016 | For the periods ended December 31, 2015 | 2014 | |||||||||||||||||||||
| 2013 | 2012 | 2011 | ThUS$ | ThUS$ | ThUS$ | |||||||||||||||||||
| ThUS$ | ThUS$ | ThUS$ | ||||||||||||||||||||||
Aircraft fuel | 2,056,643 | 2,651,067 | 4,167,030 | |||||||||||||||||||||
Other rentals and landing fees | 1,373,061 | 1,048,342 | 671,614 | 1,077,407 | 1,109,826 | 1,327,238 | ||||||||||||||||||
Aircraft fuel | 4,414,249 | 3,434,569 | 1,750,052 | |||||||||||||||||||||
Comissions | 408,671 | 308,941 | 209,255 | |||||||||||||||||||||
Other operating expenses | 1,644,827 | 1,316,095 | 646,051 | |||||||||||||||||||||
Aircraft rentals | 441,077 | 313,038 | 174,197 | 568,979 | 525,134 | 521,384 | ||||||||||||||||||
Aircraft maintenance | 477,086 | 297,618 | 182,358 | 366,153 | 437,235 | 452,731 | ||||||||||||||||||
Comissions | 269,296 | 302,774 | 365,508 | |||||||||||||||||||||
Passenger services | 331,405 | 239,848 | 136,049 | 286,621 | 295,439 | 300,325 | ||||||||||||||||||
Other operating expenses | 1,424,595 | 1,293,320 | 1,487,672 | |||||||||||||||||||||
|
|
|
|
|
| |||||||||||||||||||
Total | 9,090,376 | 6,958,451 | 3,769,576 | 6,049,694 | 6,614,795 | 8,621,888 | ||||||||||||||||||
|
|
|
|
|
| |||||||||||||||||||
(b) Depreciation and amortization
| (b) | Depreciation and amortization |
Depreciation and amortization are detailed below:
For the periods ended December 31, | ||||||||||||||||||||||||
| 2013 | 2012 | 2011 | 2016 | For the period ended December 31, 2015 | 2014 | |||||||||||||||||||
| ThUS$ | ThUS$ | ThUS$ | ThUS$ | ThUS$ | ThUS$ | |||||||||||||||||||
Depreciation (*) | 985,317 | 739,973 | 386,644 | 910,071 | 897,670 | 943,731 | ||||||||||||||||||
Amortization | 56,416 | 31,140 | 9,831 | 50,257 | 36,736 | 47,533 | ||||||||||||||||||
|
|
|
|
|
| |||||||||||||||||||
Total | 1,041,733 | 771,113 | 396,475 | 960,328 | 934,406 | 991,264 | ||||||||||||||||||
|
|
|
|
|
| |||||||||||||||||||
| (*) |
(c) Personnel expenses
| (c) | Personnel expenses |
The costs for personnel expenses are disclosed in LiabilityNote 23 liability for employee benefits (See Note 26).benefits.
(d) Financial costs
| (d) | Financial costs |
The detail of financial costs is as follows:
For the periods ended December 31, | ||||||||||||||||||||||||
| 2013 | 2012 | 2011 | 2016 | For the period ended December 31, 2015 | 2014 | |||||||||||||||||||
| ThUS$ | ThUS$ | ThUS$ | ThUS$ | ThUS$ | ThUS$ | |||||||||||||||||||
Bank loan interest | 382,969 | 185,013 | 109,168 | 352,405 | 331,511 | 330,298 | ||||||||||||||||||
Financial leases | 76,343 | 44,717 | 12,265 | 32,573 | 42,855 | 72,242 | ||||||||||||||||||
Other financial instruments | 3,212 | 64,868 | 17,644 | 31,358 | 38,991 | 27,494 | ||||||||||||||||||
|
|
|
|
|
| |||||||||||||||||||
Total | 462,524 | 294,598 | 139,077 | 416,336 | 413,357 | 430,034 | ||||||||||||||||||
|
|
|
|
|
| |||||||||||||||||||
Costs and expenses by nature presented in this note plus the Employee expenses disclosed in Note 26,23, are equivalent to the sum of cost of sales, distribution costs, administrative expenses, other expenses and financing costs presented in the consolidated statement of income by function.
| (e) | Restructuring Costs |
As part of the ongoing process of reviewing its fleet plan, in December 2015 the company recognized a negative impact on results of US$ 80 million before tax associated with the output of the rest of the A330 fleet, including engines and technical materials is recognized. These expenses are recognized at “Other Gain and Loses” of the Consolidated Statement of Income by Function.
NOTE 31 - GAINS (LOSSES) ON THE SALE OF NON-CURRENT ASSETS NOT CLASSIFIED AS HELD FOR SALE
The Gains (losses) on sales of non-current assets not classified as held for sale as of December 31, 2013, 2012 and 2011 are as follows:
For the periods ended December 31, | ||||||||||||
| 2013 | 2012 | 2011 | ||||||||||
| ThUS$ | ThUS$ | ThUS$ | ||||||||||
Property, plant and equipment | 2,545 | (2,836 | ) | (172 | ) | |||||||
|
|
|
|
|
| |||||||
Total | 2,545 | (2,836 | ) | (172 | ) | |||||||
|
|
|
|
|
| |||||||
NOTE 32 - 28—OTHER INCOME, BY FUNCTION
Other income by function is as follows:
For the periods ended December 31, | ||||||||||||
| 2013 | 2012 | 2011 | ||||||||||
| ThUS$ | ThUS$ | ThUS$ | ||||||||||
Duty free | 14,748 | 17,463 | 16,874 | |||||||||
Aircraft leasing | 36,614 | 28,863 | 12,701 | |||||||||
Logistics and courier | — | — | 10,958 | |||||||||
Customs and warehousing | 24,281 | 24,537 | 24,677 | |||||||||
Tours | 105,449 | 74,226 | 43,952 | |||||||||
Maintenance | 12,392 | 5,358 | — | |||||||||
Multiplus | 68,925 | 26,696 | — | |||||||||
Other miscellaneous income | 79,156 | 43,013 | 23,642 | |||||||||
|
|
|
|
|
| |||||||
Total | 341,565 | 220,156 | 132,804 | |||||||||
|
|
|
|
|
| |||||||
Coalition and loyalty program Multiplus Tours Aircraft leasing Customs and warehousing Maintenance Duty free Other miscellaneous income Total 2016 For the period ended
December 31,
2015 2014 ThUS$ ThUS$ ThUS$ 174,197 154,958 160,255 133,575 113,225 109,788 65,011 46,547 31,104 24,548 25,457 22,368 17,090 11,669 15,421 11,141 16,408 18,076 113,186 17,517 20,633 538,748 385,781 377,645
NOTE 33 - 29—FOREIGN CURRENCY AND EXCHANGE RATE DIFFERENCES
The functional currency of LATAM Airlines Group S.A. is the US dollar, also it has subsidiaries whose functional currency is different to the US dollar, such as the Chilean peso, Argentine peso, Colombian peso and Brazilian real, the latter due to business combinations with TAM S.A. and Subsidiaries.real.
The functional currency is defined primarily as the currency of the primary economic environment in which an entity operates and in each stateentity and all other currencies are defined as foreign currency.
Considering the above, the balances by currency mentioned in this note correspond to the sum of foreign currency of each of the entities that make LATAM Airlines Group S.A. and Subsidiaries.
a) Foreign currency
| (a) | Foreign currency |
The foreign currency detail of balances of monetary items in current and non-current assets is as follows:
Current assets | As of December 31, 2013 | As of December 31, 2012 | As of | As of | ||||||||||||
| ThUS$ | ThUS$ | ThUS$ | ThUS$ | |||||||||||||
Cash and cash equivalents | 538,213 | 337,223 | 201,416 | 182,089 | ||||||||||||
Argentine peso | 41,092 | 68,705 | 4,438 | 11,611 | ||||||||||||
Brazilian real | 3,683 | 3,308 | 9,705 | 8,810 | ||||||||||||
Chilean peso | 229,913 | 40,091 | 30,221 | 17,739 | ||||||||||||
Colombian peso | 5,254 | 671 | 1,137 | 1,829 | ||||||||||||
Euro | 16,571 | 15,502 | 1,695 | 10,663 | ||||||||||||
U.S. dollar | 44,656 | 94,035 | 128,694 | 112,422 | ||||||||||||
Strong bolivar | 162,809 | 51,346 | 61 | 2,986 | ||||||||||||
Other currency | 34,235 | 63,565 | 25,465 | 16,029 | ||||||||||||
Other financial assets | 51,082 | 30,936 | ||||||||||||||
Other financial assets, current | 14,573 | 124,042 | ||||||||||||||
Argentine peso | 885 | — | 12 | 108,592 | ||||||||||||
Brazilian real | — | 2,167 | 734 | 1,263 | ||||||||||||
Chilean peso | 25,854 | 550 | 585 | 563 | ||||||||||||
Colombian peso | 2,039 | 2,147 | — | 1,167 | ||||||||||||
Euro | 6 | 8 | ||||||||||||||
U.S. dollar | 22,035 | 18,020 | 12,879 | 12,128 | ||||||||||||
Strong bolivar | 14 | 601 | 76 | 22 | ||||||||||||
Other currency | 249 | 7,443 | 287 | 307 | ||||||||||||
Current assets | As of December 31, 2013 | As of December 31, 2012 | As of December 31, 2016 | As of December 31, 2015 | ||||||||||||
| ThUS$ | ThUS$ | ThUS$ | ThUS$ | |||||||||||||
Other non - financial assets | 56,218 | 53,493 | ||||||||||||||
Other non—financial assets, current | 107,789 | 126,130 | ||||||||||||||
Argentine peso | 5,310 | 3,740 | 16,086 | 14,719 | ||||||||||||
Brazilian real | 846 | 10,037 | 20,158 | 15,387 | ||||||||||||
Chilean peso | 16,846 | 15,310 | 1,619 | 10,265 | ||||||||||||
Colombian peso | 1,011 | 909 | 713 | 486 | ||||||||||||
Euro | 3,052 | 4,598 | 1,563 | 1,983 | ||||||||||||
U.S. dollar | 2,221 | 1,649 | 50,157 | 61,577 | ||||||||||||
Strong bolivar | 102 | 351 | 3 | — | ||||||||||||
Other currency | 26,830 | 16,899 | 17,490 | 21,713 | ||||||||||||
Trade and other accounts receivable | 417,775 | 503,601 | ||||||||||||||
Trade and other accounts receivable, current | 251,204 | 247,229 | ||||||||||||||
Argentine peso | 11,387 | 9,441 | 54,356 | 30,563 | ||||||||||||
Brazilian real | 19,986 | 33,313 | 30,675 | 11,136 | ||||||||||||
Chilean peso | 80,461 | 130,736 | 90,482 | 55,169 | ||||||||||||
Colombian peso | 2,240 | 3,153 | 9,720 | 1,195 | ||||||||||||
Euro | 21,479 | 67,287 | 21,923 | 30,006 | ||||||||||||
U.S. dollar | 114,372 | 166,758 | 14,086 | 29,937 | ||||||||||||
Strong bolivar | 2,353 | 2,759 | 43 | 7,225 | ||||||||||||
Other currency | 165,497 | 90,154 | 29,919 | 81,998 | ||||||||||||
Accounts receivable from related entities | 466 | 14,565 | ||||||||||||||
Accounts receivable from related entities, current | 554 | 181 | ||||||||||||||
Chilean peso | 466 | 14,565 | 554 | 181 | ||||||||||||
Tax assets | 14,836 | 11,060 | ||||||||||||||
Tax current assets | 28,198 | 22,717 | ||||||||||||||
Argentine peso | 1,798 | 2,371 | ||||||||||||||
Brazilian real | — | 716 | 2,462 | 5 | ||||||||||||
Chilean peso | 3,398 | 9,454 | 6,333 | 3,615 | ||||||||||||
Colombian peso | 787 | 15 | 1,418 | 1,275 | ||||||||||||
Euro | 35 | 20 | 273 | 14 | ||||||||||||
U.S. dollar | 515 | — | 177 | 1,394 | ||||||||||||
Peruvian sol | 14,387 | 12,572 | ||||||||||||||
Other currency | 10,101 | 855 | 1,350 | 1,471 | ||||||||||||
Total assets | 1,078,590 | 950,878 | ||||||||||||||
Total current assets | 603,734 | 702,388 | ||||||||||||||
Argentine peso | 58,674 | 81,886 | 76,690 | 167,856 | ||||||||||||
Brazilian real | 24,515 | 49,541 | 63,734 | 36,601 | ||||||||||||
Chilean peso | 356,938 | 210,706 | 129,794 | 87,532 | ||||||||||||
Colombian peso | 11,331 | 6,895 | 12,988 | 5,952 | ||||||||||||
Euro | 41,143 | 87,415 | 25,454 | 42,666 | ||||||||||||
U.S. Dollar | 183,799 | 280,462 | 205,993 | 217,458 | ||||||||||||
Strong bolivar | 165,278 | 55,057 | 183 | 10,233 | ||||||||||||
Other currency | 236,912 | 178,916 | 88,898 | 134,090 | ||||||||||||
Non-current assets | As of December 31, 2013 | As of December 31, 2012 | As of December 31, 2016 | As of December 31, 2015 | ||||||||||||
| ThUS$ | ThUS$ | ThUS$ | ThUS$ | |||||||||||||
Other financial assets | 17,517 | 31,329 | ||||||||||||||
Other financial assets, non-current | 26,772 | 20,767 | ||||||||||||||
Argentine peso | 24 | 8 | — | 22 | ||||||||||||
Brazilian real | 597 | 3,505 | 2,769 | 1,478 | ||||||||||||
Chilean peso | 1,701 | 98 | 83 | 77 | ||||||||||||
Colombian peso | 254 | 524 | 285 | 162 | ||||||||||||
Euro | 5,488 | 7,817 | 6,966 | 614 | ||||||||||||
U.S. dollar | 8,625 | 15,895 | 14,920 | 16,696 | ||||||||||||
Other currency | 828 | 3,482 | 1,749 | 1,718 | ||||||||||||
Other non - financial assets | 18,006 | 22,063 | ||||||||||||||
Other non—financial assets, non-current | 19,069 | 60,215 | ||||||||||||||
Argentine peso | 142 | 169 | ||||||||||||||
Brazilian real | 6,029 | 4,454 | ||||||||||||||
U.S. dollar | 8,309 | 50,108 | ||||||||||||||
Other currency | 18,006 | 22,063 | 4,589 | 5,484 | ||||||||||||
Accounts receivable | 13,429 | 14,812 | ||||||||||||||
Accounts receivable, non-current | 7,356 | 9,404 | ||||||||||||||
Chilean peso | 8,227 | 9,564 | 7,356 | 4,251 | ||||||||||||
U.S. dollar | 5,000 | 5,000 | — | 5,000 | ||||||||||||
Other currency | 202 | 248 | — | 153 | ||||||||||||
Deferred tax assets | 4,460 | 4,203 | 2,110 | 2,632 | ||||||||||||
U.S. dollar | 2,056 | — | ||||||||||||||
Colombian peso | 117 | 336 | ||||||||||||||
Other currency | 2,404 | 4,203 | 1,993 | 2,296 | ||||||||||||
Total assets | 53,412 | 72,407 | ||||||||||||||
Total non-current assets | �� | 55,307 | 93,018 | |||||||||||||
Argentine peso | 24 | 8 | 142 | 191 | ||||||||||||
Brazilian real | 597 | 3,505 | 8,798 | 5,932 | ||||||||||||
Chilean peso | 9,928 | 9,662 | 7,439 | 4,328 | ||||||||||||
Colombian peso | 254 | 524 | 402 | 498 | ||||||||||||
Euro | 5,488 | 7,817 | 6,966 | 614 | ||||||||||||
U.S. dollar | 15,681 | 20,895 | 23,229 | 71,804 | ||||||||||||
Other currency | 21,440 | 29,996 | 8,331 | 9,651 | ||||||||||||
The foreign currency detail of balances of monetary items in current liabilities and non-current is as follows:
| Up to 90 days | 91 days to 1 year | Up to 90 days | 91 days to 1 year | |||||||||||||||||||||||||||||
Current liabilities | As of December 31, 2013 | As of December 31, 2012 | As of December 31, 2013 | As of December 31, 2012 | As of December 31, 2016 | As of December 31, 2015 | As of December 31, 2016 | As of December 31, 2015 | ||||||||||||||||||||||||
| ThUS$ | ThUS$ | ThUS$ | ThUS$ | ThUS$ | ThUS$ | ThUS$ | ThUS$ | |||||||||||||||||||||||||
Other financial liabilities | 303,626 | 241,473 | 561,428 | 589,105 | ||||||||||||||||||||||||||||
Other financial liabilities, current | 287,175 | 94,199 | 455,086 | 141,992 | ||||||||||||||||||||||||||||
Chilean peso | 53,619 | — | 46,772 | — | 55,962 | 54,655 | 108,010 | 52,892 | ||||||||||||||||||||||||
Euro | 824 | 602 | 1,205 | 35 | ||||||||||||||||||||||||||||
U.S. dollar | 249,183 | 240,871 | 513,451 | 589,070 | 231,213 | 39,544 | 347,076 | (*) | 89,100 | |||||||||||||||||||||||
Trade and other accounts payables | 679,769 | 899,536 | 20,676 | 19,850 | ||||||||||||||||||||||||||||
Trade and other accounts payables, current | 585,149 | 482,402 | 16,097 | 14,981 | ||||||||||||||||||||||||||||
Argentine peso | 31,603 | 21,398 | — | — | 20,838 | 20,772 | 907 | 2,072 | ||||||||||||||||||||||||
Brazilian real | 9,671 | 38,506 | 8 | 8 | 40,740 | 37,572 | 27 | 16 | ||||||||||||||||||||||||
Chilean peso | 29,560 | 72,643 | 11,975 | 11,938 | 60,701 | 40,219 | 12,255 | 10,951 | ||||||||||||||||||||||||
Colombian peso | 14,445 | 29,268 | 422 | — | 9,049 | 5,271 | 578 | 155 | ||||||||||||||||||||||||
Euro | 19,373 | 38,540 | 3,316 | 1,695 | 23,445 | 5,275 | 5 | 618 | ||||||||||||||||||||||||
U.S. dollar | 433,377 | 283,003 | 4,902 | 6,157 | 374,431 | 310,565 | 962 | 839 | ||||||||||||||||||||||||
Strong bolivar | 4,024 | 2,710 | — | — | 761 | 2,627 | — | — | ||||||||||||||||||||||||
Peruvian sol | 33,701 | 28,293 | 1,093 | 87 | ||||||||||||||||||||||||||||
Mexican peso | 1,535 | 15,248 | — | 225 | ||||||||||||||||||||||||||||
Pound sterling | 1,769 | 7,819 | 246 | — | ||||||||||||||||||||||||||||
Uruguayan peso | 6,899 | 6,005 | — | — | ||||||||||||||||||||||||||||
Other currency | 137,716 | 413,468 | 53 | 52 | 11,280 | 2,736 | 24 | 18 | ||||||||||||||||||||||||
Accounts payable to related entities | 318 | 14 | — | — | ||||||||||||||||||||||||||||
Accounts payable to related entities, current | 220 | 447 | — | — | ||||||||||||||||||||||||||||
Chilean peso | 14 | 14 | — | — | 23 | 83 | — | — | ||||||||||||||||||||||||
U.S. dollar | 304 | — | — | — | 8 | 22 | — | — | ||||||||||||||||||||||||
Tax liabilities | 134 | 302 | — | — | ||||||||||||||||||||||||||||
Other currency | 189 | 342 | — | — | ||||||||||||||||||||||||||||
Other provisions, current | — | — | 511 | 457 | ||||||||||||||||||||||||||||
Chilean peso | 4 | 21 | — | — | — | — | 28 | 21 | ||||||||||||||||||||||||
Colombian peso | — | 150 | — | — | ||||||||||||||||||||||||||||
Other currency | �� | 130 | 131 | — | — | — | — | 483 | 436 | |||||||||||||||||||||||
Tax liabilities, current | (145 | ) | 36 | 2,442 | 9,037 | |||||||||||||||||||||||||||
Argentine peso | — | — | 2,501 | 9,036 | ||||||||||||||||||||||||||||
Brazilian real | (3 | ) | — | — | — | |||||||||||||||||||||||||||
Chilean peso | — | — | (25 | ) | — | |||||||||||||||||||||||||||
U.S. dollar | — | 27 | — | — | ||||||||||||||||||||||||||||
Other currency | (142 | ) | 9 | (34 | ) | 1 | ||||||||||||||||||||||||||
| Up to 90 days | 91 days to 1 year | Up to 90 days | 91 days to 1 year | |||||||||||||||||||||||||||||
Current liabilities | As of December 31, 2013 | As of December 31, 2012 | As of December 31, 2013 | As of December 31, 2012 | As of December 31, 2016 | As of December 31, 2015 | As of December 31, 2016 | As of December 31, 2015 | ||||||||||||||||||||||||
| ThUS$ | ThUS$ | ThUS$ | ThUS$ | ThUS$ | ThUS$ | ThUS$ | ThUS$ | |||||||||||||||||||||||||
Other non-financial liabilities | 76,040 | 14,337 | 72 | 13 | ||||||||||||||||||||||||||||
Other non-financial liabilities, current | 33,439 | 40,432 | — | — | ||||||||||||||||||||||||||||
Argentine peso | 10,710 | 2,125 | — | — | 13,463 | (2,387 | ) | — | — | |||||||||||||||||||||||
Brazilian real | 3,746 | 3,023 | 52 | 10 | 430 | 4,297 | — | — | ||||||||||||||||||||||||
Chilean peso | 37,227 | 3,478 | 19 | 2 | 14,999 | 32,228 | — | — | ||||||||||||||||||||||||
Colombian peso | 6,069 | 50 | — | — | 578 | 145 | — | — | ||||||||||||||||||||||||
Euro | 8,382 | 3,261 | — | — | 168 | 2,706 | — | — | ||||||||||||||||||||||||
U.S. dollar | 1,272 | 325 | — | — | 684 | (3,238 | ) | — | — | |||||||||||||||||||||||
Strong bolivar | 637 | 1,211 | — | — | 2 | 2,490 | — | — | ||||||||||||||||||||||||
Other currency | 7,997 | 864 | 1 | 1 | 3,115 | 4,191 | — | — | ||||||||||||||||||||||||
Total liabilities | 1,059,887 | 1,155,662 | 582,176 | 608,968 | ||||||||||||||||||||||||||||
Total current liabilities | 905,838 | 617,516 | 474,136 | 166,467 | ||||||||||||||||||||||||||||
Argentine peso | 42,313 | 23,523 | — | — | 34,301 | 18,385 | 3,408 | 11,108 | ||||||||||||||||||||||||
Brazilian real | 13,417 | 41,529 | 60 | 18 | 41,167 | 41,869 | 27 | 16 | ||||||||||||||||||||||||
Chilean peso | 120,424 | 76,156 | 58,766 | 11,940 | 131,685 | 127,185 | 120,268 | 63,864 | ||||||||||||||||||||||||
Colombian peso | 20,514 | 29,468 | 422 | — | 9,627 | 5,416 | 578 | 155 | ||||||||||||||||||||||||
Euro | 28,579 | 42,403 | 4,521 | 1,730 | 23,613 | 7,981 | 5 | 618 | ||||||||||||||||||||||||
U.S. dollar | 684,136 | 524,199 | 518,353 | 595,227 | 606,336 | 346,920 | 348,038 | 89,939 | ||||||||||||||||||||||||
Strong bolivar | 4,661 | 3,921 | — | — | 763 | 5,117 | — | — | ||||||||||||||||||||||||
Other currency | 145,843 | 414,463 | 54 | 53 | 58,346 | 64,643 | 1,812 | 767 | ||||||||||||||||||||||||
| (*) | See Note 19.a (2) |
| More than 1 to 3 years | More than 3 to 5 years | More than 5 years | ||||||||||||||||||||||||||||||||||||||||||||||
| As of | As of | As of | As of | As of | As of | |||||||||||||||||||||||||||||||||||||||||||
| More than 1 to 3 years | More than 3 to 5 years | More than 5 years | December 31, | December 31, | December 31, | December 31, | December 31, | December 31, | ||||||||||||||||||||||||||||||||||||||||
Non-current liabilities | As of December 31, 2013 | As of December 31, 2012 | As of December 31, 2013 | As of December 31, 2012 | As of December 31, 2013 | As of December 31, 2012 | 2016 | 2015 | 2016 | 2015 | 2016 | 2015 | ||||||||||||||||||||||||||||||||||||
| ThUS$ | ThUS$ | ThUS$ | ThUS$ | ThUS$ | ThUS$ | ThUS$ | ThUS$ | ThUS$ | ThUS$ | ThUS$ | ThUS$ | |||||||||||||||||||||||||||||||||||||
Other financial liabilities | 578,393 | 623,828 | 754,256 | 859,526 | 1,366,860 | 1,811,660 | ||||||||||||||||||||||||||||||||||||||||||
Other financial liabilities, non-current | 178,793 | 561,217 | 747,218 | 328,480 | 41,785 | 571,804 | ||||||||||||||||||||||||||||||||||||||||||
Chilean peso | 122,780 | — | 80,528 | — | — | — | 59,177 | 104,385 | 16,189 | 34,635 | — | — | ||||||||||||||||||||||||||||||||||||
Euro | — | 1,148 | — | — | — | — | ||||||||||||||||||||||||||||||||||||||||||
U.S. dollar | 455,613 | 622,680 | 673,728 | 859,526 | 1,366,860 | 1,811,660 | 119,616 | 456,832 | 731,029 | 293,845 | 41,785 | 571,804 | ||||||||||||||||||||||||||||||||||||
Accounts payable | 647,880 | 667,582 | 641 | 138 | 11 | — | ||||||||||||||||||||||||||||||||||||||||||
Accounts payable, non-current | 195,333 | 239,029 | 268 | 168 | 28 | 8 | ||||||||||||||||||||||||||||||||||||||||||
Chilean peso | 7,187 | 8,286 | 641 | 138 | 11 | — | 10,178 | 8,058 | 268 | 168 | 28 | 8 | ||||||||||||||||||||||||||||||||||||
U.S. dollar | 639,204 | 657,998 | — | — | — | — | 183,904 | 229,005 | — | — | — | — | ||||||||||||||||||||||||||||||||||||
Other currency | 1,489 | 1,298 | — | — | — | — | 1,251 | 1,966 | — | — | — | — | ||||||||||||||||||||||||||||||||||||
Other provisions | 11,929 | 16,187 | — | — | — | — | ||||||||||||||||||||||||||||||||||||||||||
Other provisions, non-current | 39,513 | 27,780 | — | — | — | — | ||||||||||||||||||||||||||||||||||||||||||
Argentine peso | 410 | 664 | — | — | — | — | 635 | 797 | — | — | — | — | ||||||||||||||||||||||||||||||||||||
Brazillian real | 146 | 808 | — | — | — | — | 23,541 | 11,009 | — | — | — | — | ||||||||||||||||||||||||||||||||||||
Chilean peso | — | 36 | — | — | — | — | 38 | — | — | — | — | — | ||||||||||||||||||||||||||||||||||||
Colombian peso | 569 | 198 | — | — | — | — | ||||||||||||||||||||||||||||||||||||||||||
Euro | 11,349 | 10,865 | — | — | — | — | 8,664 | 8,966 | — | — | — | — | ||||||||||||||||||||||||||||||||||||
U.S. dollar | 24 | — | — | — | — | — | 6,066 | 6,810 | — | — | — | — | ||||||||||||||||||||||||||||||||||||
Other currency | — | 3,814 | — | — | — | — | ||||||||||||||||||||||||||||||||||||||||||
Provisions for employees benefits | 636 | 86 | — | — | — | — | ||||||||||||||||||||||||||||||||||||||||||
Provisions for employees benefits, non-current | 68,774 | 56,306 | — | — | — | — | ||||||||||||||||||||||||||||||||||||||||||
Brazilian real | 28 | — | — | — | — | — | ||||||||||||||||||||||||||||||||||||||||||
Chilean peso | 68,380 | 56,306 | — | — | — | — | ||||||||||||||||||||||||||||||||||||||||||
U.S. dollar | 636 | 86 | — | — | — | — | 366 | — | — | — | — | — | ||||||||||||||||||||||||||||||||||||
Other non-financial liabilities, non-current | 3 | — | — | — | — | — | ||||||||||||||||||||||||||||||||||||||||||
Colombian peso | 3 | — | — | — | — | — | ||||||||||||||||||||||||||||||||||||||||||
Total non-current liabilities | 1,238,838 | 1,307,683 | 754,897 | 859,664 | 1,366,871 | 1,811,660 | 482,416 | 884,332 | 747,486 | 328,648 | 41,813 | 571,812 | ||||||||||||||||||||||||||||||||||||
Argentine peso | 410 | 664 | — | — | — | — | 635 | 797 | — | — | — | — | ||||||||||||||||||||||||||||||||||||
Brazilian real | 146 | 808 | — | — | — | — | 23,569 | 11,009 | — | — | — | — | ||||||||||||||||||||||||||||||||||||
Chilean peso | 129,967 | 8,322 | 81,169 | 138 | 11 | — | 137,773 | 168,749 | 16,457 | 34,803 | 28 | 8 | ||||||||||||||||||||||||||||||||||||
Colombian peso | 572 | 198 | — | — | — | — | ||||||||||||||||||||||||||||||||||||||||||
Euro | 11,349 | 12,013 | — | — | — | — | 8,664 | 8,966 | — | — | — | — | ||||||||||||||||||||||||||||||||||||
U.S. dollar | 1,095,477 | 1,280,764 | 673,728 | 859,526 | 1,366,860 | 1,811,660 | 309,952 | 692,647 | 731,029 | 293,845 | 41,785 | 571,804 | ||||||||||||||||||||||||||||||||||||
Other currency | 1,489 | 5,112 | — | — | — | — | 1,251 | 1,966 | — | — | — | — | ||||||||||||||||||||||||||||||||||||
| As of | As of | |||||||||||||||
| December 31, | December 31, | |||||||||||||||
General summary of foreign currency: | As of December 31, 2013 | As of December 31, 2012 | 2016 | 2015 | ||||||||||||
| ThUS$ | ThUS$ | ThUS$ | ThUS$ | |||||||||||||
Total assets | 1,132,002 | 1,023,285 | 659,041 | 795,406 | ||||||||||||
Argentine peso | 58,698 | 81,894 | 76,832 | 168,047 | ||||||||||||
Brazilian real | 25,112 | 53,046 | 72,532 | 42,533 | ||||||||||||
Chilean peso | 366,866 | 220,368 | 137,233 | 91,860 | ||||||||||||
Colombian peso | 11,585 | 7,419 | 13,390 | 6,450 | ||||||||||||
Euro | 46,631 | 95,232 | 32,420 | 43,280 | ||||||||||||
U.S. dollar | 199,480 | 301,357 | 229,222 | 289,262 | ||||||||||||
Strong bolivar | 165,278 | 55,057 | 183 | 10,233 | ||||||||||||
Other currency | 258,352 | 208,912 | 97,229 | 143,741 | ||||||||||||
Total liabilities | 5,002,669 | 5,743,637 | 2,651,689 | 2,568,775 | ||||||||||||
Argentine peso | 42,723 | 24,187 | 38,344 | 30,290 | ||||||||||||
Brazilian real | 13,623 | 42,355 | 64,763 | 52,894 | ||||||||||||
Chilean peso | 390,337 | 96,556 | 406,211 | 394,609 | ||||||||||||
Colombian peso | 20,936 | 29,468 | 10,777 | 5,769 | ||||||||||||
Euro | 44,449 | 56,146 | 32,282 | 17,565 | ||||||||||||
U.S. dollar | 4,338,554 | 5,071,376 | 2,037,140 | 1,995,155 | ||||||||||||
Strong bolivar | 4,661 | 3,921 | 763 | 5,117 | ||||||||||||
Other currency | 147,386 | 419,628 | 61,409 | 67,376 | ||||||||||||
Net position | ||||||||||||||||
Argentine peso | 15,975 | 57,707 | 38,488 | 137,757 | ||||||||||||
Brazilian real | 11,489 | 10,691 | 7,769 | (10,361 | ) | |||||||||||
Chilean peso | (23,471 | ) | 123,812 | (268,978 | ) | (302,749 | ) | |||||||||
Colombian peso | (9,351 | ) | (22,049 | ) | 2,613 | 681 | ||||||||||
Euro | 2,182 | 39,086 | 138 | 25,715 | ||||||||||||
U.S. dollar | (4,139,074 | ) | (4,770,019 | ) | (1,807,918 | ) | (1,705,893 | ) | ||||||||
Strong bolivar | 160,617 | 51,136 | (580 | ) | 5,116 | |||||||||||
Other currency | 110,966 | (210,716 | ) | 35,820 | 76,365 | |||||||||||
b) Exchange differences
| (b) | Exchange differences |
Exchange differences recognized in the income statement, except for financial instruments measured at fair value through profit or loss, for the period ended December 31, 2013, 20122016 and 2011,2015, generated a lossdebit of ThUS$ 482,174, a gain of ThUS$ 66,685121,651 and a loss or thecharge ThUS$ 256,467,896, respectively.
Exchange differences recognized in equity as reserves for currency translation differences for the period ended December 31, 2013, 20122016 and 2011,2015, represented a lossdebit of ThUS$ 629,858, a gain of ThUS$ 19,170494,362 and a losscharge ThUS$ 10,864,1,409,439, respectively.
The following shows the current exchange rates for the U.S. dollar, on the dates indicated:
| As of December 31, | ||||||||||||||||||||
| As of December 31, 2013 | As of December 31, 2012 | 2016 | 2015 | 2014 | ||||||||||||||||
Argentine peso | 6.52 | 4.91 | 15.84 | 12.97 | 8.55 | |||||||||||||||
Brazilian real | 2.36 | 2.04 | 3.25 | 3.98 | 2.66 | |||||||||||||||
Chilean peso | 524.61 | 479.96 | 669.47 | 710.16 | 606.75 | |||||||||||||||
Colombian peso | 1,925.52 | 1,760.00 | 3,000.25 | 3,183.00 | 2,389.50 | |||||||||||||||
Euro | 0.72 | 0.76 | 0.95 | 0.92 | 0.82 | |||||||||||||||
Strong bolivar | 6.30 | 4.30 | 673.76 | 198.70 | 12.00 | |||||||||||||||
Australian dollar | 1.12 | 0.96 | 1.38 | 1.37 | 1.22 | |||||||||||||||
Boliviano | 6.86 | 6.86 | 6.86 | 6.85 | 6.86 | |||||||||||||||
Mexican peso | 13.07 | 12.99 | 20.63 | 17.34 | 14.74 | |||||||||||||||
New Zealand dollar | 1.22 | 1.22 | 1.44 | 1.46 | 1.28 | |||||||||||||||
Peruvian Sol | 2.80 | 2.55 | 3.35 | 3.41 | 2.99 | |||||||||||||||
Uruguayan peso | 21.49 | 19.05 | 29.28 | 29.88 | 24.25 | |||||||||||||||
NOTE 34 - 30—EARNINGS / (LOSS) PER SHARE
| For the periods ended | ||||||||||||
| December 31, | ||||||||||||
| Basic earnings | 2013 | 2012 (*) | 2011 | |||||||||
Earnings attributable to controlling company’s equity holders (ThUS$) | (281,114 | ) | (19,076 | ) | 320,197 | |||||||
Weighted average number of shares, basic | 487,930,977 | 412,267,624 | 339,424,598 | |||||||||
Basic earnings per share (US$) | (0.57613 | ) | (0.04627 | ) | 0.94335 | |||||||
| For the periods ended | ||||||||||||
| December 31, | ||||||||||||
| Diluted earnings | 2013 | 2012 (*) | 2011 | |||||||||
Earnings attributable to controlling company’s equity holders (ThUS$) | (281,114 | ) | (19,076 | ) | 320,197 | |||||||
Weighted average number of shares, basic | 487,930,977 | 412,267,624 | 339,424,598 | |||||||||
Adjustment diluted weighted average shares Stock options | — | — | 271,380 | |||||||||
|
|
|
|
|
| |||||||
Weighted average number of shares, diluted | 487,930,977 | 412,267,624 | 339,695,978 | |||||||||
|
|
|
|
|
| |||||||
Diluted earnings per share (US$) | (0.57613 | ) | (0.04627 | ) | 0.94260 | |||||||
| For the period ended | ||||||||||||
| December 31, | ||||||||||||
| Basic earnings / (loss) per share | 2016 | 2015 | 2014 | |||||||||
Earnings / (loss) attributable to owners of the parent (ThUS$) | 69,220 | (219,274 | ) | (259,985 | ) | |||||||
Weighted average number of shares, basic | 546,559,599 | 545,547,819 | 545,547,819 | |||||||||
Basic earnings / (loss) per share (US$) | 0.12665 | (0.40193 | ) | (0.47656 | ) | |||||||
| For the period ended | ||||||||||||
| December 31, | ||||||||||||
| Diluted earnings / (loss) per share | 2016 | 2015 | 2014 | |||||||||
Earnings / (loss) attributable to owners of the parent (ThUS$) | 69,220 | (219,274 | ) | (259,985 | ) | |||||||
Weighted average number of shares, basic | 546,559,599 | 545,547,819 | 545,547,819 | |||||||||
|
|
|
|
|
| |||||||
Weighted average number of shares, diluted | 546,559,599 | 545,547,819 | 545,547,819 | |||||||||
|
|
|
|
|
| |||||||
Diluted earnings / (loss) per share (US$) | 0.12665 | (0.40193 | ) | (0.47656 | ) | |||||||
In the calculation of diluted earnings per share have not been considered the compensation plan disclosed in Note 34 (a.1), because the average market price is lower than the price of options.
Lawsuits
| I. | Lawsuits |
(i) Lawsuits filed by LATAM Airlines Group S.A. and Subsidiaries
| 1) | Lawsuits filed by LATAM Airlines Group S.A. and Subsidiaries |
Company | Court | Case Number | Origin | Stage of trial | Amounts Committed | |||||
(*) ThUS$ | ||||||||||
Atlantic Aviation Investments LLC (AAI). | Supreme Court of the State of New York County of New York. | 07-6022920 | Atlantic Aviation Investments LLC. (“AAI”), an indirect subsidiary LATAM Airlines Group S.A., incorporated under the laws of the State of Delaware, sued in August | In implementation stage in Switzerland, the conviction stated that Variglog should pay the principal, interest and costs in favor of AAI. It keeps the embargo of Variglog funds in Switzerland with AAI. | 17,100 Plus and | |||||
|
|
|
|
|
| ||||||||||||
| |||||||||||||||
|
|
| |||||||||||||
|
| ||||||||||||||
|
| ||||||||||||||
|
|
| |||||||||||||
|
|
|
| |||||||
Lan Argentina S.A. | National Administrative Court. | 36337/13 | ORSNA Resolution No. 123 which directs Lan Argentina to vacate the hangar located in the | On February 25, 2016, Lan Argentina Consequently, the legal structure created by the ORSNA through the 2012 Resolution was left without any effect in | ||||||
|
(ii) Trials received by LATAM Airlines Group S.A. and Subsidiaries
| 2) | Lawsuits received by LATAM Airlines Group S.A. and Subsidiaries |
Company | Court | Case Number | Origin | Stage of trial | Amounts Committed | (*) | ||||||
| ThUS$ | ||||||||||||
LATAM Airlines Group S.A. y Lan Cargo S.A. | European Commission. | — | Investigation | On April 14th, 2008, the notification of the European Commission was replied. The appeal was filed on January 24, 2011. On May 11, 2015, we attended a On November 9th, 2010, the General Directorate This | ||||||||
Company | Court | Case Number | Origin | Stage of | Amounts Committed (*) | |||||||
| ThUS$ | ||||||||||||
Lan Cargo S.A. y LATAM Airlines Group S.A. | In the High Court of Justice Chancery División (England) Ovre Romerike District Court (Norway) y Directie Juridische Zaken Afdeling Ceveil Recht (Netherlands) , Cologne Regional Court (Landgerich Köln Germany). | — | Lawsuits filed against European airlines by users of freight services in private | |||||||||
| Aerolinhas Brasileiras S.A. | Federal Justice. | 0008285- 53.2015.403.6105 | An action seeking to quash a decision and petioning for early protection in order to obgain a revocation of the penalty imposed by the Brazilian Competition Authority (CADE) in the investigation of cargo airlines alleged fair trade violations, in particular the fuel surcharge. | This action was filed by presenting a guaranty – policy – in order to suspend the effects of the CADE’s decision regarding the payment of the following fines: (i) ABSA: ThUS$10,438; (ii) Norberto Jochmann: ThUS$201; (iii) Hernan Merino: ThUS$ 102; (iv) Felipe Meyer :ThUS$ 102. The action also deals with the affirmative obligation required by the CADE consisting of the duty to publish the condemnation in a widely circulating newspaper. This obligation had also been stayed by the court of federal justice in this process. Awaiting CADE’s statement. | 10,438 | |||||||
| Aerolinhas Brasileiras S.A. | Federal Justice. | 0001872- 58.2014.4.03.6105 | An annulment action with a motion for preliminary injunction, was filed on 28/02/2014, in order to cancel tax debts of PIS, CONFINS, IPI and II, connected with the administrative process 10831.005704/2006.43. | We have been waiting since August 21, 2015 for a statement by Serasa on TAM’s letter of indemnity and a statement by the Union. The statement was authenticated on January 29, 2016. A petition on evidence and replications were filed on June 20, 2016. | 11,140 | |||||||
Company | Court | Case Number | Origin | | Stage of trial | Amounts Committed (*) ThUS$ | ||||||
Tam Linhas Aéreas S.A. | Department of Federal Revenue of Brazil | 19515.722556/2012-21 | Alleged irregularities in the SAT payments for the periods 01/2009 to 13/2009. | A judgment by the Administrative Council of Tax Appeals (CARF) has been pending since February 27, 2015. | 2,151 | |||||||
Tam Linhas Aéreas S.A. | Department of Federal Revenue of Brazil | 19515.721155/2014-15 | Alleged irregularities in the SAT payments for the periods 01/2010 to 13/2010. | A decision was rendered in favor of Tam Linhas Aéreas S.A. on August 22, 2016. The Attorney General has said it will not appeal. | 25,515 | |||||||
Tam Linhas Aéreas S.A. | Department of Federal Revenue of Brazil | 19515.720476/2015-83 | Alleged irregularities in the SAT payments for the periods 01/2011 to 12/2012 | A judgment by CARF is pending since April 12, 2016. | 52,414 | |||||||
Tam Linhas Aéreas S.A. | Court of the Second Region. | 2001.51.01.012530-0 | Ordinary judicial action brought for the purpose of declaring the nonexistence of legal relationship obligating the company to collect the Air Fund. | Unfavorable court decision in first instance. Currently expecting the ruling on the appeal filed by the company. In order to suspend chargeability of Tax Credit a Guaranty Deposit to the Court was delivered for MUS$115. The court decision requesting that the Expert make all clarifications requested by the parties in a period of 30 days was published on March 29, 2016. The plaintiffs’ submitted a petition on June 21, 2016 requesting acceptance of the opinion of their consultant and an urgent ruling on the dispute. No amount additional to the deposit that has already been made is required if this case is lost. | 115,265 | |||||||
| Tam Linhas Aéreas S.A. | Administrative Council of Tax Appeals | 19.515.002963/2009-12, 19515.722555/2012-86, 19515.721154/2014-71, 19515.720475/2015-39 | Collection of contributions to the Aviation Fund for the periods from 01/2004 to 12/2004, from 12/2006 to 12/2008, from 01/2009 to 12/2010, and from 01/2011 to 10/2012. | A judgment is pending by CARF since February 5, 2016. | 65,788 | |||||||
Company | Court | Case Number | Origin | Stage of trial | Amounts Committed (*) | |||||||||
| ThUS$ | ||||||||||||||
| Revenue Service of Brazil. | 22,225 | ||||||||||||
Aéreas S.A. | Revenue Service of Brazil. | The objection (manifestação de inconformidade) filed by the company was rejected, which is why the voluntary appeal was filed. The case was assigned to the | 43,341 | |||||||||||
| Aerovías de Integración Regional, AIRES S.A. | States Court of Appeals for the Eleventh Circuit, Florida, U.S.A. | |||||||||||||
| 2013-20319 CA 01 |
The June 20th , 2013 AIRES SA And / Or LAN AIRLINES COLOMBIA was notified of the lawsuit filed in U.S. for Regional One INC and Dash 224 LLC for damages caused by the aircraft HK-4107 arguing failure of LAN COLOMBIA AIRLINES customs duty to obtain import declaration when the aircraft in April 2010 entered Colombia for maintenance required by Regional One. | This case is being heard by the 45th Civil Court of the Bogota Circuit. In an interim decree issued August 16, 2016, the hearing under article 101 was set for February 2, 2017, this hearing was postponed at request of the parties and the Judge must resolve on a new date. When a reconciliation will be attempted, facts of the case will be set, the parties will conduct depositions and evidence will be decreed. The Federal | 12,443 | |||||||||||
Company | Court | Case Number | Origin | Stage of trial | Amounts Committed (*) | |||||||
| ThUS$ | ||||||||||||
| ||||||||||||
|
| |||||||||||
Tam Linhas Aéreas S.A. | Revenue Service of Brazil | 10880.722.355/2014-52 | On August 19th , 2014 the Federal | An administrative objection was filed on September 17th, 2014. A first-instance ruling was rendered on June 1, 2016 that was partially favorable. The separate fine was revoked. A voluntary appeal was filed on June 30, 2016, which is pending a decision by CARF. | 53,967 | |||||||
| Tam Viagens S.A. | Department of Finance to the municipality of São Paulo. | 67.168.795 / 67.168.833 / 67.168.884 / 67.168.906 / 67.168.914 / 67.168.965 | A claim was filed alleging infraction and seeking a fine because of a deficient basis for calculation of the | 89,624 | ||||||||
| ||||||||||||
Tam Linhas Aéreas S.A. | São Paulo. | 78.2014.5.02.0045 | Action filed by the Ministry of Labor, which requires compliance with legislation on breaks, extra hours and others. | Early stage. Eventually could affect the operations and control of working hours of employees. The company won in the first instance, but an appeal by the Union is expected. | 16,211 | |||||||
| TAM S.A. | Conselho Administrativo de Recursos Fiscais. | 13855.720077/2014-02 | Notice of | |||||||||
| ||||||||||||
Company | Court | Case Number | Origin | Stage of trial | Amounts Committed (*) | ||||||||||||
| ThUS$ | |||||||||||||||||
| 1° Civil Court of Comarca of Bauru/ SP. | 0049304- 37.2009.8.26.0071/1 | That action is filed by the current complainants against the defendant, TAM Linhas Aéreas | 7,057 | |||||||||||||
| |||||||||||||||||
| |||||||||||||||||
| Labor Campinas. | 37.2014.5.15.0095 |
|
| |||||||||||||
| An agreement for ThUS$2,732 was reached with the Union on August 2, 2016. Payment is now being made. | 16.365 | ||||||||||||||||
| |||||||||||||||||
| |||||||||||||||||
| |||||||||||||||||
| |||||||||||||||||
Company Court Origin Stage of trial Tam Linhas Aéreas S.A. Tam Linhas Aéreas S.A. Tam Linhas Aéreas S.A. Tam Linhas Aéreas S.A. Tam Linhas Aéreas S.A. Tam Linhas Aéreas S.A. Case Number Amounts
Committed ThUS$ Secretary of Federal Revenues of Brazil (Internal Revenue Service of Brazil). 11610.001360/2001-56 Application for reimbursement of social security contributions of PIS. Unfavorable ruling in the first and second administrative instances. Currently expecting fiscal execution ruling. 7,732 Secretary of Finance of the State of Sao Paulo (Secretary of Finance of the State of Sao Paulo). 3.117.001-8 Notice of infringement demanding payment of ICMS on imports of aircraft. Under the laws of the state of São Paulo, the Administrative Court was to declare the agreement of the matter discussed in the infraction and the related injunction, so the case was referred to the State Attorney and a determination is expected on that demand. 7,599 Tribunal Regional Federal da 3a Região (Court of the Third Region). 2006.03.00.022504-6 Penalty forcing IRPJ collection in the months of February, March and August 1998. Pending first instance ruling. 7,036 Secretaria da Fazenda do Estado de São Paulo (Secretary of Finance of the State of Sao Paulo). 3.120.286-0 Order of infringement to demand payment of ICMS governing the importation of aircraft. Trial suspended. It now expects the end of main trial. 6,311 Governo do Estado de São Paulo (State Government of Sao Paulo). 990.172 Fiscal Execution to demand payment of ICMS that affects the import of aircraft. Trial suspended. It now expects the end of main trial. 5,971 Secretaria da Fazenda do Estado de São Paulo (Secretary of Finance of the State of Sao Paulo). 3.123.000-3 Order of infringement to demand payment of ICMS governing the importation of aircraft. Trial suspended. It now expects the end of main trial. 5,749
| Sao Paulo Sao Paulo | 45.2016.5.02.090 |
|
| |||||||||||||
| Labor withdrew its complaint. | 15,917 | ||||||||||||||||
| - | ||||||||||
| ||||||||||
| ||||||||||
| ||||||||||
| ||||||||||
| ||||||||||
|
Company Court Origin Stage of trial Tam Linhas Aéreas S.A. Tam Linhas Aéreas S.A. Tam Linhas Aéreas S.A. Tam Linhas Aéreas S.A. Tam Linhas Aéreas S.A. Tam Linhas Aéreas S.A. Case Number Amounts
Committed ThUS$ Secretaria da Fazenda do Estado de São Paulo (Secretary of Finance of the State of Sao Paulo). 3.123.770-8 Order of infringement to demand payment of ICMS governing the importation of aircraft. Under the laws of the state of São Paulo, the Administrative Court was to declare the agreement of the matter discussed in the infraction and the related injunction, so the case was referred to the State Attorney and a determination is expected on that demand. 4,814 Secretaria da Fazenda do Estado de São Paulo (Secretary of Finance of the State of Sao Paulo). 3.154.701-1 Order of infringement to demand payment of ICMS governing the importation of aircraft. Expected the ruling on impeachment filed by the Company. 4,708 Secretaria da Fazenda do Estado de São Paulo (Secretary of Finance of the State of Sao Paulo). 3.146.575-4 Order of infringement to demand payment of ICMS governing the importation of aircraft. Trial suspended. It now expects the end of main trial. 4,562 Secretaria da Receita Federal (Internal Revenue Service). 10880-676.339/2009-13 Order of infringement to demand payment of IRPJ. Expected the ruling on impeachment filed by the Company. 4,523 Secretaria da Fazenda do Estado de São Paulo (Secretary of Finance of the State of Sao Paulo). 3.146.651-5 Order of infringement to demand payment of ICMS governing the importation of aircraft. Trial suspended. It now expects the end of main trial. 4,445 Secretaria da Fazenda do Estado de Goiás (Secretary of Finance of Estado de Goias). 3032722060291 Order of infringement to demand payment of ICMS in particular operations. Currently awaiting a ruling on the appeal filed by the Company. 4,218
| - | ||||||||||
The Company |
|
|
| |||||||
|
| (*) | The Company has reported the | |||||||||
| ||||||||||
| ||||||||||
| ||||||||||
|
|
| II. | Governmental Investigations. | |||||||||
|
Court
Origin
Stage of trial
| 1) | ||||||||||
|
| |||||||||
| ||||||||||
| ||||||||||
| ||||||||||
|
Company Court Origin Stage of trial Aerovias de Integración Regional AIRES S.A. In July 30, 2012 LAN AIRLINES COLOMBIA initiated legal proceedings in Colombia against regional One Inc. and Volvo Aero Services LLC, in order to declare that these companies are civilly liable for moral and material damages caused to LAN AIRLINES COLOMBIA , arising from breach of contractual obligations of the aircraft HK In June 20, 2013 AIRES SA AND / OR LAN AIRLINES COLOMBIA was notified of the lawsuit filed in the U.S. by INC and Dash regional One 224 LLC for damages caused by the aircraft HK claiming COLOMBIA LAN AIRLINES had the requirement to obtain customs import declaration when the aircraft in April 2010 entered Colombia for maintenance required by Regional One. The process in Colombia is pending resolution of preliminary objections filed by the defendant As for the process in the U.S. Federal Court is deciding whether the process follows on as a court with jurisdiction in Colombia is resolving a parallel demand in Colombia Although continues pending the decision to declare or not without case in the U.S. by the judge, the court has noted a date for trial in August 2014 if the decision is to grant the request to the case in the U.S.. Tam Linhas Aéreas S.A. Tam Linhas Aéreas S.A. Case Number Amounts
Committed ThUS$ Florida USA. 2013-20319 CA 01 12,443 Secretaria da Receita Federal (Internal Revenue Service of Brazil). 10880-926.383/2013-66 Decision of the Internal Revenue Service does not approve compensation made by the company in the application for refund of income tax for 2009. Pending the result of the dissatisfaction expressed by the company. 6,826 Secretaria da Receita Federal (Internal Revenue Service of Brazil). 1720130100068 Notice of infraction to demand tax credit is due, as the company would have improperly excluded amounts paid as interest on own capital for the years 2010 and 2011. Pending the result of the objection filed by the company. 5,234
|
|
|
| |||||||
|
InThe purpose of the investigation was to determine whether these payments violated the U.S. Foreign Corrupt Practices Act (“FCPA”) that: (i) forbids bribery of foreign government authorities in order to dealobtain a commercial advantage; and (ii) requires the companies that must abide by the FCPA to keep appropriate accounting records and implant an adequate internal control system. The FCPA is applicable to LATAM because of its ADR program in effect on the U.S. securities market.
After an exhaustive investigation, the DOJ and SEC concluded that there was no violation of the bribery provisions of the FCPA, which is consistent with any financialthe results of LATAM’s internal investigation. However, the DOJ and SEC consider that LAN accounted for these payments incorrectly and, consequently, infringed the part of the FCPA requiring companies to keep accurate accounting records. These authorities also consider that LAN’s internal controls in 2006-2007 were weak, so LAN would have also violated the provisions in the FCPA requiring it to maintain an adequate internal control system.
The agreements signed, included the following:
(a) The agreement with the DOJ involves: (i) entering into a Deferred Prosecution Agreement (“DPA”), which is a public contract under which the DOJ files public charges alleging an infringement of the FCPA accounting regulations. LATAM is not obligated to answer these charges, the DOJ will not pursue them for a period of 3 years, and the DOJ will dismiss the charges after expiration of that 3-year period provided LATAM complies with all terms of the DPA. In exchange, LATAM admitted events described in the DOJ charges for infringement to the FCPA rules on accounting records and agreed to pay the negotiated fine explained below and abide by other terms stipulated in the agreement; (ii) clauses in which LATAM admits that the payments to the consultant in Argentina were incorrectly accounted for and that at the time those payments were made (2006-2007), it did not have adequate internal controls in place; (iii) LATAM’s agreement to have an outside consultant monitor, evaluate and report to the DOJ on the effectiveness of LATAM’s compliance program for a period of 27 months; and LATAM’s agreement to continue evaluating and reporting directly to the DOJ on the effectiveness of its compliance program for a period of 9 months after the consultant’s work concludes; and (iv) paying a fine estimated to total approximately ThUS$ 12,750.
(b) The agreement with the SEC involves: (i) accepting a Cease and Desist Order, which is an administrative resolution of the SEC closing the investigation, in which LATAM will accept certain obligations arising from legal proceedings outstandingand statements of fact that are described in the document; (ii) accepting the same obligations regarding the consultant mentioned above; and (iii) paying the sum of ThUS$ 6,744, plus interest of ThUS$ 2,694.
As at December 31, 2013, whether civil, labor or tax, LATAM Airlines Group S.A., has made provisions, which are included in heading Other provisions, non-current, which is disclosed2016, a balance of ThUS$ 4,719 was payable to the SEC, as reported in Note 23.20—Trade payables and other payables.
The Company has not disclosed the individual probability of success for each contingency in order to not negatively affect its outcome.
| 2) | LATAM Airlines Ecuador was given notice on August 26, 2016 of an investigation of LATAM Airlines Ecuador and two other airlines begun, at its own initiative, by one of the Investigative Departments of the Ecuadoran Market Power Control Commission, limited to alleged signs of conscious parallelism in relation to specific fares on one domestic route in Ecuador from August 2012 to February 2013. The Investigative Department had 180 days (due February 21, 2017) extendable for another 180 days, to resolve on whether to close the investigation or file charges against two or more of the parties involved, only event in which a process will be opened. On February 21, 2017, the period of 180 days was extended for another 180 days requesting additional information. LATAM Airlines Ecuador is cooperating with the authority and has hired a law firm and an economist expert in the subject to advise the company during this process. |
| 3) | LATAM received two Information Requests from the Central-North Metropolitan Region Prosecutor’s Office, one on October 25, 2016 and the other on November 11, 2016, requesting information relating to the investigation of payments made by Lan Airlines S.A. to a consultant advising it on the solution to labor matters in Argentina in the years 2006-2007. The information requested in both Requests has been provided. |
(a) Loan covenants
| (a) | Loan covenants |
With respect to various loans signed by the Company for the financing of Boeing 767, 777767F, 777F and 787 aircraft, which carry the guarantee of the United States Export–Import Bank, limits have been set on some of the Company’s financial indicators on a consolidated basis. Moreover, and related to these same contracts, restrictions are also in place on the Company’s management in terms of its ownership and disposal of assets.
Additionally, with respect to various loans signed by its subsidiary Lan Cargo S.A. for the financing of Boeing 767F and 777F aircraft, which carry the guarantee of the United States Export–Import Bank, restrictions have been established to the Company’s management and its subsidiary Lan Cargo S.A. in terms of shareholder composition and disposal of assets.
In connection with the financing of spare engines for its Boeing 767, 767F, 777, 777F and 787, which are guaranteed by the Export—Import Bank of the United States, restrictions have been placed on the ownership structure of their guarantors and their legal successor in case of merger.
The Company and its subsidiaries do not maintain financial credit contracts with local banks in Chile that indicate some limits on financial indicators of the Company or its subsidiaries.
On March 30, 2016, LATAM structured a Revolving Credit Facility granted by with aircraft, engines, spare parts and supplies for a total amount available of US$ 325 million, this line includes restrictions minimum liquidity level as the consolidated company and individual level as for companies LATAM Airlines Group S.A. and TAM Linhas Aereas S.A.
At December 31, 2013,2016, the Company is in compliance with all indicators detailed above.
(b) Commitments under operating leases as lessee
| (b) | Commitments under operating leases as lessee |
Details of the main operating leases are as follows:
Lessor | Aircraft | As of December 31, 2013 | As of December 31, 2012 | |||||||
ACS Aircraft Finance Bermuda Ltd. - Aircastle (WFBN) | Boeing 737 | 1 | 1 | |||||||
Air Canada (Sublessor) | Airbus A340 | — | 1 | |||||||
Airbus Financial Services | Airbus A340 | 3 | 2 | |||||||
Aircraft 76B-26261 Inc. (ILFC) | Boeing 767 | — | 1 | |||||||
Aircraft 76B-26329 Inc. (ILFC) | Boeing 767 | 1 | 1 | |||||||
Aircraft 76B-27613 Inc. (ILFC) | Boeing 767 | 1 | 1 | |||||||
Aircraft 76B-27615 Inc. (ILFC) | Boeing 767 | 1 | 1 | |||||||
Aircraft 76B-28206 Inc. (ILFC) | Boeing 767 | 1 | 1 | |||||||
Aircraft Solutions Lux V S.ÀR.L. (AVMAX) | Bombardier Dhc8-200 | — | 1 | |||||||
ALC A319 1703, LLC (*) | Airbus A319 | — | 1 | |||||||
Aviacion Centaurus, A.I.E (Santander) (*) | Airbus A319 | 3 | 3 | |||||||
Aviación Centaurus, A.I.E. (*) | Airbus A321 | 1 | 1 | |||||||
Aviación Real A.I.E (*) | Airbus A319 | 1 | 1 | |||||||
Aviación Real A.I.E (*) | Airbus A320 | 1 | 1 | |||||||
Aviación Tritón A.I.E. (*) | Airbus A319 | 3 | 3 | |||||||
Avolon Aerospace AOE 19 Limited | Airbus A320 | 1 | 1 | |||||||
Avolon Aerospace AOE 20 Limited | Airbus A320 | 1 | 1 | |||||||
Avolon Aerospace AOE 6 Limited | Airbus A320 | 1 | 1 | |||||||
Avolon Aerospace AOE 62 Limited | Boeing 777 | 1 | — | |||||||
Avolon Aerospace AOE 63 Limited | Boeing 787 | 1 | — | |||||||
AWAS (SWEDEN TWO) AB (*) | Airbus A320 | — | 2 | |||||||
AWAS 4839 Trust | Airbus A320 | 1 | 1 | |||||||
AWAS 5125 Trust | Airbus A320 | 1 | 1 | |||||||
AWAS 5178 Limited | Airbus A320 | 1 | 1 | |||||||
AWAS 5234 Trust | Airbus A320 | 1 | 1 | |||||||
Baker & Spice Aviation Limited (*) | Airbus A320 | 2 | 2 | |||||||
BOC Aviation Pte. Ltd. | Airbus A320 | 1 | 1 | |||||||
Celestial Aviation Trading 35 Ltd. (GECAS) | Boeing 767 | — | 1 | |||||||
CIT Aerospace International | Boeing 767 | 1 | 1 | |||||||
CIT Aerospace International (*) | Airbus A319 | 1 | 3 | |||||||
CIT Aerospace International (*) | Airbus A320 | 4 | 4 | |||||||
Continuity Air Finance IV B.V (BOC) (*) | Airbus A319 | 1 | 1 | |||||||
Delaware Trust Company, National Association (CRAFT) | Bombardier Dhc8-200 | 7 | 9 | |||||||
Eden Irish Aircr Leasing MSN 1459 (AERCAP) (*) | Airbus A320 | 1 | 1 | |||||||
GECAS Sverige Aircraft Leasing Worldwide AB (*) | Airbus A320 | 10 | 10 | |||||||
Lessor | Aircraft | As of December 31, 2016 | As of December 31, 2015 | |||||||
Aircraft 76B-26329 Inc. | Boeing 767 | 1 | 1 | |||||||
Aircraft 76B-27615 Inc. | Boeing 767 | 1 | 1 | |||||||
Aircraft 76B-28206 Inc. | Boeing 767 | 1 | 1 | |||||||
Aviación Centaurus, A.I.E. | Airbus A319 | 3 | 3 | |||||||
Aviación Centaurus, A.I.E. | Airbus A321 | 1 | 1 | |||||||
Aviación Real A.I.E. | Airbus A319 | 1 | 1 | |||||||
Aviación Real A.I.E. | Airbus A320 | 1 | 1 | |||||||
Aviación Tritón A.I.E. | Airbus A319 | 3 | 3 | |||||||
Avolon Aerospace AOE 19 Limited | Airbus A320 | 1 | 1 | |||||||
Avolon Aerospace AOE 20 Limited | Airbus A320 | 1 | 1 | |||||||
Avolon Aerospace AOE 6 Limited | Airbus A320 | 1 | 1 | |||||||
Avolon Aerospace AOE 62 Limited | Boeing 777 | 1 | 1 | |||||||
AWAS 5125 Trust | Airbus A320 | — | 1 | |||||||
AWAS 5178 Limited | Airbus A320 | — | 1 | |||||||
AWAS 5234 Trust | Airbus A320 | 1 | 1 | |||||||
Baker & Spice Aviation Limited | Airbus A320 | 1 | 1 | |||||||
Bank of America | Airbus A321 | 2 | 3 | |||||||
CIT Aerospace International | Airbus A320 | 2 | 2 | |||||||
ECAF I 1215 DAC | Airbus A320 | 1 | 1 | |||||||
ECAF I 2838 DAC | Airbus A320 | 1 | 1 | |||||||
ECAF I 40589 DAC | Boeing 777 | 1 | 1 | |||||||
Eden Irish Aircr Leasing MSN 1459 | Airbus A320 | 1 | 1 | |||||||
GECAS Sverige Aircraft Leasing Worldwide AB | Airbus A320 | 1 | 3 | |||||||
GFL Aircraft Leasing Netherlands B.V. | Airbus A320 | 1 | 1 | |||||||
IC Airlease One Limited | Airbus A321 | 1 | — | |||||||
International Lease Finance Corporation | Boeing 767 | — | 1 | |||||||
JSA Aircraft 38484, LLC | Boeing 787 | 1 | 1 | |||||||
JSA Aircraft 7126, LLC | Airbus A320 | 1 | — | |||||||
JSA Aircraft 7128, LLC | Airbus A321 | 1 | — | |||||||
JSA Aircraft 7239, LLC | Airbus A321 | 1 | — | |||||||
JSA Aircraft 7298, LLC | Airbus A321 | 1 | — | |||||||
Macquarie Aerospace Finance 5125-2 Trust | Airbus A320 | 1 | — | |||||||
Macquarie Aerospace Finance 5178 Limited | Airbus A320 | 1 | — | |||||||
Magix Airlease Limited | Airbus A320 | 1 | 2 | |||||||
MASL Sweden (1) AB | Airbus A320 | — | 1 | |||||||
MASL Sweden (2) AB | Airbus A320 | — | 1 | |||||||
Lessor Aircraft GECAS Sverige Aircraft Leasing Worldwide AB (*) GFL Aircraft Leasing Netherlands B.V. (GECAS) (*) International Lease Finance Corporation International Lease Finance Corporation International Lease Finance Corporation (*) KN Operating Limited (NAC) MASL Sweden (1) AB (MACQUARIE) (*) MASL Sweden (2) AB (MACQUARIE) (*) MASL Sweden (7) AB (MACQUARIE) (*) MASL Sweden (8) AB (MACQUARIE) (*) MCAP Europe Limited - Mitsubishi (WTC) Orix Aviation Systems Limited Pembroke B737-7006 Leasing Limited RBS Aerospace Limited (*) SKY HIGH V LEASING COMPANY LIMITED (*) Sky High XXIV Leasing Company Limited Sky High XXV Leasing Company Limited Sunflower Aircraft Leasing Limited - AerCap Volito Aviation August 2007 AB (*) Volito Aviation November 2006 AB (*) Volito Brasilien AB (*) Volito November 2006 AB (*) Wells Fargo Bank North National Association (ACG) (*) Wells Fargo Bank North National Association (ACG) (*) Wells Fargo Bank North National Association (BAKER & SPICE) (*) Wells Fargo Bank North National Association (BOC) (*) Wells Fargo Bank North National Association (BOC) (*) Wells Fargo Bank Northwest N.A (AVOLON) (*) Wells Fargo Bank Northwest National Association (ACG) (*) Wells Fargo Bank Northwest National Association (AerCap) (*) Wells Fargo Bank Northwest National Association (BBAM) Wells Fargo Bank Northwest National Association (BBAM) Wells Fargo Bank Northwest National Association (BOC) (*) Wells Fargo Bank Northwest, N.A. (GECAS) Wells Fargo Bank Northwest, N.A. (GECAS) Wilmington Trust Company (ILFC) (*) Yamasa Singapore Pte. Ltd. Zipdell Limited (BBAM) (*) Total As of
December 31,
2013 As of
December 31,
2012 Airbus A330 2 2 Airbus A320 1 1 Boeing 737 1 2 Boeing 767 1 1 Airbus A320 1 1 Bombardier Dhc8-400 3 4 Airbus A320 1 1 Airbus A320 1 1 Airbus A320 1 1 Airbus A320 1 1 Boeing 737 1 1 Airbus A320 3 3 Boeing 737 2 2 Airbus A320 6 6 Airbus A320 1 1 Airbus A320 3 — Airbus A320 2 — Airbus A320 2 2 Airbus A320 2 2 Airbus A320 2 2 Airbus A319 1 1 Airbus A320 2 2 Airbus A319 1 1 Airbus A320 2 2 Airbus A320 — 1 Airbus A319 3 3 Airbus A320 — 2 Airbus A320 4 4 Airbus A320 2 2 Airbus A330 10 — Boeing 777 1 — Boeing 787 1 — Airbus A320 1 1 Boeing 767 4 4 Boeing 777 2 2 Airbus A319 1 1 Airbus A340 1 — Airbus A320 1 1 128 123
Lessor | Aircraft | As of December 31, 2016 | As of December 31, 2015 | |||||||||
MASL Sweden (7) AB | Airbus A320 | — | 1 | |||||||||
MASL Sweden (8) AB | Airbus A320 | 1 | 1 | |||||||||
Merlin Aviation Leasing (Ireland) 18 Limited | Airbus A320 | 1 | — | |||||||||
NBB Cuckoo Co., Ltd | Airbus A321 | 1 | 1 | |||||||||
NBB Grosbeak Co., Ltd | Airbus A321 | 1 | 1 | |||||||||
NBB Redstart Co. Ltd | Airbus A321 | 1 | — | |||||||||
NBB-6658 Lease Partnership | Airbus A321 | 1 | 1 | |||||||||
NBB-6670 Lease Partnership | Airbus A321 | 1 | 1 | |||||||||
Orix Aviation Systems Limited | Airbus A320 | 5 | 2 | |||||||||
PAAL Aquila Company Limited | Airbus A321 | 2 | — | |||||||||
PAAL Gemini Company Limited | Airbus A321 | 1 | — | |||||||||
SASOF II (J) Aviation Ireland Limited | Airbus A319 | 1 | 1 | |||||||||
Shenton Aircraft Leasing Limited | Airbus A320 | 1 | 1 | |||||||||
SKY HIGH V LEASING COMPANY LIMITED | Airbus A320 | — | 1 | |||||||||
Sky High XXIV Leasing Company Limited | Airbus A320 | 5 | 5 | |||||||||
Sky High XXV Leasing Company Limited | Airbus A320 | 2 | 2 | |||||||||
SMBC Aviation Capital Limited | Airbus A320 | 6 | 7 | |||||||||
SMBC Aviation Capital Limited | Airbus A321 | 2 | 2 | |||||||||
Sunflower Aircraft Leasing Limited | Airbus A320 | — | 2 | |||||||||
TC-CIT Aviation Ireland Limited | Airbus A320 | 1 | 1 | |||||||||
Volito Aviation August 2007 AB | Airbus A320 | 2 | 2 | |||||||||
Volito Aviation November 2006 AB | Airbus A320 | 2 | 2 | |||||||||
Volito November 2006 AB | Airbus A320 | 2 | 2 | |||||||||
Wells Fargo Bank North National Association | Airbus A319 | 3 | 3 | |||||||||
Wells Fargo Bank North National Association | Airbus A320 | 2 | 2 | |||||||||
Wells Fargo Bank Northwest National Association | Airbus A320 | 7 | 7 | |||||||||
Wells Fargo Bank Northwest National Association | Airbus A330 | — | 2 | |||||||||
Wells Fargo Bank Northwest National Association | Boeing 767 | 3 | 3 | |||||||||
Wells Fargo Bank Northwest National Association | Boeing 777 | 6 | 6 | |||||||||
Wells Fargo Bank Northwest National Association | Boeing 787 | 11 | 7 | |||||||||
Wells Fargo Bank Northwest National Association | Airbus A350 | 2 | — | |||||||||
Wilmington Trust Company | Airbus A319 | 1 | 1 | |||||||||
|
|
|
| |||||||||
Total | 111 | 106 | ||||||||||
|
|
|
| |||||||||
The rentals are shown in results for the period for which they are incurred.
The minimum future lease payments not yet payable are the following:
| As of December 31, 2013 | As of December 31, 2012 | As of December 31, 2016 | As of December 31, 2015 | |||||||||||||
| ThUS$ | ThUS$ | ThUS$ | ThUS$ | |||||||||||||
No later than one year | 475,762 | 380,713 | 533,319 | 513,748 | ||||||||||||
Between one and five years | 1,101,741 | 852,659 | 1,459,362 | 1,281,454 | ||||||||||||
Over five years | 335,019 | 235,658 | 1,262,509 | 858,095 | ||||||||||||
|
|
|
| |||||||||||||
Total | 1,912,522 | 1,469,030 | 3,255,190 | 2,653,297 | ||||||||||||
|
|
|
| |||||||||||||
The minimum lease payments charged to income are the following:
| For the periods ended | ||||||||||||||||||||||||
| December 31, | For the period ended December 31, | |||||||||||||||||||||||
| 2013 | 2012 | 2011 | 2016 | 2015 | 2014 | |||||||||||||||||||
| ThUS$ | ThUS$ | ThUS$ | ThUS$ | ThUS$ | ThUS$ | |||||||||||||||||||
Minimum operating lease payments | 441,077 | 310,496 | 168,369 | 568,979 | 525,134 | 521,384 | ||||||||||||||||||
|
|
|
|
|
| |||||||||||||||||||
Total | 441,077 | 310,496 | 168,369 | 568,979 | 525,134 | 521,384 | ||||||||||||||||||
|
|
|
|
|
| |||||||||||||||||||
In September 2011, the Company signed a contract to establish the early departure of three Boeing 737-700. The return of these three aircraft was completed during the secondfirst quarter of 2012.
During the second quarter of 2012, added three Airbus A320-2002015, two Boeing 787-9 aircraft were leased for a period of 8 years. Duringtwelve years each. On the other hand, two Airbus A320-200 aircraft were returned. In the second quarter of 2015, two Airbus A321-200 aircraft and one Boeing 787-9 aircraft were leased for a period of twelve years each. On the other hand, one Airbus A320-200 aircraft and two Airbus A330-200 aircraft were returned. In the third quarter of 2012, it the Company added two2015, five Airbus A320-200A321-200 aircraft and one Boeing 787-9 aircraft were leased for periodsa period of six and eight years.twelve years each. On the other hand, one Airbus A330-200 aircraft was returned. In addition, two Boeing 767-300 aircraft and two Airbus A320-200 were returned given the end of the lease contract. During the fourth quarter of 2012, were returned four2015, one Airbus A320-200 on lease term.A330-200 aircraft was returned.
In the first quarter of 2013, it returned an Airbus A320-200, while during the second quarter of 20132016, two Airbus A319-100, one Airbus A320-200 and one Bombardier Dhc8-200Boeing 787-9 aircraft were returned as their leasing contracts had ended. During June 2013 the contracts system applied to ten Airbus A330-200 aircraft was changed from financial leasing to operative leasing, with each aircraft being leased for a period of forty months. Duringtwelve years each. On the other hand and one Airbus A320-200 aircraft was returned. In the second quarter of 2016, three Airbus A321-200 aircraft were leased for a period of ten years each and two Boeing 787-9 aircraft were leased for a period of twelve years each. On the other hand, one Airbus A320-200 aircraft and one Boeing 767-300ER aircraft were returned. In the third quarter of 2013, two2016, three Airbus A320-200A321-200 aircraft and one Airbus A320- NEO aircraft were leased for a period of ten years each, and one Airbus A350-900 aircraft was leased for a period of 8 years each,twelve years. On the other hand and one Boeing 787Airbus A320-200 aircraft was returned. In the fourth quarter of 2016, one Airbus A350-900 aircraft was leased for a period of 12twelve years and two Boeing 777 aircraft were leased for a period of 5 years each. Moreover, one Airbus A320-200, two Boeing 767-300 aircraft and one Bombardier Dhc8-400 aircraft were returned. Additionally, during July of 2013 two Dhc8-200 aircraft were acquired on leasing. In the fourth quarter of 2013, three Airbus A320-200A321-200 aircraft was leased for a period of 8 years each, one Boeing 787ten years. On the other hand, three Airbus A320-200 aircraft was leased for a period of 12 years. Moreover,and two Airbus A320-200, one Airbus A319-100, one Airbus A340-300, one Boeing 737-700 aircraft and one Bombardier Dhc8-400A330-200 aircraft were returned.
The operating lease agreements signed by the Company and its subsidiaries state that maintenance of the aircraft should be done according to the manufacturer’s technical instructions and within the margins agreed in the leasing agreements, a cost that must be assumed by the lessee. The lessee should also contract insurance for each aircraft to cover associated risks and the amounts of these assets. Regarding rental payments, these are unrestricted and may not be netted against other accounts receivable or payable between the lessor and lessee.
At December 31, 20132016 the Company has existing letters of credit related to operating leasing as follows:
Creditor Guarantee | Debtor | Type | Value ThUS$ | Release date | ||||||||
| ||||||||||||
| ||||||||||||
| ||||||||||||
| ||||||||||||
GE Capital Aviation Services Limited | Lan Cargo S.A. | |||||||||||
Wells Fargo Bank North N.A. | Lan Cargo S.A. | One letter of credit | 5,000 | May 25, | ||||||||
Bank of America | LAT AM Airlines Group S.A. | Three letter of credit | 1,044 | Jul 2, 2017 | ||||||||
Engine Lease Finance Corporation | LAT AM Airlines Group S.A. | One letter of credit | 4,750 | Oct 8, 2017 | ||||||||
GE Capital Aviation Services Ltd. | LAT AM Airlines Group S.A. | Eight letter of credit | 34,665 | Feb 7, 2017 | ||||||||
International Lease Finance Corp | Feb | |||||||||||
| One letter of credit | 3,255 | ||||||||||
| Two letter of credit | 13,569 | Aug 14, 2017 | |||||||||
Wells Fargo Bank | LAT AM Airlines Group S.A. | Nine letter of credit | 15,160 | Feb 8, 2017 | ||||||||
CIT Aerospace International | Tam Linhas Aéreas S.A. | One letter of credit | ||||||||||
| One letter of credit | |||||||||||
| ||||||||||||
Wells Fargo Bank | ||||||||||||
| ||||||||||||
| Tam Linhas Aéreas S.A. | One letter of credit | 5,500 | |||||||||
| ||||||||||||
| ||||||||||||
| ||||||||||||
| ||||||||||||
| ||||||||||||
| ||||||||||||
| ||||||||||||
|
| |||||||||||
|
| |||||||||||
(c) Other commitments
| (c) | Other commitments |
At December 31, 20132016 the Company has existing letters of credit, certificates of deposits and warranty insurance policies as follows:
Creditor Guarantee | Debtor | Type | Value | Release date | ||||||||
Servicio Nacional de Aduana del Ecuador | Líneas Aéreas Nacionales delEcuador S.A. | Four letter of credit | 1,705 | Aug 5, 2017 | ||||||||
Corporación Peruana de Aeropuertos y Aviación Comercial | Lan Perú S.A. | Six letter of credit | 3,813 | Jan 31, 2017 | ||||||||
Lima Airport Partners S.R.L. | Lan Perú S.A. | Twenty two letter of credit | 3,805 | Mar 3, 2017 | ||||||||
Superintendencia Nacional de Aduanas y de Administración Tributaria | Lan Perú S.A. | Four letter of credit | 33,500 | Mar 20, 2017 | ||||||||
Ae na Aeropuertos S.A. | LATAM Airlines Group S.A. | Four letter of credit | 2,014 | Nov 15, 2017 | ||||||||
American Alternative Insurance Corporation | LATAM Airlines Group S.A. | Apr 5, | ||||||||||
| LATAM Airlines Group S.A. | One letter of credit | ||||||||||
| LATAM Airlines Group S.A. | |||||||||||
| Jan | |||||||||||
| ||||||||||||
|
| |||||||||||
Empresa Pú | LATAM Airlines Group S.A. | One letter of credit | 5,500 | Jun | ||||||||
JP Morgan Chase | LATAM Airlines Group S.A. | One letter of credit | 10,000 | Jun 17, 2017 | ||||||||
Metropolitan | LATAM Airlines Group S.A. | |||||||||||
| ||||||||||||
The Royal Bank of Scotland plc | LATAM Airlines Group S.A. | May 20, | ||||||||||
| ||||||||||||
| ||||||||||||
|
| |||||||||||
|
| |||||||||||
| Tam Linhas Aéreas S.A. | One insurance policies guarantee | ||||||||||
| Tam Linhas Aéreas S.A. | Two insurance policies guarantee | 24,969 | Jan 4, 2018 | ||||||||
8ª Va ra Federal da | Tam Linhas Aéreas S.A. | One insurance policies guarantee | ||||||||||
| Tam Linhas Aéreas S.A. | One insurance policies guarantee | ||||||||||
Fundação de Proteão de Defesa do Consumidor Procon | Tam Linhas Aéreas S.A. | Two insurance policies guarantee | 3,276 | Jan 21, 2021 | ||||||||
União Federal Va ra Comarc a de DF | Tam Linhas Aéreas S.A. | Two insurance policies guarantee | 2,696 | Nov 9, 2020 | ||||||||
Uniã o Federal Va ra Comarc a de SP | Tam Linhas Aéreas S.A. | One insurance policies guarantee | ||||||||||
|
| |||||||||||
|
| |||||||||||
NOTE 37 - 33—TRANSACTIONS WITH RELATED PARTIES
(a) Transactions with related parties for the period ended December 31, 2013
| (a) | Details of transactions with related parties as follows: |
| Nature of relationship with | Country | Nature of related parties | Transaction amount with related parties As of December 31, | |||||||||||||||||||
Tax No. | Related party | related parties | of origin | transactions | Currency | 2016 | 2015 | 2014 | ||||||||||||||
| ThUS$ | ThUS$ | ThUS$ | ||||||||||||||||||||
96.810.370-9 | Inversiones Costa Verde Ltda. yCPA. | Related director | Chile | Tickets sales | CLP | 6 | 15 | 31 | ||||||||||||||
96.847.880-K | Technical Training Latam S.A. | Associate (*) | Chile | Leases as lessor | CLP | — | — | 209 | ||||||||||||||
| Training services received | CLP | — | — | (785 | ) | |||||||||||||||||
| Training services received | US $ | — | — | (743 | ) | |||||||||||||||||
65.216.000-K | Comunidad Mujer | Related director | Chile | Services provided for advertising | CLP | (12 | ) | (10 | ) | (11 | ) | |||||||||||
| Tickets sales | CLP | 9 | 2 | 9 | ||||||||||||||||||
78.591.370-1 | Bethia S.A and subsidiaries | Related director | Chile | Services received of cargo transport | CLP | (394 | ) | (259 | ) | (646 | ) | |||||||||||
| Services received from National and International Courier | CLP | (285 | ) | (227 | ) | (496 | ) | |||||||||||||||
| Services provided of cargo transport | CLP | 192 | 30 | — | ||||||||||||||||||
| Other services received | CLP | — | — | (10 | ) | |||||||||||||||||
65.216.000-K | Viajes Falabella Ltda. | Related director | Chile | Sales commissions | CLP | (727 | ) | (50 | ) | — | ||||||||||||
79.773.440-3 | Transportes San Felipe S.A | Related director | Chile | Services received of transfer of passengers | CLP | (84 | ) | (127 | ) | (70 | ) | |||||||||||
| Tickets sales | CLP | 3 | 7 | 26 | ||||||||||||||||||
87.752.000-5 | Granja Marina Tornagaleones S.A. | Common shareholder | Chile | Tickets sales | CLP | 76 | 117 | 155 | ||||||||||||||
Foreign | Consultoría Administrativa Profesional S.A. de C.V. | Associate | Mexico | Professional counseling services received | MXN | (2,563 | ) | (1,191 | ) | — | ||||||||||||
Foreign | Inversora Aeronáutica Argentina | Related director | Argentina | Leases as lessor | ARS | (264 | ) | (269 | ) | (334 | ) | |||||||||||
| Revenue billboard advertising maintaining | US $ | — | 1 | 12 | ||||||||||||||||||
Foreign | TAM Aviação Executiva e Taxi Aéreo S/A | Related director | Brazil | Services provided by sale of tickets | BRL | 2 | 2 | — | ||||||||||||||
| Services provided of cargo transport | BRL | (122 | ) | (63 | ) | (12 | ) | |||||||||||||||
| Services received at airports | BRL | 7 | 5 | — | ||||||||||||||||||
Foreign | Prismah Fidelidade S.A. | Joint Venture | Brazil | Professional counseling servies received | BRL | — | — | (119 | ) | |||||||||||||
Foreign | Made In Everywhere | |||||||||||||||||||||
| Repr. Com. Distr. Ltda. | Related director | Brazil | Services received of transport | BRL | — | — | (2 | ) | ||||||||||||||
| (*) | ||||||||||||||||
|
|
|
|
|
|
| ||||||||||
|
| |||||||||||||||
|
|
|
|
| ||||||||||||
|
|
|
|
| ||||||||||||
|
|
|
|
| ||||||||||||
|
|
|
|
| ||||||||||||
|
| |||||||||||||||
|
|
|
|
| ||||||||||||
|
| |||||||||||||||
|
|
|
|
| ||||||||||||
|
| |||||||||||||||
On December 28, 2012, Inmobiliaria Aeronáutica S.A. as seller and Sotraser S.A. (Subsidiary of Bethia S.A.) as purchaser, entered into an agreement to purchase the land called “Lot No. 12 of parcellation project Lo Echevers”. The value of the sale amounts to ThUS$ 14,217. On December 31, 2013, this balance is paid.
|
|
|
|
|
|
| ||||||||||
|
| |||||||||||||||
|
|
|
|
| ||||||||||||
|
|
|
|
| ||||||||||||
|
|
|
|
| ||||||||||||
|
| |||||||||||||||
|
| |||||||||||||||
|
| |||||||||||||||
|
|
|
|
| ||||||||||||
|
| |||||||||||||||
|
|
|
| |||||||||||||
|
| |||||||||||||||
|
| |||||||||||||||
|
|
|
|
|
| |||||||||||
|
|
|
| |||||||||||||
|
|
|
| |||||||||||||
|
|
|
| |||||||||||||
| ||||||||||||||||
| ||||||||||||||||
|
|
|
| |||||||||||||
Operations corresponding to holders of common stock in TAM S.A. and subsidiaries are included following the date of the business combination, on June 22, 2012.
The balances of Accounts receivable and accounts payable to related parties are disclosed in Note 9.
Transactions between related parties have been carried out on free-trade conditions between interested and duly-informed parties.
(d) Compensation of key management
| (b) | Compensation of key management |
The Company has defined for these purposes that key management personnel are the executives who define the Company’s policies and major guidelines and who directly affect the results of the business, considering the levels of Vice-Presidents, Chief Executives and Directors.Directors (Senior).
| For the periods ended December 31, | ||||||||||||
| 2013 | 2012 | 2011 | ||||||||||
| ThUS$ | ThUS$ | ThUS$ | ||||||||||
Remuneration | 15,148 | 15,146 | 9,696 | |||||||||
Management fees | 368 | 653 | 185 | |||||||||
Non-monetary benefits | 565 | 395 | 665 | |||||||||
Short-term benefits | 4,056 | 5,060 | 5,011 | |||||||||
Share-based payments | 17,709 | 1,412 | 2,084 | |||||||||
|
|
|
|
|
| |||||||
Total | 37,846 | 22,666 | 17,641 | |||||||||
|
|
|
|
|
| |||||||
Remuneration Management fees Non-monetary benefits Short-term benefits Share-based payments Total 2016 For the period ended
December 31,
2015 2014 ThUS$ ThUS$ ThUS$ 16,514 17,185 19,507 556 547 1,213 778 864 990 23,459 19,814 — 8,085 10,811 16,086 49,392 49,221 37,796
NOTE 38 – 34—SHARE-BASED PAYMENTS
(a) Compensation plan for increase of capital in LATAM Airlines Group S.A.
| (a) | Compensation plan for increase of capital |
Compensation plans implemented by providing options for the subscription and payment of shares that have been granted fromby LATAM Airlines Group S.A. to employees of the first quarter of 2013Company and its subsidiaries, are recognized in the financial statements in accordance with the provisions of IFRS 2 “Share-based Payment”, showing the effect of the fair value of the options granted under compensation in linear between the date of grant of such options and the date on which these irrevocable.
(a.1) Compensation plan 2011
| (a.1) | Compensation plan 2011 |
At a Special Shareholders Meeting heldOn December 21, 2011, the Company’s shareholders approved, among other matters, an increase of capital of which 4,800,000 shares were allocated to compensation plans for employees of the Company and its subsidiaries, pursuant to Article 24 of the Companies Law. In this compensation plan no member of the controlling group would be benefited. The granting of options for2016, the subscription and payment period of the 4,800,000 shares has been formalized through conclusion of contracts of options to subscribe for shares, accordingcorresponding to the proportions shown incompensation plan approved at the following schedule of accrual and is relatedExtraordinary Shareholders’ Meeting held on December 21, 2011, expired.
Of the total shares allocated to the permanence condition2011 Compensation Plan, only 10,282 shares were subscribed and paid, having been placed on the market in January 2014. In view of the executiveabove, at these dates for the exerciseexpiration date, the 2011 Compensation Plan had a balance of 4,789,718 shares pending of subscription and payment, which was deducted from the authorized capital of the options:Company.
Number of | ||||
Share options in agreements of | ||||
Share options granted | ||||
Share options cancelled | (90,000 | ) | ||
Share options in agreements of share-based payments, as of December 31, 2015 | 4,518,000 | |||
Share options in agreements of share-based payments, as of January 1, 2016 | 4,518,000 | |||
Executives resign options (*) | (4,172,000 | ) | ||
Share options expired | (346,000 | ) | ||
|
| |||
Share options in agreements of share- based payments, as of December 31, | ||||
|
| |||
These options have beenwas valued and recorded at fair value at the grant date, determined by the “Black-Scholes-Merton”. The effect on income to December 20132016 corresponds to ThUS$ 17,200.
The input data of option pricing model used for share options granted are as follows:2,989 (ThUS$ 10,811 at December 31, 2015).
Weighted average share price | Exercise price | Expected volatility | Life of option | Dividends expected | Risk-free interest | |||||
US$ 23.55 | US$ 24.97 | 61.52% | 3.6 years | 0% | 0.0055 |
(a.2) Compensation plan 2013
| (a.2) | Compensation plan 2013 |
At the Extraordinary Shareholders’ Meeting held on June 11, 2013, the Company’s shareholders approved motions including increasing corporate equity, of which 1,500,000 shares were allocated to compensation plans for employees of the Company and its affiliates,subsidiaries, in conformity with the stipulations established in Article 24 of the Corporations Law. RegardWith regard to this compensation, plan, not exist yet a defined date for implementation. implementation does not exist.
| (b) | Compensation plan 2016-2018 |
The grantingCompany implemented a retention plan long-term for executives, which lasts until December 2018, with a vesting period between October 2018 and March 2019, which consists of optionsan extraordinary bonus whose calculation formula is based on the variation the value to experience the action of LATAM Airlines Group S.A. for a period of time.
This benefit is recognized in accordance with the subscriptionprovisions of IFRS 2 “Share-based Payments” and payment of shares has been formalized through conclusion of contracts of options to subscribe for shares, accordingconsidered as cash settled award and therefore recorded at fair value as a liability, which is updated to the proportions shown in the following scheduleclosing date of accrual and is related to the permanence condition of the executive at these dates for the exercise of the options:each financial statement with effect on profit or loss.
granted | ||||
Units bases, balance at December 31, 2016 | 4,719,720 | |||
The fair value has been determined on the basis of the best estimate of the future value of the Company share multiplied by the number of units granted bases.
At December 31, 2016, the carrying amount of ThUS$ 4,442, is classified under “Administrative expenses” in the Consolidated Statement of Income by Function.
| (c) | Subsidiaries compensation plans |
(b) Subsidiaries compensation plans
| (c.1) | Stock Options |
TAM Linhas Aereas S.A. and Multiplus S.A., both subsidiaries of TAM S.A., have outstanding stock options at December 31, 2013,2016, which amounted to 837,73396,675 shares and 1,082,463394,698 shares, respectively.
respectively (at December 31, 2015, the distribution of outstanding stock options amounted to 394,698 for Multiplus S.A. and 96,675 shares TAM Linhas Aéreas S.A.).
| 1st Extraordinary | 3nd Extraordinary | 4h Extraordinary | ||||||||||||||||||||||||||||||||
Description | 1st Grant | 2nd Grant | 3rd Grant | 4th Grant | Grant | Grant | Grant | Total | ||||||||||||||||||||||||||
Date | 12-28-2005 | 11-30-2006 | 12-14-2007 | 05-28-2010 | 09-27-2007 | 04-01-2010 | 04-01-2010 | |||||||||||||||||||||||||||
|
|
|
|
|
|
|
|
|
|
|
|
|
|
|
| |||||||||||||||||||
Outstanding option number | — | 119,401 | 259,857 | 228,475 | 230,000 | — | — | 837,733 | ||||||||||||||||||||||||||
|
|
|
|
|
|
|
|
|
|
|
|
|
|
|
| |||||||||||||||||||
Multiplus S.A.
| T AM Linhas Aéreas S.A. | ||||||||
| 4th Grant | ||||||||
| Description | 05-28-2010 | T otal | ||||||
Outstanding option number as December 31, 2015 | 96,675 | 96,675 | ||||||
Outstanding option number as December 31, 2016 | 96,675 | 96,675 | ||||||
| 1st Extraordinary | 2nd Extraordinary | 3nd Extraordinary | 4nd Extraordinary | |||||||||||||||||||||||||||||||||
Description | 1st Grant | 2nd Grant | 3rd Grant | 4th Grant | Grant | Grant | Grant | Grant | Total | |||||||||||||||||||||||||||
Date | 10-04-2010 | 11-08-2010 | 04-16-2012 | 10-04-2010 | 10-04-2010 | 10-04-2010 | 04-16-2012 | 11-20-2013 | ||||||||||||||||||||||||||||
|
|
|
|
|
|
|
|
|
|
|
|
|
|
|
|
|
| |||||||||||||||||||
Outstanding option number | 11,289 | 2,245 | 166,236 | 334,207 | 362,911 | — | — | 205,575 | 1,082,463 | |||||||||||||||||||||||||||
|
|
|
|
|
|
|
|
|
|
|
|
|
|
|
|
|
| |||||||||||||||||||
Outstanding option number as December 31, 2015 Outstanding option number as December 31, 2016Multiplus S.A. 3rd Grant 4th Grant 4nd Extraordinary
Grant Description 03-21-2012 04-03-2013 11-20-2013 Total 102,621 255,995 159,891 518,507 84,249 173,399 �� 137,050 394,698
The Options of TAM Linhas Aéreas S.A., under the plan’s terms, are divided into three equal parts and employees can run a third of its options after three, four and five years respectively, as long as they remain employees of the company. The agreed term of the options is seven years.
For Multiplus S.A., the plan’s terms provide that the options granted to the usual prizes are divided into three equal parts and employees may exercise one-third of their two, three and four, options respectively, as long as they keep being employees of the company. The agreed term of the options is seven years after the grant of the option. The first extraordinary granting was divided into two equal parts, and only half of the options may be exercised after three years and half after four years. The second extraordinary granting was also divided into two equal parts, which may be exercised after one and two years respectively.
Both companies have an option that contains a “service condition” in which the exercise of options depends exclusively on the delivery services by employees during a predetermined period. Terminated employees will be required to meet certain preconditions in order to maintain their right to the options.
As of December 31, 2013 the
The acquisition of the share’s rights, in both companies is as follows:
| Number of shares Accrued options | Number of shares Non accrued options | |||||||||||||||||||||||
Company | Number of shares Accrued options | Number of shares Non accrued options | As of December 31, 2016 | As of December 31, 2015 | As of December 31, 2016 | As of December 31, 2015 | ||||||||||||||||||
TAM Linhas Aéreas S.A. | 609,258 | 228,475 | — | — | 96,675 | 96,675 | ||||||||||||||||||
Multiplus S.A. | 161,294 | 921,169 | — | — | 394,698 | 518,507 | ||||||||||||||||||
In accordance with IFRS 2 - Share-based payments, the fair value of the option must be recalculated and recorded as a liability of the Company once payment is made in cash (cash-settled). The fair value of these options was calculated using the Black-Scholes“Black-Scholes-Merton” method, where the cases were updated with information LATAM Airlines Group S.A. The fairThere is no value recorded in liabilities and in income at December 31, 2013 is ThUS$ 1,4932016 (at December 31, 2015 not exist value recorded in liabilities and in income ThUS$ 509.incomes).
| (c.2) | Payments based on restricted stock |
In May of 2014 the Management Council of Multiplus S.A. approved a plan to grant restricted stock, a total of 91,103 ordinary, registered book entry securities with no face value, issued by the Company to beneficiaries.
The quantity of restricted stock units was calculated based on employees’ expected remunerations divided by the average price of shares in Multiplus S.A. traded on the BM&F Bovespa exchange in the month prior to issue, April of 2014. This benefits plan will only grant beneficiaries the right to the restricted stock when the following conditions have been met:
a. Compliance with the performance goal defined by this Council of Administration as return on Capital Invested.
b. The Beneficiary must remain as an administrator or employee of the Company for the period running from the date of issue to the following dates described, in order to obtain rights over the following fractions: (i) 1/3 (one third) after the 2nd year from the issue date; (ii) 1/3 (one third) after the 3rd year from the issue date; (iii) 1/3 (one third) after the 4th year from the issue date.
Number shares in circulation
| Opening balance | Granted | Exercised | Not acquired due to breach of employment retention conditions | Closing balance | ||||||||||||||||
From January 1 to December 31, 2015 | 91,103 | 119,731 | — | (34,924 | ) | 175,910 | ||||||||||||||
From January 1 to December 31, 2016 | 175,910 | 138,282 | (15,811 | ) | (60,525 | ) | 237,856 | |||||||||||||
NOTE 39 -THE35—STATEMENT OF CASH FLOWS
(a) The Company has done significant non-cash transactions mainly with financial leases, which are detailed in Note 17 letter (d), additional information in numeral (iv) Financial leases.
| (b) | Other inflows (outflows) of cash: |
For the periods ended December 31, | ||||||||||||
| 2016 | 2015 | 2014 | ||||||||||
| ThUS$ | ThUS$ | ThUS$ | ||||||||||
Hedging margin guarantees | 1,184 | 87,842 | (64,334 | ) | ||||||||
Change reservation systems | — | 11,000 | — | |||||||||
Bank commissions, taxes paid and other | (769 | ) | (5,137 | ) | (47,724 | ) | ||||||
SEC agreement | (4,719 | ) | — | — | ||||||||
Fuel derivatives premiums | (6,840 | ) | (20,932 | ) | (7,075 | ) | ||||||
Tax paid on bank transaction | (10,668 | ) | (7,176 | ) | — | |||||||
DOJ fine | (12,750 | ) | — | — | ||||||||
Court deposits | (33,635 | ) | (6,314 | ) | — | |||||||
Currency hedge | (39,534 | ) | 1,802 | (1,153 | ) | |||||||
Fuel hedge | (50,029 | ) | (243,587 | ) | (45,365 | ) | ||||||
Guarantees | (51,559 | ) | (2,125 | ) | (86,006 | ) | ||||||
Others | 50 | — | — | |||||||||
|
|
|
|
|
| |||||||
Total Other inflows (outflows) Operation flow | (209,269 | ) | (184,627 | ) | (251,657 | ) | ||||||
|
|
|
|
|
| |||||||
Recovery loans convertible into shares | 8,896 | 20,000 | — | |||||||||
Certificate of bank deposits | — | 3,497 | (17,399 | ) | ||||||||
Tax paid on bank transaction | (3,716 | ) | (12,921 | ) | — | |||||||
Others | (4,337 | ) | — | — | ||||||||
|
|
|
|
|
| |||||||
Total Other inflows (outflows) Investment flow | 843 | 10,576 | (17,399 | ) | ||||||||
|
|
|
|
|
| |||||||
Credit card loan manager | — | 3,227 | 23,864 | |||||||||
Early redemption of bonds TAM 2020 | — | (15,328 | ) | — | ||||||||
Guarantees bonds emission | — | (26,111 | ) | — | ||||||||
Settlement of derivative contracts | (29,828 | ) | (35,891 | ) | (42,962 | ) | ||||||
Loan guarantee | (74,186 | ) | — | — | ||||||||
Aircraft Financing advances | (125,149 | ) | (28,144 | ) | 8,669 | |||||||
Others | — | 2,490 | (3,348 | ) | ||||||||
|
|
|
|
|
| |||||||
Total Other inflows (outflows) Financing flow | (229,163 | ) | (99,757 | ) | (13,777 | ) | ||||||
|
|
|
|
|
| |||||||
| (c) | Dividends: |
For the periods ended December 31, | ||||||||||||
| 2016 | 2015 | 2014 | ||||||||||
| ThUS$ | ThUS$ | ThUS$ | ||||||||||
Multiplus S.A | (40,823 | ) | (34,632 | ) | (34,962 | ) | ||||||
Lan Perú S.A | (400 | ) | (400 | ) | (400 | ) | ||||||
|
|
|
|
|
| |||||||
Total dividends paid (*) | (41,223 | ) | (35,032 | ) | (35,362 | ) | ||||||
|
|
|
|
|
| |||||||
| (*) | Dividends paid to minority shareholders |
LATAM Airlines Group S.A. manages environmental issues at the corporate level, centralized in Environmental Management. ToThere is a commitment to the highest level to monitor the company and minimize their impact on the environment, is a commitment to the highest level, where continuous improvement and contribute to the solution of the problem of global climate change problems, generating added value to the company and the region, are the pillars of his administration.
One function of Environmental Management, in conjunction with the various areas of the Company, is to ensure environmental compliance, implementing a management system and environmental programs that meet the increasingly demanding requirements globally; well as continuous improvement programs in their internal processes that generate environmental and economic benefits and to join the currently completed.
The Environment Strategy LATAM Airlines Group S.A., is called Climate Change Strategy and it is based on the aim of being a world leader in Climate Change and Eco-efficiency, which is implemented under the following objectives:pillars:
| i. | Carbon Footprint |
| ii. | Eco-Efficiency |
| iii. | Sustainable Alternative Energy |
| iv. | Standards and Certifications |
For 2016, were established the impact of its operations by using a modern fleet, efficient operational management and continuous incorporation of new technologies.
For 2013, we have established three priority areas of work to develop:following topics:
| 1. |
| 2. |
| 3. |
| 4. | Corporate strategy to meet the |
Similarly,Thus, during 2013, activities were conducted2016, we have worked in the following initiatives:
The total amount of the Environmental Division expenses for 2013 is US$ 427,704 (US$526,074 during 2012).this select group.
NOTE 40 -EVENTS37 - EVENTS SUBSEQUENT TO THE DATE OF THE FINANCIAL STATEMENTS
(a) Term capital increase placement 2013On January 18, 2017, the Company was notified of a civil suit filed by Inversiones Ranco Tres S.A., represented by Mr. Jorge Enrique Said Yarur against LATAM Airlines Group S.A., for supposed non-compliance of contractual obligations from the social contract of the Company, as well as the directors Ramón Eblen Kadiz, Jorge Awad Mehech, Juan Jose Cueto Plaza and main executives of the Company, Enrique Cueto Plaza and Ignacio Cueto Plaza, for the supposed noncompliance of their duties as directors and main executives of the Company. LATAM has hired specialist lawyers to answer the lawsuit. On March 10, 2017, the Court rejected the dilatory exceptions presented by LATAM.
On January 10, 2014 were placed byMarch 8th, 2017, LATAM received a third Requirement of Information from the procedure of Auction Orders Book, accordingCentral-North Metropolitan Region Prosecutor’s Office requesting information relating to the provisionsinvestigation of Section 2.4Apayments made by Lan Airlines S.A. to a consultant advising it on the solution to labor matters in Argentina in the years 2006-2007.
Subsequent at December 31, 2016 until the date of issuance of these financial statements, there is no knowledge of financial facts or otherwise, that could significantly affect the Operations Manual in Shares by Stock Exchange Santiago, Stock Exchange, and the 10,314,872 cash shares that were not subscribed within the period of first refusal ended December 19, 2013. The placement price was US$ 15.17, the exchange rate observed dollar published by the Central Bank of Chile in force for Monday January 9, 2014 , equivalent to $8,072.60 , having raised therefore the equivalent today US$ 156.5 million, approximately . Thus concluded the process of placing 100 % of 62,000,000 shares for payment of first issue (not include Employee Compensation Plan for the Company and its subsidiaries ) to be placed by the Company under the capital increase approved by the Extraordinary Shareholders’ Meeting held on LATAM June 11, 2013 , total revenues of US$ 940.5 million having been achieved.balances or interpretation thereof.
LATAM Airlines Group S.A. and Subsidiaries’ consolidated financial statements as at December 31, 2013,2016, have been approved by Managementthe Board of Director’s in an extraordinary meeting held on April 30, 2014.March 15, 2017.
NOTE 41 -CONSOLIDATION38 - CONSOLIDATION SCHEDULE
In accordance with SEC rule SX 3-10 the Company is presenting consolidation schedules as Senior Notes issued by TAM Capital (issuer), a 100% subsidiary of TAM S.A., in 2007 are fully and unconditionally guaranteed by TAM S.A (guarantor) and by TAM Linhas Aéreas (guarantor) which is also a 100% subsidiary of TAM S.A.S.A.. The consolidation schedules separately present the financial information for LATAM Airlines Group S.A. (parent company), TAM S.A. (guarantor), TAM Linhas Aéreas S.A. (guarantor) and other consolidated subsidiaries of LATAM Airlines Group S.A. (non-guarantors).
The comparative consolidation schedules have been revised as a result of modifications made to the fair values calculated in the business combination with TAM S.A. and Subsidiaries, during the measurement period in accordance with IFRS 3, and correction of non- significant errors originated before the date of acquisition within TAM S.A. (Note 18.2.(c)).
Assets Current assets Cash and cash equivalents Other financial assets Other non-financial assets Trade and other accounts receivable Accounts receivable from related entities Inventories Tax assets Total current assets other than non-current assets (or disposal groups) classified as held for sale Non-current assets and disposal groups held for sale Total current assets Non-current assets Other financial assets Other non-financial assets Accounts receivable Accounts receivable from related parties Equity accounted investments Intangible assets other than goodwill Goodwill Property, plant and equipment Current tax assets, long term portion Deferred tax assets Total non-current assets Total assets LATAM S.A.
(parent company) TAM S.A.
(guarantor) TAM Capital
(subsidiary issuer) TAM Linhas
Aéreas S.A.
(guarantor) Other
(non-guarantor) Consolidating
adjustments Consolidated As of
December 31,
2016 As of
December 31,
2016 As of
December 31,
2016 As of
December 31,
2016 As of
December 31,
2016 As of
December 31,
2016 As of
December 31,
2016 ThUS$ ThUS$ ThUS$ ThUS$ ThUS$ ThUS$ ThUS$ 585,754 11,170 2 104,676 247,725 — 949,327 9,770 17,626 — 227,141 751,960 (293,669 ) 712,828 67,456 65 — 83,701 60,051 969 212,242 385,969 4,612 — 420,788 301,283 (4,763 ) 1,107,889 531,372 1,284 — 183,751 607,980 (1,323,833 ) 554 115,963 — — 121,062 4,339 (1 ) 241,363 15,581 5,918 — 4,776 39,103 (1 ) 65,377 1,711,865 40,675 2 1,145,895 2,012,441 (1,621,298 ) 3,289,580 261,798 — — 33,140 31,673 10,584 337,195 1,973,663 40,675 2 1,179,035 2,044,114 (1,610,714 ) 3,626,775 81,785 476,175 — 332,647 2,001 (790,483 ) 102,125 120,467 53 — 198,059 24,903 (106,138 ) 237,344 5,111 — — 4 3,139 — 8,254 507,234 — 408,628 64,311 859,387 (1,839,560 ) — 1,112,426 14,143 — — 375,774 (1,502,343 ) — 143,009 38,332 — 1,063,917 365,054 1 1,610,313 2,621,493 — — — 86,013 2,876 2,710,382 8,807,343 19 — 795,031 615,260 280,496 10,498,149 — — — — 20,272 — 20,272 — 17,731 — 331,119 90,149 (54,419 ) 384,580 13,398,868 546,453 408,628 2,785,088 2,441,952 (4,009,570 ) 15,571,419 15,372,531 587,128 408,630 3,964,123 4,486,066 (5,620,284 ) 19,198,194
Liabilities and shareholder’s equity Current liabilities Other financial liabilities Trade and other accounts payable Accounts payable to related parties Other provisions Tax liabilities Other non-financial liabilities Total current liabilities other than non-current liabilities (or disposal groups) classified as held for sale Non-current liabilities and disposal groups held for sale Total current liabilities Non-current liabilities Other financial liabilities Accounts payable Accounts payable to related parties Provision for losses on investments Other provisions Deferred tax liabilities Employee benefits Other non-financial liabilities Total non-current liabilities Total liabilities Equity Share capital Retained earnings Share premium Treasury shares Other reserves Parent’s ownership interest Non-controlling interest Total non-current liabilities Total liabilities CONSOLIDATED STATEMENT OF FINANCIAL POSITION LATAM S.A.
(parent company) TAM S.A.
(guarantor) TAM Capital
(subsidiary issuer) TAM Linhas
Aéreas S.A.
(guarantor) Other
(non-guarantor) Consolidating
adjustments Consolidated As of
December 31,
2016 As of
December 31,
2016 As of
December 31,
2016 As of
December 31,
2016 As of
December 31,
2016 As of
December 31,
2016 As of
December 31,
2016 ThUS$ ThUS$ ThUS$ ThUS$ ThUS$ ThUS$ ThUS$ 1,212,181 — 303,831 285,600 37,815 101 1,839,528 391,925 147 — 697,865 518,960 (15,829 ) 1,593,068 247,258 44 — 424,444 631,183 (1,302,660 ) 269 31 — — — 2,612 — 2,643 8,343 — — — 5,943 — 14,286 1,502,973 423 — 690,345 568,567 (63 ) 2,762,245 3,362,711 614 303,831 2,098,254 1,765,080 (1,318,451 ) 6,212,039 — — — — 24,792 (14,640 ) 10,152 3,362,711 614 303,831 2,098,254 1,789,872 (1,333,091 ) 6,222,191 5,706,157 — — 394,790 701,838 (5,833 ) 6,796,952 171,467 — — 183,904 4,019 1 359,391 769,260 30,142 107,957 308,984 638,321 (1,854,664 ) — 547,335 — — — 9,914 (557,249 ) — 17,298 — — 479,219 30,915 (104,938 ) 422,494 475,850 — — 246,443 171,449 22,017 915,759 48,794 — — 1,046 32,483 (1 ) 82,322 177,000 — — 36,781 — — 213,781 7,913,161 30,142 107,957 1,651,167 1,588,939 (2,500,667 ) 8,790,699 11,275,872 30,756 411,788 3,749,421 3,378,811 (3,833,758 ) 15,012,890 3,149,564 1,545,189 133,139 1,839,233 1,179,356 (4,696,917 ) 3,149,564 366,404 (1,354,337 ) (136,297 ) (1,434,402 ) (388,780 ) 3,313,816 366,404 — 22,996 — — 501,197 (524,193 ) — (178 ) — — — — — (178 ) 580,870 342,524 — (190,131 ) (184,518 ) 32,125 580,870 4,096,660 556,372 (3,158 ) 214,700 1,107,255 (1,875,169 ) 4,096,660 — — — — — 88,644 88,644 4,096,660 556,372 (3,158 ) 214,700 1,107,255 (1,786,525 ) 4,185,304 15,372,532 587,128 408,630 3,964,121 4,486,066 (5,620,283 ) 19,198,194
Assets Current assets Cash and cash equivalents Other financial assets Other non-financial assets Trade and other accounts receivable Accounts receivable from related entities Inventories Tax assets Total current assets other than non-current assets (or disposal groups) classified as held for sale Non-current assets and disposal groups held for sale Total current assets Non-current assets Other financial assets Other non-financial assets Accounts receivable Accounts receivable from related parties Equity accounted investments Intangible assets other than goodwill Goodwill Property, plant and equipment Current tax assets, long term portion Deferred tax assets Total non-current assets Total assets LATAM S.A.
(parent company) TAM S.A.
(guarantor) TAM Capital
(subsidiary issuer) TAM Linhas
Aéreas S.A.
(guarantor) Other
(non-guarantor) Consolidating
adjustments Consolidated As of
December 31,
2015 As of
December 31,
2015 As of
December 31,
2015 As of
December 31,
2015 As of
December 31,
2015 As of
December 31,
2015 As of
December 31,
2015 ThUS$ ThUS$ ThUS$ ThUS$ ThUS$ ThUS$ ThUS$ 301.109 859 67 142.439 309.023 — 753.497 108.263 416 — 105.439 581.773 (144.543 ) 651.348 123.332 718 — 150.204 55.501 261 330.016 367.322 3.897 — 151.458 274.301 (4 ) 796.974 451.061 1.072 82.218 533.629 1.049.892 (2.117.689 ) 183 146.241 — — 75.238 3.429 — 224.908 15.711 5.824 — 11.264 31.216 — 64.015 1.513.039 12.786 82.285 1.169.671 2.305.135 (2.261.975 ) 2.820.941 609 — — 277 1.074 — 1.960 1.513.648 12.786 82.285 1.169.948 2.306.209 (2.261.975 ) 2.822.901 71.776 425.952 — 221.155 1.620 (631.045 ) 89.458 84.249 730 — 114.080 33.107 3.297 235.463 2.105 — — 5.521 3.089 — 10.715 506.672 — 304.535 1 1.007.074 (1.818.282 ) — 1.065.985 11.804 — — 392.937 (1.470.726 ) — 101.212 31.993 — 879.356 308.862 2 1.321.425 2.194.449 — — — 83.250 2.876 2.280.575 8.917.026 19 — 881.138 836.100 304.374 10.938.657 — — — — 25.629 — 25.629 — 15.747 — 311.059 82.901 (33.112 ) 376.595 12.943.474 486.245 304.535 2.412.310 2.774.569 (3.642.616 ) 15.278.517 14.457.122 499.031 386.820 3.582.258 5.080.778 (5.904.591 ) 18.101.418
As of December 31, ThUS$ As of ThUS$ As of December 31, ThUS$ As of ThUS$ As of December 31, ThUS$ As of ThUS$ As of ThUS$ Liabilities and shareholder’s equity Current liabilities Other financial liabilities Trade and other accounts payable Accounts payable to related parties Other provisions Tax liabilities Other non-financial liabilities Total current liabilities Non-current liabilities Other financial liabilities Accounts payable Accounts payable to related parties Provision for losses on investments Other provisions Deferred tax liabilities Employee benefits Other non-financial liabilities Total non-current liabilities Total liabilities Equity Share capital Retained earnings Share premium Treasury shares Other reserves Parent’s ownership interest Non-controlling interest Total non-current liabilities Total liabilities LATAM S.A.
(parent company) TAM S.A.
(guarantor) TAM Capital
(subsidiary issuer) TAM Linhas
Aéreas S.A.
(guarantor) Other
(non-guarantor) Consolidating
adjustments Consolidated
2015
December 31,
2015
2015
December 31,
2015
2015
December 31,
2015
December 31,
2015 1.459.629 — 3.318 124.778 56.415 95 1.644.235 398.351 722 — 624.410 452.436 8.038 1.483.957 328.618 804 75.437 786.235 951.720 (2.142.367 ) 447 29 — — 10.776 2.894 (10.777 ) 2.922 12.755 — — — 6.623 — 19.378 1.404.126 558 — 588.839 496.542 (32 ) 2.490.033 3.603.508 2.084 78.755 2.135.038 1.966.630 (2.145.043 ) 5.640.972 5.785.018 — 299.775 527.207 927.846 (7.461 ) 7.532.385 129.759 — — 229.006 58.285 — 417.050 797.109 24.395 — — 972.543 (1.794.047 ) — 518.975 — — — 19.343 (538.318 ) — 13.768 73 — 389.120 21.535 1 424.497 478.596 — — 151.950 153.957 27.062 811.565 37.854 — — — 27.417 — 65.271 236.000 — — 36.130 — — 272.130 7.997.079 24.468 299.775 1.333.413 2.180.926 (2.312.763 ) 9.522.898 11.600.587 26.552 378.530 3.468.451 4.147.556 (4.457.806 ) 15.163.870 2.545.705 1.289.676 111.123 1.371.505 728.944 (3.501.248 ) 2.545.705 317.950 (1.126.588 ) (102.833 ) (1.191.909 ) (219.031 ) 2.640.361 317.950 — 19.194 — — 501.209 (520.403 ) — (178 ) — — — — — (178 ) (6.942 ) 290.197 — (65.641 ) (81.070 ) (143.486 ) (6.942 ) 2.856.535 472.479 8.290 113.955 930.052 (1.524.776 ) 2.856.535 — — — — — 81.013 81.013 2.856.535 472.479 8.290 113.955 930.052 (1.443.763 ) 2.937.548 14.457.122 499.031 386.820 3.582.406 5.077.608 (5.901.569 ) 18.101.418
As of December 31, ThUS$ As of ThUS$ As of December 31, ThUS$ As of ThUS$ As of December 31, ThUS$ As of ThUS$ As of ThUS$ Revenue Cost of sales Gross margin Other income Distribution costs Administrative expenses Other expenses Other gains/(losses) Gains (losses) from operating activities Financial income Financial costs Revenue and losses from associated companies Exchange differences Resut for readjustable units Income / (loss) before taxes Income tax expense / benefit NET INCOME / (LOSS) FOR THE YEAR Income / (loss) attributable to owners of the parent Income / (loss) attributable to non-controlling NET INCOME / (LOSS) Total comprehensive income / (loss) Comprehensive income / (loss) attributable to owners of the parent Comprehensive income / (loss) attributable to non-controlling interest Total comprehensive income / (loss) LATAM S.A.
(parent company) TAM S.A.
(guarantor) TAM Capital
(subsidiary issuer) TAM Linhas
Aéreas S.A.
(guarantor) Other
(non-guarantor) Consolidating
adjustments Consolidated
2016
December 31,
2016
2016
December 31,
2016
2016
December
31, 2016
December 31,
2016 2,723,927 — — 3,842,983 2,838,907 (417,477 ) 8,988,340 (2,715,888 ) — — (3,389,650 ) (2,566,040 ) 1,704,541 (6,967,037 ) 8,039 — — 453,333 272,867 1,287,064 2,021,303 1,302,707 — — 113,116 1,018,836 (1,895,911 ) 538,748 (262,038 ) — — (264,886 ) (329,094 ) 108,592 (747,426 ) (345,552 ) (534 ) — (344,929 ) (687,878 ) 505,939 (872,954 ) (199,791 ) (1,354 ) (20 ) (59,965 ) (118,470 ) 5,862 (373,738 ) (49,532 ) 790 — (4,993 ) (5,999 ) (12,900 ) (72,634 ) 453,833 (1,098 ) (20 ) (108,324 ) 150,262 (1,354 ) 493,299 (5,043 ) (104 ) 13,976 21,272 103,491 (58,643 ) 74,949 (336,386 ) (4 ) (25,643 ) (52,168 ) (58,505 ) 56,370 (416,336 ) (38,438 ) 7,052 — (80,810 ) — 112,196 — (37,365 ) — (12 ) 223,109 (67,769 ) 3,688 121,651 272 — — — 39 — 311 36,873 5,846 (11,699 ) 3,079 127,518 112,257 273,874 32,347 (3,739 ) — (101,551 ) (73,605 ) (16,656 ) (163,204 ) 69,220 2,107 (11,699 ) (98,472 ) 53,913 95,601 110,670 69,220 2,107 (11,699 ) (98,472 ) 53,913 54,151 69,220 — — — — — 41,450 41,450 69,220 2,107 (11,699 ) (98,472 ) 53,913 95,601 110,670 648,539 195 (13,199 ) (90,953 ) 147,049 3,912 695,543 648,539 195 (13,199 ) (90,953 ) 123,583 (19,626 ) 648,539 — — — 23,466 23,538 47,004 648,539 195 (13,199 ) (90,953 ) 147,049 3,912 695,543
As of ThUS$ As of ThUS$ As of ThUS$ As of ThUS$ As of ThUS$ As of ThUS$ As of ThUS$ Revenue Cost of sales Gross margin Other income Distribution costs Administrative expenses Other expenses Other gains/(losses) Gains (losses) from operating activities Financial income Financial costs Revenue and losses from associated companies Exchange differences Resut for readjustable units Income / (loss) before taxes Income tax expense / benefit NET INCOME / (LOSS) FOR THE YEAR Income / (loss) attributable to owners of the parent Income / (loss) attributable to non-controlling NET INCOME / (LOSS) Total comprehensive income / (loss) Comprehensive income / (loss) attributable to owners of the parent Comprehensive income / (loss) attributable to non-controlling interest Total comprehensive income / (loss) LATAM S.A.
(parent company) TAM S.A.
(guarantor) TAM Capital
(subsidiary issuer) TAM Linhas
Aéreas S.A.
(guarantor) Other
(non-guarantor) Consolidating
adjustments Consolidated
December 31,
2015
December 31,
2015
December 31,
2015
December 31,
2015
December 31,
2015
December
31, 2015
December 31,
2015 2.759.969 — — 4.224.290 3.228.372 (472.586 ) 9.740.045 (2.670.774 ) — — (3.745.752 ) (2.928.504 ) 1.708.321 (7.636.709 ) 89.195 — — 478.538 299.868 1.235.735 2.103.336 1.132.663 — — 181.922 1.017.029 (1.945.833 ) 385.781 (287.089 ) — — (303.936 ) (346.840 ) 154.561 (783.304 ) (325.567 ) (1.257 ) — (337.064 ) (784.628 ) 570.510 (878.006 ) (189.244 ) (951 ) (4 ) (24.325 ) (118.091 ) 8.628 (323.987 ) (81.244 ) 161 — (33.019 ) 45.423 13.399 (55.280 ) 338.714 (2.047 ) (4 ) (37.884 ) 112.761 37.000 448.540 9.222 1.472 14.986 58.670 65.700 (74.970 ) 75.080 (296.205 ) — (25.264 ) (62.918 ) (111.450 ) 82.480 (413.357 ) (217.530 ) (165.774 ) — 32.134 — 351.207 37 (40.151 ) (10 ) 4.680 (472.122 ) 49.177 (9.470 ) (467.896 ) 23 — — — 457 1 481 (205.927 ) (166.359 ) (5.602 ) (482.120 ) 116.645 386.248 (357.115 ) (13.347 ) (2.790 ) — 200.507 (37.385 ) 31.398 178.383 (219.274 ) (169.149 ) (5.602 ) (281.613 ) 79.260 417.646 (178.732 ) (219.274 ) (169.149 ) (5.602 ) (281.613 ) 79.260 377.104 (219.274 ) — — — — — 40.542 40.542 (219.274 ) (169.149 ) (5.602 ) (281.613 ) 79.260 417.646 (178.732 ) (1.551.330 ) (168.932 ) (4.162 ) (302.015 ) (57.568 ) 544.400 (1.539.607 ) (1.551.330 ) (168.932 ) (4.162 ) (302.015 ) (92.830 ) 567.938 (1.551.331 ) — — — 35.262 (23.538 ) 11.724 (1.551.330 ) (168.932 ) (4.162 ) (302.015 ) (57.568 ) 544.400 (1.539.607 )
As of ThUS$ As of ThUS$ As of ThUS$ As of ThUS$ As of ThUS$ As of ThUS$ As of ThUS$ Revenue Cost of sales Gross margin Other income Distribution costs Administrative expenses Other expenses Other gains/(losses) Gains (losses) from operating activities Financial income Financial costs Equity accounted investments Exchange differences Resut for readjustable units Income / (loss) before taxes Income tax expense / benefit NET INCOME / (LOSS) FOR THE YEAR Income / (loss) attributable to owners of the parent Income / (loss) attributable to non-controlling NET INCOME / (LOSS) Total comprehensive income / (loss) Comprehensive income / (loss) attributable to owners of the parent Comprehensive income / (loss) attributable to non-controlling interest Total comprehensive income / (loss) LATAM S.A.
(parent company) TAM S.A.
(guarantor) TAM Capital
(subsidiary issuer) TAM Linhas
Aéreas S.A.
(guarantor) Other
(non-guarantor) Consolidating
adjustments Consolidated
December 31,
2014
December 31,
2014
December 31,
2014
December 31,
2014
December 31,
2014
December
31, 2014
December 31,
2014 3.055.416 — — 6.391.949 3.564.135 (917.999 ) 12.093.501 (3.075.475 ) (408 ) — (5.202.839 ) (3.450.252 ) 2.104.473 (9.624.501 ) (20.059 ) (408 ) — 1.189.110 113.883 1.186.474 2.469.000 1.014.024 — — 20.891 1.253.142 (1.910.412 ) 377.645 (318.825 ) — — (397.445 ) (365.581 ) 124.779 (957.072 ) (350.817 ) (3.423 ) — (452.014 ) (850.026 ) 675.620 (980.660 ) (197.055 ) (1.126 ) (9 ) (110.890 ) (122.798 ) 30.857 (401.021 ) (71.175 ) (170 ) — 24.828 (122.589 ) 202.630 33.524 56.093 (5.127 ) (9 ) 274.480 (93.969 ) 309.948 541.416 6.353 (732 ) 13.789 46.414 134.249 (109.573 ) 90.500 (297.138 ) (581 ) (25.083 ) (156.890 ) (106.994 ) 156.652 (430.034 ) 86.715 179.647 — (7.530 ) (4.280 ) (261.007 ) (6.455 ) (88.909 ) 339 2.198 (81.447 ) 35.754 1.864 (130.201 ) — — — — 7 — 7 (236.886 ) 173.546 (9.105 ) 75.027 (35.233 ) 97.884 65.233 (23.099 ) 1.140 — (33.461 ) (105.194 ) (131.790 ) (292.404 ) (259.985 ) 174.686 (9.105 ) 41.566 (140.427 ) (33.906 ) (227.171 ) (259.985 ) 174.686 (9.105 ) 41.566 (140.427 ) (66.720 ) (259.985 ) — — — — — 32.814 32.814 (259.985 ) 174.686 (9.105 ) 41.566 (140.427 ) (33.906 ) (227.171 ) (980.697 ) 93.514 (9.105 ) 101.097 (269.379 ) 70.947 (993.623 ) (980.697 ) 93.514 (9.105 ) 101.097 (269.379 ) 83.874 (980.696 ) — — — — (12.927 ) (12.927 ) (980.697 ) 93.514 (9.105 ) 101.097 (269.379 ) 70.947 (993.623 )
As of ThUS$ As of ThUS$ As of December 31, 2016 ThUS$ As of 2016 ThUS$ As of ThUS$ As of 2016 ThUS$ As of 2016 Cash flows from operating activities Receipts from sales of goods and services Other receipts from operating activities Payments to suppliers for the supply of goods and services Payments to and on behalf of employees Other payments for operating activities Interest received Income taxes refunded (paid) Other inflows (outflows) of cash Net cash flows from operating activities Cash flows from (used in) investing activities Other cash receipts from sales of equity or debt instruments of other entities Other payments to acquire equity or debt instruments of other entities Loans to related parties Proceeds from sale of property, plant and equipment Purchases of property, plant and equipment Amounts raised from sale of intangible assets Purchases of intangible assets Proceeds from related parties Dividends received Other inflows (outflows ) of cash Net cash flows from investing activities Cash flows from (used in) financing activities Proceeds from issue of shares Proceeds from term loans Proceeds from short term loans Loans from related parties Repayment of loans Payments of finance lease liabilities Repayment of loans to related parties Dividends Paid Interest paid Other inflows (outflows ) of cash Net cash flows from (used in) financing activities Net increase (decrease) in, cash and cash aquivalents before effect of exchange rate Effects of variation in the exchange rate on cash and cash equivalents Net increase (decrease) in cash and cash equivalents CASH AND CASH EQUIVALENTS AT BEGINNING OF PERIOD CASH AND CASH EQUIVALENTS AT END OF PERIOD LATAM S.A.
(parent company
and guarantor) TAM S.A.
(guarantor) TAM Capital
(subsidiary issuer) TAM Linhas
Aéreas S.A.
(guarantor) Other
(non-guarantor) Consolidating
adjustments Consolidated
December 31,
2016
December 31,
2016
December 31,
December 31,
2016
December 31,
December 31,
ThUS$ 10,286,552 (518 ) 21,433 3,923,956 10,504,664 (14,817,498 ) 9,918,589 68,543 — — — 1,816 — 70,359 (8,780,152 ) (2,457 ) (3,072 ) (3,421,614 ) (9,446,856 ) 14,898,030 (6,756,121 ) (426,969 ) (3,914 ) — (794,100 ) (595,296 ) — (1,820,279 ) (40,689 ) — — 40,738 (150,246 ) (12,642 ) (162,839 ) 3,037 — 2,674 (13,117 ) 54,597 (35,949 ) 11,242 973 (1,023 ) — 1,454 (60,960 ) — (59,556 ) (106,911 ) (947 ) (1 ) (168,159 ) 58,826 7,923 (209,269 ) 1,004,384 (8,859 ) 21,034 (430,842 ) 366,545 39,864 992,126 69,466 81,610 — 1,996,724 821,931 — 2,969,731 — (97,586 ) — (1,933,835 ) (675,312 ) — (2,706,733 ) — — — — (9,844 ) 9,844 — 94,247 — — 12,161 (2,774 ) (27,550 ) 76,084 (764,342 ) — — (86,752 ) 162,816 (6,092 ) (694,370 ) — — — — 1 — 1 (62,531 ) — — (19,554 ) (6,502 ) — (88,587 ) — — 6,107 — 48,361 (54,468 ) — — — — — 1,517 (1,517 ) — — (36 ) — (3,626 ) (53 ) 4,558 843 (663,160 ) (16,012 ) 6,107 (34,882 ) 340,141 (75,225 ) (443,031 ) 6 08,496 — — — 28,628 (28,628 ) 608,496 1,381,792 — — 199,322 238,902 — 1,820,016 279,593 — — — — — 279,593 — — — — 9,844 (9,844 ) — (1,682,589 ) — — (474 ) (438,059 ) (8 ) (2,121,130 ) (151,219 ) — — (79,162 ) (33,907 ) (50,292 ) (314,580 ) (40,586 ) — (6,107 ) — (7,626 ) 54,319 — — — — — (45,030 ) 3,807 (41,223 ) (304,423 ) — (22,295 ) (44,669 ) (64,589 ) 37,688 (398,288 ) (149,814 ) 59 — (6,264 ) (70,017 ) (3,127 ) (229,163 ) (58,750 ) 59 (28,402 ) 68,753 (381,854 ) 3,915 (396,279 ) 282,474 (24,812 ) (1,261 ) (396,971 ) 324,832 (31,446 ) 152,816 — 35,123 1,196 359,209 (352,514 ) — 43,014 282,474 10,311 (65 ) (37,762 ) (27,682 ) (31,446 ) 195,830 301,109 859 67 142,439 309,023 — 753,497 583,583 11,170 2 104 ,677 281,341 (31,446 ) 949,327
As of ThUS$ As of ThUS$ As of ThUS$ As of ThUS$ As of 2015 ThUS$ As of ThUS$ As of ThUS$ Cash flows from operating activities Receipts from sales of goods and services Other receipts from operating activities Payments to suppliers for the supply of goods and services Payments to and on behalf of employees Other payments for operating activities Interest received Income taxes refunded (paid) Other inflows (outflows) of cash Net cash flows from operating activities Cash flows from (used in) investing activities Cash flows used to obtain control of subsidiaries or other businesses Other cash receipts from sales of equity or debt instruments of other entities Other payments to acquire equity or debt instruments of other entities Other proceeds selling the shares of profit of investments accounted for using the equit Loans to related parties Proceeds from sale of property, plant and equipment Purchases of property, plant and equipment Amounts raised from sale of intangible assets Purchases of intangible assets Proceeds from related parties Dividends received Other inflows (outflows) of cash Net cash flows from investing activities Cash flows from (used in) financing activities Proceeds from issue of shares Payments to acquire or redeem the entity’s shares Proceeds from term loans Proceeds from short term loans Loans from related parties Repayment of loans Payments of finance lease liabilities Repayment of loans to related parties Dividends Paid Interest paid Other inflows (outflows) of cash Net cash flows from (used in) financing activities Net increase (decrease) in, cash and cash aquivalents before effect of exchange rate Effects of variation in the exchange rate on cash and cash equivalents Net increase (decrease) in cash and cash equivalents CASH AND CASH EQUIVALENTS AT BEGINNING OF PERIOD CASH AND CASH EQUIVALENTS AT END OF PERIOD LATAM S.A.
(parent
company
and
guarantor) TAM S.A.
(guarantor) TAM Capital
(subsidiary
issuer) TAM Linhas
Aéreas S.A.
(guarantor) Other
(non-guarantor) Consolidating
adjustments Consolidated
December 31,
2015
December 31,
2015
December 31,
2015
December 31,
2015
December 31,
December 31,
2015
December 31,
2015 5,506,889 (17,705 ) — 5,442,905 5,041,794 (4,601,486 ) 11,372,397 73,596 — — — 14,641 — 88,237 (3,936,180 ) (392 ) (22,537 ) (3,853,193 ) (3,869,722 ) 4,652,442 (7,029,582 ) (389,722 ) (883 ) — (922,865 ) (851,714 ) — (2,165,184 ) (209,137 ) (70 ) — 9,241 (151,211 ) — (351,177 ) 10,076 1,647 14,986 17,311 80,425 (81,071 ) 43,374 1,838 3,902 — (255,152 ) 191,449 — (57,963 ) (153,925 ) (25,176 ) (4 ) (48,194 ) 30,876 11,796 (184,627 ) 903,435 (38,677 ) (7,555 ) 390,053 486,538 (18,319 ) 1,715,475 — 432,360 — — (432,360 ) — — 42,266 1,535 — 30 ,992 444,667 — 519,460 (108,464 ) — — (81,332 ) (514,319 ) — (704,115 ) — (295,111 ) — — 295,111 — — (63,326 ) — — — (26,461 ) 89,787 — 20,617 — — 58,700 (22,200 ) — 57,117 (1,195,216 ) — — (194,464 ) 10,943 (191,012 ) (1,569,749 ) — 29,444 — — (29,353 ) — 91 (27,463 ) — — (11,869 ) (9,846 ) (3,271 ) (52,449 ) — — — — 59,551 (59,551 ) — 4,889 — — — 4,211 (9,100 ) — — — — 3,497 7,079 — 10,576 (1,326,697 ) 168,228 — (194,476 ) (212,977 ) (173,147 ) (1,739,069 ) — — — — 89,761 (89,761 ) — — — — 66 (319 ) 253 — 1,487,939 — — — 150,031 153,514 1,791,484 205,000 — — — — — 205,000 28,932 — — — 393,460 (422,392 ) — (707,307 ) — — (440 ) (556,046 ) — (1,263,793 ) (169,700 ) — — (128,075 ) (33,024 ) (11,815 ) (342,614 ) (337,693 ) — — — (49,809 ) 387,502 — (9 ) — — 82,204 (125,181 ) 7,954 (35,032 ) (277,233 ) — — (53,156 ) (151,124 ) 97,865 (383,648 ) (95,541 ) — — 8,250 7,369 (19,835 ) (99,757 ) 134,388 — — (91,151 ) (274,882 ) 103,285 (128,360 ) (288,874 ) 129,551 (7,555 ) 104,426 (1,321 ) (88,181 ) (151,954 ) (38,384 ) (128,735 ) 7,225 (7,056 ) 83,005 — (83,945 ) (327,258 ) 816 (330 ) 97,370 81,684 (88,181 ) (235,899 ) 628,367 43 397 44,326 316,263 — 989,396 301,109 859 67 141,696 397,947 (88,181 ) 753,497
As of ThUS$ As of ThUS$ As of ThUS$ As of ThUS$ As of ThUS$ As of ThUS$ As of ThUS$ Cash flows from operating activities Receipts from sales of goods and services Other receipts from operating activities Payments to suppliers for the supply of goods and services Payments to and on behalf of employees Other payments for operating activities Interest received Income taxes refunded (paid) Other inflows (outflows) of cash Net cash flows from operating activities Cash flows from (used in) investing activities Cash flows from losing control of subsidiaries or other businesses Cash flows used to obtain control of subsidiaries or other businesses Other cash receipts from sales of equity or debt instruments of other entities Other payments to acquire equity or debt instruments of other entities Loans to related parties Proceeds from sale of property, plant and equipment Purchases of property, plant and equipment Amounts raised from sale of intangible assets Purchases of intangible assets Other cash receipts from related parties Dividends received Other inflows (outflows) of cash Net cash flows from investing activities Cash flows from (used in) financing activities Proceeds from issue of shares Payments to acquire or redeem the entity’s shares Proceeds from long term loans Proceeds from short term loans Loans from related parties Repayment of loans Payments of finance lease liabilities Repayment of loans to related parties Dividends Paid Interest paid Other inflows (outflows) of cash Net cash flows from (used in) financing activities Net increase (decrease) in, cash and cash aquivalents before effect of exchange rate Effects of variation in the exchange rate on cash and cash equivalents Net increase (decrease) in cash and cash equivalents CASH AND CASH EQUIVALENTS AT BEGINNING OF PERIOD CASH AND CASH EQUIVALENTS AT END OF PERIOD LATAM S.A.
(parent company) TAM S.A.
(guarantor) TAM Capital
(subsidiary issuer) TAM Linhas
Aéreas S.A.
(guarantor) Other
(non-guarantor) Consolidating
adjustments Consolidated
December 31,
2014
December 31,
2014
December 31,
2014
December 31,
2014
December 31,
2014
December 31,
2014
December 31,
2014 5,959,058 (45,594 ) — 6,147,010 6,256,083 (4,948,719 ) 13,367,838 89,995 — — — 7,063 (127 ) 96,931 (4,221,845 ) (3,328 ) — (4,715,944 ) (5,348,418 ) 5,466,528 (8,823,007 ) (461,680 ) (2,857 ) — (1,225,709 ) (703,860 ) (39,546 ) (2,433,652 ) (150,833 ) — — 6,791 (48,934 ) (335,238 ) (528,214 ) 8,980 — 13,789 — 27,785 (38,965 ) 11,589 (6,909 ) (5,058 ) — 614 (84,254 ) (12,782 ) (108,389 ) (126,540 ) 4,327 (9 ) 15,146 (5,507 ) (139,074 ) (251,657 ) 1,090,226 (52,510 ) 13,780 227,908 99,958 (47,923 ) 1,331,439 — — — — 3,024 (3,024 ) — (250,350 ) (118,120 ) — 33,782 (154,930 ) 490,136 518 — 228 — 80,405 342,908 100,829 524,370 (36,477 ) — — — (138,920 ) (299,259 ) (474,656 ) (126,630 ) — 12,948 — (55,146 ) 168,828 — — — — 186,015 562,272 (184,021 ) 564,266 (1,269,024 ) — — (255,636 ) (224,816 ) 309,031 (1,440,445 ) — 8,224 — — — (8,224 ) — — — — (30,933 ) (23,831 ) (995 ) (55,759 ) — — — (75,082 ) 22,380 52,702 — 9,685 — — — 752 (10,437 ) — — — — (397 ) (15,527 ) (1,475 ) (17,399 ) (1,672,796 ) (109,668 ) 12,948 (61,846 ) 318,166 614,091 (899,105 ) 156,321 219,110 — 262,702 156,402 (638,214 ) 156,321 — — — — — 4,661 4,661 706,661 4,162 — 89,598 336,159 (93,760 ) 1,042,820 597,000 — — 84,944 6,151 (84,944 ) 603,151 — — — — 169,746 (169,746 ) — (1,147,651 ) — — (419,887 ) (706,576 ) (41,006 ) (2,315,120 ) (131,484 ) — — (181,779 ) (56,262 ) (24,606 ) (394,131 ) (9,310 ) — — — (3,483 ) 12,793 — — — — — (13,983 ) (21,379 ) (35,362 ) (246,598 ) (581 ) (24,479 ) (49,536 ) (168,938 ) 121,343 (368,789 ) (37,641 ) — — — — 23,864 (13,777 ) (112,702 ) 222,691 (24,479 ) (213,958 ) (280,784 ) (910,994 ) (1,320,226 ) (695,272 ) 60,513 2,249 (47,896 ) 137,340 (344,826 ) (887,892 ) (45,080 ) (60,573 ) (1,941 ) (29,882 ) (173,817 ) 203,678 (107,615 ) (740,352 ) (60 ) 308 (77,778 ) (36,477 ) (141,148 ) (995,507 ) 1,368,719 103 89 122,104 325,718 168,170 1,984,903 628,367 43 397 44,326 289,241 27,022 989,396
| TAM Linhas | ||||||||||||||||||||||||||||
| LATAM S.A. (parent company) | TAM S.A. (guarantor) | TAM Capital (subsidiary issuer) | Aéreas S.A. (guarantor) | Other (non-guarantor) | Consolidating adjustments | Consolidated | ||||||||||||||||||||||
As of December 31, 2013 | As of December 31, 2013 | As of December 31, 2013 | As of December 31, 2013 | As of December 31, 2013 | As of December 31, 2013 | As of December 31, 2013 | ||||||||||||||||||||||
| ThUS$ | ThUS$ | ThUS$ | ThUS$ | ThUS$ | ThUS$ | ThUS$ | ||||||||||||||||||||||
Assets | ||||||||||||||||||||||||||||
Current assets | ||||||||||||||||||||||||||||
Cash and cash equivalents | 1,368,719 | 108 | 88 | 122,104 | 325,719 | 168,165 | 1,984,903 | |||||||||||||||||||||
Other financial assets | 106,020 | 2,179 | — | 198,268 | 1,283,402 | (879,925 | ) | 709,944 | ||||||||||||||||||||
Other non-financial assets | 48,556 | 189 | — | 165,578 | 54,547 | 66,747 | 335,617 | |||||||||||||||||||||
Trade and other accounts receivable | 437,232 | 6,468 | — | 859,524 | 357,886 | (28,016 | ) | 1,633,094 | ||||||||||||||||||||
Accounts receivable from related entities | 301,283 | 1,708 | — | 237,480 | 1,112,530 | (1,652,373 | ) | 628 | ||||||||||||||||||||
Inventories | 124,877 | — | — | 97,885 | 8,266 | — | 231,028 | |||||||||||||||||||||
Tax assets | 14,017 | 13,989 | — | 60,013 | 77,512 | (83,641 | ) | 81,890 | ||||||||||||||||||||
|
|
|
|
|
|
|
|
|
|
|
|
|
| |||||||||||||||
Total current assets other than non-current assets (or disposal groups) classified as held for sale | 2,400,704 | 24,641 | 88 | 1,740,852 | 3,219,862 | (2,409,043 | ) | 4,977,104 | ||||||||||||||||||||
|
|
|
|
|
|
|
|
|
|
|
|
|
| |||||||||||||||
Non-current assets and disposal groups held for sale | 16 | — | — | 1,772 | 657 | — | 2,445 | |||||||||||||||||||||
|
|
|
|
|
|
|
|
|
|
|
|
|
| |||||||||||||||
Total current assets | 2,400,720 | 24,641 | 88 | 1,742,624 | 3,220,519 | (2,409,043 | ) | 4,979,549 | ||||||||||||||||||||
|
|
|
|
|
|
|
|
|
|
|
|
|
| |||||||||||||||
Non-current assets | ||||||||||||||||||||||||||||
Other financial assets | 15,533 | — | — | 45,559 | 4,197 | — | 65,289 | |||||||||||||||||||||
Other non-financial assets | 70,574 | 477 | — | 147,837 | 6,714 | 46,674 | 272,276 | |||||||||||||||||||||
Accounts receivable | 5,510 | — | — | 5,863 | 89,402 | — | 100,775 | |||||||||||||||||||||
Accounts receivable from related parties | 336,204 | 78 | 388,871 | 113,631 | 1,646,732 | (2,485,516 | ) | — | ||||||||||||||||||||
Equity accounted investments | 1,324,427 | 411,955 | — | 327,043 | 595,829 | (2,652,658 | ) | 6,596 | ||||||||||||||||||||
Intangible assets other than goodwill | 91,124 | 16,333 | — | 1,439,241 | 493,282 | 53,328 | 2,093,308 | |||||||||||||||||||||
Goodwill | 3,602,159 | 53,328 | — | — | 122,571 | (50,453 | ) | 3,727,605 | ||||||||||||||||||||
Property, plant and equipment | 7,599,227 | 44 | — | 2,661,177 | 629,873 | 92,465 | 10,982,786 | |||||||||||||||||||||
Current tax assets, long term portion | — | — | — | — | 46,367 | (46,367 | ) | — | ||||||||||||||||||||
Deferred tax assets | — | 34,074 | — | 421,554 | 140,030 | (192,696 | ) | 402,962 | ||||||||||||||||||||
|
|
|
|
|
|
|
|
|
|
|
|
|
| |||||||||||||||
Total non-current assets | 13,044,758 | 516,289 | 388,871 | 5,161,905 | 3,774,997 | (5,235,223 | ) | 17,651,597 | ||||||||||||||||||||
|
|
|
|
|
|
|
|
|
|
|
|
|
| |||||||||||||||
Total assets | 15,445,478 | 540,930 | 388,959 | 6,904,529 | 6,995,516 | (7,644,266 | ) | 22,631,146 | ||||||||||||||||||||
|
|
|
|
|
|
|
|
|
|
|
|
|
| |||||||||||||||
138
CONSOLIDATED STATEMENT OF FINANCIAL POSITION
| LATAM S.A. (parent company) | TAM S.A. (guarantor) | TAM Capital (subsidiary issuer) | TAM Linhas Aéreas S.A. (guarantor) | Other (non-guarantor) | Consolidating adjustments | Consolidated | ||||||||||||||||||||||
As of December 31, 2013 | As of December 31, 2013 | As of December 31, 2013 | As of December 31, 2013 | As of December 31, 2013 | As of December 31, 2013 | As of December 31, 2013 | ||||||||||||||||||||||
| ThUS$ | ThUS$ | ThUS$ | ThUS$ | ThUS$ | ThUS$ | ThUS$ | ||||||||||||||||||||||
Liabilities and shareholder’s equity | ||||||||||||||||||||||||||||
Current liabilities | ||||||||||||||||||||||||||||
Other financial liabilities | 1,101,396 | — | 3,318 | 819,320 | 115,753 | — | 2,039,787 | |||||||||||||||||||||
Trade and other accounts payable | 319,004 | 3,898 | — | 724,311 | 546,130 | (35,607 | ) | 1,557,736 | ||||||||||||||||||||
Accounts payable to related parties | 387,543 | 305 | — | 289,053 | 974,140 | (1,650,536 | ) | 505 | ||||||||||||||||||||
Other provisions | 6,807 | — | — | 19,664 | 1,385 | — | 27,856 | |||||||||||||||||||||
Tax liabilities | 3,939 | 6,680 | — | 52,402 | 31,559 | (82,997 | ) | 11,583 | ||||||||||||||||||||
Other non-financial liabilities | 1,249,124 | 369 | — | 894,099 | 673,173 | 54,875 | 2,871,640 | |||||||||||||||||||||
|
|
|
|
|
|
|
|
|
|
|
|
|
| |||||||||||||||
Total current liabilities | 3,067,813 | 11,252 | 3,318 | 2,798,849 | 2,342,140 | (1,714,265 | ) | 6,509,107 | ||||||||||||||||||||
|
|
|
|
|
| �� |
|
|
|
|
|
|
| |||||||||||||||
Non-current liabilities | ||||||||||||||||||||||||||||
Other financial liabilities | 5,039,852 | — | 298,422 | 1,408,863 | 1,112,848 | — | 7,859,985 | |||||||||||||||||||||
Accounts payable | 46,647 | — | — | 816,898 | 81,089 | (21,747 | ) | 922,887 | ||||||||||||||||||||
Accounts payable to related parties | 1,306,254 | 85,202 | 57,608 | 294,758 | 743,271 | (2,487,093 | ) | — | ||||||||||||||||||||
Provision for losses on investments | 246,981 | — | — | — | 21,414 | (268,359 | ) | 36 | ||||||||||||||||||||
Other provisions | 15,529 | 123 | — | 1,017,362 | 89,197 | — | 1,122,211 | |||||||||||||||||||||
Deferred tax liabilities | 471,308 | 16,333 | — | 205,397 | 230,911 | (156,721 | ) | 767,228 | ||||||||||||||||||||
Employee benefits | 12,273 | — | — | — | 15,276 | 18,117 | 45,666 | |||||||||||||||||||||
Other non-financial liabilities | — | — | — | 77,317 | 250 | — | 77,567 | |||||||||||||||||||||
|
|
|
|
|
|
|
|
|
|
|
|
|
| |||||||||||||||
Total non-current liabilities | 7,138,844 | 101,658 | 356,030 | 3,820,595 | 2,294,256 | (2,915,803 | ) | 10,795,580 | ||||||||||||||||||||
|
|
|
|
|
|
|
|
|
|
|
|
|
| |||||||||||||||
Total liabilities | 10,206,657 | 112,910 | 359,348 | 6,619,444 | 4,636,396 | (4,630,068 | ) | 17,304,687 | ||||||||||||||||||||
Equity | ||||||||||||||||||||||||||||
Share capital | 2,389,384 | 1,901,275 | 185,228 | 1,979,282 | 1,458,941 | (5,524,726 | ) | 2,389,384 | ||||||||||||||||||||
Retained earnings | 795,303 | (2,019,778 | ) | (155,617 | ) | (1,836,203 | ) | 120,241 | 3,891,357 | 795,303 | ||||||||||||||||||
Share premium | — | 31,993 | — | — | 432,880 | (464,873 | ) | — | ||||||||||||||||||||
Treasury shares | (178 | ) | — | — | — | — | — | (178 | ) | |||||||||||||||||||
Other reserves | 2,054,312 | 514,530 | — | 142,006 | 347,058 | (1,003,594 | ) | 2,054,312 | ||||||||||||||||||||
|
|
|
|
|
|
|
|
|
|
|
|
|
| |||||||||||||||
Parent’s ownership interest | 5,238,821 | 428,020 | 29,611 | 285,085 | 2,359,120 | (3,101,836 | ) | 5,238,821 | ||||||||||||||||||||
Non-controlling interest | — | — | — | — | — | 87,638 | 87,638 | |||||||||||||||||||||
|
|
|
|
|
|
|
|
|
|
|
|
|
| |||||||||||||||
Total non-current liabilities | 5,238,821 | 428,020 | 29,611 | 285,085 | 2,359,120 | (3,014,198 | ) | 5,326,459 | ||||||||||||||||||||
|
|
|
|
|
|
|
|
|
|
|
|
|
| |||||||||||||||
Total liabilities | 15,445,478 | 540,930 | 388,959 | 6,904,529 | 6,995,516 | (7,644,266 | ) | 22,631,146 | ||||||||||||||||||||
|
|
|
|
|
|
|
|
|
|
|
|
|
| |||||||||||||||
CONSOLIDATED STATEMENT OF FINANCIAL POSITION
| LATAM S.A. (parent company) | TAM S.A. (guarantor) | TAM Capital (subsidiary issuer) | TAM Linhas Aéreas S.A. (guarantor) | Other (non-guarantor) | Consolidating adjustments | Consolidated | ||||||||||||||||||||||
As of December 31, | As of December 31, 2012 | As of December 31, | As of December 31, 2012 | As of December 31, 2012 | As of December 31, 2012 | As of December 31, 2012 | ||||||||||||||||||||||
| ThUS$ | ThUS$ | ThUS$ | ThUS$ | ThUS$ | ThUS$ | ThUS$ | ||||||||||||||||||||||
Assets | ||||||||||||||||||||||||||||
Current assets | ||||||||||||||||||||||||||||
Cash and cash equivalents | 231,930 | 69 | 3,797 | 166,755 | 169,686 | 78,026 | 650,263 | |||||||||||||||||||||
Other financial assets | 77,796 | 2,588 | — | 115,966 | 963,537 | (523,344 | ) | 636,543 | ||||||||||||||||||||
Other non-financial assets | 37,245 | 206 | — | 136,009 | 51,750 | 59,194 | 284,404 | |||||||||||||||||||||
Trade and other accounts receivable | 400,057 | 7,411 | — | 635,391 | 382,123 | (7,451 | ) | 1,417,531 | ||||||||||||||||||||
Accounts receivable from related entities | 227,465 | — | — | 52,640 | 677,723 | (942,641 | ) | 15,187 | ||||||||||||||||||||
Inventories | 93,788 | — | — | 72,635 | 10,395 | — | 176,818 | |||||||||||||||||||||
Tax assets | 16,698 | 19,786 | — | 82,383 | 41,964 | (65,046 | ) | 95,785 | ||||||||||||||||||||
|
|
|
|
|
|
|
|
|
|
|
|
|
| |||||||||||||||
Total current assets other than non-current assets (or disposal groups) classified as held for sale | 1,084,979 | 30,060 | 3,797 | 1,261,779 | 2,297,178 | (1,401,262 | ) | 3,276,531 | ||||||||||||||||||||
|
|
|
|
|
|
|
|
|
|
|
|
|
| |||||||||||||||
Non-current assets and disposal groups held for sale | 35,874 | — | — | 1,155 | 10,626 | — | 47,655 | |||||||||||||||||||||
|
|
|
|
|
|
|
|
|
|
|
|
|
| |||||||||||||||
Total current assets | 1,120,853 | 30,060 | 3,797 | 1,262,934 | 2,307,804 | (1,401,262 | ) | 3,324,186 | ||||||||||||||||||||
|
|
|
|
|
|
|
|
|
|
|
|
|
| |||||||||||||||
Non-current assets | ||||||||||||||||||||||||||||
Other financial assets | 15,499 | — | — | 30,860 | 33,771 | (6,035 | ) | 74,095 | ||||||||||||||||||||
Other non-financial assets | 59,756 | 445 | — | 199,666 | 2,219 | 45,901 | 307,987 | |||||||||||||||||||||
Accounts receivable | 16,485 | — | — | 5,989 | 28,138 | — | 50,612 | |||||||||||||||||||||
Accounts receivable from related parties | 122,219 | 89 | 141,667 | 73,044 | 1,169,225 | (1,506,244 | ) | — | ||||||||||||||||||||
Equity accounted investments | 1,258,347 | 116,713 | — | 54,677 | 356,969 | (1,782,949 | ) | 3,757 | ||||||||||||||||||||
Intangible assets other than goodwill | 83,036 | — | — | 1,663,841 | 635,522 | — | 2,382,399 | |||||||||||||||||||||
Goodwill | 4,078,562 | — | — | — | 134,598 | — | 4,213,160 | |||||||||||||||||||||
Property, plant and equipment | 6,560,859 | 57 | — | 4,109,712 | 1,136,448 | — | 11,807,076 | |||||||||||||||||||||
Current tax assets, long term portion | — | — | — | — | 45,900 | (45,900 | ) | — | ||||||||||||||||||||
Deferred tax assets | — | 36,639 | — | 466,384 | 129,372 | (469,328 | ) | 163,067 | ||||||||||||||||||||
|
|
|
|
|
|
|
|
|
|
|
|
|
| |||||||||||||||
Total non-current assets | 12,194,763 | 153,943 | 141,667 | 6,604,173 | 3,672,162 | (3,764,555 | ) | 19,002,153 | ||||||||||||||||||||
|
|
|
|
|
|
|
|
|
|
|
|
|
| |||||||||||||||
Total assets | 13,315,616 | 184,003 | 145,464 | 7,867,107 | 5,979,966 | (5,165,817 | ) | 22,326,339 | ||||||||||||||||||||
|
|
|
|
|
|
|
|
|
|
|
|
|
| |||||||||||||||
CONSOLIDATED STATEMENT OF FINANCIAL POSITION
| LATAM S.A. (parent company) | TAM S.A. (guarantor) | TAM Capital (subsidiary issuer) | TAM Linhas Aéreas S.A. (guarantor) | Other (non-guarantor) | Consolidating adjustments | Consolidated | ||||||||||||||||||||||
As of December 31, 2012 | As of December 31, 2012 | As of December 31, 2012 | As of December 31, 2012 | As of December 31, 2012 | As of December 31, 2012 | As of December 31, 2012 | ||||||||||||||||||||||
| ThUS$ | ThUS$ | ThUS$ | ThUS$ | ThUS$ | ThUS$ | ThUS$ | ||||||||||||||||||||||
Liabilities and shareholder’s equity | ||||||||||||||||||||||||||||
Current liabilities | ||||||||||||||||||||||||||||
Other financial liabilities | 746,536 | — | 3,318 | 1,096,140 | 199,499 | 1,837 | 2,047,330 | |||||||||||||||||||||
Trade and other accounts payable | 288,068 | 2,689 | — | 785,817 | 613,437 | (21 | ) | 1,689,990 | ||||||||||||||||||||
Accounts payable to related parties | 221,788 | 690 | — | 48,619 | 670,238 | (941,061 | ) | 274 | ||||||||||||||||||||
Other provisions | 6,814 | — | — | 52,175 | 585 | — | 59,574 | |||||||||||||||||||||
Tax liabilities | 2,209 | 8,222 | — | 44,970 | 26,484 | (67,373 | ) | 14,512 | ||||||||||||||||||||
Other non-financial liabilities | 989,923 | 424 | — | 813,563 | 627,832 | 54,145 | 2,485,887 | |||||||||||||||||||||
|
|
|
|
|
|
|
|
|
|
|
|
|
| |||||||||||||||
Total current liabilities | 2,255,338 | 12,025 | 3,318 | 2,841,284 | 2,138,075 | (952,473 | ) | 6,297,567 | ||||||||||||||||||||
|
|
|
|
|
|
|
|
|
|
|
|
|
| |||||||||||||||
Non-current liabilities | ||||||||||||||||||||||||||||
Other financial liabilities | 3,755,622 | — | 297,746 | 2,214,639 | 1,432,688 | (1,838 | ) | 7,698,857 | ||||||||||||||||||||
Accounts payable | 40,680 | — | — | 831,470 | 213,451 | — | 1,085,601 | |||||||||||||||||||||
Accounts payable to related parties | 345,790 | — | — | 803,970 | 344,255 | (1,494,015 | ) | — | ||||||||||||||||||||
Provision for losses on investments | 1,347,639 | 1,166,989 | — | 315,032 | 11,294 | (2,840,954 | ) | — | ||||||||||||||||||||
Other provisions | 15,320 | 140 | — | 1,215,256 | 76,156 | — | 1,306,872 | |||||||||||||||||||||
Deferred tax liabilities | 437,399 | — | — | 341,871 | 269,400 | (469,331 | ) | 579,339 | ||||||||||||||||||||
Employee benefits | 5,777 | — | — | 19,729 | 12,589 | — | 38,095 | |||||||||||||||||||||
Other non-financial liabilities | — | — | — | 99,022 | 301 | — | 99,323 | |||||||||||||||||||||
|
|
|
|
|
|
|
|
|
|
|
|
|
| |||||||||||||||
Total non-current liabilities | 5,948,227 | 1,167,129 | 297,746 | 5,840,989 | 2,360,134 | (4,806,138 | ) | 10,808,087 | ||||||||||||||||||||
|
|
|
|
|
|
|
|
|
|
|
|
|
| |||||||||||||||
Total liabilities | 8,203,565 | 1,179,154 | 301,064 | 8,682,273 | 4,498,209 | (5,758,611 | ) | 17,105,654 | ||||||||||||||||||||
Equity | ||||||||||||||||||||||||||||
Share capital | 1,501,018 | 406,542 | 43 | 493,821 | 735,302 | (1,635,708 | ) | 1,501,018 | ||||||||||||||||||||
Retained earnings | 1,076,136 | (1,750,126 | ) | (155,643 | ) | (1,778,337 | ) | 78,480 | 3,605,626 | 1,076,136 | ||||||||||||||||||
Share premium | — | 36,676 | — | — | 299,692 | (336,368 | ) | — | ||||||||||||||||||||
Treasury shares | (203 | ) | — | — | — | — | — | (203 | ) | |||||||||||||||||||
Other reserves | 2,535,100 | 311,757 | — | 469,350 | 368,283 | (1,149,390 | ) | 2,535,100 | ||||||||||||||||||||
|
|
|
|
|
|
|
|
|
|
|
|
|
| |||||||||||||||
Parent’s ownership interest | 5,112,051 | (995,151 | ) | (155,600 | ) | (815,166 | ) | 1,481,757 | 484,160 | 5,112,051 | ||||||||||||||||||
Non-controlling interest | — | — | — | — | — | 108,634 | 108,634 | |||||||||||||||||||||
|
|
|
|
|
|
|
|
|
|
|
|
|
| |||||||||||||||
Total non-current liabilities | 5,112,051 | (995,151 | ) | (155,600 | ) | (815,166 | ) | 1,481,757 | 592,794 | 5,220,685 | ||||||||||||||||||
|
|
|
|
|
|
|
|
|
|
|
|
|
| |||||||||||||||
Total liabilities | 13,315,616 | 184,003 | 145,464 | 7,867,107 | 5,979,966 | (5,165,817 | ) | 22,326,339 | ||||||||||||||||||||
|
|
|
|
|
|
|
|
|
|
|
|
|
| |||||||||||||||
CONSOLIDATED STATEMENT OF INCOME BY FUNCTION
| LATAM S.A. (parent company) | TAM S.A. (guarantor) | TAM Capital (subsidiary issuer) | TAM Linhas Aéreas S.A. (guarantor) | Other (non-guarantor) | Consolidating adjustments | Consolidated | ||||||||||||||||||||||
As of December 31, ThUS$ | As of ThUS$ | As of ThUS$ | As of 2013 ThUS$ | As of December 31, ThUS$ | As of 2013 ThUS$ | As of ThUS$ | ||||||||||||||||||||||
Revenue | 3.293.992 | — | — | 6.608.718 | 3.853.047 | (831.220 | ) | 12.924.537 | ||||||||||||||||||||
Cost of sales | (2.945.869 | ) | (3.957 | ) | — | (5.370.821 | ) | (3.493.775 | ) | 1.760.258 | (10.054.164 | ) | ||||||||||||||||
|
|
|
|
|
|
|
|
|
|
|
|
|
| |||||||||||||||
Gross margin | 348.123 | (3.957 | ) | — | 1.237.897 | 359.272 | 929.038 | 2.870.373 | ||||||||||||||||||||
|
|
|
|
|
|
|
|
|
|
|
|
|
| |||||||||||||||
Other income | 900.146 | — | — | 41.769 | 1.249.990 | (1.850.340 | ) | 341.565 | ||||||||||||||||||||
Distribution costs | (328.116 | ) | — | — | (438.251 | ) | (389.931 | ) | 130.402 | (1.025.896 | ) | |||||||||||||||||
Administrative expenses | (297.140 | ) | (19.015 | ) | — | (605.346 | ) | (917.953 | ) | 703.339 | (1.136.115 | ) | ||||||||||||||||
Other expenses | (173.866 | ) | (7.634 | ) | (27 | ) | (93.314 | ) | (142.092 | ) | 8.230 | (408.703 | ) | |||||||||||||||
Other gains/(losses) | (42.122 | ) | (1.216 | ) | — | (180.872 | ) | (21.810 | ) | 190.610 | (55.410 | ) | ||||||||||||||||
|
|
|
|
|
|
|
|
|
|
|
|
|
| |||||||||||||||
Gains (losses) from operating activities | 407.025 | (31.822 | ) | (27 | ) | (38.117 | ) | 137.476 | 111.279 | 585.814 | ||||||||||||||||||
|
|
|
|
|
|
|
|
|
|
|
|
|
| |||||||||||||||
Financial income | 1.966 | 1.668 | 7.150 | 38.284 | 91.106 | (67.346 | ) | 72.828 | ||||||||||||||||||||
Financial costs | (243.084 | ) | (449 | ) | (23.409 | ) | (142.500 | ) | (118.613 | ) | 65.531 | (462.524 | ) | |||||||||||||||
Equity accounted investments | (358.929 | ) | (430.613 | ) | — | 48.226 | — | 741.316 | — | |||||||||||||||||||
Revenue and losses from associated companies | (8.229 | ) | — | — | — | (3.599 | ) | 13.782 | 1.954 | |||||||||||||||||||
Exchange differences | (56.159 | ) | 88 | (5.006 | ) | (421.117 | ) | 19 | 1 | (482.174 | ) | |||||||||||||||||
Resut for readjustable units | 21 | — | — | — | 193 | — | 214 | |||||||||||||||||||||
|
|
|
|
|
|
|
|
|
|
|
|
|
| |||||||||||||||
Income before taxes | (257.389 | ) | (461.128 | ) | (21.292 | ) | (515.224 | ) | 106.582 | 864.563 | (283.888 | ) | ||||||||||||||||
Income tax expense | (23.725 | ) | 2.689 | — | 105.903 | (35.786 | ) | (29.012 | ) | 20.069 | ||||||||||||||||||
|
|
|
|
|
|
|
|
|
|
|
|
|
| |||||||||||||||
NET INCOME FOR THE PERIOD | (281.114 | ) | (458.439 | ) | (21.292 | ) | (409.321 | ) | 70.796 | 835.551 | (263.819 | ) | ||||||||||||||||
Income attributable to owners of the parent | (281.114 | ) | (458.439 | ) | (21.292 | ) | (409.321 | ) | 53.461 | 835.591 | (281.114 | ) | ||||||||||||||||
Income attributable to non-controlling | — | — | — | — | 17.335 | (40 | ) | 17.295 | ||||||||||||||||||||
|
|
|
|
|
|
|
|
|
|
|
|
|
| |||||||||||||||
NET INCOME | (281.114 | ) | (458.439 | ) | (21.292 | ) | (409.321 | ) | 70.796 | 835.551 | (263.819 | ) | ||||||||||||||||
|
|
|
|
|
|
|
|
|
|
|
|
|
| |||||||||||||||
Total comprehensive income | (768.457 | ) | (446.447 | ) | (21.292 | ) | (398.419 | ) | (14.050 | ) | 863.809 | (784.856 | ) | |||||||||||||||
|
|
|
|
|
|
|
|
|
|
|
|
|
| |||||||||||||||
Comprehensive income attributable to owners of the parent | (768.457 | ) | (446.447 | ) | (21.292 | ) | (398.419 | ) | 2.309 | 863.849 | (768.457 | ) | ||||||||||||||||
Comprehensive income attributable to non-controlling interest | — | — | — | (16.359 | ) | (40 | ) | (16.399 | ) | |||||||||||||||||||
|
|
|
|
|
|
|
|
|
|
|
|
|
| |||||||||||||||
Total comprehensive income | (768.457 | ) | (446.447 | ) | (21.292 | ) | (398.419 | ) | (14.050 | ) | 863.809 | (784.856 | ) | |||||||||||||||
|
|
|
|
|
|
|
|
|
|
|
|
|
| |||||||||||||||
CONSOLIDATED STATEMENT OF INCOME BY FUNCTION
| LATAM S.A. (parent company) | TAM S.A. (guarantor) | TAM Capital (subsidiary issuer) | TAM Linhas Aéreas S.A. (guarantor) | Other (non-guarantor) | Consolidating adjustments | Consolidated | ||||||||||||||||||||||
As of December 31, ThUS$ | As of ThUS$ | As of December 31, ThUS$ | As of ThUS$ | As of ThUS$ | As of ThUS$ | As of ThUS$ | ||||||||||||||||||||||
Revenue | 3.209.219 | — | — | 3.539.002 | 3.592.188 | (630.037 | ) | 9.710.372 | ||||||||||||||||||||
Cost of sales | (2.767.417 | ) | 14 | — | (2.967.003 | ) | (3.138.077 | ) | 1.238.030 | (7.634.453 | ) | |||||||||||||||||
|
|
|
|
|
|
|
|
|
|
|
|
|
| |||||||||||||||
Gross margin | 441.802 | 14 | — | 571.999 | 454.111 | 607.993 | 2.075.919 | |||||||||||||||||||||
|
|
|
|
|
|
|
|
|
|
|
|
|
| |||||||||||||||
Other income | 654.901 | — | — | 18.560 | 621.300 | (1.074.605 | ) | 220.156 | ||||||||||||||||||||
Distribution costs | (345.730 | ) | — | — | (221.468 | ) | (338.137 | ) | 101.716 | (803.619 | ) | |||||||||||||||||
Administrative expenses | (266.781 | ) | (26.300 | ) | — | (412.278 | ) | (595.504 | ) | 412.209 | (888.654 | ) | ||||||||||||||||
Other expenses | (85.788 | ) | (1.095 | ) | (3 | ) | (46.967 | ) | (126.532 | ) | (51.368 | ) | (311.753 | ) | ||||||||||||||
Other gains/(losses) | (27.026 | ) | 9 | — | 9 .938 | (32.713 | ) | 3 .961 | (45.831 | ) | ||||||||||||||||||
|
|
|
|
|
|
|
|
|
|
|
|
|
| |||||||||||||||
Gains (losses) from operating activities | 371.378 | (27.372 | ) | (3 | ) | (80.216 | ) | (17.475 | ) | (94 | ) | 246.218 | ||||||||||||||||
|
|
|
|
|
|
|
|
|
|
|
|
|
| |||||||||||||||
Financial income | 16.144 | 1.939 | 510 | 34.977 | 34.258 | (10.339 | ) | 77.489 | ||||||||||||||||||||
Financial costs | (128.586 | ) | (245 | ) | (11.401 | ) | (88.609 | ) | (76 .522 | ) | 10.765 | (294.598 | ) | |||||||||||||||
Equity accounted investments | (177.545 | ) | (67.312 | ) | — | 22 .719 | — | 222 .138 | — | |||||||||||||||||||
Revenue and losses from associated companies | 972 | — | — | — | — | — | 972 | |||||||||||||||||||||
Exchange differences | 11.233 | — | (1.259 | ) | 50 .671 | 6 .040 | — | 66.685 | ||||||||||||||||||||
Resut for readjustable units | 15 | — | — | — | 294 | (331 | ) | (22 | ) | |||||||||||||||||||
|
|
|
|
|
|
|
|
|
|
|
|
|
| |||||||||||||||
Income before taxes | 93.611 | (92.990 | ) | (12.153 | ) | (60.458 | ) | (53 .405 | ) | 222.045 | 96.744 | |||||||||||||||||
Income tax expense | (112.687 | ) | 17.796 | — | 5.299 | (12.794 | ) | — | (102.386 | ) | ||||||||||||||||||
|
|
|
|
|
|
|
|
|
|
|
|
|
| |||||||||||||||
NET INCOME FOR THE PERIOD | (19.076 | ) | (75.194 | ) | (12.153 | ) | (55.159 | ) | (66.199 | ) | 222.045 | (5.642 | ) | |||||||||||||||
Income attributable to owners of the parent | (19.076 | ) | (75.194 | ) | (12.153 | ) | (55.159 | ) | (79.633 | ) | 222 .139 | (19.076 | ) | |||||||||||||||
Income attributable to non – controlling | — | — | — | — | 13 .434 | — | 13.434 | |||||||||||||||||||||
|
|
|
|
|
|
|
|
|
|
|
|
|
| |||||||||||||||
NET INCOME | (19.076 | ) | (75.194 | ) | (12.153 | ) | (55.159 | ) | (66.199 | ) | 222.139 | (5.642 | ) | |||||||||||||||
|
|
|
|
|
|
|
|
|
|
|
|
|
| |||||||||||||||
Total comprehensive income | (2.359 | ) | (87.172 | ) | (12.154 | ) | (61.166 | ) | (68.590 | ) | 237.102 | 5.661 | ||||||||||||||||
|
|
|
|
|
|
|
|
|
|
|
|
|
| |||||||||||||||
Comprehensive income attributable to owners of the parent | (2.359 | ) | (87.172 | ) | (12.154 | ) | (61.166 | ) | (76.610 | ) | 237.102 | (2.359 | ) | |||||||||||||||
Comprehensive income attributable to non- controlling interest | — | — | — | — | 8 .020 | — | 8.020 | |||||||||||||||||||||
|
|
|
|
|
|
|
|
|
|
|
|
|
| |||||||||||||||
Total comprehensive income | (2.359 | ) | (87.172 | ) | (12.154 | ) | (61.166 | ) | (68.590 | ) | 237.102 | 5.661 | ||||||||||||||||
|
|
|
|
|
|
|
|
|
|
|
|
|
| |||||||||||||||
CONSOLIDATED STATEMENT OF CASH FLOWS DIRECT – METHOD
| TAM Linhas | ||||||||||||||||||||||||||||
| LATAM S.A. | TAM S.A. | TAM Capital | Aéreas S.A. | Other | Consolidating | |||||||||||||||||||||||
| (parent company) | (guarantor) | (subsidiary issuer) | (guarantor) | (non-guarantor) | adjustments | Consolidated | ||||||||||||||||||||||
As of 2013 ThUS$ | As of ThUS$ | As of December 31, 2013 ThUS$ | As of ThUS$ | As of ThUS$ | As of ThUS$ | As of ThUS$ | ||||||||||||||||||||||
Cash flows from operating activities | ||||||||||||||||||||||||||||
Receipts from sales of goods and services | 5,975,782 | — | — | 6,242,979 | 6,031,715 | (4,844,201 | ) | 13,406,275 | ||||||||||||||||||||
Other receipts from operating activities | 12,067 | — | — | — | 2,918 | (10,347 | ) | 4,638 | ||||||||||||||||||||
Payments to suppliers for the supply of goods and services | (4,291,945 | ) | (20,795 | ) | (377 | ) | (4,664,071 | ) | (4,417,013 | ) | 3,823,478 | (9,570,723 | ) | |||||||||||||||
Payments to and on behalf of employees | (423,688 | ) | (1,332 | ) | — | (1,572,939 | ) | (1,340,071 | ) | 932,715 | (2,405,315 | ) | ||||||||||||||||
Other payments for operating activities | — | — | — | — | (64,025 | ) | 32,810 | (31,215 | ) | |||||||||||||||||||
Dividends paid | — | — | — | — | (800 | ) | 800 | — | ||||||||||||||||||||
Dividends received | — | 70 ,950 | — | — | — | (70,950 | ) | — | ||||||||||||||||||||
Interest paid | — | — | (19,950 | ) | — | — | 19,950 | — | ||||||||||||||||||||
Interest received | 8,621 | — | — | 52,878 | 83,964 | (134,153 | ) | 11,310 | ||||||||||||||||||||
Income taxes refunded (paid) | (11,558 | ) | 4,256 | — | 40,393 | (94,185 | ) | (21,939 | ) | (83,033 | ) | |||||||||||||||||
Other inflows (outflows) of cash | 38,011 | (7,539 | ) | (27 | ) | (24,540 | ) | 16,575 | 54,281 | 76,761 | ||||||||||||||||||
|
|
|
|
|
|
|
|
|
|
|
|
|
| |||||||||||||||
Net cash flows from operating activities | 1,307,290 | 45,540 | (20,354 | ) | 74,700 | 219,078 | (217,556 | ) | 1,408,698 | |||||||||||||||||||
|
|
|
|
|
|
|
|
|
|
|
|
|
| |||||||||||||||
Cash flows from (used in) investing activities | ||||||||||||||||||||||||||||
Cash flows from losing control of subsidiaries or other businesses | — | — | — | — | 200 | (200 | ) | — | ||||||||||||||||||||
Cash flows used to obtain control of subsidiaries or other businesses | (1,650,000 | ) | (1,644,953 | ) | — | (616,911 | ) | (182,531 | ) | 4,088,878 | (5,517 | ) | ||||||||||||||||
Cash flows used in the purchase of non-controlling | — | — | — | — | — | (497 | ) | (497 | ) | |||||||||||||||||||
Other cash receipts from sales of equity or debt instruments of other entities | — | 409 | — | (208,776 | ) | (51,409 | ) | 530,261 | 270,485 | |||||||||||||||||||
Other payments to acquire equity or debt instruments of other entities | — | — | — | (29,101 | ) | (93,526 | ) | (318,174 | ) | (440,801 | ) | |||||||||||||||||
Loans to related parties | (288,957 | ) | — | (218,026 | ) | — | (86,282 | ) | 593,265 | — | ||||||||||||||||||
Proceeds from sale of property, plant and equipment | 6,281 | — | — | — | 189,445 | 29,470 | 225,196 | |||||||||||||||||||||
Purchases of property, plant and equipment | (1,523,440 | ) | — | — | (68,471 | ) | 109,632 | 100,493 | (1,381,786 | ) | ||||||||||||||||||
Amounts raised from sale of intangible assets | (12,539 | ) | — | — | (20,529 | ) | (14,021 | ) | 3,605 | (43,484 | ) | |||||||||||||||||
Proceeds from other long-term assets | — | — | — | — | 14,999 | 7,145 | 22,144 | |||||||||||||||||||||
Other cash receipts from related parties | — | — | — | (269,622 | ) | 30,260 | 239,362 | — | ||||||||||||||||||||
Income taxes refunded (paid) | — | — | — | — | (77,902 | ) | 77,902 | — | ||||||||||||||||||||
Other inflows (outflows) of cash | — | — | — | 61,188 | 18,435 | (4,175 | ) | 75,448 | ||||||||||||||||||||
|
|
|
|
|
|
|
|
|
|
|
|
|
| |||||||||||||||
Net cash flows from investing activities | (3,468,655 | ) | (1,644,544 | ) | (218,026 | ) | (1,152,222 | ) | (142,700 | ) | 5,347,335 | (1,278,812 | ) | |||||||||||||||
|
|
|
|
|
|
|
|
|
|
|
|
|
| |||||||||||||||
Cash flows from (used in) financing activities | ||||||||||||||||||||||||||||
Proceeds from issue of shares | 888,570 | 1,650,000 | 185,190 | 1,577,613 | 182,897 | (3,595,321 | ) | 888,949 | ||||||||||||||||||||
Payments to acquire or redeem the entity’s shares | — | (900 | ) | — | — | (200 | ) | 1,100 | — | |||||||||||||||||||
Proceeds from term loans | 1,924,260 | — | — | 114,768 | 65,815 | (61,325 | ) | 2,043,518 | ||||||||||||||||||||
Proceeds from short term loans | 963,800 | — | — | 145,285 | 51,984 | (59 ,910 | ) | 1,101,159 | ||||||||||||||||||||
Loans from related parties | 1,134,875 | — | — | — | 315,183 | (1,450,058 | ) | — | ||||||||||||||||||||
Repayment of loans | (1,223,409 | ) | — | — | (330,584 | ) | (332,092 | ) | (65,928 | ) | (1,952,013 | ) | ||||||||||||||||
Payments of finance lease liabilities | (83,088 | ) | — | — | (281,648 | ) | (41,234 | ) | (17,135 | ) | (423,105 | ) | ||||||||||||||||
Repayment of loans to related parties | (87,679 | ) | — | 54,594 | — | (21,874 | ) | 54,959 | — | |||||||||||||||||||
Dividends Paid | (3,288 | ) | — | — | — | (1,053 | ) | (25,353 | ) | (29,694 | ) | |||||||||||||||||
Interest paid | (164,186 | ) | — | (2,294 | ) | (329,617 | ) | (116,762 | ) | 251,853 | (361,006 | ) | ||||||||||||||||
Other inflows (outflows) of cash | (51,701 | ) | — | — | — | (59,400 | ) | 49,088 | (62,013 | ) | ||||||||||||||||||
|
|
|
|
|
|
|
|
|
|
|
|
|
| |||||||||||||||
Net cash flows from (used in) financing activities | 3,298,154 | 1,649,100 | 237,490 | 895,817 | 43,264 | (4,918,030 | ) | 1,205,795 | ||||||||||||||||||||
|
|
|
|
|
|
|
|
|
|
|
|
|
| |||||||||||||||
Net increase (decrease) in, cash and cash aquivalents before effect of exchange rate | 1,136,789 | 50,096 | (890 | ) | (181,705 | ) | 119,642 | 211,749 | 1,335,681 | |||||||||||||||||||
Effects of variation in the exchange rate on cash and cash equivalents | — | (50,061 | ) | (2,819 | ) | 137,052 | 50,398 | (135,607 | ) | (1,041 | ) | |||||||||||||||||
|
|
|
|
|
|
|
|
|
|
|
|
|
| |||||||||||||||
Net increase (decrease) in cash and cash equivalents | 1,136,789 | 35 | (3,709 | ) | (44,653 | ) | 170,040 | 76,142 | 1,334,640 | |||||||||||||||||||
CASH AND CASH EQUIVALENTS AT BEGINNING OF PERIOD | 231,930 | 73 | 3,797 | 166,755 | 169,675 | 78,037 | 650,263 | |||||||||||||||||||||
|
|
|
|
|
|
|
|
|
|
|
|
|
| |||||||||||||||
CASH AND CASH EQUIVALENTS AT END OF PERIOD | 1,368,719 | 108 | 88 | 122,102 | 339,715 | 154,179 | 1,984 ,903 | |||||||||||||||||||||
|
|
|
|
|
|
|
|
|
|
|
|
|
| |||||||||||||||
CONSOLIDATED STATEMENT OF CASH FLOWS DIRECT – METHOD
| LATAM S.A. (parent company and guarantor) | TAM S.A. (guarantor) | TAM Capital (subsidiary issuer) | TAM Linhas Aéreas S.A. (guarantor) | Other (non-guarantor) | Consolidating adjustments | Consolidated | ||||||||||||||||||||||
As of 2012 ThUS$ | As o f 2012 ThUS$ | As of ThUS$ | As of ThUS$ | As of ThUS$ | As of ThUS$ | As of ThUS$ | ||||||||||||||||||||||
Cash flows from operating activities | ||||||||||||||||||||||||||||
Receipts from sales of goods and services | 5,104,044 | — | — | 3,820,407 | 5,145,942 | (3,811,920 | ) | 10,258,473 | ||||||||||||||||||||
Other receipts from operating activities | 60,484 | — | — | — | 7,615 | (10,336 | ) | 57,763 | ||||||||||||||||||||
Payments to suppliers for the supply of goods and services | (3,998,995 | ) | (53,113 | ) | — | (2,517,274 | ) | (4,389,390 | ) | 3,804,907 | (7,153,865 | ) | ||||||||||||||||
Payments to and on behalf of employees | (407,991 | ) | (5,720 | ) | — | (798,466 | ) | (726,623 | ) | 31 | (1,938,769 | ) | ||||||||||||||||
Other payments for operating activities | — | — | — | — | (29,732 | ) | 10,407 | (19,325 | ) | |||||||||||||||||||
Interest paid | (2,371 | ) | — | (10,969 | ) | — | (907 | ) | 14,247 | — | ||||||||||||||||||
Interest received | 11,772 | 1,953 | — | 6,812 | 25,856 | 6,593 | 52,986 | |||||||||||||||||||||
Income taxes refunded (paid) | (3,641 | ) | 2,360 | — | 61,564 | (46,268 | ) | (17,033 | ) | (3,018 | ) | |||||||||||||||||
Other inflows (outflows) of cash | 19,823 | 7,171 | (4 | ) | (76,384 | ) | (17,303 | ) | 16,264 | (50,433 | ) | |||||||||||||||||
|
|
|
|
|
|
|
|
|
|
|
|
|
| |||||||||||||||
Net cash flows from operating activities | 783,125 | (47,349 | ) | (10,973 | ) | 496,659 | (30,810 | ) | 13,160 | 1,203,812 | ||||||||||||||||||
|
|
|
|
|
|
|
|
|
|
|
|
|
| |||||||||||||||
Cash flows from (used in) investing activities | ||||||||||||||||||||||||||||
Cash flows from losing control of subsidiaries or other businesses | — | — | — | — | 400 | (400 | ) | — | ||||||||||||||||||||
Cash flows used to obtain control of subsidiaries or other businesses | — | — | — | — | (176,238 | ) | 173,015 | (3,223 | ) | |||||||||||||||||||
Cash flows used in the purchase of non-controlling | — | — | — | — | (89 | ) | 89 | |||||||||||||||||||||
Other cash receipts from sales of equity or debt instruments of other entities | 30,928 | 153,179 | — | 132,738 | 69,533 | 1 | 386,379 | |||||||||||||||||||||
Loans to related parties | (234,535 | ) | — | — | (55,000 | ) | (50,701 | ) | 340,236 | — | ||||||||||||||||||
Proceeds from sale of property, plant and equipment | 29,134 | — | — | 23,035 | 21,237 | 24 | 73,429 | |||||||||||||||||||||
Purchases of property, plant and equipment | (2,310,381 | ) | (2,916 | ) | — | (97,905 | ) | 16,081 | 5,757 | (2,389,364 | ) | |||||||||||||||||
Purchases of intangible assets | (25,275 | ) | — | — | (22,034 | ) | (11,857 | ) | — | (59,166 | ) | |||||||||||||||||
Proceeds from other long-term assets | 13,940 | — | — | — | 24,095 | — | 38,035 | |||||||||||||||||||||
Cash receipts from futures contracts, forward, options and swap | — | — | — | 606 | — | (606 | ) | — | ||||||||||||||||||||
Proceeds from related parties | 65,969 | — | — | — | 33,611 | (99,580 | ) | — | ||||||||||||||||||||
Dividends received | 34,848 | 114,433 | — | — | 8,742 | (157,672 | ) | 351 | ||||||||||||||||||||
Interest received | 6,031 | — | — | — | 20,368 | (26,399 | ) | — | ||||||||||||||||||||
Other inflows (outflows) of cash | — | — | — | (69,761 | ) | 507 | 96,397 | 27,143 | ||||||||||||||||||||
|
|
|
|
|
|
|
|
|
|
|
|
|
| |||||||||||||||
Net cash flows from investing activities | (2,389,341 | ) | 264,696 | — | (88,321 | ) | (44,311 | ) | 330,862 | (1,926,416 | ) | |||||||||||||||||
Cash flows from (used in) financing activities | ||||||||||||||||||||||||||||
Proceeds from issue of shares | 79,212 | — | — | — | 192,406 | (188,106 | ) | 83,512 | ||||||||||||||||||||
Proceeds from issuance of other equity instruments | — | — | — | — | — | — | — | |||||||||||||||||||||
Payments to acquire or redeem the entity’s shares | (203 | ) | (167,589 | ) | — | — | (11,900 | ) | 179,489 | (203 | ) | |||||||||||||||||
Payments for other equity interests | — | (54,808 | ) | — | — | — | 54,808 | — | ||||||||||||||||||||
Proceeds from term loans | 2,044,463 | — | — | — | 141,200 | — | 2,185,663 | |||||||||||||||||||||
Proceeds from short term loans | 152,000 | — | — | — | — | — | 152,000 | |||||||||||||||||||||
Loans from related parties | 55,000 | — | — | 18,930 | 256,867 | (330,797 | ) | — | ||||||||||||||||||||
Repayment of loans | (260,737 | ) | — | — | (38,749 | ) | (239,846 | ) | — | (539,332 | ) | |||||||||||||||||
Payments of finance lease liabilities | (58,177 | ) | — | — | (194,634 | ) | (40,120 | ) | — | (292,931 | ) | |||||||||||||||||
Repayment of loans to related parties | (30,925 | ) | — | — | — | (68,654 | ) | 99,579 | — | |||||||||||||||||||
Proceeds from government grants | — | — | — | — | — | — | — | |||||||||||||||||||||
Dividends Paid | (103,503 | ) | — | — | (60,720 | ) | (118,266 | ) | 157,662 | (124,827 | ) | |||||||||||||||||
Interest paid | (102,005 | ) | — | — | (53,224 | ) | (69,798 | ) | (2,580 | ) | (227,607 | ) | ||||||||||||||||
Income taxes refunded (paid) | — | — | — | — | — | — | — | |||||||||||||||||||||
Other inflows (outflows) of cash | (181,985 | ) | — | — | 44,778 | (32,739 | ) | (61,133 | ) | (231,079 | ) | |||||||||||||||||
|
|
|
|
|
|
|
|
|
|
|
|
|
| |||||||||||||||
Net cash flows from (used in) financing activities | 1,593,140 | (222,397 | ) | — | (283,619 | ) | 9,150 | (91,078 | ) | 1,005,196 | ||||||||||||||||||
|
|
|
|
|
|
|
|
|
|
|
|
|
| |||||||||||||||
Net increase (decrease) in, cash and cash aquivalents before effect of exchange rate | (13,076 | ) | (5,050 | ) | (10,973 | ) | 124,719 | (65,971 | ) | 252,944 | 282,592 | |||||||||||||||||
Effects of variation in the exchange rate on cash and cash equivalents | — | 750 | 198 | (18,507 | ) | 18,000 | (7,173 | ) | (6,736 | ) | ||||||||||||||||||
|
|
|
|
|
|
|
|
|
|
|
|
|
| |||||||||||||||
Net increase (decrease) in cash and cash equivalents | (13,076 | ) | (4,300 | ) | (10,775 | ) | 106,212 | (47,971 | ) | 245,771 | 275,856 | |||||||||||||||||
CASH AND CASH EQUIVALENTS AT BEGINNING OF PERIOD | 245,006 | 4,369 | 14,572 | 60,543 | 217,657 | (167,740 | ) | 374,407 | ||||||||||||||||||||
|
|
|
|
|
|
|
|
|
|
|
|
|
| |||||||||||||||
CASH AND CASH EQUIVALENTS AT END OF PERIOD | 231,930 | 69 | 3,797 | 166,755 | 169,686 | 78,031 | 650,263 | |||||||||||||||||||||
|
|
|
|
|
|
|
|
|
|
|
|
|
| |||||||||||||||
Report of Independent Registered Public Accounting Firm
To the Board of Directors and Shareholders
Latam Airlines Group S.A.
In our opinion, the accompanying consolidated statements of financial position and the related consolidated statements of income, comprehensive income, changes in equity and cash flows present fairly, in all material respects, the financial position of Latam Airlines Group S.A. and its subsidiaries at December 31, 2013 and 2012, and the results of their operations and their cash flows for each of the three years in the period ended December 31, 2013 in conformity with International Financial Reporting Standards as issued by the International Accounting Standards Board. Also in our opinion, the Company maintained, in all material respects, effective internal control over financial reporting as of December 31, 2013, based on criteria established inInternal Control - Integrated Framework (1992)issued by the Committee of Sponsoring Organizations of the Treadway Commission (COSO). The Company’s management is responsible for these financial statements, for maintaining effective internal control over financial reporting and for its assessment of the effectiveness of internal control over financial reporting, included in Management’s Annual Report on Internal Control over Financial Reporting appearing under item 15 of this annual report. Our responsibility is to express opinions on these financial statements and on the Company’s internal control over financial reporting based on our integrated audits. We conducted our audits in accordance with the standards of the Public Company Accounting Oversight Board (United States). Those standards require that we plan and perform the audits to obtain reasonable assurance about whether the financial statements are free of material misstatement and whether effective internal control over financial reporting was maintained in all material respects. Our audits of the financial statements included examining, on a test basis, evidence supporting the amounts and disclosures in the financial statements, assessing the accounting principles used and significant estimates made by management, and evaluating the overall financial statement presentation. Our audit of internal control over financial reporting included obtaining an understanding of internal control over financial reporting, assessing the risk that a material weakness exists, and testing and evaluating the design and operating effectiveness of internal control based on the assessed risk. Our audits also included performing such other procedures as we considered necessary in the circumstances. We believe that our audits provide a reasonable basis for our opinions.
A company’s internal control over financial reporting is a process designed to provide reasonable assurance regarding the reliability of financial reporting and the preparation of financial statements for external purposes in accordance with generally accepted accounting principles. A company’s internal control over financial reporting includes those policies and procedures that (i) pertain to the maintenance of records that, in reasonable detail, accurately and fairly reflect the transactions and dispositions of the assets of the company; (ii) provide reasonable assurance that transactions are recorded as necessary to permit preparation of financial statements in accordance with generally accepted accounting principles, and that receipts and expenditures of the company are being made only in accordance with authorizations of management and directors of the company; and (iii) provide reasonable assurance regarding prevention or timely detection of unauthorized acquisition, use, or disposition of the company’s assets that could have a material effect on the financial statements.
Because of its inherent limitations, internal control over financial reporting may not prevent or detect misstatements. Also, projections of any evaluation of effectiveness to future periods are subject to the risk that controls may become inadequate because of changes in conditions, or that the degree of compliance with the policies or procedures may deteriorate.
/s/PricewaterhouseCoopers
Santiago, Chile
April 30, 2014
SIGNATURES
The registrant hereby certifies that it meets all the requirements for filing on Form 20-F and that it has duly caused and authorized the undersigned to sign this annual report on its behalf.
| ||||||
EXHIBIT INDEX
|
| |
|
| |
|
| |
|
| |
|
| |