As filed with the Securities and Exchange Commission on March 10, 2015February 22, 2018
UNITED STATES SECURITIES AND EXCHANGE COMMISSION
Washington, D.C. 20549
FORMFORM 20-F
(Mark One)
| REGISTRATION STATEMENT PURSUANT TO SECTION 12(b) or 12(g) OF THE SECURITIES EXCHANGE ACT OF 1934 |
Or
| ANNUAL REPORT PURSUANT TO SECTION 13 or 15(d) OF THE SECURITIES EXCHANGE ACT OF 1934 |
For the fiscal year ended December 31, 20142017
Or
| TRANSITION REPORT PURSUANT TO SECTION 13 or 15(d) OF THE SECURITIES EXCHANGE ACT OF 1934 |
For the transition period from to
Or
| SHELL COMPANY REPORT PURSUANT TO SECTION 13 OR 15(d) OF THE SECURITIES EXCHANGE ACT OF 1934 |
|
|
| Commission file number: | ||
| RELX PLC | RELX NV | |
| (Exact name of Registrant as specified in its charter) | (Exact name of Registrant as specified in its charter) | |
| England | The Netherlands | |
| (Jurisdiction of incorporation or organisation) | (Jurisdiction of incorporation or organisation) | |
| 1-3 Strand, London, WC2N 5JR, England | Radarweg 29, 1043 NX, Amsterdam, The Netherlands | |
| (Address of principal executive offices) | (Address of principal executive offices) | |
| Henry Udow | Jans van der Woude | |
| Company Secretary | Company Secretary | |
| 1-3 Strand, London, WC2N 5JR, England | Radarweg 29, 1043 NX, Amsterdam, The Netherlands | |
| 011 44 20 7166 5500 | 011 31 20 485 2222 | |
(Name, telephone,e-mail and/or facsimile number and address of Company Contact Person) | (Name, telephone,e-mail and/or facsimile number and address of Company Contact Person) |
Securities registered or to be registered pursuant to Section 12(b) of the Act:
Title of each class | Name of exchange on which registered | |
| ||
American Depositary Shares | New York Stock Exchange | |
Ordinary shares of 14 51/116p each | New York Stock Exchange* | |
| ||
American Depositary Shares | New York Stock Exchange | |
Ordinary shares of €0.07 each | New York Stock Exchange* |
| * | Listed, not for trading, but only in connection with the listing of the applicable Registrant’s American Depositary Shares issued in respect thereof. |
Securities registered or to be registered pursuant to Section 12(g) of the Act: None
Securities for which there is a reporting obligation pursuant to Section 15(d) of the Act: None
Indicate the number of outstanding shares of each of the issuers’ classes of capital or common stock as of December 31, 2014:2017:
| Number of outstanding shares | |||||
Ordinary shares of 14 51/116p each | ||||||
| ||||||
Ordinary shares of €0.07 each | ||||||
| ||||||
Indicate by check mark if the registrants are well-known seasoned issuers, as defined in Rule 405 of the Securities Act.
Yes þ☑ No ¨☐
If this report is an annual or transition report, indicate by check mark if the registrants are not required to file reports pursuant to Section 13 or 15(d) of the Securities Exchange Act of 1934.
Yes ¨☐ No þ☑
Indicate by check mark whether the registrants (1) have filed all reports required to be filed by Section 13 or 15(d) of the Securities Exchange Act of 1934 during the preceding 12 months (or for such shorter period that the registrant was required to file such reports), and (2) have been subject to such filing requirements for the past 90 days.
Yes þ☑ No ¨☐
Indicate by check mark whether the registrant has submitted electronically and posted on its corporate Web site, if any, every Interactive Data File required to be submitted and posted pursuant to Rule 405 of RegulationS-T during the preceding 12 months (or for such shorter period that the registrant was required to submit and post such files).
Yes ¨☑ No ¨☐
Indicate by check mark whether the registrants are large accelerated filers, accelerated filers,non-accelerated filers or non-accelerated filers.emerging growth companies. See definition of “accelerated filer and largefiler”, “large accelerated filer” and “emerging growth company” in Rule12b-2 of the Exchange Act.
| Large accelerated filer ☑ | Accelerated filer ☐ | Non-accelerated filer ☐ | ||
| Emerging growth company ☐ |
Large accelerated filer þ Accelerated filer ¨ Non-accelerated filer ¨If an emerging growth company that prepares its financial statements in accordance with U.S. GAAP, indicate by check mark if the registrant has elected not to use the extended transition period for complying with any new or revised financial accounting standards† provided pursuant to Section 13(a) of the Exchange Act.
† The term “new or revised financial accounting standard” refers to any update issued by the Financial Accounting Standards Board to its Accounting Standards Codification after April 5, 2012.
Indicate by check mark which basis of accounting the registrants have used to prepare the financial statements included in this filing.
¨☐ US GAAP þ☑ International Financial Reporting Standards as issued by the International Accounting Standards Board ¨☐ Other
If “Other” has been checked in response to the previous question indicate by check mark which financial statement item the registrants have elected to follow:
Item 17 ¨☐ Item 18 ¨☐
If this is an annual report, indicate by check mark whether the registrants are shell companies (as defined in Rule12b-2 of the Exchange Act).
Yes ¨☐ No þ☑
| Page | ||||||
| 1 | ||||||
| 2 | ||||||
ITEM 1: | IDENTITY OF DIRECTORS, SENIOR MANAGEMENT AND ADVISERS | N/A | ||||
ITEM 2: | OFFER STATISTICS AND EXPECTED TIMETABLE | N/A | ||||
ITEM 3: | KEY INFORMATION | 3 | ||||
| 3 | ||||||
| 5 | ||||||
ITEM 4: | INFORMATION ON THE GROUP | |||||
| 9 | ||||||
| 10 | ||||||
| 11 | ||||||
ITEM 4A: | UNRESOLVED STAFF COMMENTS | N/A | ||||
ITEM 5: | OPERATING AND FINANCIAL REVIEW AND PROSPECTS | |||||
| 14 | ||||||
| 24 | ||||||
| 26 | ||||||
| ||||||
ITEM 6: | DIRECTORS, SENIOR MANAGEMENT AND EMPLOYEES | |||||
| 28 | ||||||
ITEM 7: | MAJOR SHAREHOLDERS AND RELATED PARTY TRANSACTIONS | |||||
ITEM 8: | FINANCIAL INFORMATION | |||||
ITEM 9: | THE OFFER AND LISTING | |||||
ITEM 10: | ADDITIONAL INFORMATION | |||||
ITEM 11: | QUANTITATIVE AND QUALITATIVE DISCLOSURES ABOUT MARKET RISK | |||||
ITEM 12: | DESCRIPTION OF SECURITIES OTHER THAN EQUITY SECURITIES | |||||
| Page | ||||||
ITEM 13: | DEFAULTS, DIVIDEND ARREARAGES AND DELINQUENCIES | N/A | ||||
ITEM 14: | MATERIAL MODIFICATIONS TO THE RIGHTS OF SECURITY HOLDERS AND USE OF PROCEEDS | N/A | ||||
ITEM 15: | CONTROLS AND PROCEDURES | |||||
ITEM 16A: | AUDIT COMMITTEE FINANCIAL EXPERT | |||||
ITEM 16B: | CODES OF ETHICS | |||||
ITEM 16C: | PRINCIPAL ACCOUNTANT FEES AND SERVICES | |||||
ITEM 16D: | EXEMPTIONS FROM THE LISTING STANDARDS FOR AUDIT COMMITTEES | |||||
ITEM 16E: | PURCHASES OF EQUITY SECURITIES BY THE | |||||
ITEM 16F: | CHANGE IN | |||||
ITEM 16G: | CORPORATE GOVERNANCE | |||||
ITEM 16H: | MINE SAFETY DISCLOSURE | N/A | ||||
ITEM 17: | FINANCIAL STATEMENTS* | |||||
ITEM 18: | FINANCIAL STATEMENTS | F-1 | ||||
| F-2 | ||||||
| S-1 | ||||||
ITEM 19: | EXHIBITS | S-3 | ||||
| * | The registrants have responded to Item 18 in lieu of responding to this Item. |
THIS PAGE INTENTIONALLY BLANK
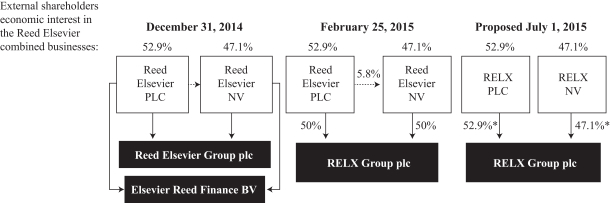
Reed ElsevierRELX PLC and Reed Elsevier NV conducted their business through two jointly owned companies during 2014, Reed Elsevier Group plc and Elsevier Reed Finance BV. Reed Elsevier PLC and Reed Elsevier NV have retained their separate legal identities. Effective February 25, 2015, Reed Elsevier PLC and Reed Elsevier NV transferred their direct ownership interests in Elsevier Reed Finance BV to their jointly-owned company Reed Elsevier Group plc and named this newly-combined single group entityis a holding company. It owns 52.9% of the shares of RELX Group plc. As
RELX NV is a result,holding company. It owns 47.1% of the shares of RELX Group plc now holds all Reed Elsevier businesses, subsidiaries and financing activities. Further information is provided on pages 23 to 24. plc.
As used in this Annual Report on Form20-F, the terms the “Group,”“the Group”, “RELX” the “combined businesses,” Group”, “RELX”, “we,” “our” or “us” refer collectively, to Reed ElsevierRELX PLC, Reed ElsevierRELX NV, RELX Group plc and theirits subsidiaries, associates and joint ventures. The financial statements of the combined businesses are referred to herein as the “combined financial statements”. Additional terms are defined in the Glossary of Terms on pagesS-1 andS-2.
In this annual report, references to US dollars, $ and ¢ are to US currency; references to sterling, £, pence or p are to UK currency; references to euro and € are to the currency of the European Economic and Monetary Union.
Statements regarding our competitive position included herein were obtained from internal surveys, market research, publicly available information and industry publications. While we believe that the market research, publicly available information and industry publications we use are reliable, we have not independently verified market and industry data from third-party sources. Moreover, while we believe our internal surveys are reliable, they have not been verified by any independent source.
This document contains references to the RELX Group website, either within the document or incorporated by reference. Information not specifically stated as being incorporated by reference from the RELX Group website or any other website referenced is not incorporated into this document and should not be considered part of this document.
Pursuant to Rule12b-23(a) of the Securities Exchange Act of 1934, as amended, certain information in this Annual Report on Form20-F is being incorporated by reference to the Group’s Annual Reports and Financial Statements 2017 appended hereto as Exhibit 15.2. With the exception of the items and pages so specified, the Group’s Annual Reports and Financial Statements 2017 are not deemed to be filed as part of this Form20-F.
1
SPECIAL NOTE REGARDING FORWARD-LOOKING STATEMENTS
This documentannual report contains a number of forward-looking statements within the meaning of Section 27A of the United States Securities Act of 1933, as amended, and Section 21E of the United States Securities Exchange Act of 1934, as amended, with respect to:to, among others:
our financial condition; |
our results of operations; |
our competitive positions; |
the features and functions of and markets for the products and services we offer; and |
our business plans and strategies. |
We consider any statements that are not historical facts to be “forward-looking statements”.statements.” These statements are based on the current expectations of the management of our businesses and are subject to risks and uncertainties that could cause actual results or outcomes to differ from those expressed in any forward-looking statement. These differences could be material; therefore, you should evaluate forward-looking statements in light of various important factors, including those set forth or incorporated by reference in this document.annual report.
Important factors that could cause our actual results to differ materially from estimates or forecasts contained in the forward lookingforward-looking statements include, among others:
|
|
|
|
|
|
|
|
changes in law and legal interpretation affecting our intellectual property rights and internet communications; |
|
|
| demand for our products and services; |
| ● | competitive factors in the industries in which we operate; |
| ● | ability to realise the future anticipated benefits of acquisitions; |
| ● | significant failure or interruption of our systems; |
| ● | compromises of our data security systems or other unauthorised access to our databases; |
| ● | failure to comply with FTC Settlement Orders; |
| ● | failure of third parties to whom we have outsourced business activities; |
| our ability to retain high-quality management; |
| ● | changes in the market values of defined benefit pension scheme assets and in the market related assumptions used to value scheme liabilities; |
| changes in tax laws and uncertainty in their application; |
| ● | exchange rate fluctuations; |
| ● | adverse market conditions or downgrades to the credit ratings of our debt; |
breaches of generally accepted ethical business standards or applicable |
our ability to manage our environmental impact; |
| failure to realise our assumptions regarding goodwill and indefinite lived intangible assets; and |
| ● | other risks referenced from time to time in the filings of |
The terms “estimate”, “project”, “plan”, “intend”, “expect”,“estimate,” “project,” “plan,” “intend,” “expect,” “should, be”,” “could,” “will, be”, “believe”, “trends”” “believe,” “trends,” and similar expressions identifymay indicate a forward-looking statements. These forward-lookingstatement. Forward-looking statements are found at various places throughout this annual report and the other documentsinformation incorporated by reference in this annual report.
You should not place undue reliance on these forward-looking statements, which speak only as of the date of this annual report. Except as may be required by law, we undertake no obligation to publicly update or release any revisions to these forward-looking statements to reflect events or circumstances after the date of this annual report or to reflect the occurrence of unanticipated events.
2
THE GROUP
The selected combinedconsolidated financial data for the Group should be read in conjunction with, and is qualified by, the combined financial statements included in this annual report. In addition, as separate legal entities, Reed Elsevier PLC and Reed Elsevier NV prepare separate consolidated financial statements for RELX Group which reflectare set forth on pages 117 to 164 of the Group’s Annual Reports and Financial Statements 2017, and incorporated herein by reference to Exhibit 15.2.
RELX PLC and RELX NV are separate, publicly-held entities. RELX PLC and RELX NV jointly own RELX Group plc which holds all of the Group’s operating businesses and financing activities. The Directors have concluded that the Group forms a single reporting entity for the presentation of consolidated financial statements and, accordingly, the Group’s consolidated financial information represents the interests of both sets of shareholders and is presented by both RELX PLC and RELX NV as their respective shareholders’ economic interests in the Group accounted for on an equity basis.consolidated financial statements.
The combinedconsolidated financial statements are prepared in accordance with accounting policies that are in conformity with International Financial Reporting Standards (“IFRS”) as issued by the International Accounting Standards Board (“IASB”) and as adopted by the European Union (“EU”). The selected financial data for the Group (in £) as at December 31, 2017, and 2016 and for the years ended December 31, 2014, 20132017, 2016 and 20122015 set out below has been extracted or derived from the audited combinedconsolidated financial statements, included herein.set forth on pages 117 to 164 of the Group’s Annual Reports and Financial Statements 2017 and incorporated herein by reference to Exhibit 15.2. The selected financial data for the Group as at December 31, 2015, 2014 and 2013 and for the years ended December 31, 20112014 and 20102013 set out below has been extracted or derived from our audited financial statements, which are not included herein, and restated for the adoption of International Accounting Standard (“IAS”) 19 Employee Benefits (revised), which was adopted in the year ended December 31, 2013.herein.
CombinedConsolidated Income Statement Data(1)
For the year ended December 31, | For the year ended December 31, | |||||||||||||||||||||||||||||||
2014(2) | 2014 | 2013 | 2012 | 2011 Restated | 2010 | 2017 | 2016 | 2015 | 2014 | 2013 | ||||||||||||||||||||||
| (in millions) | (in millions) | |||||||||||||||||||||||||||||||
Amounts in accordance with IFRS: | ||||||||||||||||||||||||||||||||
Revenue | $9,006 | £5,773 | £6,035 | £6,116 | £6,002 | £6,055 | £ | 7,355 | £ | 6,895 | £ | 5,971 | £ | 5,773 | £ | 6,035 | ||||||||||||||||
Operating profit | 2,187 | 1,402 | 1,376 | 1,333 | 1,171 | 1,064 | 1,905 | 1,708 | 1,497 | 1,402 | 1,376 | |||||||||||||||||||||
Net finance costs | (253) | (162) | (196) | (227) | (244) | (289) | (182 | ) | (195 | ) | (174 | ) | (162 | ) | (196 | ) | ||||||||||||||||
Disposals and other non operating items(4) | (17) | (11) | 16 | 45 | (22) | (46) | ||||||||||||||||||||||||||
Disposals and othernon-operating items(3) | 11 | (40 | ) | (11 | ) | (11 | ) | 16 | ||||||||||||||||||||||||
Profit before tax | 1,917 | 1,229 | 1,196 | 1,151 | 905 | 729 | 1,734 | 1,473 | 1,312 | 1,229 | 1,196 | |||||||||||||||||||||
Tax expense | (419) | (269) | (81) | (102) | (167) | (132) | (67 | ) | (304 | ) | (298 | ) | (269 | ) | (81 | ) | ||||||||||||||||
Net profit for the year | 1,498 | 960 | 1,115 | 1,049 | 738 | 597 | 1,667 | 1,169 | 1,014 | 960 | 1,115 | |||||||||||||||||||||
Net profit for the year attributable to non-controlling interests | (8) | (5) | (5) | (5) | (7) | (6) | (8 | ) | (8 | ) | (6 | ) | (5 | ) | (5 | ) | ||||||||||||||||
Net profit attributable to parent companies’ shareholders | 1,490 | 955 | 1,110 | 1,044 | 731 | 591 | ||||||||||||||||||||||||||
Net profit attributable to RELX PLC and RELX NV shareholders | £ | 1,659 | £ | 1,161 | £ | 1,008 | £ | 955 | £ | 1,110 | ||||||||||||||||||||||
CombinedConsolidated Statement of Financial Position Data(1)
As at December 31, | As at December 31, | |||||||||||||||||||||||||||||||
2014(2) | 2014 | 2013 | 2012 | 2011 | 2010 | 2017 | 2016 | 2015 | 2014 | 2013 | ||||||||||||||||||||||
| (in millions) | (in millions) | |||||||||||||||||||||||||||||||
Amounts in accordance with IFRS: | ||||||||||||||||||||||||||||||||
Total assets | $17,296 | £11,087 | £10,495 | £11,014 | £11,503 | £11,158 | £ | 12,283 | £ | 13,323 | £ | 11,185 | £ | 11,087 | £ | 10,495 | ||||||||||||||||
Long term borrowings | (4,912) | (3,149) | (2,633) | (3,162) | (3,300) | (3,786) | ||||||||||||||||||||||||||
Non-current borrowings | (4,208 | ) | (3,684 | ) | (3,278 | ) | (3,149 | ) | (2,633 | ) | ||||||||||||||||||||||
Net assets | 3,334 | 2,137 | 2,423 | 2,314 | 2,197 | 1,970 | 2,374 | 2,358 | 2,178 | 2,137 | 2,423 | |||||||||||||||||||||
Non-controlling interests | (49) | (31) | (33) | (34) | (25) | (27) | (21 | ) | (38 | ) | (34 | ) | (31 | ) | (33 | ) | ||||||||||||||||
Combined shareholders’ equity | 3,285 | 2,106 | 2,390 | 2,280 | 2,172 | 1,943 | ||||||||||||||||||||||||||
Shareholders’ equity | £ | 2,353 | £ | 2,320 | £ | 2,144 | £ | 2,106 | £ | 2,390 | ||||||||||||||||||||||
| (1) | The |
3
Operating profit is stated after charging |
| Disposals and other |
| Tax expense in |
REED ELSEVIER PLC
The selected financial data for Reed Elsevier PLC should be read in conjunction with,Earnings per share and is qualified in its entirety by, the consolidated financial statements of Reed Elsevier PLC included in this annual report. The results of Reed Elsevier PLC reflect the 52.9% economic interest of Reed Elsevier PLC’s shareholders in the Group, after taking account of results arising in Reed Elsevier PLC and its subsidiaries. These interests have been accounted for on an equity basis.
The consolidated financial statements are prepared in accordance with accounting policies that are in conformity with IFRS as issued by the IASB and as adopted by the EU. The selected financial data for Reed Elsevier PLC (in £) as at and for the years ended December 31, 2014, 2013 and 2012 set out below has been extracted or derived from the audited consolidated financial statements, included herein. The selected financial data for Reed Elsevier PLC as at and for the years ended December 31, 2011 and 2010 set out below has been extracted or derived from our audited financial statements, which are not included herein, and restated for the adoption of IAS19 Employee Benefits (revised), which was adopted in the year ended December 31, 2013.dividends
| For the year ended December 31, | ||||||||||||||||||||||||
| 2014(3) | 2014 | 2013 | 2012 | 2011 Restated | 2010 Restated | |||||||||||||||||||
| (in millions, except per share amounts) | ||||||||||||||||||||||||
Amounts in accordance with IFRS:(1) | ||||||||||||||||||||||||
Profit before tax(2) | $769 | £493 | £576 | £532 | £375 | £301 | ||||||||||||||||||
Tax (expense)/credit | (5 | ) | (3 | ) | (4 | ) | 6 | (1 | ) | (1 | ) | |||||||||||||
Profit attributable to ordinary shareholders | 764 | 490 | 572 | 538 | 374 | 300 | ||||||||||||||||||
Earnings per Reed Elsevier PLC ordinary share from total operations of the combined businesses | 67 | ¢ | 43.0p | 48.8p | 44.8p | 31.1p | 25.0p | |||||||||||||||||
Diluted earnings per Reed Elsevier PLC ordinary share from total operations of the combined businesses | 66 | ¢ | 42.5p | 48.2p | 44.3p | 30.9p | 24.9p | |||||||||||||||||
Dividends per Reed Elsevier PLC ordinary share(4) | 39 | ¢ | 24.95p | 23.65p | 21.9p | 20.65p | 20.4p | |||||||||||||||||
Total assets | $1,743 | £1,117 | £1,266 | £1,207 | £1,158 | £1,037 | ||||||||||||||||||
Total equity/Net assets | 1,741 | 1,116 | 1,264 | 1,206 | 1,149 | 1,028 | ||||||||||||||||||
Weighted average number of shares(5) | 1,140.2 | 1,140.2 | 1,172.2 | 1,200.6 | 1,202.0 | 1,199.1 | ||||||||||||||||||
| For the year ended December 31, | ||||||||||||||||||||
| 2017 | 2016 | 2015 | 2014 | 2013 | ||||||||||||||||
| (in millions, except per share amounts) | ||||||||||||||||||||
Amounts in accordance with IFRS(1): | ||||||||||||||||||||
RELX PLC | ||||||||||||||||||||
Earnings per RELX PLC ordinary share | 82.2p | 56.3p | 46.4p | 43.0p | 49.0p | |||||||||||||||
Diluted earnings per RELX PLC ordinary share | 81.5p | 55.8p | 46.0p | 42.5p | 48.3p | |||||||||||||||
Dividends per RELX PLC ordinary share(2) | 37.4p | 32.55p | 26.40p | 24.95p | 23.65p | |||||||||||||||
Weighted average number of shares(3) | 1,068.3 | 1,091.0 | 1,116.2 | 1,140.2 | 1,172.2 | |||||||||||||||
RELX NV(4) | ||||||||||||||||||||
Earnings per RELX NV share | 82.2p | 56.3p | 49.4p | 45.8p | 51.6p | |||||||||||||||
Diluted earnings per RELX NV share | 81.5p | 55.8p | 48.9p | 45.3p | 51.0p | |||||||||||||||
Dividends per RELX NV ordinary share(2) | €0.433 | €0.410 | €0.400 | €0.383 | €0.329 | |||||||||||||||
Weighted average number of shares(3) | 951.1 | 971.3 | 992.4 | 1,014.2 | 1,038.5 | |||||||||||||||
| (1) | With effect from April 6, 2016, the UK government has abolished tax credits on dividends paid after this date, including the 2015 final dividend, which was paid in May 2016. As a result of the abolition of this tax credit, dividends and therefore earnings per share are equal for both RELX PLC and RELX NV in 2016 and 2017. In calculating earnings per share of the Group up until the end of 2015 (prior to the abolition of the tax credit), the earnings for each class of share were calculated on the basis that earnings are fully distributed. The |
| (2) |
RELX NV dividends paid in the year, in amounts per ordinary share, comprise a 2016 final dividend of €0.301 and 2017 interim dividend of €0.132 giving a total of €0.433. The directors of RELX NV have proposed a 2017 final dividend of €0.316 (2016: €0.301; 2015: €0.288; 2014: €0.285; 2013: €0.243), giving a total ordinary dividend in respect of the financial year of €0.448 (2016: €0.423; 2015: €0.403; 2014: €0.383; 2013: €0.329). Translated at the December 31, 2017 noon buying rate of $1.20 per €1.00, dividends paid in the year amount to $0.52 per RELX NV share and total ordinary dividends in respect of the financial year amount to $0.54 per RELX NV share. See “— Exchange Rates” on page 5.
| Weighted average number of shares excludes shares held in treasury and shares held by the Employee Benefit Trust. |
REED ELSEVIER NV
The selected financial data for Reed Elsevier NV should be read in conjunction with, and is qualified in its entirety by, the consolidated financial statements of Reed Elsevier NV included in this annual report. The results and financial position of Reed Elsevier NV reflect the 50% economic interest of Reed Elsevier NV’s shareholders in the Group. These interests are accounted for on an equity basis.
The consolidated financial statements are prepared in accordance with accounting policies that are in conformity with IFRS as issued by the IASB and as adopted by the EU. The selected financial data for Reed Elsevier NV (in €) as at and for the years ended December 31, 2014, 2013 and 2012 set out below has been extracted or derived from the audited consolidated financial statements, included herein. The selected financial data for Reed Elsevier NV as at and for the years ended December 31, 2011 and 2010 set out below has been extracted or derived from our audited financial statements, which are not included herein, and restated for the adoption of IAS19 Employee Benefits (revised), which was adopted in the year ended December 31, 2013.
| For the year ended December 31, | ||||||||||||||||||||||||
| 2014(3) | 2014 | 2013 | 2012 | 2011 Restated | 2010 Restated | |||||||||||||||||||
| (in millions, except per share amounts) | ||||||||||||||||||||||||
Amounts in accordance with IFRS:(1) | ||||||||||||||||||||||||
Profit before tax(2) | $722 | €597 | €659 | €644 | €421 | €349 | ||||||||||||||||||
Tax (expense) | (6 | ) | (5 | ) | (4 | ) | (2 | ) | (1 | ) | (3 | ) | ||||||||||||
Profit attributable to ordinary shareholders | 716 | 592 | 655 | 642 | 420 | 346 | ||||||||||||||||||
Earnings per Reed Elsevier NV share from total operations of the combined businesses | $1.03 | €0.85 | €0.91 | €0.87 | €0.57 | €0.47 | ||||||||||||||||||
Diluted earnings per Reed Elsevier NV share from total operations of the combined businesses | $1.02 | €0.84 | €0.90 | €0.87 | €0.57 | €0.47 | ||||||||||||||||||
Dividends per Reed Elsevier NV ordinary share(4) | $0.64 | €0.525 | €0.469 | €0.456 | €0.413 | €0.402 | ||||||||||||||||||
Total assets | $1,719 | €1,421 | €1,494 | €1,460 | €1,364 | €1,203 | ||||||||||||||||||
Total equity/Net assets | 1,644 | 1,359 | 1,434 | 1,402 | 1,303 | 1,137 | ||||||||||||||||||
Weighted average number of shares(5) | 700.1 | 700.1 | 717.6 | 734.0 | 735.3 | 734.5 | ||||||||||||||||||
| (4) |
4
For a discussion of the impact of currency fluctuations on the Group’s combinedconsolidated results of operations and combinedconsolidated financial position, see “Item 5: Operating and Financial Review and Prospects”.
The following tables illustrate, for the periods and dates indicated, certain information concerning the Noon Buying Rate for pounds sterling expressed in US dollars per £1.00 and for the euro expressed in US dollars per €1.00. The exchange rate on February 27, 2015 14, 2018 was £1.00£1.00 = $1.54$1.40 and €1.00€1.00 = $1.12.$1.24.
US dollars per £1.00 — Noon Buying Rates
| Period | ||||||||||||||||
Year ended December 31, | End | Average(1) | High | Low | ||||||||||||
2014 | 1.56 | 1.65 | 1.72 | 1.55 | ||||||||||||
2013 | 1.66 | 1.56 | 1.66 | 1.48 | ||||||||||||
2012 | 1.62 | 1.59 | �� | 1.63 | 1.53 | |||||||||||
2011 | 1.55 | 1.60 | 1.67 | 1.54 | ||||||||||||
2010 | 1.56 | 1.55 | 1.64 | 1.43 | ||||||||||||
Month | High | Low | ||||||||||||||
February 2015 |
| 1.55 | 1.50 | |||||||||||||
January 2015 |
| 1.56 | 1.50 | |||||||||||||
December 2014 |
| 1.57 | 1.55 | |||||||||||||
November 2014 |
| 1.60 | 1.56 | |||||||||||||
October 2014 |
| 1.62 | 1.59 | |||||||||||||
September 2014 |
| 1.66 | 1.61 | |||||||||||||
| Period | ||||||||||||||||
Year ended December 31, | End | Average(1) | High | Low | ||||||||||||
2017 | 1.35 | 1.29 | 1.36 | 1.21 | ||||||||||||
2016 | 1.23 | 1.36 | 1.48 | 1.22 | ||||||||||||
2015 | 1.47 | 1.53 | 1.59 | 1.46 | ||||||||||||
2014 | 1.56 | 1.65 | 1.72 | 1.55 | ||||||||||||
2013 | 1.66 | 1.56 | 1.66 | 1.48 | ||||||||||||
Month | High | Low | ||||||||||||||
February 2018 (through February 16, 2018) |
| 1.42 | 1.38 | |||||||||||||
January 2018 |
| 1.43 | 1.35 | |||||||||||||
December 2017 |
| 1.35 | 1.33 | |||||||||||||
November 2017 |
| 1.35 | 1.31 | |||||||||||||
October 2017 |
| 1.33 | 1.31 | |||||||||||||
September 2017 |
| 1.36 | 1.30 | |||||||||||||
US dollars per €1.00 — Noon Buying Rates
| Period | ||||||||||||||||
Year ended December 31, | End | Average(1) | High | Low | ||||||||||||
2014 | 1.21 | 1.33 | 1.39 | 1.21 | ||||||||||||
2013 | 1.38 | 1.32 | 1.38 | 1.28 | ||||||||||||
2012 | 1.32 | 1.29 | 1.35 | 1.21 | ||||||||||||
2011 | 1.29 | 1.39 | 1.49 | 1.29 | ||||||||||||
2010 | 1.33 | 1.32 | 1.45 | 1.20 | ||||||||||||
Month | High | Low | ||||||||||||||
February 2015 |
| 1.15 | 1.12 | |||||||||||||
January 2015 |
| 1.21 | 1.13 | |||||||||||||
December 2014 |
| 1.25 | 1.21 | |||||||||||||
November 2014 |
| 1.26 | 1.24 | |||||||||||||
October 2014 |
| 1.28 | 1.25 | |||||||||||||
September 2014 |
| 1.32 | 1.26 | |||||||||||||
| Period | ||||||||||||||||
Year ended December 31, | End | Average(1) | High | Low | ||||||||||||
2017 | 1.20 | 1.13 | 1.20 | 1.04 | ||||||||||||
2016 | 1.05 | 1.11 | 1.15 | 1.04 | ||||||||||||
2015 | 1.09 | 1.11 | 1.21 | 1.05 | ||||||||||||
2014 | 1.21 | 1.33 | 1.39 | 1.21 | ||||||||||||
2013 | 1.38 | 1.32 | 1.38 | 1.28 | ||||||||||||
Month | High | Low | ||||||||||||||
February 2018 (through February 16, 2018) |
| 1.25 | 1.22 | |||||||||||||
January 2018 |
| 1.25 | 1.19 | |||||||||||||
December 2017 |
| 1.20 | 1.17 | |||||||||||||
November 2017 |
| 1.19 | 1.16 | |||||||||||||
October 2017 |
| 1.19 | 1.16 | |||||||||||||
September 2017 |
| 1.20 | 1.17 | |||||||||||||
| (1) | The average of the Noon Buying Rates on |
Noon Buying Rates have not been used in the preparation of the combined financial statements, the Reed Elsevier PLC consolidated financial statements or the Reed Elsevier NV consolidated financial statements but have been used for certain convenience translations where indicated.
5
The principal risks facing our business are included below. Additional risks not presently known to us or that we currently deem immaterial may also impair our business.
We operate in a highly competitive environment that is subject to rapid change.
Our businesses operate in highly competitive markets. These markets continue to change in response to technological innovations, legislative and regulatory changes, the entrance of new competitors, and other factors. We cannot predict the changes that may occur and the effect of those changes on the competitiveness of our businesses. In particular, the means of delivering our products and services, and the products and services themselves, may be subject to rapid technological and other changes. We cannot predict whether technological innovations, changing legislation or other factors will, in the future, make some of our products wholly or partially obsolete or less profitable. Failure to anticipate market trends could impact the competitiveness of our products and services and consequently adversely affect our revenue and profit.
We cannot assure you that there will be continued demand for our products and services.
Our businesses are dependent on the continued acceptance by our customers of our products and services and the value placed on them. We cannot predict whether there will be changes in the future, either in the market demand or from the actions of competitors, which will affect the acceptability of products, services and prices to our customers. Failure to meet evolving customer needs could impact demand for our products and services and consequently adversely affect our revenue.
Fluctuations in exchange rates may affect our reported results.
Our financial statements are expressed in pounds sterling and euros and are, therefore, subject to movements in exchange rates on the translation of the financial information of businesses whose operational currencies are other than our reporting currencies. The United States is our most important market and, accordingly, significant fluctuations in US dollar exchange rates can significantly affect our reported results and financial position from year to year. In addition, in some of our businesses we incur costs in currencies other than those in which revenues are earned. The relative movements between the exchange rates in the currencies in which costs are incurred and the currencies in which revenues are earned can significantly affect the results of those businesses.
Current and future economic, political and market forces, and dislocations beyond our control may adversely affect demand for our products and services.
The demandDemand for our products and services may be adversely impacted by factors that are beyond our control, including macrosuch as the economic political and market conditions,environment in the availability of short term and long term funding and capital and the level of volatility of interest rates, currency exchange rates and inflation. The United States, Europe and other major economies, havepolitical uncertainties (including the potential consequences of the United Kingdom’s withdrawal from the European Union under Article 50 of the Treaty of Lisbon), acts of war, terrorism and civil unrest as well as levels of government and private funding provided to academic and research institutions.
Our intellectual property rights may not be adequately protected under current laws in recent years undergone a period of economic turbulence, and this may continue into the future. Any one or more of these factors may contribute to reduced activity by our customers, may result in a reduction of demand for our products and services, and may adversely affect suppliers and third parties to whom we have outsourced business activities.
Changes in tax laws or uncertainty over their application and interpretationsome jurisdictions, which may adversely affect our reported results.results and our ability to grow.
Our businesses operate globallyproducts and services include and utilise intellectual property. We rely on trademark, copyright, patent and other intellectual property laws to establish and protect our earningsproprietary rights in this intellectual property. There is a risk that our proprietary rights could be challenged, limited, invalidated or circumvented, which may impact demand for and pricing of our products and services. Copyright laws are subject to taxationnational legislative initiatives, as well as cross border initiatives such as those from the European Commission, and increased judicial scrutiny in many differing jurisdictions and at differing rates. We seek to organise our affairs in a tax efficient manner, taking account of theseveral jurisdictions in which we operate. However, tax laws that apply toThis creates additional challenges for us in protecting our businesses may be amendedproprietary rights in content delivered through the internet and electronic platforms.
Regulatory and other changes regarding the collection or interpreted differently by the relevant authorities, which could adversely affect our reported results.
Changes in regulation of information collection and use could adversely affect our business.
Legal regulation relating to internet communications, data protection, e-commerce, direct marketing, credit scoring and digital advertising, privacy, information governance and use of public records is becoming more prevalent worldwide. Existing and proposed legislation and regulations, including changes in the manner in which such legislation and regulations are interpreted by courts and regulators may impose limits on our collection and use of certain kinds of information about individuals and our ability to communicate such information effectively with our customers. For example, many of the products offered by Risk & Business Information are subject to regulation under the US Fair Credit Reporting Act (“FCRA”), Gramm Leach Bliley Act (“GLBA”), Drivers Privacy Protection Act (“DPPA”) and related state laws. Certain of these laws further provide for statutory penalties and attorneys fees for non-compliance. We are unable to predict in what form laws and regulations will be adopted or modified or how they will be construed by the courts and regulators, or the extent to which any such laws or interpretation changes might adversely affect our business.
Changes in provision of third partythird-party information to us could adversely affect our businesses.
A number of our businesses rely extensively upon content and data from external sources. Data is obtained from public records, governmental authorities, customers and other information companies, including competitors. InLegal regulations, such as the caseEuropean Union’s General Data Protection Regulation (“GDPR”), relating to internet communications, privacy and data protection,e-commerce, information governance and use of public records, including social security number data which are obtained from public authorities, our access is governed by law. We also obtain the credit header data in our databases from consumer credit reporting agencies.becoming more prevalent worldwide. The disruption or loss of data sources, either because of changes in the law or because data suppliers decide not to supply them, may impose limits on our collection and use of certain kinds of information about individuals and our ability to communicate such information effectively with our customers.
Changes in the payment model for our Scientific, Technical & Medical primary research content could adversely affect our operations.
Our Scientific, Technical & Medical (STM) primary research content, like that of most of our competitors, is sold largely on a paid subscription basis. There is continued debate in government, academic and library communities, which are the principal customers for our STM content, regarding to what extent such content should be funded instead through fees charged to authors or authors’ funders and/or made freely available in some form after a period following publication. Some of these methods, if widely adopted, could adversely affect our STM revenue from paid subscriptions.
We cannot assure you that there will be continued demand for our products and services.
Our businesses are dependent on the continued acceptance by our customers of our products and services and the value placed on them. Failure to meet evolving customer needs could impact demand for our products and services and consequently adversely affect our revenue or the long-term returns from our investment in electronic product and platform initiatives.
We operate in a highly competitive environment that is subject to rapid change.
Our businesses operate in highly competitive markets, and the means of delivering our products and services, and the products and services themselves, continue to change in response to rapid technological innovations, legislative and regulatory changes, the entrance of new competitors and other factors. Failure to anticipate and quickly adapt to these changes could impact the competitiveness of our products and services and consequently adversely affect our revenue.
We may not realise all of the future anticipated benefits of acquisitions.
We supplement our organic development with selected acquisitions. If we are unable to generate the anticipated benefits such as revenue growth and/or cost savings associated with these acquisitions this could adversely affect return on invested capital and financial condition, or lead to an impairment of goodwill.
6
A significant failure or interruption of our electronic delivery platforms, networks or distribution systems could adversely affect our businesses and operations.
Our businesses are dependent on electronic platforms and networks, primarily the internet, for delivery of our products and services. These could be adversely affected if our electronic delivery platforms or networks experience a significant failure, interruption or security breach.
Compromises of our cyber security systems and other unauthorised access to our databases, could adversely affect our businesses and operations.
Our businesses maintain online databases and information, including public records and other personal information. As part of maintaining this information and delivering our products and services, we rely on and provide data to third parties, including customers and service providers. These databases and information are a target for compromise and face a risk of unauthorised access and use by unauthorised parties.
Our cyber security measures, and the measures used by our third-party service providers, may not detect or prevent all attempts to compromise our systems, which may jeopardise the security of the data we maintain or may disrupt our systems. Failures of our cyber security measures could result in unauthorised access to our systems, misappropriation of our or our users’ data, deletion or modification of stored information or other interruption to our business operations. As techniques used to obtain unauthorised access to or to sabotage systems change frequently, and may not be known until launched against us or our third-party service providers, we may be unable to anticipate or implement adequate measures to protect against these attacks and our service providers and customers may likewise be unable to do so. Compromises of our or our third-party service providers’ systems, or failure to comply with applicable legislation or regulatory or contractual requirements could adversely affect our financial performance, damage our reputation and expose us to risk of loss, fines and penalties, litigation and increased regulation.
Our business, operations and reputation could be adversely affected by a failure to comply with FTC Settlement Orders.
ThroughWe are subject to numerous and evolving laws and regulations designed to protect certain information and, through our Risk & Business InformationAnalytics business in the United States, we are party to two consent orders and two subsequent related supplemental orders (the “FTC Settlement Orders”) embodying settlements, with the US Federal Trade Commission (“FTC”) that resolved FTC investigations intoregarding our compliance with US federal laws governing consumer information security and relatedsecurity-related issues, including certain fraudulent data access incidents. We also entered into an Assurance of Voluntary Compliance and Discontinuance (the “AVC”) with the Attorneys General of 43 states and the District of Columbia in connection with one such FTC investigation. The FTC Settlement Orders and the AVC require us to institute and maintain information security, verification, credentialing, audit and compliance, and reporting and record retention programmes and to obtain an assessment from a qualified, independent third party every two years for twenty years (with the FTC having the right to extend such twenty-year period by up to two additional biennial assessment periods) to ensure that our performance under these information security programmes complies with the FTC Settlement Orders. Failure to comply with the FTC Settlement Orders and the AVCthese orders could result in civil penalties and adversely affect our business, operations and reputation.
BreachesOur businesses may be adversely affected by the failure of our data security systemsthird parties to whom we have outsourced business activities.
Our organisational and operational structures depend on outsourced and offshored functions, including use of cloud service providers. Poor performance, failure or other unauthorised accessbreach of third parties to our databaseswhom we have outsourced activities could adversely affect our business and operations.
Our businesses provide customers with access to database information such as case law, treatises, journals, and publications as well as other data. Some of our businesses also provide authorised customers with access to public records and other information on US individuals made available in accordance with applicable privacy laws and regulations. There are persons who try to breach our data security systems or gain other unauthorised access to our databases in order to misappropriate such information for potentially fraudulent purposes and we have previously disclosed incidents of such unauthorised access. Because the techniques used by such persons change frequently, we may be unable to anticipate or protect against the threat of breaches of data security or other unauthorised access. Breaches of our data security systems or other unauthorised access to our databases could damage ourperformance, reputation and expose us to a risk of loss or litigation and possible liability, as well as increase the likelihood of more extensive governmental regulation of these activities in a way that could adversely affect this aspect of our business.financial condition.
Changes in levels of government funding of, or spending by, academic institutions may adversely affect demand for the products and services of our scientific, technical and medical (“STM”) businesses.
The principal customers for the information products and services offered by our STM publishing businesses are academic institutions, which fund purchases of these products and services from limited budgets that may be sensitive to changes in private and governmental sources of funding. Accordingly, any decreases in budgets of academic institutions or changes in the spending patterns of academic institutions could negatively impact our business and revenues.
Our intellectual property rights may not be adequately protected under current laws in some jurisdictions, which may adversely affect our results and our ability to grow.
Our products and services are largely comprised of intellectual property content delivered through a variety of media, including online, journals and books. We rely on trademark, copyright, patent, trade secret and other intellectual property laws to establish and protect our proprietary rights in these products and services. However, we cannot assure you that our proprietary rights will not be challenged, limited, invalidated or circumvented. Despite trademark and copyright protection and similar intellectual property protection laws, third parties may be able to copy, infringe or otherwise profit from our proprietary rights without our authorisation. These unauthorised activities may be facilitated by the internet.
In addition, whilst there is now certain internet-specific copyright legislation in the United States and in the European Union, there remains significant uncertainty as to the date from which such legislation will be enforced and the form copyright law regulating digital content may ultimately take. In several jurisdictions, including the United States, Australia and the European Union, copyright laws are increasingly coming under legal review. These factors create additional challenges for us in protecting our proprietary rights in content delivered through the internet and electronic platforms. Moreover, whilst non-copyrightable databases are protected in many circumstances by law in the European Union, there is no equivalent legal protection in the United States.
We may be unable to implement and execute our strategic and business plans if we cannot maintain high-quality management.
The implementation and execution of our strategicstrategies and business plans depend on our ability to recruit, motivate and retain high-quality people.skilled employees and management. We compete globally and across business sectors for talented management and skilled individuals, particularly those with technology and data analytics capabilities. An inability to recruit, motivate or retain such peopletalent could adversely affect our business performance.
We may not realise all of the future anticipated benefits of acquisitions.
We regularly make small business acquisitions to strengthen our portfolio. Whilst our acquisitions are made within the framework of our overall strategy, which emphasises organic development, we cannot assure you we will be able to generate the anticipated benefits such as revenue growth and/or cost savings associated with these acquisitions. Failure to realise the anticipated benefits of acquisitionsrecruit and develop a diverse and inclusive workforce could adversely affect our return on invested capital and financial condition.
We cannot assure you whether our substantial investment in electronic product and platform initiatives will produce satisfactory, long term returns.
We are investing significant amounts to develop and promote electronic products and platforms. The provision of electronic products and services is very competitive and we may experience difficulties developing this aspect of our business due to a variety of factors, many of which are beyond our control. These factors may include competition from comparable and new technologies and changes in regulation.
Our businesses may be adversely affected if their electronic delivery platforms, networks or distribution systems experience a significant failure or interruption.
Our businesses are dependent on electronic platforms and distribution systems, primarily the internet, for delivery of their products and services. From time to time we have experienced verifiable attacks on our platforms and systems by unauthorised parties. To date such attacks have not resulted in any material damage to us, however, our businesses could be adversely affected if their electronic delivery platforms and networks experience a significant failure, interruption or security breach.
Our businesses may be adversely affected by the failure of third parties to whom we have outsourced business activities.
Our organisational and operational structures are dependent on outsourced and offshored functions. Poor performance or the failure of third parties to whom we have outsourced business functions could adversely affect our business performance, reputation and financial condition.business performance.
Our scientific, technical and medical primary publications could be adversely affected by changes in the market.
Our STM primary publications, like those of most of our competitors, are published on a paid subscription basis. There is continued debate in government, academic and library communities, which are the principal customers for our STM publications, regarding, to what extent such publications should be funded instead through fees charged to authors or authors’ funders and/or made freely available in some form after a period following publication. If these methods of STM publishing are widely adopted or mandated, it could adversely affect our revenue from our paid subscription publications.
Spending by companies on advertising and other marketing activities, which comprises a significant portion of our revenue, has historically been cyclical.
In 2014 2% of our revenue was derived from advertising. Total advertising revenues for our businesses in 2014 were £135 million compared with £240 million in 2013. Traditionally, spending by companies on advertising and other marketing activities has been cyclical, with companies spending significantly less on advertising in times of economic slowdown or turbulence. In addition, there has been a structural shift of advertising and lead generation to Google and other search engines.
Exhibitions is similarly affected by cyclical pressures on spending by companies. Additionally, participation and attendance at exhibitions is affected by the availability of exhibition venues and the propensity of exhibitors and attendees to travel. Our results could be adversely affected if the availability of venues or the demand from exhibitors and attendees were reduced, for example due to international security or public health concerns or acts of terrorism or war.
Changes in the market values of defined benefit pension scheme assets and in the assumptions used to value defined benefit pension scheme obligations may adversely affect our businesses.
We operate a number of pension schemes around the world. Historically, the largest schemes have beenworld, including local versions of the defined benefit type in the United Kingdom,UK and the United States and the Netherlands.States. The assets and obligations associated
with defined benefitthose pension schemes are sensitive to changes in the market values of assetsthe scheme’s investments and the market relatedmarket-related assumptions used to value scheme liabilities. In particular, declines inAdverse changes to asset values, or increases in pension scheme liabilities, due to adverse changes in discount rates, inflationlongevity assumptions or mortality assumptionsinflation could increase future pension costs and funding requirements.
Changes in tax laws or uncertainty over their application and interpretation may adversely affect our reported results.
Our businesses operate globally and our profits are subject to taxation in many different jurisdictions and at differing tax rates. The Organisation for EconomicCo-operation and Development (OECD)’s reports on Base Erosion and Profit Shifting
7
suggest a range of new approaches that national governments might adopt when taxing the activities of multinational enterprises. The OECD continues to explore options around the taxation of the digital economy. As a result of the OECD’s work and other international initiatives, tax laws that currently apply to our businesses may be amended by the relevant authorities or interpreted differently by them, and these changes could adversely affect our reported results.
Fluctuations in exchange rates may affect our results.
The RELX Group consolidated financial statements are expressed in pounds sterling and are subject to movements in exchange rates on the translation of the financial information of businesses whose operational currencies are other than sterling. The United States is our most important market and, accordingly, significant fluctuations in the US dollar exchange rate could significantly affect our reported results. We also earn revenues and incur costs in a range of other currencies, including the euro and the yen, and significant fluctuations in these exchange rates could also significantly impact our reported results.
Market conditions and credit ratings may affect the availability and cost of funding.
Macroeconomic, political and market conditions may adversely affect the availability and terms of short and long-term funding, volatility of interest rates, the credit quality of our counterparties, currency exchange rates and inflation. The majority of our outstanding debt instruments are, and any of our future debt instruments may be, publicly rated by independent rating agencies. Our borrowing costs and access to capital may be adversely affected if the credit ratings assigned to our debt are downgraded.
Breaches of generally accepted ethical business standards or applicable statutes concerning bribery could adversely affect our reputation and financial condition.
As a world-leading provider of professional information solutions to the STM, risk and business analytics, legal and exhibitions markets we, our employees and major suppliers are expected to adhere to high standards of independence and ethical conduct, including those related to anti-bribery and anti-corruption, promoting human rights and principled business conduct. A breach of generally accepted ethical business standards or applicable anti-bribery and anti-corruption or competition statutes could adversely affect our business performance, reputation and financial condition.
Failure to manage our environmental impact could adversely affect our businesses and reputation.
Our businesses have an impact on the environment, principally through the use of energy and water, waste generation and, in our supply chain, through paper use and print and production technologies. Failure to manage our environmental impact could adversely affect our reputation.
Our impairment analysis of goodwill and indefinite lived intangible assets incorporates various assumptions which are highly judgemental.judgmental. If these assumptions are not realised, we may be required to recognise a charge in the future for impairment.
As at December 31, 2014,2017, goodwill on the combinedconsolidated statement of financial position amounted to £4,981£5,965 million and intangible assets with an indefinite life amounted to £369£112 million. We conduct an impairment test at least annually, which involves a comparison of the carrying value of goodwill and indefinite lived intangible assets by cash generating unit with estimated values in use based on latest management cash flow projections. The assumptions used in the estimation of value in use are, by their very nature, highly judgemental,judgmental, and include profit growth of the business over a five year forecast period, the long term growth rate of the business thereafter, and related discount rates. There is no guarantee that our businesses will be able to achieve the forecasted results which have been included in the impairment tests and impairment charges may be required in future periods if we are unable to meet these assumptions.
Our borrowing costs and access to capital may be adversely affected if the credit ratings assigned to our debt are downgraded.
Our outstanding debt instruments are, and any of our future debt instruments may be, publicly rated by independent rating agencies such as Moody’s Investors Service Inc., Standard & Poor’s Rating Services and Fitch Ratings. A rating is based upon information furnished by us or obtained by the relevant rating agency from its own sources and from publicly available information and is subject to revision, suspension or withdrawal by the rating agency at any time. Rating agencies may review the assigned ratings due to developments that are beyond our control. Factors cited as a basis for a ratings downgrade or an assignment of a negative outlook could include the macro economic environment and the level of our indebtedness as a consequence of an acquisition. If the ratings of our debt are downgraded in the future, our borrowing costs and access to capital may be adversely affected.8
Breaches of generally accepted ethical business standards or applicable statutes concerning bribery could adversely affect our reputation and financial condition.
As a leading provider of professional information solutions to the STM, Risk & Business Information, Legal and Exhibitions markets, we are expected to adhere to high standards of independence and ethical conduct. Whilst our employees are expected to abide by our Code of Ethics and Business Conduct, employees may still fail to abide by its guidelines relating to anti-bribery and principled business conduct. Similarly, whilst our major suppliers are expected to abide by our Supplier Code of Conduct, suppliers may still fail to abide by its guidelines relating to anti-bribery and principled business conduct. A breach of generally accepted ethical business standards or applicable statutes concerning bribery by our employees or our suppliers could adversely affect our business performance, reputation and financial condition.
Failure to manage our environmental impact could adversely affect our businesses.
Our businesses have an impact on the environment, principally through the use of energy and water, waste generation and, in our supply chain, through our paper use and print and production technologies. Whilst we are committed to reducing these impacts by limiting resource use and by efficiently employing sustainable materials and technologies, we cannot assure you that these efforts and expenditures incurred by us in order to comply with either new environmental legislation and regulations, new interpretations or existing laws and regulations or more rigorous enforcement of such laws and regulations will not adversely impact our businesses or reputation.
ITEM 4: INFORMATION ON THE GROUP
HISTORY AND DEVELOPMENTBUSINESS OVERVIEW
IntroductionRELX PLC is a holding company. It owns 52.9% of the shares of RELX Group plc.
Reed ElsevierRELX NV was originallyis a holding company. It owns 47.1% of the shares of RELX Group plc.
RELX Group is a global provider of information and analytics for professional and business customers across industries. The Group serves customers in more than 180 countries and has offices in about 40 countries. It employs approximately 31,000 people of whom almost half are in North America.
We operate in four major market segments: Scientific, Technical & Medical; Risk & Business Analytics; Legal; and Exhibitions.
| ● | Scientific, Technical & Medical is a global information and analytics business that helps institutions and professionals advance healthcare, open science, and improve performance for the benefit of humanity. |
| ● | Risk & Business Analytics provides customers with solutions and decision tools that combine public and industry specific content with advanced technology and analytics to assist them in evaluating and predicting risk and enhancing operational efficiency. |
| ● | Legal is a leading global provider of legal, regulatory and business information and analytics that helps customers increase productivity, improve decision-making and outcomes and advance the rule of law around the world. |
| ● | Exhibitions is the world’s leading events business, enhancing the power offace-to-face through data and digital tools at over 500 events a year, in more than 30 countries, attracting more than 7 million participants. |
| Revenue Year ended December 31, | ||||||||||||||||||||||||
| 2017 | 2016 | 2015 | ||||||||||||||||||||||
| (in millions, except percentages) | ||||||||||||||||||||||||
Scientific, Technical & Medical | £ | 2,478 | 34 | % | £ | 2,320 | 34 | % | £ | 2,070 | 35 | % | ||||||||||||
Risk & Business Analytics | 2,076 | 28 | 1,906 | 28 | 1,601 | 27 | ||||||||||||||||||
Legal | 1,692 | 23 | 1,622 | 23 | 1,443 | 24 | ||||||||||||||||||
Exhibitions | 1,109 | 15 | 1,047 | 15 | 857 | 14 | ||||||||||||||||||
|
|
|
|
|
|
|
|
|
|
|
| |||||||||||||
Total | £ | 7,355 | 100 | % | £ | 6,895 | 100 | % | £ | 5,971 | 100 | % | ||||||||||||
|
|
|
|
|
|
|
|
|
|
|
| |||||||||||||
SCIENTIFIC, TECHNICAL & MEDICAL
The information set forth under the headings ‘Business Overview’, ‘Market opportunities’, ‘Strategic priorities’ and ‘Business model, distribution channels and competition’ on pages 14 to 17 of the Group’s Annual Reports and Financial Statements 2017 is incorporated in 1880herein by reference to Exhibit 15.2.
RISK & BUSINESS ANALYTICS
The information set forth under the headings ‘Business Overview’, ‘Market opportunities’, ‘Strategic priorities’ and Reed Elsevier‘Business model, distribution channels and competition’ on pages 20 to 23 of the Group’s Annual Reports and Financial Statements 2017 is incorporated herein by reference to Exhibit 15.2.
LEGAL
The information set forth under the headings ‘Business Overview’, ‘Market opportunities’, ‘Strategic priorities’ and ‘Business model, distribution channels and competition’ on pages 28 to 31 of the Group’s Annual Reports and Financial Statements 2017 is incorporated herein by reference to Exhibit 15.2.
EXHIBITIONS
The information set forth under the headings ‘Business Overview’, ‘Market opportunities’, ‘Strategic priorities’ and ‘Business model, distribution channels and competition’ on pages 34 to 37 of the Group’s Annual Reports and Financial Statements 2017 is incorporated herein by reference to Exhibit 15.2.
9
RELX PLC in 1903. In 1993 they contributed their respective businesses to two jointly owned companies, Reed Elsevier Group plc and Elsevier Reed Finance BV. The parent companies, Reed Elsevier PLC and Reed Elsevier NV, are separate, publicly-held entities. Reed Elsevier PLC’s ordinaryis a publicly-traded holding company with its shares are listed inon the London and New York and Reed Elsevier NV’s ordinarystock exchanges. Its principal asset is the shares areit owns in RELX Group plc, which represent a 52.9% ownership interest in RELX Group plc.
RELX NV is a publicly-traded holding company with its shares listed inon the Euronext Amsterdam and New York. York stock exchanges. Its principal asset is the shares it owns in RELX Group plc, which represent a 47.1% ownership interest in RELX Group plc.
RELX Group plc holds all the operating businesses, subsidiaries, interests in associates and joint ventures and financing activities of RELX Group, a global provider of information and analytics for professional and business customers across industries.
Trading on the New York Stock Exchange is in the form of American Depositary Shares (ADSs), evidenced by American Depositary Receipts (ADRs) issued by Citibank N.A., as depositary. During 2014, Reed Elsevier
A further description of our corporate structure as of December 31, 2017 is contained in note 1 to our consolidated financial statements as set forth on page 122 and under the heading ‘Corporate structure’ on page 71 of the Group’s Annual Reports and Financial Statements 2017 and incorporated herein by reference to Exhibit 15.2, including RELX PLC and RELX NV’s equal voting interests in RELX Group plc,plc.
We are proposing a companyset of measures that will further simplify our corporate structure into a single parent company. We believe this is a natural next step for RELX Group, removing complexity and increasing transparency. The changes will be cost and profit neutral on an ongoing basis and will not impact the economic interests of any shareholder. RELX NV shareholders will receive one new RELX PLC share in exchange for each RELX NV share held and, following the additional listing of RELX PLC shares on Euronext Amsterdam noted below, will have the option of trading new RELX PLC shares on Euronext Amsterdam, quoted and traded in euros, and receive dividend payments in euros. RELX PLC will continue to have a premium listing on the London Stock Exchange and we will be applying for an additional listing of RELX PLC on Euronext Amsterdam. RELX NV ADRs will be convertedone-for-one to RELX PLC ADRs which will continue to be listed on the New York Stock Exchange. There will be no changes to the locations, activities or staffing levels of RELX Group or its four business areas. The simplification is subject to the approval of both RELX PLC and RELX NV shareholders. We expect a circular to be sent to shareholders in Q2 2018, with implementation in Q3 2018.
Further information is set out in consolidated financial statements set forth under the section ‘Corporate Governance’ on pages 70 and 71 of the Group’s Annual Reports and Financial Statements 2017 and is incorporated herein by reference to Exhibit 15.2.
Significant Subsidiaries, Associates, Joint Ventures and Business Units
A list of significant subsidiaries, associates, joint ventures and business units is included as Exhibit 8.0 to this Form20-F.
Introduction
RELX NV was originally incorporated in England,1880 and RELX PLC in 1903. In 1993, they combined their respective businesses by contributing them to two jointly owned companies. In 2015 the publishing and information businesses and Elsevier Reed Finance BV, a company incorporated in the Netherlands, oversaw financing and treasury activities. Reed Elsevier PLC and Reed Elsevier NV each held a 50% interest in Reed Elsevier Group plc. Until February 2015, Reed Elsevier PLC held a 39% interest in Elsevier Reed Finance BV and Reed Elsevier NV held a 61% interest. Reed Elsevier PLC additionally holds an indirect equity interest in Reed Elsevier NV, reflecting the arrangements entered into between Reed Elsevier PLC and Reed Elsevier NV at the timestructure was simplified so that all of the merger, which determined the equalisation ratio wherebybusinesses are now owned by one Reed Elsevier NV ordinary share is, in broad terms, intended to confer equivalent economic interests to 1.538 Reed Elsevier PLC ordinary shares.
Effective February 25, 2015, Reed Elsevier PLC and Reed Elsevier NV transferred their direct ownership interests in Elsevier Reed Finance BV to their jointly-ownedjointly owned company, Reed Elsevier Group plc and named this newly-combined single group entity RELX Group plc. As a result,RELX PLC, RELX NV and RELX Group plc now holds all Reed Elsevier businesses,(and its subsidiaries, associates and financing activities. Further information is provided on pages 23joint ventures) are together known as RELX Group. As part of the 2015 simplification, a bonus issue of RELX NV shares was made such that, since the 2015 bonus issue, one RELX PLC ordinary share confers an equivalent economic interest to 24.one RELX NV ordinary share.
Material acquisitions and disposals
Total acquisition expenditurecash spent on acquisitions in the three years ended December 31, 2014,2017, was £933£715 million. Cash spent on acquisitions in 2017 was £141 million net of cash acquired of £35 million. During 2014, a number of acquisitions were made for total(2016: £367 million; 2015: £207 million) including deferred consideration of £396£13 million net(2016: £24 million; 2015: £25 million) on past acquisitions and spend on venture capital investments of £10 million (2016: £6 million; 2015: £16 million). Acquisition payments in respect ofnon-controlling interests in 2017 were nil (2016: nil; 2015: nil).
Net cash acquired of £9 million. During 2013, a number of acquisitions wereinflow in relation to disposals made for total consideration of £221 million, net of cash acquired of £14 million. During 2012, a number of acquisitions were made for a total consideration of £316 million, net of cash acquired of £12 million.
The net cash received on the disposal of non-strategic assets,in 2017, after timing differences and separation and transaction costs, was £53£34 million (2013: £195 million; 2012: £160 million)(2016: £13 million paid; 2015: £34 million received).
Capital expenditure
Capital expenditure on property, plant, equipment and internally developed intangible assets principally relates to the development of electronic products and investment in systems infrastructure, to support electronic publishing activities, computer equipment and office facilities. Total
10
such capital expenditure, which was financed using cash flows generated from operations, amounted to £270£354 million in 2014 (2013: £3082017 (2016: £333 million; 2012: £3332015: £307 million). In 2014,2017, there was continued investment in new productproducts and related infrastructure, particularly in the Legal segment.and in Scientific, Technical & Medical. Further information on capital expenditure is givenincluded in notes 152, 16 and 1718 to the combinedconsolidated financial statements.statements and is set forth on pages 124, 143 and 146 respectively of the Group’s Annual Reports and Financial Statements 2017 and incorporated herein by reference to Exhibit 15.2.
Principal Executive Officesexecutive offices
The principal executive offices of Reed ElsevierRELX PLC are located at1-3 Strand, London WC2N 5JR, England. Tel: +44 20 7166 5500. The principal executive offices of Reed ElsevierRELX NV are located at Radarweg 29, 1043 NX Amsterdam, the Netherlands. Tel: +31 20 485 2222. The principal executive offices of RELX Group plc are located at1-3 Strand, London, WC2N 5JR, England. Tel: +44 20 7166 5500. The principal executive office located in the United States is at 230 Park Avenue, New York, New York, 10169. Tel: +1 212 309 8100. Our internet address is www.relxgroup.com.www.relx.com. The information on our website is not incorporated by reference into this report.
Our agent in the United States is Kenneth Thompson II, General Counsel Intellectual Property, Privacy and Governance, RELX Group, kenneth.thompson@relxgroup.com,Group; kenneth.thompson@relx.com, 9443 Springboro Pike, B4/F5/514,S14, Miamisburg, Ohio, 45342.
BUSINESS OVERVIEWPROPERTY, PLANT AND EQUIPMENT
We are a leading provider of information solutions for professional customers across industries. We operate in four market segments: Scientific, Technical & Medical, providing information and tools to help its customers improve scientific and healthcare outcomes; Risk & Business Information, providing data services and tools that combine proprietary, public and third-party information, with technology and analytics to business and government customers; Legal, providing legal, tax, regulatory news and business information to legal, corporate, government and academic markets; and Exhibitions, organising exhibitions and conferences.
The Group’s reported segments are based on the internal reporting structure and financial information provided to the Boards. During 2014, Risk Solutions and Business Information have been combined into one business area, having previously operated separately. Accordingly, they are now presented as a single operating segment. Comparative figures have been presented as if the businesses had operated on a combined basis in the prior year.
Our principal operations are in North America and Europe. For the year ended December 31, 2014 we had total revenue ofown or lease approximately £5.8 billion and an average of28,200 employees. As at December 31, 2014 we had28,500 employees. In 2014, North America represented our largest single geographic market, contributing50% of our total revenue.
Revenue is derived principally from subscriptions, transactional and advertising sales. In 2014, 51% of our revenue was derived from subscriptions,47% from transactional sales and2% from advertising sales. An increasing proportion of revenue is derived from electronic information products, principally internet based. In 2014, 66% of our revenue was derived from such sources, including85% of Risk & Business Information revenue,77% of Legal revenue,74% of Scientific, Technical & Medical revenueand3% of Exhibitions revenue.
Subscription sales are defined as revenue derived from the periodic distribution or update of a product or from the provision of access to online services, which is often prepaid. Transactional sales include all other revenue from the distribution of a product and transactions of online services, usually on cash or credit terms. The level of publishing related advertising sales has historically been tied closely to the economic and business investment cycle with changes in the profit performance of advertisers, business confidence and other economic factors having a high correlation with changes in the size of the market. Subscription sales and transactional sales have tended to be more stable than advertising sales through economic cycles.
Revenue is recognised for the various categories as follows: subscriptions — on periodic despatch of subscribed product or rateably over the period of the subscription where performance is not measurable by despatch; transactional — on despatch or occurrence of the transaction or exhibition; and advertising — on publication or period of online display. Where sales consist of two or more independent components whose value can be reliably measured, revenue is recognised on each component as it is completed by performance, based on the attribution of relative value.
Our businesses compete for subscription, transactional, and advertising expenditures in scientific and medical, risk, legal and business sectors. The bases of competition include, for readers and users of the information, the quality and variety of the editorial content and data, the quality of the software to derive added value from the information, the timeliness and the price of the products and, for exhibitors and advertisers, the quality and the size of the audiences targeted.
For additional information regarding revenue from our business activities and geographic markets, see “Item 5: Operating and Financial Review and Prospects” on page 26.
| Revenue Year ended December 31, | ||||||||||||||||||||||||
| 2014 | 2013 | 2012 | ||||||||||||||||||||||
| (in millions, except percentages) | ||||||||||||||||||||||||
Scientific, Technical & Medical | £ | 2,048 | 36 | % | £ | 2,126 | 35 | % | £ | 2,063 | 34 | % | ||||||||||||
Risk & Business Information | 1,439 | 25 | 1,480 | 25 | 1,589 | 26 | ||||||||||||||||||
Legal | 1,396 | 24 | 1,567 | 26 | 1,610 | 26 | ||||||||||||||||||
Exhibitions | 890 | 15 | 862 | 14 | 854 | 14 | ||||||||||||||||||
|
|
|
|
|
|
|
|
|
|
|
| |||||||||||||
Total | £ | 5,773 | 100 | % | £ | 6,035 | 100 | % | £ | 6,116 | 100 | % | ||||||||||||
|
|
|
|
|
|
|
|
|
|
|
| |||||||||||||
SCIENTIFIC, TECHNICAL & MEDICAL
| Year ended December 31, | ||||||||||||
| 2014 | 2013 | 2012 | ||||||||||
| (in millions) | ||||||||||||
Revenue | £ | 2,048 | £ | 2,126 | £ | 2,063 | ||||||
|
|
|
|
|
| |||||||
In Scientific, Technical & Medical markets, we provide information and tools to help customers improve scientific and healthcare outcomes.
Elsevier is a leading provider of scientific, technical & medical information serving scientists, health professionals and students worldwide. Its objective is to help its customers advance science and improve healthcare by providing content and innovative information solutions that enable them to make critical decisions, enhance productivity and improve outcomes.
Elsevier is a global business with principal operations in Amsterdam, Beijing, Boston, Chennai, Delhi, London, Madrid, Munich, New York, Oxford, Paris, Philadelphia, Rio de Janeiro, St. Louis, San Diego, Singapore and Tokyo. It has 7,000 employees.
In 2014, approximately 68% of revenue came from subscription sales, 30% from transactional sales, and 2% from advertising. Approximately37% of revenue by destination in 2014 was derived from North America,30% from Europe and the remaining33% from the rest of the world.74% of revenue was delivered electronically.
Elsevier serves the needs of the science, technology & medical markets by publishing primary research, reference, and education content, as well as by providing a range of database and workflow solutions. Elsevier’s customers are scientists, academic institutions, educators, research leaders and administrators, medical researchers, doctors, nurses, allied health professionals and students, as well as hospitals, research institutions, health insurers, managed healthcare organisations, research-intensive corporations, and governments. All of these customers rely on Elsevier to provide high-quality content and critical information for making scientific and medical decisions; to review, publish, disseminate and preserve research findings; to create innovative tools to help focus research strategies, increase research effectiveness, improve medical outcomes, and enhance the efficiency of healthcare and healthcare education.
In the primary research market during 2014, over1.1 million research papers were submitted to Elsevier. Over 16,000 editors managed the peer review and selection of these papers, resulting in the publication of more than 360,000 articles in over 2,000 journals, many of which are the foremost publications in their field and a primary point of reference for new research. This content was accessed by around 12 million people, with more than 750 million full text article downloads last year. Content is provided free or at very low cost in most of the world’s poorest countries. Elsevier’s journals are primarily published and delivered through the ScienceDirect platform, the world’s largest database of scientific and medical research, hosting over 12 million pieces of content, and 30,000 full-text e-books. Flagship journals include Cell and The Lancet families of titles.
In 2014, Elsevier expanded the Lancet collection, adding new titles such as The Lancet Psychiatry, The Lancet HIV and The Lancet Haematology.
Elsevier is also a global leader in the scientific, technical & medical reference market, providing authoritative and current professional reference content. While reference has traditionally been provided in print, Elsevier has been a leader in driving the shift from print to electronic. Flagship titles include works such as Gray’s Anatomy, Nelson’s Pediatrics and Netter’s Atlas of Human Anatomy.
Elsevier’s flagship clinical reference platform, ClinicalKey, provides physicians with access to leading Elsevier and third-party reference and evidence-based medical content in a single, fully integrated site. ClinicalKey is continuing to grow, and is currently accessed by over 2,000 institutions.
In medical education, Elsevier serves students of medicine, nursing and allied health professions through print and electronic books, as well as electronic solutions. For example, HESI, an online testing and remediation solution designed to help students of nursing and allied health professionals, conducted over 700,000 tests in 2014.
Elsevier’s database and workflow products provide a range of tools and solutions for professionals in the science, technical, and medical fields. Customers include academic and corporate researchers, research administrators and healthcare professionals.
For academic and corporate researchers, significant products include Scopus, Reaxys, and Knovel. Scopus is the largest abstract and citation database of research literature in the world, with over 56 million abstract and bibliographic information records from more than 21,000 peer-reviewed journals and 5,000 international publishers. Reaxys is a leading solution for synthetic chemists, integrating chemical reaction and compound data searching with synthesis planning. Knovel provides a range of web-based productivity tools for the engineering community, integrating technical information with analytics and search to deliver trusted answers and drive innovation.
Elsevier serves academic and government research administrators through itsElsevier Research Intelligence suite of products. Leveraging bibliometric data from Scopus and other data types, SciVal,helps institutions to establish, execute and evaluate research strategies. Pure is a comprehensive research information management system which enables evidence-based research management decisions, promotes collaboration, simplifies administration and optimises impact. Our Analytical Services team provides accurate, unbiased analysis on research performance by combining high quality data sources with technical and research metrics expertise. SciVal Funding assists researchers and institutions in identifying grants that are most relevant in their research areas.
For healthcare professionals, Elsevier develops products to deliver patient-specific solutions at the point of care to improve patient outcomes. Its clinical solutions include ExitCare which provides patient education and discharge information and CPM Resource Center, which provides a data-driven framework to support nurses in undertaking procedures.
Market opportunities
Scientific, technical & medical information markets have good long-term growth characteristics. The importance of research and development to economic performance and competitive positioning is well understood by governments, academic institutions and corporations. This is reflected in the long-term growth in research and development spend and in the number of researchers worldwide. Growth in health markets is driven by ageing populations in developed markets, rising prosperity in developing markets and the increasing focus on improving medical outcomes and efficiency. Given that a significant proportion of scientific research and healthcare is funded directly or indirectly by governments, spending is influenced by governmental budgetary considerations. The commitment to research and health provision does, however, remain high, even in more difficult budgetary environments.
Strategic priorities
Elsevier’s strategic goal is to lead the way in providing information solutions that advance science, technology and health. To achieve this, Elsevier creates solutions that reflect deep insight into the way its users work and the outcomes they are seeking to achieve; strives for excellence in content, service and execution; constantly adapts and revitalises its products, business models and technology; and leverages its institutional skills, assets and resources to promote innovation and efficiency.
Elsevier’s strategic priorities are to continue to increase content volume and quality; to expand content coverage, building out integrated solutions combining Elsevier, third-party and customer data; to increase content utility, using “Smart Content” to enable new e-solutions; to combine content with analytics and technology, focused on measurably improving productivity and outcomes for customers; and to continue to drive operational efficiency and effectiveness.
In the primary research market, Elsevier aims to grow volume through new journal launches, expansion of author-pays journals and growth from emerging markets; to enhance quality by building on our premium brands; and to add value to core platforms by implementing new capabilities such as advanced recommendations on ScienceDirect and social collaboration through Mendeley.
In clinical reference markets, priorities are to expand content coverage, including licensing high-quality third-party content for ClinicalKey, as well as ensuring consistent tagging to link content assets across products.
Business model, distribution channels and competition
Science and medical research is principally disseminated on a paid subscription basis to the research facilities of academic institutions, government and corporations, and, in the case of medical and healthcare journals, also to individual practitioners and medical society members. For a number of journals, advertising and promotional income represents a small proportion of revenues predominantly from pharmaceutical companies in healthcare titles.
Over the past 15 years alternative payment models for the dissemination of research such as “author-pays” or“author’s-funder-pays” have emerged. While it is expected that paid subscription will remain the primary distribution model, Elsevier has long invested in alternate business models to address the needs of customers and researchers. Over 1,600 of Elsevier’s journals now offer the option of funding research publishing and distribution via a sponsored article fee. In addition, Elsevier now publishes more than 100 open access journals.
Electronic products, such as ScienceDirect, Scopus and ClinicalKey, are generally sold direct to customers through a dedicated sales force that has offices269 properties around the world. Subscription agents facilitateThe table below identifies the salesprincipal owned and administrative process for print journals. Books are sold through traditional and online book stores, wholesalers and, particularlyleased properties in medical and healthcare markets, directly to end users.our property portfolio.
Competition within science and medical publishing is generally on a title-by-title and product-by-product basis. Competing journals, books and databases are typically published by learned societies and other professional publishers. Workflow tools face similar competition, as well as from software companies and internal solutions developed by customers.
Location | Principal use(s) | Floor space (square feet) | ||||
Owned properties | ||||||
Alpharetta, Georgia | Office and data centre | 406,000 | ||||
Miamisburg, Ohio | Office | 403,638 | ||||
Linn, Missouri | Warehouse | 246,260 | ||||
Leased properties | ||||||
New York, New York | Office | 451,800 | ||||
Amsterdam, Netherlands | Office | 215,455 | ||||
Miamisburg, Ohio | Office and data centre | 213,802 | ||||
Sutton, England | Office | 191,960 | ||||
Major brands
Elsevier is the master brand used for the business.
Elsevier’s major brands include: Cell, a life sciences journal in biochemistry and molecular biology; and The Lancet, oneAll of the world’s leading medical journals since 1823. Many other products and journalsabove properties are major brands in their fields, including: Mendeley, an innovative research management and social collaboration platform; SciVal, ready-to-use tools to analyse the world of research, and establish, execute and evaluate the best strategies for research organisations; ClinicalKey, combines reference and evidence-based medical content into its fully-integrated clinical insight engine; ScienceDirect, the world’s largest database of scientific and medical research articles; Scopus, a research performance tool for academic institutions and funding intelligence; and HESI, a suite of preparation testing and remediation resources that generate actionable data to prepare nursing and health profession students for success in pursuing degrees, passing licensure exams and starting their careers.
RISK & BUSINESS INFORMATION
| Year ended December 31, | ||||||||||||
| 2014 | 2013 | 2012 | ||||||||||
| (in millions) | ||||||||||||
Revenue | £ | 1,439 | £ | 1,480 | £ | 1,589 | ||||||
|
|
|
|
|
| |||||||
In Risk & Business Information, we provide data, analytics and insight that enable customers to evaluate and manage risk. We develop market intelligence, supporting more confident decisions, improving economic outcomes, and enhancing operational efficiency.
From 2014 Risk Solutions and Business Information have been combined into one business area. This union brings together LexisNexis Risk Solutions’ proprietary, public and third-party information, advanced technology and analytics, with Reed Business Information’s high-value industry critical data services, information and tools as well as conferences, websites and business magazines.
Risk & Business Information has principal operations in Georgia, Florida, Illinois and Ohio in the US and London, Amsterdam and Shanghai. Risk & Business Information has 7,400 employees. Approximately 73% of revenue in 2014 came from North America, 22% from Europe and 5% from the rest of the world. 85% of Risk & Business Information’s revenue was delivered electronically.
Risk & Business Information is organised around market-facing industry/sector groups including insurance, business services, government, healthcare, major data services (including banking, energy and chemicals, human resources) and other leading brands. The largest of these sector groups is insurance.
The identity management and risk evaluation solutions providedsubstantially occupied by Insurance Solutions, Business Services, Government Solutions and Health Care Solutions utilise comprehensive database platforms of public records and proprietary information with more than two petabytes of unique data, which makes it the largest database of its kind in the US market today. Our market-leading technology enables Risk & Business Information to provide its customers with highly relevant search results swiftly and to create new, low-cost solutions quickly and efficiently. It is also increasingly used across other Group business areas such as Legal and Scientific, Technical & Medical.
Risk & Business Information is focused on developing a pipeline of new solutions to drive growth in existing business segments and selected adjacent markets and geographies.
Insurance Solutions provides a comprehensive combination of data and analytics to personal, commercial and life insurance carriers in the US to improve critical aspects of their business, from customer acquisition and underwriting to claims handling. Information solutions, including the most comprehensive US personal loss history database, C.L.U.E.®, help
insurers assess risks and provide important inputs to pricing and underwriting insurance policies. Additional key products include LexisNexis® Data Prefill, which provides critical information on customers, potential customers and their auto, property and life policy information directly into the insurance workflow, and LexisNexis® Current Carrier, which identifies current or previous insurance coverage details as well as any lapses in coverage. Insurance Solutions released new driving behaviour products in four states in 2014. These products aggregate court data within specific states to provide insurers with vital traffic violation information for use in underwriting. In the UK, Insurance Solutions’ contributory No Claims Discount (NCD) module, which automates verification of consumers’ claims history, has achieved data contribution from over 55% of the UK auto insurance sector in just over a year.
In the Insurance business, Risk & Business Information acquired four businesses during 2014. Wunelli is an industry-leading telematics data services company based in the United Kingdom. The combined LexisNexis and Wunelli datasets will result in one of the largest provider-held insurance telematics databases in the world, with solutions to support insurers as they assess risk and discount safer drivers. Risk & Business Information also acquired three US based businesses to enhance the LexisNexis eCrash solution. iyeTek is an innovative provider of mobile and handheld software solutions, enabling public safety agencies to save time and money and improve services provided to their communities. PoliceReports.US is an online distributor of vehicle accident reports currently in use by 29 states and Coplogic is a leading provider of citizen self-reporting software solutions to law enforcement agencies. In October, a joint venture was signed with Jing You to supply data into the fast-growing auto insurance market in China.
Business Services provides financial institutions with risk management, identity management, fraud detection, credit risk management, and compliance solutions. These include Know Your Customer and Anti-Money Laundering products. The business also provides risk and identity management solutions for corporate customers in retail, telecommunications and utilities sectors. Receivables management solutions help debt recovery professionals in the segmentation, management and collection of consumer and business debt. In 2014, the group substantially advanced its international strategy,RELX with the expansionexception of its international sales force, launch of a simplified Chinese language version of Bridger Insight® XG, a Bank Secrecy Act and Anti-Money Laundering solution, and the ongoing upgrade of the WorldCompliance heightened risk individuals database.
In Business Services, Risk & Business Information acquired Tracesmart, a United Kingdom-based provider of tracing, identity verification, fraud prevention, Anti-Money Laundering, debt collection and data cleansing solutions. Tracesmart, a leader in identity management and fraud solutions in the UK, is a natural complement to Risk & Business Information’s core competencies and brings a robust set of UK public records, allowing Risk & Business Information to extend its capabilities beyond the US in order to serve its customers more fully.
Government Solutions provides data and analytics to US federal, state and local law enforcement and government agencies to help solve criminal and intelligence cases and to identify fraud, waste and abuse in government programmes. The group’s Tax Refund Investigative Solution (TRIS), now sold into eight states and the District of Columbia, continues to generate substantial benefits for both clients and taxpayers, with results to date over $100 million in avoided fraud losses.
Health Care Solutions provides identity, fraud, and clinical analytics solutions across key stages of the healthcare workflow to enable intelligent decision making for payers and providers.
During the year, the acquisition of Health Market Science, a leading supplier of high-quality data on healthcare professionals and an administrator of one of the largest practitioner-level medical claim databases in the US, was completed.
The business also provides risk-related information to the legal industry through LexisNexis Legal & Professional.
Outside of these areas, Risk & Business Information provides information and online data services to business professionals worldwide, with high-value industry critical data services, information and tools as well as producing conferences, websites and business magazines. It has many strong global brands with market-leading positions across a wide range of industry sectors.
Data Services include: ICIS, an information and data service in chemicals, energy and fertiliser; Accuity, a provider of services and solutions to the banking and corporate sectors focused on payment efficiency, Know Your Customer, Anti-Money Laundering and compliance; and XpertHR, an online service providing regulatory guidance, best practices and tools for HR professionals. During the year, Accuity completed the acquisition of FircoSoft, a leading provider of watch list filtering solutions for financial institutions and corporates. Accuity also launched risk solutions for customers in trade finance.
Leading Brands include Flightglobal, Farmers Weekly, Boerderij, Fiscaal Totaal, Estates Gazette, Elsevier and New Scientist and deliver a mix of high quality data, workflow tools and high-value news, information and opinion to business professionals across many industry sectors while also providing an effective marketing channel for customers. During the year Flightglobal completed the acquisition of Innovata, a provider of global airline schedules data. Risk & Business Information also acquired Farmade, a UK-based supplier of crop recording, mapping and precision farming workflow tools.
In 2014, Risk & Business Information continued to reshape its portfolio, exiting areas not core to its strategy. As part of this strategy, 51% of Reed Construction Data (RCD), a provider of online construction data and information to the construction industry was divested, and 100% of RS Means, a construction costing service which had previously been a division of RCD. Risk & Business Information also completed its exit from its Marketing Solutions businesses, including the sales of BuyerZone and emedia and one divestment of a portfolio of B2B assets from its Netherlands operation now also completed.
Market opportunities
Risk & Business Information operates in markets with strong long-term growth drivers with growing demand for high-quality industry data and information and insight including: insurance underwriting transactions; insurance, healthcare, tax and entitlement fraud; credit defaults and financial fraud; regulatory compliance and due diligence requirements surrounding customer enrolment; security and privacy considerations; and data and analytics for the banking, energy and chemicals, human resources and aviation sectors.
In the insurance segment, growth is supported by increasing transactional activity in the auto, property and life insurance markets and the increasing adoption by insurance carriers of more sophisticated data and analytics in the prospecting, underwriting and claims evaluation processes, to assess underwriting risk, increase competitiveness and improve operating cost efficiency. Transactional activity is driven by growth in insurance quoting and policy switching, as consumers seek better policy terms. This activity is stimulated by competition among insurance companies, high levels of carrier advertising, and rising levels of internet quoting and policy binding.
A number of factors support growth in banking and financial services markets, including cross-border payments and trade finance levels, new credit originations, continued high fraud losses, stringent regulatory compliance requirements, and increasing Anti-Money Laundering fines. In receivables management, demand is driven mainly by levels of consumer debt and the prospect of recovering that debt, which is impacted by employment conditions in the US. In corporate markets, demand is supported by growth in online retail sales and continued high levels of credit card fraud. Growth in government markets is driven by the increasing use of data and analytics to combat criminal activity, fraud and tax evasion, and to address security issues. The level and timing of demand in this market is influenced by government funding and revenue considerations. In Health Care, there are numerous growth drivers for fraud and analytics solutions including the expansion of insurance coverage under the Affordable Care Act and the focus on cost containment and better patient outcomes.
Growth in the global energy and chemicals markets is driven by increasing trade and demand for more sophisticated information solutions. Risk & Business Information’s aviation information markets are being driven by increases in air traffic and in the number of aircraft transactions.
Strategic priorities
Risk & Business Information’s strategic goal is to help businesses and government achieve better outcomes with information and decision support in its individual markets through better understanding of risks associated with individuals, other businesses and transactions. By providing the highest quality industry data and tools, we assist customers in understanding their markets and managing risks efficiently and cost effectively. To achieve this, Risk & Business Information is focused on: delivering innovative new products across customer workflows; expanding the range of risk management solutions across adjacent markets; addressing international opportunities in selected markets to meet local needs; further growing its data services businesses; and continuing to strengthen its content, technology, and analytical capabilities.
Business model, distribution channels and competition
Risk & Business Information’s products in Insurance, Business Services and Government are for the most part sold directly, with pricing predominantly on a transactional basis for insurance carriers and corporations, and primarily on a subscription basis for government entities.
Data services are typically sold directly on a subscription or transactional basis. Business magazines are mainly distributed on a paid basis. Advertising revenues are sold directly.
Risk & Business Information and Verisk, a competitor, each sell data and analytics solutions to insurance carriers but largely address different activities. Risk & Business Information’s principal competitors in business services and government segments include Thomson Reuters and major credit bureaus, which in many cases address different activities in these segments as well.
Risk & Business Information’s data services and leading brands compete with a number of information providers on a service and title-by-title basis including: Platts, Thomson Reuters, IHS and Wolters Kluwer as well as many niche and privately owned competitors. Risk & Business Information competes for online advertising with other business-to-business websites, search engines and social media.
Across Risk & Business Information, subscription revenues now account for 94% of the total business with the remaining 6% derived from print and online advertising.
Major brands
Risk & Business Information’s major brands include: C.L.U.E.®, a comprehensive US personal insurance claims database; LexisNexis® Data Prefill, tools to automate the insurance application process providing critical information insurers need to quote and underwrite a policy; LexisNexis® Identity Management, a range of solutions to help clients verify that an identity exists and authenticate individuals; LexisNexis® Anti-Money Laundering Solutions, content and information for anti-money laundering compliance, risk mitigation and enhanced due diligence; LexisNexis® Revenue Recovery and Discovery, a suite of tools to enable governments to leverage public records and analytics to identify instances of fraud and to more efficiently collect on outstanding debts; Accuity, a provider of payment efficiency solutions, AML and KYC services and compliance tools for the banking and corporate sectors worldwide; ICIS, a global provider of news, price benchmarks, data, analytics and research to the energy, chemical and fertiliser industries; and Flightglobal, a data, news and advisory service for professionals working in the aviation industry.
LEGAL
| Year ended December 31, | ||||||||||||
| 2014 | 2013 | 2012 | ||||||||||
| (in millions) | ||||||||||||
Revenue | £ | 1,396 | £ | 1,567 | £ | 1,610 | ||||||
|
|
|
|
|
| |||||||
In Legal markets, we are a leading provider of legal, regulatory and news & business information and analysis to law firm, corporate, government and academic customers.
Serving customers in more than 175 countries, LexisNexis Legal & Professional provides resources and services that inform decisions, increase productivity and drive new business.
LexisNexis Legal & Professional is headquartered in New York and has principal operations in the New York, area, Ohio and North Carolina in the US, Toronto in Canada, London and Paris in Europe, and cities in several other countries in Africa and Asia Pacific. It has 9,500 employees worldwide. In 2014, approximately 79% of the revenue came from subscription sales and 21% from transactional sales. Approximately 66% of revenue by destination in 2014 was derived from North America, 23% from Europe and the remaining 11% from the rest of the world. 77% of Legal’s revenue was delivered electronically.
LexisNexis Legal & Professional is organised in market-facing groups. These are supported by global shared services organisations providing platform and product development, operational and distribution services, and other support functions.
In North America, electronic information solutions and innovative workflow tools from Research Solutions help legal and business professionals make better informed decisions in the practice of law and in managing their businesses. Flagship products for legal research are Lexis.com and Lexis Advance,New York property which provide federal and state statutes and case law, together with analysis and expert commentaries from sources such as Matthew Bender and Michie and the leading citation service Shepard’s, which advises on the continuing relevance of case law precedents. Research solutions also include news and business information, ranging from daily news to company filings, as well as public records information and analytics. LexisNexis also partners with law schools to provide services to students as part of their training.
In 2014, LexisNexis continued to release new versions of Lexis Advance, an innovative web application designed to transform how legal professionals conduct research. Built on an advanced technology platform, Lexis Advance allows primary researchers within legal and professional organisations to find relevant information more easily and efficiently, helping them to drive better outcomes. Future releases will continue to expand content and outreach and add new innovative tools. LexisNexis employs lawyers and trained editors with professional legal backgrounds who review, annotate and update the legal content to help ensure each document in the collection is current and comprehensive. This domain expertise combined with the application of our “big data” HPCC technology means the Group is able to update its entire legal collection faster and more efficiently, while also identifying and linking content, enabling customers to uncover previously undiscovered relationships between documents.
New workflow and analytical tools and content sets are regularly introduced on Lexis Advance. For example, in 2014 LexisNexis launched LexisNexis Counsel Benchmarking, a new analytics solution that works with Verdict & Settlement Analyzer to inform litigation strategy decisions. Also, LexisNexis launched new modules for Lexis Practice Advisor, a web-based practical guidance product tailored for attorneys who handle transactional matters.
LexisNexis Business & Litigation Software Solutions serves as the software arm for the company. Its business of law software provides law firms with practice management solutions, including time and billing systems, case management, cost
recovery and document management services. Its litigation software provides lawyers with a suite of tools covering case preparation to processing and review to trial preparation. During 2014, LexisNexis released multiple new versions for its existing portfolio including CounselLink, PCLaw, Sanction and Firm Manager.
In International markets outside the US, LexisNexis serves legal, corporate, government, accounting and academic markets in Europe, Canada, Africa and Asia Pacific with local and international legal, regulatory and business information. The most significant businesses are in the UK, France, Australia, Canada and South Africa.
LexisNexis focuses on providing customers with leading collections of content and innovative online solutions to help legal and business professionals make better decisions more efficiently. Penetration of online information services has grown strongly and electronic solutions now account for 63% of revenue outside the US.
In the UK, LexisNexis is a leading legal information provider offering an unrivalled collection of primary and secondary legislation, case law, expert commentary, and forms and precedents. Its extensive portfolio includes a number of heritage brands: Halsbury’s, Tolleys and Butterworths. The content is delivered through multiple formats – from print to online to mobile apps and embedded in customers’ workflow.
In 2014, LexisNexis launched additional modules for the UK LexisPSL product suite which provides lawyers a single destination for their practical legal information needs with direct links to the relevant cases, legislation, precedents, forms, practical guidance and expert commentary.
In France, LexisNexis is a leading online provider of information to lawyers, notaries and courts. A heritage brand JurisClasseur and leading authoritative content is provided through multiple formats – lexisnexis.fr, mobile and in print. These content sources are, as in the UK, being combined with new content and innovative workflow tools to develop practical guidance and practice management solutions. In 2014, LexisNexis France continued to enhance Lexis 360, the first semantic search online tool combining legal information, practical content and results from the web by providing tailored solutions for the public sector and the accounting markets.
Additional practical guidance solutions were launched in Canada, South Africa and Australia. Following the continued success of Lexis Advance in the US, an Australian version was launched in 2014 and additional international launches are planned.
In 2014, LexisNexis Legal & Professional strengthened its positions in Asia by introducing products created specifically for legal professionals and practitioners, corporate counsels, legal researchers and government institutions in markets including India, China and Japan. New practical guidance offerings are now available in China, Hong Kong and Japan. Also, LexisNexis continued its investment in broadening its core content offerings in India, Singapore and other countries in the region.
Market opportunities
Longer-term growth in legal and regulatory markets worldwide is driven by increasing levels of legislation, regulation, regulatory complexity and litigation, and an increasing number of lawyers.
Additional market opportunities are presented by the increasing demand for online information solutions and practice management tools that improve the quality and productivity of research, deliver better legal outcomes, and improve business performance. Notwithstanding this, legal activity and legal information markets are also influenced by economic conditions and corporate activity, as has been seen with the dampening of demandsubleased to new tenants and the subdued market environment in North Americano longer houses any RELX staff.
No property owned or leased by us which is considered material to us taken as a whole is presently subject to liabilities relating to environmental regulations and Europe in the aftermath of the global recession.none has major encumbrances.
Strategic priorities
LexisNexis Legal & Professional’s strategic goal is to enable better legal outcomes and be the leading provider of productivity-enhancing information and information-based workflow solutions in its markets. To achieve this LexisNexis is focused on introducing next generation products and solutions on the global New Lexis platform and infrastructure; leveraging New Lexis globally to continue to drive print to electronic migration and long-term international growth; and upgrading operational infrastructure, improving process efficiency and gradually improving margins.
In the US, LexisNexis’ focus is on the continuing development of next generation legal research and practice solutions. It is also conducting a major upgrade in operations infrastructure and customer service and support platforms. This will provide customers with an integrated and superior experience across multiple products and solutions. Over the next few years progressive product introductions, often based on the New Lexis platform, leveraging big data HPCC technology, will combine advanced technology with enriched content, sophisticated analytics and applications to enable LexisNexis’ customers to make better legal decisions and drive better outcomes for their organisations and clients.
Outside the US, LexisNexis is focused on growing online services and developing further high-quality actionable content and workflow tools, including the continuous development of practical guidance and practice management applications. In 2015, LexisNexis will continue to introduce New Lexis globally. Additionally, LexisNexis is focusing on the expansion of its activities in emerging markets.
Business model, distribution channels and competition
LexisNexis Legal & Professional products and services are generally sold directly to law firms and to corporate, government, accounting and academic customers on a paid subscription basis, with subscriptions with law firms often under multi-year contracts.
Principal competitors for LexisNexis in US legal markets are West (Thomson Reuters), CCH (Wolters Kluwer) and Bloomberg. In news and business information they are Bloomberg and Factiva (News Corporation). Competitors in litigation solutions also include software companies. Significant international competitors include Thomson Reuters, Wolters Kluwer and Factiva.
Major brands
LexisNexis is the master brand used by LexisNexis Legal & Professional.
LexisNexis Legal & Professional’s major brands include: Lexis®, legal, news and public records content for legal professionals; Matthew Bender®, critical analysis, checklists, forms, and practice guides authored by industry experts covering over 50 major practice areas; Lexis®Library, LexisNexis® UK flagship legal online product; Lexis®PSL, LexisNexis® UK legal practical guidance service; Shepard’s Citations Service, a citation service; Lexis Advance, a new online legal research tool that transforms the way legal professionals conduct research; Lexis Practice Advisor, a new resource that offers guidance to help attorneys handle transactional matters more efficiently and effectively; and Law360, a legal news provider covering the entire spectrum of practice areas every single business day.
EXHIBITIONS
| Year ended December 31, | ||||||||||||
| 2014 | 2013 | 2012 | ||||||||||
| (in millions) | ||||||||||||
Revenue | £ | 890 | £ | 862 | £ | 854 | ||||||
|
|
|
|
|
| |||||||
Reed Exhibitions is a leading exhibitions business, with 500 events in over 30 countries.
Reed Exhibitions’ portfolio of exhibitions and conferences serves 43 industry sectors across the globe. In 2014, Reed Exhibitions brought together over 7 million event participants from around the world, generating billions of dollars of business and facilitating entry into new markets for its customers and boosting the local economies where the events are hosted.
Reed Exhibitions is a global business headquartered in London and has principal offices in Paris, Vienna, Norwalk (Connecticut), São Paulo, Abu Dhabi, Beijing, Moscow, Tokyo, and Sydney. Reed Exhibitions has 3,700 employees worldwide. In 2014, approximately 70% of Exhibitions’ revenue is derived from exhibitor participation fees, with the balance primarily comprising of conference fees, online and offline advertising, sponsorship fees and admission charges. Approximately 16% of Exhibitions’ revenue came from North America, 47% from Europe and the remaining 37% from the rest of the world on an event location basis.
Reed Exhibitions organises market-leading events which are relevant to industry needs, where participants from around the world meet face-to-face to do business, to network and to learn. Its exhibitions and conferences encompass a wide range of sectors. They include construction, cosmetics, electronics, energy and alternative energy, engineering, entertainment, gifts and jewellery, healthcare, hospitality, interior design, logistics, manufacturing, pharmaceuticals, real estate, recreation, security and safety, transport and travel.
Market opportunities
Growth in the exhibitions market is influenced by both business-to-business marketing spend and business investment. Historically, these have been driven by levels of corporate profitability, which in its turn has followed overall growth in GDP. Emerging markets and higher growth sectors provide additional opportunities for Reed Exhibitions. As some events are held other than annually, growth in any one year is affected by the cycle of non-annual exhibitions.
Strategic priorities
Reed Exhibitions’ strategic goal is to understand and respond to its customers’ evolving needs and objectives better than its competition through deep knowledge of its customers and the markets they serve.
Reed Exhibitions delivers a platform for industry communities to conduct business, to network and to learn through a range of market-leading events in growth sectors, especially in higher growth geographies, enabling exhibitors to target and reach new customers quickly and cost effectively.
Organic growth will be achieved by continuing to generate greater customer value through the intelligent application of customer knowledge, by developing new events, and by building out technology platforms to ensure the rapid deployment of innovation and best practices across the organisation. Reed Exhibitions is also shaping its portfolio through a combination of strategic partnerships and acquisitions in high-growth sectors and geographies as well as by withdrawing from markets and industries with lower long-term growth prospects.
Reed Exhibitions is committed to continually improving customer solutions and experience. By providing a variety of services, including its integrated web platform, we continue to drive customer satisfaction. Using customer insights, Reed Exhibitions has developed an innovative product offering which enhances the value proposition for exhibitors by broadening their options in terms of the type and location of stand they take and the timing of their commitment to the event.
In 2014 Reed Exhibitions launched 36 new events. These included many events which delivered on the strategy of taking sector expertise, customer relationships and leading brands from one market and extending them into new geographies using local operational capability. Mipim, the leading property show held annually in Cannes, responded to the buoyant UK property market with the launch of an offshoot in London, FIBO China (health and fitness) was launched in Shanghai, building on the successful and long running German event FIBO, and in Singapore, Reed Exhibitions launched an Asian version of Maison&Objet, the leading design-led home and furniture show held twice a year in Paris.
A number of targeted acquisitions and investments were completed during 2014. Increasing its holding in Reed Tüyap gave Reed Exhibitions a strong position in Turkey, and with the acquisition of Fidalex and AFG, Reed Exhibitions achieved market leader status in Mexico. The Mexican acquisitions brought events such as Expo Carga (transport and logistics) and the Beauty Show into its portfolio. In addition, an investment in the Bakery event, serving the bakery and confectionery industry, broadening its footprint in China.
Business model, distribution channels and competition
The substantial majority of Reed Exhibitions’ revenues are from sales of exhibition space. The balance includes conference fees, online and offline advertising, sponsorship fees and, for some shows, admission charges. Exhibition space is sold directly or through local agents where applicable. Reed Exhibitions often works in collaboration with trade associations, which use the events to promote access for members to domestic and export markets, and with governments, for whom events can provide important support to stimulate foreign investment and promote regional and national enterprise. Increasingly, Reed Exhibitions is offering visitors and exhibitors the opportunity to interact before and after the show through the use of online and mobile tools such as directories and matchmaking.
Reed Exhibitions is the global market leader in a fragmented industry, holding less than a 10% global market share. Other international exhibition organisers include UBM, Informa IIR and some of the larger German Messe, including Messe Frankfurt, Messe Düsseldorf and Messe Munich. Competition also comes from industry trade associations and convention centre and exhibition hall owners.
Major brands
Reed Exhibitions’ major brands include: Mipim, the world’s property market; World Travel Market, an event for the travel industry; fiac!, an international contemporary art fair; Aluminium China, Asia’s sourcing and networking platform for the complete aluminium industry chain; Manufacturing World Tokyo, Japan’s largest trade show for the manufacturing industry; Mecanica, an international machinery trade fair; JCK Las Vegas, a North American jewellery industry trade event; and Pax Prime, a game festival for Tabletop, Videogame and PC Gamers.
ELSEVIER REED FINANCE BV
Elsevier Reed Finance BV, the Dutch parent company of the Elsevier Reed Finance BV group (“ERF”), was directly owned by Reed Elsevier PLC and Reed Elsevier NV during 2014. Effective February 25, 2015, Reed Elsevier PLC and Reed Elsevier NV transferred their direct ownership interests in ERF to their jointly-owned company Reed Elsevier Group plc. See
“Organisational Structure — Proposed Modifications to Corporate Structure, Equalisation Arrangements and Corporate Entity Names”. ERF provided treasury, finance, intellectual property and reinsurance services to the Group businesses through its subsidiaries in Switzerland: Elsevier Finance SA (“EFSA”), Reed Elsevier Properties SA (“REPSA”) and Elsevier Risks SA (“ERSA”). These three Swiss companies were organised under one Swiss holding company, which was in turn owned by ERF.
EFSA is the principal treasury centre for the combined businesses. It is responsible for all aspects of treasury advice and support for certain Group businesses, and undertakes foreign exchange and derivatives dealing services for the whole Group. EFSA also arranges or directly provides the Group businesses with financing for acquisitions, product development and other general requirements and manages cash pools, investments and debt programmes on their behalf. REPSA actively manages intellectual property assets including trademarks such as The Lancet and databases such as Reaxys and PharmaPendium. ERSA is responsible for reinsurance activities for the Group.
Certain of our businesses provide authorised customers with products and services such as access to public records and other information on individuals. Our businesses that provide such products and services are subject to applicable privacy and consumer information laws and regulations, including US federal and state laws and regulations, and regulations applicable to jurisdictions that follow EU and member state regulation. Our compliance obligations vary, from regulator to regulator, and may include, among other things, strict data security programs,programmes, submissions of regulatory reports, providing consumers with certain notices and in some instances, correcting inaccuracies in reports available through our products. From time to time, we respond in the ordinary course to inquiries and investigations from regulators who are charged with enforcing the laws and regulations applicable reports.to our businesses. We are also subject to the terms of consent decrees and other settlements with certain regulators in the U.S.US. See “Item 8: Financial Information — Legal Proceedings” on page 72.41.
Section 219 of the Iran Threat Reduction and Syrian Human Rights Act of 2012 (the “ITRA”), which added Section 13(r) to the Securities Exchange Act of 1934, as amended (the “Exchange Act”), requires disclosures regarding certain activities relating to Iran or with persons designated pursuant to various U.S. Presidential Executive Orders. These disclosures are required even where the activities, transactions or dealings were conducted in compliance with applicable law. We engage in a limited amount of activity with Iran (a) through ournon-U.S. affiliates and businesses, as well as (b) pursuant to authorisations — in the form of exemptions or licenses — issued by the U.S. government. We anticipate that similar transactions or dealings may occur in the future. The ownership or control of our customers in Iran is often difficult to determine with certainty.
11
During 2014,2017,
our Scientific, Technical & Medical |
our Risk & Business |
our Exhibitions business provided exhibition space to IRIB Media Trade |
Numerous Iranian nationals attended conferences organised by our exhibitions business.Exhibitions and Risk & Business Analytics businesses. Individuals located in Iran also subscribed to or purchased certain of our scientific, medical and technical publications. Many of these individuals are researchers, doctors or other professionals who have obtained subscriptions or purchased publications in their individual capacity, but who may be employed by government agencies in Iran or by hospitals, universities or other entities owned or controlled by the government of Iran. In addition, we work with authors, other contributors and journal editorial board members who are located in Iran, many of whom are employed at hospitals, universities or research institutions that are owned or controlled by the government of Iran. We also sometimes receive payments from authors located in Iran who pay us to make their articles publicly available. From time to time, we may employ or engage individuals in Iran to assist with transactions in Iran.
During 2014, ourOur aggregate gross revenue fromduring the foregoingfiscal year ended December 31, 2017 attributable to these Iran-related activities was approximately £6.3 million.£13.5 million compared to £11.8 million in 2016. We do not normallycustomarily allocate net profit on asubscription-by-subscription, individual customer orcountry-by-country basis. However, we estimate that our net profit fromduring the fiscal year ended December 31, 2017 attributable to these activities after internal cost allocations, amounted to 0.1%was 0.18% of our net profit reported in our combined income statement for the fiscal year ended December 31, 2014.
We believe these transactions and dealings were lawful under applicable laws and regulations and anticipate that similar transactions or dealings may occur in2017 compared to 0.17% for the future.
Reed Elsevier PLC was originally incorporated in 1903 and Reed Elsevier NV was originally incorporated in 1880. Their businesses were combined in 1993. A description of our corporate structure as offiscal year ended December 31, 2014 is contained2016.
Entities that Purchased from Our Scientific, Technical & Medical Business in note 1 to our combined financial statements on page F-10.2017
Proposed Modifications to Corporate Structure, Equalisation ArrangementsAhvaz Jundishapur University of Medical Sciences, Aja University of Medical Sciences, Alborz University of Medical Sciences, Allameh Tabatabai University, Alzahra University, Amirkabir University of Technology, Arak University of Medical Sciences, Ardabil University of Medical Sciences, Babol University of Medical Science, Birjand University of Medical Sciences, Bojnourd University, Boushehr University of Medical Sciences, Buali Sina University, Faculty of Agriculture, Fasa University of Medical Science, Ferdowsi University of Mashhad, Golestan University of Medical Sciences and Corporate Entity NamesHealth Services, Gonabad University of Medical Sciences, Guilan University of Medical Sciences, Hamedan University of Medical Science, Health and Biomedical Information Network, Hormozgan University of Medical Sciences, Ilam University of Medical Sciences, Imam Hosein Hospital, Imam Khomeini Hospital, Imam Khomeini International University, Institute for Research in Fundamental Sciences, Iran Polymer and Petrochemical Institute, Iran University of Medical Sciences, Iran University of Science and Technology, Iranian Meteorological Organisation, Iranian Research Institute for Scientific Information and Documentation, Isfahan University of Medical Sciences, Isfahan University of Technology, Islamic World Science Citation Center, Jahrom University of Medical Science, Jiroft University of Medical Sciences, Kashan University of Medical Sciences, Kerman University of Medical Sciences, Kermanshah University of Medical Sciences, Kharazmi University, KN Toosi University of Technology, Kurdistan University of Medical Sciences, Library Kermanshah Universty of Medical Sciences & Health Services, Lorestan University of Medical Sciences, Maragheh University of Medical Sciences, Mashhad University of Medical Sciences, Mazandaran University of Medical Sciences, Medical University of Dezful, National Centre for Scientific Research, National Institute for Genetic Engineering and Biotechnology, North Khorasan University of Medical Sciences, Parsian Medical Bookshop, Pasteur Institute of Iran, Qazvin University of Medical Sciences, Qom University of Medical Sciences and Health Services, Rafsanjan University of Medical Sciences, Sabzevar University of Medical Sciences, School of Medicine & Affiliated Hospitals, School of Public Health, Semnan University, Semnan University of Medical Sciences and Health Services, Shahed University Faculty of Medical Sciences, Shaheed Beheshti University of Medical Sciences, Shahid Sadoughi University of Medical Sciences and Health Services, Shahrekord University, Shahrekord University of Medical Science, Shahroud University of Medical Sciences, Shariati Hospital, Shiraz University, Shiraz University of Medical Sciences, Tabriz University of Medical Sciences, Tarbiat Modares University, Tehran University of Medical Sciences, University of Art, University of Isfahan, University of Mazandaran, University of Sistan and Baluchestan, University of Social Welfare and Rehabilitation Science, University of Tabriz, University of Tehran, Urmia University of Medical Sciences, Yasooj University of Medical Sciences Kohkiloyeh, Zabol University of Medical Sciences, Zahedan University of Medical Sciences, Zanjan University of Medical Sciences
During 2014, the Boards carried out a review of our corporate structure and equalisation arrangements to explore waysEntities that Purchased from Our Risk & Business Analytics Business in which it might be simplified and modernised. Certain changes have recently been made and others are being proposed to shareholders at the Annual General Meetings of Reed Elsevier PLC and Reed Elsevier NV to be held in April 2015. None of these changes will impact the economic or voting interests of any shareholder. In particular, dividend and capital distribution rights are unaffected. All parent company guarantees over debt are also unaffected.2017
Corporate Structure
Effective February 25, 2015, Reed Elsevier PLC and Reed Elsevier NV transferred their direct ownership interests in Elsevier Reed Finance BV to their jointly-owned company Reed Elsevier Group plc and named this newly-combined single group entity RELX Group plc. As a result, RELX Group plc now holds the businesses and subsidiaries, and carries out the Group’s financing activities.
Shareholders in Reed Elsevier PLC hold a 52.9% economic interest in the combined businesses. Reed Elsevier PLC owns a 50% direct holding in RELX Group plc and has a 5.8% shareholding in Reed Elsevier NV. All other shareholders (other than Reed Elsevier PLC) in Reed Elsevier NV hold a 47.1% economic interest in the combined businesses. In order to simplify the corporate structure and make the respective economic interests of the two parent companies’ shareholders more transparent we have proposed that Reed Elsevier PLC’s 5.8% shareholding in Reed Elsevier NV be replaced by a 2.9% direct (non-voting) shareholding in RELX Group plc. As a result, Reed Elsevier PLC’s direct equity holding in RELX Group plc will become 52.9% and Reed Elsevier NV’s direct equity holding in RELX Group plc will become 47.1%, which aligns with their shareholders’ respective economic interests.
The revised corporate structure, reflecting the changes that became effective February 25, 2015 and those being proposed to shareholders, is as follows:Abadan Petrochemical Company, Amir Kabir Petrochemical Company, Arya Sasol Polymer Company, Bakhtar Commercial Company, Bandar Imam Petrochemical Company, Behran Oil Company, Bistoun Petrochemical Company, Bouka Holding Company, Dana Polymer Company, Esfahan Petrochemical Company Inc, Excell Worldwide DMCC,
12
Fanavaran Petrochemical Company, Farabi Petrochemical Company, Ghadeer Petrochemical Company, Ghaed Bassir Petrochemical Company, Iranian Chemical Parks Development, Jam Petrochemical Company, Jam Polypropylene Company, Kangan Petro-Refining Company, KGT Oil, Kharg Petrochemical Company Ltd, Khorasan Petrochemical Company, Kian Petrochemicals Company, Kimyagaran Emrooz Chemical Industries, Morvarid Petrochemical Company, National Petrochemical Company, Pars Oil Company, Persian Gulf Petrochemical Industry Commercial Company, Petrochemical Commercial Company, Petrochemical Commercial Company International LTD (PCCI), Polynar Corporation, Sepahan Oil Company, Shahid Tondgooyan Petrochemical Company, Shazand Petrochemical Company, Sherkat Azarvan Sahami Khass, Tabriz Petrochemical Company, TOPCO, Yas Banafsh Tehran Trading Company, Zagros Petrochemical Company
Equalisation Arrangements13
Presently the equalisation ratio of Reed Elsevier PLC to Reed Elsevier NV shares is such that one Reed Elsevier NV ordinary share is generally intended to confer equivalent economic interests to 1.538 Reed Elsevier PLC ordinary shares. At its Annual General Meeting in April 2015, Reed Elsevier NV is proposing a resolution to issue additional bonus ordinary shares to existing Reed Elsevier NV shareholders on the basis of 0.538 bonus shares for each share held. If approved by shareholders, this will result in one ordinary share of Reed Elsevier NV conferring equivalent economic interests to one ordinary share of Reed Elsevier PLC. The reduction in the per share economic interests of Reed Elsevier NV shareholders as a
result of the increase in the number of Reed Elsevier NV shares will be correspondingly offset by the number of additional shares each Reed Elsevier NV shareholder receives in the bonus issue, leaving the economic interest of each shareholder unchanged. Reed Elsevier PLC and Reed Elsevier NV ADRs on the New York Stock Exchange will also be adjusted so that they each represent one Reed Elsevier PLC or one Reed Elsevier NV ordinary share (from their current 4-to-1 and 2-to-1 ratios respectively).
By moving from the current 1.538-to-1 to a new 1-to-1 equalisation ratio between Reed Elsevier PLC and Reed Elsevier NV ordinary shares, capital rights (on a per share basis), dividends per share (on a gross basis including, with respect to the dividend on Reed Elsevier PLC ordinary shares, the associated UK tax credit) and adjusted earnings per share all will be readily identifiable as substantially equivalent between ordinary shares as well as their respective ADRs, subject only to the prevailing currency exchange rates between pounds sterling, euros or US dollars. This will also make it simpler to compare the prices of Reed Elsevier PLC and Reed Elsevier NV ordinary shares as well as their respective ADRs.
Subject to shareholder approval of the issuance of additional bonus shares by Reed Elsevier NV, the bonus issue, the changes to the number of Reed Elsevier PLC and Reed Elsevier NV ADRs and the requisite amendments to the Governing Agreement, all will be effective as of July 1, 2015.
Corporate Entity Names
Along with the proposed changes to the corporate structure, the Boards undertook a review of the names of the corporate entities. Following that review, as already noted, the Boards determined that as part of the transfer of ownership of Elsevier Reed Finance BV from Reed Elsevier PLC and Reed Elsevier NV to Reed Elsevier Group plc it was appropriate to name the newly-combined entity that holds the businesses and subsidiaries, and carries out the Group’s financing activities, RELX Group plc. The Boards believe this shorter and more modern name reflects the transformation of the Group to a technology, content and analytics driven business while at the same time maintaining the link with its proud heritage. The Boards are proposing to shareholders at the Annual General Meetings in 2015 to also change the corporate names of Reed Elsevier PLC and Reed Elsevier NV to RELX PLC and RELX NV, respectively. There will not be any brand or name changes for any customer facing products or business units.
Shareholder Approval
As noted, certain of the structural changes and the change of name of the two parent companies, Reed Elsevier PLC and Reed Elsevier NV, will require the approval of shareholders. Detailed descriptions of the resolutions to be put to the Annual General Meetings of Reed Elsevier PLC and Reed Elsevier NV in April 2015 will be set out in the respective Notices of Annual General Meeting.
Significant Subsidiaries, Associates, Joint Ventures and Business Units
A list of significant subsidiaries, associates, joint ventures and business units is included under Item 19: Exhibits on pages S-3 and S-4.
INTELLECTUAL PROPERTY
Our products and services are largely comprised of intellectual property content delivered through a variety of media, including online, journals and books. We rely on trademark, copyright, patent, trade secret and other intellectual property laws, as well as in some cases licensing arrangements with third parties, to establish and protect our proprietary rights in these products and services.
We own or lease approximately 280 properties around the world, the majority of leased space being in the United States. The table below identifies the principal owned and leased properties which we use in our business.
|
|
| ||||||
| ||||||||
| ||||||||
| ||||||||
| ||||||||
| ||||||||
| ||||||||
| ||||||||
| ||||||||
| ||||||||
| ||||||||
All of the above properties are substantially occupied by our businesses with the exception of the New York, New York property, where we occupy less than half of the floor space.
No property owned or leased by us which is considered material to us taken as a whole is presently subject to liabilities relating to environmental regulations and none has major encumbrances.
ITEM 5: OPERATING AND FINANCIAL REVIEW AND PROSPECTS
The following discussion is based on the combinedconsolidated financial statements of the Group for the three years ended December 31, 20142017, 2016 and 2015 which have been prepared in accordance with International Financial Reporting Standards (“IFRS”)IFRS as issued by the International Accounting Standards Board (“IASB”)IASB and as adopted by the European Union.EU.
The following discussion should be read in conjunction with, and is qualified by reference to, the combinedconsolidated financial statements.statements set forth on pages 117 to 164 of the Group’s Annual Reports and Financial Statements 2017 and incorporated herein by reference to Exhibit 15.2.
The following tables analyse the Group’s revenue in each of the three years ended December 31, 2014, 20132017, 2016 and 20122015 by type, format and geographic market. We derive our revenue principally from subscriptions, transactional and advertising sales. Transactional sales includes revenue from exhibitions. For additional information, see note 32 to the combinedconsolidated financial statements.statements set forth on pages 124 and 125 of the Group’s Annual Reports and Financial Statements 2017 and incorporated herein by reference to Exhibit 15.2.
Revenue by type
Year ended December 31,
| 2014 | 2013 | 2012 | 2017 | 2016 | 2015 | |||||||||||||||||||||||||||||||||||||||||||
| (in millions, except percentages) | (in millions, except percentages) | |||||||||||||||||||||||||||||||||||||||||||||||
Subscriptions | £2,966 | 51 | % | £ | 3,112 | 52 | % | £ | 2,978 | 49 | % | £ | 3,808 | 52 | % | £ | 3,618 | 52 | % | £ | 3,123 | 52 | % | |||||||||||||||||||||||||
Transactional | 2,672 | 47 | 2,683 | 44 | 2,788 | 45 | 3,449 | 47 | 3,163 | 46 | 2,736 | 46 | ||||||||||||||||||||||||||||||||||||
Advertising | 135 | 2 | 240 | 4 | 350 | 6 | 98 | 1 | 114 | 2 | 112 | 2 | ||||||||||||||||||||||||||||||||||||
|
|
|
|
|
|
|
|
|
|
|
| |||||||||||||||||||||||||||||||||||||
Total | £5,773 | 100 | % | £ | 6,035 | 100 | % | £ | 6,116 | 100 | % | £ | 7,355 | 100 | % | £ | 6,895 | 100 | % | £ | 5,971 | 100 | % | |||||||||||||||||||||||||
|
|
|
|
|
|
|
|
|
|
|
| |||||||||||||||||||||||||||||||||||||
Revenue by format
Year ended December 31,
| 2014 | 2013 | 2012 | 2017 | 2016 | 2015 | |||||||||||||||||||||||||||||||||||||||||||
| (in millions, except percentages) | (in millions, except percentages) | |||||||||||||||||||||||||||||||||||||||||||||||
Electronic | £ | 3,839 | 66 | % | £ | 3,971 | 66 | % | £ | 3,896 | 64 | % | £ | 5,399 | 74 | % | £ | 4,954 | 72 | % | £ | 4,179 | 70 | % | ||||||||||||||||||||||||
Face-to-face | 1,122 | 15 | 1,066 | 15 | 886 | 15 | ||||||||||||||||||||||||||||||||||||||||||
| 1,012 | 18 | 1,168 | 19 | 1,305 | 21 | 834 | 11 | 875 | 13 | 906 | 15 | |||||||||||||||||||||||||||||||||||||
Face to face | 922 | 16 | 896 | 15 | 915 | 15 | ||||||||||||||||||||||||||||||||||||||||||
|
|
|
|
|
|
|
|
|
|
|
| |||||||||||||||||||||||||||||||||||||
Total | £ | 5,773 | 100 | % | £ | 6,035 | 100 | % | £ | 6,116 | 100 | % | £ | 7,355 | 100 | % | £ | 6,895 | 100 | % | £ | 5,971 | 100 | % | ||||||||||||||||||||||||
|
|
|
|
|
|
|
|
|
|
|
| |||||||||||||||||||||||||||||||||||||
Revenue by geographic market
Year ended December 31,
| 2014 | 2013 | 2012 | 2017 | 2016 | 2015 | |||||||||||||||||||||||||||||||||||||||||||
| (in millions, except percentages) | (in millions, except percentages) | |||||||||||||||||||||||||||||||||||||||||||||||
North America | £2,878 | 50 | % | £ | 3,082 | 51 | % | £ | 3,154 | 52 | % | £ | 4,081 | 56 | % | £ | 3,778 | 55 | % | £ | 3,215 | 54 | % | |||||||||||||||||||||||||
United Kingdom | 455 | 8 | 443 | 7 | 442 | 7 | 522 | 7 | 504 | 7 | 461 | 8 | ||||||||||||||||||||||||||||||||||||
The Netherlands | 153 | 3 | 166 | 3 | 165 | 3 | 92 | 1 | 118 | 2 | 117 | 2 | ||||||||||||||||||||||||||||||||||||
Rest of Europe | 1,053 | 18 | 1,074 | 18 | 1,176 | 19 | 1,081 | 15 | 1,091 | 16 | 958 | 16 | ||||||||||||||||||||||||||||||||||||
Rest of world | 1,234 | 21 | 1,270 | 21 | 1,179 | 19 | 1,579 | 21 | 1,404 | 20 | 1,220 | 20 | ||||||||||||||||||||||||||||||||||||
|
|
|
|
|
|
|
|
|
|
|
| |||||||||||||||||||||||||||||||||||||
Total | £5,773 | 100 | % | £ | 6,035 | 100 | % | £ | 6,116 | 100 | % | £ | 7,355 | 100 | % | £ | 6,895 | 100 | % | £ | 5,971 | 100 | % | |||||||||||||||||||||||||
|
|
|
|
|
|
|
|
|
|
|
| |||||||||||||||||||||||||||||||||||||
The cost profile of individual businesses within the Group varies widely and costs are controlled on an individual business unit basis. Our most significant cost item is staff costs of £1,709£2,273 million (2013: £1,775(2016: £2,114 million; 2012: £1,8452015: £1,751 million).
The following tables show revenue and adjusted operating profit for each of our business segments in each of the three years ended December 31, 2014, 20132017, 2016 and 20122015 together with the percentage change in 20142017 and 20132016 at both actual and constant exchange rates.currencies. The effect of currency movements on the 2017 results is further described separately below (see “— Effect of Currency Translation” on page 23). Adjusted operating profit is included on the basis that it is the key segmental
14
profit measure used by management to evaluate performance and allocate resources to the business segments, as reported under IFRS8: Operating Segments in note 32 to the combinedconsolidated financial statements.statements set forth on pages 124 and 125 of the Group’s Annual Reports and Financial Statements 2017 and incorporated herein by reference to Exhibit 15.2. Adjusted operating profit represents operating profit before amortisation of acquired intangible assets and acquisition related costs the share of profit on disposals in joint ventures, and is grossed up to exclude the equity share of finance income, finance costs and taxes in joint ventures. A reconciliation of reported operating profit to adjusted operating profit is included below.
Following a review of activities, assetsRevenue by segment, reported operating profit and costs across the business, we introduced a new method for the allocation of corporate and shared costs from January 1, 2014. Previously unallocated items and costs relating to shared activities and resources have been attributed to the business segments on the basis of usage and benefits derived. This new allocation reflects an increased level of shared resources and capitalised costs. Comparative adjusted operating profit figures for 2013 and 2012 have been restatedby segment are as if this allocation method had operated in the prior periods.follows:
| Revenue Year ended December 31, | Revenue for the year ended December 31 | |||||||||||||||||||||||||||||||||||||||||||||||||||||||||||||||||||
| 2014 | 2013 | % change | 2012 | % change | 2017 | 2016 | % change | 2015 | % change | |||||||||||||||||||||||||||||||||||||||||||||||||||||||||||
|
|
|
| actual rates | constant rates(1) |
|
| actual rates | constant rates(2) |
|
| actual rates | constant rates(1) |
| actual rates | constant rates(2) | ||||||||||||||||||||||||||||||||||||||||||||||||||||
| (in millions, except percentages) | (in millions, except percentages) | |||||||||||||||||||||||||||||||||||||||||||||||||||||||||||||||||||
Scientific, Technical & Medical | £ | 2,048 | 36 | % | £ | 2,126 | 35 | % | -4 | % | +1 | % | £ | 2,063 | 34 | % | +3 | % | +1 | % | £ | 2,478 | £ | 2,320 | +7 | % | +2 | %�� | £ | 2,070 | +12 | % | +2 | % | ||||||||||||||||||||||||||||||||||
Risk & Business Information | 1,439 | 25 | % | 1,480 | 25 | % | -3 | % | +2 | % | 1,589 | 26 | % | -7 | % | -8 | % | |||||||||||||||||||||||||||||||||||||||||||||||||||
Risk & Business Analytics | 2,076 | 1,906 | +9 | % | +4 | % | 1,601 | +19 | % | +8 | % | |||||||||||||||||||||||||||||||||||||||||||||||||||||||||
Legal | 1,396 | 24 | % | 1,567 | 26 | % | -11 | % | -6 | % | 1,610 | 26 | % | -3 | % | -4 | % | 1,692 | 1,622 | +4 | % | -1 | % | 1,443 | +12 | % | +2 | % | ||||||||||||||||||||||||||||||||||||||||
Exhibitions | 890 | 15 | % | 862 | 14 | % | +3 | % | +11 | % | 854 | 14 | % | +1 | % | +2 | % | 1,109 | 1,047 | +6 | % | +1 | % | 857 | +22 | % | +9 | % | ||||||||||||||||||||||||||||||||||||||||
|
|
|
|
|
|
|
|
|
|
|
|
| ||||||||||||||||||||||||||||||||||||||||||||||||||||||||
Total | £ | 5,773 | 100 | % | £ | 6,035 | 100 | % | -4 | % | +1 | % | £ | 6,116 | 100 | % | -1 | % | -3 | % | £ | 7,355 | £ | 6,895 | +7 | % | +2 | % | £ | 5,971 | +15 | % | +4 | % | ||||||||||||||||||||||||||||||||||
|
|
|
|
|
|
|
|
|
|
|
|
| ||||||||||||||||||||||||||||||||||||||||||||||||||||||||
| Adjusted Operating Profit(3) Year ended December 31, | ||||||||||||||||||||||||||||||||||||||||
| 2014 | 2013 Restated | % change | 2012 Restated | % change | ||||||||||||||||||||||||||||||||||||
|
|
|
| actual rates | constant rates(1) |
|
| actual rates | constant rates(2) | |||||||||||||||||||||||||||||||
| (in millions, except percentages) | ||||||||||||||||||||||||||||||||||||||||
Scientific, Technical & Medical | £762 | 44 | % | £787 | 45 | % | -3 | % | +1 | % | £743 | 44 | % | +6 | % | +2 | % | |||||||||||||||||||||||
Risk & Business Information | 506 | 29 | % | 507 | 29 | % | 0 | % | +5 | % | 498 | 29 | % | +2 | % | 0 | % | |||||||||||||||||||||||
Legal | 260 | 15 | % | 250 | 14 | % | +4 | % | +10 | % | 244 | 15 | % | +2 | % | +2 | % | |||||||||||||||||||||||
Exhibitions | 217 | 12 | % | 210 | 12 | % | +3 | % | +12 | % | 208 | 12 | % | +1 | % | +4 | % | |||||||||||||||||||||||
|
|
|
|
|
|
|
|
|
|
|
|
|
|
|
|
|
|
|
| |||||||||||||||||||||
Subtotal | £1,745 | 100 | % | £1,754 | 100 | % | £1,693 | 100 | % | |||||||||||||||||||||||||||||||
Corporate costs | (6) | (5 | ) | (5 | ) | |||||||||||||||||||||||||||||||||||
|
|
|
|
|
|
|
|
|
|
|
|
|
| |||||||||||||||||||||||||||
Total | £1,739 | £1,749 | -1 | % | +5 | % | £1,688 | +4% | +1 | % | ||||||||||||||||||||||||||||||
|
|
|
|
|
|
|
|
|
|
|
|
|
| |||||||||||||||||||||||||||
| Reported operating profit for the year ended December 31 | ||||||||||||||||||||
| 2017 | 2016 | % change | 2015 | % change | ||||||||||||||||
|
| actual rates |
| actual rates | ||||||||||||||||
| (in millions, except percentages) | ||||||||||||||||||||
Reported operating profit | £ | 1,905 | £ | 1,708 | +12 | % | £ | 1,497 | +14 | % | ||||||||||
|
|
|
|
|
| |||||||||||||||
| Adjusted operating profit for the year ended December 31 | ||||||||||||||||||||||||||||
| 2017 | 2016 | % change | 2015 | % change | ||||||||||||||||||||||||
|
| actual rates | constant rates(1) |
| actual rates | constant rates(2) | ||||||||||||||||||||||
| (in millions, except percentages) | ||||||||||||||||||||||||||||
Scientific, Technical & Medical | £ | 913 | £ | 853 | +7 | % | +2 | % | £ | 760 | +12 | % | +2 | % | ||||||||||||||
Risk & Business Analytics | 759 | 686 | +11 | % | +6 | % | 575 | +19 | % | +8 | % | |||||||||||||||||
Legal | 332 | 311 | +7 | % | +1 | % | 274 | +13 | % | +2 | % | |||||||||||||||||
Exhibitions | 285 | 269 | +6 | % | +1 | % | 217 | +24 | % | +9 | % | |||||||||||||||||
|
|
|
|
|
|
|
|
|
|
|
|
|
| |||||||||||||||
Subtotal | £ | 2,289 | £ | 2,119 | £ | 1,826 | ||||||||||||||||||||||
Unallocated items | (5 | ) | (5 | ) | (4 | ) | ||||||||||||||||||||||
|
|
|
|
|
| |||||||||||||||||||||||
Total | £ | 2,284 | £ | 2,114 | +8 | % | +3 | % | £ | 1,822 | +16 | % | +4 | % | ||||||||||||||
|
|
|
|
|
| |||||||||||||||||||||||
| (1) | Represents percentage change in |
| (2) | Represents percentage change in |
The Group uses adjusted figures, which are not defined by generally accepted accounting principles (“GAAP”) such as IFRS. Adjusted operating profit is a non-GAAP measure included on the basis that it is a key financial measurefigures and underlying growth rates are presented as additional performance measures used by management, as they provide relevant information in assessing performance. It is derivedthe Group’s performance, position and cash flows. We believe that these measures enable investors to more clearly track the core operational performance of the Group, by separating out items of income or expenditure relating to acquisitions, disposals and capital items, while providing our investors with a clear basis for assessing our ability to raise debt and invest in new business opportunities. In 2017, we have excluded the exceptional tax credit arising as a result of the US Tax Cuts and Jobs Act from our adjusted measures. RELX management uses these financial measures, along with IFRS financial measures, in evaluating the operating profitperformance of the Group as follows:a whole and
| 2014 | 2013 | 2012 | ||||||||||
| (in millions) | ||||||||||||
Operating profit | £1,402 | £ | 1,376 | £ | 1,333 | |||||||
Adjustments: | ||||||||||||
Amortisation of acquired intangible assets | 286 | 318 | 329 | |||||||||
Acquisition related costs | 30 | 43 | 21 | |||||||||
Reclassification of tax in joint ventures | 21 | 12 | 5 | |||||||||
|
|
|
|
|
| |||||||
Adjusted operating profit | £1,739 | £ | 1,749 | £ | 1,688 | |||||||
|
|
|
|
|
| |||||||
Underlying15
the individual business segments. Adjusted financial measures should not be considered in isolation from, or as a substitute for, financial information presented in compliance with IFRS. The measures may not be directly comparable to similarly reported measures by other companies.
The adjusted and underlying financial measures used in the results of operations discussion on pages 18 to 23 are: underlying revenue growth, andadjusted operating profit, underlying adjusted operating profit growth, are non-GAAP measures included on the basis that they are key financial measures used by management in assessing performance. Referencesadjusted operating margin, underlying adjusted operating margin and adjusted net profit attributable to underlyingRELX PLC and RELX NV shareholders. Underlying revenue growth rates are calculated at constant currencies,currencies. They exclude revenues from biennial and exclude the resultsother cycling shows in exhibitions, revenues from businesses acquired and disposed of all acquisitions and disposals made in both the year and prior year and revenues from assets held for sale. Underlying revenue growth rates also exclude the effects of exhibition cycling. The reconciliations of reported revenue and adjusted operating profit year-on-year are presented below:
| Revenue | Adjusted operating profit | |||||||||||||||
| £m | % change | £m | % change | |||||||||||||
Year to December 31, 2012 | 6,116 | 1,688 | ||||||||||||||
Underlying growth | 167 | +3 | % | 75 | +5 | % | ||||||||||
Exhibition cycling | (31 | ) | -1 | % | ||||||||||||
Acquisitions | 69 | +1 | % | 11 | — | |||||||||||
Disposals | (362 | ) | -6 | % | (62 | ) | -4 | % | ||||||||
Currency effects | 76 | +2 | % | 37 | +3 | % | ||||||||||
|
|
|
|
|
|
|
| |||||||||
Year to December 31, 2013 | 6,035 | -1 | % | 1,749 | +4 | % | ||||||||||
Underlying growth | 171 | +3 | % | 78 | +5 | % | ||||||||||
Exhibition cycling | 30 | +1 | % | |||||||||||||
Acquisitions | 77 | +1 | % | 11 | — | |||||||||||
Disposals | (228 | ) | -4 | % | (2 | ) | — | |||||||||
Currency effects | (312 | ) | -5 | % | (97 | ) | -6 | % | ||||||||
|
|
|
|
|
|
|
| |||||||||
Year to December 31, 2014 | 5,773 | -4 | % | 1,739 | -1 | % | ||||||||||
|
|
|
|
|
|
|
| |||||||||
In the commentary following, percentage movements are at actual exchange rates unless otherwise stated. Percentage movements at constant exchangegrowth rates are calculated usingat constant currencies. They exclude operating results from businesses acquired and disposed of in both the averageyear and hedge exchange ratesprior year, and operating results from assets held for the previous financial year. Percentage movements at both actual rates and constant rates are shown in tables on page 27. The effect of currency movements on the 2014 results is further described separately below (see “— Effect of Currency Translation” on page 37). References tosale. Adjusted operating profit relateexcludes amortisation of acquired intangible assets, acquisition related costs, and is grossed up to operating profit includingexclude the equity share of finance income, finance costs and taxes in joint ventures. Adjusted operating margin is calculated as adjusted operating profit as a percentage of reported revenue. Underlying adjusted operating margin is calculated at constant currencies and underlying growthexcludes portfolio effects. These metrics are also defined in the glossary on pagesS-1 andS-2. Adjusted net profit attributable to RELX PLC and S-2.RELX NV shareholders is reconciled to reported net profit attributable to RELX PLC and RELX NV shareholders in note 11 to the consolidated financial statements and is set forth on page 139 of the Group’s Annual Reports and Financial Statements 2017 and incorporated herein by reference to Exhibit 15.2. Reconciliations of all othernon-GAAP financial measures to the most directly comparable measure reported under IFRS are set forth in the tables below.
In the tables below and the results of operations commentary following, percentage movements are calculated using the average exchange rates for the period unless otherwise stated.
Adjusted operating profit reconciles to reported operating profit as follows:
| 2017 | 2016 | 2015 | ||||||||||
| (in millions) | ||||||||||||
Reported operating profit | £ | 1,905 | £ | 1,708 | £ | 1,497 | ||||||
Adjustments: | ||||||||||||
Amortisation of acquired intangible assets | 314 | 346 | 296 | |||||||||
Acquisition related costs | 56 | 51 | 35 | |||||||||
Reclassification of tax in joint ventures | 10 | 10 | (6 | ) | ||||||||
Reclassification of finance income in joint ventures | (1 | ) | (1 | ) | – | |||||||
|
|
|
|
|
| |||||||
Adjusted operating profit | £ | 2,284 | £ | 2,114 | £ | 1,822 | ||||||
|
|
|
|
|
| |||||||
The calculations of theyear-on-year changes in reported revenue and underlying revenue growth are presented below:
| Revenue | ||||||||
| £m | % change | |||||||
Year to December 31, 2015 | 5,971 | +3 | % | |||||
|
|
|
| |||||
Underlying revenue growth(1) | 227 | +4 | % | |||||
Exhibition cycling | 30 | 0 | % | |||||
Acquisitions | 66 | +1 | % | |||||
Disposals | (60 | ) | -1 | % | ||||
Currency effects | 661 | +11 | % | |||||
|
|
|
| |||||
Year to December 31, 2016 | 6,895 | +15 | % | |||||
|
|
|
| |||||
Underlying revenue growth(1) | 251 | +4 | % | |||||
Exhibition cycling | (52 | ) | -1 | % | ||||
Acquisitions | 60 | +1 | % | |||||
Disposals | (150 | ) | -2 | % | ||||
Currency effects | 351 | +5 | % | |||||
|
|
|
| |||||
Year to December 31, 2017 | 7,355 | +7 | % | |||||
|
|
|
| |||||
| (1) | Underlying revenue growth represents the year over year movement in reported revenue excluding the impact of the adjustments set forth in the table. |
16
The calculations of theyear-on-year changes in adjusted operating profit and underlying adjusted operating profit growth are presented below:
| Adjusted operating profit | ||||||||
| £m | % change | |||||||
Year to December 31, 2015 | 1,822 | +5 | % | |||||
|
|
|
| |||||
Underlying adjusted operating profit growth(1) | 100 | +6 | % | |||||
Acquisitions | 7 | 0 | % | |||||
Disposals | (33 | ) | -2 | % | ||||
Currency effects | 218 | +12 | % | |||||
|
|
|
| |||||
Year to December 31, 2016 | 2,114 | +16 | % | |||||
|
|
|
| |||||
Underlying adjusted operating profit growth(1) | 109 | +6 | % | |||||
Acquisitions | 7 | 0 | % | |||||
Disposals | (58 | ) | -3 | % | ||||
Currency effects | 112 | +5 | % | |||||
|
|
|
| |||||
Year to December 31, 2017 | 2,284 | +8 | % | |||||
|
|
|
| |||||
| (1) | Underlying adjusted operating profit growth represents the year over year movement in adjusted operating profit excluding the impact of the adjustments set forth in the table. |
17
Results of Operations for the Year Ended December 31, 20142017
Compared to the Year Ended December 31, 20132016
RevenueReported revenue was £5,773£7,355 million (2013: £6,035(2016: £6,895 million), down 4%up 7% (2016: 15%). The increase in reported revenue reflects good growth in electronic andface-to-face revenues, partially offset by continued print revenue declines. Underlying revenue growth was 3%. At constant currencies, revenue growth was 1%. If exhibition cycling effects had been included4% (2016: 4%) with all four market segments contributing to underlying revenue growth would have been 4%.growth.
The overall effect of disposals in 2014 was to reduce revenue growth by 4%, partially offset by a 1% contribution from acquisitions. Disposals made throughout 2014 will continue to impact reported revenue and operating profit growth rates in 2015.
The impact of currency movements was to reduce revenue by 5%, principally due to the weakening of the US dollar, on average, against sterling during 2014.
TotalReported operating costs, including the amortisationwhich comprises of acquired intangible assets and acquisition related costs, decreased by 6%, principally reflecting business disposals and currency effects, partly offset by an increase in underlying costs. Actions were taken across our businesses to improve cost efficiency. At constant currencies, total operating costs decreased by 1%.
Underlying operating costs, excluding acquisitions and disposals, were up 3%, reflecting investment in global technology platforms and the launch of new products and services, partly offset by continued process innovation.
Cost of sales were £2,006 million, down 5% compared with 2013, in line with the overall decrease in revenue. Selling and distribution costs were £934 million, down 7%, while administration and other expenses were £1,467 million, down 6%, both principally reflecting the impact of business disposals and currency effects. Except as noted, changes in cost of sales, selling and distribution costs, and administration and other expenses, including changeswas £5,487 million (2016: £5,224 million), up 5% (2016: 15%). Cost of sales were £2,631 million (2016: £2,488 million), up 6% (2016: 17%) compared to 2016, slightly lower than the overall increase in individual components thereof,revenue. Selling and distribution costs were not material to the£1,163 million (2016: £1,109 million), up 5% (2016: 15%) and administration and other expenses were £1,693 million (2016: £1,627 million), up 4% (2016: up 13%).
Reported operating profit, performancewhich includes amortisation of acquired intangible assets and acquisition related costs, was £1,905 million (2016: £1,708 million), an increase of 12% (2016: 14%).
Adjusted operating profit was £2,284 million (2016: £2,114 million), up 8% (2016: 16%), reflecting the individual segments.benefit of tight cost control across the Group.
The reported operating margin was 25.9% (2016: 24.8%). The overall adjusted operating margin of 31.1% was 0.4 percentage points higher than in the prior year. On an underlying basis, including cycling effects, the margin improved by 0.7 percentage points. Acquisitions and disposals reduced the margin by 0.4 percentage points and currency effects increased the margin by 0.1 percentage points.
Depreciation and amortisation of internally generated intangible assets increased to £272 million (2016: £257 million).
The amortisation charge in respect of acquired intangible assets, including the share of amortisation in joint ventures, decreased to £286£314 million (2013: £318(2016: £346 million), primarily reflecting certain assets becoming fully amortised, partially offset by currency effects and currency effects.acquisitions. Acquisition related costs were £30£56 million (2013: £43 million), including a charge for deferred consideration payments required to be expensed under IFRS.
Total operating costs, excluding the amortisation of acquired intangible assets and acquisition related costs, decreased by 6%, principally reflecting business disposals and currency effects. Depreciation and amortisation of internally generated intangible assets decreased to £237 million (2013: £249(2016: £51 million).
TheReported net pension expense, excludingfinance costs of £182 million (2016: £195 million) includes the net pension financing charge was £95 million (2013: £61 million), including settlement and past service credits of £15 million (2013: £59(2016: £14 million), and excludes finance income in joint ventures of £1 million (2016: £1 million). The decrease primarily reflects a lower average interest rate on borrowings, partly offset by currency translation effects.
Reported operating profitgain on disposals and othernon-operating items was £1,402 million (2013: £1,376 million).
Total adjusted operating profit was £1,739 million (2013: £1,749 million), down 1%. Underlying adjusted operating profit grew 5%. Acquisitions and disposals had minimal net impact on adjusted operating profit. Currency effects reduced adjusted operating profit by 6%.
The overall adjusted operating margin of 30.1% was 1.1 percentage points higher than in the prior year. This included a 0.9 percentage point benefit to margin from portfolio change and a 0.1 percentage point decrease from currency effects.
Net pre-tax disposal losses were £11 million (2013: £16(2016: £40 million gain),loss) arising largely from the sale of certain Risk & Business Information assets.Analytics businesses and revaluation of investments held. These lossesgains were increasedoffset by a relatedan associated tax chargecredit of £3£16 million (2013:(2016: £34 million charge)tax credit).
Net finance costs were lower at £162 million (2013: £196 million), including the pension financing charge of £15 million (2013: £19 million). The reduction primarily reflects the benefit of term debt refinancing at lower rates and currency translation effects.
ProfitReported profit before tax was £1,229£1,734 million (2013: £1,196(2016: £1,473 million). The reported tax charge was £269 million (2013: £81 million)£67m (2016: £304m). In 2013, this includedThe decrease in the tax charge is due to the US Tax Cuts and Jobs Act, which includes a reduction in the federal corporate tax rate from 35% to 21% from January 2018. Consequently, the Group has measured its US deferred tax assets and liabilities at the end of the reporting period at a combined tax rate (including state taxes) of 26%. This resulted in the recognition of an exceptional tax credit of £221 million arising on£346m in the alignment of certain business assets with their global management structure. income statement.
The reported net profit attributable to RELX PLC and RELX NV shareholders of £1,659 million (2016: £1,161 million) was up 43% (2016: 15%). The adjusted net profit attributable to RELX PLC and RELX NV shareholders of £1,635 million (2016: £1,488 million) was up 10% (2016: 17%).
The reported earnings per share for RELX PLC was 82.2p (2016: 56.3p) and for RELX NV was €0.936 (2016: €0.687). The high growth in the parent companies’year reflects the impact of the exceptional tax credit recognised as a result of the US Tax Cuts and Jobs Act.
Adjusted earnings per share were up 12% at 81.0p (2016: 72.2p) when expressed in sterling and 5% at €0.923 (2016: €0.880) when expressed in Euros. At constant currencies, adjusted earnings per share increased by 7%.
Until the end of 2015 the equalisation of dividends between RELX PLC and RELX NV took into account the prevailing tax credit that was available to certain UK tax payers at that time. The tax credit was also taken into account in the determination of reported earnings per share. The UK dividend tax credits were abolished with effect from April 6, 2016, impacting dividends paid after this date. As a result of the abolition of this tax credit, from 2016 reported earnings per share have the same value for each RELX PLC and RELX NV share.
Ordinary dividends paid to shareholders was £955in the year, being the 2016 final and 2017 interim dividends, amounted to £762 million (2013: £1,110(2016: £683 million).
The final dividends proposed by the respective Boards are 27.7p per share for RELX PLC and €0.316 per share for RELX NV, 8% and 5% higher respectively compared with the prior year final dividends. This gives total dividends for the year of 39.4p (2016: 35.95p) and €0.448 (2016: €0.423). The difference in growth rates in the final dividends reflects changes in the euro:sterling exchange rate since the prior year final dividend announcement date.
18
During 2017, a total of 44.5 million RELX PLC and RELX NV shares were repurchased. Total consideration for these repurchases was £700 million. A further 1.2 million RELX PLC shares and 1.3 million RELX NV shares were purchased by the Employee Benefit Trust. During 2017, 22.5 million RELX PLC and 22 million RELX NV shares held in treasury were cancelled. As at 31 December 2017, total shares in issue for RELX Group, net of shares held in treasury and shares held by the Employee Benefit Trust, amounted to 2,004 million; represented by 1,060 million RELX PLC shares and 944 million RELX NV shares. A further 3.3 million RELX PLC shares and 2.9 million RELX NV shares have been repurchased in 2018 as at February 14, 2018.
Scientific, Technical & MedicalMedical: 2017 financial performance
| Revenue % change* | Adjusted operating profit % change* | |||||||
Underlying growth | +2 | % | +3 | % | ||||
Acquisitions/disposals | –1 | % | –2 | % | ||||
Currency effects | –5 | % | –4 | % | ||||
|
|
|
| |||||
Total growth | –4 | % | –3 | % | ||||
|
|
|
| |||||
| 2017 £m | 2016 £m | Underlying growth | Acquisitions/ disposals | Currency effects | Total growth | |||||||||||||||||||
Revenue | 2,478 | 2,320 | +2 | % | 0 | % | +5 | % | +7 | % | ||||||||||||||
Adjusted operating profit | 913 | 853 | +3 | % | -1 | % | +5 | % | +7 | % | ||||||||||||||
Key business trends wereremained positive for the yearin 2017, with underlying profit growth slightly exceeding underlying revenue growth in research subscriptions. Electronic revenues, which now account for 74% of the total, continued to grow across all segments.growth.
Revenue was £2,048 million (2013: £2,126 million), down 4%. Underlying revenue growth was2%was +2%. Reported revenue growth was +7%. The difference between the reported and underlying growth rates primarily reflects the impact of exchange rate movements and portfolio changes, including the acquisition of Plum Analytics and bepress, and the disposal of certain international pharma promotion assets.
Underlying adjusted operating profit growth of +3% was slightly ahead of revenue growth, with a small underlying margin improvement offset by exchange rate movements and portfolio effects. Adjusted operating profit growth was +7%.
Electronic revenues saw continued good growth, partially offset by further print declines. In primary research article submissions to subscription journals and usagewe continued to grow in double digits,enhance customer value by providing broader content sets across our research offering, increasing the sophistication of our analytics, and journal quality, as measured by relative impact factor, was maintained. Subscription revenue growth was driven by increased volume and new sales.
The volume of “author-pays” or “author’s-funder-pays” articlesevolving our technology platforms. Databases & tools continued to grow from a small base. We continued todrive growth across market segments through the launch new journals,of enhanced functionality and content development.
Print books, which now operate over 100 stand-alone author pays open access journals alongside our sponsored article option in over 1,600 subscription journals.
Werepresent around 10% of divisional revenues, saw continued growthsales declines with return rates at historical levels, following higher than average return rates in databases and tools, as well asthe prior year. The decline in electronic reference and education.
Print book andprint pharma promotion revenues, continuedwhich represent less than 5% of the divisional total, returned to decline, albeit at a slightly lower rate thanhistorical trends having been stable in the prior year.
The impact of currency movements was to reduce revenue by5%. The overall effect of portfolio changes was to reduce revenue by 1%.
Total operating costs, including acquired intangible asset amortisation and acquisition related costs, decreased by5% to £1,364 million, largely reflecting currency movements. Amortisation of acquired intangible assets decreased to £79 million (2013: £86 million). Depreciation and amortisation of internally generated intangible assets decreased to £94 million (2013: £100 million).
Underlying operating costs, excluding acquired intangible asset amortisation and acquisition related costs, grew by 1%.
Adjusted operating profit was £762 million (2013: £787 million),down 3%. Underlying adjusted operating profit grew3%. The effect of portfolio changes was to reduce adjusted operating profit by2%. The impact of currency movements was to reduce adjusted operating profit by4%.
The adjusted operating margin increased by0.2 percentage points, which included a0.2 percentage point benefit from currency effects.
Risk & Business InformationAnalytics: 2017 financial performance
| Revenue % change | Adjusted operating profit % change | |||||||
Underlying growth | +6 | % | +6 | % | ||||
Acquisitions/disposals | –4 | % | –1 | % | ||||
Currency effects | –5 | % | –5 | % | ||||
|
|
|
| |||||
Total growth | –3 | % | 0 | % | ||||
|
|
|
| |||||
| 2017 £m | 2016 £m | Underlying growth | Acquisitions/ disposals | Currency effects | Total growth | |||||||||||||||||||
Revenue | 2,076 | 1,906 | +8 | % | -4 | % | +5 | % | +9 | % | ||||||||||||||
Adjusted operating profit | 759 | 686 | +8 | % | -2 | % | +5 | % | +11 | % | ||||||||||||||
Underlying revenue growth remained strong across all key segments in 2017. Underlying profit growth broadly matched underlying revenue growth.
Underlying revenue growth was driven by volume+8%. Reported revenue growth new product roll-outswas +9%. The difference between the reported and expansionunderlying growth rates primarily reflects the impact of exchange rate movements and portfolio changes including the disposal of New Scientist and other magazines, and the sale of our majority stake in adjacent segments. a property title services joint venture to our partner.
Underlying adjusted operating profit growth broadly matched underlying revenue growth reflecting ongoingas we continued to pursue our organic investment initiatives.development strategy. The margin improvement reflects a positive effect from portfolio changes. Adjusted operating profit growth was +11%.
Revenue was £1,439 million (2013: £1,480 million),down 3%. Underlying revenueIn Insurance we continued to drive growth was6%.through enhanced analytics, the extension of datasets, and by further expansion in adjacent verticals. The US market environment returned to historical trends in the fourth quarter, having been not quite as favourable earlier in the year. The international initiatives continued to progress well.
In Business Services, further development of analytics that help our customers to detect and prevent fraud and to manage risk across the financial and corporate sectors continued to drive growth, in a positive US and international market environment.
Growth in the insurance segmentgovernment and healthcare segments was driven by demand for the US auto underwriting business, take upcontinued development of new productssophisticated analytics, and services across the insurance workflow, and expansion in adjacent market verticals. The businessesother Data Services continued to expand internationally,drive growth through organic development.
19
Legal: 2017 financial performance
| 2017 £m | 2016 £m | Underlying growth | Acquisitions/ disposals | Currency effects | Total growth | |||||||||||||||||||
Revenue | 1,692 | 1,622 | +2 | % | -3 | % | +5 | % | +4 | % | ||||||||||||||
Adjusted operating profit | 332 | 311 | +11 | % | -10 | % | +6 | % | +7 | % | ||||||||||||||
Underlying revenue growth in 2017 was in line with 5% ofthe prior year, with continued efficiency gains driving strong underlying operating profit growth.
Underlying revenue outside of the US and Europe.
In Business Services, growth was driven by demand for identity authentication and fraud detection solutions, particularly in the financial services sector.
In Government, the state & local segment continued to grow. Federal government revenue trends improved during the year.
Major Data Services maintained underlying+2%. Reported revenue growth driven by Accuity, XpertHR,was +4%. The difference between the reported and ICIS, and other magazines & services were stable.
Theunderlying growth rates reflects the impact of currencyexchange rate movements was to reduce revenue by 5%.
In 2014 we continued to support organic growth throughand portfolio changes including the acquisition of data and analytics assets. In 2014 we completed the acquisition of Innovata, a provider of airline schedule data, Tracesmart, a provider of UK public records, Wunelli, a provider of telematics solutions for the auto industry, FircoSoft, a provider of anti-money laundering solutions for the financial services industry, and Health Market Science, supplier of data on health care professionals.
We also exited assets that no longer fit our strategy, includingRavel Law, the disposal of several magazinessmall print and services assets, and the spin-off of certain construction industry assets. The overall effect of portfolio changes was to reduce revenue by 4%.final exit from the Martindale Hubbell joint venture.
Total operating costs, including acquired intangible asset amortisation and acquisition related costs, decreased by4% to £1,062 million principally reflecting currency effects and the impact of disposals. The amortisation charge in respect of acquired intangible assets decreased to £116 million (2013: £128 million), reflecting certain assets becoming fully amortised and currency effects.
Underlying operating costs, excluding acquired intangible asset amortisation and acquisition related costs, grew6%, reflecting continued investment in new product development.
Adjusted operating profit was £506 million (2013: £507 million),flat on prior year. Underlying adjusted operating profit grew6%growth was +11%. Adjusted operating profit growth was +7%. The effect of portfolio changes was to reduce adjustedincrease in operating profit by1%. The impactmargin reflects ongoing organic process improvement and decommissioning of systems which, together with currency movements, was to reduce adjusted operating bymore than offset a lower profit by5%.contribution from joint ventures and other portfolio effects.
The adjusted operating margin increased by 0.9 percentage points, principally driven by portfolio changes.
Legal
| Revenue % change | Adjusted operating profit % change | |||||||
Underlying growth | +1 | % | +6 | % | ||||
Acquisitions/disposals | –7 | % | +4 | % | ||||
Currency effects | –5 | % | –6 | % | ||||
|
|
|
| |||||
Total growth | –11 | % | +4 | % | ||||
|
|
|
| |||||
Underlying revenue trends remained unchanged in 2014, with subdued market conditions in the US and Europe limiting overall revenue growth. The improvement in profitability reflects a combination of process innovation, infrastructure decommissioning, and portfolio reshaping.
Revenue was£1,396 million (2013: £1,567 million), down11%. Underlying revenue growth was1%. US and European markets remained stable but subdued. In other international markets we continued to see growth, with 11% of revenues outside of the US and Europe.
Portfolio changes reduced revenue by7%. The impact of currency movements was to reduce revenue by5%. Electronic revenues which now account for 77% of the total, saw continued growth, partially offset by print declines.
The roll outroll-out of new platform releases across our US and international markets continued, in 2014,with broader datasets and adoptionthe continued expansion of early stage legal analytics. The usage migration of US legal customers onto Lexis Advance is now substantially complete.
US and usage rates for new products and solutions haveEuropean markets remained stable. Other international markets continued to progressgrow well.
TotalExhibitions: 2017 financial performance
| 2017 £m | 2016 £m | Underlying growth | Acquisitions/ disposals | Currency effects | Total growth | |||||||||||||||||||
Revenue | 1,109 | 1,047 | +6 | % | +1 | % | +5 | % | +6 | % | ||||||||||||||
Adjusted operating profit | 285 | 269 | +2 | % | -1 | % | +5 | % | +6 | % | ||||||||||||||
Exhibitions achieved strong underlying revenue growth in 2017, slightly ahead of the prior year, with underlying operating costs, including acquired intangible asset amortisationprofit growth reflectingcycling-out effects.
Underlying revenue growth was +6%. After portfolio changes and acquisition related costs, decreased by14% to £1,223 million principally reflectingsix percentage points ofcycling-out effects, constant currency effectsrevenue growth was +1%. Reported revenue growth was +6%. The difference between the reported and constant currency growth rates reflects the impact of disposals. The amortisation charge in respectexchange rate movements and portfolio changes, including the acquisition of acquired intangible assets amounted to £57 million (2013: £64 million). Acquisition related costs reduced to £17 million (2013: £22 million) includingMCM Comic Con (UK), Cafe Seoul (South Korea) and Fitness (Australia), and the disposal of a charge for deferred consideration required to be expensed under IFRS. Depreciation and amortisationnumber of internally generated intangible assets decreased to £94 million (2013: £101 million).small events.
Underlying operating costs, excluding acquired intangible asset amortisation and acquisition related costs, were flat year on year.
Adjusted operating profit was £260 million (2013: £250 million), up4%. Underlying adjusted operating profit grew6%. The effect of portfolio changesgrowth was to increase adjusted operating profit by4%. The impact of currency movements was to reduce adjusted operating profit by6%.
Organic process innovation, infrastructure decommissioning and portfolio changes contributed to a2.6 percentage point improvement in the adjusted operating profit margin during 2014.
+2% reflectingExhibitionscycling-out
| Revenue % change | Adjusted operating profit % change | |||||||
Underlying growth (excluding cycling) | +7 | % | ||||||
Cycling effects | +2 | % | ||||||
|
|
|
| |||||
Underlying growth (adjusted for cycling) | +9 | % | +9 | % | ||||
Acquisitions/disposals | +2 | % | +3 | % | ||||
Currency effects | -8 | % | -9 | % | ||||
|
|
|
| |||||
Total growth | +3 | % | +3 | % | ||||
|
|
|
| |||||
Exhibitions achieved another year of underlying revenue and adjusted effects. Adjusted operating profit growth andwas +6%.
We continued to actively pursue organic growth opportunities, throughlaunching 36 new launchesevents, and small acquisitions.piloting several data analytics opportunities.
Revenue was £890 million (2013: £862 million), up3%. Underlying revenueOverall growth was7%. Had the effects of cycling been included, underlying revenue growth would have been two percentage points higher.
Portfolio changes increased revenue by 2%. Currency movements reduced revenue by8%.
The USremained good in Europe and Japan achieved underlying revenue growth. In the US, growth reflected demand across our broad portfolio of leading events. Strong growthstrong in Japan was driven by new launches and demand across our major events.
Europe saw modest growth overall. Domestic markets remained subdued, but international events in the UK and France achieved growth.
ChinaChina. The US continued to see strongdifferentiated growth in certain sectors, and moderate growth elsewhere.rates by industry sector. Revenues in Brazil reflected growth in somecontinued to reflect the general weakness of our leading events, but a slowdown in the wider economy. Most other markets continued to grow.grow strongly.
In 2014 we launched 36 new events and completed several small acquisitions and joint venture investments, primarily in high growth geographies and sectors. In total, 37% of revenues were outside of the US and Europe.
Total operating costs, including acquired intangible asset amortisation and acquisition related costs, were £716 million, up2%. The amortisation charge in respect of acquired intangible assets fell to £34 million (2013: £40 million).
Underlying operating costs, excluding acquired intangible asset amortisation and acquisition related costs, grew 6%, slightly below revenue, reflecting the increase in activity.
Adjusted operating profit was £217 million (2013: £210 million), up3%. Underlying adjusted operating profit grew9%. The effect of portfolio changes was to increase adjusted operating profit by 3%. The impact of currency movements was to reduce adjusted operating profit by9%.
The adjusted operating margin was flat year on year.
Results of Operations for the Year Ended December 31, 20132016
Compared to the Year Ended December 31, 20122015
In 2012 and 2013, Risk Solutions and Business Information operated as separate business areas. Accordingly, financial information has been presented separately.
In 2014, following a review of activities, assets and costs across the business, we introduced a new method for the allocation of corporate and shared costs from January 1, 2014. Previously unallocated items and costs relating to shared activities and resources have been attributed to the business segments on the basis of usage and benefits derived. This new allocation reflects an increased level of shared resources and capitalised costs. Adjusted operating profit and operating profit figures for 2013 and 2012 have been restated as if this allocation method had been used in the prior years.
RevenueReported revenue was £6,035£6,895 million (2012: £6,116(2015: £5,971 million), down 1%up 15% (2015: 3%). The increase in reported revenue reflects good growth in electronic and face to face revenues plus the impact of currency effects, partially offset by continued print revenue declines. Underlying revenue growth was 4% (2015: 3%. Had the effects of exhibition cycling been included,) with all four market segments contributing to underlying revenue growth would have been 2%.growth.
The overall effect of disposals in 2013 was to reduce revenue by 6%, partially offset by a 1% increase from acquisitions. There have been disposals in each of our businesses, but the effect is most significant in Risk Solutions, where we sold the pre-employment screening business, in Business Information where we made a number of disposals, and in Legal where Martindale-Hubbell, the US lawyer directory business, was spun out into a joint venture. Disposals made throughout 2013 will continue to impact reported revenue and operating profit growth rates in 2014.
The impact of currency movements was to increase revenue by 2%, principally due to the strengthening of the US dollar, on average, against sterling during 2013.
TotalReported operating costs, including the amortisationwhich comprises of acquired intangible assets and acquisition related costs, decreased by 2%, principally reflecting business disposals.
Cost of sales were £2,118 million, down 1% compared with 2012, in line with the overall decrease in revenue. Selling and distribution costs were £1,005 million, also down 1%. Administration and other expenses were £1,565 million, down 5%, principally reflecting the impact of business disposals. Except as noted, changes in cost of sales, selling and distribution costs, and administration and other expenses, including changeswas £5,224 million (2015: £4,538 million), up 15% (2015: 3%), principally reflecting the impact of exchange rates, plus increased staff costs and costs associated with the launch of new platforms and services. Cost of sales were £2,488 million (2015: £2,129 million), up 17% (2015: 6%) compared to 2015, slightly higher than the overall increase in individual components thereof,revenue. Selling and distribution costs were not material to the£1,109 million (2015: £965 million), up 15% (2015: 3%) and administration and other expenses were £1,627 million (2015: £1,444 million), up 13% (2015: down 2%).
20
Reported operating profit, performancewhich includes amortisation of acquired intangible assets and acquisition related costs, was £1,708 million (2015: £1,497 million), an increase of 14% (2015: 7%).
Adjusted operating profit was £2,114 million (2015: £1,822 million), up 16% (2015: 5%), reflecting the individual segments.benefit of tight cost control across the Group and currency exchange movements.
The reported operating margin was 24.8% (2015: 25.1%). The adjusted operating margin of 30.7% (2015: 30.5%) was 0.2 (2015: 0.4) percentage points higher than in the prior year. Underlying adjusted operating margin growth improved by 0.4 percentage points (2015: 0.9), currency effects increased the margin by 0.3 percentage points (2015:-0.5) and portfolio effects reduced the margin by 0.5 percentage points (2015: no impact).
Depreciation and amortisation of internally generated intangible assets increased to £257 million (2015: £228 million).
The amortisation charge in respect of acquired intangible assets, including the share of amortisation in joint ventures, was £318increased to £346 million (2012: £329(2015: £296 million)., primarily reflecting currency effects and acquisitions, partially offset by certain assets becoming fully amortised. Acquisition related costs were £43£51 million (2012: £21(2015: £35 million), including a charge for deferred consideration payments required to be expensed under IFRS..
Total operatingReported net finance costs excluding the amortisation of acquired intangible assets and acquisition related costs, decreased by 3%, reflecting business disposals.
Depreciation and amortisation of internally generated intangible assets increased to £249£195 million (2012: £227(2015: £174 million), while actions were taken across our businesses, especially Legal, to improve cost efficiency.
The net pension expense, excluding includes the net pension financing charge was £61of £14 million (2012: £89(2015: £21 million), including settlement and past service creditsexcludes finance income in joint ventures of £59£1 million (2012: £20 million), mainly arising from benefits changes(2015: nil). The increase in the US, which will reduce futurenet finance costs for our US businesses.
Underlying operating costs, excluding acquisitionsprimarily reflects higher net borrowings and disposals, were up 2%, reflecting investment in global technology platforms and launching of new products and services, partly offset by continued process improvements.currency translation effects.
Reported operating profitloss on disposals and othernon-operating items was £1,376£40 million (2012: £1,333(2015: £11 million).
Total adjusted operating profit was £1,749 million (2012: £1,688 million), up 4%. Underlying adjusted operating profit grew 5%. The impact of disposals was to reduce adjusted operating profit by 4%. Currency effects increased adjusted operating profit by 3%.
The overall adjusted operating margin of 29.0% was 1.4 percentage points higher than in the prior year. This included a 0.5 percentage point benefit to margin arising largely from portfolio change and a 0.3 percentage point benefit from currency effects.
Net pre-tax disposal gains were £16 million (2012: £45 million), arising from a gain on the sale of certain Risk Solutions’ pre-employment screening business, offset by a net loss on other disposals.& Business Analytics businesses and revaluation of investments held. These losses were offset by a relatedan associated tax chargecredit of £34 million (2012: £58(2015: £13 million).
Reported profit before tax was £1,473 million credit).
Net finance costs were lower at £196 million (2012: £227 million), including the pension financing charge of £19 million (2012: £11(2015: £1,312 million). The reduction primarily reflects the benefit of term debt refinancing at lower rates.
Profit before tax was £1,196 million (2012: £1,151 million). Thereported tax charge was £81£304 million (2012: £102(2015: £298 million). This included a deferred tax credit of £221 million arising on the alignment of certain business assets with their global management
structure. The reported net profit attributable to the parent companies’RELX PLC and RELX NV shareholders of £1,161 million (2015: £1,008 million) was £1,110up 15% (2015: 6%). The adjusted net profit attributable to RELX PLC and RELX NV shareholders of £1,488 million (2012: £1,044 million)(2015: £1,275m) was up 17% (2015: 5%).
The reported earnings per share for RELX PLC was up 21% at 56.3p (2015: 46.4p) and for RELX NV was up 1% at €0.687 (2015: €0.682). In sterling terms RELX NV’s reported EPS increased by 14%. The difference reflects the impact of the UK tax credit abolition as explained below.
Adjusted earnings per share were up 19% at 72.2p (2015: 60.5p) when expressed in sterling and 5% at €0.880 (2015: €0.835) when expressed in Euros. At constant currencies, adjusted earnings per share increased by 8%.
Until the end of 2015 the equalisation of dividends between RELX PLC and RELX NV took into account the prevailing tax credit that was available to certain UK tax payers at that time. The tax credit was also taken into account in the determination of reported earnings per share. The UK dividend tax credits were abolished with effect from April 6, 2016, impacting dividends paid after this date. As a result of the abolition of this tax credit, from 2016 reported earnings per share have the same value for each RELX PLC and RELX NV share.
Ordinary dividends paid in the year, in amounts per ordinary share, comprise: a 2015 final dividend of 22.30p and 2016 interim dividend of 10.25p giving a total of 32.55p (2015: 26.4p) for RELX PLC; and a 2015 final dividend of €0.288 and 2016 interim dividend of €0.122 giving a total of €0.410 (2015: €0.400) for RELX NV.
The final dividends proposed by the respective Boards are 25.70p per share for RELX PLC and €0.301 per share for RELX NV, 15% and 5% higher respectively compared with the prior year final dividends. This gives total dividends for the year of 35.95p (2015: 29.70p) and €0.423 (2015: €0.403). The difference in growth rates in the final dividends, and in the earlier interim dividends, reflects changes in the euro:sterling exchange rate since the respective prior year dividend announcement dates.
During 2016, 29.2 million RELX PLC and 26.1 million RELX NV shares were repurchased. Total consideration for these repurchases was £700 million. A further 1.2 million RELX PLC shares and 1.1 million RELX NV shares were purchased by the Employee Benefit Trust. During December 2016, 33.7 million RELX PLC and 30.0 million RELX NV shares held in treasury were cancelled. As at December 31, 2016, total shares in issue for RELX Group, net of shares held in treasury and shares held by the Employee Benefit Trust, amounted to 2,043 million. A further 3.7 million RELX PLC shares and 3.3m million RELX NV shares have been repurchased in 2017 as at February 22, 2017.
Scientific, Technical & MedicalMedical: 2016 financial performance
| Revenue* % change | Adjusted* operating profit % change | |||||||
Underlying growth | +2 | % | +3 | % | ||||
Acquisitions/disposals | -1 | % | -1 | % | ||||
Currency effects | +2 | % | +4 | % | ||||
|
|
|
| |||||
Total growth | +3 | % | +6 | % | ||||
|
|
|
| |||||
| 2016 £m | 2015 £m | Underlying growth | Acquisitions/ disposals | Currency effects | Total growth | |||||||||||||||||||
Revenue | 2,320 | 2,070 | +2 | % | 0 | % | +10 | % | +12 | % | ||||||||||||||
Adjusted operating profit | 853 | 760 | +3 | % | -1 | % | +10 | % | +12 | % | ||||||||||||||
21
Key business trends remained positive in 2016, with underlying adjusted operating profit growth slightly exceeding underlying revenue growth.
Underlying revenue growth was +2%. Reported revenue growth was +12%. The Scientific, Technical & Medical business achieved volumedifference between the reported and underlying growth rates primarily reflects the impact of exchange rate movements.
Underlying adjusted operating profit growth of +3% was slightly ahead of underlying revenue growth, resulting in a small underlying margin improvement which was partly offset by exchange rate movements. Adjusted operating profit growth was +12%.
In primary research, strong growth in primary researchusage and article submissions and usage, andcontinued. In 2016 we launched 64 new journals.
Good growth continued in databases & tools, across the scientific, technical & medical segments. Electronic revenue,as well as in electronic reference products.
Print books, which now accounts for 72%represent around 10% of the total, grewdivisional revenues, saw steeper second half declines than in recent years, reflecting market conditions. Print pharma promotion revenues were stable.
Risk & Business Analytics: 2016 financial performance
| 2016 £m | 2015 £m | Underlying growth | Acquisitions/ disposals | Currency effects | Total growth | |||||||||||||||||||
Revenue | 1,906 | 1,601 | +9 | % | -1 | % | +11 | % | +19 | % | ||||||||||||||
Adjusted operating profit | 686 | 575 | +9 | % | -1 | % | +11 | % | +19 | % | ||||||||||||||
Underlying revenue growth improved in 2016, with strong growth across all segments. Print book saleskey segments in both subscription and pharma promotion continued to decline.transactional revenues. Underlying adjusted operating profit growth broadly matched underlying revenue growth.
Revenue was £2,126 million (2012: £2,063 million), up 3%. Underlying revenue growth was 2%+9%.
In primary research, growth in article submissions and usage remained strong across the scientific, technical and medical segments, and journal quality, as measured by Impact Factor, continued to improve. Revenue Reported revenue growth was driven by solid subscription renewals+19%. The difference between the reported and new sales. “Author-pays” or “author’s-funder-pays” article volumes continued to grow from a small base. Goodunderlying growth in scientific databases & tools and electronic clinical solutions was also supported by new sales.
Print book sales and pharma promotion continued to decline reflecting a combinationrates reflects the impact of format migration and structural changes in the pharmaceutical industry.
Portfolio development continued in 2013. Disposals included Elsevier Business Intelligenceexchange rate movements and a number of small print and pharma focused assets. We supported our organic growth strategy with small targeted acquisitions, including Mendeley, an online reference management and collaboration solution. The overallminor effect offrom portfolio changes was to reduce revenue by 1%.changes.
The impact of currency movements was to increase revenue by 2%.
Total operating costs, including acquired intangible asset amortisation and acquisition related costs, increased by 2% to £1,433 million. Amortisation of acquired intangible assets increased to £86 million (2012: £78 million). Depreciation and amortisation of internally generated intangible assets increased to £100 million (2012: £87 million).
Underlying operating costs, excluding acquired intangible asset amortisation and acquisition related costs, grew by 1%.
Adjusted operating profit was £787 million (2012: £743 million), up 6%. Underlying adjusted operating profit grew 3%. The effect of portfolio changes was to reduce adjusted operating profit by 1%. The impact of currency movements was to increase adjusted operating profit by 4%.
The adjusted operating margin increased by 1.0 percentage points, which included a 0.6 percentage point benefit from currency effects.
Risk Solutions
| Revenue % change | Adjusted operating profit % change | |||||||
Underlying growth | +8 | % | +8 | % | ||||
Acquisitions/disposals | -9 | % | -4 | % | ||||
Currency effects | +2 | % | +2 | % | ||||
|
|
|
| |||||
Total growth | +1 | % | +6 | % | ||||
|
|
|
| |||||
All business segments achieved growth in 2013. The improvement in adjusted operating margin largely reflects the impact of portfolio changes, as underlying operating cost growth was in line withbroadly matched underlying revenue growth reflectingas we continued to develop new product development.
Revenue was £933 million (2012: £926 million), up 1%. Underlying revenueproducts and services. Adjusted operating profit growth was 8%+19%.
The 2013 results reflect the impact of portfolio changes, including the disposal of the pre-employment screening business, and some small acquisitions. Taken together, these portfolio changes had the effect of reducing revenue by 9%.
The impact of currency movements was to increase revenue by 2%.
Revenue growth in the insurance segment wascontinued to see strong growth, driven by goodvolume growth and strong take up of new products and services across the insurance workflow, and by expansion intoin adjacent market verticals including life and volumehome insurance. The international initiatives continued to progress well, with strong growth in the core underwriting business. The expansion into international markets is progressing well, although the absolute revenue contribution remains small relative to Risk Solutions overall.UK, and early stage developments in China and India.
In Business Services, growth reflected strongwas driven by demand for identity authentication and fraud detection solutions across markets. the financial services and corporate sectors.
The US mortgage refinancing market did slow downgovernment and healthcare segments continued to develop strongly. Major Data Services saw strong underlying revenue growth, and other brands & services remained stable.
Legal: 2016 financial performance
| 2016 £m | 2015 £m | Underlying growth | Acquisitions/ disposals | Currency effects | Total growth | |||||||||||||||||||
Revenue | 1,622 | 1,443 | +2 | % | 0 | % | +10 | % | +12 | % | ||||||||||||||
Adjusted operating profit | 311 | 274 | +12 | % | -10 | % | 12 | % | +14 | % | ||||||||||||||
Underlying revenue growth improved slightly in 2016, with continued efficiency gains driving strong underlying adjusted operating profit growth.
Underlying revenue growth was +2%. Reported revenue growth was +12%. The difference between the second half as expected, butreported and underlying growth rates reflects the impact of this was largely offset by continued good growth elsewhere.exchange rate movements and minor portfolio changes.
New product sales drove strong growth in government revenue for the year, somewhat tempered by a slowdown in federal markets in the fourth quarter.
Total operating costs, including acquired intangible asset amortisation and acquisition related costs, decreased by 4% to £634 million. The amortisation charge in respect of acquired intangible assets decreased to £97 million (2012: £109 million), reflecting business disposals.
Underlying operating costs, excluding acquired intangible asset amortisation and acquisition related costs, grew 8% reflecting continued investment in new product development.
Adjusted operating profit was £401 million (2012: £380 million), up 6%. Underlying adjusted operating profit grew 8%. The effect of portfolio changes was to reduce adjusted operating profit by 4%. The impact of currency movements was to increase adjusted operating by profit by 2%.
The adjusted operating margin increased by 2.1 percentage points, principally driven by portfolio changes.
Business Information
| Revenue % change | Adjusted operating profit % change | |||||||
Underlying growth | +4 | % | +14 | % | ||||
Acquisitions/disposals | -23 | % | -25 | % | ||||
Currency effects | +2 | % | +1 | % | ||||
|
|
|
| |||||
Total growth | -17 | % | -10 | % | ||||
|
|
|
| |||||
Underlying revenue growth accelerated in 2013 reflecting continued good growth in data services and modest growth elsewhere. Focus on process innovation drove a further improvement in adjusted operating profit margin.
Revenue was £547 million (2012: £663 million), down 17%. Underlying revenue growth was 4%+12%.
Major Data Services, which now accounts for over 50% of continuing portfolio revenue, achieved strong growth in 2013 driven by Accuity, ICIS and XpertHR.
Leading Brands and Other Business Magazines & Services achieved modest growth, despite weak print advertising markets, with solid results from data solutions and the agricultural segments.
In 2013 we continued to exit from businesses that no longer fit our strategy, with disposals during the period including RBI Australia, Italy, and France. Since the beginning of 2014 we have also divested BuyerZone in the Marketing Solutions segment. Portfolio changes reduced revenue by 23%.
The impact of currency movements was to increase revenue by 2%.
Since bringing the management structure of Reed Business Information and Risk Solutions more closely together at the end of 2012 we have made good initial progress on leveraging Risk Solutions’ strength in data, analytics and technology across Reed Business Information’s broader geographic footprint.
Total operating costs, including acquired intangible asset amortisation and acquisition related costs, decreased by 19% to £477 million. This included a £36 million reduction in cost of sales, a £36 million reduction in selling and distribution costs
and a £38 million reduction in administration and other expenses, each reflecting business disposals. The amortisation charge in respect of acquired intangible assets decreased to £31 million (2012: £37 million).
Underlying operating costs, excluding acquired intangible asset amortisation and acquisition related costs, grew by 1%.
Adjusted operating profit growth was £106 million (2012: £118 million), down 10%. Underlying adjusted operating profit grew 14%+13%. The effectmargin increase reflects organic process improvement and the ongoing decommissioning of systems, largely offset by lower profits from joint ventures and other portfolio changes was to reduce adjusted operating profit by 25%. The impact of currency movements was to increase adjusted operating profit by 1%.effects.
The adjusted operating margin increased by 1.5 percentage points, the result of theElectronic revenues saw continued organic transformation of the business.
Legal
| Revenue % change | Adjusted operating profit % change | |||||||
Underlying growth | +1 | % | +5 | % | ||||
Acquisitions/disposals | -5 | % | -4 | % | ||||
Currency effects | +1 | % | +1 | % | ||||
|
|
|
| |||||
Total growth | -3 | % | +2 | % | ||||
|
|
|
| |||||
Positive underlying revenue growth, was maintained in 2013 despite subdued market conditions in the US and Europe. Electronic revenue continued to show good growth, largelypartially offset by print declines.
Revenue was £1,567 million (2012: £1,610 million), down 3%. Underlying revenue growth was 1%.
In the US and in our major European markets conditions remained subdued, with growth in online solutions largely offset by continued print declines. Otherstable but subdued. Revenue from other international markets achieved good growth.continued to grow well.
The roll out of new productplatform releases in the US and international markets continued, with 73% of US legal customers activated on the New Lexis platform at period end, and new productadoption and usage progressingrates progressed well.
22
Exhibitions: 2016 financial performance
| 2016 £m | 2015 £m | Underlying growth | Acquisitions/ disposals | Currency effects | Total growth | |||||||||||||||||||
Revenue | 1,047 | 857 | +5 | % | +1 | % | +13 | % | +22 | % | ||||||||||||||
Adjusted operating profit | 269 | 217 | +7 | % | +1 | % | +16 | % | +24 | % | ||||||||||||||
Exhibitions achieved strong underlying revenue growth in 2016, in line with prior year.
Underlying revenue growth was +5%. After portfolio changes and three percentage points of cycling effects, constant currency revenue growth was +9%. Reported revenue growth was +22%. The 2013 results reflectdifference between the reported and constant currency growth rates reflects the impact of portfolio reshaping over the last 18 months, including the disposal of the US document retrieval and filing business in late 2012 and other small print assets early in 2013. In the second half of 2013 LexisNexis Martindale-Hubbell, the US lawyer directory, was spun out into a joint venture with Internet Brands, a broad-based internet marketing firm.exchange rate movements.
Portfolio changes reduced revenue by 5%. The impact of currency movements was to increase revenue by 1%.
Total operating costs, including acquired intangible asset amortisation and acquisition related costs, decreased by 2% to £1,406 million. The amortisation charge in respect of acquired intangible assets amounted to £64 million (2012: £73 million). Acquisition related costs increased to £22 million (2012: £4 million) including a charge for certain deferred consideration required to be expensed under IFRS. Depreciation and amortisation of internally generated intangible assets increased to £101 million (2012: £85 million), offset by actions taken to improve cost efficiency.
Underlying operating costs, excluding acquired intangible asset amortisation and acquisition related costs, were flat year on year.
Adjusted operating profit was £250 million (2012: £244 million), up 2%. Underlying adjusted operating profit grew 5%growth was +7%. The effect of portfolio changes was to reduce adjusted operating profit by 4%. The impact of currency movements was to increase adjusted operating profit by 1%.
Ongoing process innovation and some initial decommissioning of old infrastructure more than offset inflation and higher depreciation, contributing to a 0.7 percentage40 basis point improvement in the adjusted operating profitreported margin during 2013.
Exhibitions
| Revenue % change | Adjusted operating profit % change | |||||||
Underlying growth (excluding cycling) | +7 | % | ||||||
Cycling effects | -5 | % | ||||||
|
|
|
| |||||
Underlying growth (adjusted for cycling) | +2 | % | +4 | % | ||||
Acquisitions/disposals | 0 | % | 0 | % | ||||
Currency effects | -1 | % | -3 | % | ||||
|
|
|
| |||||
Total growth | +1 | % | +1 | % | ||||
|
|
|
| |||||
In 2013 Exhibitions maintained strong underlying revenue growth. While growth in Europe was modest, the US, Japan, Brazil and other markets all grew well.
Revenue was £862 million (2012: £854 million), up 1%. Underlying revenue growth was 7%. Had the effects of cycling been included, underlying revenue growth would have been 2%.
The US and Japan achieved strong revenue growth for the year. US shows reported good growth in visitor numbers, and growth in Japan was supported by leadership of the alternative energy sector and new launches. Brazil and China continued to generate strong growth.
In Europe good growth in international events more than offset softness in some domestic continental European events, resulting in modest overall growth.
In 2013 we launched 37 new events, primarily in high-growth geographies and sectors, including the highly successful launch of World Travel Market Latin America, building on a global franchise.
We undertook a number of portfolio changes during the year, with acquisitions including Expo Ferretera in Mexico, IPSA in Russia, Travelweek Sao Paulo in Brazil and Capsule in the US. Disposals include a number of Spanish events as well as some smaller events across geographies.
Portfolio changes had no overall effect on revenue growth during 2013. Currency movements reduced revenue by 1%.
The impact of exhibition cycling has steadily been reduced from 10% in 2011 through 8% in 2012, to 5% in 2013.
Total operating costs, including acquired intangible asset amortisation and acquisition related costs, were £704 million, up 3%. The amortisation charge in respect of acquired intangible assets increased to £40 million (2012: £32 million) as a result of acquisitions completed in 2013 and 2012.
Underlying operating costs, excluding acquired intangible asset amortisation and acquisition related costs, grew 1%, slightly below revenue.
largely reflects exchange rate movements. Adjusted operating profit growth was £210 million (2012: £208 million), up 1%. Underlying adjusted operating profit grew 4%. Portfolio changes had no overall impact on adjusted operating profit growth during 2013. The impact of currency movements was to reduce adjusted operating profit by 3%+24%.
The adjusted operating margin increased by 0.1 percentage points.Revenue growth was strong in the US and moderate in Europe. Japan grew strongly, and China saw good growth.
Revenues in Brazil continued to reflect the general weakness of the wider economy. Most other markets continued to grow strongly.
We continued to pursue growth opportunities, launching 32 new events and completing seven small acquisitions.
Critical Accounting Policies
The accounting policies of the combinedconsolidated businesses under IFRS as issued by the IASB and as adopted by the EU are described in note 2within the relevant notes to the combinedconsolidated financial statements.statements as set forth on pages 117 to 164 of the Group’s Annual Reports and Financial Statements 2017 and incorporated herein by reference to Exhibit 15.2. The most critical accounting policies and estimates used in determining the financial condition and results of the combined businesses,Group, and those requiring the most subjective or complex judgments, relate to the valuation of goodwill and acquired intangible assets, capitalisation of development spend, pensionsaccounting for defined benefit pension schemes and taxation.
The Audit Committees of Reed ElsevierRELX PLC, Reed ElsevierRELX NV and RELX Group plc have reviewed the development and selection of critical accounting estimates, and the disclosure of critical accounting policies in the financial statements.
Effect of Currency Translation
The combinedconsolidated financial statements are expressed in sterling and are therefore subject to the impact of movements in exchange rates on the translation of the financial information of individual businesses whose operational currencies are other than sterling. The principal exposures in relation to the results reported in sterling are to the US dollar and the euro, reflecting our business exposure to the United States and the euro zone, itsEuropean Economic and Monetary Union, our most important markets. Some of these exposures are offset by denominating borrowings in US dollars.dollars and euros.
Individual businesses are subject to foreign exchange transaction exposures caused by the effect of exchange rate movements on their revenue and operating costs, to the extent that such revenue and costs are not denominated in their functional currencies. Individual businesses generally hedge their exposures at market rates withthrough the centralised treasury department within ERF.department. Hedging of foreign exchange transaction exposure is the only hedging activity undertaken by the individual businesses. For further details see note 1819 to the combinedconsolidated financial statements.statements as set forth on pages 147 to 152 of the Group’s Annual Reports and Financial Statements 2017 and incorporated herein by reference to Exhibit 15.2.
Currency differences reducedincreased the Group’s revenue by £312£351 million in 20142017 compared to 2013.2016. Excluding amortisation of acquired intangible assets of £286£314 million and acquisition related costs of £30£56 million, currency differences reducedincreased operating profits by £97£112 million in 20142017 compared to 2013.2016. Acquired intangible asset amortisation and acquisition related costs are
predominantly denominated in US dollars and, after these charges, currency differences reducedincreased operating profits by £70£94 million in 20142017 compared to 2013. Borrowings2016. The majority of borrowings are predominantly denominated in US dollars and euros and, after charging net finance costs, currency differences reducedincreased profit before tax by £78£87 million in 20142017 compared to 2013.2016.
Recently Issued Accounting Pronouncements
Recently Issued Accounting Pronouncements are set outincluded in note 21 to the combinedconsolidated financial statements.
23
LIQUIDITY AND CAPITAL RESOURCES — THE GROUP
Cash Flow
Cash flows from operating activities
The Group’s cash generated from operations in 20142017 amounted to £1,851£2,445 million (2013: £1,943(2016: £2,236 million; 2012: £1,8472015: £1,882 million). Included in these net cash inflows are cash outflows of £27£42 million (2013:(2016: £40 million; 2012: £622015: £45 million) relating to acquisition related costs and exceptional restructuring costs incurred in prior years.costs. A substantial proportion of revenue is received through subscription and similar advanced receipts, principally for scientific and medical journals and exhibition fees. At December 31, 20142017 subscriptions and other revenues received in advance totalled £1,453£1,834 million (2013: £1,403(2016: £1,941 million; 2012: £1,3942015: £1,639 million).
Cash flows from investing activities
The Group’s cash outflow on the purchase of property, plant and equipment in 20142017 was £67£51 million (2013: £57 million; 2012: £70(2016: £51 million 2015: £65 million), while proceeds from the sale of property, plant and equipment amounted to £10£1 million (2013: £6(2016: £1 million; 2012: £72015: £1 million). The cash outflow on internally developed intangible assets in 20142017 was £203£303 million (2013: £251(2016: £282 million; 2012: £2632015: £242 million), reflecting sustained investment in new products and related infrastructure, particularly in the Legal business.
Net cash proceeds from disposals amounted to £53 million, after related separation and transaction costs, and working capital and other adjustments in respect of prior year transactions.Scientific, Technical & Medical businesses.
During 2014,2017, the Group paid a total of £396£131 million (2013: £221(2016: £361 million; 2012: £3162015: £191 million) for acquisitions, including deferred consideration of £34£13 million (2013: £21(2016: £24 million; 2012: £302015: £25 million) on past acquisitions and after taking account of net cash acquired of £9£7 million (2013: £14(2016: £10 million; 2012: £122015: £3 million). A further £10 million (2016: £6 million (2013: £10 million; 2012: £72015: £16 million) was paid on the purchase of investments during the year. During 2014,2017, the Group paid tax of £348£449 million (2013: £362(2016: £402 million; 2012: £2162015: £343 million).
Cash flows from financing activities
Share repurchases by the parent companiesRELX PLC and RELX NV in 20142017 were £600£700 million (2013: £600(2016: £700 million; 2012: £2502015: £500 million), with a further £100 million repurchased in 20152018 as at February 25, 2015.14, 2018. On February 26, 2015, Reed Elsevier15, 2018, RELX PLC and Reed ElsevierRELX NV announced their intention to repurchase further ordinary shares up to the value of £400£600 million in aggregate over the remainder of 2015. The2018. In addition, the Employee Benefit Trust purchased shares in the parent companiesRELX PLC and RELX NV totalling £39 million (2013: nil; 2012: nil)(2016: £29 million; 2015: £23 million). Proceeds from the exercise of share options were £45£32 million (2013: £125(2016: £23 million; 2012: £482015: £24 million).
During 2014,2017, the Group paid ordinary dividends totalling £565£762 million to the shareholders of the parent companies (2013: £549RELX PLC and RELX NV (2016: £683 million; 2012: £5212015: £583 million). Dividend payments are funded by the operating cash flow of the business after capital spend.
Debt
Net borrowings, a key indebtedness measure used in assessing the Group’s financial position, as at December 31, 20142017 were £3,550£4,732 million (2013: £3,072(2016: £4,700 million; 2012: £3,1272015: £3,782 million), comprising gross borrowings of £3,825£4,886 million, less cash and cash equivalents of £111 million and £1£43 million of related derivative financial instrument liabilities, less cashassets. The majority of our borrowings are denominated in US dollars and cash equivalentseuros and the strengthening of £276 million.sterling against the US dollar at the year end compared with the start of the year, partly offset by the weakening of sterling against the euro, resulted in slightly lower net borrowings when translated into sterling. Excluding currency effects, net borrowings increased by £399£64 million.
Net borrowings are reconciled as follows:
| 2014 | 2013 | 2012 | ||||||||||||||||||||||
| As at December 31 | 2017 | 2016 | 2015 | |||||||||||||||||||||
| £m | £m | £m | £m | £m | £m | |||||||||||||||||||
Cash & cash equivalents | 276 | 132 | 641 | 111 | 162 | 122 | ||||||||||||||||||
Borrowings | (3,825 | ) | (3,281 | ) | (3,892 | ) | (4,886 | ) | (4,843 | ) | (3,902 | ) | ||||||||||||
Related derivative financial instruments | (1 | ) | 77 | 124 | 43 | (19 | ) | (2 | ) | |||||||||||||||
|
|
|
|
|
| |||||||||||||||||||
Net borrowings | (3,550 | ) | (3,072 | ) | (3,127 | ) | (4,732 | ) | (4,700 | ) | (3,782 | ) | ||||||||||||
|
|
|
|
|
| |||||||||||||||||||
Liquidity
In June 2014, the first of two one year extension options was exercised on theThe group has a $2.0 billion unsecured committed bank facility, taking the maturity tomaturing in July 2019. This back-up facility2020, which provides security of funding for short-term debt. At December 31, 2014,2017, this facility was undrawn.
In May 2014, €350 millionMarch 2017, €1.0bn in total of euro denominated floating rate term debt was issued with a maturity of three years, and swapped to $480 million on issue. In August 2014, £300 million of sterling denominated fixed rate term debt was issued with a maturitycoupons of five0.375% and 1.000% and maturities of four years and a coupon of 2.75%. In December 2014, $20 million of US term debt maturing in January 2019 was purchased in the open market.seven years, respectively.
24
The Group believes that it has ample liquidity and access to debt capital markets, providing the ability to repay or refinance borrowings as they mature.
Contractual Obligationsobligations
The contractual obligations of the Group relating to debt finance and operating leases at December 31, 20142017 analysed by when payments are due, are summarised below.
| Total | Less than 1 year | 1-3 years | 3-5 years | After 5 years | Total | Less than 1 year | 1-3 years | 3-5 years | After 5 years | |||||||||||||||||||||||||||||||
| (in millions) | (in millions) | |||||||||||||||||||||||||||||||||||||||
Short term debt(1)(2) | £679 | £ | 679 | £ | — | £ | — | £ | — | |||||||||||||||||||||||||||||||
Long term debt (including finance leases)(2) | 3,976 | 135 | 1,246 | 962 | 1,633 | |||||||||||||||||||||||||||||||||||
Short-term borrowings(1)(2) | £681 | £681 | £— | £— | £— | |||||||||||||||||||||||||||||||||||
Long-term borrowings (including finance lease obligations)(2) | 4,928 | 119 | 1,283 | 1,323 | 2,203 | |||||||||||||||||||||||||||||||||||
Operating leases | 523 | 96 | 157 | 121 | 149 | 484 | 109 | 180 | 107 | 88 | ||||||||||||||||||||||||||||||
|
|
|
|
|
|
|
|
|
| |||||||||||||||||||||||||||||||
Total | £ | 5,178 | £ | 910 | £ | 1,403 | £ | 1,083 | £ | 1,782 | £6,093 | £909 | £1,463 | £1,430 | £2,291 | |||||||||||||||||||||||||
|
|
|
|
|
|
|
|
|
| |||||||||||||||||||||||||||||||
| (1) |
| (2) | Short and |
Information on retirement benefit obligations is set outforth in note 6 to the combinedconsolidated financial statements.statements under the heading ‘Pension schemes’ on pages 127 to 130 of the Group’s Annual Reports and Financial Statements 2017 and incorporated herein by reference to Exhibit 15.2.
Off-Balance Sheet ArrangementsOff-balance sheet arrangements
SaveExcept as disclosed above under “Contractual Obligations”, we have nooff-balance sheet arrangements that currently have or are reasonably likely to have a material effect on the combined businesses’RELX Group’s financial condition, results of operations, liquidity, capital expenditure or capital resources.
Treasury policies
The main treasury risks faced by the Group are liquidity risk, interest rate risk, foreign currency risk and credit risk. The Boards of Reed ElsevierRELX PLC, RELX NV and Reed Elsevier NVRELX Group plc agree overall policy guidelines for managing each of these risks and the Boards of RELX Group plc and Elsevier Finance SA agree policies (in line with parent company guidelines) for their respective business and treasury centres.risks. A summary of these policies is provided in note 1819 to the consolidated financial statements as set forth under the heading ‘Financial Instruments’ on pages F-37147 to F-44. 152 of the Group’s Annual Reports and Financial Statements 2017 and incorporated herein by reference to Exhibit 15.2.
Financial instruments are used to finance our businesses and to hedge transactions. Our businesses do not enter into speculative transactions.
Capital and liquidity management
The capital structure is managed to support ourthe Group’s objective of maximising long-term shareholder value through appropriate security of funding, ready access to debt and capital markets, cost effectivecost-effective borrowing and flexibility to fund business and acquisition opportunities while maintaining appropriate leverage to ensure an efficient capital structure.
25
Over the long-term, we seekthe Group seeks to maintain cash flow conversion of 90% or higher and credit rating agency metrics that are consistent with a solid investment grade credit rating. The typical creditThese metrics areas defined by the rating agencies include net debt to EBITDA, on a pensions and lease adjusted and on an unadjusted basis, and freevarious measures of cash flow as a percentage of net debt.
Net debt on an unadjusted basis is the same as net borrowings which is reconciled on page 24. Adjusted EBITDA is derived from net profit as follows:
| 2014 | 2013 | 2012 | ||||||||||
| (in millions) | (in millions) | (in millions) | ||||||||||
Net profit for the year | £960 | £1,115 | £1,049 | |||||||||
Adjustments: | ||||||||||||
Taxation | 269 | 81 | 102 | |||||||||
Disposals and other non operating items | 11 | (16 | ) | (45 | ) | |||||||
Net finance costs | 162 | 196 | 227 | |||||||||
Amortisation of acquired intangible assets | 286 | 318 | 329 | |||||||||
Depreciation and other amortisation | 237 | 249 | 227 | |||||||||
Acquisition related costs | 30 | 43 | 21 | |||||||||
Reclassification of tax in joint ventures | 21 | 12 | 5 | |||||||||
|
|
|
|
|
| |||||||
Adjusted EBITDA | £1,976 | £1,998 | £1,915 | |||||||||
|
|
|
|
|
| |||||||
Net profit for the year Adjustments: Taxation Disposals and othernon-operating items Net finance costs Amortisation of acquired intangible assets Depreciation and other amortisation Acquisition related costs Reclassification of tax in joint ventures Reclassification of finance income in joint ventures Adjusted EBITDA 2017 2016 2015 (in millions) (in millions) (in millions) £ 1,667 £ 1,169 £ 1,014 67 304 298 (11 ) 40 11 182 195 174 314 346 296 272 257 228 56 51 35 10 10 (6 ) (1 ) (1 ) – £ 2,556 £ 2,371 £ 2,050
Our uses of free cash flow, after organic investment, over the longer-term balance the dividend policy, selective acquisitions and share repurchases, while retaining the balance sheet strength to maintain access to cost effective sources of borrowing.
Further detail on our capital and liquidity management is provided in note 19 to the consolidated financial statements on page F-37.pages 147 to 152 of the Group’s Annual Reports and Financial Statements 2017 and incorporated herein by reference to Exhibit 15.2.
Short-Term BorrowingsSHORT-TERM BORROWINGS
The main treasury centres operateGroup operates a number of commercial paper programmes tothat provide flexibility for funding operational requirements of the combined businesses on a daily basis, at short notice and at competitive rates. Commercial paper is issued under both US and Euro programmes and guaranteed by Reed ElsevierRELX PLC and Reed ElsevierRELX NV. In addition, short-term borrowing facilities are established with local banks to support the daily requirements of businesses operating in certain countries where there may be restrictions on borrowing from affiliates. Term debt comprisesconsists of borrowings with an original maturity of greater than one year and which mature within 12 months of the reporting date. These short-term borrowings were backed up at December 31, 20142017 by a $2.0 billion committed bank facility maturing in July 20192020 which was undrawn. The short-term borrowing programmes are run in conjunction with term debt programmes which comprise the majority of our debt and provide the combined businessesGroup with security of funding.
The average amount and the average interest rate during the year have been calculated by taking the average of the amounts outstanding at each month end (translated to sterling at the respective month end rate) and the average of the interest rate applicable at each month end. Commercial paper issuance reached a maximum month end level of £747£763 million in September 2014,2017, and short-term loans and overdrafts reached a maximum month end level of £103£90 million in January 2014,December 2017, both as a result of movements in trading cash flows. Term debt reached a maximum month end level of £351£627 million in February 2014January 2017 as the maturitiesmaturity of the $35 million term debt issues of CHF 350issue expiring in February 2017, the €350 million and $186.5 million,term debt issue expiring in May 20142017 and February 2015 respectively, boththe £300 million term debt issue expiring in December 2017 were then fellall below 12 months.
| Short-term borrowings as at December 31, | 2014 £m | 2014 Weighted average interest rate % | 2013 £m | 2013 Weighted average interest rate % | 2012 £m | 2012 Weighted average interest rate % | 2017 (in millions) | 2017 Weighted average interest rate % | 2016 (in million) | 2016 Weighted average interest rate % | 2015 (in millions) | 2015 Weighted average interest rate % | ||||||||||||||||||||||||||||||||||||
Commercial paper | 465 | 0.3 | 229 | 0.3 | 118 | 0.2 | £376 | 0.3 | £426 | (0.2) | £113 | 0.4 | ||||||||||||||||||||||||||||||||||||
Short term loans and overdrafts | 84 | 0.8 | 58 | 1.3 | 13 | 1.5 | ||||||||||||||||||||||||||||||||||||||||||
Short-term loans and overdrafts | 88 | 1.8 | 95 | 1.7 | 105 | 2.2 | ||||||||||||||||||||||||||||||||||||||||||
Finance leases | 7 | 2.2 | 9 | 2.1 | 7 | 2.5 | 5 | 1.7 | 5 | 1.5 | 6 | 1.8 | ||||||||||||||||||||||||||||||||||||
Term debt | 120 | 5.2 | 352 | 2.0 | 592 | 3.7 | 209 | 2.8 | 633 | 2.3 | 400 | 5.6 | ||||||||||||||||||||||||||||||||||||
|
|
|
|
|
| |||||||||||||||||||||||||||||||||||||||||||
Total short term borrowings | 676 | 648 | 730 | |||||||||||||||||||||||||||||||||||||||||||||
Total short-term borrowings | £ | 678 | £ | 1,159 | £ | 624 | ||||||||||||||||||||||||||||||||||||||||||
| �� |
|
|
|
|
|
| ||||||||||||||||||||||||||||||||||||||||||
| Average short-term borrowings during the year ended December 31, | 2014 £m | 2014 Weighted average interest rate % | 2013 £m | 2013 Weighted average interest rate % | 2012 £m | 2012 Weighted average interest rate % | ||||||||||||||||||
Commercial paper | 600 | 0.3 | 333 | 0.2 | 547 | 0.5 | ||||||||||||||||||
Short term loans and overdrafts | 51 | 1.4 | 71 | 1.3 | 22 | 8.9 | ||||||||||||||||||
Finance leases | 4 | 2.3 | 8 | 2.3 | 5 | 2.7 | ||||||||||||||||||
Term debt | 183 | 3.2 | 725 | 4.7 | 469 | 3.7 | ||||||||||||||||||
26
| Average short-term borrowings during the year ended December 31, | 2017 (in millions) | 2017 Weighted average interest rate % | 2016 (in millions) | 2016 Weighted average interest rate % | 2015 (in millions) | 2015 Weighted average interest rate % | ||||||||||||||||||
Commercial paper | £ | 467 | 0.7 | £ | 429 | 0.1 | £ | 458 | 0.3 | |||||||||||||||
Short-term loans and overdrafts | 48 | 3.7 | 121 | 2.1 | 93 | 2.1 | ||||||||||||||||||
Finance leases | 5 | 1.7 | 6 | 1.8 | 7 | 2.7 | ||||||||||||||||||
Term debt | £ | 209 | 3.0 | £ | 547 | 3.6 | £ | 111 | 5.6 | |||||||||||||||
| Maximum month end short-term borrowings | 2014 £m | 2013 £m | 2012 £m | |||||||||
Commercial paper | 747 | 486 | 756 | |||||||||
Short term loans and overdrafts | 103 | 230 | 27 | |||||||||
Finance leases | 7 | 9 | 7 | |||||||||
Term debt | 351 | 1,050 | 643 | |||||||||
| Maximum month end short-term borrowings | 2017 (in millions) | 2016 (in millions) | 2015 (in millions) | |||||||||
Commercial paper | £ | 763 | £ | 989 | £ | 620 | ||||||
Short-term loans and overdrafts | 90 | 167 | 106 | |||||||||
Finance leases | 5 | 6 | 7 | |||||||||
Term debt | £ | 627 | £ | 729 | £ | 400 | ||||||
OPERATING RESULTS — REED ELSEVIER PLC AND REED ELSEVIER NVINTELLECTUAL PROPERTY
The following discussion is basedOur products and services include and utilise intellectual property content delivered through a variety of media, including online, journals and books. We rely on the financial statements of Reed Elsevier PLCtrademark, copyright, patent, trade secret and Reed Elsevier NV for the three years ended December 31, 2014, 2013other intellectual property laws, as well as in some cases licensing arrangements with third parties, to establish and 2012. The results of Reed Elsevier PLC reflect its shareholders’ 52.9% economic interestprotect our proprietary rights in the combined businesses. The results of Reed Elsevier NV reflect its shareholders’ 50% economic interest in the combined businesses. The respective economic interests of the Reed Elsevier PLCthese products and Reed Elsevier NV shareholders take account of Reed Elsevier PLC’s 5.8% indirect interest in Reed Elsevier NV. Both parent companies equity account for their respective share in the Group’s combined businesses.services.
Results of Operations for the Year Ended December 31, 2014
Compared to the Year Ended December 31, 2013
The earnings per share of Reed Elsevier PLC and Reed Elsevier NV were 43.0p and €0.85 respectively in 2014, compared to 48.8p and €0.91 in 2013. The reductions reflect the impact of deferred tax credits in 2013 on both companies.
Dividends to Reed Elsevier PLC and Reed Elsevier NV shareholders are, other than in special circumstances, equalised at the gross level, including the benefit of the UK attributable tax credit of 10% available to certain Reed Elsevier PLC shareholders.
Ordinary dividends paid in the year, in amounts per ordinary share, comprise: a 2013 final dividend of 17.95p and 2014 interim dividend of 7.00p giving a total of 24.95p (2013: 23.65p) for Reed Elsevier PLC; and a 2013 final dividend of €0.374 and 2014 interim dividend of €0.151 giving a total of €0.525 (2013: €0.469) for Reed Elsevier NV.
The Board of Reed Elsevier PLC has proposed a 2014 final dividend of19.0p, up6%, giving a total dividend of26.0p in respect of the financial year, up6% on 2013. The Board of Reed Elsevier NV, in accordance with the dividend equalisation arrangements, have proposed a 2014 final dividend of €0.438, up16%, which results in a total dividend of €0.589 in respect of the financial year, up16% on 2013. The difference in growth rates in the equalised final dividends reflects changes in the euro:sterling exchange rate since the respective prior year dividend announcement dates.
During 2014, 35,251,501 Reed Elsevier PLC shares and 20,403,351 Reed Elsevier NV shares were repurchased. A further 757,781 Reed Elsevier PLC shares and 1,989,279 Reed Elsevier NV shares were purchased by the Employee Benefit Trust. Reed Elsevier NV also repurchased 107,901 Reed Elsevier NV R shares (equivalent to 1,079,010 ordinary shares) from a subsidiary of Reed Elsevier PLC. During December 2014, 65,000,000 Reed Elsevier PLC shares and 40,000,000 Reed Elsevier NV shares held in treasury were cancelled. As at December 31, 2014, shares in issue for Reed Elsevier PLC and Reed Elsevier NV respectively, net of shares held in treasury, amounted to 1,127,666,342 and 690,905,759 (including R share equivalents). A further 4,815,950 Reed Elsevier PLC shares and 2,787,800 Reed Elsevier NV shares have been repurchased in January and February 2015.
Results of Operations for the Year Ended December 31, 2013
Compared to the Year Ended December 31, 2012
The earnings per share of Reed Elsevier PLC and Reed Elsevier NV were 48.8p and €0.91 respectively in 2013, compared to 44.8p and €0.87 in 2012. The increase reflects the improved trading performance and deferred tax credits.
Dividends to Reed Elsevier PLC and Reed Elsevier NV shareholders are, other than in special circumstances, equalised at the gross level, including the benefit of the UK attributable tax credit of 10% available to certain Reed Elsevier PLC shareholders.
Ordinary dividends paid in the year, in amounts per ordinary share, comprise: a 2012 final dividend of 17.0p and 2013 interim dividend of 6.65p giving a total of 23.65p (2012: 21.9p) for Reed Elsevier PLC; and a 2012 final dividend of €0.337 and 2013 interim dividend of €0.132 giving a total of €0.469 (2012: €0.456) for Reed Elsevier NV.
The Board of Reed Elsevier PLC has proposed a 2013 final dividend of 17.95p, up 6%, giving a total dividend of 24.60p in respect of the financial year, up 7% on 2012. The Board of Reed Elsevier NV, in accordance with the dividend equalisation arrangements, have proposed a 2013 final dividend of €0.374, up 11%, which results in a total dividend of €0.506 in respect of the financial year, up 8% on 2012. The difference in growth rates in the equalised final dividends reflects changes in the euro:sterling exchange rate since the respective prior year dividend announcement dates.
During 2013, 41,961,920 Reed Elsevier PLC ordinary shares and 24,282,106 Reed Elsevier NV ordinary shares were repurchased for consideration of £600 million. Reed Elsevier NV also repurchased 94,053 Reed Elsevier NV R shares (equivalent to 940,530 ordinary shares) from a subsidiary of Reed Elsevier PLC. These shares are held in treasury.
Trends, uncertainties and events which can affect the revenue, operating profit and liquidity and capital resources of the combined businessesRELX Group include the usage, penetration and customer renewal of our print and electronic products and the prices that customers pay for our products, the migration of products to online services, investment in new products and services, cost control and the impact of our cost reduction programmes on operational efficiency, the levels of legal industry and academic library funding, the impact of economic conditions on corporate and other customer budgets, and the level of advertising demand, the actions of competitors and regulatory and legislative developments.
Trends, uncertainties and events which could have a material impact on our revenue, operating profit and liquidity and capital resources are discussed in further detail in “Item 3: Key Information — Risk Factors”; “Item 4: Information on the Group”; and “Item 5: Operating and Financial Review and Prospects — Operating Results — The Group;Group —; Liquidity and Capital Resources — The Group; Operating Results — Reed Elsevier PLC and Reed Elsevier NV”Group”.
27
ITEM 6: DIRECTORS, SENIOR MANAGEMENT AND EMPLOYEES
The information on the Directors of each of Reed ElsevierRELX PLC, Reed ElsevierRELX NV and RELX Group plc as at February 25, 2015 were:14, 2018 is set forth under the headings ‘Executive Directors’ and‘Non-Executive Directors’ on pages 66 to 67 of the Group’s Annual Reports and Financial Statements 2017 and is incorporated herein by reference to Exhibit 15.2.
As a general rule,Non-Executive Directors serve for an initial term of three years, and are typically expected to be available to serve for a second three-year period, if invited to do so. They may also be invited to serve for a third period of three years.
The Directors are as follows:
Name (Age) |
|
| and RELX Group plc | |||
Erik Engstrom | Executive Director and Chief Executive Officer | |||||
Anthony Habgood (71) | Non-Executive Chairman(2)(3)(4) | |||||
| Non-Executive | |||||
| ||||||
Adrian Hennah | Non-Executive Director(1)(4) | |||||
| ||||||
Marike van Lier Lels | Non-Executive Director(1)(4) | |||||
Nick Luff | Executive Director and Chief Financial Officer | |||||
Robert | Non-Executive Director(2)(4) | |||||
Carol Mills (64) | Non-Executive Director(1)(4) | |||||
Linda Sanford | Non-Executive Director | |||||
Ben van der Veer | Non-Executive Director(1)(3)(4) | |||||
Suzanne Wood (57) | Non-Executive Director(1) | |||||
| (1) | Member of the Audit Committees of the Boards of |
| (2) | Member of the Remuneration Committee of the Board of RELX Group plc. |
| (3) | Member of the joint Nominations Committee of the Boards of |
| (4) | Member of the joint Corporate Governance Committee of the Boards of |
| (5) | Senior Independent Director, as defined by the UK Corporate Governance |
Duncan Palmer stepped downSuzanne Wood joined the Boards as Chief Financial Officer and retired from the Group’s BoardsaNon-Executive Director in September 2014.2017.
A person described as a Non-Executive Director of Reed Elsevier PLC, Reed Elsevier NV or RELX Group plc is a Director not employed by such company in an executive capacity.
Erik Engstrom (Swedish) Chief Executive Officer since 2009. Joined the Group as Chief Executive Officer of Elsevier in 2004. Non-Executive Director of Smith & Nephew plc. Prior to joining the Group was a partner at General Atlantic Partners. Before that was President and Chief Operating Officer of Random House Inc and, before its merger with Random House, President and Chief Executive Officer of Bantam Doubleday Dell, North America. Began his career as a consultant with McKinsey. Served as a Non-Executive Director of Eniro AB and Svenska Cellulosa Aktiebolaget SCA. Holds a BSc from Stockholm School of Economics, an MSc from the Royal Institute of Technology in Stockholm, and gained an MBA from Harvard Business School as a Fulbright Scholar.
Anthony Habgood (British) Chairman since 2009. Chairman of the Nominations and Corporate Governance Committees. Chairman of: Court of the Bank of England, Preqin Holding Limited and Norwich Research Partners LLP. Previously was Chairman of Whitbread plc, Bunzl plc and of Mölnlycke Health Care Limited and served as Chief Executive of Bunzl plc, Chief Executive of Tootal Group plc and a Director of The Boston Consulting Group. Formerly Non-Executive Director of Geest plc, Marks and Spencer plc, National Westminster Bank plc, Powergen plc, SVG Capital plc and Norfolk and Norwich University Hospitals Trust. Holds an MA in Economics from Cambridge University and an MS in Industrial Administration from Carnegie Mellon University. He is a visiting Fellow at Oxford University.
Wolfhart Hauser (German) Non-Executive Director since 2013. Chairman of the Remuneration Committee. Chief Executive Officer of Intertek Group plc and a Non-Executive Director of Associated British Foods plc. Was Chairman of Dragenopharm GmbH & Co AG from 2002 to 2006. Prior to that he was Chief Executive Officer of TÜV Suddeutschland AG between 1998 and 2002 and Chief Executive Officer of TÜV Product Services GmbH for 10 years. Served as a Non-Executive Director of Logica Plc and Intertek Group plc before his current position at the company.
Adrian Hennah (British) Non-Executive Director since 2011. Chief Financial Officer of Reckitt Benckiser Group plc and Non-Executive Director of Indivior PLC. Was Chief Financial Officer of Smith & Nephew plc from 2006 to 2012. Before that was Chief Financial Officer of Invensys plc having previously held various senior finance and management positions within GlaxoSmithKline for 18 years.
Lisa Hook (American) Non-Executive Director since 2006. Senior Independent Director. President and Chief Executive Officer of Neustar, Inc and a Director of Vantiv, Inc and Island Press serves on the US President’s National Security Telecommunications Advisory Committee (NSTAC) and as a member of the Advisory Board of the Peggy Guggenheim Collection. Was President and Chief Executive Officer at Sun Rocket Inc. Before that was President of AOL Broadband, Premium and Developer Services. Prior to joining AOL, was a founding partner at Brera Capital Partners LLC. Previously Chief Operating Officer of Time Warner Telecommunications and has served as senior advisor to the Federal Communications Commission Chairman and a senior counsel to Viacom Cable. Formerly a Director of Covad Communications, Inc and The Ocean Foundation.
Marike van Lier Lels (Dutch) Non-Executive Director of Reed Elsevier NV since 2010. Member of the Supervisory Boards of TKH Group NV, Eneco Holding NV and Royal Imtech NV, and a member of the executive committee of Aegon Association. A member of various Dutch governmental advisory boards. Previously was a member of the Supervisory Board of Maersk BV, KPN NV, USG People NV and Executive Vice President and Chief Operating Officer of the Schiphol Group. Prior to joining Schiphol Group, was a member of the Executive Board of Deutsche Post Euro Express and held various senior positions with Nedlloyd.
Nick Luff (British) Chief Financial Officer since September 2014. Non-Executive Director of Lloyds Banking Group plc. Prior to joining the Group was Group Finance Director of Centrica plc from 2007. Before that he was Chief Financial Officer at The Peninsular & Oriental Steam Navigation Company (P&O) and its affiliated companies, having previously held a number of senior finance roles at P&O. Began his career as an accountant with KPMG. Formerly a Non-Executive Director of QinetiQ Group plc. He has a degree in Mathematics from Oxford University and is a qualified UK Chartered Accountant.
Robert Polet (Dutch) Non-Executive Director since 2007. Chairman of Safilo Group S.p.A., Chairman of the Supervisory Board of Rituals Cosmetics BV and a Non-Executive Director of Philip Morris International Inc, William Grant & Sons Limited, Scotch and Soda NV and Crown Topco Limited, parent company of Vertu. Was President and Chief Executive Officer of Gucci Group from 2004 to 2011, having previously spent 26 years at Unilever working in a variety of marketing and senior executive positions throughout the world, including President of Unilever’s Worldwide Ice Cream and Frozen Foods division. Formerly a member of the Supervisory Board of Nyenrode Foundation and a Non-Executive Director of Wilderness Holdings Limited.
Linda Sanford (American) Non-Executive Director since 2012. An independent Director of Consolidated Edison, Inc. Serves on the boards of directors of The Business Council of New York State and the Partnership for New York City. Also serves on the boards of trustees of the State University of New York, St. John’s University, Rensselaer Polytechnic Institute and the New York Hall of Science. Was Senior Vice President, Enterprise Transformation, IBM Corporation until December 2014, having joined the company in 1975. Formerly a Non-Executive Director of ITT Corporation.
Ben van der Veer (Dutch) Non-Executive Director since 2009. Chairman of the Audit Committees. Member of the Supervisory Boards of Aegon NV, TomTom NV, Koninklijke FrieslandCampina NV and Royal Imtech NV. Was Chairman of the Executive Board of KPMG in the Netherlands and a member of the management committee of the KPMG International board until his retirement in 2008, having joined KPMG in 1976. Formerly a member of the Supervisory Board of Siemens Nederland NV.
The executive officers of Reed ElsevierRELX PLC, Reed ElsevierRELX NV and RELX Group plc, other than Directors, at February 25, 201514, 2018 were:
Henry Udow: Chief Legal Officer and Company Secretary of Reed ElsevierRELX PLC and RELX Group plc. A US and British citizen who is admitted to the Bar of New York State. Joined the Group in April 2011. Prior to joining the Group he was Chief Legal Officer and Company Secretary of Cadbury plc.
Ian Fraser:Gunjan Aggarwal:Chief Human Resources DirectorOfficer of RELX Group plc. Joined the Group in 2005.2017. Prior to joining the Group heshe was head of Human Resources Director at BHP Billiton plcfor Ericsson’s global media business and before that held seniorhead of Human Resources for Ericsson North America. Career includes a number of Human Resources positions in human resourcesAsia, Europe and North America at Charter plcUnilever and Woolworths plc.Novartis.
Jans van der Woude:Company Secretary and Legal Counsel of Reed ElsevierRELX NV. A Dutch lawyer. Prior to joining the Group in 2009 was legal advisor to Corporate Express NV. Before that was Corporate Legal Director of TNT NV, having previously been General Counsel at Getronics NV.
28
The remuneration policy in relation to the Executive Directors as approved by Reed ElsevierRELX PLC shareholders at the 2014 Annual General Meeting continues to apply unchanged. A copy is available onand by the Group website under http://www.relxgroup.com/go/remunerationpolicy or on pages 47 to 562005 General Meeting of the 2013 Annual Report on Form 20-F.
Annual Remuneration Report
Single Total Figure of Remuneration – Executive Directors
| (a) | (b) | (c) | (d) | (e) | (f) | (g) | (h) | (i) | ||||||||||||||||||||||||||||||||||||||
| Short-term employee benefits | Share-based awards | Pension | Total | |||||||||||||||||||||||||||||||||||||||||||
£‘000 | Salary | Benefits5 | Annual Incentive | UK statutory basis1,2,4,7 | Dutch Civil Code basis3 | UK statutory basis2 | Dutch Civil Code basis3 | UK statutory basis1,2 | Dutch Civil Code basis3 | |||||||||||||||||||||||||||||||||||||
Erik Engstrom | 2014 | 1,104 | 29 | 1,170 | 13,181 | 3,943 | 692 | 562 | 16,176 | 6,808 | ||||||||||||||||||||||||||||||||||||
| 2013 | 1,077 | 28 | 1,134 | 2,472 | 3,300 | 719 | 528 | 5,430 | 6,067 | |||||||||||||||||||||||||||||||||||||
Nick Luff6 | 2014 | 217 | 5 | 685 | 1,371 | 1,341 | 65 | 65 | 2,343 | 2,313 | ||||||||||||||||||||||||||||||||||||
Duncan Palmer | 2014 | 442 | 202 | 0 | 0 | 0 | 84 | 84 | 728 | 728 | ||||||||||||||||||||||||||||||||||||
| 2013 | 600 | 230 | 609 | 0 | 598 | 114 | 114 | 1,553 | 2,151 | |||||||||||||||||||||||||||||||||||||
2014 Annual Incentive
Set out below is a summary of performance against each financial measure and the resulting annual incentive payments for 2014 (payable in March 2015):
|
|
|
| |||||
| ||||||||
| ||||||||
| ||||||||
| ||||||||
|
| |||||||
|
| |||||||
The Board believes that disclosing details beyond what is disclosed above would be commercially sensitive and would give competitors an unfair insight into our strategic direction and annual execution plans.
Multi-year incentives
Multi-year incentives with a performance period ended December 31, 2014 were for Erik Engstrom BIP 2012, ESOS 2012 and the final tranche of the REGP and for Nick Luff a performance share award granted as part compensation for forfeited entitlements from previous employment.
The Committee assessed the performance measures for these awards and made an overall assessment of underlying business performance and other relevant factors. The vesting outcome resulting from this review is summarised below.
Discontinued REGP: Final tranche performance outcome
Performance measure | Weighting | Performance range and vesting levels set at grant1 | Achievement against the | Resulting vesting percentage | ||||||
TSR measured over five years 2010-2014 | 1/3rd | below median median upper quartile | 0% 30% 100% | In upper quartile of FTSE and European comparator groups; close to upper quartile in US comparator group | 99.7% | |||||
Average growth in adjusted EPS in 2013 and 20142 | 1/3rd | below 7% p.a. 7% p.a. 13% p.a. or above | 0% 60% 100% | 8.5% p.a. | 70.0% | |||||
ROIC in 20142 | 1/3rd | below 10.7% | 0% | |||||||
| 10.7% | 60% | 12.1% | 88.2% | |||||||
| 12.7% or above | 100% | |||||||||
Total vesting percentage: | 86.0% | |||||||||
BIP: 2012-14 cycle performance outcome
Performance measure | Weighting | Performance range and vesting levels set at grant1 | Achievement against the performance range | Resulting vesting percentage | ||||||||
Average growth in adjusted EPS over the three-year performance period2 | 50% | below 4% p.a. 4% p.a. | 0% 50% | |||||||||
| 6.5% p.a. | 75% | 8.4% p.a. | 93.7% | |||||||||
| 9% p.a. or above | 100% | |||||||||||
ROIC in the third year of the performance period2 | 50% | below 11% 11% | 0% 50% | |||||||||
| 11.5% | 75% | |||||||||||
| 12% or above | 100% | 13.0% | 100% | |||||||||
Total vesting percentage: | 96.8% | |||||||||||
ESOS: 2012-14 cycle performance outcome
Performance measure | Weighting | Performance range and vesting levels set at grant | Achievement against the performance range | Resulting vesting percentage | ||||||
Average growth in adjusted EPS over the three-year performance period | 100% | below 6% p.a. 6% p.a. or above | 0% 100% | 8.4% p.a. | 100% | |||||
Nick Luff: PSP award to compensate for forfeited entitlements from previous employment with performance period ended December 31, 2014
Performance measure | Weighting | Performance range and vesting levels set at grant | Achievement against the performance range | Resulting vesting percentage | ||||||
Average growth in adjusted EPS in 2013 and 2014 | 2/3rds | below 7% p.a. | 0% | 8.5% p.a. | 100% | |||||
| 7% p.a. or above | 100% | |||||||||
ROIC in 2014 | 1/3rd | below 10.7% | 0% | 12.1% | 100% | |||||
| 10.7% or above | 100% | |||||||||
Total vesting percentage: | 100% | |||||||||
Single Total Figure of Remuneration – Non-Executive Directors
| Total fee | Benefits1 | Total | ||||||||||||||||||||||
| 2014 | 2013 | 2014 | 2013 | 2014 | 2013 | |||||||||||||||||||
Anthony Habgood | £ | 550,000 | £ | 550,000 | £ | 2,150 | £ | 1,900 | £ | 552,150 | £ | 551,900 | ||||||||||||
Wolfhart Hauser (from April 25, 2013) | £ | 90,000 | £ | 65,058 | £ | 720 | £ | 90,720 | £ | 65,058 | ||||||||||||||
Adrian Hennah | £ | 77,500 | £ | 65,000 | £ | 720 | £ | 500 | £ | 78,220 | £ | 65,500 | ||||||||||||
Lisa Hook | £ | 110,000 | £ | 80,462 | £ | 1,230 | £ | 1,000 | £ | 111,230 | £ | 81,462 | ||||||||||||
Marike van Lier Lels2 | £ | 56,671 | £ | 55,085 | £ | 56,671 | £ | 55,085 | ||||||||||||||||
Robert Polet | £ | 77,500 | £ | 65,000 | £ | 1,230 | £ | 500 | £ | 78,730 | £ | 65,500 | ||||||||||||
Linda Sanford | £ | 77,500 | £ | 65,000 | £ | 1,230 | £ | 1,000 | £ | 78,730 | £ | 66,000 | ||||||||||||
Ben van der Veer2 | £ | 95,968 | £ | 93,220 | £ | 510 | £ | 500 | £ | 96,478 | £ | 93,720 | ||||||||||||
2014 Non-Executive Directors’ fees
The fees in the Single Total Figure table for Non-Executive Directors reflect the following fees in 2014:
| Annual fee 2014 | Annual fee 2013 | |||||||
Chairman | £ | 550,000 | £ | 550,000 | ||||
Non-Executive Directors* | £ | 65,000/€80,000 | £ | 65,000/€80,000 | ||||
Senior Independent Director | £ | 25,000 | £ | 20,000 | ||||
Chairman of: | ||||||||
– Audit Committee | £ | 25,000/€30,000 | £ | 25,000/€30,000 | ||||
– Remuneration Committee | £ | 25,000 | £ | 20,000 | ||||
Committee membership fee: | ||||||||
– Audit Committee | £ | 12,500 | ||||||
– Remuneration Committee | £ | 12,500 | ||||||
– Nominations Committee | £ | 7,500/€9,000 | ||||||
Total pension entitlements
Erik Engstrom is a member of the UK Group’s defined benefit pension arrangements. Further details are provided in the Policy Report on page 48 of the 2013 Annual Report on Form 20-F and below.
Pension – Standard information
Age at December 2014 | Normal retirement age | Director’s contributions | Participation fee | |||
51 | 60 | £11,216 | £23,962 |
Since October 2013, the CEO pays a participation fee on the amount of his base salary which exceeds the UK earnings cap. Starting with an initial rate of 1%, on April 1, 2014 the fee increased to 3%, and each April 1, thereafter this fee will increase by a further 2% of base salary which exceeds the UK earnings cap.
Pension – UK statutory basis
|
|
| ||
|
Pension – Dutch Civil Code basis (consistent with prior disclosure)
|
| |
|
Scheme interests awarded during the financial year
CURRENT MULTI-YEAR INCENTIVE PLANS
Basis on which award | Face value of award at grant1 | Value of awards if vest in line with expectations2 | Percentage of maximum that would | End of performance period | ||||||||||||
| BIP – matching share awards | ||||||||||||||||
Erik Engstrom | Opportunity to invest cash and/or shares up to value of target bonus opportunity and receive 1 for 1 matching award | £ | 1,076,856 | £ | 721,493 | If one measure pays out at threshold, the overall payout is 25%. If both measures pay out at threshold, the overall payout is 50%. |
| December 31, 2016 |
| |||||||
Nick Luff | £ | 649,992 | £ | 435,495 | ||||||||||||
| LTIP – performance share awards | ||||||||||||||||
Erik Engstrom | 250% of salary | £ | 2,692,223 | £ | 1,346,111 | If the measure with the lowest payout at threshold pays out at threshold, the overall payout is 3%. If each measure pays out at threshold, the overall payout is 32%. |
| December 31, 2016 |
| |||||||
Nick Luff | 200% of salary | £ | 1,299,988 | £ | 649,994 | |||||||||||
| ESOS – market value options | ||||||||||||||||
Erik Engstrom | 250% of salary | £ | 2,692,223 | £ | 430,756 | 33% | December 31, | |||||||||
Nick Luff | 200% of salary | £ | 1,299,988 | £ | 207,998 | 2016 | ||||||||||
ONE-OFF MULTI-YEAR INCENTIVE PLAN AWARDS TO COMPENSATE FOR FORFEITED ENTITLEMENTS FROM PREVIOUS EMPLOYMENT
Basis on which award | Face value of award at grant1 | Value of awards if vest in line with expectations2 | Percentage of maximum that would | End of performance period | ||||||||||||
Performance share awards4 |
| |||||||||||||||
Nick Luff | 200% of salary | £ | 1,299,988 | £ | 1,299,988 | If the measure with the lowest payout at threshold pays out at threshold, the overall payout is 33%. If each measure pays out at threshold, the overall payout is 100%. | | December 31, 2014 | | |||||||
| 200% of salary | £ | 1,299,988 | £ | 649,994 | If the measure with the lowest payout at threshold pays out at threshold, the overall payout is 3%. If each measure pays out at threshold, the overall payout is 32%. | | December 31, 2015 | | ||||||||
|
The following targets and vesting scales apply to awards granted in 2014:
BIP: 2014-16 cycle
Match earned on personal investment | Average growth in adjusted EPS | ROIC in the third year of the | ||
0% | below 4% p.a. | below 11.6% | ||
50% | 4% p.a. | 11.6% | ||
75% | 6.5% p.a. | 12.1% | ||
100% | 9% p.a. or above | 12.6% or above |
LTIP: 2014-16 cycle
Vesting is dependent on three separate performance measures of equal weighting: a TSR measure comprising three comparator groups, an EPS measure and a ROIC measure.1
| ||
| ||
| ||
|
The three TSR comparator groups (Sterling, Euro and US Dollar) reflect the fact that we access equity capital markets through three exchanges – London, Amsterdam and New York – in three currency zones. The Group’s TSR performance is measured separately against each comparator group and each ranking achieved will produce a payout, if any, in respect of one-third of the TSR measure. The proportion of the TSR measure that vests will be the sum of the three payouts.
Each comparator group comprises approximately 40 companies. The companies for the 2014-16 LTIP cycle were selected on the following basis (unchanged from 2013-15):
|
|
|
Vesting percentage of EPS and ROIC tranches* | Average growth in adjusted EPS over the three-year performance period | ROIC in the third | ||||
0% | below 5% p.a. | below 11.6% | ||||
33% | 5% p.a. | 11.6% | ||||
52.5% | 6% p.a. | 11.85% | ||||
65% | 7% p.a. | 12.1% | ||||
75% | 8% p.a. | 12.35% | ||||
85% | 9% p.a. | 12.6% | ||||
92.5% | 10% p.a. | 12.85% | ||||
100% | 11% p.a. or above | 13.1% or above |
ESOS: 2014-2016 cycle
| ||||
| ||||
| ||||
| ||||
|
PSP awards granted to Nick Luff as compensation for forfeited entitlements from previous employment
PSP: Performance period ended December 31, 2014
|
|
| ||||
| ||||||
|
|
PSP: Performance period ending December 31, 2015
Vesting is dependent on three separate performance measures of equal weighting: a TSR measure (comprising three comparator groups as set out in the 2013 Notices of Annual General Meetings), an EPS measure and a ROIC measure.1
|
| |||
| ||||
| ||||
|
Vesting percentage of EPS and ROIC tranches* | Average growth in adjusted | ROIC in the third | ||||
0% | below 5% p.a. | below 11.2% | ||||
33% | 5% p.a. | 11.2% | ||||
52.5% | 6% p.a. | 11.45% | ||||
65% | 7% p.a. | 11.7% | ||||
75% | 8% p.a. | 11.95% | ||||
85% | 9% p.a. | 12.2% | ||||
92.5% | 10% p.a. | 12.45% | ||||
100% | 11% p.a. or above | 12.7% or above |
External appointments
The Committee believes that the experience gained by allowing Executive Directors to serve as Non-Executive Directors on the boards of other organisations is of benefit to the Group. Accordingly, Executive Directors may, subject to the approval of the Chairman and the CEO (or the Chairman only in the case of the CEO), serve as non-executive directors on the boards of up to two non-associated companies (of which only one may be a major company) and they may retain remuneration arising from such appointments.
Nick Luff is a Non-Executive Director of Lloyds Banking Group plc and received fees of £45,000 since his appointment as a director of the Group up to the end of 2014. Duncan Palmer is a Non-Executive Director of Oshkosh Corporation and received fees of £44,773 and 2,500 shares of Oshkosh common stock during the year up to the date of terminationthe 2017 Annual General Meetings of his employment withRELX PLC and RELX NV shareholders respectively and is hereby incorporated by reference to Exhibit 15.3. The 2017 grants under the Group (£63,141 in 2013).multi-year incentive plans to Executive Directors were made under this policy.
Payments to pastAt the 2017 Annual General Meetings, RELX PLC shareholders approved a new remuneration policy for Executive Directors and paymentsNV shareholders approved amendments to the Executive Directors’ remuneration policy which is set out on pages 96 to 102 of the Group’s Annual Reports and Financial Statements 2017 and is incorporated herein by reference to Exhibit 15.2. The first multi-year incentive grants under the new policy will be made in 2018.
The policy relating to payment for loss of office
There have been no payments to past Directors or payments for loss of office in 2014 other than those included in the Single Total Figure table and the notes thereto.
Statement of Directors’ shareholdings and other share interests
Shareholding requirement
The Committee believes that a closer alignment of interests can be created between senior management and shareholders if executives build and maintain a significant personal stake in the company. The shareholding requirements applicable to the Executive Directors areandNon-Executive Directors is set out in the table below. Shares that count for this purpose are any type of Reed Elsevier PLC or Reed Elsevier NV security owned outright by the individual and their spouse, civil partner or dependent child.
Meeting the shareholding requirement is both a vesting condition for awards granted and a requirementon pages 100 to maintain eligibility for future awards. Shareholding requirements fall away on leaving the Group.
On December 31, 2014, the Executive Directors’ shareholdings were as follows (valued using the middle market closing prices102 of the relevant securities):Group’s Annual Reports and Financial Statements 2017 and is incorporated herein by reference to Exhibit 15.2.
| Shareholding requirement (% of 31 December 2014 annual base salary) | Actual shareholding as at 31 December 2014 (% of 31 December 2014 annual base salary) | |||
Erik Engstrom | 300% | 830% | ||
Nick Luff | 200%* | 59% |
Share interests
See page 65.
Performance graphs
The graphs below show total shareholder returns for Reed Elsevier PLC and Reed Elsevier NV, calculated on the basis of the average share price in the 30 trading days before the respective year end and assuming dividends were reinvested. Reed Elsevier PLC’s performance is compared with the FTSE 100 and Reed Elsevier NV with the AEX Index (to reflect their respective memberships of those indices), over the five years from December 31, 2009 to December 31, 2014. This period also reflects the tenure of the CEO and the TSR performance period for the final tranche of the REGP. The three-year charts cover the performance period of the 2012-14 cycles of BIP and ESOS.
3 years
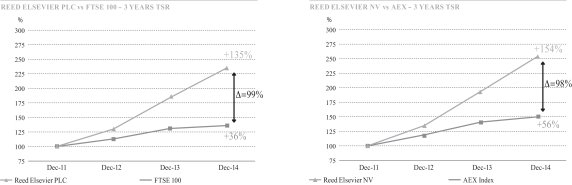
5 years
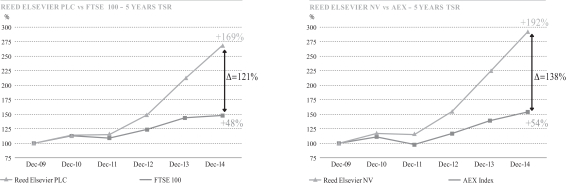
10 years
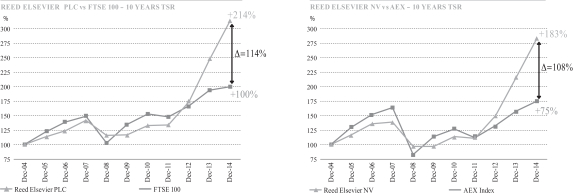
UK regulations require disclosure of the relative share performance for the six-year period, 2009-2014, of Reed Elsevier PLC. During that period the total return for the FTSE 100 was +94% while TSR for Reed Elsevier PLC was +170%, an outperformance of 76 percentage points.
CEO historical pay table
The table below shows the historical CEO pay over a seven-year period. 2008 has been included to show the pre-2009 position, as 2009 was a transition year with three CEO incumbents.
£‘000 | 2008 | 20093 | 2010 | 2011 | 2012 | 2013 | 2014 | |||||||||||||||||||||||||||||
| CEO | Sir Crispin Davis | Sir Crispin Davis | Ian Smith | Erik Engstrom | Erik Engstrom | Erik Engstrom | Erik Engstrom | Erik Engstrom | Erik Engstrom | |||||||||||||||||||||||||||
Annualised base salary | 1,181 | 1,181 | 900 | 1,000 | 1,000 | 1,025 | 1,051 | 1,077 | 1,104 | |||||||||||||||||||||||||||
Annual incentive payout as a % of maximum | 61% | 30% | 37% | 71% | 67% | 66% | 73% | 70% | 71% | |||||||||||||||||||||||||||
Multi-year incentive vesting as a % of maximum | 100% | 0% | 0% | 0% | 0% | 0% | 70% | 4 | 96% | 4 | 90% | 4 | ||||||||||||||||||||||||
CEO total (UK statutory basis)1 | 7,193 | 706 | 1,033 | 426 | 3,140 | 2,738 | 11,145 | 5 | 5,425 | 16,176 | 6 | |||||||||||||||||||||||||
CEO total (Dutch Civil Code basis)2 | 6,631 | (514 | ) | 1,033 | 431 | 2,675 | 5,045 | 5,443 | 6,067 | 6,808 | ||||||||||||||||||||||||||
Comparison of change in CEO pay with change in employee pay
The table below shows the percentage change in remuneration (salary, benefits and annual incentive) from 2013 to 2014 for the CEO compared with the average employee.
| % change from 2013 to 2014 | ||||||||
| CEO | Average employee* | |||||||
Salary | 2.5% | 2.5% | ||||||
Benefits | 2.0% | 2.5% | ||||||
Annual incentive | 3.1% | 3.3% | ||||||
Relative importance of spend on pay
The following table sets out the total employee costs for all employees, as well as the amounts paid in dividends and share repurchases.
| 2014 (£m) | 2013 (£m) | % change | ||||||||||
Employee costs* | 1,709 | 1,775 | -4% | |||||||||
Dividends | 565 | 549 | +3% | |||||||||
Share repurchases | 600 | 600 | 0% | |||||||||
Implementation of remuneration policy in 2015
Salary: The Committee has awarded a salary increase of 2.5% to the Executive Directors, which means that, from January 1, 2015, Erik Engstrom’s salary rose to £1,131,408 and Nick Luff’s salary to £666,250. This is in line with the guidelines agreed for employees in the Group’s most significant locations globally for 2015.
AIP: The operation of the AIP in 2015 remains the same as in 2014. Details of annual financial targets and KPOs are not disclosed as the Board believes that these are commercially sensitive and that disclosing them would give competitors an unfair insight into our strategic direction and annual execution plans. The targets are designed to be challenging relative to the 2015 execution plan.
Multi-year incentives: The award levels (% of salary) for 2015 are:
| CEO | CFO | |||
BIP opportunity | 100% | 100% | ||
LTIP | 250% | 200% | ||
ESOS | 250% | 200% |
The targets and vesting scales for the multi-year incentive awards granted in 2015 are as follows:
BIP: 2015-17cycle
Match earned on personal investment | Average growth in adjusted EPS over thethree-year performance period* | ROIC in the third year of the performance period* | ||
0% | below 4% p.a. | below 12.3% | ||
50% | 4% p.a. | 12.3% | ||
75% | 6.5% p.a. | 12.8% | ||
100% | 9% p.a. or above | 13.3% or above |
LTIP: 2015-17 cycle
Vesting is dependent on three separate performance measures of equal weighting: a TSR measure (comprising three comparator groups), an EPS measure and a ROIC measure.1
|
| |
| ||
| ||
|
Vesting percentage of EPS and ROIC tranches* 0% 33% 52.5% 65% 75% 85% 92.5% 100% Average growth in adjusted
EPS over the three-year
performance period ROIC in the third
year of the
performance
period below 5% p.a. below 12.3% 5% p.a. 12.3% 6% p.a. 12.55% 7% p.a. 12.8% 8% p.a. 13.05% 9% p.a. 13.3% 10% p.a. 13.55% 11% p.a. or above 13.8% or above
ESOS: 2015-2017 cycle
| ||
| ||
| ||
| ||
|
Remuneration Committee advice
The Committee consists of independent Non-Executive Directors and the Chairman of RELX Group plc. Details of members are contained in the section, “— Directors” on page 44. The Chief Legal Officer & Company Secretary attends meetings as secretary to the Committee. At the invitation of the Chairman of the Committee, the CEO of RELX Group plc attends appropriate parts of the meetings. The CEO of RELX Group plc is not in attendance during discussions about his remuneration.
The Human Resources Director advised the Committee during the year.
Towers Watson is the external adviser, appointed by the Committee through a competitive process. Towers Watson also provided actuarial and other human resources consultancy services to some of our companies during the year. The Committee is satisfied that the firm’s advice continues to be objective and independent, and that no conflict of interest exists. The individual consultants who work with the Committee do not provide advice to the Executive Directors, or act on their behalf. Towers Watson is a member of the Remuneration Consultants’ Group and conducts its work in line with the UK Code of Conduct for executive remuneration consulting. During 2014, Towers Watson received fees of £10,726 for advice given to the Committee, charged on a time and expense basis.
Compensation of executive officers
The aggregate compensation (salary, annual incentive, benefits, pension, cash allowance in lieu of pension and dividend equivalents received in respect of shares vested during 20142017 under BIP and LTIP) paid during 20142017 (and in respect of the annual incentive earned in respect of 2014)2017) to those who were executive officers (other than Directors) of RELX Group plc as at February 25, 201514, 2018 for the year ended December 31, 20142017 was £2,725,675,£2,019,068, which included contributions made to the pension plans in respect of such officers of £107,524.
29
ANNUAL REMUNERATION REPORT
The Annual Remuneration Report is set out on pages 84 to 95 of the Group’s Annual Reports and Financial Statements 2017 and is incorporated herein by reference to Exhibit 15.2.
30
Multi-yearExecutive Directors’ multi-year incentive interests
All outstanding unvested options and share awards in the tables below and on page 62 are subject to performance conditions.
For disclosure purposes, any PLC and NV ADRs awardedThis information is set forth under the BIP orheading ‘Multi-year incentive interests’ on pages 90 to 91 of the REGP have been converted into ordinary share equivalents. Between December 31, 2014Group’s Annual Reports and the date of this Annual Report on Form 20-F, there have been no changes in the options or share awards heldFinancial Statements 2017 and is incorporated herein by Executive Directors.reference to Exhibit 15.2.
Erik Engstrom
OPTIONS | Year of grant | Type of security | No. of options held on 1 Jan 2014 | No. of options granted during 2014 | Option price | No. of options exercised during 2014 | Market price per share at exercise | No. of options held on 31 Dec 2014 | Unvested options vesting on | Options exercisable until | ||||||||||||||||||||||||||||||
ESOS | 2006 | PLC ord | 178,895 | £ | 5.305 | 178,895 | £ | 9.138 | ||||||||||||||||||||||||||||||||
| NV ord | 120,198 | € | 11.470 | 120,198 | € | 15.755 | ||||||||||||||||||||||||||||||||||
| 2011 | PLC ord | 139,146 | £ | 5.390 | 139,146 | May 5, 21 | ||||||||||||||||||||||||||||||||||
| NV ord | 92,953 | € | 8.969 | 92,953 | May 5, 21 | |||||||||||||||||||||||||||||||||||
| 2012 | * | PLC ord | 198,836 | £ | 5.155 | 198,836 | May 2, 15 | May 2, 22 | ||||||||||||||||||||||||||||||||
| NV ord | 139,742 | € | 9.030 | 139,742 | May 2, 15 | May 2, 22 | ||||||||||||||||||||||||||||||||||
| 2013 | PLC ord | 178,799 | £ | 7.345 | 178,799 | May 9, 16 | May 9, 23 | |||||||||||||||||||||||||||||||||
| NV ord | 124,337 | € | 12.530 | 124,337 | May 9, 16 | May 9, 23 | ||||||||||||||||||||||||||||||||||
| 2014 | PLC ord | 145,604 | £ | 9.245 | 145,604 | Apr 7, 17 | Apr 7, 24 | |||||||||||||||||||||||||||||||||
| NV ord | 102,839 | € | 15.820 | 102,839 | Apr 7, 17 | Apr 7, 24 | ||||||||||||||||||||||||||||||||||
|
|
|
|
|
|
|
|
|
|
|
|
|
|
|
|
|
|
|
| |||||||||||||||||||||
Total PLC ords | 695,676 | 145,604 | 178,895 | 662,385 | ||||||||||||||||||||||||||||||||||||
Total NV ords | 477,230 | 102,839 | 120,198 | 459,871 | ||||||||||||||||||||||||||||||||||||
|
|
|
|
|
|
|
|
|
|
|
|
|
|
|
|
|
|
|
| |||||||||||||||||||||
SHARES | Year of grant | Type of security | No. of unvested shares held on 1 Jan 2014 | No. of shares awarded during 2014 | Market price per share at award | No. of shares vested/ performance tested during 2014 | Market price per share at vesting/ performance testing | No. of unvested/ non- performance tested shares held on 31 Dec 2014 | End of performance period | Date of release | ||||||||||||||||||||||||||||||
BIP | 2011 | NV ord | 122,352 | € | 8.969 | 110,728 | € | 15.975 | ||||||||||||||||||||||||||||||||
| 2012 | 1 | NV ord | 136,950 | € | 9.030 | 136,950 | Dec 2014 | H1 2015 | ||||||||||||||||||||||||||||||||
| 2013 | NV ord | 96,830 | € | 12.530 | 96,830 | Dec 2015 | H1 2016 | |||||||||||||||||||||||||||||||||
| 2014 | NV ord | 81,388 | € | 15.820 | 81,388 | Dec 2016 | H1 2017 | |||||||||||||||||||||||||||||||||
LTIP | 2013 | PLC ord | 178,799 | £ | 7.345 | 178,799 | Dec 2015 | H1 2016 | ||||||||||||||||||||||||||||||||
| NV ord | 124,337 | € | 12.530 | 124,337 | Dec 2015 | H1 2016 | ||||||||||||||||||||||||||||||||||
| 2014 | PLC ord | 145,604 | £ | 9.245 | 145,604 | Dec 2016 | H1 2017 | |||||||||||||||||||||||||||||||||
| NV ord | 102,839 | € | 15.820 | 102,839 | Dec 2016 | H1 2017 | ||||||||||||||||||||||||||||||||||
REGP2 | 2013 | PLC ord | 321,895 | £ | 7.760 | 321,895 | Dec 2014 | H1 2015 | ||||||||||||||||||||||||||||||||
| NV ord | 450,494 | € | 13.150 | 450,494 | Dec 2014 | H1 2015 | ||||||||||||||||||||||||||||||||||
|
|
|
|
|
|
|
|
|
|
|
|
|
|
|
|
|
|
|
| |||||||||||||||||||||
Total PLC ords |
| 500,694 | 145,604 | 646,298 | ||||||||||||||||||||||||||||||||||||
Total NV ords |
| 930,963 | 184,227 | 110,728 | 992,838 | |||||||||||||||||||||||||||||||||||
|
|
|
|
|
|
|
|
|
|
|
|
|
|
|
|
|
|
|
| |||||||||||||||||||||
Nick Luff
OPTIONS | Year of grant | Type of security | No. of options held on 1 Jan 2014 | No. of options granted during 2014 | Option price | No. of options exercised during 2014 | Market price per share at exercise | No. of options held on 31 Dec 2014 | Unvested options vesting on | Options exercisable until | ||||||||||||||||||||||||||||||
ESOS | 2014 | PLC ord | 65,656 | £ | 9.900 | 65,656 | Sep 2, 17 | Sep 2, 24 | ||||||||||||||||||||||||||||||||
| NV ord | 46,963 | € | 17.500 | 46,963 | Sep 2, 17 | Sep 2, 24 | ||||||||||||||||||||||||||||||||||
|
|
|
|
|
|
|
|
|
|
|
|
|
|
|
|
|
|
|
| |||||||||||||||||||||
Total PLC ords | 65,656 | 65,656 | ||||||||||||||||||||||||||||||||||||||
Total NV ords | 46,963 | 46,963 | ||||||||||||||||||||||||||||||||||||||
|
|
|
|
|
|
|
|
|
|
|
|
|
|
|
|
|
|
|
| |||||||||||||||||||||
SHARES | Year of grant | Type of security | No. of unvested shares held on 1 Jan 2014 | No. of shares awarded during 2014 | Market price per share at award | No. of shares vested/ performance tested during 2014 | Market price per share at vesting/ performance testing | No. of unvested/ non- performance tested shares held on 31 Dec 2014 | End of performance period | Date of release | ||||||||||||||||||||||||||||||
BIP | 2014 | PLC ord | 32,630 | £ | 9.900 | 32,630 | Dec 2016 | H1 2017 | ||||||||||||||||||||||||||||||||
| NV ord | 22,870 | € | 17.500 | 22,870 | Dec 2016 | H1 2017 | ||||||||||||||||||||||||||||||||||
LTIP | 2014 | PLC ord | 65,656 | £ | 9.900 | 65,656 | Dec 2016 | H1 2017 | ||||||||||||||||||||||||||||||||
| NV ord | 46,963 | € | 17.500 | 46,963 | Dec 2016 | H1 2017 | ||||||||||||||||||||||||||||||||||
PSP | 2014 | PLC ord | 65,656 | £ | 9.900 | 65,656 | Dec 2014 | H1 2015 | ||||||||||||||||||||||||||||||||
| NV ord | 46,963 | € | 17.500 | 46,963 | Dec 2014 | H1 2015 | ||||||||||||||||||||||||||||||||||
| 2014 | PLC ord | 65,656 | £ | 9.900 | 65,656 | Dec 2015 | H1 2016 | |||||||||||||||||||||||||||||||||
| NV ord | 46,963 | € | 17.500 | 46,963 | Dec 2015 | H1 2016 | ||||||||||||||||||||||||||||||||||
|
|
|
|
|
|
|
|
|
|
|
|
|
|
|
|
|
|
|
| |||||||||||||||||||||
Total PLC ords | 229,598 | 229,598 | ||||||||||||||||||||||||||||||||||||||
Total NV ords | 163,759 | 163,759 | ||||||||||||||||||||||||||||||||||||||
|
|
|
|
|
|
|
|
|
|
|
|
|
|
|
|
|
|
|
| |||||||||||||||||||||
Duncan Palmer |
| |||||||||||||||||||||||||||||||||||||||
SHARES | Year of grant | Type of security | No. of unvested shares held on 1 Jan 2014 | No. of shares awarded during 2014 | Market price per share at award | No. of shares vested/ performance tested during 2014 | Market price per share at vesting/ performance testing | No. of unvested/ non- performance tested shares held on 31 Dec 2014 | End of performance period | Date of release | ||||||||||||||||||||||||||||||
RSP* | 2012 | PLC ord | 72,042 | £ | 6.015 | 72,042 | £ | 9.781 | Sep 25, 14 | |||||||||||||||||||||||||||||||
| NV ord | 51,378 | 51,378 | € | 17.570 | Sep 25, 14 | |||||||||||||||||||||||||||||||||||
|
|
|
|
|
|
|
|
|
|
|
|
|
|
|
|
|
|
|
| |||||||||||||||||||||
Total PLC ords |
| 72,042 | 72,042 | |||||||||||||||||||||||||||||||||||||
Total NV ords |
| 51,378 | 51,378 | |||||||||||||||||||||||||||||||||||||
|
|
|
|
|
|
|
|
|
|
|
|
|
|
|
|
|
|
|
| |||||||||||||||||||||
THE GROUPThe Group
As of December 31, 20142017 we operated and/or had awards outstanding under a number of equity-based plans as follows:
| (i) | All-Employee Equity-Based Plans |
Our all-employee equity-based plans comprise theThe following two plans.plans are localall-employee equity based plans:
| (a) | UK SAYE Share Option Scheme (the SAYE Scheme) |
Options over Reed ElsevierRELX PLC ordinary shares have been granted under the SAYE Scheme. Shares may be acquired at not less than the higher of (i) 80% of the closing market price for the relevant share on The London Stock Exchange three dealing days before invitations to apply for options are issued, and (ii) if new shares are to be subscribed, their nominal value.
All UK employees of RELX Group plc and participating companies under its control in employment at the date of invitation are entitled to participate in the SAYE Scheme. In addition, the Directors of RELX Group plc may permit other employees of RELX Group plc and participating companies under its control to participate.
Invitations to apply for options may normally only be issued within 42 days after the announcement of our combinedconsolidated results for any period. No options may be granted more than 10 years after the approval of the scheme. A new 2013 SAYE Share Option Scheme was implemented during 2013, to replace2013. It replaced the 2003 SAYE Share Option Scheme, under which the final grant of options permitted within the scheme’s 10 year validity period was made during 2012. Outstanding options granted under the 2003 SAYE Share Option Scheme will remain capable of exercise until 2018.
On joining the SAYE Scheme, a save as you earn contract (a Savings Contract) must be entered into with an appropriate savings body, under which savings of between £10 and £500 per month may be made to such savings body for a period of three or five years. A bonus may be payable under the Savings Contract at the end of the savings period. Bonus rates are determined by HMRC. The amount of the monthly contributions may be reduced if applications exceed the number of Reed ElsevierRELX PLC ordinary shares available for the grant of options on that occasion.
The number of Reed ElsevierRELX PLC ordinary shares over which an option may be granted is limited to that number of shares which may be acquired at the exercise price out of the repayment proceeds (including any bonus) of the Savings Contract.
Options under the SAYE Scheme may normally only be exercised for a period of six months after the bonus date under the relevant Savings Contract. However, options may be exercised earlier than the normal exercise date in certain specified circumstances, including death, or on ceasing employment on account of injury, disability, redundancy, reaching contractualthe specified retirement age, or upon retirement under our self-standing retirement policy for the SAYE Scheme or the sale of the business or subsidiary for which the participant works, or on ceasing employment for any other reason, or provided the option has been held for at least three years. Exercise is allowed in the event of an amalgamation, reconstruction or take-over of the company whose shares are under option; alternatively, such options may, with the agreement of an acquiring company or a company associated with it, be exchanged for options over shares in the acquiring company or that associated company. Options may also be exercised in the event of the voluntarywinding-up of the company whose shares are under option. In the event that options are exercised before the bonus date, the participant may acquire only the number of shares that can be purchased with the accumulated savings up to the date of exercise, plus interest (if any).
In the event of any capitalisation or rights issue by Reed ElsevierRELX PLC or Reed ElsevierRELX NV, or of any consolidation, subdivision or reduction of their share capital, the number of shares subject to any relevant option and/or the exercise price may be adjusted with the approval of HMRC, subject to the independent auditors of RELX Group plc confirming in writing that such adjustment is, in their opinion, fair and reasonable.
Mr Engstrom and Mr LuffThe Executive Directors have waived their right to participate in the SAYE Scheme.
| (b) |
This facility consists of an annual issue by Reed ElsevierRELX NV of a convertible debenture loan (the Netherlands Convertible Debenture Stock Scheme) that is open for subscription by staff employed by our companies in the Netherlands or temporarily seconded to affiliates abroad. The interest rate of the scheme is determined quarterly on the basis of the highest market rates on internet savings accounts which can be withdrawn at a day’s notice in the Netherlands. Employees can annually subscribe for one or
31
more debentures of €200 each, up to a maximum amount equal to 20% of the equivalent of 15 times the employee’s fixed gross monthly salary, including any fixed monthly allowances, but excluding anynon-monthly salary components (holiday pay, annual incentives, profit shares etc). Interest is payable in arrears in the month of January following the subscription year. The loans have a term of 10 years. During the10-year term of the loan employees can decide to convert their claim on Reed ElsevierRELX NV into shares at an exercise price equal to the price of a Reed ElsevierRELX NV ordinary share on Euronext Amsterdam on the last dealing day of the month in which the employee has subscribed for the loan (the exercise price). Each debenture of €200 can be converted into 50 ordinary shares in Reed ElsevierRELX NV against payment of 50 times the exercise price, less €200.
There will be no further subscriptions under this plan as a share purchase plan for employees in the Netherlands has been introduced commencing in 2018 in lieu of the Netherlands convertible debenture stock arrangement.
| (ii) | Executive Equity-Based Plans |
Our executive equity-based plans comprise:
| (a) |
The details of how the REGP operates have been disclosed on page 51 of the 2013 Annual Report on Form 20-F. The performance measures and targets for the matching awards granted in 2013 are disclosed in the 2013 Annual Report on Form 20-F on page 62. No further awards have been or will be granted under this plan and the final tranche of awards vested on February 27, 2015.
| Long-term incentive |
The plans in this category comprise the Long-Term Incentive Plan 2013 (LTIP 2013), the Long-Term Incentive Plan 2010 (LTIP 2010) and the Long-Term Incentive Share Option Scheme 2003 (LTIS 2003). Details of the LTIP 2010 and the LTIS 2003 have been disclosed in previous years’ Annual Reports on Form 20-F.
The LTIP 2013 applies to senior executives (including executive officers and executive directors)Executive Directors). Awards may be granted as performance share awards ornil-cost options but it is currently intended to only grant performance share awards. Awards vest subject to performance measured over three financial years. Awards may be satisfied with new issue shares, a transfer of treasury shares or shares purchased in the market, but it is currently intended to continue the existing practice of satisfying awards with shares purchased in the market. The performance measures and targets applicable to awards granted in 20142017 under this plan are set out on pages 53 and 54.detailed in the table below. The vesting of awards is also subject to participants meeting a minimum shareholding requirement and continued employment (except for certain categories of approved leavers). Dividend equivalents accrue over the performance period and are paid out in cash at the end to the extent that the awards vest.
The LTIP 2010 has Further, shares vested from awards outstanding which were granted to the Executive Directors in 2012. No awards were granted under this plan in 2014.
The LTIS 2003 enabled the grant of options and restricted shares. Options previously granted under this plan vested2015 through to 2017 are subject to performance and will lapsea further six months holding period post vesting which has been increased to the extent they remain unexercised,two years for shares vested from awards granted to Executive Directors from 2018 onwards.
LTIP: 2017-19 cycle
Vesting is dependent on the tenth anniversarythree separate performance measures of the date of grant. No awards were made under the LTIS 2003 in 2014.equal weighting: a TSR measure (comprising three comparator groups), an EPS measure and a ROIC measure.(1)
Vesting percentage of each third of the TSR tranche(2) | TSR ranking within the relevant TSR comparator group | |
| 0% | below median | |
| 30% | median | |
| 100% | upper quartile |
| (1) | The calculation methodology for TSR, EPS and ROIC is set out in the 2013 Notices of Annual General Meeting, which can be found on the company’s website. |
| Each comparator group comprises approximately 40 companies. The companies for the 2017-19 LTIP cycle were selected on the same basis as the comparator groups for prior cycles under this plan. |
| (2) | Vesting is on a straight-time basis for performance between the minimum and maximum levels. |
Vesting percentage of EPS and ROIC tranches* | Average growth in adjusted EPS over the three-year performance period | ROIC in the third year of the performance period | ||
| 0% | below 5% p.a. | below 12.5% | ||
| 33% | 5% p.a. | 12.5% | ||
| 52.5% | 6% p.a. | 12.75% | ||
| 65% | 7% p.a. | 13.0% | ||
| 75% | 8% p.a. | 13.25% | ||
| 85% | 9% p.a. | 13.5% | ||
| 92.5% | 10% p.a. | 13.75% | ||
| 100% | 11% p.a. or above | 14.0% or above |
| * | Vesting is on a straigh-line basis for performance between the stated average adjusted EPS growth/ROIC percentages. |
32
| Executive share option schemes (ESOS) |
The plans in this category comprise the Executive Share Option Scheme 2013 (ESOS 2013) and the Share Option Scheme 2003 (ESOS 2003). Details of the ESOS 2003 have been disclosed in previous Annual Reports on Form20-F.
The ESOS 2013 applies to around 1,000 executives (including executive officers and executive directors).executives. Market value options are granted which vest (subject to performance in the case of executive directors)Executive Directors) after three years and remain exercisable, subject to continued employment, until the tenth anniversary of grant. Options may be satisfied with new issue shares, a transfer of treasury shares or shares purchased in the market, but it is currently intended to continue the existing practice of satisfying options with new issue shares. The performance measure and targets applicable to options granted in 20142017 under this plan to executive directorsExecutive Directors are set outforth on page 54.87 of the Group’s Annual Reports and Financial Statements 2017 and are incorporated herein by reference to Exhibit 15.2.
No further awards will be made under ESOS 2013 to Executive Directors from 2018. Outstanding unvested awards held by the executives and Directors will vest and become exercisable at the end of the relevant performance/vesting period, as applicable.
ESOS 2003 has options outstanding under it but no further options werehave been granted under this plan in 2014 and no future options will be granted under this plan.since 2013.
| Bonus investment plans (BIP) |
The Bonus Investment Plan 2010 (BIP 2010) (see page 50 of the 2013 annual report for a description of this plan) is a voluntary plan aimed at encouraging personal investment in, and ongoing holding of, ourRELX shares to promote greater alignment with shareholders and support the retention of key talent. Details of the BIP 2010 have been disclosed in previous Annual Reports on Form20-F.Awards were made in 20142017 under BIP 2010 to senior executives (including executive officers and Executive Directors). The performance measures and targets applicable to awards granted in 20142017 are set out on page 53.detailed in the table below.
No further awards will be made under the BIP from 2018. Outstanding unvested awards will vest at the normal time at the end of the applicable performance period.
BIP: 2017-19 cycle
Match earned on personal investment | Average growth in adjusted EPS over the three-year performance period* | ROIC in the third year of the performance period* | ||
| 0% | below 4% p.a. | below 12.5% | ||
| 50% | 4% p.a. | 12.5% | ||
| 75% | 6.5% p.a. | 13.0% | ||
| 100% | 9% p.a. or above | 13.5% or above |
| * | EPS and ROIC have equal weighting and straight-line vesting applies to performance between the points. |
| Retention Share Plan (RSP) and Restricted Share Plan (RSP 2014) |
The RSP has beenis used to facilitate the grant ofone-off awards of restricted shares, where appropriate, to senior new hires for example, to buy out share-based awards from previous employment. The restricted shares which have been awarded will be satisfied by shares purchased in the market and Executive Directors are not eligible to participate. In 2014, the RSP 2014 replaced the RSP for the type of awards described above.
In addition, since
33
Since 2006, employees eligible to participate in the ESOS (see (c)(b) above), other than Executive Directors, have been able to choose prior to the date of grant whether to receive all or part of their grant in the form of restricted shares based on apre-determined conversion ratio of one share for every five options that would otherwise be granted to them under ESOS. The RSP is the vehicle used to deliver the award of such restricted shares. The restricted shares vest after the expiry of three years from the date of grant, subject to the participant remaining employed by us or a participating company under our control. The restricted shares awarded are satisfied by shares purchased in the market.
Share options and conditional share awards
At February 25, 201514, 2018 the total number of ordinary shares subject to outstanding options was:
| Number of outstanding options | Options over shares | Option price range | ||||||||
UK SAYE Scheme | £ | 5.960-£ | ||||||||
Netherlands Convertible Debenture Stock Scheme | € | 4.781-€ | ||||||||
ESOS | £ | 4.665-£ | ||||||||
| € | 5.403-€ | |||||||||
| ||||||||||
Share options are expected, upon exercise, to be met principally by the issue of new ordinary shares, but may also be met from shares held by the Employee Benefit Trust.shares.
At February 25, 201514, 2018 the following conditional share awards were also outstanding:
| Number of outstanding awards | Awards over shares in | |||||||
| RELX PLC | |||||||
| RELX NV | ||||||||
LTIP | RELX PLC | |||||||
| RELX NV | ||||||||
| ||||||||
RSP | RELX PLC | |||||||
| RELX NV | ||||||||
| ||||||||
| * |
It is intended that these awards will be satisfied with shares purchased in the market.
THE GROUP
Share ownership
The interests of those individuals who were Directors of Reed ElsevierRELX PLC and Reed ElsevierRELX NV as at December 31, 20142017 in the issued share capital of the respective companies at the beginning and end of the year are shown below. Reed Elsevier PLCunder the heading ‘Statement of Directors’ shareholdings and Reed Elsevier NV ADRs are converted into ordinaryother share equivalents.interests’ on page 89 of the Group’s Annual Reports and Financial Statements 2017 and is incorporated herein by reference to Exhibit 15.2.
| Reed Elsevier PLC ordinary shares | Reed Elsevier NV ordinary shares | |||||||||||||||
| January 1, 2014 | December 31, 2014 | January 1, 2014 | December 31, 2014 | |||||||||||||
Erik Engstrom | 114,552 | 118,552 | 513,765 | 516,765 | ||||||||||||
Anthony Habgood | 50,000 | 50,000 | 25,000 | 25,000 | ||||||||||||
Wolfhart Hauser | 4,107 | 750 | 2,010 | |||||||||||||
Adrian Hennah | 5,163 | 10,508 | ||||||||||||||
Lisa Hook | 4,800 | 4,800 | ||||||||||||||
Marike van Lier Lels | ||||||||||||||||
Nick Luff | * | 17,187 | * | 12,106 | ||||||||||||
Robert Polet | 1,000 | 1,000 | ||||||||||||||
Linda Sanford | 3,600 | 6,700 | ||||||||||||||
Ben van der Veer | 5,000 | 7,000 | ||||||||||||||
The interests of the current Executive Directors of Reed ElsevierRELX PLC and Reed ElsevierRELX NV in the issued share capital of the respective companies as at March 9, 2015February 21, 2018 were:
| Interest in Reed Elsevier PLC ordinary shares* | Interest in Reed Elsevier NV ordinary shares* | Interest in RELX PLC shares | Interest in RELX NV shares | |||||||||||||
Erik Engstrom | 127,040 | 521,556 | 201,414 | 809,203 | * | |||||||||||
Nick Luff | 67,534 | 47,616 | 127,559 | 138,412 | ||||||||||||
| * |
34
Shares and options held by executive officers
The following table indicates the total aggregate number of Reed ElsevierRELX PLC and RELX NV securities beneficially owned (comprising ordinary shares and Reed Elsevier NV ordinary shares beneficially ownedADRs) and the total aggregate number of share options (comprising ordinary shares only) and conditional share awards (comprising ordinary shares and ADRs) held by the executive officers (other than Directors) of RELX Group plc (three persons) in office as of February 25, 2015:14, 2018:
| Reed Elsevier PLC ordinary shares | Reed Elsevier PLC ordinary shares subject to options | Reed Elsevier PLC conditional share awards | Reed Elsevier NV ordinary shares | Reed Elsevier NV ordinary shares subject to options | Reed Elsevier NV conditional share awards | |||||||||||||||||||
Executive officers (other than Directors) | 239,065 | 204,242 | 579,613 | 61,575 | 192,448 | 272,099 | ||||||||||||||||||
| RELX PLC shares | RELX PLC ordinary shares subject to options | RELX PLC conditional share awards | RELX NV shares | RELX NV ordinary shares subject to options | RELX NV conditional share awards | |||||||||||||||||||
Executive officers (other than Directors) | 369,885 | 124,249 | 147,610 | 121,479 | 177,401 | 215,494 | ||||||||||||||||||
In the table above, Reed Elsevier PLC and Reed Elsevier NV ADRs are converted into ordinary share equivalents.
The options over Reed ElsevierRELX PLC ordinary shares included in the above table are exercisable at prices ranging from £4.665£5.155 to £9.245£14.945 per share and between the 3rd anniversary of their respective grant date hereof and 2024.2027 (except for SAYE options which will be exercisable for six months from the respective maturity date). The options over Reed ElsevierRELX NV ordinary shares included in the above table are exercisable at prices ranging from €8.31€5.832 to €21.74€19.390 per share and between the 3rd anniversary of their respective grant date hereof(except for Dutch Debenture options which are exercisable from the date of subscription) and 2024.2027. The Reed ElsevierRELX PLC and Reed ElsevierRELX NV conditional share awards included in the above table will vest between 20152018 and 2017.
35
THE GROUP
During 2014,Membership of the Boards of Directors of Reed ElsevierRELX PLC, and Reed Elsevier NV managed their respective shareholdings in Reed Elsevier Group plc and Elsevier Reed Finance BV. Effective February 25, 2015, Reed Elsevier PLC and Reed Elsevier NV transferred their direct ownership interest in Elsevier Reed Finance BV to their jointly-owned company, Reed Elsevier Group plc and named this newly-combined single group entity RELX Group plc. For further information regarding this transfer and developments to the corporate structure, see Item 4: Organisational Structure on pages 23 to 24. The Boards of Reed Elsevier PLC, Reed Elsevier NV and RELX Group plc are harmonised.is aligned. All of the Directors of RELX Group plc are also Directors of Reed ElsevierRELX PLC and Reed ElsevierRELX NV. Reed ElsevierRELX NV may nominate for appointment up to twoNon-Executive Directors who are not appointed to the Boards of either Reed ElsevierRELX PLC or RELX Group plc. Currently, one such Director has been appointed to the Board of Reed Elsevier NV. Subject to shareholders of Reed ElsevierRELX PLC and Reed ElsevierRELX NV electing orre-electing retiring those Directors who are standing for election orre-election at their respective Annual General Meetings in 2015,2018, all the Directors of RELX Group plc will also be Directors of Reed ElsevierRELX PLC and of Reed ElsevierRELX NV. For a complete description ofadditional information regarding the Board membership positions and executive officer positions within the Group, see “— Directors”“Directors” and “Senior Management” on pages 44 to 46.page 28. Details of the membership of the Audit Committees of RELX Group plc, Reed ElsevierRELX PLC and Reed ElsevierRELX NV and details of the membership of the Remuneration Committee are given under “Directors” on page 44.28.
RELX GROUP PLC
The RELX Group plc Board consists of two Executive Directors and seven nineNon-Executive Directors. A person may only be appointed or proposed or recommended for appointment to the Board if that person has been nominated for that appointment by the joint Nominations Committee of Reed ElsevierRELX PLC and Reed ElsevierRELX NV. Persons nominated by the Nominations Committee will be required to be approved by the RELX Group plc Board, prior to appointment to the RELX Group plc Board.
Decisions of the Board of Directors of RELX Group plc require a simple majority, and the quorum required for meetings of the Board of RELX Group plc is any two Directors.
The RELX Group plc Board has established the following Committees:
| — | Audit — currently comprising |
| — | Remuneration — currently comprising three independentNon-Executive Directors and the Chairman of RELX Group plc. |
Copies of the terms of reference of the Audit Committee and the Remunerations Committee are available on request and can be viewed on our website, www.relx.com. The information on our website is not incorporated by reference into this report.
Arrangements established at the time of the merger of Reed ElsevierRELX PLC’s and Reed ElsevierRELX NV’s businesses provide that, if any person (together with persons acting in concert with him) acquires shares, or control of the voting rights attaching to shares, carrying more than 50% of the votes ordinarily exercisable at a general meeting of Reed ElsevierRELX PLC or Reed ElsevierRELX NV and has not made a comparable takeover offer for the other party, the other party may by notice suspend or modify the operation of certain provisions of the merger arrangements, such as (i) the right of the party in which control has been acquired (the “Acquired Party”) to appoint or remove directors of Reed ElsevierRELX PLC, Reed ElsevierRELX NV and RELX Group plc and (ii) the Standstill Obligations (defined below) in relation to the Acquired Party. Such a notice will cease to apply if the person acquiring control makes a comparable offer for all the equity securities of the other within a specified period or if the person (and persons acting in concert with him) ceases to have control of the other.
In the event of a change of control in one of one parent companyRELX PLC or RELX NV and not the other (where there has been no comparable offer for the other), the parent company which has not suffered the change in control will effectively have the sole right to remove and appoint directors of RELX Group plc. Also, a director removed from the Board of a parent companyRELX PLC or RELX NV which has suffered a change in control will not have to resign from the Board of the other parent company or RELX Group plc.
The articles of association of RELX Group plc contain certain restrictions on the transfer of shares in RELX Group plc. In addition, pursuant to arrangements established at the time of the merger, neither Reed ElsevierRELX PLC nor Reed ElsevierRELX NV may acquire or dispose of any interest in the share capital of the other or otherwise take any action to acquire the other without the prior approval of the other (the “Standstill Obligations”). The Panel on Takeovers and Mergers in the United Kingdom (the “Panel”) has stated that in the event of a change of statutory control of either Reed ElsevierRELX PLC or Reed ElsevierRELX NV, the person or persons acquiring such control will be required to make an offer to acquire the share capital of RELX Group plc held by the other, in accordance with the requirements of the City Code on Takeovers and Mergers in the United Kingdom. This requirement would not apply if the person acquiring statutory control of either Reed ElsevierRELX PLC or Reed ElsevierRELX NV made an offer for the other on terms which are considered by the Panel to be appropriate.
REED ELSEVIERRELX PLC
The Reed ElsevierRELX PLC Board currently consists of two Executive Directors and seven nineNon-Executive Directors. A person may only be appointed or proposed or recommended for appointment to the Board if that person has been nominated for that
36
appointment by the joint Nominations Committee of Reed ElsevierRELX PLC and Reed ElsevierRELX NV. Persons nominated by the Nominations Committee will be required to be approved by the Reed ElsevierRELX PLC Board, prior to the appointment to the Reed ElsevierRELX PLC Board. A copy of the terms of reference of the Nominations Committee is available on request and can be viewed on our website, www.relxgroup.com.www.relx.com. The information on our website is not incorporated by reference into this report.
Notwithstanding the provisions outlined above in relation to the appointment to the Board, Reed ElsevierRELX PLC shareholders retain their rights under Reed ElsevierRELX PLC’s articles of association to appoint Directors to the Reed ElsevierRELX PLC Board by ordinary resolution. Reed ElsevierRELX PLC shareholders may also, by ordinary resolution, remove a Director from the Board of Reed ElsevierRELX PLC, and in such circumstances that Director will also be required to be removed or required to resign from the Boards of Reed ElsevierRELX NV and RELX Group plc (except in circumstances where there has been a change of control of Reed ElsevierRELX PLC and not Reed ElsevierRELX NV).
The Reed ElsevierRELX PLC Board has also established the following Committees:
| — | Audit — currently comprising |
| — | Corporate Governance — a joint Committee of |
| — | Nominations — a joint Committee of |
RELX Group plc has established a Remuneration Committee, which is responsible for determining the remuneration policy (subject to shareholder approval) and monitoring and deciding its implementation for the Executive Directors of Reed ElsevierRELX PLC and RELX Group plc, and considering the remuneration for the Executive Directors of Reed ElsevierRELX NV.
Under the articles of association of Reed ElsevierRELX PLC, one third of the Directors shall retire from office and, if they wish, make themselves available forre-election by shareholders at the Annual General Meeting. Notwithstanding these provisions in the articles of association, in accordance with the provisions of the UK Corporate Governance Code all Directors normally retire and offer themselves forre-election at each Annual General Meeting.
REED ELSEVIERRELX NV
On May 8, 2013 and the unitary board governance structure became effective. Reed ElsevierRELX NV has a unitary board comprising both Executive andNon-Executive Directors. The Board currently comprises two Executive Directors and eight nineNon-Executive Directors. Directors shall be appointed by the General Shareholders’ Meeting upon a proposal of theNon-Executive Directors based on a nomination for appointment by the joint Nominations Committee of Reed ElsevierRELX NV and Reed ElsevierRELX PLC. The articles of association of Reed ElsevierRELX NV provide that a resolution of the General Shareholders’ Meeting to appoint a Director other than in accordance with a proposal of the Board can only be taken by a majority of at leasttwo-thirds of the votes cast if less thanone-half of Reed ElsevierRELX NV’s issued capital is represented at the meeting.
The General Shareholders’ Meeting of Reed ElsevierRELX NV shareholders may also, by ordinary resolution, resolve to suspend or dismiss each Director of Reed ElsevierRELX NV. In addition, each Executive Director of the Board can, at any time, be suspended by the Board. In such circumstances that Executive Director will also be required to be removed or required to resign from the Boards of Reed ElsevierRELX PLC and RELX Group plc (except in circumstances where there has been a change of control of Reed ElsevierRELX NV and not Reed ElsevierRELX PLC).
The Reed ElsevierRELX NV Board has established the following committees:
| — | Audit — currently comprising |
| — | Corporate Governance — a joint Committee of |
| — | Nominations — a joint Committee of |
RELX Group plc has established a Remuneration Committee, which is responsible for considering the remuneration for the Executive Directors of Reed ElsevierRELX NV, and determining the remuneration policy (subject to shareholder approval) and monitoring its implementation for the Executive Directors of RELX Group plc and Reed ElsevierRELX PLC.
Under the articlesArticles of associationAssociation of Reed ElsevierRELX NV, a Director of Reed ElsevierRELX NV shall retire no later than on the day on which the first General Meeting of Shareholders’ is held following the lapse of three years after his appointment, with the possibility ofre-appointment and shall retire periodically in accordance with a rotation plan drawn up by the Board. Notwithstanding these provisions in the articles of association, in accordance with the provisions of the UK Corporate Governance Code all Directors retire and seekre-appointment at each Annual General Meeting of Shareholders.Meeting. To align the arrangements regarding appointment for the Boards of Reed ElsevierRELX NV and Reed ElsevierRELX PLC annualre-appointment shall not affect the term of their three-year appointment. As a general rule, letters of appointment forNon-Executive Directors provide that, subject to annualre-election by
37
shareholders, individuals will serve for twoan initial period of three years, and are typically expected to be available to serve for a second three-year terms. The Nominations Committeeperiod, if invited to do so. They may recommend that individual Non-Executive Directorsalso be invited to serve up to onefor an additional three-year term.period of three years. A schedule with the anticipated dates of retirement of Directors is published on our website, www.relxgroup.com.www.relx.com. A copy of the terms of reference of the Nominations Committee is available on request and can be viewed on our website. The information on our website is not incorporated by reference into this report.
ELSEVIER REED FINANCE BV
During 2014, Elsevier Reed Finance BV had a two-tier board structure comprising a Management Board, consisting of three members, and a Supervisory Board, consisting of three members.
The number of people employed is disclosed in note 5 to the combinedconsolidated financial statements.statements, set forth in note 5 under the heading ‘Personnel’ on page 126 of the Group’s Annual Reports and Financial Statements 2017 and incorporated herein by reference to Exhibit 15.2.
The Board of RELX Group plc is fully committed to the concept of employee involvement and participation, and encourages each of its businesses to formulate its own tailor-made approach with theco-operation of employees. We are an equal opportunity employer, and recruit and promote employees on the basis of suitability for the job. Appropriate training and development opportunities are available to all employees. A code of ethics and business conduct applicable to employees within the Group has been adopted throughout its businesses.
38
ITEM 7:MAJOR SHAREHOLDERS AND RELATED PARTY TRANSACTIONS
REED ELSEVIERRELX PLC
Substantial share interests
As at March 6, 2015,February 22, 2018, we had been notified by the following shareholders that they held an interest of 3% or more in voting rights(1) of the issued share capital of Reed Elsevier PLC:
| ||||
| ||||
| ||||
| ||||
| ||||
RELX PLC. The number of shares and percentage interests stated abovebelow are as disclosed at the date on which the interests were notified to us.us:
Identity of Person or Group(2) | Number of Shares | % of Class | ||||||
BlackRock, Inc | 107,062,804 | 9.62 | ||||||
Invesco Limited | 58,810,637 | 5.03 | ||||||
Legal & General Group plc | 41,300,403 | 3.40 | ||||||
| (1) | Under the UK Disclosure and Transparency Rules, subject to certain limited exceptions, persons or groups with an interest of 3% or more in voting rights of the issued |
| (2) | Under the UK Large andMedium-sized Companies and Groups |
As far as Reed ElsevierRELX PLC is aware, except as disclosed herein, it is neither directly or indirectly owned nor controlled by one or more corporations or by any government.
At December 31, 20142017 there were 16,79513,530 ordinary shareholders, including the depositary for Reed ElsevierRELX PLC’s ADR programme, with a registered address in the United Kingdom, representing 99.85%95.06% of shares issued.
Reed ElsevierRELX PLC is not aware of any arrangements the operation of which may at a subsequent date result in a change in control of Reed ElsevierRELX PLC. The major shareholders of Reed ElsevierRELX PLC do not have different voting rights to other ordinary shareholders.
REED ELSEVIERRELX NV
Substantial share interests
As of March 6, 2015,February 22, 2018, we were aware of the following disclosable interests of 3% or more in the issued Reed ElsevierRELX NV shares based on the public database of and on notification received from the Netherlands Authority for the Financial Markets(1) or provided as a Schedule 13G filing(2):. The number of shares and percentage interests stated below are as disclosed on the date on which the interests were notified to us:
| ||||
| ||||
| ||||
| ||||
| ||||
| ||||
| ||||
| ||||
Identity of Person or Group | Number of Shares | % of Class | ||||||
RELX NV(3) | 54,292,694 | 5.18 | ||||||
Janus Henderson Group Plc | 52,462,008 | 5.00 | ||||||
The Bank of New York Mellon Corporation | 50,765,958 | 4.99 | ||||||
BlackRock, Inc | 49,301,998 | 4.97 | ||||||
Fil Limited | 34,423,641 | 3.37 | ||||||
Massachusetts Financial Services Company | 22,994,683 | 3.03 | ||||||
Jupiter Asset Management Limited | 31,545,168 | 3.01 | ||||||
| (1) | Under Article 5:38 of the Netherlands Financial Markets Supervision Act, any person acquiring or disposing of shares or voting rights in public companies established under the laws of the Netherlands listed on a stock exchange in the European Union, is required to notify the Netherlands Authority for the Financial Markets (AFM) without delay if such person knows, or should know, that such interest therein reaches, exceeds or drops below a 3%, 5%, 10%, 15%, 20%, 25%, 30%, 40%, 50%, 60%, 75% and 95% threshold. No interest in the shares or voting rights of |
| (2) | The Securities Exchange Act of 1934, as amended, requires any person who has, as at the end of the calendar year, a direct or indirect beneficial interest in 5% or more of the issued share capital of a company, to file a statement on Schedule 13G with the Securities and Exchange Commission reporting such interest within 45 days following the end of the calendar year. |
39
| (3) |
| Under Dutch regulations, |
As far as Reed ElsevierRELX NV is aware, except as disclosed herein, it is neither directly nor indirectly owned or controlled by any single corporation or corporations acting jointly, nor by any government.
Reed ElsevierRELX NV is not aware of any arrangements the operation of which may at a subsequent date result in a change in control of Reed ElsevierRELX NV. The major shareholders of Reed ElsevierRELX NV do not have different voting rights to other ordinary shareholders.
Transactions with joint ventures and key management personnel, comprising the Executive andNon-Executive Directors of Reed ElsevierRELX PLC and Reed ElsevierRELX NV, are set out in note 2928 to the combinedconsolidated financial statements. statements set forth under the heading ‘Related party transactions’ on pages 158 and 159 of the Group’s Annual Reports and Financial Statements 2017 and is incorporated herein by reference to Exhibit 15.2.
Further details of remuneration of key management personnel are set out in “Item 6 — Directors, Senior Management and Employees”.
40
FINANCIAL STATEMENTS
See Item 18: Financial Statements.Statements, incorporated herein by reference.
Subsequent events are set out in note 30 to the consolidated financial statements set forth under the heading ‘Subsequent events’ on page 159 of the Group’s Annual Reports and Financial Statements 2017 and is incorporated herein by reference to Exhibit 15.2.
DIVIDEND POLICY
Dividends to Reed ElsevierRELX PLC and Reed ElsevierRELX NV shareholders are, other than in special circumstances, equalised at the gross level, includinglevel. Until April 6, 2016, this included the benefit of thethen prevailing UK attributable tax credit of 10% available to certain Reed ElsevierRELX PLC shareholders. The UK government abolished these dividend tax credits with effect from April 6, 2016, so that dividends paid after this date are the same for both RELX PLC and RELX NV. As a result of this change, reported earnings per share also have the same value for each RELX PLC and RELX NV share from 2016. The exchange rate used for each dividend calculation as defined in the Reed Elsevier mergerRELX Group governing agreement is the average of the closingmid-pointspot euro/euro:sterling exchange rate averaged over a period offor the five consecutive business days commencing with the tenth business day before the announcement of the proposed dividend.dividend determination date. The Boards of Reed ElsevierRELX PLC and Reed ElsevierRELX NV have adopted dividend policies in recent years in respect of their equalised dividends that, subject to currency considerations, more closely align dividend growth with growth in adjusted earnings per share, consistent with the dividend normally being covered over the longer term at least two times by adjusted earnings per share (i.e. before the amortisation of acquired intangible assets, acquisition related costs, net financing charge on defined benefit pension schemes, disposal gains and losses and other non operatingnon-operating items, related tax effects, other deferred tax credits from intangible assets and exceptional prior year tax credits).
Reed Elsevier NV may resolve that the dividend to be paid on each R share shall be lower than the dividend to be paid on each ordinary share, but not less than 1% of the nominal value of an R share.
LEGAL PROCEEDINGS
Various of the Group’s subsidiaries operating in the United States have been the subject of legal proceedings and federal and state regulatory actions relating to data security breaches, pursuant to which unauthorised persons obtained personal identifying information from our databases, or alleged breaches of federal privacy laws in connection with the obtaining and disclosure by such subsidiaries of information without the consent of the individuals involved. The principal actions and investigations have been settled, with the substantial portion of cash payments agreed to be paid by these subsidiaries being reimbursed by insurance and third-party indemnities. The settlements generally require strict data security programs,programmes, submissions of regulatory reports andon-going monitoring by independent third parties to ensure our compliance with the terms of those settlements. While the costs of suchon-going monitoring will be borne by us, neither the costs of compliance nor the costs of suchon-going monitoring are expected to have a material adverse effect on our financial position or the results of our operations.
Many of the products offered by Risk Solutions& Business Analytics are subject to regulation under the US Fair Credit Reporting Act (“FCRA”), GrahamGramm Leach Bliley Act (“GLBA”), DriversDriver’s Privacy Protection Act (“DPPA”) and related state laws requiring that we meet certain obligations in connection with the disclosure of information. Certain of these laws further provide for statutory penalties and attorneysattorneys’ fees fornon-compliance. In the normal course of its business, Risk & Business InformationAnalytics deals with individual and class action lawsuits claiming violation of one or more of these statutes. Other than pending matters, to date, these cases have either been settled or successfully defended with a substantial portion of cash payments agreed to be paid by our insurance providers. These proceedings have not had, and are not expected to have, a material adverse effect on our financial position or the results of our operations.
We are party to various other legal proceedings arising in the ordinary course of our business, the ultimate resolutions of which are not expected to have a material adverse effect on our financial position or the results of our operations.
41
REED ELSEVIERRELX PLC
The Reed ElsevierRELX PLC ordinary shares are listed on the London Stock Exchange and the New York Stock Exchange. The London Stock Exchange is the principal trading market for Reed ElsevierRELX PLC ordinary shares. Trading on the New York Stock Exchange is in the form of American Depositary Shares (ADSs), evidenced by American Depositary Receipts (ADRs) issued by Citibank N.A., as depositary. Each ADS represents four Reed Elsevierone RELX PLC ordinary shares.share.
The table below sets forth, for the periods indicated, the high and low closing middle market quotations for the Reed ElsevierRELX PLC ordinary shares on the London Stock Exchange as derived from the Daily Official List of the London Stock Exchange and the high and low last reported sales prices in US dollars for the Reed ElsevierRELX PLC ADSs on the New York Stock Exchange, as derived from the New York Stock Exchange Composite Tape, and reported by Thomson Reuters Datastream:Bloomberg:
| Pence per ordinary share | US dollars per ADS | Pence per ordinary share | US dollars per ADS | |||||||||||||||||||||||||||||
Calendar Periods | High | Low | High | Low | High | Low | High | Low | ||||||||||||||||||||||||
2014 | 1,113 | 866 | 69.76 | 57.73 | ||||||||||||||||||||||||||||
2013 | 899 | 641 | 60.05 | 41.01 | ||||||||||||||||||||||||||||
2012 | 652 | 469 | 42.04 | 28.90 | ||||||||||||||||||||||||||||
2011 | 591 | 461 | 37.74 | 29.61 | ||||||||||||||||||||||||||||
2010 | 563 | 461 | 35.70 | 26.82 | ||||||||||||||||||||||||||||
2017 | 1,782 | 1,398 | 24.01 | 17.75 | ||||||||||||||||||||||||||||
2016 | 1,502 | 1,126 | 19.75 | 16.22 | ||||||||||||||||||||||||||||
2015 | 1,220 | 1,011 | 18.38 | 15.63 | ||||||||||||||||||||||||||||
2014(1) | 1,113 | 866 | 17.44 | 14.43 | ||||||||||||||||||||||||||||
2013(1) | 899 | 641 | 15.01 | 10.25 | ||||||||||||||||||||||||||||
2014 | ||||||||||||||||||||||||||||||||
2017 | ||||||||||||||||||||||||||||||||
Fourth Quarter | 1,113 | 938 | 69.76 | 59.69 | 1,782 | 1,668 | 24.01 | 22.47 | ||||||||||||||||||||||||
Third Quarter | 1,011 | 917 | 66.56 | 63.21 | 1,695 | 1,603 | 22.56 | 21.24 | ||||||||||||||||||||||||
Second Quarter | 959 | 866 | 65.27 | 58.39 | 1,717 | 1,544 | 22.14 | 19.74 | ||||||||||||||||||||||||
First Quarter | 935 | 878 | 62.56 | 57.73 | 1,566 | 1,398 | 19.81 | 17.75 | ||||||||||||||||||||||||
2013 | ||||||||||||||||||||||||||||||||
2016 | ||||||||||||||||||||||||||||||||
Fourth Quarter | 899 | 822 | 60.05 | 52.69 | 1,502 | 1,282 | 19.31 | 16.22 | ||||||||||||||||||||||||
Third Quarter | 854 | 761 | 54.39 | 46.18 | 1,471 | 1,390 | 19.75 | 18.50 | ||||||||||||||||||||||||
Second Quarter | 796 | 715 | 48.39 | 44.36 | 1,376 | 1,192 | 19.27 | 17.17 | ||||||||||||||||||||||||
First Quarter | 782 | 641 | 47.53 | 41.01 | 1,306 | 1,126 | 19.05 | 16.48 | ||||||||||||||||||||||||
2012 | ||||||||||||||||||||||||||||||||
2015 | ||||||||||||||||||||||||||||||||
Fourth Quarter | 652 | 598 | 42.04 | 38.25 | 1,220 | 1,119 | 18.32 | 17.16 | ||||||||||||||||||||||||
Third Quarter | 608 | 506 | 39.34 | 31.53 | 1,132 | 1,011 | 17.67 | 15.63 | ||||||||||||||||||||||||
Second Quarter | 565 | 469 | 36.24 | 28.90 | 1,179 | 1,035 | 17.44 | 16.21 | ||||||||||||||||||||||||
First Quarter | 563 | 509 | 35.75 | 31.44 | 1,188 | 1,066 | 18.38 | 16.19 | ||||||||||||||||||||||||
Month | ||||||||||||||||||||||||||||||||
February 2015 | 1,188 | 1,118 | 73.51 | 69.02 | ||||||||||||||||||||||||||||
January 2015 | 1,162 | 1,066 | 70.33 | 64.75 | ||||||||||||||||||||||||||||
December 2014 | 1,110 | 1,042 | 69.76 | 65.22 | ||||||||||||||||||||||||||||
November 2014 | 1,113 | 1,028 | 69.32 | 65.02 | ||||||||||||||||||||||||||||
October 2014 | 1,027 | 938 | 65.74 | 59.69 | ||||||||||||||||||||||||||||
September 2014 | 1,011 | 980 | 66.28 | 63.94 | ||||||||||||||||||||||||||||
February 2018 (through February 21, 2018) | 1,523 | 1,455 | 21.77 | 20.49 | ||||||||||||||||||||||||||||
January 2018 | 1,715 | 1,557 | 23.75 | 21.91 | ||||||||||||||||||||||||||||
December 2017 | 1,739 | 1,712 | 23.70 | 23.30 | ||||||||||||||||||||||||||||
November 2017 | 1,782 | 1,711 | 24.01 | 22.88 | ||||||||||||||||||||||||||||
October 2017 | 1,733 | 1,668 | 23.39 | 22.47 | ||||||||||||||||||||||||||||
September 2017 | 1,689 | 1,603 | 22.56 | 21.91 | ||||||||||||||||||||||||||||
| (1) | Following the corporate restructuring in 2015, as discussed in further detail on page 10, RELX PLC ADSs were adjusted such that one RELX PLC ADS represents one RELX PLC share. Prior period comparatives have been adjusted retrospectively to reflect this change. |
42
REED ELSEVIER
RELX NV
The Reed ElsevierRELX NV ordinary shares are quoted on Euronext Amsterdam NV and the New York Stock Exchange. Euronext Amsterdam NV is the principal trading market for Reed ElsevierRELX NV ordinary shares. Trading on the New York Stock Exchange is in the form of ADSs, evidenced by ADRs issued by Citibank N.A., as depositary. Each ADS represents two Reed Elsevierone RELX NV ordinary shares.share.
The table below sets forth, for the periods indicated, the high and low closing middle market quotations for the Reed ElsevierRELX NV Ordinary Sharesshares on Euronext Amsterdam NV as derived from theOfficiële Prijscourant of Euronext Amsterdam NV and the high and low last reported sales prices in US dollars for the Reed ElsevierRELX NV ADSs on the New York Stock Exchange, as derived from the New York Stock Exchange Composite Tape, and reported by Thomson Reuters Datastream:Bloomberg:
| € per ordinary share | US dollars per ADS | € per ordinary share | US dollars per ADS | |||||||||||||||||||||||||||||
Calendar Periods | High | Low | High | Low | High | Low | High | Low | ||||||||||||||||||||||||
2014 | 19.95 | 14.70 | 49.32 | 40.78 | ||||||||||||||||||||||||||||
2013 | 15.82 | 11.18 | 43.01 | 28.97 | ||||||||||||||||||||||||||||
2012 | 11.37 | 8.17 | 29.58 | 20.35 | ||||||||||||||||||||||||||||
2011 | 10.27 | 7.59 | 27.84 | 21.23 | ||||||||||||||||||||||||||||
2010 | 10.12 | 8.17 | 26.93 | 20.14 | ||||||||||||||||||||||||||||
2017 | 19.55 | 15.39 | 23.27 | 16.41 | ||||||||||||||||||||||||||||
2016 | 16.34 | 13.65 | 18.28 | 14.98 | ||||||||||||||||||||||||||||
2015 | 16.50 | 12.42 | 17.45 | 14.78 | ||||||||||||||||||||||||||||
2014(1) | 12.97 | 9.56 | 16.03 | 13.26 | ||||||||||||||||||||||||||||
2013(1) | 10.28 | 7.27 | 13.98 | 9.42 | ||||||||||||||||||||||||||||
2014 | ||||||||||||||||||||||||||||||||
2017 | ||||||||||||||||||||||||||||||||
Fourth Quarter | 19.95 | 16.42 | 49.32 | 42.03 | 19.55 | 18.21 | 23.27 | 21.43 | ||||||||||||||||||||||||
Third Quarter | 18.10 | 16.23 | 46.50 | 44.11 | 18.09 | 17.21 | 21.59 | 20.17 | ||||||||||||||||||||||||
Second Quarter | 16.85 | 14.70 | 45.94 | 40.78 | 18.88 | 17.36 | 21.10 | 18.56 | ||||||||||||||||||||||||
First Quarter | 16.23 | 15.09 | 44.51 | 40.89 | 17.36 | 15.39 | 18.64 | 16.41 | ||||||||||||||||||||||||
2013 | ||||||||||||||||||||||||||||||||
2016 | ||||||||||||||||||||||||||||||||
Fourth Quarter | 15.82 | 14.46 | 43.01 | 39.05 | 16.15 | 13.99 | 17.91 | 14.98 | ||||||||||||||||||||||||
Third Quarter | 15.07 | 13.00 | 40.55 | 33.68 | 16.34 | 15.43 | 18.28 | 17.21 | ||||||||||||||||||||||||
Second Quarter | 13.43 | 12.26 | 34.38 | 32.21 | 15.84 | 14.21 | 18.06 | 16.01 | ||||||||||||||||||||||||
First Quarter | 13.37 | 11.18 | 34.18 | 28.97 | 15.68 | 13.65 | 17.82 | 15.42 | ||||||||||||||||||||||||
2012 | ||||||||||||||||||||||||||||||||
2015 | ||||||||||||||||||||||||||||||||
Fourth Quarter | 11.37 | 10.23 | 29.58 | 26.50 | 16.50 | 14.34 | 17.45 | 16.30 | ||||||||||||||||||||||||
Third Quarter | 10.66 | 9.14 | 27.49 | 22.20 | 15.45 | 13.21 | 16.81 | 14.95 | ||||||||||||||||||||||||
Second Quarter | 9.73 | 8.17 | 25.97 | 20.35 | 15.65 | 13.74 | 16.58 | 15.23 | ||||||||||||||||||||||||
First Quarter | 9.64 | 8.79 | 25.76 | 22.36 | 15.40 | 12.42 | 16.75 | 14.78 | ||||||||||||||||||||||||
Month | ||||||||||||||||||||||||||||||||
February 2015 | 22.73 | 21.63 | 51.52 | 49.20 | ||||||||||||||||||||||||||||
January 2015 | 21.83 | 19.10 | 49.28 | 45.45 | ||||||||||||||||||||||||||||
December 2014 | 19.95 | 18.70 | 49.32 | 46.43 | ||||||||||||||||||||||||||||
November 2014 | 19.77 | 18.36 | 49.03 | 45.96 | ||||||||||||||||||||||||||||
October 2014 | 18.37 | 16.42 | 46.01 | 42.03 | ||||||||||||||||||||||||||||
September 2014 | 18.10 | 17.36 | 46.35 | 44.83 | ||||||||||||||||||||||||||||
February 2018 (through February 21, 2018) | 17.25 | 16.23 | 21.70 | 20.21 | ||||||||||||||||||||||||||||
January 2018 | 19.12 | 17.70 | 23.14 | 21.96 | ||||||||||||||||||||||||||||
December 2017 | 19.45 | 19.12 | 23.07 | 22.67 | ||||||||||||||||||||||||||||
November 2017 | 19.55 | 18.90 | 23.27 | 22.13 | ||||||||||||||||||||||||||||
October 2017 | 19.39 | 18.21 | 22.60 | 21.43 | ||||||||||||||||||||||||||||
September 2017 | 18.09 | 17.56 | 21.59 | 20.81 | ||||||||||||||||||||||||||||
| (1) | Following the corporate restructuring in 2015, as discussed in further detail on page 10, a bonus issue of RELX NV ordinary shares was declared such that one RELX NV ordinary share confers an equivalent economic interest to one RELX PLC ordinary share, and RELX NV ADSs were adjusted such that one RELX NV ADS represents one RELX NV ordinary share. Prior period comparatives for ordinary shares and ADSs have been adjusted retrospectively to reflect these changes. |
43
ITEM 10: ADDITIONAL INFORMATION
REED ELSEVIERRELX PLC
A copy of Reed ElsevierRELX PLC’s current Articles of Association (the “Articles”) is incorporated by reference fromfiled as Exhibit 4.11.1 to the Registration Statement onthis Form S-8 filed with the SEC on May 25, 2010 — see “Item 19: Exhibits” on pages S-3 and S-4.20-F.
The following is a summary of the current Articles. As a summary, it is not exhaustive and is qualified in its entirety by reference to UK law and the Articles.
Company’s Objects
Reed ElsevierRELX PLC’s objects are unrestricted.
Share Capital
As at December 31, 20142017 issued ordinary share capital comprised 1,205,397,3201,123.7 million shares of 14 51/116p. At December 31, 2014 the total2017 shares held in treasury were 77,730,978.totalled 63.6 million. Of these, 8,032,6433.5 million ordinary shares were held by the Employee Benefit Trust and 69,698,33560.1 million ordinary shares were held in treasury by Reed ElsevierRELX PLC. During 2014, Reed Elsevier2017, RELX PLC bought back35,251,501back 23.1 million ordinary shares to be held in treasury pursuant to the authority given by shareholders at the Annual General Meeting held on April 24, 201420, 2017 and the previous authority given by shareholders at the Annual General Meeting held on April 25, 2013.21, 2016. On December 27, 2017, RELX PLC cancelled 22.46 million ordinary shares held in treasury. These sharesshare purchases and cancellations are includedreflected in the number of ordinary shares held in treasury.treasury at December 31, 2017.
Reed ElsevierRELX PLC by ordinary resolution and subject to the UK Companies Act 2006 (the “Act”) may:
| 1. | Allot shares up to a limit of 1/3 of the issued share capital, a further 1/3 of the issued share capital may be allotted but only in connection with a fullypre-emptive rights issue; |
| 2. | Sub-divide all or part of the share capital into shares of a smaller nominal value than the existing shares; and |
| 3. | Consolidate and divide all or part of the share capital into shares of a larger nominal value than the existing shares. |
All shares created by an increase of Reed ElsevierRELX PLC’s share capital by consolidation, division orsub-division shall be subject to all the provisions of the Articles.
Reed ElsevierRELX PLC by special resolution and subject to the Act may:
| 1. | Disapply shareholderspre-emption rights on new issue shares up to a limit of 5% of the issued share |
| 2. | Buy back its own shares up to a limit of 10% of the issued share capital; and |
| 3. | Reduce its share capital. |
Transfer of ordinary shares
A certificated shareholding may be transferred in the usual form or in any other form approved by the Board. The Board in its discretion may refuse to register the transfer of a certificated share which is not fully paid and may also refuse to register the transfer of a certificated share unless the instrument of transfer:
| 1. | is stamped or certified and lodged, at the registered office or other place that the Board decide, accompanied by the relevant share certificate and any other evidence that the Board may reasonably require to prove a legitimate right to transfer; |
| 2. | is in respect of only one class of shares; and |
| 3. | is in favour of not more than four |
Where the Board refuses to register a transfer of certificated shares, it must notify the transferee of the refusal within two months after the date on which the instrument of transfer was lodged with Reed ElsevierRELX PLC.
For those members holding uncertificated shares, such transfers must be conducted using a relevant system as defined in the UK Uncertificated Securities Regulations 2001.
44
Untraced shareholders
Reed ElsevierRELX PLC is entitled to sell any of its ordinary shares if;
| 1. | during the period of twelve years prior to the publication of any advertisement stating the intent to sell, at least three dividends have become payable on the shares which have remained uncashed; and |
| 2. | during the period of three months following the publication of any advertisement stating the intent to sell, |
Dividend Rights
Subject to the provisions of the Act, the shareholders may by ordinary resolution declare a dividend no larger than the amount recommended by the Board. Interim dividends may also be payable if the Board deems that there is sufficient profit available for distribution. Except as otherwise provided by the rights attached to the shares, all dividends shall be declared and paid according to the amounts paid up on the shares on which the dividend is declared. No dividend payable in respect of a share shall bear interest against Reed ElsevierRELX PLC, unless otherwise provided by the rights attached to the share.
Unclaimed dividends
Any dividend which remains unclaimed for 12 years from the date when it became due for payment shall, if the Board so resolves, be forfeited and cease to be owed by Reed ElsevierRELX PLC to the shareholder. Reed ElsevierRELX PLC may stop issuing dividend cheques or warrants:
| 1. | Where on at least two consecutive occasions dividend cheques/warrants are left uncashed or returned undelivered; or |
| 2. | Where after one such occasion reasonable enquiries have failed to establish an updated address. |
If the member goes on to claim a dividend or warrant, Reed ElsevierRELX PLC must recommence issuing dividend cheques and warrants.
Distribution of assets on winding up
In the event of Reed ElsevierRELX PLC being wound up, on the authority of a special resolution of Reed ElsevierRELX PLC and subject to the UK Insolvency Act 1986 (as amended) the liquidator may:
| 1. | Divide among the members the whole or any part of the assets of |
| 2. | Value any assets and determine how the division should be made between the members or different classes of members. |
| 3. | Place the whole or any part of the assets in trust for the benefit of the members and determine the scope and terms of these trusts. |
A member cannot be compelled to accept an asset with an inherent liability.
Variation of rights
Subject to the Act, where the capital of Reed ElsevierRELX PLC is divided into different classes of shares, the unique rights attached to the respective classes may be varied or cancelled:
| 1. | With the written consent of the holders of 75% in nominal value of the issued shares of the class (excluding any treasury shares held in that class); or |
| 2. | By authority of a special resolution passed at a separate general meeting of the holders of the shares of the class. |
General meetings of shareholders
Subject to the Act, Reed ElsevierRELX PLC must hold a general meeting as its annual general meeting within six months from January 1 every year. The Board may convene a general meeting when necessary and must do so promptly upon requisition by the shareholders. The notice period for annual general meetings is 21 clear days and 14 clear days for other general meetings. Subject to the Act and the Articles, the notice shall be sent to every member at their registered address. If, on two consecutive occasions notices are sent to a members registered address and have been returned undelivered the member shall not be entitled to receive any subsequent notice.
45
Voting rights
On a poll, every shareholder present in person or by proxy has one vote for every share of which he is the holder. No member is entitled to vote on a partly paid share. The Board also has the discretion to prevent a member from voting in person or by proxy if they are in default of a duly served notice under section 793 of the Act, concerning a request for information about interest in Reed ElsevierRELX PLC’s shares.
Directors’ Interests
Subject to the provisions of the Act, where a Director declares an interest to the Board, the Board may authorise the matter proposed to it which would otherwise constitute a conflict of interest and place a Director in breach of their statutory duty. Such authorisation is effective where the Director in question is not included in the quorum for the meeting and the matter was agreed without their vote, or would have been agreed to had their vote not been counted. A Director’s duty to declare an interest does not apply in the circumstances provided for by section 177(5) and 177(6) of the Act. A Director:
| 1. | May be a party to, or otherwise interested in, any transaction or arrangement with |
| 2. | May act solely or with his firm in a professional capacity (not as auditor) for |
| 3. | May be interested in a body corporate in which |
A Director with a declared interest that has been authorised by the Board, is not accountable to Reed ElsevierRELX PLC or its shareholders for any benefits received.
Directors’ Remuneration
The remuneration of any Executive Director shall be determined by the Board in accordance with Reed ElsevierRELX PLC’s Remuneration Policy and may include (without limitation) admission to or continuance of membership of any scheme (including share acquisition schemes), life assurance, pension provision or other such benefits payable to the Director on or after retirement, or to his dependants on or after death.
For Directors who do not hold an executive position in Reed ElsevierRELX PLC, their ordinary remuneration shall not exceed in aggregate £500,000 per annum or such higher amount as Reed ElsevierRELX PLC may determine by ordinary resolution from time to time. Each Director shall be paid a fee for their services which is deemed to accrue from day to day at such rate as determined by the Board.
The Directors may grant extra remuneration to any Director who does not hold executive office but sits on any committee of the Board, or performs any other special services at the request of Reed ElsevierRELX PLC. This extra remuneration may be paid in addition to, or in substitution for the ordinary remuneration.
Directors’ appointment/retirement/removal
The Board may appoint a person willing to act as Director, either to fill a vacancy or as an additional Director, provided the upper limit set by the Articles is not exceeded. Reed ElsevierRELX PLC may by ordinary resolution remove any Director from office, no special notice need be given and no Director proposed for removal under the Articles has a right of protest against such removal. Directors are not required to hold any shares by way of qualification. Directors are not subject to an age limit requirement for retirement.
Borrowing powers
Subject to the Act, the Board may exercise all the powers of Reed ElsevierRELX PLC to borrow money, guarantee, indemnify, mortgage or charge its undertaking, property, assets (present and future) and uncalled capital and to issue debentures and other securities whether outright or as collateral security for any debt, liability or obligation of Reed ElsevierRELX PLC or of any third party. Without the authority of an ordinary resolution the directors are prohibited from borrowing an amount equal to the higher of (i) eight thousand million pounds; and (ii) two and a half times the adjusted total of capital and reserves.
Indemnity
Subject to the Act, without bar to any other existing indemnity entitlements, Reed ElsevierRELX PLC may use its assets to indemnify a Director against liability incurred through negligence, default, breach of duty or breach of trust in relation to Reed ElsevierRELX PLC’s affairs.
REED ELSEVIER
46
RELX NV
The following is a summary of the principal provisions of Reed ElsevierRELX NV’s Articles of Association (the “Articles”). As a summary, it is not exhaustive and is qualified in its entirety by reference to Dutch law and the Articles as they read in the Dutch language. The Articles were last amended before a civil law notary in Amsterdam on October 21, 2014June 30, 2015 after a shareholders’ resolution was passed to approve such amendment at athe Annual General Shareholders’ Meeting held on October 21, 2014.April 22, 2015. A copy of the current Articles is filed as Exhibit 1.2 — see “Item 19: Exhibits” on pagesto this FormS-3 and S-4.20-F.
Share Capital
Reed Elsevier NV has two types of shares:As at December 31, 2017 RELX NV’s issued share capital comprised 1,000.0 million ordinary shares of 0.07 euro nominal value and R shares of 0.70 euro nominal value. At the General Shareholders’ Meeting, each ordinary share is entitled to cast one vote. Each R share is convertible into 10 ordinary shares and is entitled to cast ten (10) votes. Otherwise it has the same rights as an ordinary share, except that Reed Elsevier NV may pay a lower dividend on an R share, but not less than 1% of the nominal value of an R share. The ordinary shares are listed at Euronext Amsterdam and ADRs in respect of the ordinary shares are listed on the NYSE New York.
As at December 31, 2014 Reed Elsevier NV’s issued share capital comprised 697,153,245 ordinary shares and 4,303,179 R shares. At December 31, 2014 the total2017 shares held in treasury were 49,279,276.totalled 56.4 million. Of these 5,337,7823.8 million ordinary shares were held by the Employee Benefit Trust and 41,298,544 ordinary52.6 million shares and 264,295 R shares (equivalent to 2,642,950 ordinary shares) were held in treasury by Reed ElsevierRELX NV.
At the extraordinary general meeting of shareholders of Reed Elsevier NV held in October 2014, the shareholders approved the reduction of the capital of Reed Elsevier NV by the cancellation of up to 40 million of its ordinary shares held in treasury. Following the shareholders’ meeting, the Board filed a declaration for the cancellation of 40 million ordinary shares with the Trade Register at the Chamber of Commerce on October 22, 2014. The 40 million ordinary shares of Reed Elsevier NV were subsequently cancelled with effect from December 24, 2014.
At the 20142017 Annual General Shareholders’ Meeting, shareholders passed a resolution delegating the authority to the Board to acquire shares in Reed ElsevierRELX NV for a period of 18 months from the date of the annual general meeting of shareholders and thereforeAnnual General Meeting up to and including October 22, 2015,18, 2018, for the maximum amount of 10% of the issued capital. During the year, 20,403,35121.4 million ordinary shares and additionally 107,901 R shares (equivalent to 1,079,010 ordinary shares) were purchased under this and the previous delegation of authority. On December 27, 2017, RELX NV cancelled 22.0 million ordinary shares held in treasury. These share purchases and cancellations are reflected in the number of ordinary shares held in treasury at December 31, 2017.
A resolution to renew the delegation of the authority to the Board to acquire shares in Reed ElsevierRELX NV will be submitted to the shareholders at the 20152018 Annual General Shareholders’ Meeting together with a proposal to reducefor approval of the capitalreduction of Reed Elsevier NVRELX NV’s capital by cancellation of up to 30 million of its ordinaryaccumulated shares held in treasury.
Ordinary shares can be registered in a shareholder’s name or held via a book-entry deposit under the Dutch Security Depositary Act.
Issuance of shares
Shares may be issued on the basis of a resolution of the general meeting of shareholders,General Meeting, which can designate this authority to the Board, provided that the aggregate nominal value up to which shares may be issued under this designated authority cannot exceedone-third of the sum of (i) Reed ElsevierRELX NV’s issued share capital at the time the resolution to make the designation is adopted and (ii) the aggregate nominal value of any rights granted by Reed ElsevierRELX NV to take up shares outstanding at that time.
Pre-emptive rights of existing shareholders may be restricted or excluded by a resolution of the general meetingGeneral Meeting and in the event of an issue of shares pursuant to a resolution of the Board, thepre-emptive rights can be restricted or excluded pursuant to a resolution of the Board if the Board is designated competent to do so by the general meeting.General Meeting.
Acquisition of Reed ElsevierRELX NV’s own shares
Reed ElsevierRELX NV is entitled to acquire its own fullypaid-up shares or depositary receipts thereof, provided that either the acquisition is for no consideration or that:
| (a) |
| (b) | the nominal value of the shares or depositary receipts thereof, which |
An acquisition of Reed ElsevierRELX NV’s own shares other than for no consideration is only permitted if the general meetingGeneral Meeting has granted authorisation to the Board. No voting rights may be exercised on shares held by Reed ElsevierRELX NV or a subsidiarySubsidiary and no dividend shall be paid on these shares.
The general meeting of shareholdersGeneral Meeting may at the proposal of the Board resolve to reduce Reed ElsevierRELX NV’s issued share capital through cancellation of shares or through reduction of the nominal value of shares by amendment of the Articles of Association, provided that the issued share capital or thepaid-up part thereof will not drop below the amount prescribed by the Dutch Civil Code.
Transfer of shares
The transfer of a share shall require an instrument intended for such purpose and the written acknowledgement by Reed ElsevierRELX NV of the transfer. The transfer of the rights of a Euroclear-participant with respect to ordinary shares which are included in the securities depositary system of Euroclear Nederland shall be effected in accordance with the provisions of the Dutch Security Depositary Act (Wetgiraaleffectenverkeer).
47
Dividend Rights
Each year the Board shall determine which part of the profits shown in the adopted profit and loss account shall be reserved. After allocation to reserves, the shareholders’ meetingGeneral Meeting shall determine the allocation of remaining profits. Distributions may be made only insofar as Reed ElsevierRELX NV’s equity exceeds the amount of the paid in and called up part of the issued share capital, increased by the reserves which must be kept by virtue of the law. Dividends shall be paid after adoption of the annual accounts showing that payment of dividends is permitted. Interim distributions may be payable, provided there is sufficient profit available for distribution in accordance with the aforementioned requirements as shown by interim accounts.Financial Statements.
The Board
Reed ElsevierRELX NV has a unitary board governance structure, comprising executiveExecutive and non-executiveNon-Executive directors. It is established board practice at Reed ElsevierRELX NV that the executiveExecutive and non-executive directorsNon-Executive Directors meet together. In performing their duties, the directorsDirectors shall act in accordance with the interests of Reed ElsevierRELX NV and the business connected with it.
The number of directorsDirectors is determined by the Board. The number of executive directors shall at all times be less than the number of non-executive directors.Non-Executive Directors.
Directors shall be appointed by the General Shareholders’ Meeting on the basis of a proposal of theNon-Executive Directors. Under the Articles, directors are appointed for a three-year term, with the possibility ofre-appointment. Notwithstanding these provisions in the articles of association and in accordance with the provisions of the UK Corporate Governance Code, all Directors seek annualre-appointment at the Annual General Meeting to align the arrangements regarding appointment for the Boards of Reed ElsevierRELX NV and Reed ElsevierRELX PLC.
Executive Directors
The Executive Directors are entrusted with the management of Reed ElsevierRELX NV. In performing their duties, the Executive Directors shall act in accordance with the interests of Reed ElsevierRELX NV and the business connected with it. The Board has established rules regarding the decision-making and working methods of the Executive Directors in addition to the Articles. In this context, the Board has also determined the duties for which each Executive Director in particular shall be responsible.
Non-Executive Directors
The duties of theNon-Executive Directors are to supervise the management of the Executive Directors and the general affairs in Reed ElsevierRELX NV and the business connected with it, and to assist the executive directorsExecutive Directors by providing advice. In performing their duties theNon-Executive Directors shall act in accordance with the interests of Reed ElsevierRELX NV and the business connected with it. TheNon-Executive Directors have established rules regarding their decision-making process and working methods in addition to the Articles.
Reed ElsevierRELX NV pursues a remuneration policy for the Executive Directors, which is determined by the general meetingGeneral Meeting upon a proposal by theNon-Executive Directors. The Remuneration Committee of RELX Group plc makes recommendations to theNon-Executive Directors of Reed ElsevierRELX NV with regard to the remuneration policy for Executive Directors and the remuneration in all its forms for the Executive Directors.
As a general rule,Non-Executive Directors serve for two three-year terms. Individual Directors may serve up to one additional three-year term.
Suspension/dismissal
Each Director can at any time be suspended or dismissed by the General Shareholders’ Meeting. In addition, each Executive Director can at any time be suspended by the Board.
Amendment of the Articles
Amendment of the Articles requires a shareholders’ resolution passed with an absolute majority of the votes cast, provided such resolution is passed at the proposal of the Board. Otherwise, a majority oftwo-thirds of the votes cast is required in a meeting at which at least half of Reed ElsevierRELX NV’s issued capital is represented. The notice for such a meeting must state that amendment of the Articles of Association is on the agenda. A copy of the full text of the proposed amendment of the Articles of Association must be made available free of charge to shareholders at the time of notice for the meeting. In accordance with Article 4342 of the Articles of Association, only certain provisions in the Articles including provisions governing appointments and dismissals of directorsDirectors can be amended upon a proposal of the Board.
48
General meetings of shareholders
At least once a year, a General Shareholders’ Meeting is held. Notices of a general meetingGeneral Meeting are posted on our website and are made in accordance with the relevant provisions of the law. This means that the meeting is called at no less than 42 calendar days notice by an announcement on ourthe RELX Group website. The agenda and explanatory notes for the General Shareholders’ Meeting are published in advance on the RELX Group website and are available at the listing agent and at the offices of Reed ElsevierRELX NV from the day of the notice.
The Articles of Association provide for a record date and this has been used at the recent General Shareholders’ Meetings. In accordance with Dutch law, the record date will be the 28th day before the date of the General Shareholders’ Meeting and the holder of shares as per the record date will be entitled to vote, irrespective of any transfer of such shares between the record date and the date of the general shareholders’ meeting.General Meeting.
The Annual General Shareholders’ Meeting discusses the annual report, adopts the annual accounts, resolves on a proposal to pay a dividend and votes on release from liability of the directorsDirectors as separate agenda items in the annual general shareholders’ meeting.Annual General Meeting.
Conflict of Interest—Directors
A Director shall not participate in the discussions and decision-making if he has a direct or indirect personal interest in the matter which is conflicting with the interests of Reed ElsevierRELX NV and the business connected with it. In case because of this no resolution can be adopted by the Executive Directors, theNon-Executive Directors will resolve on the matter. In case because of this no resolution can be adopted by theNon-Executive Directors, the general meetingGeneral Meeting will resolve on the matter.
Remuneration
The remuneration policy for Executive Directors is determined by the General Shareholders’ Meeting upon a proposal of theNon-Executive Directors. The remuneration of the Executive Directors is determined by theNon-Executive Directors in line with the remuneration policy agreed by the shareholders’ meeting.General Meeting. With respect to remuneration in the form of shares in Reed ElsevierRELX NV and/or rights to subscribe for such shares, theNon-Executive Directors will submit a proposal for approval to the shareholders’ meeting.General Meeting.
TheNon-Executive Directors receive an annual remuneration. The remuneration of eachNon-Executive Director individually, is determined by the Board, in line with due observance to the remuneration policy for non-executive directors.Non-Executive Directors. The maximum amount of annual remuneration shall be determined by the shareholders’ meetingGeneral Meeting and can only be adopted at the proposal of the Board. At the Annual General Meeting in 2011 the maximum amount of remuneration for theNon-Executive Directors was set at €600,000 per annum, for the proportion of the fees borne by Reed ElsevierRELX NV.
Dissolution of Reed ElsevierRELX NV
A resolution to dissolve Reed ElsevierRELX NV requires an absolute majority of the votes cast at the General Meeting of Shareholders.Meeting. The notice for such a meeting must state that dissolution will be on the agenda. If Reed ElsevierRELX NV is dissolved by a resolution of the general meeting, the executive directors shall be charged with the liquidation of Reed ElsevierRELX NV and the non-executive directorsNon-Executive Directors with the supervision thereof, subject to the relevant provisions of Book 2 of the Dutch Civil Code.
Assets which remain after payment of the debts shall be transferred to the holders of ordinary shares and the holders of class R shares in proportion to the nominal value of their shareholdings.
Indemnity
Under the Articles of Association, to the extent permissible by law, Reed ElsevierRELX NV shall indemnify and hold harmless each sitting and former directorDirector against the financial consequences of any liabilities or claims, brought by any party other than Reed ElsevierRELX NV itself or its group companies, in relation to acts or omissions performed or committed in that person’s capacity of director.
PROPOSED CHANGES TO CORPORATE STRUCTURE
Certain changes to the corporate structure of our combined businesses are being proposed for shareholder approval at the Annual General Meetings of Reed Elsevier PLC and Reed Elsevier NV to be held in April 2015. In addition, the Boards of those two companies are proposing to shareholders to change the corporate names of Reed Elsevier PLC and Reed Elsevier NV to RELX PLC and RELX NV, respectively. See “Item 4. Information on the Group—Organisational Structure” on pages 23 and 24.
There is currently no UK or Dutch legislation restricting the import or export of capital or affecting the remittance of dividends or other payments to holders of, respectively, Reed ElsevierRELX PLC ordinary shares who arenon-residents of the United Kingdom and Reed ElsevierRELX NV ordinary shares who arenon-residents of the Netherlands.
There are no limitations relating only tonon-residents of the United Kingdom under UK law or Reed ElsevierRELX PLC’s Articles on the right to be a holder of, and to vote, Reed ElsevierRELX PLC ordinary shares, or tonon-residents of the Netherlands under Dutch law or Reed ElsevierRELX NV’s Articles on the right to be a holder of, and to vote, Reed ElsevierRELX NV ordinary shares.
49
The following discussion is a summary under present law and tax authority practice of the material UK, Dutch and US federal income tax considerations relevant to the purchase, ownership and disposal of Reed ElsevierRELX PLC ordinary shares or ADSs and Reed ElsevierRELX NV ordinary shares or ADSs. This discussion applies to you only if you are a US holder, you hold your ordinary shares or ADSs as capital assets and you use the US dollar as your functional currency. It does not address the tax treatment of US holders subject to special rules, such as banks, dealers or traders in securities or currencies, insurance companies,tax-exempt entities, partnerships or other pass-through entities for US federal income tax purposes, holders ofwhich own (actually or constructively) 10% or more of Reed ElsevierRELX PLC, RELX NV or Reed Elsevier NV votingRELX Group plc shares (as measured by vote or value), persons holding ordinary shares or ADSs as part of a hedging, straddle, conversion or constructive sale transaction, persons that are resident or domiciled in the UK (or who have ceased to be resident in or became treated as resident outside the UK for the purpose of a double tax treaty (treatynon-resident) within the past five years of assessment, or, for departures before April 6, 2013, who have ceased to be resident or ordinarily resident or become treatynon-resident within the past five years of assessment) and persons that are resident in the Netherlands. The summary also does not discuss the US federal alternative minimum tax or the tax laws of particular states or localities in the US.
This summary does not consider your particular circumstances. It is not a substitute for tax advice.We urge you to consult your own independent tax advisors about the income, capital gains and/or transfer tax consequences to you in light of your particular circumstances of purchasing, holding and disposing of ordinary shares or ADSs.
As used in this discussion, “US holder” means a beneficial owner of ordinary shares or ADSs that is for US federal income tax purposes: (i) an individual US citizen or resident, (ii) a corporation, partnership or other business entity created or organised under the laws of the United States, any state thereof or the District of Columbia, (iii) a trust (a) that is subject to the control of one or more US persons and the primary supervision of a US court or (b) that has a valid election in effect under US Treasury regulations to be treated as a US person or (iv) an estate the income of which is subject to US federal income taxation regardless of its source.
UK Taxation
Dividends
Under current UK taxation legislation, no tax is required to be withheld at source from dividends paid on the Reed ElsevierRELX PLC ordinary shares or ADSs. A shareholder in Reed ElsevierDividends payable on the ADSs or RELX PLC who is an individual resident forordinary shares should not be chargeable to UK tax purposes in the United Kingdom may be entitled,hands of anon-UK resident unless such person (i) is a company carrying on a trade in calculating their liability tothe UK income tax, tothrough a tax creditUK permanent establishment, or (ii) carries on casha trade (or profession or vocation) in the UK and the dividends paid by Reed Elsevier PLC. The tax credit is equal to one-ninthare a receipt of the cash dividend.that trade.
Capital Gains
Shareholders may be liable for UK taxation on capital gains realised on the disposal of their Reed ElsevierRELX PLC ordinary shares or ADSs if at the time of the disposal the shareholder carries on a trade, profession or vocation in the United Kingdom through a branch or agency, or in the case of a company a permanent establishment, and such ordinary shares or ADSs are or have been used, held or acquired for the purposes of such trade, profession, vocation, branch, agency or permanent establishment.
UK Stamp Duty and Stamp Duty Reserve Tax
Current UK law includes a provision whereby UK stamp duty reserve tax (SDRT) or UK stamp duty is payable upon the transfer or issue of Reed ElsevierRELX PLC ordinary shares to the depositary in exchange for Reed ElsevierRELX PLC ADSs evidenced by ADRs. For this purpose, the current rate of stamp duty and SDRT is 1.5%, applied, in each case, to: (i) the issue price when the ordinary shares are issued; (ii) the amount or value of the consideration where shares are transferred for consideration in money or money’s worth; or (iii) the value of the ordinary shares in any other case. Following litigation, HMRC have accepted that they will no longer seek to apply the 1.5% SDRT charge on an issue of shares into a clearance service or depositary receipt system (or a transfer of shares into a clearance service or depositary receipt system, where such transfer is integral to the raising of capital by the company concerned) on the basis that the charge is not compatible with EU law. The UK government announced on 22 November 2017 as part of its Autumn Budget that it will not reintroduce such 1.5% charge once the UK leaves the EU in 2019. Accordingly no UK SDRT or UK stamp duty is payable upon the issue of Reed ElsevierRELX PLC shares to the depositary in exchange for Reed ElsevierRELX PLC ADSs evidenced by ADRs.ADRs (or upon the transfer of RELX PLC shares to the depositary in exchange for RELX PLC ADSs evidenced by ADRs, where such transfer is integral to the raising of capital by RELX PLC). HMRC’s view is that the 1.5% SDRT or stamp duty charge will continue to apply to a transfer of shares into a clearance service or depositary receipt system, unless they arewhere such transfer is not an integral part of the issueraising of share capital. This view is currently being challenged in further litigation.capital by the company concerned.
50
Provided that the relevant instrument of transfer is not executed in the UK and remains outside the UK, no UK stamp duty willshould in practice be payable on the acquisition or subsequent transfer of Reed ElsevierRELX PLC ADSs. Under current law, anAn agreement to transfer Reed ElsevierRELX PLC ADSs in the form of ADRs will not give rise to a liability to SDRT.
A transfer of Reed ElsevierRELX PLC ordinary shares by the depositary to an ADS holder where there is no transfer of beneficial ownership will not be chargeable to UK stamp duty or SDRT.
Purchases of Reed ElsevierRELX PLC ordinary shares, as opposed to ADSs, will generally give rise to UK stamp duty or SDRT at the time of transfer or agreement to transfer, normally at the rate of 0.5% of the amount payable for the ordinary shares. SDRT and UK stamp duty are usually paid by the purchaser. If the ordinary shares are later transferred to the depositary, additional UK stamp duty or SDRT may be payable as described above.
Inheritance tax
Subject to certain provisions relating to trusts and settlements, RELX PLC ordinary shares or ADSs held by an individual shareholder who is domiciled in the United States for the purposes of the Convention between the United States and the United Kingdom relating to estate and gift taxes and is not a UK national as defined in the Convention will not generally be subject to UK inheritance tax on the individual’s death (whether held on the date of death or gifted during the individual’s lifetime, and provided any applicable US federal gift or estate tax liability is paid), except where the ordinary share or ADS is part of the business property of a UK permanent establishment of the individual or pertains to a UK fixed base of an individual who performs independent personal services.
Dutch Taxation
Withholding tax
Dividends distributed to you by Reed ElsevierRELX NV are normally subject to a withholding tax imposed by the Netherlands at a rate of 15%, which rate equals the rate of tax that the Netherlands is generally allowed to levy under theUS-Netherlands income tax treaty. As a consequence, no administrative procedures for a partial relief at source from or a refund of Dutch dividend withholding tax need be complied with in respect of dividend distributions by Reed ElsevierRELX NV. Dividends include, among other things, stock dividends unless the dividend is distributed out of recognisedpaid-in share premium for Dutch tax purposes.
Taxation of dividends and capital gains
You will not be subject to any Dutch taxes on dividends distributed by Reed ElsevierRELX NV (other than the withholding tax described above) or any capital gain realised on the disposal of Reed ElsevierRELX NV ordinary shares or ADSs provided that (i) the Reed ElsevierRELX NV ordinary shares or ADSs are not attributable to an enterprise or an interest in an enterprise that you carry on, in whole or part through a permanent establishment or a permanent representative in the Netherlands, (ii) you do not have a substantial interest or a deemed substantial interest in Reed ElsevierRELX NV (generally, 5% or more of either the total issued and outstanding capital or the issued and outstanding capital of any class of shares) or, if you have such an interest, (a) it forms part of the assets of an enterprise, (b) you do not hold such interest with the avoidance of Netherlands (or foreign) (withholding) tax as (one of) the main purpose(s), or it forms(c) such interest does not form part of the assetsan artificial structure or series of an enterprise,structures (such as structures which are not put into place for valid business reasons reflecting economic reality), and (iii) if you are an individual, such dividend or capital gain from your Reed ElsevierRELX NV ordinary shares or ADSs does not form benefits from miscellaneous activities(“resultaatuitoverigewerkzaamheden”) in the Netherlands. Benefits from miscellaneous activities in the Netherlands include income and gains derived from the holding, whether directly or indirectly, of (a combination of) shares, debt claims or other rights (together, a “lucrative interest”) that the holder thereof has acquired under such circumstances that such income and gains are intended to be remuneration for work or services performed by such holder (or a related person) in the Netherlands, whether within or outside an employment relation, where such lucrative interest provides the holder thereof, economically speaking, with certain benefits that have a relation to the relevant work or services.
US Federal Income Taxation
Holders of the ADSs generally will be treated for US federal income tax purposes as owners of the ordinary shares represented by the ADSs. Accordingly, deposits of ordinary shares for ADSs and withdrawals of shares for ADSs will not be subject to US federal income tax.
Dividends
Dividends on Reed ElsevierRELX PLC ordinary shares or ADSs or Reed ElsevierRELX NV ordinary shares or ADSs (including any Dutch tax withheld) will generally be included in your gross income as ordinary income from foreign sources. The dollar amount recognised on receiving a dividend in pounds sterling or euros will be based on the exchange rate in effect on the date the
51
depositary receives the dividend, or in the case of ordinary shares on the date you receive the dividend, as the case may be, whether or not the payment is converted into US dollars at that time. Any gain or loss recognised on a subsequent conversion of pounds sterling or euros for a different amount will be US source ordinary income or loss. Dividends received will not be eligible for the dividends received deduction available to corporations. Dividends received will be included in net investment income for purposes of the 3.8% Medicare contribution tax applicable to certainnon-corporate US holders.
With respect to US holders who are individuals, certain dividends received from a qualified foreign corporation may be subject to reduced rates of taxation. A qualified foreign corporation includes a foreign corporation that is eligible for the benefits of certain comprehensive income tax treaties with the United States. United States Treasury Department guidance indicates that the United Kingdom is a country with which the United States has a treaty in force that meets these requirements, and Reed ElsevierRELX PLC believes it is eligible for the benefits of this treaty. Additionally, the same guidance indicates that the Netherlands is also a country with which the United States has a treaty in force that meets the above requirements, and Reed ElsevierRELX NV believes it is eligible for the benefits of this treaty. Individuals that do not meet a minimum holding period requirement during which they are not protected from the risk of loss or that elect to treat the dividend income as “investment income” pursuant to section 163(d)(4) of the US Internal Revenue Code of 1986, as amended, will not be eligible for the reduced rates of taxation. In addition, the rate reduction will not apply to dividends if the recipient of a dividend is obligated to make related payments with respect to positions in substantially similar or related property. This disallowance applies even if the minimum holding period has been met. US holders should consult their own tax advisors regarding the application of these rules given their particular circumstances.
Subject to certain conditions and limitations, foreign withholding taxes on dividends withheld at the appropriate rate may be treated as foreign taxes eligible for credit against your US federal income tax liability. For purposes of calculating the foreign tax credit, dividends paid on the ordinary shares or ADSs will be treated as income from sources outside the US and will generally constitute passive category income. Further, in certain circumstances, if you have held the ordinary shares or ADSs for less than a specified minimum period during which you are not protected from risk of loss, or are obligated to make payments related to the dividends, you will not be allowed a foreign tax credit for foreign taxes imposed on the dividends on the ordinary shares or ADSs. Individuals that treat a dividend as qualified dividend income may take into account for foreign tax credit limitation purposes only the portion of the dividend effectively taxed at the highest applicable marginal rate. The rules governing the foreign tax credit are complex. You are urged to consult your tax advisors regarding the availability of the foreign tax credit under your particular circumstances.
Dispositions
You will recognise a gain or loss on the sale or other disposition of ordinary shares or ADSs in an amount equal to the difference between your basis in the ordinary shares or ADSs and the amount realised. The gain or loss generally will be capital gain or loss. It will be long term capital gain or loss if you have held the ordinary shares or ADSs for more than one year at the time of sale or other disposition. Long term capital gains of individuals are eligible for reduced rates of taxation. Deductions for capital losses are subject to limitations. Any gain or loss you recognise generally will be treated as income from US sources for foreign tax credit limitation purposes.
If you receive pounds sterling or euros on the sale or other disposition of your ordinary shares or ADSs, you will realise an amount equal to the US dollar value of the pounds sterling or euros on the date of sale or other disposition (or in the case of cash basis and electing accrual basis taxpayers, if the ordinary shares or ADSs are traded on an established securities market, the settlement date for the sale or other disposition). You will have a tax basis in the pounds sterling or the euros that you receive equal to the US dollar amount received on the settlement date. Any gain or loss realised by a US holder between the sale date and the settlement date or on a subsequent conversion of pounds sterling or euros into US dollars will be US source ordinary income or loss. Gains recognised will be included in net investment income for purposes of the 3.8% Medicare contribution tax applicable to certainnon-corporate US holders.
Information Reporting and Backup Withholding Tax
Dividends from ordinary shares or ADSs and proceeds from the sale of the ordinary shares or ADSs may be reported to the Internal Revenue Service (IRS) unless the shareholder is a corporation or other exempt recipient. A backup withholding tax may apply to such amounts unless the shareholder (i) is a corporation, (ii) provides an accurate taxpayer identification number and otherwise complies with applicable requirements of the backup withholding rules, or (iii) otherwise establishes a basis for exemption. The amount of any backup withholding tax will be allowed as a credit against the holder’s US federal income tax liability and may entitle the holder to a refund, provided the required information is furnished to the IRS.
Certain US holders are required to report to the IRS information about their investment in ordinary shares or ADSs not held through an account with a domestic financial institution. Investors who fail to report required information are subject to substantial penalties. Investors should consult with their own tax advisers about the effect of this legislation on their investment in the ordinary shares or ADSs.
52
You may read and copy documents referred to in this annual report that have been filed or furnished with the SEC at the SEC’s public reference room located at 100 F Street NE, Washington, DC 20549-2521. Please call the SEC at1-800-SEC-0330 for further information on the public reference rooms and their copy charges.
The SEC also maintains a website at www.sec.gov that contains reports and other information regarding registrants that file electronically with the SEC. This annual report and other information submitted by us to the SEC may be accessed through this website.
53
ITEM 11: QUANTITATIVE AND QUALITATIVE DISCLOSURES ABOUT MARKET RISK
Market Risk
Our primary market risks are to changes in interest rates and exchange rates as well as liquidity and credit risk.
Net finance costs are exposed to interest rate fluctuations on borrowings, cash and cash equivalents. Upward fluctuations in interest rates increase the interest cost of floating rate borrowings whereas downward fluctuations in interest rates decrease the interest return on floating rate cash and cash equivalents. Interest expense payable on fixed rate borrowings is protected against upward fluctuations in interest rates but does not benefit from downward fluctuations. Our companies engage in foreign currency denominated transactions and are therefore subject to exchange rate risk on such transactions. Net finance costs are also exposed to changes in the fair value of derivatives (as a result of interest and exchange rate fluctuations) which are not part of a designated hedging relationship under IAS39 — Financial Instruments: Recognition and Measurement, and to ineffectiveness that may arise on designated hedging relationships. Our management of this interest rate risk and foreign exchange rate risk is described below.
We manage a portfolio of long termlong-term debt, short termshort-term debt and committed bank facilities to support our capital structure and are exposed to the risk that relevant markets are closed and debt cannot be refinanced on a timely basis. In addition, the credit spread at which we borrow is exposed to changes in market liquidity and investor demand. We manage this risk by maintaining a range of borrowing facilities and debt programmes with a maturity profile to facilitate refinancing.limit refinancing risk.
We have a credit exposure for the full principal amount of cash and cash equivalents held with individual counterparties. In addition, it haswe have a credit risk from the potential non performancenon-performance by counterparties to financial instruments; this credit risk normally being restricted to the amounts of any hedge gain and not the full principal amount being hedged. Credit risks are managed by monitoring the credit quality of counterparties and restricting the amounts outstanding with each of them.
Our management of the above market risks is described in further detail in note 1819 under the heading ‘Financial Instruments’ on pages F-39page 147 to F-40152 and in note 23 under the heading ‘Borrowings’ on page 154 to 155 to the consolidated financial statements of the combined financial statements.Group’s Annual Reports and Financial Statements 2017 and incorporated herein by reference to Exhibit 15.2.
Management of Interest Rate Risk and Foreign Exchange Rate Risk
We seek to limit our risk to interest and exchange rates by means of derivative financial instruments, including interest rate swaps, interest rate options, forward rate agreements and forward foreign exchange contracts. We only enter into derivative financial instruments to hedge (or reduce) the underlying risks described above.
We enter into interest rate swaps in order to achieve an appropriate balance between fixed and floating rate borrowings, cash and cash equivalents. Theyequivalents and to manage the risk associated with movements in interest rates. Interest rate swaps are used to hedge the effects of fluctuating interest rates on floating rate borrowings, cash and cash equivalents by allowing us to fix the interest rate on a notional principal amount equal to the principal amount of the underlying floating rate cash, cash equivalents or borrowings being hedged. They are also used to swap fixed interest rates payable on long term borrowings for a floating rate. Such swaps may be used to swap a whole fixed rate bond for floating rate or they may be used to swap a portion of the period or a portion of the principal amount for the floating rate.
Forward swaps and forward rate agreements are entered into to hedge interest rate exposures known to arise at a future date. These exposures may include new borrowings or cash deposits to be entered into at a future date or future rollovers of existing borrowings or cash deposits. Interest exposure arises on future, new and rollover borrowings and cash deposits because interest rates can fluctuate between the time a decision is made to enter into such transactions and the time those transactions are actually entered into. The purpose of forward swaps and forward rate agreements is to fix the interest cost on future borrowings or interest return on cash investments at the time it is known such a transaction will be entered into. The fixed interest rate, the floating rate index (if applicable) and the time period covered by forward swaps and forward rate agreements are known at the time the agreements are entered into. The use of forward swaps and forward rate agreements is limited to hedging activities; consequently no trading position results from their use. The hedging effect of forward swaps and forward rate agreements is the same as interest rate swaps. Similarly, Wewe use forward foreign exchange contracts to hedge the effects of exchange rate movements on our foreign currency revenue and operating costs.
Interest rate options protect against fluctuating interest rates by enabling us to fix the interest rate on a notional principal amount of borrowings or cash deposits (in a similar manner to interest rate swaps and forward rate agreements) whilst at the same time allowing us to improve the fixed rate if the market moves in a certain way. We use interest rate options from time to time when we expect interest rates to move in our favour but it is deemed imprudent to leave the interest rate risk completely unhedged. In such cases, we may use an option to lock in at certain rates whilst at the same time maintaining some freedom to benefit if rates move in its favour.
Where net finance costs are exposed to changes in the fair value of derivatives (as a result of interest and exchange rate fluctuations), Wewe manage this risk by designating derivatives in a highly effective hedging relationship unless the potential change in their fair value is deemed to be insignificant.
54
Derivative financial instruments
Derivatives are utilisedused to hedge (or reduce)manage the risks ofrisk associated with interest rate orand exchange rate movements and arethe Group does not enteredenter into unless such risks exist.speculative derivatives. Derivatives utilised, while appropriateused by the Group for hedging a particular kind of risk are not considered specialised or high-risk and are generally available from numerous sources.
Sensitivity Analysis
The following analysis sets out the sensitivity of the fair value of our financial instruments to selected changes in interest rates and exchange rates. The range of changes represents our view of the changes that are reasonably possible over a one year period.
The fair values of interest rate swaps, interest rate options, forward rate agreements and forward foreign exchange contracts set out below represent the replacement costs calculated using market rates of interest and exchange at December 31, 2014.2017. The fair value of long term borrowings has been calculated by discounting expected future cash flows at market rates.
Our use of financial instruments and itsour accounting policies for financial instruments are described more fully in notes 2 and 18note 19 to the combinedconsolidated financial statements.statements as set forth under the heading ‘Financial Instruments’ on page 147 to 152 of the Group’s Annual Reports and Financial Statements 2017 and are incorporated herein by reference to Exhibit 15.2.
(a) Interest Rate Risk
The following sensitivity analysis assumes an immediate 100 basis point change in interest rates for all currencies and maturities from their levels at December 31, 20142017 with all other variables held constant.
Financial Instrument | Fair Value December 31, 2014 | Fair Value Change | Fair Value December 31, 2013 | Fair Value Change | ||||||||||||||||||||
| +100 basis points | -100 basis points | +100 basis points | -100 basis points | |||||||||||||||||||||
| (In millions) | (In millions) | |||||||||||||||||||||||
Short term borrowings | £ | (548 | ) | £ | — | £ | — | £ | (287 | ) | £ | — | £ | — | ||||||||||
Long term borrowings (including current portion) | (3,682 | ) | 159 | (172 | ) | (3,360 | ) | 159 | (166 | ) | ||||||||||||||
Interest rate swaps (swapping fixed rate debt to floating) | 45 | (38 | ) | 40 | 92 | (47 | ) | 44 | ||||||||||||||||
Interest rate swaps (swapping floating rate debt to fixed) | — | — | — | — | 1 | — | ||||||||||||||||||
Financial Instrument | Fair Value December 31, 2017 | Fair Value Change | Fair Value December 31, 2016 | Fair Value Change | ||||||||||||||||||||
| +100 basis points | -100 basis points | +100 basis points | -100 basis points | |||||||||||||||||||||
| (In millions) | (In millions) | |||||||||||||||||||||||
Short-term borrowings | £ | (464 | ) | £ | — | £ | — | £ | (521 | ) | £ | — | £ | — | ||||||||||
Long-term borrowings (including current portion) | (4,717 | ) | 222 | (241 | ) | (4,727 | ) | 207 | (226 | ) | ||||||||||||||
Interest rate swaps (swapping fixed rate debt to floating) | 47 | (100 | ) | 108 | (7 | ) | (77 | ) | 83 | |||||||||||||||
A 100 basis point change in interest rates would not result in a material change to the fair value of other financial instruments.
At December 31, 2014, 52%2017, 44% of gross borrowings are either fixed rate or have been fixed through the use of interest rate swaps, forward rate agreements and options. A 100 basis point reduction in interest rates would result in an estimated decrease in net finance costs of £16£26 million (2013: £12(2016: £25 million), based on the composition of financial instruments including cash, cash equivalents, bank loans and commercial paper borrowings at December 31, 2014.2017. A 100 basis points rise in interest rates would result in an estimated increase in net finance costs of £16£26 million (2013: £12(2016: £25 million).
(b) Foreign Exchange Rate Risk
The following sensitivity analysis assumes an immediate 10% change in all foreign currency exchange rates against sterling from their levels at December 31, 20142017 with all other variables held constant. A +10% change indicates a strengthening of the currency against sterling and a-10% change indicates a weakening of the currency against sterling.
Financial Instrument | Fair Value December 31, 2014 | Fair Value Change | Fair Value December 31, 2013 | Fair Value Change | Fair Value December 31, 2017 | Fair Value Change | Fair Value December 31, 2016 | Fair Value Change | ||||||||||||||||||||||||||||||||||||||||
| +10% | -10% | +10% | -10% | +10% | -10% | +10% | -10% | |||||||||||||||||||||||||||||||||||||||||
| (In millions) | (In millions) | (In millions) | (In millions) | |||||||||||||||||||||||||||||||||||||||||||||
Cash and cash equivalents | £ | 276 | £ | 26 | £ | (26 | ) | £ | 132 | £ | 13 | £ | (13 | ) | £ | 111 | £ | 11 | £ | (11 | ) | £ | 162 | £ | 16 | £ | (16 | ) | ||||||||||||||||||||
Short term borrowings | (548 | ) | (48 | ) | 48 | (287 | ) | (26 | ) | 26 | ||||||||||||||||||||||||||||||||||||||
Long term borrowings (including current portion) | (3,682 | ) | (259 | ) | 259 | (3,360 | ) | (256 | ) | 256 | ||||||||||||||||||||||||||||||||||||||
Short-term borrowings | (464 | ) | (20 | ) | 20 | (521 | ) | (33 | ) | 33 | ||||||||||||||||||||||||||||||||||||||
Long-term borrowings (including current portion) | (4,717 | ) | (441 | ) | 441 | (4,727 | ) | (410 | ) | 410 | ||||||||||||||||||||||||||||||||||||||
Interest rate swaps (including cross currency interest rate swaps) | 5 | (2 | ) | 2 | 79 | 6 | (6 | ) | 47 | 5 | (5 | ) | (3 | ) | (1 | ) | 1 | |||||||||||||||||||||||||||||||
Forward foreign exchange contracts | 11 | (55 | ) | 55 | 92 | (62 | ) | 62 | 11 | (78 | ) | 78 | (123 | ) | (47 | ) | 47 | |||||||||||||||||||||||||||||||
A 10% change in foreign currency exchange rates would not result in a material change to the fair value of other financial instruments.
55
ITEM 12: DESCRIPTION OF SECURITIES OTHER THAN EQUITY SECURITIES
Fees and charges for American Depositary Receipt (ADR) holders
Citibank N.A., as depositary for the Reed ElsevierRELX PLC and Reed ElsevierRELX NV ADR programs,programmes, collects its fees for delivery and surrender of American Depositary Shares (ADSs) directly from investors depositing shares or surrendering ADSs for the purpose of withdrawal or from intermediaries acting for them. The depositary collects fees for making distributions to investors by deducting those fees from the amounts distributed or by selling a portion of distributable property to pay the fees. The depositary may collect its annual fee for depositary services by deductions from cash distributions or by directly billing investors or by charging the book-entry system accountsFinancial Statements of participants acting for them. The depositary may generally refuse to providefee-attracting services until its fees for those services are paid.
Persons depositing or withdrawing shares must pay | For | |
$5.00 (or less) per 100 ADSs (or portion of 100 ADSs) | Issuance of ADSs, including issuances resulting from a distribution of shares or rights or other property (in certain circumstances volume discounts may be available) | |
| Cancellation of ADSs for the purpose of withdrawal, including if the deposit agreement terminates | ||
$0.05 (or less) per ADS | Any cash distribution to ADS registered holders | |
A fee equivalent to the fee that would be payable if securities distributed to you had been shares and the shares had been deposited for issuance of ADSs | Distribution of securities distributed to holders of deposited securities which are distributed by the depositary to ADS registered holders | |
$0.05 (or less) per ADS per calendar year | Depositary services | |
Registration or transfer fees | Transfer and registration of shares on our share register to or from the name of the depositary or its agent when you deposit or withdraw shares | |
Expenses of the depositary | Cable, telex and facsimile transmissions (when expressly provided in the deposit agreement) | |
| Converting foreign currency to US dollars | ||
Taxes and other governmental charges the depositary or the custodian have to pay on any ADS or share underlying an ADS, for example, stock transfer taxes, stamp duty or withholding taxes | As necessary | |
Any charges incurred by the depositary or its agents for servicing the deposited securities | As necessary | |
Fees and other payments made by the depositary to the Group
In consideration of acting as depositary, Citibank N.A. has agreed to make certain reimbursements and payments to us on an annual basis for expenses related to the administration and maintenance of the ADR programsprogrammes including, but not limited to, New York Stock Exchange listing fees, investor relations expenses, or any other programprogramme related expenses. The depositary has also agreed to pay the standardout-of-pocket administrative, maintenance and shareholder services expenses for providing services to the registered DRADR holders. It has also agreed with us to waive certain standard fees associated with promotional services, programprogramme visibility campaigns and programprogramme analytic reporting. In certain instances, the depositary has agreed to provide additional annual reimbursements and payments to us based on any applicable performance indicators relating to the ADR facility. There are limits on the amount of expenses for which the depositary will reimburse us, but the amount of reimbursement available to us is not necessarily tied to the amount of fees the depositary collects from investors.
From January 1, 20142017 to February 25, 2015,14, 2018, we received a reimbursement of $282,500,$345,000, net of withheld taxes, from the depositary for New York Stock Exchange listing fees, investor relations expenses and other programprogramme related expenses, in connection with the ADR facility.
56
ITEM 15: CONTROLS AND PROCEDURES
Evaluation of Disclosure Controls and Procedures
Reed ElsevierRELX PLC and Reed ElsevierRELX NV are required to comply with applicable US regulations, including the Sarbanes-Oxley Act of 2002, insofar as they apply to foreign private issuers. Accordingly, Reed ElsevierRELX PLC and Reed ElsevierRELX NV have established a Disclosure Committee comprising the company secretaries of Reed ElsevierRELX PLC and Reed ElsevierRELX NV and other senior Reed ElsevierRELX managers appointed withto provide assurance to the Chief Executive Officer and Chief Financial Officer of Reed ElsevierRELX PLC and Reed ElsevierRELX NV. The committee has reviewed and evaluated the effectiveness of our disclosure controls and procedures as of December 31, 2014.2017. Based on that evaluation, the Chief Executive Officer and Chief Financial Officer of Reed ElsevierRELX PLC and Reed ElsevierRELX NV have concluded that the disclosure controls and procedures for the Reed Elsevier combined businesses, Reed ElsevierRELX Group, RELX PLC and Reed ElsevierRELX NV are effective as of the end of the period covered by this report.
Management’s Annual Report on Internal Control over Financial Reporting
In accordance with Section 404 of the Sarbanes-Oxley Act, management is responsible for establishing and maintaining adequate internal control over financial reporting as defined in Rules 13a — 15(f) and 15d — 15(f) under the Exchange Act, as amended. The internal controls over financial reporting of the Reed Elsevier combined businesses, Reed Elsevier PLC and Reed Elsevier NV,RELX Group are designed to provide reasonable assurance regarding the reliability of financial reporting and the preparation of financial statements for external purposes in accordance with IFRS. Because of its inherent limitations, internal control over financial reporting is not intended to provide absolute assurance that a misstatement of the financial statements of the Reed Elsevier combined businesses, Reed ElsevierRELX Group, RELX PLC and Reed ElsevierRELX NV would be prevented or detected.
Management conducted an evaluation of the effectiveness of its internal controlcontrols over financial reporting based on the framework inInternalControl-IntegratedFramework(2013) issued by the Committee of Sponsoring Organizations of the Treadway Commission. Based on this evaluation, management concluded that the internal controls over financial reporting of the combined businesses, Reed ElsevierRELX Group, RELX PLC and Reed ElsevierRELX NV were effective as of December 31, 2014.2017.
Certifications by the Chief Executive Officer and Chief Financial Officer of Reed ElsevierRELX PLC and Reed ElsevierRELX NV as required by the Sarbanes-Oxley Act are submitted as exhibits to this Form20-F (see “Item 19: Exhibits” on pagesS-3 andS-4).
DeloitteErnst & Young LLP hashave audited the combinedconsolidated financial statements for the fiscal year ended December 31, 20142017 and have audited the effectiveness of internal controlcontrols over financial reporting.reporting as at December 31, 2017. Their report in respect of the combined businessesRELX Group is included herein. Deloitte LLP have audited the consolidated financial statements of Reed Elsevier PLC and the consolidated financial statements of Reed Elsevier NV for the fiscal year ended December 31, 2014. They have also audited the effectiveness of internal control over financial reporting; their reports in respect of Reed Elsevier PLC and Reed Elsevier NV, respectively, are included herein.
57
REPORT OF INDEPENDENT REGISTERED PUBLIC ACCOUNTING FIRM
To the Members and Board of Directors of RELX PLC and the Shareholders and the Board of Directors and members of Reed Elsevier PLC and to the Board of Directors and shareholders of Reed Elsevier NV:RELX NV
Opinion on Internal Control over Financial Reporting
We have audited the Group’s (comprising RELX PLC, RELX NV, RELX Group plc and its subsidiaries, joint ventures and associates) internal control over financial reporting of the combined businesses of Reed Elsevier PLC, Reed Elsevier NV, RELX Group plc (formerly Reed Elsevier Group plc) and Elsevier Reed Finance BV and their respective subsidiaries, associates and joint ventures (together the “Combined Businesses”), as atof December 31, 2014,2017, based on criteria established inInternal Control — Integrated Framework (2013) issued by the Committee of Sponsoring Organizations of the Treadway Commission. Commission (2013 framework), (the COSO criteria). In our opinion, the Group maintained, in all material respects, effective internal control over financial reporting as of December 31, 2017, based on the COSO criteria.
We also have audited, in accordance with the standards of the Public Company Accounting Oversight Board (United States) (PCAOB), the consolidated statements of financial position of the Group (comprising RELX PLC, RELX NV, RELX Group plc and its subsidiaries, joint ventures and associates) as at December 31, 2017 and 2016, and the related consolidated statements of income, comprehensive income, cash flows, and changes in equity for each of the two years in the period ended December 31, 2017, and the related notes of the Group and our report dated February 14, 2018 expressed an unqualified opinion thereon.
Basis for Opinion
The Group’s management of Reed Elsevier PLC and Reed Elsevier NV areis responsible for maintaining effective internal control over financial reporting and for its assessment of the effectiveness of internal control over financial reporting included in the accompanying Management’s Annual Report on Internal Control over Financial Reporting. Our responsibility is to express an opinion on the Combined Businesses’Group’s internal control over financial reporting based on our audit. We are a public accounting firm registered with the PCAOB and are required to be independent with respect to the Group in accordance with the U.S. federal securities laws and the applicable rules and regulations of the Securities and Exchange Commission and the PCAOB.
We conducted our audit in accordance with the standards of the Public Company Accounting Oversight Board (United States).PCAOB. Those standards require that we plan and perform the audit to obtain reasonable assurance about whether effective internal control over financial reporting was maintained in all material respects.
Our audit included obtaining an understanding of internal control over financial reporting, assessing the risk that a material weakness exists, testing and evaluating the design and operating effectiveness of internal control based on the assessed risk, and performing such other procedures as we considered necessary in the circumstances. We believe that our audit provides a reasonable basis for our opinion.
Definition and Limitations of Internal Control Over Financial Reporting
A company’s internal control over financial reporting is a process designed by, or under the supervision of, the company’s principal executive and principal financial officers, or persons performing similar functions, and effected by the company’s board of directors, management, and other personnel to provide reasonable assurance regarding the reliability of financial reporting and the preparation of financial statements for external purposes in accordance with generally accepted accounting principles. A company’s internal control over financial reporting includes those policies and procedures that (1) pertain to the maintenance of records that, in reasonable detail, accurately and fairly reflect the transactions and dispositions of the assets of the company; (2) provide reasonable assurance that transactions are recorded as necessary to permit preparation of financial statements in accordance with generally accepted accounting principles, and that receipts and expenditures of the company are being made only in accordance with authorizations of management and directors of the company; and (3) provide reasonable assurance regarding prevention or timely detection of unauthorized acquisition, use, or disposition of the company’s assets that could have a material effect on the financial statements.
Because of theits inherent limitations, of internal control over financial reporting including the possibility of collusion or improper management override of controls, material misstatements due to error or fraud may not be preventedprevent or detected on a timely basis.detect misstatements. Also, projections of any evaluation of the effectiveness of the internal control over financial reporting to future periods are subject to the risk that the controls may become inadequate because of changes in conditions, or that the degree of compliance with the policies or procedures may deteriorate.
In our opinion, the Combined Businesses maintained, in all material respects, effective internal control over financial reporting as at December 31, 2014, based on the criteria established inInternal Control — Integrated Framework (2013) issued by the Committee of Sponsoring Organizations of the Treadway Commission.
We have also audited, in accordance with the standards of the Public Company Accounting Oversight Board (United States), the combined statement of financial position and the related combined income statement and combined statements of comprehensive income, cash flows and changes in equity as at and for the year ended December 31, 2014 of the Combined Businesses and our report dated February 25, 2015 expressed an unqualified opinion on those financial statements.
/s/ London, United Kingdom February | ||
REPORT OF INDEPENDENT REGISTERED PUBLIC ACCOUNTING FIRM
To the Board of Directors and members of Reed Elsevier PLC:
We have audited the internal control over financial reporting of Reed Elsevier PLC and its subsidiaries (the “Company”) as at December 31, 2014, based on criteria established inInternal Control — Integrated Framework (2013) issued by the Committee of Sponsoring Organizations of the Treadway Commission. The Company’s management is responsible for maintaining effective internal control over financial reporting and for its assessment of the effectiveness of internal control over financial reporting included in Management’s Annual Report on Internal Control over Financial Reporting. Our responsibility is to express an opinion on the Company’s internal control over financial reporting based on our audit.
We conducted our audit in accordance with the standards of the Public Company Accounting Oversight Board (United States). Those standards require that we plan and perform the audit to obtain reasonable assurance about whether effective internal control over financial reporting was maintained in all material respects. Our audit included obtaining an understanding of internal control over financial reporting, assessing the risk that a material weakness exists, testing and evaluating the design and operating effectiveness of internal control based on the assessed risk, and performing such other procedures as we considered necessary in the circumstances. We believe that our audit provides a reasonable basis for our opinion.
A company’s internal control over financial reporting is a process designed by, or under the supervision of, the company’s principal executive and principal financial officers, or persons performing similar functions, and effected by the company’s board of directors, management, and other personnel to provide reasonable assurance regarding the reliability of financial reporting and the preparation of financial statements for external purposes in accordance with generally accepted accounting principles. A company’s internal control over financial reporting includes those policies and procedures that (1) pertain to the maintenance of records that, in reasonable detail, accurately and fairly reflect the transactions and dispositions of the assets of the company; (2) provide reasonable assurance that transactions are recorded as necessary to permit preparation of financial statements in accordance with generally accepted accounting principles, and that receipts and expenditures of the company are being made only in accordance with authorizations of management and directors of the company; and (3) provide reasonable assurance regarding prevention or timely detection of unauthorized acquisition, use, or disposition of the company’s assets that could have a material effect on the financial statements.
Because of the inherent limitations of internal control over financial reporting, including the possibility of collusion or improper management override of controls, material misstatements due to error or fraud may not be prevented or detected on a timely basis. Also, projections of any evaluation of the effectiveness of the internal control over financial reporting to future periods are subject to the risk that the controls may become inadequate because of changes in conditions, or that the degree of compliance with the policies or procedures may deteriorate.
In our opinion, the Company maintained, in all material respects, effective internal control over financial reporting as at December 31, 2014, based on the criteria established inInternal Control — Integrated Framework (2013) issued by the Committee of Sponsoring Organizations of the Treadway Commission.
We have also audited, in accordance with the standards of the Public Company Accounting Oversight Board (United States), the consolidated statement of financial position and the related consolidated income statement and the statements of comprehensive income, cash flows and changes in equity as at and for the year ended December 31, 2014 of the Company and our report dated February 25, 2015 expressed an unqualified opinion on those financial statements.
|
58
REPORT OF INDEPENDENT REGISTERED PUBLIC ACCOUNTING FIRM
To the Board of Directors and shareholders of Reed Elsevier NV:
We have audited the internal control over financial reporting of Reed Elsevier NV and its subsidiaries (the “Company”) as at December 31, 2014, based on criteria established inInternal Control — Integrated Framework (2013) issued by the Committee of Sponsoring Organizations of the Treadway Commission. The Company’s management is responsible for maintaining effective internal control over financial reporting and for its assessment of the effectiveness of internal control over financial reporting included in Management’s Annual Report on Internal Control over Financial Reporting. Our responsibility is to express an opinion on the Company’s internal control over financial reporting based on our audit.
We conducted our audit in accordance with the standards of the Public Company Accounting Oversight Board (United States). Those standards require that we plan and perform the audit to obtain reasonable assurance about whether effective internal control over financial reporting was maintained in all material respects. Our audit included obtaining an understanding of internal control over financial reporting, assessing the risk that a material weakness exists, testing and evaluating the design and operating effectiveness of internal control based on the assessed risk, and performing such other procedures as we considered necessary in the circumstances. We believe that our audit provides a reasonable basis for our opinion.
A company’s internal control over financial reporting is a process designed by, or under the supervision of, the company’s principal executive and principal financial officers, or persons performing similar functions, and effected by the company’s board of directors, management, and other personnel to provide reasonable assurance regarding the reliability of financial reporting and the preparation of financial statements for external purposes in accordance with generally accepted accounting principles. A company’s internal control over financial reporting includes those policies and procedures that (1) pertain to the maintenance of records that, in reasonable detail, accurately and fairly reflect the transactions and dispositions of the assets of the company; (2) provide reasonable assurance that transactions are recorded as necessary to permit preparation of financial statements in accordance with generally accepted accounting principles, and that receipts and expenditures of the company are being made only in accordance with authorizations of management and directors of the company; and (3) provide reasonable assurance regarding prevention or timely detection of unauthorized acquisition, use, or disposition of the company’s assets that could have a material effect on the financial statements.
Because of the inherent limitations of internal control over financial reporting, including the possibility of collusion or improper management override of controls, material misstatements due to error or fraud may not be prevented or detected on a timely basis. Also, projections of any evaluation of the effectiveness of the internal control over financial reporting to future periods are subject to the risk that the controls may become inadequate because of changes in conditions, or that the degree of compliance with the policies or procedures may deteriorate.
In our opinion, the Company maintained, in all material respects, effective internal control over financial reporting as at December 31, 2014, based on the criteria established inInternal Control — Integrated Framework (2013) issued by the Committee of Sponsoring Organizations of the Treadway Commission.
We have also audited, in accordance with the standards of the Public Company Accounting Oversight Board (United States), the consolidated statement of financial position and the related consolidated income statement and statements of comprehensive income, cash flows and changes in equity as at and for the year ended December 31, 2014 of the Company and our report dated February 25, 2015 expressed an unqualified opinion on those financial statements.
|
|
|
Internal Control over Financial Reporting
Management, including the Chief Executive Officer and Chief Financial Officer of Reed ElsevierRELX PLC and Reed ElsevierRELX NV, have reviewed whether or not during the period covered by the annual report, there have been any changes in internal control over financial reporting that have materially affected, or are reasonably likely to materially affect, the internal controls over financial reporting of the combined businesses, Reed ElsevierRELX Group plc, RELX PLC and Reed ElsevierRELX NV. Based on that review, the Chief Executive Officer and Chief Financial Officer of Reed ElsevierRELX PLC and Reed ElsevierRELX NV have concluded that there have been no such changes.
An outline of the internal control structure is set out below.
Parent companiesRELX PLC and RELX NV
The Boards of Reed ElsevierRELX PLC and Reed ElsevierRELX NV have each adopted a schedule of matters which are required to be brought to them for decision. During 2014,2017, the Boards of Reed ElsevierRELX PLC and Reed ElsevierRELX NV exercised independent supervisory roles over the activities and systems of internal control of Reed ElsevierRELX Group plc and Elsevier Reed Finance BV.plc. In relation to Reed ElsevierRELX Group plc, and Elsevier Reed Finance BV, the Boards of Reed ElsevierRELX PLC and Reed ElsevierRELX NV approved the strategy and the annual budgets, and received regular reports on the operations, including the treasury and risk management activities of the two companies.activities. Major transactions proposed by the BoardsBoard of Reed ElsevierRELX Group plc or Elsevier Reed Finance BV requiredrequire the approval of the Boards of both Reed ElsevierRELX PLC and Reed ElsevierRELX NV.
The Reed ElsevierRELX PLC and Reed ElsevierRELX NV Audit Committees met on a regular basis to review the systems of internal control and risk management of Reed Elsevier Group plc and Elsevier Reed Finance BV.
Effective February 25, 2015, Reed Elsevier PLC and Reed Elsevier NV transferred their direct ownership interest in Elsevier Reed Finance BV to their jointly-owned company, Reed Elsevier Group plc and named this newly-combined single group entity RELX Group plc. As a result, RELX Group plc, nowwhich holds all of our businessesbusiness and subsidiaries and controls our financing activities. In the future, Elsevier Reed Finance BV and its subsidiaries will be subject to the framework of procedures and controls established by
RELX Group plc and the Audit Committee of RELX Group plc will review on a regular basis the system of internal control and risk management of Elsevier Reed Finance BV and its subsidiaries.
Operating companies
The Board of RELX Group plc is responsible for the system of internal control of the Group and reviewing the effectiveness of such systems. While the Boards of Elsevier Reed Finance BV were responsible for the system of internal control in respect of the finance activities during 2014 and reviewing the effectiveness of such systems, the responsibility transferred to RELX Group plc with effect from February 25, 2015.
The Boards of Reed Elsevier Group plc and Elsevier Reed Finance BV each implemented an ongoing process for identifying, evaluating, monitoring and managing the principal risks faced by theirits respective businesses. These processes were in place throughout the year ended December 31, 20142017 and up to the date of the approvals of this annual report.
Annual Report on FormRELX Group plc20-F.
RELX Group plc has an established framework of procedures and internal controls, with which the management of each business is required to comply. Group businesses are required to maintain systems of internal control which are appropriate to the nature and scale of their activities and address all significant strategic, operational, financial and legal compliance risks that they face. The Board of RELX Group plc has adopted a schedule of matters that are required to be brought to it for decision.
RELX Group plc has a Code of Ethics and Business Conduct that provides a guide for achieving its business goals and requires officers and employees to behave in an open, honest, ethical and principled manner. The code also outlines confidential procedures enabling employees to report any concerns about compliance, or about the Group’s financial reporting practice. The code is published on our website, www.relxgroup.com.www.relx.com. The information on our website is not incorporated by reference into this report.
Each business area has identified and evaluated its principal risks, the controls in place to manage those risks and the levels of residual risk accepted. Risk management and control procedures are embedded into the operations of the business and include the monitoring of progress in areas for improvement that come to management and board attention. The principal risks identified include protection of IT systems and data, challenges to intellectual property rights, management of strategic and operational change, evaluation and integration of acquisitions, and recruitment and retention of personnel. Further detail on the principal risks facing the Group is set out under the heading “Risk Factors” on pages 76 to 10.8.
The principal risks facing the RELX Group plc businesses are regularly reported to and assessed by the Board and Audit Committee. With the close involvement of business management and central functions, the risk management and control procedures ensure that we are managing our business risks effectively and in a coordinated manner across the business with clarity on the respective responsibilities and interdependencies. Litigation and other legal and regulatory matters are managed by legal directors in Europe and the United States.business.
The RELX Group plc Audit Committee receives regular reports on the management of material risks and reviews these reports. The Audit Committee also receives regular reports from both internal and external auditors on internal control and risk management matters. In addition, each business area is required, at the end of the financial year, to review the effectiveness of internal controls and risk management and report its findings on a detailed basis to the management of RELX Group plc. These reports are summarised and, as part of the annual review of effectiveness, submitted to the Audit Committee of RELX Group plc. The Chairman of the Audit Committee reports to the Board on any significant internal control matters arising.
Elsevier Reed Finance BV
During 2014, Elsevier Reed Finance BV had established policy guidelines, which were applied to all Elsevier Reed Finance BV companies. The respective Boards of Elsevier Reed Finance BV adopted schedules of matters required to be brought to them for decision.
Procedures are in place for monitoring the activities of the finance group, including a comprehensive treasury reporting system. The principal risks affecting the finance group have been identified and evaluated and are subject to regular review. The controls in place to manage these risks and the level of residual risk accepted were monitored by the Boards of Elsevier Reed Finance BV. In future, these will be monitored by the Audit Committee of RELX Group plc.
Audit Committees
RELX Group plc, Reed ElsevierRELX PLC and Reed ElsevierRELX NV have established Audit Committees which comprise only non-executiveNon-Executive directors, all of whom are independent. The Audit Committees, which meet regularly, are chaired by Ben van der Veer, the
59
other members being Marike van Lier Lels, Carol Mills, Adrian Hennah and Suzanne Wood (from September 26, 2017). Linda Sanford and Adrian Hennah.was a member of the Audit Committee until September 26, 2017, she was replaced by Suzanne Wood.
The main roles and responsibilities of the Audit Committees in relation to the respective companies are set out in written terms of reference and include:
| (i) | to monitor the integrity of the financial statements, |
| (ii) | to review the company’s internal financial controls and the |
| (iii) | to monitor and review the effectiveness of the |
| (iv) | to make recommendations to the Board, for it to put to the shareholders for their approval in |
| (v) | to review and monitor the external auditors’ independence and objectivity and the effectiveness of the audit process, taking into consideration relevant professional and regulatory requirements; and |
| (vi) | to develop and recommend policy on the engagement of the external auditor to supply non audit services, taking into account relevant ethical guidance regarding the provision of non audit services by the external audit firm, and to monitor compliance. |
The Audit Committees report to the respective boards on their activities identifying any matters in respect of which they consider that action or improvement is needed and making recommendations as to the steps to be taken.
The RELX Group plc Audit Committee fulfils this role in respect of the publishingoperating businesses and information operating business.finance activities as of February 15, 2018. The functions of an audit committee in respect of the financing activities were carried out by the Supervisory Board of Elsevier Reed Finance BV. The Reed ElsevierRELX PLC and Reed ElsevierRELX NV Audit Committees fulfil their roles from the perspective of the parent companiesmanagement of RELX PLC and RELX NV and both Committees have access to the reports to and the work of the RELX Group plc Audit Committee and, with respect to 2014, the Elsevier Reed Finance BV Supervisory Board.Committee.
The Audit Committees have explicit authority to investigate any matters within their terms of reference and have access to all resources and information that they may require for this purpose. The Audit Committees are entitled to obtain legal and other independent professional advice and have the authority to approve all fees payable to such advisers.
The terms of reference of each Audit Committee are reviewed annually and a copy of each is published on our website, www.relxgroup.com.www.relx.com. The information on our website is not incorporated by reference into this report.
ITEM 16A: AUDIT COMMITTEE FINANCIAL EXPERT
Each of RELX PLC and RELX NV has an Audit Committee, the members of which are identified in “Item 6: Directors, Senior Management and Employees”. The members of the Board of Directors of RELX PLC and members of the Board of RELX NV, have determined that each of their respective Audit Committees contains at least one Audit Committee financial expert within the meaning of the applicable rules and regulations of the SEC. The Audit Committee financial experts serving on the RELX PLC and the RELX NV Audit Committees are Adrian Hennah, Suzanne Wood and Ben van der Veer. Each is considered independent.
The Group has adopted a code of ethics (Code of Ethics and Business Conduct) that applies to all directors, officers and employees of the Group, as well as a separate code of ethics (Code of Ethics for Senior Financial Officers) that also applies to RELX PLC’s and RELX NV’s principal executive officer, principal financial officer, principal accounting officer or controller, or persons performing similar functions (collectively, the “Senior Financial Officers”). Both of these codes of ethics are available under “Corporate structure and governance” of the Investor centre page at www.relx.com. The information on our website is not incorporated by reference into this report. If the Code for Senior Financial Officers is amended or a provision waived, we intend to satisfy any disclosure obligations by posting information on the internet website set forth above within five business days of such amendment or waiver. In February 2016, we amended the Code for Senior Financial Officers to address those to whom the policy applies, the reporting process and potential disciplinary actions for violations, and responsibilities regarding disclosure in financial reports and other disclosure.
ITEM 16C: PRINCIPAL ACCOUNTANT FEES AND SERVICES
The aggregate fees billed by our principal accountant, Ernst & Young LLP, are set forth in note 4 to the consolidated financial statements under the heading ‘Auditors’ remuneration’ on page 126 of the Group’s Annual Reports and Financial Statements 2017 and incorporated herein by reference to Exhibit 15.2.
60
The Audit Committees of RELX PLC and RELX NV have adopted policies and procedures for thepre-approval of audit and non audit services provided by the auditors. These policies and procedures are summarised below.
The terms of engagement and scope of the annual audit of the financial statements are agreed by the respective Audit Committees in advance of the engagement of the auditors in respect of the annual audit. The audit fees are approved by the Audit Committees.
The auditors are not permitted to providenon-audit services that would compromise their independence or violate any laws or regulations that would affect their appointment as auditors. They are eligible for selection to providenon-audit services only to the extent that their skills and experience make them a logical supplier of the services. The respective Chair of Audit Committee mustpre-approve the provision of allnon-audit services by the auditors and will consider SEC rules and other guidelines in determining the scope of permitted services. All assignments other than audit-related work must be specificallypre-approved by the Audit Committees in advance of commissioning the work. Aggregatenon-audit fees must not exceed the annual audit fees in any given year, unless approved in advance by the Audit Committees. All of the audit andnon-audit services carried out in the year ended December 31, 2017 werepre-approved under the policies and procedures summarised above.
ITEM 16E: PURCHASES OF EQUITY SECURITIES BY THE ISSUER AND AFFILIATED PURCHASERS
During 2017 the Group repurchased 23.1 million RELX PLC ordinary shares and 21.4 million RELX NV ordinary shares for total consideration of £700 million, to be held in treasury. A total of 44.5 million RELX PLC and RELX NV shares were repurchased in 2017.
| PLC | NV | |||||||||||||||
Number of ordinary shares | Average price paid per share | Number of ordinary shares | Average price paid per share | |||||||||||||
| pence |
| € | |||||||||||||
January 2017 | 1,931,400 | 14.44 | 1,722,948 | 15.68 | ||||||||||||
February 2017 | 2,156,578 | 14.70 | 1,920,433 | 16.24 | ||||||||||||
March 2017 | 3,831,223 | 15.46 | 3,411,166 | 16.87 | ||||||||||||
April 2017 | 2,722,170 | 15.84 | 3,048,709 | 17.63 | ||||||||||||
May 2017 | 3,155,447 | 16.18 | 2,949,483 | 18.12 | ||||||||||||
June 2017 | 3,035,970 | 16.99 | 2,703,112 | 18.54 | ||||||||||||
July 2017 | 1,384,579 | 16.49 | 1,232,869 | 17.77 | ||||||||||||
August 2017 | 1,159,385 | 16.80 | 1,032,500 | 17.74 | ||||||||||||
September 2017 | 1,109,524 | 16.66 | 988,150 | 17.81 | ||||||||||||
October 2017 | 1,243,672 | 16.93 | 1,108,400 | 18.45 | ||||||||||||
November 2017 | 1,157,859 | 17.52 | 1,032,024 | 19.27 | ||||||||||||
December 2017 | 234,692 | 17.47 | 208,928 | 19.39 | ||||||||||||
|
|
|
|
|
|
|
| |||||||||
| 23,122,499 | 16.04 | 21,358,722 | 17.57 | |||||||||||||
|
|
|
|
|
|
|
| |||||||||
All shares were purchased under programmes publicly announced on December 8, 2016 and February 23, 2017. All of these programmes were completed during 2017.
On December 7, 2017 RELX PLC and RELX NV announced anon-discretionary programme to repurchase further ordinary shares up to the value of £100 million in total between January 2, 2018 and February 12, 2018. A further 3.3 million RELX PLC shares and 2.9 million RELX NV shares have been repurchased as at February 14, 2018, under this programme. On February 15, 2018, RELX PLC and RELX NV announced their intention to repurchase further ordinary shares up to the value of £600 million in aggregate over the remainder of 2018.
In addition, during 2017 the Employee Benefit Trust purchased 1.2 million RELX PLC shares and 1.3 million RELX NV shares.
ITEM 16G: CORPORATE GOVERNANCE
Details of our corporate governance practices are set out on pages 57 to 60 of Item 15: Controls and Procedures.
61
Compliance with New York Stock Exchange Corporate Governance Rules
Reed ElsevierRELX PLC and Reed ElsevierRELX NV, as companies listed on the New York Stock Exchange (the “NYSE”), are subject to the listing requirements of the NYSE and the rules of the U.S.US Securities and Exchange Commission (the “SEC”). We also continually monitor our compliance with the provisions of the Sarbanes-Oxley Act of 2002 that are applicable to foreign private issuers.
As a foreign private issuer, weissuers, RELX PLC and RELX NV are only required to comply with certain of the NYSE corporate governance rules and isare in compliance with all applicable rules. The NYSE’s rules also require disclosure of any significant ways in which ourtheir corporate governance practices differ from those required of US companies under the NYSE listing standards.
We follow UK corporate governance practice, which does not differ significantly from the NYSE corporate governance standards for foreign issuers. We also follow Dutch corporate governance practice. We believe that our corporate governance practices do not differ in any significant way from those required to be followed by US companies under the NYSE corporate governance listing standards.
The NYSE listing standards provide that US companies must have a nominating/corporate governance committee composed entirely of independent directors and with a written charter that addresses the committee’s purpose and responsibilities which, at a minimum, must be to identify individuals qualified to become board members, develop and recommend to the Board a set of corporate governance principles and to oversee the evaluation of the board and management.
Reed ElsevierRELX PLC and Reed ElsevierRELX NV have a joint Nominations Committee and a joint Corporate Governance Committee. The written terms of reference adopted by the Reed ElsevierRELX PLC and the Reed ElsevierRELX NV Boards for these committees specify purposes and responsibilities that correspond to those of a US company’s nominating/corporate governance committee under the NYSE’s listing standards. The Nominations Committee and the Corporate Governance Committee are composed entirely ofNon-Executive Directors.
ITEM 16A: AUDIT COMMITTEE FINANCIAL EXPERT
Each of Reed Elsevier PLC and Reed Elsevier NV has an Audit Committee, the members of which are identified in “Item 6: Directors, Senior Management and Employees”. The members of the Board of Directors of Reed Elsevier PLC and members of the Board of Reed Elsevier NV, have determined that each of their respective Audit Committees contains at least one Audit Committee financial expert within the meaning of the applicable rules and regulations of the SEC. The Audit Committee financial experts serving on the Reed Elsevier PLC and the Reed Elsevier NV Audit Committees are Adrian Hennah and Ben van der Veer. Each is considered independent.62
The Group has adopted a code of ethics (Code of Ethics and Business Conduct) that applies to all directors, officers and employees, and an additional separate code of ethics (Code for Senior Officers) that also applies to the Chief Executive Officer and Chief Financial Officer of Reed Elsevier PLC and Reed Elsevier NV and the Group Financial Controller of RELX Group plc. Both these codes of ethics are available on our website, www.relxgroup.com. The information on our website is not incorporated by reference into this report.
ITEM 16C: PRINCIPAL ACCOUNTANT FEES AND SERVICES
The aggregate fees billed by our principal accountants, Deloitte LLP, the member firm of Deloitte Touche Tohmatsu and their respective affiliates, were as follows:
| Year ended December 31, 2014 | Year ended December 31, 2013 | |||||||
| (in millions) | ||||||||
Audit fees | £4.8 | £ | 4.9 | |||||
Audit related fees | 0.5 | 0.4 | ||||||
Tax fees | 1.0 | 1.8 | ||||||
Due diligence and other transaction related services | 0.3 | — | ||||||
|
|
|
| |||||
Total | £6.6 | £ | 7.1 | |||||
|
|
|
| |||||
Audit fees of £4.8 million (2013: £4.9 million) comprise £0.6 million (2013: £0.6 million) payable to the auditors of the parent companies and £4.2 million (2013: £4.3 million) payable to the auditors of the parent companies and their associates for the audit of the financial statements of the operating and financing businesses, including the review and testing of internal control over financial reporting in accordance with the US Sarbanes-Oxley Act. Audit related fees comprise £0.5 million (2013: £0.4 million) for other audit related assurance services. Tax fees of £1 million (2013: £1.8 million) relate to tax services. Due diligence and other transaction related services fees of £0.3 million (2013: nil) relate to due diligence services.
The Audit Committees of Reed Elsevier PLC and Reed Elsevier NV have adopted policies and procedures for the pre-approval of audit and non audit services provided by the auditors. These policies and procedures are summarised below.
The terms of engagement and scope of the annual audit of the financial statements are agreed by the respective Audit Committees in advance of the engagement of the auditors in respect of the annual audit. The audit fees are approved by the Audit Committees.
The auditors are not permitted to provide non audit services that would compromise their independence or violate any laws or regulations that would affect their appointment as auditors. They are eligible for selection to provide non audit services only to the extent that their skills and experience make them a logical supplier of the services. The respective Audit Committees must pre-approve the provision of all non audit services by the auditors and will consider SEC rules and other guidelines in determining the scope of permitted services. The respective Audit Committees have pre-approved non audit services in respect of individual assignments for permitted services that meet certain criteria. Assignments outside these parameters must be specifically pre-approved by the Audit Committees in advance of commissioning the work. Aggregate non audit fees must not exceed the annual audit fees in any given year, unless approved in advance by the Audit Committees.
All of the audit and non audit services carried out in the year ended December 31, 2014 were pre-approved under the policies and procedures summarised above.
ITEM 16D: EXEMPTIONS FROM THE LISTING STANDARDS FOR AUDIT COMMITTEES
Not applicable.
ITEM 16E: PURCHASES OF EQUITY SECURITIES BY THE ISSUER AND AFFILIATED PURCHASERS
During 2014 we repurchased 35,251,501 Reed Elsevier PLC ordinary shares and 20,403,351 Reed Elsevier NV ordinary shares for total consideration of £600 million. These shares are held in treasury.
| PLC | NV | |||||||||||||||
Number of ordinary shares | Average price paid per share | Number of ordinary shares | Average price paid per share | |||||||||||||
| pence |
| € | |||||||||||||
January 2014 | 3,786,360 | 908 | 2,195,000 | 15.59 | ||||||||||||
February 2014 | 2,658,910 | 899 | 1,546,668 | 15.45 | ||||||||||||
March 2014 | 7,012,000 | 919 | 4,053,500 | 15.62 | ||||||||||||
April 2014 | 3,432,000 | 897 | 1,984,000 | 15.27 | ||||||||||||
May 2014 | 4,836,000 | 891 | 2,798,500 | 15.16 | ||||||||||||
June 2014 | 2,462,531 | 949 | 1,425,833 | 16.58 | ||||||||||||
July 2014 | 703,500 | 966 | 406,500 | 17.08 | ||||||||||||
August 2014 | 3,196,800 | 958 | 1,849,800 | 16.81 | ||||||||||||
September 2014 | 2,494,000 | 993 | 1,442,250 | 17.66 | ||||||||||||
October 2014 | 1,654,500 | 991 | 955,000 | 17.73 | ||||||||||||
November 2014 | 2,731,000 | 1,057 | 1,579,000 | 18.84 | ||||||||||||
December 2014 | 283,900 | 1,112 | 164,300 | 19.80 | ||||||||||||
|
|
|
|
|
|
|
| |||||||||
| 35,251,501 | 938 | 20,403,351 | 16.24 | |||||||||||||
|
|
|
|
|
|
|
| |||||||||
All shares were purchased under programmes publicly announced on December 16, 2013, February 27, 2014 and July 24, 2014. All of these programmes were completed during 2014.
On December 14, 2014 Reed Elsevier PLC and Reed Elsevier NV announced a non-discretionary programme to repurchase further ordinary shares up to the value of £100 million. A further 4,815,950 Reed Elsevier PLC shares and
2,787,800 Reed Elsevier NV ordinary shares have been repurchased in January and February 2015, under this programme. On February 26, 2015, Reed Elsevier PLC and Reed Elsevier NV announced their intention to repurchase further ordinary shares up to the value of £400 million in aggregate over the remainder of 2015.
During 2014 we also repurchased 107,901 Reed Elsevier NV R shares (equivalent to 1,079,010 Reed Elsevier NV ordinary shares).
During 2014 the Employee Benefit Trust (“EBT”) also purchased 757,781 Reed Elsevier PLC Shares and 1,989,279 Reed Elsevier NV Shares.
ITEM 16F: CHANGE IN REGISTRANT’S CERTIFYING ACCOUNTANT
On February 16, 2015, the Audit Committee of Reed Elsevier NV approved for the purposes of the Annual Report on Form 20-F the selection of Deloitte LLP to serve as Reed Elsevier NV’s independent registered public accounting firm, and the Audit Committees of Reed Elsevier PLC and Reed Elsevier NV approved for the purposes of Form 20-F the selection of Deloitte LLP to serve as the sole accounting firm of the combined businesses, which, for the fiscal year ended December 31, 2014, comprised Reed Elsevier PLC, Reed Elsevier NV, RELX Group plc (formerly Reed Elsevier Group plc), Elsevier Reed Finance BV and their respective subsidiaries, associates and joint ventures. Deloitte LLP was notified on February 16, 2015 of the change from being joint auditor to sole auditor for the fiscal year ended December 31, 2014. Accordingly the term of Deloitte Accountants B.V. as Reed Elsevier NV’s independent registered public accounting firm for the Form 20-F has ended.
The audit reports of Deloitte Accountants B.V. on the consolidated financial statements of Reed Elsevier NV and its subsidiaries and on the combined financial statements of the combined businesses as of and for the years ended December 31, 2013 and 2012 did not contain any adverse opinion or disclaimer of opinion nor were they qualified or modified as to uncertainty, audit scope or accounting principles. The audit reports of Deloitte Accountants B.V. on the effectiveness of internal control over financial reporting of Reed Elsevier NV and the combined businesses as of December 31, 2013 and 2012 did not contain any adverse opinion or disclaimer of opinion, nor were they qualified or modified as to uncertainty, audit scope or accounting principles.
During the two fiscal years ended December 31, 2013 and 2012, there were no disagreements between Reed Elsevier NV, the combined businesses and Deloitte Accountants B.V. on any matter of accounting principles or practices, financial statement disclosure or auditing scope or procedures which, if not resolved to the satisfaction of Deloitte Accountants B.V., would have caused Deloitte Accountants B.V. to make reference thereto in their reports on the consolidated financial statements for such years.
Reed Elsevier NV and the combined businesses provided Deloitte Accountants B.V. with a copy of this disclosure, and requested them to furnish it with a letter addressed to the U.S. Securities and Exchange Commission stating whether it agrees with the above statements. A copy of such letter, dated February 25, 2015, is filed as Exhibit 16.1 to this Form 20-F.
ITEM 16G: CORPORATE GOVERNANCE
Details of our corporate governance practices are set out on pages 88 to 95 of Item 15: Controls and Procedures.
The Registrants have responded to Item 18 in lieu of responding to this Item.
THIS PAGE INTENTIONALLY BLANK
The information set forth under the heading ‘Consolidated Financial Statements’ and ‘Notes to the consolidated financial statements’ on pages 117 to 164 of the Group’s Annual Reports and Financial Statements filed as part of this annual report
The following financial statements and related schedules, together with reports of independent registered public accounting firms thereon, are filed as part of this annual report:
2017 is incorporated herein by reference to Exhibit 15.2.
F-1
THIS PAGE INTENTIONALLY BLANK
THIS PAGE INTENTIONALLY BLANK
REPORT OF INDEPENDENT REGISTERED PUBLIC ACCOUNTING FIRM
To the Members and Board of Directors and members of Reed ElsevierRELX PLC and tothe Shareholders and the Board of Directors and shareholders of Reed Elsevier NV:RELX NV
Opinion on the Financial Statements
We have audited the accompanying combinedconsolidated statements of financial position of Reed Elsevierthe Group (comprising RELX PLC, Reed ElsevierRELX NV, RELX Group plc (formerly Reed Elsevier Group plc) and Elsevier Reed Finance BV and their respectiveits subsidiaries, associates and joint ventures (together the “Combined Businesses”)and associates) as atof December 31, 2014, 20132017 and 2012,2016, and the related combined income statements and combinedconsolidated statements of income, comprehensive income, cash flows and changes in equity for each of the two years then ended. in the period ended December 31, 2017, and the related notes (collectively referred to as the “financial statements”). In our opinion, the financial statements present fairly, in all material respects, the consolidated financial position of the Group at December 31, 2017 and 2016, and the consolidated results of its operations and its cash flows for each of the two years in the period ended December 31, 2017, in conformity with International Financial Reporting Standards as issued by the International Accounting Standards Board.
We also have audited, in accordance with the standards of the Public Company Accounting Oversight Board (United States) (PCAOB), the Company’s internal control over financial reporting as of December 31, 2017, based on criteria established in Internal Control-Integrated Framework issued by the Committee of Sponsoring Organizations of the Treadway Commission (2013 framework), and our report dated February 14, 2018 expressed an unqualified opinion thereon.
Basis for Opinion
These combinedfinancial statements are the responsibility of the Group’s management. Our responsibility is to express an opinion on the Group’s financial statements based on our audits. We are a public accounting firm registered with the PCAOB and are required to be independent with respect to the Group in accordance with the U.S. federal securities laws and the applicable rules and regulations of the Securities and Exchange Commission and the PCAOB.
We conducted our audits in accordance with the standards of the PCAOB. Those standards require that we plan and perform the audit to obtain reasonable assurance about whether the financial statements are free of material misstatement, whether due to error or fraud. Our audits included performing procedures to assess the risks of material misstatement of the financial statements, whether due to error or fraud, and performing procedures that respond to those risks. Such procedures included examining, on a test basis, evidence regarding the amounts and disclosures in the financial statements. Our audits also included evaluating the accounting principles used and significant estimates made by management, as well as evaluating the overall presentation of the financial statements. We believe that our audits provide a reasonable basis for our opinion.
/s/ Ernst & Young LLP We have served as the Group’s auditor since 2016. London, United Kingdom February 14, 2018 |
F-2
REPORT OF INDEPENDENT REGISTERED PUBLIC ACCOUNTING FIRM
To the Board of Directors and members of RELX PLC and to the Board of Directors and shareholders of RELX NV:
We have audited the accompanying consolidated income statement and consolidated statements of comprehensive income, cash flows, and changes in equity of the Group (comprising RELX PLC, RELX NV, RELX Group plc and its subsidiaries, associates and joint ventures) for the year ended December 31, 2015. These consolidated financial statements are the responsibility of the management of Reed Elsevier PLC and Reed Elsevier NV.the Group. Our responsibility is to express an opinion on the combinedconsolidated financial statements based on our audits.audit.
We conducted our auditsaudit in accordance with the standards of the Public Company Accounting Oversight Board (United States). Those standards require that we plan and perform the audit to obtain reasonable assurance about whether the financial statements are free of material misstatement. An audit includes examining, on a test basis, evidence supporting the amounts and disclosures in the financial statements. An audit also includes assessing the accounting principles used and significant estimates made by management, as well as evaluating the overall financial statement presentation. We believe that our audits provideaudit provides a reasonable basis for our opinion.
In our opinion, such combined2015 consolidated financial statements present fairly, in all material respects, the combined financial positionconsolidated results of the Combined Businesses as at December 31, 2014, 2013 and 2012, and the combined results of theirGroup’s operations and their cash flows for each of the years thenyear ended December 31, 2015, in conformity with International Financial Reporting Standards as issued by the International Accounting Standards Board.
We have also audited, in accordance with the standards of the Public Company Accounting Oversight Board (United States), the Combined Businesses’ internal control over financial reporting as at December 31, 2014, based on the criteria established inInternal Control — Integrated Framework (2013) issued by the Committee of Sponsoring Organizations of the Treadway Commission and our report dated February 25, 2015 expressed an unqualified opinion on the Combined Businesses’ internal control over financial reporting.
/s/ DELOITTE LLP London, United Kingdom February |
FOR THE YEAR ENDED DECEMBER 31, 2014
| Note | 2014 £m | 2013 £m | 2012 £m | |||||||||||||
Revenue | 3 | 5,773 | 6,035 | 6,116 | ||||||||||||
Cost of sales | (2,006 | ) | (2,118 | ) | (2,139 | ) | ||||||||||
|
|
|
|
|
| |||||||||||
Gross profit | 3,767 | 3,917 | 3,977 | |||||||||||||
Selling and distribution costs | | (934 | ) | (1,005 | ) | (1,015 | ) | |||||||||
Administration and other expenses | (1,467 | ) | (1,565 | ) | (1,653 | ) | ||||||||||
Share of results of joint ventures | 36 | 29 | 24 | |||||||||||||
|
|
|
|
|
| |||||||||||
Operating profit | 3, 4 | 1,402 | 1,376 | 1,333 | ||||||||||||
|
|
|
|
|
| |||||||||||
Finance income | 8 | 7 | 10 | 16 | ||||||||||||
Finance costs | 8 | (169 | ) | (206 | ) | (243 | ) | |||||||||
|
|
|
|
|
| |||||||||||
Net finance costs | (162 | ) | (196 | ) | (227 | ) | ||||||||||
|
|
|
|
|
| |||||||||||
Disposals and other non operating items | 9 | (11) | 16 | 45 | ||||||||||||
|
|
|
|
|
| |||||||||||
Profit before tax | 1,229 | 1,196 | 1,151 | |||||||||||||
|
|
|
|
|
| |||||||||||
Current tax | (357 | ) | (352 | ) | (153 | ) | ||||||||||
Deferred tax | 88 | 271 | 51 | |||||||||||||
|
|
|
|
|
| |||||||||||
Tax expense | 10 | (269 | ) | (81 | ) | (102 | ) | |||||||||
|
|
|
|
|
| |||||||||||
Net profit for the year | 960 | 1,115 | 1,049 | |||||||||||||
|
|
|
|
|
| |||||||||||
Attributable to: | ||||||||||||||||
Parent companies’ shareholders | 955 | 1,110 | 1,044 | |||||||||||||
Non-controlling interests | 5 | 5 | 5 | |||||||||||||
|
|
|
|
|
| |||||||||||
Net profit for the year | 960 | 1,115 | 1,049 | |||||||||||||
|
|
|
|
|
| |||||||||||
COMBINED STATEMENT OF COMPREHENSIVE INCOME
FOR THE YEAR ENDED DECEMBER 31, 2014
| Note | 2014 £m | 2013 £m | 2012 £m | |||||||||||||
Net profit for the year | 960 | 1,115 | 1,049 | |||||||||||||
Items that will not be reclassified to profit or loss: | ||||||||||||||||
Actuarial (losses)/gains on defined benefit pension schemes | 6 | (266 | ) | 40 | (293 | ) | ||||||||||
Tax on items that will not be reclassified to profit or loss | 10 | 63 | (24 | ) | 96 | |||||||||||
|
|
|
|
|
| |||||||||||
Total items that will not be reclassified to profit or loss | (203 | ) | 16 | (197 | ) | |||||||||||
|
|
|
|
|
| |||||||||||
Items that may be reclassified subsequently to profit or loss: | ||||||||||||||||
Exchange differences on translation of foreign operations | 137 | (88 | ) | (136 | ) | |||||||||||
Transfer to net profit on disposal of available for sale investments | — | — | 11 | |||||||||||||
Fair value movements on cash flow hedges | 18 | (81 | ) | 65 | 70 | |||||||||||
Transfer to net profit from cash flow hedge reserve | 18 | 19 | (3 | ) | 26 | |||||||||||
Tax on items that may be reclassified to profit or loss | 10 | 13 | (14 | ) | (24 | ) | ||||||||||
|
|
|
|
|
| |||||||||||
Total item that may be reclassified to profit or loss | 88 | (40 | ) | (53 | ) | |||||||||||
|
|
|
|
|
| |||||||||||
Other comprehensive loss for the year | (115 | ) | (24 | ) | (250 | ) | ||||||||||
|
|
|
|
|
| |||||||||||
Total comprehensive income for the year | 845 | 1,091 | 799 | |||||||||||||
|
|
|
|
|
| |||||||||||
Attributable to: | ||||||||||||||||
Parent companies’ shareholders | 840 | 1,086 | 794 | |||||||||||||
Non-controlling interests | 5 | 5 | 5 | |||||||||||||
|
|
|
|
|
| |||||||||||
Total comprehensive income for the year | 845 | 1,091 | 799 | |||||||||||||
|
|
|
|
|
| |||||||||||
COMBINED STATEMENT OF CASH FLOWS
FOR THE YEAR ENDED DECEMBER 31, 2014
| Note | 2014 £m | 2013 £m | 2012 £m | |||||||||||||
Cash flows from operating activities | ||||||||||||||||
Cash generated from operations | 11 | 1,851 | 1,943 | 1,847 | ||||||||||||
Interest paid | (139 | ) | (200 | ) | (231 | ) | ||||||||||
Interest received | 13 | 5 | 7 | |||||||||||||
Tax paid (net) | (348 | ) | (362 | ) | (216 | ) | ||||||||||
|
|
|
|
|
| |||||||||||
Net cash from operating activities | 1,377 | 1,386 | 1,407 | |||||||||||||
|
|
|
|
|
| |||||||||||
Cash flows from investing activities | ||||||||||||||||
Acquisitions | 11 | (396 | ) | (221 | ) | (316 | ) | |||||||||
Purchases of property, plant and equipment | (67 | ) | (57 | ) | (70 | ) | ||||||||||
Expenditure on internally developed intangible assets | (203 | ) | (251 | ) | (263 | ) | ||||||||||
Purchase of investments | (6 | ) | (10 | ) | (7 | ) | ||||||||||
Proceeds from disposals of property, plant and equipment | 10 | 6 | 7 | |||||||||||||
Gross proceeds from business disposals | 78 | 311 | 235 | |||||||||||||
Payments on business disposals | (25 | ) | (116 | ) | (82 | ) | ||||||||||
Dividends received from joint ventures | 44 | 22 | 20 | |||||||||||||
|
|
|
|
|
| |||||||||||
Net cash used in investing activities | (565 | ) | (316 | ) | (476 | ) | ||||||||||
|
|
|
|
|
| |||||||||||
Cash flows from financing activities | ||||||||||||||||
Dividends paid to shareholders of the parent companies | (565 | ) | (549 | ) | (521 | ) | ||||||||||
Distributions to non-controlling interests | (7 | ) | (6 | ) | (4 | ) | ||||||||||
Increase/(decrease) in short term bank loans, overdrafts and commercial paper | 232 | 169 | (434 | ) | ||||||||||||
Issuance of term debt | 589 | 184 | 592 | |||||||||||||
Repayment of term debt | (300 | ) | (915 | ) | (437 | ) | ||||||||||
Repayment of finance leases | (10 | ) | (10 | ) | (4 | ) | ||||||||||
(Acquisition)/disposal of non-controlling interest | (15 | ) | — | 7 | ||||||||||||
Repurchase of ordinary shares | (600 | ) | (600 | ) | (250 | ) | ||||||||||
Purchase of shares by employee benefit trust | (39 | ) | — | — | ||||||||||||
Proceeds on issue of ordinary shares | 45 | 125 | 48 | |||||||||||||
|
|
|
|
|
| |||||||||||
Net cash used in financing activities | (670 | ) | (1,602 | ) | (1,003 | ) | ||||||||||
|
|
|
|
|
| |||||||||||
Increase/(decrease) in cash and cash equivalents | 142 | (532 | ) | (72 | ) | |||||||||||
|
|
|
|
|
| |||||||||||
Movement in cash and cash equivalents | ||||||||||||||||
At start of year | 132 | 641 | 726 | |||||||||||||
Increase/(decrease) in cash and cash equivalents | 142 | (532 | ) | (72 | ) | |||||||||||
Exchange translation differences | 2 | 23 | (13 | ) | ||||||||||||
|
|
|
|
|
| |||||||||||
At end of year | 276 | 132 | 641 | |||||||||||||
|
|
|
|
|
| |||||||||||
COMBINED STATEMENT OF FINANCIAL POSITION
AS AT DECEMBER 31, 2014
| Note | 2014 £m | 2013 £m | 2012 £m | |||||||||||||
Non-current assets | ||||||||||||||||
Goodwill | 14 | 4,981 | 4,576 | 4,545 | ||||||||||||
Intangible assets | 15 | 3,164 | 3,124 | 3,275 | ||||||||||||
Investments in joint ventures | 16 | 125 | 125 | 100 | ||||||||||||
Other investments | 16 | 112 | 92 | 79 | ||||||||||||
Property, plant and equipment | 17 | 227 | 237 | 264 | ||||||||||||
Deferred tax assets | 19 | 464 | 442 | 79 | ||||||||||||
Derivative financial instruments | 18 | 78 | 64 | 138 | ||||||||||||
|
|
|
|
|
| |||||||||||
| 9,151 | 8,660 | 8,480 | ||||||||||||||
|
|
|
|
|
| |||||||||||
Current assets | ||||||||||||||||
Inventories and pre-publication costs | 20 | 142 | 142 | 159 | ||||||||||||
Trade and other receivables | 21 | 1,487 | 1,416 | 1,380 | ||||||||||||
Derivative financial instruments | 18 | 31 | 124 | 57 | ||||||||||||
Cash and cash equivalents | 276 | 132 | 641 | |||||||||||||
|
|
|
|
|
| |||||||||||
| 1,936 | 1,814 | 2,237 | ||||||||||||||
|
|
|
|
|
| |||||||||||
Assets held for sale | 22 | — | 21 | 297 | ||||||||||||
|
|
|
|
|
| |||||||||||
Total assets | 11,087 | 10,495 | 11,014 | |||||||||||||
|
|
|
|
|
| |||||||||||
Current liabilities | ||||||||||||||||
Trade and other payables | 23 | 2,636 | 2,595 | 2,544 | ||||||||||||
Derivative financial instruments | 18 | 23 | 4 | 11 | ||||||||||||
Borrowings | 24 | 676 | 648 | 730 | ||||||||||||
Taxation | 582 | 588 | 603 | |||||||||||||
Provisions | 26 | 19 | 17 | 30 | ||||||||||||
|
|
|
|
|
| |||||||||||
| 3,936 | 3,852 | 3,918 | ||||||||||||||
|
|
|
|
|
| |||||||||||
Non-current liabilities | ||||||||||||||||
Derivative financial instruments | 18 | 71 | 13 | — | ||||||||||||
Borrowings | 24 | 3,149 | 2,633 | 3,162 | ||||||||||||
Deferred tax liabilities | 19 | 1,056 | 1,076 | 919 | ||||||||||||
Net pension obligations | 6 | 632 | 379 | 466 | ||||||||||||
Provisions | 26 | 104 | 116 | 139 | ||||||||||||
|
|
|
|
|
| |||||||||||
| 5,012 | 4,217 | 4,686 | ||||||||||||||
|
|
|
|
|
| |||||||||||
Liabilities associated with assets held for sale | 22 | 2 | 3 | 96 | ||||||||||||
|
|
|
|
|
| |||||||||||
Total liabilities | 8,950 | 8,072 | 8,700 | |||||||||||||
|
|
|
|
|
| |||||||||||
Net assets | 2,137 | 2,423 | 2,314 | |||||||||||||
|
|
|
|
|
| |||||||||||
Capital and reserves | ||||||||||||||||
Combined share capitals | 27 | 212 | 224 | 223 | ||||||||||||
Combined share premiums | 27 | 2,820 | 2,887 | 2,727 | ||||||||||||
Combined shares held in treasury | 27 | (1,107 | ) | (1,464 | ) | (899 | ) | |||||||||
Translation reserve | 74 | (137 | ) | (23 | ) | |||||||||||
Other combined reserves | 28 | 107 | 880 | 252 | ||||||||||||
|
|
|
|
|
| |||||||||||
Combined shareholders’ equity | 2,106 | 2,390 | 2,280 | |||||||||||||
Non-controlling interests | 31 | 33 | 34 | |||||||||||||
|
|
|
|
|
| |||||||||||
Total equity | 2,137 | 2,423 | 2,314 | |||||||||||||
|
|
|
|
|
| |||||||||||
COMBINED STATEMENT OF CHANGES IN EQUITY
FOR THE YEAR ENDED DECEMBER 31, 2014
| Note | Combined share capitals £m | Combined share premiums £m | Combined shares held in treasury £m | Translation reserve £m | Other combined reserves £m | Combined shareholders’ equity £m | Non- controlling interests £m | Total equity £m | ||||||||||||||||||||||||||||
Balance at January 1, 2014 | 224 | 2,887 | (1,464 | ) | (137 | ) | 880 | 2,390 | 33 | 2,423 | ||||||||||||||||||||||||||
Total comprehensive income for the year | — | — | — | 137 | 703 | 840 | 5 | 845 | ||||||||||||||||||||||||||||
Dividends paid | 13 | — | — | — | — | (565 | ) | (565 | ) | (7 | ) | (572 | ) | |||||||||||||||||||||||
Issue of ordinary shares, net of expenses | 2 | 43 | — | — | — | 45 | — | 45 | ||||||||||||||||||||||||||||
Repurchase of ordinary shares | — | — | (639 | ) | — | — | (639 | ) | — | (639 | ) | |||||||||||||||||||||||||
Cancellation of shares | (11 | ) | — | 930 | — | (919 | ) | — | — | — | ||||||||||||||||||||||||||
Increase in share based remuneration reserve (net of tax) | — | — | — | — | 48 | 48 | — | 48 | ||||||||||||||||||||||||||||
Settlement of share awards | — | — | 27 | — | (27 | ) | — | — | — | |||||||||||||||||||||||||||
Acquisitions | — | — | — | — | — | — | 1 | 1 | ||||||||||||||||||||||||||||
Acquisition of non-controlling interest | — | — | — | — | (13 | ) | (13 | ) | (2 | ) | (15 | ) | ||||||||||||||||||||||||
Exchange differences on translation of capital and reserves | (3 | ) | (110 | ) | 39 | 74 | — | — | 1 | 1 | ||||||||||||||||||||||||||
|
|
|
|
|
|
|
|
|
|
|
|
|
|
|
| |||||||||||||||||||||
Balance at December 31, 2014 | 212 | 2,820 | (1,107 | ) | 74 | 107 | 2,106 | 31 | 2,137 | |||||||||||||||||||||||||||
|
|
|
|
|
|
|
|
|
|
|
|
|
|
|
| |||||||||||||||||||||
Balance at January 1, 2013 | 223 | 2,727 | (899 | ) | (23 | ) | 252 | 2,280 | 34 | 2,314 | ||||||||||||||||||||||||||
Total comprehensive income for the year | — | — | — | (88 | ) | 1,174 | 1,086 | 5 | 1,091 | |||||||||||||||||||||||||||
Dividends paid | 13 | — | — | — | — | (549 | ) | (549 | ) | (6 | ) | (555 | ) | |||||||||||||||||||||||
Issue of ordinary shares, net of expenses | 1 | 124 | — | — | — | 125 | — | 125 | ||||||||||||||||||||||||||||
Repurchase of ordinary shares | — | — | (600 | ) | — | — | (600 | ) | — | (600 | ) | |||||||||||||||||||||||||
Increase in share based remuneration reserve (net of tax) | — | — | — | — | 48 | 48 | — | 48 | ||||||||||||||||||||||||||||
Settlement of share awards | — | — | 40 | — | (40 | ) | — | — | — | |||||||||||||||||||||||||||
Exchange differences on translation of capital and reserves | — | 36 | (5 | ) | (26 | ) | (5 | ) | — | — | — | |||||||||||||||||||||||||
|
|
|
|
|
|
|
|
|
|
|
|
|
|
|
| |||||||||||||||||||||
Balance at December 31, 2013 | 224 | 2,887 | (1,464 | ) | (137 | ) | 880 | 2,390 | 33 | 2,423 | ||||||||||||||||||||||||||
|
|
|
|
|
|
|
|
|
|
|
|
|
|
|
| |||||||||||||||||||||
Balance at January 1, 2012 | 223 | 2,723 | (663 | ) | 88 | (199 | ) | 2,172 | 25 | 2,197 | ||||||||||||||||||||||||||
Total comprehensive income for the year | — | — | — | (136 | ) | 930 | 794 | 5 | 799 | |||||||||||||||||||||||||||
Dividends paid | 13 | — | — | — | — | (521 | ) | (521 | ) | (4 | ) | (525 | ) | |||||||||||||||||||||||
Issue of ordinary shares, net of expenses | 1 | 47 | — | — | — | 48 | — | 48 | ||||||||||||||||||||||||||||
Repurchase of ordinary shares | — | — | (250 | ) | — | — | (250 | ) | — | (250 | ) | |||||||||||||||||||||||||
Increase in share based remuneration reserve | — | — | — | — | 31 | 31 | — | 31 | ||||||||||||||||||||||||||||
Settlement of share awards | — | — | 7 | — | (7 | ) | — | — | — | |||||||||||||||||||||||||||
Acquisitions | — | — | — | — | — | — | 9 | 9 | ||||||||||||||||||||||||||||
Disposal of non-controlling interest | — | — | — | — | 6 | 6 | 1 | 7 | ||||||||||||||||||||||||||||
Exchange differences on translation of capital and reserves | (1 | ) | (43 | ) | 7 | 25 | 12 | — | (2 | ) | (2 | ) | ||||||||||||||||||||||||
|
|
|
|
|
|
|
|
|
|
|
|
|
|
|
| |||||||||||||||||||||
Balance at December 31, 2012 | 223 | 2,727 | (899 | ) | (23 | ) | 252 | 2,280 | 34 | 2,314 | ||||||||||||||||||||||||||
|
|
|
|
|
|
|
|
|
|
|
|
|
|
|
| |||||||||||||||||||||
NOTES TO THE COMBINED FINANCIAL STATEMENTS
The combined financial statements are prepared in accordance with International Financial Reporting Standards (“IFRS”) as issued by the International Accounting Standards Board (“IASB”) as adopted by the European Union.
As a consequence of the merger of their respective businesses, Reed Elsevier PLC and Reed Elsevier NV contributed their businesses to two jointly owned companies, Reed Elsevier Group plc and Elsevier Reed Finance BV. During 2014, Reed Elsevier Group plc, a company incorporated in England, owned the publishing and information businesses, and Elsevier Reed Finance BV, a company incorporated in the Netherlands, owned the financing and treasury companies. Reed Elsevier PLC and Reed Elsevier NV each held a 50% interest in Reed Elsevier Group plc. Until the end of 2014, Reed Elsevier PLC held a 39% interest in Elsevier Reed Finance BV and Reed Elsevier NV held a 61% interest. Reed Elsevier PLC additionally holds an indirect equity interest in Reed Elsevier NV, reflecting the arrangements entered into between Reed Elsevier PLC and Reed Elsevier NV at the time of the merger, which determined the equalisation ratio whereby one Reed Elsevier NV ordinary share is, in broad terms, intended to confer equivalent economic interests to 1.538 Reed Elsevier PLC ordinary shares.
The equalisation agreement between Reed Elsevier PLC and Reed Elsevier NV has the effect that their shareholders can be regarded as having the interests of a single economic group. For 2014 the Group combined financial statements (“the combined financial Statements”) represent the combined interests of both sets of shareholders and encompass the businesses of Reed Elsevier Group plc and Elsevier Reed Finance BV and their subsidiaries, associates and joint ventures, together with the two parent companies, Reed Elsevier PLC and Reed Elsevier NV (“the combined businesses”).
The Group accounting policies are set out below:
Principles of combination
In preparing the combined financial statements, subsidiaries of Reed Elsevier Group plc and Elsevier Reed Finance BV are accounted for under the acquisition method and investments in associates and joint ventures are accounted for under the equity method. All transactions and balances between the combined businesses are eliminated.
On acquisition of a subsidiary, or interest in an associate or joint venture, fair values, reflecting conditions at the date of acquisition, are attributed to the net assets, including identifiable intangible assets acquired. This includes those adjustments made to bring accounting policies into line with those of the combined businesses. The results of subsidiaries sold or acquired are included in the combined financial statements up to or from the date that control passes from or to the combined businesses.
Non-controlling interests in the net assets of the combined businesses are identified separately from combined shareholders’ equity. Non-controlling interests consist of the amount of those interests at the date of the original acquisition and the non-controlling share of changes in equity since the date of acquisition.
Foreign exchange translation
The combined financial statements are presented in pounds sterling.
Transactions in foreign currencies are recorded at the rate of exchange prevailing on the date of the transaction. At each statement of financial position date, monetary assets and liabilities that are denominated in foreign currencies are retranslated at the rate prevailing on the statement of financial position date. Exchange differences arising are recorded in the income statement other than where hedge accounting applies as set out below.
Assets and liabilities of foreign operations are translated at exchange rates prevailing on the statement of financial position date. Income and expense items and cash flows of foreign operations are translated at the average exchange rate for the period. Significant individual items of income and expense and cash flows in foreign operations are translated at the rate prevailing on the date of transaction. Exchange differences arising are classified as equity and transferred to the translation reserve. When foreign operations are disposed of, the related cumulative translation differences are recognised within the income statement in the period.
The Group uses derivative financial instruments, primarily forward contracts, to hedge its exposure to certain foreign exchange risks. Details of the Group’s accounting policies in respect of derivative financial instruments are set out below.
RevenueF-3
Revenue represents the invoiced value of sales less anticipated returns on transactions completed by performance, excluding customer sales taxes.
Revenues are recognised for the various categories as follows: subscriptions — on periodic despatch of subscribed product or rateably over the period of the subscription where performance is not measurable by despatch; transactional — on despatch or occurrence of the transaction and advertising — on publication or over the period of online display.
Where sales consist of two or more independent components whose value can be reliably measured, revenue is recognised on each component as it is completed by performance, based on attribution of relative value.
Employee benefits
The expense of defined benefit pension schemes and other post-retirement employee benefits is determined using the projected unit credit method and charged in the income statement as an operating expense, based on actuarial assumptions reflecting market conditions at the beginning of the financial year. Actuarial gains and losses are recognised in full in the statement of comprehensive income in the period in which they occur.
Past service costs are recognised immediately at the earlier of when plan amendments or curtailments occur and when related restructuring costs or termination benefits are recognised. Settlements are recognised when they occur.
Net pension obligations in respect of defined benefit schemes are included in the statement of financial position at the present value of scheme liabilities, less the fair value of scheme assets. Where schemes are in surplus, i.e. assets exceed liabilities, the net pension assets are separately included in the statement of financial position. Any net pension asset is limited to the extent that the asset is recoverable through reductions in future contributions.
The expense of defined contribution pension schemes and other employee benefits is charged in the income statement as incurred.
Share based remuneration
The fair value of share based remuneration is determined at the date of grant and recognised as an expense in the income statement on a straight line basis over the vesting period, taking account of the estimated number of shares that are expected to vest. Market based performance criteria are taken into account when determining the fair value at the date of grant. Non-market based performance criteria are taken into account when estimating the number of shares expected to vest. The fair value of share based remuneration is determined by use of a binomial or Monte Carlo simulation model as appropriate. All the Group’s share based remuneration is equity settled.
Borrowing costs
Borrowing costs that are directly attributable to the acquisition, construction or production of an asset that takes a substantial period of time to bring to use are capitalised. All other interest on borrowings is expensed as incurred. The cost of issuing borrowings is generally expensed over the period of borrowing so as to produce a constant periodic rate of charge.
Taxation
Tax expense comprises current and deferred tax. Current and deferred tax are charged or credited in the income statement except to the extent that the tax arises from a transaction or event which is recognised, in the same or a different period, outside profit or loss (either in other comprehensive income, directly in equity, or through a business combination) in which case the tax appears in the same statement as the transaction that gave rise to it.
Current tax is the amount of corporate income taxes payable or recoverable based on the profit for the period as adjusted for items that are not taxable or not deductible, and is calculated using tax rates and laws that were enacted or substantively enacted at the date of the statement of financial position. Management periodically evaluates positions taken in tax returns with respect to situations in which applicable tax regulation is subject to interpretation. Provisions are established where appropriate on the basis of amounts expected to be paid to the tax authorities.
Deferred tax is recognised on temporary differences arising between the tax bases of assets and liabilities and their carrying amounts in the statement of financial position. Deferred tax is calculated using tax rates and laws that have been enacted or substantively enacted at the end of the reporting period, and which are expected to apply when the related deferred tax asset is realised or the deferred tax liability is settled.
Deferred tax liabilities are generally recognised for all taxable temporary differences but not recognised for taxable temporary differences arising on investments in subsidiaries, associates and joint ventures where the reversal of the temporary difference can be controlled and it is probable that the difference will not reverse in the foreseeable future. Deferred tax liabilities are not recognised on temporary differences that arise from goodwill which is not deductible for tax purposes.
Deferred tax assets are recognised to the extent it is probable that taxable profits will be available against which the deductible temporary differences can be utilised and are reviewed at the end of each reporting period and reduced to the extent that it is no longer probable that sufficient taxable profits will be available to allow all or part of the asset to be recovered.
Deferred tax assets and liabilities are not recognised in respect of temporary differences that arise on initial recognition of assets and liabilities acquired other than in a business combination. Deferred tax is not discounted.
Goodwill
On the acquisition of a subsidiary or business, the purchase consideration is allocated between the net tangible and intangible assets on a fair value basis, with any excess purchase consideration representing goodwill. Goodwill arising on acquisitions also includes amounts corresponding to deferred tax liabilities recognised in respect of acquired intangible assets.
Goodwill is recognised as an asset and reviewed for impairment when there is an indicator that the asset may be impaired and at least annually. Any impairment is recognised immediately in the income statement and not subsequently reversed.
On disposal of a subsidiary or business, the attributable amount of goodwill is included in the determination of the profit or loss on disposal.
Intangible assets
Intangible assets acquired as part of a business combination are stated in the statement of financial position at their fair value as at the date of acquisition, less accumulated amortisation. Internally generated intangible assets are stated in the statement of financial position at the directly attributable cost of creation of the asset, less accumulated amortisation.
Intangible assets acquired as part of business combinations comprise: market related assets (e.g. trademarks, imprints, brands); customer related assets (e.g. subscription bases, customer lists, customer relationships); editorial content; software and systems (e.g. application infrastructure, product delivery platforms, in-process research and development); contract based assets (e.g. publishing rights, exhibition rights, supply contracts); and other intangible assets. Internally generated intangible assets typically comprise software and systems development where an identifiable asset is created that is probable to generate future economic benefits.
Intangible assets, other than brands and imprints determined to have indefinite lives, are amortised on a straight line basis over their estimated useful lives. The estimated useful lives of intangible assets with finite lives are as follows: market and customer related assets — 3 to 40 years; content, software and other acquired intangible assets — 3 to 20 years; and internally developed intangible assets — 3 to 10 years. Brands and imprints determined to have indefinite lives are not amortised and are subject to an impairment review at least annually.
Property, plant and equipment
Property, plant and equipment are stated in the statement of financial position at cost less accumulated depreciation. No depreciation is provided on freehold land. Freehold buildings and long leases are depreciated over their estimated useful lives up to a maximum of 50 years. Short leases are written off over the duration of the lease. Depreciation is provided on other assets on a straight line basis over their estimated useful lives as follows: leasehold improvements — shorter of life of lease and 10 years; plant — 3 to 20 years; office furniture, fixtures and fittings — 5 to 10 years; computer systems, communication networks and equipment — 3 to 7 years.
Investments
Investments, other than investments in joint arrangements and associates, are stated in the statement of financial position at fair value. Investments held as part of the venture capital portfolio are classified as held for trading, with changes in fair value reported in disposals and other non operating items in the income statement. All other investments are classified as available for sale with changes in fair value recognised directly in equity until the investment is disposed of or is determined to be impaired, at which time the cumulative gain or loss previously recognised in equity is brought into the net profit or loss for the period. All items recognised in the income statement relating to investments, other than investments in joint arrangements and associates, are reported as disposals and other non operating items.
Available for sale investments and venture capital investments held for trading represent investments in listed and unlisted securities. The fair value of listed securities is determined based on quoted market prices, and of unlisted securities on management’s estimate of fair value based on standard valuation techniques, including market comparisons and discounts of future cash flows, having regard to maximising the use of observable inputs and adjusting for risk. Advice from valuation experts is used as appropriate.
All joint arrangements are classified as joint ventures because the Group shares joint control and has rights to the net assets of the arrangements. Investments in joint ventures and associates are accounted for under the equity method and stated in the statement of financial position at cost as adjusted for post-acquisition changes in the Group’s share of net assets, less any impairment in value.
Impairment
At each statement of financial position date, the carrying amounts of tangible and intangible assets and goodwill are reviewed to determine whether there is any indication that those assets have suffered an impairment loss. If any such indication exists, the recoverable amount, which is the higher of value in use and fair value less costs to sell, of the asset is estimated in order to determine the extent, if any, of the impairment loss. Where the asset does not generate cash flows that are independent from other assets, value in use estimates are made based on the cash flows of the cash generating unit to which the asset belongs. Intangible assets with an indefinite useful life are tested for impairment at least annually and whenever there is any indication that the asset may be impaired.
If the recoverable amount of an asset or cash generating unit is estimated to be less than its net carrying amount, the net carrying amount of the asset or cash generating unit is reduced to its recoverable amount. Impairment losses are recognised immediately in the income statement in administration and other expenses.
Inventories and pre-publication costs
Inventories and pre-publication costs are stated at the lower of cost, including appropriate attributable overhead, and estimated net realisable value. Pre-publication costs, representing costs incurred in the origination of content prior to publication, are expensed systematically reflecting the expected sales profile over the estimated economic lives of the related products, generally up to five years.
Leases
Assets held under leases which confer rights and obligations similar to those attaching to owned assets are classified as assets held under finance leases and capitalised within property, plant and equipment or software and the corresponding liability to pay rentals is shown net of interest in the statement of financial position as obligations under finance leases. The capitalised value of the assets is depreciated on a straight line basis over the shorter of the periods of the leases or the useful lives of the assets concerned. The interest element of the lease payments is allocated so as to produce a constant periodic rate of charge.
Operating lease rentals are charged to the income statement on a straight line basis over the period of the leases. Rental income from operating leases is recognised on a straight line basis over the term of the relevant lease.
Cash and cash equivalents
Cash and cash equivalents comprise cash balances, call deposits and other short term highly liquid investments and are held in the statement of financial position at fair value.
Assets held for sale
Assets of businesses that are available for immediate sale in their current condition and for which a sales process is considered highly probable to complete are classified as assets held for sale, and are carried at the lower of carrying value and fair value less costs to sell. Fair value is based on anticipated disposal proceeds, typically derived from firm or indicative offers from potential acquirers. Non-current assets are not amortised or depreciated following their classification as held for sale. Liabilities of businesses held for sale are also separately classified on the statement of financial position.
Financial instruments
Financial instruments comprise investments (other than investments in joint ventures or associates), trade receivables, cash and cash equivalents, payables and accruals, borrowings and derivative financial instruments.
Investments (other than investments in joint ventures and associates) are classified as either held for trading or available for sale, as described above. (These investments are typically classified as either Level 1 or Level 2 in the IFRS13 fair value hierarchy.). The fair value of such investments is based on either quoted market prices or other observable market inputs.
Trade receivables are carried in the statement of financial position at invoiced value less allowance for estimated irrecoverable amounts. Irrecoverable amounts are estimated based on the ageing of trade receivables, experience and circumstance.
Borrowings and payables are recorded initially at fair value and subsequently carried at amortised cost (other than fixed rate borrowings in designated hedging relationships for which the carrying amount of the hedged portion of the borrowings is subsequently adjusted for the gain or loss attributable to the hedged risk).
Derivative financial instruments are used to hedge interest rate and foreign exchange risks. Changes in the fair value of derivative financial instruments that are designated and effective as hedges of future cash flows are recognised (net of tax) directly in equity in the hedge reserve. If a hedged firm commitment or forecasted transaction results in the recognition of a non financial asset or liability, then, at the time that the asset or liability is recognised, the associated gains or losses on the derivative that had previously been recognised in equity are included in the initial measurement of the asset or liability. For hedges that do not result in the recognition of an asset or a liability, amounts deferred in equity are recognised in the income statement in the same period in which the hedged item affects net profit or loss. Any ineffective portion of hedges is recognised immediately in the income statement.
Derivative financial instruments that are not designated as hedging instruments are classified as held for trading and recorded in the statement of financial position at fair value, with changes in fair value recognised in the income statement.
Where an effective hedge is in place against changes in the fair value of fixed rate borrowings, the hedged borrowings are adjusted for changes in fair value attributable to the risk being hedged with a corresponding income or expense included in the income statement within finance costs. The offsetting gains or losses from remeasuring the fair value of the related derivatives are also recognised in the income statement within finance costs. When the related derivative expires, is sold or terminated, or no longer qualifies for hedge accounting, the cumulative change in fair value of the hedged borrowing is amortised in the income statement over the period to maturity of the borrowing using the effective interest method.
The fair values of interest rate swaps, interest rate options, forward rate agreements and forward foreign exchange contracts represent the replacement costs calculated using observable market rates of interest and exchange. The fair value of long term borrowings is calculated by discounting expected future cash flows at observable market rates. (These instruments are accordingly classified as Level 2 in the IFRS13 fair value hierarchy.)
Cash flow hedge accounting is discontinued when a hedging instrument expires or is sold, terminated or exercised, or no longer qualifies for hedge accounting. At that time, any cumulative gain or loss on the hedging instrument recognised in equity is either retained in equity until the firm commitment or forecasted transaction occurs, or, where a hedged transaction is no longer expected to occur, is immediately credited or expensed in the income statement.
Provisions
Provisions are recognised when a present obligation exists as a result of a past event, the obligation is reasonably estimable, and it is probable that settlement will be required. Provisions are measured at the best estimate of the expenditure required to settle the obligation at the statement of financial position date.
Shares held in treasury
Shares of Reed Elsevier PLC and Reed Elsevier NV that are repurchased by the respective parent companies and not cancelled are classified as shares held in treasury. The consideration paid, including directly attributable costs, is recognised as a deduction from equity. Shares of the parent companies that are purchased by the Employee Benefit Trust are also classified as shares held in treasury, with the cost recognised as a deduction from equity.
Critical judgements and key sources of estimation uncertainty
The most significant accounting policies in determining the financial condition and results of the combined businesses, and those requiring the most subjective or complex judgement, relate to the valuation of goodwill and intangible assets, capitalisation of development spend, taxation and accounting for defined benefit pension schemes.
Goodwill and acquired intangible assets
On acquisition of a subsidiary or business, the purchase consideration is allocated between the net tangible and intangible assets other than goodwill on a fair value basis, with any excess purchase consideration representing goodwill. The valuation of acquired intangible assets represents the estimated economic value in use, using standard valuation methodologies, including as appropriate, discounted cash flow, relief from royalty and comparable market transactions. Acquired intangible assets are capitalised and amortised systematically over their estimated useful lives, subject to impairment review.
Appropriate amortisation periods are selected based on assessments of the longevity of the brands and imprints, the strength and stability of customer relationships, the market positions of the acquired assets and the technological and competitive risks that they face. Certain intangible assets in relation to acquired science and medical publishing businesses have been determined to have indefinite lives. The longevity of these assets is evidenced by their long established and well regarded brands and imprints, and their characteristically stable market positions.
The carrying amounts of goodwill and indefinite lived intangible assets in each business are reviewed for impairment at least annually. The carrying amounts of all other intangible assets are reviewed where there are indications of possible impairment. An impairment review involves a comparison of the carrying value of the asset with estimated values in use based on the latest management cash flow projections approved by the board. Key areas of judgement in estimating the values in use of businesses are the growth in cash flows over a forecast period of up to five years, the long term growth rate assumed thereafter and the discount rate applied to the forecast cash flows. A description of the key assumptions and sensitivities is provided in note 14.
Development spend
Development spend embraces investment in new products and other initiatives, ranging from the building of online delivery platforms, to launch costs of new services, to building new infrastructure applications. Launch costs and other ongoing operating expenses of new products and services are expensed as incurred. The costs of building product applications, platforms and infrastructure are capitalised as intangible assets where the investment they represent has demonstrable value and technical and commercial feasibility is assured. Costs eligible for capitalisation must be incremental, clearly identified and directly attributable to a particular project. The resulting assets are amortised over their estimated useful lives. Impairment reviews are carried out at least annually. Judgement is required in the assessment of the potential value of a development project, the identification of costs eligible for capitalisation and the selection of appropriate asset lives.
Taxation
The Group is subject to tax in numerous jurisdictions, giving rise to complex tax issues that require management to exercise judgement in making tax determinations. While the Group is confident that tax returns are appropriately prepared and filed, amounts are provided in respect of uncertain tax positions that reflect the risk with respect to tax matters under active discussion with tax authorities, or which are otherwise considered to involve uncertainty. Amounts are provided using the best estimate of tax expected to be paid based on a qualitative assessment of all relevant factors. However, it is possible that at some future date liabilities may be adjusted as a result of audits by taxing authorities. Discussions with tax authorities relating to cross-border transactions and other matters are ongoing. Although the outcome of these discussions cannot be predicted, no significant impact on the financial position of the Group is expected.
In addition, estimation of income taxes includes assessments of the recoverability of deferred tax assets. Deferred tax assets are only recognized to the extent that they are considered recoverable based on existing tax laws and forecasts of future taxable profits against which the underlying tax deductions can be utilized. The recoverability of these assets is reassessed at the end of each reporting period, and changes in recognition of deferred tax assets will affect the tax liability in the period of that reassessment.
Pensions
The Group operates a number of defined benefit pension schemes across the world. The largest schemes are in the UK, the US and the Netherlands, as described in note 6 to the financial statements. These schemes require management to exercise judgement in estimating the ultimate cost of providing post-employment benefits, especially given the length of each scheme’s liabilities. The recognition of certain scheme liabilities is also subject to judgement. Accounting for defined benefit pension schemes involves judgement about uncertain events, including the life expectancy of the members, salary and pension increases, inflation, the future operation of each scheme and the rate at which the future pension payments are discounted. Estimates for these factors are used in determining the pension cost and liabilities reported in the financial statements. The estimates made around future developments of each of the critical assumptions are made in conjunction with independent actuaries. Each scheme is subject to a periodic review by independent actuaries. Information regarding some of the assumptions used for valuation is provided in note 6 to the financial statements, together with a sensitivity analysis.
Other significant accounting policies
The accounting policies in respect of revenue recognition, pre-publication costs and property provisioning are also significant in determining the financial condition and results of the combined businesses, although the application of these policies is more straightforward.
Revenue recognition policies, while an area of management focus, are generally straightforward in application as the timing of product or service delivery and customer acceptance for the various revenue types can be readily determined. Allowances for product returns are deducted from revenues based on historical return rates. Where sales consist of two or more components that operate independently, revenue is recognised as each component is completed by performance, based on attribution of relative value.
Pre-publication costs incurred in the creation of content prior to production and publication are typically deferred and expensed over their estimated useful lives based on sales profiles. Such costs typically comprise direct internal labour costs and externally commissioned editorial and other fees. Estimated useful lives generally do not exceed five years. Annual reviews are carried out to assess the recoverability of carrying amounts.
The Group has exposures to sub lease shortfalls in respect of certain property leases for periods up to 2024. Provisions are recognised for net liabilities expected to arise on these exposures. Estimation of the provisions requires judgement in respect of future head lease costs, sub lease income and the length of vacancy periods. The charge for property provisions was nil (2013: nil; 2012: £62 million) relating to surplus property arising on the restructuring, sale and closure of Risk & Business Information businesses and includes expected losses on sub-leases entered into, an estimate of vacancy periods and future market conditions. Further information is provided in note 26 to the combined financial statements.
Standards and amendments effective for the year
The interpretations and amendments to IFRS effective for 2014 have not had a significant impact on the Group’s accounting policies or reporting.
Standards, amendments and interpretations not yet effective
New accounting standards and amendments and their expected impact on the future accounting policies and reporting of the Group are set out below.
IFRS 15 – Revenue from contracts with customers (effective for the 2017 financial year). The new standard provides a single point of reference for revenue recognition replacing a range of different revenue accounting standards, interpretations and guidance. The Group is in the process of assessing the impact of this standard.
IFRS9 – Financial Instruments (effective for the 2018 financial year). The standard replaces the existing classification and measurement requirements in IAS39 for financial assets by requiring entities to classify them as being measured either at amortised cost or fair value depending on the business model and contractual cash flow characteristics of the asset. For financial liabilities, IFRS9 requires an entity choosing to measure a liability at fair value to present the portion of the change in its fair value due to changes in the entity’s own credit risk in the other comprehensive income rather than the income statement. Adoption of the standard is not expected to have a significant impact on the measurement, presentation or disclosure of financial assets and liabilities in the combined financial statements.
Additionally, a number of amendments and interpretations have been issued which are not expected to have any significant impact on the Group’s accounting policies and reporting.
The Group is a leading provider of information solutions for professional customers across industries. We operate in four market segments: Scientific, Technical & Medical, providing information and tools to help its customers improve scientific and healthcare outcomes; Risk & Business Information, providing data services and tools that combine proprietary, public and third-party information, with technology and analytics to business and government customers; Legal, providing legal, tax, regulatory news and business information to legal, corporate, government and academic markets; and Exhibitions, organising exhibitions and conferences.
The Group’s reported segments are based on the internal reporting structure and financial information provided to the Boards. During 2014, Risk Solutions and Business Information have been combined into one Business area, having previously operated separately. Accordingly, they are now presented as a single operating segment. Comparative figures have been presented as if the businesses had operated on a combined basis in the prior year.
Following a review of activities, assets and costs across the business, the Group introduced a new method for the allocation of corporate and shared costs from January 1, 2014. Previously unallocated items and costs relating to shared activities and resources have been attributed to the business segments on the basis of usage and benefits derived. This new allocation reflects an increased level of shared resources and capitalised costs. Comparative adjusted operating profit figures have been restated as if this allocation method had been used in the prior years. This reflects the presentation of financial information provided to the Boards.
Adjusted operating profit is the key segmental profit measure used by the Group in assessing performance. It is stated before amortisation of acquired intangible assets, the share of profit on disposals in joint ventures, acquisition related costs, and is grossed up to exclude the equity share of taxes in joint ventures.
Analysis by business segment
| 2014 £m | 2013 Restated £m | 2012 Restated £m | ||||||||||
Revenue | ||||||||||||
Scientific, Technical & Medical | 2,048 | 2,126 | 2,063 | |||||||||
Risk & Business Information | 1,439 | 1,480 | 1,589 | |||||||||
Legal | 1,396 | 1,567 | 1,610 | |||||||||
Exhibitions | 890 | 862 | 854 | |||||||||
|
|
|
|
|
| |||||||
Total | 5,773 | 6,035 | 6,116 | |||||||||
|
|
|
|
|
| |||||||
Adjusted operating profit | ||||||||||||
Scientific, Technical & Medical | 762 | 787 | 743 | |||||||||
Risk & Business Information | 506 | 507 | 498 | |||||||||
Legal | 260 | 250 | 244 | |||||||||
Exhibitions | 217 | 210 | 208 | |||||||||
|
|
|
|
|
| |||||||
Sub-total | 1,745 | 1,754 | 1,693 | |||||||||
Corporate costs | (6 | ) | (5 | ) | (5 | ) | ||||||
|
|
|
|
|
| |||||||
Total | 1,739 | 1,749 | 1,688 | |||||||||
|
|
|
|
|
| |||||||
Analysis by geographical origin
| 2014 £m | 2013 £m | 2012 £m | ||||||||||
Revenue | ||||||||||||
North America | 2,884 | 3,103 | 3,122 | |||||||||
United Kingdom | 1,013 | 985 | 966 | |||||||||
The Netherlands | 636 | 656 | 611 | |||||||||
Rest of Europe | 686 | 698 | 788 | |||||||||
Rest of world | 554 | 593 | 629 | |||||||||
|
|
|
|
|
| |||||||
Total | 5,773 | 6,035 | 6,116 | |||||||||
|
|
|
|
|
| |||||||
Analysis by geographical market
| 2014 £m | 2013 £m | 2012 £m | ||||||||||
Revenue | ||||||||||||
North America | 2,878 | 3,082 | 3,154 | |||||||||
United Kingdom | 455 | 443 | 442 | |||||||||
The Netherlands | 153 | 166 | 165 | |||||||||
Rest of Europe | 1,053 | 1,074 | 1,176 | |||||||||
Rest of world | 1,234 | 1,270 | 1,179 | |||||||||
|
|
|
|
|
| |||||||
Total | 5,773 | 6,035 | 6,116 | |||||||||
|
|
|
|
|
| |||||||
Analysis by format
| 2014 £m | 2013 £m | 2012 £m | ||||||||||
Revenue | ||||||||||||
Electronic | 3,839 | 3,971 | 3,896 | |||||||||
| 1,012 | 1,168 | 1,305 | ||||||||||
Face to face | 922 | 896 | 915 | |||||||||
|
|
|
|
|
| |||||||
Total | 5,773 | 6,035 | 6,116 | |||||||||
|
|
|
|
|
| |||||||
Analysis by type
| 2014 £m | 2013 £m | 2012 £m | ||||||||||
Revenue | ||||||||||||
Subscriptions | 2,966 | 3,112 | 2,978 | |||||||||
Transactional | 2,672 | 2,683 | 2,788 | |||||||||
Advertising | 135 | 240 | 350 | |||||||||
|
|
|
|
|
| |||||||
Total | 5,773 | 6,035 | 6,116 | |||||||||
|
|
|
|
|
| |||||||
Share of post-tax results of joint ventures of £36 million (2013: £29 million; 2012: £24 million) included in operating profit comprises £16 million (2013: £6 million; 2012: £2 million) relating to Legal and £20 million (2013: £23 million; 2012: £22 million) relating to Exhibitions.
A reconciliation of operating profit to adjusted operating profit is provided below:
| 2014 £m | 2013 £m | 2012 £m | ||||||||||
Operating profit | 1,402 | 1,376 | 1,333 | |||||||||
Adjustments: | ||||||||||||
Amortisation of acquired intangible assets | 286 | 318 | 329 | |||||||||
Acquisition related costs | 30 | 43 | 21 | |||||||||
Reclassification of tax in joint ventures | 21 | 12 | 5 | |||||||||
|
|
|
|
|
| |||||||
Adjusted operating profit | 1,739 | 1,749 | 1,688 | |||||||||
|
|
|
|
|
| |||||||
Analysis by business segment
| 2014 £m | 2013 Restated £m | 2012 Restated £m | ||||||||||
Expenditure on acquired goodwill and intangible assets | ||||||||||||
Scientific, Technical & Medical | 25 | 50 | 120 | |||||||||
Risk & Business Information | 330 | 169 | 15 | |||||||||
Legal | 48 | 15 | 80 | |||||||||
Exhibitions | 23 | 56 | 178 | |||||||||
|
|
|
|
|
| |||||||
Total | 426 | 290 | 393 | |||||||||
|
|
|
|
|
| |||||||
Capital expenditure additions | ||||||||||||
Scientific, Technical & Medical | 56 | 93 | 106 | |||||||||
Risk & Business Information | 53 | 43 | 38 | |||||||||
Legal | 145 | 170 | 173 | |||||||||
Exhibitions | 27 | 15 | 25 | |||||||||
|
|
|
|
|
| |||||||
Total | 281 | 321 | 342 | |||||||||
|
|
|
|
|
| |||||||
Amortisation of acquired intangible assets | ||||||||||||
Scientific, Technical & Medical | 79 | 86 | 78 | |||||||||
Risk & Business Information | 116 | 128 | 146 | |||||||||
Legal | 57 | 64 | 73 | |||||||||
Exhibitions | 34 | 40 | 32 | |||||||||
|
|
|
|
|
| |||||||
Total | 286 | 318 | 329 | |||||||||
|
|
|
|
|
| |||||||
Depreciation and other amortisation | ||||||||||||
Scientific, Technical & Medical | 94 | 100 | 87 | |||||||||
Risk & Business Information | 34 | 33 | 38 | |||||||||
Legal | 94 | 101 | 85 | |||||||||
Exhibitions | 15 | 15 | 17 | |||||||||
|
|
|
|
|
| |||||||
Total | 237 | 249 | 227 | |||||||||
|
|
|
|
|
| |||||||
Capital expenditure comprises additions to property, plant and equipment and internally developed intangible assets. Amortisation of acquired intangible assets includes amounts in respect of joint ventures of £1 million (2013: £1 million; 2012: £1 million) in Exhibitions and £3 million (2013: nil; 2012 nil) in Legal. Other than the depreciation and amortisation above, non cash items includes a £32 million charge (2013: £31 million charge; 2012: £31 million charge) relating to the recognition of share based remuneration, comprising £12 million (2013: £11 million; 2012: £11 million) in Scientific, Technical & Medical, £8 million (2013: £8 million; 2012: £7 million) in Risk & Business Information, £7 million (2013: £7 million; 2012: £8 million) in Legal and £5 million (2013: £5 million; 2012: £5 million) in Exhibitions.
Analysis by geographical location
| 2014 £m | 2013 £m | 2012 £m | ||||||||||
Non-current assets | ||||||||||||
North America | 6,569 | 6,291 | 6,514 | |||||||||
United Kingdom | 701 | 584 | 524 | |||||||||
The Netherlands | 109 | 125 | 120 | |||||||||
Rest of Europe | 816 | 753 | 729 | |||||||||
Rest of world | 414 | 401 | 376 | |||||||||
|
|
|
|
|
| |||||||
Total | 8,609 | 8,154 | 8,263 | |||||||||
|
|
|
|
|
| |||||||
Non-current assets by geographical location exclude amounts relating to deferred tax and derivative financial instruments.
Operating profit is stated after charging/(crediting) the following:
| Note | 2014 £m | 2013 £m | 2012 £m | |||||||||||||
Staff costs | ||||||||||||||||
Wages and salaries | 1,415 | 1,508 | 1,543 | |||||||||||||
Social security costs | 167 | 175 | 187 | |||||||||||||
Pensions | 6 | 95 | 61 | 89 | ||||||||||||
Share based and related remuneration | 32 | 31 | 26 | |||||||||||||
|
|
|
|
|
| |||||||||||
Total staff costs | 1,709 | 1,775 | 1,845 | |||||||||||||
|
|
|
|
|
| |||||||||||
Depreciation and amortisation | ||||||||||||||||
Amortisation of acquired intangible assets | 15 | 282 | 317 | 328 | ||||||||||||
Share of joint ventures’ amortisation of acquired intangible assets | 4 | 1 | 1 | |||||||||||||
Amortisation of internally developed intangible assets | 15 | 158 | 160 | 151 | ||||||||||||
Depreciation of property, plant and equipment | 17 | 79 | 89 | 76 | ||||||||||||
|
|
|
|
|
| |||||||||||
Total depreciation and amortisation | 523 | 567 | 556 | |||||||||||||
|
|
|
|
|
| |||||||||||
Other expenses and income | ||||||||||||||||
Pre-publication costs, inventory expenses and other cost of sales | 2,006 | 2,118 | 2,139 | |||||||||||||
Operating lease rentals expense | 91 | 108 | 112 | |||||||||||||
Operating lease rentals income | (8 | ) | (10 | ) | (10 | ) | ||||||||||
|
|
|
|
|
| |||||||||||
The amortisation of acquired intangible assets is included within administration and other expenses.
Number of people employed: full time equivalents
| At December 31 | Average during the year | |||||||||||||||||||
| 2014 | 2013 | 2014 | 2013 | 2012 | ||||||||||||||||
Business segment | ||||||||||||||||||||
Scientific, Technical & Medical | 7,000 | 6,700 | 6,900 | 6,900 | 7,000 | |||||||||||||||
Risk & Business Information | 7,400 | 7,200 | 7,300 | 7,700 | 9,200 | |||||||||||||||
Legal | 9,500 | 10,000 | 9,600 | 10,400 | 10,400 | |||||||||||||||
Exhibitions | 3,700 | 3,400 | 3,500 | 3,300 | 3,000 | |||||||||||||||
|
|
|
|
|
|
|
|
|
| |||||||||||
Sub-total | 27,600 | 27,300 | 27,300 | 28,300 | 29,600 | |||||||||||||||
|
|
|
|
|
|
|
|
|
| |||||||||||
Corporate/shared functions | 900 | 900 | 900 | 900 | 900 | |||||||||||||||
|
|
|
|
|
|
|
|
|
| |||||||||||
Total | 28,500 | 28,200 | 28,200 | 29,200 | 30,500 | |||||||||||||||
|
|
|
|
|
|
|
|
|
| |||||||||||
Geographical location | ||||||||||||||||||||
North America | 13,300 | 13,900 | 13,400 | 14,800 | 15,900 | |||||||||||||||
United Kingdom | 4,300 | 4,100 | 4,200 | 4,100 | 4,200 | |||||||||||||||
The Netherlands | 1,600 | 1,600 | 1,600 | 1,600 | 1,600 | |||||||||||||||
Rest of Europe | 2,800 | 2,800 | 2,800 | 3,100 | 3,700 | |||||||||||||||
Rest of world | 6,500 | 5,800 | 6,200 | 5,600 | 5,100 | |||||||||||||||
|
|
|
|
|
|
|
|
|
| |||||||||||
Total | 28,500 | 28,200 | 28,200 | 29,200 | 30,500 | |||||||||||||||
|
|
|
|
|
|
|
|
|
| |||||||||||
A number of pension schemes are operated around the world. Historically, the largest schemes have been local versions of the defined benefit type with assets held in separate trustee administered funds. The largest defined benefit schemes are in the UK, the US and the Netherlands.
The UK scheme is a final salary scheme and is closed to new hires. Members accrue a portion of their final pensionable earnings based on the number of years of service. The US scheme is a cash balance scheme and is closed to new hires. Members earn pay credits dependent on age and years of service up to certain limits which are added to an account balance that accrues interest at specified minimum rates. The Netherlands scheme is a career average salary scheme and remains open to new hires. Members accrue a portion of their current salary at a rate calculated to enable them to reach a pension level based on their average salary.
Each of the major defined benefit schemes is administered by a separate fund that is legally separated from the Group. The trustees of the pension funds in the UK and the Netherlands and plan fiduciaries of the US scheme are required by law to act in the interest of the funds’ beneficiaries. In the UK and in the Netherlands the trustees of the pension fund are responsible for the investment policy with regard to the assets of the fund. The boards of trustees consist of an equal number of Group appointed and member nominated directors. In the US, the fiduciary duties for the scheme are allocated between committees which are staffed by senior employees of the Group; the investment committee has the primary responsibility for the investment and management of plan assets.
The funding of the Group’s major schemes reflects the different rules within each jurisdiction.
In the UK the level of funding is determined by statutory triennial actuarial valuations in accordance with pensions legislation. Where the scheme falls below 100% funded status, the Group and the scheme trustees must agree on how the deficit is to be remedied. The UK Pensions Regulator has significant powers and sets out in codes and guidance the parameters for scheme funding.
The US scheme has an annual statutory valuation which forms the basis for establishing the employer contribution each year (subject to ERISA and IRS minimums). Should the statutory funded status fall to below 100%, the US Pensions Protection Act requires the deficit to be rectified with additional contributions over a 7 year period.
In the Netherlands, on a regulatory basis, with effect from January 1, 2015 the scheme funding level is determined by the new Financial Assessment Framework (nFTK). The nFTK introduces, inter alia, a twelve-month average funding ratio, higher buffer requirements and stricter indexation than under previous legislation, and a 10 year recovery plan in the event of funding shortfalls. In case of a shortfall in the funding level, the first recovery plans are required to be filed with the Dutch Central Bank on July 1, 2015. On a contractual basis, the employer contribution is capped at 11.9% of salary.
Total regular employer contributions to defined benefit pension schemes in respect of 2015 are expected to be approximately £65 million.
The pension expense recognised within operating expense is:
| 2014 £m | 2013 £m | 2012 £m | ||||||||||
Defined benefit pension expense | 48 | 14 | 43 | |||||||||
Defined contribution pension expense | 47 | 47 | 46 | |||||||||
|
|
|
|
|
| |||||||
Total | 95 | 61 | 89 | |||||||||
|
|
|
|
|
| |||||||
The amounts recognised in the income statement in respect of defined benefit pension schemes during the year are presented by major scheme as follows:
| 2014 | 2013 | 2012 | ||||||||||||||||||||||||||||||||||||||||||||||
| UK £m | US £m | NL £m | Total £m | UK £m | US £m | NL £m | Total £m | UK £m | US £m | NL £m | Total £m | |||||||||||||||||||||||||||||||||||||
Service cost | 31 | 18 | 14 | 63 | 29 | 29 | 15 | 73 | 27 | 28 | 8 | 63 | ||||||||||||||||||||||||||||||||||||
Settlements and past service credits | — | — | (15 | ) | (15 | ) | — | (51 | ) | (8 | ) | (59 | ) | (1 | ) | (19 | ) | — | (20 | ) | ||||||||||||||||||||||||||||
|
|
|
|
|
|
|
|
|
|
|
|
|
|
|
|
|
|
|
|
|
|
|
| |||||||||||||||||||||||||
Defined benefit pension expense | 31 | 18 | (1 | ) | 48 | 29 | (22 | ) | 7 | 14 | 26 | 9 | 8 | 43 | ||||||||||||||||||||||||||||||||||
Net interest on net defined benefit obligation | 8 | 4 | 3 | 15 | 6 | 9 | 4 | 19 | 5 | 7 | (1 | ) | 11 | |||||||||||||||||||||||||||||||||||
|
|
|
|
|
|
|
|
|
|
|
|
|
|
|
|
|
|
|
|
|
|
|
| |||||||||||||||||||||||||
Net defined benefit pension expense | 39 | 22 | 2 | 63 | 35 | (13 | ) | 11 | 33 | 31 | 16 | 7 | 54 | |||||||||||||||||||||||||||||||||||
|
|
|
|
|
|
|
|
|
|
|
|
|
|
|
|
|
|
|
|
|
|
|
| |||||||||||||||||||||||||
Net interest on defined benefit pension scheme liabilities is presented within net finance costs in the income statement. Service cost, including settlements and past service credits is presented within operating expenses.
Settlements and past service credits in 2014 relate to plan design changes and a reduction in accrued benefits in respect of the scheme in the Netherlands. Settlements and past service credits recognised in 2013 and 2012 principally relate to plan design changes and the transfer out of certain deferred members in the US scheme and a reduction in accrued benefits in respect of the scheme in the Netherlands.
The significant valuation assumptions, determined for each major scheme in conjunction with the respective independent actuaries are presented below. The net defined benefit pension expense for each year is based on the assumptions and scheme valuations set at December 31, of the prior year.
| 2014 | 2013 | 2012 | ||||||||||||||||||||||||||||||||||
As at December 31, | UK | US | NL | UK | US | NL | UK | US | NL | |||||||||||||||||||||||||||
Discount rate | 3.75 | % | 4.25 | % | 2.30 | % | 4.60 | % | 5.05 | % | 3.60 | % | 4.65 | % | 4.25 | % | 3.50 | % | ||||||||||||||||||
Inflation | 2.90 | % | 2.50 | % | 2.00 | % | 3.25 | % | 3.00 | % | 2.00 | % | 2.85 | % | 3.00 | % | 2.00 | % | ||||||||||||||||||
Discount rates are set by reference to high quality corporate bond yields.
Mortality assumptions make allowance for future improvements in longevity and have been determined by reference to applicable mortality statistics. The average life expectancy assumptions are set out below:
| 2014 | 2013 | 2012 | ||||||||||||||||||||||||||||||||||
Male average life expectancy (as | UK | US | NL | UK | US | NL | UK | US | NL | |||||||||||||||||||||||||||
Member currently aged 60 | 90 | 87 | 86 | 90 | 84 | 86 | 90 | 84 | 86 | |||||||||||||||||||||||||||
Member currently aged 45 | 92 | 87 | 87 | 92 | 83 | 87 | 92 | 83 | 87 | |||||||||||||||||||||||||||
| 2014 | 2013 | 2012 | ||||||||||||||||||||||||||||||||||
Female average life expectancy (as | UK | US | NL | UK | US | NL | UK | US | NL | |||||||||||||||||||||||||||
Member currently aged 60 | 89 | 89 | 89 | 89 | 86 | 89 | 89 | 86 | 89 | |||||||||||||||||||||||||||
Member currently aged 45 | 91 | 90 | 90 | 91 | 85 | 89 | 91 | 85 | 89 | |||||||||||||||||||||||||||
The amount recognised in the statement of financial position in respect of defined benefit pension schemes at the start and end of the year and the movements during the year were as follows:
| 2014 | 2013 | 2012 | ||||||||||||||||||||||||||||||||||||||||||||||
| UK £m | US £m | NL £m | Total £m | UK £m | US £m | NL £m | Total £m | UK £m | US £m | NL £m | Total £m | |||||||||||||||||||||||||||||||||||||
Defined benefit obligation | ||||||||||||||||||||||||||||||||||||||||||||||||
At start of year | (2,882 | ) | (762 | ) | (716 | ) | (4,360 | ) | (2,654 | ) | (922 | ) | (696 | ) | (4,272 | ) | (2,479 | ) | (858 | ) | (539 | ) | (3,876 | ) | ||||||||||||||||||||||||
Service cost | (31 | ) | (18 | ) | (14 | ) | (63 | ) | (29 | ) | (29 | ) | (15 | ) | (73 | ) | (27 | ) | (28 | ) | (8 | ) | (63 | ) | ||||||||||||||||||||||||
Settlements and past service credits | — | — | 15 | 15 | — | 51 | 8 | 59 | 1 | 19 | — | 20 | ||||||||||||||||||||||||||||||||||||
Interest on pension scheme liabilities | (130 | ) | (39 | ) | (25 | ) | (194 | ) | (122 | ) | (41 | ) | (25 | ) | (188 | ) | (124 | ) | (44 | ) | (30 | ) | (198 | ) | ||||||||||||||||||||||||
Actuarial (loss)/gain on financial assumptions | (339 | ) | (107 | ) | (120 | ) | (566 | ) | (173 | ) | 86 | 18 | (69 | ) | (92 | ) | (145 | ) | (145 | ) | (382 | ) | ||||||||||||||||||||||||||
Actuarial gain/(loss) arising from experience assumptions | 26 | (3 | ) | 5 | 28 | 8 | (10 | ) | (3 | ) | (5 | ) | (15 | ) | (18 | ) | 1 | (32 | ) | |||||||||||||||||||||||||||||
Contributions by employees | (7 | ) | — | (5 | ) | (12 | ) | (6 | ) | — | (5 | ) | (11 | ) | (7 | ) | — | (4 | ) | (11 | ) | |||||||||||||||||||||||||||
Benefits paid* | 96 | 52 | 27 | 175 | 94 | 93 | 19 | 206 | 89 | 112 | 15 | 216 | ||||||||||||||||||||||||||||||||||||
Exchange translation differences | — | (55 | ) | 55 | — | — | 10 | (17 | ) | (7 | ) | — | 40 | 14 | 54 | |||||||||||||||||||||||||||||||||
|
|
|
|
|
|
|
|
|
|
|
|
|
|
|
|
|
|
|
|
|
|
|
| |||||||||||||||||||||||||
At end of year | (3,267 | ) | (932 | ) | (778 | ) | (4,977 | ) | (2,882 | ) | (762 | ) | (716 | ) | (4,360 | ) | (2,654 | ) | (922 | ) | (696 | ) | (4,272 | )�� | ||||||||||||||||||||||||
|
|
|
|
|
|
|
|
|
|
|
|
|
|
|
|
|
|
|
|
|
|
|
| |||||||||||||||||||||||||
| 2014 | 2013 | 2012 | ||||||||||||||||||||||||||||||||||||||||||||||
| UK £m | US £m | NL £m | Total £m | UK £m | US £m | NL £m | Total £m | UK £m | US £m | NL £m | Total £m | |||||||||||||||||||||||||||||||||||||
Fair value of scheme assets | ||||||||||||||||||||||||||||||||||||||||||||||||
At start of year | 2,691 | 676 | 614 | 3,981 | 2,516 | 710 | 580 | 3,806 | 2,371 | 726 | 537 | 3,634 | ||||||||||||||||||||||||||||||||||||
Interest income on plan assets | 122 | 35 | 22 | 179 | 116 | 32 | 21 | 169 | 119 | 37 | 31 | 187 | ||||||||||||||||||||||||||||||||||||
Return on assets excluding amounts included in interest income | 110 | 72 | 90 | 272 | 111 | 4 | (1 | ) | 114 | 45 | 53 | 23 | 121 | |||||||||||||||||||||||||||||||||||
Contributions by employer | 36 | 31 | 9 | 76 | 36 | 33 | 14 | 83 | 63 | 38 | 15 | 116 | ||||||||||||||||||||||||||||||||||||
Contributions by employees | 7 | — | 5 | 12 | 6 | — | 5 | 11 | 7 | — | 4 | 11 | ||||||||||||||||||||||||||||||||||||
Benefits paid* | (96 | ) | (52 | ) | (27 | ) | (175 | ) | (94 | ) | (93 | ) | (19 | ) | (206 | ) | (89 | ) | (112 | ) | (15 | ) | (216 | ) | ||||||||||||||||||||||||
Exchange translation differences | — | 48 | (48 | ) | — | — | (10 | ) | 14 | 4 | — | (32 | ) | (15 | ) | (47 | ) | |||||||||||||||||||||||||||||||
|
|
|
|
|
|
|
|
|
|
|
|
|
|
|
|
|
|
|
|
|
|
|
| |||||||||||||||||||||||||
At end of year | 2,870 | 810 | 665 | 4,345 | 2,691 | 676 | 614 | 3,981 | 2,516 | 710 | 580 | 3,806 | ||||||||||||||||||||||||||||||||||||
|
|
|
|
|
|
|
|
|
|
|
|
|
|
|
|
|
|
|
|
|
|
|
| |||||||||||||||||||||||||
Net defined benefit obligation | (397 | ) | (122 | ) | (113 | ) | (632 | ) | (191 | ) | (86 | ) | (102 | ) | (379 | ) | (138 | ) | (212 | ) | (116 | ) | (466 | ) | ||||||||||||||||||||||||
|
|
|
|
|
|
|
|
|
|
|
|
|
|
|
|
|
|
|
|
|
|
|
| |||||||||||||||||||||||||
As at December 31, 2014 the defined benefit obligations comprise £4,784 million (2013: £4,200 million; 2012: £4,112 million) in relation to funded schemes and £193 million (2013: £160 million; 2012: £160 million) in relation to unfunded schemes.
The weighted average duration of defined benefit scheme liabilities is 19 years in the UK (2013: 19 years; 2012: 19 years), 15 years in the US (2013: 16 years; 2012: 16 years) and 24 years in the Netherlands (2013: 21 years; 2012: 21 years). Deferred tax assets of £161 million (2013: £104 million; 2012: £153 million) are recognised in respect of the pension scheme deficits.
Amounts recognised in the statement of comprehensive income are set out below:
| 2014 £m | 2013 £m | 2012 £m | ||||||||||
Gains and losses arising during the year | ||||||||||||
Experience losses on scheme liabilities | 28 | (5 | ) | (32 | ) | |||||||
Experience gains on scheme assets | 272 | 114 | 121 | |||||||||
Actuarial (losses)/gains arising on the present value of scheme liabilities due to changes in: | ||||||||||||
— discount rates | (773 | ) | 78 | (552 | ) | |||||||
— inflation | 159 | (171 | ) | 74 | ||||||||
— other actuarial assumptions | 48 | 24 | 96 | |||||||||
|
|
|
|
|
| |||||||
| (266 | ) | 40 | (293 | ) | ||||||||
Net cumulative losses at start of year | (475 | ) | (515 | ) | (222 | ) | ||||||
|
|
|
|
|
| |||||||
Net cumulative losses at end of year | (741 | ) | (475 | ) | (515 | ) | ||||||
|
|
|
|
|
| |||||||
The major categories and fair values of scheme assets at the end of the reporting period are as follows:
| 2014 | 2013 | 2012 | ||||||||||||||||||||||||||||||||||||||||||||||
| UK £m | US £m | NL £m | Total £m | UK £m | US £m | NL £m | Total £m | UK £m | US £m | NL £m | Total £m | |||||||||||||||||||||||||||||||||||||
Equities | 1,260 | 263 | 226 | 1,749 | 1,351 | 174 | 223 | 1,748 | 1,207 | 409 | 167 | 1,783 | ||||||||||||||||||||||||||||||||||||
Government bonds | 1,249 | 70 | 261 | 1,580 | 1,089 | 68 | 261 | 1,418 | 1,088 | 164 | 71 | 1,323 | ||||||||||||||||||||||||||||||||||||
Corporate bonds | — | 455 | 143 | 598 | — | 411 | 93 | 504 | — | 88 | 304 | 392 | ||||||||||||||||||||||||||||||||||||
Property funds | 270 | — | 30 | 300 | 147 | — | 34 | 181 | 85 | 29 | 35 | 149 | ||||||||||||||||||||||||||||||||||||
Cash | 74 | 2 | 5 | 81 | 87 | 4 | 3 | 94 | 106 | 1 | 3 | 110 | ||||||||||||||||||||||||||||||||||||
Other | 17 | 20 | — | 37 | 17 | 19 | — | 36 | 30 | 19 | — | 49 | ||||||||||||||||||||||||||||||||||||
|
|
|
|
|
|
|
|
|
|
|
|
|
|
|
|
|
|
|
|
|
|
|
| |||||||||||||||||||||||||
Total | 2,870 | 810 | 665 | 4,345 | 2,691 | 676 | 614 | 3,981 | 2,516 | 710 | 580 | 3,806 | ||||||||||||||||||||||||||||||||||||
|
|
|
|
|
|
|
|
|
|
|
|
|
|
|
|
|
|
|
|
|
|
|
| |||||||||||||||||||||||||
The actual return on scheme assets for the year ended December 31, 2014 was £451 million (2013: £283 million; 2012: £308 million).
Assets and obligations associated with the schemes are sensitive to changes in the market values of assets and the market related assumptions used to value scheme liabilities. In particular, adverse changes to asset values, discount rates or inflation could increase future pension costs and funding requirements.
Typically the Group’s schemes are exposed to: investment risks, whereby actual rates of return on plan assets may be below those rates used to determine the defined benefit obligations and interest rate risks, whereby scheme deficits may increase if bond yields in the UK, US and the Netherlands decline and are not offset by returns in government and corporate bond portfolios. The schemes are also exposed to other risks such as unanticipated future increases in: member mortality patterns; inflation; and future salaries, all potentially leading to an increase in scheme liabilities (particularly in the Netherlands which is the only major scheme which remains open to new members).
Investment policies of each scheme are intended to ensure continuous payment of defined benefit pensions in the short term and long term. Efforts are made to limit risks on marketable securities by adopting investment policies that diversify assets across geographies and among equities, government and corporate bonds, property funds and cash. Asset allocations are dependent on a variety of factors including the duration of scheme liabilities and the statutory funded status of the plan.
All equities and government and corporate bonds have quoted prices in active markets.
Sensitivity analysis
The valuation of the Group’s pension scheme liabilities involves significant actuarial assumptions, being the life expectancy of the members, inflation and the rate at which the future pension payments are discounted. Differences arising from actual experience or future changes in assumptions may materially affect future pension charges. In particular, changes in assumptions for discount rates, inflation and life expectancies that are reasonably possible would have the following approximate effects on the defined benefit pension obligations:
| ||||
| ||||
| ||||
The above analysis has been calculated on the same basis used to determine the defined benefit obligation recognised in the statement of financial position. There has been no change in the methods used to prepare the analysis compared with prior years. This sensitivity analysis may not be representative of the actual change in the defined benefit obligation as it is unlikely that the change in the above assumptions would occur in isolation of one another as some of the assumptions may be correlated.
The Group provides a number of share based remuneration schemes to Directors and employees. The principal share based remuneration schemes are the Executive Share Option Schemes (ESOS), the Long Term Incentive Plan (LTIP), the Reed Elsevier Growth Plan (REGP) (discontinued after 2014), the Retention Share Plan (RSP) and the Bonus Investment Plan (BIP). Share options granted under ESOS and LTIP are exercisable after three years and up to ten years from the date of grant at a price equivalent to the market value of the respective shares at the date of grant. Conditional shares granted under ESOS, LTIP, RSP and BIP are exercisable after three years for nil consideration if conditions are met. Conditional shares granted under REGP are exercisable for nil consideration if conditions are met after three and five years. Other awards principally relate to all employee share based saving schemes in the UK and the Netherlands.
Share based remuneration awards are, other than upon retirement or in exceptional circumstances, subject to the condition that the employee remains in employment at the time of exercise.
Conditional shares granted under LTIP, REGP, RSP and BIP between 2011 and 2014 are subject to the achievement of growth targets of Reed Elsevier PLC and Reed Elsevier NV adjusted earnings per share measured at constant exchange rates as well as the achievement of a targeted percentage return on invested capital of Reed Elsevier PLC and Reed Elsevier NV. LTIP grants between 2011 and 2014 and REGP grants in 2013 are also variable subject to the achievement of a total shareholder return performance target.
The weighted average fair value per award is based on full vesting on achievement of non market related performance conditions and stochastic models for market related components. The conditional shares and option awards are recognised in the income statement over the vesting period, being between three and five years, on the basis of expected performance against the non market related conditions, with the fair value related to market related components unchanging.
2014 grants
| In respect of Reed Elsevier PLC ordinary shares | In respect of Reed Elsevier NV ordinary shares | |||||||||||||||
| Number of shares ’000 | Weighted average fair value per award £ | Number of shares ’000 | Weighted average fair value per award £ | |||||||||||||
Share options | ||||||||||||||||
ESOS | 1,221 | 0.98 | 863 | 1.13 | ||||||||||||
Other | 1,064 | 1.31 | 314 | 0.90 | ||||||||||||
|
|
|
|
|
|
|
| |||||||||
Total share options | 2,285 | 1.13 | 1,177 | 1.07 | ||||||||||||
|
|
|
|
|
|
|
| |||||||||
Conditional shares | ||||||||||||||||
ESOS | 365 | 8.27 | 258 | 11.24 | ||||||||||||
LTIP | 1,031 | 7.81 | 729 | 10.85 | ||||||||||||
RSP | 131 | 9.90 | 94 | 14.18 | ||||||||||||
BIP | 769 | 9.23 | 483 | 12.88 | ||||||||||||
|
|
|
|
|
|
|
| |||||||||
Total conditional shares | 2,296 | 8.48 | 1,564 | 11.74 | ||||||||||||
|
|
|
|
|
|
|
| |||||||||
2013 grants
| In respect of Reed Elsevier PLC ordinary shares | In respect of Reed Elsevier NV ordinary shares | |||||||||||||||
| Number of shares ’000 | Weighted average fair value per award £ | Number of shares ’000 | Weighted average fair value per award £ | |||||||||||||
Share options | ||||||||||||||||
ESOS | 1,521 | 1.12 | 1,058 | 1.52 | ||||||||||||
Other | 645 | 1.29 | 257 | 1.10 | ||||||||||||
|
|
|
|
|
|
|
| |||||||||
Total share options | 2,166 | 1.17 | 1,315 | 1.44 | ||||||||||||
|
|
|
|
|
|
|
| |||||||||
Conditional shares | ||||||||||||||||
ESOS | 524 | 6.51 | 365 | 9.28 | ||||||||||||
LTIP | 1,338 | 6.14 | 930 | 8.90 | ||||||||||||
REGP | 322 | 6.49 | 450 | 9.34 | ||||||||||||
RSP | 10 | 7.35 | 7 | �� | 10.65 | |||||||||||
BIP | 987 | 7.40 | 615 | 10.69 | ||||||||||||
|
|
|
|
|
|
|
| |||||||||
Total conditional shares | 3,181 | 6.63 | 2,367 | 9.51 | ||||||||||||
|
|
|
|
|
|
|
| |||||||||
2012 grants
| In respect of Reed Elsevier PLC ordinary shares | In respect of Reed Elsevier NV ordinary shares | |||||||||||||||
| Number of shares ’000 | Weighted average fair value per award £ | Number of shares ’000 | Weighted average fair value per award £ | |||||||||||||
Share options | ||||||||||||||||
ESOS | 1,801 | 0.90 | 1,263 | 1.20 | ||||||||||||
Other | 702 | 1.04 | 293 | 0.95 | ||||||||||||
|
|
|
|
|
|
|
| |||||||||
Total share options | 2,503 | 0.94 | 1,556 | 1.15 | ||||||||||||
|
|
|
|
|
|
|
| |||||||||
Conditional shares | ||||||||||||||||
ESOS | 797 | 4.60 | 560 | 6.41 | ||||||||||||
LTIP | 1,807 | 4.45 | 1,144 | 6.13 | ||||||||||||
RSP | 256 | 6.00 | 5 | 7.82 | ||||||||||||
BIP | 1,542 | 5.20 | 696 | 7.41 | ||||||||||||
|
|
|
|
|
|
|
| |||||||||
Total conditional shares | 4,402 | 4.83 | 2,405 | 6.57 | ||||||||||||
|
|
|
|
|
|
|
| |||||||||
The main assumptions used to determine the fair values are set out below:
Assumptions for grants made during the year
| In respect of Reed Elsevier PLC ordinary shares | In respect of Reed Elsevier NV ordinary shares | |||||||||||||||||||||||
| 2014 | 2013 | 2012 | 2014 | 2013 | 2012 | |||||||||||||||||||
Weighted average share price at date of grant | ||||||||||||||||||||||||
ESOS | £ | 9.28 | £ | 7.35 | £ | 5.19 | € | 15.92 | € | 12.53 | € | 9.07 | ||||||||||||
LTIP | £ | 9.29 | £ | 7.35 | £ | 5.25 | € | 15.94 | € | 12.54 | € | 8.91 | ||||||||||||
REGP | — | £ | 7.76 | — | — | € | 13.15 | — | ||||||||||||||||
RSP | £ | 9.90 | £ | 7.35 | £ | 6.00 | € | 17.50 | € | 12.53 | € | 9.65 | ||||||||||||
BIP | £ | 9.23 | £ | 7.39 | £ | 5.20 | € | 15.90 | € | 12.53 | € | 9.15 | ||||||||||||
Other | £ | 8.86 | £ | 7.45 | £ | 5.49 | € | 15.63 | € | 11.89 | € | 9.63 | ||||||||||||
Expected share price volatility | 19 | % | 28 | % | 30 | % | 19 | % | 28 | % | 30 | % | ||||||||||||
Expected option life | 4 years | 4 years | 4 years | 4 years | 4 years | 4 years | ||||||||||||||||||
Expected dividend yield | 3.8 | % | 4.1 | % | 3.9 | % | 4.5 | % | 4.7 | % | 4.5 | % | ||||||||||||
Risk free interest rate | 1.5 | % | 0.5 | % | 0.8 | % | 0.6 | % | 0.4 | % | 0.9 | % | ||||||||||||
Expected lapse rate | 2-5 | % | 2-5 | % | 2-5 | % | 2-4 | % | 2-4 | % | 2-4 | % | ||||||||||||
Expected share price volatility has been estimated based on relevant historic data in respect of the Reed Elsevier PLC and Reed Elsevier NV ordinary share prices. Expected share option life has been estimated based on historical exercise patterns in respect of Reed Elsevier PLC and Reed Elsevier NV share options.
The share based remuneration awards outstanding as at December 31, 2014 in respect of both Reed Elsevier PLC and Reed Elsevier NV ordinary shares are set out below:
| In respect of Reed Elsevier PLC ordinary shares | In respect of Reed Elsevier NV ordinary shares | |||||||||||||||
| Number of shares under option ’000 | Weighted average exercise price (pence) | Number of shares under option ’000 | Weighted average exercise price (€) | |||||||||||||
Share options | ||||||||||||||||
Outstanding at January 1, 2012 | 29,540 | 534 | 21,641 | 10.99 | ||||||||||||
Granted | 2,503 | 497 | 1,556 | 9.19 | ||||||||||||
Exercised | (6,694 | ) | 497 | (1,913 | ) | 9.36 | ||||||||||
Forfeited | (1,022 | ) | 498 | (581 | ) | 9.33 | ||||||||||
Expired | (4,992 | ) | 592 | (5,121 | ) | 12.34 | ||||||||||
|
|
|
|
|
|
|
| |||||||||
Outstanding at January 1, 2013 | 19,335 | 529 | 15,582 | 10.63 | ||||||||||||
Granted | 2,166 | 694 | 1,315 | 12.41 | ||||||||||||
Exercised | (9,102 | ) | 542 | (7,628 | ) | 10.72 | ||||||||||
Forfeited | (112 | ) | 535 | (167 | ) | 11.30 | ||||||||||
Expired | (560 | ) | 537 | (462 | ) | 11.30 | ||||||||||
|
|
|
|
|
|
|
| |||||||||
Outstanding at January 1, 2014 | 11,727 | 549 | 8,640 | 10.77 | ||||||||||||
Granted | 2,285 | 827 | 1,177 | 15.86 | ||||||||||||
Exercised | (3,318 | ) | 520 | (2,740 | ) | 11.13 | ||||||||||
Forfeited | (832 | ) | 514 | (348 | ) | 10.28 | ||||||||||
Expired | (535 | ) | 577 | (573 | ) | 10.28 | ||||||||||
|
|
|
|
|
|
|
| |||||||||
Outstanding at December 31, 2014 | 9,327 | 629 | 6,156 | 11.66 | ||||||||||||
|
|
|
|
|
|
|
| |||||||||
Exercisable at December 31, 2012 | 12,573 | 553 | 12,329 | 11.12 | ||||||||||||
Exercisable at December 31, 2013 | 5,150 | 537 | 5,535 | 11.09 | ||||||||||||
Exercisable at December 31, 2014 | 3,163 | 550 | 3,480 | 11.11 | ||||||||||||
|
|
|
|
|
|
|
| |||||||||
| Number of Reed Elsevier PLC ordinary shares ’000 | Number of Reed Elsevier NV ordinary shares ’000 | |||||||
Conditional shares | ||||||||
Outstanding at January 1, 2012 | 13,896 | 8,267 | ||||||
Granted | 4,402 | 2,405 | ||||||
Vested | (601 | ) | (391 | ) | ||||
Forfeited/lapsed | (5,885 | ) | (3,575 | ) | ||||
|
|
|
| |||||
Outstanding at January 1, 2013 | 11,812 | 6,706 | ||||||
Granted | 3,181 | 2,367 | ||||||
Vested | (3,256 | ) | (1,966 | ) | ||||
Forfeited/lapsed | (1,395 | ) | (923 | ) | ||||
|
|
|
| |||||
Outstanding at January 1, 2014 | 10,342 | 6,184 | ||||||
Granted | 2,296 | 1,564 | ||||||
Vested | (2,772 | ) | (1,591 | ) | ||||
Forfeited/lapsed | (1,236 | ) | (622 | ) | ||||
|
|
|
| |||||
Outstanding at December 31, 2014 | 8,630 | 5,535 | ||||||
|
|
|
| |||||
The weighted average share price at the date of exercise of share options and vesting of conditional shares during 2014 was 885p (2013: 761p; 2012: 593p) for Reed Elsevier PLC ordinary shares and €15.03 (2013: €13.15; 2012: €10.43) for Reed Elsevier NV ordinary shares.
Range of exercise prices for outstanding share options
| 2014 | 2013 | 2012 | ||||||||||||||||||||||
| Number of shares under option ’000 | Weighted average remaining period until expiry (years) | Number of shares under option ’000 | Weighted average remaining period until expiry (years) | Number of shares under option ’000 | Weighted average remaining period until expiry (years) | |||||||||||||||||||
Reed Elsevier PLC ordinary shares (pence) | ||||||||||||||||||||||||
401-450 | 834 | 1.6 | 1,772 | 1.9 | 1,925 | 2.8 | ||||||||||||||||||
451-500 | 451 | 5.4 | 1,161 | 4.2 | 4,415 | 3.5 | ||||||||||||||||||
501-550 | 3,184 | 5.5 | 5,284 | 5.6 | 8,981 | 5.7 | ||||||||||||||||||
551-600 | 576 | 2.8 | 695 | 3.9 | 189 | 5.4 | ||||||||||||||||||
601-650 | 788 | 2.8 | 1,338 | 4.0 | 3,825 | 4.8 | ||||||||||||||||||
651-700 | — | — | — | — | — | — | ||||||||||||||||||
701-750 | 2,301 | 6.3 | 1,462 | 9.4 | — | — | ||||||||||||||||||
801-850 | 10 | 8.6 | 10 | �� | 9.6 | — | — | |||||||||||||||||
851-900 | 2 | 8.9 | 2 | 9.9 | — | — | ||||||||||||||||||
901-950 | 1,088 | 9.3 | 3 | 9.0 | — | — | ||||||||||||||||||
951-1000 | 93 | 9.7 | — | — | — | — | ||||||||||||||||||
|
|
|
|
|
|
|
|
|
|
|
| |||||||||||||
Total | 9,327 | 5.4 | 11,727 | 5.1 | 19,335 | 4.7 | ||||||||||||||||||
|
|
|
|
|
|
|
|
|
|
|
| |||||||||||||
Reed Elsevier NV ordinary shares (euro) | ||||||||||||||||||||||||
7.01-8.00 | 24 | 4.0 | 41 | 5.0 | 58 | 6.1 | ||||||||||||||||||
8.01-9.00 | 1,024 | 5.7 | 1,834 | 6.8 | 2,736 | 7.7 | ||||||||||||||||||
9.01-10.00 | 1,459 | 6.4 | 1,813 | 7.2 | 3,142 | 6.9 | ||||||||||||||||||
10.01-11.00 | 60 | 2.8 | 619 | 1.4 | 2,697 | 1.6 | ||||||||||||||||||
11.01-12.00 | 587 | 1.6 | 1,670 | 2.3 | 3,982 | 2.6 | ||||||||||||||||||
12.01-13.00 | 1,424 | 6.5 | 1,864 | 7.1 | 1,806 | 5.1 | ||||||||||||||||||
13.01-14.00 | 87 | 3.7 | 134 | 4.7 | 118 | 4.1 | ||||||||||||||||||
14.01-15.00 | 406 | 3.0 | 663 | 3.1 | 1,043 | 4.1 | ||||||||||||||||||
15.01-16.00 | 976 | 9.2 | 2 | 9.9 | — | — | ||||||||||||||||||
16.01-17.00 | 15 | 9.0 | — | — | — | — | ||||||||||||||||||
17.01-18.00 | 94 | 9.5 | — | — | — | — | ||||||||||||||||||
|
|
|
|
|
|
|
|
|
|
|
| |||||||||||||
Total | 6,156 | 6.0 | 8,640 | 5.4 | 15,582 | 4.6 | ||||||||||||||||||
|
|
|
|
|
|
|
|
|
|
|
| |||||||||||||
Share options are expected, upon exercise, to be met principally by the issue of new ordinary shares but may also be met from shares held by the Employee Benefit Trust (“EBT”) (see note 27). Conditional shares will be met from shares held by the EBT.
| 2014 £m | 2013 £m | 2012 £m | ||||||||||
Interest on short term bank loans, overdrafts and commercial paper | (13 | ) | (11 | ) | (27 | ) | ||||||
Interest on term debt | (134 | ) | (168 | ) | (196 | ) | ||||||
Interest on obligations under finance leases | — | (1 | ) | (1 | ) | |||||||
|
|
|
|
|
| |||||||
Total borrowing costs | (147 | ) | (180 | ) | (224 | ) | ||||||
Losses on loans and derivatives not designated as hedges | (7 | ) | (7 | ) | (8 | ) | ||||||
Net financing charge on defined benefit pension schemes | (15 | ) | (19 | ) | (11 | ) | ||||||
|
|
|
|
|
| |||||||
Finance costs | (169 | ) | (206 | ) | (243 | ) | ||||||
|
|
|
|
|
| |||||||
Interest on bank deposits | 7 | 4 | 7 | |||||||||
Gains on loans and derivatives not designated as hedges | — | 6 | 9 | |||||||||
|
|
|
|
|
| |||||||
Finance income | 7 | 10 | 16 | |||||||||
|
|
|
|
|
| |||||||
Net finance costs | (162 | ) | (196 | ) | (227 | ) | ||||||
|
|
|
|
|
| |||||||
A net loss of £52 million (2013: £1 million gain; 2012: £2 million loss) on interest rate derivatives designated as cash flow hedges was recognised directly in equity. This included losses of £54 million (2013: nil; 2012: nil) related to foreign exchange movements on debt hedges, which were reclassified immediately to the income statement and offset £54 million (2013: nil; 2012: nil) of foreign exchange gains on the related debt. The remaining gain of £2 million (2013: £1 million gain; 2012:£2 million loss) recognised in equity may be reclassified to the income statement in future periods. Including the £54 million (2013: nil; 2012: nil) of foreign exchange losses, losses of £56 million (2013: £3 million; 2012:£16 million) in total were transferred from the hedge reserve in the period.
| 2014 £m | 2013 £m | 2012 £m | ||||||||||
Revaluation of held for trading investments | 8 | 5 | 19 | |||||||||
Property provisions on disposed businesses | — | — | (60 | ) | ||||||||
(Loss)/gain on disposal of businesses and assets held for sale | (19 | ) | 11 | 86 | ||||||||
|
|
|
|
|
| |||||||
Net (loss)/gain on disposals and other non operating items | (11 | ) | 16 | 45 | ||||||||
|
|
|
|
|
| |||||||
| 2014 £m | 2013 £m | 2012 £m | ||||||||||
Current tax | ||||||||||||
United Kingdom | (36 | ) | (50 | ) | (73 | ) | ||||||
The Netherlands | (93 | ) | (80 | ) | (68 | ) | ||||||
Rest of world | (228 | ) | (222 | ) | (12 | ) | ||||||
|
|
|
|
|
| |||||||
Total current tax charge | (357 | ) | (352 | ) | (153 | ) | ||||||
Deferred tax | 88 | 271 | 51 | |||||||||
|
|
|
|
|
| |||||||
Tax expense | (269 | ) | (81 | ) | (102 | ) | ||||||
|
|
|
|
|
| |||||||
The decrease in the UK current tax charge over the period reflects the reductions in the UK statutory rate of tax, and the settlement of prior year tax matters.
The net tax expense charged on profit before tax differs from the theoretical amount that would arise using the weighted average of tax rates applicable to accounting profits and losses of the consolidated entities, as follows:
| 2014 £m | 2013 £m | 2012 £m | ||||||||||
Profit before tax | 1,229 | 1,196 | 1,151 | |||||||||
|
|
|
|
|
| |||||||
Tax at average applicable rates | (292 | ) | (280 | ) | (244 | ) | ||||||
Tax on share of results of joint ventures | 21 | 10 | 7 | |||||||||
Expenses not deductible for tax purposes and US state taxes | (26 | ) | (38 | ) | (30 | ) | ||||||
Non-taxable costs of share based remuneration | — | 3 | 3 | |||||||||
(Non-deductible)/non-taxable disposal related gains and losses | (22 | ) | (22 | ) | 69 | |||||||
Tax losses of the period not recognised | (4 | ) | (4 | ) | (6 | ) | ||||||
Recognition and utilization of tax losses that arose in prior years | 4 | 9 | 6 | |||||||||
Exceptional prior year tax credit | — | — | 96 | |||||||||
Deferred tax credit on the alignment of business assets | — | 221 | — | |||||||||
Other adjustments in respect of prior periods | 50 | 24 | (2 | ) | ||||||||
Deferred tax effect of changes in tax rates | — | (4 | ) | (1 | ) | |||||||
|
|
|
|
|
| |||||||
Tax expense | (269 | ) | (81 | ) | (102 | ) | ||||||
|
|
|
|
|
| |||||||
Tax expense as a percentage of profit before tax | 22 | % | 7 | % | 9 | % | ||||||
|
|
|
|
|
| |||||||
The weighted average applicable tax rate for the year was 23.7% (2013: 23.4%, 2012: 21.2%). This increase is caused by a change in the relative profitability of entities in the countries in which they operate, partially offset by the impact of the reduction in the tax rate of the United Kingdom (see below).
During 2013, the Group aligned certain business assets with their global management structure. As a result of this alignment the tax deductible value of these assets was updated to market value. This results in a deferred tax credit of £221 million which was excluded from adjusted earnings along with other deferred tax assets from intangible assets.
During 2012, the Group resolved a number of significant prior year tax matters and reassessed its exposure to other tax matters across the jurisdictions in which the Group operates. As a result of this reassessment, current tax liabilities were reduced by £96 million to reflect the lower cash tax expected to be payable.
The following tax has been recognised directly in other comprehensive income or equity during the year:
| 2014 £m | 2013 £m | 2012 £m | ||||||||||
Tax on items that will not be reclassified to profit or loss | ||||||||||||
Tax on actuarial movements on defined benefit pension schemes | 63 | (24 | ) | 91 | ||||||||
Tax credit on other items | — | — | 5 | |||||||||
|
|
|
|
|
| |||||||
| 63 | (24 | ) | 96 | |||||||||
|
|
|
|
|
| |||||||
Tax on items that may be reclassified to profit or loss | ||||||||||||
Tax on fair value movements on cash flow hedges | 13 | (14 | ) | (24 | ) | |||||||
|
|
|
|
|
| |||||||
| 13 | (14 | ) | (24 | ) | ||||||||
|
|
|
|
|
| |||||||
Net tax credit/(debit) recognised in other comprehensive income | 76 | (38 | ) | 72 | ||||||||
|
|
|
|
|
| |||||||
Tax credit on share based remuneration recognised directly in equity | 20 | 20 | — | |||||||||
|
|
|
|
|
| |||||||
A number of changes to the UK corporation tax system, including reductions of the main rate of corporation tax from 23% to 21% with effect from April 1, 2014, and from 21% to 20% with effect from April 1, 2015, were substantively enacted on July 2, 2013. The Group has measured its UK deferred tax assets and liabilities at the end of the reporting period at 20% (2013: 20%; 2012: 23%).
Reconciliation of profit before tax to cash generated from operations
| 2014 £m | 2013 £m | 2012 £m | ||||||||||
Profit before tax | 1,229 | 1,196 | 1,151 | |||||||||
Disposals and other non operating items | 11 | (16 | ) | (45 | ) | |||||||
Net finance costs | 162 | 196 | 227 | |||||||||
Share of results of joint ventures | (36 | ) | (29 | ) | (24 | ) | ||||||
|
|
|
|
|
| |||||||
Operating profit before joint ventures | 1,366 | 1,347 | 1,309 | |||||||||
|
|
|
|
|
| |||||||
Amortisation of acquired intangible assets | 282 | 317 | 328 | |||||||||
Amortisation of internally developed intangible assets | 158 | 160 | 151 | |||||||||
Depreciation of property, plant and equipment | 79 | 89 | 76 | |||||||||
Share based remuneration | 32 | 31 | 31 | |||||||||
|
|
|
|
|
| |||||||
Total non cash items | 551 | 597 | 586 | |||||||||
|
|
|
|
|
| |||||||
Decrease in inventories and pre-publication costs | 3 | 10 | 21 | |||||||||
(Increase)/decrease in receivables | (66 | ) | 5 | 4 | ||||||||
Decrease in payables | (3 | ) | (16 | ) | (73 | ) | ||||||
|
|
|
|
|
| |||||||
Increase in working capital | (66 | ) | (1 | ) | (48 | ) | ||||||
|
|
|
|
|
| |||||||
Cash generated from operations | 1,851 | 1,943 | 1,847 | |||||||||
|
|
|
|
|
| |||||||
Cash flow on acquisitions
| Note | 2014 £m | 2013 £m | 2012 £m | |||||||||||||
Purchase of businesses | 12 | (347 | ) | (194 | ) | (276 | ) | |||||||||
Investment in joint ventures | (15 | ) | (6 | ) | (10 | ) | ||||||||||
Deferred payments relating to prior year acquisitions | (34 | ) | (21 | ) | (30 | ) | ||||||||||
|
|
|
|
|
| |||||||||||
Total | (396 | ) | (221 | ) | (316 | ) | ||||||||||
|
|
|
|
|
| |||||||||||
Acquisitions in 2014
During the year a number of acquisitions were made for a total consideration of £356 million, after taking account of net cash acquired of £9 million. The net assets of the businesses acquired are incorporated at their fair value to the combined businesses. Provisional fair values of the consideration given and of the assets and liabilities acquired are summarised below:
| ||||
| ||||
| ||||
| ||||
| ||||
| ||||
| ||||
| ||||
| ||||
| ||||
| ||||
| ||||
Goodwill, being the excess of the consideration over the net tangible and intangible assets acquired, represents benefits which do not qualify for recognition as intangible assets, including the ability of the business to generate higher returns than individual assets, skilled workforces, and acquisition synergies that are specific to the Group. In addition, goodwill arises on the recognition of deferred tax liabilities in respect of intangible assets, for which amortisation does not qualify for tax deductions.
The fair value of the assets and liabilities acquired are provisional pending the completion of the valuation exercises. Final fair values will be incorporated in the 2015 combined financial statements. There were no significant adjustments to the provisional fair values of prior year acquisitions established in 2013.
The businesses acquired in 2014 contributed £37 million to revenue, decreased net profit by £6 million and contributed a net cash inflow of £3 million from operating activities for the part year under the Group’s ownership and before taking account of acquisition financing costs. Had the businesses been acquired at the beginning of the year, on a proforma basis the the Group revenues and net profit attributable to parent companies’ shareholders for the year would have been £5,840 million and £957 million respectively, before taking account of acquisition financing costs.
Acquisitions in 2013
During the year a number of acquisitions were made for a total consideration of £239 million, after taking account of net cash acquired of £14 million. The net assets of the businesses acquired are incorporated at their fair value to the combined businesses. Fair values of the consideration given and of the assets and liabilities acquired are summarised below:
| ||||
| ||||
| ||||
| ||||
| ||||
| ||||
| ||||
| ||||
| ||||
| ||||
Goodwill, being the excess of the consideration over the net tangible and intangible assets acquired, represents benefits which do not qualify for recognition as intangible assets, including the ability of the business to generate higher returns than individual assets, skilled workforces, and acquisition synergies that are specific to the Group. In addition, goodwill arises on the recognition of deferred tax liabilities in respect of intangible assets, for which amortisation does not qualify for tax deductions.
In 2013, there were no significant adjustments to the provisional fair values of prior year acquisitions established in 2012.
The businesses acquired in 2013 contributed £27 million to revenue, decreased net profit by £1 million and contributed a net cash outflow of £3 million from operating activities for the part year under the Group’s ownership and before taking account of acquisition financing costs. Had the businesses been acquired at the beginning of the year, on a proforma basis the the Group revenues and net profit attributable to parent companies’ shareholders for the year would have been £6,067 million and £1,112 million respectively, before taking account of acquisition financing costs.
Acquisitions in 2012
During the year a number of acquisitions were made for a total consideration of £341 million, after taking account of net cash acquired of £12 million. The net assets of the businesses acquired are incorporated at their fair value to the combined businesses. The fair values of the consideration given and of the assets and liabilities acquired are summarised below:
| ||||
| ||||
| ||||
| ||||
| ||||
| ||||
| ||||
| ||||
| ||||
| ||||
| ||||
| ||||
Goodwill, being the excess of the consideration over the net tangible and intangible assets acquired, represents benefits which do not qualify for recognition as intangible assets, including the ability of the business to generate higher returns than individual assets, skilled workforces, and acquisition synergies that are specific to the Group. In addition, goodwill arises on the recognition of deferred tax liabilities in respect of intangible assets, for which amortisation does not qualify for tax deductions.
In 2012, there were no significant adjustments to the provisional fair values of prior year acquisitions established in 2011.
The businesses acquired in 2012 contributed £73 million to revenue, decreased net profit by £10 million and contributed £2 million to net cash inflow from operating activities for the part year under the Group’s ownership and before taking account of acquisition financing costs. Had the businesses been acquired at the beginning of the year, on a proforma basis the the Group revenues and net profit attributable to parent companies’ shareholders for the year would have been £6,153 million and £1,048 million respectively, before taking account of acquisition financing costs.
Ordinary dividends paid in the year
| 2014 £m | 2013 £m | 2012 £m | ||||||||||
Reed Elsevier PLC | 285 | 278 | 264 | |||||||||
Reed Elsevier NV | 281 | 273 | 259 | |||||||||
|
|
|
|
|
| |||||||
Total | 566 | 551 | 523 | |||||||||
|
|
|
|
|
| |||||||
Ordinary dividends paid in the year, in amounts per ordinary share, comprise: a 2013 final dividend of 17.95p and a 2014 interim dividend of 7p giving a total of 24.95p (2013: 23.65p; 2012: 21.9p) for Reed Elsevier PLC; and a 2013 final dividend of €0.374 and a 2014 interim dividend of €0.151 giving a total of €0.525 (2013: €0.469; 2012: €0.456) for Reed Elsevier NV.
The directors of Reed Elsevier PLC have proposed a final dividend of 19.0p (2013: 17.95p; 2012: 17.0p). The directors of Reed Elsevier NV have proposed a final dividend of €0.438 (2013: €0.374; 2012: €0.337). The total cost of funding the proposed final dividends is expected to be £445 million, for which no liability has been recognised at the statement of financial position date.
Ordinary dividends paid and proposed relating to the financial year
| 2014 £m | 2013 £m | 2012 £m | ||||||||||
Reed Elsevier PLC | 294 | 283 | 273 | |||||||||
Reed Elsevier NV | 312 | 288 | 262 | |||||||||
|
|
|
|
|
| |||||||
Total | 606 | 571 | 535 | |||||||||
|
|
|
|
|
| |||||||
Dividends paid to Reed Elsevier PLC and Reed Elsevier NV shareholders are, other than in special circumstances, equalised at the gross level inclusive of the UK tax credit of 10% available to certain Reed Elsevier PLC shareholders.
| 2014 £m | 2013 £m | 2012 £m | ||||||||||
At January 1 | 4,576 | 4,545 | 4,729 | |||||||||
Acquisitions | 240 | 157 | 165 | |||||||||
Disposals/reclassified as held for sale | (34 | ) | (46 | ) | (152 | ) | ||||||
Exchange translation differences | 199 | (80 | ) | (197 | ) | |||||||
|
|
|
|
|
| |||||||
At December 31 | 4,981 | 4,576 | 4,545 | |||||||||
|
|
|
|
|
| |||||||
The carrying amount of goodwill is after cumulative amortisation of £1,106 million (2013: £1,154 million; 2012: £1,180 million) which was charged prior to the adoption of IFRS and £9 million (2013: £9 million; 2012: £20 million) of subsequent impairment charges recorded in prior years.
Impairment review
Impairment testing of goodwill and indefinite lived intangible assets is performed at least annually in accordance with the methodology described within critical judgements and key sources of estimation uncertainty on page F-15. There were no charges for impairment of goodwill in 2014 (2013: nil; 2012: nil).
Goodwill is compiled and assessed among groups of cash generating units (CGUs) which represent the lowest level at which goodwill is monitored by management. Typically, acquisitions are integrated into existing business units, and the goodwill arising is allocated to the groups of CGUs that are expected to benefit from the synergies of the acquisition. As the business areas have become increasingly integrated and globalised, management has reviewed the allocation of goodwill to groups of CGUs. In order to reflect the global leverage of assets, skills, knowledge and technology platforms, and consequential changes to the monitoring of goodwill by management, the number of groups of CGUs to which goodwill is allocated has been reduced from 25 in 2013 to 5 in 2014 (2012: 22). Reducing the number of groups of CGUs had no impact on the carrying values of goodwill, which are set out below:
| 2014 £m | 2013 £m | 2012 £m | ||||||||||
Scientific, Technical & Medical | 1,109 | 1,051 | 1,026 | |||||||||
Risk Solutions | 1,779 | 1,604 | 1,559 | |||||||||
Business Information | 480 | 374 | 408 | |||||||||
Legal | 1,199 | 1,121 | 1,150 | |||||||||
Exhibitions | 414 | 426 | 402 | |||||||||
|
|
|
|
|
| |||||||
Total | 4,981 | 4,576 | 4,545 | |||||||||
|
|
|
|
|
| |||||||
The key assumptions for each group of CGUs are disclosed below:
Key Assumptions | Pre-tax discount rate | Nominal long term market growth rate | ||
Scientific, Technical & Medical | 10.4% | 3.0% | ||
Risk Solutions | 11.5% | 3.0% | ||
Business Information | 11.7% | 3.0% | ||
Legal | 11.5% | 2.0% | ||
Exhibitions | 11.7% | 3.0% | ||
|
|
The pre-tax discount rates used are based on the Group’s weighted average cost of capital, adjusted to reflect a risk premium specific to each business. Nominal long-term market growth rates do not exceed the long term average growth prospects for the sectors and territories in which the businesses operate.
A sensitivity analysis has been performed based on changes in key assumptions considered to be reasonably possible by management: an increase in the discount rate of 0.5%; a decrease in the compound annual growth rate for adjusted cash flow in the five-year forecast period of 2.0%; and a decrease in the nominal long term market growth rates of 0.5%. The sensitivity analysis shows that no impairment charges would result from these scenarios.
| Market and customer related £m | Content, software and other £m | Total acquired intangible assets £m | Internally developed intangible assets £m | Total £m | ||||||||||||||||
Cost | ||||||||||||||||||||
At January 1, 2012 | 2,802 | 3,263 | 6,065 | 1,422 | 7,487 | |||||||||||||||
Acquisitions | 201 | 27 | 228 | 1 | 229 | |||||||||||||||
Additions | — | — | — | 261 | 261 | |||||||||||||||
Disposals/reclassified as held for sale | (56 | ) | (97 | ) | (153 | ) | (114 | ) | (267 | ) | ||||||||||
Exchange translation differences | (131 | ) | (103 | ) | (234 | ) | (53 | ) | (287 | ) | ||||||||||
|
|
|
|
|
|
|
|
|
| |||||||||||
At January 1, 2013 | 2,816 | 3,090 | 5,906 | 1,517 | 7,423 | |||||||||||||||
Acquisitions | 49 | 84 | 133 | — | 133 | |||||||||||||||
Additions | — | — | — | 251 | 251 | |||||||||||||||
Disposals/reclassified as held for sale | (55 | ) | (216 | ) | (271 | ) | (27 | ) | (298 | ) | ||||||||||
Exchange translation differences | (65 | ) | (16 | ) | (81 | ) | (24 | ) | (105 | ) | ||||||||||
|
|
|
|
|
|
|
|
|
| |||||||||||
At January 1, 2014 | 2,745 | 2,942 | 5,687 | 1,717 | 7,404 | |||||||||||||||
Acquisitions | 69 | 117 | 186 | 1 | 187 | |||||||||||||||
Additions | — | — | — | 207 | 207 | |||||||||||||||
Disposals/reclassified as held for sale | — | (62 | ) | (62 | ) | (73 | ) | (135 | ) | |||||||||||
Exchange translation differences | 151 | 44 | 195 | 32 | 227 | |||||||||||||||
|
|
|
|
|
|
|
|
|
| |||||||||||
At December 31, 2014 | 2,965 | 3,041 | 6,006 | 1,884 | 7,890 | |||||||||||||||
|
|
|
|
|
|
|
|
|
| |||||||||||
Accumulated amortisation and impairment | ||||||||||||||||||||
At January 1, 2012 | 744 | 2,422 | 3,166 | 827 | 3,993 | |||||||||||||||
Charge for the year | 173 | 155 | 328 | 151 | 479 | |||||||||||||||
Disposals/reclassified as held for sale | (11 | ) | (89 | ) | (100 | ) | (79 | ) | (179 | ) | ||||||||||
Exchange translation differences | (36 | ) | (80 | ) | (116 | ) | (29 | ) | (145 | ) | ||||||||||
|
|
|
|
|
|
|
|
|
| |||||||||||
At January 1, 2013 | 870 | 2,408 | 3,278 | 870 | 4,148 | |||||||||||||||
Charge for the year | 178 | 139 | 317 | 160 | 477 | |||||||||||||||
Disposals | (55 | ) | (216 | ) | (271 | ) | (22 | ) | (293 | ) | ||||||||||
Exchange translation differences | (26 | ) | (15 | ) | (41 | ) | (11 | ) | (52 | ) | ||||||||||
|
|
|
|
|
|
|
|
|
| |||||||||||
At January 1, 2014 | 967 | 2,316 | 3,283 | 997 | 4,280 | |||||||||||||||
Charge for the year | 154 | 128 | 282 | 158 | 440 | |||||||||||||||
Disposals | — | (44 | ) | (44 | ) | (64 | ) | (108 | ) | |||||||||||
Exchange translation differences | 58 | 43 | 101 | 13 | 114 | |||||||||||||||
|
|
|
|
|
|
|
|
|
| |||||||||||
At December 31, 2014 | 1,179 | 2,443 | 3,622 | 1,104 | 4,726 | |||||||||||||||
|
|
|
|
|
|
|
|
|
| |||||||||||
Net book amount | ||||||||||||||||||||
At December 31, 2012 | 1,946 | 682 | 2,628 | 647 | 3,275 | |||||||||||||||
At December 31, 2013 | 1,778 | 626 | 2,404 | 720 | 3,124 | |||||||||||||||
At December 31, 2014 | 1,786 | 598 | 2,384 | 780 | 3,164 | |||||||||||||||
|
|
|
|
|
|
|
|
|
| |||||||||||
Intangible assets acquired as part of business combinations comprise: market related assets (e.g. trademarks, imprints, brands); customer related assets (e.g. subscription bases, customer lists, customer relationships); and content, software and other intangible assets (e.g. editorial content, software and product delivery systems, other publishing rights, exhibition rights and supply contracts). Included in content, software and other acquired intangible assets are assets with a net book value of £265 million (2013: £353 million; 2012: £431 million) that arose on acquisitions completed prior to the adoption of IFRS that have not been allocated to specific categories of intangible assets. Internally developed intangible assets typically comprise software and systems development where an identifiable asset is created that is expected to generate future economic benefits.
Included in market and customer related intangible assets are £369 million (2013: £347 million; 2012: £354 million) of brands and imprints relating to Scientific, Technical & Medical determined to have indefinite lives based on an assessment of their historical longevity and stable market positions. Indefinite lived intangibles are tested for impairment at least annually using the same value in use assumptions as set out in critical judgements and key sources of estimation uncertainty on pages F-14 to F-15.
| 2014 £m | 2013 £m | 2012 £m | ||||||||||
Investments in joint ventures | 125 | 125 | 100 | |||||||||
Available for sale investments | 2 | 2 | 3 | |||||||||
Venture capital investments held for trading | 110 | 90 | 76 | |||||||||
|
|
|
|
|
| |||||||
Total | 237 | 217 | 179 | |||||||||
|
|
|
|
|
| |||||||
The value of venture capital investments held for trading, determined by reference to quoted market prices, amounted to nil (2013: £12 million; 2012: £27 million). The value of other venture capital investments and available for sale investments has been determined by reference to other observable market inputs. Gains and losses included in the combined income statement are set out in note 9.
An analysis of changes in the carrying value of investments in joint ventures is set out below:
| 2014 £m | 2013 £m | 2012 £m | ||||||||||
At January 1 | 125 | 100 | 124 | |||||||||
Share of results of joint ventures | 36 | 29 | 24 | |||||||||
Dividends received from joint ventures | (44 | ) | (22 | ) | (20 | ) | ||||||
Disposals and transfers | (1 | ) | (3 | ) | (33 | ) | ||||||
Additions | 15 | 21 | 10 | |||||||||
Exchange translation differences | (6 | ) | — | (5 | ) | |||||||
|
|
|
|
|
| |||||||
At December 31 | 125 | 125 | 100 | |||||||||
|
|
|
|
|
| |||||||
The principal joint ventures at December 31, 2014 are exhibition joint ventures within Exhibitions and Giuffrè and Martindale within Legal.
Summarised aggregate information in respect of joint ventures and the Group’s share is set out below:
| Total joint ventures | The Group’s share | |||||||||||||||||||||||
| 2014 £m | 2013 £m | 2012 £m | 2014 £m | 2013 £m | 2012 £m | |||||||||||||||||||
Revenue | 284 | 225 | 187 | 153 | 110 | 91 | ||||||||||||||||||
Net profit for the year | 69 | 57 | 45 | 36 | 29 | 24 | ||||||||||||||||||
|
|
|
|
|
|
|
|
|
|
|
| |||||||||||||
Total assets | 285 | 246 | 227 | 138 | 117 | 104 | ||||||||||||||||||
Total liabilities | (181 | ) | (134 | ) | (126 | ) | (91 | ) | (64 | ) | (59 | ) | ||||||||||||
|
|
|
|
|
|
|
|
|
|
|
| |||||||||||||
Net assets | 104 | 112 | 101 | 47 | 53 | 45 | ||||||||||||||||||
|
|
|
|
|
| |||||||||||||||||||
Goodwill | 78 | 72 | 55 | |||||||||||||||||||||
|
|
|
|
|
| |||||||||||||||||||
Total | 125 | 125 | 100 | |||||||||||||||||||||
|
|
|
|
|
| |||||||||||||||||||
The Group’s combined other comprehensive income includes nil relating to joint ventures (2013: nil; 2012: nil).
| 2014 | 2013 | 2012 | ||||||||||||||||||||||||||||||||||
| Land and buildings £m | Fixtures and equipment £m | Total £m | Land and buildings £m | Fixtures and equipment £m | Total £m | Land and buildings £m | Fixtures and equipment £m | Total £m | ||||||||||||||||||||||||||||
Cost | ||||||||||||||||||||||||||||||||||||
At January 1 | 210 | 558 | 768 | 218 | 537 | 755 | 238 | 582 | 820 | |||||||||||||||||||||||||||
Acquisitions | — | 3 | 3 | — | — | — | — | 1 | 1 | |||||||||||||||||||||||||||
Capital expenditure | 9 | 61 | 70 | 4 | 66 | 70 | 10 | 70 | 80 | |||||||||||||||||||||||||||
Disposals/reclassified as held for sale | (25 | ) | (40 | ) | (65 | ) | (8 | ) | (34 | ) | (42 | ) | (21 | ) | (97 | ) | (118 | ) | ||||||||||||||||||
Exchange translation differences | 7 | 18 | 25 | (4 | ) | (11 | ) | (15 | ) | (9 | ) | (19 | ) | (28 | ) | |||||||||||||||||||||
|
|
|
|
|
|
|
|
|
|
|
|
|
|
|
|
|
| |||||||||||||||||||
| At December 31 | 201 | 600 | 801 | 210 | 558 | 768 | 218 | 537 | 755 | |||||||||||||||||||||||||||
|
|
|
|
|
|
|
|
|
|
|
|
|
|
|
|
|
| |||||||||||||||||||
Accumulated depreciation | ||||||||||||||||||||||||||||||||||||
At January 1 | 117 | 414 | 531 | 116 | 375 | 491 | 118 | 414 | 532 | |||||||||||||||||||||||||||
Disposals/reclassified as held for sale | (16 | ) | (38 | ) | (54 | ) | (6 | ) | (32 | ) | (38 | ) | (5 | ) | (94 | ) | (99 | ) | ||||||||||||||||||
Charge for the year | 9 | 70 | 79 | 9 | 80 | 89 | 8 | 68 | 76 | |||||||||||||||||||||||||||
Exchange translation differences | 4 | 14 | 18 | (2 | ) | (9 | ) | (11 | ) | (5 | ) | (13 | ) | (18 | ) | |||||||||||||||||||||
|
|
|
|
|
|
|
|
|
|
|
|
|
|
|
|
|
| |||||||||||||||||||
At December 31 | 114 | 460 | 574 | 117 | 414 | 531 | 116 | 375 | 491 | |||||||||||||||||||||||||||
|
|
|
|
|
|
|
|
|
|
|
|
|
|
|
|
|
| |||||||||||||||||||
Net book amount | 87 | 140 | 227 | 93 | 144 | 237 | 102 | 162 | 264 | |||||||||||||||||||||||||||
|
|
|
|
|
|
|
|
|
|
|
|
|
|
|
|
|
| |||||||||||||||||||
No depreciation is provided on freehold land of £14 million (2013: £14 million; 2012: £15 million). The net book amount of property, plant and equipment at December 31, 2014 includes £13 million (2013: £17 million; 2012: £11 million) in respect of assets held under finance leases relating to fixtures and equipment.
The main financial risks faced by the Group are liquidity risk, market risk — comprising interest rate risk and foreign exchange risk — and credit risk. Financial instruments are used to finance the Group’s businesses and to hedge interest rate and foreign exchange risks. The Group’s businesses do not enter into speculative derivative transactions. Details of financial instruments subject to liquidity, market and credit risks are described below.
Liquidity risk
The Group maintains a range of borrowing facilities and debt programmes to fund its requirements, at short notice and at competitive rates.
The balance of long-term debt, short-term debt and committed bank facilities is managed to provide security of funding, taking into account the cash generation cycle of the business and the uncertain size and timing of acquisition spend. To accommodate the significant free cash flow generated by the Group and to capitalise on an inexpensive source of funding, a meaningful portion of the overall debt portfolio is typically kept short term as long as there exists acceptable liquidity in the commercial paper markets and sufficient capacity under committed credit lines. The treasury policies ensure adequate liquidity by requiring (a) that no more than $1.5 billion of term debt matures in any 12-month period, (b) that the sum of term debt maturing over the ensuing 12 months plus commercial paper is less than the sum of available cash plus committed facilities and (c) minimum levels of borrowing with maturities over three and five years are maintained.
The treasury policies ensure debt efficiency by (a) targeting certain levels of commercial paper across a given year, (b) maintaining a weighted average maturity of the gross debt portfolio of approximately 5 years and (c) minimising surplus cash balances. From time to time, based on cash flow and market conditions, the Group may redeem term debt early or
repurchase outstanding debt in the open market. Debt is issued to meet the funding requirements of various jurisdictions and in the currency that is needed. It is recognised that debt can act as a natural translation hedge of earnings and net assets in currencies other than the reporting currencies. For this reason, a significant proportion of our net debt has historically been denominated in US dollars, reflecting the size and importance of the US businesses.
There were no changes to the Group’s long-term approach to capital and liquidity management during the year.
The remaining contractual maturities for borrowings and derivative financial instruments are shown in the table below. The table shows undiscounted principal and interest cash flows and includes contractual gross cash flows to be exchanged as part of cross currency interest rate swaps and forward foreign exchange contracts where there is a legal right of set-off.
| Contractual cash flow | ||||||||||||||||||||||||||||||||
At December 31, 2014 | Carrying amount £m | Within 1 year £m | 1-2 Years £m | 2-3 Years £m | 3-4 Years £m | 4-5 Years £m | More than 5 Years £m | Total £m | ||||||||||||||||||||||||
Borrowings | ||||||||||||||||||||||||||||||||
Fixed rate borrowings | (2,937 | ) | (263 | ) | (536 | ) | (432 | ) | (265 | ) | (632 | ) | (1,631 | ) | (3,759 | ) | ||||||||||||||||
Floating rate borrowings | (888 | ) | (551 | ) | (3 | ) | (275 | ) | (65 | ) | — | (2 | ) | (896 | ) | |||||||||||||||||
Derivative financial liabilities | ||||||||||||||||||||||||||||||||
Interest rate derivatives | — | — | — | — | — | — | — | — | ||||||||||||||||||||||||
Cross currency interest rate swaps | (47 | ) | (11 | ) | (10 | ) | (318 | ) | (188 | ) | — | — | (527 | ) | ||||||||||||||||||
Forward foreign exchange contracts | (47 | ) | (1,288 | ) | (474 | ) | (150 | ) | (58 | ) | — | — | (1,970 | ) | ||||||||||||||||||
Derivative financial assets | ||||||||||||||||||||||||||||||||
Interest rate derivatives | 46 | 14 | 13 | 11 | 4 | 4 | 5 | 51 | ||||||||||||||||||||||||
Cross currency interest rate swaps | 6 | 3 | 3 | 275 | 181 | — | — | 462 | ||||||||||||||||||||||||
Forward foreign exchange contracts | 57 | 1,293 | 475 | 150 | 62 | — | — | 1,980 | ||||||||||||||||||||||||
|
|
|
|
|
|
|
|
|
|
|
|
|
|
|
| |||||||||||||||||
Total | (3,810 | ) | (803 | ) | (532 | ) | (739 | ) | (329 | ) | (628 | ) | (1,628 | ) | (4,659 | ) | ||||||||||||||||
|
|
|
|
|
|
|
|
|
|
|
|
|
|
|
| |||||||||||||||||
| Contractual cash flow | ||||||||||||||||||||||||||||||||
At December 31, 2013 | Carrying amount £m | Within 1 year £m | 1-2 Years £m | 2-3 Years £m | 3-4 Years £m | 4-5 Years £m | More than 5 Years £m | Total £m | ||||||||||||||||||||||||
Borrowings | ||||||||||||||||||||||||||||||||
Fixed rate borrowings | (2,931 | ) | (497 | ) | (243 | ) | (524 | ) | (420 | ) | (264 | ) | (1,909 | ) | (3,857 | ) | ||||||||||||||||
Floating rate borrowings | (350 | ) | (288 | ) | (61 | ) | — | (1 | ) | — | (2 | ) | (352 | ) | ||||||||||||||||||
Derivative financial liabilities | ||||||||||||||||||||||||||||||||
Interest rate derivatives | (4 | ) | — | — | — | (1 | ) | (4 | ) | (7 | ) | (12 | ) | |||||||||||||||||||
Cross currency interest rate swaps | (6 | ) | (180 | ) | (3 | ) | (5 | ) | (7 | ) | (193 | ) | — | (388 | ) | |||||||||||||||||
Forward foreign exchange contracts | (7 | ) | (1,031 | ) | (402 | ) | (222 | ) | — | — | — | (1,655 | ) | |||||||||||||||||||
Derivative financial assets | ||||||||||||||||||||||||||||||||
Interest rate derivatives | 19 | 13 | 11 | 6 | 1 | — | — | 31 | ||||||||||||||||||||||||
Cross currency interest rate swaps | 70 | 247 | 2 | 2 | 3 | 189 | — | 443 | ||||||||||||||||||||||||
Forward foreign exchange contracts | 99 | 1,082 | 431 | 233 | — | — | — | 1,746 | ||||||||||||||||||||||||
|
|
|
|
|
|
|
|
|
|
|
|
|
|
|
| |||||||||||||||||
Total | (3,110 | ) | (654 | ) | (265 | ) | (510 | ) | (425 | ) | (272 | ) | (1,918 | ) | (4,044 | ) | ||||||||||||||||
|
|
|
|
|
|
|
|
|
|
|
|
|
|
|
| |||||||||||||||||
| Contractual cash flow | ||||||||||||||||||||||||||||||||
At December 31, 2012 | Carrying amount £m | Within 1 year £m | 1-2 Years £m | 2-3 Years £m | 3-4 Years £m | 4-5 Years £m | More than 5 Years £m | Total £m | ||||||||||||||||||||||||
Borrowings | ||||||||||||||||||||||||||||||||
Fixed rate borrowings | (3,695 | ) | (803 | ) | (797 | ) | (251 | ) | (530 | ) | (428 | ) | (1,940 | ) | (4,749 | ) | ||||||||||||||||
Floating rate borrowings | (197 | ) | (132 | ) | (1 | ) | (63 | ) | — | (1 | ) | (3 | ) | (200 | ) | |||||||||||||||||
Derivative financial liabilities | ||||||||||||||||||||||||||||||||
Interest rate derivatives | (2 | ) | (3 | ) | — | — | — | — | (5 | ) | (8 | ) | ||||||||||||||||||||
Cross currency interest rate swaps | — | (166 | ) | (180 | ) | — | — | — | — | (346 | ) | |||||||||||||||||||||
Forward foreign exchange contracts | (9 | ) | (1,382 | ) | (442 | ) | (194 | ) | — | — | — | (2,018 | ) | |||||||||||||||||||
Derivative financial assets | ||||||||||||||||||||||||||||||||
Interest rate derivatives | 47 | 35 | 13 | 12 | 9 | 6 | — | 75 | ||||||||||||||||||||||||
Cross currency interest rate swaps | 93 | 202 | 243 | — | — | — | — | 445 | ||||||||||||||||||||||||
Forward foreign exchange contracts | 55 | 1,400 | 460 | 202 | — | — | — | 2,062 | ||||||||||||||||||||||||
|
|
|
|
|
|
|
|
|
|
|
|
|
|
|
| |||||||||||||||||
Total | (3,708 | ) | (849 | ) | (704 | ) | (294 | ) | (521 | ) | (423 | ) | (1,948 | ) | (4,739 | ) | ||||||||||||||||
|
|
|
|
|
|
|
|
|
|
|
|
|
|
|
| |||||||||||||||||
The carrying amount of derivative financial liabilities comprises £3 million (2013: £10 million; 2012: nil) in relation to fair value hedges, £78 million (2013: £7 million; 2012: £7 million) in relation to cash flow hedges and £9 million (2013: nil; 2012: £4 million) not designated as hedging instruments, plus £4 million of cash collateral received from swap counterparties which has been added to the related derivative financial liabilities (2013: £13 million which has been offset against the related derivative financial assets; 2012: nil) (see ‘Credit risk’ below). The carrying amount of derivative financial assets comprises £46 million (2013: £84 million; 2012: £124 million) in relation to fair value hedges, £60 million (2013: £88 million; 2012: £46 million) in relation to cash flow hedges and £3 million (2013: £29 million; 2012: £25 million) not designated as hedging instruments. The expected cash flows in respect of the cash collateral have been included in the tables above together with the cash flows for the related cross currency interest rate swaps.
At December 31, 2014, the Group had access to a $2,000 million committed bank facility maturing in July 2019, which was undrawn. This facility backs up short term borrowings. All borrowings that mature within the next two years can be covered by the facility and by utilising available cash resources.
The committed bank facility, together with certain private placements, are subject to financial covenants typical to the Group’s size and financial strength. The Group had significant headroom within these covenants for the year ended December 31, 2014. There are no financial covenants in any outstanding public bonds.
Market Risk
The Group’s primary market risks are to interest rate fluctuations and exchange rate movements. Derivatives are used to hedge or reduce the risks of interest rate and exchange rate movements and are not entered into unless such risks exist. Derivatives used by the Group for hedging a particular risk are not specialised and are generally available from numerous sources. The impact of market risks on net post employment benefit obligations and taxation is excluded from the following market risk sensitivity analysis.
Interest rate exposure management
The Group’s interest rate exposure management policy aims to reduce the exposure of the combined businesses to changes in interest rates at efficient cost. To achieve this we use fixed rate term debt, interest rate swaps, forward rate agreements and interest rate options. Interest rate derivatives are used only to hedge an underlying risk and no net market positions are held.
At December 31, 2014, 52% of gross borrowings were either fixed rate or had been fixed through the use of interest rate swaps, forward rate agreements and options. A 100 basis point reduction in interest rates would result in an estimated decrease in net finance costs of £16 million (2013: £12 million; 2012: £8 million), based on the composition of financial instruments including cash, cash equivalents, bank loans and commercial paper borrowings at December 31, 2014. A 100 basis point rise in interest rates would result in an estimated increase in net finance costs of £16 million (2013: £12 million; 2012: £8 million).
The impact on net equity of a theoretical change in interest rates as at December 31, 2014 is restricted to the change in carrying value of floating rate to fixed rate interest rate derivatives in a designated cash flow hedge relationship and undesignated interest rate derivatives, of which there were none in the Group as at December 31, 2014. A 100 basis point reduction in interest rates would therefore result in a reduction in net equity of nil (2013: nil; 2012: £1 million) and a 100 basis point increase in interest rates would increase net equity by nil (2013: £1 million; 2012: £2 million). The impact of a change in interest rates on the carrying value of fixed rate borrowings in a designated fair value hedge relationship would be offset by the change in carrying value of the related interest rate derivative. Fixed rate borrowings not in a designated hedging relationship are carried at amortised cost.
Foreign currency exposure management
Translation exposures arise on the earnings and net assets of business operations in countries other than those of each parent company. Some of these exposures are offset by denominating borrowings in US dollars. Currency exposures on transactions denominated in a foreign currency are generally hedged using forward contracts. In addition, recurring transactions and future investment exposures may be hedged, in advance of becoming contractual. The precise policy differs according to the specific circumstances of the individual businesses. Highly predictable future cash flows may be covered for transactions expected to occur during the next 24 months (50 months for the Scientific, Technical & Medical subscription businesses) within limits defined according to the period before the transaction is expected to become contractual. Cover takes the form of foreign exchange forward contracts.
As at December 31, 2014, the amount of outstanding foreign exchange cover against future transactions was £1.4 billion (2013: £1.3 billion; 2012: £1.2 billion).
A theoretical weakening of all currencies by 10% against sterling at December 31, 2014 would decrease the carrying value of net assets, excluding net borrowings, by £524 million (2013: £500 million; 2012: £495 million). This would be offset to a degree by a decrease in net borrowings of £255 million (2013: £246 million; 2012: £286 million). A strengthening of all currencies by 10% against sterling at December 31, 2014 would increase the carrying value of net assets, excluding net borrowings, by £524 million (2013: £500 million; 2012: £495 million) and increase net borrowings by £255 million (2013: £246 million; 2012: £286 million).
A retranslation of the combined businesses’ net profit for the year assuming a 10% weakening of all foreign currencies against sterling but excluding transactional exposures would reduce net profit by £80 million (2013: £92 million; 2012: £80 million). A 10% strengthening of all foreign currencies against sterling on this basis would increase net profit for the year by £80 million (2013: £92 million; 2012: £80 million).
Credit risk
The Group seeks to limit interest rate and foreign exchange risks described above by the use of financial instruments and as a result has a credit risk from the potential non performance by the counterparties to these financial instruments, which are unsecured. The amount of this credit risk is normally restricted to the amounts of any hedge gain and not the principal amount being hedged. The Group also has a credit exposure to counterparties for the full principal amount of cash and cash equivalents. Credit risks are controlled by monitoring the credit quality of these counterparties, principally licensed commercial banks and investment banks with strong long term credit ratings, and the amounts outstanding with each of them.
In certain situations, the Group enters into credit support arrangements with derivative counterparties to mitigate the credit exposures arising from hedge gains on the related financial instruments. Under these arrangements, the Group receives (or pays) cash collateral equal to the mark to market valuation of the related derivative asset (or liability) on monthly settlement dates. At December 31, 2014, £4 million (2013: £13 million; 2012: nil) of cash collateral had been received, and the resulting payable balance was added to the related derivative liabilities of £1 million (2013: £13 million offset against the related derivative assets of £12 million; 2012: nil) in the statement of financial position.
The Group has treasury policies in place which do not allow concentrations of risk with individual counterparties and do not allow significant treasury exposures with counterparties which are rated lower than A-/A3 by Standard & Poor’s, Moody’s and Fitch. At December 31, 2014, cash and cash equivalents totalled £276 million (2013: £132 million; 2012: £641 million), of which 96% (2013: 90%; 2012: 98%) was held with banks rated A-/A3 or better.
The Group also has credit risk with respect to trade receivables due from its customers that include national and state governments, academic institutions and large and small enterprises including law firms, book stores and wholesalers. The
concentration of credit risk from trade receivables is limited due to the large and broad customer base. Trade receivable exposures are managed locally in the business units where they arise. Where appropriate, business units seek to minimise this exposure by taking payment in advance and through management of credit terms. Allowance is made for bad and doubtful debts based on management’s assessment of the risk taking into account the ageing profile, experience and circumstance. The maximum exposure to credit risk is represented by the carrying amount of each financial asset, including derivative financial instruments, recorded in the statement of financial position.
Included within trade receivables are the following amounts which are past due but for which no allowance has been made. Past due up to one month £136 million (2013: £156 million; 2012: £148 million); past due two to three months £66 million (2013: £76 million; 2012: £58 million); past due four to six months £30 million (2013: £26 million; 2012: £14 million); and past due greater than six months £7 million (2013: £7 million; 2012: £1 million). Examples of trade receivables which are past due but for which no allowance has been made include those receivables where there is no concern over the creditworthiness of the customer and where the history of dealings with the customer indicate the amount will be settled.
Hedge accounting
The hedging relationships that are designated under IAS39 — Financial Instruments are described below:
Fair value hedges
The Group has entered into interest rate swaps and cross currency interest rate swaps to hedge the exposure to changes in the fair value of fixed rate borrowings due to interest rate and foreign currency movements which could affect the income statement. Interest rate derivatives (including cross currency interest rate swaps) with a principal amount of £908 million were in place at December 31, 2014, swapping fixed rate term debt issues denominated in US dollars (USD), sterling and euros to floating rate USD, sterling and euro debt respectively for the whole or part of their term (2013: £1,104 million swapping fixed rate term debt issues denominated in USD, sterling, euros and Swiss francs (CHF) to floating rate USD, sterling, euro and USD debt respectively for the whole or part of their term; 2012: £1,502 million swapping fixed rate term debt issues denominated in sterling, euros and Swiss francs (CHF) to floating rate sterling, euros and US dollar (USD) debt respectively for the whole of their term).
The gains and losses on the borrowings and related derivatives designated as fair value hedges, which are included in the income statement, for the three years ended December 31, 2014 were as follows:
Gains/(losses) on borrowings and related derivatives
| January 1, 2012 £m | Fair value movement gain/(loss) £m | De-designated £m | Exchange gain/(loss) £m | December 31, 2012 £m | ||||||||||||||||
GBP debt | (30 | ) | (6 | ) | — | — | (36 | ) | ||||||||||||
Related interest rate swaps | 30 | 6 | — | — | 36 | |||||||||||||||
|
|
|
|
|
|
|
|
|
| |||||||||||
| — | — | — | — | — | ||||||||||||||||
|
|
|
|
|
|
|
|
|
| |||||||||||
EUR debt | (9 | ) | (8 | ) | 9 | — | (8 | ) | ||||||||||||
Related interest rate swaps | 9 | 8 | (9 | ) | — | 8 | ||||||||||||||
|
|
|
|
|
|
|
|
|
| |||||||||||
| — | — | — | — | — | ||||||||||||||||
|
|
|
|
|
|
|
|
|
| |||||||||||
CHF debt | (84 | ) | — | — | 4 | (80 | ) | |||||||||||||
Related CHF to USD cross currency interest rate swaps | 84 | — | — | (4 | ) | 80 | ||||||||||||||
|
|
|
|
|
|
|
|
|
| |||||||||||
| — | — | — | — | — | ||||||||||||||||
|
|
|
|
|
|
|
|
|
| |||||||||||
Total relating to GBP, EUR and CHF debt | (123 | ) | (14 | ) | 9 | 4 | (124 | ) | ||||||||||||
Total related interest rate derivatives | 123 | 14 | (9 | ) | (4 | ) | 124 | |||||||||||||
|
|
|
|
|
|
|
|
|
| |||||||||||
Net gain | — | — | — | — | — | |||||||||||||||
|
|
|
|
|
|
|
|
|
| |||||||||||
| January 1, 2013 £m | Fair value movement gain/(loss) £m | Exchange gain/(loss) £m | December 31, 2013 £m | |||||||||||||
USD debt | — | 6 | — | 6 | ||||||||||||
Related interest rate swap | — | (6 | ) | — | (6 | ) | ||||||||||
|
|
|
|
|
|
|
| |||||||||
| — | — | — | — | |||||||||||||
|
|
|
|
|
|
|
| |||||||||
GBP debt | (36 | ) | 17 | — | (19 | ) | ||||||||||
Related interest rate swaps | 36 | (17 | ) | — | 19 | |||||||||||
|
|
|
|
|
|
|
| |||||||||
| — | — | — | — | |||||||||||||
|
|
|
|
|
|
|
| |||||||||
EUR debt | (8 | ) | 13 | (1 | ) | 4 | ||||||||||
Related interest rate swaps | 8 | (13 | ) | 1 | (4 | ) | ||||||||||
|
|
|
|
|
|
|
| |||||||||
| — | — | — | — | |||||||||||||
|
|
|
|
|
|
|
| |||||||||
CHF debt | (80 | ) | 14 | 1 | (65 | ) | ||||||||||
Related CHF to USD cross currency interest rate swaps | 80 | (14 | ) | (1 | ) | 65 | ||||||||||
|
|
|
|
|
|
|
| |||||||||
| — | — | — | — | |||||||||||||
|
|
|
|
|
|
|
| |||||||||
Total USD, GBP, EUR and CHF debt | (124 | ) | 50 | — | (74 | ) | ||||||||||
Total related interest rate derivatives | 124 | (50 | ) | — | 74 | |||||||||||
|
|
|
|
|
|
|
| |||||||||
Net gain | — | — | — | — | ||||||||||||
|
|
|
|
|
|
|
| |||||||||
| January 1, 2014 £m | Fair value movement gain/(loss) £m | Exchange gain/(loss) £m | December 31, 2014 £m | |||||||||||||
USD debt | 6 | (3 | ) | — | 3 | |||||||||||
Related interest rate swap | (6 | ) | 3 | — | (3 | ) | ||||||||||
|
|
|
|
|
|
|
| |||||||||
| — | — | — | — | |||||||||||||
|
|
|
|
|
|
|
| |||||||||
GBP debt | (19 | ) | (1 | ) | — | (20 | ) | |||||||||
Related interest rate swaps | 19 | 1 | — | 20 | ||||||||||||
|
|
|
|
|
|
|
| |||||||||
| — | — | — | — | |||||||||||||
|
|
|
|
|
|
|
| |||||||||
EUR debt | 4 | (31 | ) | 1 | (26 | ) | ||||||||||
Related interest rate swaps | (4 | ) | 31 | (1 | ) | 26 | ||||||||||
|
|
|
|
|
|
|
| |||||||||
| — | — | — | — | |||||||||||||
|
|
|
|
|
|
|
| |||||||||
CHF debt | (65 | ) | 65 | — | — | |||||||||||
Related CHF to USD cross currency interest rate swaps | 65 | (65 | ) | — | — | |||||||||||
|
|
|
|
|
|
|
| |||||||||
| — | — | — | — | |||||||||||||
|
|
|
|
|
|
|
| |||||||||
Total USD, GBP, EUR and CHF debt | (74 | ) | 30 | 1 | (43 | ) | ||||||||||
Total related interest rate derivatives | 74 | (30 | ) | (1 | ) | 43 | ||||||||||
|
|
|
|
|
|
|
| |||||||||
Net gain | — | — | — | — | ||||||||||||
|
|
|
|
|
|
|
| |||||||||
All fair value hedges were highly effective throughout the three years ended December 31, 2014.
Gross borrowings as at December 31, 2014 included £29 million (2013: £31 million; 2012: £37 million) in relation to fair value adjustments to borrowings previously designated in a fair value hedge relationship which were de-designated in 2008. The related derivatives were closed out on de-designation with a cash inflow of £62 million. £4 million (2013: £5 million; 2012: £5 million ) of these fair value adjustments were amortised in the year as a reduction to finance costs.
Cash flow hedges
The Group enters into two types of cash flow hedge:
Movements in the hedge reserve in 2014, 2013 and 2012, including gains and losses on cash flow hedging instruments, were as follows:
| Debt hedges £m | Revenue hedges £m | Total hedge reserve pre-tax £m | ||||||||||
Hedge reserve at January 1, 2012: losses deferred | (17 | ) | (46 | ) | (63 | ) | ||||||
(Losses)/gains arising in 2012 | (2 | ) | 72 | 70 | ||||||||
Amounts recognised in income statement | 16 | 10 | 26 | |||||||||
Exchange translation differences | 1 | 1 | 2 | |||||||||
|
|
|
|
|
| |||||||
Hedge reserve at January 1, 2013: (losses)/gains deferred | (2 | ) | 37 | 35 | ||||||||
Gains arising in 2013 | 1 | 64 | 65 | |||||||||
Amounts recognised in income statement | 3 | (6 | ) | (3 | ) | |||||||
Exchange translation differences | — | (1 | ) | (1 | ) | |||||||
|
|
|
|
|
| |||||||
Hedge reserve at January 1, 2014: gains deferred | 2 | 94 | 96 | |||||||||
Losses arising in 2014 | (52 | ) | (29) | (81 | ) | |||||||
Amounts recognised in income statement | 56 | (37) | 19 | |||||||||
Exchange translation differences | — | 1 | 1 | |||||||||
|
|
|
|
|
| |||||||
Hedge reserve at December 31, 2014: gains deferred | 6 | 29 | 35 | |||||||||
|
|
|
|
|
| |||||||
All cash flow hedges were highly effective throughout the three years ended December 31, 2014.
A tax charge of £10 million (2013: £23 million; 2012: £9 million) in respect of the above gains and losses at December 31, 2014 was also deferred in the hedge reserve.
Of the amounts recognised in the income statement in the year, gains of £37 million (2013: £6 million gain; 2012: £10 million loss) were recognised in revenue, and losses of £56 million (2013: £3 million; 2012: £16 million) were recognised in finance costs. A tax charge of £9 million (2013: £1 million charge; 2012: £5 million credit) was recognised in relation to these items.
The deferred gains and losses on cash flow hedges at December 31, 2014 are currently expected to be recognised in the income statement in future years as follows:
| Debt hedges £m | Revenue hedges £m | Total hedge reserve pre-tax £m | ||||||||||
2015 | (1) | 24 | 23 | |||||||||
2016 | — | 6 | 6 | |||||||||
2017 | 2 | (2 | ) | — | ||||||||
2018 | 5 | 1 | 6 | |||||||||
2019 | — | — | — | |||||||||
|
|
|
|
|
| |||||||
Gains deferred in hedge reserve at end of year | 6 | 29 | 35 | |||||||||
|
|
|
|
|
| |||||||
The cash flows for these hedges are expected to occur in line with the recognition of the gain and losses in the income statement, other than in respect of certain forward foreign exchange hedges on subscriptions, where cash flows may occur in advance of the subscription year.
| 2014 £m | 2013 £m | 2012 £m | ||||||||||
Deferred tax assets | 464 | 442 | 79 | |||||||||
Deferred tax liabilities | (1,056 | ) | (1,076 | ) | (919 | ) | ||||||
|
|
|
|
|
| |||||||
Total | (592 | ) | (634 | ) | (840 | ) | ||||||
|
|
|
|
|
| |||||||
Movements in deferred tax liabilities and assets (before taking into consideration the offsetting of balances within the same jurisdiction) are summarised as follows:
| Deferred tax liabilities | Deferred tax assets | |||||||||||||||||||||||||||||||
| Excess of tax allowances over amortisation £m | Acquired intangible assets £m | Other temporary differences £m | Excess of amortisation over tax allowances £m | Tax losses carried forward £m | Pensions liabilities £m | Other temporary differences £m | Total £m | |||||||||||||||||||||||||
Deferred tax (liability)/asset at January 1, 2012 | (231 | ) | (900 | ) | (105 | ) | 16 | 48 | 86 | 62 | (1,024 | ) | ||||||||||||||||||||
(Charge)/credit to profit | (5 | ) | 85 | (9 | ) | (3 | ) | (19 | ) | (32 | ) | 23 | 40 | |||||||||||||||||||
(Charge)/credit to equity/other comprehensive income | — | — | (3 | ) | — | — | 102 | (6 | ) | 93 | ||||||||||||||||||||||
Acquisitions | 1 | (10 | ) | — | (3 | ) | (2 | ) | — | (2 | ) | (16 | ) | |||||||||||||||||||
Disposals/reclassified as held for sale | 2 | 18 | 7 | — | (1 | ) | — | (1 | ) | 25 | ||||||||||||||||||||||
Exchange translation differences | 10 | 35 | 2 | (1 | ) | (3 | ) | (3 | ) | 2 | 42 | |||||||||||||||||||||
|
|
|
|
|
|
|
|
|
|
|
|
|
|
|
| |||||||||||||||||
Deferred tax (liability)/asset at January 1, 2013 | (223 | ) | (772 | ) | (108 | ) | 9 | 23 | 153 | 78 | (840 | ) | ||||||||||||||||||||
(Charge)/credit to profit | (138 | ) | 98 | (106 | ) | 346 | (8 | ) | (26 | ) | 105 | 271 | ||||||||||||||||||||
(Charge)/credit to equity/other comprehensive income | — | — | (6 | ) | — | — | (24 | ) | 12 | (18 | ) | |||||||||||||||||||||
Acquisitions | — | (39 | ) | — | — | — | — | — | (39 | ) | ||||||||||||||||||||||
Disposals/reclassified as held for sale | (3 | ) | (18 | ) | (9 | ) | — | — | — | — | (30 | ) | ||||||||||||||||||||
Exchange translation differences | 13 | 13 | 4 | (6 | ) | (1 | ) | 1 | (2 | ) | 22 | |||||||||||||||||||||
|
|
|
|
|
|
|
|
|
|
|
|
|
|
|
| |||||||||||||||||
Deferred tax (liability)/asset at January 1, 2014 | (351 | ) | (718 | ) | (225 | ) | 349 | 14 | 104 | 193 | (634 | ) | ||||||||||||||||||||
Credit/(charge) to profit | 11 | 71 | (18 | ) | (4 | ) | 5 | (6 | ) | 29 | 88 | |||||||||||||||||||||
(Charge)/credit to equity/other comprehensive income | — | — | (8 | ) | — | — | 63 | 15 | 70 | |||||||||||||||||||||||
Acquisitions | — | (53 | ) | — | — | 17 | — | — | (36 | ) | ||||||||||||||||||||||
Disposals/reclassified as held for sale | — | — | — | — | — | — | — | — | ||||||||||||||||||||||||
Exchange translation differences | (21 | ) | (34 | ) | 10 | (22 | ) | — | — | (13 | ) | (80 | ) | |||||||||||||||||||
|
|
|
|
|
|
|
|
|
|
|
|
|
|
|
| |||||||||||||||||
Deferred tax (liability)/asset at December 31, 2014 | (361 | ) | (734 | ) | (241 | ) | 323 | 36 | 161 | 224 | (592 | ) | ||||||||||||||||||||
|
|
|
|
|
|
|
|
|
|
|
|
|
|
|
| |||||||||||||||||
Other deferred tax liabilities includes temporary differences in respect of plant, property and equipment, capitalised development spend and financial instruments. Other deferred tax assets includes temporary differences in respect of share based remuneration, provisions and financial instruments.
Deferred tax assets in respect of tax losses and other deductible temporary differences have only been recognised to the extent that it is more likely than not that sufficient taxable profits will be available to allow the asset to be recovered. Accordingly, no deferred tax asset has been recognised in respect of unused trading losses of approximately £80 million (2013: £84 million; 2012: £129 million) carried forward at year end. The deferred tax asset not recognised in respect of these losses is approximately £19 million (2013: £20 million; 2012: £34 million). Of the unrecognised losses, £49 million (2013: £56 million; 2012: £47 million) will expire if not utilised within 10 years, and £31 million (2013: £28 million; 2012: £82 million) will expire after more than 10 years.
Deferred tax assets of approximately £13 million (2013: £14 million; 2012: £9 million) have not been recognised in respect of tax losses and other temporary differences carried forward of £65 million (2013: £69 million; 2012: £41 million) which can only be used to offset future capital gains.
| 2014 £m | 2013 £m | 2012 £m | ||||||||||
Raw materials | 2 | 3 | 3 | |||||||||
Pre-publication costs | 92 | 90 | 101 | |||||||||
Finished goods | 48 | 49 | 55 | |||||||||
|
|
|
|
|
| |||||||
Total | 142 | 142 | 159 | |||||||||
|
|
|
|
|
| |||||||
| 2014 £m | 2013 £m | 2012 £m | ||||||||||
Trade receivables | 1,361 | 1,299 | 1,256 | |||||||||
Allowance for doubtful debts | (50 | ) | (57 | ) | (51 | ) | ||||||
|
|
|
|
|
| |||||||
| 1,311 | 1,242 | 1,205 | ||||||||||
Prepayments and accrued income | 176 | 174 | 175 | |||||||||
|
|
|
|
|
| |||||||
Total | 1,487 | 1,416 | 1,380 | |||||||||
|
|
|
|
|
| |||||||
Trade receivables are predominantly non-interest bearing and their carrying amounts approximate to their fair value.
Trade receivables are stated net of allowances for bad and doubtful debts. The movements in the provision during the year were as follows:
| 2014 £m | 2013 £m | 2012 £m | ||||||||||
At January 1 | 57 | 51 | 63 | |||||||||
Charge for the year | 8 | 17 | 13 | |||||||||
Trade receivables written off | (14 | ) | (11 | ) | (18 | ) | ||||||
Disposals | — | — | (6 | ) | ||||||||
Exchange translation differences | (1 | ) | — | (1 | ) | |||||||
|
|
|
|
|
| |||||||
At December 31 | 50 | 57 | 51 | |||||||||
|
|
|
|
|
| |||||||
The major classes of assets and liabilities of operations classified as held for sale are as follows:
| 2014 £m | 2013 £m | 2012 £m | ||||||||||
Goodwill | — | 16 | 134 | |||||||||
Intangible assets | — | — | 84 | |||||||||
Property, plant and equipment | — | — | 3 | |||||||||
Deferred tax assets | — | — | 4 | |||||||||
Inventories | — | — | 1 | |||||||||
Trade and other receivables | — | 5 | 71 | |||||||||
|
|
|
|
|
| |||||||
Total assets held for sale | — | 21 | 297 | |||||||||
|
|
|
|
|
| |||||||
Trade and other payables | 2 | 3 | 69 | |||||||||
Deferred tax liabilities | — | — | 27 | |||||||||
|
|
|
|
|
| |||||||
Total liabilities associated with assets held for sale | 2 | 3 | 96 | |||||||||
|
|
|
|
|
| |||||||
| 2014 £m | 2013 £m | 2012 £m | ||||||||||
Payables | 333 | 330 | 303 | |||||||||
Accruals | 462 | 443 | 420 | |||||||||
Social security and other taxes | 88 | 88 | 85 | |||||||||
Other payables | 300 | 331 | 342 | |||||||||
Deferred income | 1,453 | 1,403 | 1,394 | |||||||||
|
|
|
|
|
| |||||||
Total | 2,636 | 2,595 | 2,544 | |||||||||
|
|
|
|
|
| |||||||
Trade and other payables are predominately non-interest bearing and their carrying amounts approximate to their fair value.
| 2014 | 2013 | 2012 | ||||||||||||||||||||||||||||||||||
| Falling due within 1 year £m | Falling due in more than 1 year £m | Total £m | Falling due within 1 year £m | Falling due in more than 1 year £m | Total £m | Falling due within 1 year £m | Falling due in more than 1 year £m | Total £m | ||||||||||||||||||||||||||||
Financial liabilities measured at amortised cost: | ||||||||||||||||||||||||||||||||||||
Short term bank loans, overdrafts and commercial paper | 548 | — | 548 | 287 | — | 287 | 131 | — | 131 | |||||||||||||||||||||||||||
Term debt | — | 1,823 | 1,823 | �� | — | 1,223 | 1,223 | — | 1,526 | 1,526 | ||||||||||||||||||||||||||
Finance leases | 7 | 5 | 12 | 9 | 8 | 17 | 7 | 9 | 16 | |||||||||||||||||||||||||||
Term debt in fair value hedging relationships | — | 951 | 951 | 240 | 938 | 1,178 | 102 | 1,036 | 1,138 | |||||||||||||||||||||||||||
Term debt previously in fair value hedging relationships | 121 | 370 | 491 | 112 | 464 | 576 | 490 | 591 | 1,081 | |||||||||||||||||||||||||||
|
|
|
|
|
|
|
|
|
|
|
|
|
|
|
|
|
| |||||||||||||||||||
Total | 676 | 3,149 | 3,825 | 648 | 2,633 | 3,281 | 730 | 3,162 | 3,892 | |||||||||||||||||||||||||||
|
|
|
|
|
|
|
|
|
|
|
|
|
|
|
|
|
| |||||||||||||||||||
The total fair value of financial liabilities measured at amortised cost is £2,597 million (2013: £1,709 million; 2012: £1,996 million). The total fair value of term debt in fair value hedging relationships is £1,045 million (2013: £1,288 million; 2012: £1,177 million). The total fair value of term debt previously in fair value hedging relationships is £588 million (2013: £650 million; 2012: £1,189 million).
In 2013, £186 million principal amount of term debt maturing in 2019 was exchanged for £235 million principal amount of term debt maturing in 2022 and cash. The exchange is treated as a debt modification for accounting purposes. The premium arising is offset against the carrying amount of the newly issued term debt maturing in 2022 and will be amortised over its life.
Term debt includes term debt issued by Reed Elsevier Capital Inc., a 100% owned finance subsidiary of RELX Group plc. The parent companies have fully and unconditionally guaranteed these securities. No other subsidiary of the parent companies or RELX Group plc guarantees the securities.
Analysis by year of repayment
| 2014 | 2013 | 2012 | ||||||||||||||||||||||||||||||||||||||||||||||
| Short term bank loans, overdrafts and commercial paper £m | Term debt £m | Finance leases £m | Total £m | Short term bank loans, overdrafts and commercial paper £m | Term debt £m | Finance leases £m | Total £m | Short term bank loans, overdrafts and commercial paper £m | Term debt £m | Finance leases £m | Total £m | |||||||||||||||||||||||||||||||||||||
Within 1 year | 548 | 121 | 7 | 676 | 287 | 352 | 9 | 648 | 131 | 592 | 7 | 730 | ||||||||||||||||||||||||||||||||||||
|
|
|
|
|
|
|
|
|
|
|
|
|
|
|
|
|
|
|
|
|
|
|
| |||||||||||||||||||||||||
Within 1 to 2 years | — | 400 | 4 | 404 | — | 174 | 5 | 179 | — | 644 | 6 | 650 | ||||||||||||||||||||||||||||||||||||
Within 2 to 3 years | — | 615 | 1 | 616 | — | 400 | 3 | 403 | — | 178 | 3 | 181 | ||||||||||||||||||||||||||||||||||||
Within 3 to 4 years | — | 242 | — | 242 | — | 341 | — | 341 | — | 400 | — | 400 | ||||||||||||||||||||||||||||||||||||
Within 4 to 5 years | — | 553 | — | 553 | — | 181 | — | 181 | — | 359 | — | 359 | ||||||||||||||||||||||||||||||||||||
After 5 years | — | 1,334 | — | 1,334 | — | 1,529 | — | 1,529 | — | 1,572 | — | 1,572 | ||||||||||||||||||||||||||||||||||||
|
|
|
|
|
|
|
|
|
|
|
|
|
|
|
|
|
|
|
|
|
|
|
| |||||||||||||||||||||||||
After 1 year | — | 3,144 | 5 | 3,149 | — | 2,625 | 8 | 2,633 | — | 3,153 | 9 | 3,162 | ||||||||||||||||||||||||||||||||||||
|
|
|
|
|
|
|
|
|
|
|
|
|
|
|
|
|
|
|
|
|
|
|
| |||||||||||||||||||||||||
Total | 548 | 3,265 | 12 | 3,825 | 287 | 2,977 | 17 | 3,281 | 131 | 3,745 | 16 | 3,892 | ||||||||||||||||||||||||||||||||||||
|
|
|
|
|
|
|
|
|
|
|
|
|
|
|
|
|
|
|
|
|
|
|
| |||||||||||||||||||||||||
Short term bank loans, overdrafts and commercial paper were backed up at December 31, 2014 by a $2,000 million (£1,284 million) committed bank facility maturing in July 2019, which was undrawn.
Analysis by currency
| 2014 | 2013 | 2012 | ||||||||||||||||||||||||||||||||||||||||||||||
| Short term bank loans, overdrafts and commercial paper £m | Term debt £m | Finance leases £m | Total £m | Short term bank loans, overdrafts and commercial paper £m | Term debt £m | Finance leases £m | Total £m | Short term bank loans, overdrafts and commercial paper £m | Term debt £m | Finance leases £m | Total £m | |||||||||||||||||||||||||||||||||||||
US dollars | 254 | 1,788 | 12 | 2,054 | 87 | 1,800 | 17 | 1,904 | 25 | 2,059 | 16 | 2,100 | ||||||||||||||||||||||||||||||||||||
£ sterling | 69 | 1,020 | — | 1,089 | 27 | 719 | — | 746 | — | 736 | — | 736 | ||||||||||||||||||||||||||||||||||||
Euro | 224 | 457 | — | 681 | 167 | 458 | — | 625 | 103 | 950 | — | 1,053 | ||||||||||||||||||||||||||||||||||||
Other currencies | 1 | — | — | 1 | 6 | — | — | 6 | 3 | — | — | 3 | ||||||||||||||||||||||||||||||||||||
|
|
|
|
|
|
|
|
|
|
|
|
|
|
|
|
|
|
|
|
|
|
|
| |||||||||||||||||||||||||
Total | 548 | 3,265 | 12 | 3,825 | 287 | 2,977 | 17 | 3,281 | 131 | 3,745 | 16 | 3,892 | ||||||||||||||||||||||||||||||||||||
|
|
|
|
|
|
|
|
|
|
|
|
|
|
|
|
|
|
|
|
|
|
|
| |||||||||||||||||||||||||
Included in the US dollar amounts for term debt above is £449 million (2013: £427 million; 2012: £347 million) of debt denominated in euros (€350 million; 2013: nil; 2012: nil) and Swiss francs (CHF 275 million; 2013: CHF 625 million; 2012: CHF 500 million) that was swapped into US dollars on issuance and against which there are related derivative financial instruments, which, as at December 31, 2014, had a fair value of £40 million (2013: £81 million; 2012: £80 million).
Finance leases
At December 31, 2014 future finance lease obligations fall due as follows:
| 2014 £m | 2013 £m | 2012 £m | ||||||||||
Within one year | 7 | 9 | 7 | |||||||||
In the second to fifth years inclusive | 5 | 8 | 9 | |||||||||
|
|
|
|
|
| |||||||
| 12 | 17 | 16 | ||||||||||
Less future finance charges | — | — | — | |||||||||
|
|
|
|
|
| |||||||
Total | 12 | 17 | 16 | |||||||||
|
|
|
|
|
| |||||||
Present value of future finance lease obligations payable: | ||||||||||||
Within one year | 7 | 9 | 7 | |||||||||
In the second to fifth years inclusive | 5 | 8 | 9 | |||||||||
|
|
|
|
|
| |||||||
Total | 12 | 17 | 16 | |||||||||
|
|
|
|
|
| |||||||
The fair value of the lease obligations approximates to their carrying amount.
Operating leases
The Group leases various properties, principally offices and warehouses, which have varying terms and renewal rights that are typical to the territory in which they are located.
At December 31, 2014 outstanding commitments under non-cancellable operating leases fall due as follows:
| 2014 £m | 2013 £m | 2012 £m | ||||||||||
Within one year | 96 | 103 | 117 | |||||||||
In the second to fifth years inclusive | 279 | 275 | 309 | |||||||||
After five years | 148 | 169 | 184 | |||||||||
|
|
|
|
|
| |||||||
Total | 523 | 547 | 610 | |||||||||
|
|
|
|
|
| |||||||
Of the above outstanding commitments, £509 million (2013: £528 million; 2012: £577 million) relate to land and buildings.
The Group has a number of properties that are sub-leased. The future lease receivables contracted with sub-tenants fall due as follows:
| 2014 £m | 2013 £m | 2012 £m | ||||||||||
Within one year | 15 | 16 | 16 | |||||||||
In the second to fifth years inclusive | 46 | 43 | 33 | |||||||||
After five years | 21 | 25 | 17 | |||||||||
|
|
|
|
|
| |||||||
Total | 82 | 84 | 66 | |||||||||
|
|
|
|
|
| |||||||
| 2014 | 2013 | 2012 | ||||||||||
| £m | £m | £m | ||||||||||
At January 1 | 133 | 169 | 126 | |||||||||
Transfer | — | — | 22 | |||||||||
Charged | — | — | 62 | |||||||||
Utilised | (16 | ) | (35 | ) | (36 | ) | ||||||
Exchange translation differences | 6 | (1 | ) | (5 | ) | |||||||
|
|
|
|
|
| |||||||
At December 31 | 123 | 133 | 169 | |||||||||
|
|
|
|
|
| |||||||
Provisions principally relate to leasehold properties, including sub-lease shortfalls and guarantees given in respect of certain property leases for various periods up to 2024.
At December 31, 2014, provisions are included within current and non-current liabilities as follows:
| 2014 £m | 2013 £m | 2012 £m | ||||||||||
Current liabilities | 19 | 17 | 30 | |||||||||
Non-current liabilities | 104 | 116 | 139 | |||||||||
|
|
|
|
|
| |||||||
Total | 123 | 133 | 169 | |||||||||
|
|
|
|
|
| |||||||
Combined share capitals exclude the shares of Reed Elsevier NV held by a subsidiary of Reed Elsevier PLC. Disclosures in respect of share capital are given in note 12 to the Reed Elsevier PLC consolidated financial statements and note 13 to the Reed Elsevier NV consolidated financial statements. Combined share premiums exclude the share premium in respect of shares of Reed Elsevier NV held by a subsidiary of Reed Elsevier PLC.
During the year, Reed Elsevier PLC repurchased 35.2 million Reed Elsevier PLC ordinary shares and Reed Elsevier NV repurchased 20.4 million Reed Elsevier NV ordinary shares for consideration of £600 million. These shares are held in treasury. In addition, Reed Elsevier NV repurchased 107,901 R shares. During the year 65 million Reed Elsevier PLC and 40 million Reed Elsevier NV shares held in treasury were cancelled.
The Employee Benefit Trust (EBT) purchases Reed Elsevier PLC and Reed Elsevier NV shares which, at the trustees’ discretion, can be used in respect of the exercise of share options and to meet commitments under conditional share awards. During the year the EBT purchased 0.8 million Reed Elsevier PLC shares and 2.0 million Reed Elsevier NV shares for a total cost of £39 million (2013: nil; 2012: nil). At 31 December 2014, shares held by the EBT were £117 million (2013: £112 million; 2012: £152 million) at cost.
Details of the shares held in treasury are provided in note 12 of the Reed Elsevier PLC consolidated financial statements and note 13 of the Reed Elsevier NV consolidated financial statements.
| 2014 | 2013 | 2012 | ||||||||||||||||||
| Hedge reserve £m | Other reserves £m | Total £m | Total £m | Total £m | ||||||||||||||||
At January 1 | 73 | 807 | 880 | 252 | (199 | ) | ||||||||||||||
Profit attributable to parent companies’ shareholders | — | 955 | 955 | 1,110 | 1,044 | |||||||||||||||
Dividends paid | — | (565 | ) | (565 | ) | (549 | ) | (521 | ) | |||||||||||
Actuarial (losses)/gains on defined benefit pension schemes | — | (266 | ) | (266 | ) | 40 | (293 | ) | ||||||||||||
Transfer to net profit on disposal of available for sale investments | — | — | — | — | 11 | |||||||||||||||
Fair value movements on cash flow hedges | (81 | ) | — | (81 | ) | 65 | 70 | |||||||||||||
Transfer to net profit from cash flow hedge reserve | 19 | — | 19 | (3 | ) | 26 | ||||||||||||||
Tax recognised in other comprehensive income | 13 | 63 | 76 | (38 | ) | 72 | ||||||||||||||
Increase in share based remuneration reserve (net of tax) | — | 48 | 48 | 48 | 31 | |||||||||||||||
Cancellation of shares | — | (919 | ) | (919 | ) | — | — | |||||||||||||
Settlement of share awards | — | (27 | ) | (27 | ) | (40 | ) | (7 | ) | |||||||||||
Acquisition of non-controlling interests | — | (13 | ) | (13 | ) | — | 6 | |||||||||||||
Exchange translation differences | 1 | (1 | ) | — | (5 | ) | 12 | |||||||||||||
|
|
|
|
|
|
|
|
|
| |||||||||||
At December 31 | 25 | 82 | 107 | 880 | 252 | |||||||||||||||
|
|
|
|
|
|
|
|
|
| |||||||||||
Other reserves principally comprise retained earnings and the share based remuneration reserve.
Transactions between the combined businesses have been eliminated within the combined financial statements. Transactions with joint ventures were made on normal market terms of trading and comprise sales of goods and services of nil (2013: £1 million; 2012: £1 million). As at December 31, 2014 amounts owed by joint ventures were £1 million (2013: £7 million; 2012: £1 million) and amounts due to joint ventures were £6 million (2013: £6 million; 2012: £1 million).
Key management personnel remuneration is set out below. Key Management personnel are also related parties as defined by IAS 24 — Related Party Disclosures and comprise the Executive and Non-Executive Directors of Reed Elsevier PLC and Reed Elsevier NV. For reporting purposes, salary, benefits and annual incentive payments are considered short term employee benefits.
Key Management personnel remuneration
| 2014 £m | 2013 £m | 2012 £m | ||||||||||
Salaries and other short term employee benefits and Non-Executive fees | 5 | 4 | 5 | |||||||||
Post employment benefits* | 1 | 1 | 1 | |||||||||
Share based remuneration** | 5 | 4 | 5 | |||||||||
|
|
|
|
|
| |||||||
Total | 11 | 9 | 11 | |||||||||
|
|
|
|
|
| |||||||
Termination benefits of £238,023 were paid to directors during 2014 (2013: nil; 2012: nil) further details are shown on page 46. No loans, advances or guarantees have been provided on behalf of any Director. The aggregate gain made by Executive Directors on the exercise of options during 2014 were £1,101,114 (2013: £2,526,305). The current Executive Directors did not exercise any options during 2012.
The combined financial statements were approved by the Boards of directors of Reed Elsevier PLC and Reed Elsevier NV on February 25, 2015.
THIS PAGE INTENTIONALLY BLANK
CONSOLIDATED FINANCIAL STATEMENTS
REPORT OF INDEPENDENT REGISTERED PUBLIC ACCOUNTING FIRM
To the Board of Directors and members of Reed Elsevier PLC:
We have audited the accompanying consolidated statements of financial position of Reed Elsevier PLC and its subsidiaries (the “Company”) as at December 31, 2014, 2013 and 2012, and the related consolidated income statements, and consolidated statements of comprehensive income, cash flows and changes in equity for each of the years then ended. These consolidated financial statements are the responsibility of the Company’s management. Our responsibility is to express an opinion on the financial statements based on our audits.
We conducted our audits in accordance with the standards of the Public Company Accounting Oversight Board (United States). Those standards require that we plan and perform the audit to obtain reasonable assurance about whether the financial statements are free of material misstatement. An audit includes examining, on a test basis, evidence supporting the amounts and disclosures in the financial statements. An audit also includes assessing the accounting principles used and significant estimates made by management, as well as evaluating the overall financial statement presentation. We believe that our audits provide a reasonable basis for our opinion.
In our opinion, such consolidated financial statements present fairly, in all material respects, the financial position of Reed Elsevier PLC and its subsidiaries as at December 31, 2014, 2013 and 2012, and the results of their operations and their cash flows for each of the years then ended, in conformity with International Financial Reporting Standards as issued by the International Accounting Standards Board.
We have also audited, in accordance with the standards of the Public Company Accounting Oversight Board (United States), the Company’s internal control over financial reporting as at December 31, 2014, based on the criteria established inInternal Control — Integrated Framework (2013) issued by the Committee of Sponsoring Organizations of the Treadway Commission and our report dated February 25, 2015 expressed an unqualified opinion on the Company’s internal control over financial reporting.
/s/ DELOITTE LLP
London, United Kingdom
February 25, 2015
REED ELSEVIER PLC
FOR THE YEAR ENDED DECEMBER 31, 2014
| Note | 2014 £m | 2013 £m | 2012 £m | |||||||||||||
Administrative expenses | 3 | (2 | ) | (2 | ) | (2 | ) | |||||||||
Effect of tax credit equalisation on distributed earnings | 4 | (15 | ) | (15 | ) | (14 | ) | |||||||||
Share of results of joint ventures | 11 | 495 | 583 | 547 | ||||||||||||
|
|
|
|
|
| |||||||||||
Operating profit | 478 | 566 | 531 | |||||||||||||
Finance income | 6 | 15 | 10 | 1 | ||||||||||||
|
|
|
|
|
| |||||||||||
Profit before tax | 493 | 576 | 532 | |||||||||||||
Tax (expense)/credit | 7 | (3 | ) | (4 | ) | 6 | ||||||||||
|
|
|
|
|
| |||||||||||
Profit attributable to ordinary shareholders | 490 | 572 | 538 | |||||||||||||
|
|
|
|
|
| |||||||||||
REED ELSEVIER PLC
CONSOLIDATED STATEMENT OF COMPREHENSIVE INCOME
FOR THE YEAR ENDED DECEMBER 31, 2014
| 2014 £m | 2013 £m | 2012 £m | ||||||||||
Profit attributable to ordinary shareholders | 490 | 572 | 538 | |||||||||
Share of joint ventures’ other comprehensive loss for the year | (61 | ) | (13 | ) | (132 | ) | ||||||
|
|
|
|
|
| |||||||
Total comprehensive income for the year | 429 | 559 | 406 | |||||||||
|
|
|
|
|
| |||||||
| ||||||||||||||||
| ||||||||||||||||
| ||||||||||||||||
REED ELSEVIER PLC
CONSOLIDATED STATEMENT OF CASH FLOWS
FOR THE YEAR ENDED DECEMBER 31, 2014
| Note | 2014 £m | 2013 £m | 2012 £m | |||||||||||||
Cash flows from operating activities | ||||||||||||||||
Cash used by operations | 10 | (2 | ) | (2 | ) | (2 | ) | |||||||||
Interest received | 15 | 10 | 1 | |||||||||||||
Tax paid | (4 | ) | (3 | ) | (2 | ) | ||||||||||
|
|
|
|
|
| |||||||||||
Net cash from/(used in) operating activities | 9 | 5 | (3 | ) | ||||||||||||
|
|
|
|
|
| |||||||||||
Cash flows from investing activities | ||||||||||||||||
Dividends received from joint ventures | 11 | 618 | 102 | 694 | ||||||||||||
|
|
|
|
|
| |||||||||||
Net cash received from investing activities | 618 | 102 | 694 | |||||||||||||
|
|
|
|
|
| |||||||||||
Cash flows from financing activities | ||||||||||||||||
Equity dividends paid | 8 | (285 | ) | (278 | ) | (264 | ) | |||||||||
Repurchase of ordinary shares | (333 | ) | (326 | ) | (143 | ) | ||||||||||
Proceeds on issue of ordinary shares | 18 | 50 | 33 | |||||||||||||
(Increase)/decrease in net funding balances due from joint ventures | 10 | (27 | ) | 447 | �� | (317 | ) | |||||||||
|
|
|
|
|
| |||||||||||
Net cash used in financing activities | (627 | ) | (107 | ) | (691 | ) | ||||||||||
|
|
|
|
|
| |||||||||||
Movement in cash and cash equivalents | — | — | — | |||||||||||||
|
|
|
|
|
| |||||||||||
REED ELSEVIER PLC
CONSOLIDATED STATEMENT OF FINANCIAL POSITION
AS AT DECEMBER 31, 2014
| Note | 2014 £m | 2013 £m | 2012 £m | |||||||||||||
Non-current assets | ||||||||||||||||
Investments in joint ventures | 11 | 1,117 | 1,266 | 1,207 | ||||||||||||
|
|
|
|
|
| |||||||||||
Total assets | 1,117 | 1,266 | 1,207 | |||||||||||||
|
|
|
|
|
| |||||||||||
Current liabilities | ||||||||||||||||
Taxation | 1 | 2 | 1 | |||||||||||||
|
|
|
|
|
| |||||||||||
Total liabilities | 1 | 2 | 1 | |||||||||||||
|
|
|
|
|
| |||||||||||
Net assets | 1,116 | 1,264 | 1,206 | |||||||||||||
|
|
|
|
|
| |||||||||||
Capital and reserves | ||||||||||||||||
Called up share capital | 12 | 174 | 182 | 181 | ||||||||||||
Share premium account | 1,274 | 1,257 | 1,208 | |||||||||||||
Shares held in treasury (including in joint ventures) | (593 | ) | (752 | ) | (447 | ) | ||||||||||
Capital redemption reserve | 13 | 4 | 4 | |||||||||||||
Translation reserve | 112 | 40 | 87 | |||||||||||||
Other reserves | 13 | 136 | 533 | 173 | ||||||||||||
|
|
|
|
|
| |||||||||||
Total equity | 1,116 | 1,264 | 1,206 | |||||||||||||
|
|
|
|
|
| |||||||||||
REED ELSEVIER PLC
CONSOLIDATED STATEMENT OF CHANGES IN EQUITY
FOR THE YEAR ENDED DECEMBER 31, 2014
| Note | Share capital £m | Share premium £m | Shares held in treasury £m | Capital redemption reserve £m | Translation reserve £m | Other reserves £m | Total equity £m | |||||||||||||||||||||||||
Balance 2014 | ||||||||||||||||||||||||||||||||
Balance at January 1, 2014 | 182 | 1,257 | (752 | ) | 4 | 40 | 533 | 1,264 | ||||||||||||||||||||||||
Total comprehensive income for the year | — | — | — | — | 72 | 357 | 429 | |||||||||||||||||||||||||
Equity dividends paid | 8 | — | — | — | — | — | (285) | (285 | ) | |||||||||||||||||||||||
Issue of ordinary shares, net of expenses | 1 | 17 | — | — | — | — | 18 | |||||||||||||||||||||||||
Repurchase of ordinary shares | — | — | (350 | ) | — | — | — | (350 | ) | |||||||||||||||||||||||
Cancellation of shares | (9 | ) | — | 495 | 9 | — | (495 | ) | — | |||||||||||||||||||||||
Share of joint ventures’ increase in share based remuneration reserve (net of tax) | — | — | — | — | — | 25 | 25 | |||||||||||||||||||||||||
Share of joint ventures’ settlement of share awards by the employee benefit trust | — | — | 14 | — | — | (14 | ) | — | ||||||||||||||||||||||||
Share of joint ventures’ acquisition of non controlling interest | — | — | — | — | — | (7 | ) | (7 | ) | |||||||||||||||||||||||
Equalisation adjustments | — | — | — | — | — | 22 | 22 | |||||||||||||||||||||||||
|
|
|
|
|
|
|
|
|
|
|
|
|
| |||||||||||||||||||
Balance at December 31, 2014 | 174 | 1,274 | (593 | ) | 13 | 112 | 136 | 1,116 | ||||||||||||||||||||||||
|
|
|
|
|
|
|
|
|
|
|
|
|
| |||||||||||||||||||
Balance at January 1, 2013 | 181 | 1,208 | (447 | ) | 4 | 87 | 173 | 1,206 | ||||||||||||||||||||||||
Total comprehensive income for the year | — | — | — | — | (47 | ) | 606 | 559 | ||||||||||||||||||||||||
Equity dividends paid | 8 | — | — | — | — | — | (278) | (278 | ) | |||||||||||||||||||||||
Issue of ordinary shares, net of expenses | 1 | 49 | — | — | — | — | 50 | |||||||||||||||||||||||||
Repurchase of ordinary shares | — | — | (326 | ) | — | — | — | (326 | ) | |||||||||||||||||||||||
Share of joint ventures’ increase in share based remuneration reserve (net of tax) | — | — | — | — | — | 25 | 25 | |||||||||||||||||||||||||
Share of joint ventures’ settlement of share awards by the employee benefit trust | — | — | 21 | — | — | (21 | ) | — | ||||||||||||||||||||||||
Equalisation adjustments | — | — | — | — | — | 28 | 28 | |||||||||||||||||||||||||
|
|
|
|
|
|
|
|
|
|
|
|
|
| |||||||||||||||||||
Balance at December 31, 2013 | 182 | 1,257 | (752 | ) | 4 | 40 | 533 | 1,264 | ||||||||||||||||||||||||
|
|
|
|
|
|
|
|
|
|
|
|
|
| |||||||||||||||||||
Balance at January 1, 2012 | 180 | 1,176 | (308 | ) | 4 | 159 | (62 | ) | 1,149 | |||||||||||||||||||||||
Total comprehensive income for the year | — | — | — | — | (72 | ) | 478 | 406 | ||||||||||||||||||||||||
Equity dividends paid | 8 | — | — | — | — | — | (264 | ) | (264 | ) | ||||||||||||||||||||||
Issue of ordinary shares, net of expenses | 1 | 32 | — | — | — | — | 33 | |||||||||||||||||||||||||
Repurchase of ordinary shares | — | — | (143 | ) | — | — | — | (143 | ) | |||||||||||||||||||||||
Share of joint ventures’ increase in share based remuneration reserve | — | — | — | — | — | 16 | 16 | |||||||||||||||||||||||||
Share of joint ventures’ settlement of share awards by the employee benefit trust | — | — | 4 | — | — | (4 | ) | — | ||||||||||||||||||||||||
Share of joint venture’s disposal of non-controlling interests | — | — | — | — | — | 3 | 3 | |||||||||||||||||||||||||
Equalisation adjustments | — | — | — | — | — | 6 | 6 | |||||||||||||||||||||||||
|
|
|
|
|
|
|
|
|
|
|
|
|
| |||||||||||||||||||
Balance at December 31, 2012 | 181 | 1,208 | (447 | ) | 4 | 87 | 173 | 1,206 | ||||||||||||||||||||||||
|
|
|
|
|
|
|
|
|
|
|
|
|
| |||||||||||||||||||
REED ELSEVIER PLC
NOTES TO THE CONSOLIDATED FINANCIAL STATEMENTS
As a consequence of the merger of their respective businesses, Reed Elsevier PLC and Reed Elsevier NV contributed their businesses to two jointly owned companies, Reed Elsevier Group plc and Elsevier Reed Finance BV. During 2014, Reed Elsevier Group plc, a company incorporated in England, owned the publishing and information businesses, and Elsevier Reed Finance BV, a company incorporated in the Netherlands, owned the financing and treasury companies. Reed Elsevier PLC and Reed Elsevier NV each held a 50% interest in Reed Elsevier Group plc. Until the end of 2014, Reed Elsevier PLC held a 39% interest in Elsevier Reed Finance BV and Reed Elsevier NV held a 61% interest. Reed Elsevier PLC additionally holds an indirect equity interest in Reed Elsevier NV, reflecting the arrangements entered into between Reed Elsevier PLC and Reed Elsevier NV at the time of the merger, which determined the equalisation ratio whereby one Reed Elsevier NV ordinary share is, in broad terms, intended to confer equivalent economic interests to 1.538 Reed Elsevier PLC ordinary shares.
The equalisation agreement between Reed Elsevier PLC and Reed Elsevier NV has the effect that their shareholders can be regarded as having the interests of a single economic group. For 2014 the Group combined financial statements (“the combined financial Statements”) represent the combined interests of both sets of shareholders and encompass the businesses of Reed Elsevier Group plc and Elsevier Reed Finance BV and their subsidiaries, associates and joint ventures, together with the two parent companies, Reed Elsevier PLC and Reed Elsevier NV (“the combined businesses”).
The combined financial statements on pages F-3 to F-51 form an integral part of the notes to Reed Elsevier PLC’s consolidated financial statements. The combined financial statements (“the combined financial statements”) represent the combined interests of both sets of shareholders and encompass the businesses of Reed Elsevier Group plc and Elsevier Reed Finance BV and their subsidiaries, associates and joint ventures, together with the two parent companies, Reed Elsevier PLC and Reed Elsevier NV (“the combined businesses”).
Basis of preparation
These consolidated financial statements, which have been prepared under the historical cost convention, report the consolidated statements of income, comprehensive income, cash flow, financial position and changes in equity of Reed Elsevier PLC (incorporated and domiciled in the United Kingdom), and have been prepared in accordance with accounting policies that are in conformity with International Financial Reporting Standards (“IFRS”) as issued by the International Accounting Standards Board (“IASB”) and as adopted by the European Union.
Unless otherwise indicated, all amounts shown in the financial statements are in pounds sterling (“£”).
The combined financial statements presented in pounds sterling on pages F-3 to F-51 form an integral part of the notes to Reed Elsevier PLC’s statutory financial statements. The accounting policies adopted in the preparation of the combined financial statements are set out on pages F-53 to F-65.
Determination of profit
The Reed Elsevier PLC share of the combined results has been calculated on the basis of the 52.9% economic interest of the Reed Elsevier PLC shareholders in the combined businesses, after taking account of results arising in Reed Elsevier PLC and its subsidiaries. Dividends paid to Reed Elsevier PLC and Reed Elsevier NV shareholders are, other than in special circumstances, equalised at the gross level inclusive of the UK tax credit available to certain Reed Elsevier PLC shareholders. In Reed Elsevier PLC’s consolidated financial statements, an adjustment is required to equalise the benefit of the tax credit between the two sets of shareholders in accordance with the equalisation agreement. This equalisation adjustment arises on dividends paid by Reed Elsevier PLC to its shareholders and reduces the consolidated attributable earnings by 47.1% of the total amount of the tax credit.
Investments
Reed Elsevier PLC’s economic interest in the net assets of the combined businesses has been shown on the statement of financial position as investments in joint ventures, net of the assets and liabilities reported as part of Reed Elsevier PLC and its subsidiaries. Investments in joint ventures are accounted for using the equity method.
Foreign exchange translation
Transactions in foreign currencies are recorded at the rate of exchange prevailing on the date of the transaction. At each statement of financial position date, monetary assets and liabilities that are denominated in foreign currencies are retranslated at the rate prevailing on the statement of financial position date. Exchange differences arising are recorded in the income statement. The exchange gains or losses relating to the retranslation of Reed Elsevier PLC’s economic interest in the net assets of the combined businesses are classified as equity and transferred to the translation reserve.
When foreign operations are disposed of, the related cumulative translation differences are recognised within the income statement in the period.
Taxation
Tax expense comprises current and deferred tax. Current and deferred tax are charged or credited in the income statement except to the extent that the tax arises from a transaction or event which is recognised, in the same or a different period, outside profit or loss (either in other comprehensive income, directly in equity, or through a business combination) in which case the tax appears in the same statement as the transaction that gave rise to it.
Current tax is the amount of corporate income taxes payable or recoverable based on the profit for the period as adjusted for items that are not taxable or not deductible, and is calculated using tax rates and laws that were enacted or substantively enacted at the date of the statement of financial position. Management periodically evaluates positions taken in tax returns with respect to situations in which applicable tax regulation is subject to interpretation. Provisions are established where appropriate on the basis of amounts expected to be paid to the tax authorities.
Deferred tax is recognised on temporary differences arising between the tax bases of assets and liabilities and their carrying amounts in the statement of financial position. Deferred tax is calculated using tax rates and laws that have been enacted or substantively enacted at the end of the reporting period, and which are expected to apply when the related deferred tax asset is realised or the deferred tax liability is settled.
Deferred tax liabilities are generally recognised for all taxable temporary differences but not recognised for taxable temporary differences arising on investments in subsidiaries, associates and joint ventures where the reversal of the temporary difference can be controlled and it is probable that the difference will not reverse in the foreseeable future. Deferred tax liabilities are not recognised on temporary differences that arise from goodwill which is not deductible for tax purposes.
Deferred tax assets are recognised to the extent it is probable that taxable profits will be available against which the deductible temporary differences can be utilised, and reviewed at the end of each reporting period and reduced to the extent that it is no longer probable that sufficient taxable profits will be available to allow all or part of the asset to be recovered.
Deferred tax assets and liabilities are not recognised in respect of temporary differences that arise on initial recognition of assets and liabilities acquired other than in a business combination. Deferred tax is not discounted.
Critical judgements and key sources of estimation uncertainty
Critical judgments in the preparation of the combined financial statements are set out on pages F-14 to F-15.
Standards and amendments effective for the year
The interpretations and amendments to IFRS effective for 2014 have not had a significant impact on Reed Elsevier PLC’s policies or reporting.
Standards, amendments and interpretations not yet effective
Recently issued standards, amendments and interpretations and their impact on future accounting policies and reporting have been considered on page F-16 of the combined financial statements.
Administrative expenses include £1,371,000 (2013: £972,000; 2012: £877,000) paid in the year to Reed Elsevier Group plc under a contract for the services of Directors and administrative support. Reed Elsevier PLC has no employees (2013: nil; 2012: nil).
The tax credit equalisation adjustment arises on ordinary dividends paid by Reed Elsevier PLC to its shareholders and reduces the consolidated profit attributable to ordinary shareholders by 47.1% of the total amount of the tax credit, as set out in the accounting policies in note 2.
All transactions with joint ventures, which are related parties of Reed Elsevier PLC, are reflected in these financial statements. Key management personnel are also related parties and comprise the Executive Directors of Reed Elsevier PLC. Transactions with key management personnel are set out in note 3 and in note 29 to the combined financial statements.
| 2014 £m | 2013 £m | 2012 £m | ||||||||||
Finance income from joint ventures | 15 | 10 | 1 | |||||||||
|
|
|
|
|
| |||||||
| 2014 £m | 2013 £m | 2012 £m | ||||||||||
UK corporation tax (expense)/credit | (3 | ) | (4 | ) | 6 | |||||||
|
|
|
|
|
| |||||||
A reconciliation of the notional tax charge based on the applicable rate of tax to the actual total tax expense is set out below. |
| |||||||||||
| 2014 £m | 2013 £m | 2012 £m | ||||||||||
Profit before tax | 493 | 576 | 532 | |||||||||
|
|
|
|
|
| |||||||
Tax at applicable rate 21.5% (2013: 23.25%; 2012: 24.5%) | (106 | ) | (134 | ) | (131 | ) | ||||||
Tax at applicable rate on share of results of joint ventures | 103 | 136 | 134 | |||||||||
Other | — | (6 | ) | 3 | ||||||||
|
|
|
|
|
| |||||||
Tax (expense)/credit | (3 | ) | (4 | ) | 6 | |||||||
|
|
|
|
|
| |||||||
| Ordinary dividends declared and paid in the year | 2014 pence | 2013 pence | 2012 pence | 2014 £m | 2013 £m | 2012 £m | ||||||||||||||||||
Ordinary shares | ||||||||||||||||||||||||
Final for prior financial year | 17.95p | 17.00p | 15.90p | 205 | 200 | 191 | ||||||||||||||||||
Interim for financial year | 7.00p | 6.65p | 6.00p | 80 | 78 | 73 | ||||||||||||||||||
|
|
|
|
|
|
|
|
|
|
|
| |||||||||||||
Total | 24.95p | 23.65p | 21.90p | 285 | 278 | 264 | ||||||||||||||||||
|
|
|
|
|
|
|
|
|
|
|
| |||||||||||||
The directors of Reed Elsevier PLC have proposed a final dividend of 19.0p (2013: 17.95p; 2012: 17.0p). The cost of funding the proposed final dividend is expected to be £214 million. No liability has been recognised at the statement of financial position date.
| ||||||||||||||||||
| ||||||||||||||||||
| ||||||||||||||||||
| ||||||||||||||||||
| 2014 | ||||||||||||
| Weighted average number of shares (millions) | Earnings £m | EPS pence | ||||||||||
Basic EPS | 1,140.2 | 490 | 43.0p | |||||||||
|
|
|
|
|
| |||||||
Diluted EPS | 1,152.7 | 490 | 42.5p | |||||||||
|
|
|
|
|
| |||||||
| 2013 | ||||||||||||
| Weighted average number of shares (millions) | Earnings £m | EPS pence | ||||||||||
Basic EPS | 1,172.2 | 572 | 48.8p | |||||||||
|
|
|
|
|
| |||||||
Diluted EPS | 1,187.2 | 572 | 48.2p | |||||||||
|
|
|
|
|
| |||||||
| 2012 | ||||||||||||
| Weighted average number of shares (millions) | Earnings £m | EPS pence | ||||||||||
Basic EPS | 1,200.6 | 538 | 44.8p | |||||||||
|
|
|
|
|
| |||||||
Diluted EPS | 1,215.1 | 538 | 44.3p | |||||||||
|
|
|
|
|
| |||||||
The diluted EPS figures are calculated after taking account of the effect of potential additional ordinary shares arising from share options and conditional shares.
The weighted average number of shares is after deducting shares held in treasury. Movements in the number of shares in issue net of treasury shares for the year ended December 31, 2014 are shown in note 12.
The weighted average number of shares used in the diluted EPS calculations above is after deducting shares held in treasury and is derived as follows:
| 2014 (millions) | 2013 (millions) | 2012 (millions) | ||||||||||
Weighted average number of shares — Basic | 1,140.2 | 1,172.2 | 1,200.6 | |||||||||
Weighted average number of dilutive shares under option | 12.5 | 15.0 | 14.5 | |||||||||
|
|
|
|
|
| |||||||
Weighted average number of shares — Diluted | 1,152.7 | 1,187.2 | 1,215.1 | |||||||||
|
|
|
|
|
| |||||||
Reconciliation of profit before tax to cash used by operations
| 2014 £m | 2013 £m | 2012 £m | ||||||||||
Profit before tax | 493 | 576 | 532 | |||||||||
Effect of tax credit equalisation on distributed earnings | 15 | 15 | 14 | |||||||||
Net finance income | (15 | ) | (10 | ) | (1 | ) | ||||||
Share of results of joint ventures | (495 | ) | (583 | ) | (547 | ) | ||||||
|
|
|
|
|
| |||||||
Cash used by operations | (2 | ) | (2 | ) | (2 | ) | ||||||
|
|
|
|
|
| |||||||
Reconciliation of net funding balances due from joint ventures
| 2014 £m | 2013 £m | 2012 £m | ||||||||||
At January 1 | 502 | 949 | 632 | |||||||||
Cash flow | 27 | (447 | ) | 317 | ||||||||
|
|
|
|
|
| |||||||
At December 31 | 529 | 502 | 949 | |||||||||
|
|
|
|
|
| |||||||
| 2014 £m | 2013 £m | 2012 £m | ||||||||||
Share of results of joint ventures | 495 | 583 | 547 | |||||||||
Share of joint ventures’: | ||||||||||||
Other comprehensive loss | (61 | ) | (13 | ) | (132 | ) | ||||||
(Acquisition)/disposal of non-controlling interests | (7 | ) | — | 3 | ||||||||
Increase in share based remuneration reserve (net of tax) | 25 | 25 | 16 | |||||||||
Share of joint ventures purchase of treasury shares by employee benefit trust | (17 | ) | — | — | ||||||||
Equalisation adjustments | 7 | 13 | (8 | ) | ||||||||
Dividends received from joint ventures | (618 | ) | (102 | ) | (694 | ) | ||||||
Increase/(decrease) in net funding balances due from joint ventures | 27 | (447 | ) | 317 | ||||||||
|
|
|
|
|
| |||||||
Net movement in the year | (149 | ) | 59 | 49 | ||||||||
At January 1 | 1,266 | 1,207 | 1,158 | |||||||||
|
|
|
|
|
| |||||||
At December 31 | 1,117 | 1,266 | 1,207 | |||||||||
|
|
|
|
|
| |||||||
During the year Reed Elsevier PLC received dividends of £118 million (2013: £102 million; 2012: £394 million) from Elsevier Reed Finance BV and £500 million from RELX Group plc (2013: nil; 2012: £300 million).
Summarised information showing total amounts in respect of joint ventures and Reed Elsevier PLC shareholders’ share is set out below.
| Total joint ventures | Reed Elsevier PLC shareholders’ share | |||||||||||||||||||||||
| 2014 £m | 2013 £m | 2012 £m | 2014 £m | 2013 £m | 2012 £m | |||||||||||||||||||
Revenue | 5,773 | 6,035 | 6,116 | 3,054 | 3,193 | 3,235 | ||||||||||||||||||
Net profit for the year | 960 | 1,115 | 1,049 | 495 | 583 | 547 | ||||||||||||||||||
|
|
|
|
|
|
|
|
|
|
|
| |||||||||||||
Reed Elsevier PLC’s share of joint ventures’ net profit attributable to parent company shareholders for the year excludes the net profit that arose directly in Reed Elsevier PLC of £10 million (2013: £4 million; 2012: £5 million loss).
Reed Elsevier PLC’s other comprehensive income includes a loss of £61 million (2013: £13 million; 2012: £132 million) relating to joint ventures.
| Total joint ventures | Reed Elsevier PLC shareholders’ share | |||||||||||||||||||||||
| 2014 £m | 2013 £m | 2012 £m | 2014 £m | 2013 £m | 2012 £m | |||||||||||||||||||
Total assets | 11,087 | 10,495 | 11,014 | 5,876 | 5,552 | 5,826 | ||||||||||||||||||
Total liabilities | (8,950 | ) | (8,072 | ) | (8,700 | ) | (5,288 | ) | (4,788 | ) | (5,568 | ) | ||||||||||||
|
|
|
|
|
|
|
|
|
|
|
| |||||||||||||
Net assets | 2,137 | 2,423 | 2,314 | 588 | 764 | 258 | ||||||||||||||||||
|
|
|
|
|
|
|
|
|
|
|
| |||||||||||||
Attributable to: | ||||||||||||||||||||||||
Joint ventures | 2,106 | 2,390 | 2,280 | 588 | 764 | 258 | ||||||||||||||||||
Non-controlling interests | 31 | 33 | 34 | — | — | — | ||||||||||||||||||
|
|
|
|
|
|
|
|
|
|
|
| |||||||||||||
| 2,137 | 2,423 | 2,314 | 588 | 764 | 258 | |||||||||||||||||||
|
|
|
|
|
| |||||||||||||||||||
Funding balances due from joint ventures | 529 | 502 | 949 | |||||||||||||||||||||
|
|
|
|
|
| |||||||||||||||||||
Total | 1,117 | 1,266 | 1,207 | |||||||||||||||||||||
|
|
|
|
|
| |||||||||||||||||||
F-63
The above amounts for Reed Elsevier PLC’s shareholders’ share of total assets and total liabilities exclude assets and liabilities held directly by Reed Elsevier PLC, but include the counterparty balances of amounts owed to and by other Group businesses. Included within Reed Elsevier PLC’s share of assets and liabilities are cash and cash equivalents of £146 million (2013: £70 million; 2012: £339 million) and borrowings of £2,027 million (2013: £1,736 million; 2012: £2,059 million) respectively.
Called up share capital — issued and fully paid
| 2014 | 2013 | 2012 | ||||||||||||||||||||||
| No. of shares | £m | No. of shares | £m | No. of shares | £m | |||||||||||||||||||
At January 1 | 1,267,036,696 | 182 | 1,257,597,977 | 181 | 1,250,913,565 | 180 | ||||||||||||||||||
Issue of ordinary shares | 3,360,624 | 1 | 9,438,719 | 1 | 6,684,412 | 1 | ||||||||||||||||||
Shares cancelled | (65,000,000 | ) | (9 | ) | — | — | — | — | ||||||||||||||||
|
|
|
|
|
|
|
|
|
|
|
| |||||||||||||
At December 31 | 1,205,397,320 | 174 | 1,267,036,696 | 182 | 1,257,597,977 | 181 | ||||||||||||||||||
|
|
|
|
|
|
|
|
|
|
|
| |||||||||||||
The issue of ordinary shares relates to the exercise of share options. Details of share option and conditional share schemes are set out in note 7 to the combined financial statements.
| Year Ended December 31, | ||||||||||||||||||||
| Shares in issue (millions) | Treasury shares (millions) | 2014 Shares in issue net of treasury shares (millions) | 2013 Shares in issue net of treasury shares (millions) | 2012 Shares in issue net of treasury shares (millions) | ||||||||||||||||
Number of ordinary shares | ||||||||||||||||||||
At January 1 | 1,267.0 | (109.6 | ) | 1,157.4 | 1,186.6 | 1,202.6 | ||||||||||||||
Issue of ordinary shares | 3.4 | — | �� | 3.4 | 9.4 | 6.7 | ||||||||||||||
Repurchase of ordinary shares | — | (35.2 | ) | (35.2 | ) | (41.9 | ) | (23.3 | ) | |||||||||||
Net release of shares by the employee benefit trust | — | 2.1 | 2.1 | 3.3 | 0.6 | |||||||||||||||
Shares cancelled | (65.0 | ) | 65.0 | — | — | — | ||||||||||||||
|
|
|
|
|
|
|
|
|
| |||||||||||
At December 31 | 1,205.4 | (77.7 | ) | 1,127.7 | 1,157.4 | 1,186.6 | ||||||||||||||
|
|
|
|
|
|
|
|
|
| |||||||||||
Weighted average number of equivalent ordinary shares during the year | 1,140.2 | 1,172.2 | 1,200.6 | |||||||||||||||||
|
|
|
|
|
| |||||||||||||||
All of the ordinary shares rank equally with respect to voting rights and rights to receive dividends, except for shares held in treasury by the parent company, which do not attract voting or dividend rights. The Employee Benefit Trust (EBT) has waived the right to receive dividends on Reed Elsevier PLC shares. There are no restrictions on the rights to transfer shares.
At December 31, 2014, shares held in treasury related to 8,032,643 (2013: 10,120,537; 2012: 13,451,468) Reed Elsevier PLC ordinary shares held by the EBT; and 69,698,335 (2013: 99,446,834; 2012: 57,484,914) Reed Elsevier PLC ordinary shares held by the parent company. The EBT purchases Reed Elsevier PLC shares which, at the Trustees’ discretion, can be used in respect of the exercise of share options and to meet commitments under conditional shares awards. At December 31, 2014, Reed Elsevier PLC shares held by the EBT were £54 million (2013: £64 million; 2012: £84 million) at cost. During December 2014, 65,000,000 Reed Elsevier PLC ordinary shares held in treasury were cancelled.
| 2014 £m | 2013 £m | 2012 £m | ||||||||||
At January 1 | 533 | 173 | (62 | ) | ||||||||
Profit attributable to ordinary shareholders | 490 | 572 | 538 | |||||||||
Cancellation of shares | (495 | ) | — | — | ||||||||
Share of joint ventures’: | ||||||||||||
Actuarial (losses)/gains on defined benefit pension schemes | (140 | ) | 21 | (155 | ) | |||||||
Transfer to net profit on disposal of available for sale investments | — | — | 6 | |||||||||
Fair value movements on cash flow hedges | (43 | ) | 34 | 37 | ||||||||
Transfer to net profit from cash flow hedge reserve | 10 | (2 | ) | 14 | ||||||||
Tax recognised in other comprehensive income | 40 | (19 | ) | 38 | ||||||||
Increase in share based remuneration reserve (net of tax) | 25 | 25 | 16 | |||||||||
Settlement of share awards | (14 | ) | (21 | ) | (4 | ) | ||||||
(Acquisition)/disposal of non-controlling interest | (7 | ) | — | 3 | ||||||||
Equalisation adjustments | 22 | 28 | 6 | |||||||||
Equity dividends paid | (285 | ) | (278 | ) | (264 | ) | ||||||
|
|
|
|
|
| |||||||
At December 31 | 136 | 533 | 173 | |||||||||
|
|
|
|
|
| |||||||
There are contingent liabilities in respect of borrowings of joint ventures guaranteed by Reed Elsevier PLC as follows:
| 2014 £m | 2013 £m | 2012 £m | ||||||||||
Guaranteed jointly and severally with Reed Elsevier NV | 3,607 | 3,063 | 3,595 | |||||||||
|
|
|
|
|
| |||||||
Financial instruments disclosures in respect of the borrowings covered by the above guarantees are given in note 18 to the combined financial statements.
Effective February 25, 2015, Reed Elsevier PLC transferred its direct ownership interest in Elsevier Reed Finance BV to its jointly-owned company Reed Elsevier Group plc, for consideration of 31,613 ordinary voting shares in Reed Elsevier Group plc. Simultaneously, Reed Elsevier NV transferred its direct ownership interest in Elsevier Reed Finance BV to Reed Elsevier Group plc, for consideration of 31,613 ordinary voting shares in Reed Elsevier Group plc. This newly-combined single group entity was named RELX Group plc. The R shares and E shares of RELX Group plc held by Reed Elsevier PLC and Reed Elsevier NV respectively were converted into non-voting shares.
Reed Elsevier PLC has retained its 52.9% economic interest in the combined businesses, and no gain or loss was recorded on the transaction. As Reed Elsevier PLC and Reed Elsevier NV each hold 50% of the voting shares in issue, joint control of RELX Group plc is retained and their respective interests will continue to be accounted for under the equity method, as described in the accounting policies on page F-59.
Subsequently, Reed Elsevier PLC transferred non-interest bearing, payable-on-demand receivables of £475 million to RELX Group plc for consideration of 2 ordinary non-voting R shares. As these R shares do not have voting rights, this transaction did not impact the joint-control of RELX Group plc.
The consolidated financial statements were approved by the Board of directors on February 25, 2015.
THIS PAGE INTENTIONALLY BLANK
F-4
CONSOLIDATED FINANCIAL STATEMENTS
REPORT OF INDEPENDENT REGISTERED PUBLIC ACCOUNTING FIRM
To the Board of Directors and shareholders of Reed Elsevier NV:
We have audited the accompanying consolidated statements of financial position of Reed Elsevier NV and its subsidiaries (the “Company”) as at December 31, 2014, 2013 and 2012, and the related consolidated income statements, and consolidated statements of comprehensive income, cash flows and changes in equity for each of the years then ended. These consolidated financial statements are the responsibility of the Company’s management. Our responsibility is to express an opinion on the financial statements based on our audits.
We conducted our audits in accordance with the standards of the Public Company Accounting Oversight Board (United States). Those standards require that we plan and perform the audit to obtain reasonable assurance about whether the financial statements are free of material misstatement. An audit includes examining, on a test basis, evidence supporting the amounts and disclosures in the financial statements. An audit also includes assessing the accounting principles used and significant estimates made by management, as well as evaluating the overall financial statement presentation. We believe that our audits provide a reasonable basis for our opinion.
In our opinion, such consolidated financial statements present fairly, in all material respects, the financial position of Reed Elsevier NV and its subsidiaries as at December 31, 2014, 2013 and 2012, and the results of their operations and their cash flows for each of the years then ended, in conformity with International Financial Reporting Standards as issued by the International Accounting Standards Board.
We have also audited, in accordance with the standards of the Public Company Accounting Oversight Board (United States), the Company’s internal control over financial reporting as at December 31, 2014, based on the criteria established inInternal Control — Integrated Framework (2013) issued by the Committee of Sponsoring Organizations of the Treadway Commission and our report dated February 25, 2015 expressed an unqualified opinion on the Company’s internal control over financial reporting.
/s/ DELOITTE LLP
London, United Kingdom
February 25, 2015
REED ELSEVIER NV
FOR THE YEAR ENDED DECEMBER 31, 2014
| Note | 2014 €m | 2013 €m | 2012 €m | |||||||||||||
Administrative expenses | 4 | (3 | ) | (2 | ) | (2 | ) | |||||||||
Share of results of joint ventures | 11 | 575 | 642 | 638 | ||||||||||||
|
|
|
|
|
| |||||||||||
Operating profit | 572 | 640 | 636 | |||||||||||||
Finance income | 6 | 25 | 19 | 8 | ||||||||||||
|
|
|
|
|
| |||||||||||
Profit before tax | 597 | 659 | 644 | |||||||||||||
Tax expense | 7 | (5 | ) | (4 | ) | (2 | ) | |||||||||
|
|
|
|
|
| |||||||||||
Profit attributable to shareholders | 592 | 655 | 642 | |||||||||||||
|
|
|
|
|
| |||||||||||
REED ELSEVIER NV
CONSOLIDATED STATEMENT OF COMPREHENSIVE INCOME
FOR THE YEAR ENDED DECEMBER 31, 2014
| 2014 €m | 2013 €m | 2012 €m | ||||||||||
Profit attributable to shareholders | 592 | 655 | 642 | |||||||||
Share of joint ventures’ other comprehensive income/(loss) for the year | 29 | (48 | ) | (121 | ) | |||||||
|
|
|
|
|
| |||||||
Total comprehensive income for the year | 621 | 607 | 521 | |||||||||
|
|
|
|
|
| |||||||
| Note | 2014 €m | 2013 €m | 2012 €m | |||||||||||||
Earnings per share (“EPS”) | ||||||||||||||||
Basic earnings per share | 9 | € | 0.85 | € | 0.91 | € | 0.87 | |||||||||
Diluted earnings per share | 9 | € | 0.84 | € | 0.90 | € | 0.87 | |||||||||
REED ELSEVIER NV
CONSOLIDATED STATEMENT OF CASH FLOWS
FOR THE YEAR ENDED DECEMBER 31, 2014
| Note | 2014 €m | 2013 €m | 2012 €m | |||||||||||||
Cash flows from operating activities | ||||||||||||||||
Cash used by operations | 10 | (3 | ) | (3 | ) | (5 | ) | |||||||||
Interest received | 26 | 19 | 6 | |||||||||||||
Tax paid | (3 | ) | (1 | ) | (2 | ) | ||||||||||
|
|
|
|
|
| |||||||||||
Net cash from/(used in) operating activities | 20 | 15 | (1 | ) | ||||||||||||
|
|
|
|
|
| |||||||||||
Cash flows from investing activities | ||||||||||||||||
Dividends received from joint ventures | 11 | 520 | 186 | 754 | ||||||||||||
|
|
|
|
|
| |||||||||||
Net cash from investing activities | 520 | 186 | 754 | |||||||||||||
|
|
|
|
|
| |||||||||||
Cash flows from financing activities | ||||||||||||||||
Equity dividends paid | 8 | (349 | ) | (321 | ) | (319 | ) | |||||||||
Repurchase of shares | (361 | ) | (337 | ) | (141 | ) | ||||||||||
Proceeds on issue of ordinary shares | 33 | 88 | 18 | |||||||||||||
Decrease/(increase) in net funding balances due from joint ventures | 10 | 141 | 370 | (313 | ) | |||||||||||
|
|
|
|
|
| |||||||||||
Net cash used in financing activities | (536 | ) | (200 | ) | (755 | ) | ||||||||||
|
|
|
|
|
| |||||||||||
Net increase/(decrease) in cash and cash equivalents | 4 | 1 | (2 | ) | ||||||||||||
|
|
|
|
|
| |||||||||||
REED ELSEVIER NV
CONSOLIDATED STATEMENT OF FINANCIAL POSITION
AS AT DECEMBER 31, 2014
| Note | 2014 €m | 2013 €m | 2012 €m | |||||||||||||
Non-current assets | ||||||||||||||||
Investments in joint ventures | 11 | 1,412 | 1,488 | 1,455 | ||||||||||||
Current assets | ||||||||||||||||
Amounts due from joint ventures | 3 | 4 | 4 | |||||||||||||
Cash and cash equivalents | 6 | 2 | 1 | |||||||||||||
|
|
|
|
|
| |||||||||||
| 9 | 6 | 5 | ||||||||||||||
|
|
|
|
|
| |||||||||||
Total assets | 1,421 | 1,494 | 1,460 | |||||||||||||
|
|
|
|
|
| |||||||||||
Current liabilities | ||||||||||||||||
Payables | 12 | 6 | 6 | 7 | ||||||||||||
Taxation | 56 | 54 | 51 | |||||||||||||
|
|
|
|
|
| |||||||||||
Total liabilities | 62 | 60 | 58 | |||||||||||||
|
|
|
|
|
| |||||||||||
Net assets | 1,359 | 1,434 | 1,402 | |||||||||||||
|
|
|
|
|
| |||||||||||
Capital and reserves | ||||||||||||||||
Share capital issued | 13 | 52 | 55 | 54 | ||||||||||||
Paid-in surplus | 2,309 | 2,276 | 2,189 | |||||||||||||
Shares held in treasury (including in joint ventures) | (711 | ) | (881 | ) | (571 | ) | ||||||||||
Translation reserve | 60 | (131 | ) | (42 | ) | |||||||||||
Other reserves | 14 | (351 | ) | 115 | (228 | ) | ||||||||||
|
|
|
|
|
| |||||||||||
Total equity | 1,359 | 1,434 | 1,402 | |||||||||||||
|
|
|
|
|
| |||||||||||
REED ELSEVIER NV
CONSOLIDATED STATEMENT OF CHANGES IN EQUITY
FOR THE YEAR ENDED DECEMBER 31, 2014
| Note | Share capital €m | Paid-in surplus €m | Shares held in treasury €m | Translation reserve €m | Other reserves €m | Total equity €m | ||||||||||||||||||||||
Balance at January 1, 2014 | 55 | 2,276 | (881 | ) | (131 | ) | 115 | 1,434 | ||||||||||||||||||||
Total comprehensive income for the year | — | — | — | 185 | 436 | 621 | ||||||||||||||||||||||
Equity dividends paid | 8 | — | — | — | — | (349 | ) | (349 | ) | |||||||||||||||||||
Issue of ordinary shares, net of expenses | — | 33 | — | — | — | 33 | ||||||||||||||||||||||
Repurchase of shares | — | — | (381 | ) | — | — | (381 | ) | ||||||||||||||||||||
Cancellation of shares | (3 | ) | — | 540 | — | (537 | ) | — | ||||||||||||||||||||
Share of joint ventures’ increase in share based remuneration reserve (net of tax) | — | — | — | — | 30 | 30 | ||||||||||||||||||||||
Share of joint ventures’ settlement of share awards by the employee benefit trust | — | — | 17 | — | (17 | ) | — | |||||||||||||||||||||
Share of joint ventures’ acquisition of non-controlling interest | — | — | — | — | (9 | ) | (9 | ) | ||||||||||||||||||||
Equalisation adjustments | — | — | — | (20 | ) | (20 | ) | |||||||||||||||||||||
Exchange translation differences | — | — | (6) | 6 | — | — | ||||||||||||||||||||||
|
|
|
|
|
|
|
|
|
|
|
| |||||||||||||||||
Balance at December 31, 2014 | 52 | 2,309 | (711 | ) | 60 | (351 | ) | 1,359 | ||||||||||||||||||||
|
|
|
|
|
|
|
|
|
|
|
| |||||||||||||||||
Balance at January 1, 2013 | 54 | 2,189 | (571 | ) | (42 | ) | (228 | ) | 1,402 | |||||||||||||||||||
Total comprehensive income for the year | — | — | — | (86 | ) | 693 | 607 | |||||||||||||||||||||
Equity dividends paid | 8 | — | — | — | — | (321 | ) | (321 | ) | |||||||||||||||||||
Issue of ordinary shares, net of expenses | 1 | 87 | — | — | — | 88 | ||||||||||||||||||||||
Repurchase of shares | — | — | (337 | ) | — | — | (337 | ) | ||||||||||||||||||||
Share of joint ventures’ increase in share based remuneration reserve (net of tax) | — | — | — | — | 29 | 29 | ||||||||||||||||||||||
Share of joint ventures’ settlement of share awards by the employee benefit trust | — | — | 24 | — | (24 | ) | — | |||||||||||||||||||||
Equalisation adjustments | — | — | — | — | (34 | ) | (34 | ) | ||||||||||||||||||||
Exchange translation differences | — | — | 3 | (3 | ) | — | — | |||||||||||||||||||||
|
|
|
|
|
|
|
|
|
|
|
| |||||||||||||||||
Balance at December 31, 2013 | 55 | 2,276 | (881) | (131) | 115 | 1,434 | ||||||||||||||||||||||
|
|
|
|
|
|
|
|
|
|
|
| |||||||||||||||||
Balance at January 1, 2012 | 54 | 2,171 | (432 | ) | 6 | (496 | ) | 1,303 | ||||||||||||||||||||
Total comprehensive income for the year | — | — | — | (51 | ) | 572 | 521 | |||||||||||||||||||||
Equity dividends paid | 8 | — | — | — | — | (319 | ) | (319 | ) | |||||||||||||||||||
Issue of ordinary shares, net of expenses | — | 18 | — | — | — | 18 | ||||||||||||||||||||||
Repurchase of shares | — | — | (141 | ) | — | — | (141 | ) | ||||||||||||||||||||
Share of joint ventures’ increase in share based remuneration reserve | — | — | — | — | 19 | 19 | ||||||||||||||||||||||
Share of joint ventures’ settlement of share awards by the employee benefit trust | — | — | 5 | — | (5 | ) | — | |||||||||||||||||||||
Share of joint ventures’ acquisition of non-controlling interest | — | — | — | — | 4 | 4 | ||||||||||||||||||||||
Equalisation adjustments | — | — | — | — | (3 | ) | (3 | ) | ||||||||||||||||||||
Exchange translation differences | — | — | (3 | ) | 3 | — | — | |||||||||||||||||||||
|
|
|
|
|
|
|
|
|
|
|
| |||||||||||||||||
Balance at December 31, 2012 | 54 | 2,189 | (571 | ) | (42 | ) | (228 | ) | 1,402 | |||||||||||||||||||
|
|
|
|
|
|
|
|
|
|
|
| |||||||||||||||||
REED ELSEVIER NV
NOTES TO THE CONSOLIDATED FINANCIAL STATEMENTS
As a consequence of the merger of their respective businesses, Reed Elsevier PLC and Reed Elsevier NV contributed their businesses to two jointly owned companies, Reed Elsevier Group plc and Elsevier Reed Finance BV. During 2014, Reed Elsevier Group plc, a company incorporated in England, owned the publishing and information businesses, and Elsevier Reed Finance BV, a company incorporated in the Netherlands, owned the financing and treasury companies. Reed Elsevier PLC and Reed Elsevier NV each held a 50% interest in Reed Elsevier Group plc. Until the end of 2014, Reed Elsevier PLC held a 39% interest in Elsevier Reed Finance BV and Reed Elsevier NV held a 61% interest. Reed Elsevier PLC additionally holds an indirect equity interest in Reed Elsevier NV, reflecting the arrangements entered into between Reed Elsevier PLC and Reed Elsevier NV at the time of the merger, which determined the equalisation ratio whereby one Reed Elsevier NV ordinary share is, in broad terms, intended to confer equivalent economic interests to 1.538 Reed Elsevier PLC ordinary shares.
Unless otherwise indicated, all amounts shown in the consolidated financial statements are stated in euros (“€”). Certain disclosures required to comply with Dutch statutory reporting requirements have been omitted.
The combined financial statements on pages F-3 to F-51 form an integral part of the notes to Reed Elsevier NV’s consolidated financial statements. The combined financial statements (“the combined financial statements”) represent the combined interests of both sets of shareholders and encompass the businesses of Reed Elsevier Group plc and Elsevier Reed Finance BV and their subsidiaries, associates and joint ventures, together with the two parent companies, Reed Elsevier PLC and Reed Elsevier NV (“the combined businesses”).
Basis of Preparation
These consolidated financial statements, which have been prepared under the historical cost convention, report the consolidated statements of income, comprehensive income, cash flow, financial position and changes in equity of Reed Elsevier NV (incorporated and domiciled in the Netherlands), and have been prepared in accordance with accounting policies that are in conformity with International Financial Reporting Standards (“IFRS”) as issued by the International Accounting Standards Board (“IASB”) and as adopted by the European Union.
Unless otherwise indicated, all amounts shown in the financial statements are in euros (“€”).
As a consequence of the merger of the company’s businesses with those of Reed Elsevier PLC, the shareholders of Reed Elsevier NV and Reed Elsevier PLC can be regarded as having the interests of a single economic group, enjoying substantially equivalent ordinary dividend and capital rights in the earnings and net assets of the combined businesses. The combined businesses are composed of Reed Elsevier Group plc and Elsevier Reed Finance BV and their respective subsidiaries and joint ventures, together with the two parent companies, Reed Elsevier NV and Reed Elsevier PLC. The combined businesses are jointly controlled by Reed Elsevier NV and Reed Elsevier PLC.
The Reed Elsevier NV consolidated financial statements are presented incorporating Reed Elsevier NV’s investments in the combined businesses accounted for using the equity method, as adjusted for the effects of the equalisation arrangement between Reed Elsevier NV and Reed Elsevier PLC. The arrangement lays down the distribution of dividends and net assets in such a way that Reed Elsevier N.V’s share in the profit and net assets of the combined businesses equals 50%, with all settlements accruing to shareholders from the equalisation arrangements taken directly to reserves.
Because the dividend paid to shareholders by Reed Elsevier NV is, other than in special circumstances, equivalent to the Reed Elsevier PLC dividend plus the UK tax credit available to certain Reed Elsevier PLC shareholders, Reed Elsevier NV normally distributes a higher proportion of the combined profit attributable than Reed Elsevier PLC. Reed Elsevier PLC’s share in this difference in dividend distributions is settled with Reed Elsevier NV and is credited directly to consolidated reserves under equalisation. Reed Elsevier NV can pay a nominal dividend on its R shares held by a subsidiary of Reed Elsevier PLC that is lower than the dividend on the ordinary shares. Equally, Reed Elsevier NV has the possibility to receive dividends directly from Dutch affiliates. During 2014, Reed Elsevier PLC was compensated by direct dividend payments by Reed Elsevier Group plc. The settlements flowing from these arrangements are also taken directly to consolidated reserves under equalisation.
Combined financial statements
The accounting policies adopted in the preparation of the combined financial statements are set out on pages F-10 toF-16.
Basis of valuation of assets and liabilities
Reed Elsevier NV’s 50% economic interest in the net assets of the combined businesses has been shown on the consolidated statement of financial position as investments in joint ventures, net of the assets and liabilities reported as part of Reed Elsevier NV. Joint ventures are accounted for using the equity method.
Assets and liabilities are stated at historical cost, less provision, if appropriate, for any impairment in value.
Foreign exchange translation
Transactions in foreign currencies are recorded at the rate of exchange prevailing on the date of the transaction. At each statement of financial position date, monetary assets and liabilities that are denominated in foreign currencies are retranslated at the rate prevailing on the statement of financial position date. Exchange differences arising are recorded in the income statement. The gains or losses relating to the retranslation of Reed Elsevier NV’s 50% interest in the net assets of the combined businesses are classified as equity and transferred to the translation reserve.
When foreign operations are disposed of, the related cumulative translation differences are recognised within the income statement in the period.
Taxation
Tax expense comprises current and deferred tax. Current and deferred tax are charged or credited in the income statement except to the extent that the tax arises from a transaction or event which is recognised, in the same or a different period, outside profit or loss (either in other comprehensive income, directly in equity, or through a business combination) in which case the tax appears in the same statement as the transaction that gave rise to it.
Current tax is the amount of corporate income taxes payable or recoverable based on the profit for the period as adjusted for items that are not taxable or not deductible, and is calculated using tax rates and laws that were enacted or substantively enacted at the date of the statement of financial position. Management periodically evaluates positions taken in tax returns with respect to situations in which applicable tax regulation is subject to interpretation. Provisions are established where appropriate on the basis of amounts expected to be paid to the tax authorities.
Deferred tax is recognised on temporary differences arising between the tax bases of assets and liabilities and their carrying amounts in the statement of financial position. Deferred tax is calculated using tax rates and laws that have been enacted or substantively enacted at the end of the reporting period, and which are expected to apply when the related deferred tax asset is realised or the deferred tax liability is settled.
Deferred tax liabilities are generally recognised for all taxable temporary differences but not recognised for taxable temporary differences arising on investments in subsidiaries, associates and joint ventures where the reversal of the temporary difference can be controlled and it is probable that the difference will not reverse in the foreseeable future. Deferred tax liabilities are not recognised on temporary differences that arise from goodwill which is not deductible for tax purposes.
Deferred tax assets are recognised to the extent it is probable that taxable profits will be available against which the deductible temporary differences can be utilised, and reviewed at the end of each reporting period and reduced to the extent that it is no longer probable that sufficient taxable profits will be available to allow all or part of the asset to be recovered.
Deferred tax assets and liabilities are not recognised in respect of temporary differences that arise on initial recognition of assets and liabilities acquired other than in a business combination. Deferred tax is not discounted.
Critical judgements and key sources of estimation uncertainty
Critical judgments in the preparation of the combined financial statements are set out on pages F-14 to F-15.
Standards and amendments effective for the year
The interpretations and amendments to IFRS effective for 2014 have not had a significant impact on Reed Elsevier NV’s accounting policies or reporting.
Standards, amendments and interpretations not yet effective
Recently issued standards, amendments and interpretations and their impact on future accounting policies and reporting have been considered on page F-16 of the combined financial statements.
The consolidated financial statements of Reed Elsevier NV reflect the 50% economic interest that its shareholders have under the equalisation arrangements in the combined businesses, accounted for on an equity basis.
The combined financial statements are presented in pounds sterling, which is the functional currency of the Group. The following analysis presents how the consolidated financial statements of Reed Elsevier NV, presented in euros, are derived from the combined financial statements.
Reed Elsevier NV consolidated profit attributable to shareholders | 2014 | 2013 | 2012 | |||||||||
Combined businesses net profit attributable to parent company shareholders in pounds sterling | £ | 955m | £ | 1,110m | £ | 1,044m | ||||||
Combined businesses net profit attributable to parent company shareholders translated into euros at year end exchange rates (2014: €1.24 to £1.00; 2013: €1.18 to £1.00; 2012: €1.23 to £1.000) | € | 1,184m | € | 1,310m | € | 1,284m | ||||||
Reed Elsevier NV’s 50% share of combined net profit attributable to shareholders | € | 592m | € | 655m | € | 642m | ||||||
|
|
|
|
|
| |||||||
Reed Elsevier NV consolidated total equity | 2014 | 2013 | 2012 | |||||||||
Combined shareholders’ equity in pounds sterling | £ | 2,106m | £ | 2,390m | £ | 2,280m | ||||||
Combined shareholders’ equity in pounds sterling translated into euros at year end exchange rates (2014: €1.29 to £1.00; 2013: €1.20 to £1.00; 2012: €1.23 to £1.00) | € | 2,717m | € | 2,868m | € | 2,804m | ||||||
Reed Elsevier NV’s 50% share of combined equity | € | 1,359m | € | 1,434m | € | 1,402m | ||||||
|
|
|
|
|
| |||||||
Administrative expenses include the remuneration for present and former Executive and Non-Executive Directors of Reed Elsevier NV in respect of services rendered to Reed Elsevier NV and the combined businesses. Fees for Non-Executive Directors of Reed Elsevier NV of €0.3 million (2013: €0.3 million; 2012: €0.3 million) are included in remuneration. Insofar as remuneration during 2014 was related to services rendered to Reed Elsevier Group plc and Elsevier Reed Finance BV group, it was borne by these groups. Reed Elsevier NV has no employees (2013: nil; 2012: nil).
All transactions with joint ventures, which are related parties of Reed Elsevier NV, are reflected in these financial statements. Key management personnel are also related parties and comprise the Directors of Reed Elsevier NV. Transactions with key management personnel are set out in note 4 and in note 29 to the combined financial statements.
| 2014 €m | 2013 €m | 2012 €m | ||||||||||
Finance income from joint ventures | 25 | 19 | 8 | |||||||||
|
|
|
|
|
| |||||||
A reconciliation of the notional tax charge based on the applicable rate of tax to the actual total tax expense is set out below.
| 2014 €m | 2013 €m | 2012 €m | ||||||||||
Profit before tax | 597 | 659 | 644 | |||||||||
|
|
|
|
|
| |||||||
Tax at applicable rate 25.0% (2013: 25.0%; 2012: 25.0%) | (149 | ) | (165 | ) | (161 | ) | ||||||
Tax at applicable rate on share of results of joint ventures | 144 | 161 | 159 | |||||||||
|
|
|
|
|
| |||||||
Tax expense | (5 | ) | (4 | ) | (2 | ) | ||||||
|
|
|
|
|
| |||||||
| Dividends declared and paid in the year | 2014 € | 2013 € | 2012 € | 2014 €m | 2013 €m | 2012 €m | ||||||||||||||||||
Ordinary shares | ||||||||||||||||||||||||
Final for prior financial year | € | 0.374 | € | 0.337 | € | 0.326 | 249 | 230 | 228 | |||||||||||||||
Interim for financial year | € | 0.151 | € | 0.132 | € | 0.130 | 100 | 91 | 91 | |||||||||||||||
R shares | — | — | — | — | — | — | ||||||||||||||||||
|
|
|
|
|
|
|
|
|
|
|
| |||||||||||||
Total | € | 0.525 | € | 0.469 | € | 0.456 | 349 | 321 | 319 | |||||||||||||||
|
|
|
|
|
|
|
|
|
|
|
| |||||||||||||
The directors of Reed Elsevier NV have proposed a final dividend of €0.438 (2013: €0.374; 2012: €0.337). The cost of funding the proposed final dividend is expected to be €287 million. No liability has been recognised at the statement of financial position date.
| Dividends paid and proposed relating to the financial year | 2014 € | 2013 € | 2012 € | |||||||||
Ordinary shares | ||||||||||||
Interim (paid) | € | 0.151 | € | 0.132 | € | 0.130 | ||||||
Final (proposed) | € | 0.438 | € | 0.374 | € | 0.337 | ||||||
R shares | — | — | — | |||||||||
|
|
|
|
|
| |||||||
Total | € | 0.589 | € | 0.506 | € | 0.467 | ||||||
|
|
|
|
|
| |||||||
| 2014 | ||||||||||||
| Weighted average number of shares (millions) | Earnings €m | EPS € | ||||||||||
Basic EPS | 700.1 | 592 | € | 0.85 | ||||||||
|
|
|
|
|
| |||||||
Diluted EPS | 708.3 | 592 | € | 0.84 | ||||||||
|
|
|
|
|
| |||||||
| 2013 | ||||||||||||
| Weighted average number of shares (millions) | Earnings €m | EPS € | ||||||||||
Basic EPS | 717.6 | 655 | € | 0.91 | ||||||||
|
|
|
|
|
| |||||||
Diluted EPS | 726.9 | 655 | € | 0.90 | ||||||||
|
|
|
|
|
| |||||||
| 2012 | ||||||||||||
| Weighted average number of shares (millions) | Earnings Restated €m | EPS Restated € | ||||||||||
Basic EPS | 734.0 | 642 | € | 0.87 | ||||||||
|
|
|
|
|
| |||||||
Diluted EPS | 742.1 | 642 | € | 0.87 | ||||||||
|
|
|
|
|
| |||||||
The diluted EPS figures are calculated after taking account of the effect of potential additional ordinary shares arising from share options and conditional shares.
The weighted average number of shares reflects the equivalent ordinary shares amount taking into account R shares and is after deducting shares held in treasury. Movements in the number of ordinary shares or equivalents for the year ended December 31, 2014 are shown in note 13.
The average number of equivalent ordinary shares takes into account the R shares in Reed Elsevier NV held by a subsidiary of Reed Elsevier PLC, which represents a 5.8% interest in Reed Elsevier NV’s share capital.
The weighted average number of shares used in the calculation of diluted EPS is after deducting shares held in treasury and is derived as follows:
| 2014 (millions) | 2013 (millions) | 2012 (millions) | ||||||||||
Weighted average number of shares — Basic | 700.1 | 717.6 | 734.0 | |||||||||
Weighted average number of dilutive shares under options | 8.2 | 9.3 | 8.1 | |||||||||
|
|
|
|
|
| |||||||
Weighted average number of shares — Diluted | 708.3 | 726.9 | 742.1 | |||||||||
|
|
|
|
|
| |||||||
Reconciliation of profit before tax to cash used by operations
| 2014 €m | 2013 €m | 2012 €m | ||||||||||
Profit before tax | 597 | 659 | 644 | |||||||||
Finance income | (25 | ) | (19 | ) | (8 | ) | ||||||
Share of results of joint ventures | (575 | ) | (642 | ) | (638 | ) | ||||||
Decrease in payables | — | (1 | ) | (3 | ) | |||||||
|
|
|
|
|
| |||||||
Cash used by operations | (3 | ) | (3 | ) | (5 | ) | ||||||
|
|
|
|
|
| |||||||
Reconciliation of net funding balances due from joint ventures
| 2014 €m | 2013 €m | 2012 €m | ||||||||||
At January 1 | 1,027 | 1,397 | 1,084 | |||||||||
Cash flow | (141 | ) | (370 | ) | 313 | |||||||
|
|
|
|
|
| |||||||
At December 31 | 886 | 1,027 | 1,397 | |||||||||
|
|
|
|
|
| |||||||
| 2014 €m | 2013 €m | 2012 €m | ||||||||||
Share of results of joint ventures | 575 | 642 | 638 | |||||||||
Share of joint ventures’: | ||||||||||||
Other comprehensive income/(loss) | 29 | (48 | ) | (121 | ) | |||||||
(Acquisition)/disposal of non-controlling interests | (9 | ) | — | 4 | ||||||||
Increase in share based remuneration reserve (net of tax) | 30 | 29 | 19 | |||||||||
Purchase of treasury shares by employee benefit trust | (20 | ) | — | — | ||||||||
Equalisation adjustments | (20 | ) | (34 | ) | (3 | ) | ||||||
Dividends received from joint ventures | (520 | ) | (186 | ) | (754 | ) | ||||||
(Decrease)/increase in net funding balances due from joint ventures | (141 | ) | (370 | ) | 313 | |||||||
|
|
|
|
|
| |||||||
Net movement in the year | (76 | ) | 33 | 96 | ||||||||
At January 1 | 1,488 | 1,455 | 1,359 | |||||||||
|
|
|
|
|
| |||||||
At December 31 | 1,412 | 1,488 | 1,455 | |||||||||
|
|
|
|
|
| |||||||
During the year Reed Elsevier NV received dividends of €300 million from Reed Elsevier Overseas BV (2013: nil; 2012: nil) and €220 million from Elsevier Reed Finance BV (2013: €186 million; 2012: €394 million) and nil from RELX Group plc (2013: nil; 2012: €300 million).
Summarised information showing total amounts in respect of joint ventures and Reed Elsevier NV shareholders’ 50% share is set out below:
| Total joint ventures | Reed Elsevier NV shareholders’ share | |||||||||||||||||||||||
| 2014 €m | 2013 €m | 2012 €m | 2014 €m | 2013 €m | 2012 €m | |||||||||||||||||||
Revenue | 7,159 | 7,121 | 7,523 | 3,580 | 3,561 | 3,762 | ||||||||||||||||||
Net profit for the year | 1,190 | 1,316 | 1,290 | 575 | 642 | 638 | ||||||||||||||||||
|
|
|
|
|
|
|
|
|
|
|
| |||||||||||||
Reed Elsevier NV’s share of joint ventures’ net profit attributable to parent company shareholders for the year excludes the net profit that arose directly in Reed Elsevier NV of €17 million (2013: €13 million; 2012: €4 million).
Reed Elsevier NV’s other comprehensive income includes income of €29 million (2013: €48 million loss; 2012: €21 million loss) relating to joint ventures.
| Total joint ventures | Reed Elsevier NV shareholders’ share | |||||||||||||||||||||||
| 2014 €m | 2013 €m | 2012 €m | 2014 €m | 2013 €m | 2012 €m | |||||||||||||||||||
Total assets | 14,302 | 12,594 | 13,547 | 7,145 | 6,295 | 6,773 | ||||||||||||||||||
Total liabilities | (11,545 | ) | (9,686 | ) | (10,701 | ) | (6,619 | ) | (5,834 | ) | (6,715 | ) | ||||||||||||
|
|
|
|
|
|
|
|
|
|
|
| |||||||||||||
Net assets/(liabilities) | 2,757 | 2,908 | 2,846 | 526 | 461 | 58 | ||||||||||||||||||
|
|
|
|
|
|
|
|
|
|
|
| |||||||||||||
Attributable to: | ||||||||||||||||||||||||
Joint ventures | 2,717 | 2,868 | 2,804 | 526 | 461 | 58 | ||||||||||||||||||
Non-controlling interests | 40 | 40 | 42 | — | — | — | ||||||||||||||||||
|
|
|
|
|
|
|
|
|
|
|
| |||||||||||||
| 2,757 | 2,908 | 2,846 | 526 | 461 | 58 | |||||||||||||||||||
|
|
|
|
|
| |||||||||||||||||||
Net funding balances due from joint ventures | 886 | 1,027 | 1,397 | |||||||||||||||||||||
|
|
|
|
|
| |||||||||||||||||||
Total | 1,412 | 1,488 | 1,455 | |||||||||||||||||||||
|
|
|
|
|
| |||||||||||||||||||
The above amounts for Reed Elsevier NV’s shareholders’ share of total assets and total liabilities exclude assets and liabilities held directly by Reed Elsevier NV, but include the counterparty balances of amounts owed to and by other Group businesses. Included within Reed Elsevier NV’s share of assets and liabilities are cash and cash equivalents of €172 million (2013: €77 million; 2012: €393 million) and borrowings of €2,467 million (2013: €1,963 million; 2012: €2,386 million) respectively.
Included within payables are employee convertible debenture loans of €4 million (2013: €5 million; 2012: €7 million) with a weighted average interest rate of 1.65% (2013: 1.95%; 2012: 2.56%). Depending on the conversion terms, the surrender of €200 par value debenture loans qualifies for 50 Reed Elsevier NV ordinary shares.
Authorised
| No. of shares | €m | |||||||
Ordinary shares of €0.07 each | 1,800,000,000 | 126 | ||||||
R shares of €0.70 each | 26,000,000 | 18 | ||||||
|
| |||||||
Total | 144 | |||||||
|
| |||||||
Issued and fully paid
| R shares Number | Ordinary shares Number | R shares €m | Ordinary shares €m | Total €m | ||||||||||||||||
At January 1, 2012 | 4,303,179 | 724,077,755 | 3 | 51 | 54 | |||||||||||||||
Issue of ordinary shares | — | 1,906,470 | — | — | — | |||||||||||||||
|
|
|
|
|
|
|
|
|
| |||||||||||
At January 1, 2013 | 4,303,179 | 725,984,225 | 3 | 51 | 54 | |||||||||||||||
Issue of ordinary shares | — | 8,165,731 | — | 1 | 1 | |||||||||||||||
|
|
|
|
|
|
|
|
|
| |||||||||||
At January 1, 2014 | 4,303,179 | 734,149,956 | 3 | 52 | 55 | |||||||||||||||
Issue of ordinary shares | — | 3,003,289 | — | — | — | |||||||||||||||
Cancellation of shares | — | (40,000,000 | ) | — | (3 | ) | (3 | ) | ||||||||||||
|
|
|
|
|
|
|
|
|
| |||||||||||
At December 31, 2014 | 4,303,179 | 697,153,245 | 3 | 49 | 52 | |||||||||||||||
|
|
|
|
|
|
|
|
|
| |||||||||||
The issue of shares relates to the exercise of share options. Details of share option and conditional share schemes are set out in note 7 to the combined financial statements.
| Year Ended December 31, | ||||||||||||||||||||||||
| Ordinary shares in issue (millions) | R share in issue* (millions) | Treasury shares (millions) | 2014 Ordinary share equivalents net of treasury shares (millions) | 2013 Ordinary share equivalents net of treasury shares (millions) | 2012 Ordinary shares equivalents net of treasury shares (millions) | |||||||||||||||||||
Number of ordinary shares or equivalents | ||||||||||||||||||||||||
Ordinary shares at January 1 | 734.1 | — | (65.9 | ) | 668.2 | 682.4 | 692.8 | |||||||||||||||||
Issue of ordinary shares | 3.0 | — | — | 3.0 | 8.1 | 1.9 | ||||||||||||||||||
Repurchase of ordinary shares | — | — | (20.4 | ) | (20.4 | ) | (24.3 | ) | (12.7 | ) | ||||||||||||||
Cancellation of shares | (40.0 | ) | — | 40.0 | — | — | — | |||||||||||||||||
Net (purchase)/release of ordinary shares by the employee benefit trust | — | — | (0.3 | ) | (0.3 | ) | 2.0 | 0.4 | ||||||||||||||||
|
|
|
|
|
|
|
|
|
|
|
| |||||||||||||
Ordinary shares at December 31 | 697.1 | — | (46.6 | ) | 650.5 | 668.2 | 682.4 | |||||||||||||||||
|
|
|
|
|
|
|
|
|
|
|
| |||||||||||||
R share equivalents at January 1 | — | 43.0 | (1.5 | ) | 41.5 | 42.4 | 43 | |||||||||||||||||
Repurchase of R share equivalents | — | — | (l.1 | ) | (1.1 | ) | (0.9 | ) | (0.6 | ) | ||||||||||||||
|
|
|
|
|
|
|
|
|
|
|
| |||||||||||||
R share equivalents at December 31 | — | 43.0 | (2.6 | ) | 40.4 | 41.5 | 42.4 | |||||||||||||||||
|
|
|
|
|
|
|
|
|
|
|
| |||||||||||||
Total ordinary share equivalents at December 31 | 697.1 | 43.0 | (49.2 | ) | 690.9 | 709.7 | 724.8 | |||||||||||||||||
|
|
|
|
|
|
|
|
|
|
|
| |||||||||||||
Weighted average number of equivalent ordinary shares during the year | 700.1 | 717.6 | 734.0 | |||||||||||||||||||||
|
|
|
|
|
| |||||||||||||||||||
At December 31, 2014, 4,038,884 R shares (2013: 4,146,785; 2012: 4,240,838) were held by a subsidiary of Reed Elsevier PLC. The R shares are convertible at the election of the holders into ten ordinary shares each and each R share carries an entitlement to cast ten votes. They have otherwise the same rights as the ordinary shares, except that Reed Elsevier NV may pay a lower dividend on the R shares.
At December 31, 2014 shares held in treasury comprised 41,298,544 ordinary shares and 264,295 R shares (equivalent to 2,642,950 ordinary shares). In addition, 5,337,782 ordinary shares were held by the Employee Benefit Trust. At an extraordinary general meeting of shareholders of Reed Elsevier NV held in October 2014, the shareholders approved the reduction of the capital of the Reed Elsevier NV by the cancellation of up to 40,000,000 of its ordinary shares held in treasury. Following the shareholders’ meeting, the Board filed a declaration for the cancellation of 40,000,000 ordinary shares with the Trade Register at the Chamber of Commerce on October 22, 2014. The 40,000,000 ordinary shares of Reed Elsevier NV were subsequently cancelled with effect from December 24, 2014.
| 2014 €m | 2013 €m | 2012 €m | ||||||||||
At January 1 | 115 | (228 | ) | (496 | ) | |||||||
Profit attributable to shareholders | 592 | 655 | 642 | |||||||||
Cancellation of shares | (537 | ) | — | — | ||||||||
Share of joint ventures’: | ||||||||||||
Actuarial (losses)/gains on defined benefit pension schemes | (165 | ) | 24 | (180 | ) | |||||||
Transfer to net profit on disposal of available for sale investments | — | — | 7 | |||||||||
Fair value movements on cash flow hedges | (50 | ) | 38 | 43 | ||||||||
Transfer to net profit from cash flow hedge reserve | 12 | (2 | ) | 16 | ||||||||
Tax recognised in other comprehensive income | 47 | (22 | ) | 44 | ||||||||
Increase in share based remuneration reserve (net of tax) | 30 | 29 | 19 | |||||||||
Settlement of share awards | (17 | ) | (24 | ) | (5 | ) | ||||||
(Acquisition)/disposal of non-controlling interests | (9 | ) | — | 4 | ||||||||
Equalisation adjustments | (20 | ) | (34 | ) | (3 | ) | ||||||
Equity dividends paid | (349 | ) | (321 | ) | (319 | ) | ||||||
|
|
|
|
|
| |||||||
At December 31 | (351 | ) | 115 | (228 | ) | |||||||
|
|
|
|
|
| |||||||
There are contingent liabilities in respect of borrowings of joint ventures guaranteed by Reed Elsevier NV as follows:
| 2014 €m | 2013 €m | 2012 €m | ||||||||||
Guaranteed jointly and severally with Reed Elsevier PLC | 4,653 | 3,676 | 4,422 | |||||||||
|
|
|
|
|
| |||||||
Financial instruments disclosures in respect of the borrowings covered by the above guarantees are given in note 18 to the combined financial statements.
Effective February 25, 2015, Reed Elsevier NV transferred interest bearing receivables of €836 million to Elsevier Reed Finance BV for consideration of 1 ordinary voting E share. Subsequently, on February 25, 2015, Reed Elsevier NV transferred its direct ownership interest in Elsevier Reed Finance BV to its jointly-owned company Reed Elsevier Group plc, for consideration of 31,613 ordinary voting shares in Reed Elsevier Group plc. Simultaneously, Reed Elsevier PLC transferred its direct ownership interest in Elsevier Reed Finance BV to Reed Elsevier Group plc, for consideration of 31,613 ordinary voting shares in Reed Elsevier Group plc. This newly-combined single group entity was named RELX Group plc. The R shares and E shares of RELX Group plc held by Reed Elsevier PLC and Reed Elsevier NV respectively were converted into non-voting shares.
Reed Elsevier NV has retained its 50% economic interest in the combined businesses, and no gains or losses were recorded on the transactions. As Reed Elsevier NV and Reed Elsevier PLC each hold 50% of the voting shares in issue, joint control of RELX Group plc is retained and their respective interests will continue to be accounted for under the equity method, as described in the accounting policies on page F-73.
The consolidated financial statements were approved by the Board of directors on February 25, 2015.
GLOSSARY OF TERMS
Terms used in Annual Report on Form20-F | US equivalent or brief description |
Accruals | Accrued expenses |
Adjusted cash flow | Cash generated from operations plus dividends from joint ventures less net capital expenditure on property, plant and equipment and internally developed intangible assets, and excluding pension deficit payments and payments in relation to |
Adjusted earnings per share | Adjusted net profit attributable to RELX PLC and RELX NV shareholders divided by the total weighted average number of shares for the group |
Adjusted net profit attributable to RELX PLC and RELX NV shareholders | Net profit attributable to RELX PLC and RELX NV shareholders before amortisation of acquired intangible assets, acquisition related costs, net interest on net defined benefit obligation, disposals and othernon-operating items, other deferred tax credits from intangible assets and exceptional tax credits |
Adjusted operating margin | Adjusted operating profit expressed as a percentage of revenue. This is a key financial measure used by management to evaluate performance and allocate resources |
Adjusted operating profit | Operating profit before amortisation of acquired intangible assets, |
Allotted | Issued |
Associate | An entity in which the Group has a participating interest and, in the opinion of the directors, can exercise significant influence on its management |
|
Called up share capital | Issued share capital |
Capital and reserves | Shareholders’ equity |
Cash flow conversion | The proportion of adjusted operating profits converted into cash |
Combined |
|
Effective tax rate on adjusted operating profit | Tax rate excluding movements on deferred tax balances not expected to crystallise in the near term, more closely aligning with cash taxes payable, and includes the benefit of deductible tax amortisation on acquired goodwill and intangible assets |
EPS | Earnings per ordinary share |
Finance lease | Capital lease |
Free cash flow | Operating cash flow excluding the effects of interest, tax and dividends |
Invested capital | Average capital employed in the year expressed at the average exchange rates for the year. Capital employed represents the net assets of the business before borrowings and derivative financial instruments and current and deferred taxes, after adding back the cumulative amortisation and impairment of acquired intangible assets and goodwill and deducting from goodwill the gross up in respect of deferred tax liabilities recognised on acquisition of intangible assets |
Investments | Non-current investments |
Freehold | Ownership with absolute rights in perpetuity |
S-1
Interest receivable | Interest income |
Interest payable | Interest expense |
Net borrowings | Gross borrowings, less related derivative financial instrument assets and cash and cash equivalents |
Net cash acquired | Cash less debt acquired with a business |
Operating costs | Cost of sales plus selling and distribution costs plus administration and other expenses |
Portfolio effects | Changes in the portfolio relating to acquisitions, disposals and assets held for sale |
Prepayments | Prepaid expenses |
Profit | Income |
Profit attributable | Net income |
Share based remuneration | Stock based compensation |
Share premium account | Premiums paid in excess of par value of ordinary shares |
Return on invested capital | Post tax adjusted operating profit expressed as a percentage of average capital employed. This is a key financial measure used by management |
Revenue | Sales |
Underlying growth | Underlying growth rates are calculated at constant currencies, and exclude the results of all acquisitions and disposals made in both the year and prior year and assets held for sale. Underlying revenue growth rates also exclude the effects of exhibition cycling. This is a key financial measure as it provides an assessment of year on year organic growth without distortion for part year contributions and the impact of changes in foreign exchange rates |
S-2
Exhibits filed as part of this annual report, or incorporated by reference
S-3
| 13.4 | Certification Pursuant to 18 U.S.C. Section 1350, as Adopted Pursuant to Section 906 of the Sarbanes-Oxley Act of 2002, by the Chief Financial Officer of | |
| 15.1 | Independent Registered Public Accounting Firm’s Consent | |
| | Annual Reports and Financial Statements 2017 | |
| 15.3 | Remuneration Policy Report (incorporated by reference from Exhibit 15.3 to the 2015 Annual Report onForm 20-F (FileNo. 001-13334) filed with the SEC on March 8, 2016) | |
| 15.4 | Independent Registered Public Accounting Firm’s Consent | |
| | ||
The total amount of long term debt securities of the Group authorised under any single instrument does not exceed 10% of the combined total assets of the Group. The Registrants hereby agree to furnish to the Commission, upon its request, a copy of any instrument defining the rights of holders of long term debt of the Group or any of the combined businesses for which consolidated or unconsolidated financial statements are required to be filed.
The agreements and other documents filed as exhibits to this report are not intended to provide factual information or other disclosure other than the terms of the agreements or other documents themselves, and you should not rely on them for that purpose. In particular, any representation and warranties made by any of the registrants in therethese agreements or other documents were made solely within the specific context of the relevant agreement or document and may not describe the actual state of affairs at the date they were made or at any other time.
| * | Certain of the information included within Exhibit 15.2, which is provided pursuant to Rule12b-23(a)(3) of the Securities Exchange Act of 1934, as amended, is incorporated by reference in this Form20-F, as specified elsewhere in this Form20-F. With the exception of the items and pages so specified, the Annual Reports and Financial Statements 2017 are not deemed to be filed as part of this Form20-F. |
S-4
SIGNATURES
Each of the Registrants hereby certifies that it meets all of the requirements for filing on Form20-F and that it has duly caused and authorised the undersigned to sign this annual report on its behalf.
Registrant |
Registrant | |
By: /s/ E ENGSTROM
E Engstrom Chief Executive Officer | By: /s/ E ENGSTROM
E Engstrom Chief Executive Officer | |
By: /s/ N
N Luff Chief Financial Officer | By: /s/ N
N Luff Chief Financial Officer | |
Dated: | Dated: | |
S-5